Attached files
| file | filename |
|---|---|
| EX-21 - LIST OF SUBSIDIARIES - US ECOLOGY, INC. | usecology_10k-ex21.htm |
| EX-14.1 - CODE OF ETHICS - US ECOLOGY, INC. | usecology_10k-ex1401.htm |
| EX-32.2 - CERTIFICATION - US ECOLOGY, INC. | usecology_10k-ex3202.htm |
| EX-23.2 - CONSENT - US ECOLOGY, INC. | usecology_10k-ex2302.htm |
| EX-31.1 - CERTIFICATION - US ECOLOGY, INC. | usecology_10k-ex3101.htm |
| EX-23.1 - CONSENT - US ECOLOGY, INC. | usecology_10k-ex2301.htm |
| EX-31.2 - CERTIFICATION - US ECOLOGY, INC. | usecology_10k-ex3102.htm |
| EX-3.1 - RESTATED CERTIFICATE OF INCORPORATION - US ECOLOGY, INC. | usecology_10k-ex0301.htm |
| EX-32.1 - CERTIFICATION - US ECOLOGY, INC. | usecology_10k-ex3201.htm |
UNITED
STATES SECURITIES AND
EXCHANGE
COMMISSION
Washington,
D.C. 20549
FORM 10-K
| x |
ANNUAL
REPORT PURSUANT TO SECTION 13 or 15(d) OF THE
SECURITIES EXCHANGE ACT OF 1934
For
the fiscal year ended December 31, 2009
OR
|
||
| o |
TRANSITION
REPORT PURSUANT TO Section 13 or 15(d) OF
THE
SECURITIES EXCHANGE ACT OF 1934
For
the transition period from ___________ to __________.
|
Commission
file number: 0-11688
US
ECOLOGY, INC.
(Exact
name of Registrant as specified in its Charter)
|
Delaware
|
95-3889638
|
|
|
(State
or other jurisdiction)
|
(I.R.S.
Employer Identification Number)
|
|
|
300
E. Mallard Dr., Suite 300
|
||
|
Boise,
Idaho
|
83706
|
|
|
(Address
of principal executive offices)
|
(Zip
Code)
|
|
(208)
331-8400
|
||
|
(Registrant’s
telephone number, including area
code)
|
||
SECURITIES
REGISTERED PURSUANT TO SECTION 12(b) OF THE ACT: NONE
SECURITIES
REGISTERED PURSUANT TO SECTION 12(g) OF THE ACT:
|
Title
of each class
|
||
|
Common
Stock, $0.01 par value
|
||
Indicate
by check mark if the registrant is a well-known seasoned issuer, as defined in
Rule 405 of the Securities Act. Yes o No x
Indicate
by check mark if the registrant is not required to file reports pursuant to
Section 13 or Section 15(d) of the Act. Yes o No x
Indicate by check mark whether the
registrant (1) has filed all reports required to be filed by Section 13 or 15(d)
of the Securities Exchange Act of 1934 during the preceding 12 months (or for
such shorter period that the Registrant was required to file such reports), and
(2) has been subject to such filing requirements for the past 90 days. Yes x No o
Indicate
by check mark whether the registrant has submitted electronically and posted on
its corporate Web site, if any, every Interactive Data File required to be
submitted and posted pursuant to Rule 405 of Regulation S-T (§ 232.405 of this
chapter) during the preceding 12 months (or for such shorter period that the
registrant was required to submit and post such files). Yes o No o
Indicate by check mark if disclosure of
delinquent filers pursuant to Item 405 of Regulation S-K (§229.405 of this
chapter) is not contained herein, and will not be contained, to the best of
registrant’s knowledge, in definitive proxy or information statements
incorporated by reference in Part III of this Form 10-K or any amendment to this
Form 10-K. x
Indicate
by check mark whether the registrant is a large accelerated filer, an
accelerated filer, a non-accelerated filer, or a smaller reporting company. See
definition of “accelerated filer and large accelerated filer” in Rule 12b-2 of
the Exchange Act. (Check one):
| Large accelerated filer o | Accelerated filer x |
Non-accelerated
filer o
|
Smaller reporting company o |
|
(Do not check if a smaller reporting
company)
|
Indicate
by check mark if the registrant is a shell company (as defined in Rule 12b-2 of
the Act). Yes o No x
The
aggregate market value of the registrant’s voting stock held by non-affiliates
on June 30, 2009 was approximately $305.5 million based on the closing price of
$17.92 per share as reported on the NASDAQ Global Market System.
At March
2, 2010, the registrant had outstanding 18,319,851 shares of its Common
Stock.
Documents
Incorporated by Reference
Listed
hereunder are the documents, any portions of which are incorporated by reference
and the Parts of this Form 10-K into which such portions are
incorporated:
|
|
1.
|
The
registrant’s definitive proxy statement for use in connection with the
Annual Meeting of Stockholders to be held on or about May 24, 2010 to be
filed within 120 days after the registrant’s fiscal year ended December
31, 2009, portions of which are incorporated by reference into
Part III of this
Form 10-K.
|
US
ECOLOGY, INC. (formerly known as American Ecology Corporation)
FORM 10-K
TABLE
OF CONTENTS
|
Item
|
Page
|
|||
|
PART I
|
||||
|
Cautionary Statement
|
3
|
|||
|
1.
|
Business
|
4
|
||
|
1A.
|
Risk Factors
|
12
|
||
|
1B.
|
Unresolved Staff Comments
|
16
|
||
|
2.
|
Properties
|
16
|
||
|
3.
|
Legal Proceedings
|
16
|
||
|
4.
|
Intentionally
Omitted
|
17
|
||
|
PART II
|
||||
|
5.
|
Market for Registrant’s Common Equity, Related
Stockholder Matters and Issuer Purchases of Equity
Securities
|
17
|
||
|
6.
|
Selected Financial Data
|
18
|
||
|
7.
|
Management’s Discussion and Analysis of Financial
Condition and Results of Operations
|
19
|
||
|
7A.
|
Quantitative and Qualitative Disclosures About
Market Risk
|
33
|
||
|
8.
|
Financial Statements and Supplementary
Data
|
34
|
||
|
9.
|
Changes in and Disagreements With Accountants on
Accounting and Financial Disclosure
|
56
|
||
|
9A.
|
Controls and Procedures
|
56
|
||
|
9B.
|
Other Information
|
56
|
||
|
PART III
|
||||
|
10.
|
Directors, Executive Officers and Corporate
Governance
|
57
|
||
|
11.
|
Executive Compensation
|
57
|
||
|
12.
|
Security Ownership of Certain Beneficial Owners
and Management and Related Stockholder Matters
|
57
|
||
|
13.
|
Certain Relationships and Related
Transactions and Director Independence
|
58
|
||
|
14.
|
Principal Accountant Fees and Services
|
58
|
||
|
PART IV
|
||||
|
15.
|
Exhibits and Financial Statement
Schedules
|
58
|
||
|
SIGNATURES
|
59
|
|||
2
PART
I
Cautionary
Statement for Purposes of Safe Harbor Provisions of the Private Securities
Litigation Reform Act of 1995
This
annual report on Form 10-K contains forward-looking statements within the
meaning of federal securities laws. Statements that are not historical facts,
including statements about our beliefs and expectations, are forward-looking
statements. Forward-looking statements include those statements preceded by,
followed by, or that include the words "may," "could," "would," "should,"
"believe," "expect," "anticipate," "plan," "estimate," "target," "project,"
"intend" and similar expressions. These statements include, among others,
statements regarding our financial and operating results, strategic objectives
and means to achieve those objectives, the amount and timing of capital
expenditures, the likelihood of our success in expanding our
business, financing plans, budgets, working capital needs and sources of
liquidity.
Forward-looking
statements are only predictions and are not guarantees of performance. These
statements are based on management's beliefs and assumptions, which in turn are
based on currently available information. Important assumptions include, among
others, those regarding demand for Company services, expansion of service
offerings geographically or through new or expanded service lines, the timing
and cost of planned capital expenditures, competitive conditions and general
economic conditions. These assumptions could prove inaccurate. Forward-looking
statements also involve known and unknown risks and uncertainties, which could
cause actual results to differ materially from those contained in any
forward-looking statement. Many of these factors are beyond our ability to
control or predict. Such factors include, but are not limited to, a loss of a
major customer, compliance with and changes to applicable laws and regulations,
access to cost effective transportation services, access to insurance and other
financial assurances, loss of key personnel, lawsuits, labor disputes, adverse
economic conditions including a tightened credit market, government funding or
competitive pressures, incidents or adverse weather conditions that could limit
or suspend specific operations, implementation of new technologies, production
rates for thermal treatment services, market conditions and pricing for recycled
materials, our ability to replace business from our completed
Honeywell Jersey City project, our ability to perform under required contracts,
our ability to permit and contract for timely construction of new or expanded
disposal cells, our willingness or ability to pay dividends, and our ability to
effectively integrate any acquisitions.
Except
as required by applicable law, including the securities laws of the United
States and the rules and regulations of the SEC, we are under no obligation to
publicly update or revise any forward-looking statements, whether as a result of
new information, future events or otherwise. You should not place undue reliance
on our forward-looking statements. Although we believe that the expectations
reflected in forward-looking statements are reasonable, we cannot guarantee
future results or performance. Before you invest in our common stock, you should
be aware that the occurrence of the events described in the "Risk Factors"
section in this report could harm our business, prospects, operating results,
and financial condition.
Investors
should also be aware that while we do, from time to time, communicate with
securities analysts, it is against our policy to disclose to them any material
non-public information or other confidential commercial information.
Accordingly, stockholders should not assume that we agree with any statement or
report issued by any analyst irrespective of the content of the statement or
report. Furthermore, we have a policy against issuing or confirming financial
forecasts or projections issued by others. Thus, to the extent that reports
issued by securities analysts contain any projections, forecasts or opinions,
such reports are not the responsibility of US Ecology, Inc.
3
Item 1. Business
General
The table
below contains definitions that are used throughout this Annual Report on Form
10-K.
|
Term
|
Meaning
|
|||
|
AEA
|
Atomic
Energy Act of 1954 as amended
|
|||
|
US
Ecology, the Company, “we,” “our,” “us”
|
US
Ecology, Inc., and its subsidiaries
|
|||
|
CERCLA
or “Superfund”
|
Comprehensive
Environmental Response, Compensation and Liability Act of
1980
|
|||
|
FUSRAP
|
U.S.
Army Corps of Engineers Formerly Utilized Site Remedial Action
Program
|
|||
|
LARM
|
Low-activity
radioactive material exempt from federal Atomic Energy Act regulation for
disposal
|
|||
|
LLRW
|
Low-level
radioactive waste regulated under the federal Atomic Energy Act for
disposal
|
|||
|
NORM/NARM
|
Naturally
occurring and accelerator produced radioactive material
|
|||
|
NRC
|
U.S.
Nuclear Regulatory Commission
|
|||
|
PCBs
|
Polychlorinated
biphenyls
|
|||
|
RCRA
|
Resource
Conservation and Recovery Act of 1976
|
|||
|
SEC
|
U.
S. Securities and Exchange Commission
|
|||
|
TCEQ
|
Texas
Commission on Environmental Quality
|
|||
|
TSCA
|
Toxic
Substances Control Act of 1976
|
|||
|
USACE
|
U.S.
Army Corps of Engineers
|
|||
|
USEPA
|
U.S.
Environmental Protection Agency
|
|||
|
WUTC
|
Washington
Utilities and Transportation Commission
|
US
Ecology, Inc., (formerly known as American Ecology Corporation) through our
subsidiaries, provides radioactive, hazardous, PCB and non-hazardous industrial
waste management and recycling services to commercial and government entities,
such as refineries and chemical production facilities, manufacturers, electric
utilities, steel mills, medical and academic institutions and waste broker /
aggregators. Headquartered in Boise, Idaho, we are one of the nation’s oldest
providers of such services. US Ecology and its predecessor companies have been
in business for more than 50 years. We operate nationally and employed 221
people as of December 31, 2009.
Our
filings with the SEC are posted on our website at www.usecology.com.
The information found on our website is not part of this or any other report we
file with or furnish to the SEC. The public can also obtain copies of these
filings by visiting the SEC’s Public Reference Room at 100 F Street NE,
Washington DC 20549, or by calling the SEC at 1-800-SEC-0330 or by accessing the
SEC’s website at www.sec.gov.
US
Ecology was most recently incorporated as a Delaware corporation in May 1987 as
American Ecology Corporation. On February 22, 2010, the Company changed its name
from American Ecology Corporation to US Ecology, Inc. Our wholly-owned primary
operating subsidiaries are US Ecology Nevada, Inc., a Delaware corporation
(“USEN”); US Ecology Washington, Inc., a Delaware corporation (“USEW”); US
Ecology Texas, Inc., a Delaware corporation (“USET”); US Ecology Idaho, Inc., a
Delaware corporation (“USEI”) and US Ecology Field Services, Inc., a Delaware
corporation (“USEFS”). American Ecology Recycle Center, Inc., a Delaware
corporation (“AERC”) previously operated our discontinued Oak Ridge, Tennessee
LLRW processing business. US Ecology Illinois, Inc., a California corporation,
operates our closed property in Sheffield, Illinois.
We
operate within two business segments: Operating Disposal Facilities and
Non-Operating Disposal Facilities. These segments reflect our current
operational status and internal reporting structure. Operating Disposal
Facilities accept hazardous, LARM and LLRW and include our RCRA hazardous waste
treatment and disposal facilities in Beatty, Nevada; Grand View, Idaho; and
Robstown, Texas; and our AEA disposal facility in Richland, Washington. Our
Washington, Idaho and (to a lesser degree) Texas facilities also accept certain
NORM/NARM waste and LARM. Non-Operating Disposal Facilities include our former
disposal facilities in Sheffield, Illinois; Beatty, Nevada; and Bruneau, Idaho
and a former hazardous waste processing and deep-well injection operation in
Winona, Texas. Income taxes are assigned to the corporate office. All
other items are included in the segment where they originated. Inter-company
transactions have been eliminated from the segment information and are not
significant between segments. Financial information with respect to each segment
is further discussed in Note 15 of the consolidated financial statements located
in Item 8 - Financial Statements and Supplementary Data to this Form
10-K.
4
The following table summarizes each segment:
|
Subsidiary
|
Location
|
Services
|
||
|
Operating
Disposal Facilities
|
||||
|
USEI
|
Grand
View, Idaho
|
Hazardous,
non-hazardous industrial, PCB, NORM/NARM, LARM and mixed waste treatment
and disposal, rail transfer station
|
||
|
USET
|
Robstown,
Texas
|
Hazardous,
non-hazardous industrial, LARM and NORM/NARM waste treatment and disposal,
recycling services, rail transfer station
|
||
|
USEN
|
Beatty,
Nevada
|
Hazardous,
non-hazardous industrial and PCB waste treatment and
disposal
|
||
|
USEW
|
Richland,
Washington
|
LLRW,
NORM/NARM and LARM waste disposal
|
||
|
Non-Operating
Facilities
|
||||
|
US
Ecology Illinois, Inc. (“USE”)
|
Sheffield,
Illinois
|
Closed
LLRW disposal facility under long-term care: State of Illinois is
licensee
|
||
|
USE
|
Sheffield,
Illinois
|
Non-operating
hazardous waste disposal facility: USE is permittee
|
||
|
American
Ecology Environmental Services Corporation (“AEESC”)
|
Winona,
Texas
|
Non-operating
hazardous waste processing and deep well facility: AEESC is
permittee
|
||
|
USEI
|
Bruneau,
Idaho
|
Closed
hazardous waste disposal facility: USEI is
permittee
|
Operating
Disposal Facilities
A
significant portion of our disposal revenue is derived from discrete waste
clean-up projects (“Event Business”) which vary widely in size, duration and
unit pricing. The duration of Event Business projects can last from a one-week
clean up of a small contaminated site to a multiple year clean-up project. The
one-time nature of Event Business, diverse spectrum of waste types received and
widely varying unit pricing necessarily creates variability in revenue and
earnings. This variability may be influenced by general economic conditions,
funding availability, changes in laws and regulations, government enforcement
actions or court orders, public controversy, litigation, weather, real estate
redevelopment project timing, government appropriation and funding commitment
cycles and other factors. The types and amounts of waste received from recurring
customers (“Base Business”) also vary quarter-to-quarter, sometimes
significantly, but are generally more predictable than Event
Business.
Depending
on project-specific customer needs and competitive economics, transportation
services may be offered at or near our cost to help secure new business. For
waste transported by rail from the eastern United States and other locations
distant from our Grand View, Idaho or Robstown, Texas facilities,
transportation-related revenue can account for as much as three-fourths (75%) of
total project revenue.
5
The types
of waste received, also referred to as “service mix,” can produce significant
quarter-to-quarter and year-to-year variations in revenue, gross profit, gross
margin, operating profit and net income for both Base and Event business. Event
Business contributed approximately 44% and 50% of revenue for the years ended
December 31, 2009 and 2008, respectively. Base Business represented
approximately 56% and 50% of disposal revenue (excluding transportation revenue)
for the years ended December 31, 2009 and 2008, respectively. Our strategy is to
expand our Base Business while securing both short-term and extended-duration
Event Business. When Base Business covers our fixed overhead costs, a
significant portion of disposal revenue generated from Event Business is
generally realized as operating income and net income. This strategy takes
advantage of the operating leverage inherent to the largely fixed-cost nature of
the waste disposal business. Contribution margin is influenced by
whether the waste may be directly disposed (“direct disposal”) or requires the
application of chemical reagents (variable costs) to treat the waste prior
to disposal.
To
maximize utilization of our railcar fleet, we periodically deploy available
railcars to transport waste from clean-up sites to disposal facilities operated
by other companies. Such transportation services may be bundled with
for-profit logistics and field services support work.
Grand View, Idaho RCRA/TSCA
Facility. Our Grand View, Idaho facility was purchased in
2001. It is located on 1,252 acres of Company-owned land about 60
miles southeast of Boise, Idaho in the Owyhee Desert. We own an additional 159
acres approximately two miles east of the facility, which is used as a clay
source for disposal unit liner construction and 189 acres where our rail
transfer station is located approximately 30 miles northeast of the disposal
site. The disposal facility is permitted to accept hazardous, toxic and
non-hazardous waste regulated under RCRA and TSCA. This facility is also
permitted to accept certain NORM and NARM radioactive material and LARM exempted
from NRC regulation for disposal purposes, including certain “mixed” hazardous
and radioactive waste generated by commercial and government customers including
certain waste received under our USACE contract. We also treat and “delist”
hazardous electric arc furnace dust (“K061”) from steel mills. Delisted waste is
subject to lower state fees applicable to non-hazardous waste. The facility is
regulated under permits issued by the Idaho Department of Environmental Quality
and the USEPA.
Robstown, Texas RCRA
Facility. Our Robstown Texas facility began operations in
1973. It is located on 240 acres owned by the Company near Robstown,
Texas about 10 miles west of Corpus Christi. In 2005, we purchased an additional
200 acres of adjacent land for future expansion. We also own 174 acres of
non-adjacent land where we have operated a rail transfer station since 2006.
This facility is permitted to accept hazardous and non-hazardous waste regulated
under RCRA. The facility is regulated under a permit issued by the TCEQ and is
permitted to accept certain LARM and mixed wastes. In 2008, we began providing
hydrocarbon treatment and recycling services using thermal desorption equipment
owned and operated by a third party under contract.
Beatty, Nevada RCRA/TSCA
Facility. Our Beatty, Nevada facility, which began receiving hazardous
waste in 1970, is located in the Amargosa Desert about 120 miles northwest of
Las Vegas, Nevada and about 30 miles east of Death Valley, California. USEN
leases 80 acres from the State of Nevada for hazardous and PCB waste treatment
and disposal operations. In April 2007, we renewed our lease with the State of
Nevada as a year-to-year periodic tenancy until (i) the site reaches full
capacity and can no longer accept waste (generally estimated at about 12-14
years); (ii) the lease is terminated by us at our option; or (iii) the State
terminates the lease due to our breach of the lease terms. All other terms,
including those relating to rents and fees, were unchanged from the previous
lease. The Company-leased land is located within a 400 acre buffer zone leased
by the State of Nevada from the federal government which the Company believes is
a viable location for future expansion. The facility is regulated under permits
issued by the Nevada Department of Environmental Protection and the USEPA. The
State of Nevada assesses disposal fees to fund a dedicated trust account to pay
for closure and post-closure costs.
Richland, Washington LLRW
Facility. Our Richland, Washington LLRW facility has been in operation
since 1965 and is located on 100 acres of land leased from the State of
Washington on the U.S. Department of Energy Hanford Reservation 35 miles west of
Richland, Washington. USEW subleases this property from the State of Washington.
The lease between the State of Washington and the federal government expires in
2063. We renewed our sublease with the State of Washington in July 2005 for 10
years with four 10-year renewal options. The facility is licensed by the
Washington Department of Health for health and safety purposes. The WUTC sets
disposal rates for LLRW. Rates are set at an amount sufficient to cover
operating costs and provide us with a reasonable profit. In 2007, we entered a
new rate agreement with the WUTC that expires January 1, 2014. The State of
Washington assesses user fees for local economic development, state regulatory
agency expenses and a dedicated trust account to pay for long-term care after
the facility closes. The State of Washington maintains a separate trust fund for
future closure expenses. The Richland facility is also home to our On-Site
Services group, which arranges LLRW and LARM waste packaging, shipment and
disposal services.
6
Non-Operating Disposal Facilities
Bruneau, Idaho RCRA Site.
This remote 83 acre desert site, acquired along with the Grand View,
Idaho disposal operation in 2001, was closed by the prior owner under an
approved RCRA plan. Post-closure monitoring is expected to continue for
approximately 20 more years in accordance with permit and regulatory
requirements.
Sheffield, Illinois RCRA
Site. We previously operated two hazardous waste disposal areas next to
the Sheffield LLRW disposal area. The first opened in 1968 and ceased operations
in 1974. The second accepted waste from 1974 through 1983. We expect to perform
groundwater remediation and monitoring at the site for approximately 16 more
years.
Winona, Texas Site. From 1980
to 1994, Gibraltar Chemical Resources operated the Winona hazardous waste
processing and deep well facility. In 1994, we purchased the facility. Solvent
recovery, deep well injection and waste brokering operations were conducted on a
nine acre site until 1997 when we ceased operations. We are proceeding under a
post-closure order with the State of Texas and expect to perform monitoring for
a 30 year post-closure care period. We own an additional 298 acres adjacent to
the permitted site.
INDUSTRY
In the
1970s and 1980s, industry growth was driven by new environmental laws and
actions by federal and state agencies to regulate existing hazardous waste
management facilities and direct the clean up of contaminated sites under the
federal Superfund law. By the early 1990s, excess hazardous waste management
capacity had been constructed by the waste services industry. At the same time,
to better manage risk and reduce expenses, many waste generators instituted
industrial process changes and other methods to reduce waste production. Waste
volumes shipped for disposal from Superfund and other properties also diminished
as contaminated sites were cleaned up. These factors led to highly competitive
market conditions that still apply today.
We
believe that a baseline demand for hazardous waste services will continue into
the future with fluctuations driven by general and industry-specific economic
conditions, identification of new clean-up needs, clean-up project schedules and
public policy decisions. We further believe that the ability to deliver
specialized niche services while aggressively competing for large volume
clean-up projects and non-niche commodity business opportunities differentiates
successful from less successful companies. We seek to control variable costs,
expand service lines, expand waste throughput capabilities, build market share
and ultimately increase profitability. Past initiatives that have successfully
contributed to our increased operating income include, but are not limited
to:
|
●
|
acquiring
our Grand View, Idaho treatment and disposal facility and rail transfer
station in 2001;
|
|
●
|
expanding
our radioactive material and hazardous waste permits to manage additional
types of waste;
|
|
●
|
expanding
our rail transportation services through a fleet of Company-owned rail
cars;
|
|
●
|
constructing
a second truck-to-rail transload building in Idaho and developing a rail
transfer station in Texas;
|
|
●
|
constructing
new, high-capacity waste treatment buildings in Texas and Nevada with
automated waste treatment additive delivery systems and expanded waste
storage capabilities;
|
|
●
|
opening
an organic chemical waste treatment laboratory in Texas to improve
treatment “recipes” and reduce costs at all three of our RCRA facilities;
and
|
|
●
|
establishing
a thermal recycling service at our Robstown, Texas site which allows the
facility to accept a broad spectrum of recyclable, hydrocarbon-based
materials.
|
Our
Richland, Washington disposal facility, serving the Northwest and Rocky Mountain
Compacts, is one of two operating Compact disposal facilities in the nation.
Both were in full operation for decades before passage of the federal LLRW
Policy Act in 1980. While our Washington disposal facility has substantial
unused capacity, it can only accept LLRW from the 11 western states comprising
the two Compacts served. The Barnwell, South Carolina site, operated by
EnergySolutions
exclusively serves the three-state Atlantic Compact. LLRW from states outside
the Northwest Compact region may be disposed at a non-compact, commercial
disposal site in Clive, Utah, also operated by EnergySolutions.
7
Pricing
at the three AEA licensed LLRW disposal facilities heightened demand for more
cost-effective disposal of soil, debris, consumer products, industrial wastes
and other materials containing LARM including “mixed wastes” exhibiting both
hazardous and radioactive properties. In addition to commercial demand, a
substantial amount of LARM is generated by government clean-up projects. The
NRC, USEPA and USACE have authorized the use of hazardous waste disposal
facilities to dispose of certain LARM, encouraging expansion of this compliant,
cost-effective alternative. Our Grand View, Idaho RCRA hazardous waste facility
has significantly increased waste throughput based on permit modifications
allowing expanded LARM acceptance. Our Robstown, Texas disposal facility is also
permitted to accept LARM on a more limited basis. We believe we are well
positioned to grow our LARM business based on our:
|
●
|
industry
reputation and commercial
branding;
|
|
●
|
existing
permits, including recent modifications allowing additional waste
types;
|
|
●
|
safety
and regulatory compliance
record;
|
|
●
|
decades
of experience safely handling radioactive materials at multiple
facilities;
|
|
●
|
high
volume waste throughput capabilities including rail transportation and
field services support; and
|
|
●
|
competitive
pricing.
|
Permits,
Licenses and Regulatory Requirements
Our
hazardous, industrial, non-hazardous and radioactive materials business is
subject to extensive federal and state environmental, health, safety, and
transportation laws, regulations, permits and licenses. Local government
controls also apply. The responsible government regulatory agencies regularly
inspect our operations to monitor compliance. They have authority to enforce
compliance through the suspension or revocation of operating licenses and
permits and the imposition of civil or criminal penalties in case of violations.
We believe that this body of law and regulations and the specialized services we
provide contribute to demand and represent a significant obstacle to new market
entrants.
RCRA
provides a comprehensive framework for regulating hazardous waste
transportation, treatment, storage and disposal. LARM and NORM/NARM may also be
managed under RCRA permits, as is authorized for our facilities in Grand View,
Idaho and Robstown, Texas. RCRA regulation is the responsibility of the USEPA,
which may delegate authority to state agencies. Chemical compounds and residues
derived from USEPA listed industrial processes are subject to RCRA standards
unless they are delisted through rulemaking such as the steel mill waste
treatment process employed at our Grand View, Idaho facility. RCRA liability may
be imposed for improper waste management or failure to take corrective action
for releases of hazardous substances. To the extent wastes are recycled or
beneficially reused, regulatory controls and permitting requirements under RCRA
diminish.
CERCLA
and its amendments impose strict, joint and several liability on owners or
operators of facilities where a release of hazardous substances has occurred, on
parties who generated hazardous substances released at such facilities and on
parties who arranged for the transportation of hazardous substances. Liability
under CERCLA may be imposed if releases of hazardous substances occur at
treatment, storage, or disposal sites. Since waste generators are subject to the
same liabilities, we believe that they are motivated to minimize the number of
disposal sites used. Disposal facilities require USEPA authorization to receive
CERCLA wastes. Our three hazardous waste disposal facilities have this
authorization.
TSCA
regulates the treatment, storage and disposal of PCBs. Regulation and licensing
of PCB wastes is the responsibility of the USEPA. Our Grand View, Idaho and
Beatty, Nevada disposal facilities have TSCA treatment, storage and disposal
permits. Our Texas facility has a TSCA storage permit and may dispose of
PCB-contaminated waste in limited concentrations not requiring a TSCA disposal
permit.
The AEA
assigns the NRC regulatory authority over receipt, possession, use and transfer
of certain radioactive materials, including disposal. The NRC has adopted
regulations for licensing commercial LLRW disposal and has delegated regulatory
authority to certain states including Washington, where our Richland facility is
located. The NRC and U.S. Department of Transportation regulate the transport of
radioactive materials. Shippers must comply with both the general requirements
for hazardous materials transportation and specific requirements for
transporting radioactive materials.
The
Energy Policy Act of 2005 amended the AEA to classify discrete (i.e.
concentrated versus diffuse) NORM/NARM as byproduct material. The law does not
apply to interstate Compacts ratified by Congress pursuant to the LLRW Policy
Act. NRC regulations issued in 2006 to implement the law limit receipt of
certain NARM waste at our Grand View, Idaho facility to non-production
accelerators. This did not materially affect our Idaho business and
did not affect our Washington business.
8
Obtaining
authorization to construct and operate new radioactive or hazardous waste
facilities is a lengthy and complex process. We believe we have demonstrated
significant expertise in this area. We also believe we possess all permits,
licenses and regulatory approvals required to maintain regulatory compliance and
operate our facilities and have the specialized expertise required to obtain
additional approvals to continue growing our business in the
future.
We incur
costs and make capital investments to comply with environmental regulations.
These regulations require that we operate our facilities in accordance with
permit-specific requirements. Our Idaho and Texas facilities are also
required to provide required financial assurance for closure and post-closure
obligations should our facilities cease operations. Both human
resource and capital investments are required to maintain compliance with these
requirements.
Insurance,
Financial Assurance and Risk Management
We carry
a broad range of insurance coverage, including general liability, automobile
liability, real and personal property, workers’ compensation, directors’ and
officers’ liability, environmental impairment liability and other coverage
customary to the industry. We do not expect the impact of any known casualty,
property, environmental or other contingency to be material to our financial
condition, results of operations or cash flows.
As noted
above, applicable regulations require financial assurance to cover the cost of
final closure and post-closure obligations at certain of our operating and
non-operating disposal facilities. Acceptable forms of financial assurance
include third-party standby letters of credit, surety bonds and insurance.
Alternatively, we may be required to collect fees from waste generators to fund
state-controlled escrow or trust accounts during the operating life of the
facility. Through December 31, 2009, we have met our financial assurance
requirements through insurance, standby letters of credit and self-funded
restricted trusts.
Insurance
policies covering our closure and post-closure obligation were renewed in
December 2005 and expire in December 2010. Under the renewal terms, we
established an interest bearing trust account to guarantee our non-operating
site closure and post-closure liability, subject to regulatory approval. We are
also required by our insurer to maintain collateral equal to 15% of our
aggregate financial assurance insurance policies for our operating sites through
the policy term. While we expect to timely renew these policies, if we are
unable to obtain adequate closure, post-closure or environmental insurance in
the future, any partial or completely uninsured claim against us, if successful,
could have a material adverse effect on our financial condition, results of
operations and cash flows. Failure to maintain adequate financial assurance
could also result in regulatory action including early closure of facilities. As
of December 31, 2009, we have provided collateral of $4.8 million in funded
trust agreements, issued $4.0 million in letters of credit for financial
assurance and have insurance policies of approximately $34 million for closure
and post-closure obligations. While we have been able to obtain the required
financial assurance, premium and collateral requirements may increase, which may
have an adverse impact on our results of operations.
Primary
casualty insurance programs generally do not cover accidental environmental
contamination losses. To provide insurance protection for potential claims, we
maintain environmental impairment liability insurance and professional
environmental consultant’s liability insurance for non-nuclear occurrences. For
nuclear liability coverage, we maintain Facility Form and Workers’ Form nuclear
liability insurance provided under the federal Price Anderson Act. This
insurance covers the operations of our facilities, suppliers and transporters.
We purchase primary property, casualty and excess liability policies through
traditional third-party insurance carriers.
Significant
Customers
We
dispose of LARM and hazardous waste under a contract with the
USACE. We also arrange transportation of waste to our disposal
facilities for both government and industry customers which contributes
significant revenue. In June 2005, we entered into an Event Business clean-up
project contract with Honeywell International, Inc. (“Honeywell”) to transport,
treat and dispose approximately 1.3 million tons of chromite ore processing
residue at our Grand View, Idaho disposal facility. This clean-up project was
completed in October 2009. Honeywell accounted for 38%, 43% and 41% of our
revenue in 2009, 2008 and 2007 respectively. No other customer
accounted for more than 10% of revenue for 2009, 2008 or 2007.
Markets
Disposal Services. Waste
containing heavy metals or hazardous waste that does not require treatment prior
to disposal is generally commoditized and subject to highly competitive pricing.
These commoditized services are also sensitive to transportation distance and
related costs. Waste transported by rail is typically less expensive, on a per
mile basis, than waste transported by truck. Hazardous waste containing organic
chemical compounds and LARM services are less of a commoditized
service.
9
Our
Robstown, Texas hazardous waste facility is well positioned to serve refineries,
chemical production plants and other industries concentrated near the Texas Gulf
coast. The facility also accepts certain NORM and LARM. In 2006, we constructed
a rail transfer station approximately five miles
from this facility that extends the facility’s geographic reach. In 2007, our
Texas facility expanded its laboratory to include analysis of organic chemical
compounds, which are contained in many of the wastes produced by customers. In
June 2008, we began operating a high-throughput thermal desorption unit at the
facility which allows us to accept a broad spectrum of recyclable,
hydrocarbon-based materials.
Our
Beatty, Nevada facility primarily competes for business in California, Arizona,
Utah and Nevada. Due to the site’s superior geologic and climate conditions in
the Amargosa Desert, the Beatty, Nevada facility also competes for wastes from
more distant locations. The Beatty, Nevada facility competes over a larger
geographic area for PCB waste due to the more limited number of TSCA disposal
facilities nationwide.
Our Grand
View, Idaho facility accepts waste from across the nation shipped through our
rail transfer station located adjacent to a main east-west rail line. Waste
throughput has been significantly enhanced by rail track expansions in 2006 and
2008 and the construction of a second rail-to-truck indoor transfer building in
2006. The Grand View facility’s primary markets are RCRA, LARM and mixed waste
clean-up projects, and brokered waste. Permit modifications have expanded LARM
services. Substantial waste volumes have been received under our contract with
Honeywell which was completed in October of 2009, and a contract with the USACE
that is also utilized by other federal agencies. The current USACE contract
expires in 2010; however, multi-year projects initiated before that date may
continue for five years beyond 2010 under the same terms. Based on past public
statements, we believe that the USACE generally expects the federal clean-up
program funding the contract to continue through 2021. For this reason and due
to limited competition, we expect to enter a follow-on contract in
2010.
To meet
USEPA land disposal restrictions (“LDRs”), waste stabilization, encapsulation,
chemical oxidation and other treatment technologies are used at our Grand View,
Idaho, Beatty, Nevada and Robstown, Texas facilities. These capabilities allow
all three sites to manage a much broader spectrum of wastes than if LDR
treatment was not offered. Our Robstown, Texas facility also offers
thermal desorption treatment and recycling services.
Our
Richland, Washington disposal facility serves LLRW producers in the eight states
of the Northwest Compact. The three Rocky Mountain Compact states may also use
our facility. Since we are a designated monopoly LLRW service provider in the
Northwest Compact, the State of Washington approves our disposal rates. Since
NORM/NARM is not subject to Compact restrictions, we may accept this waste from
all fifty states. Rate regulation does not apply to NORM/NARM pricing since
monopoly conditions do not apply.
Competition
We
compete with large and small companies in each of the commercial markets we
serve. While niche services apply, the radioactive, hazardous and non-hazardous
industrial waste management industry is generally very competitive. We believe
that our primary hazardous waste and PCB disposal competitors are Clean Harbors,
Inc., Waste Control Specialists, LLC and Waste Management, Inc. We believe that
our primary radioactive material disposal competitors are EnergySolutions, Inc. and Waste
Control Specialists, LLC. The principal competitive factors applicable to both
of these business areas are:
|
●
|
price;
|
|
●
|
specialized
permits and “niche” service
offerings;
|
|
●
|
customer
service;
|
|
●
|
operational
efficiency and technical
expertise;
|
|
●
|
regulatory
compliance and worker safety;
|
|
●
|
industry
reputation and brand name
recognition;
|
|
●
|
transportation
distance; and
|
|
●
|
local
community support.
|
10
We
believe that we are competitive in all markets we serve and that we offer a
nationally unique mix of services, including niche technologies and services
that favorably distinguish us from competitors. We also believe that our strong
brand name recognition from more than five decades of experience, compliance and
safety record, customer service reputation and positive relations with
regulators and local communities enhance our competitive position. Advantages
exist for competitors that have technology, permits or equipment to handle a
broader range of waste, that operate in jurisdictions imposing lower disposal
fees and/or are located closer to where wastes are generated.
We do not
compete with companies seeking federal government contracts to manage and/or
operate radioactive waste treatment and disposal facilities owned by the U.S.
Department of Energy (“USDOE”). We accept minimal amounts of remediation waste
from USDOE facilities at Company disposal facilities from time to time; however,
this is not a material part of our business.
Seasonal
Effects
Market
conditions and federal funding decisions generally have a larger effect on
revenue than does seasonality. Operating revenue is generally lower in the
winter months, however, and increases when short-term, weather-influenced
clean-up projects are more frequently undertaken. While large, multi-year
clean-up projects tend to continue in winter months, the pace of waste shipments
may be slower due to weather.
Personnel
On
December 31, 2009, we had 221 employees, of which 10 were members of the Paper,
Allied-Industrial Chemical & Energy Workers International Union, AFL-CIO and
CLC (PACE) at our Richland, Washington facility.
Executive
Officers of Registrant
The
following table sets forth the names, ages and titles, as well as a brief
account of the business experience of each person who is an executive officer of
US Ecology:
|
Name
|
Age
|
Title
|
||
|
James
R. Baumgardner
|
47
|
President
and Chief Executive Officer
|
||
|
Simon
G. Bell
|
39
|
Vice
President of Operations
|
||
|
John
M. Cooper
|
55
|
Vice
President and Chief Information Officer
|
||
|
Jeffrey
R. Feeler
|
40
|
Vice
President and Chief Financial Officer
|
||
|
Eric
L. Gerratt
|
39
|
Vice
President and Controller
|
||
|
Steven
D. Welling
|
51
|
Senior
Vice President, Sales and
Marketing
|
James R.
Baumgardner was appointed President
and Chief Executive Officer in January 2010. Mr. Baumgardner
previously served as the Company’s President and Chief Operating Officer from
January 2009 to January 2010 and as the Company’s Senior Vice President and
Chief Financial Officer from 1999 to 2006. From 2006 to 2008, he was
Senior Vice President and Chief Financial Officer with SECOR International Inc.,
a Redmond, Washington based provider of environmental consulting
services. Prior to 1999, he held various positions in corporate
banking, corporate treasury and investment banking. He holds an MBA
and a BS from Oregon State University.
Simon G.
Bell was appointed Vice President of Operations in August of 2007 and is
responsible for managing both operating and closed facilities. From 2005 to
August 2007, he was Vice President of Hazardous Waste Operations and from 2002
to 2005, our Idaho facility General Manager and Environmental Manager. His 18
years of industry experience includes service as general manager of a competitor
disposal facility and mining industry experience in Idaho, Nevada and South
Dakota. He holds a BS in Geology from Colorado State University.
John M.
Cooper joined us in July 2002 and is Vice President and Chief Information
Officer. Previously, he served as Vice President, Information Systems for BMC
West Corporation and was Director of Business Development for the High Tech
Industry at Oracle Corporation. Mr. Cooper offers more than 20 years of computer
industry experience. He holds a BS in Physics from Utah State
University.
Jeffrey R.
Feeler was appointed Vice President, Chief Financial Officer, Treasurer
and Secretary in May 2007. He joined US Ecology in 2006 as Vice President,
Controller, Chief Accounting Officer, Treasurer and Secretary. He previously
held financial and accounting management positions with MWI Veterinary Supply,
Inc. (2005-2006), Albertson’s, Inc. (2003-2005) and Hewlett-Packard Company
(2002-2003). From 1993 to 2002, he held various accounting and auditing
positions for PricewaterhouseCoopers LLP. Mr. Feeler is a Certified Public
Accountant and holds a BBA of Accounting and a BBA of Finance from Boise State
University.
11
Eric L. Gerratt
joined US Ecology in August 2007 as Vice President and
Controller. He previously held various financial and accounting
management positions at SUPERVALU, Inc (2006-2007) and Albertson’s, Inc.
(2003-2006). From 1997 to 2003, he held various accounting and
auditing positions for PricewaterhouseCoopers LLP. Mr. Gerratt is a
Certified Public Accountant and holds a BS in Accounting from the University of
Idaho.
Steven D.
Welling joined us in 2001 through the Envirosafe Services of Idaho (now
US Ecology Idaho) acquisition. He previously served as National Accounts Manager
for Envirosource Technologies and Western Sales Manager for Envirosafe Services
of Idaho and before that managed new market development and sales for a national
bulk chemical transportation company. Mr. Welling holds a BS from California
State University-Stanislaus.
Item
1A. Risk Factors
In
addition to the factors discussed elsewhere in this Form 10-K, the
following are important factors which could cause actual results or events to
differ materially from those contained in any forward-looking statements made by
or on behalf of us.
A
significant portion of our business depends upon non-recurring event clean-up
projects over which we have no control.
A
significant portion of our disposal revenue is attributable to discrete Event
Business which varies widely in size, duration and unit pricing. For the year
ended December 31, 2009, approximately 44% of our treatment and disposal
revenues were derived from Event Business projects. The one-time nature of Event
Business necessarily creates variability in revenue and earnings. This
variability is further influenced by service mix, general economic conditions,
funding availability, changes in laws and regulations, government enforcement
actions, public controversy, litigation, weather, property redevelopment plans
and other factors. As a result of this variability, we can experience
significant quarter-to-quarter and year-to-year volatility in revenue, gross
profit, gross margin, operating income and net income. Also, while many large
project opportunities are identifiable years in advance, both large and small
project opportunities also routinely arise with little prior notice. This
uncertainty, which is inherent to the hazardous and radioactive waste disposal
industry, is factored into our budgeting and externally communicated business
projections. Our projections combine historical experience with
identified sales pipeline opportunities and planned initiatives for new or
expanded service lines. A reduction in the number and size of new clean-up
projects won to replace completed work could have a material adverse affect on
our business.
The
completion of, loss of or failure to renew one or more significant contracts
could adversely affect our profitability.
Our
multiple year Honeywell Jersey City project was completed in October
2009. Under this four year contract, which began in 2005, we received
approximately 1.3 million tons of waste at our Grand View, Idaho facility.
Revenue from Honeywell represented 38%, 43% and 41% of total revenue in 2009,
2008 and 2007, respectively. Waste received from the Honeywell Jersey
City project contained high metals concentrations of chromite ore processing
residue soil and debris that is a commodity material resulting in the waste
stream being one of our lower margin treatment services. However, in 2009 we
experienced increased profitability on the waste received from Honeywell
as a result of an approximate 30% reduction in our additive costs used to treat
the waste prior to disposal, a reduction in personnel as we prepared for the end
of the project and, to a limited degree, increased logistics and processing
efficiencies realized over the duration of the project. At the same time,
economic conditions significantly impacted our non-Honeywell business resulting
in the Honeywell portion of our business becoming a more significant portion of
our total overall business. As a result, operating income generated from the
Honeywell Jersey City project grew to an estimated 30% of our total operating
income, more than in any other year. We expect that replacement of revenue and
operating income from the Honeywell Jersey City project to come from our
expanded treatment and disposal capabilities, expanded permits, thermal
recycling services, utilization of our railcar fleet to secure other
unidentified remedial cleanup projects, expanding services to waste brokers and
strategic acquisitions. The time frame required to replace the Honeywell Jersey
City project revenue and earnings is dependent on a number of factors, many of
which are outside the control of the Company, including but not limited to
general economic conditions, capital in the commercial credit markets, general
level of government funding on environmental matters, real estate development
and other industrial investment opportunities. If we are unable to
replace the contribution from the Honeywell Jersey City project with new
projects could result in a material adverse affect on our business.
We have a
multiple year contract with the USACE which accounted for approximately 8% of
our total revenues for the year ended December 31, 2009. We have a
long-term disposal contract with the USACE that was scheduled to expire in 2009
but has been extended to expire in 2010. While multi-year USACE
projects may continue under the contract for up to five years beyond 2010, the
contract does not guarantee any funding beyond assigned project-specific task
orders or a follow-on contract for projects first awarded after 2010. Reduced
appropriations for the USACE and/or other government clean-up work, a reduction
in project-specific task orders, and/or the loss of or failure to renew these or
other large contracts and task orders combined with failure to replace their
contribution with new projects could result in a material adverse affect on our
business.
12
Adverse economic conditions, government funding or competitive pressures affecting our customers could harm our business.
We serve
oil refineries, chemical production plants, steel mills, waste
broker-aggregators serving small manufacturers and other industrial customers
that are, or may be, affected by changing economic conditions and competition.
These customers may be significantly impacted by a deterioration in general
economic conditions and may curtail waste production and/or delay spending on
plant maintenance, waste clean-up projects and other discretionary
work. Spending by government agencies may also be reduced due to
declining tax revenues that may result from a general deterioration in economic
conditions. Factors that can impact general economic conditions and
the level of spending by our customers include the general level of consumer and
industrial spending, increases in fuel and energy costs, residential and
commercial real estate and mortgage market conditions, labor and healthcare
costs, access to credit, consumer confidence and other macroeconomic factors
affecting spending behavior. Market forces may also compel customers
to cease or reduce operations, declare bankruptcy, liquidate or relocate to
other countries, any of which could adversely affect our business.
Our
operations are significantly affected by the commencement and completion of both
large and multiple, smaller clean-up projects; potential seasonal fluctuations
due to weather; budgetary decisions and cash flow limitations influencing the
timing of customer spending for remedial activities; the timing of regulatory
agency decisions and judicial proceedings; changes in government regulations and
enforcement policies and other factors that may delay or cause the cancellation
of clean-up projects. We do not control such factors, which can cause our
revenue and income to vary significantly from quarter-to-quarter and
year-to-year.
If
we fail to comply with applicable laws and regulations our business could be
adversely affected.
The
changing regulatory framework governing our business creates significant risks.
We could be held liable if our operations cause contamination of air,
groundwater or soil. Under current law, we may be held liable for damage caused
by conditions that existed before we acquired the assets or operations involved.
Also, we may be liable if we arrange for the transportation, disposal or
treatment of hazardous substances that cause environmental contamination at
facilities operated by others, or if a predecessor made such arrangements and we
are a successor. Liability for environmental damage could have a material
adverse effect on our financial condition, results of operations and cash
flows.
Stringent
regulations of federal and state governments have a substantial impact on our
business. Local government controls also apply. Many complex laws, rules, orders
and regulatory interpretations govern environmental protection, health, safety,
land use, zoning, transportation and related matters. Failure to obtain on a
timely basis or comply with applicable federal, state and local governmental
regulations, licenses, permits or approvals for our waste treatment and disposal
facilities could prevent or restrict our ability to provide certain services,
resulting in a potentially significant loss of revenue and earnings. Changes in
environmental regulations may require us to make significant capital or other
expenditures. Changes in laws or regulations or changes in the enforcement or
interpretation of existing laws regulations or permitted activities may require
us to modify existing operating licenses or permits, or obtain additional
approvals. New governmental requirements that raise compliance standards or
require changes in operating practices or technology may impose significant
costs and/or limit operations.
Our
revenues are primarily generated as a result of requirements imposed on our
customers under federal and state laws, and regulations to protect public health
and the environment. If requirements to comply with laws and regulations
governing management of PCB, hazardous or radioactive waste were relaxed or less
vigorously enforced, demand for our services could materially decrease and our
revenues and earnings could be significantly reduced.
Our
market is highly competitive. Failure to compete successfully could have a
material adverse effect on our business, financial condition and results of
operation.
We face
competition from companies with greater resources, service offerings we do not
provide and lower pricing in certain instances. An increase in the
number of commercial treatment or disposal facilities for hazardous or
radioactive waste, significant expansion of existing competitor permitted
capabilities or a decrease in the treatment or disposal fees charged by
competitors could materially and adversely affect our results of operations. Our
business is also heavily affected by waste tipping fees imposed by government
agencies. These fees, which vary from state to state and are periodically
adjusted, may adversely impact the competitive environment in which we conduct
our business.
13
If
we are unable to obtain regulatory approvals and contracts for construction of
additional disposal space by the time our current disposal capacity is
exhausted, our business would be adversely affected.
Construction
of new disposal capacity at our operating disposal facilities beyond currently
permitted capacity requires state regulatory agency
approvals. Administrative processes for such approval reviews
vary. The State of Texas, which regulates our Robstown facility,
provides for an adjudicatory hearing process administered by a hearing officer
appointed by the State. While we have historically been successful in obtaining
timely approvals for proposed disposal facility expansions including those
involving adjudicatory processes, there can be no assurance that we will be
successful in obtaining future expansion approvals in a timely manner or at
all. If we are not successful in receiving these approvals, our
disposal capacity could eventually be exhausted, preventing us from accepting
additional waste at an affected facility. This would have a material
adverse effect on our business.
We
may not be able to obtain timely or cost effective transportation services which
could adversely affect our profitability.
Revenue
at each of our facilities is subject to potential risks from disruptions in rail
or truck transportation services relied upon to deliver waste to our facilities.
Increases in fuel costs and unforeseen events such as labor disputes, public
health pandemics, natural disasters and other acts of God, war, or terror could
prevent or delay shipments and reduce both volumes and revenue. Our rail
transportation service agreements with our customers generally allow us to pass
on fuel surcharges assessed by the railroads, which decrease or eliminate our
exposure to fuel cost increases. Transportation services may be limited by
economic conditions, including increased demand for rail or trucking services,
resulting in periods of slower service to the point that individual customer
needs cannot be met. No assurance can be given that we can procure
transportation services in a timely manner at competitive rates or pass through
fuel cost increases in all cases. Such factors could also limit our ability to
achieve revenue and earnings objectives.
If
we are unable to obtain at a reasonable cost the necessary levels of insurance
and financial assurances required for operations, our business and results of
operations would be adversely affected.
We are
required by law, license, permit, and prudence to maintain various insurance
instruments and financial assurances. We carry a broad range of insurance
coverages that are customary for a company of our size in our business. We
obtain these coverages to mitigate risk of loss, allowing us to manage our
self-insured exposure from potential claims. We are self-insured for employee
health-care coverage. Stop-loss insurance is carried covering liability on
claims in excess of $150,000 per individual or on an aggregate basis for the
monthly population. Accrued costs related to the self-insured health care
coverage were $212,000 and $234,000 at December 31, 2009 and 2008, respectively.
We also maintain a Pollution and Remediation Legal Liability Policy pursuant to
RCRA regulations subject to a $250,000 self-insured retention. In addition, we
are insured for consultant’s environmental liability subject to a $100,000
self-insured retention. We are also insured for losses or damage to third party
property or people subject to a $50,000 self-insured retention. If our insurers
were unable to meet their obligations, or our own obligations for claims were
more than expected, there could be a material adverse effect to our financial
condition and results of operation.
Through
December 31, 2009, we have met our financial assurance requirements through
insurance. Our current closure and post-closure policies were renewed in
December 2005 and expires in December 2010. This renewal required us to
establish a self-fund trust for our non-operating site closure and post-closure
liability and provide collateral equal to 15% of financial assurance through the
term of the policy. We currently have in place all financial assurance
instruments necessary for our operations. While we expect to continue renewing
these policies, if we were unable to obtain adequate closure, post-closure or
environmental insurance in the future, any partially or completely uninsured
claim against us, if successful and of sufficient magnitude, could have a
material adverse effect on our results of operations and cash flows.
Additionally, continued access to casualty and pollution legal liability
insurance with sufficient limits, at acceptable terms, is important to obtaining
new business. Failure to maintain adequate financial assurance could also result
in regulatory action including early closure of facilities. As of December 31,
2009, we have provided collateral of $4.8 million in funded trust agreements and
issued $4.0 million in letters of credit through our primary bank for financial
assurance insurance policies of approximately $34 million for closure and
post-closure obligations. While we believe we will be able to maintain the
requisite financial assurance policies at a reasonable cost, premium and
collateral requirements may materially increase. Such increases could
have a material adverse effect on our financial condition and results of
operations.
14
Loss
of key management or sales personnel could harm our business.
We have
an experienced management team and rely on the continued service of our senior
managers to achieve our objectives. We also have a senior sales team with
industry experience averaging over 15 years. Our objective is to retain our
present management and sales teams and identify, hire, train, motivate and
retain highly skilled personnel. The loss of any key management employee or
sales personnel could adversely affect our business and results of
operations.
The
hazardous and radioactive waste industry in which we operate is subject to
litigation risk.
The
handling of radioactive, PCBs and hazardous material subjects us to potential
liability claims by employees, contractors, property owners, neighbors and
others. There can be no assurance that our existing liability insurance is
adequate to cover claims asserted against us or that we will be able to maintain
adequate insurance in the future. Adverse rulings in legal matters could also
have a material adverse effect on our financial condition and results of
operations.
Our
business requires the handling of dangerous substances. Improper handling of
such substances could result in an adverse impact on our business.
We are
subject to unexpected occurrences related, or unrelated, to the routine handling
of dangerous substances. A fire or other incident, such as the fire in 2004 in
our Robstown, Texas waste treatment building, could impair one or more
facilities from performing normal operations. This could have a material adverse
impact on our financial condition and results of operations. Improper handling
of these substances could also violate laws and regulations resulting in fines
and/or suspension of operations.
Failure to perform under our
contracts may adversely harm our business.
Certain
contracts require us to meet specified performance criteria. Our ability to meet
these criteria requires that we expend significant resources. If we or our
subcontractors are unable to perform as required, we could be subject to
substantial monetary penalties and/or loss of the affected contracts which may
adversely affect our business.
We
may not be able or willing to pay future dividends.
Our
ability to pay dividends is subject to our future financial condition and
certain conditions such as continued compliance with bank covenants. Our Board
of Directors must also approve any dividends at their sole discretion. Pursuant
to our credit agreement, we may only declare quarterly or annual dividends if on
the date of declaration no event of default has occurred, no other event or
condition that upon notice or continuation would constitute a default, and
payment of the dividend will not result in a default. Unforeseen events or
situations could cause non-compliance with these bank covenants, or cause the
Board of Directors to discontinue or reduce the amount of any dividend
payment.
We may not be able to effectively
implement thermal desorption recycling and other new
technologies.
We expect
to continue implementing new technologies at our facilities. If we
are unable to obtain targeted revenue streams from the thermal desorption
recycling technology placed into service at our Robstown, Texas facility in 2008
our financial condition and results of operations could be adversely
impacted. This could occur due to any number of risk factors
including changes in market conditions including increased competition, outlets
for recycled materials, equipment malfunction, disputes with the equipment
owner/operator, the performance of the owner/operator in meeting its contractual
obligations, regulatory compliance, and equipment operation and maintenance
costs. In addition, if we are unable to identify and implement other
new technologies in response to market conditions and customer requirements in a
timely, cost effective manner, our financial condition and results of operations
could also be adversely impacted.
Integration
of potential acquisitions may impose substantial costs and delays and cause
other unanticipated adverse impacts.
Acquisitions
involve multiple risks. Our inability to successfully integrate the operations
of an acquired business into our operations could have a material adverse effect
on our business. These risks include but are not limited to:
|
●
|
changing
market conditions;
|
|
●
|
increased
competition;
|
|
●
|
the
need to spend substantial operational, financial and management resources
integrating new businesses, technologies and processes and related
difficulties integrating the operations, personnel or
systems;
|
15
|
●
|
retention
of key personnel and
customers;
|
|
●
|
impairments
of goodwill and other intangible assets;
and
|
|
●
|
environmental
and other liabilities associated with past
operations.
|
Item 1B. Unresolved Staff Comments
None.
Item
2. Properties
The
following table describes our non-disposal related properties and facilities at
December 31, 2009 owned or leased by us.
|
Location
|
Segment
|
Function
|
Size
|
Own/Lease
|
||||
|
Boise,
Idaho
|
Corporate
|
Corporate
office
|
11,492
sq. ft.
|
Lease
|
||||
|
Elmore
County, Idaho
|
Operating
Disposal Facility
|
Rail
transfer station
|
189
acres
|
Own
|
||||
|
Robstown,
Texas
|
Operating
Disposal Facility
|
Rail
transfer station
|
174
acres
|
Own
|
||||
|
Bruneau,
Idaho
|
Non-operating
Disposal Facility
|
Former
disposal facility
|
83
acres
|
Own
|
||||
|
Sheffield,
Illinois
|
Non-operating
Disposal Facility
|
Former
disposal facility
|
374
acres
|
Own
|
||||
|
Winona,
Texas
|
Non-operating
Disposal Facility
|
Former
deep well facility
|
298
acres
|
Own
|
||||
The
following table describes our treatment and disposal properties owned or leased
by us, total acreage owned or controlled by us at the facility, estimated amount
of permitted airspace available at each facility, the estimated amount of
non-permitted airspace and the estimated life at each facility. All estimates
are as of December 31, 2009.
|
Location
|
Own/Lease
|
Total
Acreage
|
Permitted
Airspace
(Cubic
Yards)
|
Non-Permitted
Airspace
(Cubic
Yards)
|
Estimate Life
(in
years)
|
||||||
|
Beatty,
Nevada
|
Lease
|
80
|
1,494,372
|
-
|
14
|
||||||
|
Grand
View, Idaho
|
Own
|
1,411
|
2,034,825
|
28,100,000
|
81
|
||||||
|
Robstown,
Texas
|
Own
|
440
|
2,209,409
|
-
|
19
|
||||||
|
Richland,
Washington (1)
|
Sublease
|
100
|
661,330
|
-
|
46
|
||||||
_______________________
|
(1)
|
The
Richland, Washington facility is on land subleased from the State of
Washington. Our sublease has 6 years remaining on the base term with four
10-year renewal options, giving us control of the property until the year
2055 provided that we meet our obligations and operate in a compliant
manner. The facility’s intended operating life is equal to the period of
the sublease.
|
Item
3. Legal Proceedings
In the
ordinary course of business, we are involved in judicial and administrative
proceedings involving federal, state or local governmental authorities. Actions
may also be brought by individuals or groups in connection with alleged
violations of existing permits, alleged damages from exposure to hazardous
substances purportedly released from our operated sites, provision of services
to customers, disputes with employees, contractors or vendors and other
litigation. We maintain insurance coverage for property and damage claims which
may be asserted against us. Periodically, management reviews and may establish
or adjust reserves for legal and administrative matters, or fees expected to be
incurred in connection therewith. As of December 31, 2009, we did not have any
ongoing, pending or threatened legal action that management believes would have
a material adverse effect on our financial position, results of operations or
cash flows.
16
Item 4. Intentionally Omitted
PART
II
Item
5. Market For Registrant’s Common Equity, Related Stockholder Matters And Issuer
Purchases Of Equity Securities
Our
common stock is listed on the NASDAQ Global Select Market under the symbol ECOL.
As of February 19, 2010 there were approximately 10,423 beneficial owners of our
common stock. High and low sales prices for the common stock for each quarter in
the last two years are shown below:
|
2009
|
2008
|
|||||||||||||||||
|
High
|
Low
|
High
|
Low
|
|||||||||||||||
|
First
Quarter
|
$ | 21.21 | $ | 13.56 | $ | 26.84 | $ | 18.51 | ||||||||||
|
Second
Quarter
|
$ | 20.42 | $ | 13.59 | $ | 30.54 | $ | 24.50 | ||||||||||
|
Third
Quarter
|
$ | 19.73 | $ | 15.87 | $ | 33.83 | $ | 24.73 | ||||||||||
|
Fourth
Quarter
|
$ | 19.90 | $ | 15.97 | $ | 27.73 | $ | 14.17 | ||||||||||
The
following graph compares the five-year cumulative total return on our common
stock with the comparable five-year cumulative total returns of the NASDAQ
Composite Index and a waste
industry peer group of publicly traded companies for fiscal year
2009. The companies which make up the selected industry peer group
are Clean Harbors, Inc; Perma-Fix Environmental Services, Inc; and Waste
Management Inc. The graph assumes that the value of the investment in US Ecology
common stock and each index was $100 at December 31, 2003 and assumes the
reinvestment of dividends. The chart below the graph sets forth the data points
in dollars as of December 31 of each year.
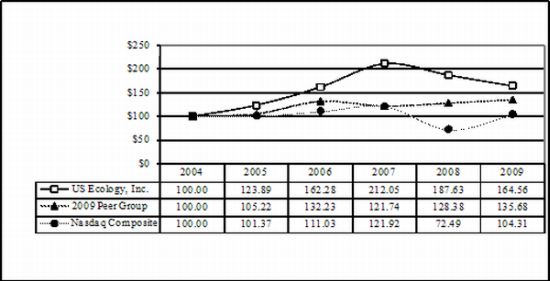
17
We have
paid the following dividends on our common stock ($s in thousands except per
share amounts):
|
2009
|
2008
|
||||||||||||||||
|
Per
share
|
Dollars
|
Per
share
|
Dollars
|
||||||||||||||
|
First
Quarter
|
$ | 0.18 | $ | 3,267 | $ | 0.15 | $ | 2,737 | |||||||||
|
Second
Quarter
|
0.18 | 3,267 | 0.15 | 2,737 | |||||||||||||
|
Third
Quarter
|
0.18 | 3,267 | 0.18 | 3,286 | |||||||||||||
|
Fourth
Quarter
|
0.18 | 3,267 | 0.18 | 3,294 | |||||||||||||
|
Total
|
$ | 0.72 | $ | 13,068 | $ | 0.66 | $ | 12,054 | |||||||||
In June
2008, we entered into a credit facility with Wells Fargo Bank that provides us
with $15.0 million of unsecured borrowing capacity and matures on June 15, 2010.
Pursuant to our credit agreement, we may only declare quarterly or annual
dividends if on the date of declaration, no event of default has occurred, or no
other event or condition has occurred that would constitute an event of default
after giving effect to the payment of the dividend. No events of
default have occurred to date.
Item
6. Selected Financial Data
This
summary should be read in conjunction with the consolidated financial statements
and related notes.
|
$s
in thousands, except for per share data
|
2009
|
2008
|
2007
|
2006
|
2005
|
|||||||||||||||
|
Revenue
|
$ | 132,519 | $ | 175,827 | $ | 165,520 | $ | 116,838 | $ | 79,387 | ||||||||||
|
Insurance
proceeds
(1)
|
661 | - | - | 704 | 901 | |||||||||||||||
|
Operating
income
|
23,102 | 34,521 | 30,867 | 24,458 | 19,432 | |||||||||||||||
|
Gain
on settlement of litigation (2)
|
- | - | - | - | 5,327 | |||||||||||||||
|
Income
tax expense (benefit)
|
9,513 | 13,735 | 12,322 | 9,979 | 9,676 | |||||||||||||||
|
Net
income
|
13,970 | 21,498 | 19,396 | 15,889 | 15,438 | |||||||||||||||
|
Earnings
per share - basic
|
$ | 0.77 | $ | 1.18 | $ | 1.06 | $ | 0.88 | $ | 0.88 | ||||||||||
|
Earnings
per share - diluted:
|
$ | 0.77 | $ | 1.18 | $ | 1.06 | $ | 0.87 | $ | 0.86 | ||||||||||
|
Shares
used in earnings per share calculation:
|
||||||||||||||||||||
|
Basic
|
18,146 | 18,236 | 18,217 | 18,071 | 17,570 | |||||||||||||||
|
Diluted
|
18,173 | 18,290 | 18,257 | 18,202 | 17,950 | |||||||||||||||
|
Dividends
paid per share
|
$ | 0.72 | $ | 0.66 | $ | 0.60 | $ | 0.60 | $ | 0.30 | ||||||||||
|
Total
assets
|
$ | 123,662 | $ | 127,445 | $ | 117,076 | $ | 104,041 | $ | 89,396 | ||||||||||
|
Working
capital (3)
|
38,830 | 36,892 | 29,846 | 24,459 | 31,484 | |||||||||||||||
|
Long-term
debt, net of current portion
|
10 | 21 | 27 | 24 | - | |||||||||||||||
|
Stockholders'
equity
|
93,498 | 91,942 | 83,098 | 73,355 | 63,886 | |||||||||||||||
|
Return
on invested capital (4)
|
14.3% | 18.7% | 17.2% | 18.7% | 19.5% | |||||||||||||||
________________________
|
(1)
|
Relates
to insurance recoveries from an employee dishonesty claim in 2009 and a
treatment building fire in 2004 for the 2006 and 2005
recoveries.
|
|
(2)
|
For
the year ended December 31, 2005, we recognized a gain associated with a
legal settlement with the State of
Nebraska.
|
|
(3)
|
Calculated
as current assets minus current
liabilities.
|
|
(4)
|
Calculated
as operating income less applicable taxes divided by the sum of
stockholders equity, long-term debt, closure and post-closure obligations,
monetized operating leases less cash and short-term
investments.
|
18
Item
7. Management's Discussion and Analysis of Financial Condition and Results of
Operations
General
We are a
hazardous, PCB, non-hazardous and radioactive waste services company providing
treatment, disposal, recycling and transportation services to commercial and
government entities including but not limited to oil refineries, chemical
production facilities, manufacturers, electric utilities, steel mills,
biotechnology companies, military installations, waste broker aggregators and
medical and academic institutions. The majority of the waste received at our
facilities is produced in the United States. We generate revenue from fees
charged to treat and dispose of waste at our four fixed disposal facilities
located near Grand View, Idaho; Richland, Washington; Beatty, Nevada; and
Robstown, Texas. We manage a dedicated fleet of railcars and arrange for the
transportation of waste to our facilities. Transportation services have
contributed significant revenue in recent years. We also utilize this railcar
fleet to provide transportation services for disposal at facilities operated by
other companies on a less frequent basis. We or our predecessor companies have
been in the waste business since 1952.
Our
customers may be divided into categories to better evaluate period-to-period
changes in our treatment and disposal revenue based on service mix and type of
business (recurring “Base” or “Event” clean-up business). Each of
these categories is described in the table below with information on the
percentage of total treatment and disposal revenues for each category for the
years ended December 31, 2009 and 2008.
|
Customer
Category
|
Description
|
%
of 2009
Treatment
and Disposal Revenue (1)
|
%
of 2008 Treatment and Disposal Revenue (1)
|
|||||||
|
Broker
|
Companies
that collect and aggregate waste from their direct customers, comprised of
both Base and Event clean-up business.
|
36% | 30% | |||||||
|
Private
Clean-up
|
Private
sector clean-up project waste, typically Event business.
|
19% | 25% | |||||||
|
Government
|
Federal
and State government clean-up project waste, comprised of both Base
business and Event clean-up business.
|
15% | 19% | |||||||
|
Refinery
|
Petroleum
refinery customers, comprised of both Base and Event clean-up
business.
|
12% | 6% | |||||||
|
Other
industry
|
Electric
utilities, chemical manufacturers and other industrial customers not
included in other categories, comprised of both recurring Base business
and Event clean-up business.
|
10% | 11% | |||||||
|
Rate
regulated
|
Northwest
and Rocky Mountain Compact customers paying rate-regulated disposal fees
set by the State of Washington, predominantly Base
business.
|
7% | 6% | |||||||
|
Steel
|
Steel
mill customers, comprised of both Base and Event clean-up
business.
|
1% | 3% | |||||||
|
(1)
|
Excludes
all transportation service revenue
|
A
significant portion of our disposal revenue is attributable to discrete Event
Business projects which vary widely in size, duration and unit pricing. For the
year ended December 31, 2009, approximately 44% of our treatment and disposal
revenue was derived from Event Business projects. The one-time nature of Event
Business, diverse spectrum of waste types received and widely varying unit
pricing necessarily creates variability in revenue and earnings. This
variability may be influenced by general economic conditions, funding
availability, changes in laws and regulations, government enforcement actions or
court orders, public controversy, litigation, weather, real estate redevelopment
project timing, government appropriation and funding commitment cycles and other
factors. The types and amounts of waste received from Base Business also vary
from quarter-to-quarter. As a result of this variability, we can
experience significant quarter-to-quarter and year-to-year differences in
revenue, gross profit, gross margin, operating income and net income. Also,
while many large projects are pursued months or years in advance of work
performance, both large and small clean-up project opportunities routinely arise
with little prior notice. This uncertainty, which is inherent to the hazardous
and radioactive waste disposal business, is
factored into our projections and externally communicated business outlook
statements. Our projections combine historical experience with identified sales
pipeline opportunities, new or expanded service line projections and prevailing
market conditions. Management believes that the significant adverse
general economic conditions emerging in late 2008 and continuing into 2010
exacerbate the uncertainty inherent to projecting future results.
19
Depending
on project-specific customer needs and competitive economics, transportation
services may be offered at or near our cost to help secure new business. For
waste transported by rail from the eastern United States and other locations
distant from our Grand View, Idaho facility, transportation-related revenue can
account for as much as three-fourths (75%) of total project revenue. While
bundling transportation and disposal services reduces overall gross profit as a
percentage of total revenue (“gross margin”), this value-added service has
allowed us to win multiple projects that management believes we could not
otherwise have competed for successfully. Our acquisition of a
Company-owned railcar fleet to supplement railcars obtained under operating
leases has reduced our reliance on short-term rentals and ultimately has reduced
transportation expenses.
The
increased waste volumes resulting from projects won through this bundling
strategy have driven operating leverage benefits and increased
profitability. While waste treatment and other variable costs are
project-specific, the earnings contribution from the individual projects
generally increases as overall disposal volumes increase. Management
believes that maximizing operating income and earnings per share is a higher
priority than maintaining or increasing gross margin. We plan to
continue aggressively bidding bundled transportation and disposal services based
on this strategy.
To
maximize utilization of our railcar fleet, we periodically deploy available
railcars to transport waste from clean-up sites to disposal facilities operated
by other companies. Such transportation services may be bundled with
for-profit logistics and field services support work.
We serve
oil refineries, chemical production plants, steel mills, waste
broker-aggregators serving small manufacturers and other industrial customers
that are generally affected by adverse economic conditions and a tight credit
environment. Such conditions may cause our customers as well as those they serve
to curtail operations resulting in lower waste production and/or delayed
spending on off-site waste shipments, maintenance, waste clean-up projects and
other work. Factors that can impact general economic conditions and the level of
spending by our customers include, but are not limited to, consumer and
industrial spending, increases in fuel and energy costs, conditions in the real
estate and mortgage markets, labor and healthcare costs, access to credit,
consumer confidence and other economic factors affecting spending
behavior. Market forces may also induce customers to reduce or cease
operations, declare bankruptcy, liquidate or relocate to other countries, any of
which could adversely affect our business. To the extent our business
is either government funded or driven by government regulations or enforcement
actions, we believe it is less susceptible to general economic conditions.
However, spending by government agencies may also be reduced due to declining
tax revenues resulting from a weak economy or changes in policy. Disbursement of
funds appropriated by Congress may also be delayed for administrative or other
reasons.
Adverse
economic trends arising in the second half of 2008 and continuing into 2010 have
resulted in a decrease in near-term demand for our services from industrial
production and manufacturing activities and waste-generating businesses that
support them. These conditions also impact spending on real estate “brownfield”
redevelopment projects and other discretionary industry clean-up
projects. We have tightened our credit standards in response to these
trends, which may also impact our business. Demand for our services
may benefit from greater emphasis on enforcement by the current federal
administration as well as increased federal funding for environmental
remediation, including funds specifically appropriated for remediation by the
American Recovery and Reinvestment Act of 2009 (“ARRA”). While we
have received ARRA funding commitments on certain projects served by the Company
and believe additional opportunities exist, this process has been slower than
initially anticipated due to administratively burdensome reporting requirements
by government agencies and we are not able to estimate the overall opportunity
to the Company represented by the ARRA.
Overall
Performance
On a
consolidated basis, our financial performance for the year ended December 31,
2009 (“2009”) declined as compared to the years ended December 31, 2008 (“2008”)
and December 31, 2007 (“2007”). A significant portion of our disposal revenue is
derived from government Event clean-up projects, which are primarily driven by
federal, state and (to a lesser extent) local government appropriations.
Government Event projects include federal and state Superfund projects which,
like other remediation work, depend on project-specific funding.
We have a
contract with the USACE to provide disposal services for the USACE FUSRAP
clean-up program. The current USACE contract expires in 2010, however,
multi-year projects underway before the expiration date may continue for five
years under the same terms. The USACE expects the federal clean-up program,
which funds the contract, to continue through approximately 2021. Given our
current level of service to the USACE, we believe follow-on contracting is
likely. From
time to time the USEPA and other federal agencies use our contract to dispose of
Superfund and other federal clean-up waste. Annual FUSRAP funding has remained
generally constant. In 2009, USACE revenue was approximately 8% of total revenue
or $11.2 million as compared to 6% or $11.4 million and 7% or $12.2 million of
total revenue in 2008 and 2007, respectively. Treatment and disposal revenue
from the USACE declined 23% in 2009 as compared with 2008, partially offset by
increased transportation services being offered.
20
We
believe that private sector remediation projects are driven by economic
conditions, regulatory agency enforcement actions and settlements including
regulatory enforcement actions, judicial proceedings, availability of private
funds, post-remediation real estate redevelopment plans and other
factors. During economic downturns, management believes that
privately-funded remediation projects that are not driven by enforcement actions
are more likely to be delayed than when the economy is healthy. The economic
condition of a specific industry category (e.g. refinery or steel mill
production) is also relevant, however, as is the financial condition of specific
customers. We serve multiple private clean-up efforts on an ongoing basis.
The revenue and gross margin for individual projects vary considerably depending
on the amount of waste shipped to our disposal sites, the rate at which the
waste is shipped and unit pricing.
In 2005,
we entered into a large project contract with Honeywell to transport, treat and
dispose approximately 1.3 million tons of chromite ore processing residue.
Treatment of metals-bearing waste is generally a commoditized service and we
believe we earned this business through a combination of our high volume waste
throughput capability, the superior environmental conditions present at our site
in the Owyhee Desert of southwestern Idaho and competitive pricing for bundled
transportation and disposal services. Initial Honeywell shipments were received
at our Grand View, Idaho facility in July 2005 and the project was completed in
October 2009. Honeywell revenue was 38%, 43% and 41% of our total revenue in
2009, 2008 and 2007, respectively.
Work on
Study Area 7, the primary Honeywell Jersey site, was completed in early October
2009. While this work represented a significant portion of the Company’s total
revenue, approximately 75% of the revenue from this contract is for
transportation services provided at or near our cost. In addition, the
treatment of chromite ore processing residue (COPR) is a commodity material
resulting in the waste stream being one of our lower margin treatment
services. However, in 2009 we experienced increased profitability on the
waste received from Honeywell as a result of an approximate 30% reduction in our
additive costs used to treat the waste prior to disposal, a reduction in
personnel as we prepared for the end of the project and, to a limited degree,
increased logistics and processing efficiencies realized over the duration of
the project. At the same time, economic conditions significantly impacted our
non-Honeywell business resulting in the Honeywell portion of our business
becoming a more significant portion of our total overall business. As a result,
operating income generated from the Honeywell Jersey City project grew to an
estimated 30% of our total operating income, more than in any other
year. The Honeywell contract remains in effect for work at other smaller
Honeywell Study Area sites in the Jersey City area. We expect that our expanded
treatment and disposal capabilities, expanded permits, thermal recycling
services, utilization of our railcar fleet on other projects and a continued
strategy of maximizing operating leverage at our disposal sites and expanding
services to waste brokers will generate sufficient cash flows to continue to
fund operations after completion of the Honeywell contract.
We employ
a sales incentive plan that rewards Base Business revenue. During 2009, Base
Business revenue decreased 6% compared to 2008 levels. Base Business revenue was
approximately 56% of total 2009 treatment and disposal revenue, up from 50% in
2008. The hazardous waste business is highly competitive and no assurance can be
given that we will maintain these Base Business revenue levels or increase our
market share.
2007 to
2009 year-to-year comparisons are affected by multiple significant events
including, but not limited to:
|
●
|
Adjustments
in amounts reserved for future closure and post-closure costs at operating
and non-operating hazardous waste facilities in 2009 and 2008 based on
updated cost estimates and timing of closure and post-closure cost
activities.
|
|
●
|
Increased
amounts reserved for future closure and post-closure costs at operating
and non-operating hazardous waste facilities in 2007 for increased closure
cost estimates and acceleration of closure
projects.
|
|
●
|
Settlement
of an employee dishonesty insurance claim in the fourth quarter of
2009.
|
These
events are discussed in detail below.
2009
Events
Employee dishonesty insurance
proceeds: In 2009, we received and recognized net insurance
proceeds related to recovery of an employee dishonesty claim for
$661,000.
Operating and Non-operating facility
closure expenses: In 2009, we recognized net favorable
adjustments of $331,000 related to changes in cost estimates to close our
operating and non-operating sites and perform post-closure
monitoring.
21
Thermal asset impairment
charge: In 2009, we recorded an asset impairment charge of
$244,000 related to discontinuation of thermal services at our Beatty, Nevada
facility.
2008
Events
Operating and Non-operating facility
closure expenses: In 2008, we recognized a favorable
adjustment of $857,000 based on written confirmation from the State of Nevada
that cash contributed by the Company and held in a dedicated State account
maintained to satisfy closure and post-closure obligations at our Beatty, Nevada
facility could be used to fund interim closure work carried out by the
Company. We also recognized favorable adjustments of approximately
$230,000 related to changes in cost estimates to close our operating and
non-operating sites and perform post-closure monitoring. Partially
offsetting these favorable adjustments was a charge of $164,000 primarily
related to higher than estimated costs incurred in 2008 to grout and close the
remaining deep well at our non-operating Winona, Texas facility.
2007
Events
Operating and Non-operating facility
closure expenses: In 2007, we incurred $394,000 of expenses
related to changes in closure cost estimates to close our operating and
non-operating sites and perform post-closure monitoring activities. These
increases in estimates were primarily a result of higher petroleum-based
disposal cell liner material costs and soil excavation and placement costs which
had escalated faster than the rate of inflation.
Results
of Operations
The below
table summarizes our operating results and percentage of revenues for the years
ended December 31, 2009, 2008 and 2007.
|
$s
in thousands
|
2009
|
%
|
2008
|
%
|
2007
|
%
|
|||||||||||||
|
Revenue
|
$ | 132,519 | 100.0% | $ | 175,827 | 100.0% | $ | 165,520 | 100.0% | ||||||||||
|
Transportation
costs
|
52,708 | 39.8% | 82,064 | 46.7% | 79,326 | 47.9% | |||||||||||||
|
Other
direct operating costs
|
43,535 | 32.9% | 44,322 | 25.2% | 40,681 | 24.6% | |||||||||||||
|
Gross
profit
|
36,276 | 27.3% | 49,441 | 28.1% | 45,513 | 27.5% | |||||||||||||
|
Selling,
general and administrative expenses
|
13,835 | 10.4% | 14,920 | 8.5% | 14,646 | 8.8% | |||||||||||||
|
Insurance
proceeds
|
(661 | ) | -0.5% | - | - | ||||||||||||||
|
Operating
income
|
23,102 | 17.4% | 34,521 | 19.6% | 30,867 | 18.7% | |||||||||||||
|
Other
income (expense)
|
|||||||||||||||||||
|
Interest
income
|
116 | 0.1% | 413 | 0.2% | 732 | 0.4% | |||||||||||||
|
Interest
expense
|
(2 | ) | (7 | ) | (3 | ) | |||||||||||||
|
Other
|
267 | 0.2% | 306 | 0.2% | 122 | 0.1% | |||||||||||||
|
Total
other income
|
381 | 0.3% | 712 | 0.4% | 851 | 0.5% | |||||||||||||
|
Income
before income tax
|
23,483 | 17.7% | 35,233 | 20.0% | 31,718 | 19.2% | |||||||||||||
|
Income
tax expense
|
9,513 | 7.2% | 13,735 | 7.8% | 12,322 | 7.5% | |||||||||||||
|
Net
income
|
$ | 13,970 | 10.5% | $ | 21,498 | 12.2% | $ | 19,396 | 11.7% | ||||||||||
Segments
We
operate within two segments, Operating Disposal Facilities and Non-operating
Disposal Facilities, which are combined with our discontinued Processing
operations and with Corporate to arrive at consolidated income. Only the
Operating Disposal Facilities segment reports significant revenue and profits.
Non-operating Disposal Facilities generate virtually no revenue and no profit.
Corporate generates no revenue and provides administrative, management and
support services to the other segments. Income taxes are assigned to Corporate.
All other items are included in the segment where they originated. Inter-company
transactions have been eliminated from the segment information and are not
significant between segments. Detailed financial information for our reportable
segments can be found in Note 15 of the consolidated financial statements under
Item 8 - Financial Statements and Supplementary Data to this Form
10-K.
22
2009 Compared to 2008
Revenue. Revenue
decreased 25% to $132.5 million for 2009, down from $175.8 million for
2008. This decrease reflects lower revenue on bundled rail
transportation and disposal contracts and lower treatment and disposal revenue.
During 2009, we disposed of 774,000 tons of hazardous and radioactive waste,
down 35% from 1.2 million tons disposed in 2008. Our average selling price for
treatment and disposal services (excluding transportation) in 2009 was 23%
higher than our average selling price in 2008. This increase
primarily reflects the pricing for the thermal recycling service initially
introduced at our Robstown, Texas facility in the second half of
2008.
During
2009, treatment and disposal revenue (excluding transportation services) from
recurring Base Business was 6% lower than 2008 and represented 56% of
non-transportation revenue in 2009. This compared to 50% of non-transportation
revenue in 2008. This decrease primarily reflects Base Business declines in our
other industry, steel and broker industry business categories partially offset
by growth in our refinery business.
Event
Business treatment and disposal revenue in 2009 decreased 24% compared to 2008
and comprised 44% of non-transportation revenue. This compared to 50%
of non-transportation revenue in 2008. As discussed further below,
this reflects decreased treatment and disposal revenue from private and
government customer categories, partially offset by increases in our broker and
other industry business categories.
The
following table summarizes revenue growth (both Base and Event Business) by
industry customer type for 2009 as compared to 2008.
|
Treatment
and Disposal Revenue Growth
2009
vs. 2008
|
|||
|
Refinery
|
71% | ||
|
Rate
regulated
|
4% | ||
|
Broker
|
0% | ||
|
Other
industry
|
-24% | ||
|
Private
|
-34% | ||
|
Government
|
-35% | ||
|
Steel
|
-66% |
Treatment
and disposal revenue from our refinery customers increased 71% in 2009 compared
to 2008. This increase is primarily due to initial introduction of thermal
recycling services at our Robstown, Texas facility in the second half of
2008.
Rate-regulated
business at our Richland, Washington low-level radioactive waste facility
increased 4% in 2009 compared to 2008. Our Richland facility operates under a
State-approved revenue requirement. This increase is primarily due to our annual
rate adjustments based on an inflation index.
Broker
business was flat in 2009 compared to 2008. Our Broker business saw an increase
in waste shipments for our thermal recycling services at our Robstown, Texas
facility in 2009. Excluding brokered thermal recycling services, our broker
business declined 3% in 2009 as compared with 2008.
Other
industry revenue decreased 24% in 2009 compared to 2008. This decrease reflects
a PCB waste clean-up project for an electric utility customer shipped to our
Grand View, Idaho facility that was completed in 2008 coupled with a decline in
business with electric utility, manufacturing and other industrial customers as
a result of weaker year-over-year economic conditions and industrial
production.
Treatment
and disposal revenue from private clean-up customers for 2009 decreased 34%
compared to 2008. The decrease is due primarily to decreased shipments on the
Honeywell Study Area 7 and Molycorp, Pennsylvania projects in 2009 compared to
2008. The Honeywell Study Area 7 site and other much smaller Honeywell Study
Area sites contributed 38% of total revenue (including transportation) in 2009,
or $50.6 million compared to 43% of total revenue (including transportation), or
$76.4 million, in 2008. The Molycorp project, which was completed in the second
quarter of 2009, contributed 2% of total revenue (including transportation), or
$2.1 million in 2009, as compared to 5% of total revenue (including
transportation), or $9.6 million in 2008.
23
Government
clean-up business revenue decreased 35% in 2009 compared to 2008. This decrease
reflects state-funded clean-up projects shipped to our Robstown, Texas and
Beatty, Nevada facilities, a US Army remediation project shipped to our Grand
View, Idaho facility from an overseas military base and a military base
cleanup project shipping to our Beatty, Nevada facility which were all completed
in 2008 and not replaced in 2009. Revenue from cleanup work under the
USACE contract declined slightly in gross revenue, contributing 8% of total
revenue or $11.2 million in 2009 compared to 6% of total revenue or $11.4
million in 2008. Treatment and disposal revenue from the USACE, however,
declined 23% in 2009 as compared with 2008, partially offset by increased
transportation services being offered. Project-specific timing at the multiple
USACE clean-up sites we serve drove this variability. Each such site typically
is remediated over multiple years in discretely funded project phases that may
involve different types of waste being shipped to different disposal companies.
These phases vary by type and amount of waste shipped and
duration. No USACE projects served by the Company were cancelled or
awarded to competitors during 2009. We believe the timing and disbursement of
funds for discrete work phases in 2009 were negatively impacted by competing
administrative demands and reporting requirements associated with USACE
implementation of the ARRA.
Treatment
and disposal revenue from steel mill customers decreased 66% in 2009 compared to
2008. This reflects business lost to zinc recyclers offering a cost-effective
alternative to land disposal as well as substantially reduced steel production
levels in 2009 at mills currently served by the Company.
Gross
Profit. In
2009, gross profit decreased 27% to $36.3 million, down from $49.4 million in
2008. This decrease reflects a decrease of 35% in disposal volumes in 2009
compared to 2008, which was partially offset by an increase in our average selling price for
treatment and disposal services (excluding transportation) of 23% in
2009. The decrease is also partially attributable to net positive
adjustments to our closure and post-closure obligations in 2008 of $923,000
compared to net favorable adjustments of $331,000 in 2009.
Gross
margin was 27% in 2009 down from 28% in 2008. This reflects lower
treatment and disposal waste volumes partially offset by a decrease in low
margin and pass through transportation revenue. Disposal gross
margins (excluding transportation revenue and costs) were 45% in 2009 as
compared to 52% in 2008. This decrease reflects reduced operating
leverage caused by significantly lower waste volumes as well as a greater
percentage of waste requiring treatment (and increased variable costs) prior to
disposal.
Use of additives to meet
USEPA treatment standards is a variable cost dependent on the type of waste
treated.Except for disposal unit airspace, treatment additives and (to a
much lesser degree) employee overtime and energy costs, most other direct costs
are fixed and do not significantly vary with changes in waste volume. This
highlights the operating leverage inherent to the disposal business. Management
focuses on earnings rather than gross margin, since increased gross margin could
result in lower waste throughput, reduced operating leverage and lower gross
profit.
Selling, General
and Administrative (“SG&A”). SG&A expenses
as a percentage of total revenue increased to 10% in 2009 as compared to
8% in 2008. In total dollars, SG&A expenses decreased 7%, or $1.1 million,
to $13.8 million in 2009, down from $14.9 million in 2008. The
decrease in SG&A expenses was due to lower incentive compensation due to
lower revenue and earnings, lower sales commissions on reduced revenues and
lower travel and administrative costs resulting from ongoing 2009 cost control
initiatives. These decreases were partially offset by a $244,000
asset impairment charge related to the discontinuation of thermal services at
our Beatty, Nevada facility.
Insurance
proceeds. During the second quarter of 2009, management of the Company
discovered evidence indicating that from November 2007 through April 2009 a
former employee embezzled approximately $714,000 in the aggregate from the
Company through an entity purporting to provide truck transportation services to
one of the Company’s wholly-owned subsidiaries. The Company has
insurance policies in place that cover employee dishonesty claims and received
net proceeds of $661,000 related to its claim in the fourth quarter of
2009.
Interest income
and expense. Interest income is
earned on cash balances and short-term investments and is a function of
prevailing market rates and balances. In 2009, we earned $116,000 of
interest income, down from $413,000 in 2008. This decrease was due to a lower
average rate of interest earned on investments in 2009 compared to 2008,
partially offset by higher average balances of cash equivalents and short-term
investments in 2009.
24
Other income
(expense). Other income (expense) includes business activities not
included in current year ordinary and usual revenue and expenses. In
2009, we recognized $267,000 in other income primarily for royalty income from a
previously sold municipal waste landfill in Texas and a gain on the sale of a
parcel of property associated with our discontinued operation in Winona,
Texas. This income was partially offset by foreign currency
transaction losses related to waste shipments from a Canadian customer. Other
income in 2008 was $306,000, primarily from royalty income from the Texas
municipal landfill.
Income tax
expense. Our
effective income tax rate for the year ended December 31, 2009 was 40.5%
compared to 39.0% in 2008. This increase reflects higher state income
tax rates. This increase also reflects lower pre-tax earnings in 2009
which increased the impact of non-tax-deductible expenses on our effective tax
rate.
As of
December 31, 2009, we had approximately $83.0 million in state net operating
loss carry forwards (“NOLs”) for which we maintain nearly a full valuation
allowance. These state NOLs are located in states where we currently do little
or no business, and consider it unlikely that we will utilize these NOLs in the
future.
As of
December 31, 2009 and 2008, we had no unrecognized tax benefits. We
recognize interest assessed by taxing authorities as a component of interest
expense. We recognize any penalties assessed by taxing authorities as
a component of selling, general and administrative expenses. Interest
and penalties for both 2009 and 2008 were not material.
2008
Compared to 2007
Revenue. Revenue
increased 6% to $175.8 million for 2008, up from $165.5 million for
2007. This increase was primarily attributable to increased treatment
and disposal revenue driven by an 13% increase in Base Business revenue and a 5%
increase in Event Business revenue in 2008 compared to 2007. The
increase is also partially attributable to higher revenue from transportation
services on bundled rail transportation and disposal contracts. During 2008, we
disposed of 1.2 million tons of hazardous and radioactive waste, up 7% from 1.1
million tons disposed in 2007. Our average selling price for treatment and
disposal services (excluding transportation) in 2008 was 4% higher than our
average selling price in 2007. Management believes this reflects
normal variations in service mix that are inherent to the business.
During
2008, treatment and disposal revenue from recurring Base Business grew 13% and
represented 50% of non-transportation revenue in 2008 compared to 48% in 2007.
Base Business revenue increased in 2008 as a result of strong growth in our
broker and other industry business categories. Event Business revenue was 5%
higher in 2008 than in 2007, and represented 50% of our non-transportation
revenue in 2008 and 52% in 2007. Event Business growth was attributable to
higher disposal revenue from waste broker, government clean-up and refinery
customers.
The
following table summarizes revenue growth (both Base and Event Business) by
industry customer type for 2008 as compared to 2007.
|
Treatment
and Disposal Revenue Growth
2008
vs. 2007
|
|||
|
Broker
|
23% | ||
|
Other
industry
|
22% | ||
|
Refinery
|
19% | ||
|
Government
|
17% | ||
|
Private
|
-5% | ||
|
Rate
regulated
|
-10% | ||
|
Steel
|
-21% |
Our
broker business increased 23% in 2008 compared to 2007, reflecting continued
success teaming with national and regional waste broker companies that do not
compete with us. Waste brokered to us for treatment and recycling
during the second half of 2008 at the thermal desorption unit installed at our
Robstown, Texas facility contributed to this growth.
Our other
industry revenue category increased 22% in 2008 compared to 2007. This increase
was due primarily to a large PCB waste clean-up for an electric utility customer
shipped to our Grand View, Idaho facility in early 2008 and increased shipments
from new Base Business customers.
25
Treatment
and disposal revenue from refinery customers grew 19% in 2008 as compared to
2007. This growth is primarily attributable to a contaminated soil cleanup
project shipped to our Idaho facility in 2008 and the introduction of our
thermal desorption recycling service in Texas in the second half of
2008.
Government
clean-up business revenue increased 17% in 2008 over 2007. This increase
reflects a state-funded contaminated soil clean-up project shipping to our
Robstown, Texas and Beatty, Nevada facilities in 2008 and increased shipments
from military base clean-ups by the Department of Defense. These increases were
partially offset by reduced waste disposal shipments from the USACE in 2008 as
compared with 2007. This reduction reflects timing as task orders are completed
and new task orders commenced as well as a higher percentage of available
appropriations being spent by the USACE on transportation due to higher fuel
charges. Including rail transportation services provided to the USACE, total
revenue under the USACE contract contributed 6% of total revenue in 2008, or
$11.4 million, as compared to 7% of total revenue in 2007, or $12.2
million.
Treatment
and disposal revenue from private clean-up customers decreased approximately 5%
during 2008 over the same period last year. The Molycorp project which ramped
down to completion in the second quarter of 2009 was partially responsible for
this decline. Molycorp contributed 5% of total revenue (including
transportation), or $9.6 million in 2008 as compared to 9% of total revenue
(including transportation), or $14.5 million in 2007. The decrease is
also partially attributable to shipments to our Beatty, Nevada facility from a
large brownfield redevelopment project competed in 2007. These
decreases were partially offset by increased shipments from the Honeywell Jersey
City project which was completed in October 2009. Including both transportation
and disposal revenue, Honeywell contributed 43% of total revenue for 2008, or
$76.4 million. This compares to 41% of total revenue (including transportation)
for 2007, or $67.9 million.
Rate-regulated
business at our Richland, Washington low-level radioactive waste facility
decreased 10% in 2008 over 2007. Our Richland facility operates under a
State-approved revenue requirement established a new, six year rate which took
effect in 2008. The 2008 decrease primarily reflects a lower revenue
requirement in 2008 than the previous rate agreement in effect for
2007. The current rate agreement provides for annual rate adjustments
based on a specified inflation index.
Treatment and disposal
revenue from our steel mill customers decreased 21% during in 2008 compared to
2007. This decline was a result of business lost to zinc recyclers
offering an alternative to disposal as well as reduced steel production levels
in the second half of 2008 at mills served by the Company.
Gross Profit. Gross profit in 2008
increased by 9% to $49.4 million, up from $45.5 million in 2007. This increase
was attributable to increased waste volumes disposed of in 2008 as compared to
2007 and net favorable adjustments of $923,000 in our closure and post-closure
obligations recorded in 2008. During 2008, we received written
confirmation from the State of Nevada that cash contributed by us and held in a
dedicated state account to satisfy closure and post-closure obligations at our
Beatty, Nevada hazardous waste disposal facility can be used to fund interim
closure work. As a result, an $857,000 obligation previously recorded
for closure activities at the Beatty, Nevada facility was removed. The remaining
$66,000 of net favorable adjustment reflects year-end cost estimate revisions
for closure activities and post-closure obligations at our Grand View, Idaho
facility and non-operating Sheffield, Illinois facility, partially offset by
increased costs to close our deep-well injection system at our non-operating
facility in Winona, Texas. Gross margin
was 28% for both 2008 and 2007.
Treatment
and disposal gross margin (excluding transportation services) was 52% of
treatment and disposal revenue in 2008 compared to 53% of treatment and disposal
revenue in 2007. The service mix of waste received at our facilities can have a
significant impact on our gross margin on a period-to-period basis. Treatment of
metals-bearing hazardous wastes, such as the Honeywell Jersey City chromite ore
waste, is a commoditized service with lower gross margins than other waste
materials that require no treatment prior to disposal or higher margin niche
treatment services such as treatment of waste containing organic chemical
compounds and radioactive material disposal.
Use of additives to meet
USEPA treatment standards is a variable cost dependent on the type of waste
treated.Except for disposal unit airspace, treatment additives and (to a
much lesser degree) employee overtime and energy costs, most other direct costs
are fixed and do not significantly vary with changes in waste volume. This
highlights the operating leverage inherent to the disposal business. Management
focuses on earnings rather than gross margin, since increased gross margin could
result in lower waste throughput, reduced operating leverage and lower gross
profit.
26
During
2007 gross profit and gross margin were reduced by approximately $394,000 for
charges related to closure and post-closure expenses at our operating and
non-operating facilities in Robstown and Winona, Texas and Sheffield,
Illinois.
Selling, General
and Administrative. SG&A expenses
as a percentage of total revenue declined to 8% in 2008 as compared to 9%
in 2007. In total dollars, SG&A expenses increased 2% to $14.9 million in
2008, up from $14.6 million in 2007. The increase in SG&A
expenses was due to higher payroll and benefit expenses, bad debt expense and
stock and performance based compensation expense. The increase also
reflects $129,000 of business development expenses on an acquisition opportunity
the Company elected not to pursue during the year.
Interest income
and expense. Interest income is
earned on cash balances and short-term investments and is a function of
prevailing market rates and balances. In 2008, we earned $413,000 of
interest income, down from $732,000 in 2007. This decrease was due to a lower
average rate of interest earned on investments in 2008 compared to 2007,
partially offset by higher average balances of cash equivalents and short-term
investments in 2008.
Other income
(expense). Other income (expense) includes business activities not
included in current year ordinary and usual revenue and expenses. In
2008, we recognized $306,000 in other income primarily for royalty income from a
previously sold municipal waste landfill in Texas. Other income in 2007 was
$122,000, primarily from a $26,000 net gain on sale of excess property
associated with our discontinued operation in Winona, Texas and $88,000 in
royalty income from the Texas municipal landfill.
Income tax
expense. Our
effective income tax rate for the years ended December 31, 2008 was 39.0%
compared to 38.8% in 2007. The lower 2007 effective tax rate reflects the
realization of approximately $325,000 in state investment tax credits on our
filed income tax returns.
As of
December 31, 2008, we had approximately $72.4 million in state NOLs for which we
maintain nearly a full valuation allowance. These state NOLs are located in
states where we currently do little or no business, and consider it unlikely
that we will utilize these NOLs in the future.
As of
December 31, 2008 and 2007, we had no unrecognized tax benefits. We
recognize interest assessed by taxing authorities as a component of interest
expense. We recognize any penalties assessed by taxing authorities as a
component of selling, general and administrative expenses. Interest
and penalties for both 2008 and 2007 were not material.
Liquidity
and Capital Resources
Our
principal source of cash is from operations. The $31.3 million in cash and cash
equivalents at December 31, 2009 was comprised of cash and cash equivalents
immediately available for operations.
We have a
$15.0 million unsecured revolving line of credit (the “Revolving Credit
Agreement”) with Wells Fargo Bank, National Association (“Wells Fargo”) expiring
on June 15, 2010. This unsecured line-of-credit is available to supplement daily
working capital if needed. Monthly interest-only payments are required on
outstanding debt levels based on a pricing grid, under which the interest rate
decreases or increases based on our ratio of funded debt to earnings before
interest, taxes, depreciation and amortization. We can elect to borrow monies
utilizing LIBOR plus an applicable spread or the prime rate. The Revolving
Credit Agreement contains quarterly financial covenants, including a maximum
leverage ratio, a maximum funded debt ratio and a minimum required tangible net
worth. Pursuant to our Revolving Credit Agreement, we may only declare quarterly
or annual dividends if on the date of declaration, no event of default has
occurred, or no other event or condition has occurred that would constitute an
event of default after giving effect to the payment of the dividend. At December
31, 2009 we were in compliance with all financial covenants in the Revolving
Credit Agreement. We have a standby letter of credit to support our closure and
post-closure obligation of $4.0 million that expires in December 2010. At
December 31, 2009, we had a borrowing capacity of $11.0 million after deducting
the outstanding letter of credit, with no borrowings
outstanding. Based on discussions with Wells Fargo and other
financial institutions, we do not currently expect difficulties in renewing or
replacing the existing Revolving Credit Agreement on terms and conditions that
we find to be acceptable.
On
October 28, 2008, our Board of Directors authorized management to repurchase up
to 600,000 shares, or approximately 3%, of our outstanding common stock. On
December 11, 2008, the program was extended to February 28, 2009. On February
23, 2009, the program was again extended through December 31, 2009. The program
expired on December 31, 2009. No stock was repurchased during the
fourth quarter of 2009. During 2008 and through December 31, 2009, the Company
repurchased 155,315 shares under the plan at an average price of $16.68 per
share using cash on hand.
27
Work
under our Honeywell contract represented 38% of total revenue for the year ended
December 31, 2009. Work on Study Area 7, the primary Honeywell Jersey site, was
completed in early October 2009. While this work represented a significant
portion of the Company’s total revenue, approximately 75% of the revenue from
this contract is for transportation services provided at or near our
cost. In addition, the treatment of chromite ore processing residue (COPR)
is a commodity material resulting in the waste stream being one of our
lower margin treatment services. However, in 2009 we experienced increased
profitability on the waste received from Honeywell as a result of an approximate
30% reduction in our additive costs used to treat the waste prior to disposal, a
reduction in personnel as we prepared for the end of the project and, to a
limited degree, increased logistics and processing efficiencies realized
over the duration of the project. At the same time, economic conditions
significantly impacted our non-Honeywell business resulting in the Honeywell
portion of our business becoming a more significant portion of our total overall
business. As a result, operating income generated from the Honeywell Jersey City
project grew to an estimated 30% of our total operating income, more than in any
other year. The Honeywell contract remains in effect for work at other smaller
Honeywell Study Area sites in the Jersey City area. We expect that our expanded
treatment and disposal capabilities, expanded permits, thermal recycling
services, utilization of our railcar fleet on other projects and a continued
strategy of maximizing operating leverage at our disposal sites and expanding
services to waste brokers will generate sufficient cash flows to continue to
fund operations after completion of the Honeywell contract.
Management
believes that cash on hand and cash flow from operations will be sufficient to
meet all operating cash needs during the next 12 months.
Operating
Activities. In 2009, net cash provided
by operating activities was $36.8 million. This reflects net income of
$14.0 million, decreases in receivables of $14.4 million, utilization of a $2.8
million income tax receivable, changes in deferred income taxes of $1.8 million
and depreciation, amortization and accretion of $9.0 million. Partially
offsetting these sources of cash were decreases in accounts payable and accrued
liabilities of $1.1 million, decreases in deferred revenue of $3.3 million and
decreases in accrued salaries and benefits of $1.2 million. Impacts on net
income are due to the factors discussed above under Results of Operations. The
decrease in receivables is primarily attributable to a decline in revenue in
2009 compared with the 2008. Days sales outstanding were 68 days as of December
31, 2009, compared to 66 days at December 31, 2008. The decrease in income tax
receivable reflects application of prior year over-payments to current year tax
liabilities generated during in 2009. The decrease in accounts payable and
accrued liabilities and deferred revenue is primarily attributable to lower
waste disposal volumes in 2009 compared to 2008. The decrease in accrued
salaries and benefits reflects incentive compensation earned for 2008
performance and paid in the first quarter of 2009.
In 2008, cash provided by
operating activities was $30.6 million. This was primarily attributable to net
income of $21.5 million, depreciation, amortization and accretion of $10.6
million and changes in deferred income taxes. These amounts were partially
offset by decreases in closure and post-closure obligations of $1.9 million, a
decrease in accounts payable and accrued liabilities of $1.8 million, increases
in income tax receivables of $1.8 million, and increases in accounts receivable
(net of the increase in deferred revenue) of $1.1 million. The increase
in net income is discussed above under Results of Operations. The
decrease in closure and post-closure obligations was due primarily to the
removal of the closure obligation related to our Beatty, Nevada facility and
payments made on our closure and post-closure obligations. The
decrease in accounts payable and accrued liabilities is primarily attributable
to reimbursements related to our rate-regulated business in Richland,
Washington. The increase in tax receivables was the result of
accelerated tax deductions related to bonus depreciation, accelerated
amortization of cell space and other tax planning strategies. The
increase in accounts receivable was primarily attributable to revenue
growth. Days sales outstanding increased to 66 days as of December
31, 2008 compared to 65 days as of December 31, 2007.
In 2007,
cash provided by operating activities was $30.7 million. This was primarily
attributable to net income of $19.4 million, changes in deferred tax of $2.9
million, accrued salaries and benefits and stock based compensation. These
amounts were partially offset by increases in accounts receivable (net of the
increase in deferred revenue) of $851,000, a decrease in accounts payable and
accrued liabilities of $659,000 and payments to meet closure post-closure
obligations. The
increase in net income is discussed above under Results of
Operations. During 2007, we fully utilized our
federal NOLs and began using cash to pay our tax obligations. The
increase in accounts receivable reflects higher disposal and transportation
revenue for 2007 as compared to 2006. Longer payment terms for the Honeywell
Jersey City project contributed to the increase in accounts receivable in 2007,
during which days sales outstanding increased to 65 days as of December 31,
2007, compared to 61 days at December 31, 2006.
Investing
Activities. In
2009, net cash used in investing activities was $10.8 million. Significant
transactions affecting cash used in investing activities during 2009 include
capital expenditures of $9.4 million including $4.4 million to construct
additional disposal capacity at our Grand View, Idaho facility and $842,000 to
construct additional disposal capacity at our Robstown, Texas
facility. Other capital projects included equipment and fixture
purchases at all four operating disposal facilities. Purchases of short-term
investments of $1.4 million also contributed to net cash used in investing
activities during 2009.
28
In 2008,
net cash used in investing activities was $11.2 million. We spent $13.6 million
on capital projects, including $3.5 million to construct additional disposal
capacity at our Beatty, Nevada facility, $3.8 million for additional disposal
capacity at our Robstown, Texas facility and an additional $2.8 million at the
Texas facility on infrastructure for the thermal desorption recycling equipment
installed at that operation. Other capital projects included equipment and
fixture purchases at all four operating waste facilities. Partially
offsetting cash outflows for capital expenditures were net maturities of
short-term investments totaling $2.2 million.
In 2007,
net cash used in investing activities was $11.5 million. During 2007, capital
expenditures totaled $15.4 million, primarily for construction of a new
treatment and storage building at our Beatty, Nevada facility for $4.3 million;
a new storage building and waste testing laboratory at our Robstown, Texas
facility for $1.3 million; construction of additional disposal space at our
Idaho and Texas facilities for $6.0 million and various equipment and fixture
purchases at all four operating waste facilities. Partially offsetting cash
outflows for capital expenditures were net maturities of short-term investments
totaling $4.1 million.
Financing
Activities. For 2009, net cash used in financing
activities was $13.1 million primarily as a result of the payment of
dividends.
For 2008,
net cash used in financing activities was $13.5 million. This
included $12.1 million in dividend payments and $2.6 million used for common
stock repurchases. The dividend payments and common stock repurchases were
partially offset by proceeds received from stock option exercises and associated
tax benefits.
For 2007,
net cash used in financing activities was $10.4 million. This was primarily
attributable to $10.9 million in dividend payments partially offset by proceeds
from stock option exercises and associated tax benefits.
Subsequent
Events
On
January 4, 2010 the Company declared a dividend of $0.18 per common share to
stockholders of record on January 15, 2010. The dividend was paid out
of cash on hand on January 22, 2010 in an aggregate amount of $3.3
million.
Contractual
Obligations and Guarantees
Contractual
Obligations
US
Ecology’s contractual obligations at December 31, 2009 mature as
follows:
|
Payments
Due by Period
|
|||||||||||||||||||||
|
1
Year
|
More
than
|
||||||||||||||||||||
|
$s
in thousands
|
Total
|
or
less
|
2-3
Years
|
4-5
Years
|
5
Years
|
||||||||||||||||
|
Closure and post-closure
obligations (1)
|
$ | 111,064 | $ | 319 | $ | 5,737 | $ | 2,991 | $ | 102,017 | |||||||||||
|
Operating
lease commitments
|
990 | 465 | 321 | 159 | 45 | ||||||||||||||||
|
Capital
lease obligation
|
22 | 12 | 10 | - | - | ||||||||||||||||
|
Total
contractual obligations
|
$ | 112,076 | $ | 796 | $ | 6,068 | $ | 3,150 | $ | 102,062 | |||||||||||
________________________
|
(1)
|
For
the purposes of the table above, our closure and post-closure obligations
are shown on an undiscounted basis and inflated using an estimated annual
inflation rate of 2.6%. Cash payments for closure and post-closure
obligation extend to the year 2105.
|
29
Guarantees
We enter
into a wide range of indemnification arrangements, guarantees and assurances in
the ordinary course of business and have evaluated agreements that contain
guarantees and indemnification clauses in accordance with Financial Accounting
Standards Board (“FASB”) Accounting Standards
Codification™ (“ASC”) Topic 460 Guarantees. These include
tort indemnities, tax indemnities, indemnities against third-party claims
arising out of arrangements to provide services to us and indemnities related to
the sale of our securities. We also indemnify individuals made party
to any suit or proceeding if that individual was acting as an officer or
director of US Ecology or was serving at the request of US Ecology or any of its
subsidiaries during their tenure as a director or officer. We also provide
guarantees and indemnifications for the benefit of our wholly-owned subsidiaries
to satisfy performance obligations, including closure and post-closure financial
assurances. It is difficult to quantify the maximum potential liability under
these indemnification arrangements; however, we are not currently aware of any
material liabilities arising from these arrangements.
Environmental
Matters
We
maintain reserves and insurance policies for future closure and post-closure
obligations at both current and formerly operated disposal facilities. These
reserves and insurance policies are based on management estimates of future
closure and post-closure monitoring using engineering evaluations and
interpretations of regulatory requirements which are periodically updated.
Accounting for closure and post-closure costs includes final disposal unit
capping, soil and groundwater monitoring and routine maintenance and
surveillance required after a site is closed.
We
estimate that our undiscounted future closure and post-closure costs for all
facilities was approximately $111 million at December 31, 2009, with a median
payment year of 2057. Our future closure and post-closure estimates are our best
estimate of current costs and are updated periodically to reflect current
technology, cost of materials and services, applicable laws, regulations and
permit conditions or orders and other factors. These current costs are adjusted
for anticipated annual inflation or cost of living rates, which we assumed to be
2.6% as of December 31, 2009. These future closure and post-closure estimates
are discounted to their present value for financial reporting purposes using our
credit-adjusted risk-free interest rate, which approximates our incremental
borrowing rate in effect at the time the obligation is established or when there
are upward revisions to our estimated closure and post-closure costs. At
December 31, 2009, our weighted-average credit-adjusted risk-free interest rate
was 7.9%. For financial reporting purposes, our recorded closure and
post-closure obligations were $13.4 million and $14.5 million for 2009 and 2008,
respectively.
Through
December 31, 2009, we have met our financial assurance requirements through
insurance and self-funded restricted trusts. Our current closure and
post-closure policies were renewed in December 2005 and expire in December 2010.
This renewal required us to self-fund trust accounts for our closure and
post-closure obligations at our non-operating sites.
We are
also required to provide collateral equal to 15% of the insurance policy limits
for operating site closure and post-closure obligations through the remainder of
the policy term. As of December 31, 2009, we have issued $4 million in letters
of credit to satisfy this collateral requirement with limits of approximately
$34 million for our operating sites. We also have $4.8 million in self-funded
restricted trust agreements to cover financial assurance obligations at our
non-operating facilities. These self-funded trust agreements are identified as
“Restricted Cash” on our consolidated balance sheet.
We expect
to renew these policies in the future. If we are unable to obtain
adequate closure, post-closure or environmental liability insurance in future
years, any partial or completely uninsured claim against us, if successful and
of sufficient magnitude, could have a material adverse effect on our financial
condition, results of operations or cash flows. Additionally, continued access
to casualty and pollution legal liability insurance with sufficient limits, at
acceptable terms, is important to obtaining new business. Failure to maintain
adequate financial assurance could also result in regulatory action including
early closure of facilities. While we believe we will be able to maintain the
requisite financial assurance policies at a reasonable cost, premium and
collateral requirements may materially increase.
Operation
of disposal facilities creates operational, closure and post-closure obligations
that could result in unplanned monitoring and corrective action costs. We cannot
predict the likelihood or effect of all such costs, new laws or regulations,
litigation or other future events affecting our facilities. We do not believe
that continuing to satisfy our environmental obligations will have a material
adverse effect on our financial condition or results of operations.
Seasonal
Effects
Market
conditions and federal funding decisions generally have a larger effect on
revenue than does seasonality. Operating revenue is generally lower in the
winter months, however, and increases when short-term, weather-influenced
cleanup projects are more frequently undertaken. While large, multi-year cleanup
projects tend to continue in winter months, the pace of waste shipments may be
slowed due to weather.
30
Critical Accounting Policies
Our
discussion and analysis of our financial condition and results of operations are
based upon our consolidated financial statements, which have been prepared in
accordance with accounting principles generally accepted in the United States.
The preparation of these financial statements require us to make estimates and
judgments that affect the reported amounts of assets, liabilities, revenues and
expenses and related disclosure of contingent assets and liabilities. On an
ongoing basis, we evaluate our estimates included in our critical accounting
policies discussed below and those accounting policies and use of estimates
discussed in Notes 2 and 3 to our consolidated financial statements. We base our
estimates on historical experience and on various assumptions and other factors
we believe to be reasonable, the results of which form the basis for making
judgments about the carrying values of assets and liabilities that are not
readily apparent from other sources. We make adjustments to judgments and
estimates based on current facts and circumstances on an ongoing basis.
Historically, actual results have not significantly deviated from those
determined using the estimates described below or in Notes 2 and 3 to the
consolidated financial statements. However, actual amounts could differ
materially from those estimated at the time the consolidated financial
statements are prepared.
We
believe the following critical accounting policies are important to understand
our financial condition and results of operations and require management’s most
difficult, subjective or complex judgments, often as a result of the need to
estimate the effect of matters that are inherently uncertain.
Revenue
Recognition
We
recognize revenue when persuasive evidence of an arrangement exists, delivery
and disposal have occurred or services have been rendered, the price is fixed or
determinable and collection is reasonably assured. We recognize revenue from two
primary sources: 1) waste treatment, recycling and disposal and 2) waste
transportation services.
Waste
treatment and disposal revenue results primarily from fees charged to customers
for treatment and/or disposal or recycling of specified wastes. Waste treatment
and disposal revenue is generally charged on a per-ton or per-yard basis based
on contracted prices and is recognized when services are complete and the waste
is disposed of in our landfill.
Transportation
revenue results from delivering customer waste to a disposal facility for
treatment and/or disposal or recycling. Transportation services are generally
not provided on a stand-alone basis and instead are bundled with other Company
services. However, in some instances we provide transportation and logistics
services for shipment of wastes from cleanup sites to disposal facilities
operated by other companies. We account for our bundled arrangements as multiple
deliverable arrangements and determine the amount of revenue recognized for each
deliverable (unit of accounting) using the relative fair value method.
Transportation revenue is recognized when the transported waste is received at
the disposal facility. Waste treatment and disposal revenue under bundled
arrangements is recognized when services are complete and the waste is disposed
in the landfill, which is generally the same day as receipt of the waste at the
disposal site.
Burial
fees collected from customers for each ton or cubic yard of waste disposed in
our landfills are paid to the respective local and/or state government entity
and are not included in revenue. Revenue and associated cost from waste that has
been received but not yet treated and disposed of in our landfills are deferred
until disposal occurs.
Our
Richland, Washington disposal facility is regulated by the WUTC, which approves
our rates for disposal of LLRW. Annual revenue levels are established based on a
six year rate agreement with the WUTC at amounts sufficient to cover the costs
of operation and provide us with a reasonable profit. Per-unit rates charged to
LLRW customers during the year are based on our evaluation of disposal volume
and radioactivity projections submitted to us by waste generators. Our proposed
rates are then reviewed and approved by the WUTC. If annual revenue exceeds the
approved levels set by the WUTC, we are required to refund excess collections to
facility users on a pro-rata basis. The rate agreement in effect for 2009 began
on January 1, 2008 and expires on January 1, 2014.
Disposal
Facility Accounting
In
general, a disposal cell development asset exists for the cost of building new
disposal space and a closure liability exists for closing, maintaining and
monitoring the disposal unit once this space is filled. Major assumptions and
judgments used to calculate cell development assets and closure liabilities are
as follows:
|
§
|
Personnel
and equipment costs incurred to construct new disposal cells are
identified and capitalized as a cell development
asset.
|
|
§
|
The
cell development asset is amortized as each available cubic yard of
disposal space is filled. Periodic independent engineering surveys and
inspection reports are used to determine the remaining volume available.
These reports take into account volume, compaction rates and space
reserved for capping filled disposal
cells.
|
31
|
§
|
FASB
ASC Topic 410 Asset
Retirement and Environmental Obligations (formerly Statement of
Financial Accounting Standard (“SFAS”) No. 143 Accounting for Asset
Retirement Obligations), requires us to record the fair value of an
Asset Retirement Obligation (“ARO”) as a liability in the period in which
we incur a legal obligation associated with the retirement of tangible
long-lived assets. We are also required to record a corresponding asset
that is amortized over the life of the underlying tangible asset. After
the initial measurement, the ARO is adjusted at the end of each period to
reflect the passage of time and changes in the estimated future cash flows
underlying the obligation.
|
The
closure liability (obligation) represents the present value of current cost
estimates to close, maintain and monitor disposal cells and support facilities.
Cost estimates are developed using input from our technical and accounting
personnel as well as independent engineers and our interpretation of current
requirements, and are intended to approximate fair value under the provisions of
ASC 410. We estimate the timing of future payments based on expected
annual disposal airspace consumption and then accrete the current cost estimate
by an estimated inflation rate, estimated at December 31, 2009 to be 2.6%.
Inflated current costs are then discounted using our credit-adjusted risk-free
interest rate, which approximates our incremental borrowing rate in effect at
the time the obligation is established or when there are upward revisions to our
estimated closure and post-closure costs. Our weighted-average credit-adjusted
risk-free interest rate at December 31, 2009 approximated 7.9%. Final closure
and post-closure monitoring obligations are currently estimated as being paid
through 2105. During 2009, we updated several assumptions. This included the
estimated cost of closing our Robstown, Texas facility, the estimated cost of
closing active disposal cells, site closure costs, post-closure activities and
the estimated year of site closure for our Grand View, Idaho facility. These
changes resulted in a net decrease to our closure post-closure obligation of
$1.7 million, a decrease of $1.3 million in retirement assets and $331,000
recorded as a reduction of other direct costs.
Changes
in inflation rates or the estimated costs, timing or extent of the required
future activities to close, maintain and monitor disposal cells and facilities
result in both: (i) a current adjustment to the recorded liability
and related asset and (ii) a change in the liability and asset amounts to be
recorded prospectively over the remaining life of the asset in accordance with
our depreciation policy. A hypothetical 1% increase in the inflation
rate would increase our closure/post-closure obligation by $1.5
million. A hypothetical 10% increase in our cost estimates would
increase our closure/post-closure obligation by $1.3 million.
Share
Based Payments
The
Company’s Board of Directors granted stock options to purchase our common stock
to certain employees and Directors under our previous 1992 Employee Stock Option
Plan and our 2008 Stock Option Incentive Plan. The Company has also granted
directors and certain employees restricted stock awards under the 2005 Director
Stock Plan and the 2006 Employee Stock Plan. Additionally, outstanding options
have been granted under a 1992 Director Plan option plan that was cancelled in
2005.The benefits provided under all of these plans are subject to the
provisions of ASC Topic 718 Compensation – Stock
Compensation (formerly revised SFAS No. 123 (SFAS 123 R), Share-Based Payment), which
we adopted effective January 1, 2006.
The
determination of fair value of stock option awards on the date of grant using
the Black-Scholes model is affected by our stock price and subjective
assumptions. These assumptions include, but are not limited to, the expected
term of stock options and expected stock price volatility over the term of the
awards. Refer to Note 13 to the consolidated financial statements included in
this Form 10-K for a summary of the assumptions utilized in 2009, 2008 and
2007. Our stock options have characteristics significantly different
from those of traded options, and changes in the assumptions can materially
affect the fair value estimates.
ASC 718
requires forfeitures to be estimated at the time of grant and revised, if
necessary, in subsequent periods if actual forfeitures differ from those
estimates. When actual forfeitures vary from our estimates, we recognize the
difference in compensation expense in the period the actual forfeitures occur or
when options vest.
Income
Taxes
Income
taxes are accounted for using an asset and liability approach in accordance with
ASC Topic 740 Income
Taxes (formerly SFAS No. 109, Accounting for Income Taxes),
which requires the recognition of deferred tax assets and liabilities for the
expected future tax consequences of temporary differences between the financial
statement and tax basis of assets and liabilities at the applicable tax rates.
Deferred tax assets are required to be evaluated for the likelihood of use in
future periods. A valuation allowance is recorded against deferred tax assets
if, based on the weight of the available evidence, it is more likely than not
that some or all of the deferred tax assets will not be realized. The
determination of the need for a valuation allowance, if any, requires
management’s judgment and the use of estimates. During 2007, we utilized the
remaining federal net operating loss carry forwards that were available as of
December 31, 2006, and began paying our tax obligations from operating cash
flows. As of December 31, 2009, we have deferred tax assets totaling
approximately $2.9 million, net of a valuation allowance of $2.9 million and
deferred tax liabilities totaling approximately $7.9 million.
32
On
January 1, 2007 we adopted the provisions of ASC 740 related to income tax
uncertainties (formerly FASB Interpretation No. 48, Accounting for Uncertainty in Income
Taxes-an Interpretation of FASB Statement No. 109) to account for
uncertain tax positions. As discussed in Note 2 and Note 11 to the accompanying
consolidated financial statements, the adoption had no impact on our financial
position, results of operations or cash flows. The application of income tax law
is inherently complex. Tax laws and regulations are voluminous and at times
ambiguous and interpretations of guidance regarding such tax laws and
regulations change over time. This requires us to make many subjective
assumptions and judgments regarding our income tax exposures. Changes in our
assumptions and judgments can materially affect our financial position, results
of operations and cash flows.
Litigation
We have
in the past been involved in litigation requiring estimates of timing and loss
potential whose timing and ultimate disposition is controlled by the judicial
process. As of December 31, 2009, we did not have any ongoing, pending or
threatened legal action that management believes would have a material adverse
effect on our financial position, results of operations or cash flows. The
decision to accrue costs or write off assets is based on the pertinent facts and
our evaluation of present circumstances.
Off
Balance Sheet Arrangements
We do not
have any off balance sheet arrangements or interests in variable interest
entities that would require consolidation. US Ecology operates through
wholly-owned subsidiaries.
Item
7A. Quantitative and Qualitative Disclosures About Market Risk
We do not
maintain equities, commodities, derivatives, or any other similar instruments
for trading or any other purposes.
We have
minimal interest rate risk on investments or other assets due to our
preservation of capital approach to investments. At December 31, 2009,
approximately $31.3 million was held in cash and cash equivalents primarily
invested in money market accounts. Interest earned on these
investments is less than 1% per year. We have no debt obligations subject to
interest rate risk except for our available credit facility, under which we can
elect to borrow monies utilizing LIBOR plus an applicable spread or the prime
rate. At December 31, 2009 and 2008, there were no outstanding
borrowings on the credit facility.
33
Item
8. Financial Statements and Supplementary Data
|
Page
Number
|
||
|
Report
of Independent Registered Public Accounting Firm
|
35
|
|
|
Report
of Independent Registered Public Accounting Firm
|
36
|
|
|
Consolidated
Balance Sheets as of December 31, 2009 and 2008
|
37
|
|
|
Consolidated
Statements of Operations for the years ended December 31, 2009, 2008 and
2007
|
38
|
|
|
Consolidated
Statements of Cash Flows for the years ended December 31, 2009, 2008 and
2007
|
39
|
|
|
Consolidated
Statements of Stockholders’ Equity for the years ended December 31, 2009,
2008 and 2007
|
40
|
|
|
Notes
to Consolidated Financial Statements
|
41
|
34
REPORT OF INDEPENDENT REGISTERED PUBLIC ACCOUNTING FIRM
To the
Board of Directors and Stockholders of
U.S.
Ecology, Inc.
Boise,
Idaho
We have
audited the accompanying consolidated balance sheet of U.S. Ecology, Inc.
(formerly known as American Ecology Corporation) and subsidiaries (the
"Company") as of December 31, 2009, and the related consolidated statements of
operations, stockholders' equity, and cash flows for the year ended December 31,
2009. We also have audited the Company's internal control over financial
reporting as of December 31, 2009, based on criteria established in Internal
Control — Integrated Framework issued by the Committee of Sponsoring
Organizations of the Treadway Commission. The Company's management is
responsible for these financial statements, for maintaining effective internal
control over financial reporting, and for its assessment of the effectiveness of
internal control over financial reporting, included in the accompanying
Management’s Annual Report on Internal Controls over Financial Reporting. Our
responsibility is to express an opinion on these financial statements and an
opinion on the Company's internal control over financial reporting based on our
audits.
We
conducted our audits in accordance with the standards of the Public Company
Accounting Oversight Board (United States). Those standards require that we plan
and perform the audit to obtain reasonable assurance about whether the financial
statements are free of material misstatement and whether effective internal
control over financial reporting was maintained in all material respects. Our
audits of the financial statements included examining, on a test basis, evidence
supporting the amounts and disclosures in the financial statements, assessing
the accounting principles used and significant estimates made by management, and
evaluating the overall financial statement presentation. Our audit of internal
control over financial reporting included obtaining an understanding of internal
control over financial reporting, assessing the risk that a material weakness
exists, and testing and evaluating the design and operating effectiveness of
internal control based on the assessed risk. Our audits also included performing
such other procedures as we considered necessary in the circumstances. We
believe that our audits provide a reasonable basis for our
opinions.
A
company's internal control over financial reporting is a process designed by, or
under the supervision of, the company's principal executive and principal
financial officers, or persons performing similar functions, and effected by the
company's board of directors, management, and other personnel to provide
reasonable assurance regarding the reliability of financial reporting and the
preparation of financial statements for external purposes in accordance with
generally accepted accounting principles. A company's internal control over
financial reporting includes those policies and procedures that (1) pertain to
the maintenance of records that, in reasonable detail, accurately and fairly
reflect the transactions and dispositions of the assets of the company; (2)
provide reasonable assurance that transactions are recorded as necessary to
permit preparation of financial statements in accordance with generally accepted
accounting principles, and that receipts and expenditures of the company are
being made only in accordance with authorizations of management and directors of
the company; and (3) provide reasonable assurance regarding prevention or timely
detection of unauthorized acquisition, use, or disposition of the company's
assets that could have a material effect on the financial
statements.
Because
of the inherent limitations of internal control over financial reporting,
including the possibility of collusion or improper management override of
controls, material misstatements due to error or fraud may not be prevented or
detected on a timely basis. Also, projections of any evaluation of the
effectiveness of the internal control over financial reporting to future periods
are subject to the risk that the controls may become inadequate because of
changes in conditions, or that the degree of compliance with the policies or
procedures may deteriorate.
In our opinion, the
consolidated financial statements referred to above present fairly, in all
material respects, the financial position of U.S. Ecology, Inc. and subsidiaries
as of December 31, 2009, and the results of their operations and their cash
flows for the year ended December 31, 2009, in conformity with accounting
principles generally accepted in the United States of America. Also, in our
opinion, the Company maintained, in all material respects, effective internal
control over financial reporting as of December 31, 2009, based on the criteria
established in Internal
Control — Integrated Framework issued by the Committee of Sponsoring
Organizations of the Treadway Commission.
/s/
Deloitte and Touche LLP
Boise,
Idaho
March 4,
2010
35
REPORT
OF INDEPENDENT REGISTERED PUBLIC ACCOUNTING FIRM
To the
Stockholders and Board of Directors of
U.S.
Ecology, Inc.
We have
audited the accompanying consolidated balance sheet of U.S. Ecology, Inc.
(formerly American Ecology Corporation) and subsidiaries (“the Company”) as of
December 31, 2008, and the related consolidated statements of operations,
stockholders' equity and cash flows for each of the years in the two-year period
ended December 31, 2008. These consolidated financial statements are the
responsibility of the Company's management. Our responsibility is to express an
opinion on these financial statements based on our audits.
We
conducted our audits in accordance with the standards of the Public Company
Accounting Oversight Board (United States). Those standards require that we plan
and perform the audits to obtain reasonable assurance about whether the
financial statements are free of material misstatement. An audit
includes examining, on a test basis, evidence supporting the amounts and
disclosures in the consolidated financial statements. An audit also includes
assessing the accounting principles used and significant estimates made by
management, as well as evaluating the overall financial statement presentation.
We believe that our audits provide a reasonable basis for our
opinion.
In our
opinion, the consolidated financial statements referred to above present fairly,
in all material respects, the consolidated financial position of U.S. Ecology,
Inc. and subsidiaries as of December 31, 2008 and the consolidated results of
its operations and its cash flows for each of the years in the two-year period
ended December 31, 2008, in conformity with accounting principles generally
accepted in the United States of America.
/s/
Moss Adams LLP
Portland,
OR
February
25, 2009
36
US
ECOLOGY, INC. (formerly known as American Ecology Corporation)
CONSOLIDATED
BALANCE SHEETS
in
thousands, except share and per share amounts
|
As
of December 31,
|
||||||||
|
2009
|
2008
|
|||||||
|
Assets
|
||||||||
|
Current
Assets:
|
||||||||
|
Cash
and cash equivalents
|
$ | 31,347 | $ | 18,473 | ||||
|
Short-term
investments
|
1,395 | - | ||||||
|
Receivables,
net
|
16,302 | 30,737 | ||||||
|
Prepaid
expenses and other current assets
|
1,752 | 2,281 | ||||||
|
Income
tax receivable
|
- | 2,834 | ||||||
|
Deferred
income taxes
|
41 | 417 | ||||||
|
Total
current assets
|
50,837 | 54,742 | ||||||
|
Property
and equipment, net
|
67,485 | 67,987 | ||||||
|
Restricted
cash
|
4,800 | 4,716 | ||||||
|
Other
assets
|
540 | - | ||||||
|
Total
assets
|
$ | 123,662 | $ | 127,445 | ||||
|
Liabilities
And Stockholders’ Equity
|
||||||||
|
Current
Liabilities:
|
||||||||
|
Accounts
payable
|
$ | 4,264 | $ | 5,400 | ||||
|
Deferred
revenue
|
1,353 | 4,657 | ||||||
|
Accrued
liabilities
|
4,150 | 4,398 | ||||||
|
Accrued
salaries and benefits
|
1,735 | 2,895 | ||||||
|
Income
taxes payable
|
201 | - | ||||||
|
Current
portion of closure and post-closure obligations
|
293 | 490 | ||||||
|
Current
portion of capital lease obligations
|
11 | 10 | ||||||
|
Total
current liabilities
|
12,007 | 17,850 | ||||||
|
Long-term
closure and post-closure obligations
|
13,070 | 13,972 | ||||||
|
Long-term
capital lease obligations
|
10 | 21 | ||||||
|
Deferred
income taxes
|
5,077 | 3,660 | ||||||
|
Total
liabilities
|
30,164 | 35,503 | ||||||
|
Contingencies
and commitments
|
||||||||
|
Stockholders’
Equity:
|
||||||||
|
Common
stock $0.01 par value, 50,000 authorized; 18,306 and 18,304 shares
issued, respectively
|
183 | 183 | ||||||
|
Additional
paid-in capital
|
61,459 | 60,803 | ||||||
|
Retained
earnings
|
34,446 | 33,544 | ||||||
|
Common
stock held in treasury, at cost, 155 and 155, respectively
|
(2,590 | ) | (2,588 | ) | ||||
|
Total
stockholders’ equity
|
93,498 | 91,942 | ||||||
|
Total
liabilities and stockholders’ equity
|
$ | 123,662 | $ | 127,445 | ||||
The
accompanying notes are an integral part of these financial
statements.
37
US
ECOLOGY, INC. (formerly known as American Ecology Corporation)
CONSOLIDATED
STATEMENTS OF OPERATIONS
in
thousands, except share and per share amounts
|
For
the Year Ended December 31,
|
||||||||||||
|
2009
|
2008
|
2007
|
||||||||||
|
Revenue
|
$ | 132,519 | $ | 175,827 | $ | 165,520 | ||||||
|
Transportation
costs
|
52,708 | 82,064 | 79,326 | |||||||||
|
Other
direct operating costs
|
43,535 | 44,322 | 40,681 | |||||||||
|
Gross
profit
|
36,276 | 49,441 | 45,513 | |||||||||
|
Selling,
general and administrative expenses
|
13,835 | 14,920 | 14,646 | |||||||||
|
Insurance
proceeds
|
(661 | ) | - | - | ||||||||
|
Operating
income
|
23,102 | 34,521 | 30,867 | |||||||||
|
Other
income (expense):
|
||||||||||||
|
Interest
income
|
116 | 413 | 732 | |||||||||
|
Interest
expense
|
(2 | ) | (7 | ) | (3 | ) | ||||||
|
Other
|
267 | 306 | 122 | |||||||||
|
Total
other income
|
381 | 712 | 851 | |||||||||
|
Income
before income taxes
|
23,483 | 35,233 | 31,718 | |||||||||
|
Income
tax expense
|
9,513 | 13,735 | 12,322 | |||||||||
|
Net
income
|
$ | 13,970 | $ | 21,498 | $ | 19,396 | ||||||
|
Earnings
per share:
|
||||||||||||
|
Basic
|
$ | 0.77 | $ | 1.18 | $ | 1.06 | ||||||
|
Diluted
|
$ | 0.77 | $ | 1.18 | $ | 1.06 | ||||||
|
Shares
used in earnings per share
calculation:
|
||||||||||||
|
Basic
|
18,146 | 18,236 | 18,217 | |||||||||
|
Diluted
|
18,173 | 18,290 | 18,257 | |||||||||
|
Dividends
paid per share
|
$ | 0.72 | $ | 0.66 | $ | 0.60 | ||||||
The
accompanying notes are an integral part of these financial
statements.
38
US
ECOLOGY, INC. (formerly known as American Ecology Corporation)
CONSOLIDATED
STATEMENTS OF CASH FLOWS
in
thousands
|
For
the Year Ended December 31,
|
||||||||||||
|
2009
|
2008
|
2007
|
||||||||||
|
Cash
Flows From Operating Activities:
|
||||||||||||
|
Net
income
|
$ | 13,970 | $ | 21,498 | $ | 19,396 | ||||||
|
Adjustments
to reconcile net income to net cash provided by operating
activities:
|
||||||||||||
|
Depreciation,
amortization and accretion
|
9,046 | 10,641 | 10,009 | |||||||||
|
Deferred
income taxes
|
1,793 | 3,333 | 2,924 | |||||||||
|
Stock-based
compensation expense
|
655 | 820 | 743 | |||||||||
|
Net
loss (gain) on sale of property and equipment
|
296 | 34 | (26 | ) | ||||||||
|
Accretion
of interest income
|
- | (15 | ) | (158 | ) | |||||||
|
Changes
in assets and liabilities:
|
||||||||||||
|
Receivables
|
14,435 | (1,315 | ) | (1,730 | ) | |||||||
|
Income
tax receivable
|
2,834 | (1,840 | ) | (344 | ) | |||||||
|
Other
assets
|
(11 | ) | 753 | (395 | ) | |||||||
|
Accounts
payable and accrued liabilities
|
(1,054 | ) | (1,815 | ) | (659 | ) | ||||||
|
Deferred
revenue
|
(3,304 | ) | 166 | 879 | ||||||||
|
Accrued
salaries and benefits
|
(1,160 | ) | 282 | 670 | ||||||||
|
Income
tax payable
|
201 | - | - | |||||||||
|
Closure
and post-closure obligations
|
(928 | ) | (1,934 | ) | (659 | ) | ||||||
|
Other
|
14 | - | - | |||||||||
|
Net
cash provided by operating activities
|
36,787 | 30,608 | 30,650 | |||||||||
|
Cash
Flows From Investing Activities:
|
||||||||||||
|
Purchases
of property and equipment
|
(9,405 | ) | (13,617 | ) | (15,430 | ) | ||||||
|
Purchases
of short-term investments
|
(1,409 | ) | (992 | ) | (24,901 | ) | ||||||
|
Maturities
of short-term investments
|
- | 3,216 | 28,970 | |||||||||
|
Restricted
cash
|
(84 | ) | 165 | (190 | ) | |||||||
|
Proceeds
from sale of property and equipment
|
64 | 14 | 92 | |||||||||
|
Net
cash used in investing activities
|
(10,834 | ) | (11,214 | ) | (11,459 | ) | ||||||
|
Cash
Flows From Financing Activities:
|
||||||||||||
|
Dividends
paid
|
(13,068 | ) | (12,054 | ) | (10,937 | ) | ||||||
|
Common
stock repurchases
|
(2 | ) | (2,588 | ) | - | |||||||
|
Payment
of capital lease obligations
|
(10 | ) | (10 | ) | (7 | ) | ||||||
|
Proceeds
from stock option exercises
|
- | 1,095 | 328 | |||||||||
|
Tax
benefit of common stock options
|
- | 73 | 213 | |||||||||
|
Other
|
1 | - | - | |||||||||
|
Net
cash used in financing activities
|
(13,079 | ) | (13,484 | ) | (10,403 | ) | ||||||
|
Increase
in cash and cash equivalents
|
12,874 | 5,910 | 8,788 | |||||||||
|
Cash
and cash equivalents at beginning of year
|
18,473 | 12,563 | 3,775 | |||||||||
|
Cash
and cash equivalents at end of year
|
$ | 31,347 | $ | 18,473 | $ | 12,563 | ||||||
|
Supplemental
Disclosures
|
||||||||||||
|
Income
taxes paid, net of receipts
|
$ | 4,686 | $ | 12,169 | $ | 9,545 | ||||||
|
Interest
paid
|
2 | 7 | 3 | |||||||||
|
Non-cash
investing and financing activities:
|
||||||||||||
|
Closure/Post
closure retirement asset
|
(1,338 | ) | 45 | 1,913 | ||||||||
|
Capital
expenditures in accounts payable
|
566 | 896 | 411 | |||||||||
|
Acquisition
of equipment with capital leases
|
- | 6 | 12 | |||||||||
The
accompanying notes are an integral part of these financial
statements.
39
US
ECOLOGY, INC. (formerly known as American Ecology Corporation)
CONSOLIDATED
STATEMENTS OF STOCKHOLDERS’ EQUITY
$s
in thousands
|
Common
Shares
Issued
|
Par
Value
Common
Stock
|
Additional
Paid-In
Capital
|
Retained
Earnings
|
Treasury
Stock
|
Total
Equity
|
|||||||||||||||||||
|
Balance
12-31-2006
|
18,174,040 | $ | 182 | $ | 57,532 | $ | 15,641 | $ | - | $ | 73,355 | |||||||||||||
|
Net
income
|
- | - | - | 19,396 | - | 19,396 | ||||||||||||||||||
|
Dividend
paid
|
- | - | - | (10,937 | ) | - | (10,937 | ) | ||||||||||||||||
|
Stock
option exercises
|
51,000 | - | 328 | - | - | 328 | ||||||||||||||||||
|
Tax
benefit of equity based awards
|
- | - | 213 | - | - | 213 | ||||||||||||||||||
|
Stock-based
compensation
|
- | - | 743 | - | - | 743 | ||||||||||||||||||
|
Issuance
of restricted common stock net of forfeitures
|
21,000 | - | - | - | - | - | ||||||||||||||||||
|
Balance
12-31-2007
|
18,246,040 | 182 | 58,816 | 24,100 | - | 83,098 | ||||||||||||||||||
|
Net
income
|
- | - | - | 21,498 | - | 21,498 | ||||||||||||||||||
|
Dividend
paid
|
- | - | - | (12,054 | ) | - | (12,054 | ) | ||||||||||||||||
|
Stock
option exercises
|
53,774 | 1 | 1,094 | - | - | 1,095 | ||||||||||||||||||
|
Tax
benefit of equity based awards
|
- | - | 73 | - | - | 73 | ||||||||||||||||||
|
Stock-based
compensation
|
- | - | 820 | - | - | 820 | ||||||||||||||||||
|
Issuance
of restricted common stock
|
4,500 | - | - | - | - | - | ||||||||||||||||||
|
Repurchase
of common stock: 155,175 shares
|
- | - | - | - | (2,588 | ) | (2,588 | ) | ||||||||||||||||
|
Balance
12-31-2008
|
18,304,314 | 183 | 60,803 | 33,544 | (2,588 | ) | 91,942 | |||||||||||||||||
|
Net
income
|
- | - | - | 13,970 | - | 13,970 | ||||||||||||||||||
|
Dividend
paid
|
- | - | - | (13,068 | ) | - | (13,068 | ) | ||||||||||||||||
|
Tax
benefit of equity based awards
|
- | - | - | - | - | - | ||||||||||||||||||
|
Stock-based
compensation
|
- | - | 655 | - | 655 | |||||||||||||||||||
|
Issuance
of restricted common stock net of forfeitures
|
1,300 | - | - | - | - | - | ||||||||||||||||||
|
Repurchase
of common stock: 140 shares
|
- | - | - | - | (2 | ) | (2 | ) | ||||||||||||||||
|
Other
|
- | - | 1 | - | - | 1 | ||||||||||||||||||
|
Balance
12-31-2009
|
18,305,614 | $ | 183 | $ | 61,459 | $ | 34,446 | $ | (2,590 | ) | $ | 93,498 | ||||||||||||
The
accompanying notes are an integral part of these financial
statements
40
US
ECOLOGY, INC. (formerly known as American Ecology Corporation)
NOTES
TO CONSOLIDATED FINANCIAL STATEMENTS
|
NOTE
1.
|
DESCRIPTION
OF BUSINESS
|
US
Ecology was most recently incorporated as a Delaware corporation in May 1987 as
American Ecology Corporation. On February 22, 2010 the Company changed its name
from American Ecology Corporation to US Ecology, Inc. US Ecology, Inc., through
its subsidiaries provides radioactive, Polychlorinated biphenyl (“PCB”),
hazardous and industrial waste management services to commercial and government
entities, such as refineries and chemical production facilities, electric
utilities, manufacturers, steel mills and medical and academic institutions. We
are headquartered in Boise, Idaho. Throughout these financial statements words
such as “we,” “us,” “our,” “US Ecology” and the “Company” refer to US Ecology,
Inc., and its subsidiaries.
Our
principal operating subsidiaries are US Ecology Nevada, Inc., a Delaware
corporation; US Ecology Texas, Inc., a Delaware corporation; US Ecology
Washington, Inc., a Delaware corporation; and US Ecology Idaho, Inc., a Delaware
corporation.
We
operate within two segments: Operating Disposal Facilities and Non-Operating
Disposal Facilities. The Operating Disposal Facilities are currently accepting
hazardous, PCB, industrial and low-level radioactive waste (“LLRW”), naturally
occurring and accelerator produced radioactive materials (“NORM/NARM”) and
low-activity radioactive material (“LARM”). The Operating Disposal Facilities
segment includes our RCRA permitted waste treatment and disposal facilities in
Beatty, Nevada; Grand View, Idaho; and Robstown, Texas, and our AEA permitted
disposal facility in Richland, Washington.
The
Non-Operating Disposal Facilities segment includes our closed hazardous waste
disposal, processing, and deep-well injection facilities located in Sheffield,
Illinois; Bruneau, Idaho; and Winona, Texas. We currently incur costs for
remediation and long-term monitoring and maintenance obligations at our closed
facilities.
|
NOTE
2.
|
SUMMARY
OF SIGNIFICANT ACCOUNTING POLICIES
|
Principles of Consolidation.
The accompanying financial statements are prepared on a consolidated basis. All
significant inter-company balances and transactions have been eliminated in
consolidation. Our year-end is December 31. We have evaluated
subsequent events through the date and time the financial statements were issued
on March 4, 2010.
Cash and Cash Equivalents.
Cash and cash equivalents consist primarily of cash on deposit, money market
accounts and short-term investments with remaining maturities of 90 days or
less.
Short-Term Investments.
Short-term investments consist of investments in government agency securities or
investments in high-quality commercial paper. Investments are classified as
available for sale and held at amortized cost, which approximates fair value.
The investments have a maximum maturity of nine months at December 31, 2009. Our
investment policy allows for maturities up to two years and a wide range of
investment rated debt.
Financial Instruments. Cash
and cash equivalents, short-term investments, accounts receivable, short-term
borrowings, restricted cash, accounts payable and accrued liabilities as
presented in the consolidated financial statements approximate fair value
because of the short-term nature of these instruments.
Receivables. Receivables are
stated at an amount management expects to collect. Based on management’s
assessment of the credit history of the customers having outstanding balances
and factoring in current economic conditions, management has concluded that
potential unreserved future losses on balances outstanding at year-end will not
be material.
Restricted
Cash. Restricted cash balances of $4.8 million and
$4.7 million at December 31, 2009 and 2008, respectively, represent
funds held in third party managed trust accounts as collateral for our financial
assurance policies for closure and post-closure obligations. These
restricted cash balances are maintained by third-party trustees and are invested
in money market accounts. The balances are adjusted to fair market
value on a monthly basis.
Revenue Recognition. We
recognize revenue when persuasive evidence of an arrangement exists, delivery
and disposal have occurred or services have been rendered, the price is fixed or
determinable and collection is reasonably assured. We recognize revenue from two
primary sources: 1) waste treatment, recycling and disposal and 2) waste
transportation services.
41
Waste
treatment and disposal revenue results primarily from fees charged to customers
for treatment and/or disposal or recycling of specified wastes. Waste treatment
and disposal revenue is generally charged on a per-ton or per-yard basis based
on contracted prices and is recognized when services are complete and the waste
is disposed of in our landfill.
Transportation
revenue results from delivering customer waste to a disposal facility for
treatment and/or disposal or recycling. Transportation services are generally
not provided on a stand-alone basis and instead are bundled with other Company
services. However, in some instances we provide transportation and logistics
services for shipment of waste from cleanup sites to disposal facilities
operated by other companies. We account for our bundled arrangements as multiple
deliverable arrangements and determine the amount of revenue recognized for each
deliverable (unit of accounting) using the relative fair value method.
Transportation revenue is recognized when the transported waste is received at
the disposal facility. Waste treatment and disposal revenue under bundled
arrangements is recognized when services are complete and the waste is disposed
in the landfill, which is generally the same day as receipt of the waste at the
disposal site.
Burial
fees collected from customers for each ton or cubic yard of waste disposed in
our landfills are paid to the respective local and/or state government entity
and are not included in revenue. Revenue and associated cost from waste that has
been received but not yet treated and disposed of in our landfills are deferred
until disposal occurs.
Our
Richland, Washington disposal facility is regulated by the Washington Utilities
and Transportation Commission (“WUTC”), which approves our rates for disposal of
low-level radioactive waste regulated under the federal Atomic Energy Act
(“LLRW”). Annual revenue levels are established based on a rate agreement with
the WUTC at amounts sufficient to cover the costs of operation and provide us
with a reasonable profit. Per-unit rates charged to LLRW customers during the
year are based on our evaluation of disposal volume and radioactivity
projections submitted to us by waste generators. Our proposed rates are then
reviewed and approved by the WUTC. If annual revenue exceeds the approved levels
set by the WUTC, we are required to refund excess collections to facility users
on a pro-rata basis. The rate agreement in effect for 2009 began on January 1,
2008 and expires on January 1, 2014.
Unbilled Receivables.
Unbilled receivables are recorded for work performed under contracts that have
not yet been invoiced to customers and arise due to the timing of billings.
Substantially all unbilled receivables at December 31, 2009 were billed in the
following month.
Deferred revenue. Revenue
from waste that has been received but not yet treated and disposed of in our
landfill or advance billings prior to treatment and disposal services are
deferred until such services are completed.
Property and Equipment.
Property and equipment are recorded at cost and depreciated on the straight-line
method over estimated useful lives. Replacements and major repairs of property
and equipment are capitalized and retirements are made when assets are disposed
of or when the useful life has been exhausted. Minor components and parts are
expensed as incurred. During 2009, 2008 and 2007, maintenance and repair
expenses charged to continuing operations were $2.0 million, $2.1 million and
$1.9 million, respectively.
We assume
no salvage value for our depreciable fixed assets. The estimated useful lives
for significant property and equipment categories are as follows (in
years):
|
Useful
Lives
|
|||
|
Vehicles
and other equipment
|
3
to 10
|
||
|
Disposal
facility and equipment
|
3
to 20
|
||
|
Buildings
and improvements
|
5
to 40
|
||
|
Railcars
|
40
|
Disposal Cell Accounting.
Qualified disposal cell development costs such as personnel and equipment costs
incurred to construct new disposal cells are recorded and capitalized at cost.
Capitalized cell development costs, net of recorded amortization, are added to
estimated future costs of the permitted disposal cell to be incurred over the
remaining construction of the cell, to determine the amount to be amortized over
the remaining estimated cell life. Estimates of future costs are developed using
input from independent engineers and internal technical and accounting managers.
We review these estimates at least annually. Amortization is recorded on a unit
of consumption basis, typically applying cost as a rate per cubic yard disposed.
Disposal facility costs are expected to be fully amortized upon final closure of
the facility, as no salvage value applies. Costs associated with ongoing
disposal operations are charged to expense as incurred.
42
We have
material financial commitments for closure and post-closure obligations for
certain facilities we own or operate. We estimate future cost requirements for
closure and post-closure monitoring based on Resource Conservation and Recovery
Act (“RCRA”), and conforming state requirements and facility permits. RCRA
requires that companies provide the responsible regulatory agency acceptable
financial assurance for closure and post-closure monitoring of each facility for
30 years following closure. Estimates for final closure and post-closure costs
are developed using input from our technical and accounting managers as well as
independent engineers and are reviewed by management at least annually. These
estimates involve projections of costs that will be incurred after the disposal
facility ceases operations, through the required post-closure care period. The
present value of the estimated closure and post-closure costs are accreted using
the interest method of allocation to other direct costs in our consolidated
statement of operations so that 100% of the future cost has been incurred at the
time of payment.
Impairment of Long-lived
assets. Long-lived assets consist primarily of property and equipment and
facility development costs. The recoverability of long-lived assets is evaluated
periodically through analysis of operating results and consideration of other
significant events or changes in the business environment. If an operating unit
had indications of possible impairment, such as current operating losses, we
would evaluate whether impairment exists on the basis of undiscounted expected
future cash flows from operations over the remaining amortization period. If an
impairment loss were to exist, the carrying amount of the related long-lived
assets would be reduced to their estimated fair value based upon discounted cash
flows from operations.
Income taxes. Income taxes
are accounted for using an asset and liability approach. This requires the
recognition of deferred tax assets and liabilities for the expected future tax
consequences of temporary differences between the financial statement and tax
basis of assets and liabilities at the applicable tax rates. A valuation
allowance is recorded against deferred tax assets if, based on the weight of the
available evidence, it is more likely than not that some or all of the deferred
tax assets will not be realized.
The
determination of our provision for income taxes requires significant judgment,
the use of estimates, and the interpretation and application of complex tax
laws. Significant judgment is required in assessing the timing and amounts of
deductible and taxable items and the probability of sustaining uncertain tax
positions. The impact of uncertain tax positions would be recorded in our
financial statements only after determining a more-likely-than-not probability
that the uncertain tax positions would withstand challenge, if any, from taxing
authorities. As facts and circumstances change, we reassess these probabilities
and would record any changes in the financial statements as
appropriate.
Insurance. We are
self-insured for health-care coverage of employees. Stop-loss insurance is
carried, under which we assume liability for claims in excess of $150,000 per
individual or on an aggregate basis for the monthly population. Accrued costs
for our self-insured health care coverage were $212,000 and $234,000 at December
31, 2009 and 2008, respectively. We also maintain a Pollution and Remediation
Legal Liability Policy pursuant to RCRA subject to a $250,000 self-insured
retention. We are also insured for consultant environmental liability subject to
a $100,000 self-insured retention. Additionally, we are insured for
losses or damage to third party property or people subject to a $50,000
self-insured retention.
Earnings per share. Basic
earnings per share is calculated based on the weighted-average number of
outstanding common shares during the applicable period. Diluted earnings per
share is based on the weighted-average number of outstanding common shares plus
the weighted-average number of potential outstanding common shares. Potential
common shares that would increase earnings per share or decrease loss per share
are anti-dilutive and are excluded from earnings per share computations.
Earnings per share is computed separately for each period
presented.
Treasury Stock. Shares of
common stock repurchased by us are recorded at cost as treasury stock and result
in a reduction of stockholders’ equity in our Consolidated Balance Sheets.
Treasury shares are reissued using the weighted average cost method for
determining the cost of the shares reissued. The difference between
the cost of the shares reissued and the issuance price is added or deducted from
additional paid-in capital.
43
New and Recently Issued
Accounting Pronouncements.
In
December 2007, the FASB issued a new statement regarding business
combinations located under ASC Topic 805 Business Combinations
(formerly SFAS 141(revised 2007), Business Combinations ),
which establishes principles and requirements for how an acquirer recognizes and
measures the identifiable assets acquired, the liabilities assumed and any
non-controlling interest in the acquiree in a business combination. The new
statement requires that assets and liabilities, including contingencies, be
recorded at the fair value determined on the acquisition date with changes
thereafter reflected in results of operations, as opposed to goodwill.
Additionally, the new statement modifies the treatment of restructuring costs
associated with a business combination and requires acquisition costs to be
expensed as incurred. The new statement also provides guidance on disclosures
related to the nature and financial impact of the business combination and is
effective for transactions closing after December 15, 2008 and for fiscal years
beginning after December 15, 2008. The new statement will be applied for
future business combinations, if any, entered into by the Company. The impact of
this new standard is dependent on the nature of completed acquisition. Any
impact will be evaluated as part of the economic evaluation of such a business
combination.
In
December 2007, the FASB issued a new statement establishing accounting and
reporting standards for the non-controlling interest in a subsidiary and for the
deconsolidation of a subsidiary located under ASC Topic 810 Consolidation (formerly SFAS
160, Noncontrolling Interests
in Consolidated Financial Statements – an amendment of ARB No. 51). This
statement is effective prospectively, except for certain retrospective
disclosure requirements, for fiscal years beginning after December 15,
2008. This statement was effective for the Company at the beginning of the first
quarter of 2009 and had no impact on our consolidated financial statements since
we have no non-controlling interests in any subsidiaries and have had no
subsidiary deconsolidation.
In May
2009, the FASB issued a new statement that establishes general standards of
accounting for, and disclosure of events that occur after the balance sheet date
but before the financial statements are issued or are available to be issued.
The new statement, located in ASC Topic 855 Subsequent Events (formerly
SFAS 165, Subsequent
Events) requires entities to disclose the date through which subsequent
events were evaluated as well as the rationale for why that date was selected,
that is, whether that date represents the date the financial statements were
issued or were available to be issued. The new statement is effective for
interim or annual periods ending after June 15, 2009, which was the quarter
ended June 30, 2009 for the Company. In February 2010, the FASB amended its
guidance removing the requirement for SEC filers to disclose the date through
which an entity has evaluated subsequent events. The adoption of this new
statement did not have a material impact on our consolidated financial
statements.
In June
2009, the FASB issued a new statement that provides for the FASB ASC (the
“Codification”) to become the single official source of authoritative,
nongovernmental U.S. generally accepted accounting principles (GAAP). The
new statement, located in ASC Topic 105-10 Generally Accepted Accounting
Principles (formerly SFAS 168, The FASB Accounting Standards
Codification™ and the Hierarchy of Generally Accepted Accounting Principles – a
replacement of FASB Statement No. 162) is effective for interim and
annual periods ending after September 15, 2009, which was the quarter ended
September 30, 2009 for the Company. The adoption of this statement
did not have a material impact on our consolidated financial
statements.
|
NOTE
3.
|
USE
OF ESTIMATES AND RECLASSIFICATIONS
|
Use of
Estimates
The
preparation of financial statements in conformity with accounting principles
generally accepted in the United States requires management to make estimates
and assumptions that affect the reported amounts of assets and liabilities and
the disclosure of contingent assets and liabilities at the date of the financial
statements, as well as the reported amounts of revenue and expenses during the
reporting period. Listed below are the estimates and assumptions that management
considers to be significant in the preparation of its financial
statements.
|
●
|
Allowance for Doubtful
Accounts – We estimate losses for uncollectible accounts based on
the aging of the accounts receivable and an evaluation of the likelihood
of success in collecting the
receivable.
|
|
●
|
Recovery of Long-Lived
Assets – We evaluate the recovery of our long-lived assets
periodically by analyzing its operating results and considering
significant events or changes in the business
environment.
|
|
●
|
Income Taxes – We
assume the deductibility of certain costs in our income tax filings,
estimate our state income tax rate and estimate the future recovery of
deferred tax assets.
|
|
●
|
Legal Accruals – We
estimate the amount of potential exposure we may have with respect to
litigation, claims and
assessments.
|
44
|
●
|
Disposal Cell Development and
Final Closure/Post-Closure Amortization – We expense amounts for
disposal cell usage and final closure and post-closure costs for each
cubic yard of waste disposed of at our operating facilities. In
determining the amount to expense for each cubic yard of waste disposed,
we estimate the cost to develop each disposal cell and the final closure
and post-closure costs for each disposal cell and facility. The expense
for each cubic yard is then calculated based on the remaining permitted
capacity and total permitted capacity. Estimates for final closure and
post-closure costs are developed using input from third-party engineering
consultants, and our internal technical and accounting personnel.
Management reviews estimates at least annually. Estimates for final
disposal cell closure and post-closure consider when the costs would
actually be paid and, where appropriate, inflation and discount
rates.
|
Actual
results could differ materially from the estimates and assumptions that we use
in the preparation of our financial statements. As it relates to estimates and
assumptions in amortization rates and environmental obligations, significant
engineering, operations and accounting judgments are required. We review these
estimates and assumptions no less than annually. In many circumstances, the
ultimate outcome of these estimates and assumptions will not be known for
decades into the future. Actual results could differ materially from these
estimates and assumptions due to changes in applicable regulations, changes in
future operational plans and inherent imprecision associated with estimating
environmental impacts far into the future.
Reclassifications
The
Company reclassified $267,000 from long-term deferred income tax liabilities to
current deferred income tax assets on the consolidated balance sheet at December
31, 2008. The amount reclassified represents the portion of the Company’s
valuation allowance on deferred tax assets allocated to current deferred
taxes. Previously, the entire valuation allowance on deferred taxes
was recorded against long-term deferred tax assets. This reclassification had no
impact on results of operations or cash flows and we believe this
reclassification is not material to the consolidated financial statements taken
as a whole.
|
NOTE
4.
|
CONCENTRATIONS
AND CREDIT RISK
|
Major Customers. Honeywell
International, Inc., accounted for 38%, 43% and 41% of revenue for the years
ending December 31, 2009, 2008 and 2007, respectively. No other
customer accounted for more than 10% of revenue for the years ending December
31, 2009, 2008 and 2007.
The
following customers accounted for more than 10% of total trade receivables as of
December 31:
|
Percent
of Receivables
|
|||||||||
|
Customer
|
2009
|
2008
|
|||||||
|
Honeywell
International, Inc.
|
2% | 43% | |||||||
|
U.S.
Army Corps of Engineers
|
18% | 5% | |||||||
|
WRS
Infrastructure & Environmental
|
11% | 0% | |||||||
No other
customer’s trade receivables represented more than 10% as of December 31, 2009
and 2008.
Credit Risk Concentration. We
maintain most of our cash and short-term investments with nationally recognized
financial institutions like Wells Fargo Bank. Substantially all balances are
uninsured and are not used as collateral for other obligations. Concentrations
of credit risk on accounts receivable are believed to be limited due to the
number, diversification and character of the obligors and our credit evaluation
process.
Labor Concentrations. As of
December 31, 2009, the Paper, Allied-Industrial Chemical & Energy Workers
International Union, AFL-CIO, CLC (PACE), represents 10 employees at our
Richland facility. Our 211 other employees do not belong to a
union.
|
NOTE
5.
|
SHORT-TERM
INVESTMENTS
|
Short-term
investments at December 31, 2009 comprised of $1.4 million in fixed maturity
commercial paper maturing in June 2010. There were no short-term investments
outstanding at December 31, 2008.
45
|
NOTE
6.
|
RECEIVABLES
|
Receivables
at December 31, 2009 and 2008
were as follows:
|
$s
in thousands
|
2009
|
2008
|
|||||||
|
Trade
|
$ | 16,016 | $ | 27,324 | |||||
|
Unbilled
revenue
|
337 | 3,536 | |||||||
|
Other
|
70 | 226 | |||||||
| 16,423 | 31,086 | ||||||||
|
Allowance
for doubtful accounts
|
(121 | ) | (349 | ) | |||||
| $ | 16,302 | $ | 30,737 | ||||||
The
allowance for doubtful accounts is a provision for uncollectible accounts
receivable and unbilled receivables. The allowance is evaluated and adjusted to
reflect our collection history and an analysis of the accounts receivables
aging. The allowance is decreased by accounts receivable as they are written
off. The allowance is adjusted periodically to reflect actual
experience:
|
$s
in thousands
|
Balance
at
Beginning
of
Period
|
Charged
(Credited)
to
Costs
and
Expenses
|
Recoveries
(Deductions/
Write-offs)
|
Balance
at
End
of Period
|
||||||||||||||
|
Allowance
for Doubtful Accounts
|
||||||||||||||||||
|
Year
ended December 31, 2009
|
$ | 349 | $ | (39 | ) | $ | (189 | ) | $ | 121 | ||||||||
|
Year
ended December 31, 2008
|
$ | 134 | $ | 219 | $ | (4 | ) | $ | 349 | |||||||||
|
Year
ended December 31, 2007
|
$ | 110 | $ | 103 | $ | (79 | ) | $ | 134 | |||||||||
|
NOTE
7.
|
PROPERTY
AND EQUIPMENT
|
Property
and equipment at December 31, 2009 and 2008
were as follows:
|
$s
in thousands
|
2009
|
2008
|
|||||||
|
Cell
development costs
|
$ | 44,029 | $ | 42,432 | |||||
|
Land
and improvements
|
9,773 | 9,158 | |||||||
|
Buildings
and improvements
|
29,151 | 29,721 | |||||||
|
Railcars
|
17,375 | 17,375 | |||||||
|
Vehicles
and other equipment
|
21,824 | 22,065 | |||||||
|
Construction
in progress
|
7,822 | 4,473 | |||||||
| 129,974 | 125,224 | ||||||||
|
Accumulated
depreciation and amortization
|
(62,489 | ) | (57,237 | ) | |||||
| $ | 67,485 | $ | 67,987 | ||||||
Depreciation
and amortization expense was $7.9 million, $9.4 million and $8.9 million for the
years ended December 31, 2009, 2008 and 2007, respectively.
|
NOTE
8.
|
EMPLOYEE
BENEFIT PLANS
|
We
maintain the US Ecology, Inc., 401(k) Savings Plan (“the Plan”) for employees
who voluntarily contribute a portion of their compensation, thereby deferring
income for federal income tax purposes. The Plan covers substantially all of our
employees. Participants may contribute a percentage of salary up to the IRS
limitations.We contribute a matching contribution equal to 55% of participant
contributions up to 6% of compensation. We contributed in 2009, 2008 and 2007
matching contributions to the Plan of $311,000, $311,000 and $267,000,
respectively.
46
|
NOTE
9.
|
CLOSURE
AND POST-CLOSURE OBLIGATIONS
|
Accrued
closure and post-closure liability represents the expected future costs,
including corrective actions, associated with closure and post-closure of our
operating and non-operating disposal facilities. Liabilities are recorded when
work is probable, and the costs can be reasonably estimated. We perform periodic
reviews of both non-operating and operating facilities and revise accruals for
estimated closure and post-closure, remediation or other costs as necessary.
Recorded liabilities are based on our best estimates of current costs and are
updated periodically to include the effects of existing technology, presently
enacted laws and regulations, inflation and other economic factors.
We do not
presently bear significant financial responsibility for closure and post-closure
care of the disposal facilities located on state-owned land at our Beatty,
Nevada site or state-leased federal land at the Richland, Washington site. The
States of Nevada and Washington collect fees from us based on the waste received
on a quarterly basis. Such fees are deposited in dedicated, state-controlled
funds to cover the future costs of closure and post-closure care and
maintenance. Such fees are periodically reviewed by the states.
We apply
ASC 410 to account for our asset retirement obligations which requires a
liability to be recognized as part of the fair value of future asset retirement
obligations and an associated asset to be recognized as part of the carrying
amount of the underlying asset. This obligation is valued based on our best
estimates of current costs and current estimated closure cost taking into
account current technology, material and service costs, laws and regulations.
These cost estimates are increased by an estimated inflation rate, estimated to
be 2.6% at December 31, 2009. Inflated current costs are then
discounted using our credit-adjusted risk-free interest rate, which approximates
our incremental borrowing rate, in effect at the time the obligation is
established or when there are upward revisions to our estimated closure and
post-closure costs. Our weighted-average credit-adjusted risk-free interest rate
at December 31, 2009 approximated 7.9%. We perform periodic reviews of both
non-operating and operating sites and revise the accruals as
necessary.
Changes
to reported closure and post-closure obligations for the years ended December
31, 2009 and 2008 were as follows:
|
$s
in thousands
|
2009
|
2008
|
|||||||
|
Beginning
obligation
|
$ | 14,462 | $ | 15,134 | |||||
|
Accretion
expense
|
1,167 | 1,217 | |||||||
|
Payments
|
(598 | ) | (1,011 | ) | |||||
|
Adjustments
|
(1,668 | ) | (878 | ) | |||||
|
Ending
obligation
|
13,363 | 14,462 | |||||||
|
Less
current portion
|
(293 | ) | (490 | ) | |||||
|
Long-term
portion
|
$ | 13,070 | $ | 13,972 | |||||
The
adjustment to the obligation is a change in the expected timing or amount of
cash expenditures based upon actual and estimated cash expenditures. The primary
adjustments in 2009 were: (1) a $1.9 million decrease to the
obligation for our Grand View, Idaho and Robstown, Texas facilities, primarily
as a result of decreases to our estimated costs to close active disposal cells,
(2) a $231,000 increase to the obligations associated with our non-operating
facilities as a result of changes in our estimated costs for closure and
post-closure activities.
The
primary adjustments in 2008 were: (1) an $857,000 decrease as a
result of removing the closure obligation associated with our Beatty, Nevada
facility based on written confirmation from the State of Nevada that cash
contributed by the Company and held in a dedicated state account maintained to
satisfy closure and post-closure obligations at our Beatty, Nevada hazardous
waste disposal facility can be used to fund interim closure work, (2) a net
$21,000 decrease to the obligation as a result of changes in our estimated costs
for closure and post-closure activities at our operating and non-operating
facilities.
47
The
reported closure and post-closure asset is recorded as a component of Property
and equipment, net, in the consolidated balance sheet for the years ended
December 31, 2009 and 2008 as follows:
|
$s
in thousands
|
2009
|
2008
|
|||||||
|
Net
closure and post-closure asset, beginning of year
|
$ | 2,228 | $ | 3,298 | |||||
|
Additions
or adjustments to closure and post-closure asset
|
(1,338 | ) | 30 | ||||||
|
Amortization
of closure post-closure asset
|
(890 | ) | (1,100 | ) | |||||
|
Net
closure and post-closure asset, end of year
|
$ | - | $ | 2,228 | |||||
|
NOTE
10.
|
DEBT
|
Revolving
Line of Credit
On June
30, 2008, we entered into a new $15.0 million unsecured revolving line of credit
(the “Revolving Credit Agreement”) with Wells Fargo Bank, National Association
(“Wells Fargo”). This Revolving Credit Agreement expires on June 15,
2010. Monthly interest only payments are paid based on a pricing grid
under which the interest rate decreases or increases based on our ratio of
funded debt to earnings before interest, taxes, depreciation and amortization.
We can elect to borrow utilizing the offshore London Inter-Bank Offering Rate
(“LIBOR”) plus an applicable spread or the prime rate. At December 31, 2009, the
applicable interest rate on the line of credit was 1.08%. The credit agreement
contains certain quarterly financial covenants, including a maximum leverage
ratio, a maximum funded debt ratio and a minimum required tangible net worth.
Pursuant to our credit agreement, we may only declare quarterly or annual
dividends if on the date of declaration, no event of default has occurred, or no
other event or condition has occurred that would constitute an event of default
after giving effect to the payment of the dividend. At December 31, 2009, we
were in compliance with all of the financial covenants in the credit agreement.
Based on discussions with Wells Fargo and other financial institutions, we do
not currently expect difficulties in renewing or replacing the existing
Revolving Credit Agreement on terms and conditions that we find to be
acceptable.
At
December 31, 2009 and 2008, we had no amounts outstanding on the revolving line
of credit. At December 31, 2009 the availability under the line of credit was
$11.0 million with $4.0 million of the line of credit issued in the form of a
standby letter of credit utilized as collateral for closure and post-closure
financial assurance. At December 31, 2008, the availability under the line of
credit was $11.0 million with $4.0 million of the line of credit issued in the
form of a standby letter of credit utilized as collateral for closure and
post-closure financial assurance.
|
NOTE
11.
|
INCOME
TAXES
|
The
components of the income tax expense were as follows:
|
$s
in thousands
|
2009
|
2008
|
2007
|
||||||||||
|
Current:
|
|||||||||||||
|
U.S.
Federal
|
$ | 6,630 | $ | 8,992 | $ | 8,310 | |||||||
|
State
|
1,090 | 1,411 | 1,088 | ||||||||||
| 7,720 | 10,403 | 9,398 | |||||||||||
|
Deferred:
|
|||||||||||||
|
U.S.
Federal
|
1,591 | 3,042 | 2,864 | ||||||||||
|
State
|
202 | 290 | 60 | ||||||||||
| 1,793 | 3,332 | 2,924 | |||||||||||
| $ | 9,513 | $ | 13,735 | $ | 12,322 | ||||||||
The following table reconciles between the effective income tax rate and the applicable statutory federal and state income tax rate:
|
2009
|
2008
|
2007
|
||||||||||||
|
Taxes
computed at statutory rate
|
35.0 | % | 35.0 | % | 35.0 | % | ||||||||
|
State
income taxes (net of federal) income tax benefit
|
3.7 | 3.4 | 2.0 | |||||||||||
|
Other
|
1.8 | 0.6 | 1.8 | |||||||||||
| 40.5 | % | 39.0 | % | 38.8 | % | |||||||||
48
The tax
effects of temporary differences between income for financial reporting and
taxes that gave rise to significant portions of the deferred tax assets and
liabilities as of December 31, 2009 and 2008 were as follows:
|
$s
in thousands
|
2009
|
2008
|
||||||||
|
Current
deferred tax assets:
|
||||||||||
|
Environmental
compliance and other site related costs
|
$ | 40 | $ | 188 | ||||||
|
Accruals,
allowances and other
|
320 | 496 | ||||||||
|
Less: valuation
allowance - current portion
|
(319 | ) | (267 | ) | ||||||
|
Total
current deferred tax assets
|
$ | 41 | $ | 417 | ||||||
|
Long-term
deferred tax assets (liabilities):
|
||||||||||
|
Net
operating loss carry forward
|
$ | 2,905 | $ | 2,313 | ||||||
|
Environmental
compliance and other site related costs
|
(1,623 | ) | (550 | ) | ||||||
|
Accruals,
allowances and other
|
81 | 90 | ||||||||
|
Property
and equipment
|
(3,873 | ) | (3,512 | ) | ||||||
|
Total
long-term deferred tax assets
|
(2,510 | ) | (1,659 | ) | ||||||
|
Less:
valuation allowance
|
(2,567 | ) | (2,001 | ) | ||||||
|
Net
long-term deferred tax (liabilities) assets
|
$ | (5,077 | ) | $ | (3,660 | ) | ||||
We have
historically recorded a valuation allowance for certain deferred tax assets due
to uncertainties regarding future operating results and limitations on
utilization of net operating loss carry forwards (“NOLs”) for tax purposes. The
realization of a significant portion of net deferred tax assets is based in part
on our estimates of the timing of reversals of certain temporary differences and
on the generation of taxable income before such reversals. At December 31, 2009
and 2008, we continued to maintain a valuation allowance for approximately $2.9
million and $2.3 million, respectively, of state tax benefits that are not
expected to be utilizable prior to expiration. During the first quarter of 2007,
we utilized the remaining $2.5 million of federal net operating loss carry
forwards that were available at December 31, 2006 and began paying our tax
obligations from operating cash flows during the second quarter of
2007.
On
January 1, 2007, we adopted the provisions of ASC 740 related to income tax
uncertainties (formerly FASB Interpretation No. 48, Accounting for Uncertainty in Income
Taxes-an Interpretation of FASB Statement No. 109) which clarifies the
accounting for income taxes by prescribing a minimum recognition threshold a tax
position is required to meet before being recognized in the financial
statements. ASC 740 also provides guidance on derecognition, measurement,
classification, interest and penalties, accounting in interim periods,
disclosure and transition. This adoption did not have an impact on our
consolidated financial statements. We had no unrecognized tax benefits as of
December 31, 2009, 2008 or 2007. We recognize interest assessed by taxing
authorities as a component of interest expense. We recognize any penalties
assessed by taxing authorities as a component of selling, general and
administrative expenses.
Interest and penalties for the years ended December 31, 2009, 2008 and
2007 were not material.
We file
U.S. federal income tax returns with the Internal Revenue Service (“IRS”) as
well as income tax returns in various states. We may be subject to examination
by the IRS for tax years 2006 through 2009. Additionally, we may be subject to
examinations by various state taxing jurisdictions for tax years 2005 through
2009. We are currently not under examination by the IRS or any state tax
jurisdiction.
|
NOTE
12.
|
CONTINGENCIES
AND COMMITMENTS
|
Litigation
In the
ordinary course of conducting business, we are involved in judicial and
administrative proceedings involving federal, state or local governmental
authorities. Actions may also be brought by individuals or groups in connection
with permitting of planned facilities, alleged violations of existing permits,
or alleged damages suffered from exposure to hazardous substances purportedly
released from our operated sites, as well as other litigation. We maintain
insurance intended to cover property and damage claims asserted as a result of
our operations. Periodically, management reviews and may establish reserves for
legal and administrative matters, or fees expected to be incurred in connection
therewith. As of December 31, 2009, we did not have any ongoing, pending or
threatened legal action that management believes would have a material adverse
effect on our financial position, results of operations or cash
flows.
49
Operating Leases
Lease
agreements primarily cover rail cars and office space. Future minimum lease
payments on non-cancellable operating leases as of December 31, 2009 were as
follows:
|
$s
in thousands
|
|||||
|
2010
|
$ | 465 | |||
|
2011
|
211 | ||||
|
2012
|
110 | ||||
|
2013
|
81 | ||||
|
2014
|
78 | ||||
|
Thereafter
|
45 | ||||
| $ | 990 | ||||
Rental
expense from continuing operations amounted to $3.3 million, $3.5 million and
$4.4 million during 2009, 2008 and 2007, respectively.
|
NOTE
13.
|
EQUITY
|
Stock
Options
We have
three stock option plans, the 1992 Stock Option Plan for Employees (“the 1992
Employee Plan”), the 1992 Director Stock Option Plan (“the 1992 Director Plan”)
and the 2008 Stock Option Incentive Plan (“the 2008 Stock Option Plan”) which
was approved by our stockholders in May 2008. In March 2005, the Board of
Directors cancelled the 1992 Director Plan except for the options then
outstanding. These plans were developed to provide additional incentives through
equity ownership in US Ecology and, as a result, encourage employees to
contribute to our success. The following table summarizes our stock option plan
activity for each of the years ended December 31:
|
$s
in thousands, except per share amounts
|
2009
|
2008
|
2007
|
|||||||||||
|
Outstanding
at beginning of period
|
206,002 | 266,376 | 291,900 | |||||||||||
|
Granted
|
147,000 | 3,400 | 52,976 | |||||||||||
|
Exercised
|
- | (53,774 | ) | (51,000 | ) | |||||||||
|
Cancelled
or expired
|
(26,642 | ) | (10,000 | ) | (27,500 | ) | ||||||||
|
Outstanding
at end of period
|
326,360 | 206,002 | 266,376 | |||||||||||
|
Weighted
average exercise price of options:
|
||||||||||||||
|
Beginning
of period
|
$ | 17.19 | $ | 17.10 | $ | 13.43 | ||||||||
|
Granted
|
$ | 19.85 | $ | 28.52 | $ | 22.67 | ||||||||
|
Exercised
|
$ | - | $ | 20.37 | $ | 6.44 | ||||||||
|
Cancelled
or expired
|
$ | 14.77 | $ | 1.47 | $ | 8.63 | ||||||||
|
Outstanding
at end of period
|
$ | 18.59 | $ | 17.19 | $ | 17.10 | ||||||||
|
Exercisable
at end of period
|
167,577 | 125,957 | 124,077 | |||||||||||
|
Available
for future grant
|
1,366,242 | 1,496,600 | - | |||||||||||
|
Intrinsic
value of options exercised
|
$ | - | $ | 546 | $ | 583 | ||||||||
|
Aggregate
intrinsic value of options outstanding
|
$ | 592 | $ | 922 | $ | 1,700 | ||||||||
|
Aggregate
intrinsic value of options exercisable
|
$ | 575 | $ | 922 | $ | 1,502 | ||||||||
50
|
Outstanding
options
|
Exercisable
options
|
|||||||||||||||||
|
Weighted
|
||||||||||||||||||
|
average
|
||||||||||||||||||
|
remaining
|
Weighted
|
Weighted
|
||||||||||||||||
|
contractual
|
average
|
average
|
||||||||||||||||
|
Number
of
|
life
|
exercise
|
Number
of
|
exercise
|
||||||||||||||
|
Range
of exercise prices
|
Shares
|
(in
years)
|
price
|
Shares
|
price
|
|||||||||||||
| $2.42 | 10,000 | 1.4 | $ | 2.42 | 10,000 | $ | 2.42 | |||||||||||
| $3.75 - 3.92 | 22,200 | 1.1 | $ | 3.81 | 22,200 | $ | 3.81 | |||||||||||
| $9.20 - 12.15 | 20,000 | 4.6 | $ | 10.31 | 20,000 | $ | 10.31 | |||||||||||
| $16.40 | 27,000 | 9.4 | $ | 16.40 | - | $ | - | |||||||||||
| $20.27 - 21.74 | 212,760 | 8.0 | $ | 21.08 | 91,427 | $ | 21.69 | |||||||||||
| $23.48 | 31,000 | 7.9 | $ | 23.48 | 20,550 | $ | 23.48 | |||||||||||
| $28.52 | 3,400 | 8.4 | $ | 28.52 | 3,400 | $ | 28.52 | |||||||||||
All
share-based compensation is measured at the grant date based on the fair value
of the award, and is recognized as an expense in earnings over the requisite
service period.
During
2009, we granted 120,000 incentive and non-qualified stock options to purchase
US Ecology common stock to members of our management team. These
options expire in the year 2019 and vest over three years. During
2009, we granted 27,000 non-qualified stock options to purchase US Ecology
common stock to non-employee directors. These options expire in
the year 2019 and vest over one year contingent on the non-employee director
attending a minimum of seventy-five percent of regularly scheduled board
meetings during the year. During 2008, we granted 3,400 non-qualified stock
options to a non-employee director. These options expire in
the year 2018 and vest over one year contingent on the non-employee director
attending a minimum of seventy-five percent of regularly scheduled board
meetings during the year. In 2007, we granted 52,976 incentive and non-qualified
stock options to purchase US Ecology common stock to members of our management
team. These options expire in the year 2017 and vest over three years.
Compensation expense related to stock options for the years ended December 31,
2009, 2008 and 2007 were as follows:
|
2009
|
2008
|
2007
|
||||||||||||
|
|
||||||||||||||
|
Stock-based
compensation recorded in selling, general and administrative
expense
|
$ | 572,502 | $ | 474,435 | $ | 370,335 | ||||||||
|
Stock-based
compensation recorded in other direct costs
|
$ | 2,619 | 5,087 | 5,087 | ||||||||||
|
Total
stock-based compensation expense
|
$ | 575,121 | $ | 479,522 | $ | 375,422 | ||||||||
The fair
value of each option grant is estimated using the Black-Scholes option-pricing
model with the following weighted-average assumptions:
|
2009
|
2008
|
2007
|
|||||||
|
Expected
life
|
3.3
years
|
3.2
years
|
3.2
years
|
||||||
|
Expected
volatility
|
47% | 40% | 40% | ||||||
|
Risk-free
interest rate
|
1.1% | 2.7% | 3.5% | ||||||
|
Expected
dividend yield
|
2.8% | 2.6% | 3.0% | ||||||
|
Weighted-average
fair value of options granted during the period
|
$5.68 | $7.29 | $5.81 |
Restricted
Stock Plans
We have
two restricted stock plans: the Amended and Restated 2005 Non-Employee Director
Compensation Plan (the “Director Plan”) and the 2006 Restricted Stock Plan (the
“Employee Plan”). The Director Plan establishes the cash compensation that each
non-employee board member receives. In addition, the Director Plan provides that
each non-employee director receive an annual award of the number of shares of
restricted stock with a value equal to $25,000 on the date of grant with a
one-year vesting period. In April 2008, the Director Plan was amended to allow
each non-employee director to elect to receive their annual equity based award
in either shares of restricted stock under the Director Plan or an equivalent
dollar value of stock options under the 2008 Stock Option Plan with a one-year
vesting period. Vesting is also contingent on the non-employee
director attending a minimum of seventy-five percent of regularly scheduled
board meetings during the year. 200,000 shares of common stock have been
authorized for issuance under the Director Plan. As of December 31, 2009, 32,100
shares of restricted stock were issued to the non-employee directors and 167,900
shares of stock remained available for issuance under the Director
Plan.
51
The
Employee Plan provides that employees are eligible for restricted stock grants
at the discretion of the Board of Directors. 200,000 shares of common stock have
been authorized for issuance under the Employee Plan. During 2009 and 2008, no
shares of restricted stock were granted to employees. In 2007, we
granted 14,500 shares of restricted stock, net of forfeitures. Of the
14,500 shares of restricted stock granted in 2007, 200 shares vest one-third
annually over three years, 7,150 shares vest over one year and 7,150 shares were
fully vested on the grant date. As of December 31, 2009, 180,399
shares of stock remained available for future issuance under the
plan.
The table
below summarizes restricted stock activity and related expense for the years
ended December 31, 2009, 2008 and 2007.
|
2009
|
2008
|
2007
|
||||||||||||||||||||||
|
Shares
|
Weighted
Average
Grant
Date
Fair Value
|
Shares
|
Weighted
Average
Grant Date Fair Value
|
Shares
|
Weighted
Average
Grant
Date
Fair Value
|
|||||||||||||||||||
|
Outstanding
at beginning of period
|
6,448 | $ | 26.34 | 17,408 | $ | 22.20 | 12,300 | $ | 23.75 | |||||||||||||||
|
Granted
|
1,500 | 16.40 | 4,500 | 28.52 | 21,500 | 22.72 | ||||||||||||||||||
|
Vested
|
(6,083 | ) | 26.67 | (15,460 | ) | 22.31 | (15,892 | ) | 23.95 | |||||||||||||||
|
Cancelled
or expired
|
(199 | ) | 21.27 | - | - | (500 | ) | 21.53 | ||||||||||||||||
|
Outstanding
at end of period
|
1,666 | $ | 16.79 | 6,448 | $ | 26.34 | 17,408 | $ | 22.20 | |||||||||||||||
|
Available
for future grant
|
348,299 | 349,600 | 354,100 | |||||||||||||||||||||
|
Compensation
expense recognized in:
|
||||||||||||||||||||||||
|
Other
direct costs
|
$ | 855 | $ | 7,892 | $ | 9,066 | ||||||||||||||||||
|
Selling,
general & administrative
|
$ | 78,371 | $ | 332,614 | $ | 358,577 | ||||||||||||||||||
|
Unearned
compensation
|
$ | 10,385 | $ | 68,111 | $ | 279,122 | ||||||||||||||||||
Treasury
Stock
On
October 28, 2008, our Board of Directors authorized a program to repurchase up
to 600,000 shares of the Company’s outstanding common stock through December 31,
2008. On December 11, 2008, the program was extended from December
31, 2008 to February 28, 2009. On February 23, 2009, the program was extended
from February 28, 2009 to December 31, 2009. In 2008, we repurchased 155,175
shares at an average cost of $16.68 per share. In 2009, we
repurchased 140 shares at an average cost of $16.02 per share. The program
expired on December 31, 2009.
52
|
NOTE
14.
|
CALCULATION
OF EARNINGS PER SHARE
|
|
$s
and shares in thousands, except per share amounts
|
2009
|
2008
|
2007
|
|||||||||||||||||||||
|
Basic
|
Diluted
|
Basic
|
Diluted
|
Basic
|
Diluted
|
|||||||||||||||||||
|
Net
income
|
$ | 13,970 | $ | 13,970 | $ | 21,498 | $ | 21,498 | $ | 19,396 | $ | 19,396 | ||||||||||||
|
Weighted
average common shares outstanding
|
18,146 | 18,146 | 18,236 | 18,236 | 18,217 | 18,217 | ||||||||||||||||||
|
Dilutive
effect of stock options and restricted stock
|
27 | 54 | 40 | |||||||||||||||||||||
|
Weighted
average shares outstanding
|
18,173 | 18,290 | 18,257 | |||||||||||||||||||||
|
Earnings
per share
|
$ | 0.77 | $ | 0.77 | $ | 1.18 | $ | 1.18 | $ | 1.06 | $ | 1.06 | ||||||||||||
|
Anti-dilutive
shares excluded from calculation
|
268 | 83 | 166 | |||||||||||||||||||||
|
NOTE
15.
|
OPERATING
SEGMENTS
|
We
operate with two segments, Operating Disposal Facilities, and Non-Operating
Disposal Facilities. These segments reflect our internal reporting structure and
nature of services offered. The Operating Disposal Facility segment represents
disposal facilities accepting hazardous and radioactive waste. The Non-Operating
Disposal Facility segment represents facilities which are not accepting
hazardous and/or radioactive waste or formerly proposed new
facilities.
Income
taxes are assigned to Corporate, but all other items are included in the segment
where they originated. Inter-company transactions have been eliminated from the
segment information and are not significant between segments.
Summarized
financial information concerning our reportable segments is shown in the
following table:
|
$s
in thousands
|
Operating
Disposal
Facilities
|
Non-
Operating
Disposal
Facilities
|
Corporate
|
Total
|
|||||||||||||
|
2009
|
|||||||||||||||||
|
Revenue
- Treatment and disposal
|
$ | 79,307 | $ | 22 | $ | - | $ | 79,329 | |||||||||
|
Revenue
- Transportation services
|
53,190 | - | - | 53,190 | |||||||||||||
|
Total
revenue
|
132,497 | 22 | - | 132,519 | |||||||||||||
|
Transportation
costs
|
52,708 | - | - | 52,708 | |||||||||||||
|
Other
direct operating costs
|
43,073 | 462 | - | 43,535 | |||||||||||||
|
Gross
profit (loss)
|
36,716 | (440 | ) | - | 36,276 | ||||||||||||
|
Selling,
general & administration
|
4,790 | - | 9,045 | 13,835 | |||||||||||||
|
Insurance
proceeds
|
(661 | ) | - | - | (661 | ) | |||||||||||
|
Operating
income (loss)
|
32,587 | (440 | ) | (9,045 | ) | 23,102 | |||||||||||
|
Interest
income (expense), net
|
(1 | ) | - | 115 | 114 | ||||||||||||
|
Other
income
|
187 | 80 | - | 267 | |||||||||||||
|
Income
(loss) before tax
|
32,773 | (360 | ) | (8,930 | ) | 23,483 | |||||||||||
|
Tax
expense
|
- | - | 9,513 | 9,513 | |||||||||||||
|
Net
income (loss)
|
$ | 32,773 | $ | (360 | ) | $ | (18,443 | ) | $ | 13,970 | |||||||
|
Depreciation,
amortization & accretion
|
$ | 8,782 | $ | 219 | $ | 45 | $ | 9,046 | |||||||||
|
Capital
expenditures
|
$ | 9,371 | $ | - | $ | 34 | $ | 9,405 | |||||||||
|
Total
assets
|
$ | 84,729 | $ | 39 | $ | 38,894 | $ | 123,662 | |||||||||
53
|
$s
in thousands
|
Operating
Disposal
Facilities
|
Non-
Operating
Disposal
Facilities
|
Corporate
|
Total
|
|||||||||||||
|
2008
|
|||||||||||||||||
|
Revenue
- Treatment and disposal
|
$ | 92,996 | $ | 23 | $ | - | $ | 93,019 | |||||||||
|
Revenue
- Transportation services
|
82,808 | - | - | 82,808 | |||||||||||||
|
Total
revenue
|
175,804 | 23 | - | 175,827 | |||||||||||||
|
Transportation
costs
|
82,064 | - | - | 82,064 | |||||||||||||
|
Other
direct operating costs
|
44,025 | 265 | 32 | 44,322 | |||||||||||||
|
Gross
profit (loss)
|
49,715 | (242 | ) | (32 | ) | 49,441 | |||||||||||
|
Selling,
general & administration
|
5,121 | - | 9,799 | 14,920 | |||||||||||||
|
Insurance
proceeds
|
- | - | - | - | |||||||||||||
|
Operating
income (loss)
|
44,594 | (242 | ) | (9,831 | ) | 34,521 | |||||||||||
|
Interest
income (expense), net
|
(3 | ) | - | 409 | 406 | ||||||||||||
|
Other
income
|
305 | - | 1 | 306 | |||||||||||||
|
Income
(loss) before tax
|
44,896 | (242 | ) | (9,421 | ) | 35,233 | |||||||||||
|
Tax
expense
|
- | - | 13,735 | 13,735 | |||||||||||||
|
Net
income (loss)
|
$ | 44,896 | $ | (242 | ) | $ | (23,156 | ) | $ | 21,498 | |||||||
|
Depreciation,
amortization & accretion
|
$ | 10,308 | $ | 285 | $ | 48 | $ | 10,641 | |||||||||
|
Capital
expenditures
|
$ | 13,558 | $ | 9 | $ | 50 | $ | 13,617 | |||||||||
|
Total
assets
|
$ | 99,906 | $ | 59 | $ | 27,480 | $ | 127,445 | |||||||||
|
$s
in thousands
|
Operating
Disposal
Facilities
|
Non-
Operating
Disposal
Facilities
|
Corporate
|
Total
|
|||||||||||||
|
2007
|
|||||||||||||||||
|
Revenue
- Treatment and disposal
|
$ | 85,827 | $ | 21 | $ | - | $ | 85,848 | |||||||||
|
Revenue
- Transportation services
|
79,672 | - | - | 79,672 | |||||||||||||
|
Total
revenue
|
165,499 | 21 | - | 165,520 | |||||||||||||
|
Transportation
costs
|
79,326 | - | - | 79,326 | |||||||||||||
|
Other
direct operating costs
|
40,156 | 525 | - | 40,681 | |||||||||||||
|
Gross
profit (loss)
|
46,017 | (504 | ) | - | 45,513 | ||||||||||||
|
Selling,
general
|
|||||||||||||||||
|
&
administration
|
5,255 | - | 9,391 | 14,646 | |||||||||||||
|
Insurance
proceeds
|
- | - | - | - | |||||||||||||
|
Operating
income (loss)
|
40,762 | (504 | ) | (9,391 | ) | 30,867 | |||||||||||
|
Interest
income, net
|
16 | - | 713 | 729 | |||||||||||||
|
Other
income
|
56 | 66 | - | 122 | |||||||||||||
|
Income
(loss) before tax
|
40,834 | (438 | ) | (8,678 | ) | 31,718 | |||||||||||
|
Tax
expense
|
- | - | 12,322 | 12,322 | |||||||||||||
|
Net
income (loss)
|
$ | 40,834 | $ | (438 | ) | $ | (21,000 | ) | $ | 19,396 | |||||||
|
Depreciation,
amortization & accretion
|
$ | 9,654 | $ | 317 | $ | 38 | $ | 10,009 | |||||||||
|
Capital
expenditures
|
$ | 15,386 | $ | 4 | $ | 40 | $ | 15,430 | |||||||||
|
Total
assets
|
$ | 94,325 | $ | 40 | $ | 22,711 | $ | 117,076 | |||||||||
|
NOTE
16.
|
HONEYWELL
INTERNATIONAL CONTRACT
|
In June
2005, we entered into a contract with Honeywell International, Inc. to
transport, treat, and dispose of approximately 1.3 million tons of chromite ore
processing residue. The project was completed in October
2009. Honeywell International, Inc., accounted for 38%, 43% and 41%
of revenue for the years ending December 31, 2009, 2008 and 2007,
respectively.
54
|
NOTE
17.
|
QUARTERLY
FINANCIAL DATA (unaudited)
|
The
unaudited consolidated quarterly results of operations for 2009 and 2008
were:
|
Three-Months
Ended
|
|||||||||||||||||||||
|
Mar.
31,
|
June
30,
|
Sept.
30,
|
Dec.
31,
|
Year
|
|||||||||||||||||
|
$s
and shares in thousands, except per share data
|
|||||||||||||||||||||
|
2009
|
|||||||||||||||||||||
|
Revenue
|
$ | 34,965 | $ | 36,377 | $ | 37,529 | $ | 23,648 | $ | 132,519 | |||||||||||
|
Gross
profit
|
9,546 | 9,112 | 9,983 | 7,635 | 36,276 | ||||||||||||||||
|
Operating
income
|
5,973 | 5,716 | 6,777 | 4,636 | 23,102 | ||||||||||||||||
|
Net
income
|
3,644 | 3,518 | 4,164 | 2,644 | 13,970 | ||||||||||||||||
|
Earnings per share—diluted
(1)
|
$ | 0.20 | $ | 0.19 | $ | 0.23 | $ | 0.15 | $ | 0.77 | |||||||||||
|
Weighted
average common shares outstanding used in the diluted earnings per
share calculation
|
18,176 | 18,175 | 18,170 | 18,172 | 18,173 | ||||||||||||||||
|
2008
|
|||||||||||||||||||||
|
Revenue
|
$ | 46,219 | $ | 44,516 | $ | 41,051 | $ | 44,041 | $ | 175,827 | |||||||||||
|
Gross
profit
|
13,444 | 13,578 | 10,021 | 12,398 | 49,441 | ||||||||||||||||
|
Operating
income
|
9,525 | 9,846 | 6,812 | 8,338 | 34,521 | ||||||||||||||||
|
Net
income
|
5,868 | 6,110 | 4,271 | 5,249 | 21,498 | ||||||||||||||||
|
Earnings per share—diluted
(1)
|
$ | 0.32 | $ | 0.33 | $ | 0.23 | $ | 0.29 | $ | 1.18 | |||||||||||
|
Weighted
average common shares outstanding used in the diluted earnings per
share calculation
|
18,277 | 18,295 | 18,330 | 18,258 | 18,290 | ||||||||||||||||
|
(1)
|
Diluted
earnings per common share for each quarter presented above are based on
the respective weighted average number of common shares for the respective
quarter. The dilutive potential common shares outstanding for each period
and the sum of the quarters may not necessarily be equal to the full year
diluted earnings per common share
amount.
|
|
NOTE
18.
|
SUBSEQUENT
EVENTS
|
On
January 4, 2010 the Company declared a dividend of $0.18 per common share for
stockholders of record on January 15, 2010. The dividend was paid out
of cash on hand on January 22, 2010 in an aggregate amount of $3.3
million.
55
Item
9. Changes in and Disagreements with Accountants on Accounting and Financial
Disclosure
None
Item
9A. Controls and Procedures
An
evaluation was performed under the supervision and with the participation of the
Company’s management, including its Chief Executive Officer, or CEO, and Chief
Financial Officer, or CFO, of the effectiveness of the Company’s disclosure
controls and procedures, as such term is defined under Rule 13a-15e under the
Securities Exchange Act of 1934, as amended (the “Exchange Act”) as of December
31, 2009. Based on that evaluation, the Company’s management, including the CEO
and CFO, concluded that the Company’s disclosure controls and procedures are
effective to provide reasonable assurance that information required to be
disclosed by the Company in reports that it files or submits under the Exchange
Act is recorded, processed, summarized and reported as specified in Securities
and Exchange Commission rules and forms and that such information is accumulated
and communicated to the Company’s management, including the CEO and CFO, or
persons performing similar functions, as appropriate to allow timely decisions
regarding required disclosure.
There
were no changes in the Company’s internal control over financial reporting
identified in connection with the evaluation of such controls that occurred
during the Company’s most recent fiscal quarter that has materially affected, or
is reasonably likely to materially affect, the Company’s internal control over
financial reporting.
Management’s Annual Report on
Internal Controls over Financial Reporting.
Management
is responsible for and maintains a system of internal controls over financial
reporting that is designed to provide reasonable assurance that its records and
filings accurately reflect the transactions engaged in Section 404 of
Sarbanes-Oxley Act of 2002 and related rules issued by the US SEC requiring
management to issue a report on its internal controls over financial
reporting.
There are
inherent limitations in the effectiveness of any internal control, including the
possibility of human error and the circumvention or overriding of controls.
Accordingly, even effective internal control can provide only reasonable
assurance with respect to financial statement preparation. Further, because of
changes in conditions, the effectiveness of internal controls may vary over
time.
Management
has conducted an assessment of its internal controls over financial reporting
utilizing the criteria set forth by the Committee of Sponsoring Organizations
(“COSO”) of the Treadway Commission in Internal Control – Integrated Framework
and concluded that, as of December 31, 2009, the internal controls over
financial reporting were effective to provide reasonable assurance regarding the
reliability of financial reporting.
Our
independent registered public accounting firm, Deloitte and Touche LLP, has
audited the effectiveness of internal control over financial reporting as of
December 31, 2009, as stated in their report, which is included in Part II, Item
8 of this Annual Report on Form 10-K.
Item
9B. Other Information
None
56
PART
III
Item
10. Directors,
Executive Officers and Corporate Governance.
The
information regarding directors and nominees for directors of the Company,
including identification of the members of the audit committee and audit
committee financial expert, is presented under the headings “Corporate
Governance—Committees of the Board of Directors,” and “Election of
Directors—Nominees For Directors” in the Company’s definitive proxy statement
for use in connection with the 2010 Annual Meeting of Stockholders (the “Proxy
Statement”) to be filed within 120 days after the end of the Company’s fiscal
year ended December 31, 2009. The information contained under these
headings is incorporated herein by reference. Information regarding the
executive officers of the Company is included in this Annual Report on
Form 10-K under Item 1 of Part I as permitted by Instruction 3 to Item
401(b) of Regulation S-K.
We have
adopted a code of conduct that applies to our Chief Executive Officer and Chief
Financial Officer. This code of conduct is available on our Web site at www.usecology.com. If we make any amendments
to this code other than technical, administrative or other non-substantive
amendments, or grant any waivers, including implicit waivers, from a provision
of this code to our Chief Executive Officer or Chief Financial Officer, we will
disclose the nature of the amendment or waiver, its effective date and to whom
it applies in a report filed with the SEC.
Item
11. Executive
Compensation.
Information
concerning executive and director compensation is presented under the heading
“Compensation Discussion and Analysis” in the Proxy Statement. The information
contained under these headings is incorporated herein by reference.
Item
12. Security
Ownership of Certain Beneficial Owners and Management and Related Stockholder
Matters.
Information
with respect to security ownership of certain beneficial owners and management
is set forth under the heading “Security Ownership of Certain Beneficial Owners
and Directors and Officers” in the Proxy Statement. The information contained
under these headings is incorporated herein by reference.
The
following table provides information as of December 31, 2009 about the
common stock that may be issued under all of our existing equity compensation
plans, including the 1992 Employee Stock Option Plan, 1992 Director Stock Option
Plan, 2005 Non-Employee Director Compensation Plan, the 2006 Restricted Stock
Plan and the 2008 Stock Option Incentive Plan. All of these plans have been
approved by our stockholders.
|
Number
of securities
to
be issued upon
exercise
of
outstanding
options,
warrants
and rights
(a)
(1)
|
Weighted-average
exercise
price of
outstanding
options,
warrants
and rights
(b)
(2)
|
Number
of securities
remaining
available for
future
issuance under
equity
compensation
plans
(excluding
securities
reflected in
column
(a))
(c)
|
|||||||||||
|
|
|||||||||||||
|
Equity
stock option compensation plans approved by security
holders
|
328,026 | $ | 18.59 | 1,714,541 | |||||||||
|
|
|||||||||||||
|
Equity
compensation plans not approved by security
holders
|
- | - | - | ||||||||||
|
Total
|
328,026 | $ | 18.59 | 1,714,541 | |||||||||
|
(1)
|
Includes
1,666 shares of unvested restricted stock awards outstanding under the
2005 Non-Employee Director Compensation Plan and 2006 Restricted Stock
Plan.
|
|
(2)
|
The
weighted-average exercise price does not take into account the shares
issuable upon vesting of outstanding restricted stock awards, which have
no exercise price.
|
57
Item 13. Certain Relationships and Related Transactions and Director Independence.
Information
concerning related transactions is presented under the heading “Certain
Relationships and Related Transactions” in the Proxy Statement. The information
contained under this heading is incorporated herein by reference.
Item
14. Principal Accountant Fees and Services.
Information
concerning principal accountant fees and services is presented under the heading
“Ratification of Appointment of Independent Registered Public Accountant” in the
Proxy Statement. The information contained under this heading is incorporated
herein by reference.
Item
15. Exhibits and Financial Statement Schedules.
|
(a)
|
The
following documents are filed as part of this
report:
|
|
1)
|
Consolidated
Financial Statements: See Index to Consolidated Financial Statements at
Item 8 on page 34 of this
report.
|
|
2)
|
Financial
Statement Schedules. Schedules have been omitted because they are not
required or because the information is included in the financial
statements at Item 8 on page
34.
|
|
3)
|
Exhibits
are incorporated herein by reference or are filed with this report as set
forth in the Index to Exhibits on page 60
hereof.
|
58
Signatures
Pursuant
to the requirements of Section 13 or 15(d) of the Securities Exchange
Act of 1934, the registrant has duly caused this report to be signed on its
behalf by the undersigned, thereunto duly authorized.
|
US
ECOLOGY, INC.
|
||
|
By:
/s/ Jeffrey R.
Feeler
|
||
|
Jeffrey
R. Feeler
|
||
|
Vice
President and Chief Financial Officer
|
||
|
Date:
March 4, 2010
|
Pursuant
to the requirements of the Securities Exchange Act of 1934, this report has been
signed below by the following persons on behalf of the registrant and in the
capacities indicated as of March 4, 2010.
|
/s/
James R.
Baumgardner
|
/s/
Jeffrey R.
Feeler
|
|
|
James
R. Baumgardner
President
and Chief Executive Officer
(Principal
Executive Officer)
|
Jeffrey
R. Feeler
Vice
President and Chief Financial Officer
(Principal
Financial Officer and Principal
Accounting
Officer)
|
|
|
/s/
Simon G.
Bell
|
/s/
John M.
Cooper
|
|
|
Simon
G. Bell.
Vice
President of Operations
|
John
M. Cooper
Vice
President and Chief Information Officer
|
|
|
/s/
Eric L.
Gerratt
|
/s/
Steven D.
Welling
|
|
|
Eric
L. Gerratt
Vice
President and Controller
|
Steven
D. Welling.
Senior
Vice President Sales and Marketing
|
|
| /s/ Victor J. Barnhart |
/s/
Joe F.
Colvin
|
|
|
Victor
J. Barnhart (Director)
|
Joe
F. Colvin (Director)
|
|
|
/s/
Roy C.
Eliff
|
/s/
Edward F.
Heil
|
|
|
Roy
C. Eliff (Director)
|
Edward
F. Heil (Director)
|
|
|
/s/
Jeffrey S.
Merrifield
|
/s/
John W.
Poling
|
|
|
Jeffrey
S. Merrifield (Director)
|
John W. Poling
(Director)
|
|
|
/s/
Stephen A.
Romano
|
||
|
Stephen
A. Romano (Director)
|
59
|
Exhibit
No.
|
Description
|
Incorporated
by Reference from Registrant's
|
||
|
3.1
|
Restated
Certificate of Incorporation
|
|||
|
3.3
|
Amended
and Restated Bylaws
|
Form
8-K filed 12-11-2007
|
||
|
10.1
|
Sublease
dated July 27, 2005, between the State of Washington and US Ecology
Washington, Inc.
|
Form
8-K filed 7-27-05
|
||
|
10.2
|
Lease
Agreement as amended between American Ecology Corporation and the State of
Nevada
|
2nd
Qtr 2007 Form 10-Q filed 8-7-2007
|
||
|
10.50
|
Revolving
Credit Agreement between American Ecology Corporation and Wells Fargo
Bank, National Association
|
Form
8-K filed 7-1-08
|
||
|
10.51
|
First
Amendment To The Revolving Credit Agreement between American Ecology
Corporation and Wells Fargo Bank, National Association
|
2nd
Qtr Form 10-Q filed 7-30-2009
|
||
|
10.53
|
*Amended
and Restated American Ecology Corporation 1992 Employee Stock Option
Plan
|
Proxy
Statement dated 4-16-03
|
||
|
10.54
|
*Management
Incentive Plan Effective January 1, 2007
|
1st
Qtr Form 10-Q filed 4-30-2007
|
||
|
10.55
|
*Management
Incentive Plan Effective January 1, 2008
|
2007
Form 10-K
|
||
|
10.56
|
*Management
Incentive Plan Effective January 1, 2009
|
1st
Qtr Form 10-Q filed 4-30-2009
|
||
|
10.60
|
*Form
of Indemnification Agreement between American Ecology Corporation and each
of the Company’s Directors and Officers
|
Form
8-K filed 5-26-05
|
||
|
10.62
|
*2006
Restricted Stock Plan
|
Proxy
Statement dated 3-31-06
|
||
|
10.65
|
*2008
Stock Option Incentive Plan
|
Proxy
Statement dated 4-10-2008
|
||
|
10.70
|
Form
of Royalty Agreement for El Centro Landfill Dated February 13,
2003
|
Form
8-K filed 2-13-03
|
||
|
10.71
|
*Executive
Employment Agreement with James R. Baumgardner **
|
2008
Form 10-K
|
||
|
10.72
|
*Change
of Control Agreement with Simon G. Bell
|
2008
Form 10-K
|
||
|
10.73
|
*Change
of Control Agreement with John M. Cooper
|
2008
Form 10-K
|
||
|
10.74
|
*Change
of Control Agreement with Jeffrey R. Feeler
|
2008
Form 10-K
|
||
|
10.75
|
*Change
of Control Agreement with Eric L. Gerratt
|
2008
Form 10-K
|
||
|
10.76
|
*Change
of Control Agreement with Steven D. Welling
|
2008
Form 10-K
|
||
|
10.77
|
*Amendment
to Change of Control Agreement with Simon G. Bell
|
2008
Form 10-K
|
||
|
10.78
|
*Amendment
to Change of Control Agreement with John M. Cooper
|
2008
Form 10-K
|
||
|
10.79
|
*Amendment
to Change of Control Agreement with Jeffrey R. Feeler
|
2008
Form 10-K
|
||
|
10.80
|
*Amendment
to Change of Control Agreement with Eric L. Gerratt
|
2008
Form 10-K
|
||
|
10.81
|
*Amendment
to Change of Control with Steven D. Welling
|
2008
Form 10-K
|
||
|
10.82
|
Amended
and Restated 2005 Non-Employee Director Compensation Plan
|
2008
Form 10-K
|
||
|
14.1
|
Code
of Ethics for Chief Executive, President and Chief Operating Officer,
Chief Financial Officer and Other Executive Officers
|
|||
|
14.2
|
Code
of Ethics for Directors
|
2007
Form 10-K
|
||
|
21
|
List
of Subsidiaries
|
|||
|
23.1
|
Consent
of Moss Adams LLP
|
|||
|
23.2
|
Consent
of Deloitte and Touche LLP
|
|||
|
31.1
|
Certifications
of December 31, 2009 Form 10-K by Chief Executive Officer dated March 4,
2010
|
|||
|
31.2
|
Certifications
of December 31, 2009 Form 10-K by Chief Financial Officer dated March 4,
2010
|
|||
|
32.1
|
Certifications
of December 31, 2009 Form 10-K by Chief Executive Officer dated March 4,
2010
|
|||
|
32.2
|
Certifications
of December 31, 2009 Form 10-K by Chief Financial Officer dated March 4,
2010
|
|||
|
*
Identifies management contracts or compensatory plans or arrangements
required to be filed as an exhibit hereto.
|
||||
|
**
Certain portions of the exhibit have been omitted pursuant to a
confidential treatment request submitted to the
SEC
|
||||
60