Attached files
| file | filename |
|---|---|
| 8-K - 8-K - Blackstone Group Inc | d567442d8k.htm |
Exhibit 99.1

Blackstone Reports First Quarter 2018 Results
New York, April 19, 2018: Blackstone (NYSE:BX) today reported its first quarter 2018 results.
Stephen A. Schwarzman, Chairman and Chief Executive Officer, said, “Amid declining global markets and a sharp increase in volatility, Blackstone continued to protect and grow our investors’ capital in the first quarter, delivering strong outperformance across strategies. Investors in the institutional, retail and insurer channels are allocating more capital to our firm, resulting in more than $18 billion of inflows during the quarter and driving our total assets under management to a new record of $450 billion, up 22% year over year.”
Mr. Schwarzman also said, “Our financial strength continues to build, and our A+ rated balance sheet gives us the flexibility and firepower to enhance our capital return to unitholders. Today I am pleased to announce we have increased our unit repurchase authorization to $1 billion. We also intend to make a special distribution of $0.30 per unit in 2018 representing a portion of the proceeds received in connection with the conclusion of our direct lending sub-advisory relationship.”
Blackstone issued a full detailed presentation of its first quarter 2018 results, which can be viewed at www.blackstone.com.
Distribution
Blackstone has declared a quarterly distribution of $0.35 per common unit to record holders of common units at the close of business on April 30, 2018. This distribution will be paid on May 7, 2018.
Quarterly Investor Call Details
Blackstone will host a conference call on April 19, 2018 at 11:00 a.m. ET to discuss first quarter 2018 results. The conference call can be accessed via the Investors section of Blackstone’s website at www.blackstone.com or by dialing +1 (877) 391-6747 (U.S. domestic) or +1 (617) 597-9291 (international), pass code 149 943 55#. For those unable to listen to the live broadcast, a replay will be available on www.blackstone.com or by dialing +1 (888) 286-8010 (U.S. domestic) or +1 (617) 801-6888 (international), pass code 994 507 16#.
The Blackstone Group L.P.
345 Park Avenue
New York, New York 10154
T 212 583 5000
About Blackstone
Blackstone is one of the world’s leading investment firms. We seek to create positive economic impact and long-term value for our investors, the companies we invest in, and the communities in which we work. We do this by using extraordinary people and flexible capital to help companies solve problems. Our asset management businesses, with $450 billion in assets under management, include investment vehicles focused on private equity, real estate, public debt and equity, non-investment grade credit, real assets and secondary funds, all on a global basis. Further information is available at www.blackstone.com. Follow Blackstone on Twitter @Blackstone.
Forward-Looking Statements
This release may contain forward-looking statements within the meaning of Section 27A of the Securities Act of 1933 and Section 21E of the Securities Exchange Act of 1934 which reflect Blackstone’s current views with respect to, among other things, Blackstone’s operations, financial performance and unit repurchase and distribution activities. You can identify these forward-looking statements by the use of words such as “outlook,” “indicator,” “believes,” “expects,” “potential,” “continues,” “may,” “will,” “should,” “seeks,” “approximately,” “predicts,” “intends,” “plans,” “estimates,” “anticipates” or the negative version of these words or other comparable words. Such forward-looking statements are subject to various risks and uncertainties. Accordingly, there are or will be important factors that could cause actual outcomes or results to differ materially from those indicated in these statements. Blackstone believes these factors include but are not limited to those described under the section entitled “Risk Factors” in its Annual Report on Form 10-K for the fiscal year ended December 31, 2017, as such factors may be updated from time to time in its periodic filings with the Securities and Exchange Commission, which are accessible on the SEC’s website at www.sec.gov. These factors should not be construed as exhaustive and should be read in conjunction with the other cautionary statements that are included in this release and in the filings. Blackstone undertakes no obligation to publicly update or review any forward-looking statement, whether as a result of new information, future developments or otherwise.
This release does not constitute an offer of any Blackstone Fund.
Investor and Media Relations Contacts
| Joan Solotar Blackstone |
Weston Tucker Blackstone Tel: +1 (212) 583-5231 tucker@blackstone.com |
Christine Anderson Blackstone Tel: +1 (212) 583-5182 Christine.Anderson@blackstone.com |
2
 April 19, 2018 Blackstone’s First Quarter 2018 Earnings |
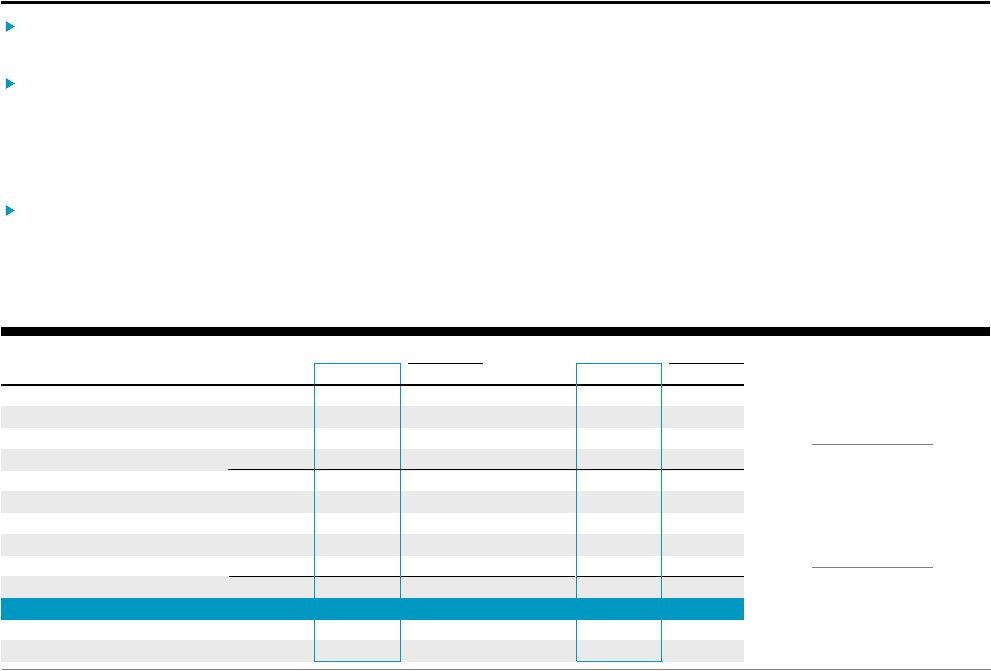
 Blackstone 1 Blackstone’s First Quarter 2018 GAAP Results GAAP Net Income was $842 million for the quarter, and $3.2 billion over the last twelve months (“LTM”). GAAP Net Income Attributable to The Blackstone Group L.P. was $368 million for the quarter and $1.4 billion over the LTM. n/m = not meaningful. Effective January 1, 2018, Blackstone adopted new GAAP guidance regarding revenue recognition (see page 2). All prior periods have been conformed to the new guidance. Please see Blackstone’s 4Q’17 Supplemental Financial Data (Updated) available at ir.blackstone.com for additional historical
periods. % Change
% Change (Dollars in Thousands, Except per Unit Data) (Unaudited) 1Q'17 1Q'18 vs. 1Q'17 1Q'17 LTM 1Q'18 LTM vs. 1Q'17 LTM Revenues Management and Advisory Fees, Net 645,484 $
728,849 $
13% 2,497,356 $ 2,834,687 $ 14% Incentive Fees 46,511 12,566 (73)% 168,432 208,569 24% Investment Income (Loss) Performance Allocations Realized 1,111,905 269,640 (76)% 2,376,023 2,729,546 15% Unrealized (124,621) 628,089 n/m 348,981 647,237 85% Principal Investment Income Realized 251,344 42,145 (83)% 542,082 426,570 (21)% Unrealized (40,188) 111,774 n/m 33,633 194,567 479% Total Investment Income 1,198,440 1,051,648 (12)% 3,300,719 3,997,920 21% Interest and Dividend Revenue 28,495 35,385 24% 101,144 146,586 45% Other (4,212) (59,317) n/m 56,153 (188,334) n/m Total Revenues 1,914,718 1,769,131 (8)% 6,123,804 6,999,428 14% Expenses Compensation and Benefits Compensation 351,589 389,403 11% 1,340,994 1,480,299 10% Incentive Fee Compensation 22,465 6,662 (70)% 77,601 89,476 15% Performance Allocations Compensation Realized 366,478 112,062 (69)% 772,766 1,027,549 33% Unrealized 7,533 254,435 n/m 306,860 350,696 14% Total Compensation and Benefits 748,065 762,562 2% 2,498,221 2,948,020 18% General, Administrative and Other 109,386 126,713 16% 524,453 505,909 (4)% Interest Expense 40,246 38,671 (4)% 155,544 195,911 26% Fund Expenses 24,076 54,985 128% 71,028 163,696 130% Total Expenses 921,773 982,931 7% 3,249,246 3,813,536 17% Other Income Reduction of Tax Receivable Agreement Liability - - n/m - 403,855 n/m Net Gains from Fund Investment Activities 66,132 110,599 67% 231,740 366,064 58% Income Before Provision for Taxes 1,059,077 $ 896,799 $
(15)% 3,106,298 $ 3,955,811 $ 27% Provision for Taxes 57,437 54,495 (5)% 180,653 740,205 310% Net Income 1,001,640 $ 842,304 $
(16)% 2,925,645 $ 3,215,606 $ 10% Net Income (Loss) Attributable to Redeemable Non-Controlling Interests in Consolidated Entities
2,000 (1,275) n/m 12,378 10,531 (15)% Net Income Attributable to Non-Controlling Interests in Consolidated Entities
138,685 155,499 12% 344,751 514,253 49% Net Income Attributable to Non-Controlling Interests in Blackstone Holdings
409,046 320,208 (22)% 1,237,667 1,303,485 5% Net Income Attributable to The Blackstone Group L.P. ("BX") 451,909 $
367,872 $
(19)% 1,330,849 $ 1,387,337 $ 4% Net Income per Common Unit, Basic 0.68 $
0.55 $
(19)% 2.04 $
2.07 $
1% Net Income per Common Unit, Diluted 0.68 $
0.53 $
(22)% 2.00 $
2.07 $
3% |
 Blackstone 2 Revenue Recognition: New GAAP Guidance Effective January 1, 2018, Blackstone adopted new GAAP guidance on revenue recognition and implemented a change in accounting principle related to Carried Interest and Incentive Allocations. • The new GAAP guidance resulted in changes to the recognition of contractual Incentive Fees and their separate presentation in our results. • Carried Interest and Incentive Allocations will now be accounted for under the GAAP guidance for equity method investments and be presented as Investment Income – Performance Allocations. Blackstone adopted the new revenue guidance on a full retrospective basis and all prior periods have been conformed to the new guidance. • Adoption of the new guidance resulted in changes to GAAP Net Income Attributable to The Blackstone Group L.P. and Economic Income which were not material. • The new guidance resulted in no change to Blackstone’s non-GAAP measures of Fee Related Earnings and Distributable Earnings. • Performance Revenues in our segment results and non-GAAP measures collectively refer to Realized Incentive Fees and Performance Allocations. |
 Blackstone 3 Blackstone’s First Quarter 2018 Segment Highlights Economic Net Income (“ENI”) was $792 million ($0.65/unit) in the quarter, on $1.7 billion of Total Segment Revenues. • ENI was $3.2 billion ($2.65/unit) for the LTM, up 7% year-over-year, on $6.6 billion of Total Segment Revenues. Distributable Earnings (“DE”) was $502 million ($0.41/unit) in the quarter, driven by $282 million of Realized Performance Revenues, comprised of Realized Incentive Fees and Realized Performance Allocations. • DE was $3.1 billion ($2.56/unit) for the LTM on $2.9 billion of Realized Performance Revenues. Fee Related Earnings (“FRE”) was $333 million in the quarter, up 14% year-over-year, on $736 million of Net Management and Advisory Fees. • FRE was $1.3 billion for the LTM, up 20% year-over-year, on $2.9 billion of Net Management and Advisory Fees. Total Assets Under Management (“AUM”) grew to a record $449.6 billion, up 22% year-over-year, through a combination of continued fundraising and fund appreciation. • Inflows were $18.2 billion in the quarter, bringing LTM inflows to a record $112.2 billion. • Fee-Earning AUM increased 23% year-over-year to $344.7 billion. Quarterly and LTM capital deployed were $10.1 billion and $49.0 billion, respectively. Blackstone increased its unit repurchase authorization to $1 billion and announced $0.30 per unit special distribution to be paid out over the next three quarters. Blackstone declared a first quarter distribution of $0.35 per common unit payable on May 7, 2018. The changes in carrying value, fund returns and composite returns presented throughout this presentation represent those of the
applicable Blackstone Funds and not those of The
Blackstone Group L.P. |
 Blackstone 4 Additional Highlights $1 Billion Unit Repurchase Authorization Our Board of Directors has authorized the repurchase of up to $1 billion of common units and Blackstone Holdings partnership units, nearly tripling the $335.8 million of repurchase authorization remaining under the prior authorization. While the repurchase authorization is broad-based, Blackstone anticipates unit repurchases will largely be used to offset the dilutive effect from annual equity awards. Units may be repurchased from time to time in open market transactions, in privately negotiated transactions or otherwise. The timing and the actual number of units repurchased will depend on a variety of factors, including legal requirements, price and economic and market conditions. The unit repurchase program may be changed, suspended or discontinued at any time and does not have a specified expiration date. Special Cash Distribution In April 2018, Blackstone received approximately $580 million of pre-tax proceeds in connection with concluding GSO’s investment sub-advisory relationship with FS Investments. Blackstone intends to distribute a portion of the after-tax proceeds to unitholders – resulting in an anticipated incremental $0.30 per unit to be distributed over the next three quarters. |
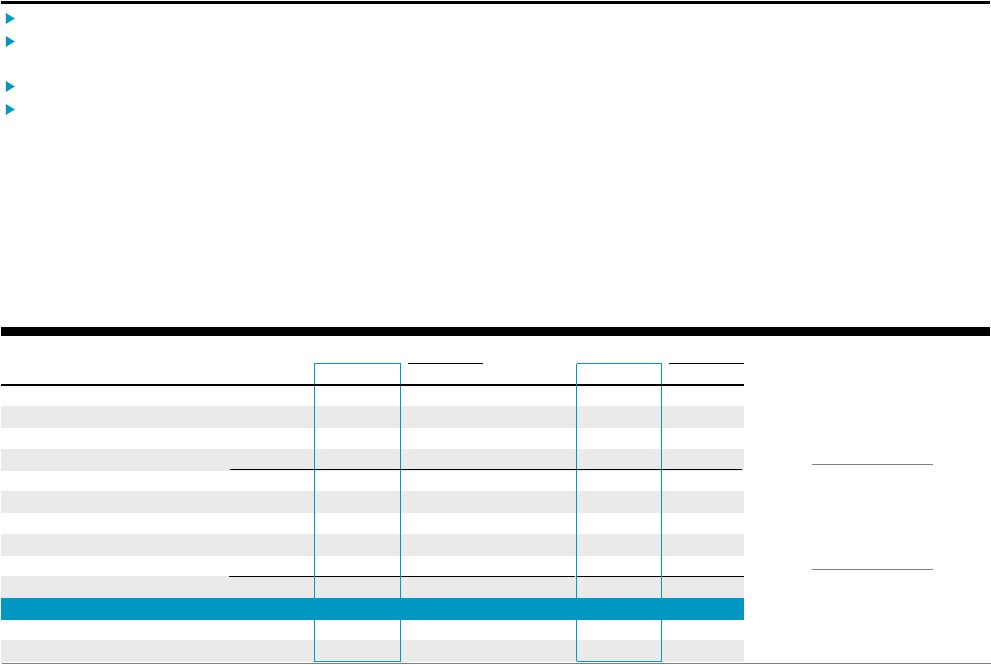
 %
Change % Change
(Dollars in Thousands, Except per Unit Data)
1Q'17 1Q'18 vs. 1Q'17 1Q'17 LTM 1Q'18 LTM vs. 1Q'17 LTM Management and Advisory Fees, Net 649,581 $ 736,044 $ 13% 2,499,373 $ 2,857,254 $ 14% Performance Revenues 1,034,381 910,547 (12)% 2,896,103 3,587,986 24% Principal Investment Income 103,959 42,671 (59)% 350,899 243,700 (31)% Interest, Dividend and Other Revenue 20,209 (24,509) n/m 154,422 (41,849) n/m Total Revenues 1,808,130 1,664,753 (8)% 5,900,797 6,647,091 13% Total Expenses 821,415 854,816 4% 2,821,246 3,345,259 19% Taxes 18,805 18,228 (3)% 94,274 100,954 7% Economic Net Income 967,910 $ 791,709 $ (18)% 2,985,277 $ 3,200,878 $ 7% ENI per Unit 0.81 $
0.65 $
(20)% 2.49 $
2.65 $
6% Fee Related Earnings 290,742 $ 332,873 $ 14% 1,065,763 $ 1,278,350 $ 20% FRE per Unit 0.24 $
0.28 $
17% 0.90 $
1.07 $
19% Distributable Earnings 1,230,138 $ 502,055 $ (59)% 2,957,498 $ 3,148,132 $ 6% DE per Common Unit 1.02 $
0.41 $
(60)% 2.42 $
2.56 $
6% Total AUM 368,196,917 $ 449,613,826 $ 22% 368,196,917 $ 449,613,826 $ 22% Fee-Earning AUM 280,215,551 $ 344,650,797 $ 23% 280,215,551 $ 344,650,797 $ 23% Blackstone’s First Quarter 2018 Segment Earnings Performance Revenues collectively refer to Realized Incentive Fees and Performance Allocations.
Blackstone
5 |
 Blackstone 6 6.4% 1Q’18 Increase in Corporate Private Equity Carrying Value Private Equity $1.0 billion 1Q’18 Realizations $111.4 billion Total AUM up 12% YoY Corporate Private Equity carrying value increased 6.4% in the quarter, driven by strong appreciation in the private portfolio. Invested $4.0 billion in the quarter, including a new Corporate Private Equity investment in Paysafe, as well as deployments in Tactical Opportunities and Strategic Partners. • Landmark Thomson Reuters investment was committed but not yet deployed during the quarter. Realizations of $1.0 billion in the quarter were driven by activity across Corporate Private Equity, Strategic Partners and Tactical Opportunities, bringing LTM realizations to $10.6 billion. Completed an initial public offering of BCP VI’s largest investment, Gates Industrial, on January 25, 2018. Total AUM inflows of $3.5 billion and portfolio appreciation in the quarter drove Total AUM to $111.4 billion. • Fee-Earning AUM increased 6% year-over-year to $72.4 billion. % Change % Change (Dollars in Thousands) 1Q'17 1Q'18 vs. 1Q'17 1Q'17 LTM 1Q'18 LTM vs. 1Q'17 LTM Management and Advisory Fees, Net 180,692 $ 190,862 $ 6% 608,038 $ 774,605 $ 27% Performance Revenues 398,203 474,439 19% 965,005 1,220,210 26% Principal Investment Income 40,772 23,706 (42)% 109,473 86,354 (21)% Interest, Dividend and Other Revenue 4,861 (7,865) n/m 46,011 (15,550) n/m Total Revenues 624,528 681,142 9% 1,728,527 2,065,619 20% Compensation 83,603 99,729 19% 313,297 378,800 21% Performance Compensation 142,277 211,847 49% 392,373 545,209 39% Interest Expense 10,427 10,133 (3)% 47,440 50,835 7% Other Operating Expenses 27,761 31,151 12% 126,466 124,387 (2)% Total Expenses 264,068 352,860 34% 879,576 1,099,231 25% Economic Income 360,460 $ 328,282 $ (9)% 848,951 $ 966,388 $ 14% Total AUM 99,707,057 $ 111,414,214 $ 12% 99,707,057 $ 111,414,214 $ 12% Fee-Earning AUM 68,227,286 $ 72,398,415 $ 6% 68,227,286 $ 72,398,415 $ 6% |
 Blackstone 7 % Change % Change (Dollars in Thousands) 1Q'17 1Q'18 vs. 1Q'17 1Q'17 LTM 1Q'18 LTM vs. 1Q'17 LTM Management Fees, Net 215,608 $ 247,946 $ 15% 866,665 $ 971,376 $ 12% Performance Revenues 514,709 382,126 (26)% 1,433,414 1,945,102 36% Principal Investment Income 35,726 17,377 (51)% 146,481 115,334 (21)% Interest, Dividend and Other Revenue 8,944 (6,369) n/m 56,298 (8,654) n/m Total Revenues 774,987 641,080 (17)% 2,502,858 3,023,158 21% Compensation 102,702 112,824 10% 387,476 437,333 13% Performance Compensation 199,081 135,563 (32)% 528,368 741,118 40% Interest Expense 14,635 14,149 (3)% 52,194 70,855 36% Other Operating Expenses 30,864 29,417 (5)% 136,621 134,595 (1)% Total Expenses 347,282 291,953 (16)% 1,104,659 1,383,901 25% Economic Income 427,705 $ 349,127 $ (18)% 1,398,199 $ 1,639,257 $ 17% Total AUM 102,070,930 $ 119,575,884 $ 17% 102,070,930 $ 119,575,884 $ 17% Fee-Earning AUM 71,904,741 $ 87,284,578 $ 21% 71,904,741 $ 87,284,578 $ 21% Real Estate 3.5% 1Q’18 Increase in Opportunistic Funds’ Carrying Value $119.6 billion Total AUM up 17% YoY
$2.7 billion
1Q’18 Realizations
Opportunistic
funds’
carrying
value
increased
3.5%
during
the
quarter
primarily
driven
by
gains
in
private
investment
values;
core+
funds’
carrying
values
increased
3.4%
in
the
quarter.
Active
investing
quarter
with
$6.7
billion
invested
or
committed,
with
50%
outside
of
North
America.
• Includes $1.3 billion for the purchase of a majority stake in the Banco Popular Spanish real estate portfolio, along with a commitment to purchase a public Canadian industrial REIT in core+ expected to close in the second quarter of 2018. Realizations of $2.7 billion in the quarter driven by proceeds from Invitation Homes and BioMed Realty Trust. Total AUM up 17% and Fee-Earning AUM up 21% year-over-year to $119.6 billion and $87.3 billion, respectively. • Total AUM inflows of $3.6 billion in the quarter driven by fundraising across the core+ platform, including $691 million in BPP Europe and co-invest, $623 million in BREIT and $460 million in BPP U.S. • Global core+ Total AUM up 87% year-over-year to $29.7 billion, four years after launching the business. Carrying value for core+ funds excludes BREIT. |
 Blackstone 8 Hedge Fund Solutions 1.3% 1Q’18 BPS Composite Gross Return $3.9 billion 1Q’18 Total AUM Inflows $78.7 billion Total AUM up 7% YoY
The
BPS
Composite
gross
return
was
1.3%
in
the
quarter
(1.1%
net),
and
6.7%
for
the
LTM
(5.8%
net),
despite
the
volatility
in
the
markets,
continuing
positive
momentum
in
returns
for
hedge
fund
strategies.
Total
AUM
inflows
of
$3.9
billion
during
the
quarter
and
$12.4
billion
for
the
LTM,
driven
by
customized
solutions
and
individual
investor
and
specialized
solutions.
• Net inflows of $2.8 billion represent the largest quarterly amount since 2014. • April 1 subscriptions of $698 million are not yet included in Total AUM. Total AUM increased 7% year-over-year to a record $78.7 billion, driven primarily by appreciation across strategies. • Total AUM for BAAM’s individual investor solutions platform reached $9.0 billion, up 34% year-over-year. • Fee-Earning AUM up 7% year-over-year to $73.6 billion. The BPS Composite gross and net returns are based on the BAAM Principal Solutions (“BPS”) Composite, which does not include
BAAM's individual investor solutions (liquid alternatives), ventures (seeding and minority interests), strategic opportunities (co- invests), and advisory (non-discretionary) platforms, except for investments by BPS funds directly into those platforms.
BAAM-managed funds in liquidation and non fee-paying
assets (net returns only) are also excluded. The funds/accounts that comprise the BPS Composite are not managed within a single fund or account and are managed with different mandates. There is no guarantee that BAAM would have made the same mix of investments in a stand-alone fund/account. The BPS Composite is not an investible product and, as such, the performance of the Composite does not represent the performance of an actual fund or account.
% Change % Change (Dollars in Thousands) 1Q'17 1Q'18 vs. 1Q'17 1Q'17 LTM 1Q'18 LTM vs. 1Q'17 LTM Management Fees, Net 128,727 $ 129,573 $ 1% 520,823 $ 519,781 $ (0)% Performance Revenues 33,499 15,238 (55)% 75,624 144,426 91% Principal Investment Income 17,661 1,080 (94)% 42,935 33,505 (22)% Interest, Dividend and Other Revenue 2,387 (5,476) n/m 22,721 (10,718) n/m Total Revenues 182,274 140,415 (23)% 662,103 686,994 4% Compensation 47,604 50,300 6% 178,755 179,478 0% Performance Compensation 13,739 8,635 (37)% 32,232 51,361 59% Interest Expense 6,543 6,271 (4)% 25,020 31,346 25% Other Operating Expenses 16,379 18,785 15% 74,142 70,671 (5)% Total Expenses 84,265 83,991 (0)% 310,149 332,856 7% Economic Income 98,009 $ 56,424 $ (42)% 351,954 $ 354,138 $ 1% Total AUM 73,303,381 $ 78,657,551 $ 7% 73,303,381 $ 78,657,551 $ 7% Fee-Earning AUM 68,812,528 $ 73,570,498 $ 7% 68,812,528 $ 73,570,498 $ 7% |
 Blackstone 9 Credit $7.1 billion 1Q’18 Total AUM Inflows $140.0 billion Total AUM up 50% YoY 1Q’18 Composite Gross Returns Performing Credit 3.2% Distressed (0.3)% Composite gross returns of 3.2% for Performing Credit and (0.3)% for Distressed Strategies for the quarter. Investment pace remained strong with $1.7 billion of capital deployed or committed during the quarter and $9.3 billion over the LTM, predominantly capitalizing on distressed and European opportunities. Continued strong realization activity across funds of $2.5 billion in the quarter and $11.7 billion for the LTM. Total AUM increased 50% year-over-year to a record $140.0 billion, driven by inflows from the new Blackstone Insurance Solutions platform launch and Harvest acquisition, both of which occurred in the fourth quarter of last year. • Total AUM for Blackstone Insurance Solutions reached $24.1 billion at quarter end, including $1.0 billion invested in other Blackstone products. • Raised $678 million of capital in the quarter for the successor flagship distressed fund, with the final close occurring in the second quarter bringing the total fund size to $7.5 billion. • Concluded the first close for a successor credit alpha fund for $476 million. • Launched ten CLOs (six U.S. and four European) in the LTM totaling $6.8 billion, including $1.6 billion in the first quarter. % Change % Change (Dollars in Thousands) 1Q'17 1Q'18 vs. 1Q'17 1Q'17 LTM 1Q'18 LTM vs. 1Q'17 LTM Management Fees, Net 124,554 $ 167,663 $ 35% 503,847 $ 591,492 $ 17% Performance Revenues 87,970 38,744 (56)% 422,060 278,248 (34)% Principal Investment Income 9,800 508 (95)% 52,010 8,507 (84)% Interest, Dividend and Other Revenue 4,017 (4,799) n/m 29,392 (6,927) n/m Total Revenues 226,341 202,116 (11)% 1,007,309 871,320 (14)% Compensation 55,118 73,474 33% 205,312 254,805 24% Performance Compensation 41,379 17,114 (59)% 204,254 130,033 (36)% Interest Expense 7,845 7,685 (2)% 26,321 38,590 47% Other Operating Expenses 21,458 27,739 29% 90,975 105,843 16% Total Expenses 125,800 126,012 0% 526,862 529,271 0% Economic Income 100,541 $ 76,104 $ (24)% 480,447 $ 342,049 $ (29)% Total AUM 93,115,549 $ 139,966,177 $ 50% 93,115,549 $ 139,966,177 $ 50% Fee-Earning AUM 71,270,996 $ 111,397,306 $ 56% 71,270,996 $ 111,397,306 $ 56% Performing Credit Strategies include mezzanine lending funds, Business Development Companies (“BDCs”) and other performing
credit strategy funds. Distressed Strategies include credit alpha strategies, stressed / distressed funds and energy strategies. The composite gross returns represent a weighted-average composite of the fee-earning funds exceeding $100 million of fair value at each respective quarter end for each
strategy. Composite gross returns exclude the Blackstone Funds that were contributed to GSO as part of Blackstone’s acquisition of GSO in March 2008. Performing Credit Strategies’ net composite returns were 2.3% and 5.5% for 1Q’18 and 1Q’18 LTM. Distressed Strategies’
net composite returns were (0.6)% and 2.5% for 1Q’18 and 1Q'18 LTM. The breakdown of Total AUM for 1Q’18 is as follows: Distressed Strategies $27.0 billion (14% Incentive Fee, 86% Performance Allocations), Performing Credit Strategies $39.8 billion (5% Incentive Fee, 95% Performance Allocations),
Long Only $40.3 billion, Blackstone Insurance Solutions $23.1 billion, and Harvest $9.9 billion. The breakdown of Fee-Earning AUM for 1Q’18 is as follows: Distressed Strategies $12.3 billion (29% Incentive Fee, 71% Performance Allocations), Performing Credit Strategies $27.6 billion (10%
Incentive Fee, 90% Performance Allocations), Long Only $38.6 billion, Blackstone Insurance Solutions $23.1 billion, and Harvest $9.8 billion.
|
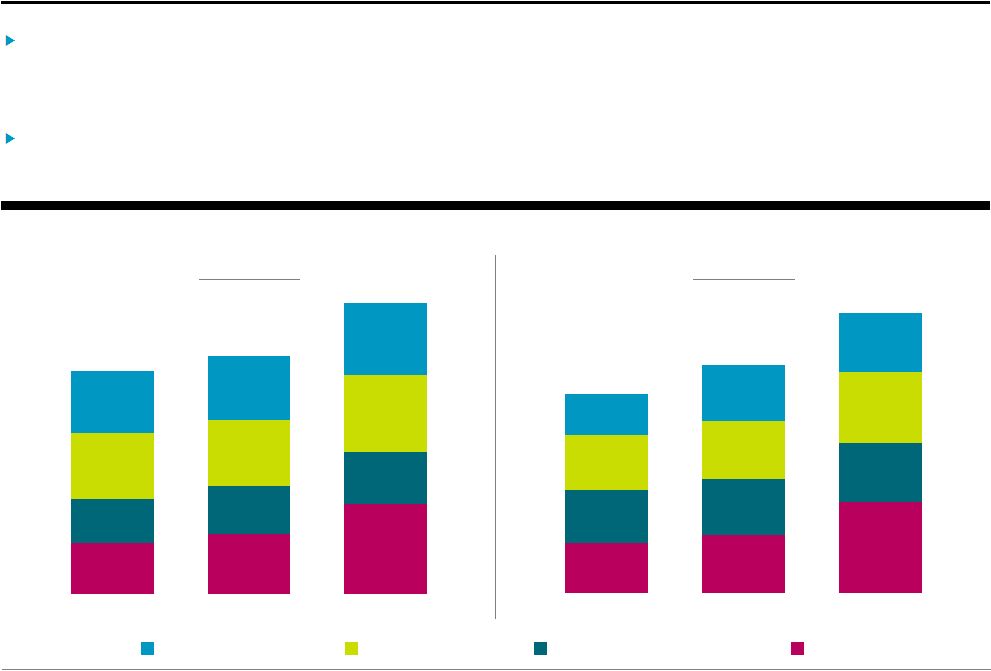 Blackstone 10 $78.7 $93.1 $140.0 $68.5 $73.3 $78.7 $101.1 $102.1 $119.6 $95.5 $99.7 $111.4 $343.7 $368.2 $449.6 1Q'16 1Q'17 1Q'18 $62.1 $71.3 $111.4 $64.8 $68.8 $73.6 $67.3 $71.9 $87.3 $50.2 $68.2 $72.4 $244.5 $280.2 $344.7 1Q'16 1Q'17 1Q'18 Fee-Earning AUM by Segment (Dollars in Billions) Total AUM by Segment (Dollars in Billions) Assets Under Management Total AUM increased $81.4 billion, or 22%, year-over-year to $449.6 billion driven by $112.2 billion of
inflows. •
Total AUM increased despite realizations of $44.8 billion during
the LTM. Fee-Earning AUM of $344.7 billion up 23%
year-over-year as $101.7 billion of inflows outpaced $45.6 billion of realizations and outflows. Private Equity Real Estate Hedge Fund Solutions Credit |
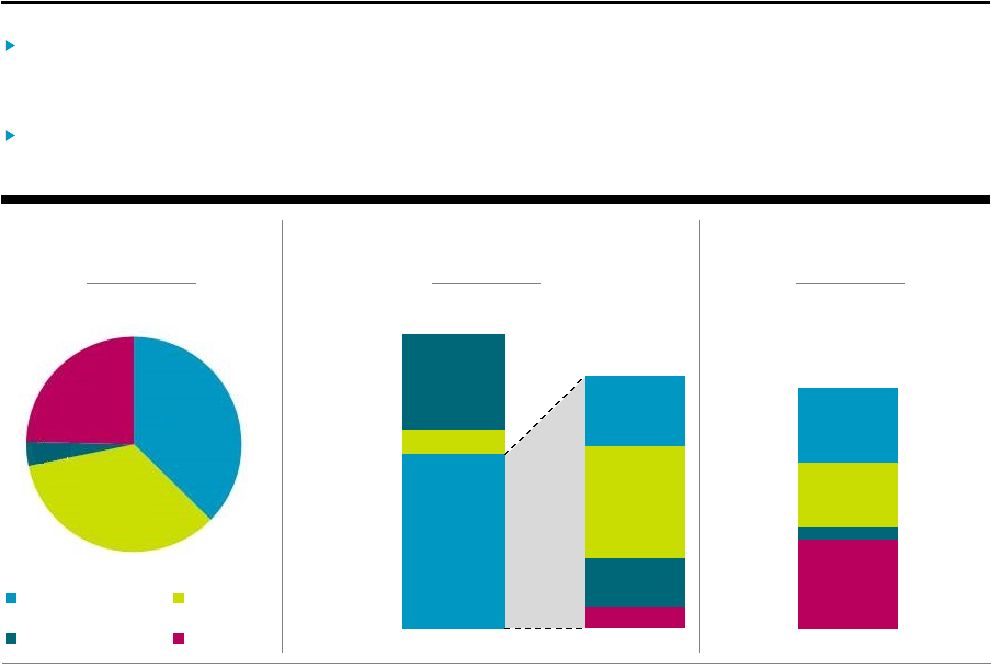 Blackstone 11 $172.3 $23.7 $95.0 $291.0 $14.4 $33.7 $76.4 $47.7 $172.3 Additional Capital Detail Uninvested Not Currently Earning Performance Revenues Currently Earning Performance Revenues Private Equity Real Estate Hedge Fund Solutions Credit $93 billion 1Q’18 Total Dry Powder $291 billion Performance Revenue Eligible AUM $47 billion Not Currently Earning Management Fees Performance Revenue Eligible AUM Currently Earning Performance Revenues of $172.3 billion includes $47.7 billion for Private Equity
(Corporate Private Equity $28.2 billion, Tactical
Opportunities $12.3 billion, Strategic Partners $7.2 billion), $76.4 billion for Real Estate (BREP $44.3 billion, core+ $24.3 billion, BREDS $7.8 billion), $33.7 billion for Hedge Fund Solutions, and $14.4 billion for Credit (Distressed Strategies $6.8 billion, Performing Credit Strategies $7.0 billion, Long Only and Master Limited
Partnership (“MLP”) $584 million).
Undrawn
capital
(“Total
Dry
Powder”)
was
$92.8
billion,
despite
$49.0
billion
of
capital
deployed
over
the
LTM.
• 80% of Total Dry Powder was raised since the beginning of 2015. Performance Revenue Eligible AUM reached $291.0 billion at quarter end, up 7% year-over-year, despite significant realizations in the Real Estate, Private Equity, and Credit segments. $17.3 $2.5 $12.5 $14.6 $46.8 Hedge Fund Solutions Private Equity Real Estate Credit $34.7 $31.9 $3.4 $22.8 |
 Blackstone 12 At March 31, 2018, Blackstone had $4.5
billion
in
total
cash,
cash
equivalents,
and
corporate
treasury
investments
and
$10.1
billion
of
cash
and
net
investments,
or
$8.
40
per
unit.
Blackstone
has
no
net
debt,
a
$1.5
billion
undrawn
credit
revolver
and
maintains
A+/A+
ratings.
Deconsolidated Balance Sheet Highlights
Balance Sheet Highlights are preliminary, and exclude the consolidated
Blackstone Funds. GP/Fund Investments include Blackstone investments in Private Equity, Real Estate, Hedge Fund Solutions, and Credit, which were $647 million, $892 million, $114 million, and $368 million, respectively, as of March 31, 2018. Cash and Net
Investments per unit amounts are calculated using period end DE
Units Outstanding (see page 34, Unit Rollforward).
A+/A+
Rated by S&P and Fitch
$1.5 billion
Undrawn Credit Revolver
with August 2021 Maturity
$4.5 billion
Total Cash and
Corporate Treasury
Cash and Net Investments
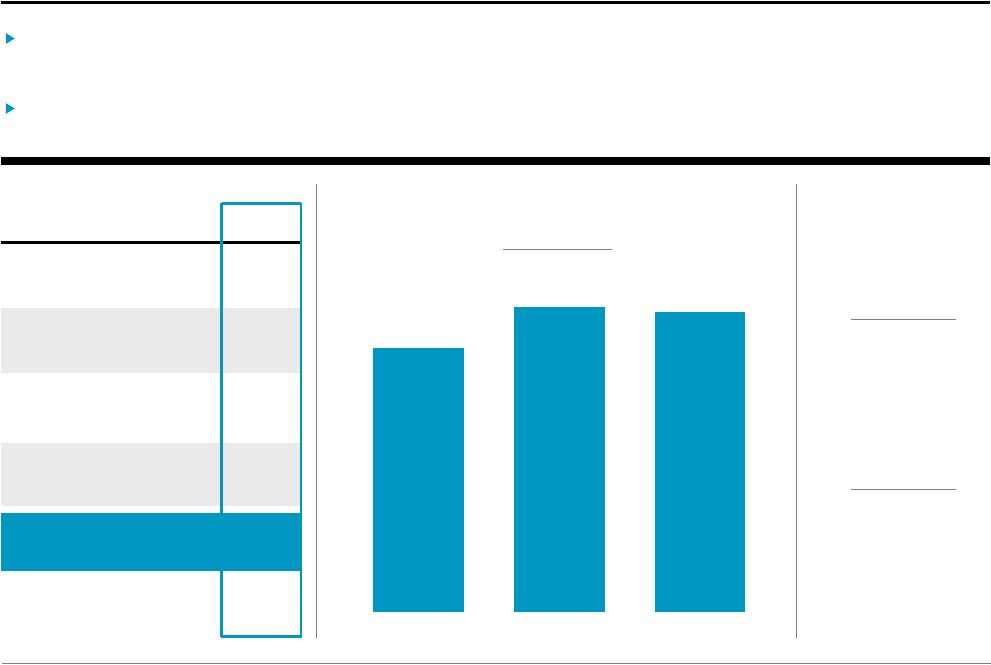
(Per Unit) (Dollars in Millions) 1Q’18 Cash and Cash Equivalents $ 1,747 Corporate Treasury Investments 2,749 GP/Fund Investments 2,022 Net Accrued Performance Revenues 3,605 Cash and Net Investments $ 10,123 Outstanding Bonds (at par) $ 3,607 $7.39 $8.53 $8.40 1Q'16 1Q'17 1Q'18 |
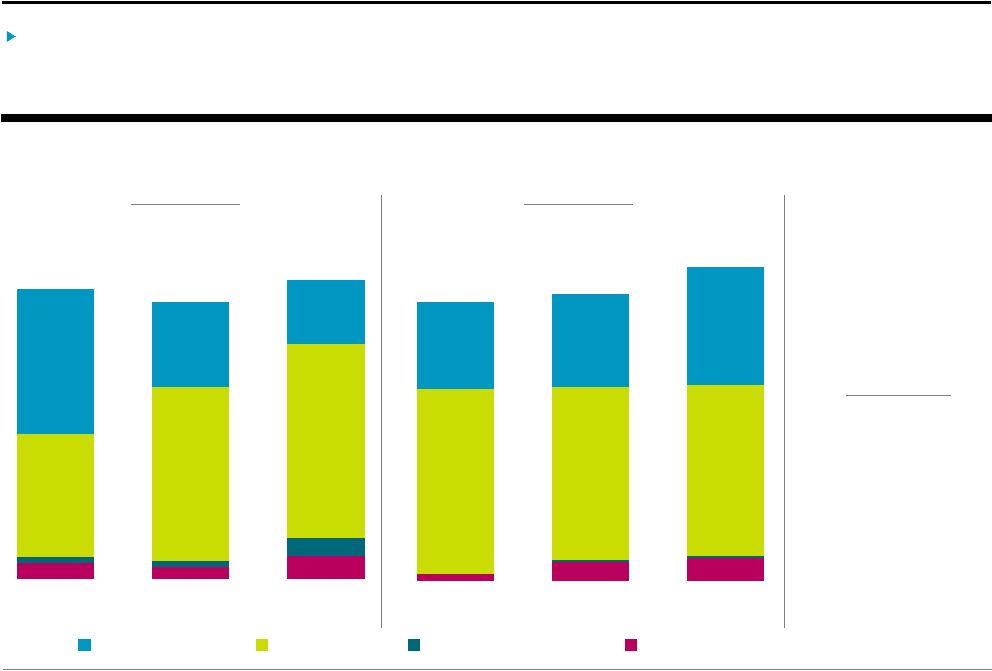 Blackstone 13 $2,120 $1,989 $1,972 $1,000 $1,073 $1,348 $3,205 $3,304 $3,605 1Q'16 1Q'17 1Q'18 $754 $1,070 $1,189 $889 $521 $396 $1,780 $1,704 $1,838 1Q'16 LTM 1Q'17 LTM 1Q'18 LTM Performance Revenues Net Realized Performance Revenues (Dollars in Millions) Net Accrued Performance Revenues (Dollars in Millions) Private Equity Real Estate Credit Hedge Fund Solutions $3.6 billion Net Accrued Performance Revenues at 1Q’18 $2.99 per unit Net Accrued Performance Revenues at 1Q’18 Net Accrued Performance Revenues per unit is calculated using period end DE Units Outstanding (see page 34, Unit
Rollforward). Net
Accrued
Performance
Revenues
were
$3.6
billion
($2.99/unit),
increasing
9%
year-over-year
with
strong
appreciation
generating
$2.1
billion
of
additional
Net
Accrued
Performance
Revenues
that
offset
$1.8
billion
of
Net
Realized
Performance
Revenues. |
 Appendix |
 Blackstone 15 Total Segments See page 2 for information regarding the adoption of new GAAP guidance on revenue recognition.
(Dollars in Thousands)
1Q'17 2Q'17 3Q'17 4Q'17 1Q'18 1Q'17 LTM 1Q'18 LTM Revenues Management and Advisory Fees, Net Base Management Fees 642,958 $
671,368 $
669,902 $
696,163 $
707,156 $
2,454,034 $ 2,744,589 $ Transaction, Advisory and Other Fees, Net 40,222 38,892 32,295 45,407 37,066 138,481 153,660 Management Fee Offsets (33,599) (13,424) (10,215) (9,178) (8,178) (93,142) (40,995) Total Management and Advisory Fees, Net 649,581 696,836 691,982 732,392 736,044 2,499,373 2,857,254 Performance Revenues Realized Incentive Fees 46,511 40,303 35,513 122,057 12,566 169,545 210,439 Realized Performance Allocations 1,111,948 603,096 434,994 1,422,830 269,642 2,376,571 2,730,562 Unrealized Performance Allocations (124,078) 95,707 407,425 (484,486) 628,339 349,987 646,985 Total Performance Revenues 1,034,381 739,106 877,932 1,060,401 910,547 2,896,103 3,587,986 Principal Investment Income (Loss) Realized 202,894 100,887 60,188 72,225 28,693 412,864 261,993 Unrealized (98,935) (33,167) 17,384 (16,488) 13,978 (61,965) (18,293) Total Principal Investment Income 103,959 67,720 77,572 55,737 42,671 350,899 243,700 Interest Income and Dividend Revenue 28,496 33,703 37,885 42,836 36,385 101,749 150,809 Other (8,287) (62,469) (34,144) (35,151) (60,894) 52,673 (192,658) Total Revenues 1,808,130 1,474,896 1,651,227 1,856,215 1,664,753 5,900,797 6,647,091 Expenses Compensation 289,027 305,257 302,798 306,034 336,327 1,084,840 1,250,416 Performance Compensation Realized Incentive Fees 22,465 21,032 18,332 43,450 6,662 77,601 89,476 Realized Performance Allocations 366,478 195,738 162,505 557,244 112,062 772,766 1,027,549 Unrealized Performance Allocations 7,533 86,910 175,534 (166,183) 254,435 306,860 350,696 Total Compensation and Benefits 685,503 608,937 659,169 740,545 709,486 2,242,067 2,718,137 Interest Expense 39,450 40,294 40,749 72,345 38,238 150,975 191,626 Other Operating Expenses 96,462 105,838 106,617 115,949 107,092 428,204 435,496 Total Expenses 821,415 755,069 806,535 928,839 854,816 2,821,246 3,345,259 Economic Income 986,715 $
719,827 $
844,692 $
927,376 $
809,937 $
3,079,551 $ 3,301,832 $ Economic Net Income 967,910 $
695,659 $
822,140 $
891,370 $
791,709 $
2,985,277 $ 3,200,878 $ Fee Related Earnings 290,742 $
311,183 $
306,708 $
327,586 $
332,873 $
1,065,763 $ 1,278,350 $ Distributable Earnings 1,230,138 $ 781,365 $
625,566 $
1,239,146 $ 502,055 $
2,957,498 $ 3,148,132 $ Total Assets Under Management 368,196,917 $ 371,056,281 $ 387,449,746 $ 434,128,243 $ 449,613,826 $ 368,196,917 $ 449,613,826 $ Fee-Earning Assets Under Management 280,215,551 $ 281,934,511 $ 285,698,425 $ 335,343,998 $ 344,650,797 $ 280,215,551 $ 344,650,797 $ Weighted Average Fee-Earning AUM 279,582,971 $ 281,966,547 $ 284,114,581 $ 311,353,064 $ 344,482,808 $ 271,944,095 $ 317,684,345 $ LP Capital Invested 9,709,930 $ 7,799,624 $ 10,043,022 $ 18,663,837 $ 9,323,329 $ 25,616,109 $ 45,829,812 $ Total Capital Invested 11,840,913 $ 8,382,583 $ 10,925,170 $ 19,529,797 $ 10,119,519 $ 28,422,948 $ 48,957,069 $ |
 Blackstone 16 (Dollars in Thousands) 1Q'17 2Q'17 3Q'17 4Q'17 1Q'18 1Q'17 LTM 1Q'18 LTM Revenues Management and Advisory Fees, Net Base Management Fees 176,706 $
177,684 $
182,764 $
187,664 $
182,961 $
601,651 $
731,073 $
Transaction, Advisory and Other Fees, Net
16,176 17,289 8,748 15,411 11,094 46,539 52,542 Management Fee Offsets
(12,190) (3,753) (1,088) (976) (3,193)
(40,152)
(9,010)
Total Management and Advisory
Fees, Net 180,692
191,220
190,424
202,099
190,862
608,038
774,605
Performance Revenues
Realized Performance Allocations
582,681 198,168 101,918 274,421 77,123 797,667 651,630 Unrealized Performance Allocations
(184,478) 9 80,326
90,929
397,316
167,338
568,580
Total Performance Revenues
398,203 198,177 182,244 365,350 474,439 965,005 1,220,210 Principal Investment Income (Loss)
Realized 81,294 41,168 7,077 25,298 6,338 170,028 79,881 Unrealized (40,522) (25,892) 17,300 (2,303) 17,368 (60,555) 6,473 Total Principal Investment Income
40,772 15,276 24,377 22,995 23,706 109,473 86,354 Interest Income and Dividend Revenue
6,661 7,922 9,046 9,209 8,543 25,766 34,720 Other (1,800) (16,124) (8,346) (9,392) (16,408) 20,245 (50,270) Total Revenues 624,528 396,471 397,745 590,261 681,142 1,728,527 2,065,619 Expenses Compensation 83,603 90,676 96,166 92,229 99,729 313,297 378,800 Performance Compensation
Realized Performance Allocations
181,633 63,060 48,019 111,832 33,045 277,088 255,956 Unrealized Performance Allocations
(39,356) 22,219 45,484 42,748 178,802 115,285 289,253 Total Compensation and Benefits
225,880 175,955 189,669 246,809 311,576 705,670 924,009 Interest Expense
10,427 10,728 10,804 19,170 10,133 47,440 50,835 Other Operating Expenses
27,761 28,592 32,166 32,478 31,151 126,466 124,387 Total Expenses 264,068 215,275 232,639 298,457 352,860 879,576 1,099,231 Economic Income
360,460 $
181,196 $
165,106 $
291,804 $
328,282 $
848,951 $
966,388 $
Total Assets Under Management
99,707,057 $ 100,019,716 $ 102,453,979 $ 105,560,576 $ 111,414,214 $ 99,707,057 $ 111,414,214 $ Fee-Earning Assets Under Management 68,227,286 $ 68,029,670 $ 67,538,062 $ 70,140,883 $ 72,398,415 $ 68,227,286 $ 72,398,415 $ Weighted Average Fee-Earning AUM 68,613,668 $ 68,194,287 $ 67,606,365 $ 68,815,882 $ 71,881,372 $ 68,415,122 $ 68,184,390 $ LP Capital Invested 4,736,388 $ 3,846,841 $ 3,725,919 $ 4,614,237 $ 3,301,949 $ 10,314,297 $ 15,488,946 $ Total Capital Invested 6,748,859 $ 4,221,479 $ 4,279,062 $ 4,929,609 $ 3,955,198 $ 12,685,979 $ 17,385,348 $ Private Equity |
 Blackstone 17 (Dollars in Thousands) 1Q'17 2Q'17 3Q'17 4Q'17 1Q'18 1Q'17 LTM 1Q'18 LTM Revenues Management Fees, Net Base Management Fees 197,879 $
227,865 $
224,048 $
222,399 $
226,526 $
793,133 $
900,838 $
Transaction and Other Fees, Net
21,279 16,087 20,616 24,799 23,088 80,809 84,590 Management Fee Offsets
(3,550) (5,018) (4,232) (3,134) (1,668) (7,277) (14,052) Total Management Fees, Net
215,608 238,934 240,432 244,064 247,946 866,665 971,376 Performance Revenues
Realized Incentive Fees
2,882 4,878 3,778 20,094 4,375 28,316 33,125 Realized Performance Allocations
519,873 389,441 307,932 971,996 151,309 1,522,852 1,820,678 Unrealized Performance Allocations
(8,046) 89,688 273,731 (498,562) 226,442 (117,754) 91,299 Total Performance Revenues
514,709 484,007 585,441 493,528 382,126 1,433,414 1,945,102 Principal Investment Income (Loss)
Realized 119,579 57,599 44,449 34,276 14,690 229,316 151,014 Unrealized (83,853) (20,519) (8,319) (9,529) 2,687 (82,835) (35,680) Total Principal Investment Income
35,726 37,080 36,130 24,747 17,377 146,481 115,334 Interest Income and Dividend Revenue
12,094 14,493 15,461 16,036 15,128 41,016 61,118 Other (3,150) (22,965) (13,108) (12,202) (21,497) 15,282 (69,772) Total Revenues 774,987 751,549 864,356 766,173 641,080 2,502,858 3,023,158 Expenses Compensation 102,702 110,266 105,753 108,490 112,824 387,476 437,333 Performance Compensation
Realized Incentive Fees
1,333 2,711 1,967 10,203 2,210 11,223 17,091 Realized Performance Allocations
179,956 124,512 104,112 364,410 54,183 469,564 647,217 Unrealized Performance Allocations
17,792 64,254 105,640 (172,254) 79,170 47,581 76,810 Total Compensation and Benefits
301,783 301,743 317,472 310,849 248,387 915,844 1,178,451 Interest Expense
14,635 14,787 15,028 26,891 14,149 52,194 70,855 Other Operating Expenses
30,864 33,379 33,256 38,543 29,417 136,621 134,595 Total Expenses 347,282 349,909 365,756 376,283 291,953 1,104,659 1,383,901 Economic Income
427,705 $
401,640 $
498,600 $
389,890 $
349,127 $
1,398,199 $ 1,639,257 $ Total Assets Under Management 102,070,930 $ 104,034,287 $ 111,298,844 $ 115,340,363 $ 119,575,884 $ 102,070,930 $ 119,575,884 $ Fee-Earning Assets Under Management 71,904,741 $ 73,710,243 $ 75,081,521 $ 83,984,824 $ 87,284,578 $ 71,904,741 $ 87,284,578 $ Weighted Average Fee-Earning AUM 72,268,792 $ 73,320,319 $ 74,340,895 $ 77,626,395 $ 86,670,284 $ 68,760,233 $ 77,570,231 $ LP Capital Invested 2,590,419 $ 2,371,918 $ 3,778,790 $ 10,845,388 $ 4,254,201 $ 9,812,984 $ 21,250,297 $ Total Capital Invested 2,651,965 $ 2,379,922 $ 3,841,972 $ 11,008,356 $ 4,342,936 $ 10,007,762 $ 21,573,186 $ Real Estate |
 Blackstone 18 Hedge Fund Solutions (Dollars in Thousands) 1Q'17 2Q'17 3Q'17 4Q'17 1Q'18 1Q'17 LTM 1Q'18 LTM Revenues Management Fees, Net Base Management Fees 128,468 $
128,698 $
129,410 $
129,472 $
129,228 $
520,046 $
516,808 $
Transaction and Other Fees, Net
259 1,696 48 977 345 777 3,066 Management Fee Offsets - - (28) (65) - - (93) Total Management Fees, Net 128,727 130,394 129,430 130,384 129,573 520,823 519,781 Performance Revenues Realized Incentive Fees 14,087 6,548 12,186 74,031 8,171 42,670 100,936 Realized Performance Allocations 597 447 2,031 44,416 2,006 11,507 48,900 Unrealized Performance Allocations 18,815 14,849 10,327 (35,647) 5,061 21,447 (5,410) Total Performance Revenues 33,499 21,844 24,544 82,800 15,238 75,624 144,426 Principal Investment Income (Loss) Realized (632) 225 1,316 8,165 640 (3,111) 10,346 Unrealized 18,293 11,578 12,723 (1,582) 440 46,046 23,159 Total Principal Investment Income 17,661 11,803 14,039 6,583 1,080 42,935 33,505 Interest Income and Dividend Revenue 3,997 4,674 5,316 7,538 4,812 14,786 22,340 Other (1,610) (10,720) (5,859) (6,191) (10,288) 7,935 (33,058) Total Revenues 182,274 157,995 167,470 221,114 140,415 662,103 686,994 Expenses Compensation 47,604 47,361 44,347 37,470 50,300 178,755 179,478 Performance Compensation Realized Incentive Fees 7,014 4,097 5,862 20,159 4,034 19,794 34,152 Realized Performance Allocations 303 265 1,022 14,626 2,415 5,057 18,328 Unrealized Performance Allocations 6,422 5,968 3,541 (12,814) 2,186 7,381 (1,119) Total Compensation and Benefits 61,343 57,691 54,772 59,441 58,935 210,987 230,839 Interest Expense 6,543 6,688 6,763 11,624 6,271 25,020 31,346 Other Operating Expenses 16,379 16,318 17,958 17,610 18,785 74,142 70,671 Total Expenses 84,265 80,697 79,493 88,675 83,991 310,149 332,856 Economic Income 98,009 $
77,298 $
87,977 $
132,439 $
56,424 $
351,954 $
354,138 $
Total Assets Under Management
73,303,381 $ 72,476,444 $ 74,219,563 $ 75,090,834 $ 78,657,551 $ 73,303,381 $ 78,657,551 $ Fee-Earning Assets Under Management 68,812,528 $ 67,824,464 $ 69,037,961 $ 69,914,061 $ 73,570,498 $ 68,812,528 $ 73,570,498 $ Weighted Average Fee-Earning AUM 68,406,531 $ 69,301,130 $ 68,957,501 $ 71,101,632 $ 74,251,757 $ 67,206,240 $ 71,250,841 $ LP Capital Invested 121,857 $
89,985 $
360,748 $
328,640 $
755,818 $
559,648 $
1,535,191 $ Total Capital Invested 121,888 $
93,191 $
363,420 $
383,070 $
785,874 $
566,538 $
1,625,555 $ |
 Blackstone 19 Credit (Dollars in Thousands) 1Q'17 2Q'17 3Q'17 4Q'17 1Q'18 1Q'17 LTM 1Q'18 LTM Revenues Management Fees, Net Base Management Fees 139,905 $
137,121 $
133,680 $
156,628 $
168,441 $
539,204 $
595,870 $
Transaction and Other Fees, Net
2,508 3,820 2,883 4,220 2,539 10,356 13,462 Management Fee Offsets
(17,859) (4,653) (4,867) (5,003) (3,317) (45,713) (17,840) Total Management Fees, Net
124,554 136,288 131,696 155,845 167,663 503,847 591,492 Performance Revenues
Realized Incentive Fees
29,542 28,877 19,549 27,932 20 98,559
76,378
Realized Performance
Allocations 8,797
15,040
23,113
131,997
39,204
44,545
209,354
Unrealized Performance Allocations
49,631 (8,839) 43,041 (41,206) (480) 278,956
(7,484)
Total Performance
Revenues 87,970
35,078
85,703
118,723
38,744
422,060
278,248
Principal Investment Income (Loss)
Realized 2,653 1,895 7,346 4,486 7,025 16,631 20,752 Unrealized 7,147 1,666 (4,320) (3,074) (6,517) 35,379 (12,245) Total Principal Investment Income
9,800 3,561 3,026 1,412 508 52,010
8,507
Interest Income and
Dividend Revenue 5,744
6,614
8,062
10,053
7,902
20,181
32,631
Other
(1,727) (12,660) (6,831) (7,366) (12,701) 9,211 (39,558) Total Revenues 226,341 168,881 221,656 278,667 202,116 1,007,309 871,320 Expenses Compensation 55,118 56,954 56,532 67,845 73,474 205,312 254,805 Performance Compensation
Realized Incentive Fees
14,118 14,224 10,503 13,088 418 46,584
38,233
Realized Performance
Allocations 4,586
7,901
9,352
66,376
22,419
21,057
106,048
Unrealized Performance Allocations
22,675 (5,531) 20,869 (23,863) (5,723) 136,613 (14,248) Total Compensation and Benefits
96,497 73,548 97,256 123,446 90,588 409,566 384,838 Interest Expense
7,845 8,091 8,154 14,660 7,685 26,321 38,590 Other Operating Expenses
21,458 27,549 23,237 27,318 27,739 90,975 105,843 Total Expenses 125,800 109,188 128,647 165,424 126,012 526,862 529,271 Economic Income
100,541 $
59,693 $
93,009 $
113,243 $
76,104 $
480,447 $
342,049 $
Total Assets Under Management
93,115,549 $ 94,525,834 $ 99,477,360 $ 138,136,470 $ 139,966,177 $ 93,115,549 $ 139,966,177 $ Fee-Earning Assets Under Management 71,270,996 $ 72,370,134 $ 74,040,881 $ 111,304,230 $ 111,397,306 $ 71,270,996 $ 111,397,306 $ Weighted Average Fee-Earning AUM 70,293,980 $ 71,150,811 $ 73,209,820 $ 93,809,155 $ 111,679,395 $ 67,562,500 $ 100,678,883 $ LP Capital Invested 2,261,266 $ 1,490,880 $ 2,177,565 $ 2,875,572 $ 1,011,361 $ 4,929,180 $ 7,555,378 $ Total Capital Invested 2,318,201 $ 1,687,991 $ 2,440,716 $ 3,208,762 $ 1,035,511 $ 5,162,669 $ 8,372,980 $ |
 Blackstone 20 Unitholder Distribution A detailed description of Blackstone’s distribution policy and the definition of Distributable Earnings can be found on page 35, Definitions and Distribution Policy. DE before Certain Payables represents Distributable Earnings before the deduction for the Payable Under Tax Receivable Agreement and tax expense (benefit) of wholly owned subsidiaries. Per
Unit calculations are based on end of period Total Common Units Outstanding (page 34, Unit Rollforward); actual distributions are paid to unitholders as of the applicable record date. Retained capital is withheld
pro-rata from common and Blackstone Holdings Partnership unitholders. Common unitholders’ share was $41 million for 1Q’18 and $254 million for 1Q’18 LTM.
Generated
$0.41
of
Distributable
Earnings
per
common
unit
during
the
quarter,
bringing
the
LTM
amount
to
$2.56
per
common
unit.
Blackstone
declared
a
quarterly
distribution
of
$0.35
per
common
unit
to
record
holders
as
of
April
30,
2018;
payable
on
May
7,
2018.
% Change % Change (Dollars in Thousands, Except per Unit Data) 1Q'17 2Q'17 3Q'17 4Q'17 1Q'18 vs. 1Q'17 1Q'17 LTM 1Q'18 LTM vs. 1Q'17 LTM Distributable Earnings 1,230,138 $ 781,365 $ 625,566 $ 1,239,146 $ 502,055 $ (59)% 2,957,498 $ 3,148,132 $ 6% Add: Other Payables Attributable to Common Unitholders 6,632 29,808 9,448 52,216 7,028 6% 88,950 98,500 11% DE before Certain Payables 1,236,770 811,173 635,014 1,291,362 509,083 (59)% 3,046,448 3,246,632 7% Percent to Common Unitholders 55% 56% 56% 56% 56% 55% 56% DE before Certain Payables Attributable
to Common Unitholders
683,473 451,302 353,193 720,124 285,633 (58)% 1,671,908 1,810,252 8% Less: Other Payables Attributable to Common Unitholders (6,632) (29,808) (9,448) (52,216) (7,028) 6% (88,950) (98,500) 11% DE Attributable to Common Unitholders 676,841 421,494 343,745 667,908 278,605 (59)% 1,582,958 1,711,752 8% DE per Common Unit 1.02 $ 0.63 $ 0.52 $ 1.00 $ 0.41 $ (60)% 2.42 $ 2.56 $
6% Less: Retained Capital per Common Unit (0.15) $ (0.09) $ (0.08) $ (0.15) $ (0.06) $ (60)% (0.31) $ (0.38) $ 23% Actual Distribution per Common Unit 0.87 $ 0.54 $ 0.44 $ 0.85 $ 0.35 $ (60)% 2.11 $ 2.18 $
3% Record Date Apr 30, 2018 Payable Date May 7, 2018 |
 Blackstone 21 1Q’18 Total AUM Rollforward (Dollars in Millions) 1Q’18 LTM Total AUM Rollforward (Dollars in Millions) Inflows include contributions, capital raised, other increases in available capital, purchases, multi-asset product allocations to
other strategies and acquisitions. Outflows represent redemptions, client withdrawals and other decreases in available capital. Realizations represent realizations from the disposition of assets. Market Activity
represents gains (losses) on
portfolio investments and impact of foreign exchange rate fluctuations. In the Real Estate segment, carrying value for core+ funds excludes BREIT. Total Assets Under Management Private Equity Real Estate Hedge Fund Solutions Credit Inflows: Second Asian opportunistic fund ($1.2 billion); BPP Europe and co-invest ($691 million); BREIT ($623 million); BPP U.S.
($460
million); BREDS ($362
million).
Realizations: BREP opportunistic funds and co-invest ($1.9 billion); BREDS ($478 million); core+ funds ($256 million). Market Activity: Carrying value increases of 3.5% and 3.4% within the opportunistic and core+ funds, respectively. Inflows: Customized solutions ($1.8 billion); individual investor and specialized solutions ($1.7 billion); commingled products ($430 million). Outflows and Realizations: Individual investor and specialized solutions ($851 million); customized solutions ($298 million); commingled products ($33 million). Market Activity: BAAM’s Principal Solutions Composite up 1.3% gross (1.1% net) during the quarter. Inflows: Distressed strategies ($2.0 billion); long only and MLP ($2.0 billion); two new CLOs ($1.6 billion); Blackstone Insurance Solutions
($1.2 billion).
Outflows and Realizations: Distressed strategies ($1.7 billion); long only and MLP ($1.4 billion); capital returned to investors for CLOs outside investment periods ($559 million); mezzanine funds ($381 million). Inflows: Tactical Opportunities ($1.9 billion); Strategic Partners ($786 million); multi-asset products ($460 million); Corporate Private Equity ($398 million). Realizations: Strategic Partners ($466 million); Corporate Private Equity ($354 million); Tactical Opportunities ($221
million). Market
Activity:
Carrying
value
increase
of
6.4%
within
Corporate
Private
Equity.
Private Real Hedge Fund Equity Estate Solutions 4Q'17 105,561 $ 115,340 $ 75,091 $ 138,136 $ 434,128 $ Inflows 3,534 3,623 3,941 7,081 18,179 Outflows (379) (148) (1,127) (1,960) (3,614) Realizations (1,042) (2,667) (56) (2,492) (6,257) Net Inflows 2,114 808 2,758 2,629 8,309 Market Activity 3,740 3,428 809 (799) 7,177 1Q'18 111,414 $ 119,576 $ 78,658 $ 139,966 $ 449,614 $ QoQ Increase 6% 4% 5% 1% 4% Credit Total Private Real Hedge Fund Equity Estate Solutions 1Q'17 99,707 $ 102,071 $ 73,303 $ 93,116 $ 368,197 $ Inflows 13,542 24,138 12,406 62,092 112,178 Outflows (1,386) (1,338) (9,286) (6,038) (18,049) Realizations (10,635) (20,510) (1,963) (11,718) (44,826) Net Inflows 1,520 2,290 1,157 44,336 49,304 Market Activity 10,187 15,215 4,197 2,514 32,113 1Q'18 111,414 $ 119,576 $ 78,658 $ 139,966 $ 449,614 $ YoY Increase 12% 17% 7% 50% 22% Credit Total |
 1Q’18 Fee-Earning AUM Rollforward (Dollars in Millions) 1Q’18 LTM Fee-Earning AUM Rollforward (Dollars in Millions) Private Equity Real Estate Hedge Fund Solutions Credit Inflows: BREP opportunistic funds and co-invest ($1.4 billion); BPP Europe and co-invest ($811 million); BREIT ($623 million); BREDS ($400 million); BPP U.S. ($242 million). Realizations: BREP opportunistic funds and co-invest ($779 million); BREDS ($486 million); core+ funds ($222 million). Inflows: Customized solutions ($1.8 billion); individual investor and specialized solutions ($1.5 billion); commingled products ($424 million). Outflows and Realizations: Individual investor and specialized solutions ($697 million); customized solutions ($231 million); commingled products ($30 million). Inflows: Long only and MLP ($1.8 billion); two new CLOs ($1.6 billion); Blackstone Insurance Solutions ($1.2 billion); distressed strategies ($610 million); mezzanine funds ($336 million). Outflows and Realizations: Long only and MLP ($1.3 billion); distressed strategies ($1.0 billion); capital returned to investors for CLOs outside investment periods ($559 million); mezzanine funds ($227 million).
Inflows:
Tactical
Opportunities
($1.7
billion);
multi-asset
product
($1.0
billion);
Strategic
Partners
($435
million);
Corporate
Private
Equity
($230 million).
Realizations: Strategic Partners ($471 million); Tactical Opportunities ($177 million); Corporate Private Equity ($89 million). Fee-Earning Assets Under Management Inflows include contributions, capital raised, other increases in available capital, purchases, multi-asset product allocations to
other strategies and acquisitions. Outflows represent redemptions,
client withdrawals and other decreases in available capital. Realizations
represent realizations from the disposition of assets. Market Activity represents gains (losses) on portfolio investments and impact of foreign exchange rate fluctuations. Private Real Hedge Fund Equity Estate Solutions 4Q'17 70,141 $ 83,985 $ 69,914 $ 111,304 $ 335,344 $ Inflows 3,404 3,550 3,816 5,552 16,323 Outflows (469) (211) (902) (2,045) (3,627) Realizations (736) (1,494) (56) (1,995) (4,281) Net Inflows 2,199 1,845 2,858 1,513 8,415 Market Activity 59 1,454 798 (1,420) 891 1Q'18 72,398 $ 87,285 $ 73,570 $ 111,397 $ 344,651 $ QoQ Increase 3% 4% 5% 0% 3% Credit Total Private Real Hedge Fund Equity Estate Solutions 1Q'17 68,227 $ 71,905 $ 68,813 $ 71,271 $ 280,216 $ Inflows 10,552 24,981 10,936 55,206 101,674 Outflows (1,661) (2,887) (8,410) (5,598) (18,557) Realizations (5,132) (10,566) (1,791) (9,594) (27,083) Net Inflows 3,759 11,527 735 40,013 56,034 Market Activity 412 3,853 4,023 113 8,401 1Q'18 72,398 $ 87,285 $ 73,570 $ 111,397 $ 344,651 $ YoY Increase 6% 21% 7% 56% 23% Credit Total Blackstone 22 |
 Blackstone 23 Net Accrued Performance Revenues Net Accrued Performance Revenues are presented net of performance compensation and do not include clawback amounts, if any, which are
disclosed in the 10-K/Q. Net Realized Performance Revenues
are included in DE. Net Realized Performance Revenues above represent Performance Revenues realized, but not yet distributed as of the reporting date and included in the Net Accrued
Performance Revenues balance. When these fees are received, the receivable is
reduced without further impacting DE. Per Unit calculations are based on end of period DE Units Outstanding (see page 34 Unit Rollforward). $3.6 billion Net Accrued Performance Revenues at 1Q’18 $2.99 per unit Net Accrued Performance Revenues at 1Q’18 $537 million Increase to Receivable from Net Performance Revenues in 1Q’18 $280 million Decrease to Receivable from Net Realized Distributions in 1Q’18 Net Accrued Performance Revenues (Dollars in Millions, Except per Unit Data) 4Q'17 1Q'18 1Q'18 Per Unit QoQ Change Private Equity BCP IV 87 $
70
$
0.06 $
(17)
$
BCP
V 73
70 0.06
(3) BCP VI
668 783
0.65 115
BCP VII 16 59
0.05 43
BEP I 95 91
0.08 (4)
BEP II 5 34
0.03 29
Tactical Opportunities 104 138
0.11 34
Strategic Partners 66 81
0.07 15
BTAS 13 19
0.02 6
Other 3 3
- -
Total Private Equity
1,130 $
1,348 $
1.12 $
218
$
Real
Estate BREP IV
9 10
0.01 1
BREP V 203 205
0.17 2
BREP VI 190 184
0.15 (6)
BREP VII 587 606
0.50 19
BREP VIII 255 288
0.24 33
BREP Europe III 67 61
0.05 (6)
BREP Europe IV 207 220
0.18 13
BREP Europe V 25 41
0.03 16
BREP Asia I 102 112
0.09 10
BPP 134 174
0.14 40
BREIT 10 14
0.01 4
BREDS 35 32
0.03 (3)
BTAS 16 25
0.02 9
Total Real Estate 1,840 $
1,972 $
1.62 $
132
$
Total Hedge
Fund Solutions 89
$
19 $
0.02
$
(70)
$
Total
Credit 289
$
266 $
0.22
$
(23)
$
Net Accrued
Performance Revenue 3,348
$
3,605
$
2.99
$
257
$
Memo: Net
Realized Performance Revenues 222
$
50
$
0.04 $
(172) $
|
 Blackstone 24 Investment Records as of March 31, 2018 (a) Continued... (Dollars in Thousands, Except Where Noted) Committed Available Unrealized Investments Realized Investments Total Investments Net IRRs (d) Fund (Investment Period Beginning Date / Ending Date) Capital Capital (b) Value MOIC (c) % Public Value MOIC (c) Value MOIC (c) Realized Total Private Equity BCP I (Oct 1987 / Oct 1993) 859,081 $ - $
- $
n/a - 1,741,738 $ 2.6x 1,741,738 $ 2.6x 19% 19% BCP II (Oct 1993 / Aug 1997) 1,361,100 - - n/a - 3,256,819 2.5x 3,256,819 2.5x 32% 32% BCP III (Aug 1997 / Nov 2002) 3,967,422 - - n/a - 9,184,688 2.3x 9,184,688 2.3x 14% 14% BCOM (Jun 2000 / Jun 2006) 2,137,330 24,575 17,393 1.4x - 2,953,649 1.4x 2,971,042 1.4x 7% 6% BCP IV (Nov 2002 / Dec 2005) 6,773,182 209,294 702,682 0.7x 48% 20,677,725 3.2x 21,380,407 2.8x 42% 36% BCP V (Dec 2005 / Jan 2011) 21,026,008 1,056,606 2,256,174 1.1x 42% 35,892,518 2.0x 38,148,692 1.9x 9% 8% BCP VI (Jan 2011 / May 2016) 15,190,284 1,807,564 16,676,954 1.7x 31% 8,567,871 2.0x 25,244,825 1.8x 22% 14% BEP I (Aug 2011 / Feb 2015) 2,437,617 159,896 2,513,248 1.5x 31% 1,384,179 2.0x 3,897,427 1.6x 29% 12% BEP II (Feb 2015 / Feb 2021) (e) 4,868,538 1,831,339 2,621,584 1.3x - 55,898 2.5x 2,677,482 1.3x n/m 13% BCP VII (May 2016 / May 2022) 18,551,468 12,824,126 5,233,973 1.3x - 282,579 1.1x 5,516,552 1.3x n/m 15% BCP Asia (Dec 2017 /Dec 2023) (f) 1,797,100 1,627,752 103 n/m - - n/a 103 n/m n/a n/m Total Corporate Private Equity 78,969,130 $ 19,541,152 $ 30,022,111 $ 1.4x 24% 83,997,664 $ 2.2x 114,019,775 $ 1.9x 17% 15% Tactical Opportunities 17,551,322 7,729,918 10,003,228 1.2x - 4,653,915 1.7x 14,657,143 1.4x 23% 12% Tactical Opportunities Co-Investment and Other 5,257,448 1,449,306 3,823,716 1.2x - 1,130,175 1.6x 4,953,891 1.2x n/a 15% Strategic Partners I-V and Co-Investment (g) 11,862,592 1,743,623 2,154,396 n/m - 15,360,143 n/m 17,514,539 1.5x n/a 13% Strategic Partners VI LBO, RE and SMA (g) 7,402,171 2,345,359 3,362,791 n/m - 2,540,056 n/m 5,902,847 1.4x n/a 21% Strategic Partners VII (g) 7,669,970 2,685,945 4,204,924 n/m - 281,924 n/m 4,486,848 1.3x n/a 63% Strategic Partners RA II (g) 1,806,807 1,465,246 251,324 n/m - 5,582 n/m 256,906 1.2x n/a n/m BCEP (Jan 2017 / Jan 2021) (h) 4,755,133 3,376,278 1,451,222 1.1x - - n/a 1,451,222 1.1x n/a 4% Other Funds and Co-Investment (i) 1,129,258 513 66,087 0.9x - 639,492 0.9x 705,579 0.9x n/m n/m Real Estate Pre-BREP 140,714 $ - $
- $
n/a - 345,190 $ 2.5x 345,190 $ 2.5x 33% 33% BREP I (Sep 1994 / Oct 1996) 380,708 - - n/a - 1,327,708 2.8x 1,327,708 2.8x 40% 40% BREP II (Oct 1996 / Mar 1999) 1,198,339 - - n/a - 2,531,614 2.1x 2,531,614 2.1x 19% 19% BREP III (Apr 1999 / Apr 2003) 1,522,708 - - n/a - 3,330,406 2.4x 3,330,406 2.4x 21% 21% BREP IV (Apr 2003 / Dec 2005) 2,198,694 - 356,962 0.4x 39% 4,193,319 2.2x 4,550,281 1.7x 35% 12% BREP V (Dec 2005 / Feb 2007) 5,539,418 - 1,757,545 2.0x 30% 11,571,333 2.4x 13,328,878 2.3x 13% 11% BREP VI (Feb 2007 / Aug 2011) 11,060,444 556,442 2,031,419 2.0x 26% 25,400,275 2.6x 27,431,694 2.5x 14% 13% BREP VII (Aug 2011 / Apr 2015) 13,495,014 2,063,162 12,300,534 1.7x 18% 16,197,932 2.1x 28,498,466 1.9x 29% 18% BREP VIII (Apr 2015 / Oct 2020) 16,411,403 8,884,917 10,308,128 1.4x 1% 3,700,071 1.5x 14,008,199 1.4x 28% 17% Total Global BREP 51,947,442 $ 11,504,521 $ 26,754,588 $ 1.5x 13% 68,597,848 $ 2.3x 95,352,436 $ 2.0x 20% 16% BREP Int'l (Jan 2001 / Sep 2005) 824,172 € - € - € n/a - 1,369,016 € 2.1x 1,369,016 € 2.1x 23% 23% BREP Int'l II (Sep 2005 / Jun 2008) (j) 1,629,748 - 178,866 0.7x 24% 2,242,404 2.0x 2,421,270 1.7x 10% 8% BREP Europe III (Jun 2008 / Sep 2013) 3,205,167 454,762 1,402,919 1.5x - 4,965,527 2.5x 6,368,446 2.2x 22% 16% BREP Europe IV (Sep 2013 / Dec 2016) 6,709,008 1,296,578 5,053,183 1.5x 9% 5,855,191 2.0x 10,908,374 1.7x 28% 18% BREP Europe V (Dec 2016 / Jun 2022) 7,855,508 4,494,806 3,571,217 1.2x - 12,559 2.5x 3,583,776 1.2x n/m 20% Total Euro BREP 20,223,603 € 6,246,146 € 10,206,185 € 1.3x 5% 14,444,697 € 2.1x 24,650,882 € 1.7x 18% 14% BREP Asia I (Jun 2013 / Dec 2017) 5,095,494 $ 1,893,763 $ 4,268,941 $ 1.4x - 2,435,863 $ 1.8x 6,704,804 $ 1.5x 23% 17% BREP Asia II (Dec 2017 / Jun 2023) 6,911,267 6,755,702 323,200 1.0x - - n/a 323,200 1.0x n/a n/a BREP Co-Investment (k) 6,892,347 146,573 2,311,814 1.8x 55% 11,510,361 2.1x 13,822,175 2.0x 16% 16% Total BREP 95,605,403 $ 28,073,264 $ 45,861,628 $ 1.5x 12% 101,124,888 $ 2.2x 146,986,516 $ 1.9x 19% 16% BPP (l) 23,755,472 $ 3,425,136 $ 23,531,250 $ 1.2x - 1,947,913 $ n/m 25,479,163 $ 1.2x n/m 12% BREDS (m) 13,242,063 $ 5,244,979 $ 3,094,557 $ 1.1x - 8,872,128 $ 1.3x 11,966,685 $ 1.3x 12% 11% |
 Blackstone 25 Investment Records as of March 31, 2018 (a) – Continued The returns presented herein represent those of the applicable Blackstone Funds and not those of The Blackstone Group L.P.
n/m Not meaningful. n/a Not applicable. (a) Preliminary. (b) Available Capital represents total investable capital commitments, including side-by-side, adjusted for certain expenses and
expired or recallable capital and may include leverage, less
invested capital. This amount is not reduced by outstanding commitments to investments. (c) Multiple of Invested Capital (“MOIC”) represents carrying value, before management fees, expenses and Carried Interest, divided
by invested capital. (d)
Net Internal Rate of Return (“IRR”) represents the annualized inception to March 31, 2018 IRR on total invested capital based on realized proceeds and unrealized value, as applicable, after management fees, expenses and Carried Interest.
(e) Total Net IRR represents the compound annual rate of return based on actual limited partner cash flows and valuations after management fees (excluding management fees funded using its revolving credit facility), expenses and the general partner’s allocation of profits.
Including management fees funded using the revolving credit
facility, BEP II’s Total Net IRR would have been 13%. BEP II’s Realized Net IRR is not meaningful. (f) Includes foreign currency gain or loss on invested undrawn capital, if any.
(g) Realizations are treated as return of capital until fully recovered and therefore unrealized and realized MOICs are not
meaningful. (h)
BCEP, or Blackstone Core Equity Partners, is a core private equity fund which
invests with a more modest risk profile and longer hold period.
(i) Returns for Other Funds and Co-Investment are not meaningful as these funds have limited transaction activity.
(j) The 10% Realized Net IRR and 8% Total Net IRR exclude investors that opted out of the Hilton investment opportunity. Overall BREP
International II performance reflects a 9% Realized Net IRR and a
6% Total Net IRR. (k)
BREP Co-Investment represents co-investment capital raised for various
BREP investments. The Net IRR reflected is calculated by aggregating each co-investment’s realized proceeds and unrealized value, as applicable, after management fees, expenses and Carried Interest.
(l) BPP represents the core+ real estate funds which invest with a more modest risk profile and lower leverage. Excludes BREIT.
(m) Excludes Capital Trust drawdown funds. (n) BSCH, or Blackstone Strategic Capital Holdings, is a permanent capital vehicle focused on acquiring strategic minority positions in alternative asset managers. (o) Funds presented represent the flagship credit drawdown funds only. The Total Credit Net IRR is the combined IRR of the eight credit
drawdown funds presented. (Dollars in Thousands, Except Where
Noted) Committed
Available Unrealized Investments Realized Investments Total Investments Net IRRs (d) Fund (Investment Period Beginning Date / Ending Date) Capital Capital (b) Value MOIC (c) % Public Value MOIC (c) Value MOIC (c) Realized Total Hedge Fund Solutions BSCH (Dec 2013 / Jun 2020) (n) 3,298,575 $ 2,351,974 $ 950,535 $ 1.0x - 246,864 $ n/a 1,197,399 $ 1.3x n/a 6% BSCH Co-Investment 276,000 164,903 104,812 0.9x - 22,953 n/a 127,765 1.1x n/a 11% Total Hedge Fund Solutions 3,574,575 $ 2,516,877 $ 1,055,347 $ 1.0x - 269,817 $ n/a 1,325,164 $ 1.3x n/a 6% Credit (o) Mezzanine I (Jul 2007 / Oct 2011) 2,000,000 $ 97,114 $
44,779 $
0.8x - 4,769,092 $ 1.6x 4,813,871 $ 1.6x n/a 17% Mezzanine II (Nov 2011 / Nov 2016) 4,120,000 1,159,450 2,539,622 1.1x - 3,938,808 1.5x 6,478,430 1.3x n/a 13% Mezzanine III (Sep 2016 / Sep 2021) 6,639,133 4,074,443 2,546,836 1.1x - 548,379 1.5x 3,095,215 1.1x n/a 13% Stressed / Distressed Investing I (Sep 2009 / May 2013) 3,253,143 175,000 382,975 0.6x - 5,541,392 1.5x 5,924,367 1.4x n/a 11% Stressed / Distressed Investing II (Jun 2013 / Jun 2018) 5,125,000 704,060 2,979,367 1.1x - 2,670,978 1.4x 5,650,345 1.2x n/a 13% Stressed / Distressed Investing III (Dec 2017/ Dec 2022) 7,331,130 6,876,354 454,546 1.1x - 10,482 n/a 465,028 1.1x n/a n/a Energy Select Opportunities (Nov 2015 / Nov 2018) 2,856,867 1,382,309 1,583,917 1.2x - 383,558 1.7x 1,967,475 1.2x n/a 19% Euro European Senior Debt Fund (Feb 2015 / Feb 2019) 1,964,689 € 1,636,988 € 1,712,615 € 1.0x - 556,585 € 1.6x 2,269,200 € 1.1x n/a 11% Total Credit 33,591,683 $ 16,482,061 $ 12,638,301 $ 1.1x - 18,496,740 $ 1.5x 31,135,041 $ 1.3x 14% n/a |
 Blackstone 26 Notes on page 28. Reconciliation of GAAP to Non-GAAP Measures – Quarters (Dollars in Thousands) 1Q'16 2Q'16 3Q'16 4Q'16 1Q'17 2Q'17 3Q'17 4Q'17 1Q'18 Net Income Attributable to The Blackstone Group L.P. 160,074 $ 198,444 $ 310,027 $ 370,469 $ 451,909 $ 337,407 $ 377,920 $ 304,138 $ 367,872 $ Net Income Attributable to Non-Controlling Interests in Blackstone Holdings
131,478 201,648 282,798 344,175 409,046 283,637 340,202 359,438 320,208 Net Income Attributable to Non-Controlling Interests in Consolidated Entities
40,086 64,729 82,653 58,684 138,685 112,944 113,446 132,364 155,499 Net Income Attributable to Redeemable Non-Controlling Interests in Consolidated Entities (6,401) (2,049) 10,764 1,663 2,000 991 3,215 7,600 (1,275) Net Income 325,237 $ 462,772 $ 686,242 $ 774,991 $ 1,001,640 $ 734,979 $ 834,783 $ 803,540 $ 842,304 $ Provision for Taxes 9,146 47,415 27,714 48,087 57,437 29,608 59,512 596,590 54,495 Income Before Provision for Taxes 334,383 $ 510,187 $ 713,956 $ 823,078 $ 1,059,077 $ 764,587 $ 894,295 $ 1,400,130 $ 896,799 $ Transaction-Related Charges (a) 64,136 69,956 60,029 70,816 56,979 57,831 55,714 (347,055) 52,489 Amortization of Intangibles (b) 23,208 23,208 22,054 15,996 11,344 11,344 11,344 14,265 14,873 (Income) Associated with Non-Controlling Interests of Consolidated Entities (c) (33,685) (62,680) (93,417) (60,347) (140,685) (113,935) (116,661) (139,964) (154,224) Economic Income 388,042 $ 540,671 $ 702,622 $ 849,543 $ 986,715 $ 719,827 $ 844,692 $ 927,376 $ 809,937 $ (Taxes) (d) (16,794) (21,234) (20,985) (33,250) (18,805) (24,168) (22,552) (36,006) (18,228) Economic Net Income 371,248 $ 519,437 $ 681,637 $ 816,293 $ 967,910 $ 695,659 $ 822,140 $ 891,370 $ 791,709 $ Taxes (d) 16,794 21,234 20,985 33,250 18,805 24,168 22,552 36,006 18,228 Performance Revenues Adjustment (e) (315,414) (448,158) (663,108) (750,456) (1,034,381) (739,106) (877,932) (1,060,401) (910,547) Principal Investment Income Adjustment (f) 26,650 (59,771) (87,887) (99,282) (103,959) (67,720) (77,572) (55,737) (42,671) Other Revenue (g) 6,248 (8,546) 425 (52,839) 8,287 62,469 34,144 35,151 60,894 Net Interest Loss (h) 13,351 13,546 14,184 10,542 10,954 6,591 2,864 29,509 1,853 Performance Compensation and Benefits Adjustment (i) 106,827 179,848 263,224 317,679 396,476 303,680 356,371 434,511 373,159 Equity-Based Compensation - Non-Performance Compensation Related (j) 20,963 16,852 16,624 19,308 26,650 25,442 24,141 17,177 40,248 Fee Related Earnings 246,667 $ 234,442 $ 246,084 $ 294,495 $ 290,742 $ 311,183 $ 306,708 $ 327,586 $ 332,873 $ Net Realized Performance Revenues (k) 187,794 251,935 352,008 327,053 772,780 429,177 293,339 948,412 167,384 Realized Principal Investment Income (l) (10,101) 53,670 60,634 95,666 202,894 100,887 60,188 72,225 28,693 Net Interest (Loss) (h) (13,351) (13,546) (14,184) (10,542) (10,954) (6,591) (2,864) (29,509) (1,853) Taxes and Related Payables Including Payable Under Tax Receivable Agreement (m)
(16,794) (31,588) (51,089) (67,678) (25,324) (53,291) (31,805) (79,568) (25,042) Distributable Earnings 394,215 $ 494,913 $ 593,453 $ 638,994 $ 1,230,138 $ 781,365 $ 625,566 $ 1,239,146 $ 502,055 $ Interest Expense (n) 36,497 36,020 36,419 39,086 39,450 40,294 40,749 72,345 38,238 Taxes and Related Payables Including Payable Under Tax Receivable Agreement (m)
16,794 31,588 51,089 67,678 25,324 53,291 31,805 79,568 25,042 Depreciation and Amortization 6,292 6,331 7,338 12,010 6,216 6,392 6,027 6,593 6,251 Adjusted EBITDA 453,798 $ 568,852 $ 688,299 $ 757,768 $ 1,301,128 $ 881,342 $ 704,147 $ 1,397,652 $ 571,586 $ |
 Blackstone 27 Notes on page 28. Reconciliation of GAAP to Non-GAAP Measures – Years (Dollars in Thousands) 2013 2014 2015 2016 2017 1Q'17 LTM 1Q'18 LTM Net Income Attributable to The Blackstone Group L.P. 1,175,346 $ 1,588,827 $ 713,188 $ 1,039,014 $ 1,471,374 $ 1,330,849 $ 1,387,337 $ Net Income Attributable to Non-Controlling Interests in Blackstone Holdings
1,343,874 1,705,001 686,529 960,099 1,392,323 1,237,667 1,303,485 Net Income Attributable to Non-Controlling Interests in Consolidated Entities
198,557 335,070 219,900 246,152 497,439 344,751 514,253 Net Income Attributable to Redeemable Non-Controlling Interests in Consolidated Entities 183,315 74,794 11,145 3,977 13,806 12,378 10,531 Net Income 2,901,092 $ 3,703,692 $ 1,630,762 $ 2,249,242 $ 3,374,942 $ 2,925,645 $ 3,215,606 $ Provision for Taxes 255,642 291,173 190,398 132,362 743,147 180,653 740,205 Income Before Provision for Taxes 3,156,734 $ 3,994,865 $ 1,821,160 $ 2,381,604 $ 4,118,089 $ 3,106,298 $ 3,955,811 $ Transaction-Related Charges (a) 722,707 856,382 489,563 264,937 (176,531) 257,780 (181,021) Amortization of Intangibles (b) 106,643 111,254 104,530 84,466 48,297 72,602 51,826 (Income) Associated with Non-Controlling Interests of Consolidated Entities (c) (381,872) (409,864) (231,045) (250,129) (511,245) (357,129) (524,784) Economic Income 3,604,212 $ 4,552,637 $ 2,184,208 $ 2,480,878 $ 3,478,610 $ 3,079,551 $ 3,301,832 $ (Taxes) (d) (82,164) (199,512) (27,527) (92,263) (101,531) (94,274) (100,954) Economic Net Income 3,522,048 $ 4,353,125 $ 2,156,681 $ 2,388,615 $ 3,377,079 $ 2,985,277 $ 3,200,878 $ Taxes (d) 82,164 199,512 27,527 92,263 101,531 94,274 100,954 Performance Revenues Adjustment (e) (3,573,819) (4,408,748) (1,810,253) (2,177,136) (3,711,820) (2,896,103) (3,587,986) Principal Investment Income Adjustment (f) (687,805) (471,628) (52,849) (220,290) (304,988) (350,899) (243,700) Other Revenue (g) (10,308) (9,405) (8,500) (54,712) 140,051 (52,673) 192,658 Net Interest Loss (h) 32,968 36,511 44,181 51,623 49,918 49,226 40,817 Performance Compensation and Benefits Adjustment (i) 1,422,455 1,294,235 570,324 867,578 1,491,038 1,157,227 1,467,721 Equity-Based Compensation - Non-Performance Compensation Related (j) 130,124 45,133 96,901 73,747 93,410 79,434 107,008 Fee Related Earnings 917,827 $ 1,038,735 $ 1,024,012 $ 1,021,688 $ 1,236,219 $ 1,065,763 $ 1,278,350 $ Net Realized Performance Revenues (k) 960,175 1,789,692 2,527,019 1,118,790 2,443,708 1,703,776 1,838,312 Realized Principal Investment Income (l) 170,471 543,425 418,808 199,869 436,194 412,864 261,993 Net Interest (Loss) (h) (32,968) (36,511) (44,181) (51,623) (49,918) (49,226) (40,817) Taxes and Related Payables Including Payable Under Tax Receivable Agreement (m)
(156,734) (280,788) (90,470) (167,149) (189,988) (175,679) (189,706) Distributable Earnings 1,858,771 $ 3,054,553 $ 3,835,188 $ 2,121,575 $ 3,876,215 $ 2,957,498 $ 3,148,132 $ Interest Expense (n) 103,904 112,563 139,842 148,022 192,838 150,975 191,626 Taxes and Related Payables Including Payable Under Tax Receivable Agreement (m)
156,734 280,788 90,470 167,149 189,988 175,679 189,706 Depreciation and Amortization 35,441 32,300 27,213 31,971 25,228 31,895 25,263 Adjusted EBITDA 2,154,850 $ 3,480,204 $ 4,092,713 $ 2,468,717 $ 4,284,269 $ 3,316,047 $ 3,554,727 $ |
 Blackstone 28 Reconciliation of GAAP to Non-GAAP Measures – Notes Note: See page 35, Definitions and Distribution Policy. (a) This adjustment adds back to Income (Loss) Before Provision (Benefit) for Taxes amounts for Transaction-Related Charges which include
principally equity-based compensation charges associated with
Blackstone’s initial public offering and certain long-term retention programs outside of annual deferred compensation, adjustments to the Tax Receivable Agreement Liability and other corporate actions.
(b) This adjustment adds back to Income (Loss) Before Provision (Benefit) for Taxes amounts for the Amortization of Intangibles which are
associated with Blackstone’s initial public offering and
other corporate actions. (c)
This adjustment adds back to Income (Loss) Before Provision (Benefit) for Taxes
the amount of (Income) Loss Associated with Non-Controlling
Interests of Consolidated Entities.
(d) Taxes represent the total GAAP tax provision adjusted to include only the current tax provision (benefit) calculated on Income (Loss)
Before Provision for Taxes and adjusted to exclude the tax impact
on any divestitures. (e)
This adjustment removes from EI the total segment amount of Performance
Revenues, comprised of Incentive Fees and Performance
Allocations. (f) This adjustment removes from EI the total segment amount of Principal Investment Income (Loss).
(g) This adjustment removes from EI the total segment amount of Other Revenue.
(h) This adjustment represents Interest Income and Dividend Revenue less Interest Expense.
(i) This adjustment removes from expenses the compensation and benefit amounts related to Blackstone’s profit sharing plans related to
Performance Revenues, including Performance Compensation Related
equity-based award expense. (j)
Represents Non-Performance Compensation Related equity-based award
expense and excludes all transaction-related equity-based charges. (k) Represents the adjustment for realized Performance Revenues net of corresponding actual amounts due under Blackstone’s profit
sharing plans related thereto.
(l) Represents the adjustment for Blackstone’s Realized Principal Investment Income (Loss).
(m) Taxes and Related Payables Including Payable Under Tax Receivable Agreement represent the total GAAP tax provision adjusted to include only the current tax provision (benefit) calculated on Income (Loss) Before Provision for Taxes and to exclude the tax impact on any
divestitures and the Payable Under Tax Receivable
Agreement. (n)
Represents Total Segment Interest Expense.
|
 Blackstone 29 (Dollars in Thousands) 1Q'17 2Q'17 3Q'17 4Q'17 1Q'18 1Q'17 LTM 1Q'18 LTM Management and Advisory Fees, Net GAAP 645,484 $
690,857 $
685,922 $
729,059 $
728,849 $
2,497,356 $ 2,834,687 $ Consolidation and Elimination Adjustment (a) 4,097 5,979 6,060 3,333 7,195 2,017 22,567 Total Segment 649,581 $
696,836 $
691,982 $
732,392 $
736,044 $
2,499,373 $ 2,857,254 $ Performance Revenue GAAP Incentive Fees 46,511 40,303 35,513 120,187 12,566 168,432 208,569 Investment Income - Realized Performance Allocations
1,111,905 602,662 434,982 1,422,262 269,640 2,376,023 2,729,546 Investment Income - Unrealized Performance Allocations
(124,621) 95,532 406,649 (483,033) 628,089 348,981 647,237 GAAP 1,033,795 $ 738,497 $
877,144 $
1,059,416 $ 910,295 $
2,893,436 $ 3,585,352 $ Elimination Adjustment (b) 586 609
788 985
252 2,667
2,634
Total
Segment 1,034,381
$
739,106
$
877,932
$
1,060,401
$
910,547
$
2,896,103
$
3,587,986
$
Principal Investment Income
GAAP Investment Income - Realized Principal Investment Income 251,344 125,058 74,805 184,562 42,145 542,082 426,570 Investment Income - Unrealized Principal Investment Income
(40,188) 7,275 96,085 (20,567) 111,774 33,633 194,567 GAAP 211,156 $
132,333 $
170,890 $
163,995 $
153,919 $
575,715 $
621,137 $
Consolidation and Elimination Adjustment (c)
(107,197) (64,613) (93,318) (108,258) (111,248) (224,816) (377,437) Total Segment 103,959 $
67,720 $
77,572 $
55,737 $
42,671 $
350,899 $
243,700 $
Interest, Dividend and Other Revenue
GAAP Interest and Dividend Revenue 28,495 33,703 36,974 40,524 35,385 101,144 146,586 Other (4,212) (59,664) (35,572) (33,781) (59,317) 56,153 (188,334) GAAP 24,283 $
(25,961) $
1,402 $
6,743 $
(23,932) $
157,297 $
(41,748) $
Consolidation and Elimination Adjustment (d)
(4,074) (2,805) 2,339 942 (577)
(2,875) (101) Total Segment
20,209 $
(28,766) $
3,741 $
7,685 $
(24,509) $
154,422 $
(41,849) $
Total Revenues GAAP 1,914,718 $ 1,535,726 $ 1,735,358 $ 1,959,213 $ 1,769,131 $ 6,123,804 $ 6,999,428 $ Consolidation and Elimination Adjustment (e) (106,588) (60,830) (84,131) (102,998) (104,378) (223,007) (352,337) Total Segment 1,808,130 $ 1,474,896 $ 1,651,227 $ 1,856,215 $ 1,664,753 $ 5,900,797 $ 6,647,091 $ Compensation GAAP 351,589 $
367,203 $
359,209 $
364,484 $
389,403 $
1,340,994 $ 1,480,299 $ Consolidation Adjustment (f) (62,562) (61,946) (56,411) (58,450) (53,076) (256,154) (229,883) Total Segment 289,027 $
305,257 $
302,798 $
306,034 $
336,327 $
1,084,840 $ 1,250,416 $ Notes on page 30. Continued... Reconciliation of GAAP to Total Segment Measures |
 Blackstone 30 This analysis reconciles the summarized components of Total Segments (pages 5-9) to their respective Total Segment amounts (page 15) and to their equivalent GAAP measures, reported on the Consolidated Statements of Operations (page 1). (a) Represents (1) the add back of management fees earned from consolidated Blackstone Funds which have been eliminated in consolidation, and
(2) the removal of revenue representing the reimbursement of certain expenses by Blackstone Funds, which are presented gross under GAAP but netted against Other Operating Expenses in the segments.
(b) Represents the add back of performance revenues earned from consolidated Blackstone Funds which have been eliminated in
consolidation. (c)
Represents (1) the add back of investment income, including general partner
income, earned from consolidated Blackstone Funds which have been eliminated in consolidation, and (2) the inclusion of investment income on non- consolidated Blackstone Funds which in GAAP is recorded as Other Income (Loss) - Net Gains (Losses) from Fund Investment Activities. (d) Represents (1) the add back of other revenues earned from consolidated Blackstone Funds which have been eliminated in consolidation, and
(2) the removal of certain transaction-related amounts.
(e) Represents the total consolidation and elimination adjustments for Total Revenues.
(f) Represents transaction-based equity compensation that is not recorded in the segments.
(g) Represents interest expense associated with the Tax Receivable Agreement.
(h) Represents the removal of (1) the amortization of transaction based intangibles, and (2) expenses reimbursed by Blackstone Funds, which
are presented gross under GAAP but netted against Other Operating Expenses in the segments. (i) Represents (1) the reversal of Fund Expenses, which are attributable to consolidated Blackstone Funds and not a component of the
segments, and (2) total consolidation and elimination adjustments for Total Expenses. (j) Represents the inclusion of Other Income (Loss) which is included in GAAP but not as a component of the segments.
(k) Represents the total consolidation and elimination adjustments between GAAP and Total Segment results.
Reconciliation of GAAP to Total Segment Measures – Continued (Dollars in Thousands) 1Q'17 2Q'17 3Q'17 4Q'17 1Q'18 1Q'17 LTM 1Q'18 LTM Performance Compensation GAAP Incentive Fee Compensation 22,465 $
21,032 $
18,332 $
43,450 $
6,662 $
77,601 $
89,476 $
Performance Allocations Compensation - Realized
366,478 195,738 162,505 557,244 112,062 772,766 1,027,549 Performance Allocations Compensation - Unrealized
7,533 86,910 175,534 (166,183) 254,435 306,860 350,696 GAAP 396,476 $
303,680 $
356,371 $
434,511 $
373,159 $
1,157,227 $ 1,467,721 $ Total Segment 396,476 $
303,680 $
356,371 $
434,511 $
373,159 $
1,157,227 $ 1,467,721 $ Interest Expense GAAP 40,246 $
41,089 $
41,545 $
74,606 $
38,671 $
155,544 $
195,911 $
Consolidation Adjustment (g)
(796) (795)
(796) (2,261)
(433)
(4,569) (4,285) Total Segment 39,450 $
40,294 $
40,749 $
72,345 $
38,238 $
150,975 $
191,626 $
GAAP General, Administrative and Other to Total Segment Other Operating
Expenses GAAP
109,386 $
119,552 $
121,036 $
138,608 $
126,713 $
524,453 $
505,909 $
Consolidation and Elimination Adjustment (h)
(12,924) (13,714) (14,419) (22,659) (19,621) (96,249) (70,413) Total Segment 96,462 $
105,838 $
106,617 $
115,949 $
107,092 $
428,204 $
435,496 $
Total Expenses GAAP 921,773 $
881,193 $
904,511 $
1,044,901 $ 982,931 $
3,249,246 $ 3,813,536 $ Less: GAAP Fund Expenses (i) (24,076) (49,669) (26,350) (32,692) (54,985) (71,028) (163,696) Consolidation and Elimination Adjustment (i)
(76,282) (76,455) (71,626) (83,370) (73,130) (356,972) (304,581) Total Segment 821,415 $
755,069 $
806,535 $
928,839 $
854,816 $
2,821,246 $ 3,345,259 $ GAAP Income Before Provision for Taxes to Total Segment Economic Income GAAP Revenues Less Expenses 992,945 654,533 830,847 914,312 786,200 2,874,558 3,185,892 Other Income (j)
66,132 110,054 63,448 485,818 110,599 231,740 769,919 GAAP 1,059,077 $ 764,587 $
894,295 $
1,400,130 $ 896,799 $
3,106,298 $ 3,955,811 $ Consolidation and Elimination Adjustment (k) (72,362) (44,760) (49,603) (472,754) (86,862) (26,747) (653,979) Total Segment 986,715 $
719,827 $
844,692 $
927,376 $
809,937 $
3,079,551 $ 3,301,832 $ |
 Walkdown of Financial Metrics
(Dollars in Thousands, Except per Unit Data)
1Q'18 1Q'18 LTM Results Per Unit Results Per Unit Management and Advisory Fees, Net 736,044 $
2,857,254 $ Fee Related Compensation (296,079) (1,143,408) Other Operating Expenses (107,092) (435,496) Fee Related Earnings 332,873 $
0.28 $
1,278,350 $ 1.07 $
Net Realized Performance Revenues
167,384 1,838,312 Realized Principal Investment Income 28,693 261,993 Net Interest (Loss) (1,853) (40,817) Taxes and Related Payables (25,042) (189,706) Distributable Earnings 502,055 $
0.41 $
3,148,132 $ 2.56 $
Net Unrealized Performance Revenues
373,904 296,289 Unrealized Principal Investment Income 13,978 (18,293) Other Revenue (60,894) (192,658) Add Back: Related Payables 6,814 88,752 Less: Equity-Based Compensation (44,148) (121,344) Economic Net Income 791,709 $
0.65 $
3,200,878 $ 2.65 $
Blackstone
31
See pages 32 and 33, Walkdown of Financial Metrics – Calculation of
Certain Non-GAAP Financial Metrics for the calculation of the amounts presented herein that are not the respective captions on page 15, Total Segments. 1Q’18 Fee Related Earnings per Unit is based on end of period DE Units Outstanding; 1Q’18 DE per Unit is based on DE
attributable to Common Unitholders (see page 20, Unitholder Distribution) and end of period Total Common Units Outstanding; and 1Q’18 ENI per Unit is based on Weighted-Average ENI Adjusted Units. 1Q’18 LTM
per Unit represents the sum of the last four quarters. See page 34, Unit Rollforward. |
 Blackstone 32 (Dollars in Thousands) 1Q'16 2Q'16 3Q'16 4Q'16 1Q'17 2Q'17 3Q'17 4Q'17 1Q'18 Compensation (287,403) $ (286,155) $ (268,595) $ (241,063) $ (289,027) $ (305,257) $ (302,798) $ (306,034) $ (336,327) $ Less: Equity-Based Compensation - Non-Performance Compensation Related (a)
20,963 16,852 16,624 19,308 26,650 25,442 24,141 17,177 40,248 Fee Related Compensation (266,440) $ (269,303) $ (251,971) $ (221,755) $ (262,377) $ (279,815) $ (278,657) $ (288,857) $ (296,079) $ Realized Incentive Fees 28,007 29,231 26,992 66,811 46,511 40,303 35,513 122,057 12,566 Realized Performance Allocations 231,352 323,866 507,325 433,432 1,111,948 603,096 434,994 1,422,830 269,642 Less: Realized Incentive Fees Compensation (13,785) (14,763) (13,003) (27,370) (22,465) (21,032) (18,332) (43,450) (6,662) Less: Realized Performance Allocations Compensation (58,841) (88,069) (170,860) (147,359) (366,478) (195,738) (162,505) (557,244) (112,062) Plus: Equity-Based Compensation - Performance Compensation Related (a)
1,061 1,670 1,554 1,539 3,264 2,548 3,669 4,219 3,900 Net Realized Performance Revenues 187,794 $ 251,935 $ 352,008 $ 327,053 $ 772,780 $ 429,177 $ 293,339 $ 948,412 $ 167,384 $ Interest Income and Dividend Revenue 23,146 22,474 22,235 28,544 28,496 33,703 37,885 42,836 36,385 Less: Interest Expense (36,497) (36,020) (36,419) (39,086) (39,450) (40,294) (40,749) (72,345) (38,238) Net Interest (Loss) (13,351) $ (13,546) $ (14,184) $ (10,542) $ (10,954) $ (6,591) $ (2,864) $ (29,509) $ (1,853) $ Taxes and Related Payables (b) (16,794) $ (31,588) $ (51,089) $ (67,678) $ (25,324) $ (53,291) $ (31,805) $ (79,568) $ (25,042) $ Unrealized Performance Allocations 56,055 95,061 128,791 250,213 (124,078) 95,707 407,425 (484,486) 628,339 Less: Unrealized Performance Allocations Compensation (34,201) (77,016) (79,361) (142,950) (7,533) (86,910) (175,534) 166,183 (254,435) Net Unrealized Performance Revenues 21,854 $ 18,045 $ 49,430 $ 107,263 $ (131,611) $ 8,797 $ 231,891 $ (318,303) $ 373,904 $ Related Payables (c) - $ 10,354 $ 30,104 $ 34,428 $ 6,519 $ 29,123 $ 9,253 $ 43,562 $ 6,814 $ Equity-Based Compensation - Non-Performance Compensation Related (a)
20,963 16,852 16,624 19,308 26,650 25,442 24,141 17,177 40,248 Plus: Equity-Based Compensation - Performance Compensation Related (a)
1,061 1,670 1,554 1,539 3,264 2,548 3,669 4,219 3,900 Equity-Based Compensation 22,024 $ 18,522 $ 18,178 $ 20,847 $ 29,914 $ 27,990 $ 27,810 $ 21,396 $ 44,148 $ Walkdown of Financial Metrics – Calculation of Non-GAAP Financial Metrics – Quarters Unless otherwise noted, all amounts are the respective captions from the Total Segment information.
(a) Represents equity-based award expense included in Economic Income, which excludes all transaction-related equity-based
charges. (b)
See page 26, Reconciliation of GAAP to Non-GAAP Measures – Quarters for this adjustment. (c) Represents tax-related payables including the Payable Under Tax Receivable Agreement, which is a component of Taxes and Related
Payables. |
 Blackstone 33 Walkdown of Financial Metrics – Calculation of Non-GAAP Financial Metrics – Years Unless otherwise noted, all amounts are the respective captions from the Total Segment information.
(a) Represents equity-based award expense included in Economic Income, which excludes all transaction-related equity-based
charges. (b)
See page 27, Reconciliation of GAAP to Non-GAAP Measures – Years for this adjustment. (c) Represents tax-related payables including the Payable Under Tax Receivable Agreement, which is a component of Taxes and Related
Payables. (Dollars in Thousands)
2013 2014 2015 2016 2017 1Q'17 LTM 1Q'18 LTM Compensation (1,115,640) $ (1,153,511) $ (1,189,219) $ (1,083,216) $ (1,203,116) $ (1,084,840) $ (1,250,416) $ Less: Equity-Based Compensation - Non-Performance Compensation Related (a)
130,124 45,133 96,901 73,747 93,410 79,434 107,008 Fee Related Compensation (985,516) $ (1,108,378) $ (1,092,318) $ (1,009,469) $ (1,109,706) $ (1,005,406) $ (1,143,408) $ Realized Incentive Fees 231,000 173,106 168,554 151,041 244,384 169,545 210,439 Realized Performance Allocations 1,187,291 2,539,235 3,232,068 1,495,975 3,572,868 2,376,571 2,730,562 Less: Realized Incentive Fees Compensation (102,149) (78,271) (77,291) (68,921) (105,279) (77,601) (89,476) Less: Realized Performance Allocations Compensation (355,967) (847,471) (802,455) (465,129) (1,281,965) (772,766) (1,027,549) Plus: Equity-Based Compensation - Performance Compensation Related (a)
- 3,093 6,143 5,824 13,700 8,027 14,336 Net Realized Performance Revenues
960,175 $ 1,789,692 $ 2,527,019 $ 1,118,790 $ 2,443,708 $ 1,703,776 $ 1,838,312 $ Interest Income and Dividend Revenue 70,936 76,052 95,661 96,399 142,920 101,749 150,809 Less: Interest Expense (103,904) (112,563) (139,842) (148,022) (192,838) (150,975) (191,626) Net Interest (Loss) (32,968) $ (36,511) $ (44,181) $ (51,623) $ (49,918) $ (49,226) $ (40,817) $ Taxes and Related Payables (b) (156,734) $ (280,788) $ (90,470) $ (167,149) $ (189,988) $ (175,679) $ (189,706) $ Unrealized Performance Allocations 2,155,528 1,696,407 (1,590,369) 530,120 (105,432) 349,987 646,985 Less: Unrealized Performance Allocations Compensation (964,339) (368,493) 309,422 (333,528) (103,794) (306,860) (350,696) Net Unrealized Performance Revenues 1,191,189 $ 1,327,914 $ (1,280,947) $ 196,592 $ (209,226) $ 43,127 $ 296,289 $ Related Payables (c) 74,570 $ 81,276 $ 62,943 $ 74,886 $ 88,457 $ 81,405 $ 88,752 $ Equity-Based Compensation - Non-Performance Compensation Related (a)
130,124 45,133 96,901 73,747 93,410 79,434 107,008 Plus: Equity-Based Compensation - Performance Compensation Related (a)
- 3,093 6,143 5,824 13,700 8,027 14,336 Equity-Based Compensation
130,124 $ 48,226 $ 103,044 $ 79,571 $ 107,110 $ 87,461 $ 121,344 $ |
 Blackstone 34 Unit Rollforward Common Unitholders receive tax benefits from deductions taken by Blackstone’s corporate tax paying subsidiaries and bear
responsibility for the deduction from Distributable Earnings of
the Payable Under Tax Receivable Agreement and certain other tax-related
payables. Distributable Earnings Units Outstanding excludes units which are not entitled to distributions. 1Q'17 2Q'17 3Q'17 4Q'17 1Q'18 Total GAAP Weighted-Average Common Units Outstanding - Basic 660,939,708 664,681,299 667,384,727 668,781,321 674,479,140 Adjustments: Weighted-Average Unvested Deferred Restricted Common Units 809,184 998,974 663,474 702,960 198,934 Weighted-Average Blackstone Holdings Partnership Units 537,758,091 534,326,066 532,454,091 - 535,895,780 Total GAAP Weighted-Average Units Outstanding - Diluted 1,199,506,983 1,200,006,339 1,200,502,292 669,484,281 1,210,573,854 Adjustments: Weighted-Average Blackstone Holdings Partnership Units - - - 531,139,507 - Weighted-Average Economic Net Income Adjusted Units
1,199,506,983 1,200,006,339 1,200,502,292 1,200,623,788 1,210,573,854 Economic Net Income Adjusted Units, End of Period 1,199,565,618 1,199,890,628 1,200,559,970 1,200,553,187 1,210,853,058 Total Common Units Outstanding 661,126,963 665,503,840 667,027,762 668,733,356 676,168,743 Adjustments: Blackstone Holdings Partnership Units 535,206,716 530,678,056 532,235,827 530,472,212 528,967,264 Distributable Earnings Units Outstanding 1,196,333,679 1,196,181,896 1,199,263,589 1,199,205,568 1,205,136,007 |
 Blackstone 35 Definitions and Distribution Policy Blackstone discloses the following financial measures that are calculated and presented on the basis of methodologies other than in accordance with generally accepted accounting principles in the United States of America (“non-GAAP”) in this presentation:
• Blackstone uses Economic Income, or “EI”, as a key measure of value creation, a benchmark of its performance and in making
resource deployment and compensation decisions across its four
segments. EI represents segment net income before taxes excluding transaction-related charges. Transaction-related charges arise from Blackstone’s initial public offering (“IPO”) and certain long-term retention programs outside of
annual deferred compensation and other corporate actions,
including acquisitions. Transaction-related charges include certain equity-based compensation charges, the amortization of intangible assets and contingent consideration associated with acquisitions. EI presents revenues and expenses on a basis that deconsolidates the
investment funds Blackstone manages.
• Economic Net Income, or “ENI”, represents EI adjusted to include current period taxes. Taxes represent the total GAAP tax
provision adjusted to include only the current tax provision
(benefit) calculated on Income (Loss) Before Provision for Taxes and adjusted to exclude the tax impact of any divestitures. • Performance Revenues collectively refers to: (a) Realized Incentive Fees, and (b) Performance Allocations. Performance Compensation
collectively refers to the related compensation and benefit
amounts for: (a) Realized Incentive Fees Compensation, and (b) Performance Allocations. • Blackstone uses Fee Related Earnings, or “FRE”, which is derived from EI, as a measure to highlight earnings from operations
excluding: (a) the income related to
performance revenue and related performance compensation, (b) income earned from Blackstone’s investments in the Blackstone Funds, (c) net interest income (loss), (d) equity-based compensation, and (e) Other Revenue. Blackstone uses FRE as a measure to assess whether recurring
revenue from its businesses
is sufficient to adequately cover all of its operating expenses and generate profits. FRE equals contractual management fee revenues less (a) compensation expenses (which excludes amortization of equity-based awards, and Performance Compensation), and (b) other operating
expenses. •
Distributable Earnings, or “DE”, which is derived from
Blackstone’s segment reported results, is a supplemental measure to assess performance and amounts available for distributions to Blackstone unitholders, including Blackstone personnel and others who are limited partners of the Blackstone Holdings partnerships. DE is intended to show the amount of net realized earnings without the effects of the consolidation of the Blackstone
Funds. DE, which is a component of ENI, is the sum across all
segments of: (a) Total Management, Advisory and Other Fees, Net, (b) Interest and Dividend Revenue, (c) Realized Incentive Fees, (d) Realized Performance Allocations, and (e) Realized Principal Investment Income (Loss); less (a) Compensation, excluding the expense of
equity-based
awards, (b) Realized Incentive Fee Compensation, (c) Realized Performance Allocations Compensation, (d) Interest Expense, (e) Other Operating Expenses, and (f) Taxes and Related Payables Under the Tax Receivable Agreement. DE is reconciled to Blackstone’s Consolidated
Statement of Operations. •
Blackstone uses Adjusted Earnings Before Interest, Taxes and Depreciation and
Amortization, or “Adjusted EBITDA”, as a supplemental non-GAAP measure derived from segment reported results and may be used to assess its ability to service its borrowings. Adjusted EBITDA represents DE plus
the addition of (a)
Interest Expense, (b) Taxes and Related Payables Including Payable Under Tax
Receivable Agreement, and (c) Depreciation and Amortization.
Distribution Policy. Blackstone’s intention is to distribute quarterly to common unitholders approximately 85% of The Blackstone Group L.P.’s share of Distributable Earnings, subject to adjustment by amounts determined by Blackstone’s general partner to be necessary or appropriate
to provide for the conduct
of its business, to make appropriate investments in its business and funds, to comply with applicable law, any of its debt instruments or other agreements, or to provide for future cash requirements such as tax-related payments, clawback obligations and distributions to
unitholders for any ensuing quarter. The amount to be distributed
could also be adjusted upward in any one quarter. All of the foregoing is subject to the qualification that the declaration and payment of any distributions are at the sole discretion of Blackstone’s general partner and may change its distribution policy
at any time, including, without limitation, to eliminate such
distributions entirely. |
 Blackstone 36 Forward-Looking Statements This presentation may contain forward-looking statements within the meaning of Section 27A of the Securities Act of 1933 and
Section 21E of the Securities Exchange Act of 1934 which reflect
Blackstone’s current views with respect to, among other things,
Blackstone’s operations, financial performance and unit repurchase and
distribution activities. You can identify these forward-looking
statements by the use of words such as “outlook,”
“indicator,” “believes,” “expects,” “potential,” “continues,” “may,” “will,” “should,” “seeks,” “approximately,” “predicts,” “intends,” “plans,” “estimates,”
“anticipates” or the negative version of these words or other comparable words. Such forward-looking statements are subject to various risks and uncertainties. Accordingly, there are or will
be important factors that could cause actual
outcomes or
results to differ materially from those indicated in these statements. Blackstone believes these factors include but are not limited to those described under the section entitled “Risk Factors” in its Annual
Report on Form 10-K for the fiscal year ended December 31, 2017, as such
factors may be updated from time to time in its periodic filings
with the Securities and Exchange Commission, which are accessible on the SEC’s website at www.sec.gov. These factors should not be construed as exhaustive and should be read in conjunction with the other cautionary statements that are included in this
presentation and in the filings. Blackstone undertakes no
obligation to publicly update or review any forward-looking statement, whether as a result of new information, future developments or otherwise.
This presentation does not constitute an offer of any Blackstone
Fund. |