Attached files
| file | filename |
|---|---|
| EX-32.2 - EX-32.2 - Blackstone Group Inc | d377864dex322.htm |
| EX-32.1 - EX-32.1 - Blackstone Group Inc | d377864dex321.htm |
| EX-31.2 - EX-31.2 - Blackstone Group Inc | d377864dex312.htm |
| EX-31.1 - EX-31.1 - Blackstone Group Inc | d377864dex311.htm |
| EX-10.1 - EX-10.1 - Blackstone Group Inc | d377864dex101.htm |
Table of Contents
UNITED STATES
SECURITIES AND EXCHANGE COMMISSION
WASHINGTON, D.C. 20549
FORM 10-Q
(Mark One)
| ☒ | QUARTERLY REPORT PURSUANT TO SECTION 13 OR 15(d) OF THE SECURITIES EXCHANGE ACT OF 1934 FOR THE QUARTERLY PERIOD ENDED MARCH 31, 2017 |
OR
| ☐ | TRANSITION REPORT PURSUANT TO SECTION 13 OR 15(d) OF THE SECURITIES EXCHANGE ACT OF 1934 FOR THE TRANSITION PERIOD FROM TO |
Commission File Number: 001-33551

The Blackstone Group L.P.
(Exact name of Registrant as specified in its charter)
| Delaware | 20-8875684 | |
| (State or other jurisdiction of incorporation or organization) |
(I.R.S. Employer Identification No.) |
345 Park Avenue
New York, New York 10154
(Address of principal executive offices)(Zip Code)
(212) 583-5000
(Registrant’s telephone number, including area code)
Indicate by check mark whether the Registrant (1) has filed all reports required to be filed by Section 13 or 15(d) of the Securities Exchange Act of 1934 during the preceding 12 months (or for such shorter period that the Registrant was required to file such reports), and (2) has been subject to such filing requirements for the past 90 days. Yes ☒ No ☐
Indicate by check mark whether the registrant has submitted electronically and posted on its corporate Web site, if any, every Interactive Data File required to be submitted and posted pursuant to Rule 405 of Regulation S-T (§232.405 of this chapter) during the preceding 12 months (or for such shorter period that the registrant was required to submit and post such files). Yes ☒ No ☐
Indicate by check mark whether the Registrant is a large accelerated filer, an accelerated filer, a non-accelerated filer, a smaller reporting company, or an emerging growth company. See the definitions of “large accelerated filer,” “accelerated filer,” “smaller reporting company,” and “emerging growth company” in Rule 12b-2 of the Exchange Act.
| Large accelerated filer ☒ |
Accelerated filer ☐ | |
| Non-accelerated filer ☐ |
Smaller reporting company ☐ | |
| (Do not check if a smaller reporting company) |
Emerging growth company ☐ |
If an emerging growth company, indicate by check mark if the registrant has elected not to use the extended transition period for complying with any new or revised financial accounting standards provided pursuant to Section 13(a) of the Exchange Act. ☐
Indicate by check mark whether the Registrant is a shell company (as defined in Rule 12b-2 of the Exchange Act). Yes ☐ No ☒
The number of the Registrant’s voting common units representing limited partner interests outstanding as of May 3, 2017 was 609,204,345. The number of the Registrant’s non-voting common units representing limited partner interests outstanding as of May 3, 2017 was 37,538,435.
Table of Contents
| Page | ||||||
| PART I. | ||||||
| ITEM 1. | 5 | |||||
| Unaudited Condensed Consolidated Financial Statements — March 31, 2017 and 2016: |
||||||
| Condensed Consolidated Statements of Financial Condition as of March 31, 2017 and December 31, 2016 |
5 | |||||
| Condensed Consolidated Statements of Operations for the Three Months Ended March 31, 2017 and 2016 |
7 | |||||
| 8 | ||||||
| 9 | ||||||
| Condensed Consolidated Statements of Cash Flows for the Three Months Ended March 31, 2017 and 2016 |
11 | |||||
| 13 | ||||||
| ITEM 1A. | UNAUDITED SUPPLEMENTAL PRESENTATION OF STATEMENTS OF FINANCIAL CONDITION |
55 | ||||
| ITEM 2. | MANAGEMENT’S DISCUSSION AND ANALYSIS OF FINANCIAL CONDITION AND RESULTS OF OPERATIONS |
57 | ||||
| ITEM 3. | 119 | |||||
| ITEM 4. | 123 | |||||
| PART II. | ||||||
| ITEM 1. | 124 | |||||
| ITEM 1A. | 124 | |||||
| ITEM 2. | 124 | |||||
| ITEM 3. | 125 | |||||
| ITEM 4. | 125 | |||||
| ITEM 5. | 125 | |||||
| ITEM 6. | 125 | |||||
| 126 | ||||||||
1
Table of Contents
Forward-Looking Statements
This report may contain forward-looking statements within the meaning of Section 27A of the Securities Act of 1933 and Section 21E of the Securities Exchange Act of 1934 which reflect our current views with respect to, among other things, our operations and financial performance. You can identify these forward-looking statements by the use of words such as “outlook,” “indicator,” “believes,” “expects,” “potential,” “continues,” “may,” “will,” “should,” “seeks,” “approximately,” “predicts,” “intends,” “plans,” “estimates,” “anticipates” or the negative version of these words or other comparable words. Such forward-looking statements are subject to various risks and uncertainties. Accordingly, there are or will be important factors that could cause actual outcomes or results to differ materially from those indicated in these statements. We believe these factors include but are not limited to those described under the section entitled “Risk Factors” in our Annual Report on Form 10-K for the year ended December 31, 2016 and in this report, as such factors may be updated from time to time in our periodic filings with the United States Securities and Exchange Commission (“SEC”), which are accessible on the SEC’s website at www.sec.gov. These factors should not be construed as exhaustive and should be read in conjunction with the other cautionary statements that are included in this report and in our other periodic filings. The forward-looking statements speak only as of the date of this report, and we undertake no obligation to publicly update or review any forward-looking statement, whether as a result of new information, future developments or otherwise.
Website and Social Media Disclosure
We use our website (www.blackstone.com), Facebook page (www.facebook.com/blackstone), Twitter (www.twitter.com/blackstone), LinkedIn (www.linkedin.com/company/the-blackstone-group), Instagram (www.instagram.com/blackstone) and YouTube (www.youtube.com/user/blackstonegroup) accounts as channels of distribution of company information. The information we post through these channels may be deemed material. Accordingly, investors should monitor these channels, in addition to following our press releases, SEC filings and public conference calls and webcasts. In addition, you may automatically receive e-mail alerts and other information about Blackstone when you enroll your e-mail address by visiting the “Contact Us/Email Alerts” section of our website at http://ir.blackstone.com. The contents of our website, any alerts and social media channels are not, however, a part of this report.
In this report, references to “Blackstone,” the “Partnership,” “we,” “us” or “our” refer to The Blackstone Group L.P. and its consolidated subsidiaries. Unless the context otherwise requires, references in this report to the ownership of Mr. Stephen A. Schwarzman, our founder, and other Blackstone personnel include the ownership of personal planning vehicles and family members of these individuals.
“Blackstone Funds,” “our funds” and “our investment funds” refer to the private equity funds, real estate funds, funds of hedge funds, credit-focused funds, collateralized loan obligation (“CLO”), real estate investment trusts and registered investment companies that are managed by Blackstone. “Our carry funds” refers to the private equity funds, real estate funds and certain of the hedge fund solutions and credit-focused funds (with multi-year drawdown, commitment-based structures that only pay carry on the realization of an investment) that are managed by Blackstone. We refer to our general corporate private equity funds as Blackstone Capital Partners (“BCP”) funds, our energy-focused private equity funds as Blackstone Energy Partners (“BEP”) funds, our core private equity fund as Blackstone Core Equity Partners (“BCEP”), our opportunistic investment platform that invests globally across asset classes, industries and geographies as Blackstone Tactical Opportunities (“Tactical Opportunities”), our secondary private equity fund of funds business as Strategic Partners Fund Solutions (“Strategic Partners”), a multi-asset investment program for eligible high net worth investors offering exposure to certain of our key illiquid investment strategies through a single commitment as Blackstone Total Alternatives Solution (“BTAS”) and our capital markets services business as Blackstone Capital Markets (“BXCM”). We refer to our real estate opportunistic funds as Blackstone Real Estate Partners (“BREP”) funds and our real estate debt investment funds as Blackstone Real Estate Debt Strategies (“BREDS”) funds. We refer to our core+ real estate funds, which target substantially stabilized assets in prime markets, as Blackstone Property Partners (“BPP”) funds. We refer to our real
2
Table of Contents
estate investment trusts as “REITs”, to Blackstone Mortgage Trust, Inc., our NYSE-listed REIT, as “BXMT”, and to Blackstone Real Estate Income Trust, Inc., our non-exchange traded REIT, as “BREIT”. “Our hedge funds” refers to our funds of hedge funds, certain of our real estate debt investment funds, including a registered investment company, and certain other credit-focused funds which are managed by Blackstone.
“Assets Under Management” refers to the assets we manage. Our Assets Under Management equals the sum of:
| (a) | the fair value of the investments held by our carry funds and our side-by-side and co-investment entities managed by us, plus the capital that we are entitled to call from investors in those funds and entities pursuant to the terms of their respective capital commitments, including capital commitments to funds that have yet to commence their investment periods, plus for certain credit-oriented funds the amounts available to be borrowed under asset based credit facilities, |
| (b) | the net asset value of (1) our hedge funds, real estate debt carry funds and open ended core+ real estate fund (plus, in each case, the capital that we are entitled to call from investors in those funds, including commitments yet to commence their investment periods), and (2) our funds of hedge funds, our Hedge Fund Solutions registered investment companies, and our non-exchange traded REIT, |
| (c) | the invested capital, fair value or net asset value of assets we manage pursuant to separately managed accounts, |
| (d) | the amount of debt and equity outstanding for our CLOs during the reinvestment period, |
| (e) | the aggregate par amount of collateral assets, including principal cash, for our CLOs after the reinvestment period, |
| (f) | the gross or net amount of assets (including leverage where applicable) for our credit-focused registered investment companies, and |
| (g) | the fair value of common stock, preferred stock, convertible debt, or similar instruments issued by BXMT. |
Our carry funds are commitment-based drawdown structured funds that do not permit investors to redeem their interests at their election. Our funds of hedge funds, hedge funds, funds structured like hedge funds and other open ended funds in our Hedge Fund Solutions, Credit and Real Estate segments generally have structures that afford an investor the right to withdraw or redeem their interests on a periodic basis (for example, annually or quarterly), typically with 30 to 95 days’ notice, depending on the fund and the liquidity profile of the underlying assets. Investment advisory agreements related to certain separately managed accounts in our Hedge Fund Solutions and Credit segments may generally be terminated by an investor on 30 to 90 days’ notice.
“Fee-Earning Assets Under Management” refers to the assets we manage on which we derive management and/or performance fees. Our Fee-Earning Assets Under Management equals the sum of:
| (a) | for our Private Equity segment funds and Real Estate segment carry funds including certain real estate debt investment funds and certain of our Hedge Fund Solutions funds, the amount of capital commitments, remaining invested capital, fair value or par value of assets held, depending on the fee terms of the fund, |
| (b) | for our credit-focused carry funds, the amount of remaining invested capital (which may include leverage) or net asset value, depending on the fee terms of the fund, |
| (c) | the remaining invested capital or fair value of assets held in co-investment vehicles managed by us on which we receive fees, |
| (d) | the net asset value of our funds of hedge funds, hedge funds, open ended core+ real estate fund, co-investments managed by us on which we receive fees, certain registered investment companies, and our non-exchanged traded REIT, |
3
Table of Contents
| (e) | the invested capital, fair value of assets or the net asset value we manage pursuant to separately managed accounts, |
| (f) | the net proceeds received from equity offerings and accumulated core earnings of BXMT, subject to certain adjustments, |
| (g) | the aggregate par amount of collateral assets, including principal cash, of our CLOs, and |
| (h) | the gross amount of assets (including leverage) or the net assets (plus leverage where applicable) for certain of our credit-focused registered investment companies. |
Each of our segments may include certain Fee-Earning Assets Under Management on which we earn performance fees but not management fees.
Our calculations of assets under management and fee-earning assets under management may differ from the calculations of other asset managers, and as a result this measure may not be comparable to similar measures presented by other asset managers. In addition, our calculation of assets under management includes commitments to, and the fair value of, invested capital in our funds from Blackstone and our personnel, regardless of whether such commitments or invested capital are subject to fees. Our definitions of assets under management or fee-earning assets under management are not based on any definition of assets under management or fee-earning assets under management that is set forth in the agreements governing the investment funds that we manage.
For our carry funds, total assets under management includes the fair value of the investments held, whereas fee-earning assets under management includes the amount of capital commitments, the remaining amount of invested capital at cost depending on whether the investment period has or has not expired or the fee terms of the fund. As such, fee-earning assets under management may be greater than total assets under management when the aggregate fair value of the remaining investments is less than the cost of those investments.
This report does not constitute an offer of any Blackstone Fund.
4
Table of Contents
| ITEM 1. | FINANCIAL STATEMENTS |
THE BLACKSTONE GROUP L.P.
Condensed Consolidated Statements of Financial Condition (Unaudited)
(Dollars in Thousands, Except Unit Data)
| March 31, 2017 |
December 31, 2016 |
|||||||
| Assets |
||||||||
| Cash and Cash Equivalents |
$ | 2,303,680 | $ | 1,837,253 | ||||
| Cash Held by Blackstone Funds and Other |
1,416,904 | 1,005,161 | ||||||
| Investments (including assets pledged of $142,265 and $119,139 at March 31, 2017 and December 31, 2016, respectively) |
18,138,258 | 17,694,975 | ||||||
| Accounts Receivable |
1,274,154 | 772,695 | ||||||
| Reverse Repurchase Agreements |
44,635 | 118,495 | ||||||
| Due from Affiliates |
1,669,124 | 1,442,378 | ||||||
| Intangible Assets, Net |
251,640 | 262,604 | ||||||
| Goodwill |
1,718,519 | 1,718,519 | ||||||
| Other Assets |
257,102 | 264,788 | ||||||
| Deferred Tax Assets |
1,263,148 | 1,286,469 | ||||||
|
|
|
|
|
|||||
| Total Assets |
$ | 28,337,164 | $ | 26,403,337 | ||||
|
|
|
|
|
|||||
| Liabilities and Partners’ Capital |
||||||||
| Loans Payable |
$ | 9,796,933 | $ | 8,866,366 | ||||
| Due to Affiliates |
1,236,067 | 1,321,772 | ||||||
| Accrued Compensation and Benefits |
2,221,161 | 2,327,762 | ||||||
| Securities Sold, Not Yet Purchased |
178,448 | 215,398 | ||||||
| Repurchase Agreements |
94,646 | 75,324 | ||||||
| Accounts Payable, Accrued Expenses and Other Liabilities |
1,707,050 | 1,081,782 | ||||||
|
|
|
|
|
|||||
| Total Liabilities |
15,234,305 | 13,888,404 | ||||||
|
|
|
|
|
|||||
| Commitments and Contingencies |
||||||||
| Redeemable Non-Controlling Interests in Consolidated Entities |
188,658 | 185,390 | ||||||
|
|
|
|
|
|||||
| Partners’ Capital |
||||||||
| The Blackstone Group L.P. Partners’ Capital |
||||||||
| Partners’ Capital (common units: 649,352,407 issued and outstanding as of March 31, 2017; 643,459,542 issued and outstanding as of December 31, 2016) |
6,713,622 | 6,523,929 | ||||||
| Accumulated Other Comprehensive Loss |
(55,201 | ) | (62,887 | ) | ||||
|
|
|
|
|
|||||
| Total The Blackstone Group L.P. Partners’ Capital |
6,658,421 | 6,461,042 | ||||||
| Non-Controlling Interests in Consolidated Entities |
2,650,789 | 2,428,964 | ||||||
| Non-Controlling Interests in Blackstone Holdings |
3,604,991 | 3,439,537 | ||||||
|
|
|
|
|
|||||
| Total Partners’ Capital |
12,914,201 | 12,329,543 | ||||||
|
|
|
|
|
|||||
| Total Liabilities and Partners’ Capital |
$ | 28,337,164 | $ | 26,403,337 | ||||
|
|
|
|
|
|||||
continued…
See notes to condensed consolidated financial statements.
5
Table of Contents
THE BLACKSTONE GROUP L.P.
Condensed Consolidated Statements of Financial Condition (Unaudited)
(Dollars in Thousands)
The following presents the portion of the consolidated balances presented above, after intercompany eliminations, attributable to consolidated Blackstone Funds which are variable interest entities. The following assets may only be used to settle obligations of these consolidated Blackstone Funds and these liabilities are only the obligations of these consolidated Blackstone Funds and they do not have recourse to the general credit of Blackstone.
| March 31, 2017 |
December 31, 2016 |
|||||||
| Assets |
||||||||
| Cash Held by Blackstone Funds and Other |
$ | 1,088,917 | $ | 740,760 | ||||
| Investments |
7,184,513 | 6,459,355 | ||||||
| Accounts Receivable |
938,363 | 355,364 | ||||||
| Due from Affiliates |
14,770 | 21,300 | ||||||
| Other Assets |
3,629 | 2,602 | ||||||
|
|
|
|
|
|||||
| Total Assets |
$ | 9,230,192 | $ | 7,579,381 | ||||
|
|
|
|
|
|||||
| Liabilities |
||||||||
| Loans Payable |
$ | 6,386,217 | $ | 5,466,444 | ||||
| Due to Affiliates |
57,343 | 72,609 | ||||||
| Securities Sold, Not Yet Purchased |
81,417 | 81,309 | ||||||
| Repurchase Agreements |
73,393 | 66,221 | ||||||
| Accounts Payable, Accrued Expenses and Other Liabilities |
1,208,745 | 545,481 | ||||||
|
|
|
|
|
|||||
| Total Liabilities |
$ | 7,807,115 | $ | 6,232,064 | ||||
|
|
|
|
|
|||||
See notes to condensed consolidated financial statements.
6
Table of Contents
THE BLACKSTONE GROUP L.P.
Condensed Consolidated Statements of Operations (Unaudited)
(Dollars in Thousands, Except Unit and Per Unit Data)
| Three Months Ended March 31, |
||||||||
| 2017 | 2016 | |||||||
| Revenues |
||||||||
| Management and Advisory Fees, Net |
$ | 642,142 | $ | 608,906 | ||||
|
|
|
|
|
|||||
| Performance Fees |
||||||||
| Realized |
||||||||
| Carried Interest |
1,111,256 | 230,909 | ||||||
| Incentive Fees |
47,160 | 28,419 | ||||||
| Unrealized |
||||||||
| Carried Interest |
(154,683 | ) | 47,586 | |||||
| Incentive Fees |
59,409 | 7,579 | ||||||
|
|
|
|
|
|||||
| Total Performance Fees |
1,063,142 | 314,493 | ||||||
|
|
|
|
|
|||||
| Investment Income (Loss) |
||||||||
| Realized |
251,344 | (12,001 | ) | |||||
| Unrealized |
(40,188 | ) | 3,493 | |||||
|
|
|
|
|
|||||
| Total Investment Income (Loss) |
211,156 | (8,508 | ) | |||||
|
|
|
|
|
|||||
| Interest and Dividend Revenue |
28,495 | 23,075 | ||||||
| Other |
(4,212 | ) | (5,612 | ) | ||||
|
|
|
|
|
|||||
| Total Revenues |
1,940,723 | 932,354 | ||||||
|
|
|
|
|
|||||
| Expenses |
||||||||
| Compensation and Benefits |
||||||||
| Compensation |
351,589 | 346,003 | ||||||
| Performance Fee Compensation |
||||||||
| Realized |
||||||||
| Carried Interest |
366,191 | 58,504 | ||||||
| Incentive Fees |
22,752 | 14,124 | ||||||
| Unrealized |
||||||||
| Carried Interest |
(4,387 | ) | 30,001 | |||||
| Incentive Fees |
23,139 | 3,448 | ||||||
|
|
|
|
|
|||||
| Total Compensation and Benefits |
759,284 | 452,080 | ||||||
| General, Administrative and Other |
106,044 | 123,045 | ||||||
| Interest Expense |
40,246 | 37,356 | ||||||
| Fund Expenses |
24,076 | 5,229 | ||||||
|
|
|
|
|
|||||
| Total Expenses |
929,650 | 617,710 | ||||||
|
|
|
|
|
|||||
| Other Income |
||||||||
| Net Gains from Fund Investment Activities |
66,132 | 19,142 | ||||||
|
|
|
|
|
|||||
| Income Before Provision for Taxes |
1,077,205 | 333,786 | ||||||
| Provision for Taxes |
57,437 | 9,146 | ||||||
|
|
|
|
|
|||||
| Net Income |
1,019,768 | 324,640 | ||||||
| Net Income (Loss) Attributable to Redeemable |
||||||||
| Non-Controlling Interests in Consolidated Entities |
2,000 | (6,401 | ) | |||||
| Net Income Attributable to Non-Controlling |
||||||||
| Interests in Consolidated Entities |
138,685 | 40,086 | ||||||
| Net Income Attributable to Non-Controlling |
||||||||
| Interests in Blackstone Holdings |
417,258 | 131,202 | ||||||
|
|
|
|
|
|||||
| Net Income Attributable to The Blackstone Group L.P. |
$ | 461,825 | $ | 159,753 | ||||
|
|
|
|
|
|||||
| Net Income Per Common Unit |
||||||||
| Common Units, Basic |
$ | 0.70 | $ | 0.25 | ||||
|
|
|
|
|
|||||
| Common Units, Diluted |
$ | 0.69 | $ | 0.23 | ||||
|
|
|
|
|
|||||
| Weighted-Average Common Units Outstanding |
||||||||
| Common Units, Basic |
660,939,708 | 644,897,849 | ||||||
|
|
|
|
|
|||||
| Common Units, Diluted |
1,199,506,983 | 1,194,273,401 | ||||||
|
|
|
|
|
|||||
| Distributions Declared Per Common Unit |
$ | 0.47 | $ | 0.61 | ||||
|
|
|
|
|
|||||
| Revenues Earned from Affiliates |
||||||||
| Management and Advisory Fees, Net |
$ | 50,085 | $ | 56,675 | ||||
|
|
|
|
|
|||||
See notes to condensed consolidated financial statements.
7
Table of Contents
THE BLACKSTONE GROUP L.P.
Condensed Consolidated Statements of Comprehensive Income (Loss) (Unaudited)
(Dollars in Thousands)
| Three Months Ended March 31, |
||||||||
| 2017 | 2016 | |||||||
| Net Income |
$ | 1,019,768 | $ | 324,640 | ||||
| Other Comprehensive Income, Net of Tax — Currency Translation Adjustment |
11,504 | 17,612 | ||||||
|
|
|
|
|
|||||
| Comprehensive Income |
1,031,272 | 342,252 | ||||||
| Less: |
||||||||
| Comprehensive Income (Loss) Attributable to Redeemable Non-Controlling Interests in Consolidated Entities |
2,000 | (6,401 | ) | |||||
| Comprehensive Income Attributable to Non-Controlling Interests in Consolidated Entities |
142,503 | 51,243 | ||||||
| Comprehensive Income Attributable to Non-Controlling Interests in Blackstone Holdings |
417,258 | 131,202 | ||||||
|
|
|
|
|
|||||
| Comprehensive Income Attributable to The Blackstone Group L.P. |
$ | 469,511 | $ | 166,208 | ||||
|
|
|
|
|
|||||
See notes to condensed consolidated financial statements.
8
Table of Contents
THE BLACKSTONE GROUP L.P.
Condensed Consolidated Statements of Changes in Partners’ Capital (Unaudited)
(Dollars in Thousands, Except Unit Data)
| The Blackstone Group L.P. | ||||||||||||||||||||||||||||||||
| Common Units |
Partners’ Capital |
Accumulated Other Compre- hensive Income (Loss) |
Total | Non- Controlling Interests in Consolidated Entities |
Non- Controlling Interests in Blackstone Holdings |
Total Partners’ Capital |
Redeemable Non- Controlling Interests in Consolidated Entities |
|||||||||||||||||||||||||
| Balance at December 31, 2016 |
643,459,542 | $ | 6,523,929 | $ | (62,887 | ) | $ | 6,461,042 | $ | 2,428,964 | $ | 3,439,537 | $ | 12,329,543 | $ | 185,390 | ||||||||||||||||
| Net Income |
— | 461,825 | — | 461,825 | 138,685 | 417,258 | 1,017,768 | 2,000 | ||||||||||||||||||||||||
| Currency Translation Adjustment |
— | — | 7,686 | 7,686 | 3,818 | — | 11,504 | — | ||||||||||||||||||||||||
| Capital Contributions |
— | — | — | — | 238,203 | — | 238,203 | 11,484 | ||||||||||||||||||||||||
| Capital Distributions |
— | (308,925 | ) | — | (308,925 | ) | (156,819 | ) | (284,636 | ) | (750,380 | ) | (10,216 | ) | ||||||||||||||||||
| Transfer of Non-Controlling Interests in Consolidated Entities |
— | — | — | — | (2,062 | ) | — | (2,062 | ) | — | ||||||||||||||||||||||
| Deferred Tax Effects Resulting from Acquisition of Ownership Interests from Non-Controlling Interest Holders |
— | 2,297 | — | 2,297 | — | — | 2,297 | — | ||||||||||||||||||||||||
| Equity-Based Compensation |
— | 43,703 | — | 43,703 | — | 36,355 | 80,058 | — | ||||||||||||||||||||||||
| Net Delivery of Vested Blackstone Holdings Partnership Units and Blackstone Common Units |
3,780,081 | (11,940 | ) | — | (11,940 | ) | — | (790 | ) | (12,730 | ) | — | ||||||||||||||||||||
| Change in The Blackstone Group L.P.’s Ownership Interest |
— | (10,789 | ) | — | (10,789 | ) | — | 10,789 | — | — | ||||||||||||||||||||||
| Conversion of Blackstone Holdings Partnership Units to Blackstone Common Units |
2,112,784 | 13,522 | — | 13,522 | — | (13,522 | ) | — | — | |||||||||||||||||||||||
|
|
|
|
|
|
|
|
|
|
|
|
|
|
|
|
|
|||||||||||||||||
| Balance at March 31, 2017 |
649,352,407 | $ | 6,713,622 | $ | (55,201 | ) | $ | 6,658,421 | $ | 2,650,789 | $ | 3,604,991 | $ | 12,914,201 | $ | 188,658 | ||||||||||||||||
|
|
|
|
|
|
|
|
|
|
|
|
|
|
|
|
|
|||||||||||||||||
continued…
See notes to condensed consolidated financial statements.
9
Table of Contents
THE BLACKSTONE GROUP L.P.
Condensed Consolidated Statements of Changes in Partners’ Capital (Unaudited)
(Dollars in Thousands, Except Unit Data)
| The Blackstone Group L.P. | ||||||||||||||||||||||||||||||||
| Common Units |
Partners’ Capital |
Accumulated Other Compre- hensive (Loss) |
Total | Non- Controlling Interests in Consolidated Entities |
Non- Controlling Interests in Blackstone Holdings |
Total Partners’ Capital |
Redeemable Non- Controlling Interests in Consolidated Entities |
|||||||||||||||||||||||||
| Balance at December 31, 2015 |
624,450,162 | $ | 6,322,307 | $ | (52,519 | ) | $ | 6,269,788 | $ | 2,408,701 | $ | 3,368,509 | $ | 12,046,998 | $ | 183,459 | ||||||||||||||||
| Net Income (Loss) |
— | 159,753 | — | 159,753 | 40,086 | 131,202 | 331,041 | (6,401 | ) | |||||||||||||||||||||||
| Currency Translation Adjustment |
— | — | 6,455 | 6,455 | 11,157 | — | 17,612 | — | ||||||||||||||||||||||||
| Capital Contributions |
— | — | — | — | 94,418 | — | 94,418 | — | ||||||||||||||||||||||||
| Capital Distributions |
— | (389,780 | ) | — | (389,780 | ) | (68,692 | ) | (355,360 | ) | (813,832 | ) | (4 | ) | ||||||||||||||||||
| Transfer of Non-Controlling Interests in Consolidated Entities |
— | — | — | — | (5,312 | ) | — | (5,312 | ) | — | ||||||||||||||||||||||
| Deferred Tax Effects Resulting from Acquisition of Ownership Interests from Non-Controlling Interest Holders |
— | (1,145 | ) | — | (1,145 | ) | — | — | (1,145 | ) | — | |||||||||||||||||||||
| Equity-Based Compensation |
— | 36,053 | — | 36,053 | — | 41,455 | 77,508 | — | ||||||||||||||||||||||||
| Net Delivery of Vested Blackstone Holdings Partnership Units and Blackstone Common Units |
4,025,507 | (13,262 | ) | — | (13,262 | ) | — | — | (13,262 | ) | — | |||||||||||||||||||||
| Change in The Blackstone Group L.P.’s Ownership Interest |
— | 3,618 | — | 3,618 | — | (3,618 | ) | — | — | |||||||||||||||||||||||
| Conversion of Blackstone Holdings Partnership Units to Blackstone Common Units |
3,073,286 | 18,931 | — | 18,931 | — | (18,931 | ) | — | — | |||||||||||||||||||||||
|
|
|
|
|
|
|
|
|
|
|
|
|
|
|
|
|
|||||||||||||||||
| Balance at March 31, 2016 |
631,548,955 | $ | 6,136,475 | $ | (46,064 | ) | $ | 6,090,411 | $ | 2,480,358 | $ | 3,163,257 | $ | 11,734,026 | $ | 177,054 | ||||||||||||||||
|
|
|
|
|
|
|
|
|
|
|
|
|
|
|
|
|
|||||||||||||||||
See notes to condensed consolidated financial statements.
10
Table of Contents
THE BLACKSTONE GROUP L.P.
Condensed Consolidated Statements of Cash Flows (Unaudited)
(Dollars in Thousands)
| Three Months Ended March 31, |
||||||||
| 2017 | 2016 | |||||||
| Operating Activities |
||||||||
| Net Income |
$ | 1,019,768 | $ | 324,640 | ||||
| Adjustments to Reconcile Net Income to Net Cash Provided by Operating Activities |
||||||||
| Blackstone Funds Related |
||||||||
| Net Realized Gains on Investments |
(1,464,126 | ) | (253,857 | ) | ||||
| Change in Unrealized (Gains) Losses on Investments |
63,480 | (18,321 | ) | |||||
| Non-Cash Performance Fees |
100,524 | (15,077 | ) | |||||
| Non-Cash Performance Fee Compensation |
407,696 | 106,076 | ||||||
| Equity-Based Compensation Expense |
91,269 | 79,840 | ||||||
| Amortization of Intangibles |
10,964 | 22,828 | ||||||
| Other Non-Cash Amounts Included in Net Income |
52,123 | 7,652 | ||||||
| Cash Flows Due to Changes in Operating Assets and Liabilities |
||||||||
| Cash Held by Blackstone Funds and Other |
(400,386 | ) | 51,134 | |||||
| Accounts Receivable |
352,788 | (21,063 | ) | |||||
| Reverse Repurchase Agreements |
73,860 | 159,592 | ||||||
| Due from Affiliates |
(146,750 | ) | 124,519 | |||||
| Other Assets |
2,335 | 52,381 | ||||||
| Accrued Compensation and Benefits |
(523,779 | ) | (289,532 | ) | ||||
| Securities Sold, Not Yet Purchased |
(37,632 | ) | (76,620 | ) | ||||
| Accounts Payable, Accrued Expenses and Other Liabilities |
(656,935 | ) | (264,198 | ) | ||||
| Repurchase Agreements |
19,415 | 8,620 | ||||||
| Due to Affiliates |
(65,935 | ) | (3,642 | ) | ||||
| Investments Purchased |
(2,330,873 | ) | (1,333,052 | ) | ||||
| Cash Proceeds from Sale of Investments |
3,583,318 | 1,558,301 | ||||||
|
|
|
|
|
|||||
| Net Cash Provided by Operating Activities |
151,124 | 220,221 | ||||||
|
|
|
|
|
|||||
| Investing Activities |
||||||||
| Purchase of Furniture, Equipment and Leasehold Improvements |
(10,007 | ) | (9,934 | ) | ||||
| Changes in Restricted Cash |
7,990 | 5,843 | ||||||
|
|
|
|
|
|||||
| Net Cash Used in Investing Activities |
(2,017 | ) | (4,091 | ) | ||||
|
|
|
|
|
|||||
continued…
See notes to condensed consolidated financial statements.
11
Table of Contents
THE BLACKSTONE GROUP L.P.
Condensed Consolidated Statements of Cash Flows (Unaudited)
(Dollars in Thousands)
| Three Months Ended March 31, |
||||||||
| 2017 | 2016 | |||||||
| Financing Activities |
||||||||
| Distributions to Non-Controlling Interest Holders in Consolidated Entities |
$ | (139,059 | ) | $ | (68,696 | ) | ||
| Contributions from Non-Controlling Interest Holders in Consolidated Entities |
246,274 | 88,079 | ||||||
| Payments Under Tax Receivable Agreement |
(59,667 | ) | (78,985 | ) | ||||
| Net Settlement of Vested Common Units and Repurchase of Common and Blackstone Holdings Partnership Units |
(12,730 | ) | (13,262 | ) | ||||
| Proceeds from Loans Payable |
996,892 | 158,456 | ||||||
| Repayment and Repurchase of Loans Payable |
(125,425 | ) | (21,327 | ) | ||||
| Distributions to Unitholders |
(593,561 | ) | (745,140 | ) | ||||
|
|
|
|
|
|||||
| Net Cash Provided by (Used in) Financing Activities |
312,724 | (680,875 | ) | |||||
|
|
|
|
|
|||||
| Effect of Exchange Rate Changes on Cash and Cash Equivalents |
4,596 | (27 | ) | |||||
|
|
|
|
|
|||||
| Net Increase (Decrease) in Cash and Cash Equivalents |
466,427 | (464,772 | ) | |||||
| Cash and Cash Equivalents, Beginning of Period |
1,837,253 | 1,837,324 | ||||||
|
|
|
|
|
|||||
| Cash and Cash Equivalents, End of Period |
$ | 2,303,680 | $ | 1,372,552 | ||||
|
|
|
|
|
|||||
| Supplemental Disclosure of Cash Flows Information |
||||||||
| Payments for Interest |
$ | 57,339 | $ | 60,907 | ||||
|
|
|
|
|
|||||
| Payments for Income Taxes |
$ | 16,849 | $ | 6,995 | ||||
|
|
|
|
|
|||||
| Supplemental Disclosure of Non-Cash Investing and Financing Activities |
||||||||
| Non-Cash Contributions from Non-Controlling Interest Holders |
$ | 1,738 | $ | 967 | ||||
|
|
|
|
|
|||||
| Non-Cash Distributions to Non-Controlling Interest Holders |
$ | (27,976 | ) | $ | — | |||
|
|
|
|
|
|||||
| Transfer of Interests to Non-Controlling Interest Holders |
$ | (2,062 | ) | $ | (5,312 | ) | ||
|
|
|
|
|
|||||
| Change in The Blackstone Group L.P.’s Ownership Interest |
$ | (10,789 | ) | $ | 3,618 | |||
|
|
|
|
|
|||||
| Net Settlement of Vested Common Units |
$ | 60,853 | $ | 59,605 | ||||
|
|
|
|
|
|||||
| Conversion of Blackstone Holdings Partnership Units to Common Units |
$ | 13,522 | $ | 18,931 | ||||
|
|
|
|
|
|||||
| Acquisition of Ownership Interests from Non-Controlling Interest Holders |
||||||||
| Deferred Tax Asset |
$ | (15,129 | ) | $ | (14,427 | ) | ||
|
|
|
|
|
|||||
| Due to Affiliates |
$ | 12,832 | $ | 15,572 | ||||
|
|
|
|
|
|||||
| Partners’ Capital |
$ | 2,297 | $ | (1,145 | ) | |||
|
|
|
|
|
|||||
See notes to condensed consolidated financial statements.
12
Table of Contents
THE BLACKSTONE GROUP L.P.
Notes to Condensed Consolidated Financial Statements
(All Dollars Are in Thousands, Except Unit and Per Unit Data, Except Where Noted)
| 1. | ORGANIZATION |
The Blackstone Group L.P., together with its subsidiaries (“Blackstone” or the “Partnership”), is a leading global manager of private capital. The alternative asset management business includes the management of private equity funds, real estate funds, real estate investment trusts (“REITs”), funds of hedge funds, hedge funds, credit-focused funds, collateralized loan obligation (“CLO”) vehicles, separately managed accounts and registered investment companies (collectively referred to as the “Blackstone Funds”). Blackstone’s business is organized into four segments: private equity, real estate, hedge fund solutions and credit.
The Partnership was formed as a Delaware limited partnership on March 12, 2007. The Partnership is managed and operated by its general partner, Blackstone Group Management L.L.C., which is in turn wholly owned and controlled by one of Blackstone’s founders, Stephen A. Schwarzman (the “Founder”), and Blackstone’s other senior managing directors. The activities of the Partnership are conducted through its holding partnerships: Blackstone Holdings I L.P., Blackstone Holdings AI L.P., Blackstone Holdings II L.P., Blackstone Holdings III L.P. and Blackstone Holdings IV L.P. (collectively, “Blackstone Holdings”, “Blackstone Holdings Partnerships” or the “Holding Partnerships”). The Partnership, through its wholly owned subsidiaries, is the sole general partner in each of these Holding Partnerships.
Generally, holders of the limited partner interests in the Holding Partnerships may, four times each year, exchange their limited partnership interests (“Partnership Units”) for Blackstone common units, on a one-to-one basis, exchanging one Partnership Unit from each of the Holding Partnerships for one Blackstone common unit.
| 2. | SUMMARY OF SIGNIFICANT ACCOUNTING POLICIES |
Basis of Presentation
The accompanying unaudited condensed consolidated financial statements of the Partnership have been prepared in accordance with accounting principles generally accepted in the United States of America (“GAAP”) for interim financial information and the instructions to Form 10-Q. The condensed consolidated financial statements, including these notes, are unaudited and exclude some of the disclosures required in audited financial statements. Management believes it has made all necessary adjustments (consisting of only normal recurring items) so that the condensed consolidated financial statements are presented fairly and that estimates made in preparing its condensed consolidated financial statements are reasonable and prudent. The operating results presented for interim periods are not necessarily indicative of the results that may be expected for any other interim period or for the entire year. These condensed consolidated financial statements should be read in conjunction with the audited consolidated financial statements included in the Partnership’s Annual Report on Form 10-K for the year ended December 31, 2016 filed with the Securities and Exchange Commission. As disclosed in the audited consolidated financial statements, the Partnership adopted certain accounting guidance for the quarter ended June 30, 2016 and any adjustments were reflected prospectively as of January 1, 2016. As such, the condensed consolidated financial statements for the three months ended March 31, 2016 were recast from the amounts originally reported in the Partnership’s Quarterly Report on Form 10-Q for the quarter ended March 31, 2016.
The condensed consolidated financial statements include the accounts of the Partnership, its wholly owned or majority-owned subsidiaries, the consolidated entities which are considered to be variable interest entities and for which the Partnership is considered the primary beneficiary, and certain partnerships or similar entities which are not considered variable interest entities but in which the general partner is presumed to have control.
All intercompany balances and transactions have been eliminated in consolidation.
13
Table of Contents
THE BLACKSTONE GROUP L.P.
Notes to Condensed Consolidated Financial Statements—Continued
(All Dollars Are in Thousands, Except Unit and Per Unit Data, Except Where Noted)
Restructurings within consolidated CLOs are treated as investment purchases or sales, as applicable, in the Condensed Consolidated Statements of Cash Flows.
Consolidation
The Partnership consolidates all entities that it controls through a majority voting interest or otherwise, including those Blackstone Funds in which the general partner has a controlling financial interest. The Partnership has a controlling interest in Blackstone Holdings because the limited partners do not have the right to dissolve the partnerships or have substantive kick out rights or participating rights that would overcome the presumption of control by the Partnership. Accordingly, the Partnership consolidates Blackstone Holdings and records non-controlling interests to reflect the economic interests of the limited partners of Blackstone Holdings.
In addition, the Partnership consolidates all variable interest entities (“VIE”) in which it is the primary beneficiary. An enterprise is determined to be the primary beneficiary if it holds a controlling financial interest. A controlling financial interest is defined as (a) the power to direct the activities of a VIE that most significantly impact the entity’s economic performance and (b) the obligation to absorb losses of the entity or the right to receive benefits from the entity that could potentially be significant to the VIE. The consolidation guidance requires an analysis to determine (a) whether an entity in which the Partnership holds a variable interest is a VIE and (b) whether the Partnership’s involvement, through holding interests directly or indirectly in the entity or contractually through other variable interests (for example, management and performance related fees), would give it a controlling financial interest. Performance of that analysis requires the exercise of judgment.
The Partnership determines whether it is the primary beneficiary of a VIE at the time it becomes involved with a variable interest entity and reconsiders that conclusion continually. In evaluating whether the Partnership is the primary beneficiary, Blackstone evaluates its economic interests in the entity held either directly or indirectly by the Partnership. The consolidation analysis can generally be performed qualitatively; however, if it is not readily apparent that the Partnership is not the primary beneficiary, a quantitative analysis may also be performed. Investments and redemptions (either by the Partnership, affiliates of the Partnership or third parties) or amendments to the governing documents of the respective Blackstone Funds could affect an entity’s status as a VIE or the determination of the primary beneficiary. At each reporting date, the Partnership assesses whether it is the primary beneficiary and will consolidate or deconsolidate accordingly.
Assets of consolidated VIEs that can only be used to settle obligations of the consolidated VIE and liabilities of a consolidated VIE for which creditors (or beneficial interest holders) do not have recourse to the general credit of Blackstone are presented in a separate section in the Condensed Consolidated Statements of Financial Condition.
Blackstone’s other disclosures regarding VIEs are discussed in Note 9. “Variable Interest Entities”.
Fair Value of Financial Instruments
GAAP establishes a hierarchical disclosure framework which prioritizes and ranks the level of market price observability used in measuring financial instruments at fair value. Market price observability is affected by a number of factors, including the type of financial instrument, the characteristics specific to the financial instrument and the state of the marketplace, including the existence and transparency of transactions between market participants. Financial instruments with readily available quoted prices in active markets generally will have a higher degree of market price observability and a lesser degree of judgment used in measuring fair value.
14
Table of Contents
THE BLACKSTONE GROUP L.P.
Notes to Condensed Consolidated Financial Statements—Continued
(All Dollars Are in Thousands, Except Unit and Per Unit Data, Except Where Noted)
Financial instruments measured and reported at fair value are classified and disclosed based on the observability of inputs used in the determination of fair values, as follows:
| • | Level I — Quoted prices are available in active markets for identical financial instruments as of the reporting date. The types of financial instruments in Level I include listed equities, listed derivatives and mutual funds with quoted prices. The Partnership does not adjust the quoted price for these investments, even in situations where Blackstone holds a large position and a sale could reasonably impact the quoted price. |
| • | Level II — Pricing inputs are other than quoted prices in active markets, which are either directly or indirectly observable as of the reporting date, and fair value is determined through the use of models or other valuation methodologies. Financial instruments which are generally included in this category include corporate bonds and loans, including corporate bonds and loans held within CLO vehicles, government and agency securities, less liquid and restricted equity securities, and certain over-the-counter derivatives where the fair value is based on observable inputs. Senior and subordinated notes issued by CLO vehicles are classified within Level II of the fair value hierarchy. |
| • | Level III — Pricing inputs are unobservable for the financial instruments and includes situations where there is little, if any, market activity for the financial instrument. The inputs into the determination of fair value require significant management judgment or estimation. Financial instruments that are included in this category generally include general and limited partnership interests in private equity and real estate funds, credit-focused funds, distressed debt and non-investment grade residual interests in securitizations, certain corporate bonds and loans held within CLO vehicles, and certain over-the-counter derivatives where the fair value is based on unobservable inputs. |
In certain cases, the inputs used to measure fair value may fall into different levels of the fair value hierarchy. In such cases, the determination of which category within the fair value hierarchy is appropriate for any given financial instrument is based on the lowest level of input that is significant to the fair value measurement. The Partnership’s assessment of the significance of a particular input to the fair value measurement in its entirety requires judgment and considers factors specific to the financial instrument.
Transfers between levels of the fair value hierarchy are recognized at the beginning of the reporting period.
Level II Valuation Techniques
Financial instruments classified within Level II of the fair value hierarchy comprise debt instruments, including certain corporate loans and bonds held by Blackstone’s consolidated CLO vehicles and debt securities sold, not yet purchased. Certain equity securities and derivative instruments valued using observable inputs are also classified as Level II.
The valuation techniques used to value financial instruments classified within Level II of the fair value hierarchy are as follows:
| • | Debt Instruments and Equity Securities are valued on the basis of prices from an orderly transaction between market participants provided by reputable dealers or pricing services. In determining the value of a particular investment, pricing services may use certain information with respect to transactions in such investments, quotations from dealers, pricing matrices and market transactions in comparable investments and various relationships between investments. The valuation of certain equity securities is based on an observable price for an identical security adjusted for the effect of a restriction. |
15
Table of Contents
THE BLACKSTONE GROUP L.P.
Notes to Condensed Consolidated Financial Statements—Continued
(All Dollars Are in Thousands, Except Unit and Per Unit Data, Except Where Noted)
| • | Freestanding Derivatives are valued using contractual cash flows and observable inputs comprising yield curves, foreign currency rates and credit spreads. |
| • | Senior and subordinate notes issued by CLO vehicles are classified based on the more observable fair value of CLO assets less (a) the fair value of any beneficial interests held by Blackstone, and (b) the carrying value of any beneficial interests that represent compensation for services. |
Level III Valuation Techniques
In the absence of observable market prices, Blackstone values its investments using valuation methodologies applied on a consistent basis. For some investments little market activity may exist; management’s determination of fair value is then based on the best information available in the circumstances, and may incorporate management’s own assumptions and involves a significant degree of judgment, taking into consideration a combination of internal and external factors, including the appropriate risk adjustments for non-performance and liquidity risks. Investments for which market prices are not observable include private investments in the equity of operating companies, real estate properties, certain funds of hedge funds and credit-focused investments.
Private Equity Investments — The fair values of private equity investments are determined by reference to projected net earnings, earnings before interest, taxes, depreciation and amortization (“EBITDA”), the discounted cash flow method, public market or private transactions, valuations for comparable companies and other measures which, in many cases, are based on unaudited information at the time received. Valuations may be derived by reference to observable valuation measures for comparable companies or transactions (for example, multiplying a key performance metric of the investee company, such as EBITDA, by a relevant valuation multiple observed in the range of comparable companies or transactions), adjusted by management for differences between the investment and the referenced comparables, and in some instances by reference to option pricing models or other similar methods. Where a discounted cash flow method is used, a terminal value is derived by reference to EBITDA or price/earnings exit multiples.
Real Estate Investments — The fair values of real estate investments are determined by considering projected operating cash flows, sales of comparable assets, if any, and replacement costs, among other measures. The methods used to estimate the fair value of real estate investments include the discounted cash flow method and/or capitalization rates (“cap rates”) analysis. Valuations may be derived by reference to observable valuation measures for comparable companies or assets (for example, multiplying a key performance metric of the investee company or asset, such as EBITDA, by a relevant valuation multiple observed in the range of comparable companies or transactions), adjusted by management for differences between the investment and the referenced comparables, and in some instances by reference to option pricing models or other similar methods. Where a discounted cash flow method is used, a terminal value is derived by reference to an exit EBITDA multiple or capitalization rate. Additionally, where applicable, projected distributable cash flow through debt maturity will be considered in support of the investment’s fair value.
Credit-Focused Investments — The fair values of credit-focused investments are generally determined on the basis of prices between market participants provided by reputable dealers or pricing services. For credit-focused investments that are not publicly traded or whose market prices are not readily available, Blackstone may utilize other valuation techniques, including the discounted cash flow method or a market approach. The discounted cash flow method projects the expected cash flows of the debt instrument based on contractual terms, and discounts such cash flows back to the valuation date using a market-based yield. The market-based yield is estimated using yields of publicly traded debt instruments issued by companies operating in similar industries as the subject investment, with similar leverage statistics and time to maturity.
16
Table of Contents
THE BLACKSTONE GROUP L.P.
Notes to Condensed Consolidated Financial Statements—Continued
(All Dollars Are in Thousands, Except Unit and Per Unit Data, Except Where Noted)
The market approach is generally used to determine the enterprise value of the issuer of a credit investment, and considers valuation multiples of comparable companies or transactions. The resulting enterprise value will dictate whether or not such credit investment has adequate enterprise value coverage. In cases of distressed credit instruments, the market approach may be used to estimate a recovery value in the event of a restructuring.
Level III Valuation Process
Investments classified within Level III of the fair value hierarchy are valued on a quarterly basis, taking into consideration factors including any changes in Blackstone’s weighted-average cost of capital assumptions, discounted cash flow projections and exit multiple assumptions, as well as any changes in economic and other relevant conditions, and valuation models are updated accordingly. The valuation process also includes a review by an independent valuation party, at least annually for all investments, and quarterly for certain investments, to corroborate the values determined by management. The valuations of Blackstone’s investments are reviewed quarterly by a valuation committee chaired by Blackstone’s Vice Chairman and includes senior heads of each of Blackstone’s businesses, as well as representatives of legal and finance. Each quarter, the valuations of Blackstone’s investments are also reviewed by the Audit Committee in a meeting attended by the chairman of the valuation committee. The valuations are further tested by comparison to actual sales prices obtained on disposition of the investments.
Investments, at Fair Value
The Blackstone Funds are accounted for as investment companies under the American Institute of Certified Public Accountants Accounting and Auditing Guide, Investment Companies, and reflect their investments, including majority-owned and controlled investments (the “Portfolio Companies”), at fair value. Such consolidated funds’ investments are reflected in Investments on the Condensed Consolidated Statements of Financial Condition at fair value, with unrealized gains and losses resulting from changes in fair value reflected as a component of Net Gains (Losses) from Fund Investment Activities in the Condensed Consolidated Statements of Operations. Fair value is the amount that would be received to sell an asset or paid to transfer a liability, in an orderly transaction between market participants at the measurement date, at current market conditions (i.e., the exit price).
Blackstone’s principal investments are presented at fair value with unrealized appreciation or depreciation and realized gains and losses recognized in the Condensed Consolidated Statements of Operations within Investment Income (Loss).
For certain instruments, the Partnership has elected the fair value option. Such election is irrevocable and is applied on an investment by investment basis at initial recognition. The Partnership has applied the fair value option for certain loans and receivables and certain investments in private debt securities that otherwise would not have been carried at fair value with gains and losses recorded in net income. Accounting for these financial instruments at fair value is consistent with how the Partnership accounts for its other principal investments. Loans extended to third parties are recorded within Accounts Receivable within the Condensed Consolidated Statements of Financial Condition. Debt securities for which the fair value option has been elected are recorded within Investments. The methodology for measuring the fair value of such investments is consistent with the methodology applied to private equity, real estate, credit-focused and funds of hedge funds investments. Changes in the fair value of such instruments are recognized in Investment Income (Loss) in the Condensed Consolidated Statements of Operations. Interest income on interest bearing loans and receivables and debt securities on which the fair value option has been elected is based on stated coupon rates adjusted for the accretion of purchase discounts and the amortization of purchase premiums. This interest income is recorded within Interest and Dividend Revenue.
17
Table of Contents
THE BLACKSTONE GROUP L.P.
Notes to Condensed Consolidated Financial Statements—Continued
(All Dollars Are in Thousands, Except Unit and Per Unit Data, Except Where Noted)
In addition, the Partnership has elected the fair value option for the assets and liabilities of CLO vehicles that are consolidated as of January 1, 2010, as a result of the initial adoption of variable interest entity consolidation guidance. The Partnership has also elected the fair value option for CLO vehicles consolidated as a result of the acquisitions of CLO management contracts or the acquisition of the share capital of CLO managers. Historically, the adjustment resulting from the difference between the fair value of assets and liabilities for each of these events was presented as a transition and acquisition adjustment to Appropriated Partners’ Capital. Assets of the consolidated CLOs are presented within Investments within the Condensed Consolidated Statements of Financial Condition and Liabilities within Loans Payable for the amounts due to unaffiliated third parties and Due to Affiliates for the amounts held by non-consolidated affiliates. Changes in the fair value of consolidated CLO assets and liabilities and related interest, dividend and other income subsequent to adoption and acquisition are presented within Net Gains (Losses) from Fund Investment Activities. Expenses of consolidated CLO vehicles are presented in Fund Expenses. Historically, amounts attributable to Non-Controlling Interests in Consolidated Entities had a corresponding adjustment to Appropriated Partners’ Capital. On the adoption of the new CLO measurement guidance, there is no attribution of amounts to Non-Controlling Interests and no corresponding adjustments to Appropriated Partners’ Capital.
The Partnership has elected the fair value option for certain proprietary investments that would otherwise have been accounted for using the equity method of accounting. The fair value of such investments is based on quoted prices in an active market or using the discounted cash flow method. Changes in fair value are recognized in Investment Income (Loss) in the Condensed Consolidated Statements of Operations.
Further disclosure on instruments for which the fair value option has been elected is presented in Note 7. “Fair Value Option”.
The investments of consolidated Blackstone Funds in funds of hedge funds (“Investee Funds”) are valued at net asset value (“NAV”) per share of the Investee Fund. In limited circumstances, the Partnership may determine, based on its own due diligence and investment procedures, that NAV per share does not represent fair value. In such circumstances, the Partnership will estimate the fair value in good faith and in a manner that it reasonably chooses, in accordance with the requirements of GAAP.
Certain investments of Blackstone and of the consolidated Blackstone funds of hedge funds and credit-focused funds measure their investments in underlying funds at fair value using NAV per share without adjustment. The terms of the investee’s investment generally provide for minimum holding periods or lock-ups, the institution of gates on redemptions or the suspension of redemptions or an ability to side pocket investments, at the discretion of the investee’s fund manager, and as a result, investments may not be redeemable at, or within three months of, the reporting date. A side pocket is used by hedge funds and funds of hedge funds to separate investments that may lack a readily ascertainable value, are illiquid or are subject to liquidity restriction. Redemptions are generally not permitted until the investments within a side pocket are liquidated or it is deemed that the conditions existing at the time that required the investment to be included in the side pocket no longer exist. As the timing of either of these events is uncertain, the timing at which the Partnership may redeem an investment held in a side pocket cannot be estimated. Further disclosure on instruments for which fair value is measured using NAV per share is presented in Note 5. “Net Asset Value as Fair Value”.
Security and loan transactions are recorded on a trade date basis.
18
Table of Contents
THE BLACKSTONE GROUP L.P.
Notes to Condensed Consolidated Financial Statements—Continued
(All Dollars Are in Thousands, Except Unit and Per Unit Data, Except Where Noted)
Equity Method Investments
Investments in which the Partnership is deemed to exert significant influence, but not control, are accounted for using the equity method of accounting. Under the equity method of accounting, the Partnership’s share of earnings (losses) from equity method investments is included in Investment Income (Loss) in the Condensed Consolidated Statements of Operations. The carrying amounts of equity method investments are reflected in Investments in the Condensed Consolidated Statements of Financial Condition. As the underlying investments of the Partnership’s equity method investments in Blackstone Funds are reported at fair value, the carrying value of the Partnership’s equity method investments approximates fair value.
Repurchase and Reverse Repurchase Agreements
Securities purchased under agreements to resell (“reverse repurchase agreements”) and securities sold under agreements to repurchase (“repurchase agreements”), comprised primarily of U.S. and non-U.S. government and agency securities, asset-backed securities and corporate debt, represent collateralized financing transactions. Such transactions are recorded in the Condensed Consolidated Statements of Financial Condition at their contractual amounts and include accrued interest. The carrying value of repurchase and reverse repurchase agreements approximates fair value.
The Partnership manages credit exposure arising from reverse repurchase agreements and repurchase agreements by, in appropriate circumstances, entering into master netting agreements and collateral arrangements with counterparties that provide the Partnership, in the event of a counterparty default, the right to liquidate collateral and the right to offset a counterparty’s rights and obligations.
The Partnership takes possession of securities purchased under reverse repurchase agreements and is permitted to repledge, deliver or otherwise use such securities. The Partnership also pledges its financial instruments to counterparties to collateralize repurchase agreements. Financial instruments pledged that can be repledged, delivered or otherwise used by the counterparty are recorded in Investments in the Condensed Consolidated Statements of Financial Condition. Additional disclosures relating to reverse repurchase and repurchase agreements are discussed in Note 10. “Reverse Repurchase and Repurchase Agreements”.
Blackstone does not offset assets and liabilities relating to reverse repurchase agreements and repurchase agreements in its Condensed Consolidated Statements of Financial Condition. Additional disclosures relating to offsetting are discussed in Note 11. “Offsetting of Assets and Liabilities”.
Securities Sold, Not Yet Purchased
Securities Sold, Not Yet Purchased consist of equity and debt securities that the Partnership has borrowed and sold. The Partnership is required to “cover” its short sale in the future by purchasing the security at prevailing market prices and delivering it to the counterparty from which it borrowed the security. The Partnership is exposed to loss in the event that the price at which a security may have to be purchased to cover a short sale exceeds the price at which the borrowed security was sold short.
Securities Sold, Not Yet Purchased are recorded at fair value in the Condensed Consolidated Statements of Financial Condition.
Derivative Instruments
The Partnership recognizes all derivatives as assets or liabilities on its Condensed Consolidated Statements of Financial Condition at fair value. On the date the Partnership enters into a derivative contract, it designates and
19
Table of Contents
THE BLACKSTONE GROUP L.P.
Notes to Condensed Consolidated Financial Statements—Continued
(All Dollars Are in Thousands, Except Unit and Per Unit Data, Except Where Noted)
documents each derivative contract as one of the following: (a) a hedge of a recognized asset or liability (“fair value hedge”), (b) a hedge of a forecasted transaction or of the variability of cash flows to be received or paid related to a recognized asset or liability (“cash flow hedge”), (c) a hedge of a net investment in a foreign operation, or (d) a derivative instrument not designated as a hedging instrument (“freestanding derivative”). For a fair value hedge, Blackstone records changes in the fair value of the derivative and, to the extent that it is highly effective, changes in the fair value of the hedged asset or liability attributable to the hedged risk, in current period earnings in General, Administrative and Other in the Condensed Consolidated Statements of Operations. Changes in the fair value of derivatives designated as hedging instruments caused by factors other than changes in the risk being hedged, which are excluded from the assessment of hedge effectiveness, are recognized in current period earnings. Gains or losses on a derivative instrument that is designated as, and is effective as, an economic hedge of a net investment in a foreign operation are reported in the cumulative translation adjustment section of other comprehensive income to the extent it is effective as a hedge. The ineffective portion of a net investment hedge is recognized in current period earnings.
The Partnership formally documents at inception its hedge relationships, including identification of the hedging instruments and the hedged items, its risk management objectives, strategy for undertaking the hedge transaction and the Partnership’s evaluation of effectiveness of its hedged transaction. At least monthly, the Partnership also formally assesses whether the derivative it designated in each hedging relationship is expected to be, and has been, highly effective in offsetting changes in estimated fair values or cash flows of the hedged items using either the regression analysis or the dollar offset method. For net investment hedges, the Partnership uses a method based on changes in spot rates to measure effectiveness. If it is determined that a derivative is not highly effective at hedging the designated exposure, hedge accounting is discontinued. The Partnership may also at any time remove a designation of a fair value hedge. The fair values of hedging derivative instruments are reflected within Other Assets in the Condensed Consolidated Statements of Financial Condition.
For freestanding derivative contracts, the Partnership presents changes in fair value in current period earnings. Changes in the fair value of derivative instruments held by consolidated Blackstone Funds are reflected in Net Gains (Losses) from Fund Investment Activities or, where derivative instruments are held by the Partnership, within Investment Income (Loss) in the Condensed Consolidated Statements of Operations. The fair value of freestanding derivative assets of the consolidated Blackstone Funds are recorded within Investments, the fair value of freestanding derivative assets that are not part of the consolidated Blackstone Funds are recorded within Other Assets and the fair value of freestanding derivative liabilities are recorded within Accounts Payable, Accrued Expenses and Other Liabilities in the Condensed Consolidated Statements of Financial Condition.
The Partnership has elected to not offset derivative assets and liabilities or financial assets in its Condensed Consolidated Statements of Financial Condition, including cash, that may be received or paid as part of collateral arrangements, even when an enforceable master netting agreement is in place that provides the Partnership, in the event of counterparty default, the right to liquidate collateral and the right to offset a counterparty’s rights and obligations.
Blackstone’s other disclosures regarding derivative financial instruments are discussed in Note 6. “Derivative Financial Instruments”.
Blackstone’s disclosures regarding offsetting are discussed in Note 11. “Offsetting of Assets and Liabilities”.
Affiliates
Blackstone considers its Founder, senior managing directors, employees, the Blackstone Funds and the Portfolio Companies to be affiliates.
20
Table of Contents
THE BLACKSTONE GROUP L.P.
Notes to Condensed Consolidated Financial Statements—Continued
(All Dollars Are in Thousands, Except Unit and Per Unit Data, Except Where Noted)
Distributions
Distributions are reflected in the condensed consolidated financial statements when declared.
Recent Accounting Developments
In May 2014, the Financial Accounting Standards Board (“FASB”) issued amended guidance on revenue from contracts with customers. The guidance requires that an entity should recognize revenue to depict the transfer of promised goods or services to customers in an amount that reflects the consideration to which the entity expects to be entitled in exchange for those goods or services. An entity is required to (a) identify the contract(s) with a customer, (b) identify the performance obligations in the contract, (c) determine the transaction price, (d) allocate the transaction price to the performance obligations in the contract, and (e) recognize revenue when (or as) the entity satisfies a performance obligation. In determining the transaction price, an entity may include variable consideration only to the extent that it is probable that a significant reversal in the amount of cumulative revenue recognized would not occur when the uncertainty associated with the variable consideration is resolved.
The guidance introduces new qualitative and quantitative disclosure requirements about contracts with customers including revenue and impairments recognized, disaggregation of revenue and information about contract balances and performance obligations. Information is required about significant judgments and changes in judgments in determining the timing of satisfaction of performance obligations and determining the transaction price and amounts allocated to performance obligations. Additional disclosures are required about assets recognized from the costs to obtain or fulfill a contract.
In August 2015, the FASB issued new guidance deferring the effective date of the new revenue recognition standard by one year. The new guidance should be applied for annual reporting periods beginning after December 15, 2017, including interim periods within that reporting period.
Blackstone has concluded that capital allocation-based Performance Fees (“Capital Allocation-Based Arrangements”) represent equity method investments that are not in the scope of the amended revenue recognition guidance. Therefore, effective January 1, 2018, Blackstone will amend the recognition and measurement of Capital Allocation-Based Arrangements. This accounting change will not change the timing or amount of revenue recognized related to Capital Allocation-Based Arrangements. These amounts are currently recognized within Realized and Unrealized Performance Fees — Carried Interest and Incentive Fees in the Consolidated Statements of Operations. Under the equity method of accounting Blackstone will recognize its allocations of Carried Interest or Incentive Fees within Investment Income along with the allocations proportionate to Blackstone’s ownership interests in the Blackstone Funds. Blackstone will apply a retrospective application and prior periods shall be restated. The impact of adoption is a reclassification of Carried Interest to Investment Income. This change will have no impact on Net Income Attributable to The Blackstone Group L.P. Blackstone has concluded that the majority of its Incentive Fees are not part of a Capital Allocation-Based Arrangement (“Contractual Incentive Fees”), and are within the scope of the amended revenue recognition guidance. This accounting change will delay recognition of Contractual Incentive Fees compared to our current accounting treatment, and it is not expected to have a material impact on Blackstone’s financial statements.
The Partnership is evaluating the impact of the amended revenue recognition guidance on other revenue streams including management fees and considerations for reporting revenue gross versus net.
In February 2016, the FASB issued amended guidance on the accounting for leases. The guidance requires the recognition of lease assets and lease liabilities for those leases classified as operating leases under previous GAAP. The guidance retains a distinction between finance leases and operating leases. The classification criteria for
21
Table of Contents
THE BLACKSTONE GROUP L.P.
Notes to Condensed Consolidated Financial Statements—Continued
(All Dollars Are in Thousands, Except Unit and Per Unit Data, Except Where Noted)
distinguishing between finance leases and operating leases are substantially similar to the classification criteria for distinguishing between capital leases and operating leases under previous GAAP. The recognition, measurement and presentation of expenses and cash flows arising from a lease by a lessee have not changed significantly from previous GAAP.
For operating leases, a lessee is required to do the following: (a) recognize a right-of-use asset and a lease liability, initially measured at the present value of the lease payments, in the Statement of Financial Condition, (b) recognize a single lease cost, calculated so that the cost of the lease is allocated over the lease term on a generally straight-line basis, and (c) classify all cash payments within operating activities in the statement of cash flows.
The guidance is effective for fiscal periods beginning after December 15, 2018. Early application is permitted. Blackstone is evaluating the impact of the amended guidance on the Consolidated Statement of Financial Condition. It is not expected to have a material impact on the Consolidated Statements of Operations or the Consolidated Statements of Cash Flows.
| 3. | INTANGIBLE ASSETS |
Intangible Assets, Net consists of the following:
| March 31, 2017 |
December 31, 2016 |
|||||||
| Finite-Lived Intangible Assets/Contractual Rights |
$ | 1,400,876 | $ | 1,400,876 | ||||
| Accumulated Amortization |
(1,149,236 | ) | (1,138,272 | ) | ||||
|
|
|
|
|
|||||
| Intangible Assets, Net |
$ | 251,640 | $ | 262,604 | ||||
|
|
|
|
|
|||||
Amortization expense associated with Blackstone’s intangible assets was $11.0 million for the three months ended March 31, 2017 and $22.8 million for the three months ended March 31, 2016.
Amortization of Intangible Assets held at March 31, 2017 is expected to be $43.9 million, $43.8 million, $43.8 million, $43.8 million, and $43.8 million for each of the years ending December 31, 2017, 2018, 2019, 2020, and 2021, respectively. Blackstone’s intangible assets as of March 31, 2017 are expected to amortize over a weighted-average period of 5.9 years.
| 4. | INVESTMENTS |
Investments consist of the following:
| March 31, 2017 |
December 31, 2016 |
|||||||
| Investments of Consolidated Blackstone Funds |
$ | 7,202,289 | $ | 6,480,674 | ||||
| Equity Method Investments |
2,955,852 | 3,092,378 | ||||||
| Corporate Treasury Investments |
2,451,274 | 2,518,438 | ||||||
| Performance Fees |
5,213,345 | 5,320,994 | ||||||
| Other Investments |
315,498 | 282,491 | ||||||
|
|
|
|
|
|||||
| $ | 18,138,258 | $ | 17,694,975 | |||||
|
|
|
|
|
|||||
22
Table of Contents
THE BLACKSTONE GROUP L.P.
Notes to Condensed Consolidated Financial Statements—Continued
(All Dollars Are in Thousands, Except Unit and Per Unit Data, Except Where Noted)
Blackstone’s share of Investments of Consolidated Blackstone Funds totaled $384.2 million and $384.4 million at March 31, 2017 and December 31, 2016, respectively.
Investments of Consolidated Blackstone Funds
The following table presents the Realized and Net Change in Unrealized Gains (Losses) on investments held by the consolidated Blackstone Funds and a reconciliation to Other Income — Net Gains from Fund Investment Activities in the Condensed Consolidated Statements of Operations:
| Three Months Ended March 31, |
||||||||
| 2017 | 2016 | |||||||
| Realized Gains |
$ | 55,908 | $ | 13,382 | ||||
| Net Change in Unrealized Losses |
(28,522 | ) | (25,241 | ) | ||||
|
|
|
|
|
|||||
| Realized and Net Change in Unrealized Gains (Losses) from Consolidated Blackstone Funds |
27,386 | (11,859 | ) | |||||
| Interest and Dividend Revenue Attributable to Consolidated Blackstone Funds |
38,746 | 31,001 | ||||||
|
|
|
|
|
|||||
| Other Income — Net Gains from Fund Investment Activities |
$ | 66,132 | $ | 19,142 | ||||
|
|
|
|
|
|||||
Equity Method Investments
Blackstone’s equity method investments include its investments in private equity funds, real estate funds, funds of hedge funds and credit-focused funds and other proprietary investments, which are not consolidated but in which the Partnership exerts significant influence.
Blackstone evaluates each of its equity method investments to determine if any were significant as defined by guidance from the United States Securities and Exchange Commission. As of and for the three months ended March 31, 2017 and 2016, no individual equity method investment held by Blackstone met the significance criteria. As such, Blackstone is not required to present separate financial statements for any of its equity method investments.
The Partnership recognized net gains related to its equity method investments of $168.5 million and $17.6 million for the three months ended March 31, 2017 and 2016, respectively.
Corporate Treasury Investments
The portion of corporate treasury investments included in Investments represents the Partnership’s investments into primarily fixed income securities, mutual fund interests, and other fund interests. These strategies are managed by a combination of Blackstone personnel and third party advisors. The following table presents the Realized and Net Change in Unrealized Gains (Losses) on these investments:
| Three Months Ended March 31, |
||||||||
| 2017 | 2016 | |||||||
| Realized Losses |
$ | (5,681 | ) | $ | (18,609 | ) | ||
| Net Change in Unrealized Gains |
30,480 | 1,783 | ||||||
|
|
|
|
|
|||||
| $ | 24,799 | $ | (16,826 | ) | ||||
|
|
|
|
|
|||||
23
Table of Contents
THE BLACKSTONE GROUP L.P.
Notes to Condensed Consolidated Financial Statements—Continued
(All Dollars Are in Thousands, Except Unit and Per Unit Data, Except Where Noted)
Performance Fees
Performance Fees allocated to the general partner in respect of performance of certain carry funds, funds of hedge funds and credit-focused funds were as follows:
| Private Equity |
Real Estate | Hedge Fund Solutions |
Credit | Total | ||||||||||||||||
| Performance Fees, December 31, 2016 |
$ | 1,984,792 | $ | 2,970,448 | $ | 6,132 | $ | 359,622 | $ | 5,320,994 | ||||||||||
| Performance Fees Allocated as a Result of Changes in Fund Fair Values |
399,477 | 495,505 | 19,404 | 60,964 | 975,350 | |||||||||||||||
| Foreign Exchange Gain |
— | 15,858 | — | — | 15,858 | |||||||||||||||
| Fund Distributions |
(635,706 | ) | (450,940 | ) | (3,347 | ) | (8,864 | ) | (1,098,857 | ) | ||||||||||
|
|
|
|
|
|
|
|
|
|
|
|||||||||||
| Performance Fees, March 31, 2017 |
$ | 1,748,563 | $ | 3,030,871 | $ | 22,189 | $ | 411,722 | $ | 5,213,345 | ||||||||||
|
|
|
|
|
|
|
|
|
|
|
|||||||||||
Other Investments
Other Investments consist primarily of proprietary investment securities held by Blackstone. The following table presents Blackstone’s Realized and Net Change in Unrealized Gains (Losses) in other investments:
| Three Months Ended March 31, | ||||||||
| 2017 | 2016 | |||||||
| Realized Gains |
$ | 5 | $ | 4,733 | ||||
| Net Change in Unrealized Gains (Losses) |
5,488 | (6,235 | ) | |||||
|
|
|
|
|
|||||
| $ | 5,493 | $ | (1,502 | ) | ||||
|
|
|
|
|
|||||
| 5. | NET ASSET VALUE AS FAIR VALUE |
A summary of fair value by strategy type alongside the remaining unfunded commitments and ability to redeem such investments as of March 31, 2017 is presented below:
| Strategy |
Fair Value | Unfunded Commitments |
Redemption Frequency (if currently eligible) |
Redemption Notice Period |
||||||||||||
| Diversified Instruments |
$ | 169,421 | $ | 125 | (a | ) | (a | ) | ||||||||
| Credit Driven |
206,419 | 268 | (b | ) | (b | ) | ||||||||||
| Equity |
59,748 | — | (c | ) | (c | ) | ||||||||||
| Commodities |
2,135 | — | (d | ) | (d | ) | ||||||||||
|
|
|
|
|
|||||||||||||
| $ | 437,723 | $ | 393 | |||||||||||||
|
|
|
|
|
|||||||||||||
| (a) | Diversified Instruments include investments in funds that invest across multiple strategies. Investments representing 4% of the fair value of the investments in this category may not be redeemed at, or within three months of, the reporting date. The remaining 96% of investments in this category are redeemable as of the reporting date. |
| (b) | The Credit Driven category includes investments in hedge funds that invest primarily in domestic and international bonds. Investments representing 43% of the fair value of the investments in this category may not be redeemed at, or within three months of, the reporting date. The remaining 57% of investments in this category are redeemable as of the reporting date. |
24
Table of Contents
THE BLACKSTONE GROUP L.P.
Notes to Condensed Consolidated Financial Statements—Continued
(All Dollars Are in Thousands, Except Unit and Per Unit Data, Except Where Noted)
| (c) | The Equity category includes investments in hedge funds that invest primarily in domestic and international equity securities. Investments representing 100% of the fair value of the investments in this category may not be redeemed at, or within three months of, the reporting date. |
| (d) | The Commodities category includes investments in commodities-focused funds that primarily invest in futures and physical-based commodity driven strategies. Investments representing 100% of the fair value of the investments in this category may not be redeemed at, or within three months of, the reporting date. |
| 6. | DERIVATIVE FINANCIAL INSTRUMENTS |
Blackstone and the consolidated Blackstone Funds enter into derivative contracts in the normal course of business to achieve certain risk management objectives and for general investment purposes. Blackstone may enter into derivative contracts in order to hedge its interest rate risk exposure against the effects of interest rate changes. Additionally, Blackstone may also enter into derivative contracts in order to hedge its foreign currency risk exposure against the effects of a portion of its non-U.S. dollar denominated currency net investments. As a result of the use of derivative contracts, Blackstone and the consolidated Blackstone Funds are exposed to the risk that counterparties will fail to fulfill their contractual obligations. To mitigate such counterparty risk, Blackstone and the consolidated Blackstone Funds enter into contracts with certain major financial institutions, all of which have investment grade ratings. Counterparty credit risk is evaluated in determining the fair value of derivative instruments.
Net Investment Hedges
To manage the potential exposure from adverse changes in currency exchange rates arising from Blackstone’s net investment in foreign operations, during December 2014, Blackstone entered into several foreign currency forward contracts to hedge a portion of the net investment in Blackstone’s non-U.S. dollar denominated foreign operations.
Blackstone uses foreign currency forward contracts to hedge portions of Blackstone’s net investments in foreign operations. The gains and losses due to change in fair value attributable to changes in spot exchange rates on foreign currency derivatives designated as net investment hedges were recognized in Other Comprehensive Income, Net of Tax — Currency Translation Adjustment. For the three months ended March 31, 2017 the resulting loss was $0.6 million.
Freestanding Derivatives
Freestanding derivatives are instruments that Blackstone and certain of the consolidated Blackstone Funds have entered into as part of their overall risk management and investment strategies. These derivative contracts are not designated as hedging instruments for accounting purposes. Such contracts may include interest rate swaps, foreign exchange contracts, equity swaps, options, futures and other derivative contracts.
25
Table of Contents
THE BLACKSTONE GROUP L.P.
Notes to Condensed Consolidated Financial Statements—Continued
(All Dollars Are in Thousands, Except Unit and Per Unit Data, Except Where Noted)
The table below summarizes the aggregate notional amount and fair value of the derivative financial instruments. The notional amount represents the absolute value amount of all outstanding derivative contracts.
| March 31, 2017 | December 31, 2016 | |||||||||||||||||||||||||||||||
| Assets | Liabilities | Assets | Liabilities | |||||||||||||||||||||||||||||
| Notional | Fair Value |
Notional | Fair Value |
Notional | Fair Value |
Notional | Fair Value |
|||||||||||||||||||||||||
| Net Investment Hedges |
||||||||||||||||||||||||||||||||
| Foreign Currency Contracts |
$ | 55,678 | $ | 771 | $ | — | $ | — | $ | — | $ | — | $ | 51,267 | $ | 587 | ||||||||||||||||
|
|
|
|
|
|
|
|
|
|
|
|
|
|
|
|
|
|||||||||||||||||
| Freestanding Derivatives |
||||||||||||||||||||||||||||||||
| Blackstone |
||||||||||||||||||||||||||||||||
| Interest Rate Contracts |
1,883,697 | 1,658 | 512,719 | 2,239 | 2,651,583 | 2,356 | 546,211 | 2,355 | ||||||||||||||||||||||||
| Foreign Currency Contracts |
213,764 | 2,411 | 209,298 | 1,751 | 164,247 | 1,037 | 127,444 | 966 | ||||||||||||||||||||||||
| Credit Default Swaps |
— | — | 3,000 | 351 | — | — | 3,819 | 215 | ||||||||||||||||||||||||
| Investments of Consolidated |
||||||||||||||||||||||||||||||||
| Blackstone Funds |
||||||||||||||||||||||||||||||||
| Foreign Currency Contracts |
279,646 | 23,930 | 149,656 | 1,861 | 254,162 | 25,050 | 136,025 | 3,903 | ||||||||||||||||||||||||
| Credit Default Swaps |
— | — | 119,625 | 1,788 | — | — | 113,057 | 3,350 | ||||||||||||||||||||||||
|
|
|
|
|
|
|
|
|
|
|
|
|
|
|
|
|
|||||||||||||||||
| 2,377,107 | 27,999 | 994,298 | 7,990 | 3,069,992 | 28,443 | 926,556 | 10,789 | |||||||||||||||||||||||||
|
|
|
|
|
|
|
|
|
|
|
|
|
|
|
|
|
|||||||||||||||||
| Total |
$ | 2,432,785 | $ | 28,770 | $ | 994,298 | $ | 7,990 | $ | 3,069,992 | $ | 28,443 | $ | 977,823 | $ | 11,376 | ||||||||||||||||
|
|
|
|
|
|
|
|
|
|
|
|
|
|
|
|
|
|||||||||||||||||
The table below summarizes the impact to the Condensed Consolidated Statements of Operations from derivative financial instruments:
| Three Months Ended March 31, |
||||||||
| 2017 | 2016 | |||||||
| Net Investment Hedges — Foreign Currency Contracts |
||||||||
| Hedge Ineffectiveness |
$ | (22 | ) | $ | 129 | |||
|
|
|
|
|
|||||
| Freestanding Derivatives |
||||||||
| Realized Gains (Losses) |
||||||||
| Interest Rate Contracts |
$ | (940 | ) | $ | (7,358 | ) | ||
| Foreign Currency Contracts |
1,420 | (4,310 | ) | |||||
| Credit Default Swaps |
5 | (3,811 | ) | |||||
|
|
|
|
|
|||||
| Total |
$ | 485 | $ | (15,479 | ) | |||
|
|
|
|
|
|||||
| Net Change in Unrealized Gains (Losses) |
||||||||
| Interest Rate Contracts |
$ | (217 | ) | $ | (2,666 | ) | ||
| Foreign Currency Contracts |
(1,960 | ) | 15,322 | |||||
| Credit Default Swaps |
1,947 | (4,276 | ) | |||||
|
|
|
|
|
|||||
| Total |
$ | (230 | ) | $ | 8,380 | |||
|
|
|
|
|
|||||
As of March 31, 2017 and December 31, 2016, the Partnership had not designated any derivatives as cash flow hedges.
26
Table of Contents
THE BLACKSTONE GROUP L.P.
Notes to Condensed Consolidated Financial Statements—Continued
(All Dollars Are in Thousands, Except Unit and Per Unit Data, Except Where Noted)
| 7. | FAIR VALUE OPTION |
The following table summarizes the financial instruments for which the fair value option has been elected:
| March 31, 2017 |
December 31, 2016 |
|||||||
| Assets |
||||||||
| Loans and Receivables |
$ | 112,056 | $ | 211,359 | ||||
| Equity and Preferred Securities |
466,219 | 444,713 | ||||||
| Assets of Consolidated CLO Vehicles |
||||||||
| Corporate Loans |
5,587,151 | 4,762,071 | ||||||
| Corporate Bonds |
623,944 | 710,947 | ||||||
|
|
|
|
|
|||||
| $ | 6,789,370 | $ | 6,129,090 | |||||
|
|
|
|
|
|||||
| Liabilities |
||||||||
| Liabilities of Consolidated CLO Vehicles |
||||||||
| Senior Secured Notes |
$ | 6,027,719 | $ | 5,125,804 | ||||
| Subordinated Notes |
||||||||
| Loans Payable |
355,694 | 337,846 | ||||||
| Due to Affiliates |
7,065 | 7,748 | ||||||
|
|
|
|
|
|||||
| $ | 6,390,478 | $ | 5,471,398 | |||||
|
|
|
|
|
|||||
The following table presents the Realized and Net Change in Unrealized Gains (Losses) on financial instruments on which the fair value option was elected:
| Three Months Ended March 31, | ||||||||||||||||
| 2017 | 2016 | |||||||||||||||
| Realized Gains |
Net Change in Unrealized Gains (Losses) |
Realized Gains (Losses) |
Net Change in Unrealized Gains (Losses) |
|||||||||||||
| Assets |
||||||||||||||||
| Loans and Receivables |
$ | — | $ | 7,418 | $ | — | $ | (3,778 | ) | |||||||
| Equity and Preferred Securities |
— | 13,109 | 3 | (3,832 | ) | |||||||||||
| Debt Securities |
— | — | — | (689 | ) | |||||||||||
| Assets of Consolidated CLO Vehicles |
||||||||||||||||
| Corporate Loans |
1,872 | (11,389 | ) | (13,707 | ) | 957 | ||||||||||
| Corporate Bonds |
5,634 | (5,874 | ) | 190 | 271 | |||||||||||
| Other |
— | — | 178 | — | ||||||||||||
|
|
|
|
|
|
|
|
|
|||||||||
| $ | 7,506 | $ | 3,264 | $ | (13,336 | ) | $ | (7,071 | ) | |||||||
|
|
|
|
|
|
|
|
|
|||||||||
| Liabilities |
||||||||||||||||
| Liabilities of Consolidated CLO Vehicles |
||||||||||||||||
| Subordinated Notes |
$ | — | $ | 7,912 | $ | — | $ | 12,413 | ||||||||
|
|
|
|
|
|
|
|
|
|||||||||
27
Table of Contents
THE BLACKSTONE GROUP L.P.
Notes to Condensed Consolidated Financial Statements—Continued
(All Dollars Are in Thousands, Except Unit and Per Unit Data, Except Where Noted)
The following table presents information for those financial instruments for which the fair value option was elected:
| March 31, 2017 | December 31, 2016 | |||||||||||||||||||||||
| For Financial Assets Past Due (a) |
For Financial Assets Past Due (a) |
|||||||||||||||||||||||
| Excess (Deficiency) of Fair Value Over Principal |
Fair Value |
Excess of Fair Value Over Principal |
Excess (Deficiency) of Fair Value Over Principal |
Fair Value |
Excess of Fair Value Over Principal |
|||||||||||||||||||
| Loans and Receivables |
$ | 897 | $ | — | $ | — | $ | (6,476 | ) | $ | — | $ | — | |||||||||||
| Assets of Consolidated CLO Vehicles |
||||||||||||||||||||||||
| Corporate Loans |
(6,631 | ) | — | — | 2,616 | — | — | |||||||||||||||||
| Corporate Bonds |
4,162 | — | — | 7,259 | — | — | ||||||||||||||||||
|
|
|
|
|
|
|
|
|
|
|
|
|
|||||||||||||
| $ | (1,572 | ) | $ | — | $ | — | $ | 3,399 | $ | — | $ | — | ||||||||||||
|
|
|
|
|
|
|
|
|
|
|
|
|
|||||||||||||
| (a) | Corporate Loans and Corporate Bonds within CLO assets are classified as past due if contractual payments are more than one day past due. |
As of March 31, 2017 and December 31, 2016, no Loans and Receivables for which the fair value option was elected were past due or in non-accrual status. As of March 31, 2017 and December 31, 2016, no Corporate Bonds included within the Assets of Consolidated CLO Vehicles for which the fair value option was elected were past due or in non-accrual status.
28
Table of Contents
THE BLACKSTONE GROUP L.P.
Notes to Condensed Consolidated Financial Statements—Continued
(All Dollars Are in Thousands, Except Unit and Per Unit Data, Except Where Noted)
| 8. | FAIR VALUE MEASUREMENTS OF FINANCIAL INSTRUMENTS |
The following tables summarize the valuation of the Partnership’s financial assets and liabilities by the fair value hierarchy:
| March 31, 2017 | ||||||||||||||||||||
| Level I | Level II | Level III | NAV | Total | ||||||||||||||||
| Assets |
||||||||||||||||||||
| Cash and Cash Equivalents — Money Market Funds |
$ | 988,676 | $ | — | $ | — | $ | — | $ | 988,676 | ||||||||||
|
|
|
|
|
|
|
|
|
|
|
|||||||||||
| Investments |
||||||||||||||||||||
| Investments of Consolidated Blackstone Funds (a) |
||||||||||||||||||||
| Investment Funds |
— | — | — | 148,665 | 148,665 | |||||||||||||||
| Equity Securities |
63,158 | 58,922 | 113,797 | — | 235,877 | |||||||||||||||
| Partnership and LLC Interests |
— | 20,870 | 333,616 | — | 354,486 | |||||||||||||||
| Debt Instruments |
— | 219,752 | 8,484 | — | 228,236 | |||||||||||||||
| Freestanding Derivatives — Foreign Currency Contracts |
— | 2,337 | — | — | 2,337 | |||||||||||||||
| Assets of Consolidated CLO Vehicles |
||||||||||||||||||||
| Corporate Loans |
— | 5,357,082 | 230,069 | — | 5,587,151 | |||||||||||||||
| Corporate Bonds |
— | 623,944 | — | — | 623,944 | |||||||||||||||
| Freestanding Derivatives — Foreign Currency Contracts |
— | 21,593 | — | — | 21,593 | |||||||||||||||
|
|
|
|
|
|
|
|
|
|
|
|||||||||||
| Total Investments of Consolidated Blackstone Funds |
63,158 | 6,304,500 | 685,966 | 148,665 | 7,202,289 | |||||||||||||||
|
|
|
|
|
|
|
|
|
|
|
|||||||||||
| Corporate Treasury Investments |
||||||||||||||||||||
| Equity Securities |
290,946 | — | — | — | 290,946 | |||||||||||||||
| Debt Instruments |
— | 1,861,996 | 28,803 | 55,874 | 1,946,673 | |||||||||||||||
| Other |
— | — | — | 213,655 | 213,655 | |||||||||||||||
|
|
|
|
|
|
|
|
|
|
|
|||||||||||
| Total Corporate Treasury Investments |
290,946 | 1,861,996 | 28,803 | 269,529 | 2,451,274 | |||||||||||||||
|
|
|
|
|
|
|
|
|
|
|
|||||||||||
| Other Investments |
175,660 | 10,679 | 109,630 | 19,529 | 315,498 | |||||||||||||||
|
|
|
|
|
|
|
|
|
|
|
|||||||||||
| Total Investments |
529,764 | 8,177,175 | 824,399 | 437,723 | 9,969,061 | |||||||||||||||
|
|
|
|
|
|
|
|
|
|
|
|||||||||||
| Accounts Receivable — Loans and Receivables |
— | — | 112,056 | — | 112,056 | |||||||||||||||
|
|
|
|
|
|
|
|
|
|
|
|||||||||||
| Other Assets |
||||||||||||||||||||
| Freestanding Derivatives |
||||||||||||||||||||
| Interest Rate Contracts |
871 | 787 | — | — | 1,658 | |||||||||||||||
| Foreign Currency Contracts |
— | 2,411 | — | — | 2,411 | |||||||||||||||
|
|
|
|
|
|
|
|
|
|
|
|||||||||||
| Total Freestanding Derivatives |
871 | 3,198 | — | — | 4,069 | |||||||||||||||
| Net Investment Hedges — Foreign Currency Contracts |
— | 771 | — | — | 771 | |||||||||||||||
|
|
|
|
|
|
|
|
|
|
|
|||||||||||
| Total Other Assets |
871 | 3,969 | — | — | 4,840 | |||||||||||||||
|
|
|
|
|
|
|
|
|
|
|
|||||||||||
| $ | 1,519,311 | $ | 8,181,144 | $ | 936,455 | $ | 437,723 | $ | 11,074,633 | |||||||||||
|
|
|
|
|
|
|
|
|
|
|
|||||||||||
29
Table of Contents
THE BLACKSTONE GROUP L.P.
Notes to Condensed Consolidated Financial Statements—Continued
(All Dollars Are in Thousands, Except Unit and Per Unit Data, Except Where Noted)
| March 31, 2017 | ||||||||||||||||
| Level I | Level II | Level III | Total | |||||||||||||
| Liabilities |
||||||||||||||||
| Loans Payable — Liabilities of Consolidated CLO Vehicles (a) |
||||||||||||||||
| Senior Secured Notes (b) |
$ | — | $ | 6,027,719 | $ | — | $ | 6,027,719 | ||||||||
| Subordinated Notes (b) |
— | 355,694 | — | 355,694 | ||||||||||||
|
|
|
|
|
|
|
|
|
|||||||||
| Total Loans Payable |
— | 6,383,413 | — | 6,383,413 | ||||||||||||
|
|
|
|
|
|
|
|
|
|||||||||
| Due to Affiliates — Liabilities of Consolidated CLO Vehicles (a) |
||||||||||||||||
| Subordinated Notes (b) |
— | 7,065 | — | 7,065 | ||||||||||||
|
|
|
|
|
|
|
|
|
|||||||||
| Total Due to Affiliates |
— | 7,065 | — | 7,065 | ||||||||||||
|
|
|
|
|
|
|
|
|
|||||||||
| Securities Sold, Not Yet Purchased |
— | 178,448 | — | 178,448 | ||||||||||||
|
|
|
|
|
|
|
|
|
|||||||||
| Accounts Payable, Accrued Expenses and Other Liabilities |
||||||||||||||||
| Liabilities of Consolidated Blackstone Funds — Freestanding Derivatives (a) |
||||||||||||||||
| Foreign Currency Contracts |
— | 1,861 | — | 1,861 | ||||||||||||
| Credit Default Swaps |
— | 1,788 | — | 1,788 | ||||||||||||
|
|
|
|
|
|
|
|
|
|||||||||
| Total Liabilities of Consolidated Blackstone Funds |
— | 3,649 | — | 3,649 | ||||||||||||
|
|
|
|
|
|
|
|
|
|||||||||
| Freestanding Derivatives |
||||||||||||||||
| Interest Rate Contracts |
988 | 1,251 | — | 2,239 | ||||||||||||
| Foreign Currency Contracts |
— | 1,751 | — | 1,751 | ||||||||||||
| Credit Default Swaps |
— | 351 | — | 351 | ||||||||||||
|
|
|
|
|
|
|
|
|
|||||||||
| Total Freestanding Derivatives |
988 | 3,353 | — | 4,341 | ||||||||||||
|
|
|
|
|
|
|
|
|
|||||||||
| Total Accounts Payable, Accrued Expenses and Other Liabilities |
988 | 7,002 | — | 7,990 | ||||||||||||
|
|
|
|
|
|
|
|
|
|||||||||
| $ | 988 | $ | 6,575,928 | $ | — | $ | 6,576,916 | |||||||||
|
|
|
|
|
|
|
|
|
|||||||||
30
Table of Contents
THE BLACKSTONE GROUP L.P.
Notes to Condensed Consolidated Financial Statements—Continued
(All Dollars Are in Thousands, Except Unit and Per Unit Data, Except Where Noted)
| December 31, 2016 | ||||||||||||||||||||
| Level I | Level II | Level III | NAV | Total | ||||||||||||||||
| Assets |
||||||||||||||||||||
| Cash and Cash Equivalents — Money Market Funds |
$ | 443,442 | $ | — | $ | — | $ | — | $ | 443,442 | ||||||||||
|
|
|
|
|
|
|
|
|
|
|
|||||||||||
| Investments |
||||||||||||||||||||
| Investments of Consolidated Blackstone Funds (a) |
||||||||||||||||||||
| Investment Funds |
— | — | — | 148,993 | 148,993 | |||||||||||||||
| Equity Securities |
76,381 | 70,544 | 93,657 | — | 240,582 | |||||||||||||||
| Partnership and LLC Interests |
— | 29,430 | 337,230 | — | 366,660 | |||||||||||||||
| Debt Instruments |
— | 219,049 | 7,322 | — | 226,371 | |||||||||||||||
| Freestanding Derivatives — Foreign Currency Contracts |
— | 2,327 | — | — | 2,327 | |||||||||||||||
| Assets of Consolidated CLO Vehicles |
||||||||||||||||||||
| Corporate Loans |
— | 4,514,407 | 247,664 | — | 4,762,071 | |||||||||||||||
| Corporate Bonds |
— | 710,947 | — | — | 710,947 | |||||||||||||||
| Freestanding Derivatives — Foreign Currency Contracts |
— | 22,723 | — | — | 22,723 | |||||||||||||||
|
|
|
|
|
|
|
|
|
|
|
|||||||||||
| Total Investments of Consolidated Blackstone Funds |
76,381 | 5,569,427 | 685,873 | 148,993 | 6,480,674 | |||||||||||||||
|
|
|
|
|
|
|
|
|
|
|
|||||||||||
| Corporate Treasury Investments |
||||||||||||||||||||
| Equity Securities |
281,505 | — | — | — | 281,505 | |||||||||||||||
| Debt Instruments |
— | 1,944,171 | 30,424 | 54,907 | 2,029,502 | |||||||||||||||
| Other |
— | — | — | 207,431 | 207,431 | |||||||||||||||
|
|
|
|
|
|
|
|
|
|
|
|||||||||||
| Total Corporate Treasury Investments |
281,505 | 1,944,171 | 30,424 | 262,338 | 2,518,438 | |||||||||||||||
|
|
|
|
|
|
|
|
|
|
|
|||||||||||
| Other Investments |
163,548 | — | 100,164 | 18,779 | 282,491 | |||||||||||||||
|
|
|
|
|
|
|
|
|
|
|
|||||||||||
| Total Investments |
521,434 | 7,513,598 | 816,461 | 430,110 | 9,281,603 | |||||||||||||||
|
|
|
|
|
|
|
|
|
|
|
|||||||||||
| Accounts Receivable — Loans and Receivables |
— | — | 211,359 | — | 211,359 | |||||||||||||||
|
|
|
|
|
|
|
|
|
|
|
|||||||||||
| Other Assets |
||||||||||||||||||||
| Freestanding Derivatives |
||||||||||||||||||||
| Interest Rate Contracts |
1,883 | 473 | — | — | 2,356 | |||||||||||||||
| Foreign Currency Contracts |
— | 1,037 | — | — | 1,037 | |||||||||||||||
|
|
|
|
|
|
|
|
|
|
|
|||||||||||
| Total Freestanding Derivatives |
1,883 | 1,510 | — | — | 3,393 | |||||||||||||||
|
|
|
|
|
|
|
|
|
|
|
|||||||||||
| Total Other Assets |
1,883 | 1,510 | — | — | 3,393 | |||||||||||||||
|
|
|
|
|
|
|
|
|
|
|
|||||||||||
| $ | 966,759 | $ | 7,515,108 | $ | 1,027,820 | $ | 430,110 | $ | 9,939,797 | |||||||||||
|
|
|
|
|
|
|
|
|
|
|
|||||||||||
31
Table of Contents
THE BLACKSTONE GROUP L.P.
Notes to Condensed Consolidated Financial Statements—Continued
(All Dollars Are in Thousands, Except Unit and Per Unit Data, Except Where Noted)
| December 31, 2016 | ||||||||||||||||
| Level I | Level II | Level III | Total | |||||||||||||
| Liabilities |
||||||||||||||||
| Loans Payable — Liabilities of Consolidated CLO Vehicles (a) |
||||||||||||||||
| Senior Secured Notes (b) |
$ | — | $ | 5,125,804 | $ | — | $ | 5,125,804 | ||||||||
| Subordinated Notes (b) |
— | 337,846 | — | 337,846 | ||||||||||||
|
|
|
|
|
|
|
|
|
|||||||||
| Total Loans Payable |
— | 5,463,650 | — | 5,463,650 | ||||||||||||
|
|
|
|
|
|
|
|
|
|||||||||
| Due to Affiliates — Liabilities of Consolidated CLO Vehicles (a) |
||||||||||||||||
| Subordinated Notes (b) |
— | 7,748 | — | 7,748 | ||||||||||||
|
|
|
|
|
|
|
|
|
|||||||||
| Total Due to Affiliates |
— | 7,748 | — | 7,748 | ||||||||||||
|
|
|
|
|
|
|
|
|
|||||||||
| Securities Sold, Not Yet Purchased |
— | 215,398 | — | 215,398 | ||||||||||||
|
|
|
|
|
|
|
|
|
|||||||||
| Accounts Payable, Accrued Expenses and Other Liabilities |
||||||||||||||||
| Liabilities of Consolidated Blackstone Funds — Freestanding Derivatives (a) |
||||||||||||||||
| Foreign Currency Contracts |
— | 3,903 | — | 3,903 | ||||||||||||
| Credit Default Swaps |
— | 3,350 | — | 3,350 | ||||||||||||
|
|
|
|
|
|
|
|
|
|||||||||
| Total Liabilities of Consolidated Blackstone Funds |
— | 7,253 | — | 7,253 | ||||||||||||
|
|
|
|
|
|
|
|
|
|||||||||
| Freestanding Derivatives |
||||||||||||||||
| Interest Rate Contracts |
750 | 1,605 | — | 2,355 | ||||||||||||
| Foreign Currency Contracts |
— | 966 | — | 966 | ||||||||||||
| Credit Default Swaps |
— | 215 | — | 215 | ||||||||||||
|
|
|
|
|
|
|
|
|
|||||||||
| Total Freestanding Derivatives |
750 | 2,786 | — | 3,536 | ||||||||||||
|
|
|
|
|
|
|
|
|
|||||||||
| Net Investment Hedges — Foreign Currency Contracts |
— | 587 | — | 587 | ||||||||||||
|
|
|
|
|
|
|
|
|
|||||||||
| Total Accounts Payable, Accrued Expenses and Other Liabilities |
750 | 10,626 | — | 11,376 | ||||||||||||
|
|
|
|
|
|
|
|
|
|||||||||
| $ | 750 | $ | 5,697,422 | $ | — | $ | 5,698,172 | |||||||||
|
|
|
|
|
|
|
|
|
|||||||||
| (a) | Pursuant to GAAP consolidation guidance, the Partnership is required to consolidate all VIEs in which it has been identified as the primary beneficiary, including certain CLO vehicles, and other funds in which a consolidated entity of the Partnership, as the general partner of the fund, has a controlling financial interest. While the Partnership is required to consolidate certain funds, including CLO vehicles, for GAAP purposes, the Partnership has no ability to utilize the assets of these funds and there is no recourse to the Partnership for their liabilities since these are client assets and liabilities. |
| (b) | Senior and subordinate notes issued by CLO vehicles are classified based on the more observable fair value of CLO assets less (a) the fair value of any beneficial interests held by Blackstone, and (b) the carrying value of any beneficial interests that represent compensation for services. |
The following table summarizes the fair value transfers between Level I and Level II for positions that existed as of March 31, 2017 and 2016, respectively:
| Three Months Ended March 31, |
||||||||
| 2017 | 2016 | |||||||
| Transfers from Level I into Level II (a) |
$ | — | $ | 2,114 | ||||
| Transfers from Level II into Level I (b) |
$ | — | $ | 28,346 | ||||
| (a) | Transfers out of Level I represent those financial instruments for which restrictions exist and adjustments were made to an otherwise observable price to reflect fair value at the reporting date. |
| (b) | Transfers into Level I represent those financial instruments for which an unadjusted quoted price in an active market became available for the identical asset. |
32
Table of Contents
THE BLACKSTONE GROUP L.P.
Notes to Condensed Consolidated Financial Statements—Continued
(All Dollars Are in Thousands, Except Unit and Per Unit Data, Except Where Noted)
The following table summarizes the quantitative inputs and assumptions used for items categorized in Level III of the fair value hierarchy as of March 31, 2017:
| Fair Value | Valuation Techniques |
Unobservable Inputs |
Ranges | Weighted Average (a) |
||||||||||||||||
| Financial Assets |
||||||||||||||||||||
| Investments of Consolidated Blackstone Funds |
||||||||||||||||||||
| Equity Securities |
$ | 61,375 | Discounted Cash Flows | Discount Rate | 7.3% - 29.1% | 12.8% | ||||||||||||||
| Revenue CAGR | -0.6% - 39.7% | 7.0% | ||||||||||||||||||
| Exit Capitalization Rate | 5.3% - 11.4% | 8.6% | ||||||||||||||||||
| Exit Multiple - EBITDA | 1.9x - 19.0x | 9.7x | ||||||||||||||||||
| Exit Multiple - P/E | 9.5x - 17.0x | 10.1x | ||||||||||||||||||
| 2,497 | Market Comparable Companies | Book Value Multiple | 0.9x | N/A | ||||||||||||||||
| EBITDA Multiple | 8.0x | N/A | ||||||||||||||||||
| 18,088 | Other | N/A | N/A | N/A | ||||||||||||||||
| 1,705 | Third Party Pricing | N/A | N/A | N/A | ||||||||||||||||
| 30,132 | Transaction Price | N/A | N/A | N/A | ||||||||||||||||
| Partnership and LLC Interests |
301,370 | Discounted Cash Flows | Discount Rate | 4.5% - 27.6% | 9.2% | |||||||||||||||
| Revenue CAGR | -7.3% - 28.9% | 6.9% | ||||||||||||||||||
| Exit Capitalization Rate | 3.0% - 11.0% | 5.8% | ||||||||||||||||||
| Exit Multiple - EBITDA | 0.2x - 18.7x | 10.8x | ||||||||||||||||||
| Exit Multiple - P/E | 9.3x | N/A | ||||||||||||||||||
| 530 | Market Comparable Companies | Book Value Multiple | 1.0x | N/A | ||||||||||||||||
| 14,018 | Other | N/A | N/A | N/A | ||||||||||||||||
| 2,254 | Third Party Pricing | N/A | N/A | N/A | ||||||||||||||||
| 15,444 | Transaction Price | N/A | N/A | N/A | ||||||||||||||||
| Debt Instruments |
4,942 | Discounted Cash Flows | Discount Rate | 8.9% - 20.0% | 10.6% | |||||||||||||||
| Revenue CAGR | 5.1% | N/A | ||||||||||||||||||
| Exit Capitalization Rate | 4.7% - 8.3% | 7.4% | ||||||||||||||||||
| Exit Multiple - EBITDA | 12.0x | N/A | ||||||||||||||||||
| 2,089 | Third Party Pricing | N/A | N/A | N/A | ||||||||||||||||
| 1,453 | Transaction Price | N/A | N/A | N/A | ||||||||||||||||
| Assets of Consolidated CLO Vehicles |
14,183 | Market Comparable Companies | EBITDA Multiple | 9.6x | N/A | |||||||||||||||
| 215,886 | Third Party Pricing | N/A | N/A | N/A | ||||||||||||||||
|
|
|
|||||||||||||||||||
| Total Investments of Consolidated Blackstone Funds |
685,966 | |||||||||||||||||||
continued …
33
Table of Contents
THE BLACKSTONE GROUP L.P.
Notes to Condensed Consolidated Financial Statements—Continued
(All Dollars Are in Thousands, Except Unit and Per Unit Data, Except Where Noted)
| Fair Value | Valuation Techniques |
Unobservable Inputs |
Ranges | Weighted Average (a) |
||||||||||||||||
| Corporate Treasury Investments |
$ | 9,969 | Discounted Cash Flows | Discount Rate | 5.1% - 10.2% | 6.5% | ||||||||||||||
| Default Rate | 1.3% - 2.0% | 1.9% | ||||||||||||||||||
| Pre-payment Rate | 20.0% | N/A | ||||||||||||||||||
| Recovery Lag | 12 Months | N/A | ||||||||||||||||||
| Recovery Rate | 6.3% - 79.0% | 66.4% | ||||||||||||||||||
| Reinvestment Rate | LIBOR + 350 bps - | LIBOR + 391 bps | ||||||||||||||||||
| LIBOR + 400 bps | ||||||||||||||||||||
| 18,834 | Third Party Pricing | N/A | N/A | N/A | ||||||||||||||||
| Loans and Receivables |
112,056 | Discounted Cash Flows | Discount Rate | 8.4% - 14.3% | 12.3% | |||||||||||||||
| Other Investments |
79,977 | Discounted Cash Flows | Discount Rate | 0.6% - 15.0% | 2.7% | |||||||||||||||
| Default Rate | 2.0% | N/A | ||||||||||||||||||
| Pre-payment Rate | 20.0% | N/A | ||||||||||||||||||
| Recovery Lag | 12 Months | N/A | ||||||||||||||||||
| Recovery Rate | 70.0% | N/A | ||||||||||||||||||
| Reinvestment Rate | LIBOR + 400 bps | N/A | ||||||||||||||||||
| 29,653 | Transaction Price | N/A | N/A | N/A | ||||||||||||||||
|
|
|
|||||||||||||||||||
| Total |
$ | 936,455 | ||||||||||||||||||
|
|
|
|||||||||||||||||||
34
Table of Contents
THE BLACKSTONE GROUP L.P.
Notes to Condensed Consolidated Financial Statements—Continued
(All Dollars Are in Thousands, Except Unit and Per Unit Data, Except Where Noted)
The following table summarizes the quantitative inputs and assumptions used for items categorized in Level III of the fair value hierarchy as of December 31, 2016:
| Fair Value | Valuation Techniques |
Unobservable Inputs |
Ranges | Weighted Average (a) |
||||||||||||||||
| Financial Assets |
||||||||||||||||||||
| Investments of Consolidated Blackstone Funds |
||||||||||||||||||||
| Equity Securities |
$ | 58,826 | Discounted Cash Flows | Discount Rate | 7.3% - 28.7% | 12.7% | ||||||||||||||
| Revenue CAGR | -0.2% - 20.1% | 6.3% | ||||||||||||||||||
| Exit Capitalization Rate | 5.0% - 11.4% | 8.5% | ||||||||||||||||||
| Exit Multiple - EBITDA | 4.0x - 20.0x | 10.0x | ||||||||||||||||||
| Exit Multiple - P/E | 10.5x - 17.0x | 11.0x | ||||||||||||||||||
| 2,032 | Market Comparable Companies | Book Value Multiple | 0.9x | N/A | ||||||||||||||||
| 22,843 | Other | N/A | N/A | N/A | ||||||||||||||||
| 9,956 | Transaction Price | N/A | N/A | N/A | ||||||||||||||||
| Partnership and LLC Interests |
303,281 | Discounted Cash Flows | Discount Rate | 3.4% - 27.6% | 9.4% | |||||||||||||||
| Revenue CAGR | -27.1% - 47.3% | 7.2% | ||||||||||||||||||
| Exit Capitalization Rate | 3.0% - 11.0% | 6.0% | ||||||||||||||||||
| Exit Multiple - EBITDA | 3.9x - 18.3x | 10.5x | ||||||||||||||||||
| Exit Multiple - P/E | 9.3x | N/A | ||||||||||||||||||
| 13,945 | Market Comparable Companies | Capitalization Rate | 5.0% - 5.6% | 5.2% | ||||||||||||||||
| 12,916 | Other | N/A | N/A | N/A | ||||||||||||||||
| 1,238 | Third Party Pricing | N/A | N/A | N/A | ||||||||||||||||
| 5,850 | Transaction Price | N/A | N/A | N/A | ||||||||||||||||
| Debt Instruments |
5,002 | Discounted Cash Flows | Discount Rate | 8.3% - 20.0% | 12.9% | |||||||||||||||
| Revenue CAGR | 4.8% - 70.8% | 33.8% | ||||||||||||||||||
| Exit Capitalization Rate | 4.7% - 8.3% | 7.5% | ||||||||||||||||||
| Exit Multiple - EBITDA | 9.6x - 12.0x | 11.0x | ||||||||||||||||||
| 2,227 | Third Party Pricing | N/A | N/A | N/A | ||||||||||||||||
| 93 | Transaction Price | N/A | N/A | N/A | ||||||||||||||||
| Assets of Consolidated CLO Vehicles |
13,723 | Market Comparable Companies | EBITDA Multiple | 9.6x | N/A | |||||||||||||||
| 233,941 | Third Party Pricing | N/A | N/A | N/A | ||||||||||||||||
|
|
|
|||||||||||||||||||
| Total Investments of Consolidated Blackstone Funds |
685,873 | |||||||||||||||||||
continued …
35
Table of Contents
THE BLACKSTONE GROUP L.P.
Notes to Condensed Consolidated Financial Statements—Continued
(All Dollars Are in Thousands, Except Unit and Per Unit Data, Except Where Noted)
| Fair Value | Valuation Techniques |
Unobservable Inputs |
Ranges | Weighted Average (a) | ||||||||||
| Corporate Treasury Investments |
$ | 9,783 | Discounted Cash Flows | Discount Rate | 6.1% - 10.0% | 7.1% | ||||||||
| Default Rate | 1.0% - 2.0% | 1.8% | ||||||||||||
| Pre-payment Rate | 20.0% | N/A | ||||||||||||
| Recovery Lag | 12 Months | N/A | ||||||||||||
| Recovery Rate | 18.5% - 76.5% | 66.4% | ||||||||||||
| Reinvestment Rate | LIBOR + 350 bps - | LIBOR + 390 bps | ||||||||||||
| LIBOR + 400 bps | ||||||||||||||
| 20,641 | Third Party Pricing | N/A | N/A | N/A | ||||||||||
| Loans and Receivables |
211,359 | Discounted Cash Flows | Discount Rate | 12.0% - 16.4% | 13.3% | |||||||||
| Other Investments |
78,619 | Discounted Cash Flows | Discount Rate | 1.2% - 15.0% | 3.1% | |||||||||
| Default Rate | 2.0% | N/A | ||||||||||||
| Pre-payment Rate | 20.0% | N/A | ||||||||||||
| Recovery Lag | 12 Months | N/A | ||||||||||||
| Recovery Rate | 70.0% | N/A | ||||||||||||
| Reinvestment Rate | LIBOR + 400 bps | N/A | ||||||||||||
| 21,545 | Transaction Price | N/A | N/A | N/A | ||||||||||
|
|
|
|||||||||||||
| Total |
$ | 1,027,820 | ||||||||||||
|
|
|
|||||||||||||
| N/A | Not applicable. | |
| CAGR | Compound annual growth rate. | |
| EBITDA | Earnings before interest, taxes, depreciation and amortization. | |
| Exit Multiple | Ranges include the last twelve months EBITDA, forward EBITDA and price/earnings exit multiples. | |
| Third Party Pricing | Third Party Pricing is generally determined on the basis of unadjusted prices between market participants provided by reputable dealers or pricing services. | |
| Transaction Price | Includes recent acquisitions or transactions. | |
| (a) | Unobservable inputs were weighted based on the fair value of the investments included in the range. |
The significant unobservable inputs used in the fair value measurement of corporate treasury investments, debt instruments and other investments are discount rates, default rates, recovery rates, recovery lag, pre-payment rates and reinvestment rates. Increases (decreases) in any of the discount rates, default rates, recovery lag and pre-payment rates in isolation would result in a lower (higher) fair value measurement. Increases (decreases) in any of the recovery rates and reinvestment rates in isolation would result in a higher (lower) fair value measurement. Generally, a change in the assumption used for default rates may be accompanied by a directionally similar change in the assumption used for recovery lag and a directionally opposite change in the assumption used for recovery rates and pre-payment rates.
The significant unobservable inputs used in the fair value measurement of equity securities, partnership and LLC interests, debt instruments, assets of consolidated CLO vehicles and loans and receivables are discount rates, exit capitalization rates, exit multiples, EBITDA multiples and revenue compound annual growth rates. Increases (decreases) in any of discount rates and exit capitalization rates in isolation can result in a lower (higher) fair value measurement. Increases (decreases) in any of exit multiples and revenue compound annual growth rates in isolation can result in a higher (lower) fair value measurement.
36
Table of Contents
THE BLACKSTONE GROUP L.P.
Notes to Condensed Consolidated Financial Statements—Continued
(All Dollars Are in Thousands, Except Unit and Per Unit Data, Except Where Noted)
Since December 31, 2016, there have been no changes in valuation techniques within Level II and Level III that have had a material impact on the valuation of financial instruments.
The following tables summarize the changes in financial assets and liabilities measured at fair value for which the Partnership has used Level III inputs to determine fair value and does not include gains or losses that were reported in Level III in prior years or for instruments that were transferred out of Level III prior to the end of the respective reporting period. Total realized and unrealized gains and losses recorded for Level III investments are reported in either Investment Income (Loss) or Net Gains (Losses) from Fund Investment Activities in the Condensed Consolidated Statements of Operations.
| Level III Financial Assets at Fair
Value Three Months Ended March 31, |
||||||||||||||||||||||||||||||||
| 2017 | 2016 | |||||||||||||||||||||||||||||||
| Investments of Consolidated Funds |
Loans and Receivables |
Other Investments (a) |
Total | Investments of Consolidated Funds |
Loans and Receivables |
Other Investments (a) |
Total | |||||||||||||||||||||||||
| Balance, Beginning of Period |
$ | 685,873 | $ | 211,359 | $ | 130,588 | $ | 1,027,820 | $ | 774,392 | $ | 261,994 | $ | 155,841 | $ | 1,192,227 | ||||||||||||||||
| Transfer In to Level III (b) |
47,866 | — | 9,923 | 57,789 | 54,626 | — | 290 | 54,916 | ||||||||||||||||||||||||
| Transfer Out of Level III (b) |
(121,193 | ) | — | (6,080 | ) | (127,273 | ) | (61,879 | ) | — | (4,005 | ) | (65,884 | ) | ||||||||||||||||||
| Purchases |
157,904 | 69,483 | 12,447 | 239,834 | 63,932 | 298,381 | — | 362,313 | ||||||||||||||||||||||||
| Sales |
(112,814 | ) | (176,160 | ) | (10,032 | ) | (299,006 | ) | (92,578 | ) | (267,556 | ) | (20,007 | ) | (380,141 | ) | ||||||||||||||||
| Settlements |
— | (2,491 | ) | (100 | ) | (2,591 | ) | — | (4,294 | ) | (140 | ) | (4,434 | ) | ||||||||||||||||||
| Changes in Gains (Losses) Included in Earnings and Other Comprehensive Income (Loss) |
28,330 | 9,865 | 1,687 | 39,882 | (1,795 | ) | (667 | ) | (1,715 | ) | (4,177 | ) | ||||||||||||||||||||
|
|
|
|
|
|
|
|
|
|
|
|
|
|
|
|
|
|||||||||||||||||
| Balance, End of Period |
$ | 685,966 | $ | 112,056 | $ | 138,433 | $ | 936,455 | $ | 736,698 | $ | 287,858 | $ | 130,264 | $ | 1,154,820 | ||||||||||||||||
|
|
|
|
|
|
|
|
|
|
|
|
|
|
|
|
|
|||||||||||||||||
| Changes in Unrealized Gains (Losses) Included in Earnings Related to Investments Still Held at the Reporting Date |
$ | 3,197 | $ | 9,864 | $ | 339 | $ | 13,400 | $ | (18,484 | ) | $ | (667 | ) | $ | (1,300 | ) | $ | (20,451 | ) | ||||||||||||
|
|
|
|
|
|
|
|
|
|
|
|
|
|
|
|
|
|||||||||||||||||
| (a) | Represents corporate treasury investments and Other Investments. |
| (b) | Transfers in and out of Level III financial assets and liabilities were due to changes in the observability of inputs used in the valuation of such assets and liabilities. |
There were no Level III financial liabilities as of and for the three months ended March 31, 2017 and 2016.
| 9. | VARIABLE INTEREST ENTITIES |
Pursuant to GAAP consolidation guidance, the Partnership consolidates certain VIEs in which it is determined that the Partnership is the primary beneficiary either directly or indirectly, through a consolidated entity or affiliate. VIEs include certain private equity, real estate, credit-focused or funds of hedge funds entities and CLO vehicles. The purpose of such VIEs is to provide strategy specific investment opportunities for investors in exchange for management and performance based fees. The investment strategies of the Blackstone Funds differ by product; however, the fundamental risks of the Blackstone Funds have similar characteristics, including loss of invested capital and loss of management fees and performance based fees. In Blackstone’s role as general partner, collateral manager or investment adviser, it generally
37
Table of Contents
THE BLACKSTONE GROUP L.P.
Notes to Condensed Consolidated Financial Statements—Continued
(All Dollars Are in Thousands, Except Unit and Per Unit Data, Except Where Noted)
considers itself the sponsor of the applicable Blackstone Fund. The Partnership does not provide performance guarantees and has no other financial obligation to provide funding to consolidated VIEs other than its own capital commitments.
The assets of consolidated variable interest entities may only be used to settle obligations of these consolidated Blackstone Funds. In addition, there is no recourse to the Partnership for the consolidated VIEs’ liabilities including the liabilities of the consolidated CLO vehicles.
The Partnership holds variable interests in certain VIEs which are not consolidated as it is determined that the Partnership is not the primary beneficiary. The Partnership’s involvement with such entities is in the form of direct equity interests and fee arrangements. The maximum exposure to loss represents the loss of assets recognized by Blackstone relating to non-consolidated entities, any amounts due to non-consolidated entities and any clawback obligation relating to previously distributed carried interest. The assets and liabilities recognized in the Partnership’s Condensed Consolidated Statements of Financial Condition related to the Partnership’s interest in these non-consolidated VIEs and the Partnership’s maximum exposure to loss relating to non-consolidated VIEs were as follows:
| March 31, 2017 |
December 31, 2016 |
|||||||
| Investments |
$ | 669,970 | $ | 644,546 | ||||
| Accounts Receivable |
14,161 | 12,308 | ||||||
| Due from Affiliates |
46,520 | 35,099 | ||||||
|
|
|
|
|
|||||
| Total VIE Assets |
730,651 | 691,953 | ||||||
| Due to Affiliates |
689 | 577 | ||||||
| Accounts Payable, Accrued Expenses and Other Liabilities |
64 | 38 | ||||||
| Potential Clawback Obligation |
83,547 | 81,936 | ||||||
|
|
|
|
|
|||||
| Maximum Exposure to Loss |
$ | 814,951 | $ | 774,504 | ||||
|
|
|
|
|
|||||
| 10. | REVERSE REPURCHASE AND REPURCHASE AGREEMENTS |
At March 31, 2017, the Partnership received securities, primarily U.S. and non-U.S. government and agency securities, asset-backed securities and corporate debt, with a fair value of $43.4 million as collateral for reverse repurchase agreements that could be repledged, delivered or otherwise used. Securities with a fair value of $43.4 million and cash were used to cover Securities Sold, Not Yet Purchased. The Partnership also pledged securities with a carrying value of $142.3 million and cash to collateralize its repurchase agreements. Such securities can be repledged, delivered or otherwise used by the counterparty.
At December 31, 2016, the Partnership pledged securities with a carrying value of $119.1 million and cash to collateralize its repurchase agreements. Such securities can be repledged, delivered or otherwise used by the counterparty.
38
Table of Contents
THE BLACKSTONE GROUP L.P.
Notes to Condensed Consolidated Financial Statements—Continued
(All Dollars Are in Thousands, Except Unit and Per Unit Data, Except Where Noted)
The following tables provide information regarding the Partnership’s Repurchase Agreements obligation by type of collateral pledged:
| March 31, 2017 | ||||||||||||||||||||
| Remaining Contractual Maturity of the Agreements | ||||||||||||||||||||
| Overnight and Continuous |
Up to 30 Days |
30 - 90 Days |
Greater than 90 days |
Total | ||||||||||||||||
| Repurchase Agreements |
||||||||||||||||||||
| U.S. Treasury and Agency Securities |
$ | 21,253 | $ | — | $ | — | $ | — | $ | 21,253 | ||||||||||
| Asset-Backed Securities |
— | 17,050 | 52,423 | 3,920 | 73,393 | |||||||||||||||
|
|
|
|
|
|
|
|
|
|
|
|||||||||||
| Total |
$ | 21,253 | $ | 17,050 | $ | 52,423 | $ | 3,920 | $ | 94,646 | ||||||||||
|
|
|
|
|
|
|
|
|
|
|
|||||||||||
| Gross Amount of Recognized Liabilities for Repurchase Agreements in Note 11. “Offsetting of Assets and Liabilities” |
|
$ | 94,646 | |||||||||||||||||
|
|
|
|||||||||||||||||||
| Amounts Related to Agreements Not Included in Offsetting Disclosure in Note 11. “Offsetting of Assets and Liabilities” |
|
$ | — | |||||||||||||||||
|
|
|
|||||||||||||||||||
| December 31, 2016 | ||||||||||||||||||||
| Remaining Contractual Maturity of the Agreements | ||||||||||||||||||||
| Overnight and Continuous |
Up to 30 Days |
30 - 90 Days |
Greater than 90 days |
Total | ||||||||||||||||
| Repurchase Agreements |
||||||||||||||||||||
| U.S. Treasury and Agency Securities |
$ | 7,034 | $ | — | $ | — | $ | — | $ | 7,034 | ||||||||||
| Asset-Backed Securities |
— | 12,805 | 30,796 | 24,689 | 68,290 | |||||||||||||||
|
|
|
|
|
|
|
|
|
|
|
|||||||||||
| Total |
$ | 7,034 | $ | 12,805 | $ | 30,796 | $ | 24,689 | $ | 75,324 | ||||||||||
|
|
|
|
|
|
|
|
|
|
|
|||||||||||
| Gross Amount of Recognized Liabilities for Repurchase Agreements in Note 11. “Offsetting of Assets and Liabilities” |
|
$ | 75,324 | |||||||||||||||||
|
|
|
|||||||||||||||||||
| Amounts Related to Agreements Not Included in Offsetting Disclosure in Note 11. “Offsetting of Assets and Liabilities” |
|
$ | — | |||||||||||||||||
|
|
|
|||||||||||||||||||
| 11. | OFFSETTING OF ASSETS AND LIABILITIES |
The following tables present the offsetting of assets and liabilities as of March 31, 2017:
| Gross and Net Amounts of Assets Presented in the Statement of Financial Condition |
Gross Amounts Not Offset in the Statement of Financial Condition |
|||||||||||||||
| Financial Instruments |
Cash Collateral Received |
Net Amount | ||||||||||||||
| Assets |
||||||||||||||||
| Net Investment Hedges |
$ | 771 | $ | — | $ | — | $ | 771 | ||||||||
| Freestanding Derivatives |
6,406 | 1,571 | 3,867 | 968 | ||||||||||||
| Reverse Repurchase Agreements |
44,635 | 43,419 | — | 1,216 | ||||||||||||
|
|
|
|
|
|
|
|
|
|||||||||
| Total |
$ | 51,812 | $ | 44,990 | $ | 3,867 | $ | 2,955 | ||||||||
|
|
|
|
|
|
|
|
|
|||||||||
39
Table of Contents
THE BLACKSTONE GROUP L.P.
Notes to Condensed Consolidated Financial Statements—Continued
(All Dollars Are in Thousands, Except Unit and Per Unit Data, Except Where Noted)
| Gross and Net Amounts of Liabilities Presented in the Statement of Financial Condition |
Gross Amounts Not Offset in the Statement of Financial Condition |
|||||||||||||||
| Financial Instruments |
Cash Collateral Pledged |
Net Amount | ||||||||||||||
| Liabilities |
||||||||||||||||
| Freestanding Derivatives |
$ | 6,129 | $ | 1,571 | $ | 3,673 | $ | 885 | ||||||||
| Repurchase Agreements |
94,646 | 91,453 | 3,119 | 74 | ||||||||||||
|
|
|
|
|
|
|
|
|
|||||||||
| Total |
$ | 100,775 | $ | 93,024 | $ | 6,792 | $ | 959 | ||||||||
|
|
|
|
|
|
|
|
|
|||||||||
The following tables present the offsetting of assets and liabilities as of December 31, 2016:
| Gross and Net Amounts of Assets Presented in the Statement of Financial Condition |
Gross Amounts Not Offset in the Statement of Financial Condition |
|||||||||||||||
| Financial Instruments |
Cash Collateral Received |
Net Amount | ||||||||||||||
| Assets |
||||||||||||||||
| Freestanding Derivatives |
$ | 5,720 | $ | 1,064 | $ | 2,892 | $ | 1,764 | ||||||||
| Reverse Repurchase Agreements |
118,495 | 117,775 | — | 720 | ||||||||||||
|
|
|
|
|
|
|
|
|
|||||||||
| Total |
$ | 124,215 | $ | 118,839 | $ | 2,892 | $ | 2,484 | ||||||||
|
|
|
|
|
|
|
|
|
|||||||||
| Gross and Net Amounts of Liabilities Presented in the Statement of Financial Condition |
Gross Amounts Not Offset in the Statement of Financial Condition |
|||||||||||||||
| Financial Instruments |
Cash Collateral Pledged |
Net Amount | ||||||||||||||
| Liabilities |
||||||||||||||||
| Net Investment Hedges |
$ | 587 | $ | — | $ | — | $ | 587 | ||||||||
| Freestanding Derivatives |
6,886 | 1,064 | 5,638 | 184 | ||||||||||||
| Repurchase Agreements |
75,324 | 72,195 | 3,129 | — | ||||||||||||
|
|
|
|
|
|
|
|
|
|||||||||
| Total |
$ | 82,797 | $ | 73,259 | $ | 8,767 | $ | 771 | ||||||||
|
|
|
|
|
|
|
|
|
|||||||||
Reverse Repurchase Agreements and Repurchase Agreements are presented separately on the Condensed Consolidated Statements of Financial Condition. Freestanding Derivative assets are included in Other Assets in the Condensed Consolidated Statements of Financial Condition. The following table presents the components of Other Assets:
| March 31, 2017 | December 31, 2016 | |||||||
| Furniture, Equipment and Leasehold Improvements, Net |
$ | 130,693 | $ | 126,784 | ||||
| Prepaid Expenses |
83,125 | 96,888 | ||||||
| Other Assets |
38,444 | 37,723 | ||||||
| Freestanding Derivatives |
4,069 | 3,393 | ||||||
| Net Investment Hedges |
771 | — | ||||||
|
|
|
|
|
|||||
| Total |
$ | 257,102 | $ | 264,788 | ||||
|
|
|
|
|
|||||
40
Table of Contents
THE BLACKSTONE GROUP L.P.
Notes to Condensed Consolidated Financial Statements—Continued
(All Dollars Are in Thousands, Except Unit and Per Unit Data, Except Where Noted)
Freestanding Derivative liabilities are included in Accounts Payable, Accrued Expenses and Other Liabilities in the Condensed Consolidated Statements of Financial Condition and are not a significant component thereof.
Notional Pooling Arrangement
Blackstone has a notional cash pooling arrangement with a financial institution for cash management purposes. This arrangement allows for cash withdrawals based upon aggregate cash balances on deposit at the same financial institution. Cash withdrawals cannot exceed aggregate cash balances on deposit. The net balance of cash on deposit and overdrafts is used as a basis for calculating net interest expense or income. As of March 31, 2017, the aggregate cash balance on deposit relating to the cash pooling arrangement was $1.5 billion, which was offset with an accompanying overdraft of $1.5 billion.
| 12. | BORROWINGS |
The following table presents the general characteristics of each of our Notes, as well as their carrying value and fair value. The Notes are included in Loans Payable within the Condensed Consolidated Statements of Financial Condition. All of the Notes were issued at a discount. All of the Notes accrue interest from the Issue Date and all pay interest in arrears on a semi-annual basis or annual basis.
| March 31, 2017 | December 31, 2016 | |||||||||||||||
| Senior Notes |
Carrying Value |
Fair Value (a) |
Carrying Value |
Fair Value (a) |
||||||||||||
| 6.625%, Due 8/15/2019 (b) |
$ | 605,093 | $ | 643,851 | $ | 607,121 | $ | 648,765 | ||||||||
| 5.875%, Due 3/15/2021 |
398,205 | 445,600 | 398,105 | 447,600 | ||||||||||||
| 4.750%, Due 2/15/2023 |
393,398 | 434,880 | 393,158 | 426,520 | ||||||||||||
| 6.250%, Due 8/15/2042 |
237,876 | 295,850 | 237,830 | 285,450 | ||||||||||||
| 5.000%, Due 6/15/2044 |
488,386 | 516,650 | 488,337 | 497,200 | ||||||||||||
| 4.450%, Due 7/15/2045 |
343,843 | 332,710 | 343,816 | 322,525 | ||||||||||||
| 2.000%, Due 5/19/2025 |
315,291 | 333,908 | 310,805 | 331,096 | ||||||||||||
| 1.000%, Due 10/5/2026 |
628,624 | 602,435 | 620,750 | 598,270 | ||||||||||||
|
|
|
|
|
|
|
|
|
|||||||||
| Total |
$ | 3,410,716 | $ | 3,605,884 | $ | 3,399,922 | $ | 3,557,426 | ||||||||
|
|
|
|
|
|
|
|
|
|||||||||
| (a) | Fair value is determined by broker quote and these notes would be classified as Level II within the fair value hierarchy. |
| (b) | The carrying and fair values are determined using the original $600 million par amount less $15 million attributable to these notes which were acquired but not retired by Blackstone during 2012. |
41
Table of Contents
THE BLACKSTONE GROUP L.P.
Notes to Condensed Consolidated Financial Statements—Continued
(All Dollars Are in Thousands, Except Unit and Per Unit Data, Except Where Noted)
Included within Loans Payable and Due to Affiliates within the Condensed Consolidated Statements of Financial Condition are amounts due to holders of debt securities issued by Blackstone’s consolidated CLO vehicles. Borrowings through the consolidated CLO vehicles consisted of the following:
| March 31, 2017 | December 31, 2016 | |||||||||||||||||||||||
| Borrowing Outstanding |
Weighted- Average Interest Rate |
Weighted- Average Remaining Maturity in Years |
Borrowing Outstanding |
Weighted- Average Interest Rate |
Weighted- Average Remaining Maturity in Years |
|||||||||||||||||||
| Senior Secured Notes |
$ | 6,041,613 | 1.98 | % | 4.7 | $ | 5,124,241 | 2.17 | % | 5.4 | ||||||||||||||
| Subordinated Notes |
410,590 | (a | ) | N/A | 382,735 | (a) | N/A | |||||||||||||||||
|
|
|
|
|
|||||||||||||||||||||
| $ | 6,452,203 | $ | 5,506,976 | |||||||||||||||||||||
|
|
|
|
|
|||||||||||||||||||||
| (a) | The Subordinated Notes do not have contractual interest rates but instead receive distributions from the excess cash flows of the CLO vehicles. |
Senior Secured Notes and Subordinated Notes comprise the following amounts:
| March 31, 2017 | December 31, 2016 | |||||||||||||||||||||||
| Fair Value | Amounts Due to Non- Consolidated Affiliates |
Fair Value | Amounts Due to Non- Consolidated Affiliates |
|||||||||||||||||||||
| Borrowing Outstanding |
Fair Value | Borrowing Outstanding |
Fair Value | |||||||||||||||||||||
| Senior Secured Notes |
$ | 6,027,719 | $ | — | $ | — | $ | 5,125,804 | $ | — | $ | — | ||||||||||||
| Subordinated Notes |
362,759 | 10,000 | 7,065 | 345,594 | 10,000 | 7,748 | ||||||||||||||||||
|
|
|
|
|
|
|
|
|
|
|
|
|
|||||||||||||
| $ | 6,390,478 | $ | 10,000 | $ | 7,065 | $ | 5,471,398 | $10,000 | $7,748 | |||||||||||||||
|
|
|
|
|
|
|
|
|
|
|
|
|
|||||||||||||
The Loans Payable of the consolidated CLO vehicles are collateralized by assets held by each respective CLO vehicle and assets of one vehicle may not be used to satisfy the liabilities of another. As of March 31, 2017 and December 31, 2016, the fair value of the consolidated CLO assets was $8.1 billion and $6.4 billion, respectively. This collateral consisted of Cash, Corporate Loans, Corporate Bonds and other securities.
Scheduled principal payments for borrowings as of March 31, 2017 were as follows:
| Operating Borrowings |
Blackstone Fund Facilities/CLO Vehicles |
Total Borrowings |
||||||||||
| 2017 |
$ | — | $ | 322,365 | $ | 322,365 | ||||||
| 2018 |
— | — | — | |||||||||
| 2019 |
585,000 | — | 585,000 | |||||||||
| 2020 |
— | — | — | |||||||||
| 2021 |
400,000 | — | 400,000 | |||||||||
| Thereafter |
2,458,680 | 6,132,643 | 8,591,323 | |||||||||
|
|
|
|
|
|
|
|||||||
| Total |
$ | 3,443,680 | $ | 6,455,008 | $ | 9,898,688 | ||||||
|
|
|
|
|
|
|
|||||||
42
Table of Contents
THE BLACKSTONE GROUP L.P.
Notes to Condensed Consolidated Financial Statements—Continued
(All Dollars Are in Thousands, Except Unit and Per Unit Data, Except Where Noted)
| 13. | INCOME TAXES |
Blackstone’s effective tax rate was 5.3% and 2.7% for the three months ended March 31, 2017 and 2016, respectively. Blackstone’s income tax provision was $57.4 million and $9.1 million for the three months ended March 31, 2017 and 2016, respectively.
The Blackstone Group L.P. and certain of its subsidiaries operate in the U.S. as partnerships for income tax purposes (partnerships generally are not subject to federal income taxes) and generally as corporate entities in non-U.S. jurisdictions. Blackstone’s effective tax rate for the three months ended March 31, 2017 and 2016 was substantially due to the fact that certain corporate subsidiaries are subject to federal, state, local and foreign income taxes (as applicable) and other subsidiaries are subject to New York City unincorporated business taxes.
| 14. | NET INCOME PER COMMON UNIT |
Basic and diluted net income per common unit for the three months ended March 31, 2017 and March 31, 2016 was calculated as follows:
| Three Months
Ended March 31, |
||||||||
| 2017 | 2016 | |||||||
| Net Income for Per Common Unit Calculations |
||||||||
| Net Income Attributable to The Blackstone Group L.P., Basic |
$ | 461,825 | $ | 159,753 | ||||
| Incremental Net Income from Assumed Exchange of Blackstone Holdings Partnership Units |
371,284 | 117,684 | ||||||
|
|
|
|
|
|||||
| Net Income Attributable to The Blackstone Group L.P., Diluted |
$ | 833,109 | $ | 277,437 | ||||
|
|
|
|
|
|||||
| Units Outstanding |
||||||||
| Weighted-Average Common Units Outstanding, Basic |
660,939,708 | 644,897,849 | ||||||
| Weighted-Average Unvested Deferred Restricted Common Units |
809,184 | 1,332,772 | ||||||
| Weighted-Average Blackstone Holdings Partnership Units |
537,758,091 | 548,042,780 | ||||||
|
|
|
|
|
|||||
| Weighted-Average Common Units Outstanding, Diluted |
1,199,506,983 | 1,194,273,401 | ||||||
|
|
|
|
|
|||||
| Net Income Per Common Unit, Basic |
$ | 0.70 | $ | 0.25 | ||||
|
|
|
|
|
|||||
| Net Income Per Common Unit, Diluted |
$ | 0.69 | $ | 0.23 | ||||
|
|
|
|
|
|||||
| Distributions Declared Per Common Unit (a) |
$ | 0.47 | $ | 0.61 | ||||
|
|
|
|
|
|||||
| (a) | Distributions declared reflects the calendar date of the declaration for each distribution. |
Unit Repurchase Program
In January 2008, Blackstone announced that the Board of Directors of its general partner, Blackstone Group Management L.L.C., had authorized the repurchase by Blackstone of up to $500 million of Blackstone common units and Blackstone Holdings Partnership Units. Under this unit repurchase program, units may be repurchased from time to time in open market transactions, in privately negotiated transactions or otherwise. The timing and the actual number of Blackstone common units and Blackstone Holdings Partnership Units repurchased will depend on a variety of factors, including legal requirements, price and economic and market conditions. This unit repurchase program may be suspended or discontinued at any time and does not have a specified expiration date.
43
Table of Contents
THE BLACKSTONE GROUP L.P.
Notes to Condensed Consolidated Financial Statements—Continued
(All Dollars Are in Thousands, Except Unit and Per Unit Data, Except Where Noted)
During the three month periods ended March 31, 2017 and 2016, no units were repurchased. As of March 31, 2017, the amount remaining available for repurchases under this program was $335.8 million.
| 15. | EQUITY-BASED COMPENSATION |
The Partnership has granted equity-based compensation awards to Blackstone’s senior managing directors, non-partner professionals, non-professionals and selected external advisers under the Partnership’s 2007 Equity Incentive Plan (the “Equity Plan”), the majority of which to date were granted in connection with Blackstone’s initial public offering (“IPO”). The Equity Plan allows for the granting of options, unit appreciation rights or other unit-based awards (units, restricted units, restricted common units, deferred restricted common units, phantom restricted common units or other unit-based awards based in whole or in part on the fair value of the Blackstone common units or Blackstone Holdings Partnership Units) which may contain certain service or performance requirements. As of January 1, 2017, the Partnership had the ability to grant 170,379,944 units under the Equity Plan.
For the three months ended March 31, 2017 and March 31, 2016, the Partnership recorded compensation expense of $91.3 million and $79.8 million, respectively, in relation to its equity-based awards with corresponding tax benefits of $14.1 million and $8.3 million, respectively.
As of March 31, 2017, there was $899.9 million of estimated unrecognized compensation expense related to unvested awards. This cost is expected to be recognized over a weighted-average period of 4.4 years.
Total vested and unvested outstanding units, including Blackstone common units, Blackstone Holdings Partnership Units and deferred restricted common units, were 1,198,182,811 as of March 31, 2017. Total outstanding unvested phantom units were 42,793 as of March 31, 2017.
A summary of the status of the Partnership’s unvested equity-based awards as of March 31, 2017 and of changes during the period January 1, 2017 through March 31, 2017 is presented below:
| Blackstone Holdings | The Blackstone Group L.P. | |||||||||||||||||||||||
| Equity Settled Awards | Cash Settled Awards | |||||||||||||||||||||||
| Unvested Units |
Partnership Units |
Weighted- Average Grant Date Fair Value |
Deferred Restricted Common Units and Options |
Weighted- Average Grant Date Fair Value |
Phantom Units |
Weighted- Average Grant Date Fair Value |
||||||||||||||||||
| Balance, December 31, 2016 |
34,568,726 | $ | 33.58 | 12,206,016 | $ | 24.65 | 40,460 | $ | 28.14 | |||||||||||||||
| Granted |
179,596 | 27.03 | 2,213,133 | 27.64 | 3,057 | 27.03 | ||||||||||||||||||
| Vested |
(2,326,984 | ) | 35.48 | (2,352,245 | ) | 25.87 | (1,338 | ) | 28.61 | |||||||||||||||
| Forfeited |
(255,433 | ) | 24.52 | (86,559 | ) | 28.69 | — | — | ||||||||||||||||
|
|
|
|
|
|
|
|||||||||||||||||||
| Balance, March 31, 2017 |
32,165,905 | $ | 34.01 | 11,980,345 | $ | 25.29 | 42,179 | $ | 28.81 | |||||||||||||||
|
|
|
|
|
|
|
|||||||||||||||||||
44
Table of Contents
THE BLACKSTONE GROUP L.P.
Notes to Condensed Consolidated Financial Statements—Continued
(All Dollars Are in Thousands, Except Unit and Per Unit Data, Except Where Noted)
Units Expected to Vest
The following unvested units, after expected forfeitures, as of March 31, 2017, are expected to vest:
| Units | Weighted-Average Service Period in Years |
|||||||
| Blackstone Holdings Partnership Units |
27,095,652 | 4.0 | ||||||
| Deferred Restricted Blackstone Common Units |
10,620,157 | 1.8 | ||||||
|
|
|
|
|
|||||
| Total Equity-Based Awards |
37,715,809 | 3.4 | ||||||
|
|
|
|
|
|||||
| Phantom Units |
32,589 | 3.1 | ||||||
|
|
|
|
|
|||||
| 16. | RELATED PARTY TRANSACTIONS |
Affiliate Receivables and Payables
Due from Affiliates and Due to Affiliates consisted of the following:
| March 31, 2017 |
December 31, 2016 |
|||||||
| Due from Affiliates |
||||||||
| Advances Made on Behalf of Certain Non-Controlling Interest Holders and Blackstone Employees Principally for Investments in Blackstone Funds |
$ | 409,423 | $ | 342,943 | ||||
| Amounts Due from Portfolio Companies and Funds |
441,849 | 456,469 | ||||||
| Management and Performance Fees Due from Non-Consolidated Funds |
558,995 | 445,280 | ||||||
| Payments Made on Behalf of Non-Consolidated Entities |
256,341 | 196,134 | ||||||
| Investments Redeemed in Non-Consolidated Funds of Hedge Funds |
1,412 | 1,552 | ||||||
| Accrual for Potential Clawback of Previously Distributed Carried Interest |
1,104 | — | ||||||
|
|
|
|
|
|||||
| $ | 1,669,124 | $ | 1,442,378 | |||||
|
|
|
|
|
|||||
| March 31, 2017 |
December 31, 2016 |
|||||||
| Due to Affiliates |
||||||||
| Due to Certain Non-Controlling Interest Holders in Connection with the Tax Receivable Agreements |
$ | 1,141,411 | $ | 1,186,145 | ||||
| Distributions Received on Behalf of Certain Non-Controlling Interest Holders and Blackstone Employees |
35,735 | 28,012 | ||||||
| Distributions Received on Behalf of Blackstone Entities |
41,011 | 80,034 | ||||||
| Payments Made by Non-Consolidated Entities |
8,674 | 19,833 | ||||||
| Due to Note Holders of Consolidated CLO Vehicles |
7,065 | 7,748 | ||||||
| Accrual for Potential Repayment of Previously Received Performance Fees |
2,171 | — | ||||||
|
|
|
|
|
|||||
| $ | 1,236,067 | $ | 1,321,772 | |||||
|
|
|
|
|
|||||
Interests of the Founder, Senior Managing Directors, Employees and Other Related Parties
The Founder, senior managing directors, employees and certain other related parties invest on a discretionary basis in the consolidated Blackstone Funds both directly and through consolidated entities. These investments
45
Table of Contents
THE BLACKSTONE GROUP L.P.
Notes to Condensed Consolidated Financial Statements—Continued
(All Dollars Are in Thousands, Except Unit and Per Unit Data, Except Where Noted)
generally are subject to preferential management fee and performance fee arrangements. As of March 31, 2017 and December 31, 2016, such investments aggregated $795.3 million and $740.3 million, respectively. Their share of the Net Income Attributable to Redeemable Non-Controlling and Non-Controlling Interests in Consolidated Entities aggregated $30.6 million and $3.0 million for the three months ended March 31, 2017 and 2016, respectively.
Revenues Earned from Affiliates
Management and Advisory Fees, Net earned from affiliates totaled $50.1 million and $56.7 million for the three months ended March 31, 2017 and 2016, respectively. Fees relate primarily to transaction and monitoring fees which are negotiated in the ordinary course of fundraising and investment activities.
Loans to Affiliates
Loans to affiliates consist of interest bearing advances to certain Blackstone individuals to finance their investments in certain Blackstone Funds. These loans earn interest at Blackstone’s cost of borrowing and such interest totaled $0.2 million and $0.2 million for the three months ended March 31, 2017 and 2016, respectively.
Contingent Repayment Guarantee
Blackstone and its personnel who have received carried interest distributions have guaranteed payment on a several basis (subject to a cap) to the carry funds of any clawback obligation with respect to the excess carried interest allocated to the general partners of such funds and indirectly received thereby to the extent that either Blackstone or its personnel fails to fulfill its clawback obligation, if any. The Accrual for Potential Repayment of Previously Received Performance Fees represents amounts previously paid to Blackstone Holdings and non-controlling interest holders that would need to be repaid to the Blackstone Funds if the carry funds were to be liquidated based on the fair value of their underlying investments as of March 31, 2017. See Note 17. “Commitments and Contingencies — Contingencies — Contingent Obligations (Clawback)”.
Aircraft and Other Services
In the normal course of business, Blackstone personnel make use of aircraft owned as personal assets by Stephen A. Schwarzman; an aircraft owned jointly as a personal asset by Hamilton E. James, Blackstone’s President and Chief Operating Officer, and a Director of Blackstone, and Jonathan D. Gray, Blackstone’s Global Head of Real Estate and a Director of Blackstone; and an aircraft owned jointly as a personal asset by Bennett J. Goodman, Co-Founder of GSO Capital and a Director of Blackstone, and another senior managing director (each such aircraft, “Personal Aircraft”). Mr. Schwarzman paid for his purchases of his Personal Aircraft himself. Each of Mr. James and Mr. Gray paid for his respective interest in their jointly owned Personal Aircraft. Mr. Goodman paid for his interest in his jointly owned Personal Aircraft. Mr. Schwarzman, Mr. James, Mr. Gray and Mr. Goodman respectively bear operating, personnel and maintenance costs associated with the operation of such Personal Aircraft. Payment by Blackstone for the use of the Personal Aircraft by Blackstone employees is made based on market rates.
In addition, on occasion, certain of Blackstone’s executive officers and employee directors and their families may make personal use of aircraft owned by Blackstone or in which Blackstone owns a fractional interest, as well as other assets of Blackstone. Any such personal use of Blackstone assets is charged to the executive officer or employee director based on market rates and usage. Personal use of Blackstone resources is also reimbursed to Blackstone based on market rates.
The transactions described herein are not material to the Condensed Consolidated Financial Statements.
46
Table of Contents
THE BLACKSTONE GROUP L.P.
Notes to Condensed Consolidated Financial Statements—Continued
(All Dollars Are in Thousands, Except Unit and Per Unit Data, Except Where Noted)
Tax Receivable Agreements
Blackstone used a portion of the proceeds from the IPO and the sale of non-voting common units to Beijing Wonderful Investments to purchase interests in the predecessor businesses from the predecessor owners. In addition, holders of Blackstone Holdings Partnership Units may exchange their Blackstone Holdings Partnership Units for Blackstone common units on a one-for-one basis. The purchase and subsequent exchanges are expected to result in increases in the tax basis of the tangible and intangible assets of Blackstone Holdings and therefore reduce the amount of tax that Blackstone’s wholly owned subsidiaries would otherwise be required to pay in the future.
One of the subsidiaries of the Partnership which is a corporate taxpayer has entered into tax receivable agreements with each of the predecessor owners and additional tax receivable agreements have been executed, and will continue to be executed, with newly-admitted senior managing directors and others who acquire Blackstone Holdings Partnership Units. The agreements provide for the payment by the corporate taxpayer to such owners of 85% of the amount of cash savings, if any, in U.S. federal, state and local income tax that the corporate taxpayers actually realize as a result of the aforementioned increases in tax basis and of certain other tax benefits related to entering into these tax receivable agreements. For purposes of the tax receivable agreements, cash savings in income tax will be computed by comparing the actual income tax liability of the corporate taxpayers to the amount of such taxes that the corporate taxpayers would have been required to pay had there been no increase to the tax basis of the tangible and intangible assets of Blackstone Holdings as a result of the exchanges and had the corporate taxpayers not entered into the tax receivable agreements.
Assuming no future material changes in the relevant tax law and that the corporate taxpayers earn sufficient taxable income to realize the full tax benefit of the increased amortization of the assets, the expected future payments under the tax receivable agreements (which are taxable to the recipients) will aggregate $1.2 billion over the next 15 years. The after tax net present value of these estimated payments totals $364.7 million assuming a 15% discount rate and using Blackstone’s most recent projections relating to the estimated timing of the benefit to be received. Future payments under the tax receivable agreements in respect of subsequent exchanges would be in addition to these amounts. The payments under the tax receivable agreements are not conditioned upon continued ownership of Blackstone equity interests by the pre-IPO owners and the others mentioned above.
Amounts related to the deferred tax asset resulting from the increase in tax basis from the exchange of Blackstone Holdings Partnership Units to Blackstone common units, the resulting remeasurement of net deferred tax assets at the Blackstone ownership percentage at the balance sheet date, the due to affiliates for the future payments resulting from the tax receivable agreements and resulting adjustment to partners’ capital are included as Acquisition of Ownership Interests from Non-Controlling Interest Holders in the Supplemental Disclosure of Non-Cash Investing and Financing Activities in the Condensed Consolidated Statements of Cash Flows.
Other
Blackstone does business with and on behalf of some of its Portfolio Companies; all such arrangements are on a negotiated basis.
Additionally, please see Note 17. “Commitments and Contingencies — Contingencies — Guarantees” for information regarding guarantees provided to a lending institution for certain loans held by employees.
47
Table of Contents
THE BLACKSTONE GROUP L.P.
Notes to Condensed Consolidated Financial Statements—Continued
(All Dollars Are in Thousands, Except Unit and Per Unit Data, Except Where Noted)
| 17. | COMMITMENTS AND CONTINGENCIES |
Commitments
Investment Commitments
Blackstone had $2.4 billion of investment commitments as of March 31, 2017 representing general partner capital funding commitments to the Blackstone Funds, limited partner capital funding to other funds and Blackstone principal investment commitments. The consolidated Blackstone Funds had signed investment commitments of $359.0 million as of March 31, 2017 which includes $65.3 million of signed investment commitments for portfolio company acquisitions in the process of closing.
Contingencies
Guarantees
Certain of Blackstone’s consolidated real estate funds guarantee payments to third parties in connection with the on-going business activities and/or acquisitions of their Portfolio Companies. There is no direct recourse to the Partnership to fulfill such obligations. To the extent that underlying funds are required to fulfill guarantee obligations, the Partnership’s invested capital in such funds is at risk. Total investments at risk in respect of guarantees extended by consolidated real estate funds was $5.3 million as of March 31, 2017.
The Blackstone Holdings Partnerships provided guarantees to a lending institution for certain loans held by employees either for investment in Blackstone Funds or for members’ capital contributions to Blackstone International Partners LLP. The amount guaranteed as of March 31, 2017 was $144.8 million.
Litigation
From time to time, Blackstone is named as a defendant in legal actions relating to transactions conducted in the ordinary course of business. Although there can be no assurance of the outcome of such legal actions, in the opinion of management, Blackstone does not have a potential liability related to any current legal proceeding or claim that would individually or in the aggregate materially affect its results of operations, financial position or cash flows.
Contingent Obligations (Clawback)
Carried Interest is subject to clawback to the extent that the Carried Interest received to date with respect to a fund exceeds the amount due to Blackstone based on cumulative results of that fund. The actual clawback liability, however, generally does not become realized until the end of a fund’s life except for certain Blackstone real estate funds, multi-asset class investment funds and credit-focused funds, which may have an interim clawback liability. The lives of the carry funds, including available contemplated extensions, for which a liability for potential clawback obligations has been recorded for financial reporting purposes, are currently anticipated to expire at various points through 2028. Further extensions of such terms may be implemented under given circumstances.
For financial reporting purposes, when applicable, the general partners record a liability for potential clawback obligations to the limited partners of some of the carry funds due to changes in the unrealized value of a fund’s remaining investments and where the fund’s general partner has previously received Carried Interest distributions with respect to such fund’s realized investments.
48
Table of Contents
THE BLACKSTONE GROUP L.P.
Notes to Condensed Consolidated Financial Statements—Continued
(All Dollars Are in Thousands, Except Unit and Per Unit Data, Except Where Noted)
The following table presents the clawback obligations by segment:
| March 31, 2017 | December 31, 2016 | |||||||||||||||||||||||
| Segment |
Blackstone Holdings |
Current and Former Personnel |
Total | Blackstone Holdings |
Current and Former Personnel |
Total | ||||||||||||||||||
| Credit |
$ | 1,067 | $ | 1,104 | $ | 2,171 | $ | — | $ | — | $ | — | ||||||||||||
|
|
|
|
|
|
|
|
|
|
|
|
|
|||||||||||||
For Private Equity, Real Estate, and certain Credit Funds, a portion of the carried interest paid to current and former Blackstone personnel is held in segregated accounts in the event of a cash clawback obligation. These segregated accounts are not included in the Condensed Consolidated Financial Statements of the Partnership, except to the extent a portion of the assets held in the segregated accounts may be allocated to a consolidated Blackstone fund of hedge funds. At March 31, 2017, $658.2 million was held in segregated accounts for the purpose of meeting any clawback obligations of current and former personnel if such payments are required.
In the Credit segment, payment of carried interest to the Partnership by the majority of the rescue lending, mezzanine and hedge fund strategies funds is substantially deferred under the terms of the partnership agreements. This deferral mitigates the need to hold funds in segregated accounts in the event of a cash clawback obligation.
If, at March 31, 2017, all of the investments held by our carry funds were deemed worthless, a possibility that management views as remote, the amount of Carried Interest subject to potential clawback would be $5.4 billion, on an after tax basis where applicable, of which Blackstone Holdings is potentially liable for $4.9 billion if current and former Blackstone personnel default on their share of the liability, a possibility that management also views as remote.
| 18. | SEGMENT REPORTING |
Blackstone transacts its primary business in the United States and substantially all of its revenues are generated domestically.
Blackstone conducts its alternative asset management businesses through four segments:
| • | Private Equity — Blackstone’s Private Equity segment primarily comprises its management of flagship corporate private equity funds, sector-focused corporate private equity funds, including energy-focused funds, a core private equity fund, an opportunistic investment platform, a secondary private equity fund of funds business, a multi-asset investment program for eligible high net worth investors and a capital markets services business. |
| • | Real Estate — Blackstone’s Real Estate segment primarily comprises its management of global, European focused and Asian focused opportunistic real estate funds, high yield real estate debt funds, liquid real estate debt funds, core+ real estate funds, a NYSE-listed REIT and a non-exchange traded REIT. |
| • | Hedge Fund Solutions — Blackstone’s Hedge Fund Solutions segment is comprised principally of Blackstone Alternative Asset Management (“BAAM”), which manages a broad range of commingled and customized hedge fund of fund solutions and also includes investment platforms that seed new hedge fund businesses, purchase minority ownership interests in more established hedge funds, invest in special situation opportunities, create alternative solutions in regulated structures and trade directly. |
| • | Credit — Blackstone’s Credit segment consists principally of GSO Capital Partners LP (“GSO”), which is organized into performing credit strategies (which include mezzanine lending funds, business development companies and other performing credit strategies), distressed strategies (which include hedge fund strategies, rescue lending funds and distressed energy strategies) and long only strategies (which consist of CLOs, closed end funds, commingled funds and separately managed accounts). |
49
Table of Contents
THE BLACKSTONE GROUP L.P.
Notes to Condensed Consolidated Financial Statements—Continued
(All Dollars Are in Thousands, Except Unit and Per Unit Data, Except Where Noted)
These business segments are differentiated by their various sources of income. The Private Equity, Real Estate, Hedge Fund Solutions and Credit segments primarily earn their income from management fees and investment returns on assets under management.
Blackstone uses Economic Income as a key measure of value creation, a benchmark of its performance and in making resource deployment and compensation decisions across its four segments. Economic Income represents segment net income before taxes excluding transaction-related charges. Transaction-related charges arise from Blackstone’s IPO and certain long-term retention programs outside of annual deferred compensation and other corporate actions, including acquisitions. Transaction-related charges include certain equity-based compensation charges, the amortization of intangible assets and contingent consideration associated with acquisitions. Economic Income presents revenues and expenses on a basis that deconsolidates the investment funds Blackstone manages. Economic Net Income (“ENI”) represents Economic Income adjusted to include current period taxes. Taxes represent the total GAAP tax provision adjusted to include only the current tax provision (benefit) calculated on Income (Loss) Before Provision for Taxes.
Senior management makes operating decisions and assesses the performance of each of Blackstone’s business segments based on financial and operating metrics and data that is presented without the consolidation of any of the Blackstone Funds that are consolidated into the Condensed Consolidated Financial Statements. Consequently, all segment data excludes the assets, liabilities and operating results related to the Blackstone Funds.
50
Table of Contents
THE BLACKSTONE GROUP L.P.
Notes to Condensed Consolidated Financial Statements—Continued
(All Dollars Are in Thousands, Except Unit and Per Unit Data, Except Where Noted)
The following table presents the financial data for Blackstone’s four segments as of and for the three months ended March 31, 2017 and 2016.
| March 31, 2017 and the Three Months Then Ended | ||||||||||||||||||||
| Private Equity |
Real Estate | Hedge Fund Solutions |
Credit | Total Segments |
||||||||||||||||
| Segment Revenues |
||||||||||||||||||||
| Management and Advisory Fees, Net |
||||||||||||||||||||
| Base Management Fees |
$ | 177,464 | $ | 197,879 | $ | 128,468 | $ | 139,147 | $ | 642,958 | ||||||||||
| Transaction, Advisory and Other Fees, Net |
17,200 | 21,279 | 259 | 1,484 | 40,222 | |||||||||||||||
| Management Fee Offsets |
(12,190 | ) | (3,550 | ) | — | (17,859 | ) | (33,599 | ) | |||||||||||
|
|
|
|
|
|
|
|
|
|
|
|||||||||||
| Total Management and Advisory Fees, Net |
182,474 | 215,608 | 128,727 | 122,772 | 649,581 | |||||||||||||||
|
|
|
|
|
|
|
|
|
|
|
|||||||||||
| Performance Fees |
||||||||||||||||||||
| Realized |
||||||||||||||||||||
| Carried Interest |
582,681 | 519,841 | — | 8,800 | 1,111,322 | |||||||||||||||
| Incentive Fees |
— | 2,914 | 14,684 | 29,539 | 47,137 | |||||||||||||||
| Unrealized |
||||||||||||||||||||
| Carried Interest |
(184,833 | ) | (22,268 | ) | 3,797 | 48,557 | (154,747 | ) | ||||||||||||
| Incentive Fees |
— | 18,713 | 40,311 | 992 | 60,016 | |||||||||||||||
|
|
|
|
|
|
|
|
|
|
|
|||||||||||
| Total Performance Fees |
397,848 | 519,200 | 58,792 | 87,888 | 1,063,728 | |||||||||||||||
|
|
|
|
|
|
|
|
|
|
|
|||||||||||
| Investment Income (Loss) |
||||||||||||||||||||
| Realized |
80,889 | 119,579 | (632 | ) | 3,058 | 202,894 | ||||||||||||||
| Unrealized |
(40,824 | ) | (83,853 | ) | 18,293 | 7,449 | (98,935 | ) | ||||||||||||
|
|
|
|
|
|
|
|
|
|
|
|||||||||||
| Total Investment Income |
40,065 | 35,726 | 17,661 | 10,507 | 103,959 | |||||||||||||||
| Interest and Dividend Revenue |
10,922 | 18,167 | 7,554 | 9,233 | 45,876 | |||||||||||||||
| Other |
(1,800 | ) | (3,150 | ) | (1,610 | ) | (1,727 | ) | (8,287 | ) | ||||||||||
|
|
|
|
|
|
|
|
|
|
|
|||||||||||
| Total Revenues |
629,509 | 785,551 | 211,124 | 228,673 | 1,854,857 | |||||||||||||||
|
|
|
|
|
|
|
|
|
|
|
|||||||||||
| Expenses |
||||||||||||||||||||
| Compensation and Benefits Compensation |
83,742 | 102,702 | 47,604 | 54,979 | 289,027 | |||||||||||||||
| Performance Fee Compensation |
||||||||||||||||||||
| Realized |
||||||||||||||||||||
| Carried Interest |
181,633 | 179,925 | — | 4,633 | 366,191 | |||||||||||||||
| Incentive Fees |
— | 1,364 | 7,317 | 14,071 | 22,752 | |||||||||||||||
| Unrealized |
||||||||||||||||||||
| Carried Interest |
(39,356 | ) | 11,798 | 1,209 | 21,962 | (4,387 | ) | |||||||||||||
| Incentive Fees |
— | 8,509 | 14,004 | 626 | 23,139 | |||||||||||||||
|
|
|
|
|
|
|
|
|
|
|
|||||||||||
| Total Compensation and Benefits |
226,019 | 304,298 | 70,134 | 96,271 | 696,722 | |||||||||||||||
| Other Operating Expenses |
42,822 | 51,969 | 25,800 | 32,701 | 153,292 | |||||||||||||||
|
|
|
|
|
|
|
|
|
|
|
|||||||||||
| Total Expenses |
268,841 | 356,267 | 95,934 | 128,972 | 850,014 | |||||||||||||||
|
|
|
|
|
|
|
|
|
|
|
|||||||||||
| Economic Income |
$ | 360,668 | $ | 429,284 | $ | 115,190 | $ | 99,701 | $ | 1,004,843 | ||||||||||
|
|
|
|
|
|
|
|
|
|
|
|||||||||||
| Segment Assets |
$ | 5,983,046 | $ | 7,916,805 | $ | 2,297,471 | $ | 3,302,146 | $ | 19,499,468 | ||||||||||
|
|
|
|
|
|
|
|
|
|
|
|||||||||||
51
Table of Contents
THE BLACKSTONE GROUP L.P.
Notes to Condensed Consolidated Financial Statements—Continued
(All Dollars Are in Thousands, Except Unit and Per Unit Data, Except Where Noted)
| Three Months Ended March 31, 2016 | ||||||||||||||||||||
| Private Equity |
Real Estate | Hedge Fund Solutions |
Credit | Total Segments |
||||||||||||||||
| Segment Revenues |
||||||||||||||||||||
| Management and Advisory Fees, Net |
||||||||||||||||||||
| Base Management Fees |
$ | 130,648 | $ | 199,907 | $ | 130,158 | $ | 125,990 | $ | 586,703 | ||||||||||
| Transaction, Advisory and Other Fees, Net |
8,920 | 35,794 | 543 | 1,342 | 46,599 | |||||||||||||||
| Management Fee Offsets |
(6,848 | ) | (3,595 | ) | — | (9,658 | ) | (20,101 | ) | |||||||||||
|
|
|
|
|
|
|
|
|
|
|
|||||||||||
| Total Management and Advisory Fees, Net |
132,720 | 232,106 | 130,701 | 117,674 | 613,201 | |||||||||||||||
|
|
|
|
|
|
|
|
|
|
|
|||||||||||
| Performance Fees |
||||||||||||||||||||
| Realized |
||||||||||||||||||||
| Carried Interest |
30,282 | 200,627 | — | — | 230,909 | |||||||||||||||
| Incentive Fees |
— | 4,069 | 2,684 | 21,697 | 28,450 | |||||||||||||||
| Unrealized |
||||||||||||||||||||
| Carried Interest |
73,875 | (11,522 | ) | 32 | (14,779 | ) | 47,606 | |||||||||||||
| Incentive Fees |
— | 9,765 | (2,935 | ) | 270 | 7,100 | ||||||||||||||
|
|
|
|
|
|
|
|
|
|
|
|||||||||||
| Total Performance Fees |
104,157 | 202,939 | (219 | ) | 7,188 | 314,065 | ||||||||||||||
|
|
|
|
|
|
|
|
|
|
|
|||||||||||
| Investment Income (Loss) |
||||||||||||||||||||
| Realized |
(15,357 | ) | 12,975 | (4,745 | ) | (2,974 | ) | (10,101 | ) | |||||||||||
| Unrealized |
15,440 | (2,137 | ) | (12,291 | ) | (17,561 | ) | (16,549 | ) | |||||||||||
|
|
|
|
|
|
|
|
|
|
|
|||||||||||
| Total Investment Income (Loss) |
83 | 10,838 | (17,036 | ) | (20,535 | ) | (26,650 | ) | ||||||||||||
| Interest and Dividend Revenue |
9,849 | 13,188 | 5,296 | 6,748 | 35,081 | |||||||||||||||
| Other |
(1,587 | ) | (1,909 | ) | (1,388 | ) | (1,364 | ) | (6,248 | ) | ||||||||||
|
|
|
|
|
|
|
|
|
|
|
|||||||||||
| Total Revenues |
245,222 | 457,162 | 117,354 | 109,711 | 929,449 | |||||||||||||||
|
|
|
|
|
|
|
|
|
|
|
|||||||||||
| Expenses |
||||||||||||||||||||
| Compensation and Benefits Compensation |
80,274 | 100,578 | 54,169 | 52,382 | 287,403 | |||||||||||||||
| Performance Fee Compensation |
||||||||||||||||||||
| Realized |
||||||||||||||||||||
| Carried Interest |
15,427 | 43,076 | — | — | 58,503 | |||||||||||||||
| Incentive Fees |
— | 2,133 | 1,863 | 10,127 | 14,123 | |||||||||||||||
| Unrealized |
||||||||||||||||||||
| Carried Interest |
9,296 | 27,703 | — | (6,998 | ) | 30,001 | ||||||||||||||
| Incentive Fees |
— | 4,158 | (1,195 | ) | 485 | 3,448 | ||||||||||||||
|
|
|
|
|
|
|
|
|
|
|
|||||||||||
| Total Compensation and Benefits |
104,997 | 177,648 | 54,837 | 55,996 | 393,478 | |||||||||||||||
| Other Operating Expenses |
48,063 | 48,097 | 26,146 | 26,220 | 148,526 | |||||||||||||||
|
|
|
|
|
|
|
|
|
|
|
|||||||||||
| Total Expenses |
153,060 | 225,745 | 80,983 | 82,216 | 542,004 | |||||||||||||||
|
|
|
|
|
|
|
|
|
|
|
|||||||||||
| Economic Income |
$ | 92,162 | $ | 231,417 | $ | 36,371 | $ | 27,495 | $ | 387,445 | ||||||||||
|
|
|
|
|
|
|
|
|
|
|
|||||||||||
52
Table of Contents
THE BLACKSTONE GROUP L.P.
Notes to Condensed Consolidated Financial Statements—Continued
(All Dollars Are in Thousands, Except Unit and Per Unit Data, Except Where Noted)
The following table reconciles the Total Segments to Blackstone’s Income Before Provision for Taxes and Total Assets as of and for the three months ended March 31, 2017 and 2016:
| Three Months Ended March 31, 2017 | Three Months Ended March 31, 2016 | |||||||||||||||||||||||
| Total Segments |
Consolidation Adjustments and Reconciling Items |
Blackstone Consolidated |
Total Segments |
Consolidation Adjustments and Reconciling Items |
Blackstone Consolidated |
|||||||||||||||||||
| Revenues |
$ | 1,854,857 | $ | 85,866(a) | $ | 1,940,723 | $ | 929,449 | $ | 2,905(a) | $ | 932,354 | ||||||||||||
| Expenses |
$ | 850,014 | $ | 79,636(b) | $ | 929,650 | $ | 542,004 | $ | 75,706(b) | $ | 617,710 | ||||||||||||
| Other Income |
$ | — | $ | 66,132(c) | $ | 66,132 | $ | — | $ | 19,142(c) | $ | 19,142 | ||||||||||||
| Economic Income |
$ | 1,004,843 | $ | 72,362(d) | $ | 1,077,205 | $ | 387,445 | $ | (53,659)(d) | $ | 333,786 | ||||||||||||
| Total Assets |
$ | 19,499,468 | $ | 8,837,696(e) | $ | 28,337,164 | ||||||||||||||||||
| (a) | The Revenues adjustment represents management and performance fees earned from Blackstone Funds that were eliminated in consolidation to arrive at Blackstone consolidated revenues, non-segment related Investment Income (Loss), which is included in Blackstone consolidated revenues and the elimination of inter-segment interest income. |
| (b) | The Expenses adjustment represents the addition of expenses of the consolidated Blackstone Funds to the Blackstone unconsolidated expenses, amortization of intangibles, expenses related to transaction-related equity-based compensation and the elimination of inter-segment interest expense to arrive at Blackstone consolidated expenses. |
| (c) | The Other Income adjustment results from the following: |
| Three Months Ended March 31, | ||||||||
| 2017 | 2016 | |||||||
| Fund Management Fees and Performance Fees Eliminated in Consolidation and Transactional Investment Loss |
$ | (85,321 | ) | $ | (2,757 | ) | ||
| Fund Expenses Added in Consolidation |
7,491 | (5,847 | ) | |||||
| Income Associated with Non-Controlling Interests of Consolidated Entities |
140,685 | 33,685 | ||||||
| Transaction-Related Other Income (Loss) |
3,277 | (5,939 | ) | |||||
|
|
|
|
|
|||||
| Total Consolidation Adjustments and Reconciling Items |
$ | 66,132 | $ | 19,142 | ||||
|
|
|
|
|
|||||
| (d) | The reconciliation of Economic Income to Income Before Provision for Taxes as reported in the Condensed Consolidated Statements of Operations consists of the following: |
| Three Months Ended March 31, | ||||||||
| 2017 | 2016 | |||||||
| Economic Income |
$ | 1,004,843 | $ | 387,445 | ||||
|
|
|
|
|
|||||
| Adjustments |
||||||||
| Amortization of Intangibles |
(11,344 | ) | (23,208 | ) | ||||
| Transaction-Related Charges |
(56,979 | ) | (64,136 | ) | ||||
| Income Associated with Non-Controlling Interests of Consolidated Entities |
140,685 | 33,685 | ||||||
|
|
|
|
|
|||||
| Total Consolidation Adjustments and Reconciling Items |
72,362 | (53,659 | ) | |||||
|
|
|
|
|
|||||
| Income Before Provision for Taxes |
$ | 1,077,205 | $ | 333,786 | ||||
|
|
|
|
|
|||||
53
Table of Contents
THE BLACKSTONE GROUP L.P.
Notes to Condensed Consolidated Financial Statements—Continued
(All Dollars Are in Thousands, Except Unit and Per Unit Data, Except Where Noted)
| (e) | The Total Assets adjustment represents the addition of assets of the consolidated Blackstone Funds to the Blackstone unconsolidated assets to arrive at Blackstone consolidated assets. |
| 19. | SUBSEQUENT EVENTS |
There have been no events since March 31, 2017 that require recognition or disclosure in the Condensed Consolidated Financial Statements.
54
Table of Contents
| ITEM 1A. | UNAUDITED SUPPLEMENTAL PRESENTATION OF STATEMENTS OF FINANCIAL CONDITION |
THE BLACKSTONE GROUP L.P.
Unaudited Consolidating Statements of Financial Condition
(Dollars in Thousands)
| March 31, 2017 | ||||||||||||||||
| Consolidated Operating Partnerships |
Consolidated Blackstone Funds (a) |
Reclasses and Eliminations |
Consolidated | |||||||||||||
| Assets |
||||||||||||||||
| Cash and Cash Equivalents |
$ | 2,303,680 | $ | — | $ | — | $ | 2,303,680 | ||||||||
| Cash Held by Blackstone Funds and Other |
327,687 | 1,089,217 | — | 1,416,904 | ||||||||||||
| Investments |
11,334,290 | 7,209,216 | (405,248 | ) | 18,138,258 | |||||||||||
| Accounts Receivable |
327,390 | 946,764 | — | 1,274,154 | ||||||||||||
| Reverse Repurchase Agreements |
44,635 | — | — | 44,635 | ||||||||||||
| Due from Affiliates |
1,677,312 | 16,157 | (24,345 | ) | 1,669,124 | |||||||||||
| Intangible Assets, Net |
251,640 | — | — | 251,640 | ||||||||||||
| Goodwill |
1,718,519 | — | — | 1,718,519 | ||||||||||||
| Other Assets |
251,167 | 5,935 | — | 257,102 | ||||||||||||
| Deferred Tax Assets |
1,263,148 | — | — | 1,263,148 | ||||||||||||
|
|
|
|
|
|
|
|
|
|||||||||
| Total Assets |
$ | 19,499,468 | $ | 9,267,289 | $ | (429,593 | ) | $ | 28,337,164 | |||||||
|
|
|
|
|
|
|
|
|
|||||||||
| Liabilities and Partners’ Capital |
||||||||||||||||
| Loans Payable |
$ | 3,410,716 | $ | 6,386,217 | $ | — | $ | 9,796,933 | ||||||||
| Due to Affiliates |
1,187,566 | 104,446 | (55,945 | ) | 1,236,067 | |||||||||||
| Accrued Compensation and Benefits |
2,221,161 | — | — | 2,221,161 | ||||||||||||
| Securities Sold, Not Yet Purchased |
92,763 | 85,685 | — | 178,448 | ||||||||||||
| Repurchase Agreements |
21,253 | 73,393 | — | 94,646 | ||||||||||||
| Accounts Payable, Accrued Expenses and Other Liabilities |
492,014 | 1,215,036 | — | 1,707,050 | ||||||||||||
|
|
|
|
|
|
|
|
|
|||||||||
| Total Liabilities |
7,425,473 | 7,864,777 | (55,945 | ) | 15,234,305 | |||||||||||
|
|
|
|
|
|
|
|
|
|||||||||
| Redeemable Non-Controlling Interests in |
— | 188,658 | — | 188,658 | ||||||||||||
|
|
|
|
|
|
|
|
|
|||||||||
| Partners’ Capital |
||||||||||||||||
| Partners’ Capital |
6,714,320 | 357,957 | (358,655 | ) | 6,713,622 | |||||||||||
| Accumulated Other Comprehensive Income (Loss) |
(55,988 | ) | — | 787 | (55,201 | ) | ||||||||||
| Non-Controlling Interests in Consolidated Entities |
1,810,672 | 855,897 | (15,780 | ) | 2,650,789 | |||||||||||
| Non-Controlling Interests in Blackstone Holdings |
3,604,991 | — | — | 3,604,991 | ||||||||||||
|
|
|
|
|
|
|
|
|
|||||||||
| Total Partners’ Capital |
12,073,995 | 1,213,854 | (373,648 | ) | 12,914,201 | |||||||||||
|
|
|
|
|
|
|
|
|
|||||||||
| Total Liabilities and Partners’ Capital |
$ | 19,499,468 | $ | 9,267,289 | $ | (429,593 | ) | $ | 28,337,164 | |||||||
|
|
|
|
|
|
|
|
|
|||||||||
continued…
55
Table of Contents
THE BLACKSTONE GROUP L.P.
Unaudited Consolidating Statements of Financial Condition
(Dollars in Thousands)
| December 31, 2016 | ||||||||||||||||
| Consolidated Operating Partnerships |
Consolidated Blackstone Funds (a) |
Reclasses and Eliminations |
Consolidated | |||||||||||||
| Assets |
||||||||||||||||
| Cash and Cash Equivalents |
$ | 1,837,253 | $ | — | $ | — | $ | 1,837,253 | ||||||||
| Cash Held by Blackstone Funds and Other |
261,909 | 743,252 | — | 1,005,161 | ||||||||||||
| Investments |
11,618,729 | 6,474,168 | (397,922 | ) | 17,694,975 | |||||||||||
| Accounts Receivable |
404,843 | 367,852 | — | 772,695 | ||||||||||||
| Reverse Repurchase Agreements |
118,495 | — | — | 118,495 | ||||||||||||
| Due from Affiliates |
1,433,612 | 27,473 | (18,707 | ) | 1,442,378 | |||||||||||
| Intangible Assets, Net |
262,604 | — | — | 262,604 | ||||||||||||
| Goodwill |
1,718,519 | — | — | 1,718,519 | ||||||||||||
| Other Assets |
259,695 | 5,093 | — | 264,788 | ||||||||||||
| Deferred Tax Assets |
1,286,469 | — | — | 1,286,469 | ||||||||||||
|
|
|
|
|
|
|
|
|
|||||||||
| Total Assets |
$ | 19,202,128 | $ | 7,617,838 | $ | (416,629 | ) | $ | 26,403,337 | |||||||
|
|
|
|
|
|
|
|
|
|||||||||
| Liabilities and Partners’ Capital |
||||||||||||||||
| Loans Payable |
$ | 3,399,922 | $ | 5,466,444 | $ | — | $ | 8,866,366 | ||||||||
| Due to Affiliates |
1,253,791 | 86,688 | (18,707 | ) | 1,321,772 | |||||||||||
| Accrued Compensation and Benefits |
2,327,762 | — | — | 2,327,762 | ||||||||||||
| Securities Sold, Not Yet Purchased |
127,710 | 87,688 | — | 215,398 | ||||||||||||
| Repurchase Agreements |
7,034 | 68,290 | — | 75,324 | ||||||||||||
| Accounts Payable, Accrued Expenses and Other Liabilities |
533,101 | 548,681 | — | 1,081,782 | ||||||||||||
|
|
|
|
|
|
|
|
|
|||||||||
| Total Liabilities |
7,649,320 | 6,257,791 | (18,707 | ) | 13,888,404 | |||||||||||
|
|
|
|
|
|
|
|
|
|||||||||
| Redeemable Non-Controlling Interests in Consolidated Entities |
— | 185,390 | — | 185,390 | ||||||||||||
|
|
|
|
|
|
|
|
|
|||||||||
| Partners’ Capital |
||||||||||||||||
| Partners’ Capital |
6,524,607 | 398,001 | (398,679 | ) | 6,523,929 | |||||||||||
| Accumulated Other Comprehensive Income (Loss) |
(63,644 | ) | — | 757 | (62,887 | ) | ||||||||||
| Non-Controlling Interests in Consolidated Entities |
1,652,308 | 776,656 | — | 2,428,964 | ||||||||||||
| Non-Controlling Interests in Blackstone Holdings |
3,439,537 | — | — | 3,439,537 | ||||||||||||
|
|
|
|
|
|
|
|
|
|||||||||
| Total Partners’ Capital |
11,552,808 | 1,174,657 | (397,922 | ) | 12,329,543 | |||||||||||
|
|
|
|
|
|
|
|
|
|||||||||
| Total Liabilities and Partners’ Capital |
$ | 19,202,128 | $ | 7,617,838 | $ | (416,629 | ) | $ | 26,403,337 | |||||||
|
|
|
|
|
|
|
|
|
|||||||||
| (a) | The Consolidated Blackstone Funds consisted of the following: |
Blackstone Real Estate Partners VI.C — ESH L.P.
Blackstone Real Estate Special Situations Fund L.P.
Blackstone Real Estate Special Situations Offshore Fund Ltd.
Blackstone Strategic Alliance Fund L.P.
Blackstone/GSO Loan Financing Limited
BSSF I AIV L.P.
BTD CP Holdings, LP
GSO Legacy Associates II LLC
GSO Legacy Associates LLC
56
Table of Contents
Private equity side-by-side investment vehicles
Real estate side-by-side investment vehicles
Mezzanine side-by-side investment vehicles
Collateralized loan obligation vehicles
| ITEM 2. | MANAGEMENT’S DISCUSSION AND ANALYSIS OF FINANCIAL CONDITION AND RESULTS OF OPERATIONS |
The following discussion and analysis should be read in conjunction with The Blackstone Group L.P.’s condensed consolidated financial statements and the related notes included within this Quarterly Report on Form 10-Q.
Our Business
Blackstone is one of the largest independent managers of private capital in the world. Our business is organized into four segments:
| • | Private Equity. We are a world leader in private equity investing, having managed seven general private equity funds, as well as three sector-focused funds, since we established this business in 1987. Our Private Equity segment includes our corporate private equity business, which consists of our flagship corporate private equity funds, Blackstone Capital Partners (“BCP”) funds, our sector-focused corporate private equity funds, including our energy-focused funds, Blackstone Energy Partners (“BEP”) funds and our core private equity fund, Blackstone Core Equity Partners (“BCEP”). In addition, our Private Equity segment includes our opportunistic investment platform that invests globally across asset classes, industries and geographies, Blackstone Tactical Opportunities (“Tactical Opportunities”), our secondary private equity fund of funds business, Strategic Partners Fund Solutions (“Strategic Partners”), a multi-asset investment program for eligible high net worth investors offering exposure to certain of Blackstone’s key illiquid investment strategies through a single commitment, Blackstone Total Alternatives Solutions (“BTAS”) and our capital markets services business, Blackstone Capital Markets (“BXCM”). |
Our corporate private equity business pursues transactions throughout the world across a variety of transaction types, including large buyouts, mid-cap buyouts, buy and build platforms (which involve multiple acquisitions behind a single management team and platform) and growth equity/development projects (which involve significant minority investments in mature companies and greenfield development projects in energy and power). Tactical Opportunities seeks to capitalize on complex and dislocated market situations across asset classes, industries and geographies in a broad range of investments, including private and public securities, and instruments, where the underlying exposure may be to equity, debt, and/or real assets. Strategic Partners focuses on delivering access to a range of opportunities, leveraging its proprietary database to acquire single fund interests or complex portfolios in an efficient and timely manner.
| • | Real Estate. Our Real Estate group is one of the largest real estate investment managers in the world. We operate as one globally integrated business, with investments in North America, Europe, Asia and Latin America. |
Our Blackstone Real Estate Partners (“BREP”) funds are geographically diversified and target a broad range of “opportunistic” real estate and real estate related investments. The BREP funds include global funds as well as funds focused specifically on Europe or Asia investments. We seek to acquire high quality, well-located yet undermanaged assets at an attractive basis, address any property or business issues through active asset management and sell the assets once our business plan is accomplished. BREP has made significant investments in hotels, office buildings, shopping centers, residential and industrial assets, as well as a variety of real estate operating companies.
Our Blackstone Real Estate Debt Strategies (“BREDS”) vehicles target debt investment opportunities collateralized by commercial real estate in both public and private markets, primarily in the U.S. and
57
Table of Contents
Europe. BREDS’ scale and investment mandates enable it to provide a variety of lending and investment options including mezzanine loans, senior loans and liquid securities. The BREDS platform includes a number of high yield real estate debt funds, liquid real estate debt funds and BXMT, a NYSE-listed real estate investment trust (“REIT”).
Our core+ real estate business, Blackstone Property Partners (“BPP”) has assembled a global portfolio of high quality core+ investments across the U.S., Europe and Asia. Our BPP vehicles target substantially stabilized assets in prime markets with a focus on office, multifamily, industrial and retail assets. We manage several core+ real estate funds and BREIT, a non-exchange traded REIT, which targets primarily stabilized income-oriented commercial real estate in the U.S.
| • | Hedge Fund Solutions. Blackstone’s Hedge Fund Solutions segment is comprised principally of Blackstone Alternative Asset Management (“BAAM”). BAAM is the world’s largest discretionary allocator to hedge funds, managing a broad range of commingled and customized hedge fund of fund solutions since its inception in 1990. The Hedge Fund Solutions segment also includes investment platforms that seed new hedge fund businesses, purchase minority ownership interests in more established hedge funds, invest in special situation opportunities, create alternative solutions in regulated structures and trade directly. |
| • | Credit. Our credit business consists principally of GSO Capital Partners LP (“GSO”) which was founded in 2005 and subsequently acquired by Blackstone in 2008. GSO is one of the largest leveraged finance-focused alternative asset managers in the world and is the largest manager of collateralized loan obligations (“CLOs”) globally. The investment portfolios of the funds we manage or sub-advise predominantly consist of loans and securities of non-investment grade companies spread across the capital structure including senior debt, subordinated debt, preferred stock and common equity. |
The GSO business is organized into three overarching strategies: performing credit, distressed and long only. Our performing credit strategies include mezzanine lending funds, business development companies that we sub-advise (“BDCs”) and other performing credit strategy funds. Our distressed strategies include hedge fund strategies, rescue lending funds and distressed energy strategies. GSO’s long only strategies consist of CLOs, closed-end funds, commingled funds and separately managed accounts.
We generate revenue from fees earned pursuant to contractual arrangements with funds, fund investors and fund portfolio companies (including management, transaction and monitoring fees), and from capital markets services. We invest in the funds we manage and, in most cases, receive a preferred allocation of income (i.e., a carried interest) or an incentive fee from an investment fund in the event that specified cumulative investment returns are achieved (generally collectively referred to as “Performance Fees”). The composition of our revenues will vary based on market conditions and the cyclicality of the different businesses in which we operate. Net investment gains and investment income generated by the Blackstone Funds, principally private equity and real estate funds, are driven by value created by our operating and strategic initiatives as well as overall market conditions. Fair values are affected by changes in the fundamentals of the portfolio company, the portfolio company’s industry, the overall economy and other market conditions.
Business Environment
Blackstone’s businesses are materially affected by conditions in the financial markets and economic conditions in the U.S., Europe, Asia and, to a lesser extent, elsewhere in the world.
The first quarter of 2017 was largely characterized by strengthening investor confidence and a continuation of the significant equity market appreciation seen in late 2016 following the U.S. presidential election, reflecting expectations with respect to potential tax and regulatory reform. The S&P 500 ended the quarter up 6%, near its all-time high reached earlier in March 2017. In addition, most other global indices rose as well, including the FTSE 100 (up 3%), the Euro Stoxx (up 6%) and the Hang Seng (up 10%), although the Nikkei declined slightly (down 1%). This equity market performance was in stark contrast to the first quarter of 2016, which marked one of the
58
Table of Contents
worst starts to a year for equities in U.S. history. Stock market volatility remained subdued, with the CBOE Volatility Index reaching its lowest level in 10 years, ending the quarter down 12%.
Though trailing equity markets, most bond sectors posted modest gains for the quarter, with the Bloomberg Barclays U.S. Aggregate Index up 0.8%, investment grade corporates up 1.6% and high yield corporates up 2.7%. In March, the U.S. Federal Reserve raised the targeted range for its benchmark interest rate by 25 basis points to 0.75% to 1.0%, as was widely expected, and 10-year U.S. treasury yields ended the quarter flat at 2.4%. High yield spreads tightened 22 basis points and issuance rose significantly, up 175% year over year. Global equity capital markets activity for both initial public offerings (“IPO”) and follow-ons reached a two-year high, up 61% year over year, driven by strong market conditions and investor optimism.
In currency markets, the U.S. dollar slipped, with the USD index down 3% during the quarter. The euro rose 1% versus the U.S. dollar, while the pound and Japanese yen rose 2% and 5%, respectively.
After rebounding significantly in the second half of 2016, oil markets demonstrated some weakness in the first quarter of 2017, with West Texas Intermediate Crude down 6% compared to the end of 2016, ending the quarter below $51 a barrel. Despite OPEC production cuts, price declines were led by still abundant existing supply and slowing demand from key economies such as Japan, Germany, Korea and India. Prices for other commodities also fell, with the Bloomberg Commodity Index declining 2.5% in the first quarter.
While commodity prices were somewhat weaker during the first quarter, overall global expansion continued, buoyed by stronger industrial activity, capital investment and improving worldwide demand. Fears over a sharp economic slowdown in China have moderated, and GDP growth accelerated to 6.9% during the first quarter of 2017 from 6.8% in the fourth quarter of 2016.
Most economists expect global growth to pick up modestly, driven by post-election confidence in the U.S., better prospects for larger emerging markets and increased global trade. However, significant uncertainty remains regarding the impact of European populism, geopolitical instability and the timing and magnitude of U.S. tax and regulatory reform, which may impact U.S. and global markets for the remainder of 2017.
59
Table of Contents
Organizational Structure
The simplified diagram below depicts our current organizational structure. The diagram does not depict all of our subsidiaries, including intermediate holding companies through which certain of the subsidiaries depicted are held.
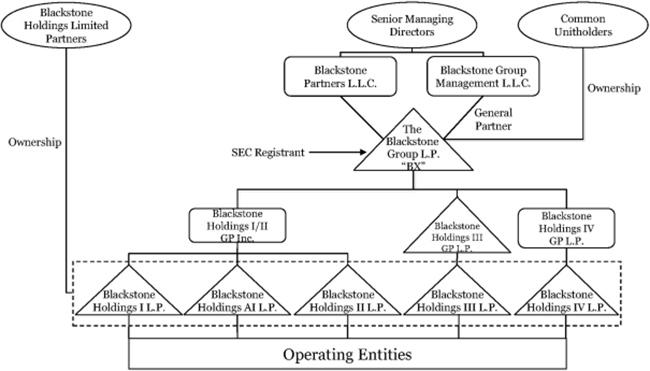
Key Financial Measures and Indicators
We manage our business using traditional financial measures and key operating metrics since we believe these metrics measure the productivity of our investment activities. Our key financial measures and indicators are discussed below.
Revenues
Revenues primarily consist of management and advisory fees, performance fees, investment income, interest and dividend revenue and other. Please refer to “Part I. Item 1. Business — Incentive Arrangements / Fee Structure” in our Annual Report on Form 10-K for the year ended December 31, 2016 and “Critical Accounting Policies — Revenue Recognition” for additional information regarding the manner in which Base Management Fees and Performance Fees are generated.
Management and Advisory Fees, Net — Management and Advisory Fees, Net are comprised of management fees, including base management fees, transaction and other fees and advisory fees net of management fee reductions and offsets.
The Partnership earns base management fees from limited partners of funds in each of its managed funds, at a fixed percentage of assets under management, net asset value, total assets, committed capital or invested capital, or in some cases, a fixed fee. Base management fees are recognized based on contractual terms specified in the underlying investment advisory agreements.
60
Table of Contents
Transaction and other fees (including monitoring fees) are fees charged directly to managed funds and portfolio companies. The investment advisory agreements generally require that the investment adviser reduce the amount of management fees payable by the limited partners to the Partnership (“management fee reductions”) by an amount equal to a portion of the transaction and other fees directly paid to the Partnership by the portfolio companies. The amount of the reduction varies by fund, the type of fee paid by the portfolio company and the previously incurred expenses of the fund.
Management fee offsets are reductions to management fees payable by the limited partners of the Blackstone Funds, which are granted based on the amount such limited partners reimburse the Blackstone Funds for placement fees.
Advisory fees consist of transaction-based fee arrangements. Transaction-based fees are recognized when (a) there is evidence of an arrangement with a client, (b) agreed upon services have been provided, (c) fees are fixed or determinable, and (d) collection is reasonably assured.
Accrued but unpaid Management and Advisory Fees, net of management fee reductions and management fee offsets, as of the reporting date are included in Accounts Receivable or Due from Affiliates in the Condensed Consolidated Statements of Financial Condition. Management fees paid by limited partners to the Blackstone Funds and passed on to Blackstone are not considered affiliate revenues.
Performance Fees — Performance Fees earned on the performance of Blackstone’s hedge fund structures (“Incentive Fees”) are recognized based on fund performance during the period, subject to the achievement of minimum return levels, or high water marks, in accordance with the respective terms set out in each hedge fund’s governing agreements. Accrued but unpaid Incentive Fees charged directly to investors in Blackstone’s offshore hedge funds as of the reporting date are recorded within Due from Affiliates in the Condensed Consolidated Statements of Financial Condition. Accrued but unpaid Incentive Fees on onshore funds as of the reporting date are reflected in Investments in the Condensed Consolidated Statements of Financial Condition. Incentive Fees are realized at the end of a measurement period, typically annually. Once realized, such fees are not subject to clawback or reversal.
In certain fund structures, specifically in private equity, real estate and certain hedge fund solutions and credit-focused funds (“carry funds”), performance fees (“Carried Interest”) are allocated to the general partner based on cumulative fund performance to date, subject to a preferred return to limited partners. At the end of each reporting period, the Partnership calculates the Carried Interest that would be due to the Partnership for each fund, pursuant to the fund agreements, as if the fair value of the underlying investments were realized as of such date, irrespective of whether such amounts have been realized. As the fair value of underlying investments varies between reporting periods, it is necessary to make adjustments to amounts recorded as Carried Interest to reflect either (a) positive performance resulting in an increase in the Carried Interest allocated to the general partner or (b) negative performance that would cause the amount due to the Partnership to be less than the amount previously recognized as revenue, resulting in a negative adjustment to Carried Interest allocated to the general partner. In each scenario, it is necessary to calculate the Carried Interest on cumulative results compared to the Carried Interest recorded to date and make the required positive or negative adjustments. The Partnership ceases to record negative Carried Interest allocations once previously recognized Carried Interest allocations for such fund have been fully reversed. The Partnership is not obligated to pay guaranteed returns or hurdles, and therefore, cannot have negative Carried Interest over the life of a fund. Accrued but unpaid Carried Interest as of the reporting date is reflected in Investments in the Condensed Consolidated Statements of Financial Condition.
Carried Interest is realized when an underlying investment is profitably disposed of and the fund’s cumulative returns are in excess of the preferred return or, in limited instances, after certain thresholds for return of capital are met. Carried Interest is subject to clawback to the extent that the Carried Interest received to date exceeds the amount due to Blackstone based on cumulative results. As such, the accrual for potential repayment of previously received Carried Interest, which is a component of Due to Affiliates, represents all amounts previously distributed to
61
Table of Contents
Blackstone Holdings and non-controlling interest holders that would need to be repaid to the Blackstone carry funds if the Blackstone carry funds were to be liquidated based on the current fair value of the underlying funds’ investments as of the reporting date. The actual clawback liability, however, generally does not become realized until the end of a fund’s life except for certain funds, including certain Blackstone real estate funds, multi-asset class investment funds and credit-focused funds, which may have an interim clawback liability.
Investment Income (Loss) — Investment Income (Loss) represents the unrealized and realized gains and losses on the Partnership’s principal investments, including its investments in Blackstone Funds that are not consolidated, its equity method investments, and other principal investments. Investment Income (Loss) is realized when the Partnership redeems all or a portion of its investment or when the Partnership receives cash income, such as dividends or distributions. Unrealized Investment Income (Loss) results from changes in the fair value of the underlying investment as well as the reversal of unrealized gain (loss) at the time an investment is realized.
Interest and Dividend Revenue — Interest and Dividend Revenue comprises primarily interest and dividend income earned on principal investments held by Blackstone.
Other Revenue — Other Revenue consists of miscellaneous income and foreign exchange gains and losses arising on transactions denominated in currencies other than U.S. dollars.
Expenses
Compensation and Benefits — Compensation — Compensation and Benefits consists of (a) employee compensation, comprising salary and bonus, and benefits paid and payable to employees and senior managing directors and (b) equity-based compensation associated with the grants of equity-based awards to employees and senior managing directors. Compensation cost relating to the issuance of equity-based awards to senior managing directors and employees is measured at fair value at the grant date, taking into consideration expected forfeitures, and expensed over the vesting period on a straight-line basis, except in the case of (a) equity-based awards that do not require future service, which are expensed immediately and (b) certain awards to recipients that meet specified criteria making them eligible for retirement treatment (allowing such recipient to keep a percentage of those awards upon departure from Blackstone after becoming eligible for retirement), for which the expense for the portion of the award that would be retained in the event of retirement is either expensed immediately or amortized to the retirement date. Cash settled equity-based awards are classified as liabilities and are remeasured at the end of each reporting period.
Compensation and Benefits — Performance Fee — Performance Fee Compensation consists of Carried Interest (which may be distributed in cash or in-kind) and Incentive Fee allocations, and may in future periods also include allocations of investment income from Blackstone’s firm investments, to employees and senior managing directors participating in certain profit sharing initiatives. Such compensation expense is subject to both positive and negative adjustments. Unlike Carried Interest and Incentive Fees, compensation expense is based on the performance of individual investments held by a fund rather than on a fund by fund basis.
Other Operating Expenses — Other Operating Expenses represents general and administrative expenses including interest expense, occupancy and equipment expenses and other expenses, which consist principally of professional fees, public company costs, travel and related expenses, communications and information services and depreciation and amortization.
Fund Expenses — The expenses of our consolidated Blackstone Funds consist primarily of interest expense, professional fees and other third party expenses.
Non-Controlling Interests in Consolidated Entities
Non-Controlling Interests in Consolidated Entities represent the component of Partners’ Capital in consolidated Blackstone Funds held by third party investors and employees. The percentage interests held by third parties and
62
Table of Contents
employees is adjusted for general partner allocations and by subscriptions and redemptions in funds of hedge funds and certain credit-focused funds which occur during the reporting period. In addition, all non-controlling interests in consolidated Blackstone Funds are attributed a share of income (loss) arising from the respective funds and a share of other comprehensive income, if applicable. Income (Loss) is allocated to non-controlling interests in consolidated entities based on the relative ownership interests of third party investors and employees after considering any contractual arrangements that govern the allocation of income (loss) such as fees allocable to The Blackstone Group L.P.
Redeemable Non-Controlling Interests in Consolidated Entities
Non-controlling interests related to funds of hedge funds are subject to annual, semi-annual or quarterly redemption by investors in these funds following the expiration of a specified period of time, or may be withdrawn subject to a redemption fee during the period when capital may not be withdrawn. As limited partners in these types of funds have been granted redemption rights, amounts relating to third party interests in such consolidated funds are presented as Redeemable Non-Controlling Interests in Consolidated Entities within the Condensed Consolidated Statements of Financial Condition. When redeemable amounts become legally payable to investors, they are classified as a liability and included in Accounts Payable, Accrued Expenses and Other Liabilities in the Condensed Consolidated Statements of Financial Condition. For all consolidated funds in which redemption rights have not been granted, non-controlling interests are presented within Partners’ Capital in the Condensed Consolidated Statements of Financial Condition as Non-Controlling Interests in Consolidated Entities.
Non-Controlling Interests in Blackstone Holdings
Non-Controlling Interests in Blackstone Holdings represent the component of Partners’ Capital in the consolidated Blackstone Holdings Partnerships held by Blackstone personnel and others who are limited partners of the Blackstone Holdings Partnerships.
Certain costs and expenses are borne directly by the Holdings Partnerships. Income (Loss), excluding those costs directly borne by and attributable to the Holdings Partnerships, is attributable to Non-Controlling Interests in Blackstone Holdings. This residual attribution is based on the year to date average percentage of Blackstone Holdings Partnership Units held by Blackstone personnel and others who are limited partners of the Blackstone Holdings Partnerships.
Income Taxes
The Blackstone Holdings Partnerships and certain of their subsidiaries operate in the U.S. as partnerships for U.S. federal income tax purposes and generally as corporate entities in non-U.S. jurisdictions. Accordingly, these entities in some cases are subject to New York City unincorporated business taxes or non-U.S. income taxes. In addition, certain of the wholly owned subsidiaries of the Partnership and the Blackstone Holdings Partnerships will be subject to federal, state and local corporate income taxes at the entity level and the related tax provision attributable to the Partnership’s share of this income tax is reflected in the Condensed Consolidated Financial Statements.
Income taxes are accounted for using the asset and liability method of accounting. Under this method, deferred tax assets and liabilities are recognized for the expected future tax consequences of differences between the carrying amounts of assets and liabilities and their respective tax basis, using tax rates in effect for the year in which the differences are expected to reverse. The effect on deferred assets and liabilities of a change in tax rates is recognized in income in the period when the change is enacted. Deferred tax assets are reduced by a valuation allowance when it is more likely than not that some portion or all of the deferred tax assets will not be realized. Current and deferred tax liabilities are recorded within Accounts Payable, Accrued Expenses and Other Liabilities in the Condensed Consolidated Statements of Financial Condition.
63
Table of Contents
Blackstone uses the flow-through method to account for investment tax credits. Under this method, the investment tax credits are recognized as a reduction to income tax expense.
Blackstone analyzes its tax filing positions in all of the U.S. federal, state, local and foreign tax jurisdictions where it is required to file income tax returns, as well as for all open tax years in these jurisdictions. Blackstone records uncertain tax positions on the basis of a two-step process: (a) a determination is made whether it is more likely than not that the tax positions will be sustained based on the technical merits of the position and (b) those tax positions that meet the more-likely-than-not threshold are recognized as the largest amount of tax benefit that is greater than 50 percent likely to be realized upon ultimate settlement with the related tax authority. Blackstone recognizes accrued interest and penalties related to uncertain tax positions in General, Administrative, and Other expenses within the Condensed Consolidated Statements of Operations.
There remains some uncertainty regarding Blackstone’s future taxation levels. Over the past several years, members of Congress and the administration of former President Obama have made a number of legislative proposals to change the taxation of carried interest that would have, in general, treated income and gains, including gain on sale, attributable to an investment services partnership interest, or “ISPI,” as income subject to a new blended tax rate that is higher than the capital gains rate applicable to such income under current law, except to the extent such ISPI would have been considered under the legislation to be a qualified capital interest. Our common units and the interests that we hold in entities that are entitled to receive carried interest would likely have been classified as ISPIs for purposes of this legislation. During his presidential campaign, President Trump expressed his support for legislation ending treatment of carried interest as capital gain. Whether or when the U.S. Congress will pass such legislation or what provisions will be included in any final legislation if enacted is unclear.
Some of the above legislative proposals have provided that, for taxable years beginning ten years after the date of enactment, income derived with respect to an ISPI that is not a qualified capital interest and that is subject to the foregoing rules would not meet the qualifying income requirements under the publicly traded partnership rules. Therefore, if similar legislation were to be enacted, following such ten-year period, we would be precluded from qualifying as a partnership for U.S. federal income tax purposes or be required to hold all such ISPIs through corporations.
Both President Trump and the Republican members of the U.S. House of Representatives have publicly stated that one of their top legislative priorities is significant reform of the Internal Revenue Code, including significant changes to taxation of business entities. Proposals by members of Congress have included, among other things: (a) reducing corporate tax rates (the highest dropping from 35% to 20%) and reducing individual tax rates (the highest dropping from 39.6% to 33%), (b) changing to a destination-based tax system, which would tax goods where they are consumed rather than produced, by providing for certain border adjustments which would effectively exempt exports from, and subject imports to, U.S. tax, (c) changing to a territorial tax system by exempting dividends from foreign subsidiaries from U.S. tax, but subjecting unrepatriated earnings of foreign subsidiaries to U.S. tax, paid over the course of eight years (8.75% on cash and cash equivalent and 3.5% otherwise), (d) allowing deductions for interest expense only against interest income, with any nondeductible net interest expense being carried forward indefinitely, (e) permitting current deductions for investment in tangible and intangible property (excluding land), (f) eliminating certain “special interest” deductions and credits, (g) taxing the active business income of pass-through entities at a maximum rate, such as 25%, (h) repealing the 3.8% net investment income tax and corporate and individual alternative minimum taxes and (i) extending the carryforward of net operating losses. While President Trump has expressed support for a number of these proposals, he has also set forth ideas for tax reform that differ in key ways. In particular, on April 26, 2017, the Trump administration released a brief summary of certain core principles for a tax reform proposal that would (1) lower the top tax rate on business income, including business income earned through partnerships and other pass-through entities, such as Blackstone, to 15%, (2) lower the top tax rate on income of individuals to 35%, (3) repeal the 3.8% net investment income tax and the alternative minimum tax, (4) change to a territorial tax system as described above, including a one-time tax on existing unrepatriated earnings, and (5) eliminate certain unspecified tax breaks for the wealthiest individuals and special interests, but does not specifically refer to the changes described in clauses (b), (d), (e) and (i) above. Both the timing and the details of any such tax reform are unclear. The impact of any potential tax reform on us, our
64
Table of Contents
portfolio companies and our investors is uncertain and could be adverse. Prospective investors should consult their own tax advisors regarding potential changes in tax laws.
States and other jurisdictions have also considered legislation to increase taxes with respect to carried interest. For example, New York has considered legislation, which could have caused a non-resident of New York who holds our common units to be subject to New York state income tax on carried interest earned by entities in which we hold an indirect interest, thereby requiring the non-resident to file a New York state income tax return reporting such carried interest income. Whether or when similar legislation will be enacted is unclear. Finally, several state and local jurisdictions have evaluated ways to subject partnerships to entity level taxation through the imposition of state or local income, franchise or other forms of taxation or to increase the amount of such taxation.
If we were taxed as a corporation or were forced to hold interests in entities earning income from carried interest through taxable subsidiary corporations, our effective tax rate could increase significantly. The federal statutory rate for corporations is currently 35% (although Congress is considering, and the Trump administration has set forth, proposals to lower that rate), and the state and local tax rates, net of the federal benefit, aggregate approximately 5%. If a variation of the above described legislation or any other change in the tax laws, rules, regulations or interpretations preclude us from qualifying for treatment as a partnership for U.S. federal income tax purposes under the publicly traded partnership rules or force us to hold interests in entities earning income from carried interest through taxable subsidiary corporations, this could materially increase our tax liability, and could well result in a reduction in the market price of our common units.
Meaningfully quantifying the potential impact on Blackstone of this potential future legislation or any similar legislation is not possible at this time. Multiple versions of legislation in this area have been proposed over the last few years that have included significantly different provisions regarding effective dates and the treatment of invested capital, tiered entities and cross-border operations, among other matters. Depending upon what version of the legislation, if any, were enacted, the potential impact on a public company such as Blackstone in a given year could differ significantly and could be material. In addition, even if these legislative proposals would not themselves impose a tax on a publicly traded partnership such as Blackstone, they could force Blackstone and other publicly traded partnerships to restructure their operations so as to prevent disqualifying income from reaching the publicly traded partnership in amounts that would disqualify the partnership from treatment as a partnership for U.S. federal income tax purposes. Such a restructuring could result in more income being earned in corporate subsidiaries, thereby increasing corporate income tax liability indirectly borne by the publicly traded partnership. In addition, we, and our common unitholders, could be taxed on any such restructuring. The nature of any such restructuring would depend on the precise provisions of the legislation that was ultimately enacted, as well as the particular facts and circumstances of Blackstone’s operations at the time any such legislation were to take effect, making the task of predicting the amount of additional tax highly speculative.
Congress, the Organization for Economic Co-operation and Development (“OECD”) and other government agencies in jurisdictions in which we and our affiliates invest or do business have maintained a focus on issues related to the taxation of multinational companies. The OECD, which represents a coalition of member countries, is contemplating changes to numerous long-standing tax principles through its base erosion and profit shifting project, which is focused on a number of issues, including the shifting of profits between affiliated entities in different tax jurisdictions, interest deductibility and eligibility for the benefits of double tax treaties. A number of European jurisdictions have enacted taxes on financial transactions, and the European Commission has proposed legislation to harmonize these taxes under the so-called “enhanced cooperation procedure,” which provides for adoption of EU-level legislation applicable to some but not all EU Member States. These contemplated changes, if adopted by individual countries, could increase tax uncertainty and/or costs faced by us, our portfolio companies and our investors, change our business model and cause other adverse consequences. The timing or impact of these proposals is unclear at this point. In addition, tax laws, regulations and interpretations are subject to continual changes, which could adversely affect our structures or returns to our investors. For instance, various countries have adopted or proposed tax legislation that may adversely affect portfolio companies and investment structures in countries in which our funds have invested and may limit the benefits of additional investments in those countries.
65
Table of Contents
In addition, legislation enacted in 2015 significantly changed the rules for U.S. federal income tax audits of partnerships. Such audits will continue to be conducted at the partnership level, but with respect to tax returns for taxable years beginning after December 31, 2017, and unless a partnership qualifies for and affirmatively elects an alternative procedure, any adjustments to the amount of tax due (including interest and penalties) will be payable by the partnership. Under the elective alternative procedure, a partnership would issue information returns to persons who were partners in the audited year, who would then be required to take the adjustments into account in calculating their own tax liability, and the partnership would not be liable for the adjustments. If a partnership elects the alternative procedure for a given adjustment, the amount of taxes for which its partners would be liable would be increased by any applicable penalties and a special interest charge. There can be no assurance that we will be eligible to make such an election or that we will, in fact, make such an election for any given adjustment. If we do not or are not able to make such an election, then (a) our then-current common unitholders, in the aggregate, could indirectly bear income tax liabilities in excess of the aggregate amount of taxes that would have been due had we elected the alternative procedure, and (b) a given common unitholder may indirectly bear taxes attributable to income allocable to other common unitholders or former common unitholders, including taxes (as well as interest and penalties) with respect to periods prior to such holder’s ownership of common units. Amounts available for distribution to our common unitholders may be reduced as a result of our obligation to pay any taxes associated with an adjustment. Many issues with respect to, and the overall effect of, this legislation on us are uncertain, and common unitholders should consult their own tax advisors regarding all aspects of this legislation as it affects their particular circumstances.
Economic Income
Blackstone uses Economic Income as a key measure of value creation, a benchmark of its performance and in making resource deployment and compensation decisions across its four segments. Economic Income represents segment net income before taxes excluding transaction-related charges. Transaction-related charges arise from Blackstone’s IPO and certain long-term retention programs outside of annual deferred compensation and other corporate actions, including acquisitions. Transaction-related charges include certain equity-based compensation charges, the amortization of intangible assets and contingent consideration associated with acquisitions. Economic Income presents revenues and expenses on a basis that deconsolidates the investment funds Blackstone manages. Economic Net Income (“ENI”) represents Economic Income adjusted to include current period taxes. Taxes represent the total tax provision calculated under accounting principles generally accepted in the United States of America (“GAAP”) adjusted to include only the current tax provision (benefit) calculated on Income (Loss) Before Provision for Taxes. Economic Income, our principal segment measure, is derived from and reconciled to, but not equivalent to, its most directly comparable GAAP measure of Income (Loss) Before Provision for Taxes. (See Note 18. “Segment Reporting” in the “Notes to Condensed Consolidated Financial Statements” in Part I. Item 1. Financial Statements.)
Fee Related Earnings
Blackstone uses Fee Related Earnings, which is derived from Economic Income, as a measure to highlight earnings from operations excluding: (a) the income related to performance fees and related performance fee compensation, (b) income earned from Blackstone’s investments in the Blackstone Funds, (c) net interest income (loss), equity-based compensation, and (d) Other Revenue. Management uses Fee Related Earnings as a measure to assess whether recurring revenue from our businesses is sufficient to adequately cover all of our operating expenses and generate profits. Fee Related Earnings equals contractual fee revenues, less (a) compensation expenses (which excludes amortization of equity-based awards, Carried Interest and Incentive Fee compensation), and (b) non-interest operating expenses. See “— Liquidity and Capital Resources — Sources and Uses of Liquidity” below for our discussion of Fee Related Earnings.
Distributable Earnings
Distributable Earnings, which is derived from our segment reported results, is a supplemental measure to assess performance and amounts available for distributions to Blackstone unitholders, including Blackstone personnel and
66
Table of Contents
others who are limited partners of the Blackstone Holdings partnerships. Distributable Earnings, which is a measure not prepared under GAAP (a “non-GAAP” measure), is intended to show the amount of net realized earnings without the effects of the consolidation of the Blackstone Funds. Distributable Earnings is derived from and reconciled to, but not equivalent to, its most directly comparable GAAP measure of Income (Loss) Before Provision for Taxes. See “— Liquidity and Capital Resources — Sources and Uses of Liquidity” below for our discussion of Distributable Earnings.
Distributable Earnings, which is a component of Economic Net Income, is the sum across all segments of: (a) Total Management, Advisory and Other Fees, Net (b) Interest and Dividend Revenue, (c) Realized Performance Fees, and (d) Realized Investment Income (Loss); less (a) Compensation, excluding the expense of equity-based awards, (b) Realized Performance Fee Compensation, (c) Other Operating Expenses, and (d) Taxes and Related Payables Under the Tax Receivable Agreement.
Adjusted Earnings Before Interest, Taxes and Depreciation and Amortization
Adjusted Earnings Before Interest, Taxes and Depreciation and Amortization (“Adjusted EBITDA”), is a supplemental non-GAAP measure derived from our segment reported results and may be used to assess our ability to service our borrowings. Adjusted EBITDA represents Distributable Earnings plus the addition of (a) Interest Expense (including inter-segment interest related expenses), (b) Taxes and Related Payables Including Payable Under Tax Receivable Agreement, and (c) Depreciation and Amortization. See “— Liquidity and Capital Resources — Sources and Uses of Liquidity” below for our calculation of Adjusted EBITDA.
67
Table of Contents
Summary Walkdown of GAAP to Non-GAAP Financial Metrics
The relationship of our GAAP to non-GAAP financial measures is presented in the summary walkdown below. The summary walkdown shows how each non-GAAP financial measure is related to the other non-GAAP financial measures. This presentation is not meant to be a detailed calculation of each measure, but to show the relationship between the measures. For the calculation of each of these non-GAAP financial measures and a full reconciliation of Income Before Provision for Taxes to Distributable Earnings, please see “— Liquidity and Capital Resources — Sources and Uses of Liquidity.”
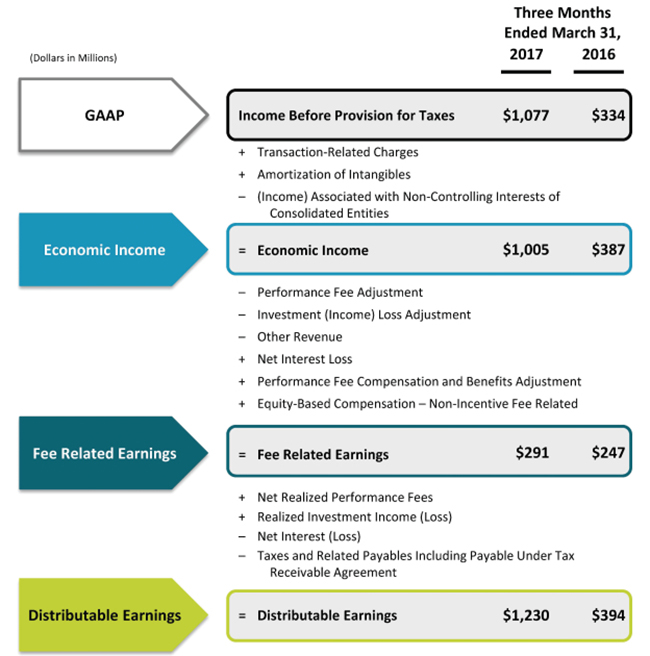
68
Table of Contents
Operating Metrics
The alternative asset management business is a complex business that is primarily based on managing third party capital and does not require substantial capital investment to support rapid growth. However, there also can be volatility associated with its earnings and cash flows. Since our inception, we have developed and used various key operating metrics to assess and monitor the operating performance of our various alternative asset management businesses in order to monitor the effectiveness of our value creating strategies.
Assets Under Management. Assets Under Management refers to the assets we manage. Our Assets Under Management equals the sum of:
| (a) | the fair value of the investments held by our carry funds and our side-by-side and co-investment entities managed by us, plus the capital that we are entitled to call from investors in those funds and entities pursuant to the terms of their respective capital commitments, including capital commitments to funds that have yet to commence their investment periods, plus for certain credit-oriented funds the amounts available to be borrowed under asset based credit facilities, |
| (b) | the net asset value of (1) our hedge funds, real estate debt carry funds and open ended core+ real estate fund (plus, in each case, the capital that we are entitled to call from investors in those funds, including commitments yet to commence their investment periods), and (2) our funds of hedge funds, our Hedge Fund Solutions registered investment companies, and our non-exchange traded REIT, |
| (c) | the invested capital, fair value or net asset value of assets we manage pursuant to separately managed accounts, |
| (d) | the amount of debt and equity outstanding for our CLOs during the reinvestment period, |
| (e) | the aggregate par amount of collateral assets, including principal cash, for our CLOs after the reinvestment period, |
| (f) | the gross or net amount of assets (including leverage where applicable) for our credit-focused registered investment companies, and |
| (g) | the fair value of common stock, preferred stock, convertible debt, or similar instruments issued by BXMT. |
Our carry funds are commitment-based drawdown structured funds that do not permit investors to redeem their interests at their election. Our funds of hedge funds, hedge funds, funds structured like hedge funds and other open ended funds in our Hedge Fund Solutions, Credit and Real Estate segments generally have structures that afford an investor the right to withdraw or redeem their interests on a periodic basis (for example, annually or quarterly), typically with 30 to 95 days’ notice, depending on the fund and the liquidity profile of the underlying assets. Investment advisory agreements related to certain separately managed accounts in our Hedge Fund Solutions and Credit segments may generally be terminated by an investor on 30 to 90 days’ notice.
Fee-Earning Assets Under Management. Fee-Earning Assets Under Management refers to the assets we manage on which we derive management and/or performance fees. Our Fee-Earning Assets Under Management equals the sum of:
| (a) | for our Private Equity segment funds and Real Estate segment carry funds including certain real estate debt investment funds and certain of our Hedge Fund Solutions funds, the amount of capital commitments, remaining invested capital, fair value or par value of assets held, depending on the fee terms of the fund, |
| (b) | for our credit-focused carry funds, the amount of remaining invested capital (which may include leverage) or net asset value, depending on the fee terms of the fund, |
| (c) | the remaining invested capital or fair value of assets held in co-investment vehicles managed by us on which we receive fees, |
69
Table of Contents
| (d) | the net asset value of our funds of hedge funds, hedge funds, open ended core+ real estate fund, co-investments managed by us on which we receive fees, certain registered investment companies, and our non-exchange traded REIT, |
| (e) | the invested capital, fair value of assets or the net asset value we manage pursuant to separately managed accounts, |
| (f) | the net proceeds received from equity offerings and accumulated core earnings of BXMT, subject to certain adjustments, |
| (g) | the aggregate par amount of collateral assets, including principal cash, of our CLOs, and |
| (h) | the gross amount of assets (including leverage) or the net assets (plus leverage where applicable) for certain of our credit-focused registered investment companies. |
Each of our segments may include certain Fee-Earning Assets Under Management on which we earn performance fees but not management fees.
Our calculations of assets under management and fee-earning assets under management may differ from the calculations of other asset managers, and as a result this measure may not be comparable to similar measures presented by other asset managers. In addition, our calculation of assets under management includes commitments to, and the fair value of, invested capital in our funds from Blackstone and our personnel, regardless of whether such commitments or invested capital are subject to fees. Our definitions of assets under management and fee-earning assets under management are not based on any definition of assets under management and fee-earning assets under management that is set forth in the agreements governing the investment funds that we manage.
For our carry funds, total assets under management includes the fair value of the investments held, whereas fee-earning assets under management includes the amount of capital commitments, the remaining amount of invested capital at cost depending on whether the investment period has or has not expired or the fee terms of the fund. As such, fee-earning assets under management may be greater than total assets under management when the aggregate fair value of the remaining investments is less than the cost of those investments.
Limited Partner Capital Invested. Limited Partner Capital Invested represents the amount of Limited Partner capital commitments which were invested by our carry and drawdown funds during each period presented, plus the capital invested through co-investments arranged by us that were made by limited partners in investments of our carry funds on which we receive fees or a Carried Interest allocation or Incentive Fee.
The amount of committed undrawn capital available for investment, including general partner and employee commitments, is known as dry powder and is an indicator of the capital we have available for future investments.
70
Table of Contents
Consolidated Results of Operations
Following is a discussion of our consolidated results of operations for the three months ended March 31, 2017 and 2016. For a more detailed discussion of the factors that affected the results of our four business segments (which are presented on a basis that deconsolidates the investment funds we manage) in these periods, see “— Segment Analysis” below.
The following table sets forth information regarding our consolidated results of operations and certain key operating metrics for the three months ended March 31, 2017 and 2016:
| Three Months Ended March 31, |
2017 vs. 2016 | |||||||||||||||
| 2017 | 2016 | $ | % | |||||||||||||
| Revenues |
||||||||||||||||
| Management and Advisory Fees, Net |
$ | 642,142 | $ | 608,906 | $ | 33,236 | 5 | % | ||||||||
|
|
|
|
|
|
|
|
|
|||||||||
| Performance Fees |
||||||||||||||||
| Realized |
||||||||||||||||
| Carried Interest |
1,111,256 | 230,909 | 880,347 | 381 | % | |||||||||||
| Incentive Fees |
47,160 | 28,419 | 18,741 | 66 | % | |||||||||||
| Unrealized |
||||||||||||||||
| Carried Interest |
(154,683 | ) | 47,586 | (202,269 | ) | N/M | ||||||||||
| Incentive Fees |
59,409 | 7,579 | 51,830 | 684 | % | |||||||||||
|
|
|
|
|
|
|
|
|
|||||||||
| Total Performance Fees |
1,063,142 | 314,493 | 748,649 | 238 | % | |||||||||||
|
|
|
|
|
|
|
|
|
|||||||||
| Investment Income (Loss) |
||||||||||||||||
| Realized |
251,344 | (12,001 | ) | 263,345 | N/M | |||||||||||
| Unrealized |
(40,188 | ) | 3,493 | (43,681 | ) | N/M | ||||||||||
|
|
|
|
|
|
|
|
|
|||||||||
| Total Investment Income (Loss) |
211,156 | (8,508 | ) | 219,664 | N/M | |||||||||||
|
|
|
|
|
|
|
|
|
|||||||||
| Interest and Dividend Revenue |
28,495 | 23,075 | 5,420 | 23 | % | |||||||||||
| Other |
(4,212 | ) | (5,612 | ) | 1,400 | -25 | % | |||||||||
|
|
|
|
|
|
|
|
|
|||||||||
| Total Revenues |
1,940,723 | 932,354 | 1,008,369 | 108 | % | |||||||||||
|
|
|
|
|
|
|
|
|
|||||||||
| Expenses |
||||||||||||||||
| Compensation and Benefits |
||||||||||||||||
| Compensation |
351,589 | 346,003 | 5,586 | 2 | % | |||||||||||
| Performance Fee Compensation |
||||||||||||||||
| Realized |
||||||||||||||||
| Carried Interest |
366,191 | 58,504 | 307,687 | 526 | % | |||||||||||
| Incentive Fees |
22,752 | 14,124 | 8,628 | 61 | % | |||||||||||
| Unrealized |
||||||||||||||||
| Carried Interest |
(4,387 | ) | 30,001 | (34,388 | ) | N/M | ||||||||||
| Incentive Fees |
23,139 | 3,448 | 19,691 | 571 | % | |||||||||||
|
|
|
|
|
|
|
|
|
|||||||||
| Total Compensation and Benefits |
759,284 | 452,080 | 307,204 | 68 | % | |||||||||||
| General, Administrative and Other |
106,044 | 123,045 | (17,001 | ) | -14 | % | ||||||||||
| Interest Expense |
40,246 | 37,356 | 2,890 | 8 | % | |||||||||||
| Fund Expenses |
24,076 | 5,229 | 18,847 | 360 | % | |||||||||||
|
|
|
|
|
|
|
|
|
|||||||||
| Total Expenses |
929,650 | 617,710 | 311,940 | 50 | % | |||||||||||
|
|
|
|
|
|
|
|
|
|||||||||
| Other Income |
||||||||||||||||
| Net Gains from Fund Investment Activities |
66,132 | 19,142 | 46,990 | 245 | % | |||||||||||
|
|
|
|
|
|
|
|
|
|||||||||
| Income Before Provision for Taxes |
1,077,205 | 333,786 | 743,419 | 223 | % | |||||||||||
| Provision for Taxes |
57,437 | 9,146 | 48,291 | 528 | % | |||||||||||
|
|
|
|
|
|
|
|
|
|||||||||
| Net Income |
1,019,768 | 324,640 | 695,128 | 214 | % | |||||||||||
| Net Income (Loss) Attributable to Redeemable Non-Controlling Interests in Consolidated Entities |
2,000 | (6,401 | ) | 8,401 | N/M | |||||||||||
| Net Income Attributable to Non-Controlling Interests in Consolidated Entities |
138,685 | 40,086 | 98,599 | 246 | % | |||||||||||
| Net Income Attributable to Non-Controlling Interests in Blackstone Holdings |
417,258 | 131,202 | 286,056 | 218 | % | |||||||||||
|
|
|
|
|
|
|
|
|
|||||||||
| Net Income Attributable to The Blackstone Group L.P. |
$ | 461,825 | $ | 159,753 | $ | 302,072 | 189 | % | ||||||||
|
|
|
|
|
|
|
|
|
|||||||||
N/M Not meaningful.
71
Table of Contents
Three Months Ended March 31, 2017 Compared to Three Months Ended March 31, 2016
Revenues
Total Revenues were $1.9 billion for the three months ended March 31, 2017, an increase of $1.0 billion compared to Total Revenues for the three months ended March 31, 2016 of $932.4 million. The increase in revenues was primarily attributable to increases in Performance Fees, Investment Income (Loss), and Management and Advisory Fees, Net of $748.6 million, $219.7 million and $33.2 million, respectively.
The increase in Performance Fees was attributable to increases in our Real Estate, Private Equity, Credit and Hedge Fund Solutions segments of $316.3 million, $293.7 million, $80.7 million and $59.0 million, respectively. The increase in our Real Estate segment was due to the net appreciation of investment holdings in our BREP opportunistic funds, which appreciated 5.7% versus 1.8% in the comparable 2016 quarter. Performance Fees in our Private Equity segment increased due to appreciation in the BCP VI private portfolio. The increase in our Credit segment was due to higher returns in our Performing Credit Strategies and Distressed Strategies. The increase in our Hedge Fund Solutions segment was primarily driven by higher returns for a number of funds.
The increase in Investment Income (Loss) was due to increases in our Private Equity, Credit, Hedge Fund Solutions and Real Estate segments of $40.0 million, $31.0 million, $34.7 million and $24.9 million, respectively. The increase in our Private Equity segment was due to an increase in the appreciation of our investment holdings. The increase in our Credit segment was due to the prior year period’s unrealized investment losses in our distressed strategies and long only funds. The increase in our Hedge Fund Solutions segment was due to the year over year net appreciation of investments of which Blackstone owns a share. The increase in our Real Estate segment was primarily due to the net increase in appreciation of the Partnership’s principal investments.
The increase in Management and Advisory Fees, Net was primarily due to an increase in our Private Equity segment, partially offset by a decrease in our Real Estate segment. The increase of $49.8 million in our Private Equity segment was primarily due to the increase in fee-earning assets across the segment. The decrease of $16.5 million in our Real Estate segment was primarily due to the timing of investment closings.
Expenses
Expenses were $929.7 million for the three months ended March 31, 2017, an increase of $311.9 million compared to $617.7 million for the three months ended March 31, 2016. The increase in expenses was primarily attributable to an increase in Performance Fee Compensation of $301.6 million. The increase in Performance Fee Compensation was primarily attributable to an increase in Performance Fee Revenue, on which a portion of compensation is based.
Other Income
Other Income — Net Gains from Fund Investment Activities is attributable to the consolidated Blackstone Funds which are largely held by third party investors. As such, most of this Other Income is eliminated from the results attributable to The Blackstone Group L.P. through the redeemable non-controlling interests and non-controlling interests items in the Condensed Consolidated Statements of Operations.
Other Income — Net Gains from Fund Investment Activities was $66.1 million for the three months ended March 31, 2017, an increase of $47.0 million compared to $19.1 million for the three months ended March 31, 2016. The increase was due to increases in our Real Estate, Credit, Private Equity, and Hedge Fund Solutions segments of $23.4 million, $9.6 million, $7.8 million, and $6.1 million, respectively. The increase in our Real Estate segment was primarily the result of a year over year net increase in the appreciation of investments across our funds. The increase in our Credit segment was primarily the result of newly launched CLOs. The increase in our Private Equity segment was primarily due to the higher unrealized gains compared to the same period in 2016. The increase in our Hedge Fund Solutions segment was primarily the result of an increase in investment performance.
72
Table of Contents
Provision for Taxes
The following table summarizes Blackstone’s tax position:
| Three Months Ended March 31, |
||||||||
| 2017 | 2016 | |||||||
| Income Before Provision for Taxes |
$ | 1,077,205 | $ | 333,786 | ||||
| Provision for Taxes |
$ | 57,437 | $ | 9,146 | ||||
| Effective Income Tax Rate |
5.3 | % | 2.7 | % | ||||
The following table reconciles the effective income tax rate to the U.S. federal statutory tax rate:
| Three Months Ended March 31, |
2017 vs. 2016 |
|||||||||||
| 2017 | 2016 | |||||||||||
| Statutory U.S. Federal Income Tax Rate |
35.0 | % | 35.0 | % | — | |||||||
| Income Passed Through to Common Unitholders and Non-Controlling Interest Holders (a) |
-30.4 | % | -33.3 | % | 2.9 | % | ||||||
| State and Local Income Taxes |
1.2 | % | 2.0 | % | -0.8 | % | ||||||
| Other |
-0.5 | % | -1.0 | % | 0.5 | % | ||||||
|
|
|
|
|
|
|
|||||||
| Effective Income Tax Rate |
5.3 | % | 2.7 | % | 2.6 | % | ||||||
|
|
|
|
|
|
|
|||||||
| (a) | Includes income that is not taxable to the Partnership and its subsidiaries. Such income is directly taxable to the Partnership’s unitholders and the non-controlling interest holders. |
Blackstone’s Provision for Taxes for the three months ended March 31, 2017 and 2016 was $57.4 million and $9.1 million, respectively, resulting in effective tax rates of 5.3% and 2.7%, respectively.
The increase in Blackstone’s effective tax rate for the three months ended March 31, 2017 compared to the three months ended March 31, 2016 resulted primarily from a relative decrease in the amount of income not taxable to the Partnership and its subsidiaries, which was therefore passed through to common unitholders and non-controlling interest holders. For the three months ended March 31, 2017, $934.0 million of Blackstone’s Income Before Provision for Taxes of $1.1 billion was not taxable to the Partnership, compared to $317.8 million of Blackstone’s Income Before Provision for Taxes of $333.8 million for the prior year period.
Non-Controlling Interests in Consolidated Entities
The Net Income Attributable to Redeemable Non-Controlling Interests in Consolidated Entities and Net Income Attributable to Non-Controlling Interests in Consolidated Entities is attributable to the consolidated Blackstone Funds. The amounts of these items vary directly with the performance of the consolidated Blackstone Funds and largely eliminate the amount of Other Income — Net Gains from Fund Investment Activities from the Net Income (Loss) Attributable to The Blackstone Group L.P.
Net Income Attributable to Non-Controlling Interests in Blackstone Holdings is derived from the Income Before Provision for Taxes, excluding the Net Gains from Fund Investment Activities and the percentage allocation of the income between Blackstone Holdings and The Blackstone Group L.P. after considering any contractual arrangements that govern the allocation of income (loss) such as fees allocable to The Blackstone Group L.P.
For the three months ended March 31, 2017 and 2016, the Net Income Before Taxes allocated to Blackstone Holdings was 45.3% and 46.4%, respectively. The decrease of 1.1% was primarily due to conversions of Blackstone Holdings Partnership Units to Blackstone common units and the vesting of common units.
73
Table of Contents
Operating Metrics
The following graphs and tables summarize the Fee-Earning Assets Under Management by Segment and Total Assets Under Management by Segment, followed by a rollforward of activity for the three months ended March 31, 2017 and 2016. For a description of how Assets Under Management and Fee-Earning Assets Under Management are determined, please see “— Key Financial Measures and Indicators — Operating Metrics — Assets Under Management and Fee-Earning Assets Under Management”:
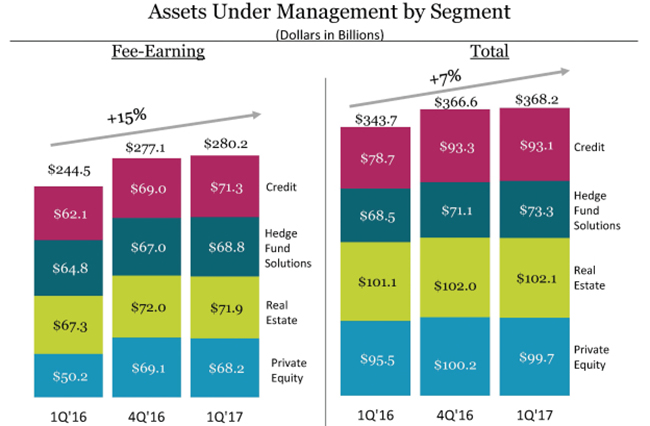
Note: Totals may not add due to rounding.
74
Table of Contents
| Three Months Ended | ||||||||||||||||||||||||||||||||||||||||
| March 31, 2017 | March 31, 2016 | |||||||||||||||||||||||||||||||||||||||
| Private Equity |
Real Estate | Hedge Fund Solutions |
Credit | Total | Private Equity |
Real Estate | Hedge Fund Solutions |
Credit | Total | |||||||||||||||||||||||||||||||
| (Dollars in Thousands) | ||||||||||||||||||||||||||||||||||||||||
| Fee-Earning Assets Under Management |
||||||||||||||||||||||||||||||||||||||||
| Balance, Beginning of Period |
$ | 69,113,409 | $ | 72,030,054 | $ | 66,987,553 | $ | 68,961,656 | $ | 277,092,672 | $ | 51,451,196 | $ | 67,345,357 | $ | 65,665,439 | $ | 61,684,380 | $ | 246,146,372 | ||||||||||||||||||||
| Inflows, including Commitments (a) |
1,134,984 | 2,125,293 | 3,183,304 | 5,420,690 | 11,864,271 | 558,343 | 1,591,900 | 2,851,509 | 2,331,315 | 7,333,067 | ||||||||||||||||||||||||||||||
| Outflows, including Distributions (b) |
(28,766 | ) | (96,512 | ) | (2,269,260 | ) | (787,121 | ) | (3,181,659 | ) | (370,510 | ) | (36,900 | ) | (1,602,796 | ) | (1,107,045 | ) | (3,117,251 | ) | ||||||||||||||||||||
| Realizations (c) |
(2,163,020 | ) | (2,779,662 | ) | (447,124 | ) | (2,796,816 | ) | (8,186,622 | ) | (1,287,860 | ) | (2,119,708 | ) | (145,912 | ) | (723,449 | ) | (4,276,929 | ) | ||||||||||||||||||||
|
|
|
|
|
|
|
|
|
|
|
|
|
|
|
|
|
|
|
|
|
|||||||||||||||||||||
| Net Inflows (Outflows) |
(1,056,802 | ) | (750,881 | ) | 466,920 | 1,836,753 | 495,990 | (1,100,027 | ) | (564,708 | ) | 1,102,801 | 500,821 | (61,113 | ) | |||||||||||||||||||||||||
| Market Appreciation (Depreciation) (d)(g) |
175,013 | 625,568 | 1,358,055 | 468,253 | 2,626,889 | (122,857 | ) | 517,790 | (1,936,987 | ) | (90,441 | ) | (1,632,495 | ) | ||||||||||||||||||||||||||
|
|
|
|
|
|
|
|
|
|
|
|
|
|
|
|
|
|
|
|
|
|||||||||||||||||||||
| Balance, End of Period (e) |
$ | 68,231,620 | $ | 71,904,741 | $ | 68,812,528 | $ | 71,266,662 | $ | 280,215,551 | $ | 50,228,312 | $ | 67,298,439 | $ | 64,831,253 | $ | 62,094,760 | $ | 244,452,764 | ||||||||||||||||||||
|
|
|
|
|
|
|
|
|
|
|
|
|
|
|
|
|
|
|
|
|
|||||||||||||||||||||
| Increase (Decrease) |
$ | (881,789 | ) | $ | (125,313 | ) | $ | 1,824,975 | $ | 2,305,006 | $ | 3,122,879 | $ | (1,222,884 | ) | $ | (46,918 | ) | $ | (834,186 | ) | $ | 410,380 | $ | (1,693,608 | ) | ||||||||||||||
| Increase (Decrease) |
-1 | % | -0 | % | 3 | % | 3 | % | 1 | % | -2 | % | -0 | % | -1 | % | 1 | % | -1 | % | ||||||||||||||||||||
| Annualized Base Management Fee Rate (f) |
1.04 | % | 1.10 | % | 0.75 | % | 0.78 | % | 0.92 | % | 1.04 | % | 1.19 | % | 0.80 | % | 0.81 | % | 0.96 | % | ||||||||||||||||||||
| Three Months Ended | ||||||||||||||||||||||||||||||||||||||||
| March 31, 2017 | March 31, 2016 | |||||||||||||||||||||||||||||||||||||||
| Private Equity |
Real Estate | Hedge Fund Solutions |
Credit | Total | Private Equity |
Real Estate | Hedge Fund Solutions |
Credit | Total | |||||||||||||||||||||||||||||||
| (Dollars in Thousands) | ||||||||||||||||||||||||||||||||||||||||
| Total Assets Under Management |
||||||||||||||||||||||||||||||||||||||||
| Balance, Beginning of Period |
$ | 100,192,950 | $ | 101,963,652 | $ | 71,119,718 | $ | 93,277,145 | $ | 366,553,465 | $ | 94,280,074 | $ | 93,917,824 | $ | 69,105,425 | $ | 79,081,252 | $ | 336,384,575 | ||||||||||||||||||||
| Inflows, including Commitments (a) |
2,649,218 | 3,329,484 | 3,640,680 | 4,337,668 | 13,957,050 | 2,988,650 | 9,057,220 | 3,180,618 | 1,863,603 | 17,090,091 | ||||||||||||||||||||||||||||||
| Outflows, including Distributions (b) |
(247,029 | ) | (210,125 | ) | (2,501,738 | ) | (2,063,039 | ) | (5,021,931 | ) | (260,841 | ) | (267,679 | ) | (1,631,519 | ) | (1,385,139 | ) | (3,545,178 | ) | ||||||||||||||||||||
| Realizations (c) |
(6,167,300 | ) | (6,684,804 | ) | (503,191 | ) | (3,262,535 | ) | (16,617,830 | ) | (2,119,372 | ) | (3,450,706 | ) | (150,768 | ) | (884,896 | ) | (6,605,742 | ) | ||||||||||||||||||||
|
|
|
|
|
|
|
|
|
|
|
|
|
|
|
|
|
|
|
|
|
|||||||||||||||||||||
| Net Inflows (Outflows) |
(3,765,111 | ) | (3,565,445 | ) | 635,751 | (987,906 | ) | (7,682,711 | ) | 608,437 | 5,338,835 | 1,398,331 | (406,432 | ) | 6,939,171 | |||||||||||||||||||||||||
| Market Appreciation (Depreciation) (d)(h) |
3,283,567 | 3,672,723 | 1,547,912 | 821,961 | 9,326,163 | 577,716 | 1,850,869 | (2,028,340 | ) | (18,529 | ) | 381,716 | ||||||||||||||||||||||||||||
|
|
|
|
|
|
|
|
|
|
|
|
|
|
|
|
|
|
|
|
|
|||||||||||||||||||||
| Balance, End of Period (e) |
$ | 99,711,406 | $ | 102,070,930 | $ | 73,303,381 | $ | 93,111,200 | $ | 368,196,917 | $ | 95,466,227 | $ | 101,107,528 | $ | 68,475,416 | $ | 78,656,291 | $ | 343,705,462 | ||||||||||||||||||||
|
|
|
|
|
|
|
|
|
|
|
|
|
|
|
|
|
|
|
|
|
|||||||||||||||||||||
| Increase (Decrease) |
$ | (481,544 | ) | $ | 107,278 | $ | 2,183,663 | $ | (165,945 | ) | $ | 1,643,452 | $ | 1,186,153 | $ | 7,189,704 | $ | (630,009 | ) | $ | (424,961 | ) | $ | 7,320,887 | ||||||||||||||||
| Increase (Decrease) |
-0 | % | 0 | % | 3 | % | -0 | % | 0 | % | 1 | % | 8 | % | -1 | % | -1 | % | 2 | % | ||||||||||||||||||||
| (a) | Inflows represent contributions in our hedge funds and closed-end mutual funds, increases in available capital for our carry funds (capital raises, recallable capital and increased side-by-side commitments) and CLOs and increases in the capital we manage pursuant to separately managed account programs. |
| (b) | Outflows represent redemptions in our hedge funds and closed-end mutual funds, client withdrawals from our separately managed account programs and decreases in available capital for our carry funds (expired capital, expense drawdowns and decreased side-by-side commitments). |
| (c) | Realizations represent realizations from the disposition of assets, capital returned to investors from CLOs. |
| (d) | Market appreciation (depreciation) includes realized and unrealized gains (losses) on portfolio investments and the impact of foreign exchange rate fluctuations. |
75
Table of Contents
| (e) | Fee-Earning Assets Under Management and Total Assets Under Management as of March 31, 2017 included $23.0 million and $38.8 million, respectively, from a joint venture in which we are the minority interest holder. |
| (f) | Represents the annualized current quarter’s Base Management Fee divided by period end Fee-Earning Assets Under Management. |
| (g) | For the three months ended March 31, 2017, the impact to Fee-Earning Assets Under Management due to foreign exchange rate fluctuations was $1.7 million, $275.5 million, $160.8 million and $438.0 million for the Private Equity, Real Estate, Credit and Total segments, respectively. For the three months ended March 31, 2016, such impact was $1.8 million, $208.7 million, $375.0 million and $585.4 million for the Private Equity, Real Estate, Credit and Total segments, respectively. |
| (h) | For the three months ended March 31, 2017, the impact to Total Assets Under Management due to foreign exchange rate fluctuations was $242.1 million, $546.2 million, $203.8 million and $992.1 million for the Private Equity, Real Estate, Credit and Total segments, respectively. For the three months ended March 31, 2016, such impact was $155.7 million, $529.5 million, $558.2 million and $1.2 billion for the Private Equity, Real Estate, Credit and Total segments, respectively. |
Fee-Earning Assets Under Management
Fee-Earning Assets Under Management were $280.2 billion at March 31, 2017, an increase of $3.1 billion, compared to $277.1 billion at December 31, 2016. The net increase was due to:
| • | Inflows of $11.9 billion related to: |
| • | $5.4 billion in our Credit segment driven by $1.5 billion of inflows across our long only strategies, $1.3 billion raised for our distressed strategies, $1.1 billion raised for our mezzanine strategies and $871.0 million of capital raised for our BDCs, |
| • | $3.2 billion in our Hedge Fund Solutions segment mainly related to growth in customized solutions of $1.9 billion, individual investor and specialized solutions of $705.0 million and commingled products of $549.2 million, |
| • | $2.1 billion in our Real Estate segment primarily related to $945.8 million from BREDS, $579.9 million from BREP and $477.5 million from BREIT, and |
| • | $1.1 billion in our Private Equity segment primarily due to $584.9 million from core private equity, and $218.6 from Tactical Opportunities. |
| • | Market appreciation of $2.6 billion due to: |
| • | $1.4 billion appreciation in our Hedge Fund Solutions segment due to returns from BAAM’s Principal Solutions Composite of 2.7% gross (2.5% net), |
| • | $625.6 million in our Real Estate segment primarily due to appreciation of $262.1 million and $57.5 million from BPP and BXMT, respectively, as well as $275.5 million of foreign exchange appreciation, and |
| • | $468.3 million appreciation in our Credit segment due to appreciation of $298.9 million in our BDCs and $166.4 million from certain long only strategies, which collectively includes $160.8 million due to foreign exchange appreciation. |
Offsetting these increases were:
| • | Realizations of $8.2 billion primarily driven by: |
| • | $2.8 billion in our Credit segment primarily due to $1.2 billion of realizations from distressed strategies, $943.8 million of capital returned to investors for CLOs outside investment periods, $372.1 million of realizations from mezzanine strategies and $244.8 million of dividends paid to investors in our BDCs, |
76
Table of Contents
| • | $2.8 billion in our Real Estate segment primarily due to $1.4 billion of realizations across BREP global and European opportunistic funds, $747.7 million of realizations from BREDS and $346.9 million of realizations from BREP co-investment, and |
| • | $2.2 billion in our Private Equity segment primarily due to $828.5 million from BCP VI, $731.7 million from BCP V and $491.7 million from Strategic Partners. |
| • | Outflows of $3.2 billion primarily attributable to: |
| • | $2.3 billion in our Hedge Fund Solutions segment, reflecting investors’ liquidity needs and certain strategic shifts in their programs, with outflows of $1.6 billion from individual investor and specialized solutions and $1.1 billion from customized solutions, and |
| • | $787.1 million in our Credit segment primarily driven by investor liquidity needs and a shift in investor sentiment on credit. The primary outflows were $417.2 million from distressed strategies and $315.1 million from certain long only strategies. |
BAAM had net outflows of $229.2 million from April 1 through May 1, 2017.
Fee-Earning Assets Under Management were $244.5 billion at March 31, 2016, a decrease of $1.7 billion, compared to $246.1 billion at December 31, 2015. The net decrease was due to:
| • | Realizations of $4.3 billion driven by: |
| • | $2.1 billion in our Real Estate segment primarily due to realizations of $1.4 billion across BREP, including co-investment, and $658.5 million in BREDS, |
| • | $1.3 billion in our Private Equity segment primarily due to realizations of $982.3 million in BCP V and $214.1 million in Strategic Partners, and |
| • | $723.4 million in our Credit segment primarily due to $285.3 million of capital returned to CLO investors from CLOs that are post their re-investment periods, $225.8 million in dividends paid to investors in our BDCs and $131.4 million returned in Carry Funds. |
| • | Outflows of $3.1 billion primarily attributable to: |
| • | $1.6 billion in our Hedge Fund Solutions segment primarily due to the liquidity needs of limited partners and strategic shifts in their programs, with $1.1 billion from individual investor and specialized solutions and $493.6 million from customized solutions, and |
| • | $1.1 billion in our Credit segment primarily driven by investor liquidity needs, shift in investor sentiment on credit and de-leveraging of the BDC funds. The primary outflows were $477.3 million from our BDCs, $458.5 million from our long only separately managed accounts and $137.4 million from hedge fund strategies. |
| • | Market depreciation of $1.6 billion principally due to: |
| • | $1.9 billion depreciation in our Hedge Fund Solutions segment due to BAAM’s Principal Solutions Composite down 2.9% gross (down 3.1% net), offset by $517.8 million of market appreciation in our Real Estate segment from appreciation of 4.4% within our core+ real estate funds and the impact of foreign exchange translation on our European opportunistic funds. |
Offsetting these decreases were:
| • | Inflows of $7.3 billion related to: |
| • | $2.9 billion in our Hedge Fund Solutions segment mainly related to growth in its customized, commingled and individual investor solutions products, |
| • | $2.3 billion in our Credit segment principally due to inflows of $519.9 million from our carry funds, $507.4 million from our BDCs, $500.0 million from one new U.S. CLO and $311.1 million from hedge fund strategies, |
77
Table of Contents
| • | $1.6 billion in our Real Estate segment primarily due to $709.6 million capital raised and invested for BREP co-investment and $559.8 million from BREDS, and |
| • | $558.3 million in our Private Equity segment primarily due to inflows of $584.1 million in Strategic Partners, $288.1 million in Tactical Opportunities and net commitments to BTAS. |
Total Assets Under Management
Total Assets Under Management were $368.2 billion at March 31, 2017, an increase of $1.6 billion, compared to $366.6 billion at December 31, 2016. The net increase was due to:
| • | Inflows of $14.0 billion primarily related to: |
| • | $4.3 billion in our Credit segment primarily due to $1.6 billion raised in certain long only strategies, $882.1 million raised from mezzanine strategies (the majority of which will become Fee-Earning Assets Under Management when invested), $871.0 million raised for BDCs and $611.4 million raised from the launch of a new CLO, |
| • | $3.6 billion in our Hedge Fund Solutions segment primarily driven by continued platform diversification and growth in customized solutions and individual investor solutions, |
| • | $3.3 billion in our Real Estate segment primarily related to $1.2 billion from core+ real estate funds, $973.6 million from BREP opportunistic funds, $673.4 million from BREDS and $477.5 million from BREIT, and |
| • | $2.6 billion in our Private Equity segment primarily related to $1.7 billion from BCP co-investment, $732.6 million from Strategic Partners and $336.4 million from Tactical Opportunities (capital raised is included in Fee-Earning Assets Under Management at the investment period commencement of each fund or at such time indicated in each fund’s limited partnership agreement). |
| • | Market appreciation of $9.3 billion due to: |
Total Assets Under Management market appreciation (depreciation) in our Private Equity and Real Estate segments generally represents the change in fair value of the investments held and typically exceeds the Fee-Earning Assets Under Management market appreciation (depreciation) which generally represents only the invested capital.
| • | $3.7 billion appreciation in our Real Estate segment due to a carrying value increase in our opportunistic and core+ real estate funds of 5.7% and 3.1%, respectively, as well as $546.2 million of foreign exchange appreciation, |
| • | $3.3 billion appreciation in our Private Equity segment primarily due to strong fund performance, including 6.9% for our corporate private equity funds and 3.6% in Tactical Opportunities, |
| • | $1.5 billion appreciation in our Hedge Fund Solutions segment primarily due to reasons noted above in Fee-Earning Assets Under Management, and |
| • | $822.0 million appreciation in our Credit segment due to $298.9 million in BDCs and $257.6 million in distressed strategies, as well as $203.8 million of foreign exchange appreciation. |
Offsetting these increases were:
| • | Realizations of $16.6 billion driven by: |
Total Assets Under Management realizations in our Private Equity and Real Estate segments generally represents the total proceeds and typically exceeds the Fee-Earning Assets Under Management realizations which generally represents only the invested capital.
| • | $6.7 billion in our Real Estate segment due to realizations of $5.0 billion from BREP opportunistic funds, $1.0 billion from BREP co-investment and $348.5 million from BREDS, |
78
Table of Contents
| • | $6.2 billion in our Private Equity segment primarily due to continued disposition activity across the segment, mainly $2.2 billion from BCP V, $2.2 billion from BCP VI, $777.9 million from BCP co-investment, $548.0 million from Strategic Partners funds and $315.7 million from Tactical Opportunities, and |
| • | $3.3 billion in our Credit segment due to realizations of $1.5 billion from our distressed strategies, $943.8 million from returns to CLO investors and $569.2 million from our mezzanine strategies. |
| • | Outflows of $5.0 billion primarily attributable to: |
| • | $2.5 billion in our Hedge Fund Solutions segment primarily due to the same reasons in Fee-Earning Assets Under Management above, and |
| • | $2.1 billion in our Credit segment primarily due to $1.6 billion from distressed strategies and $306.2 million from our long only strategies. |
Total Assets Under Management were $343.7 billion at March 31, 2016, an increase of $7.3 billion, compared to $336.4 billion at December 31, 2015. The net increase was due to:
| • | Inflows of $17.1 billion primarily related to: |
| • | $9.1 billion in our Real Estate segment primarily due to $5.2 billion capital raised for our fifth European opportunistic fund, $1.7 billion for our third mezzanine debt fund, $842.4 million from BREP co-investment and $555.0 million from U.S. core+ real estate, |
| • | $3.2 billion in our Hedge Fund Solutions segment primarily related to the reasons noted above in Fee-Earning Assets Under Management, |
| • | $3.0 billion in our Private Equity segment primarily related to $1.8 billion from Strategic Partners, 898.6 million from BCP VII and $669.5 million from the initial closing for our core private equity fund, and |
| • | $1.9 billion in our Credit segment primarily due to $527.5 million raised due to the closing of one new CLO, $507.4 million of capital raised for our BDCs, $462.0 million for our long only strategies and $267.6 million raised in hedge fund strategies. |
| • | Market appreciation of $381.7 million primarily due to: |
| • | $1.9 billion appreciation in our Real Estate segment primarily due to carrying value increases of 1.8% and 4.4% within the opportunistic and core+ platforms, respectively. This also includes the positive impact of $529.5 million from foreign exchange translation of our non-U.S. dollar denominated investments and European opportunistic funds, |
| • | $577.7 million appreciation in our Private Equity segment due to appreciation of $519.4 million in BCP V and $155.7 million of currency gains, partially offset by depreciation of $255.2 million in BCP VI, and |
| • | $2.0 billion depreciation in our Hedge Fund Solutions segment due to BAAM’s Principal Solutions Composite down 2.9% gross (down 3.1% net). |
Offsetting these increases were:
| • | Realizations of $6.6 billion driven by: |
| • | $3.5 billion in our Real Estate segment primarily due to realizations of $1.9 billion across the BREP global and European opportunistic platform, $1.1 billion in BREP co-investment and $328.1 million in BREDS, |
| • | $2.1 billion in our Private Equity segment primarily due to realizations of $1.4 billion in BCP V and $352.2 million in Strategic Partners, and |
79
Table of Contents
| • | $884.9 million in our Credit segment primarily due to $313.4 million of capital returned to CLO investors from CLOs that are post their re-investment periods, $265.6 million returned in our credit-focused carry funds and $225.8 million in dividends paid to investors in our BDCs. |
| • | Outflows of $3.5 billion primarily attributable to: |
| • | $1.6 billion in our Hedge Fund Solutions segment primarily due to reasons noted above in Fee-Earning Assets Under Management, and |
| • | $1.4 billion in our Credit segment primarily due to the same reasons in Fee-Earning Assets Under Management above. |
Limited Partner Capital Invested
The following presents the limited partner capital invested during the respective periods:
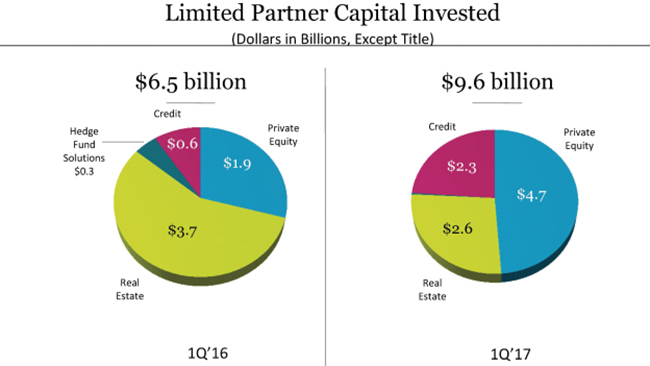
| Note: | Totals in graph may not add due to rounding. |
| Three Months Ended March 31, |
||||||||
| 2016 | 2017 | |||||||
| (Dollars in Thousands) | ||||||||
| Limited Partner Capital Invested |
||||||||
| Private Equity |
$ | 1,865,698 | $ | 4,736,388 | ||||
| Real Estate |
3,747,181 | 2,590,419 | ||||||
| Hedge Fund Solutions |
315,757 | 28,592 | ||||||
| Credit |
586,935 | 2,261,266 | ||||||
|
|
|
|
|
|||||
| Total |
$ | 6,515,571 | $ | 9,616,665 | ||||
|
|
|
|
|
|||||
80
Table of Contents
The following presents the committed undrawn capital available for investment (“dry powder”) for the respective periods:
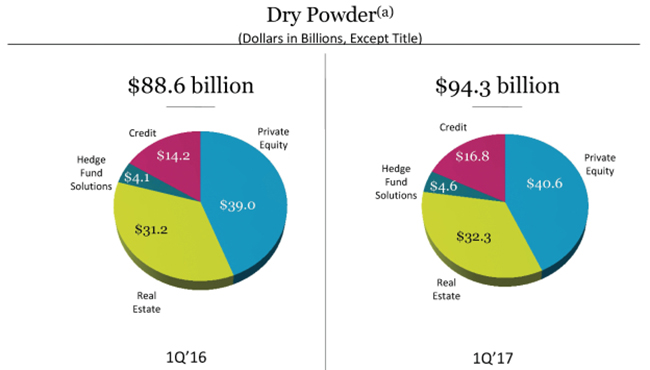
| Note: | Totals may not add due to rounding. Amounts are as of March 31 of each year. |
| (a) | Represents illiquid drawdown funds only; excludes marketable vehicles; includes both Fee-Earning (third party) capital and general partner and employee commitments that do not earn fees. Amounts are reduced by outstanding commitments to invest, but for which capital has not been called. |
| March 31, | ||||||||
| 2016 | 2017 | |||||||
| (Dollars in Thousands) | ||||||||
| Dry Powder Available for Investment |
||||||||
| Private Equity |
$ | 38,984,123 | $ | 40,568,278 | ||||
| Real Estate |
31,245,484 | 32,303,375 | ||||||
| Hedge Fund Solutions |
4,137,171 | 4,630,434 | ||||||
| Credit |
14,235,097 | 16,819,031 | ||||||
|
|
|
|
|
|||||
| Total |
$ | 88,601,875 | $ | 94,321,118 | ||||
|
|
|
|
|
|||||
Net Accrued Performance Fees
The following table presents the accrued performance fees, net of performance fee compensation, of the Blackstone Funds as of March 31, 2017 and 2016. Net accrued performance fees presented do not include clawback amounts, if any, which are disclosed in Note 17. “Commitments and Contingencies — Contingencies — Contingent Obligations (Clawback)” in the “Notes to Condensed Consolidated Financial Statements” in “Part I. Item 1.
81
Table of Contents
Financial Statements” of this filing. The net accrued performance fees as of each reporting date are principally unrealized carried interest and incentive fees which, if realized, can be a significant component of Distributable Earnings.
| March 31, | ||||||||
| 2017 | 2016 | |||||||
| (Dollars in Millions) | ||||||||
| Private Equity |
||||||||
| BCP IV Carried Interest |
$ | 109 | $ | 155 | ||||
| BCP V Carried Interest |
128 | 358 | ||||||
| BCP VI Carried Interest |
560 | 340 | ||||||
| BEP I Carried Interest |
99 | 46 | ||||||
| BEP II Carried Interest |
11 | — | ||||||
| Tactical Opportunities Carried Interest |
104 | 56 | ||||||
| BTAS Carried Interest |
21 | 5 | ||||||
| Strategic Partners Carried Interest |
38 | 38 | ||||||
| Other Carried Interest |
3 | 2 | ||||||
|
|
|
|
|
|||||
| Total Private Equity (a) |
1,073 | 1,000 | ||||||
|
|
|
|
|
|||||
| Real Estate |
||||||||
| BREP IV Carried Interest |
7 | 11 | ||||||
| BREP V Carried Interest |
265 | 417 | ||||||
| BREP VI Carried Interest |
316 | 636 | ||||||
| BREP VII Carried Interest |
552 | 570 | ||||||
| BREP VIII Carried Interest |
179 | 34 | ||||||
| BREP Europe III Carried Interest |
161 | 181 | ||||||
| BREP Europe IV Carried Interest |
289 | 126 | ||||||
| BREP Asia Carried Interest |
96 | 68 | ||||||
| BPP Carried Interest |
64 | 41 | ||||||
| BPP Incentive Fees |
41 | 18 | ||||||
| BREDS Carried Interest |
16 | 16 | ||||||
| BREDS Incentive Fees |
5 | 2 | ||||||
| Asia Platform Incentive Fees |
7 | 7 | ||||||
|
|
|
|
|
|||||
| Total Real Estate (a) |
1,998 | 2,127 | ||||||
|
|
|
|
|
|||||
| Hedge Fund Solutions |
||||||||
| Incentive Fees |
38 | 5 | ||||||
|
|
|
|
|
|||||
| Total Hedge Fund Solutions |
38 | 5 | ||||||
|
|
|
|
|
|||||
| Credit |
||||||||
| Carried Interest |
195 | 66 | ||||||
| Incentive Fees |
26 | 14 | ||||||
|
|
|
|
|
|||||
| Total Credit |
221 | 80 | ||||||
|
|
|
|
|
|||||
| Total Blackstone |
||||||||
| Carried Interest |
3,213 | 3,166 | ||||||
| Incentive Fees |
117 | 46 | ||||||
|
|
|
|
|
|||||
| Net Accrued Performance Fees |
$ | 3,330 | $ | 3,212 | ||||
|
|
|
|
|
|||||
| (a) | Private Equity and Real Estate include Co-Investments, as applicable. |
82
Table of Contents
Performance Fee Eligible Assets Under Management
The following represents invested and to be invested capital, including closed commitments for funds whose investment period has not yet commenced, on which performance fees could be earned if certain hurdles are met:
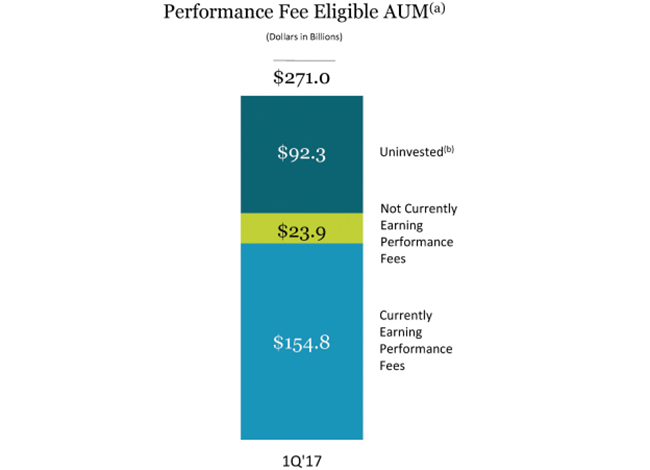
| Note: | Totals may not add due to rounding. Amounts are as of March 31, 2017. |
| (a) | Represents invested and to be invested capital at fair value, including closed commitments for funds whose investment period has not yet commenced, on which performance fees could be earned if certain hurdles are met. |
| (b) | Represents dry powder exclusive of non-fee earning general partner and employee commitments. |
Investment Record
Fund returns information for our significant funds is included throughout this discussion and analysis to facilitate an understanding of our results of operations for the periods presented. The fund returns information reflected in this discussion and analysis is not indicative of the financial performance of The Blackstone Group L.P. and is also not necessarily indicative of the future performance of any particular fund. An investment in The Blackstone Group L.P. is not an investment in any of our funds. There can be no assurance that any of our funds or our other existing and future funds will achieve similar returns.
83
Table of Contents
The following table presents the investment record of our significant drawdown funds from inception through March 31, 2017:
| Unrealized Investments | Realized Investments |
Total Investments | Net IRRs (c) |
|||||||||||||||||||||||||||||||||||||||
| Fund (Investment Period) | Committed Capital |
Available Capital (a) |
Value | MOIC (b) | % Public |
Value | MOIC (b) | Value | MOIC (b) | Realized |
Total | |||||||||||||||||||||||||||||||
| (Dollars in Thousands, Except Where Noted) | ||||||||||||||||||||||||||||||||||||||||||
| Private Equity |
||||||||||||||||||||||||||||||||||||||||||
| BCP I (Oct 1987 / Oct 1993) |
$ | 859,081 | $ | — | $ | — | N/A | — | $ | 1,741,738 | 2.6x | $ | 1,741,738 | 2.6x | 19% | 19 | % | |||||||||||||||||||||||||
| BCP II (Oct 1993 / Aug 1997) |
1,361,100 | — | — | N/A | — | 3,256,819 | 2.5x | 3,256,819 | 2.5x | 32% | 32 | % | ||||||||||||||||||||||||||||||
| BCP III (Aug 1997 / Nov 2002) |
3,967,422 | — | — | N/A | — | 9,184,688 | 2.3x | 9,184,688 | 2.3x | 14% | 14 | % | ||||||||||||||||||||||||||||||
| BCOM (Jun 2000 / Jun 2006) |
2,137,330 | 24,575 | 23,299 | 1.8x | — | 2,951,018 | 1.4x | 2,974,317 | 1.4x | 6% | 6 | % | ||||||||||||||||||||||||||||||
| BCP IV (Nov 2002 / Dec 2005) |
6,773,182 | 215,546 | 1,339,848 | 1.2x | 41 | % | 20,049,478 | 3.1x | 21,389,326 | 2.8x | 41% | 36 | % | |||||||||||||||||||||||||||||
| BCP V (Dec 2005 / Jan 2011) |
21,019,849 | 1,241,060 | 3,871,309 | 1.4x | 57 | % | 34,076,797 | 1.9x | 37,948,106 | 1.9x | 9% | 8 | % | |||||||||||||||||||||||||||||
| BCP VI (Jan 2011 / May 2016) |
15,190,007 | 1,794,580 | 15,219,024 | 1.4x | 23 | % | 6,084,689 | 2.0x | 21,303,713 | 1.5x | 28% | 12 | % | |||||||||||||||||||||||||||||
| BEP I (Aug 2011 / Feb 2015) |
2,437,584 | 166,111 | 2,889,394 | 1.5x | 32 | % | 859,498 | 1.9x | 3,748,892 | 1.6x | 42% | 15 | % | |||||||||||||||||||||||||||||
| BEP II (Feb 2015 / Feb 2021) |
4,816,358 | 2,933,755 | 1,881,655 | 1.2x | — | — | N/A | 1,881,655 | 1.2x | N/A | 47 | % | ||||||||||||||||||||||||||||||
| BCP VII (May 2016 / May 2022) |
18,549,374 | 16,134,686 | 2,450,097 | 1.0x | — | — | N/A | 2,450,097 | 1.0x | N/A | N/M | |||||||||||||||||||||||||||||||
|
|
|
|
|
|
|
|
|
|
|
|
|
|
|
|
|
|
|
|
|
|
||||||||||||||||||||||
| Total Corporate Private Equity |
$ | 77,111,287 | $ | 22,510,313 | $ | 27,674,626 | 1.4x | 26 | % | $ | 78,204,725 | 2.2x | $ | 105,879,351 | 1.9x | 17% | 15 | % | ||||||||||||||||||||||||
|
|
|
|
|
|
|
|
|
|
|
|
|
|
|
|
|
|
|
|
|
|
||||||||||||||||||||||
| Tactical Opportunities |
$ | 13,946,336 | $ | 6,394,172 | $ | 8,206,191 | 1.2x | 7 | % | $ | 2,501,655 | 1.5x | $ | 10,707,846 | 1.3x | 27% | 11 | % | ||||||||||||||||||||||||
| Tactical Opportunities Co-Investment and Other |
3,262,702 | 1,141,991 | 2,028,075 | 1.1x | — | 321,638 | 1.5x | 2,349,713 | 1.2x | N/A | 12 | % | ||||||||||||||||||||||||||||||
| Strategic Partners I-V and Co-Investment (d) |
12,833,284 | 2,487,200 | 2,965,240 | N/M | — | 14,288,889 | N/M | 17,254,129 | 1.5x | N/A | 13 | % | ||||||||||||||||||||||||||||||
| Strategic Partners VI LBO, RE and SMA (d) |
7,402,171 | 2,495,828 | 3,498,260 | N/M | — | 1,277,356 | N/M | 4,775,616 | 1.4x | N/A | 23 | % | ||||||||||||||||||||||||||||||
| Strategic Partners VII (d) |
7,489,970 | 6,197,007 | 583,820 | N/M | — | 26,626 | N/M | 610,446 | 1.2x | N/A | N/M | |||||||||||||||||||||||||||||||
| BCEP (e) |
4,129,194 | 3,524,972 | 604,222 | 1.0x | — | — | N/A | 604,222 | 1.0x | N/A | N/M | |||||||||||||||||||||||||||||||
| Other Funds and Co-Investment (f) |
1,469,956 | 415,513 | 29,182 | 0.8x | 67 | % | 634,538 | 1.0x | 663,720 | 1.0x | N/M | N/M | ||||||||||||||||||||||||||||||
| Real Estate |
||||||||||||||||||||||||||||||||||||||||||
| Dollar |
||||||||||||||||||||||||||||||||||||||||||
| Pre-BREP |
$ | 140,714 | $ | — | $ | — | N/A | — | $ | 345,190 | 2.5x | $ | 345,190 | 2.5x | 33% | 33 | % | |||||||||||||||||||||||||
| BREP I (Sep 1994 / Oct 1996) |
380,708 | — | — | N/A | — | 1,327,708 | 2.8x | 1,327,708 | 2.8x | 40% | 40 | % | ||||||||||||||||||||||||||||||
| BREP II (Oct 1996 / Mar 1999) |
1,198,339 | — | — | N/A | — | 2,531,614 | 2.1x | 2,531,614 | 2.1x | 19% | 19 | % | ||||||||||||||||||||||||||||||
| BREP III (Apr 1999 / Apr 2003) |
1,522,708 | — | — | N/A | — | 3,330,406 | 2.4x | 3,330,406 | 2.4x | 21% | 21 | % | ||||||||||||||||||||||||||||||
| BREP IV (Apr 2003 / Dec 2005) |
2,198,694 | — | 369,644 | 0.5x | 27 | % | 4,160,248 | 2.2x | 4,529,892 | 1.7x | 31% | 12 | % | |||||||||||||||||||||||||||||
| BREP V (Dec 2005 / Feb 2007) |
5,539,418 | — | 2,496,440 | 2.1x | 15 | % | 10,609,427 | 2.3x | 13,105,867 | 2.3x | 12% | 11 | % | |||||||||||||||||||||||||||||
| BREP VI (Feb 2007 / Aug 2011) |
11,060,444 | 557,816 | 3,736,543 | 2.2x | 47 | % | 23,036,112 | 2.5x | 26,772,655 | 2.4x | 14% | 13 | % | |||||||||||||||||||||||||||||
| BREP VII (Aug 2011 / Apr 2015) |
13,493,581 | 2,209,815 | 14,636,784 | 1.6x | 20 | % | 11,269,048 | 1.9x | 25,905,832 | 1.7x | 28% | 18 | % | |||||||||||||||||||||||||||||
| BREP VIII (Apr 2015 / Oct 2020) |
16,416,375 | 10,443,865 | 7,887,455 | 1.3x | 1 | % | 2,017,820 | 1.2x | 9,905,275 | 1.3x | 18% | 18 | % | |||||||||||||||||||||||||||||
|
|
|
|
|
|
|
|
|
|
|
|
|
|
|
|
|
|
|
|
|
|
||||||||||||||||||||||
| Total Global BREP |
$ | 51,950,981 | $ | 13,211,496 | $ | 29,126,866 | 1.6x | 18 | % | $ | 58,627,573 | 2.2x | $ | 87,754,439 | 1.9x | 19% | 16 | % | ||||||||||||||||||||||||
|
|
|
|
|
|
|
|
|
|
|
|
|
|
|
|
|
|
|
|
|
|
||||||||||||||||||||||
| Euro |
||||||||||||||||||||||||||||||||||||||||||
| BREP Int’l (Jan 2001 / Sep 2005) |
€ | 824,172 | € | — | € | — | N/A | — | € | 1,369,016 | 2.1x | € | 1,369,016 | 2.1x | 23% | 23 | % | |||||||||||||||||||||||||
| BREP Int’l II (Sep 2005 / Jun 2008) |
1,629,748 | — | 286,518 | 0.8x | 55 | % | 2,058,381 | 2.0x | 2,344,899 | 1.7x | 9% | 6 | % | |||||||||||||||||||||||||||||
| BREP Europe III (Jun 2008 / Sep 2013) |
3,205,140 | 472,766 | 2,934,256 | 1.9x | — | 3,041,895 | 2.2x | 5,976,151 | 2.0x | 22% | 16 | % | ||||||||||||||||||||||||||||||
| BREP Europe IV (Sep 2013 / Dec 2016) |
6,707,714 | 1,520,962 | 8,185,788 | 1.5x | 3 | % | 1,164,684 | 1.5x | 9,350,472 | 1.5x | 22% | 18 | % | |||||||||||||||||||||||||||||
| BREP Europe V (Dec 2016 / Jun 2021) |
6,703,649 | 6,319,485 | 501,107 | 1.0x | — | — | N/A | 501,107 | 1.0x | N/A | N/A | |||||||||||||||||||||||||||||||
|
|
|
|
|
|
|
|
|
|
|
|
|
|
|
|
|
|
|
|
|
|
||||||||||||||||||||||
| Total Euro BREP |
€ | 19,070,423 | € | 8,313,213 | € | 11,907,669 | 1.5x | 3 | % | € | 7,633,976 | 2.0x | € | 19,541,645 | 1.7x | 16% | 14 | % | ||||||||||||||||||||||||
|
|
|
|
|
|
|
|
|
|
|
|
|
|
|
|
|
|
|
|
|
|
||||||||||||||||||||||
| BREP Co-Investment (g) |
$ | 6,819,065 | $ | 146,573 | $ | 3,053,753 | 1.6x | 66 | % | $ | 10,203,022 | 2.1x | $ | 13,256,775 | 2.0x | 16% | 16 | % | ||||||||||||||||||||||||
| BREP Asia (Jun 2013 / Dec 2017) |
5,085,933 | 3,028,120 | 2,761,252 | 1.4x | 1 | % | 2,030,989 | 1.7x | 4,792,241 | 1.5x | 21% | 17 | % | |||||||||||||||||||||||||||||
|
|
|
|
|
|
|
|
|
|
|
|
|
|
|
|
|
|
|
|
|
|
||||||||||||||||||||||
| Total BREP |
$ | 87,344,028 | $ | 25,350,327 | $ | 49,532,093 | 1.5x | 16 | % | $ | 81,016,633 | 2.2x | $ | 130,548,726 | 1.9x | 18% | 16 | % | ||||||||||||||||||||||||
|
|
|
|
|
|
|
|
|
|
|
|
|
|
|
|
|
|
|
|
|
|
||||||||||||||||||||||
| BPP (h) |
$ | 14,115,916 | $ | 3,403,887 | $ | 13,277,011 | 1.2x | — | $ | 107,286 | 1.9x | $ | 13,384,297 | 1.2x | 36% | 13 | % | |||||||||||||||||||||||||
| BREDS (i) |
12,252,291 | 6,968,549 | 2,451,243 | 1.2x | — | 6,892,140 | 1.3x | 9,343,383 | 1.3x | 13% | 11 | % | ||||||||||||||||||||||||||||||
| continued ... | ||||||||||||||||||||||||||||||||||||||||||
84
Table of Contents
| Unrealized Investments | Realized Investments |
Total Investments | Net IRRs (c) |
|||||||||||||||||||||||||||||||||||||||
| Fund (Investment Period) | Committed Capital |
Available Capital (a) |
Value | MOIC (b) | % Public |
Value | MOIC (b) | Value | MOIC (b) | Realized |
Total | |||||||||||||||||||||||||||||||
| (Dollars in Thousands, Except Where Noted) | ||||||||||||||||||||||||||||||||||||||||||
| Hedge Fund Solutions |
||||||||||||||||||||||||||||||||||||||||||
| BSCH (Dec 2013 / Jun 2020) (j) |
$ | 3,300,600 | $ | 2,651,996 | $ | 689,443 | 1.1x | — | $ | 135,582 | N/A | $ | 825,025 | 1.3x | N/A | 6 | % | |||||||||||||||||||||||||
| BSCH Co-Investment |
75,500 | 31,237 | 44,495 | 1.0x | — | 4,298 | N/A | 48,793 | 1.1x | N/A | 6 | % | ||||||||||||||||||||||||||||||
|
|
|
|
|
|
|
|
|
|
|
|
|
|
|
|
|
|
|
|
|
|
||||||||||||||||||||||
| Total Hedge Fund Solutions |
$ | 3,376,100 | $ | 2,683,233 | $ | 733,938 | 1.0x | — | $ | 139,880 | N/A | $ | 873,818 | 1.2x | N/A | 6 | % | |||||||||||||||||||||||||
|
|
|
|
|
|
|
|
|
|
|
|
|
|
|
|
|
|
|
|
|
|
||||||||||||||||||||||
| Credit (k) |
||||||||||||||||||||||||||||||||||||||||||
| Dollar |
||||||||||||||||||||||||||||||||||||||||||
| Mezzanine I (Jul 2007 / Oct 2011) |
$ | 2,000,000 | $ | 99,280 | $ | 161,361 | 1.3x | — | $ | 4,663,932 | 1.6x | $ | 4,825,293 | 1.6x | N/A | 17 | % | |||||||||||||||||||||||||
| Mezzanine II (Nov 2011 / Nov 2016) |
4,120,000 | 1,393,677 | 3,256,146 | 1.1x | — | 2,622,256 | 1.5x | 5,878,402 | 1.3x | N/A | 13 | % | ||||||||||||||||||||||||||||||
| Mezzanine III (Sep 2016 / Sep 2021) |
6,639,133 | 5,467,784 | 1,212,728 | 1.0x | — | — | N/A | 1,212,728 | 1.0x | N/A | N/M | |||||||||||||||||||||||||||||||
| Rescue Lending I (Sep 2009 / May 2013) |
3,253,143 | 275,335 | 847,510 | 1.1x | — | 5,120,819 | 1.5x | 5,968,329 | 1.4x | N/A | 11 | % | ||||||||||||||||||||||||||||||
| Rescue Lending II (Jun 2013 / Jun 2018) |
5,125,000 | 1,446,697 | 3,597,915 | 1.2x | — | 1,199,162 | 1.3x | 4,797,077 | 1.2x | N/A | 19 | % | ||||||||||||||||||||||||||||||
| Energy Select Opportunities (Nov 2015 / Nov 2018) |
2,856,866 | 2,085,415 | 888,696 | 1.1x | — | 172,592 | 1.5x | 1,061,288 | 1.2x | N/A | 26 | % | ||||||||||||||||||||||||||||||
| Euro |
||||||||||||||||||||||||||||||||||||||||||
| European Senior Debt Fund (Feb 2015 / Feb 2018) |
€ | 1,964,689 | € | 2,925,122 | € | 886,329 | 1.0x | — | € | 156,195 | 1.2x | € | 1,042,524 | 1.0x | N/A | -5 | % | |||||||||||||||||||||||||
|
|
|
|
|
|
|
|
|
|
|
|
|
|
|
|
|
|
|
|
|
|
||||||||||||||||||||||
| Total Credit |
$ | 26,260,552 | $ | 13,896,899 | $ | 10,914,405 | 1.1x | — | $ | 13,951,100 | 1.5x | $ | 24,865,505 | 1.3x | N/A | 14 | % | |||||||||||||||||||||||||
|
|
|
|
|
|
|
|
|
|
|
|
|
|
|
|
|
|
|
|
|
|
||||||||||||||||||||||
| N/M | Not meaningful. |
| N/A | Not applicable. |
| (a) | Available Capital represents total investable capital commitments, including side-by-side, adjusted for certain expenses and expired or recallable capital and may include leverage, less invested capital. This amount is not reduced by outstanding commitments to investments. |
| (b) | Multiple of Invested Capital (“MOIC”) represents carrying value, before management fees, expenses and Carried Interest, divided by invested capital. |
| (c) | Net Internal Rate of Return (“IRR”) represents the annualized inception to March 31, 2017 IRR on total invested capital based on realized proceeds and unrealized value, as applicable, after management fees, expenses and Carried Interest. |
| (d) | Realizations are treated as return of capital until fully recovered and therefore unrealized and realized MOICs are not meaningful. |
| (e) | BCEP, or Blackstone Core Equity Partners, is a core private equity fund which invests with a more modest risk profile and longer hold period. |
| (f) | Returns for Other Funds and Co-Investment are not meaningful as these funds have limited transaction activity. |
| (g) | BREP Co-Investment represents co-investment capital raised for various BREP investments. The Net IRR reflected is calculated by aggregating each co-investment’s realized proceeds and unrealized value, as applicable, after management fees, expenses and Carried Interest. |
| (h) | BPP represents the core+ real estate funds which invest with a more modest risk profile and lower leverage. |
| (i) | Excludes Capital Trust drawdown funds. |
| (j) | BSCH, or Blackstone Strategic Capital Holdings, is a permanent capital vehicle focused on acquiring strategic minority positions in alternative asset managers. |
| (k) | Funds presented represent the flagship credit drawdown funds only. The Total Credit Net IRR is the combined IRR of the seven credit drawdown funds presented. |
85
Table of Contents
Segment Analysis
Discussed below is our Economic Income for each of our segments. This information is reflected in the manner utilized by our senior management to make operating decisions, assess performance and allocate resources. References to “our” sectors or investments may also refer to portfolio companies and investments of the underlying funds that we manage.
For segment reporting purposes, revenues and expenses are presented on a basis that deconsolidates the investment funds we manage. As a result, segment revenues are greater than those presented on a consolidated GAAP basis because fund management fees recognized in certain segments are received from the Blackstone Funds and eliminated in consolidation when presented on a consolidated GAAP basis. Furthermore, segment expenses are lower than related amounts presented on a consolidated GAAP basis due to the exclusion of fund expenses that are paid by Limited Partners and the elimination of non-controlling interests.
86
Table of Contents
Private Equity
The following table presents the results of operations for our Private Equity segment:
| Three Months Ended March 31, |
2017 vs. 2016 | |||||||||||||||
| 2017 | 2016 | $ | % | |||||||||||||
| (Dollars in Thousands) | ||||||||||||||||
| Segment Revenues |
||||||||||||||||
| Management and Advisory Fees, Net |
||||||||||||||||
| Base Management Fees |
$ | 177,464 | $ | 130,648 | $ | 46,816 | 36 | % | ||||||||
| Transaction, Advisory Fees and Other, Net |
17,200 | 8,920 | 8,280 | 93 | % | |||||||||||
| Management Fee Offsets |
(12,190 | ) | (6,848 | ) | (5,342 | ) | 78 | % | ||||||||
|
|
|
|
|
|
|
|
|
|||||||||
| Total Management and Advisory Fees, Net |
182,474 | 132,720 | 49,754 | 37 | % | |||||||||||
|
|
|
|
|
|
|
|
|
|||||||||
| Performance Fees |
||||||||||||||||
| Realized |
||||||||||||||||
| Carried Interest |
582,681 | 30,282 | 552,399 | N/M | ||||||||||||
| Unrealized |
||||||||||||||||
| Carried Interest |
(184,833 | ) | 73,875 | (258,708 | ) | N/M | ||||||||||
|
|
|
|
|
|
|
|
|
|||||||||
| Total Performance Fees |
397,848 | 104,157 | 293,691 | 282 | % | |||||||||||
|
|
|
|
|
|
|
|
|
|||||||||
| Investment Income (Loss) |
||||||||||||||||
| Realized |
80,889 | (15,357 | ) | 96,246 | N/M | |||||||||||
| Unrealized |
(40,824 | ) | 15,440 | (56,264 | ) | N/M | ||||||||||
|
|
|
|
|
|
|
|
|
|||||||||
| Total Investment Income |
40,065 | 83 | 39,982 | N/M | ||||||||||||
| Interest and Dividend Revenue |
10,922 | 9,849 | 1,073 | 11 | % | |||||||||||
| Other |
(1,800 | ) | (1,587 | ) | (213 | ) | 13 | % | ||||||||
|
|
|
|
|
|
|
|
|
|||||||||
| Total Revenues |
629,509 | 245,222 | 384,287 | 157 | % | |||||||||||
|
|
|
|
|
|
|
|
|
|||||||||
| Expenses |
||||||||||||||||
| Compensation and Benefits |
||||||||||||||||
| Compensation |
83,742 | 80,274 | 3,468 | 4 | % | |||||||||||
| Performance Fee Compensation |
||||||||||||||||
| Realized |
||||||||||||||||
| Carried Interest |
181,633 | 15,427 | 166,206 | N/M | ||||||||||||
| Unrealized |
||||||||||||||||
| Carried Interest |
(39,356 | ) | 9,296 | (48,652 | ) | N/M | ||||||||||
|
|
|
|
|
|
|
|
|
|||||||||
| Total Compensation and Benefits |
226,019 | 104,997 | 121,022 | 115 | % | |||||||||||
| Other Operating Expenses |
42,822 | 48,063 | (5,241 | ) | -11 | % | ||||||||||
|
|
|
|
|
|
|
|
|
|||||||||
| Total Expenses |
268,841 | 153,060 | 115,781 | 76 | % | |||||||||||
|
|
|
|
|
|
|
|
|
|||||||||
| Economic Income |
$ | 360,668 | $ | 92,162 | $ | 268,506 | 291 | % | ||||||||
|
|
|
|
|
|
|
|
|
|||||||||
N/M Not meaningful.
Three Months Ended March 31, 2017 Compared to Three Months Ended March 31, 2016
Revenues
Revenues were $629.5 million for the three months ended March 31, 2017, an increase of $384.3 million compared to $245.2 million for the three months ended March 31, 2016. The increase in revenues was primarily attributable to increases in Performance Fees, Total Management and Advisory Fees, Net and Investment Income of $293.7 million, $49.8 million and $40.0 million, respectively.
Revenues in our Private Equity segment in the first quarter of 2017 were significantly higher compared to the first quarter of 2016, driven primarily by appreciation in public and private investments in the U.S. portfolio.
87
Table of Contents
The market environment in early 2017 continues to be generally characterized by high prices and as a result, the market for new investments remains challenging. Nonetheless, in the first quarter of 2017, our Private Equity funds were able to deploy significant capital, particularly in the healthcare and energy sectors. In addition, our Private Equity funds had record realization activity in the first quarter of 2017. Our portfolio companies continue to operate in a stable, slow growth economic environment characterized by uncertainty surrounding governmental and tax policy. Revenues in the Private Equity segment would likely be negatively impacted if the capital markets experienced a prolonged period of volatility, including as a result of uncertainty regarding governmental and tax policy, or market and/or macroeconomic conditions were to deteriorate.
Performance Fees, which are determined on a fund by fund basis, were $397.8 million for the three months ended March 31, 2017, an increase of $293.7 million, compared to $104.2 million for the three months ended March 31, 2016, driven mainly by the private portfolio in BCP VI.
Total Management and Advisory Fees, Net were $182.5 million for the three months ended March 31, 2017, an increase of $49.8 million compared to $132.7 million for the three months ended March 31, 2016, driven primarily by increases in Base Management Fees and Transaction, Advisory and Other Fees, Net. Base Management Fees were $177.5 million for the three months ended March 31, 2017, an increase of $46.8 million compared to $130.6 million for the three months ended March 31, 2016, primarily due to the increase in fee-earning assets across the segment. Transaction, Advisory and Other Fees, Net were $17.2 million for the three months ended March 31, 2017, an increase of $8.3 million compared to $8.9 million for the three months ended March 31, 2016, principally due to increased capital market deal activity.
Investment Income was $40.1 million for the three months ended March 31, 2017, an increase of $40.0 million compared to $0.1 million for the three months ended March 31, 2016, driven primarily by an increase in the appreciation of our investment holdings.
Expenses
Expenses were $268.8 million for the three months ended March 31, 2017, an increase of $115.8 million, compared to $153.1 million for the three months ended March 31, 2016. The increase was attributable to a $117.6 million increase in Performance Fee Compensation, partially offset by a $5.2 million decrease in Other Operating Expenses. The increase in Performance Fee Compensation was driven by the increase in Performance Fees Revenue. The decrease in Other Operating Expenses was primarily due to a decrease in interest and other expense allocations to the segment.
Fund Returns
Fund returns information for our significant funds is included throughout this discussion and analysis to facilitate an understanding of our results of operations for the periods presented. The fund returns information reflected in this discussion and analysis is not indicative of the financial performance of The Blackstone Group L.P. and is also not necessarily indicative of the future performance of any particular fund. An investment in The Blackstone Group L.P. is not an investment in any of our funds. There can be no assurance that any of our funds or our other existing and future funds will achieve similar returns.
88
Table of Contents
The following table presents the internal rates of return of our significant private equity funds:
| Three Months Ended March 31, |
March 31, 2017 Inception to Date |
|||||||||||||||||||||||||||||||
| 2017 | 2016 | Realized | Total | |||||||||||||||||||||||||||||
| Fund (a) |
Gross | Net | Gross | Net | Gross | Net | Gross | Net | ||||||||||||||||||||||||
| BCP IV |
-2 | % | -2 | % | 4 | % | 3 | % | 55 | % | 41 | % | 50 | % | 36 | % | ||||||||||||||||
| BCP V |
3 | % | 2 | % | 6 | % | 4 | % | 11 | % | 9 | % | 10 | % | 8 | % | ||||||||||||||||
| BCOM |
3 | % | 3 | % | 3 | % | 3 | % | 13 | % | 6 | % | 13 | % | 6 | % | ||||||||||||||||
| BCP VI |
9 | % | 7 | % | -1 | % | -1 | % | 35 | % | 28 | % | 18 | % | 12 | % | ||||||||||||||||
| BEP I |
10 | % | 9 | % | — | — | 44 | % | 42 | % | 19 | % | 15 | % | ||||||||||||||||||
| BEP II (b) |
13 | % | 13 | % | N/M | N/M | N/A | N/A | 77 | % | 47 | % | ||||||||||||||||||||
| Tactical Opportunities |
4 | % | 3 | % | 1 | % | 1 | % | 35 | % | 27 | % | 15 | % | 11 | % | ||||||||||||||||
| Strategic Partners |
5 | % | 5 | % | — | -1 | % | N/A | N/A | 17 | % | 14 | % | |||||||||||||||||||
The returns presented herein represent those of the applicable Blackstone Funds and not those of The Blackstone Group L.P.
N/M Not meaningful.
N/A Not applicable.
| (a) | Net returns are based on the change in carrying value (realized and unrealized) after management fees, expenses and carried interest allocations. |
| (b) | BEP II’s 2016 investment returns are presented as N/M due to the early stage nature and limited operations of the fund’s investments which are held at cost. Accordingly, the 2016 returns would only be reflective of the impact of fees and expenses incurred to date. |
The corporate private equity funds within the Private Equity segment have five funds with closed investment periods: BCP IV, BCP V, BCP VI, BCOM and BEP I. As of March 31, 2017, BCP IV was above its carried interest threshold (i.e., the preferred return payable to its limited partners before the general partner is eligible to receive carried interest) and would still be above its carried interest threshold even if all remaining investments were valued at zero. BCP V is comprised of two fund classes based on the timings of fund closings, the BCP V “main fund” and BCP V-AC fund. Within these fund classes, the general partner is subject to equalization such that (a) the general partner accrues carried interest when the total carried interest for the combined fund classes is positive and (b) the general partner realizes carried interest so long as clawback obligations, if any, for the combined fund classes are fully satisfied. During the quarter, both fund classes were above their respective carried interest thresholds. BCP VI is currently above its carried interest threshold. BCOM is currently above its carried interest threshold and has generated inception to date positive returns. We are entitled to retain previously realized carried interest up to 20% of BCOM’s net gains. As a result, Performance Fees are recognized from BCOM on current period gains and losses. BEP I is currently above its carried interest threshold.
89
Table of Contents
Real Estate
The following table presents the results of operations for our Real Estate segment:
| Three Months Ended March 31, |
2017 vs. 2016 | |||||||||||||||
| 2017 | 2016 | $ | % | |||||||||||||
| (Dollars in Thousands) | ||||||||||||||||
| Segment Revenues |
||||||||||||||||
| Management Fees, Net |
||||||||||||||||
| Base Management Fees |
$ | 197,879 | $ | 199,907 | $ | (2,028 | ) | -1 | % | |||||||
| Transaction and Other Fees, Net |
21,279 | 35,794 | (14,515 | ) | -41 | % | ||||||||||
| Management Fee Offsets |
(3,550 | ) | (3,595 | ) | 45 | -1 | % | |||||||||
|
|
|
|
|
|
|
|
|
|||||||||
| Total Management Fees, Net |
215,608 | 232,106 | (16,498 | ) | -7 | % | ||||||||||
|
|
|
|
|
|
|
|
|
|||||||||
| Performance Fees |
||||||||||||||||
| Realized |
||||||||||||||||
| Carried Interest |
519,841 | 200,627 | 319,214 | 159 | % | |||||||||||
| Incentive Fees |
2,914 | 4,069 | (1,155 | ) | -28 | % | ||||||||||
| Unrealized |
||||||||||||||||
| Carried Interest |
(22,268 | ) | (11,522 | ) | (10,746 | ) | 93 | % | ||||||||
| Incentive Fees |
18,713 | 9,765 | 8,948 | 92 | % | |||||||||||
|
|
|
|
|
|
|
|
|
|||||||||
| Total Performance Fees |
519,200 | 202,939 | 316,261 | 156 | % | |||||||||||
|
|
|
|
|
|
|
|
|
|||||||||
| Investment Income (Loss) |
||||||||||||||||
| Realized |
119,579 | 12,975 | 106,604 | 822 | % | |||||||||||
| Unrealized |
(83,853 | ) | (2,137 | ) | (81,716 | ) | N/M | |||||||||
|
|
|
|
|
|
|
|
|
|||||||||
| Total Investment Income |
35,726 | 10,838 | 24,888 | 230 | % | |||||||||||
| Interest and Dividend Revenue |
18,167 | 13,188 | 4,979 | 38 | % | |||||||||||
| Other |
(3,150 | ) | (1,909 | ) | (1,241 | ) | 65 | % | ||||||||
|
|
|
|
|
|
|
|
|
|||||||||
| Total Revenues |
785,551 | 457,162 | 328,389 | 72 | % | |||||||||||
|
|
|
|
|
|
|
|
|
|||||||||
| Expenses |
||||||||||||||||
| Compensation and Benefits |
||||||||||||||||
| Compensation |
102,702 | 100,578 | 2,124 | 2 | % | |||||||||||
| Performance Fee Compensation |
||||||||||||||||
| Realized |
||||||||||||||||
| Carried Interest |
179,925 | 43,076 | 136,849 | 318 | % | |||||||||||
| Incentive Fees |
1,364 | 2,133 | (769 | ) | -36 | % | ||||||||||
| Unrealized |
||||||||||||||||
| Carried Interest |
11,798 | 27,703 | (15,905 | ) | -57 | % | ||||||||||
| Incentive Fees |
8,509 | 4,158 | 4,351 | 105 | % | |||||||||||
|
|
|
|
|
|
|
|
|
|||||||||
| Total Compensation and Benefits |
304,298 | 177,648 | 126,650 | 71 | % | |||||||||||
| Other Operating Expenses |
51,969 | 48,097 | 3,872 | 8 | % | |||||||||||
|
|
|
|
|
|
|
|
|
|||||||||
| Total Expenses |
356,267 | 225,745 | 130,522 | 58 | % | |||||||||||
|
|
|
|
|
|
|
|
|
|||||||||
| Economic Income |
$ | 429,284 | $ | 231,417 | $ | 197,867 | 86 | % | ||||||||
|
|
|
|
|
|
|
|
|
|||||||||
N/M Not meaningful.
Three Months Ended March 31, 2017 Compared to Three Months Ended March 31, 2016
Revenues
Revenues were $785.6 million for the three months ended March 31, 2017, an increase of $328.4 million compared to $457.2 million for the three months ended March 31, 2016. The increase in revenues was primarily
attributable to increases of $316.3 million in Performance Fees and $24.9 million in Investment Income, partially offset by a decrease of $16.5 million in Total Management Fees, Net.
90
Table of Contents
In the first quarter of 2017, revenues in our Real Estate segment increased primarily due to appreciation in private investments in our BREP opportunistic funds compared to the first quarter of 2016. Overall, operating trends in our Real Estate portfolio remain stable and supply-demand fundamentals remain solid in most markets, although we see decelerating growth in certain geographies and sectors, notably retail. As a result of less distress and rising asset values, the U.S. continues to experience a more challenging opportunistic investment environment than in the early part of 2016, although in the first quarter of 2017, our Real Estate funds remained active in both deployment and realizations. In Europe, our Real Estate funds were active where lingering distress continued to provide investment opportunities. In our real estate debt funds, liquid fund performance was strong in the first quarter of 2017 compared to the broad market sell-off in the first quarter of 2016. Revenues in our Real Estate segment would likely be negatively impacted if the capital markets experienced a period of prolonged volatility, including as a result of uncertainty regarding governmental and tax policy, or market and/or macroeconomic conditions were to deteriorate.
Performance Fees, which are determined on a fund by fund basis, were $519.2 million for the three months ended March 31, 2017, an increase of $316.3 million compared to $202.9 million for the three months ended March 31, 2016. Performance Fees increased due to the net appreciation of investments holdings in our BREP opportunistic funds, which appreciated 5.7% versus 1.8% in the comparable 2016 quarter.
Investment Income was $35.7 million for the three months ended March 31, 2017, an increase of $24.9 million compared to $10.8 million for the three months ended March 31, 2016. The increase in Investment Income was primarily due to the net increase in appreciation of the Partnership’s principal investments.
Total Management Fees, Net were $215.6 million for the three months ended March 31, 2017, a decrease of $16.5 million compared to $232.1 million for the three months ended March 31, 2016, driven primarily by decreases in Transaction and Other Fees, Net. Transaction and Other Fees, Net were $21.3 million for the three months ended March 31, 2017, a decrease of $14.5 million compared to $35.8 million for the three months ended March 31, 2016, primarily due to the timing of investment closings.
The annualized Base Management Fee Rate decreased from 1.19% at March 31, 2016 to 1.10% at March 31, 2017. The decrease was principally due to commencement of the investment period of BREP Europe V in the fourth quarter of 2016, which added Fee-Earning Assets Under Management, the majority of which are under Base Management Fee holiday until the second quarter 2017.
Expenses
Expenses were $356.3 million for the three months ended March 31, 2017, an increase of $130.5 million, compared to $225.7 million for the three months ended March 31, 2016. The increase was primarily due to increases of $124.5 million in Performance Fee Compensation and $3.9 million in Other Operating Expenses. The increase in Performance Fee Compensation was a result of an increase in Performance Fee Revenue. The increase in Other Operating Expenses was primarily due to an increase in interest and other expense allocations to the segment.
Fund Returns
Fund return information for our significant funds is included throughout this discussion and analysis to facilitate an understanding of our results of operations for the periods presented. The fund returns information reflected in this discussion and analysis is not indicative of the financial performance of The Blackstone Group L.P. and is also not necessarily indicative of the future performance of any particular fund. An investment in The Blackstone Group L.P. is not an investment in any of our funds. There can be no assurance that any of our funds or our other existing and future funds will achieve similar returns.
91
Table of Contents
The following table presents the internal rates of return of our significant real estate funds:
| Three Months Ended March 31, |
March 31, 2017 Inception to Date |
|||||||||||||||||||||||||||||||
| 2017 | 2016 | Realized | Total | |||||||||||||||||||||||||||||
| Fund (a) |
Gross | Net | Gross | Net | Gross | Net | Gross | Net | ||||||||||||||||||||||||
| BREP IV |
-2 | % | -1 | % | -8 | % | -6 | % | 52 | % | 31 | % | 22 | % | 12 | % | ||||||||||||||||
| BREP V |
1 | % | 1 | % | — | — | 16 | % | 12 | % | 14 | % | 11 | % | ||||||||||||||||||
| BREP VI |
3 | % | 3 | % | 4 | % | 3 | % | 18 | % | 14 | % | 17 | % | 13 | % | ||||||||||||||||
| BREP VII |
4 | % | 4 | % | 1 | % | — | 39 | % | 28 | % | 26 | % | 18 | % | |||||||||||||||||
| BREP VIII |
6 | % | 4 | % | 6 | % | 4 | % | 29 | % | 18 | % | 31 | % | 18 | % | ||||||||||||||||
| BREP International II (b) |
-1 | % | -1 | % | 2 | % | 2 | % | 10 | % | 9 | % | 7 | % | 6 | % | ||||||||||||||||
| BREP Europe III (b) |
8 | % | 7 | % | -1 | % | -1 | % | 33 | % | 22 | % | 25 | % | 16 | % | ||||||||||||||||
| BREP Europe IV (b) |
13 | % | 10 | % | 2 | % | 1 | % | 34 | % | 22 | % | 25 | % | 18 | % | ||||||||||||||||
| BREP Co-Investment (c) |
2 | % | 2 | % | 2 | % | -1 | % | 18 | % | 16 | % | 17 | % | 16 | % | ||||||||||||||||
| BREP Asia |
7 | % | 5 | % | 6 | % | 4 | % | 29 | % | 21 | % | 26 | % | 17 | % | ||||||||||||||||
| BPP |
3 | % | 3 | % | 4 | % | 4 | % | 37 | % | 36 | % | 15 | % | 13 | % | ||||||||||||||||
| BREDS Drawdown |
4 | % | 3 | % | 5 | % | 2 | % | 17 | % | 13 | % | 16 | % | 11 | % | ||||||||||||||||
| BREDS Liquid |
4 | % | 3 | % | -5 | % | -5 | % | N/A | N/A | 12 | % | 8 | % | ||||||||||||||||||
The returns presented herein represent those of the applicable Blackstone Funds and not those of The Blackstone Group L.P.
N/A Not applicable.
| (a) | Net returns are based on the change in carrying value (realized and unrealized) after management fees, expenses and performance fee allocations. |
| (b) | Euro-based internal rates of return. |
| (c) | Excludes fully realized co-investments prior to Blackstone’s IPO. |
The following table presents the carried interest status of our real estate carry funds with expired investment periods which are currently not generating performance fees as of March 31, 2017:
| Gain to Cross Carried Interest Threshold (a) | ||||||||||||
| Fully Invested Funds |
Amount | % Change in Total Enterprise Value (b) |
% Change in Equity Value |
|||||||||
| (Amounts in Millions) | ||||||||||||
| BREP International II (Sep 2005 / Jun 2008) |
€ | 831 | 43 | % | 321 | % | ||||||
| (a) | The general partner of each fund is allocated carried interest when the annualized returns, net of management fees and expenses, exceed the preferred return as dictated by the fund agreements. The preferred return is calculated for each limited partner individually. The Gain to Cross carried interest Threshold represents the increase in equity at the fund level (excluding our side-by-side investments) that is required for the general partner to begin accruing carried interest, assuming the gain is earned pro rata across the fund’s investments and is achieved at the reporting date. |
| (b) | Total Enterprise Value is the respective fund’s pro rata ownership of the privately held portfolio companies’ Enterprise Value. |
The Real Estate segment has three funds in their investment period, which were above their respective carried interest thresholds as of March 31, 2017: BREP VIII, BREP Asia and BREDS III.
92
Table of Contents
Hedge Fund Solutions
The following table presents the results of operations for our Hedge Fund Solutions segment:
| Three Months Ended | ||||||||||||||||
| March 31, | 2017 vs. 2016 | |||||||||||||||
| 2017 | 2016 | $ | % | |||||||||||||
| (Dollars in Thousands) | ||||||||||||||||
| Segment Revenues |
||||||||||||||||
| Management Fees, Net |
||||||||||||||||
| Base Management Fees |
$ | 128,468 | $ | 130,158 | $ | (1,690 | ) | -1 | % | |||||||
| Transaction and Other Fees, Net |
259 | 543 | (284 | ) | -52 | % | ||||||||||
|
|
|
|
|
|
|
|
|
|||||||||
| Total Management Fees, Net |
128,727 | 130,701 | (1,974 | ) | -2 | % | ||||||||||
|
|
|
|
|
|
|
|
|
|||||||||
| Performance Fees |
||||||||||||||||
| Realized |
||||||||||||||||
| Incentive Fees |
14,684 | 2,684 | 12,000 | 447 | % | |||||||||||
| Unrealized |
||||||||||||||||
| Carried Interest |
3,797 | 32 | 3,765 | N/M | ||||||||||||
| Incentive Fees |
40,311 | (2,935 | ) | 43,246 | N/M | |||||||||||
|
|
|
|
|
|
|
|
|
|||||||||
| Total Performance Fees |
58,792 | (219 | ) | 59,011 | N/M | |||||||||||
|
|
|
|
|
|
|
|
|
|||||||||
| Investment Income (Loss) |
||||||||||||||||
| Realized |
(632 | ) | (4,745 | ) | 4,113 | -87 | % | |||||||||
| Unrealized |
18,293 | (12,291 | ) | 30,584 | N/M | |||||||||||
|
|
|
|
|
|
|
|
|
|||||||||
| Total Investment Income (Loss) |
17,661 | (17,036 | ) | 34,697 | N/M | |||||||||||
| Interest and Dividend Revenue |
7,554 | 5,296 | 2,258 | 43 | % | |||||||||||
| Other |
(1,610 | ) | (1,388 | ) | (222 | ) | 16 | % | ||||||||
|
|
|
|
|
|
|
|
|
|||||||||
| Total Revenues |
211,124 | 117,354 | 93,770 | 80 | % | |||||||||||
|
|
|
|
|
|
|
|
|
|||||||||
| Expenses |
||||||||||||||||
| Compensation and Benefits |
||||||||||||||||
| Compensation |
47,604 | 54,169 | (6,565 | ) | -12 | % | ||||||||||
| Performance Fee Compensation |
||||||||||||||||
| Realized |
||||||||||||||||
| Incentive Fees |
7,317 | 1,863 | 5,454 | 293 | % | |||||||||||
| Unrealized |
||||||||||||||||
| Carried Interest |
1,209 | — | 1,209 | N/M | ||||||||||||
| Incentive Fees |
14,004 | (1,195 | ) | 15,199 | N/M | |||||||||||
|
|
|
|
|
|
|
|
|
|||||||||
| Total Compensation and Benefits |
70,134 | 54,837 | 15,297 | 28 | % | |||||||||||
| Other Operating Expenses |
25,800 | 26,146 | (346 | ) | -1 | % | ||||||||||
|
|
|
|
|
|
|
|
|
|||||||||
| Total Expenses |
95,934 | 80,983 | 14,951 | 18 | % | |||||||||||
|
|
|
|
|
|
|
|
|
|||||||||
| Economic Income |
$ | 115,190 | $ | 36,371 | $ | 78,819 | 217 | % | ||||||||
|
|
|
|
|
|
|
|
|
|||||||||
N/M Not meaningful.
Three Months Ended March 31, 2017 Compared to Three Months Ended March 31, 2016
Revenues
Revenues were $211.1 million for the three months ended March 31, 2017, an increase of $93.8 million compared to $117.4 million for the three months ended March 31, 2016. The increase in revenues was primarily attributable to increases of $59.0 million in Total Performance Fees and $34.7 million in Investment Income (Loss).
Revenues in our Hedge Fund Solutions segment in the first quarter of 2017 increased compared to the first quarter of 2016, a challenging quarter for equity markets, primarily as a result of improved performance across
93
Table of Contents
multiple strategies in the segment, with the BPS Composite gross return up 2.7% in the quarter (2.5% net). In addition, approximately 84% of Hedge Fund Solutions’ Fee-Earnings Assets Under Management eligible for Incentive Fees was above the high water mark as of the end of the first quarter of 2017. Hedge Fund Solutions revenues would likely be negatively impacted if global asset prices experienced another period of decline, including as a result of uncertainty regarding governmental and tax policy, or liquidity needs caused investors to withdraw assets.
Total Performance Fees, which are determined on a fund by fund basis, were $58.8 million for the three months ended March 31, 2017, an increase of $59.0 million compared to $(0.2) million for the three months ended March 31, 2016. The increase was primarily driven by higher returns for a number of funds.
Total Investment Income (Loss) was $17.7 million for the three months ended March 31, 2017, an increase of $34.7 million compared to $(17.0) million for the three months ended March 31, 2016, primarily due to the year over year net appreciation of investments of which Blackstone owns a share.
Expenses
Expenses were $95.9 million for the three months ended March 31, 2017, an increase of $15.0 million compared to $81.0 million for the three months ended March 31, 2016. The increase in expenses was attributable to an increase of $21.9 million in Performance Fee Compensation, partially offset by a $6.6 million decrease in Compensation. Performance Fee Compensation was $22.5 million for the three months ended March 31, 2017 compared to $0.7 million for the three months ended March 31, 2016, primarily due to an increase in Performance Fee Revenue. Compensation was $47.6 million for the three months ended March 31, 2017 compared to $54.2 million for the three months ended March 31, 2016, primarily due to an overall decrease in Management Fees.
Operating Metrics
The following table presents information regarding our Incentive Fee-Earning Assets Under Management:
| Fee-Earning Assets Under Management Eligible for Incentive Fees |
Estimated % Above High Water Mark / Benchmark (a) |
|||||||||||||||
| As of March 31, | As of March 31, | |||||||||||||||
| 2016 | 2017 | 2016 | 2017 | |||||||||||||
| (Dollars in Thousands) | ||||||||||||||||
| BAAM-Managed Funds (b) |
$ | 35,411,177 | $ | 36,953,493 | 1 | % | 84 | % | ||||||||
| (a) | Estimated % Above High Water Mark/Benchmark represents the percentage of Fee-Earning Assets Under Management Eligible for Incentive Fees that as of the dates presented would earn incentive fees when the applicable BAAM-managed fund has positive investment performance relative to a benchmark, where applicable. Incremental positive performance in the applicable Blackstone Funds may cause additional assets to reach their respective High Water Mark or clear a benchmark return, thereby resulting in an increase in Estimated % Above High Water Mark/Benchmark. |
| (b) | For the BAAM-managed funds, at March 31, 2017 the incremental appreciation needed for the 16% of Fee-Earning Assets Under Management below their respective High Water Marks/Benchmarks to reach their respective High Water Marks/Benchmarks was $437.3 million, a decrease of $1.3 billion, compared to $1.7 billion at March 31, 2016. Of the Fee-Earning Assets Under Management below their respective High Water Marks/Benchmarks as of March 31, 2017, 43% were within 5% of reaching their respective High Water Mark. |
94
Table of Contents
Composite Returns
Composite returns information is included throughout this discussion and analysis to facilitate an understanding of our results of operations for the periods presented. The composite returns information reflected in this discussion and analysis is not indicative of the financial performance of The Blackstone Group L.P. and is also not necessarily indicative of the future results of any particular fund. An investment in The Blackstone Group L.P. is not an investment in any of our funds or composites. There can be no assurance that any of our funds or composites or our other existing and future funds or composites will achieve similar returns.
The following table presents the return information of the BAAM Principal Solutions Composite:
| Three Months Ended March 31, |
Average Annual Returns (a) | |||||||||||||||||||||||||||||||||||||||||||||||
| Periods Ended March 31, 2017 |
||||||||||||||||||||||||||||||||||||||||||||||||
| 2017 | 2016 | One Year |
Three Year |
Five Year |
Historical | |||||||||||||||||||||||||||||||||||||||||||
| Composite |
Gross | Net | Gross | Net | Gross | Net | Gross | Net | Gross | Net | Gross | Net | ||||||||||||||||||||||||||||||||||||
| BAAM Principal Solutions Composite (b) |
3 | % | 2 | % | -3 | % | -3 | % | 10 | % | 9 | % | 5 | % | 4 | % | 7 | % | 6 | % | 7 | % | 6 | % | ||||||||||||||||||||||||
The returns presented represent those of the applicable Blackstone Funds and not those of The Blackstone Group L.P.
| (a) | Composite returns present a summarized asset-weighted return measure to evaluate the overall performance of the applicable class of Blackstone Funds. |
| (b) | BAAM’s Principal Solutions (“BPS”) Composite covers the period from January 2000 to present, although BAAM’s inception date is September 1990. BPS Composite does not include BAAM’s individual investor solutions (i.e., liquid alternatives), long-biased commodities, ventures (i.e., seeding and minority interests), strategic opportunities (i.e., co-investments), Senfina (i.e., direct trading) and advisory (non-discretionary) platforms, except for investments by BPS funds directly into those platforms. BAAM-managed funds in liquidation are also excluded. The historical return is from January 1, 2000. |
95
Table of Contents
Credit
The following table presents the results of operations for our Credit segment:
| Three Months Ended March 31, |
2017 vs. 2016 | |||||||||||||||
| 2017 | 2016 | $ | % | |||||||||||||
| (Dollars in Thousands) | ||||||||||||||||
| Segment Revenues |
||||||||||||||||
| Management Fees, Net |
||||||||||||||||
| Base Management Fees |
$ | 139,147 | $ | 125,990 | $ | 13,157 | 10 | % | ||||||||
| Transaction and Other Fees, Net |
1,484 | 1,342 | 142 | 11 | % | |||||||||||
| Management Fee Offsets |
(17,859 | ) | (9,658 | ) | (8,201 | ) | 85 | % | ||||||||
|
|
|
|
|
|
|
|
|
|||||||||
| Total Management Fees, Net |
122,772 | 117,674 | 5,098 | 4 | % | |||||||||||
|
|
|
|
|
|
|
|
|
|||||||||
| Performance Fees |
||||||||||||||||
| Realized |
||||||||||||||||
| Carried Interest |
8,800 | — | 8,800 | N/M | ||||||||||||
| Incentive Fees |
29,539 | 21,697 | 7,842 | 36 | % | |||||||||||
| Unrealized |
||||||||||||||||
| Carried Interest |
48,557 | (14,779 | ) | 63,336 | N/M | |||||||||||
| Incentive Fees |
992 | 270 | 722 | 267 | % | |||||||||||
|
|
|
|
|
|
|
|
|
|||||||||
| Total Performance Fees |
87,888 | 7,188 | 80,700 | N/M | ||||||||||||
|
|
|
|
|
|
|
|
|
|||||||||
| Investment Income (Loss) |
||||||||||||||||
| Realized |
3,058 | (2,974 | ) | 6,032 | N/M | |||||||||||
| Unrealized |
7,449 | (17,561 | ) | 25,010 | N/M | |||||||||||
|
|
|
|
|
|
|
|
|
|||||||||
| Total Investment Income (Loss) |
10,507 | (20,535 | ) | 31,042 | N/M | |||||||||||
| Interest and Dividend Revenue |
9,233 | 6,748 | 2,485 | 37 | % | |||||||||||
| Other |
(1,727 | ) | (1,364 | ) | (363 | ) | 27 | % | ||||||||
|
|
|
|
|
|
|
|
|
|||||||||
| Total Revenues |
228,673 | 109,711 | 118,962 | 108 | % | |||||||||||
|
|
|
|
|
|
|
|
|
|||||||||
| Expenses |
||||||||||||||||
| Compensation and Benefits |
||||||||||||||||
| Compensation |
54,979 | 52,382 | 2,597 | 5 | % | |||||||||||
| Performance Fee Compensation |
||||||||||||||||
| Realized |
||||||||||||||||
| Carried Interest |
4,633 | — | 4,633 | N/M | ||||||||||||
| Incentive Fees |
14,071 | 10,127 | 3,944 | 39 | % | |||||||||||
| Unrealized |
||||||||||||||||
| Carried Interest |
21,962 | (6,998 | ) | 28,960 | N/M | |||||||||||
| Incentive Fees |
626 | 485 | 141 | 29 | % | |||||||||||
|
|
|
|
|
|
|
|
|
|||||||||
| Total Compensation and Benefits |
96,271 | 55,996 | 40,275 | 72 | % | |||||||||||
| Other Operating Expenses |
32,701 | 26,220 | 6,481 | 25 | % | |||||||||||
|
|
|
|
|
|
|
|
|
|||||||||
| Total Expenses |
128,972 | 82,216 | 46,756 | 57 | % | |||||||||||
|
|
|
|
|
|
|
|
|
|||||||||
| Economic Income |
$ | 99,701 | $ | 27,495 | $ | 72,206 | 263 | % | ||||||||
|
|
|
|
|
|
|
|
|
|||||||||
| N/M | Not meaningful. |
Three Months Ended March 31, 2017 Compared to Three Months Ended March 31, 2016
Revenues
Revenues were $228.7 million for the three months ended March 31, 2017, an increase of $119.0 million, compared to $109.7 million for the three months ended March 31, 2016. The increase in revenues was primarily attributable to increases of $80.7 million in Performance Fees, $31.0 million in Investment Income (Loss) and $5.1 million in Total Management Fees, Net.
96
Table of Contents
Revenues in our Credit segment increased in the first quarter of 2017 compared to the first quarter of 2016, driven by solid performance across both the performing credit and distressed strategies, with particularly strong performance in our energy investments compared to the prior-year period. Despite the continuing low interest rate environment, our Credit funds were able to identify attractive investment opportunities in the first quarter of 2017 by focusing on transactions where our scale and expertise granted us a competitive advantage, particularly in the European direct lending and energy sectors. Our Credit segment revenues may, however, be negatively impacted by prolonged periods of market pressure, depressed energy prices, market volatility or uncertainty regarding governmental and tax policy.
Performance Fees were $87.9 million for the three months ended March 31, 2017, an increase of $80.7 million, compared to $7.2 million for the three months ended March 31, 2016. This change was primarily attributable to higher returns in our Performing Credit Strategies and Distressed Strategies.
Investment Income (Loss) was $10.5 million for the three months ended March 31, 2017, an increase of $31.0 million, compared to $(20.5) million for the three months ended March 31, 2016, primarily due to the prior period’s unrealized investment losses in our distressed strategies and long only funds.
Total Management Fees, Net were $122.8 million for the three months ended March 31, 2017, an increase of $5.1 million, compared to $117.7 million for the three months ended March 31, 2016. The increase was primarily attributable to our long only and hedge fund strategies.
Expenses
Expenses were $129.0 million for the three months ended March 31, 2017, an increase of $46.8 million, compared to $82.2 million for the three months ended March 31, 2016. The increase in expenses was primarily attributable to increases of $37.7 million in Performance Fee Compensation and $6.5 million in Other Operating Expenses. The increase in Performance Fee Compensation was largely due to the increase in Performance Fee Revenue. The increase in Other Operating Expenses was due to an increase in interest, professional fees, other expense allocations to the segment and certain one-time expenses.
Fund Returns
Fund return information for our significant businesses is included throughout this discussion and analysis to facilitate an understanding of our results of operations for the periods presented. The fund returns information reflected in this discussion and analysis is not indicative of the financial performance of The Blackstone Group L.P. and is also not necessarily indicative of the future results of any particular fund. An investment in The Blackstone Group L.P. is not an investment in any of our funds. There can be no assurance that any of our funds or our other existing and future funds will achieve similar returns.
The following table presents combined internal rates of return of the segment’s Performing Credit and Distressed Strategies funds:
| Three Months Ended March 31, |
March 31,
2017 Inception to Date |
|||||||||||||||||||||||
| 2017 | 2016 | |||||||||||||||||||||||
| Composite (a) |
Gross | Net | Gross | Net | Gross | Net | ||||||||||||||||||
| Performing Credit Strategies (b) |
3 | % | 2 | % | 1 | % | — | 15 | % | 9 | % | |||||||||||||
| Distressed Strategies (c) |
3 | % | 2 | % | -3 | % | -4 | % | 12 | % | 7 | % | ||||||||||||
The returns presented herein represent those of the applicable Blackstone Funds and not those of The Blackstone Group L.P.
| (a) | Net returns are based on the change in carrying value (realized and unrealized) after management fees, expenses and performance fee allocations, net of tax advances. |
97
Table of Contents
| (b) | Performing Credit Strategies include mezzanine lending funds, BDCs and other performing credit strategy funds. Performing Credit Strategies’ returns represent the IRR of the combined cash flows of the fee-earning funds exceeding $100 million of fair value at each respective quarter end excluding the Blackstone Funds that were contributed to GSO as part of Blackstone’s acquisition of GSO in March 2008. The inception to date returns are from July 16, 2007. |
| (c) | Distressed Strategies include rescue lending funds, distressed hedge funds and energy strategies. Distressed Strategies’ returns represent the IRR of the combined cash flows of the fee-earning funds exceeding $100 million of fair value at each respective quarter end. The inception to date returns are from August 1, 2005. |
As of March 31, 2017, there was $27.4 billion of Performance Fee eligible assets under management invested in Credit strategies that were above the hurdle necessary to generate Incentive Fees or carried interest. This represented 51% of the total Performance Fee eligible assets at fair value across all Credit strategies.
Liquidity and Capital Resources
General
Blackstone’s business model derives revenue primarily from third party assets under management. Blackstone is not a capital or balance sheet intensive business and targets operating expense levels such that total management and advisory fees exceed total operating expenses each period. As a result, we require limited capital resources to support the working capital or operating needs of our businesses. We draw primarily on the long-term committed capital of our limited partner investors to fund the investment requirements of the Blackstone Funds and use our own realizations and cash flows to invest in growth initiatives, make commitments to our own funds, where our minimum general partner commitments are generally less than 5% of the limited partner commitments of a fund, and pay distributions to unitholders.
Fluctuations in our statement of financial condition result primarily from activities of the Blackstone Funds which are consolidated as well as business transactions, such as the issuance of senior notes described below. The majority economic ownership interests of the Blackstone Funds are reflected as Redeemable Non-Controlling Interests in Consolidated Entities and Non-Controlling Interests in Consolidated Entities in the Condensed Consolidated Financial Statements. The consolidation of these Blackstone Funds has no net effect on the Partnership’s Net Income or Partners’ Capital. Additionally, fluctuations in our statement of financial condition also include appreciation or depreciation in Blackstone investments in the Blackstone Funds, additional investments and redemptions of such interests in the Blackstone Funds and the collection of receivables related to management and advisory fees.
Total assets were $28.3 billion as of March 31, 2017, up $1.9 billion from December 31, 2016.
Total liabilities were $15.2 billion as of March 31, 2017, up $1.3 billion from December 31, 2016. The increase was principally due to an increase in Loans Payable of $930.6 million, primarily due to new CLO vehicles.
For the three months ended March 31, 2017, we had Total Fee Related Revenues of $649.6 million and related expenses of $358.8 million, generating Fee Related Earnings of $290.7 million and Distributable Earnings of $1.2 billion.
Sources and Uses of Liquidity
We have multiple sources of liquidity to meet our capital needs, including annual cash flows, accumulated earnings in the businesses, the proceeds from our issuances of senior notes, liquid investments we hold on our balance sheet for our own use and access to our $1.5 billion committed revolving credit facility. As of March 31, 2017, Blackstone had $2.3 billion in cash and cash equivalents, $2.7 billion invested in corporate treasury investments, $1.9 billion invested in Blackstone Funds and other investments, against $3.4 billion in borrowings from our bond issuances, and no borrowings outstanding under our revolving credit facility.
98
Table of Contents
In addition to the cash we received from our debt offerings and availability under our committed revolving credit facility, we expect to receive (a) cash generated from operating activities, (b) carried interest and incentive income realizations, and (c) realizations on the carry and hedge fund investments that we make. The amounts received from these three sources in particular may vary substantially from year to year and quarter to quarter depending on the frequency and size of realization events or net returns experienced by our investment funds. Our available capital could be adversely affected if there are prolonged periods of few substantial realizations from our investment funds accompanied by substantial capital calls for new investments from those investment funds. Therefore, Blackstone’s commitments to our funds are taken into consideration when managing our overall liquidity and cash position.
We expect that our primary liquidity needs will be cash to (a) provide capital to facilitate the growth of our existing businesses which principally includes funding our general partner and co-investment commitments to our funds, (b) provide capital to facilitate our expansion into new businesses that are complementary, (c) pay operating expenses, including cash compensation to our employees and other obligations as they arise, (d) fund modest capital expenditures, (e) repay borrowings and related interest costs, (f) pay income taxes, and (g) make distributions to our
99
Table of Contents
unitholders and the holders of Blackstone Holdings Partnership Units. Our own capital commitments to our funds, the funds we invest in and our investment strategies as of March 31, 2017 consisted of the following:
| Blackstone and General Partner |
Senior Managing Directors and Certain Other Professionals (a) |
|||||||||||||||
| Fund |
Original Commitment |
Remaining Commitment |
Original Commitment |
Remaining Commitment |
||||||||||||
| (Dollars in Thousands) | ||||||||||||||||
| Private Equity |
||||||||||||||||
| BCP VII |
$ | 500,000 | $ | 456,063 | $ | 225,000 | $ | 205,228 | ||||||||
| BCP VI |
719,718 | 121,989 | 250,000 | 42,374 | ||||||||||||
| BCP V |
629,356 | 39,938 | — | — | ||||||||||||
| BEP I |
50,000 | 4,853 | — | — | ||||||||||||
| BEP II |
80,000 | 54,185 | 26,667 | 18,062 | ||||||||||||
| BCEP |
120,000 | 101,608 | — | — | ||||||||||||
| Tactical Opportunities |
277,677 | 128,296 | 74,826 | 42,765 | ||||||||||||
| Strategic Partners |
346,856 | 267,713 | 58,627 | 46,614 | ||||||||||||
| Other (b) |
236,525 | 28,494 | — | — | ||||||||||||
| Real Estate |
||||||||||||||||
| BREP VIII |
300,000 | 189,508 | 100,000 | 63,169 | ||||||||||||
| BREP VII |
300,000 | 48,588 | 100,000 | 16,196 | ||||||||||||
| BREP VI |
750,000 | 36,809 | 150,000 | 7,362 | ||||||||||||
| BREP Europe III |
100,000 | 13,231 | 35,000 | 4,410 | ||||||||||||
| BREP Europe IV |
130,000 | 26,253 | 43,333 | 8,751 | ||||||||||||
| BREP Europe V |
130,000 | 120,544 | 43,333 | 40,181 | ||||||||||||
| BREP Asia |
50,392 | 30,171 | 16,667 | 9,979 | ||||||||||||
| BREDS II |
50,000 | 26,647 | 16,667 | 8,882 | ||||||||||||
| BREDS III |
50,000 | 45,392 | 16,667 | 15,131 | ||||||||||||
| Other (b) |
149,482 | 38,583 | — | — | ||||||||||||
| Hedge Fund Solutions |
||||||||||||||||
| Strategic Alliance |
50,000 | 2,033 | — | — | ||||||||||||
| Strategic Alliance II |
50,000 | 1,482 | — | — | ||||||||||||
| Strategic Alliance III |
22,000 | 22,000 | — | — | ||||||||||||
| Strategic Holdings LP |
50,000 | 40,182 | — | — | ||||||||||||
| Other (b) |
800 | 270 | — | — | ||||||||||||
| Credit |
||||||||||||||||
| Capital Opportunities Fund II LP |
120,000 | 40,787 | 109,979 | 37,381 | ||||||||||||
| GSO Capital Solutions II |
125,000 | 61,518 | 119,537 | 58,830 | ||||||||||||
| Blackstone/GSO Capital Solutions |
50,000 | 6,552 | 27,666 | 3,625 | ||||||||||||
| BMezz II |
17,692 | 3,085 | — | — | ||||||||||||
| GSO Credit Alpha Fund LP |
52,102 | 20,852 | 50,247 | 20,110 | ||||||||||||
| GSO Euro Senior Debt Fund LP |
63,000 | 52,764 | 56,811 | 47,581 | ||||||||||||
| GSO Energy Select Opportunities Fund |
80,000 | 64,443 | 74,682 | 60,159 | ||||||||||||
| Capital Opportunities Fund III LP |
130,783 | 111,715 | 29,834 | 25,389 | ||||||||||||
| Other (b) |
86,037 | 40,323 | 16,187 | 5,234 | ||||||||||||
| Other |
||||||||||||||||
| Treasury |
145,541 | 136,853 | — | — | ||||||||||||
|
|
|
|
|
|
|
|
|
|||||||||
| Total |
$ | 6,012,961 | $ | 2,383,724 | $ | 1,641,730 | $ | 787,413 | ||||||||
|
|
|
|
|
|
|
|
|
|||||||||
| (a) | For some of the general partner commitments shown in the table above, we require our senior managing directors and certain other professionals to fund a portion of the commitment even though the ultimate obligation to fund the aggregate commitment is ours pursuant to the governing agreements of the respective funds. The amounts of the aggregate applicable general partner original and remaining commitment are shown in the table above. In addition, certain senior managing directors and other professionals are required to fund a |
100
Table of Contents
| de minimis amount of the commitment in the other private equity, real estate and credit-focused carry funds. We expect our commitments to be drawn down over time and to be funded by available cash and cash generated from operations and realizations. Taking into account prevailing market conditions and both the liquidity and cash or liquid investment balances, we believe that the sources of liquidity described above will be more than sufficient to fund our working capital requirements. |
| (b) | Represents capital commitments to a number of other funds in each respective segment. |
As of March 31, 2017, Blackstone Holdings Finance Co. L.L.C. (the “Issuer”), an indirect subsidiary of the Partnership, had issued and outstanding the following senior notes (collectively the “Notes”):
| Senior Notes (a) |
Issue Date | Aggregate Principal Amount (Dollars/Euros in Thousands) |
||||
| 6.625%, Due 8/15/2019 |
8/20/2009 | $ | 600,000 | |||
| 5.875%, Due 3/15/2021 |
9/15/2010 | $ | 400,000 | |||
| 4.750%, Due 2/15/2023 |
8/17/2012 | $ | 400,000 | |||
| 6.250%, Due 8/15/2042 |
8/17/2012 | $ | 250,000 | |||
| 5.000%, Due 6/15/2044 |
4/7/2014 | $ | 500,000 | |||
| 4.450%, Due 7/15/2045 |
4/27/2015 | $ | 350,000 | |||
| 2.000%, Due 5/19/2025 |
5/19/2015 | € | 300,000 | |||
| 1.000%, Due 10/5/2026 |
10/5/2016 | € | 600,000 | |||
| (a) | The Notes are unsecured and unsubordinated obligations of the Issuer and are fully and unconditionally guaranteed, jointly and severally, by The Blackstone Group L.P. and each of the Blackstone Holdings Partnerships. The Notes contain customary covenants and financial restrictions that, among other things, limit the Issuer and the guarantors’ ability, subject to certain exceptions, to incur indebtedness secured by liens on voting stock or profit participating equity interests of their subsidiaries or merge, consolidate or sell, transfer or lease assets. The Notes also contain customary events of default. All or a portion of the Notes may be redeemed at our option, in whole or in part, at any time and from time to time, prior to their stated maturity, at the make-whole redemption price set forth in the Notes. If a change of control repurchase event occurs, the Notes are subject to repurchase at the repurchase price as set forth in the Notes. |
Blackstone, through indirect subsidiaries, has a $1.5 billion unsecured revolving credit facility (the “Credit Facility”) with Citibank, N.A., as Administrative Agent with a maturity date of August 31, 2021. Borrowings may also be made in U.K. sterling, euros, Swiss francs or Japanese yen, in each case subject to certain sub-limits. The Credit Facility contains customary representations, covenants and events of default. Financial covenants consist of a maximum net leverage ratio and a requirement to keep a minimum amount of fee-earning assets under management, each tested quarterly.
In January 2008, the Board of Directors of our general partner, Blackstone Group Management L.L.C., authorized the repurchase of up to $500 million of our common units and Blackstone Holdings Partnership Units. Under this unit repurchase program, units may be repurchased from time to time in open market transactions, in privately negotiated transactions or otherwise. The timing and the actual number of Blackstone common units and Blackstone Holdings Partnership Units repurchased will depend on a variety of factors, including legal requirements, price and economic and market conditions. This unit repurchase program may be suspended or discontinued at any time and does not have a specified expiration date. During the three months ended March 31, 2017, no units were repurchased. As of March 31, 2017, the amount remaining under this program available for repurchases was $335.8 million.
Distributable Earnings, Fee Related Earnings and Economic Net Income
We use Distributable Earnings, which is derived from our segment reported results, as a supplemental non-GAAP measure to assess performance and amounts available for distributions to Blackstone unitholders, including Blackstone personnel and others who are limited partners of the Blackstone Holdings Partnerships. Distributable
101
Table of Contents
Earnings is intended to show the amount of net realized earnings without the effects of the consolidation of the Blackstone Funds. Distributable Earnings is derived from and reconciled to, but not equivalent to, its most directly comparable GAAP measure of Income (Loss) Before Provision for Taxes. Distributable Earnings, which is a component of Economic Net Income, is the sum across all segments of: (a) Total Management, Advisory and Other Fees, Net (b) Interest and Dividend Revenue, (c) Realized Performance Fees, and (d) Realized Investment Income (Loss); less (a) Compensation, excluding the expense of equity-based awards, (b) Realized Performance Fee Compensation, (c) Other Operating Expenses, and (d) Taxes and Related Payables Under the Tax Receivable Agreement.
Effective January 1, 2017, Fee Related Earnings was redefined to exclude all Equity-Based Compensation and Other Revenue. Distributable Earnings was redefined to exclude Other Revenue. All prior periods have been recast to reflect this reclassification. Equity-Based Compensation and Other Revenue both continue to be included in Economic Income and Economic Net Income.
The following table calculates Blackstone’s Fee Related Earnings, Distributable Earnings and Economic Net Income:
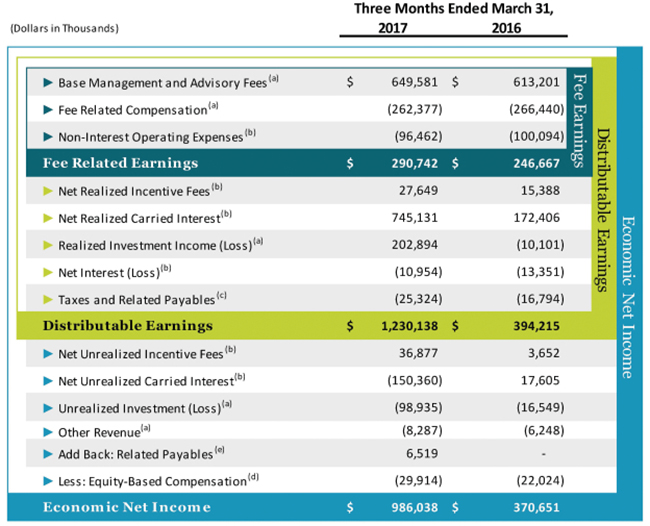
| (a) | Represents the total segment amounts of the respective captions. See Note 18. “Segment Reporting” in the “Notes to Condensed Consolidated Financial Statements” in “Part I. Item 1. Financial Statements” of this filing. |
| (b) | Detail on this amount is included in the table below. |
102
Table of Contents
| (c) | Taxes and Related Payables Including Payable Under Tax Receivable Agreement represents the total GAAP tax provision adjusted to include only the current tax provision (benefit) calculated on Income (Loss) Before Provision for Taxes and the Payable Under Tax Receivable Agreement. |
| (d) | Represents equity-based award expense included in Economic Income, which excludes all transaction-related equity-based charges. |
| (e) | Represents tax-related payables including the Payable Under Tax Receivable Agreement, which is a component of Taxes and Related Payables. |
The following calculates the components of Fee Related Earnings, Distributable Earnings and Economic Net Income in the above table identified by note (b):
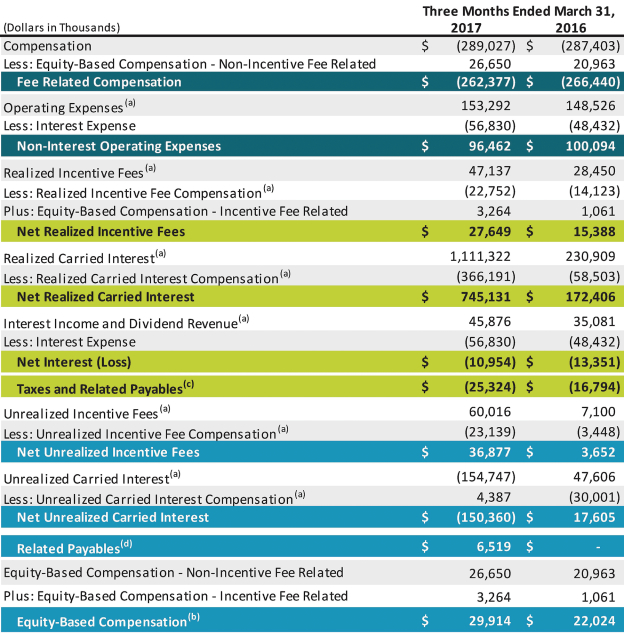
103
Table of Contents
| (a) | Represents the total segment amounts of the respective captions. See Note 18. “Segment Reporting” in the “Notes to Condensed Consolidated Financial Statements” in “Part I. Item 1. Financial Statements” of this filing. |
| (b) | Represents equity-based award expense included in Economic Income, which excludes all transaction-related equity-based charges. |
| (c) | Taxes and Related Payables Including Payable Under Tax Receivable Agreement represents the total GAAP tax provision adjusted to include only the current tax provision (benefit) calculated on Income (Loss) Before Provision for Taxes and the Payable Under Tax Receivable Agreement. |
| (d) | Represents tax-related payables including the Payable Under Tax Receivable Agreement, which is a component of Taxes and Related Payables. |
104
Table of Contents
The following table is a reconciliation of Net Income (Loss) Attributable to The Blackstone Group L.P. to Economic Income, of Economic Income to Economic Net Income, of Economic Net Income to Fee Related Earnings, of Fee Related Earnings to Distributable Earnings and of Distributable Earnings to Adjusted Earnings Before Interest, Taxes and Depreciation and Amortization:
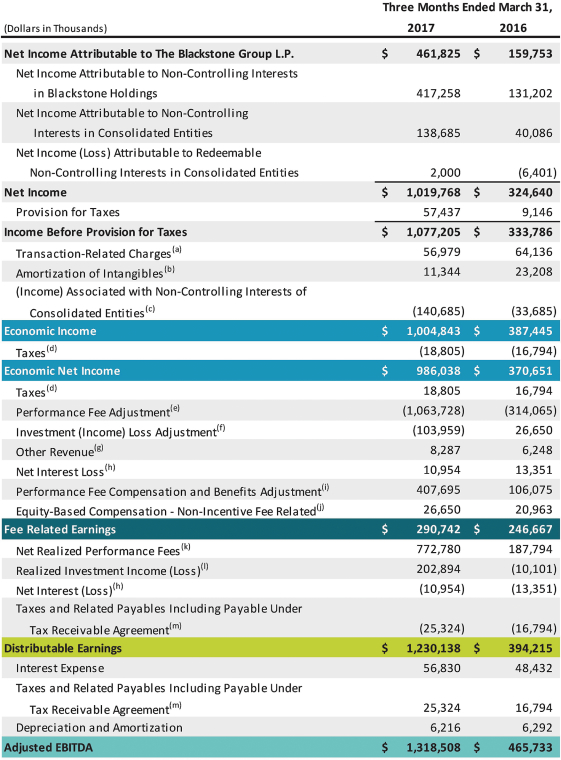
105
Table of Contents
| (a) | This adjustment adds back to Income (Loss) Before Provision (Benefit) for Taxes amounts for Transaction-Related Charges which include principally equity-based compensation charges associated with Blackstone’s IPO and long-term retention programs outside of annual deferred compensation and other corporate actions. |
| (b) | This adjustment adds back to Income (Loss) Before Provision (Benefit) for Taxes amounts for the Amortization of Intangibles which are associated with Blackstone’s IPO and other corporate actions. |
| (c) | This adjustment adds back to Income (Loss) Before Provision (Benefit) for Taxes the amount of (Income) Loss Associated with Non-Controlling Interests of Consolidated Entities and includes the amount of Management Fee Revenues associated with consolidated CLO entities. |
| (d) | Taxes represent the total GAAP tax provision adjusted to include only the current tax provision (benefit) calculated on Income (Loss) Before Provision (Benefit) for Taxes. |
| (e) | This adjustment removes from Economic Income the total segment amount of Performance Fees. |
| (f) | This adjustment removes from Economic Income the total segment amount of Investment Income (Loss). |
| (g) | This adjustment removes from Economic Income the total segment amount of Other Revenue. |
| (h) | This adjustment represents Interest Income and Dividend Revenue less Interest Expense. |
| (i) | This adjustment removes from expenses the compensation and benefit amounts related to Blackstone’s profit sharing plans related to Performance Fees, including Incentive Fee Related equity-based award expense. |
| (j) | Represents Non-Incentive Fee Related equity-based award expense and excludes all transaction-related equity-based charges. |
| (k) | Represents the adjustment for realized Performance Fees net of corresponding actual amounts due under Blackstone’s profit sharing plans related thereto. Equals the sum of Net Realized Incentive Fees and Net Realized Carried Interest. |
| (l) | Represents the adjustment for Blackstone’s Realized Investment Income (Loss). |
| (m) | Taxes and Related Payables Including Payable Under Tax Receivable Agreement represent the total GAAP tax provision adjusted to include only the current tax provision (benefit) calculated on Income (Loss) Before Provision (Benefit) for Taxes and the Payable Under Tax Receivable Agreement. |
Distributions
Distributable Earnings, which is derived from Blackstone’s segment reported results, is a supplemental measure to assess performance and amounts available for distributions to Blackstone unitholders, including Blackstone personnel and others who are limited partners of the Blackstone Holdings Partnerships. Distributable Earnings is intended to show the amount of net realized earnings without the effects of the consolidation of the Blackstone Funds. Distributable Earnings, which is a component of Economic Net Income, is the sum across all segments of: (a) Total Management and Advisory Fees, (b) Interest and Dividend Revenue, (c) Other Revenue, (d) Realized Performance Fees, and (e) Realized Investment Income (Loss); less (a) Compensation, excluding the expense of equity-based awards, (b) Realized Performance Fee Compensation, (c) Other Operating Expenses, and (d) Taxes and Related Payables Including the Payable Under Tax Receivable Agreement.
Our intention is to distribute quarterly to common unitholders approximately 85% of The Blackstone Group L.P.’s share of Distributable Earnings, subject to adjustment by amounts determined by Blackstone’s general partner to be necessary or appropriate to provide for the conduct of its business, to make appropriate investments in its business and funds, to comply with applicable law, any of its debt instruments or other agreements, or to provide for future cash requirements such as tax-related payments, clawback obligations and distributions to unitholders for any ensuing quarter. The amount to be distributed could also be adjusted upward in any one quarter.
All of the foregoing is subject to the qualification that the declaration and payment of any distributions are at the sole discretion of our general partner and our general partner may change our distribution policy at any time, including, without limitation, to reduce the quarterly distribution payable to our common unitholders or even to eliminate such distributions entirely.
106
Table of Contents
Because the subsidiaries of The Blackstone Group L.P. must pay taxes and make payments under the tax receivable agreements, the amounts ultimately distributed by The Blackstone Group L.P. to its common unitholders in respect of each fiscal year are generally expected to be less, on a per unit basis, than the amounts distributed by the Blackstone Holdings Partnerships to the Blackstone personnel and others who are limited partners of the Blackstone Holdings Partnerships in respect of their Blackstone Holdings Partnership Units.
The following graph shows fiscal quarterly and annual per common unitholder distributions for 2016 and 2017. Distributions are declared and paid in the quarter subsequent to the quarter in which they are earned.
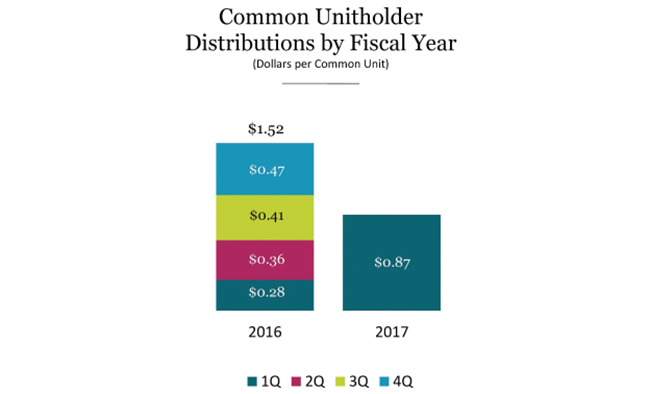
With respect to the first quarter of fiscal year 2017, we have paid to common unitholders a distribution of $0.87 per common unit. With respect to fiscal year 2016, we paid common unitholders aggregate distributions of $1.52 per common unit.
Leverage
We may under certain circumstances use leverage opportunistically and over time to create the most efficient capital structure for Blackstone and our public common unitholders. In addition to the borrowings from our bond issuances and our revolving credit facility, we may use reverse repurchase agreements, repurchase agreements and securities sold, not yet purchased. All of these positions are held in a separately managed portfolio. Reverse repurchase agreements are entered into primarily to take advantage of opportunistic yields otherwise absent in the overnight markets and also to use the collateral received to cover securities sold, not yet purchased. Repurchase agreements are entered into primarily to opportunistically yield higher spreads on purchased securities. The balances held in these financial instruments fluctuate based on Blackstone’s liquidity needs, market conditions and investment risk profiles.
Generally our funds in our private equity segment, our opportunistic real estate funds, funds of hedge funds and certain credit-focused funds have not utilized substantial leverage at the fund level other than for (a) short-term
107
Table of Contents
borrowings between the date of an investment and the receipt of capital from the investing fund’s investors, and (b) long-term borrowings for certain investments in aggregate amounts which are generally 1% to 25% of the capital commitments of the respective fund. Our carry funds make direct or indirect investments in companies that utilize leverage in their capital structure. The degree of leverage employed varies among portfolio companies.
Certain of our Real Estate debt hedge funds, Hedge Fund Solutions funds and credit-focused funds use leverage in order to obtain additional market exposure, enhance returns on invested capital and/or to bridge short-term cash needs. The forms of leverage primarily employed by these funds include purchasing securities on margin, utilizing collateralized financing and using derivative instruments.
The following table presents information regarding these financial instruments in our Condensed Consolidated Statements of Financial Condition:
| Reverse Repurchase Agreements |
Repurchase Agreements |
Securities Sold, Not Yet Purchased |
||||||||||
| (Dollars in Millions) | ||||||||||||
| Balance, March 31, 2017 |
$ | 44.6 | $ | 94.6 | $ | 178.4 | ||||||
| Balance, December 31, 2016 |
$ | 118.5 | $ | 75.3 | $ | 215.4 | ||||||
| Three Months Ended March 31, 2017 |
||||||||||||
| Average Daily Balance |
$ | 92.4 | $ | 120.5 | $ | 231.1 | ||||||
| Maximum Daily Balance |
$ | 118.5 | $ | 152.7 | $ | 262.1 | ||||||
108
Table of Contents
Contractual Obligations, Commitments and Contingencies
The following table sets forth information relating to our contractual obligations as of March 31, 2017 on a consolidated basis and on a basis deconsolidating the Blackstone Funds:
| Contractual Obligations |
April 1, 2017 to December 31, 2017 |
2018-2019 | 2020-2021 | Thereafter | Total | |||||||||||||||
| (Dollars in Thousands) | ||||||||||||||||||||
| Operating Lease Obligations (a) |
$ | 56,635 | $ | 139,271 | $ | 138,549 | $ | 414,494 | $ | 748,949 | ||||||||||
| Purchase Obligations |
20,987 | 18,597 | 1,973 | — | 41,557 | |||||||||||||||
| Blackstone Issued Notes and Revolving Credit Facility (b) |
— | 585,000 | 400,000 | 2,458,680 | 3,443,680 | |||||||||||||||
| Interest on Blackstone Issued Notes and Revolving Credit Facility (c) |
94,015 | 300,478 | 211,214 | 1,350,446 | 1,956,153 | |||||||||||||||
| Blackstone Funds and CLO Vehicles Debt Obligations Payable (d) |
322,365 | — | — | 6,132,643 | 6,455,008 | |||||||||||||||
| Interest on Blackstone Funds and CLO Vehicles Debt Obligations Payable (e) |
87,528 | 227,532 | 227,532 | 795,222 | 1,337,814 | |||||||||||||||
| Blackstone Funds Capital Commitments to Investee Funds (f) |
359,032 | — | — | — | 359,032 | |||||||||||||||
| Due to Certain Non-Controlling Interest Holders in Connection with Tax Receivable Agreements (g) |
— | 177,834 | 173,951 | 816,135 | 1,167,920 | |||||||||||||||
| Unrecognized Tax Benefits, Including Interest and Penalties (h) |
6,367 | — | — | — | 6,367 | |||||||||||||||
| Blackstone Operating Entities Capital Commitments to Blackstone Funds and Other (i) |
2,383,724 | — | — | — | 2,383,724 | |||||||||||||||
|
|
|
|
|
|
|
|
|
|
|
|||||||||||
| Consolidated Contractual Obligations |
3,330,653 | 1,448,712 | 1,153,219 | 11,967,620 | 17,900,204 | |||||||||||||||
| Blackstone Funds and CLO Vehicles Debt Obligations Payable (d) |
(322,365 | ) | — | — | (6,132,643 | ) | (6,455,008 | ) | ||||||||||||
| Interest on Blackstone Funds and CLO Vehicles Debt Obligations Payable (e) |
(87,528 | ) | (227,532 | ) | (227,532 | ) | (795,222 | ) | (1,337,814 | ) | ||||||||||
| Blackstone Funds Capital Commitments to Investee Funds (f) |
(359,032 | ) | — | — | — | (359,032 | ) | |||||||||||||
|
|
|
|
|
|
|
|
|
|
|
|||||||||||
| Blackstone Operating Entities Contractual Obligations |
$ | 2,561,728 | $ | 1,221,180 | $ | 925,687 | $ | 5,039,755 | $ | 9,748,350 | ||||||||||
|
|
|
|
|
|
|
|
|
|
|
|||||||||||
| (a) | We lease our primary office space and certain office equipment under agreements that expire through 2030. In connection with certain office space lease agreements, we are responsible for escalation payments. The contractual obligation table above includes only guaranteed minimum lease payments for such leases and does not project potential escalation or other lease-related payments. These leases are classified as operating leases for financial statement purposes and as such are not recorded as liabilities on the Condensed Consolidated Statements of Financial Condition. The amounts are presented net of contractual sublease commitments. |
| (b) | Represents the principal amount due on the senior notes we issued. As of March 31, 2017, we had no outstanding borrowings under our revolver. |
| (c) | Represents interest to be paid over the maturity of our senior notes and borrowings under our revolving credit facility which has been calculated assuming no pre-payments are made and debt is held until its final maturity date. These amounts exclude commitment fees for unutilized borrowings under our revolver. |
| (d) | These obligations are those of the Blackstone Funds including the consolidated CLO vehicles. |
| (e) | Represents interest to be paid over the maturity of the related consolidated Blackstone Funds’ and CLO vehicles’ debt obligations which has been calculated assuming no pre-payments will be made and debt will be |
109
Table of Contents
| held until its final maturity date. The future interest payments are calculated using variable rates in effect as of March 31, 2017, at spreads to market rates pursuant to the financing agreements, and range from 0.7% to 9.4%. The majority of the borrowings are due on demand and for purposes of this schedule are assumed to mature within one year. Interest on the majority of these borrowings rolls over into the principal balance at each reset date. |
| (f) | These obligations represent commitments of the consolidated Blackstone Funds to make capital contributions to investee funds and portfolio companies. These amounts are generally due on demand and are therefore presented in the less than one year category. |
| (g) | Represents obligations by the Partnership’s corporate subsidiary to make payments under the Tax Receivable Agreements to certain non-controlling interest holders for the tax savings realized from the taxable purchases of their interests in connection with the reorganization at the time of Blackstone’s IPO in 2007 and subsequent purchases. The obligation represents the amount of the payments currently expected to be made, which are dependent on the tax savings actually realized as determined annually without discounting for the timing of the payments. As required by GAAP, the amount of the obligation included in the Condensed Consolidated Financial Statements and shown in Note 16. “Related Party Transactions” (see “Part I. Item 1. Financial Statements”) differs to reflect the net present value of the payments due to certain non-controlling interest holders. |
| (h) | The total represents gross unrecognized tax benefits of $3.4 million and interest and penalties of $3.0 million. In addition, Blackstone is not able to make a reasonably reliable estimate of the timing of payments in individual years in connection with gross unrecognized benefits of $0.3 million and interest of $0.4 million; therefore, such amounts are not included in the above contractual obligations table. |
| (i) | These obligations represent commitments by us to provide general partner capital funding to the Blackstone Funds, limited partner capital funding to other funds and Blackstone principal investment commitments. These amounts are generally due on demand and are therefore presented in the less than one year category; however, a substantial amount of the capital commitments are expected to be called over the next three years. We expect to continue to make these general partner capital commitments as we raise additional amounts for our investment funds over time. |
Guarantees
Blackstone and certain of its consolidated funds provide financial guarantees. The amounts and nature of these guarantees are described in Note 17. “Commitments and Contingencies — Contingencies — Guarantees” in the “Notes to Condensed Consolidated Financial Statements” in “Part I. Item 1. Financial Statements” of this filing.
Indemnifications
In many of its service contracts, Blackstone agrees to indemnify the third party service provider under certain circumstances. The terms of the indemnities vary from contract to contract and the amount of indemnification liability, if any, cannot be determined and has not been included in the table above or recorded in our Condensed Consolidated Financial Statements as of March 31, 2017.
Clawback Obligations
Carried Interest is subject to clawback to the extent that the Carried Interest received to date with respect to a fund exceeds the amount due to Blackstone based on cumulative results of that fund. The actual clawback liability, however, generally does not become realized until the end of a fund’s life except for certain Blackstone real estate funds, multi-asset class investment funds and credit-focused funds, which may have an interim clawback liability. The lives of the carry funds, including available contemplated extensions, for which a liability for potential clawback obligations has been recorded for financial reporting purposes, are currently anticipated to expire at various points through 2028. Further extensions of such terms may be implemented under given circumstances.
110
Table of Contents
For financial reporting purposes, when applicable, the general partners record a liability for potential clawback obligations to the limited partners of some of the carry funds due to changes in the unrealized value of a fund’s remaining investments and where the fund’s general partner has previously received Carried Interest distributions with respect to such fund’s realized investments.
As of March 31, 2017, the total clawback obligations were $2.2 million, of which $1.1 million related to Blackstone Holdings and $1.1 million related to current and former Blackstone personnel. If, at March 31, 2017, all of the investments held by our carry funds were deemed worthless, a possibility that management views as remote, the amount of Carried Interest subject to potential clawback would be $5.4 billion, on an after tax basis where applicable, of which Blackstone Holdings is potentially liable for $4.9 billion if current and former Blackstone personnel default on their share of the liability, a possibility that management also views as remote. (See Note 16. “Related Party Transactions” and Note 17. “Commitments and Contingencies” in the “Notes to Condensed Consolidated Financial Statements” in “Part I. Item 1. Financial Statements” of this filing.)
Critical Accounting Policies
We prepare our Condensed Consolidated Financial Statements in accordance with GAAP. In applying many of these accounting principles, we need to make assumptions, estimates and/or judgments that affect the reported amounts of assets, liabilities, revenues and expenses in our condensed consolidated financial statements. We base our estimates and judgments on historical experience and other assumptions that we believe are reasonable under the circumstances. These assumptions, estimates and/or judgments, however, are often subjective. Actual results may be affected negatively based on changing circumstances. If actual amounts are ultimately different from our estimates, the revisions are included in our results of operations for the period in which the actual amounts become known. We believe the following critical accounting policies could potentially produce materially different results if we were to change underlying assumptions, estimates and/or judgments. (See Note 2. “Summary of Significant Accounting Policies” in the “Notes to Condensed Consolidated Financial Statements” in “Part I. Item 1. Financial Statements” of this filing.)
Consolidation
The Partnership consolidates all entities that it controls through a majority voting interest or otherwise, including those Blackstone Funds in which the general partner has a controlling financial interest. The Partnership has a controlling interest in Blackstone Holdings because the limited partners do not have the right to dissolve the partnerships or have substantive kick out rights or participating rights that would overcome the presumption of control by the Partnership. Accordingly, the Partnership consolidates Blackstone Holdings and records non-controlling interests to reflect the economic interests of the limited partners of Blackstone Holdings.
In addition, the Partnership consolidates all variable interest entities (“VIE”) in which it is the primary beneficiary. An enterprise is determined to be the primary beneficiary if it holds a controlling financial interest. A controlling financial interest is defined as (a) the power to direct the activities of a VIE that most significantly impact the entity’s economic performance and (b) the obligation to absorb losses of the entity or the right to receive benefits from the entity that could potentially be significant to the VIE. The consolidation guidance requires an analysis to determine (a) whether an entity in which the Partnership holds a variable interest is a VIE and (b) whether the Partnership’s involvement, through holding interests directly or indirectly in the entity or contractually through other variable interests (for example, management and performance related fees), would give it a controlling financial interest. Performance of that analysis requires the exercise of judgment.
The Partnership determines whether it is the primary beneficiary of a VIE at the time it becomes involved with a variable interest entity and reconsiders that conclusion continually. In evaluating whether the Partnership is the primary beneficiary, Blackstone evaluates its economic interests in the entity held either directly or indirectly by the Partnership. The consolidation analysis can generally be performed qualitatively; however, if it is not readily apparent that the Partnership is not the primary beneficiary, a quantitative analysis may also be performed.
111
Table of Contents
Investments and redemptions (either by the Partnership, affiliates of the Partnership or third parties) or amendments to the governing documents of the respective Blackstone Funds could affect an entity’s status as a VIE or the determination of the primary beneficiary. At each reporting date, the Partnership assesses whether it is the primary beneficiary and will consolidate or deconsolidate accordingly.
Assets of consolidated VIEs that can only be used to settle obligations of the consolidated VIE and liabilities of a consolidated VIE for which creditors (or beneficial interest holders) do not have recourse to the general credit of Blackstone are presented in a separate section in the Condensed Consolidated Statements of Financial Condition.
Revenue Recognition
Revenues primarily consist of management and advisory fees, performance fees, investment income, interest and dividend revenue and other. Please refer to “Part I. Item 1. Business — Incentive Arrangements / Fee Structure” in our Annual Report on Form 10-K for the year ended December 31, 2016 for additional information regarding the manner in which Base Management Fees and Performance Fees are generated.
Management and Advisory Fees, Net — Management and Advisory Fees, Net are comprised of management fees, including base management fees, transaction and other fees and advisory fees net of management fee reductions and offsets.
The Partnership earns base management fees from limited partners of funds in each of its managed funds, at a fixed percentage of assets under management, net asset value, total assets, committed capital or invested capital, or in some cases, a fixed fee. Base management fees are recognized based on contractual terms specified in the underlying investment advisory agreements. The range of management fee rates and the calculation base from which they are earned, generally, are as follows:
On private equity, real estate, and certain of our hedge fund solutions and credit-focused funds:
| • | 0.25% to 2.00% of committed capital or invested capital during the investment period, |
| • | 0.50% to 1.75% of invested capital or investment fair value subsequent to the investment period for private equity and real estate funds, and |
| • | 1.00% to 1.50% of invested capital or net asset value subsequent to the investment period for certain credit-focused funds. |
On real estate and credit-focused funds structured like hedge funds:
| • | 0.50% to 1.50% of net asset value. |
On credit-focused separately managed accounts:
| • | 0.35% to 1.50% of net asset value. |
On real estate separately managed accounts:
| • | 0.50% to 2.00% of invested capital, net operating income or net asset value. |
On funds of hedge funds and separately managed accounts invested in hedge funds:
| • | 0.50% to 1.25% of net asset value. |
On CLO vehicles:
| • | 0.40% to 0.65% of the aggregate par amount of collateral assets, including principal cash. |
112
Table of Contents
On credit-focused registered and non-registered investment companies:
| • | 0.35% to 1.50% of total assets or net asset value. |
The investment adviser of BXMT receives annual management fees based upon 1.50% of BXMT’s net proceeds received from equity offerings and accumulated “core earnings” (which is generally equal to its GAAP net income excluding certain non-cash and other items), subject to certain adjustments. The investment adviser of our non-exchange traded REIT receives a management fee of 1.25% per annum of net asset value, payable monthly.
Transaction and other fees (including monitoring fees) are fees charged directly to managed funds and portfolio companies. The investment advisory agreements generally require that the investment adviser reduce the amount of management fees payable by the limited partners to the Partnership (“management fee reductions”) by an amount equal to a portion of the transaction and other fees directly paid to the Partnership by the portfolio companies. The amount of the reduction varies by fund, the type of fee paid by the portfolio company and the previously incurred expenses of the fund.
Management fee offsets are reductions to management fees payable by the limited partners of the Blackstone Funds, which are granted based on the amount such limited partners reimburse the Blackstone Funds for placement fees.
Advisory fees consist of transaction-based fee arrangements. Transaction-based fees are recognized when (a) there is evidence of an arrangement with a client, (b) agreed upon services have been provided, (c) fees are fixed or determinable, and (d) collection is reasonably assured.
Accrued but unpaid Management and Advisory Fees, net of management fee reductions and management fee offsets, as of the reporting date are included in Accounts Receivable or Due from Affiliates in the Condensed Consolidated Statements of Financial Condition. Management fees paid by limited partners to the Blackstone Funds and passed on to Blackstone are not considered affiliate revenues.
Performance Fees — Performance Fees earned on the performance of Blackstone’s hedge fund structures (“Incentive Fees”) are recognized based on fund performance during the period, subject to the achievement of minimum return levels, or high water marks, in accordance with the respective terms set out in each hedge fund’s governing agreements. Accrued but unpaid Incentive Fees charged directly to investors in Blackstone’s offshore hedge funds as of the reporting date are recorded within Due from Affiliates in the Condensed Consolidated Statements of Financial Condition. Accrued but unpaid Incentive Fees on onshore funds as of the reporting date are reflected in Investments in the Condensed Consolidated Statements of Financial Condition. Incentive Fees are realized at the end of a measurement period, typically annually. Once realized, such fees are not subject to clawback or reversal.
In certain fund structures, specifically in private equity, real estate and certain hedge fund solutions and credit-focused funds (“carry funds”), performance fees (“Carried Interest”) are allocated to the general partner based on cumulative fund performance to date, subject to a preferred return to limited partners. At the end of each reporting period, the Partnership calculates the Carried Interest that would be due to the Partnership for each fund, pursuant to the fund agreements, as if the fair value of the underlying investments were realized as of such date, irrespective of whether such amounts have been realized. As the fair value of underlying investments varies between reporting periods, it is necessary to make adjustments to amounts recorded as Carried Interest to reflect either (a) positive performance resulting in an increase in the Carried Interest allocated to the general partner or (b) negative performance that would cause the amount due to the Partnership to be less than the amount previously recognized as revenue, resulting in a negative adjustment to Carried Interest allocated to the general partner. In each scenario, it is necessary to calculate the Carried Interest on cumulative results compared to the Carried Interest recorded to date and make the required positive or negative adjustments. The Partnership ceases to record negative Carried Interest allocations once previously recognized Carried Interest allocations for such fund have been fully reversed. The
113
Table of Contents
Partnership is not obligated to pay guaranteed returns or hurdles, and therefore, cannot have negative Carried Interest over the life of a fund. Accrued but unpaid Carried Interest as of the reporting date is reflected in Investments in the Condensed Consolidated Statements of Financial Condition.
Carried Interest is realized when an underlying investment is profitably disposed of and the fund’s cumulative returns are in excess of the preferred return or, in limited instances, after certain thresholds for return of capital are met. Carried Interest is subject to clawback to the extent that the Carried Interest received to date exceeds the amount due to Blackstone based on cumulative results. As such, the accrual for potential repayment of previously received Carried Interest, which is a component of Due to Affiliates, represents all amounts previously distributed to Blackstone Holdings and non-controlling interest holders that would need to be repaid to the Blackstone carry funds if the Blackstone carry funds were to be liquidated based on the current fair value of the underlying funds’ investments as of the reporting date. The actual clawback liability, however, generally does not become realized until the end of a fund’s life except for certain funds, including certain Blackstone real estate funds, multi-asset class investment funds and credit-focused funds, which may have an interim clawback liability.
Investment Income (Loss) — Investment Income (Loss) represents the unrealized and realized gains and losses on the Partnership’s principal investments, including its investments in Blackstone Funds that are not consolidated, its equity method investments and other principal investments. Investment Income (Loss) is realized when the Partnership redeems all or a portion of its investment or when the Partnership receives cash income, such as dividends or distributions. Unrealized Investment Income (Loss) results from changes in the fair value of the underlying investment as well as the reversal of unrealized gain (loss) at the time an investment is realized.
Interest and Dividend Revenue — Interest and Dividend Revenue comprises primarily interest and dividend income earned on principal investments held by Blackstone.
Other Revenue — Other Revenue consists of miscellaneous income and foreign exchange gains and losses arising on transactions denominated in currencies other than U.S. dollars.
Expenses
Our expenses include compensation and benefits expense and general and administrative expenses. Our accounting policies related thereto are as follows:
Compensation and Benefits — Compensation — Compensation and Benefits consists of (a) employee compensation, comprising salary and bonus, and benefits paid and payable to employees and senior managing directors and (b) equity-based compensation associated with the grants of equity-based awards to employees and senior managing directors. Compensation cost relating to the issuance of equity-based awards to senior managing directors and employees is measured at fair value at the grant date, taking into consideration expected forfeitures, and expensed over the vesting period on a straight-line basis, except in the case of (a) equity-based awards that do not require future service, which are expensed immediately and (b) certain awards to recipients that meet specified criteria making them eligible for retirement treatment (allowing such recipient to keep a percentage of those awards upon departure from Blackstone after becoming eligible for retirement), for which the expense for the portion of the award that would be retained in the event of retirement is either expensed immediately or amortized to the retirement date. Cash settled equity-based awards are classified as liabilities and are remeasured at the end of each reporting period.
Compensation and Benefits — Performance Fee — Performance Fee Compensation consists of Carried Interest (which may be distributed in cash or in kind) and Incentive Fee allocations, and may in future periods also include allocations of investment income from Blackstone’s firm investments, to employees and senior managing directors participating in certain profit sharing initiatives. Such compensation expense is subject to both positive and negative adjustments. Unlike Carried Interest and Incentive Fees, compensation expense is based on the performance of individual investments held by a fund rather than on a fund by fund basis. Compensation received from advisory clients in the form of securities of such clients may also be allocated to employees and senior managing directors.
114
Table of Contents
Fair Value of Financial Instruments
GAAP establishes a hierarchical disclosure framework which prioritizes and ranks the level of market price observability used in measuring financial instruments at fair value. Market price observability is affected by a number of factors, including the type of financial instrument, the characteristics specific to the financial instrument and the state of the marketplace, including the existence and transparency of transactions between market participants. Financial instruments with readily available quoted prices in active markets generally will have a higher degree of market price observability and a lesser degree of judgment used in measuring fair value.
Financial instruments measured and reported at fair value are classified and disclosed based on the observability of inputs used in the determination of fair values, as follows:
| • | Level I — Quoted prices are available in active markets for identical financial instruments as of the reporting date. The types of financial instruments in Level I include listed equities, listed derivatives and mutual funds with quoted prices. The Partnership does not adjust the quoted price for these investments, even in situations where Blackstone holds a large position and a sale could reasonably impact the quoted price. |
| • | Level II — Pricing inputs are other than quoted prices in active markets, which are either directly or indirectly observable as of the reporting date, and fair value is determined through the use of models or other valuation methodologies. Financial instruments which are generally included in this category include corporate bonds and loans, including corporate bonds and loans held within CLO vehicles, government and agency securities, less liquid and restricted equity securities, and certain over-the-counter derivatives where the fair value is based on observable inputs. Senior and subordinated notes issued by CLO vehicles are classified within Level II of the fair value hierarchy. |
| • | Level III — Pricing inputs are unobservable for the financial instruments and includes situations where there is little, if any, market activity for the financial instrument. The inputs into the determination of fair value require significant management judgment or estimation. Financial instruments that are included in this category generally include general and limited partnership interests in private equity and real estate funds, credit-focused funds, distressed debt and non-investment grade residual interests in securitizations, certain corporate bonds and loans held within CLO vehicles, and certain over-the-counter derivatives where the fair value is based on unobservable inputs. |
In certain cases, the inputs used to measure fair value may fall into different levels of the fair value hierarchy. In such cases, the determination of which category within the fair value hierarchy is appropriate for any given financial instrument is based on the lowest level of input that is significant to the fair value measurement. The Partnership’s assessment of the significance of a particular input to the fair value measurement in its entirety requires judgment and considers factors specific to the financial instrument.
Transfers between levels of the fair value hierarchy are recognized at the beginning of the reporting period.
Level II Valuation Techniques
Financial instruments classified within Level II of the fair value hierarchy comprise debt instruments, including certain corporate loans and bonds held by Blackstone’s consolidated CLO vehicles and debt securities sold, not yet purchased. Certain equity securities and derivative instruments valued using observable inputs are also classified as Level II.
The valuation techniques used to value financial instruments classified within Level II of the fair value hierarchy are as follows:
| • | Debt Instruments and Equity Securities are valued on the basis of prices from an orderly transaction between market participants provided by reputable dealers or pricing services. In determining the value of |
115
Table of Contents
| a particular investment, pricing services may use certain information with respect to transactions in such investments, quotations from dealers, pricing matrices and market transactions in comparable investments and various relationships between investments. The valuation of certain equity securities is based on an observable price for an identical security adjusted for the effect of a restriction. |
| • | Freestanding Derivatives are valued using contractual cash flows and observable inputs comprising yield curves, foreign currency rates and credit spreads. |
| • | Senior and subordinate notes issued by CLO vehicles are classified based on the more observable fair value of CLO assets less (a) the fair value of any beneficial interests held by Blackstone, and (b) the carrying value of any beneficial interests that represent compensation for services. |
Level III Valuation Techniques
In the absence of observable market prices, Blackstone values its investments using valuation methodologies applied on a consistent basis. For some investments little market activity may exist; management’s determination of fair value is then based on the best information available in the circumstances, and may incorporate management’s own assumptions and involves a significant degree of judgment, taking into consideration a combination of internal and external factors, including the appropriate risk adjustments for non-performance and liquidity risks. Investments for which market prices are not observable include private investments in the equity of operating companies, real estate properties, certain funds of hedge funds and credit-focused investments.
Private Equity Investments — The fair values of private equity investments are determined by reference to projected net earnings, earnings before interest, taxes, depreciation and amortization (“EBITDA”), the discounted cash flow method, public market or private transactions, valuations for comparable companies and other measures which, in many cases, are based on unaudited information at the time received. Valuations may be derived by reference to observable valuation measures for comparable companies or transactions (for example, multiplying a key performance metric of the investee company, such as EBITDA, by a relevant valuation multiple observed in the range of comparable companies or transactions), adjusted by management for differences between the investment and the referenced comparables, and in some instances by reference to option pricing models or other similar methods. Where a discounted cash flow method is used, a terminal value is derived by reference to EBITDA or price/earnings exit multiples.
Real Estate Investments — The fair values of real estate investments are determined by considering projected operating cash flows, sales of comparable assets, if any, and replacement costs, among other measures. The methods used to estimate the fair value of real estate investments include the discounted cash flow method and/or capitalization rates (“cap rates”) analysis. Valuations may be derived by reference to observable valuation measures for comparable companies or assets (for example, multiplying a key performance metric of the investee company or asset, such as EBITDA, by a relevant valuation multiple observed in the range of comparable companies or transactions), adjusted by management for differences between the investment and the referenced comparables, and in some instances by reference to option pricing models or other similar methods. Where a discounted cash flow method is used, a terminal value is derived by reference to an exit EBITDA multiple or capitalization rate. Additionally, where applicable, projected distributable cash flow through debt maturity will be considered in support of the investment’s fair value.
Credit-Focused Investments — The fair values of credit-focused investments are generally determined on the basis of prices between market participants provided by reputable dealers or pricing services. For credit-focused investments that are not publicly traded or whose market prices are not readily available, Blackstone may utilize other valuation techniques, including the discounted cash flow method or a market approach. The discounted cash flow method projects the expected cash flows of the debt instrument based on contractual terms, and discounts such cash flows back to the valuation date using a market-based yield. The market-based yield is estimated using yields of publicly traded debt instruments issued by companies operating in similar industries as the subject investment, with similar leverage statistics and time to maturity.
116
Table of Contents
The market approach is generally used to determine the enterprise value of the issuer of a credit investment, and considers valuation multiples of comparable companies or transactions. The resulting enterprise value will dictate whether or not such credit investment has adequate enterprise value coverage. In cases of distressed credit instruments, the market approach may be used to estimate a recovery value in the event of a restructuring.
Level III Valuation Process
Investments classified within Level III of the fair value hierarchy are valued on a quarterly basis, taking into consideration factors including any changes in Blackstone’s weighted-average cost of capital assumptions, discounted cash flow projections and exit multiple assumptions, as well as any changes in economic and other relevant conditions, and valuation models are updated accordingly. The valuation process also includes a review by an independent valuation party, at least annually for all investments, and quarterly for certain investments, to corroborate the values determined by management. The valuations of Blackstone’s investments are reviewed quarterly by a valuation committee chaired by Blackstone’s Vice Chairman and includes senior heads of each of Blackstone’s businesses, as well as representatives of legal and finance. Each quarter, the valuations of Blackstone’s investments are also reviewed by the Audit Committee in a meeting attended by the chairman of the valuation committee. The valuations are further tested by comparison to actual sales prices obtained on disposition of the investments.
Investments, at Fair Value
The Blackstone Funds are accounted for as investment companies under the American Institute of Certified Public Accountants Accounting and Auditing Guide, Investment Companies, and reflect their investments, including majority-owned and controlled investments (the “Portfolio Companies”), at fair value. Such consolidated funds’ investments are reflected in Investments on the Condensed Consolidated Statements of Financial Condition at fair value, with unrealized gains and losses resulting from changes in fair value reflected as a component of Net Gains (Losses) from Fund Investment Activities in the Condensed Consolidated Statements of Operations. Fair value is the amount that would be received to sell an asset or paid to transfer a liability, in an orderly transaction between market participants at the measurement date, at current market conditions (i.e., the exit price).
Blackstone’s principal investments are presented at fair value with unrealized appreciation or depreciation and realized gains and losses recognized in the Condensed Consolidated Statements of Operations within Investment Income (Loss).
For certain instruments, the Partnership has elected the fair value option. Such election is irrevocable and is applied on an investment by investment basis at initial recognition. The Partnership has applied the fair value option for certain loans and receivables and certain investments in private debt securities that otherwise would not have been carried at fair value with gains and losses recorded in net income. Accounting for these financial instruments at fair value is consistent with how the Partnership accounts for its other principal investments. Loans extended to third parties are recorded within Accounts Receivable within the Condensed Consolidated Statements of Financial Condition. Debt securities for which the fair value option has been elected are recorded within Investments. The methodology for measuring the fair value of such investments is consistent with the methodology applied to private equity, real estate, credit-focused and funds of hedge funds investments. Changes in the fair value of such instruments are recognized in Investment Income (Loss) in the Condensed Consolidated Statements of Operations. Interest income on interest bearing loans and receivables and debt securities on which the fair value option has been elected is based on stated coupon rates adjusted for the accretion of purchase discounts and the amortization of purchase premiums. This interest income is recorded within Interest and Dividend Revenue.
In addition, the Partnership has elected the fair value option for the assets and liabilities of CLO vehicles that are consolidated as of January 1, 2010, as a result of the initial adoption of variable interest entity consolidation guidance. The Partnership has also elected the fair value option for CLO vehicles consolidated as a result of the acquisitions of CLO management contracts or the acquisition of the share capital of CLO managers. Historically, the
117
Table of Contents
adjustment resulting from the difference between the fair value of assets and liabilities for each of these events was presented as a transition and acquisition adjustment to Appropriated Partners’ Capital. Assets of the consolidated CLOs are presented within Investments within the Condensed Consolidated Statements of Financial Condition and Liabilities within Loans Payable for the amounts due to unaffiliated third parties and Due to Affiliates for the amounts held by non-consolidated affiliates. Changes in the fair value of consolidated CLO assets and liabilities and related interest, dividend and other income subsequent to adoption and acquisition are presented within Net Gains (Losses) from Fund Investment Activities. Expenses of consolidated CLO vehicles are presented in Fund Expenses. Historically, amounts attributable to Non-Controlling Interests in Consolidated Entities had a corresponding adjustment to Appropriated Partners’ Capital. On the adoption of the new CLO measurement guidance, there is no attribution of amounts to Non-Controlling Interests and no corresponding adjustments to Appropriated Partners’ Capital.
The Partnership has elected the fair value option for certain proprietary investments that would otherwise have been accounted for using the equity method of accounting. The fair value of such investments is based on quoted prices in an active market or using the discounted cash flow method. Changes in fair value are recognized in Investment Income (Loss) in the Condensed Consolidated Statements of Operations.
Further disclosure on instruments for which the fair value option has been elected is presented in Note 7. “Fair Value Option” in the “Notes to Condensed Consolidated Financial Statements” in “Part I. Item 1. Financial Statements” of this filing.
The investments of consolidated Blackstone Funds in funds of hedge funds (“Investee Funds”) are valued at net asset value (“NAV”) per share of the Investee Fund. In limited circumstances, the Partnership may determine, based on its own due diligence and investment procedures, that NAV per share does not represent fair value. In such circumstances, the Partnership will estimate the fair value in good faith and in a manner that it reasonably chooses, in accordance with the requirements of GAAP.
Certain investments of Blackstone and of the consolidated Blackstone funds of hedge funds and credit-focused funds measure their investments in underlying funds at fair value using NAV per share without adjustment. The terms of the investee’s investment generally provide for minimum holding periods or lock-ups, the institution of gates on redemptions or the suspension of redemptions or an ability to side pocket investments, at the discretion of the investee’s fund manager, and as a result, investments may not be redeemable at, or within three months of, the reporting date. A side pocket is used by hedge funds and funds of hedge funds to separate investments that may lack a readily ascertainable value, are illiquid or are subject to liquidity restriction. Redemptions are generally not permitted until the investments within a side pocket are liquidated or it is deemed that the conditions existing at the time that required the investment to be included in the side pocket no longer exist. As the timing of either of these events is uncertain, the timing at which the Partnership may redeem an investment held in a side pocket cannot be estimated. Further disclosure on instruments for which fair value is measured using NAV per share is presented in Note 5. “Net Asset Value as Fair Value” in the “Notes to Condensed Consolidated Financial Statements” in “Part I. Item 1. Financial Statements” of this filing.
Intangibles and Goodwill
Blackstone’s intangible assets consist of contractual rights to earn future fee income, including management and advisory fees, Incentive Fees and Carried Interest. Identifiable finite-lived intangible assets are amortized on a straight-line basis over their estimated useful lives, ranging from 3 to 20 years, reflecting the contractual lives of such assets. Amortization expense is included within General, Administrative and Other in the Condensed Consolidated Statements of Operations. The Partnership does not hold any indefinite-lived intangible assets. Intangible assets are reviewed for impairment when events or changes in circumstances indicate that the carrying amount may not be recoverable.
118
Table of Contents
Goodwill comprises goodwill arising from the contribution and reorganization of the Partnership’s predecessor entities in 2007 immediately prior to its IPO, the acquisition of GSO in 2008 and the acquisition of Strategic Partners in 2013. Goodwill is reviewed for impairment at least annually utilizing a qualitative or quantitative approach, and more frequently if circumstances indicate impairment may have occurred. The impairment testing for goodwill under the qualitative approach is based first on a qualitative assessment to determine if it is more likely than not that the fair value of Blackstone’s operating segments is less than their respective carrying values. The operating segment is the reporting level for testing the impairment of goodwill. If it is determined that it is more likely than not that an operating segment’s fair value is less than its carrying value or when the quantitative approach is used, a two-step quantitative assessment is performed to (a) calculate the fair value of the operating segment and compare it to its carrying value, and (b) if the carrying value exceeds its fair value, to measure an impairment loss.
Senior management has organized the firm into four operating segments. All of the components in each segment have similar economic characteristics and senior management makes key operating decisions based on the performance of each segment. Therefore, we believe that operating segment is the appropriate reporting level for testing the impairment of goodwill.
The carrying value of goodwill was $1.7 billion as of March 31, 2017 and December 31, 2016. At March 31, 2017 and December 31, 2016, we determined that there was no evidence of goodwill impairment.
Off-Balance Sheet Arrangements
In the normal course of business, we enter into various off-balance sheet arrangements including sponsoring and owning limited or general partner interests in consolidated and non-consolidated funds, entering into derivative transactions, entering into operating leases and entering into guarantee arrangements. We also have ongoing capital commitment arrangements with certain of our consolidated and non-consolidated drawdown funds. We do not have any off-balance sheet arrangements that would require us to fund losses or guarantee target returns to investors in our funds.
Further disclosure on our off-balance sheet arrangements is presented in the “Notes to Condensed Consolidated Financial Statements” in “Part I. Item 1. Financial Statements” of this filing as follows:
| • | Note 6. “Derivative Financial Instruments”, |
| • | Note 9. “Variable Interest Entities”, and |
| • | Note 17. “Commitments and Contingencies — Commitments — Investment Commitments” and “— Contingencies — Guarantees”. |
Recent Accounting Developments
Information regarding recent accounting developments and their impact on Blackstone can be found in Note 2. “Summary of Significant Accounting Policies” in the “Notes to Condensed Consolidated Financial Statements” in “Part I. Item 1. Financial Statements” of this filing.
| ITEM 3. | QUANTITATIVE AND QUALITATIVE DISCLOSURES ABOUT MARKET RISK |
Our predominant exposure to market risk is related to our role as general partner or investment adviser to the Blackstone Funds and the sensitivities to movements in the fair value of their investments, including the effect on management fees, performance fees and investment income.
119
Table of Contents
Although the Blackstone Funds share many common themes, each of our alternative asset management operations runs its own investment and risk management processes, subject to our overall risk tolerance and philosophy:
| • | The investment process of our carry funds involves a detailed analysis of potential investments, and asset management teams are assigned to oversee the operations, strategic development, financing and capital deployment decisions of each portfolio investment. Key investment decisions are subject to approval by the applicable investment committee, which is comprised of Blackstone senior managing directors and senior management. |
| • | In our capacity as adviser to certain funds in our Hedge Fund Solutions and Credit segments, we continuously monitor a variety of markets for attractive trading opportunities, applying a number of traditional and customized risk management metrics to analyze risk related to specific assets or portfolios. In addition, we perform extensive credit and cash flow analyses of borrowers, credit-based assets and underlying hedge fund managers, and have extensive asset management teams that monitor covenant compliance by, and relevant financial data of, borrowers and other obligors, asset pool performance statistics, tracking of cash payments relating to investments and ongoing analysis of the credit status of investments. |
Effect on Fund Management Fees
Our management fees are based on (a) third parties’ capital commitments to a Blackstone Fund, (b) third parties’ capital invested in a Blackstone Fund or (c) the net asset value, or NAV, of a Blackstone Fund, as described in our Condensed Consolidated Financial Statements. Management fees will only be directly affected by short-term changes in market conditions to the extent they are based on NAV or represent permanent impairments of value. These management fees will be increased (or reduced) in direct proportion to the effect of changes in the fair value of our investments in the related funds. The proportion of our management fees that are based on NAV is dependent on the number and types of Blackstone Funds in existence and the current stage of each fund’s life cycle. For the three months ended March 31, 2017 and March 31, 2016, the percentages of our fund management fees based on the NAV of the applicable funds or separately managed accounts, were as follows:
| Three Months Ended March 31, |
||||||||
| 2017 | 2016 | |||||||
| Fund Management Fees Based on the NAV of the Applicable Funds or Separately Managed Accounts |
34 | % | 32 | % | ||||
Market Risk
The Blackstone Funds hold investments which are reported at fair value. Based on the fair value as of March 31, 2017 and March 31, 2016, we estimate that a 10% decline in fair value of the investments would result in the following declines in Management Fees, Performance Fees, Net of Related Compensation Expense and Investment Income:
| March 31, | ||||||||||||||||||||||||
| 2017 | 2016 | |||||||||||||||||||||||
| Performance | Performance | |||||||||||||||||||||||
| Fees, Net of | Fees, Net of | |||||||||||||||||||||||
| Related | Related | |||||||||||||||||||||||
| Management | Compensation | Investment | Management | Compensation | Investment | |||||||||||||||||||
| Fees (a) | Expense (b) | Income (b) | Fees (a) | Expense (b) | Income (b) | |||||||||||||||||||
| (Dollars in Thousands) | ||||||||||||||||||||||||
| 10% Decline in Fair Value of the Investments |
$ | 88,945 | $ | 1,177,531 | $ | 235,607 | $ | 83,597 | $ | 1,279,978 | $ | 242,146 | ||||||||||||
| (a) | Represents the annualized effect of the 10% decline. |
| (b) | Represents the reporting date effect of the 10% decline. |
120
Table of Contents
Total Assets Under Management, excluding undrawn capital commitments and the amount of capital raised for our CLOs, by segment, and the percentage amount classified as Level III investments as defined within the fair value standards of GAAP, are as follows:
| March 31, 2017 | ||||||||
| Total Assets Under Management, Excluding Undrawn Capital Commitments and the Amount of Capital Raised for CLOs |
Percentage Amount Classified as Level III Investments |
|||||||
| (Dollars in Thousands) | ||||||||
| Private Equity |
$ | 47,990,889 | 69 | % | ||||
| Real Estate |
$ | 67,712,883 | 80 | % | ||||
| Credit |
$ | 53,273,271 | 51 | % | ||||
The fair value of our investments and securities can vary significantly based on a number of factors that take into consideration the diversity of the Blackstone Funds’ investment portfolio and on a number of factors and inputs such as similar transactions, financial metrics, and industry comparatives, among others. (See “Part I. Item 1A. Risk Factors” in our Annual Report on Form 10-K for the year ended December 31, 2016. Also see “Part I. Item 2. Management’s Discussion and Analysis of Financial Condition and Results of Operations — Critical Accounting Policies — Investments, at Fair Value.”) We believe these fair value amounts should be utilized with caution as our intent and strategy is to hold investments and securities until prevailing market conditions are beneficial for investment sales.
Investors in all of our carry funds (and certain of our credit-focused funds and funds of hedge funds) make capital commitments to those funds that we are entitled to call from those investors at any time during prescribed periods. We depend on investors fulfilling their commitments when we call capital from them in order for those funds to consummate investments and otherwise pay their related obligations when due, including management fees. We have not had investors fail to honor capital calls to any meaningful extent and any investor that did not fund a capital call would be subject to having a significant amount of its existing investment forfeited in that fund; however, if investors were to fail to satisfy a significant amount of capital calls for any particular fund or funds, those funds could be materially and adversely affected.
Exchange Rate Risk
The Blackstone Funds hold investments that are denominated in non-U.S. dollar currencies that may be affected by movements in the rate of exchange between the U.S. dollar and non-U.S. dollar currencies. Additionally, a portion of our management fees are denominated in non-U.S. dollar currencies. We estimate that as of March 31, 2017 and March 31, 2016, a 10% decline in the rate of exchange of all foreign currencies against the U.S. dollar would result in the following declines in Management Fees, Performance Fees, Net of Related Compensation Expense and Investment Income:
| March 31, | ||||||||||||||||||||||||
| 2017 | 2016 | |||||||||||||||||||||||
| Performance | Performance | |||||||||||||||||||||||
| Fees, Net of | Fees, Net of | |||||||||||||||||||||||
| Related | Related | |||||||||||||||||||||||
| Management | Compensation | Investment | Management | Compensation | Investment | |||||||||||||||||||
| Fees (a) | Expense (b) | Income (b) | Fees (a) | Expense (b) | Income (b) | |||||||||||||||||||
| (Dollars in Thousands) | ||||||||||||||||||||||||
| 10% Decline in the Rate of Exchange of All Foreign Currencies Against the U.S. Dollar |
$ | 14,297 | $ | 269,236 | $ | 29,883 | $ | 12,828 | $ | 248,490 | $ | 31,258 | ||||||||||||
| (a) | Represents the annualized effect of the 10% decline. |
| (b) | Represents the reporting date effect of the 10% decline. |
121
Table of Contents
Interest Rate Risk
Blackstone has debt obligations payable that accrue interest at variable rates. Interest rate changes may therefore affect the amount of our interest payments, future earnings and cash flows. Based on our debt obligations payable as of March 31, 2017 and March 31, 2016, we estimate that interest expense relating to variable rates would increase on an annual basis, in the event interest rates were to increase by one percentage point, as follows:
| March 31, | ||||||||
| 2017 | 2016 | |||||||
| (Dollars in Thousands) | ||||||||
| Annualized Increase in Interest Expense Due to a One Percentage Point Increase in Interest Rates |
$ | 28 | $ | 43 | ||||
Blackstone has a diversified portfolio of liquid assets to meet the liquidity needs of various businesses. This portfolio includes cash, open ended money market mutual funds, open ended bond mutual funds, marketable investment securities, freestanding derivative contracts, repurchase and reverse repurchase agreements and other investments. If interest rates were to increase by one percentage point, we estimate that our annualized investment income would decrease, offset by an estimated increase in interest income on an annual basis from interest on floating rate assets, as follows:
| March 31, | ||||||||||||||||
| 2017 | 2016 | |||||||||||||||
| Annualized | Annualized | |||||||||||||||
| Annualized | Increase in | Annualized | Increase in | |||||||||||||
| Decrease in | Interest Income | Decrease in | Interest Income | |||||||||||||
| Investment | from Floating | Investment | from Floating | |||||||||||||
| Income | Rate Assets | Income | Rate Assets | |||||||||||||
| (Dollars in Thousands) | ||||||||||||||||
| One Percentage Point Increase in Interest Rates |
$ | 10,240 | (a) | $ | 26,036 | $ | 13,291 | (a) | $ | 14,543 | ||||||
| (a) | As of March 31, 2017 and 2016, this represents 0.2% and 0.4% of our portfolio of liquid assets, respectively. |
Credit Risk
Certain Blackstone Funds and the Investee Funds are subject to certain inherent risks through their investments.
Our portfolio of liquid assets contain certain credit risks including, but not limited to, exposure to uninsured deposits with financial institutions, unsecured corporate bonds and mortgage-backed securities. These exposures are actively monitored on a continuous basis and positions are reallocated based on changes in risk profile, market or economic conditions.
We estimate that our annualized investment income would decrease, if credit spreads were to increase by one percentage point, as follows:
| March 31, | ||||||||
| 2017 | 2016 | |||||||
| (Dollars in Thousands) |
||||||||
| Decrease in Annualized Investment Income Due to a One Percentage Point Increase in Credit Spreads (a) |
$ | 39,531 | $ | 23,622 | ||||
| (a) | As of March 31, 2017 and 2016, this represents 0.8% and 0.7% of our portfolio of liquid assets, respectively. |
Certain of our entities hold derivative instruments that contain an element of risk in the event that the counterparties may be unable to meet the terms of such agreements. We minimize our risk exposure by limiting the counterparties with which we enter into contracts to banks and investment banks who meet established credit and
122
Table of Contents
capital guidelines. We do not expect any counterparty to default on its obligations and therefore do not expect to incur any loss due to counterparty default.
| ITEM 4. | CONTROLS AND PROCEDURES |
We maintain “disclosure controls and procedures,” as such term is defined in Rules 13a-15(e) and 15d-15(e) under the Securities Exchange Act of 1934 (the “Exchange Act”), that are designed to ensure that information required to be disclosed by us in reports that we file or submit under the Exchange Act is recorded, processed, summarized and reported within the time periods specified in Securities and Exchange Commission rules and forms, and that such information is accumulated and communicated to our management, including our Chief Executive Officer and Chief Financial Officer, as appropriate, to allow timely decisions regarding required disclosure. In designing disclosure controls and procedures, our management necessarily was required to apply its judgment in evaluating the cost-benefit relationship of possible disclosure controls and procedures. The design of any disclosure controls and procedures also is based in part upon certain assumptions about the likelihood of future events, and there can be no assurance that any design will succeed in achieving its stated goals under all potential future conditions. Any controls and procedures, no matter how well designed and operated, can provide only reasonable assurance of achieving the desired objectives.
Our management, including our Chief Executive Officer and Chief Financial Officer, evaluated the effectiveness of our disclosure controls and procedures pursuant to Rule 13a-15 under the Exchange Act as of the end of the period covered by this report. Based on that evaluation, our Chief Executive Officer and Chief Financial Officer have concluded that, as of the end of the period covered by this report, our disclosure controls and procedures (as defined in Rule 13a-15(e) under the Exchange Act) are effective at the reasonable assurance level to accomplish their objectives of ensuring that information we are required to disclose in reports that we file or submit under the Exchange Act is recorded, processed, summarized and reported within the time periods specified in Securities and Exchange Commission rules and forms, and that such information is accumulated and communicated to our management, including our Chief Executive Officer and Chief Financial Officer, as appropriate, to allow timely decisions regarding required disclosure.
No changes in our internal control over financial reporting (as such term is defined in Rules 13a-15(f) and 15d-15(f) under the Securities Exchange Act) occurred during our most recent quarter, that has materially affected, or is reasonably likely to materially affect, our internal control over financial reporting.
123
Table of Contents
| ITEM 1. | LEGAL PROCEEDINGS |
We may from time to time be involved in litigation and claims incidental to the conduct of our business. Our businesses are also subject to extensive regulation, which may result in regulatory proceedings against us. See “Part I. Item 1A. Risk Factors” in our Annual Report on Form 10-K for the year ended December 31, 2016. We are not currently subject to any pending judicial, administrative or arbitration proceedings that we expect to have a material impact on our consolidated financial statements. However, given the inherent unpredictability of these types of proceedings and the potentially large and/or indeterminate amounts that could be sought, it is possible that an adverse outcome in certain matters could have a material effect on Blackstone’s financial results in any particular period.
| ITEM 1A. | RISK FACTORS |
For a discussion of our potential risks and uncertainties, see the information under the heading “Risk Factors” in our Annual Report on Form 10-K for the year ended December 31, 2016 and in our subsequently filed Quarterly Reports on Form 10-Q, all of which are accessible on the Securities and Exchange Commission’s website at www.sec.gov.
See “Part I. Item 2. Management’s Discussion and Analysis of Financial Condition and Results of Operations — Business Environment” in this report for a discussion of the conditions in the financial markets and economic conditions affecting our businesses. This discussion updates, and should be read together with, the risk factor entitled “Difficult market conditions can adversely affect our business in many ways, including by reducing the value or performance of the investments made by our investment funds and reducing the ability of our investment funds to raise or deploy capital, each of which could materially reduce our revenue, earnings and cash flow and adversely affect our financial prospects and condition.” in our Annual Report on Form 10-K for the year ended December 31, 2016.
The risks described in our Annual Report on Form 10-K and in our subsequently filed Quarterly Reports on Form 10-Q are not the only risks facing us. Additional risks and uncertainties not currently known to us or that we currently deem to be immaterial also may materially adversely affect our business, financial condition and/or operating results.
| ITEM 2. | UNREGISTERED SALES OF EQUITY SECURITIES AND USE OF PROCEEDS |
In January 2008, the Board of Directors of our general partner, Blackstone Group Management L.L.C., authorized the repurchase of up to $500 million of Blackstone common units and Blackstone Holdings Partnership Units. Under this unit repurchase program, units may be repurchased from time to time in open market transactions, in privately negotiated transactions or otherwise. The timing and the actual number of Blackstone common units and Blackstone Holdings Partnership Units repurchased will depend on a variety of factors, including legal requirements, price and economic and market conditions. The unit repurchase program may be suspended or discontinued at any time and does not have a specified expiration date. During the three months ended March 31, 2017, no units were repurchased. As of March 31, 2017, the amount remaining available for repurchases was $335.8 million under this program. See “Part I. Item 1. Financial Statements — Notes to Condensed Consolidated Financial Statements — Note 14. Net Income Per Common Unit” and “Part I. Item 2. Management’s Discussion and Analysis of Financial Condition and Results of Operations — Liquidity and Capital Resources — Liquidity Needs” for further information regarding this unit repurchase program.
As permitted by our policies and procedures governing transactions in our securities by our directors, executive officers and other employees, from time to time some of these persons may establish plans or arrangements complying with Rule 10b5-1 under the Exchange Act, and similar plans and arrangements relating to our common units and Blackstone Holdings Partnership Units.
124
Table of Contents
| ITEM 3. | DEFAULTS UPON SENIOR SECURITIES |
Not applicable.
| ITEM 4. | MINE SAFETY DISCLOSURES |
Not applicable.
| ITEM 5. | OTHER INFORMATION |
None.
| ITEM 6. | EXHIBITS |
| Exhibit |
Exhibit Description | |
| 10.1+ | Amended and Restated Agreement of Exempted Limited Partnership of Blackstone Real Estate Associates Europe V L.P., dated May 8, 2017 and deemed effective as of March 1, 2016. | |
| 31.1 | Certification of the Chief Executive Officer pursuant to Rule 13a-14(a). | |
| 31.2 | Certification of the Chief Financial Officer pursuant to Rule 13a-14(a). | |
| 32.1 | Certification of the Chief Executive Officer pursuant to 18 U.S.C. Section 1350, as adopted pursuant to Section 906 of the Sarbanes-Oxley Act of 2002 (furnished herewith). | |
| 32.2 | Certification of the Chief Financial Officer pursuant to 18 U.S.C. Section 1350, as adopted pursuant to Section 906 of the Sarbanes-Oxley Act of 2002 (furnished herewith). | |
| 101.INS | XBRL Instance Document. | |
| 101.SCH | XBRL Taxonomy Extension Schema Document. | |
| 101.CAL | XBRL Taxonomy Extension Calculation Linkbase Document. | |
| 101.DEF | XBRL Taxonomy Extension Definition Linkbase Document. | |
| 101.LAB | XBRL Taxonomy Extension Label Linkbase Document. | |
| 101.PRE | XBRL Taxonomy Extension Presentation Linkbase Document. | |
| + | Management contract or compensatory plan or arrangement in which directors or executive officers are eligible to participate. |
The agreements and other documents filed as exhibits to this report are not intended to provide factual information or other disclosure other than with respect to the terms of the agreements or other documents themselves, and you should not rely on them for that purpose. In particular, any representations and warranties made by us in these agreements or other documents were made solely within the specific context of the relevant agreement or document and may not describe the actual state of affairs as of the date they were made or at any other time.
125
Table of Contents
Pursuant to the requirements of the Securities Exchange Act of 1934, the Registrant has duly caused this report to be signed on its behalf by the undersigned thereunto duly authorized.
Date: May 9, 2017
| The Blackstone Group L.P. | ||
| By: | Blackstone Group Management L.L.C., | |
| its General Partner | ||
| /s/ Michael S. Chae | ||
| Name: | Michael S. Chae | |
| Title: | Chief Financial Officer | |
| (Principal Financial Officer and Authorized Signatory) | ||
126