Attached files
| file | filename |
|---|---|
| EX-32.2 - EX-32.2 - Blackstone Group Inc | d280098dex322.htm |
| EX-32.1 - EX-32.1 - Blackstone Group Inc | d280098dex321.htm |
| EX-31.2 - EX-31.2 - Blackstone Group Inc | d280098dex312.htm |
| EX-31.1 - EX-31.1 - Blackstone Group Inc | d280098dex311.htm |
| EX-23.1 - EX-23.1 - Blackstone Group Inc | d280098dex231.htm |
| EX-21.1 - EX-21.1 - Blackstone Group Inc | d280098dex211.htm |
| EX-10.83 - EX-10.83 - Blackstone Group Inc | d280098dex1083.htm |
| EX-10.82 - EX-10.82 - Blackstone Group Inc | d280098dex1082.htm |
Table of Contents
UNITED STATES
SECURITIES AND EXCHANGE COMMISSION
WASHINGTON, D.C. 20549
FORM 10-K
(Mark One)
| ☒ | ANNUAL REPORT PURSUANT TO SECTION 13 OR 15(d) OF THE SECURITIES EXCHANGE ACT OF 1934 FOR THE FISCAL YEAR ENDED DECEMBER 31, 2016 |
OR
| ☐ | TRANSITION REPORT PURSUANT TO SECTION 13 OR 15(d) OF THE SECURITIES EXCHANGE ACT OF 1934 FOR THE TRANSITION PERIOD FROM TO |
Commission File Number: 001-33551

The Blackstone Group L.P.
(Exact name of Registrant as specified in its charter)
| Delaware | 20-8875684 | |
| (State or other jurisdiction of incorporation or organization) |
(I.R.S. Employer Identification No.) |
345 Park Avenue
New York, New York 10154
(Address of principal executive offices)(Zip Code)
(212) 583-5000
(Registrant’s telephone number, including area code)
Securities registered pursuant to Section 12(b) of the Act:
| Title of each class |
Name of each exchange on which registered | |
| Common units representing limited partner interests | New York Stock Exchange |
Securities registered pursuant to Section 12(g) of the Act: None
Indicate by check mark if the Registrant is a well-known seasoned issuer, as defined in Rule 405 of the Securities Act. Yes ☒ No ☐
Indicate by check mark if the Registrant is not required to file reports pursuant to Section 13 or Section 15(d) of the Act. Yes ☐ No ☒
Indicate by check mark whether the Registrant (1) has filed all reports required to be filed by Section 13 or 15(d) of the Securities Exchange Act of 1934 during the preceding 12 months (or for such shorter period that the Registrant was required to file such reports), and (2) has been subject to such filing requirements for the past 90 days. Yes ☒ No ☐
Indicate by check mark whether the registrant has submitted electronically and posted on its corporate Web site, if any, every Interactive Data File required to be submitted and posted pursuant to Rule 405 of Regulation S-T (§232.405 of this chapter) during the preceding 12 months (or for such shorter period that the registrant was required to submit and post such files). Yes ☒ No ☐
Indicate by check mark if disclosure of delinquent filers pursuant to Item 405 of Regulation S-K (§229.405 of this chapter) is not contained herein and will not be contained, to the best of the Registrant’s knowledge, in definitive proxy or information statements incorporated by reference in Part III of this Form 10-K or any amendment to this Form 10-K. ☐
Indicate by check mark whether the Registrant is a large accelerated filer, an accelerated filer, a non-accelerated filer or a smaller reporting company. See the definitions of “large accelerated filer,” “accelerated filer” and “smaller reporting company” in Rule 12b-2 of the Exchange Act.
| Large accelerated filer ☒ |
Accelerated filer ☐ | |
| Non-accelerated filer ☐ |
Smaller reporting company ☐ | |
| (do not check if a smaller reporting company) |
Indicate by check mark whether the Registrant is a shell company (as defined in Rule 12b-2 of the Act). Yes ☐ No ☒
The aggregate market value of the common units of the Registrant held by non-affiliates as of June 30, 2016 was approximately $15.3 billion, which includes non-voting common units with a value of approximately $1.4 billion.
The number of the Registrant’s voting common units representing limited partner interests outstanding as of February 17, 2017 was 587,607,442. The number of the Registrant’s non-voting common units representing limited partner interests outstanding as of February 17, 2017 was 54,470,009.
DOCUMENTS INCORPORATED BY REFERENCE
None
Table of Contents
| Page | ||||||
| PART I. | ||||||
| ITEM 1. | 5 | |||||
| ITEM 1A. | 19 | |||||
| ITEM 1B. | 71 | |||||
| ITEM 2. | 72 | |||||
| ITEM 3. | 72 | |||||
| ITEM 4. | 72 | |||||
| PART II. | ||||||
| ITEM 5. | 73 | |||||
| ITEM 6. | 76 | |||||
| ITEM 7. | MANAGEMENT’S DISCUSSION AND ANALYSIS OF FINANCIAL CONDITION AND RESULTS OF OPERATIONS |
78 | ||||
| ITEM 7A. | 146 | |||||
| ITEM 8. | 150 | |||||
| ITEM 8A. | UNAUDITED SUPPLEMENTAL PRESENTATION OF STATEMENTS OF FINANCIAL CONDITION |
222 | ||||
| ITEM 9. | CHANGES IN AND DISAGREEMENTS WITH ACCOUNTANTS ON ACCOUNTING AND FINANCIAL DISCLOSURE |
224 | ||||
| ITEM 9A. | 224 | |||||
| ITEM 9B. | 225 | |||||
| PART III. | ||||||
| ITEM 10. | 226 | |||||
| ITEM 11. | 233 | |||||
| ITEM 12. | SECURITY OWNERSHIP OF CERTAIN BENEFICIAL OWNERS AND MANAGEMENT AND RELATED STOCKHOLDER MATTERS |
254 | ||||
| ITEM 13. | CERTAIN RELATIONSHIPS AND RELATED TRANSACTIONS, AND DIRECTOR INDEPENDENCE |
257 | ||||
| ITEM 14. | 265 | |||||
| PART IV. | ||||||
| ITEM 15. | 267 | |||||
| ITEM 16. | 278 | |||||
| 279 | ||||||
1
Table of Contents
Forward-Looking Statements
This report may contain forward-looking statements within the meaning of Section 27A of the Securities Act of 1933 and Section 21E of the Securities Exchange Act of 1934 which reflect our current views with respect to, among other things, our operations and financial performance. You can identify these forward-looking statements by the use of words such as “outlook,” “indicator,” “believes,” “expects,” “potential,” “continues,” “may,” “will,” “should,” “seeks,” “approximately,” “predicts,” “intends,” “plans,” “estimates,” “anticipates” or the negative version of these words or other comparable words. Such forward-looking statements are subject to various risks and uncertainties. Accordingly, there are or will be important factors that could cause actual outcomes or results to differ materially from those indicated in these statements. We believe these factors include but are not limited to those described under the section entitled “Risk Factors” in this report, as such factors may be updated from time to time in our periodic filings with the United States Securities and Exchange Commission (“SEC”), which are accessible on the SEC’s website at www.sec.gov. These factors should not be construed as exhaustive and should be read in conjunction with the other cautionary statements that are included in this report and in our other periodic filings. The forward-looking statements speak only as of the date of this report, and we undertake no obligation to publicly update or review any forward-looking statement, whether as a result of new information, future developments or otherwise.
Website and Social Media Disclosure
We use our website (www.blackstone.com), Facebook page (www.facebook.com/blackstone), Twitter (www.twitter.com/blackstone), LinkedIn (www.linkedin.com/company/the-blackstone-group), Instagram (www.instagram.com/blackstone) and YouTube (www.youtube.com/user/blackstonegroup) accounts as channels of distribution of company information. The information we post through these channels may be deemed material. Accordingly, investors should monitor these channels, in addition to following our press releases, SEC filings and public conference calls and webcasts. In addition, you may automatically receive e-mail alerts and other information about Blackstone when you enroll your e-mail address by visiting the “Contact Us/Email Alerts” section of our website at http://ir.blackstone.com. The contents of our website, any alerts and social media channels are not, however, a part of this report.
In this report, references to “Blackstone,” the “Partnership,” “we,” “us” or “our” refer to The Blackstone Group L.P. and its consolidated subsidiaries. Unless the context otherwise requires, references in this report to the ownership of Mr. Stephen A. Schwarzman, our founder, and other Blackstone personnel include the ownership of personal planning vehicles and family members of these individuals.
“Blackstone Funds,” “our funds” and “our investment funds” refer to the private equity funds, real estate funds, funds of hedge funds, credit-focused funds, collateralized loan obligation (“CLO”), real estate investment trusts and registered investment companies that are managed by Blackstone. “Our carry funds” refers to the private equity funds, real estate funds and certain of the hedge fund solutions and credit-focused funds (with multi-year drawdown, commitment-based structures that only pay carry on the realization of an investment) that are managed by Blackstone. We refer to our general corporate private equity funds as Blackstone Capital Partners (“BCP”) funds, our energy-focused private equity funds as Blackstone Energy Partners (“BEP”) funds, our core private equity fund as Blackstone Core Equity Partners (“BCEP”), our opportunistic investment platform that invests globally across asset classes, industries and geographies as Blackstone Tactical Opportunities (“Tactical Opportunities”), our secondary private equity fund of funds business as Strategic Partners Fund Solutions (“Strategic Partners”), a multi-asset investment program for eligible high net worth investors offering exposure to certain of our key illiquid investment strategies through a single commitment as Blackstone Total Alternatives Solution (“BTAS”) and our capital markets services business as Blackstone Capital Markets (“BXCM”). We refer to our real estate opportunistic funds as Blackstone Real Estate Partners (“BREP”) funds and our real estate debt investment funds as Blackstone Real Estate Debt Strategies (“BREDS”) funds. We refer to our core+ real estate funds, which target substantially stabilized assets in prime markets, as Blackstone Property Partners (“BPP”) funds. We refer to our real
2
Table of Contents
estate investment trusts as “REITs” and to Blackstone Mortgage Trust, Inc., our NYSE-listed REIT as “BXMT”. “Our hedge funds” refers to our funds of hedge funds, certain of our real estate debt investment funds, including a registered investment company, and certain other credit-focused funds which are managed by Blackstone.
“Assets Under Management” refers to the assets we manage. Our Assets Under Management equals the sum of:
| (a) | the fair value of the investments held by our carry funds and our side-by-side and co-investment entities managed by us, plus the capital that we are entitled to call from investors in those funds and entities pursuant to the terms of their respective capital commitments, including capital commitments to funds that have yet to commence their investment periods, plus for certain credit-oriented funds the amounts available to be borrowed under asset based credit facilities, |
| (b) | the net asset value of our funds of hedge funds, hedge funds, real estate debt carry funds (plus the capital that we are entitled to call from investors in those funds), open ended core+ real estate fund, our Hedge Fund Solutions registered investment companies, and our non-exchange traded REIT, |
| (c) | the invested capital, fair value or net asset value of assets we manage pursuant to separately managed accounts, |
| (d) | the amount of debt and equity outstanding for our CLOs during the reinvestment period, |
| (e) | the aggregate par amount of collateral assets, including principal cash, for our CLOs after the reinvestment period, |
| (f) | the gross or net amount of assets (including leverage where applicable) for our credit-focused registered investment companies, and |
| (g) | the fair value of common stock, preferred stock, convertible debt, or similar instruments issued by BXMT. |
Our carry funds are commitment-based drawdown structured funds that do not permit investors to redeem their interests at their election. Our funds of hedge funds, hedge funds and funds structured like hedge funds in our Hedge Fund Solutions, Credit and Real Estate segments generally have structures that afford an investor the right to withdraw or redeem their interests on a periodic basis (for example, annually or quarterly), typically with 30 to 95 days’ notice, depending on the fund and the liquidity profile of the underlying assets. Investment advisory agreements related to certain separately managed accounts in our Hedge Fund Solutions and Credit segments may generally be terminated by an investor on 30 to 90 days’ notice.
“Fee-Earning Assets Under Management” refers to the assets we manage on which we derive management and/or performance fees. Our Fee-Earning Assets Under Management equals the sum of:
| (a) | for our Private Equity segment funds and Real Estate segment carry funds including certain real estate debt investment funds and certain of our Hedge Fund Solutions funds, the amount of capital commitments, remaining invested capital, fair value or par value of assets held, depending on the fee terms of the fund, |
| (b) | for our credit-focused carry funds, the amount of remaining invested capital (which may include leverage) or net asset value, depending on the fee terms of the fund, |
| (c) | the remaining invested capital or fair value of assets held in co-investment vehicles managed by us on which we receive fees, |
| (d) | the net asset value of our funds of hedge funds, hedge funds, open ended core+ real estate fund, co-investments managed by us on which we receive fees, certain registered investment companies, and our non-exchanged traded REIT, |
| (e) | the invested capital, fair value of assets or the net asset value we manage pursuant to separately managed accounts, |
| (f) | the net proceeds received from equity offerings and accumulated core earnings of BXMT, subject to certain adjustments, |
3
Table of Contents
| (g) | the aggregate par amount of collateral assets, including principal cash, of our CLOs, and |
| (h) | the gross amount of assets (including leverage) or the net assets (plus leverage where applicable) for certain of our credit-focused registered investment companies. |
Each of our segments may include certain Fee-Earning Assets Under Management on which we earn performance fees but not management fees.
Our calculations of assets under management and fee-earning assets under management may differ from the calculations of other asset managers, and as a result this measure may not be comparable to similar measures presented by other asset managers. In addition, our calculation of assets under management includes commitments to, and the fair value of, invested capital in our funds from Blackstone and our personnel, regardless of whether such commitments or invested capital are subject to fees. Our definitions of assets under management or fee-earning assets under management are not based on any definition of assets under management or fee-earning assets under management that is set forth in the agreements governing the investment funds that we manage.
For our carry funds, total assets under management includes the fair value of the investments held, whereas fee-earning assets under management includes the amount of capital commitments, the remaining amount of invested capital at cost depending on whether the investment period has or has not expired or the fee terms of the fund. As such, fee-earning assets under management may be greater than total assets under management when the aggregate fair value of the remaining investments is less than the cost of those investments.
This report does not constitute an offer of any Blackstone Fund.
4
Table of Contents
PART I.
| ITEM 1. | BUSINESS |
Overview
Blackstone is a leading global alternative asset manager, with Total Assets Under Management of $366.6 billion as of December 31, 2016. As stewards of public funds, we look to drive outstanding results for our investors and clients by deploying capital and ideas to help businesses succeed and grow. Our alternative asset management businesses include investment vehicles focused on private equity, real estate, hedge fund solutions, non-investment grade credit, secondary private equity funds of funds and multi-asset class strategies. We also provide capital markets services.
All of Blackstone’s businesses use a solutions oriented approach to drive better performance. We believe our scaled, diversified businesses, coupled with our long track record of investment performance, proven investment approach and strong client relationships, position us to continue to perform well in a variety of market conditions, expand our assets under management and add complementary businesses.
Two of our primary limited partner constituencies are public and corporate pension funds. As a result, to the extent our funds perform well, it supports a better retirement for millions of pensioners.
In addition, because we are a global firm with a footprint on nearly every continent, our investments can make a difference around the world. We are committed to making our family of companies stronger in ways that can have positive impacts on local economies.
As of December 31, 2016, we had 123 senior managing directors and approximately 2,120 other employees at our headquarters in New York and in 29 other cities around the world. We believe hiring, training and retaining talented individuals coupled with our rigorous investment process has supported our excellent investment record over many years. This record in turn has allowed us to successfully and repeatedly raise additional assets from an increasingly wide variety of sophisticated investors.
2016 Highlights
Sustained Healthy Realization Activity Driving Distributions
| • | Continued strong realization activity across business segments despite a volatile market backdrop, with total realizations of $39 billion in 2016, and averaging $42 billion per year over the last three years. |
| • | Blackstone has distributed over $8 billion in value, including the value of the spin-off of our financial advisory business, to common and Holdings unitholders over the past three years, one of the highest returns of capital to equity holders in our industry. |
Platform Expansion Enabling Large Scale Capital Deployment
| • | Global scale and business diversification allow Blackstone to identify attractive investment opportunities around the world, despite more challenging market conditions in certain areas. As a result, the past three years have marked the three largest for capital deployment in our history, with $23 billion deployed in 2016 and a cumulative $82 billion deployed over the past three years. |
| • | We are generating significant deal flow from new strategies. Three of our largest new initiatives in the past five years — Tactical Opportunities, core+ real estate and Strategic Partners — invested an aggregate $7 billion in 2016, or 30% of total capital deployed. In addition, our new core private equity initiative signed its first investment in January 2017. |
5
Table of Contents
Another Year of Double-Digit Growth in Fee-Earning Assets Under Management
| • | Each of our investing businesses saw positive growth in both Assets Under Management and Fee-Earning Assets Under Management in 2016, despite significant levels of realizations, given continued strong fundraising across businesses. Fee-Earning Assets Under Management rose 13% in 2016 to $277 billion and Assets Under Management rose 9% to $367 billion, both of which were firm records. |
| • | Gross organic capital inflows across our businesses reached $70 billion for 2016, our second best year on record. Our limited partners continue to give us large scale capital for our new initiatives, including Tactical Opportunities, which in five years has reached $17 billion in Assets Under Management, core+ real estate, which in three years has reached $14 billion in Assets Under Management and Strategic Partners, which now has over $20 billion in Assets Under Management, more than double the size of the platform when we acquired it three years ago. |
| • | Continued to diversify our sources of capital, including bringing our institutional quality solutions to the retail high net worth area and family office channels, with a meaningful amount of capital inflows coming from the retail channel. |
| • | Maintained focus on developing innovative investment structures and capital raising opportunities, sponsoring (together with Axis Capital) the creation of Harrington Re Ltd., a Bermuda-based multi-line reinsurance company, which will invest a significant portion of its capital across a multi-asset alternative strategy managed by Blackstone. |
Industry-Leading Credit Rating and Strong Balance Sheet
| • | Strong balance sheet with no net debt, $4.6 billion in total cash, cash equivalents and corporate treasury investments, and a $1.5 billion undrawn revolver. |
| • | S&P and Fitch have both affirmed Blackstone’s A+ / A+ credit ratings, making Blackstone the highest rated alternative asset manager and one of the highest rated global financial services firms. |
| • | Successfully executed our second euro bond sale in a highly oversubscribed offering of €600 million of 1.0% notes due 2026, which was priced within a few basis points of the benchmark rate’s all-time low. |
Positively Impacting Communities
| • | The Blackstone Charitable Foundation continued its work with local partners in targeted regions to create or grow non-profit programs that support networks and resources for entrepreneurs. In 2016, the Foundation expanded Blackstone LaunchPad to three universities in Texas. In January 2017, working with the city of Chicago and World Business Chicago, it launched the Blackstone Inclusive Entrepreneurship Challenge, a three-year pilot program that will award up to $3.4 million in grants to create a cohort of innovative organizations that effectively recruit and support diverse entrepreneurs and scale start-ups in the Chicago area. |
| • | In April 2013, Blackstone committed to hire 50,000 American veterans across its portfolio over five years in support of the White House’s “Joining Forces” initiative, and has successfully hired 45,000 to date. For the past four years, Blackstone has hosted a Blackstone Veterans Hiring Summit designed to help hiring executives within corporations share best practices on attracting and recruiting veterans and to assist representatives from the U.S. military and government as they work in coordination with Blackstone portfolio companies |
Business Segments
Our four business segments are: (a) Private Equity, (b) Real Estate, (c) Hedge Fund Solutions and (d) Credit.
Information about our business segments should be read together with “Part II. Item 7. Management’s Discussion and Analysis of Financial Condition and Results of Operations” and the historical financial statements and related notes included elsewhere in this Form 10-K.
6
Table of Contents
Private Equity
Our Private Equity segment, established in 1987, is a global business with approximately 250 employees managing $100.2 billion of Total Assets Under Management as of December 31, 2016. We are a world leader in private equity investing, having managed seven general private equity funds, as well as three sector-focused funds since we established the business. We are focused on identifying, managing and creating lasting value for our investors. Our Private Equity segment includes our corporate private equity business, which consists of our flagship corporate private equity funds, Blackstone Capital Partners (“BCP”) funds, our sector-focused corporate private equity funds, including our energy-focused funds, Blackstone Energy Partners (“BEP”) funds and our core private equity fund, which targets control-oriented investments in high-quality companies with durable businesses and seeks to offer a lower level of risk and a longer hold period than traditional private equity. In addition, our Private Equity segment includes our opportunistic investment platform that invests globally across asset classes, industries and geographies, Blackstone Tactical Opportunities (“Tactical Opportunities”), our secondary private equity fund of funds business, Strategic Partners Fund Solutions (“Strategic Partners”), a multi-asset investment program for eligible high net worth investors offering exposure to certain of Blackstone’s key illiquid investment strategies through a single commitment, Blackstone Total Alternatives Solutions (“BTAS”) and our capital markets services business, Blackstone Capital Markets (“BXCM”).
Our corporate private equity business pursues transactions throughout the world across a variety of transaction types, including large buyouts, mid-cap buyouts, buy and build platforms (which involve multiple acquisitions behind a single management team and platform) and growth equity/development projects (which involve significant minority investments in operating companies and greenfield development projects in energy and power). Our private equity business’s investment strategies and core themes continually evolve, in anticipation of, or in response to, changes in the global economy, local markets, regulation, capital flows and geopolitical trends. We seek to construct a differentiated portfolio of investments with a well-defined, interventionist, post-acquisition value creation strategy. Similarly, we seek investments that can generate strong unlevered returns regardless of entry or exit cycle timing. Finally, when we can identify sectors or geographies in which the demand for capital greatly exceeds the readily available supply, our private equity business seeks to make investments at or near book value where it can create goodwill or franchise value through post-acquisition actions.
Tactical Opportunities, our opportunistic investment platform, invests globally across asset classes, industries and geographies. Tactical Opportunities’ mandate allows for flexible investing where it seeks to capitalize on time-sensitive, complex or dislocated market situations in areas where it sees mispriced risks. The Tactical Opportunities team leverages intellectual capital from across all of our businesses to inform our investment diligence and execution. A flexible investment mandate allows Tactical Opportunities to structure a broad range of investments, including private and public securities and instruments, where the underlying exposure may be to equity, debt and/or real assets, and to construct a diversified portfolio of investments that provides differentiated exposures relative to traditional alternative asset managers.
Strategic Partners, our secondary private equity fund of funds business was established in 2000 and acquired by Blackstone in 2013. Strategic Partners is focused on investing in a range of opportunities, leveraging its proprietary database to execute transactions ranging from single fund interests to complex, structured portfolio solutions, in an efficient and timely manner.
For more information concerning the revenues and fees we derive from our Private Equity segment, see “—Incentive Arrangements / Fee Structure” in this Item 1.
Real Estate
Our Real Estate group was founded in 1991 and is one of the largest real estate investment managers in the world, with $102.0 billion of Total Assets Under Management as of December 31, 2016. We operate as one globally integrated business with 285 employees and investments in North America, Europe, Asia and Latin America.
7
Table of Contents
Our Blackstone Real Estate Partners (“BREP”) funds are geographically diversified and target a broad range of “opportunistic” real estate and real estate related investments. The BREP funds include global funds as well as funds focused specifically on Europe or Asia investments. We seek to acquire high quality, well-located yet undermanaged assets at an attractive basis, address any property or business issues through active asset management and sell the assets once our business plan is accomplished. BREP has made significant investments in hotels, office buildings, shopping centers, residential and industrial assets, as well as a variety of real estate operating companies.
We launched Blackstone Real Estate Debt Strategies (“BREDS”), our real estate debt platform, in 2008. Our BREDS vehicles target debt investment opportunities collateralized by commercial real estate. BREDS invests in both public and private markets, primarily in the U.S. and Europe. BREDS’ scale and investment mandates enable it to provide a variety of lending options for our borrowers and investment options for our investors, including mezzanine loans, senior loans and liquid securities. The BREDS platform includes a number of high yield and high grade real estate debt funds, liquid real estate debt funds and Blackstone Mortgage Trust, Inc. (“BXMT”), a NYSE-listed REIT.
We launched our core+ real estate business (“BPP”) in 2013 and we have assembled a global portfolio of high quality core+ investments across the U.S., Europe and Asia. Our BPP vehicles target substantially stabilized assets in prime markets with a focus on office, multifamily, industrial and retail assets. The funds generate returns through both current income and value appreciation over the long term. We manage several core+ real estate funds and a non-exchange traded REIT.
For more information concerning the revenues and fees we derive from our Real Estate segment, see “— Incentive Arrangements / Fee Structure” in this Item 1.
Hedge Fund Solutions
Our Hedge Fund Solutions group is comprised primarily of Blackstone Alternative Asset Management (“BAAM”). BAAM is the world’s largest discretionary allocator to hedge funds, managing a broad range of commingled and customized hedge fund of fund solutions since its inception in 1990. The Hedge Fund Solution segment also includes investment platforms that seed new hedge fund businesses, purchase minority ownership interests in more established hedge funds, invest in special situation opportunities, create alternative solutions in regulated structures and trade directly. Working with our clients over the past 20 plus years, our Hedge Fund Solutions group has developed into a leading manager of institutional hedge fund of funds with approximately 160 employees managing $71.1 billion of Total Assets Under Management as of December 31, 2016. Hedge Fund Solutions’ overall investment philosophy is to protect and grow investors’ assets through both commingled and custom-tailored investment strategies designed to deliver compelling risk-adjusted returns and mitigate risk. Diversification, risk management, due diligence and a focus on downside protection are key tenets of our approach. For more information concerning the revenues and fees we derive from our Hedge Fund Solutions segment, see “— Incentive Arrangements / Fee Structure” in this Item 1.
Credit
Our credit business consists principally of GSO Capital Partners LP (“GSO”) which was founded in 2005 and subsequently acquired by Blackstone in 2008. GSO, with $93.3 billion of Total Assets Under Management as of December 31, 2016 and approximately 180 employees, is one of the largest leveraged finance-focused alternative asset managers in the world and is the largest manager of CLOs globally. The investment portfolios of the funds we manage or sub-advise predominantly consist of loans and securities of non-investment grade companies spread across the capital structure including senior debt, subordinated debt, preferred stock and common equity.
The GSO business is organized into three overarching strategies: performing credit, distressed and long only. Our performing credit strategies include mezzanine lending funds, business development companies (“BDCs”) that we sub-advise and other performing credit strategy funds. Our distressed strategies include hedge fund strategies, rescue lending funds and distressed energy strategies. GSO’s long only strategies consist of CLOs, closed end funds, commingled funds and separately managed accounts.
8
Table of Contents
Financial and Other Information by Segment
Financial and other information by segment for the years ended December 31, 2016, 2015 and 2014 is set forth in Note 21. “Segment Reporting” in the “Notes to Consolidated Financial Statements” in “Part II. Item 8. Financial Statements and Supplementary Data” of this filing.
Pátria Investments
On October 1, 2010, we purchased a 40% equity interest in Pátria Investments Limited and Pátria Investimentos Ltda. (collectively, “Pátria”). Pátria is a leading Brazilian alternative asset manager that was founded in 1988. As of December 31, 2016, Pátria’s alternative asset management businesses had $9.4 billion in assets under management, including the management of private equity funds ($4.4 billion), real estate funds ($1.3 billion), infrastructure funds ($3.6 billion) and new initiatives ($225.4 million). Pátria has approximately 245 employees and is led by a group of three managing partners. Our investment in Pátria is a minority, non-controlling investment, which we record using the equity method of accounting. We have representatives on Pátria’s board of directors in proportion to our ownership, but we do not control the day-to-day management of the firm or the investment decisions of their funds, all of which continues to reside with the local Brazilian partners.
Investment Process and Risk Management
We maintain a rigorous investment process across all of our funds, accounts and other investment vehicles. Each fund, account or other vehicle has investment policies and procedures that generally contain requirements and limitations for investments, such as limitations relating to the amount that will be invested in any one investment and the types of industries or geographic regions in which the fund, account or other vehicle will invest, as well as limitations required by law. Our business’ investment committees review and evaluate investment opportunities in a framework that includes a qualitative and quantitative assessment of the key risks of each investment.
Private Equity Funds
Our Private Equity investment professionals are responsible for selecting, evaluating, structuring, diligencing, negotiating, executing, managing and exiting investments, as well as pursuing operational improvements and value creation. After an initial selection, evaluation and diligence process, the relevant team of investment professionals (i.e., the deal team) submits a proposed transaction for review by the review committee of our private equity funds. Review committee meetings are led by an executive committee of several senior managing directors of our Private Equity segment. Following assimilation of the review committee’s input and its decision to proceed, the proposed investment is vetted by the investment committee. The investment committee of our private equity funds is composed of Stephen A. Schwarzman, Hamilton E. James, Joseph Baratta, Global Head of Private Equity, and selected senior managing directors of our Private Equity segment, including individuals based on the location and sector of the proposed transaction. The investment committee is responsible for approving all investment decisions made on behalf of our private equity funds. Considerations that the investment committee takes into account when evaluating an investment include the quality of a business in which the fund proposes to invest and the quality of the management team of such business, expected levered and unlevered returns of the investment in a variety of investment scenarios, the ability of the company in which the investment is made to service debt in a range of economic and interest rate environments, environmental, social and governance, or ESG, issues and macroeconomic trends in the relevant geographic region.
The investment professionals of our private equity funds are responsible for monitoring an investment once it is made and for making recommendations with respect to exiting an investment. In addition to members of a deal team and our portfolio operations group, which is responsible for assisting in enhancing portfolio companies’ operations and value, all professionals in our private equity business meet several times each year to review the performance of the funds’ portfolio companies.
Our Tactical Opportunities business has a substantially similar process to the Private Equity process described above, with the exception of the composition of the review and investment committee. The Tactical Opportunities
9
Table of Contents
review committee is comprised of the senior managing directors and managing directors of the Tactical Opportunities business and a senior managing director of our Private Equity business, and the investment committee is comprised of Mr. Schwarzman, Mr. James, the business heads of Blackstone’s Private Equity, Real Estate and Credit businesses, and certain other senior managing directors.
Our Strategic Partners business seeks capital appreciation through the purchase of secondary interests in mature, high-quality private equity funds from investors seeking liquidity. After rigorous, highly analytical investment due diligence, the Strategic Partners investment professionals present a proposed transaction to the group’s investment committee. The Strategic Partners investment committee is made up of senior members of the Strategic Partners team, including all of the group’s Senior Managing Directors. The investment committee meets to review, and decide whether to approve or deny, transactions. The investment professionals on the Strategic Partners team are responsible for monitoring each investment once it is made. In addition to members of the investment team, and given the large number of underlying investments, the Strategic Partners Finance team will also track investment valuations pursuant to the group’s valuation policies and procedures.
Real Estate Funds
Our Real Estate investment professionals are responsible for selecting, evaluating, structuring, diligencing, negotiating, executing, managing, monitoring and exiting investments, as well as pursuing operational improvements and value creation. Our real estate operation has an investment committee similar to that described under “— Private Equity Funds.” After an initial selection, evaluation and diligence process, the relevant team of investment professionals (i.e., the deal team) will present a proposed transaction at a weekly meeting of the investment committee. The real estate investment committee, which includes Mr. Schwarzman, Mr. James, Jonathan D. Gray, Global Head of Real Estate, and the senior managing directors in the Real Estate segment, scrutinizes potential transactions, provides guidance and instructions at the appropriate stage of the transaction and approves the investments. Considerations that the investment committee takes into account when evaluating an investment include current and anticipated market fundamentals (including, for example, supply and demand fundamentals) and macroeconomic trends in the relevant geographic region, the quality of the asset in which the fund proposes to invest, the appropriateness of existing or planned leverage levels of the business or asset and our ability to successfully implement operational plans and improvements and exit the investment at an expected rate of return. Deal team members and our asset management group are responsible for monitoring and enhancing investments’ operations and value.
Hedge Fund Solutions
Before deciding to invest in a new hedge fund or with a new hedge fund manager, our Hedge Fund Solutions team conducts extensive due diligence, including an on-site “front office” review of the fund’s/manager’s performance, investment terms, investment strategy and investment personnel, a “back office” review of the fund’s/manager’s operations, processes, risk management and internal controls, industry reference checks and a legal review of the investment structures and legal documents. Once initial due diligence procedures are completed and the investment and other professionals are satisfied with the results of the review, the team will present the potential investment to the relevant Hedge Fund Solutions investment committee. The investment committees are comprised of relevant senior managing directors and senior investment personnel. Existing investments are reviewed and monitored on a regular and continuous basis, and J. Tomilson Hill, CEO of the Hedge Fund Solutions group and Vice Chairman of Blackstone, and other senior members of our Hedge Fund Solutions team meet regularly with Mr. Schwarzman and Mr. James to review the group’s business and affairs
Credit
Each of our credit-focused funds has an investment committee similar to that described under “— Private Equity Funds.” The investment committees for the credit-focused funds, which typically include Bennett J. Goodman and J. Albert Smith III and senior members of the respective investment teams associated with each
10
Table of Contents
credit-focused fund, review potential transactions, provide input regarding the scope of due diligence and approve recommended investments and dispositions, subject to delineated exceptions set forth in the funds’ investment charters. In addition, senior members of GSO, including Mr. Goodman and Mr. Smith III, meet regularly with Mr. Schwarzman and Mr. James to discuss investment and risk management activities and market conditions.
The investment decisions for the customized credit long only clients and other clients whose portfolios are actively traded are made by separate investment committees, each of which is composed of certain of the group’s respective senior managing directors, managing directors and other investment professionals. With limited exceptions where the portfolio managers wish to capitalize on time sensitive market opportunities, the investment committee approves all assets that are held by the applicable client. The investment team is staffed by professionals within research, portfolio management, trading and capital formation to ensure active management of the portfolios. Industry-focused research analysts provide the committee with a formal and comprehensive review of any new investment recommendation, while our portfolio managers and trading professionals provide opinions on other technical aspects of the recommendation as well as the risks associated with the overall portfolio composition. Investments are subject to predetermined periodic reviews to assess their continued fit within the funds. Our research team monitors the operating performance of the underlying issuers, while portfolio managers, in concert with our traders, focus on optimizing asset composition to maximize value for our investors.
Structure and Operation of Our Investment Vehicles
Our private investment funds are generally organized as limited partnerships with respect to U.S. domiciled vehicles and limited liability (and other similar) companies with respect to non-U.S. domiciled vehicles. In the case of our separately managed accounts, the investor, rather than us, generally controls the investment vehicle that holds or has custody of the investments we advise the vehicle to make. We conduct the sponsorship and management of our carry funds and other similar vehicles primarily through a partnership structure in which limited partnerships organized by us accept commitments and/or funds for investment from institutional investors and, to a more limited extent, high net worth individuals. Such commitments are generally drawn down from investors on an as-needed basis to fund investments over a specified term. With the exception of certain core+ real estate and real estate debt funds, our private equity and private real estate funds are commitment structured funds. For certain core+ real estate and real estate debt funds, all or a portion of the committed capital is funded on or promptly after the investor’s subscription date and cash proceeds resulting from the disposition of investments can be reused indefinitely for further investment, subject to certain investor withdrawal rights. Our Real Estate business also includes a NYSE-listed REIT, BXMT, a non-exchange traded REIT, and a registered open-ended investment company complex, each of which is externally managed or advised by Blackstone-owned entities. Our credit-focused funds are generally commitment structured funds or open-ended where the investor’s capital is fully funded into the fund upon or soon after the subscription for interests in the fund. Ten credit-focused vehicles that we manage or sub-advise in whole or in part are registered investment companies (including BDCs). The CLO vehicles we manage are structured investment vehicles that are generally private companies with limited liability. Most of our funds of hedge funds as well as our hedge funds are structured as funds where the investor’s capital is fully funded into the fund upon the subscription for interests in the fund.
Our investment funds, separately managed accounts and other vehicles are generally advised by a Blackstone entity serving as investment adviser that is registered under the U.S. Investment Advisers Act of 1940, or “Advisers Act.” Substantially all of the day-to-day operations of each investment vehicle are typically carried out by the Blackstone entity serving as investment adviser pursuant to an investment advisory (or similar) agreement. Generally, the material terms of our investment advisory agreements relate to the scope of services to be rendered by the investment adviser to the applicable vehicle, the calculation of management fees to be borne by investors in our investment vehicles, the calculation of and the manner and extent to which other fees received by the investment adviser from funds or fund portfolio companies serve to offset or reduce the management fees payable by investors in our investment vehicles and certain rights of termination with respect to our investment advisory agreements. With the exception of the registered funds described below, the investment vehicles themselves do not generally register as investment companies under the U.S. Investment Company Act of 1940, or “1940 Act,” in reliance on the
11
Table of Contents
statutory exemptions provided by Section 3(c)(7) or Section 7(d) thereof or, typically in the case of vehicles formed prior to 1997, Section 3(c)(1) thereof. Section 3(c)(7) of the 1940 Act exempts from its registration requirements investment vehicles privately placed in the United States whose securities are owned exclusively by persons who, at the time of acquisition of such securities, are “qualified purchasers” as defined under the 1940 Act. Section 3(c)(1) of the 1940 Act exempts from its registration requirements privately placed investment vehicles whose securities are beneficially owned by not more than 100 persons. In addition, under current interpretations of the SEC, Section 7(d) of the 1940 Act exempts from registration any non-U.S. investment vehicle all of whose outstanding securities are beneficially owned either by non-U.S. residents or by U.S. residents that are qualified purchasers. BXMT is externally managed by a Blackstone-owned entity pursuant to a management agreement, conducts its operations in a manner that allows it to maintain its REIT qualification and also avail itself of the statutory exemption provided by Section 3(c)(5)(C) of the 1940 Act for companies engaged primarily in investment in mortgages and other liens or investments in real estate. Our non-exchange traded REIT is externally advised by a Blackstone-owned entity pursuant to an advisory agreement, conducts its operations in a manner that allows it to maintain its REIT qualification and also avails itself of the statutory exemption provided by Section 3(c)(5)(C) of the 1940 Act.
In some cases, one or more of our investment advisers, including within GSO, BAAM and BREDS advisers, advises or sub-advises funds registered under the 1940 Act. In addition to having an investment adviser, each investment fund that is a limited partnership, or “partnership” fund, also has a general partner that generally makes all operational and investment decisions, including the making, monitoring and disposing of investments. The limited partners of the partnership funds take no part in the conduct or control of the business of the investment funds, have no right or authority to act for or bind the investment funds and have no influence over the voting or disposition of the securities or other assets held by the investment funds. With the exception of certain of our funds of hedge funds, hedge funds, certain credit-focused funds, and other funds or separately managed accounts for the benefit of one or more specified investors, third party investors in our funds have the right to remove the general partner of the fund or to accelerate the liquidation date of the investment fund without cause by a simple majority vote. In addition, the governing agreements of our investment funds provide that in the event certain “key persons” in our investment funds do not meet specified time commitments with regard to managing the fund, then investors in certain funds have the right to vote to terminate the investment period by a specified percentage (including, in certain cases a simple majority) vote in accordance with specified procedures, accelerate the withdrawal of their capital on an investor-by-investor basis, or the fund’s investment period will automatically terminate and the vote of a simple majority of investors is required to restart it. In addition, the governing agreements of some of our investment funds provide that investors have the right to terminate, for any reason, the investment period by a vote of 75% of the investors in such fund.
Incentive Arrangements / Fee Structure
Management Fees
The following describes the management fees received by the Blackstone investment advisers.
| • | The investment adviser of each of our carry funds generally receives an annual management fee based upon a percentage of the fund’s capital commitments, invested capital and/or undeployed capital during the investment period and the fund’s invested capital or investment fair value after the investment period, except that the investment advisers to certain of our credit-focused carry/incentive funds and core+ real estate funds receive an annual management fee that is based upon a percentage of invested capital or net asset value throughout the term of the fund. These management fees are payable on a regular basis (typically quarterly) in the contractually prescribed amounts over the life of the fund. Depending on the base upon which management fees are calculated, negative performance of one or more investments in the fund may reduce the total management fee paid, but not the fee rate. |
| • | The investment adviser of each of our funds that are structured like hedge funds, or of our funds of hedge funds, registered mutual funds and separately managed accounts that invest in hedge funds, generally receives an annual management fee that is based upon a percentage of the fund’s or account’s net asset |
12
Table of Contents
| value. These management fees are also payable on a regular basis (typically quarterly). These funds often afford investors increased liquidity through annual, semi-annual or quarterly, or in the case of registered mutual funds, daily, withdrawal or redemption rights, in some cases following the expiration of a specified period of time when capital may not be withdrawn. The amount of management fees to which the investment adviser is entitled with respect thereto will proportionately increase as the net asset value of each investor’s capital account grows and will proportionately decrease as the net asset value of each investor’s capital account decreases. |
| • | The investment adviser of each of our CLOs typically receives annual management fees based upon a percentage of each fund’s assets, subject to certain performance measures related to the underlying assets the vehicle owns, and additional management fees which are incentive-based (that is, subject to meeting certain return criteria). These management fees are also payable on a regular basis (typically quarterly). The term of each CLO varies from deal to deal and may be subject to early redemption or extension; typically, however, a CLO will be wound down within eight to eleven years of being launched. While the management fees tend to be approximately 0.5% per annum of each fund’s aggregate par amount of collateral assets, including principal cash, for the term of the deal, the quantum of fees will decrease as the fund deleverages toward the end of its term. |
| • | The investment adviser of our separately managed accounts generally receives annual management fees typically based upon a percentage of each account’s net asset value or invested capital. The management fees we receive from our separately managed accounts are generally paid on a regular basis (typically quarterly) and may alternatively be based on invested capital or proportionately increase or decrease based on the net asset value of the separately managed account. The management fees we are paid for managing a separately managed account will generally be subject to contractual rights the investor has to terminate our management of an account on as short as 30 days’ prior notice. |
| • | The investment adviser of each of our credit-focused registered and non-registered investment companies typically receives annual management fees based upon a percentage of each company’s net asset value or total managed assets. The management fees we receive from the registered investment companies we manage are generally paid on a regular basis (typically quarterly) and proportionately increase or decrease based on the net asset value or gross assets of the investment company. The management fees we are paid for managing the investment company will generally be subject to contractual rights the company’s board of directors (or, in the case of the BDCs we sub-advise, the investment adviser) has to terminate our management of an account on as short as 30 days’ prior notice. |
| • | The investment adviser of BXMT receives annual management fees based upon a percentage of BXMT’s net proceeds received from equity offerings and accumulated “core earnings” (which is generally equal to its net income, calculated under accounting principles generally accepted in the United States of America (“GAAP”), excluding certain non-cash and other items), subject to certain adjustments. The management fees we receive from managing BXMT are paid quarterly and increase or decrease based on, among other things, BXMT’s net proceeds received from equity offerings and accumulated core earnings (subject to certain adjustments). |
| • | The investment adviser of our non-exchange traded REIT receives a management fee based on a percentage of the REIT’s net asset value, payable monthly. |
For additional information regarding the management fee rates we receive, see “Item 7. Management’s Discussion and Analysis of Financial Condition and Results of Operations — Critical Accounting Policies — Revenue Recognition — Management and Advisory Fees, Net.”
Incentive Fees
The general partners or similar entities of each of our hedge fund structures receive performance based allocation fees (“incentive fees”) of generally up to 20% of the applicable fund’s net capital appreciation per annum, subject to certain net loss carry forward (known as a “high water mark”) and/or other hurdle provisions. In some
13
Table of Contents
cases, the investment adviser of each of our funds of hedge funds, separately managed accounts that invest in hedge funds and certain non-U.S. registered investment companies, is entitled to an incentive fee of generally up to 15% of the applicable investment vehicle’s net appreciation, subject to a high water mark and in some cases a preferred return. In addition, for the BDCs we sub-advise, we receive incentive fees of 10% of the vehicle’s net appreciation per annum (in certain cases paid quarterly), subject to a preferred return. The external manager of BXMT is entitled to an incentive fee, payable quarterly, in an amount, not less than zero, equal to the product of (a) 20% and (b) the excess of (i) BXMT’s core earnings for the previous 12-month period over (ii) an amount equal to 7% per annum multiplied by BXMT’s average outstanding equity (as defined in the management agreement), provided that BXMT’s core earnings over the prior three-year period are greater than zero. The special limited partner, an affiliate of our non-exchange traded REIT, is entitled to a performance participation interest, which is paid annually and accrues monthly, in an amount equal to 12.5% of it’s total return, subject to a 5% hurdle amount and a high water mark with a catch-up. In addition, the general partner of certain core+ real estate funds is entitled to an incentive fee allocation of up to 10% of excess profits, subject to a 7% hurdle amount and a loss recovery amount with a catch-up. Incentive Fees are realized at the end of a measurement period, typically annually for hedge funds and every three years from when a limited partner makes its initial investment for a certain core+ real estate fund. Once realized, such fees are not subject to clawback.
Carried Interest
The general partner or an affiliate of each of our carry funds also receives carried interest from the investment fund. Carried interest entitles the general partner (or an affiliate) to a preferred allocation of income and gains from a fund. Our ability to generate carried interest is an important element of our business and carried interest has historically accounted for a very significant portion of our income.
The carried interest is typically structured as a net profits interest in the applicable fund. In the case of our carry funds, carried interest is calculated on a “realized gain” basis, and each general partner is generally entitled to a carried interest equal to 20% of the net realized income and gains (generally taking into account realized and unrealized losses) generated by such fund, except that the general partners (or affiliates) of certain of our credit-focused funds, real estate debt funds, core+ real estate funds, Tactical Opportunities funds, multi-asset class investment funds and secondary funds of funds, and our core private equity fund, are generally entitled to a carried interest that ranges between 10% and 20%, depending on the specific fund (subject to variation across our business units and funds). Net realized income or loss is not netted between or among funds, and in some cases our carry funds provide for carried interest on current income distributions (subject to certain conditions).
For most carry funds, the carried interest is subject to an annual preferred limited partner return ranging from 5% to 8%, subject to a catch-up allocation to the general partner. Some of our carry funds (e.g., our Tactical Opportunities funds generally) do not provide for a preferred return, and generally the terms of our carry funds vary in certain respects across our business units and vintages. If, at the end of the life of a carry fund (or earlier with respect to certain of our real estate, real estate debt, core+ real estate and multi-asset class and/or opportunistic investment funds), as a result of diminished performance of later investments in a carry fund’s life, (a) the general partner receives in excess of the relevant carried interest percentage(s) applicable to the fund as applied to the fund’s cumulative net profits over the life of the fund, or (in certain cases) (b) the carry fund has not achieved investment returns that exceed the preferred return threshold (if applicable), then we will be obligated to repay an amount equal to the carried interest that was previously distributed to us that exceeds the amounts to which the relevant general partner was ultimately entitled on an after tax basis. This obligation is known as a “clawback” obligation and is an obligation of any person who directly received such carried interest, including us and our employees who participate in our carried interest plans.
Although a portion of any distributions by us to our unitholders may include any carried interest received by us, we do not intend to seek fulfillment of any clawback obligation by seeking to have our unitholders return any portion of such distributions attributable to carried interest associated with any clawback obligation. To the extent we are required to fulfill a clawback obligation, however, our general partner may determine to decrease the amount
14
Table of Contents
of our distributions to common unitholders. The clawback obligation operates with respect to a given carry fund’s own net investment performance only and carried interest of other funds is not netted for determining this contingent obligation. Moreover, although a clawback obligation is several, the governing agreements of most of our funds provide that to the extent another recipient of carried interest (such as a current or former employee) does not fund his or her respective share of the clawback obligation then due, then we and our employees who participate in such carried interest plans may have to fund additional amounts (generally an additional 50-67%) although we retain the right to pursue any remedies that we have under such governing agreements against those carried interest recipients who fail to fund their obligations. We have recorded a contingent repayment obligation equal to the amount that would be due on December 31, 2016, if the various carry funds were liquidated at their current carrying value.
For additional information concerning the clawback obligations we could face, see “Item 1A. Risk Factors — We may not have sufficient cash to pay back ‘clawback’ obligations if and when they are triggered under the governing agreements with our investors.”
Advisory and Transaction Fees
Some of our investment advisers, particularly real estate and credit advisers, receive customary fees (for example, acquisition, origination and other transaction fees) upon consummation of their funds’ transactions, and may from time to time receive advisory, monitoring and other fees in connection with their activities. The transaction fees that they receive are generally calculated as a percentage (that generally can range up to 3%) of the total value of the acquired asset or the par value of the originated loan, as applicable. For most of the funds where we receive such fees, we are required to reduce the management fees charged to the funds’ limited partners by 50% to 100% of such limited partner’s share of such fees.
Capital Invested In and Alongside Our Investment Funds
To further align our interests with those of investors in our investment funds, we have invested the firm’s capital and that of our personnel in the investment funds we sponsor and manage. Minimum general partner capital commitments to our investment funds are determined separately with respect to our investment funds and, generally, are less than 5% of the limited partner commitments of any particular fund. See “Part II. Item 7. Management’s Discussion and Analysis of Financial Condition and Results of Operations — Liquidity Needs” for more information regarding our minimum general partner capital commitments to our funds. We determine whether to make general partner capital commitments to our funds in excess of the minimum required commitments based on, among other things, our anticipated liquidity, working capital and other capital needs. In many cases, we require our senior managing directors and other professionals to fund a portion of the general partner capital commitments to our funds. In other cases, we may from time to time offer to our senior managing directors and employees a part of the funded or unfunded general partner commitments to our investment funds. Our general partner capital commitments are funded with cash and not with carried interest or deferral of management fees.
Investors in many of our funds also receive the opportunity to make additional “co-investments” with the investment funds. Our personnel, as well as Blackstone itself, also have the opportunity to make co-investments, which we refer to as “side-by-side investments,” with many of our carry funds. Co-investments and side-by-side investments are investments in portfolio companies or other assets on the same terms and conditions as those acquired by the applicable fund. Co-investments refer to investments arranged by us that are made by our limited partner investors (and other investors in some instances) in a portfolio company or other assets alongside an investment fund. In certain cases, limited partner investors may pay additional management fees or carried interest in connection with such co-investments. Side-by-side investments are similar to co-investments but are made by directors, officers, senior managing directors, employees and certain affiliates of Blackstone. These investments are generally made pursuant to a binding election, subject to certain limitations, made once a year for the estimated activity during the ensuing 12 months under which those persons are permitted to make investments alongside a particular carry fund in all transactions of that fund for that year. Side-by-side investments are funded in cash and are not generally subject to management fees or carried interest.
15
Table of Contents
Competition
The asset management industry is intensely competitive, and we expect it to remain so. We compete both globally and on a regional, industry and niche basis. We compete on the basis of a number of factors, including investment performance, transaction execution skills, access to capital, access to and retention of qualified personnel, reputation, range of products and services, innovation and price.
We face competition both in the pursuit of outside investors for our investment funds and in acquiring investments in attractive portfolio companies and making other investments. Although many institutional and individual investors have increased the amount of capital they commit to alternative investment funds, such increases may create increased competition with respect to fees charged by our funds. Certain institutional investors are demonstrating a preference to in-source their own investment professionals and to make direct investments in alternative assets without the assistance of private equity advisers like us. Such institutional investors may become our competitors and could cease to be our clients.
Depending on the investment, we face competition primarily from sponsors managing other private equity funds, specialized investment funds, hedge funds and other pools of capital, other financial institutions including sovereign wealth funds, corporate buyers and other parties. Several of these competitors have significant amounts of capital and many of them have investment objectives similar to ours, which may create additional competition for investment opportunities. Some of these competitors may also have a lower cost of capital and access to funding sources or other resources that are not available to us, which may create competitive disadvantages for us with respect to investment opportunities. In addition, some of these competitors may have higher risk tolerances, different risk assessments or lower return thresholds, which could allow them to consider a wider variety of investments and to bid more aggressively than us for investments that we want to make. Corporate buyers may be able to achieve synergistic cost savings with regard to an investment or be perceived by sellers as otherwise being more desirable bidders, which may provide them with a competitive advantage in bidding for an investment.
In all of our businesses, competition is also intense for the attraction and retention of qualified employees. Our ability to continue to compete effectively in our businesses will depend upon our ability to attract new employees and retain and motivate our existing employees.
For additional information concerning the competitive risks that we face, see “Item 1A. Risk Factors — Risks Related to Our Business — The asset management business is intensely competitive.”
Employees
As of December 31, 2016, we employed approximately 2,240 people, including our 123 senior managing directors. We strive to maintain a work environment that fosters professionalism, excellence, integrity and cooperation among our employees.
Regulatory and Compliance Matters
Our businesses, as well as the financial services industry generally, are subject to extensive regulation in the United States and elsewhere.
All of the investment advisers of our investment funds operating in the U.S. are registered as investment advisers with the SEC (other investment advisers are registered in non-U.S. jurisdictions). Registered investment advisers are subject to the requirements and regulations of the Advisers Act. Such requirements relate to, among other things, fiduciary duties to clients, maintaining an effective compliance program, solicitation agreements, conflicts of interest, recordkeeping and reporting requirements, disclosure requirements, limitations on agency cross and principal transactions between an adviser and advisory clients, and general anti-fraud prohibitions.
16
Table of Contents
Blackstone Advisory Partners L.P., a subsidiary of ours through which we conduct our capital markets services business and certain of our fund marketing and distribution, is registered as a broker-dealer with the SEC and is subject to regulation and oversight by the SEC, is a member of the Financial Industry Regulatory Authority, or “FINRA,” and is registered as a broker-dealer in 50 states, the District of Columbia, the Commonwealth of Puerto Rico and the Virgin Islands. In addition, FINRA, a self-regulatory organization that is subject to oversight by the SEC, adopts and enforces rules governing the conduct, and examines the activities, of its member firms, including our broker-dealer entity. State securities regulators also have regulatory or oversight authority over our broker-dealer entity.
Broker-dealers are subject to regulations that cover all aspects of the securities business, including, among others, the implementation of a supervisory control system over the securities business, advertising and sales practices, conduct of and compensation in connection with public securities offerings, maintenance of adequate net capital, record keeping and the conduct and qualifications of employees. In particular, as a registered broker-dealer and member of FINRA, Blackstone Advisory Partners L.P. is subject to the SEC’s uniform net capital rule, Rule 15c3-1. Rule 15c3-1 specifies the minimum level of net capital a broker-dealer must maintain and also requires that a significant part of a broker-dealer’s assets be kept in relatively liquid form. The SEC and various self-regulatory organizations impose rules that require notification when net capital falls below certain predefined criteria, limit the ratio of subordinated debt to equity in the capital structure of a broker-dealer and constrain the ability of a broker-dealer to expand its business under certain circumstances. Additionally, the SEC’s uniform net capital rule imposes certain requirements that may have the effect of prohibiting a broker-dealer from distributing or withdrawing capital and requiring prior notice to the SEC for certain withdrawals of capital.
In addition, certain of the closed-end and open-end mutual funds and investment management companies we manage, advise or sub-advise are registered under the 1940 Act. The 1940 Act and the rules thereunder govern, among other things, the relationship between us and such investment vehicles and limit such investment vehicles’ ability to enter into certain transactions with us or our affiliates, including other funds managed, advised or sub-advised by us.
Pursuant to the U.K. Financial Services and Markets Act 2000, or “FSMA,” certain of our subsidiaries are subject to regulations promulgated and administered by the Financial Conduct Authority (“FCA”). The Blackstone Group International Partners LLP and GSO Capital Partners International LLP are both authorized and regulated by the FCA in the United Kingdom. The FSMA and rules promulgated thereunder form the cornerstone of legislation which governs all aspects of our investment business in the United Kingdom, including sales, research and trading practices, provision of investment advice, use and safekeeping of client funds and securities, regulatory capital, record keeping, approval standards for individuals, anti-money laundering, periodic reporting and settlement procedures. Blackstone Property Management Limited is authorized and regulated by the FCA in the United Kingdom as a property management and advisory company with the ability to administer contracts of insurance.
Blackstone/GSO Debt Funds Management Europe Limited is authorized by the Central Bank of Ireland as an Investment Firm under the European Communities (Markets in Financial Instruments) Regulations 2007. Blackstone/GSO Debt Funds Management Europe II Limited is authorized by the Central Bank of Ireland as an Alternative Investment Fund Manager under the European Union Alternative Investment Fund Managers Regulations 2013. The Blackstone Group Denmark ApS is regulated as an investment adviser by the Danish Financial Supervisory Authority. Certain Blackstone operating entities are licensed and subject to regulation by financial regulatory authorities in Japan, Hong Kong, Australia and Singapore: The Blackstone Group Japan K.K., a financial instruments firm, is registered with Kanto Local Finance Bureau (Kin-sho) and regulated by the Japan Financial Services Agency; The Blackstone Group (HK) Limited is regulated by the Hong Kong Securities and Futures Commission; The Blackstone Group (Australia) Pty Limited ACN 149 142 058 and Blackstone Real Estate Australia Pty Limited ACN 604 167 651 each holds an Australian financial services license authorizing it to provide financial services in Australia (AFSL 408376 and AFSL 485716, respectively) and is regulated by the Australian Securities and Investments Commission; and The Blackstone Singapore Pte. Ltd is regulated by the Monetary Authority of Singapore (Company Registration Number: 201020503E).
17
Table of Contents
The SEC and various self-regulatory organizations and state securities regulators have in recent years increased their regulatory activities, including regulation, examination and enforcement in respect of asset management firms.
As described above, certain of our businesses are subject to compliance with laws and regulations of U.S. federal and state governments, non-U.S. governments, their respective agencies and/or various self-regulatory organizations or exchanges relating to, among other things, marketing of investment products, disclosure and the privacy of client information, and any failure to comply with these regulations could expose us to liability and/or damage our reputation. Our businesses have operated for many years within a legal framework that requires our being able to monitor and comply with a broad range of legal and regulatory developments that affect our activities. However, additional legislation, changes in rules promulgated by self-regulatory organizations or changes in the interpretation or enforcement of existing laws and rules, either in the United States or elsewhere, may directly affect our mode of operation and profitability.
Rigorous legal and compliance analysis of our businesses and investments is endemic to our culture and risk management. Our Chief Legal Officer and Global Head of Compliance, together with the Chief Compliance Officers of each of our businesses, supervise our compliance personnel, who are responsible for addressing all regulatory and compliance matters that affect our activities. We strive to maintain a culture of compliance through the use of policies and procedures such as codes of conduct, compliance systems, testing and monitoring, communication of compliance guidance and employee education and training. Our compliance policies and procedures address a variety of regulatory and compliance matters such as the handling of material non-public information, personal securities trading, marketing practices, gifts and entertainment, valuation of investments on a fund-specific basis, document retention, potential conflicts of interest, the allocation of investment opportunities, collection of fees and expense allocation.
Our compliance group also monitors the information barriers that we maintain between the public and private sides of Blackstone’s businesses. We believe that our various businesses’ access to the intellectual knowledge and contacts and relationships that reside throughout our firm benefits all of our businesses. To maximize that access without compromising compliance with our legal and contractual obligations, our compliance group oversees and monitors the communications between groups that are on the private side of our information barrier and groups that are on the public side, as well as between different public side groups. Our compliance group also monitors contractual obligations that may be impacted and potential conflicts that may arise in connection with these inter-group discussions.
In addition, disclosure controls and procedures and internal controls over financial reporting are documented, tested and assessed for design and operating effectiveness in compliance with the U.S. Sarbanes-Oxley Act of 2002 (“Sarbanes-Oxley”). We have an Internal Audit department with a global mandate and dedicated resources that provides risk-based audit, Sarbanes-Oxley compliance and advisory practices. Internal Audit, which reports directly to the audit committee of the board of directors of our general partner, aims to provide reasonable, independent, and objective assurance to our management and the board of directors of our general partner that risks are well managed and that controls are appropriate and effective.
Our enterprise risk management practices include review and monitoring of our business, investment and other key risks at various levels, including at the fund, business unit and corporate level. Committees comprised of members of management and representatives of various business units and corporate functions consider and evaluate legal, reputational, operational, control and other risks attendant to our business. In addition, senior management regularly reports to the audit committee of the board of directors of our general partner on risk matters, including by providing periodic risk reports, an overview of management’s view of key risks to the firm and detailed assessments of selected risks.
There are a number of pending or recently enacted legislative and regulatory initiatives in the United States and in Europe that could significantly affect our business. Please see “Item 1A. Risk Factors — Risks Related to Our Business — Regulatory changes in the United States could adversely affect our business” and “Item 1A. Risk
18
Table of Contents
Factors — Risks Related to Our Business — Recent regulatory changes in jurisdictions outside the United States could adversely affect our business.”
Available Information
The Blackstone Group L.P. is a Delaware limited partnership that was formed on March 12, 2007.
We file annual, quarterly and current reports and other information with the SEC. These filings are available to the public over the internet at the SEC’s website at www.sec.gov. You may also read and copy any document we file at the SEC’s public reference room located at 100 F Street, N.E., Washington, D.C. 20549. Please call the SEC at 1-800-SEC-0330 for further information on the public reference room.
Our principal internet address is www.blackstone.com. We make available free of charge on or through www.blackstone.com our annual reports on Form 10-K, quarterly reports on Form 10-Q, current reports on Form 8-K, and amendments to those reports, as soon as reasonably practicable after we electronically file such material with, or furnish it to, the SEC. The contents of our website are not, however, a part of this report.
| ITEM 1A. | RISK FACTORS |
Risks Related to Our Business
Difficult market conditions can adversely affect our business in many ways, including by reducing the value or performance of the investments made by our investment funds and reducing the ability of our investment funds to raise or deploy capital, each of which could materially reduce our revenue, earnings and cash flow and adversely affect our financial prospects and condition.
Our business is materially affected by conditions in the global financial markets and economic conditions or events throughout the world that are outside our control, including but not limited to changes in interest rates, availability of credit, inflation rates, economic uncertainty, changes in laws (including laws relating to taxation), trade barriers, commodity prices, currency exchange rates and controls and national and international political circumstances (including wars, terrorist acts or security operations). These factors may affect the level and volatility of securities prices and the liquidity and the value of investments, and we may not be able to or may choose not to manage our exposure to these market conditions and/or other events. In the event of a market downturn each of our businesses could be affected in different ways.
Turmoil in the global financial markets, such as occurred in 2008-2009, can provoke significant volatility of equity and debt securities prices. This can have a material and rapid impact on our mark-to-market valuations particularly with respect to our public holdings and credit investments. As publicly traded equity securities have in recent years represented a significant proportion of the assets of many of our carry funds, stock market volatility may have a greater impact on our reported results than in the past and declines in the stock market may adversely affect our results, including our revenues and net income. A lack of credit resulting from turmoil in the global financial markets in the future may materially hinder the initiation of new, large-sized transactions for our private equity and real estate segments and adversely impact our operating results. Although base rates are inside of historical averages and financing costs remain low, there is some concern that the monetary policy of central banks, including of the U.S. Federal Reserve, potential tax and regulatory reform, and other market factors may lead to rising interest rates and adversely impact the cost and availability of credit, as well as the value of our investments. In addition, many emerging economies continue to experience weakness, tighter credit conditions and a decreased availability of foreign capital. A strong U.S. dollar, which could be associated with rising interest rates and pro-export policies, could have an adverse impact on economic growth in emerging economies. In addition, 2016 was a year of significant financial market volatility and geopolitical change, including, among other major events, the U.K. vote to leave the European Union (“Brexit”). Although the long-term impact on economic conditions is uncertain, Brexit may have an adverse effect on the rate of economic growth in the U.K. and Europe, which may negatively impact real estate and other asset values in those regions.
19
Table of Contents
Although interest rates have been at historically low levels for the last few years, the U.S. Federal Reserve raised rates in late 2016 and has indicated an intention to continue raising rates in 2017. A period of sharply rising interest rates could create downward pressure on the price of real estate and increase the cost of debt financing for the transactions we pursue, each of which may have an adverse impact on our business.
Many investments made by our funds are highly illiquid, and we may not be able to realize investments in a timely manner. During early 2016, for example, volatile equity and credit markets resulted in reduced opportunities for our funds to exit and realize value from their existing investments. Although volatility has subsided in recent months and opportunities for exit through the equity markets have increased, uncertainty surrounding potential changes to governmental policy may impact these market conditions. Although the equity markets are not the only means by which we exit investments, should we experience another period of challenging equity markets, our funds may experience increased difficulty in realizing value from investments. We are unable to predict whether and to what extent uncertainty surrounding economic and market conditions will be reduced, and even in the absence of uncertainty, adverse conditions and/or other events in particular sectors may cause our performance to suffer further.
Challenging market and economic conditions have also made it and may in the future make it more difficult and competitive to find suitable investments for the funds to effectively deploy capital. This could adversely affect our performance and ability to raise new funds. During periods of difficult market conditions or slowdowns (which may be across one or more industries, sectors or geographies), our funds’ portfolio companies may experience adverse operating performance, decreased revenues, credit rating downgrades, financial losses, difficulty in obtaining access to financing and increased funding costs. Negative financial results in our investment funds’ portfolio companies may result in lower investment returns for our investment funds, which could materially and adversely affect our ability to raise new funds as well as our operating results and cash flow. To the extent the operating performance of those portfolio companies (as well as valuation multiples) do not improve or other portfolio companies experience adverse operating performance, our investment funds may sell those assets at values that are less than we projected or even a loss, thereby significantly affecting those investment funds’ performance and consequently our operating results and cash flow. During such periods of weakness, our investment funds’ portfolio companies may also have difficulty expanding their businesses and operations or meeting their debt service obligations or other expenses as they become due, including expenses payable to us. Furthermore, such negative market conditions could potentially result in a portfolio company entering bankruptcy proceedings, thereby potentially resulting in a complete loss of the fund’s investment in such portfolio company and a significant negative impact to the investment fund’s performance and consequently to our operating results and cash flow, as well as to our reputation. In addition, negative market conditions would also increase the risk of default with respect to investments held by our investment funds that have significant debt investments, such as our credit-focused funds. Estimates or projections of market conditions, commodity prices and supply and demand dynamics are key factors in evaluating potential investment opportunities and valuing the investments made by our funds. These estimates are subject to wide variances based on changes in market conditions, underlying assumptions, commodity prices and technical or investment-related assumptions.
In addition, the performance of the investments made by our credit and private equity funds in the energy and natural resources markets are also subject to a high degree of market risk given, among other matters, the volatility of commodity prices. See “— Investments by our funds in the power and energy industries involve various operational, construction, regulatory and market risks that could adversely affect our results of operations, liquidity and financial condition.”
Our operating performance may also be adversely affected by our fixed costs and other expenses and the possibility that we would be unable to scale back other costs within a time frame sufficient to match any decreases in revenue relating to changes in market and economic conditions. In order to reduce expenses in the face of a difficult economic environment, we may need to cut back or eliminate the use of certain services or service providers, or terminate the employment of a significant number of our personnel that, in each case, could be important to our business and without which our operating results could be adversely affected.
20
Table of Contents
Changes in the debt financing markets could negatively impact the ability of our funds and their portfolio companies to obtain attractive financing or refinancing for their investments and could increase the cost of such financing if it is obtained, which could lead to lower-yielding investments and potentially decrease our net income.
A significant contraction in the market for debt financing, such as the contraction that occurred in 2008 and 2009 or other adverse change relating to the terms of debt financing (such as, for example, higher rates, higher equity requirements, and/or more restrictive covenants), particularly in the area of acquisition financings for private equity and real estate transactions, could have a material adverse impact on our business. In addition, the financing of acquisitions or the operations of our funds’ portfolio companies with debt could also become less attractive to the extent the deductibility of corporate interest expense is limited. See “— Possible U.S. federal income tax reform, could adversely affect us.” If our funds are unable to obtain committed debt financing for potential acquisitions, can only obtain debt financing at an increased interest rate or on unfavorable terms or the ability to deduct corporate interest expense is limited, our funds may have difficulty completing otherwise profitable acquisitions or may generate profits that are lower than would otherwise be the case, either of which could lead to a decrease in our revenues. Similarly, our funds’ portfolio companies regularly utilize the corporate debt markets in order to obtain financing for their operations. To the extent that the credit markets and/or regulatory or tax changes render such financing difficult to obtain, more expensive or otherwise less attractive, this may also negatively impact the financial results of those portfolio companies and, therefore, the investment returns on our funds. In addition, to the extent that market conditions and/or regulatory changes make it difficult or impossible to refinance debt that is maturing in the near-term, some of our funds’ portfolio companies may be unable to repay such debt at maturity and may be forced to sell assets, undergo a recapitalization or seek bankruptcy protection.
A decline in the pace or size of investment made by our funds may adversely affect our revenues.
The revenues that we earn are driven in part by the pace at which our funds make investments and the size of those investments, and a decline in the pace or the size of such investments may reduce our revenues. Many factors could cause such a decline in the pace of investment, including high prices, the inability of our investment professionals to identify attractive investment opportunities, competition for such opportunities among other potential acquirers, decreased availability of capital on attractive terms and our failure to consummate identified investment opportunities because of business, regulatory or legal complexities or uncertainty and adverse developments in the U.S. or global economy or financial markets. In addition, an increase in the pace at which our funds exit investments could reduce the fee revenue we earn if such exits are not offset by new commitments and investments.
Our revenue, earnings, net income and cash flow are all highly variable, which may make it difficult for us to achieve steady earnings growth on a quarterly basis and may cause the price of our common units to decline.
Our revenue, net income and cash flow are all highly variable. For example, our cash flow may fluctuate significantly due to the fact that we receive carried interest from our carry funds only when investments are realized and achieve a certain preferred return. In addition, transaction fees received by our carry funds can vary significantly from quarter to quarter. We may also experience fluctuations in our results, including our revenue and net income, from quarter to quarter due to a number of other factors, including changes in the valuations of our funds’ investments, changes in the amount of distributions, dividends or interest paid in respect of investments, changes in our operating expenses, the degree to which we encounter competition and general economic and market conditions. In particular, economic and market conditions may lead to volatility in the mark-to-market valuations of investments made by our funds, particularly in respect of our public investments. The valuations of investments made by our funds could also be subject to high volatility as a result of uncertainty regarding governmental policy with respect to, among other things, tax reform, financial services regulation, international trade, immigration, healthcare, labor, infrastructure and energy. Achieving steady growth in net income and cash flow on a quarterly basis may be difficult, which could in turn lead to large adverse movements or general increased volatility in the price of our common units.
21
Table of Contents
The timing and receipt of carried interest generated by our carry funds is uncertain and will contribute to the volatility of our results. Carried interest depends on our carry funds’ performance and opportunities for realizing gains, which may be limited. It takes a substantial period of time to identify attractive investment opportunities, to raise all the funds needed to make an investment and then to realize the cash value (or other proceeds) of an investment through a sale, public offering, recapitalization or other exit. Even if an investment proves to be profitable, it may be a number of years before any profits can be realized in cash (or other proceeds). We cannot predict when, or if, any realization of investments will occur. In addition, upon the realization of a profitable investment by any of our carry funds and prior to us receiving any carried interest in respect of that investment, 100% of the proceeds of that investment must generally be paid to the investors in that carry fund until they have recovered certain fees and expenses and achieved a certain return on all realized investments by that carry fund as well as a recovery of any unrealized losses. If we were to have a realization event in a particular quarter, it may have a significant impact on our results for that particular quarter which may not be replicated in subsequent quarters. We recognize revenue on investments in our investment funds based on our allocable share of realized and unrealized gains (or losses) reported by such investment funds, and a decline in realized or unrealized gains, or an increase in realized or unrealized losses, would adversely affect our revenue and possibly cash flow, which could further increase the volatility of our quarterly results. Because our carry funds have preferred return thresholds to investors that need to be met prior to Blackstone receiving any carried interest, substantial declines in the carrying value of the investment portfolios of a carry fund can significantly delay or eliminate any carried interest distributions paid to us in respect of that fund since the value of the assets in the fund would need to recover to their aggregate cost basis plus the preferred return over time before we would be entitled to receive any carried interest from that fund.
The timing and receipt of carried interest also varies with the life cycle of our carry funds. During periods in which a relatively large portion of our assets under management is attributable to carry funds and investments in their “harvesting” period, our carry funds would make larger distributions than in the fundraising or investment periods that precede harvesting. During periods in which a significant portion of our assets under management is attributable to carry funds that are not in their harvesting periods, we may receive substantially lower carried interest distributions.
With respect to most of our funds of hedge funds, our core+ real estate funds and our credit-focused and real estate debt funds structured like hedge funds, our incentive income is paid annually or semi-annually, and the varying frequency of these payments will contribute to the volatility of our cash flow. Furthermore, we earn this incentive income only if the net asset value of a fund has increased or, in the case of certain funds, increased beyond a particular return threshold. Certain of these funds also have “high water marks” whereby we do not earn incentive income during a particular period even though the fund had positive returns in such period as a result of losses in prior periods. If one of these funds experiences losses, we will not be able to earn incentive income from the fund until it surpasses the previous high water mark. The incentive income we earn is therefore dependent on the net asset value of the fund, which could lead to significant volatility in our results.
Because our revenue, net income and cash flow can be highly variable from quarter to quarter and year to year, we do not provide any guidance regarding our expected quarterly and annual operating results. The lack of guidance may affect the expectations of public market analysts and could cause increased volatility in our common unit price.
Adverse economic and market conditions may adversely affect our liquidity position, which could adversely affect our business operations in the future.
We use cash to (a) provide capital to facilitate the growth of our existing businesses, which principally includes funding our general partner and co-investment commitments to our funds, (b) provide capital for business expansion, (c) pay operating expenses and other obligations as they arise, (d) fund capital expenditures, (e) service interest payments on our debt and repay debt, (f) pay income taxes, and (g) make distributions to our unitholders and the holders of Blackstone Holdings Partnership Units. In addition to the cash we received in connection with our initial public offering (“IPO”) and our prior bond offerings, our principal sources of cash are: (a) Fee Related Earnings, (b) Realized Performance Fees net of related profit sharing interests that are included in Compensation
22
Table of Contents
and (c) Blackstone Investment Income related to its investments in liquid funds and its net realized investment income on its illiquid investments. We have also entered into a $1.5 billion revolving credit facility with a final maturity date of August 31, 2021. Our long-term debt totaled $3.4 billion in borrowings from our prior bond issuances and we had no borrowings outstanding against our $1.5 billion revolving credit facility as of December 31, 2016. At the end of 2016, we had $1.8 billion in cash and cash equivalents, $2.8 billion invested in our corporate treasury investments and $2.2 billion invested in Blackstone funds and other investments.
If the global economy and conditions in the financing markets worsen, our fund investment performance could suffer, resulting in, for example, the payment of less or no carried interest to us. The payment of less or no carried interest could cause our cash flow from operations to significantly decrease, which could materially and adversely affect our liquidity position and the amount of cash we have on hand to conduct our operations and make distributions to our unitholders. Having less cash on hand could in turn require us to rely on other sources of cash (such as the capital markets, which may not be available to us on acceptable terms) to conduct our operations, which include, for example, funding significant general partner and co-investment commitments to our carry funds, or to make quarterly distributions to our unitholders. Furthermore, during adverse economic and market conditions, we might not be able to renew all or part of our existing revolving credit facility or find alternate financing on commercially reasonable terms. As a result, our uses of cash may exceed our sources of cash, thereby potentially affecting our liquidity position.
We depend on our founder and other key senior managing directors and the loss of their services would have a material adverse effect on our business, results and financial condition.
We depend on the efforts, skill, reputations and business contacts of our founder, Stephen A. Schwarzman, and other key senior managing directors, the information and deal flow they generate during the normal course of their activities and the synergies among the diverse fields of expertise and knowledge held by our professionals. Accordingly, our success will depend on the continued service of these individuals, who are not obligated to remain employed with us. Several key senior managing directors have left the firm in the past and others may do so in the future, and we cannot predict the impact that the departure of any key senior managing director will have on our ability to achieve our investment objectives. The loss of the services of any of them could have a material adverse effect on our revenues, net income and cash flows and could harm our ability to maintain or grow assets under management in existing funds or raise additional funds in the future. We have historically relied in part on the interests of these professionals in the investment funds’ carried interest and incentive fees to discourage them from leaving the firm. However, to the extent our investment funds perform poorly, thereby reducing the potential for carried interest and incentive fees, their interests in carried interest and incentive fees become less valuable to them and become less effective as incentives for them to continue to be employed at Blackstone.
Our senior managing directors and other key personnel possess substantial experience and expertise and have strong business relationships with investors in our funds, clients and other members of the business community. As a result, the loss of these personnel could jeopardize our relationships with investors in our funds, our clients and members of the business community and result in the reduction of assets under management or fewer investment opportunities.
Our publicly traded structure may adversely affect our ability to retain and motivate our senior managing directors and other key personnel and to recruit, retain and motivate new senior managing directors and other key personnel, both of which could adversely affect our business, results and financial condition.
Our most important asset is our people, and our continued success is highly dependent upon the efforts of our senior managing directors and other professionals. Our future success and growth depends to a substantial degree on our ability to retain and motivate our senior managing directors and other key personnel and to strategically recruit, retain and motivate new talented personnel. Most of our current senior managing directors and other senior personnel have equity interests in our business that are primarily partnership units in Blackstone Holdings (as defined under “Part III. Item 13. Certain Relationships and Related Transactions, and Director
23
Table of Contents
Independence — Blackstone Holdings Partnership Agreements”) and which entitle such personnel to cash distributions. However, the value of such Blackstone Holdings Partnership Units and the distributions in respect of these equity interests may not be sufficient to retain and motivate our senior managing directors and other key personnel, nor may they be sufficiently attractive to strategically recruit, retain and motivate new talented personnel. Moreover, prior to our IPO, many of our senior managing directors and other senior personnel had interests in each of our underlying businesses which may have entitled to them to a larger amount of cash distributions than they receive in respect of Blackstone Holdings Partnership Units.
Additionally, the retention of an increasingly larger portion of the Blackstone Holdings Partnership Units held by senior managing directors is not dependent upon their continued employment with us as those equity interests continue to vest as time passes. Moreover, the minimum retained ownership requirements and transfer restrictions to which these interests are subject in certain instances lapse over time, may not be enforceable in all cases and can be waived. There is no guarantee that the non-competition and non-solicitation agreements to which our senior managing directors are subject, together with our other arrangements with them, will prevent them from leaving us, joining our competitors or otherwise competing with us or that these agreements will be enforceable in all cases. In addition, these agreements will expire after a certain period of time, at which point each of our senior managing directors would be free to compete against us and solicit investors in our funds, clients and employees.
We might not be able to provide future senior managing directors with equity interests in our business to the same extent or with the same tax consequences from which our existing senior managing directors previously benefited. For example, during his presidential campaign, President Trump expressed support for legislation ending treatment of carried interest as capital gain. If federal, state or local legislation to treat carried interest as ordinary income rather than as capital gain for tax purposes were to be enacted, we and possibly our unitholders would be required to pay a materially higher amount of taxes, thereby adversely affecting our ability to recruit, retain and motivate our current and future professionals. See “— Risks Related to United States Taxation — Our structure involves complex provisions of U.S. federal income tax law for which no clear precedent or authority may be available. Our structure also is subject to potential legislative, judicial or administrative change and differing interpretations, possibly on a retroactive basis.”
Alternatively, the value of the units we may issue senior managing directors at any given time may subsequently fall (as reflected in the market price of our common units), which could counteract the incentives we are seeking to induce in them. Therefore, in order to recruit and retain existing and future senior managing directors, we may need to increase the level of compensation that we pay to them. Accordingly, as we promote or hire new senior managing directors over time, we may increase the level of compensation we pay to our senior managing directors, which would cause our total employee compensation and benefits expense as a percentage of our total revenue to increase and adversely affect our profitability. In addition, issuance of equity interests in our business in the future to senior managing directors and other personnel would dilute public common unitholders.
We strive to maintain a work environment that reinforces our culture of collaboration, motivation and alignment of interests with investors. If we do not continue to develop and implement the right processes and tools to manage our changing enterprise and maintain this culture, our ability to compete successfully and achieve our business objectives could be impaired, which could negatively impact our business, financial condition and results of operations.
Our organizational documents do not limit our ability to enter into new lines of businesses, and we may expand into new investment strategies, geographic markets and businesses, each of which may result in additional risks and uncertainties in our businesses.
Our plan, to the extent that market conditions permit, is to continue to grow our investment businesses and expand into new investment strategies, geographic markets and businesses. Our organizational documents do not limit us to investment management businesses. Accordingly, we may pursue growth through acquisitions of other investment management companies, acquisitions of critical business partners, or other strategic initiatives. In
24
Table of Contents
addition, we expect opportunities will arise to acquire other alternative or traditional asset managers. To the extent we make strategic investments or acquisitions, undertake other strategic initiatives or enter into a new line of business, we will face numerous risks and uncertainties, including risks associated with (a) the required investment of capital and other resources, (b) the possibility that we have insufficient expertise to engage in such activities profitably or without incurring inappropriate amounts of risk, (c) the diversion of management’s attention from our core businesses, (d) assumption of liabilities in any acquired business, (e) the disruption of our ongoing businesses, (f) the increasing demands on or issues related to the combining or integrating operational and management systems and controls, (g) compliance with additional regulatory requirements, and (h) the broadening of our geographic footprint, including the risks associated with conducting operations in non-U.S. jurisdictions. Entry into certain lines of business may subject us to new laws and regulations with which we are not familiar, or from which we are currently exempt, and may lead to increased litigation and regulatory risk. For example, our recent and planned business initiatives include offering registered investment products and the creation of investment products open to retail investors. These activities have and will continue to impose additional compliance burdens on us and could also subject us to enhanced regulatory scrutiny and expose us to greater reputation and litigation risk. See “— We are subject to substantial litigation risks and may face significant liabilities and damage to our professional reputation as a result of litigation allegations and negative publicity.” In addition, if a new business generates insufficient revenues or if we are unable to efficiently manage our expanded operations, our results of operations will be adversely affected. Our strategic initiatives may include joint ventures, in which case we will be subject to additional risks and uncertainties in that we may be dependent upon, and subject to liability, losses or reputational damage relating to, systems, controls and personnel that are not under our control.
If we are unable to consummate or successfully integrate additional development opportunities, acquisitions or joint ventures, we may not be able to implement our growth strategy successfully.
Our growth strategy is based, in part, on the selective development or acquisition of asset management businesses, or other businesses complementary to our business where we think we can add substantial value or generate substantial returns. The success of this strategy will depend on, among other things: (a) the availability of suitable opportunities, (b) the level of competition from other companies that may have greater financial resources, (c) our ability to value potential development or acquisition opportunities accurately and negotiate acceptable terms for those opportunities, (d) our ability to obtain requisite approvals and licenses from the relevant governmental authorities and to comply with applicable laws and regulations without incurring undue costs and delays and (e) our ability to identify and enter into mutually beneficial relationships with venture partners. Moreover, even if we are able to identify and successfully complete an acquisition, we may encounter unexpected difficulties or incur unexpected costs associated with integrating and overseeing the operations of the new businesses. If we are not successful in implementing our growth strategy, our business, financial results and the market price for our common units may be adversely affected.
The spin-off of our financial and strategic advisory services, restructuring and reorganization advisory services, and Park Hill fund placement businesses could result in substantial tax liability for us and/or our unitholders.
On October 1, 2015, we completed the previously announced spin-off of our financial and strategic advisory services, restructuring and reorganization advisory services, and Park Hill fund placement businesses and combined these businesses with PJT Partners, an independent financial advisory firm founded by Paul J. Taubman, to form an independent publicly traded company. We may be responsible for U.S. federal income tax liabilities that relate to the spin-off if certain internal reorganization transactions in connection with the spin-off fail to qualify as tax-free, and our unitholders may also incur U.S. federal income tax liability in such circumstances.
In past years, the U.S. Congress has considered legislation that, if enacted, would have (a) for taxable years beginning ten years after the date of enactment, precluded us from qualifying as a partnership for U.S. federal income tax purposes or required us to hold carried interest through taxable subsidiary corporations and (b) taxed individual holders of common units with respect to certain income and gains at increased rates. If any similar
25
Table of Contents
legislation were to be enacted and apply to us, we could incur a material increase in our tax liability and a substantial portion of our income could be taxed at a higher rate to the individual holders of our common units.
Over the past several years, members of the U.S. Congress and the administration of former President Obama have made a number of legislative proposals to change the taxation of carried interest that would have, in general, treated income and gains, including gain on sale, attributable to an investment services partnership interest, or “ISPI,” as income subject to a new blended tax rate that is higher than the capital gains rate applicable to such income under current law, except to the extent such ISPI would have been considered under the legislation to be a qualified capital interest. Our common units and the interests that we hold in entities that are entitled to receive carried interest would likely have been classified as ISPIs for purposes of this legislation. During his presidential campaign, President Trump expressed support for legislation ending treatment of carried interest as capital gain. Whether or when the U.S. Congress will pass such legislation or what provisions will be included in any final legislation if enacted is unclear.
Some of the above legislative proposals have provided that, for taxable years beginning ten years after the date of enactment, income derived with respect to an ISPI that is not a qualified capital interest and that is subject to the foregoing rules would not meet the qualifying income requirements under the publicly traded partnership rules. Therefore, if similar legislation were to be enacted, following such ten-year period, we would be precluded from qualifying as a partnership for U.S. federal income tax purposes or be required to hold all such ISPIs through corporations. If we were taxed as a U.S. corporation or held all ISPIs through U.S. corporations, our effective tax rate could increase significantly. The federal statutory rate for corporations is currently 35% (although Congress is considering proposals to lower that rate, as discussed below). In addition, we could be subject to increased state and local taxes. Furthermore, common unitholders could be subject to tax on our conversion into a corporation or any restructuring required in order for us to hold our ISPIs through a corporation.
States and other jurisdictions have also considered legislation to increase taxes with respect to carried interest. For example, New York has considered legislation which could have caused a non-resident of New York who holds our common units to be subject to New York state income tax on carried interest earned by entities in which we hold an indirect interest, thereby requiring the non-resident to file a New York state income tax return reporting such carried interest income. Whether or when similar legislation will be enacted is unclear. Finally, several state and local jurisdictions have evaluated ways to subject partnerships to entity level taxation through the imposition of state or local income, franchise or other forms of taxation or to increase the amount of such taxation. If any state were to impose a tax upon us as an entity, our distribution to common unitholders would be reduced.
Possible U.S. federal income tax reform, could adversely affect us.
Both President Trump and the Republican members of the U.S. House of Representatives have publicly stated that one of their top legislative priorities is significant reform of the Internal Revenue Code, including significant changes to taxation of business entities. Proposals by members of Congress have included, among other things:
| • | Reducing corporate tax rates (the highest dropping from 35% to 20%) and reducing individual tax rates (the highest dropping from 39.6% to 33%), |
| • | Changing to a destination-based tax system, which would tax goods where they are consumed rather than produced, by providing for certain border adjustments which would effectively exempt exports from, and subject imports to, U.S. tax, |
| • | Changing to a territorial tax system by exempting dividends from foreign subsidiaries from U.S. tax, but subjecting unrepatriated earnings of foreign subsidiaries to U.S. tax, paid over the course of eight years (8.75% on cash and cash equivalents and 3.5% otherwise), |
| • | Allowing deductions for interest expense only against interest income, with nondeductible net interest expense being carried forward indefinitely, |
| • | Permitted current deductions for investment in tangible and intangible property (excluding land), |
26
Table of Contents
| • | Eliminating certain “special interest” deductions and credits, |
| • | Taxing the active business income of pass-through entities at a maximum rate, such as 25%, |
| • | Repealing the 3.8% net investment income tax and corporate and individual alternative minimum taxes, and |
| • | Extending the carryforward of net operating losses. |
While President Trump has expressed his support for a number of these proposals, he has also set forth ideas for tax reform that differ in key ways. In particular, in their June 2016 “A Better Way Forward on Tax Reform” (the “House Blueprint”), Republican members of the U.S. House of Representatives proposed, as part of a comprehensive package of tax reform, changes to the Internal Revenue Code that would, along with a reduction in the corporate tax rate and accelerating expensing of capital expenditures, prohibit the deductibility of net interest expense. Many of our funds, particularly our private equity and real estate funds, rely heavily on the use of leverage. Changes to the Internal Revenue Code that limit the deductibility of interest expense would increase the after-tax cost of debt financing of acquisitions, which could make the use of leverage for new investments less attractive, require us to adjust our funds’ investment strategies, increase competition for investments relative to strategic buyers with a lower cost of capital and adversely affect our funds’ investment returns. In addition, many of our funds’ portfolio companies regularly utilize the corporate debt markets in order to obtain financing for their operations and to make acquisitions, and limitations on the deductibility of interest could subject such portfolio companies to increased tax liability and adversely affect their profitability.
Both the timing and the details of any such tax reform are unclear. The impact of any potential tax reform on us, our funds’ portfolio companies and our investors is uncertain and could be adverse. Prospective investors should consult their own tax advisors regarding potential changes in tax laws.
Additional proposed changes in taxation of businesses could adversely affect us.
Congress, the Organization for Economic Co-operation and Development (“OECD”) and other government agencies in jurisdictions in which we and our affiliates invest or do business have maintained a focus on issues related to the taxation of multinational companies. The OECD, which represents a coalition of member countries, is contemplating changes to numerous long-standing tax principles through its base erosion and profit shifting (“BEPS”) project, which is focused on a number of issues, including the shifting of profits between affiliated entities in different tax jurisdictions, interest deductibility and eligibility for the benefits of double tax treaties. A number of European jurisdictions have enacted taxes on financial transactions, and the European Commission has proposed legislation to harmonize these taxes under the so-called “enhanced cooperation procedure,” which provides for adoption of EU-level legislation applicable to some but not all EU Member States. These contemplated changes, if adopted by individual countries, could increase tax uncertainty and/or costs faced by us, our funds’ portfolio companies and our investors, change our business model and cause other adverse consequences. The timing or impact of these proposals is unclear at this point. In addition, tax laws, regulations and interpretations are subject to continual changes, which could adversely affect our structures or returns to our investors. For instance, various countries have adopted or proposed tax legislation that may adversely affect portfolio companies and investment structures in countries in which our funds have invested and may limit the benefits of additional investments in those countries.
The potential requirement to convert our financial statements from being prepared in conformity with accounting principles generally accepted in the United States of America to International Financial Reporting Standards may strain our resources and increase our annual expenses.
As a public entity, the SEC may require in the future that we report our financial results under International Financial Reporting Standards (“IFRS”) instead of under GAAP. IFRS is a set of accounting principles that has been gaining acceptance on a worldwide basis. These standards are published by the London-based International
27
Table of Contents
Accounting Standards Board and are more focused on objectives and principles and less reliant on detailed rules than GAAP. Today, there remain significant and material differences in several key areas between GAAP and IFRS that would affect Blackstone. Additionally, GAAP provides specific guidance in classes of accounting transactions for which equivalent guidance in IFRS does not exist. The adoption of IFRS is highly complex and would have an impact on many aspects and operations of Blackstone, including but not limited to financial accounting and reporting systems, internal controls, taxes, borrowing covenants and cash management. A significant amount of time, internal and external resources and expenses over a multi-year period would likely be required for this conversion.
Operational risks may disrupt our businesses, result in losses or limit our growth.
We rely heavily on our financial, accounting, communications and other data processing systems. Our systems may fail to operate properly or become disabled as a result of tampering or a breach of our network security systems or otherwise. In addition, our systems face ongoing cybersecurity threats and attacks. Breaches of our network security systems could involve attacks that are intended to obtain unauthorized access to our proprietary information, destroy data or disable, degrade or sabotage our systems, often through the introduction of computer viruses, cyberattacks and other means and could originate from a wide variety of sources, including unknown third parties outside the firm. Although we take various measures to ensure the integrity of our systems, there can be no assurance that these measures will provide protection. If our systems are compromised, do not operate properly or are disabled, we could suffer financial loss, a disruption of our businesses, liability to our investment funds and fund investors, regulatory intervention or reputational damage.
In addition, we operate in businesses that are highly dependent on information systems and technology. Our information systems and technology may not continue to be able to accommodate our growth, and the cost of maintaining such systems may increase from its current level. Such a failure to accommodate growth, or an increase in costs related to such information systems, could have a material adverse effect on us.
Furthermore, we depend on our headquarters in New York City, where many of our personnel are located, for the continued operation of our business. A disaster or a disruption in the infrastructure that supports our businesses, including a disruption involving electronic communications or other services used by us or third parties with whom we conduct business, or directly affecting our headquarters, could have a material adverse impact on our ability to continue to operate our business without interruption. Our disaster recovery and business continuity programs may not be sufficient to mitigate the harm that may result from such a disaster or disruption. In addition, insurance and other safeguards might only partially reimburse us for our losses, if at all.
Finally, we rely on third party service providers for certain aspects of our business, including for certain information systems and technology and administration of our hedge funds. Any interruption or deterioration in the performance of these third parties or failures or compromises of their information systems and technology could impair the quality of the funds’ operations and could affect our reputation and hence adversely affect our businesses.
Extensive regulation of our businesses affects our activities and creates the potential for significant liabilities and penalties. The possibility of increased regulatory focus could result in additional burdens on our business.
Our business is subject to extensive regulation, including periodic examinations, by governmental agencies and self-regulatory organizations in the jurisdictions in which we operate around the world. These authorities have regulatory powers dealing with many aspects of financial services, including the authority to grant, and in specific circumstances to cancel, permissions to carry on particular activities. Many of these regulators, including U.S. and foreign government agencies and self-regulatory organizations, as well as state securities commissions in the United States, are also empowered to conduct investigations and administrative proceedings that can result in fines, suspensions of personnel, changes in policies, procedures or disclosure or other sanctions, including censure, the issuance of cease-and-desist orders, the suspension or expulsion of a broker-dealer or investment adviser from registration or memberships or the commencement of a civil or criminal lawsuit against us or our personnel.
28
Table of Contents
Moreover, the financial services industry recently has been the subject of heightened scrutiny, and the SEC has specifically focused on private equity. In that connection, the SEC’s prior lists of examination priorities have included, among other things, private equity firms’ collection of fees and allocation of expenses, their marketing and valuation practices and allocation of investment opportunities. We regularly are subject to requests for information and informal or formal investigations by the SEC and other regulatory authorities, with which we routinely cooperate, and which have included review of historical practices that were previously examined. For example, in October 2015, without admitting or denying any wrongdoing, three of our private equity fund advisors consented to the entry of an order settling certain matters in connection with funds formed many years ago relating to historical monitoring fee termination practices and historical practices relating to the application of disparate vendor discounts to Blackstone and to our funds that were charged in 2011. SEC actions and initiatives can have an adverse effect on our financial results, including as a result of the imposition of a sanction or changing our historic practices. Even if an investigation or proceeding did not result in a sanction or the sanction imposed against us or our personnel by a regulator were small in monetary amount, the adverse publicity relating to the investigation, proceeding or imposition of these sanctions could harm our reputation and cause us to lose existing clients or fail to gain new clients.
We rely on complex exemptions from statutes in conducting our asset management activities.
We regularly rely on exemptions from various requirements of the U.S. Securities Act of 1933, as amended, or “Securities Act,” the Exchange Act, the 1940 Act, the Commodity Exchange Act and the U.S. Employee Retirement Income Security Act of 1974, as amended, in conducting our asset management activities. These exemptions are sometimes highly complex and may in certain circumstances depend on compliance by third parties whom we do not control. If for any reason these exemptions were to become unavailable to us, we could become subject to regulatory action or third party claims and our business could be materially and adversely affected. For example, the “bad actor” disqualification provisions of Rule 506 of Regulation D under the Securities Act ban an issuer from offering or selling securities pursuant to the safe harbor rule in Rule 506 if the issuer or any other “covered person” is the subject of a criminal, regulatory or court order or other “disqualifying event” under the rule which has not been waived. The definition of “covered person” includes an issuer’s directors, general partners, managing members and executive officers; affiliates who are also issuing securities in the offering; beneficial owners of 20% or more of the issuer’s outstanding equity securities; and promoters and persons compensated for soliciting investors in the offering. Accordingly, our ability to rely on Rule 506 to offer or sell securities would be impaired if we or any “covered person” is the subject of a disqualifying event under the rule and we are unable to obtain a waiver. The requirements imposed by our regulators are designed primarily to ensure the integrity of the financial markets and to protect investors in our investment funds and are not designed to protect our common unitholders. Consequently, these regulations often serve to limit our activities and impose burdensome compliance requirements.
We and our affiliates from time to time are required to report specified dealings or transactions involving Iran or other sanctioned individuals or entities.
The Iran Threat Reduction and Syria Human Rights Act of 2012 (“ITRA”) expands the scope of U.S. sanctions against Iran. Additionally, Section 219 of the ITRA amended the Exchange Act to require companies subject to SEC reporting obligations under Section 13 of the Exchange Act to disclose in their periodic reports specified dealings or transactions involving Iran or other individuals and entities targeted by certain OFAC sanctions engaged in by the reporting company or any of its affiliates during the period covered by the relevant periodic report. In some cases, ITRA requires companies to disclose these types of transactions even if they were permissible under U.S. law. Companies that currently may be or may have been at the time considered our affiliates have publicly filed and/or provided to us the disclosures reproduced on Exhibit 99.1 of each of our Quarterly Reports on Form 10-Q filed on May 5, 2016 and August 4, 2016, which disclosures are hereby incorporated by reference herein. We have not independently verified or participated in the preparation of these disclosures. We are required to separately file with the SEC a notice that such activities have been disclosed in this report, and the SEC is required to post this notice of disclosure on its website and send the report to the U.S. President and certain U.S. Congressional committees. The U.S. President thereafter is required to initiate an investigation and, within 180 days of initiating such an
29
Table of Contents
investigation, to determine whether sanctions should be imposed. Disclosure of such activity, even if such activity is not subject to sanctions under applicable law, and any sanctions actually imposed on us or our affiliates as a result of these activities, could harm our reputation and have a negative impact on our business.
Regulatory changes in the United States could adversely affect our business.
As a result of the financial crisis and highly publicized financial scandals, investors have exhibited concerns over the integrity of the U.S. financial markets and the regulatory environment in which we operate in the U.S. There has been active debate over the appropriate extent of regulation and oversight of private investment funds and their managers. We may be adversely affected as a result of new or revised legislation or regulations imposed by the SEC or other U.S. governmental regulatory authorities or self-regulatory organizations that supervise the financial markets. We also may be adversely affected by changes in the interpretation or enforcement of existing laws and rules by these governmental authorities and self-regulatory organizations. For example, in recent years, senior officials at the SEC implemented a “broken windows” policy, meaning that the SEC will pursue even the most minor violations on the theory that publicly pursuing smaller matters will reduce the prevalence of larger matters.
On July 21, 2010, President Obama signed into law the Dodd-Frank Wall Street Reform and Consumer Protection Act (the “Dodd-Frank Act”), which imposed significant changes on almost every aspect of the U.S. financial services industry, including aspects of our business. Among other things, the Dodd-Frank Act includes the following provisions that could have an adverse impact on our ability to conduct our business:
| • | As described elsewhere in this Annual Report on Form 10-K, all of the investment advisers of our investment funds operated in the U.S. are registered as investment advisers with the SEC. Private equity and hedge fund advisers registered with the SEC under the Advisers Act are required to maintain extensive records and to file reports. |
| • | On December 16, 2015, the Commodity Futures Trading Commission (“CFTC”) published a final rule governing margin requirements for uncleared swaps entered into by swap dealers and major swap participants subject to CFTC regulation. The final rule, which became effective on April 1, 2016, generally requires covered swap entities, subject to certain thresholds and exemptions for inter-affiliate swaps, to collect and post margin in respect of uncleared swap transactions with other covered swap entities and financial end-users. These newly adopted rules on margin requirements for uncleared swaps could adversely affect our business, including our ability to enter such swaps or our available liquidity. |
| • | The Dodd-Frank Act authorizes federal regulatory agencies to review and, in certain cases, prohibit compensation arrangements at financial institutions that give employees incentives to engage in conduct deemed to encourage inappropriate risk taking by covered financial institutions. On May 16, 2016, the SEC re-proposed a rule, as part of a joint rulemaking effort with U.S. federal banking regulators that would apply to “covered financial institutions,” including registered investment advisers and broker-dealers that have total consolidated assets of at least $1 billion, and imposes substantive and procedural requirements on incentive-based compensation arrangements. If adopted, the application of this rule to us could limit our ability to recruit and retain investment professionals and senior management executives. However, the proposed rule remains pending and may be subject to significant modifications in 2017. |
| • | The Dodd-Frank Act, under what has become known as the “Volcker Rule,” generally prohibits depository institution holding companies (including foreign banks with U.S. branches and insurance companies with U.S. depository institution subsidiaries), insured depository institutions and subsidiaries and affiliates of such entities (collectively, “banking entities”) from investing in or sponsoring private equity funds or hedge funds. The Volcker Rule became effective as a matter of statute on July 21, 2012, but banking entities had a so-called “conformance period,” which ran until July 21, 2015, to wind down, sell, transfer or otherwise conform their investments and activities to the Volcker Rule, absent an extension by the Federal Reserve or an exemption for certain “permitted activities.” On December 10, 2013, the Federal Reserve and other federal regulatory agencies issued final rules implementing the principal components of the Volcker Rule. For investments in and relationships with |
30
Table of Contents
| certain funds that were in place prior to December 31, 2013, the Federal Reserve has granted a series of extensions that give banking entities until July 21, 2017 to comply with the Volcker Rule. In addition, a separate extension of up to five years may be sought by banking entities for investments in certain illiquid funds. Divestitures by banking entities of impermissible ownership interests in covered funds to comply with the Volcker Rule may lead to lower prices in the secondary market for interests in our funds, which could have adverse implications for our ability to raise funds from investors who may have considered the availability of secondary market liquidity as a factor in determining whether to invest. |
| • | The Dodd-Frank Act amends the Exchange Act to direct the Federal Reserve and other federal regulatory agencies to adopt rules requiring sponsors of asset-backed securities to retain at least 5% of the credit risk relating to the assets that underlie such asset-backed securities. In October 2014, five federal banking and housing agencies (the Federal Deposit Insurance Corporation, the Comptroller of the Currency, the Federal Reserve, the Department of Housing and Urban Development, and the Federal Housing Finance Agency) and the SEC issued the final credit risk retention rules (the “U.S. Risk Retention Rules”). With respect to the regulation of CLOs, the U.S. Risk Retention Rules generally require that the “sponsor” (which, in most cases, will be us) or a “majority-owned affiliate” thereof (in each case as defined in the U.S. Risk Retention Rules) will retain an “eligible vertical interest” or an “eligible horizontal residual interest” (in each case as defined therein) or any combination thereof in the CLO in the manner required by the U.S. Risk Retention Rules. The U.S. Risk Retention Rules became effective on December 24, 2016 and CLOs issued prior to that date are exempt from the requirements set forth in the U.S. Risk Retention Rules, except in connection with any offer and sale of securities thereunder after the U.S. Risk Retention Rules effective date, which may include circumstances in which the CLO documentation is amended in a material way, or the relevant CLO securities are repriced or refinanced. The U.S. Risk Retention Rules contain provisions that may have adverse effects on us, including the obligation to acquire the required retention interest and hold it for a period of several years, during which we may not hedge the credit risk exposure associated with such securities. The U.S. Risk Retention Rules permit the financing of a required retention interest, provided that such financing be on a full recourse basis. To the extent that we were to employ leverage for our required retention investments, that could cause losses to be earlier and larger than they would have been if leverage were not employed. |
Many of these provisions are subject to further rulemaking and to the discretion of regulatory bodies, such as the FSOC, the Federal Reserve and the SEC.
There has been increasing commentary amongst regulators and intergovernmental institutions, including the Financial Stability Board (“FSB”) and International Monetary Fund, on the topic of so-called “shadow banking,” a term generally taken to refer to credit intermediation involving entities and activities outside the regulated banking system. Although private equity firms have generally not been the focus of this commentary in recent months, if regulators were to extend regulatory and supervisory requirements currently applicable to banks to certain sectors or funds of our business or if we are considered to be engaged in “shadow banking,” the regulatory and operating costs associated therewith could adversely impact our business. In the United States:
| • | The process established by the Dodd-Frank Act for designation of systemically important non-bank firms has provided a means for ensuring that the perimeter of prudential regulation can be extended as appropriate to cover a non-bank firm. The Dodd-Frank Act established the Financial Stability Oversight Council (the “FSOC”), which is comprised of representatives of all the major U.S. financial regulators, to act as the financial system’s systemic risk regulator. The FSOC has the authority to review the activities of non-bank financial companies predominantly engaged in financial activities and designate those companies determined to be “systemically important” for supervision by the Federal Reserve. Such designation is applicable to companies where material distress could pose risk to the financial stability of the United States. |
| • | On April 3, 2012, the FSOC issued a final rule and interpretive guidance regarding the process by which it will designate non-bank financial companies as systemically important. The final rule and interpretive |
31
Table of Contents
| guidance details a three-stage process, with the level of scrutiny increasing at each stage. Initially, the FSOC applies a broad set of uniform quantitative metrics to screen out financial companies that do not warrant additional review. The FSOC considers whether a company has at least $50 billion in total consolidated assets and whether it meets other thresholds relating to credit default swaps outstanding, derivative liabilities, loans and bonds outstanding, a minimum leverage ratio of total consolidated assets (excluding separate accounts) to total equity of 15 to 1, and a short-term debt ratio of debt (with maturities less than 12 months) to total consolidated assets (excluding separate accounts) of 10%. A company that meets or exceeds both the asset threshold and one of the other thresholds will be subject to additional review. The review criteria could, and is expected to, evolve over time. On April 18, 2016, the FSOC released an update on its multi-year review of asset management products and activities and created an interagency working group to assess potential risks associated with certain leveraged funds. To date, the FSOC has not designated any asset management firms or funds, including Blackstone, as a systemically important financial institution. While we believe it to be unlikely that we would be designated as systemically important, if such designation were to occur, we would be subject to significantly increased levels of regulation, which includes, without limitation, a requirement to adopt heightened standards relating to capital, leverage, liquidity, risk management, credit exposure reporting and concentration limits, restrictions on acquisitions and being subject to annual stress tests by the Federal Reserve. To date, the FSOC has made designations of four non-bank companies as “systemically important” subject to Federal Reserve supervision. The FSOC has since rescinded one such company’s designation, and a federal court, in a decision that is under appeal, has rescinded a second company’s designation. |
| • | On December 18, 2014, the FSOC released a notice seeking public comment on the potential risks posed by aspects of the asset management industry, including whether asset management products and activities may pose potential risks to the U.S. financial system in the areas of liquidity and redemptions, leverage, operational functions, and resolution, or in other areas. |
| • | In connection with the work of the FSOC, on October 31, 2011, the SEC and the CFTC issued a joint final rule on systemic risk reporting designed to assist the FSOC in gathering information from many sectors of the financial system for monitoring risks. This final rule requires large private equity fund advisers, such as Blackstone, to submit reports, on Form PF, focusing primarily on the extent of leverage incurred by their funds’ portfolio companies, the use of bridge financing and their funds’ investments in financial institutions. |
Rule 206(4)-5 under the Advisers Act regarding “pay to play” practices by investment advisers involving campaign contributions and other payments to government clients and elected officials able to exert influence on such clients prohibits investment advisers from providing advisory services for compensation to a government client for two years, subject to very limited exceptions, after the investment adviser, its senior executives or its personnel involved in soliciting investments from government entities make contributions to certain candidates and officials in position to influence the hiring of an investment adviser by such government client. Advisers are required to implement compliance policies designed, among other matters, to track contributions by certain of the adviser’s employees and engagements of third parties that solicit government entities and to keep certain records in order to enable the SEC to determine compliance with the rule. Any failure on our part to comply with the rule could expose us to significant penalties and reputational damage. In addition, there have been similar rules on a state level regarding “pay to play” practices by investment advisers.
In June 2011, the Basel Committee on Banking Supervision, an international body comprised of senior representatives of bank supervisory authorities and central banks from 27 countries, including the United States, announced the final framework for a comprehensive set of capital and liquidity standards, commonly referred to as “Basel III,” for internationally active banking organizations. These new standards, which will be fully phased in by 2019, will require banks to hold more capital, predominantly in the form of common equity, than under the current capital framework. Implementation of Basel III will require implementing regulations and guidelines by member states. In July 2013, the U.S. federal banking regulators announced the adoption of final regulations to implement Basel III for U.S. banking organizations, subject to various transition periods. Compliance with the Basel III
32
Table of Contents
standards may result in significant costs to banking organizations, which in turn may result in higher borrowing costs for the private sector, including our funds and portfolio companies, and reduced access to certain types of credit. See “— Changes in the debt financing markets could negatively impact the ability of our funds and their portfolio companies to obtain attractive financing or refinancing for their investments and could increase the cost of such financing if it is obtained, which could lead to lower-yielding investments and potentially decrease our net income.”
In March 2013, the Federal Reserve and other U.S. federal banking agencies issued updated leveraged lending guidance covering transactions characterized by a degree of financial leverage. In November 2015, in connection with the banking agencies’ most recent review of large credits under the Shared National Credit review, the agencies noted high credit risk and weaknesses related to leveraged lending and for loans related to oil and gas exploration, production and energy services. To the extent that such guidance limits the amount or cost of financing we are able to obtain for our transactions, the returns on our investments may suffer. In addition, in December 2015, the U.S. federal banking agencies issued a statement cautioning financial institutions on rising concentrations in commercial real estate and an easing of related underwriting standards.
In addition, in December 2015, the SEC proposed a new rule that would reduce the ability of registered investment companies to utilize derivatives and other instruments that could be deemed to leverage a fund’s portfolio, which if adopted in its current form, may impact the ability of certain of our registered funds to continue pursuing certain aspects of their current investment strategies.
In addition, in April 2016, the U.S. Department of Labor (the “DOL”) issued a final rule, which generally takes effect on April 10, 2017 and among others things, expands the definition of “investment advice fiduciary” under ERISA and thereby the circumstances in which certain investment advisers and other intermediaries are treated as fiduciaries to ERISA plans and individual retirement accounts. On February 3, 2017, President Trump issued a memorandum asking the DOL to examine the final rule. Whether the final rule will take effect in its current form and/or on the currently proposed timing is impossible to determine. The final rule, if implemented, could have an adverse effect on the distribution of our products to certain investors.
Any changes in the regulatory framework applicable to our business, including the changes described above, may impose additional compliance and other costs, increase regulatory investigations of the investment activities of our funds, require the attention of our senior management, affect the manner in which we conduct our business and adversely affect our profitability. The full extent of the impact on us of the Dodd-Frank Act or any other new laws, regulations or initiatives that may be proposed, including by the Trump administration, which has expressed support for potential modifications to the Dodd-Frank Act and other deregulatory measures, is impossible to determine.
Financial deregulation measures proposed by the Trump administration and members of the U.S. Congress may create regulatory uncertainty for the financial sector, increase competition in certain of our investment strategies and adversely affect our business, financial condition and results of operations.
The Trump administration’s short-term legislative agenda may include certain deregulatory measures for the U.S. financial services industry, including changes to the Volcker Rule, the U.S. Risk Retention Rules, Basel III capital requirements, the FSOC’s authority and other aspects of the Dodd-Frank Act. On February 3, 2017, President Trump signed an executive order calling for the administration to review U.S. financial laws and regulations in order to determine their consistency with a set of core principles identified in the order. One bill, the Financial CHOICE Act (the “CHOICE Act”), which was sponsored by Rep. Jeb Hensarling last year, is being discussed as an avenue for amending the Dodd-Frank Act and may be subject to certain revisions in the near-term. The CHOICE Act would eliminate the power of the FSOC to designate non-bank financial institutions as systemically important, repeal the Volcker Rule and change the structure and powers of the Consumer Financial Protection Bureau. In addition, the CHOICE Act would allow certain qualifying banking organizations with a satisfactory composite supervisory rating and a non-risk weighted leverage ratio of at least 10% to elect to be exempt from risk-weighted capital ratios, liquidity requirements and other regulations currently applicable to
33
Table of Contents
banking organizations, and would revise the U.S. Risk Retention Rules to remove the risk retention requirement for all asset-backed securitizations other than for certain non-qualifying residential mortgage securitizations. The CHOICE Act is also expected to significantly alter stress testing, possibly exempting qualifying banking organizations from stress tests altogether and eliminating the Federal Reserve Board’s ability to make “qualitative” objections to capital plans submitted by other banking organizations. In addition, the CHOICE Act would also significantly enhance the SEC’s enforcement capabilities and increase the maximum civil penalties and criminal sanctions under federal securities laws, including under the 1940 Act and the Advisers Act.
Whether the CHOICE Act will be enacted, and if so, whether additional amendments would be added during the legislative process remains unclear. However, the results of the recent elections have increased the likelihood that the CHOICE Act or similar financial reform legislation will be enacted. In addition, in the absence of legislative change, the Trump administration may influence the substance of regulatory supervision through the appointment of individuals to the Federal Reserve Board. On February 10, 2017, Daniel K. Tarullo submitted his resignation as a member of the Federal Reserve Board to President Trump, effective on or around April 5, 2017. Governor Tarullo currently serves as the Chairman of the Federal Reserve Board’s Committee on Supervision and Regulation and has served as Chairman of the Financial Stability Board’s Standing Committee on Supervisory and Regulatory Cooperation. As a result of Governor Tarullo’s resignation, President Trump is expected to soon be able to nominate three of the Federal Reserve Board’s seven seats, including a Vice Chairman for Supervision. The nominations by Mr. Trump may increase the likelihood that the Federal Reserve Board will depart from adopting capital and liquidity requirements for U.S. banking organizations that are more stringent than those that have been agreed upon at the international level, including through the Basel Committee on Banking Supervision’s Basel III framework.
Measures focused on deregulation of the U.S. financial services industry may have the effect of increasing competition for our credit-focused businesses or otherwise reducing investment opportunities. Increased competition from banks and other financial institutions in the credit markets could have the effect of reducing credit spreads, which may adversely affect the revenues of our credit and other businesses whose strategies include the provision of credit to borrowers.
Determining the full extent of the impact on us or any of our funds’ portfolio companies of any such potential financial reform legislation, or whether any such particular proposal will become law, is impossible. However, any such changes may impose additional costs on us and our funds’ portfolio companies, require the attention of our senior management or result in limitations on the manner in which business is conducted, or may ultimately have an adverse impact on the competitiveness of certain non-bank financial service providers vis-à-vis traditional banking organizations.
The potential for governmental policy changes and regulatory reform by the Trump administration and the U.S. Congress as a result of the recent U.S. Presidential and Congressional elections may create regulatory uncertainty for our funds’ portfolio companies and our investment strategies and adversely affect the profitability of our funds’ portfolio companies.
Governmental policy changes and regulatory reform could have a material impact on the investment strategies of our funds. A prolonged environment of regulatory uncertainty may make the identification of attractive investment opportunities and the deployment of capital more challenging. In addition, our ability to identify business and other risks associated with new investments depends in part on our ability to anticipate and accurately assess regulatory and other changes that may have a material impact on the businesses in which we choose to invest. The failure to accurately predict the possible outcome of policy changes and regulatory reform could have a material adverse effect on the returns generated from our funds’ investments and our revenues.
The Trump administration has expressed intent to pursue governmental policy changes and/or regulatory reform in multiple areas, including tax, international trade, immigration, healthcare, labor, infrastructure and energy. While there is currently a substantial lack of clarity around the likelihood, timing and details of many such potential
34
Table of Contents
changes, such changes may adversely affect the companies in which we have invested or choose to invest in the future in a number of ways, including, without limitation:
| • | Immigration reform, a core component of President Trump’s campaign, has been an early area of focus for his administration. Although the details and timing of potential changes to immigration law are difficult to predict, restrictions on the ability of individuals from certain countries to obtain non-immigrant visas or limitations on the number of individuals eligible for U.S. work visas may make it more difficult for current and future portfolio companies to recruit and retain skilled foreign workers and may increase labor and compliance costs. |
| • | The House Blueprint published by Republican members of the U.S. House of Representatives in June 2016 proposed changes that would limit the deductibility of net interest expense. Many of our funds’ portfolio companies regularly utilize the corporate debt markets in order to obtain financing for their operations and to make acquisitions, and limitations on the deductibility of interest expense could subject such portfolio companies to increased tax liability and adversely affect their profitability. |
| • | President Trump has raised the possibility of greater restrictions on international trade and significant increases to tariffs on goods imported into the U.S., particularly from China. In addition, the House Blueprint published by Republican members of the U.S. House of Representatives in June 2016 proposed changes that would exempt from U.S. taxation any profits from the export of goods and services from the U.S. and effectively subject to a 20% tax any imports (by both businesses and consumers) to the U.S., referred to as “border adjustability.” Changes to international trade agreements or the imposition of tariffs or other trade barriers could increase costs, decrease margins, reduce the competitiveness of products and services offered by current and future portfolio companies and adversely affect the revenues and profitability of companies whose businesses rely on goods imported from outside of the U.S. While border adjustability is designed to be offset by changes in value of the U.S. dollar, that premise may not be realized in whole or in part. |
| • | President Trump has expressed support for widespread healthcare reform and the repeal of all or portions of the Patient Protection and Affordable Care Act (“ACA”). An increase in the size of the uninsured population or a reduction in funds presently available to patients as a result of repeal of significant portions of the ACA could adversely affect multiple businesses in the healthcare industry, including pharmaceutical companies that benefit from purchases by individuals covered by government-subsidized insurance, hospitals that may be required to increase write-offs for bad debt resulting from the inability of insured patients to pay for care and insurance companies that have developed effective plans for participating in healthcare exchanges. |
Although there is a substantial lack of clarity regarding the likelihood, timing and details of any such potential changes, such changes may impose additional costs on the companies in which we have invested or choose to invest in the future, require the attention of senior management or result in limitations on the manner in which the companies in which we have invested or choose to invest in the future conduct business.
Changes in U.S. and foreign tax law could adversely affect our ability to raise funds from certain foreign investors.
Under the U.S. Foreign Account Tax Compliance Act (“FATCA”), all entities in a broadly defined class of foreign financial institutions (“FFIs”) are required to comply with a complicated and expansive reporting regime or be subject to a 30% United States withholding tax on certain U.S. payments (and beginning in 2019, a 30% withholding tax on gross proceeds from the sale of U.S. stocks and securities) and non-U.S. entities which are not FFIs are required to either certify they have no substantial U.S. beneficial ownership or to report certain information with respect to their substantial U.S. beneficial ownership or be subject to a 30% U.S. withholding tax on certain U.S. payments (and beginning in 2019, a 30% withholding tax on gross proceeds from the sale of U.S. stocks and securities). The reporting obligations imposed under FATCA require FFIs to enter into agreements with the IRS to obtain and disclose information about certain investors to the IRS. In addition, the administrative and economic
35
Table of Contents
costs of compliance with FATCA may discourage some foreign investors from investing in U.S. funds, which could adversely affect our ability to raise funds from these investors. Other countries such as the United Kingdom and the Cayman Islands have implemented regimes similar to that of FATCA. For example, under an initiative known as Global FATCA, more than 100 OECD member countries have committed to automatic exchange of information relating to accounts held by tax residents of signatory countries, using a Common Reporting Standard (“CRS”). Reporting under CRS is scheduled to commence in 2017 in countries that have signed on as “early adopters.” Compliance with such regimes could result in increased administrative and compliance costs and could subject our investment entities to increased non-U.S. withholding taxes.
Recent regulatory changes in jurisdictions outside the United States could adversely affect our business.
Similar to the environment in the United States, the current environment in jurisdictions outside the United States in which we operate, in particular Europe, has become subject to further regulation. Governmental regulators and other authorities in Europe have proposed or implemented a number of initiatives and additional rules and regulations that could adversely affect our business.
The European Union Alternative Investment Fund Managers Directive (the “AIFMD”), as transposed into national law within the member states of the European Union (the “EU”), established a new regulatory regime for alternative investment fund managers, including private equity and hedge fund managers. The AIFMD is intended to apply in the additional member states of the European Economic Area (“EEA”), namely, Norway, Iceland and Liechtenstein, but to date the AIFMD has not yet been referenced in the Agreement on the European Economic Area (but on the assumption that the AIFMD will apply harmonized requirements throughout the EEA, we refer to the EEA rather than to the EU). The AIFMD regulates managers established in or with a registered office in the EEA managing one or more alternative investments funds, but it also regulates non EEA-based managers, such as our affiliates, when they seek to market securities of alternative investment funds in the EEA. We have had to comply with these and other requirements of the AIFMD in order to market our investment funds to professional investors in the EEA, including compliance with prescribed pre-investment disclosures, prescribed annual report disclosures, periodic reporting to regulators in respect of each fund marketed, and asset-stripping restrictions in relation to the acquisition of non-listed companies or issuers established in the EEA (these restrictions prohibit certain distributions to shareholders for 24 months following closing of an acquisition). As there is no requirement for member states to operate or maintain a national private placement regime and, if they do, the member state is free to impose rules that are stricter than the minimum required, this has restricted our ability to market our investment funds, e.g., in those states that do not operate national private placement and/or impose such requirements that make it disproportionately burdensome to do so.
In late 2016, we commenced the process of establishing an authorized manager (“AIFM”) in Luxembourg. A fully-authorized AIFM is entitled to market a fund established in the EEA (an “EEA AIF”) to professional investors in the EEA. The Luxembourg AIFM is primarily intended to manage European fund structures that can be marketed to EEA investors under the passport and that can invest in parallel with our non-EEA funds. The European funds will be managed by the AIFM, but will draw on the expertise of the U.S. managers to pursue the relevant investment strategies.
As an authorized AIFM is subject to all of the requirements of the AIFMD, such as rules relating to, among other things, remuneration, minimum regulatory capital requirements, restrictions on the use of leverage, requirements in relation to liquidity, risk management and valuation of assets, the establishment of a platform in the EEA may increase the ongoing cost of administration and compliance with the AIFMD, including costs and expenses of collecting and collating data of the EEA funds and the preparation of regular reports to be filed with the regulator. The advantages of this structure potentially come at a cost of greater overall complexity, higher compliance and administration costs and less overall flexibility.
Following the financial crisis the FSB has taken on an increasingly important role in promoting the reform of international financial regulation through coordinating national financial authorities and international standard-
36
Table of Contents
setting bodies in their development of regulatory, supervisory and financial sector policies. One of the risks identified by the FSB to the stability of the financial system is credit intermediation (involving maturity and liquidity transformation) and/or a build-up of leverage by non-bank entities — so-called “shadow banking”. The FSB has proposed adoption of a two-pronged strategy to address financial stability risks in shadow banking: (a) create a monitoring framework to track developments in shadow banking; and (b) coordinate and contribute to the development of policies to strengthen oversight and regulation of shadow banking, focusing on measures to: (i) mitigate risks in banks’ interactions with shadow banking entities; (ii) reduce the susceptibility of money market funds to “runs”; (iii) improve transparency and align the incentives in securitization; (iv) dampen pro-cyclicality and other financial stability risks in securities financing transactions such as repos and securities lending; and (v) assess and mitigate financial stability risks posed by other shadow banking entities and activities.
In December 2015, the European Banking Authority (“EBA”) produced guidelines to set appropriate aggregate limits to shadow banking entities when carrying out banking activities. These guidelines came into effect on January 1, 2017. While most alternative investment funds are excluded from the definition of “shadow banking entity,” funds that use leverage on a substantial basis at fund level or have certain third party lending exposures are within the definition. When dealing with shadow banking entities, the EEA financial institution would be required to implement additional effective processes (including with respect to due diligence) and set internal aggregate and individual limits to such exposures where they exceed 0.25% of the institution’s eligible capital. While the guidelines do not themselves introduce a quantitative limit to institutions’ exposures to shadow banking entities at the individual or aggregate exposure level, they place the responsibility on the banking sector to demonstrate that risks are managed effectively. Affected institutions will be required to set internal aggregate and individual limits to exposures to individual shadow banking entities which could limit or restrict the availability of credit and/or increase the cost of credit from these institutions for impacted funds.
In July 2016, Germany introduced legislation to prohibit banks above a certain threshold from conducting credit and guarantee business with: (i) German hedge funds or German funds of hedge funds or (ii) non-German funds which use leverage on a substantial basis within the meaning of the AIFMD. In Germany, certain banks are therefore forbidden from providing loans and/or guarantees to an AIF using leverage on a substantial basis, thereby potentially limiting or restricting the availability of credit and/or increasing the cost of credit for affected funds.
Our investment businesses are subject to the risk that similar measures might be introduced in other countries in which our funds currently have investments or plan to invest in the future, or that other legislative or regulatory measures that negatively affect their respective portfolio investments might be promulgated in any of the countries in which they invest. Blackstone’s non-U.S. advisory entities are, to the extent required, registered with the relevant regulatory authority of the jurisdiction in which the advisory entity is domiciled. In addition, we voluntarily participate in several transparency initiatives, including those organized by the American Investment Council, the British Private Equity and Venture Capital Association and others calling for the reporting of information concerning companies in which certain of our funds have investments. The reporting related to such initiatives may divert the attention of our personnel and the management teams of our funds’ portfolio companies. Moreover, sensitive business information relating to us or our funds’ portfolio companies could be publicly released.
Our use of leverage to finance our business will expose us to substantial risks, which are exacerbated by our funds’ use of leverage to finance investments.
We intend to use borrowings to finance our business operations as a public company. For example, in August 2009, September 2010, August 2012, April 2014, April 2015, May 2015 and October 2016, we issued (a) $600 million of 6.625% ten-year senior notes, (b) $400 million of 5.875% ten-year senior notes, (c) $400 million of 4.75% ten-year senior notes and $250 million of 6.25% thirty-year senior notes, (d) $500 million of 5% thirty-year senior notes, (e) $350 million of 4.45% thirty-year senior notes, (f) €300 million of 2% ten-year senior notes, and (g) €600 million of 1% ten-year senior notes, respectively. Borrowing to finance our businesses exposes us to the typical risks associated with the use of leverage, including those discussed below under “— Dependence on significant leverage in investments by our funds could adversely affect our ability to achieve attractive rates of
37
Table of Contents
return on those investments.” In order for us to utilize leverage to finance our business, we are dependent on financial institutions such as global banks extending credit to us on terms that are reasonable to us. There is no guarantee that such institutions will continue to extend credit to us or renew any existing credit agreements we may have with them, or that we will be able to refinance outstanding notes when they mature. We have a credit facility which provides for revolving credit borrowings that has a final maturity date of August 31, 2021. As borrowings under the facility or any other indebtedness mature, we may be required to either refinance them by entering into a new facility, which could result in higher borrowing costs, or by issuing equity, which would dilute existing unitholders. We could also repay them by using cash on hand, cash provided by our continuing operations or cash from the sale of our assets, which could reduce distributions to our unitholders. We could have difficulty entering into new facilities or issuing equity in the future on attractive terms, or at all. These risks are exacerbated by our funds’ use of leverage to finance investments.
We are subject to substantial litigation risks and may face significant liabilities and damage to our professional reputation as a result of litigation allegations and negative publicity.
In recent years, the volume of claims and amount of damages claimed in litigation and regulatory proceedings against the financial services industry in general have been increasing. The investment decisions we make in our asset management business and the activities of our investment professionals on behalf of portfolio companies of our carry funds may subject the companies, funds and us to the risk of third party litigation arising from investor dissatisfaction with the performance of those investment funds, alleged conflicts of interest, the activities of our funds’ portfolio companies and a variety of other litigation claims. From time to time we, our funds and our funds’ portfolio companies have been and may be subject to class action suits by shareholders in public companies that we have agreed to acquire that challenge our acquisition transactions and/or attempt to enjoin them. Please see “Item 3. Legal Proceedings” below for additional information.
In addition, to the extent investors in our investment funds suffer losses resulting from fraud, gross negligence, willful misconduct or other similar misconduct, investors may have remedies against us, our investment funds, our senior managing directors or our affiliates under the federal securities law and/or state law. While the general partners and investment advisers to our investment funds, including their directors, officers, other employees and affiliates, are generally indemnified to the fullest extent permitted by law with respect to their conduct in connection with the management of the business and affairs of our investment funds, such indemnity does not extend to actions determined to have involved fraud, gross negligence, willful misconduct or other similar misconduct.
The activities of our capital markets services business may also subject us to the risk of liabilities to our clients and third parties, including our clients’ stockholders, under securities or other laws in connection with transactions in which we participate.
In addition, our plan, to the extent that market conditions permit, is to continue to grow our investment businesses and expand into new investment strategies, geographic markets, businesses and distribution channels, including the retail channel. To the extent we distribute products through new channels, including through unaffiliated firms, we may not be able to effectively monitor or control the manner of their distribution, which could result in litigation against us, including with respect to, among other things, claims that products distributed through such channels are distributed to customers for whom they are unsuitable or distributed in any other inappropriate manner. In addition, the distribution of products through new channels whether directly or through market intermediaries, including in the retail channel, could expose us to additional regulatory risk in the form of allegations of improper conduct and/or actions by state and federal regulators against us with respect to, among other things, product suitability, conflicts of interest and the adequacy of disclosure to customers to whom our products are distributed through those channels.
If any private lawsuits or regulatory actions were brought against us and resulted in a finding of substantial legal liability, it could materially adversely affect our business, financial condition or results of operations or cause significant reputational harm to us, which could seriously harm our business. We depend to a large extent on our
38
Table of Contents
business relationships and our reputation for integrity and high-caliber professional services to attract and retain investors and to pursue investment opportunities for our carry funds. As a result, allegations of improper conduct by private litigants or regulators, whether the ultimate outcome is favorable or unfavorable to us, as well as negative publicity and press speculation about us, our investment activities, our new lines of business or distribution channels, or the private equity industry in general, whether or not valid, may harm our reputation, which may be more damaging to our business than to other types of businesses.
Employee misconduct could harm us by impairing our ability to attract and retain clients and subjecting us to significant legal liability and reputational harm. Fraud and other deceptive practices or other misconduct at our funds’ portfolio companies could similarly subject us to liability and reputational damage and also harm performance.
There is a risk that our employees could engage in misconduct that adversely affects our business. We are subject to a number of obligations and standards arising from our asset management business and our authority over the assets managed by our asset management business. The violation of these obligations and standards by any of our employees would adversely affect our clients and us. Our business often requires that we deal with confidential matters of great significance to companies in which we may invest. If our employees were improperly to use or disclose confidential information, we could suffer serious harm to our reputation, financial position and current and future business relationships. Detecting or deterring employee misconduct is not always possible, and the extensive precautions we take to detect and prevent this activity may not be effective in all cases. If one of our employees were to engage in misconduct or were to be accused of such misconduct, our business and our reputation could be adversely affected.
In recent years, the U.S. Department of Justice and the SEC have devoted greater resources to enforcement of the Foreign Corrupt Practices Act (“FCPA”). In addition, the United Kingdom has also significantly expanded the reach of its anti-bribery laws. Local jurisdictions, such as Brazil, have also recently brought a greater focus to anti-bribery laws. While we have developed and implemented policies and procedures designed to ensure strict compliance by us and our personnel with the FCPA, such policies and procedures may not be effective in all instances to prevent violations. Any determination that we have violated the FCPA, the U.K. anti-bribery laws or other applicable anti-corruption laws could subject us to, among other things, civil and criminal penalties, material fines, profit disgorgement, injunctions on future conduct, securities litigation and a general loss of investor confidence, any one of which could adversely affect our business prospects, financial position or the market value of our common units.
In addition, we may also be adversely affected if there is misconduct by personnel of portfolio companies in which our funds invest. For example, financial fraud or other deceptive practices at our funds’ portfolio companies, or failures by personnel at our funds’ portfolio companies to comply with anti-bribery, trade sanctions or other legal and regulatory requirements, could cause significant reputational and business harm to us. Such misconduct may undermine our due diligence efforts with respect to such portfolio companies and could negatively affect the valuations of the investments by our funds in such portfolio companies. In addition, we may face an increased risk of such misconduct to the extent our investment in non-U.S. markets, particularly emerging markets, increases.
Poor performance of our investment funds would cause a decline in our revenue, income and cash flow, may obligate us to repay carried interest previously paid to us, and could adversely affect our ability to raise capital for future investment funds.
In the event that any of our investment funds were to perform poorly, our revenue, income and cash flow would decline because the value of our assets under management would decrease, which would result in a reduction in management fees, and our investment returns would decrease, resulting in a reduction in the carried interest and incentive fees we earn. Moreover, we could experience losses on our investments of our own principal as a result of poor investment performance by our investment funds. Furthermore, if, as a result of poor performance of later investments in a carry fund’s life, the fund does not achieve certain investment returns for the fund over its life, we
39
Table of Contents
will be obligated to repay the amount by which carried interest that was previously distributed to us exceeds amounts to which the relevant general partner is ultimately entitled.
Poor performance of our investment funds could make it more difficult for us to raise new capital. Investors in carry funds might decline to invest in future investment funds we raise and investors in hedge funds or other investment funds might withdraw their investments as a result of poor performance of the investment funds in which they are invested. Investors and potential investors in our funds continually assess our investment funds’ performance, and our ability to raise capital for existing and future investment funds and avoid excessive redemption levels will depend on our investment funds’ continued satisfactory performance. Accordingly, poor fund performance may deter future investment in our funds and thereby decrease the capital invested in our funds and ultimately, our management fee revenue. Alternatively, in the face of poor fund performance, investors could demand lower fees or fee concessions for existing or future funds which would likewise decrease our revenue.
Our asset management business depends in large part on our ability to raise capital from third party investors. If we are unable to raise capital from third party investors, we would be unable to collect management fees or deploy their capital into investments and potentially collect transaction fees or carried interest, which would materially reduce our revenue and cash flow and adversely affect our financial condition.
Our ability to raise capital from third party investors depends on a number of factors, including certain factors that are outside our control. Certain factors, such as the performance of the stock market and the asset allocation rules or investment policies to which such third party investors are subject, could inhibit or restrict the ability of third party investors to make investments in our investment funds or the asset classes in which our investment funds invest. For example, during 2008 and 2009, many third party investors that invest in alternative assets and have historically invested in our investment funds experienced significant volatility in valuations of their investment portfolios, including a significant decline in the value of their overall private equity, real estate, venture capital and hedge fund portfolios, which affected our ability to raise capital from them. Coupled with a lack of realizations during that period from their existing private equity and real estate portfolios, many of these investors were left with disproportionately outsized remaining commitments to a number of investment funds, which significantly limited their ability to make new commitments to third party managed investment funds such as those managed by us. Our ability to raise new funds could similarly be hampered if the general appeal of private equity and alternative investments were to decline. An investment in a limited partner interest in a private equity fund is more illiquid and the returns on such investment may be more volatile than an investment in securities for which there is a more active and transparent market. Private equity and alternative investments could fall into disfavor as a result of concerns about liquidity and short-term performance. Such concerns could be exhibited, in particular, by public pension funds, which have historically been among the largest investors in alternative assets. Many public pension funds are significantly underfunded and their funding problems have been, and may in the future be, exacerbated by economic downturn. Concerns with liquidity could cause such public pension funds to reevaluate the appropriateness of alternative investments. Although the amount of commitments investors are making to alternative investment funds has increased in recent years, there is no assurance that this will continue or that our ability to raise capital from investors will not be hampered. In addition, our ability to raise capital from third parties outside of the U.S. could be limited to the extent other countries, such as China, impose restrictions or limitations on outbound foreign investment.
In addition, certain institutional investors, including sovereign wealth funds and public pension funds, have demonstrated an increased preference for alternatives to the traditional investment fund structure, such as managed accounts, smaller funds and co-investment vehicles. There can be no assurance that such alternatives will be as profitable for us as the traditional investment fund structure, or as to the impact such a trend could have on the cost of our operations or profitability if we were to implement these alternative investment structures. Moreover, certain institutional investors are demonstrating a preference to in-source their own investment professionals and to make direct investments in alternative assets without the assistance of private equity advisers like us. Such institutional investors may become our competitors and could cease to be our clients. As some existing investors cease or significantly curtail making commitments to alternative investment funds, we may need to identify and attract new
40
Table of Contents
investors in order to maintain or increase the size of our investment funds. There are no assurances that we can find or secure commitments from those new investors. If economic conditions were to deteriorate or if we are unable to find new investors, we might raise less than our desired amount for a given fund. Further, as we seek to expand into other asset classes, we may be unable to raise a sufficient amount of capital to adequately support such businesses. If we are unable to successfully raise capital, it could materially reduce our revenue and cash flow and adversely affect our financial condition.
Although retail investors have been part of our historic distribution efforts, we have increasingly undertaken business initiatives to increase the number and type of investment products we offer to high net worth individuals, family offices and other mass affluent investors. In some cases we seek to distribute our unregistered funds to such retail investors indirectly through feeder funds sponsored by brokerage firms or private banks and in other cases directly to the qualified clients of independent investment advisors and brokers. In other cases we create registered investment products specifically designed for retail investors. Our initiatives to access retail investors entail the investment of resources and our objectives may not be fully realized. Moreover, accessing retail investors and selling retail directed products exposes us to new and greater levels of risk, including heightened litigation and regulatory enforcement risks. Although we seek to ensure through due diligence and onboarding procedures that the channels through which retail investors access our investment products conduct themselves responsibly, to the extent that our investment products are being distributed through third parties we are exposed to reputational damage and possible legal liability to the extent such third parties improperly sell our products to investors. Similarly, the hiring of employees to cover independent advisors and brokers presents risks if they fail to follow training, review and supervisory procedures.
In addition, in connection with raising new funds or making further investments in existing funds, we negotiate terms for such funds and investments with existing and potential investors. The outcome of such negotiations could result in our agreement to terms that are materially less favorable to us than for prior funds we have managed or funds managed by our competitors. Such terms could restrict our ability to raise investment funds with investment objectives or strategies that compete with existing funds, add additional expenses and obligations for us in managing the fund or increase our potential liabilities, all of which could ultimately reduce our revenues. In addition, certain institutional investors have publicly criticized certain fund fee and expense structures, including management fees and transaction and advisory fees. Although we have no obligation to modify any of our fees with respect to our existing funds, we may experience pressure to do so in our funds. For example, we have confronted and expect to continue to confront requests from a variety of investors and groups representing investors to decrease fees, which could result in a reduction in the fees and carried interest and incentive fees we earn.
Valuation methodologies for certain assets in our funds can be subject to significant subjectivity and the fair value of assets established pursuant to such methodologies may never be realized, which could result in significant losses for our funds.
There are often no readily ascertainable market prices for illiquid investments in our private equity, real estate and certain of our credit-focused funds. We determine the value of the investments of each of our private equity, real estate and credit-focused funds at least quarterly based on the fair value of such investments. The fair value of investments of a private equity, real estate or credit-focused fund is generally determined using several methodologies described in the investment funds’ valuation policies.
Investments for which market prices are not observable include private investments in the equity of operating companies or real estate properties. Fair values of such investments are determined by reference to projected net earnings, earnings before interest, taxes, depreciation and amortization (“EBITDA”), the discounted cash flow method, public market or private transactions, valuations for comparable companies and other measures which, in many cases, are unaudited at the time received. In determining fair values of real estate investments, we also consider projected operating cash flows, sales of comparable assets, if any, replacement costs and capitalization rates (“cap rates”) analyses. Valuations may be derived by reference to observable valuation measures for comparable companies or assets (for example, multiplying a key performance metric of the investee company or asset, such as EBITDA, by a relevant valuation multiple observed in the range of comparable companies or
41
Table of Contents
transactions), adjusted by management for differences between the investment and the referenced comparables, and in some instances by reference to option pricing models or other similar methods. Additionally, where applicable, projected distributable cash flow through debt maturity will also be considered in support of the investment’s fair value. In determining fair values of exploration and production (E&P) investments within the energy sector, we consider the following: projected operating cash flows resulting from the utilization of third party analysis of the reserve quantities, which may from time to time be adjusted for management’s view, combined with the forward strip price for the specific commodity in the near-term, BEP’s long-term view of the commodity price in the outer years, sales of comparable assets, and replacement costs. Valuations may be derived by reference to observable valuation measures for comparable companies or assets (for example, multiplying a key performance metric of the investee company or asset, such as barrel of oil equivalent, or BOE, by a relevant reserve metric observed in the range of comparable companies or transactions), adjusted by management for differences between the investment and the referenced comparables, and in some instances by reference to other similar methods. Additionally, where applicable, given the structured nature of some of the preferred securities, projected distributable cash flow through maturity or other triggering events will also be considered in support of the investment’s fair value. These valuation methodologies involve a significant degree of management judgment.
In certain cases debt and equity securities are valued on the basis of prices from an orderly transaction between market participants provided by reputable dealers or pricing services. In determining the value of a particular investment, pricing services may use certain information with respect to transactions in such investments, quotations from dealers, pricing matrices and market transactions in comparable investments and various relationships between investments.
The determination of fair value using these methodologies takes into consideration a range of factors including but not limited to the price at which the investment was acquired, the nature of the investment, local market conditions, trading values on public exchanges for comparable securities, current and projected operating performance and financing transactions subsequent to the acquisition of the investment. These valuation methodologies involve a significant degree of management judgment. For example, as to investments that we share with another sponsor, we may apply a different valuation methodology than the other sponsor does or derive a different value than the other sponsor has derived on the same investment. These differences might cause some investors to question our valuations.
Because there is significant uncertainty in the valuation of, or in the stability of the value of illiquid investments, the fair values of such investments as reflected in an investment fund’s net asset value do not necessarily reflect the prices that would actually be obtained by us on behalf of the investment fund when such investments are realized. Realizations at values significantly lower than the values at which investments have been reflected in prior fund net asset values would result in losses for the applicable fund, a decline in asset management fees and the loss of potential carried interest and incentive fees. Changes in values attributed to investments from quarter to quarter may result in volatility in the net asset values and results of operations and cash flow that we report from period to period. Also, a situation where asset values turn out to be materially different than values reflected in prior fund net asset values could cause investors to lose confidence in us, which would in turn result in difficulty in raising additional funds or redemptions from our hedge funds.
The historical returns attributable to our funds should not be considered as indicative of the future results of our funds or of our future results or of any returns expected on an investment in our common units.
The historical and potential future returns of the investment funds that we manage are not directly linked to returns on our common units. Therefore, any continued positive performance of the investment funds that we manage will not necessarily result in positive returns on an investment in our common units. However, poor performance of the investment funds that we manage would cause a decline in our revenue from such investment funds, and would therefore have a negative effect on our performance and in all likelihood the returns on an investment in our common units.
42
Table of Contents
Moreover, with respect to the historical returns of our investment funds:
| • | we may create new funds in the future that reflect a different asset mix and different investment strategies, as well as a varied geographic and industry exposure as compared to our present funds, and any such new funds could have different returns from our existing or previous funds, |
| • | as the global markets rebounded from the financial crisis in recent years, market conditions were largely favorable, which helped to generate positive performance, particularly in our private equity and real estate businesses, although there can be no assurance that such conditions will repeat or that our current or future investment funds will avail themselves of comparable market conditions, |
| • | the rates of returns of our carry funds reflect unrealized gains as of the applicable measurement date that may never be realized, which may adversely affect the ultimate value realized from those funds’ investments, |
| • | the rates of returns of our BCP and BREP funds in some years were positively influenced by a number of investments that experienced rapid and substantial increases in value following the dates on which those investments were made, which may not occur with respect to future investments, |
| • | in recent years, there has been increased competition for private equity investment opportunities resulting from, among other things, the increased amount of capital invested in alternative investment funds, |
| • | our investment funds’ returns in some years benefited from investment opportunities and general market conditions that may not repeat themselves, our current or future investment funds might not be able to avail themselves of comparable investment opportunities or market conditions, and the circumstances under which our current or future funds may make future investments may differ significantly from those conditions prevailing in the past, |
| • | newly established funds may generate lower returns during the period in which they initially deploy their capital, and |
| • | the rates of return reflect our historical cost structure, which may vary in the future due to various factors enumerated elsewhere in this report and other factors beyond our control, including changes in laws. |
The future internal rate of return for any current or future fund may vary considerably from the historical internal rate of return generated by any particular fund, or for our funds as a whole. In addition, future returns will be affected by the applicable risks described elsewhere in this Annual Report on Form 10-K, including risks of the industries and businesses in which a particular fund invests.
Dependence on significant leverage in investments by our funds could adversely affect our ability to achieve attractive rates of return on those investments.
Many of our carry funds’ investments rely heavily on the use of leverage, and our ability to achieve attractive rates of return on investments will depend on our ability to access sufficient sources of indebtedness at attractive rates. For example, in many private equity investments, indebtedness may constitute as much as 70% or more of a portfolio company’s or real estate asset’s total debt and equity capitalization, including debt that may be incurred in connection with the investment. The absence of available sources of sufficient senior debt financing for extended periods of time could therefore materially and adversely affect our private equity and real estate businesses. In addition, in March 2013, the Federal Reserve and other U.S. federal banking agencies issued updated leveraged lending guidance covering transactions characterized by a degree of financial leverage. In November 2015, in connection with the banking agencies’ most recent review of large credits under the Shared National Credit review, the agencies noted high credit risk and weaknesses related to leveraged lending and for loans related to oil and gas exploration, production and energy services. Such guidance may limit the amount or cost of financing we are able to obtain for our transactions, and as a result, the returns on our investments may suffer. See “— Regulatory changes in the United States could adversely affect our business.” Furthermore, any tax reform limiting the deductibility of corporate interest expense could make it more costly to use debt financing for our acquisitions or otherwise have an
43
Table of Contents
adverse impact on the cost structure of our transactions, and could therefore adversely affect the returns on our funds’ investments. See “— Possible U.S. federal income tax reform, could adversely affect us.”
In addition, an increase in either the general levels of interest rates or in the risk spread demanded by sources of indebtedness would make it more expensive to finance those businesses’ investments. Increases in interest rates could also make it more difficult to locate and consummate private equity investments because other potential buyers, including operating companies acting as strategic buyers, may be able to bid for an asset at a higher price due to a lower overall cost of capital or their ability to benefit from a higher amount of cost savings following the acquisition of the asset. In addition, a portion of the indebtedness used to finance private equity investments often includes high yield debt securities issued in the capital markets. Availability of capital from the high yield debt markets is subject to significant volatility, and there may be times when we might not be able to access those markets at attractive rates, or at all, when completing an investment.
Investments in highly leveraged entities are inherently more sensitive to declines in revenues, increases in expenses and interest rates and adverse economic, market and industry developments. The incurrence of a significant amount of indebtedness by an entity could, among other things:
| • | give rise to an obligation to make mandatory pre-payments of debt using excess cash flow, which might limit the entity’s ability to respond to changing industry conditions to the extent additional cash is needed for the response, to make unplanned but necessary capital expenditures or to take advantage of growth opportunities, |
| • | limit the entity’s ability to adjust to changing market conditions, thereby placing it at a competitive disadvantage compared to its competitors who have relatively less debt, |
| • | allow even moderate reductions in operating cash flow to render it unable to service its indebtedness, leading to a bankruptcy or other reorganization of the entity and a loss of part or all of the equity investment in it, |
| • | limit the entity’s ability to engage in strategic acquisitions that might be necessary to generate attractive returns or further growth, and |
| • | limit the entity’s ability to obtain additional financing or increase the cost of obtaining such financing, including for capital expenditures, working capital or general corporate purposes. |
As a result, the risk of loss associated with a leveraged entity is generally greater than for companies with comparatively less debt. For example, many investments consummated by private equity sponsors during 2005, 2006 and 2007 that utilized significant amounts of leverage subsequently experienced severe economic stress and, in certain cases, defaulted on their debt obligations due to a decrease in revenues and cash flow precipitated by the subsequent economic downturn during 2008 and 2009.
When our BCP and BREP funds’ existing portfolio investments reach the point when debt incurred to finance those investments mature in significant amounts and must be either repaid or refinanced, those investments may materially suffer if they have generated insufficient cash flow to repay maturing debt and there is insufficient capacity and availability in the financing markets to permit them to refinance maturing debt on satisfactory terms, or at all. If a limited availability of financing for such purposes were to persist for an extended period of time, when significant amounts of the debt incurred to finance our private equity and real estate funds’ existing portfolio investments came due, these funds could be materially and adversely affected.
Many of the hedge funds in which our funds of hedge funds invest and our credit-focused funds, CLOs may choose to use leverage as part of their respective investment programs and regularly borrow a substantial amount of their capital. The use of leverage poses a significant degree of risk and enhances the possibility of a significant loss in the value of the investment portfolio. A fund may borrow money from time to time to purchase or carry securities or may enter into derivative transactions (such as total return swaps) with counterparties that have embedded
44
Table of Contents
leverage. The interest expense and other costs incurred in connection with such borrowing may not be recovered by appreciation in the securities purchased or carried and will be lost — and the timing and magnitude of such losses may be accelerated or exacerbated — in the event of a decline in the market value of such securities. Gains realized with borrowed funds may cause the fund’s net asset value to increase at a faster rate than would be the case without borrowings. However, if investment results fail to cover the cost of borrowings, the fund’s net asset value could also decrease faster than if there had been no borrowings.
Increases in interest rates could also decrease the value of fixed-rate debt investments that our investment funds make. In addition, to the extent that any changes in tax law make debt financing less attractive to certain categories of borrowers this could adversely affect the investment opportunities for our credit-focused funds.
Any of the foregoing circumstances could have a material adverse effect on our financial condition, results of operations and cash flow.
The asset management business is intensely competitive.
The asset management business is intensely competitive, with competition based on a variety of factors, including investment performance, the quality of service provided to clients, investor liquidity and willingness to invest, fund terms (including fees), brand recognition and business reputation. Our asset management business competes with a number of private equity funds, specialized investment funds, hedge funds, funds of hedge funds and other sponsors managing pools of capital, as well as corporate buyers, traditional asset managers, commercial banks, investment banks and other financial institutions (including sovereign wealth funds), and we expect that competition will continue to increase. A number of factors serve to increase our competitive risks:
| • | a number of our competitors in some of our businesses have greater financial, technical, marketing and other resources and more personnel than we do, |
| • | some of our funds may not perform as well as competitors’ funds or other available investment products, |
| • | several of our competitors have significant amounts of capital, and many of them have similar investment objectives to ours, which may create additional competition for investment opportunities and may reduce the size and duration of pricing inefficiencies that many alternative investment strategies seek to exploit, |
| • | some of our competitors, particularly strategic competitors, may have a lower cost of capital, which may be exacerbated to the extent potential changes to the Internal Revenue Code limit the deductibility of interest expense, |
| • | some of our competitors may have access to funding sources that are not available to us, which may create competitive disadvantages for us with respect to investment opportunities, |
| • | some of our competitors may be subject to less regulation and accordingly may have more flexibility to undertake and execute certain businesses or investments than we can and/or bear less compliance expense than we do, |
| • | some of our competitors may have more flexibility than us in raising certain types of investment funds under the investment management contracts they have negotiated with their investors, |
| • | some of our competitors may have higher risk tolerances, different risk assessments or lower return thresholds, which could allow them to consider a wider variety of investments and to bid more aggressively than us for investments that we want to make, |
| • | some of our competitors may be more successful than us in the development and implementation of new technology to address investor demand for product and strategy innovation, particularly in the hedge fund industry, |
| • | there are relatively few barriers to entry impeding new alternative asset fund management firms, and the successful efforts of new entrants into our various businesses, including former “star” portfolio managers at large diversified financial institutions as well as such institutions themselves, is expected to continue to result in increased competition, |
45
Table of Contents
| • | some of our competitors may have better expertise or be regarded by investors as having better expertise in a specific asset class or geographic region than we do, |
| • | our competitors that are corporate buyers may be able to achieve synergistic cost savings in respect of an investment, which may provide them with a competitive advantage in bidding for an investment, |
| • | some investors may prefer to invest with an investment manager that is not publicly traded or is smaller with only one or two investment products that it manages, and |
| • | other industry participants will from time to time seek to recruit our investment professionals and other employees away from us. |
We may lose investment opportunities in the future if we do not match investment prices, structures and terms offered by competitors. Alternatively, we may experience decreased rates of return and increased risks of loss if we match investment prices, structures and terms offered by competitors. Moreover, if we are forced to compete with other alternative asset managers on the basis of price, we may not be able to maintain our current fund fee and carried interest terms. We have historically competed primarily on the performance of our funds, and not on the level of our fees or carried interest relative to those of our competitors. However, there is a risk that fees and carried interest in the alternative investment management industry will decline, without regard to the historical performance of a manager. Fee or carried interest income reductions on existing or future funds, without corresponding decreases in our cost structure, would adversely affect our revenues and profitability.
In addition, the attractiveness of our investment funds relative to investments in other investment products could decrease depending on economic conditions. Furthermore, any deregulatory measures for the U.S. financial services industry undertaken by the U.S. Congress or the Trump administration may create additional competition, particularly with respect to our credit-focused funds. See “— Financial deregulation measures proposed by the Trump administration and members of the U.S. Congress may create regulatory uncertainty for the financial sector, increase competition in certain of our investment strategies and adversely affect our business, financial condition and results of operations.”
This competitive pressure could adversely affect our ability to make successful investments and limit our ability to raise future investment funds, either of which would adversely impact our business, revenue, results of operations and cash flow.
The due diligence process that we undertake in connection with investments by our investment funds may not reveal all facts that may be relevant in connection with an investment.
Before making investments in private equity and other investments, we conduct due diligence that we deem reasonable and appropriate based on the facts and circumstances applicable to each investment. When conducting due diligence, we may be required to evaluate important and complex business, financial, tax, accounting, environmental and legal issues. Outside consultants, legal advisers, accountants and investment banks may be involved in the due diligence process in varying degrees depending on the type of investment. Nevertheless, when conducting due diligence and making an assessment regarding an investment, we rely on the resources available to us, including information provided by the target of the investment and, in some circumstances, third party investigations. The due diligence investigation that we will carry out with respect to any investment opportunity may not reveal or highlight all relevant facts (including fraud) that may be necessary or helpful in evaluating such investment opportunity. Moreover, such an investigation will not necessarily result in the investment being successful.
In connection with the due diligence that our funds of hedge funds conduct in making and monitoring investments in third party hedge funds, we rely on information supplied by third party hedge funds or by service providers to such third party hedge funds. The information we receive from them may not be accurate or complete and therefore we may not have all the relevant facts necessary to properly assess and monitor our funds’ investment in a particular hedge fund.
46
Table of Contents
Our asset management activities involve investments in relatively high-risk, illiquid assets, and we may fail to realize any profits from these activities for a considerable period of time or lose some or all of our principal investments.
Many of our investment funds invest in securities that are not publicly traded. In many cases, our investment funds may be prohibited by contract or by applicable securities laws from selling such securities for a period of time. Our investment funds will generally not be able to sell these securities publicly unless their sale is registered under applicable securities laws, or unless an exemption from such registration is available. The ability of many of our investment funds, particularly our BCP funds, to dispose of investments is heavily dependent on the public equity markets. For example, the ability to realize any value from an investment may depend upon the ability to complete an initial public offering of the portfolio company in which such investment is held. Even if the securities are publicly traded, large holdings of securities can often be disposed of only over a substantial length of time, exposing the investment returns to risks of downward movement in market prices during the intended disposition period. Moreover, because the investment strategy of many of our funds, particularly our private equity funds, often entails our having representation on our funds’ public portfolio company boards, our funds may be restricted in their ability to effect such sales during certain time periods. Accordingly, under certain conditions, our investment funds may be forced to either sell securities at lower prices than they had expected to realize or defer — potentially for a considerable period of time — sales that they had planned to make. We have made and expect to continue to make significant principal investments in our current and future investment funds. Contributing capital to these investment funds is risky, and we may lose some or the entire principal amount of our investments.
We have engaged in large-sized investments, which involve certain complexities and risks that are not encountered in small- and medium-sized investments.
Our BCP and BREP funds have invested and plan to continue to invest in large transactions. The size of these investments involves certain complexities and risks that are not encountered in small- and medium-sized investments. For example, larger transactions may be more difficult to finance, and exiting larger deals may present challenges in many cases. In addition, larger transactions may entail greater scrutiny by regulators, labor unions and other third parties.
Larger transactions may be structured as “consortium transactions” due to the size of the investment and the amount of capital required to be invested. A consortium transaction involves an equity investment in which two or more private equity firms serve together or collectively as equity sponsors. We participated in a significant number of consortium transactions in prior years due to the increased size of many of the transactions in which we were involved. Consortium transactions generally entail a reduced level of control by Blackstone over the investment because governance rights must be shared with the other private equity investors. Accordingly, we may not be able to control decisions relating to the investment, including decisions relating to the management and operation of the company and the timing and nature of any exit, which could result in the risks described in “— Our investment funds make investments in companies that we do not control.”
Any of these factors could increase the risk that our larger investments could be less successful. The consequences to our investment funds of an unsuccessful larger investment could be more severe given the size of the investment.
We often pursue investment opportunities that involve business, regulatory, legal or other complexities.
As an element of our investment style, we may pursue unusually complex investment opportunities. This can often take the form of substantial business, regulatory or legal complexity that would deter other investment managers. Our tolerance for complexity presents risks, as such transactions can be more difficult, expensive and time-consuming to finance and execute; it can be more difficult to manage or realize value from the assets acquired in such transactions; and such transactions sometimes entail a higher level of regulatory scrutiny or a greater risk of contingent liabilities. Any of these risks could harm the performance of our funds.
47
Table of Contents
Our investment funds make investments in companies that we do not control.
Investments by most of our investment funds will include debt instruments and equity securities of companies that we do not control. Such instruments and securities may be acquired by our investment funds through trading activities or through purchases of securities from the issuer. In addition, our flagship and core private equity funds and our opportunistic and core+ real estate funds may acquire minority equity interests (particularly in consortium transactions, as described in “— We have engaged in large-sized investments, which involve certain complexities and risks that are not encountered in small- and medium-sized investments”) and may also dispose of a portion of their majority equity investments in portfolio companies over time in a manner that results in the investment funds retaining a minority investment. Those investments will be subject to the risk that the company in which the investment is made may make business, financial or management decisions with which we do not agree or that the majority stakeholders or the management of the company may take risks or otherwise act in a manner that does not serve our interests. In addition, to the extent we hold only a minority equity interest in a company, we may lack affirmative control rights, which may diminish our ability to influence the company’s affairs in a manner intended to enhance the value of our investment in the company. If any of the foregoing were to occur, the values of investments by our investment funds could decrease and our financial condition, results of operations and cash flow could suffer as a result.
We expect to make investments in companies that are based outside of the United States, which may expose us to additional risks not typically associated with investing in companies that are based in the United States.
Many of our investment funds generally invest a significant portion of their assets in the equity, debt, loans or other securities of issuers located outside the United States, and we expect that international investments will increase as a proportion of certain of our funds’ portfolios in the future. Investments in non-U.S. securities involve certain factors not typically associated with investing in U.S. securities, including risks relating to:
| • | currency exchange matters, including fluctuations in currency exchange rates and costs associated with conversion of investment principal and income from one currency into another, |
| • | less developed or efficient financial markets than in the United States, which may lead to potential price volatility and relative illiquidity, |
| • | the absence of uniform accounting, auditing and financial reporting standards, practices and disclosure requirements and less government supervision and regulation, |
| • | changes in laws or clarifications to existing laws that could impact our tax treaty positions, which could adversely impact the returns on our investments, |
| • | a less developed legal or regulatory environment, differences in the legal and regulatory environment or enhanced legal and regulatory compliance, |
| • | heightened exposure to corruption risk in non-U.S. markets, |
| • | political hostility to investments by foreign or private equity investors, |
| • | reliance on a more limited number of commodity inputs, service providers and/or distribution mechanisms, |
| • | higher rates of inflation, |
| • | higher transaction costs, |
| • | difficulty in enforcing contractual obligations, |
| • | fewer investor protections and less publicly available information in respect of companies in non-U.S. markets, |
| • | certain economic and political risks, including potential exchange control regulations and restrictions on our non-U.S. investments and repatriation of profits on investments or of capital invested, the risks of political, economic or social instability, the possibility of expropriation or confiscatory taxation and adverse economic and political developments, and |
48
Table of Contents
| • | the possible imposition of non-U.S. taxes or withholding on income and gains recognized with respect to such securities. |
In addition, investments in companies that are based outside of the United States are subject to the risk of the possibility of restrictions on international trade or the imposition of tariffs, both of which President Trump has raised as a possibility. See “— The potential for governmental policy changes and regulatory reform by the Trump administration and the U.S. Congress as a result of the recent U.S. Presidential and Congressional elections may create regulatory uncertainty for our funds’ portfolio companies and our investment strategies and adversely affect the profitability of our funds’ portfolio companies.”
There can be no assurance that adverse developments with respect to such risks will not adversely affect our assets that are held in certain countries or the returns from these assets.
We may not have sufficient cash to pay back “clawback” obligations if and when they are triggered under the governing agreements with our investors.
If, at the end of the life of a carry fund (or earlier with respect to certain of our real estate funds, real estate debt funds, core+ real estate funds and certain multi-asset class and/or opportunistic investment funds), as a result of diminished performance of later investments in any carry fund’s life, the carry fund has not achieved investment returns that (in most cases) exceed the preferred return threshold or (in all cases) the general partner receives in excess of the relevant carried interest percentage(s) applicable to the fund as applied to the fund’s cumulative net profits over the life of the fund, we will be obligated to repay the amount by which carried interest that was previously distributed to us exceeds the amounts to which the relevant general partner is ultimately entitled on an after tax basis. This obligation is known as a “clawback” obligation and is an obligation of any person who directly received such carried interest, including us and our employees who participate in our carried interest plans. Although a portion of any distributions by us to our unitholders may include any carried interest received by us, we do not intend to seek fulfillment of any clawback obligation by seeking to have our unitholders return any portion of such distributions attributable to carried interest associated with any clawback obligation. To the extent we are required to fulfill a clawback obligation, however, our general partner may determine to decrease the amount of our distributions to common unitholders. The clawback obligation operates with respect to a given carry fund’s own net investment performance only and performance of other funds are not netted for determining this contingent obligation.
Adverse economic conditions may increase the likelihood that one or more of our carry funds may be subject to clawback obligations upon the end of their respective lives (or earlier with respect to certain of our real estate funds, real estate debt funds and certain multi-asset class and/or opportunistic investment funds). To the extent one or more clawback obligations were to occur for any one or more carry funds, we might not have available cash at the time such clawback obligation is triggered to repay the carried interest and satisfy such obligation. If we were unable to repay such carried interest, we would be in breach of the governing agreements with our investors and could be subject to liability. Moreover, although a clawback obligation is several, the governing agreements of most of our funds provide that to the extent another recipient of carried interest (such as a current or former employee) does not fund his or her respective share, then we and our employees who participate in such carried interest plans may have to fund additional amounts (generally an additional 50-67%) beyond what we actually received in carried interest, although we retain the right to pursue any remedies that we have under such governing agreements against those carried interest recipients who fail to fund their obligations.
Investments by our investment funds will in most cases rank junior to investments made by others.
In most cases, the companies in which our investment funds invest will have indebtedness or equity securities, or may be permitted to incur indebtedness or to issue equity securities, that rank senior to our investment. By their terms, such instruments may provide that their holders are entitled to receive payments of dividends, interest or principal on or before the dates on which payments are to be made in respect of our investment. Also, in the event of
49
Table of Contents
insolvency, liquidation, dissolution, reorganization or bankruptcy of a company in which an investment is made, holders of securities ranking senior to our investment would typically be entitled to receive payment in full before distributions could be made in respect of our investment. After repaying senior security holders, the company may not have any remaining assets to use for repaying amounts owed in respect of our investment. To the extent that any assets remain, holders of claims that rank equally with our investment would be entitled to share on an equal and ratable basis in distributions that are made out of those assets. Also, during periods of financial distress or following an insolvency, the ability of our investment funds to influence a company’s affairs and to take actions to protect their investments may be substantially less than that of the senior creditors.
Investors in our hedge funds may redeem their investments in these funds. In addition, the investment management agreements related to our separately managed accounts may permit the investor to terminate our management of such account on short notice. Lastly, investors in our other investment funds have the right to cause these investment funds to be dissolved. Any of these events would lead to a decrease in our revenues, which could be substantial.
Investors in our hedge funds may generally redeem their investments on an annual, semi-annual or quarterly basis following the expiration of a specified period of time when capital may not be withdrawn, subject to the applicable fund’s specific redemption provisions. In addition, we have certain other open-ended funds, including core+ real estate and certain real estate debt funds, which contain similar redemption provisions in their governing documents. In a declining market, many hedge funds and other open-ended funds, including some of our funds, may experience declines in value, and the pace of redemptions and consequent reduction in our assets under management could accelerate. Such declines in value may be both provoked and exacerbated by margin calls and forced selling of assets. To the extent appropriate and permissible under a fund’s constituent documents, we may limit or suspend redemptions during a redemption period, which may have a reputational impact on us. See “— Hedge fund investments are subject to numerous additional risks.” The decrease in revenues that would result from significant redemptions in our hedge funds and other open-ended funds could have a material adverse effect on our business, revenues, net income and cash flows.
We currently manage a significant portion of investor assets through separately managed accounts whereby we earn management and incentive fees, and we intend to continue to seek additional separately managed account mandates. The investment management agreements we enter into in connection with managing separately managed accounts on behalf of certain clients may be terminated by such clients on as little as 30 days’ prior written notice. In addition, the boards of directors of the investment management companies we manage, or the adviser in respect of the registered BDCs we sub-advise, could terminate our advisory engagement of those companies, on as little as 30 days’ prior written notice. In the case of any such terminations, the management and incentive fees we earn in connection with managing such account or company would immediately cease, which could result in a significant adverse impact on our revenues.
The governing agreements of all of our investment funds (with the exception of certain of our funds of hedge funds) provide that, subject to certain conditions, third party investors in those funds will have the right to remove the general partner of the fund or to accelerate the liquidation date of the investment fund without cause by a simple majority vote, resulting in a reduction in management fees we would earn from such investment funds and a significant reduction in the amounts of total carried interest and incentive fees from those funds. Carried interest and incentive fees could be significantly reduced as a result of our inability to maximize the value of investments by an investment fund during the liquidation process or in the event of the triggering of a “clawback” obligation. Finally, the applicable funds would cease to exist. In addition, the governing agreements of our investment funds provide that in the event certain “key persons” in our investment funds do not meet specified time commitments with regard to managing the fund, then investors in certain funds have the right to vote to terminate the investment period by a specified percentage (including, in certain cases, a simple majority) vote in accordance with specified procedures, accelerate the withdrawal of their capital on an investor-by-investor basis, or the fund’s investment period will automatically terminate and the vote of a simple majority of investors is required to restart it. In addition, the governing agreements of some of our investment funds provide that investors have the right to terminate, for any
50
Table of Contents
reason, the investment period by a vote of 75% of the investors in such fund. In addition to having a significant negative impact on our revenue, net income and cash flow, the occurrence of such an event with respect to any of our investment funds would likely result in significant reputational damage to us.
In addition, because all of our investment funds have advisers that are registered under the Advisers Act, the management agreements of all of our investment funds would be terminated upon an “assignment,” without investor consent, of these agreements, which may be deemed to occur in the event these advisers were to experience a change of control. We cannot be certain that consents required for assignments of our investment management agreements will be obtained if a change of control occurs. In addition, with respect to our 1940 Act registered funds, each investment fund’s investment management agreement must be approved annually by the independent members of such investment fund’s board of directors and, in certain cases, by its stockholders, as required by law. Termination of these agreements would cause us to lose the fees we earn from such investment funds.
Third party investors in our investment funds with commitment-based structures may not satisfy their contractual obligation to fund capital calls when requested by us, which could adversely affect a fund’s operations and performance.
Investors in all of our carry funds (and certain of our hedge funds) make capital commitments to those funds that we are entitled to call from those investors at any time during prescribed periods. We depend on investors fulfilling their commitments when we call capital from them in order for those funds to consummate investments and otherwise pay their obligations (for example, management fees) when due. A default by an investor may also limit a fund’s availability to incur borrowings and avail itself of what would otherwise have been available credit. We have not had investors fail to honor capital calls to any meaningful extent. Any investor that did not fund a capital call would generally be subject to several possible penalties, including having a significant amount of its existing investment forfeited in that fund. However, the impact of the penalty is directly correlated to the amount of capital previously invested by the investor in the fund and if an investor has invested little or no capital, for instance early in the life of the fund, then the forfeiture penalty may not be as meaningful. Investors may also negotiate for lesser or reduced penalties at the outset of the fund, thereby inhibiting our ability to enforce the funding of a capital call. Third party investors in private equity, real estate and venture capital funds typically use distributions from prior investments to meet future capital calls. In cases where valuations of investors’ existing investments fall and the pace of distributions slows, investors may be unable to make new commitments to third party managed investment funds such as those advised by us. If investors were to fail to satisfy a significant amount of capital calls for any particular fund or funds, the operation and performance of those funds could be materially and adversely affected.
Certain policies and procedures implemented to mitigate potential conflicts of interest and address certain regulatory requirements may reduce the synergies across our various businesses.
Because of our various lines of asset management businesses and our capital markets services business, we will be subject to a number of actual and potential conflicts of interest and subject to greater regulatory oversight than that to which we would otherwise be subject if we had just one line of business. In addressing these conflicts and regulatory requirements across our various businesses, we have implemented certain policies and procedures (for example, information walls) that may reduce the positive synergies that we cultivate across these businesses. For example, we may come into possession of material non-public information with respect to issuers in which we may be considering making an investment. As a consequence, we may be precluded from providing such information or other ideas to our other businesses that might be of benefit to them.
Our failure to deal appropriately with conflicts of interest in our investment business could damage our reputation and adversely affect our businesses.
As we have expanded and as we continue to expand the number and scope of our businesses, we increasingly confront potential conflicts of interest relating to our funds’ investment activities. A decision to acquire material
51
Table of Contents
non-public information about a company while pursuing an investment opportunity for a particular fund gives rise to a potential conflict of interest when it results in our having to restrict the ability of other funds to take any action. Certain of our funds may have overlapping investment objectives, including funds that have different fee structures, and potential conflicts may arise with respect to our decisions regarding how to allocate investment opportunities among those funds to the extent the fund documents do not mandate a specific investment allocation. For example, we may allocate an investment opportunity that is appropriate for two or more investment funds in a manner that excludes one or more funds or results in a disproportionate allocation based on factors or criteria that we determine, such as sourcing of the transaction, the relative amounts of capital available for investment in each fund, the nature and extent of involvement in the transaction on the part of the respective teams of investment professionals dedicated to the respective funds and other considerations deemed relevant by us. In addition, the challenge of allocating investment opportunities to certain funds may be exacerbated as we expand our business to include more public vehicles. We may also cause different private equity funds to invest in a single portfolio company, for example where the fund that made an initial investment no longer has capital available to invest. We may also cause different funds that we manage to purchase different classes of securities in the same portfolio company. For example, one of our CLO funds could acquire a debt security issued by the same company in which one of our private equity funds owns common equity securities. A direct conflict of interest could arise between the debt holders and the equity holders if such a company were to develop insolvency concerns, and that conflict would have to be carefully managed by us. In addition, conflicts of interest may exist in the valuation of our investments and regarding decisions about the allocation of specific investment opportunities among us and our funds and the allocation of fees and costs among us, our funds and their portfolio companies. Lastly, in certain, infrequent instances we may purchase an investment alongside one of our investment funds or sell an investment to one of our investment funds and conflicts may arise in respect of the allocation, pricing and timing of such investments and the ultimate disposition of such investments. To the extent we failed to appropriately deal with any such conflicts, it could negatively impact our reputation and ability to raise additional funds or result in potential litigation or regulatory action against us.
Risk management activities may adversely affect the return on our funds’ investments.
When managing our exposure to market risks, we may (on our own behalf or on behalf of our funds) from time to time use forward contracts, options, swaps, caps, collars and floors or pursue other strategies or use other forms of derivative instruments to limit our exposure to changes in the relative values of investments that may result from market developments, including changes in prevailing interest rates, currency exchange rates and commodity prices. The success of any hedging or other derivative transactions generally will depend on our ability to correctly predict market changes, the degree of correlation between price movements of a derivative instrument, the position being hedged, the creditworthiness of the counterparty and other factors. As a result, while we may enter into a transaction in order to reduce our exposure to market risks, the transaction may result in poorer overall investment performance than if it had not been executed. Such transactions may also limit the opportunity for gain if the value of a hedged position increases.
While such hedging arrangements may reduce certain risks, such arrangements themselves may entail certain other risks. These arrangements may require the posting of cash collateral at a time when a fund has insufficient cash or illiquid assets such that the posting of the cash is either impossible or requires the sale of assets at prices that do not reflect their underlying value. Moreover, these hedging arrangements may generate significant transaction costs, including potential tax costs, that reduce the returns generated by a fund. Finally, the CFTC may in the future require certain foreign exchange products to be subject to mandatory clearing, which could increase the cost of entering into currency hedges.
Our real estate funds are subject to the risks inherent in the ownership and operation of real estate and the construction and development of real estate.
Investments in our real estate funds will be subject to the risks inherent in the ownership and operation of real estate and real estate related businesses and assets, including the deterioration of real estate fundamentals. These
52
Table of Contents
risks include but are not limited to, those associated with the burdens of ownership of real property, general and local economic conditions, changes in supply of and demand for competing properties in an area (as a result, for instance, of overbuilding), fluctuations in the average occupancy and room rates for hotel properties, operating income, the financial resources of tenants, changes in building, environmental, zoning and other laws, casualty or condemnation losses, energy and supply shortages, various uninsured or uninsurable risks, natural disasters, changes in government regulations (such as rent control), changes in real property tax rates, changes in interest rates, the reduced availability of mortgage funds which may render the sale or refinancing of properties difficult or impracticable, increased mortgage defaults, increases in borrowing rates, negative developments in the economy that depress travel activity, environmental liabilities, contingent liabilities on disposition of assets, acts of god, terrorist attacks, war and other factors that are beyond our control. According to publicly released statements, a top legislative priority of the Trump administration and the new U.S. Congress is significant tax reform, including significant changes to the taxation of business entities and the deductibility of corporate interest expense. Certain aspects of any such reform could potentially negatively impact investments in real estate. In addition, if our real estate funds acquire direct or indirect interests in undeveloped land or underdeveloped real property, which may often be non-income producing, they will be subject to the risks normally associated with such assets and development activities, including risks relating to the availability and timely receipt of zoning and other regulatory or environmental approvals, the cost and timely completion of construction (including risks beyond the control of our fund, such as weather or labor conditions or material shortages) and the availability of both construction and permanent financing on favorable terms. In addition, our real estate funds may also make investments in residential real estate projects and/or otherwise participate in financing opportunities relating to residential real estate assets or portfolios thereof from time to time, which may be more highly susceptible to adverse changes in prevailing economic and/or market conditions and present additional risks relative to the ownership and operation of commercial real estate assets.
Certain of our investment funds may invest in securities of companies that are experiencing significant financial or business difficulties, including companies involved in bankruptcy or other reorganization and liquidation proceedings. Such investments are subject to a greater risk of poor performance or loss.
Certain of our investment funds, especially our credit-focused funds, may invest in business enterprises involved in work-outs, liquidations, spin-offs, reorganizations, bankruptcies and similar transactions and may purchase high-risk receivables. An investment in such business enterprises entails the risk that the transaction in which such business enterprise is involved either will be unsuccessful, will take considerable time or will result in a distribution of cash or a new security the value of which will be less than the purchase price to the fund of the security or other financial instrument in respect of which such distribution is received. In addition, if an anticipated transaction does not in fact occur, the fund may be required to sell its investment at a loss. Investments in troubled companies may also be adversely affected by U.S. federal and state laws relating to, among other things, fraudulent conveyances, voidable preferences, lender liability and a bankruptcy court’s discretionary power to disallow, subordinate or disenfranchise particular claims. Investments in securities and private claims of troubled companies made in connection with an attempt to influence a restructuring proposal or plan of reorganization in a bankruptcy case may also involve substantial litigation. Because there is substantial uncertainty concerning the outcome of transactions involving financially troubled companies, there is a potential risk of loss by a fund of its entire investment in such company. Moreover, a major economic recession could have a materially adverse impact on the value of such securities. Adverse publicity and investor perceptions, whether or not based on fundamental analysis, may also decrease the value and liquidity of securities rated below investment grade or otherwise adversely affect our reputation.
In addition, at least one federal Circuit Court has determined that an investment fund could be liable for ERISA Title IV pension obligations (including withdrawal liability incurred with respect to union multiemployer plans) of its portfolio companies, if such fund is a “trade or business” and the fund’s ownership interest in the portfolio company is significant enough to bring the portfolio company within its “controlled group.” While a number of cases have held that managing investments is not a “trade or business” for tax purposes, the Circuit Court in this case concluded the an investment fund could be a “trade or business” for ERISA purposes based on certain factors,
53
Table of Contents
including the fund’s level of involvement in the management of its portfolio companies and the nature of its management fee arrangements. Ongoing litigation related to the Circuit Court’s decision suggests that additional factors may be relevant for purposes of determining whether an investment fund could face “controlled group” liability under ERISA, including the structure of the investment and the nature of the fund’s relationship with other affiliated investors and co-investors in the portfolio company. Moreover, regardless of whether or not an investment fund is determined to be a “trade or business” for purposes of ERISA, a court might hold that one of the fund’s portfolio companies could become jointly and severally liable for another portfolio company’s unfunded pension liabilities pursuant to the ERISA “controlled group” rules, depending upon the relevant investment structures and ownership interests as noted above.
Certain of our fund investments may be concentrated in certain asset types or in a geographic region, which could exacerbate any negative performance of those funds to the extent those concentrated investments perform poorly.
The governing agreements of our investment funds contain only limited investment restrictions and only limited requirements as to diversification of fund investments, either by geographic region or asset type. For example, approximately 66% of the investments of our real estate funds (based on fair values as of December 31, 2016) are in office building, hotel and shopping center assets. During periods of difficult market conditions or slowdowns in these sectors, the decreased revenues, difficulty in obtaining access to financing and increased funding costs experienced by our real estate funds may be exacerbated by this concentration of investments, which would result in lower investment returns for our real estate funds.
Investments by our funds in the power and energy industries involve various operational, construction, regulatory and market risks that could adversely affect our results of operations, liquidity and financial condition.
The development, operation and maintenance of power and energy generation facilities involves many risks, including, as applicable, labor issues, start-up risks, breakdown or failure of facilities, lack of sufficient capital to maintain the facilities and the dependence on a specific fuel source. Power and energy generation facilities in which our funds invest are also subject to risks associated with volatility in the price of fuel sources and the impact of unusual or adverse weather conditions or other natural events, as well as the risk of performance below expected levels of output, efficiency or reliability. The occurrence of any such items could result in lost revenues and/or increased expenses. In turn, such developments could impair a portfolio company’s ability to repay its debt or conduct its operations. We may also choose or be required to decommission a power generation facility or other asset. The decommissioning process could be protracted and result in the incurrence of significant financial and/or regulatory obligations or other uncertainties.
Our power and energy sector portfolio companies may also face construction risks typical for power generation and related infrastructure businesses. Such developments could result in substantial unanticipated delays or expenses and, under certain circumstances, could prevent completion of construction activities once undertaken. Delays in the completion of any power project may result in lost revenues or increased expenses, including higher operation and maintenance costs related to such portfolio company.
The power and energy sectors are the subject of substantial and complex laws, rules and regulation by various federal and state regulatory agencies. Failure to comply with applicable laws, rules and regulations could result in the prevention of operation of certain facilities or the prevention of the sale of such a facility to a third party, as well as the loss of certain rate authority, refund liability, penalties and other remedies, all of which could result in additional costs to a portfolio company and adversely affect the investment results. In addition, any legislative efforts by the Trump administration or the new U.S. Congress to overturn or modify policies or regulations enacted by the prior administration that placed limitations on coal and gas electric generation, mining and/or exploration could adversely affect certain of our energy investments, including our alternative energy investments. Conversely, any governmental policy changes encouraging resource extraction could have the effect of supporting low energy prices, which could have a negative impact on certain of our energy investments.
54
Table of Contents
Our businesses that invest in the energy industry also focus on investments in businesses involved in oil and gas exploration and development, which can be a speculative business involving a high degree of risk, including:
| • | the use of new technologies, including hydraulic fracturing, |
| • | reliance on estimates of oil and gas reserves in the evaluation of available geological, geophysical, engineering and economic data for each reservoir, and |
| • | encountering unexpected formations or pressures, premature declines of reservoirs, blow-outs, equipment failures and other accidents in completing wells and otherwise, cratering, sour gas releases, uncontrollable flows of oil, natural gas or well fluids, adverse weather conditions, pollution, fires, spills and other environmental risks. |
In addition, the performance of the investments made by our credit and equity funds in the energy and natural resources markets are also subject to a high degree of market risk, as such investments are likely to be, directly or indirectly substantially dependent upon prevailing prices of oil, natural gas and other commodities. Oil and natural gas prices are subject to wide fluctuation in response to factors beyond the control of us or our funds’ portfolio companies, including relatively minor changes in the supply and demand for oil and natural gas, market uncertainty, the level of consumer product demand, weather conditions, governmental regulation, the price and availability of alternative fuels, political and economic conditions in oil producing countries, foreign supply of such commodities and overall domestic and foreign economic conditions. These factors make it difficult to predict future commodity price movements with any certainty.
The financial projections of our funds’ portfolio companies could prove inaccurate.
Our funds generally establish the capital structure of portfolio companies on the basis of financial projections prepared by the management of such portfolio companies. These projected operating results will normally be based primarily on judgments of the management of the portfolio companies. In all cases, projections are only estimates of future results that are based upon assumptions made at the time that the projections are developed. General economic conditions, which are not predictable, along with other factors may cause actual performance to fall short of the financial projections that were used to establish a given portfolio company’s capital structure. Because of the leverage we typically employ in our investments, this could cause a substantial decrease in the value of our equity holdings in the portfolio company. The inaccuracy of financial projections could thus cause our funds’ performance to fall short of our expectations.
Contingent liabilities could harm fund performance.
We may cause our funds to acquire an investment that is subject to contingent liabilities. Such contingent liabilities could be unknown to us at the time of acquisition or, if they are known to us, we may not accurately assess or protect against the risks that they present. Acquired contingent liabilities could thus result in unforeseen losses for our funds. In addition, in connection with the disposition of an investment in a portfolio company, a fund may be required to make representations about the business and financial affairs of such portfolio company typical of those made in connection with the sale of a business. A fund may also be required to indemnify the purchasers of such investment to the extent that any such representations are inaccurate. These arrangements may result in the incurrence of contingent liabilities by a fund, even after the disposition of an investment. Accordingly, the inaccuracy of representations and warranties made by a fund could harm such fund’s performance.
Our funds may be forced to dispose of investments at a disadvantageous time.
Our funds may make investments that they do not advantageously dispose of prior to the date the applicable fund is dissolved, either by expiration of such fund’s term or otherwise. Although we generally expect that investments will be disposed of prior to dissolution or be suitable for in-kind distribution at dissolution, and the general partners of the funds have only a limited ability to extend the term of the fund with the consent of fund
55
Table of Contents
investors or the advisory board of the fund, as applicable, our funds may have to sell, distribute or otherwise dispose of investments at a disadvantageous time as a result of dissolution. This would result in a lower than expected return on the investments and, perhaps, on the fund itself.
Hedge fund investments are subject to numerous additional risks.
Investments by our funds of hedge funds in other hedge funds, as well as investments by our credit-focused and real estate debt hedge funds, are subject to numerous additional risks, including the following:
| • | Certain of the funds are newly established funds without any operating history or are managed by management companies or general partners who may not have as significant track records as an independent manager. |
| • | Generally, there are few limitations on the execution of the hedge funds’ investment strategies, which are subject to the sole discretion of the management company or the general partner of such funds. |
| • | Hedge funds may engage in short selling, which is subject to the theoretically unlimited risk of loss because there is no limit on how much the price of a security may appreciate before the short position is closed out. A fund may be subject to losses if a security lender demands return of the lent securities and an alternative lending source cannot be found or if the fund is otherwise unable to borrow securities that are necessary to hedge its positions. |
| • | Hedge funds are exposed to the risk that a counterparty will not settle a transaction in accordance with its terms and conditions because of a dispute over the terms of the contract (whether or not bona fide) or because of a credit or liquidity problem, thus causing the fund to suffer a loss. Counterparty risk is accentuated for contracts with longer maturities where events may intervene to prevent settlement, or where the fund has concentrated its transactions with a single or small group of counterparties. Generally, hedge funds are not restricted from dealing with any particular counterparty or from concentrating any or all of their transactions with one counterparty. Moreover, the funds’ internal consideration of the creditworthiness of their counterparties may prove insufficient. The absence of a regulated market to facilitate settlement may increase the potential for losses. |
| • | Credit risk may arise through a default by one of several large institutions that are dependent on one another to meet their liquidity or operational needs, so that a default by one institution causes a series of defaults by the other institutions. This “systemic risk” may adversely affect the financial intermediaries (such as clearing agencies, clearing houses, banks, securities firms and exchanges) with which the hedge funds interact on a daily basis. |
| • | The efficacy of investment and trading strategies depend largely on the ability to establish and maintain an overall market position in a combination of financial instruments. A hedge fund’s trading orders may not be executed in a timely and efficient manner due to various circumstances, including systems failures or human error. In such event, the funds might only be able to acquire some but not all of the components of the position, or if the overall position were to need adjustment, the funds might not be able to make such adjustment. As a result, the funds would not be able to achieve the market position selected by the management company or general partner of such funds, and might incur a loss in liquidating their position. |
| • | Hedge funds are subject to risks due to potential illiquidity of assets. Hedge funds may make investments or hold trading positions in markets that are volatile and which may become illiquid. Timely divestiture or sale of trading positions can be impaired by decreased trading volume, increased price volatility, concentrated trading positions, limitations on the ability to transfer positions in highly specialized or structured transactions to which they may be a party, and changes in industry and government regulations. It may be impossible or costly for hedge funds to liquidate positions rapidly in order to meet margin calls, withdrawal requests or otherwise, particularly if there are other market participants seeking to dispose of similar assets at the same time or the relevant market is otherwise moving against a position or in the |
56
Table of Contents
| event of trading halts or daily price movement limits on the market or otherwise. Moreover, these risks may be exacerbated for our funds of hedge funds. For example, if one of our funds of hedge funds were to invest a significant portion of its assets in two or more hedge funds that each had illiquid positions in the same issuer, the illiquidity risk for our funds of hedge funds would be compounded. For example, in 2008 many hedge funds, including some of our hedge funds, experienced significant declines in value. In many cases, these declines in value were both provoked and exacerbated by margin calls and forced selling of assets. Moreover, certain of our funds of hedge funds were invested in third party hedge funds that halted redemptions in the face of illiquidity and other issues, which precluded those funds of hedge funds from receiving their capital back on request. |
| • | Hedge fund investments are subject to risks relating to investments in commodities, futures, options and other derivatives, the prices of which are highly volatile and may be subject to the theoretically unlimited risk of loss in certain circumstances, including if the fund writes a call option. Price movements of commodities, futures and options contracts and payments pursuant to swap agreements are influenced by, among other things, interest rates, changing supply and demand relationships, trade, fiscal, monetary and exchange control programs and policies of governments and national and international political and economic events and policies. The value of futures, options and swap agreements also depends upon the price of the commodities underlying them. In addition, hedge funds’ assets are subject to the risk of the failure of any of the exchanges on which their positions trade or of their clearinghouses or counterparties. Most U.S. commodities exchanges limit fluctuations in certain commodity interest prices during a single day by imposing “daily price fluctuation limits” or “daily limits,” the existence of which may reduce liquidity or effectively curtail trading in particular markets. |
We are subject to risks in using prime brokers, custodians, counterparties, administrators and other agents.
Many of our funds depend on the services of prime brokers, custodians, counterparties, administrators and other agents to carry out certain securities and derivatives transactions. The terms of these contracts are often customized and complex, and many of these arrangements occur in markets or relate to products that are not subject to regulatory oversight, although the Dodd-Frank Act provides for new regulation of the derivatives market. In particular, some of our funds utilize prime brokerage arrangements with a relatively limited number of counterparties, which has the effect of concentrating the transaction volume (and related counterparty default risk) of these funds with these counterparties.
Our funds are subject to the risk that the counterparty to one or more of these contracts defaults, either voluntarily or involuntarily, on its performance under the contract. Any such default may occur suddenly and without notice to us. Moreover, if a counterparty defaults, we may be unable to take action to cover our exposure, either because we lack contractual recourse or because market conditions make it difficult to take effective action. This inability could occur in times of market stress, which is when defaults are most likely to occur.
In addition, our risk management process may not accurately anticipate the impact of market stress or counterparty financial condition, and as a result, we may not have taken sufficient action to reduce our risks effectively. Default risk may arise from events or circumstances that are difficult to detect, foresee or evaluate. In addition, concerns about, or a default by, one large participant could lead to significant liquidity problems for other participants, which may in turn expose us to significant losses.
Although we have risk management processes to ensure that we are not exposed to a single counterparty for significant periods of time, given the large number and size of our funds, we often have large positions with a single counterparty. For example, most of our funds have credit lines. If the lender under one or more of those credit lines were to become insolvent, we may have difficulty replacing the credit line and one or more of our funds may face liquidity problems.
In the event of a counterparty default, particularly a default by a major investment bank or a default by a counterparty to a significant number of our contracts, one or more of our funds may have outstanding trades that
57
Table of Contents
they cannot settle or are delayed in settling. As a result, these funds could incur material losses and the resulting market impact of a major counterparty default could harm our businesses, results of operation and financial condition.
In the event of the insolvency of a prime broker, custodian, counterparty or any other party that is holding assets of our funds as collateral, our funds might not be able to recover equivalent assets in full as they will rank among the prime broker’s, custodian’s or counterparty’s unsecured creditors in relation to the assets held as collateral. In addition, our funds’ cash held with a prime broker, custodian or counterparty generally will not be segregated from the prime broker’s, custodian’s or counterparty’s own cash, and our funds may therefore rank as unsecured creditors in relation thereto. If our derivatives transactions are cleared through a derivatives clearing organization, the CFTC has issued final rules regulating the segregation and protection of collateral posted by customers of cleared and uncleared swaps. The CFTC is also working to provide new guidance regarding prime broker arrangements and intermediation generally with regard to trading on swap execution facilities.
The counterparty risks that we face have increased in complexity and magnitude as a result of disruption in the financial markets in recent years. For example, the consolidation and elimination of counterparties has increased our concentration of counterparty risk and decreased the universe of potential counterparties, and our funds are generally not restricted from dealing with any particular counterparty or from concentrating any or all of their transactions with one counterparty. In addition, counterparties have in the past and may in the future react to market volatility by tightening underwriting standards and increasing margin requirements for all categories of financing, which may decrease the overall amount of leverage available and increase the costs of borrowing.
Underwriting activities by our capital markets services business expose us to risks.
We act as an underwriter in securities offerings through our capital markets services business. We may incur losses and be subject to reputational harm to the extent that, for any reason, we are unable to sell securities we purchased as an underwriter at the anticipated price levels. As an underwriter, we also are subject to liability for material misstatements or omissions in prospectuses and other offering documents relating to offerings we underwrite.
Risks Related to Our Organizational Structure
Our common unitholders do not elect our general partner or vote on our general partner’s directors and have limited ability to influence decisions regarding our business.
Our general partner, Blackstone Group Management L.L.C., which is owned by our senior managing directors, manages all of our operations and activities. Blackstone Group Management L.L.C. has a board of directors that is responsible for the oversight of our business and operations. Our general partner’s board of directors is elected in accordance with its limited liability company agreement, where our senior managing directors have agreed that our founder, Stephen A. Schwarzman, will have the power to appoint and remove the directors of our general partner. The limited liability company agreement of our general partner provides that at such time as Mr. Schwarzman should cease to be a founder, Hamilton E. James will thereupon succeed Mr. Schwarzman as the sole founding member of our general partner, and thereafter such power will revert to the members of our general partner (our senior managing directors) holding a majority in interest in our general partner.
Our common unitholders do not elect our general partner or its board of directors and, unlike the holders of common stock in a corporation, have only limited voting rights on matters affecting our business and therefore limited ability to influence decisions regarding our business. Furthermore, if our common unitholders are dissatisfied with the performance of our general partner, they have little ability to remove our general partner. Our general partner may not be removed unless that removal is approved by the vote of the holders of not less than two-thirds of the voting power of our outstanding common units and special voting units (including common units and special voting units held by the general partner and its affiliates) and we receive an opinion of counsel regarding
58
Table of Contents
limited liability matters. As of December 31, 2016, Blackstone Partners L.L.C., an entity wholly owned by our personnel and others who are limited partners, had 48.2% of the voting power of The Blackstone Group L.P. limited partners. Therefore, our senior managing directors have the ability to block any removal of our general partner and, given their control of our general partner, control The Blackstone Group L.P.
Blackstone personnel collectively own a controlling interest in us and will be able to determine the outcome of those few matters that may be submitted for a vote of the limited partners.
Our senior managing directors generally have sufficient voting power to determine the outcome of those few matters that may be submitted for a vote of the limited partners of The Blackstone Group L.P., including any attempt to remove our general partner, which our senior managing directors have the ability to block.
Our common unitholders’ voting rights are further restricted by the provision in our partnership agreement stating that any common units held by a person that beneficially owns 20% or more of any class of The Blackstone Group L.P. common units then outstanding (other than our general partner and its affiliates, or a direct or subsequently approved transferee of our general partner or its affiliates) cannot be voted on any matter. In addition, our partnership agreement contains provisions limiting the ability of our common unitholders to call meetings or to acquire information about our operations, as well as other provisions limiting the ability of our common unitholders to influence the manner or direction of our management. Our partnership agreement also does not restrict our general partner’s ability to take actions that may result in our being treated as an entity taxable as a corporation for U.S. federal (and applicable state) income tax purposes without the approval of our common unitholders. Furthermore, the common unitholders are not entitled to dissenters’ rights of appraisal under our partnership agreement or applicable Delaware law in the event of a merger or consolidation, a sale of substantially all of our assets or any other transaction or event. In addition, we have the right to acquire all of our then outstanding common units if not more than 10% of our common units are held by persons other than our general partner and its affiliates.
As a result of these matters and the provisions referred to under “— Our common unitholders do not elect our general partner or vote on our general partner’s directors and have limited ability to influence decisions regarding our business,” our common unitholders may be deprived of an opportunity to receive a premium for their common units in the future through a sale of The Blackstone Group L.P., and the trading prices of our common units may be adversely affected by the absence or reduction of a takeover premium in the trading price.
We are a limited partnership and as a result fall within exceptions from certain corporate governance and other requirements under the rules of the New York Stock Exchange.
We are a limited partnership and fall within exceptions from certain corporate governance and other requirements of the rules of the New York Stock Exchange. Pursuant to these exceptions, limited partnerships may elect not to comply with certain corporate governance requirements of the New York Stock Exchange, including the requirements (a) that a majority of the board of directors of our general partner consist of independent directors, (b) that we have a nominating/corporate governance committee that is composed entirely of independent directors (c) that we have a compensation committee that is composed entirely of independent directors, and (d) that the compensation committee be required to consider certain independence factors when engaging compensation consultants, legal counsel and other committee advisers. In addition, we are not required to hold annual meetings of our common unitholders. We will continue to avail ourselves of these exceptions. Accordingly, common unitholders generally do not have the same protections afforded to equityholders of entities that are subject to all of the corporate governance requirements of the New York Stock Exchange.
Potential conflicts of interest may arise among our general partner, its affiliates and us. Our general partner and its affiliates have limited fiduciary duties to us and our common unitholders, which may permit them to favor their own interests to the detriment of us and our common unitholders.
Conflicts of interest may arise among our general partner and its affiliates, on the one hand, and us and our common unitholders, on the other hand. As a result of these conflicts, our general partner may favor its own
59
Table of Contents
interests and the interests of its affiliates over the interests of our common unitholders. These conflicts include, among others, the following:
| • | our general partner determines the amount and timing of our investments and dispositions, indebtedness, issuances of additional partnership interests and amounts of reserves, each of which can affect the amount of cash that is available for distribution to our common unitholders, |
| • | our general partner is allowed to take into account the interests of parties other than us in resolving conflicts of interest, which has the effect of limiting its duties (including fiduciary duties) to our common unitholders. For example, our subsidiaries that serve as the general partners of our investment funds have fiduciary and contractual obligations to the investors in those funds, as a result of which we expect to regularly take actions that might adversely affect our near-term results of operations or cash flow, |
| • | because our senior managing directors hold their Blackstone Holdings Partnership Units directly or through entities that are not subject to corporate income taxation and The Blackstone Group L.P. holds Blackstone Holdings Partnership Units through wholly owned subsidiaries, some of which are subject to corporate income taxation, conflicts may arise between our senior managing directors and The Blackstone Group L.P. relating to the selection and structuring of investments, |
| • | other than as set forth in the non-competition and non-solicitation agreements to which our senior managing directors are subject, which may not be enforceable, affiliates of our general partner and existing and former personnel employed by our general partner are not prohibited from engaging in other businesses or activities, including those that might be in direct competition with us, |
| • | our general partner has limited its liability and reduced or eliminated its duties (including fiduciary duties) under the partnership agreement, while also restricting the remedies available to our common unitholders for actions that, without these limitations, might constitute breaches of duty (including fiduciary duty). In addition, we have agreed to indemnify our general partner and its affiliates to the fullest extent permitted by law, except with respect to conduct involving bad faith, fraud or willful misconduct. By purchasing our common units, common unitholders will have agreed and consented to the provisions set forth in our partnership agreement, including the provisions regarding conflicts of interest situations that, in the absence of such provisions, might constitute a breach of fiduciary or other duties under applicable state law, |
| • | our partnership agreement does not restrict our general partner from causing us to pay it or its affiliates for any services rendered, or from entering into additional contractual arrangements with any of these entities on our behalf, so long as the terms of any such additional contractual arrangements are fair and reasonable to us as determined under the partnership agreement, |
| • | our general partner determines how much debt we incur and that decision may adversely affect our credit ratings, |
| • | our general partner determines which costs incurred by it and its affiliates are reimbursable by us, |
| • | our general partner controls the enforcement of obligations owed to us by it and its affiliates, and |
| • | our general partner decides whether to retain separate counsel, accountants or others to perform services for us. |
See “Part III. Item 13. Certain Relationships and Related Transactions, and Director Independence” and “Part III. Item 10. Directors, Executive Officers and Corporate Governance — Partnership Management and Governance — Conflicts Committee.”
60
Table of Contents
Our partnership agreement contains provisions that reduce or eliminate duties (including fiduciary duties) of our general partner and limit remedies available to common unitholders for actions that might otherwise constitute a breach of duty. It will be difficult for a common unitholder to successfully challenge a resolution of a conflict of interest by our general partner or by its conflicts committee.
Our partnership agreement contains provisions that waive or consent to conduct by our general partner and its affiliates that might otherwise raise issues about compliance with fiduciary duties or applicable law. For example, our partnership agreement provides that when our general partner is acting in its individual capacity, as opposed to in its capacity as our general partner, it may act without any fiduciary obligations to us or our common unitholders whatsoever. When our general partner, in its capacity as our general partner, is permitted to or required to make a decision in its “sole discretion” or “discretion” or that it deems “necessary or appropriate” or “necessary or advisable,” then our general partner is entitled to consider only such interests and factors as it desires, including its own interests, and has no duty or obligation (fiduciary or otherwise) to give any consideration to any interest of or factors affecting us or any limited partners and will not be subject to any different standards imposed by the partnership agreement, the Delaware Limited Partnership Act or under any other law, rule or regulation or in equity. These modifications of fiduciary duties are expressly permitted by Delaware law. Hence, we and our common unitholders only have recourse and are able to seek remedies against our general partner if our general partner breaches its obligations pursuant to our partnership agreement. Unless our general partner breaches its obligations pursuant to our partnership agreement, we and our common unitholders do not have any recourse against our general partner even if our general partner were to act in a manner that was inconsistent with traditional fiduciary duties. Furthermore, even if there has been a breach of the obligations set forth in our partnership agreement, our partnership agreement provides that our general partner and its officers and directors are not liable to us or our common unitholders for errors of judgment or for any acts or omissions unless there has been a final and non-appealable judgment by a court of competent jurisdiction determining that the general partner or its officers and directors acted in bad faith or engaged in fraud or willful misconduct. These modifications are detrimental to the common unitholders because they restrict the remedies available to common unitholders for actions that without those limitations might constitute breaches of duty (including fiduciary duty).
Whenever a potential conflict of interest exists between us and our general partner, our general partner may resolve such conflict of interest. If our general partner determines that its resolution of the conflict of interest is on terms no less favorable to us than those generally being provided to or available from unrelated third parties or is fair and reasonable to us, taking into account the totality of the relationships between us and our general partner, then it will be presumed that in making this determination, our general partner acted in good faith. A common unitholder seeking to challenge this resolution of the conflict of interest would bear the burden of overcoming such presumption. This is different from the situation with Delaware corporations, where a conflict resolution by an interested party would be presumed to be unfair and the interested party would have the burden of demonstrating that the resolution was fair.
Also, if our general partner obtains the approval of the conflicts committee of our general partner, the resolution will be conclusively deemed to be fair and reasonable to us and not a breach by our general partner of any duties it may owe to us or our common unitholders. This is different from the situation with Delaware corporations, where a conflict resolution by a committee consisting solely of independent directors may, in certain circumstances, merely shift the burden of demonstrating unfairness to the plaintiff. Common unitholders, in purchasing our common units, are deemed as having consented to the provisions set forth in the partnership agreement, including provisions regarding conflicts of interest situations that, in the absence of such provisions, might be considered a breach of fiduciary or other duties under applicable state law. As a result, common unitholders will, as a practical matter, not be able to successfully challenge an informed decision by the conflicts committee. See “Part III. Item 10. Directors, Executive Officers and Corporate Governance — Partnership Management and Governance — Conflicts Committee.”
61
Table of Contents
The control of our general partner may be transferred to a third party without common unitholder consent.
Our general partner may transfer its general partner interest to a third party in a merger or consolidation without the consent of our common unitholders. Furthermore, at any time, the members of our general partner may sell or transfer all or part of their limited liability company interests in our general partner without the approval of the common unitholders, subject to certain restrictions as described elsewhere in this annual report. A new general partner may not be willing or able to form new investment funds and could form funds that have investment objectives and governing terms that differ materially from those of our current investment funds. A new owner could also have a different investment philosophy, employ investment professionals who are less experienced, be unsuccessful in identifying investment opportunities or have a track record that is not as successful as Blackstone’s track record. If any of the foregoing were to occur, we could experience difficulty in making new investments, and the value of our existing investments, our business, our results of operations and our financial condition could materially suffer.
We intend to pay regular distributions to our common unitholders, but our ability to do so may be limited by cash flow from operations and available liquidity, our holding partnership structure, applicable provisions of Delaware law and contractual restrictions.
Our intention is to distribute quarterly to common unitholders approximately 85% of The Blackstone Group L.P.’s share of Distributable Earnings, subject to adjustment by amounts determined by Blackstone’s general partner to be necessary or appropriate to provide for the conduct of its business, to make appropriate investments in its business and our funds, to comply with applicable law, any of its debt instruments or other agreements, or to provide for future cash requirements such as tax-related payments, clawback obligations and distributions to unitholders for any ensuing quarter. All of the foregoing is subject to the qualification that the declaration and payment of any distributions are at the sole discretion of our general partner, and may change at any time, including, without limitation, to eliminate such distributions entirely.
The Blackstone Group L.P. is a holding partnership and has no material assets other than the ownership of the partnership units in Blackstone Holdings held through wholly owned subsidiaries. The Blackstone Group L.P. has no independent means of generating revenue. Accordingly, we intend to cause Blackstone Holdings to make distributions to its partners, including The Blackstone Group L.P.’s wholly owned subsidiaries, to fund any distributions The Blackstone Group L.P. may declare on the common units.
Our ability to make cash distributions to our unitholders will depend on a number of factors, including among others general economic and business conditions, our strategic plans and prospects, our business and investment opportunities, our financial condition and operating results, including the timing and extent of our realizations, working capital requirements and anticipated cash needs, contractual restrictions and obligations including fulfilling our current and future capital commitments, legal, tax and regulatory restrictions, restrictions and other implications on the payment of distributions by us to our common unitholders or by our subsidiaries to us and such other factors as our general partner may deem relevant.
Under the Delaware Limited Partnership Act, we may not make a distribution to a partner if after the distribution all our liabilities, other than liabilities to partners on account of their partnership interests and liabilities for which the recourse of creditors is limited to specific property of the partnership, would exceed the fair value of our assets. If we were to make such an impermissible distribution, any limited partner who received a distribution and knew at the time of the distribution that the distribution was in violation of the Delaware Limited Partnership Act would be liable to us for the amount of the distribution for three years. In addition, the terms of our revolving credit facility or other financing arrangements may from time to time include covenants or other restrictions that could constrain our ability to make distributions.
62
Table of Contents
The amortization of finite-lived intangible assets and non-cash equity-based compensation results in substantial expenses that may increase the net loss we record in certain periods or cause us to record a net loss in periods during which we would otherwise have recorded net income.
As part of the reorganization related to our IPO we acquired interests in our business from our predecessor owners. This transaction has been accounted for partially as a transfer of interests under common control and partially as an acquisition of non-controlling interests. We accounted for the acquisition of the non-controlling interests using the purchase method of accounting, and reflected the excess of the purchase price over the fair value of the tangible assets acquired and liabilities assumed as goodwill and other intangible assets on our statement of financial condition. As of December 31, 2016, we have $262.6 million of finite-lived intangible assets (in addition to $1.7 billion of goodwill), net of accumulated amortization. These finite-lived intangible assets are from the IPO and other business transactions. We are amortizing these finite-lived intangibles over their estimated useful lives, which range from three to twenty years, using the straight-line method, with a weighted-average remaining amortization period of 6.1 years as of December 31, 2016. The amortization of these finite-lived intangible assets and of this non-cash equity-based compensation will increase our expenses substantially during the relevant periods. These expenses may increase the net loss we record in certain periods or cause us to record a net loss in periods during which we would otherwise have recorded net income.
We are required to pay our senior managing directors for most of the benefits relating to any additional tax depreciation or amortization deductions we may claim as a result of the tax basis step-up we received as part of the reorganization we implemented in connection with our IPO or receive in connection with future exchanges of our common units and related transactions.
As part of the reorganization we implemented in connection with our IPO, we purchased interests in our business from our pre-IPO owners. In addition, holders of partnership units in Blackstone Holdings (other than The Blackstone Group L.P.’s wholly owned subsidiaries), subject to the vesting and minimum retained ownership requirements and transfer restrictions set forth in the partnership agreements of the Blackstone Holdings Partnerships, may up to four times each year (subject to the terms of the exchange agreement) exchange their Blackstone Holdings Partnership Units for The Blackstone Group L.P. common units on a one-for-one basis. A Blackstone Holdings limited partner must exchange one partnership unit in each of the Blackstone Holdings Partnerships to effect an exchange for a common unit. The purchase and subsequent exchanges are expected to result in increases in the tax basis of the tangible and intangible assets of Blackstone Holdings that otherwise would not have been available. These increases in tax basis may increase (for tax purposes) depreciation and amortization and therefore reduce the amount of tax that certain of The Blackstone Group L.P.’s wholly owned subsidiaries that are taxable as corporations for U.S. federal income tax purposes, which we refer to as the “corporate taxpayers,” would otherwise be required to pay in the future, although the IRS may challenge all or part of that tax basis increase, and a court could sustain such a challenge.
One of the corporate taxpayers has entered into a tax receivable agreement with our senior managing directors and other pre-IPO owners that provides for the payment by the corporate taxpayer to the counterparties of 85% of the amount of cash savings, if any, in U.S. federal, state and local income tax or franchise tax that the corporate taxpayers actually realize as a result of these increases in tax basis and of certain other tax benefits related to entering into the tax receivable agreement, including tax benefits attributable to payments under the tax receivable agreement. In addition, additional tax receivable agreements have been executed, and others may continue to be executed, with newly admitted Blackstone senior managing directors and certain others who receive Blackstone Holdings Partnership Units. This payment obligation is an obligation of the corporate taxpayer and not of Blackstone Holdings. As such, the cash distributions to public common unitholders may vary from holders of Blackstone Holdings Partnership Units (held by Blackstone personnel and others) to the extent payments are made under the tax receivable agreements to selling holders of Blackstone Holdings Partnership Units. As the payments reflect actual tax savings received by Blackstone entities, there may be a timing difference between the tax savings received by Blackstone entities and the cash payments to selling holders of Blackstone Holdings Partnership Units. While the actual increase in tax basis, as well as the amount and timing of any payments under this agreement, will
63
Table of Contents
vary depending upon a number of factors, including the timing of exchanges, the price of our common units at the time of the exchange, the extent to which such exchanges are taxable and the amount and timing of our income, we expect that as a result of the size of the increases in the tax basis of the tangible and intangible assets of Blackstone Holdings, the payments that we may make under the tax receivable agreements will be substantial. The payments under a tax receivable agreement are not conditioned upon a tax receivable agreement counterparty’s continued ownership of us. We may need to incur debt to finance payments under the tax receivable agreement to the extent our cash resources are insufficient to meet our obligations under the tax receivable agreements as a result of timing discrepancies or otherwise.
Although we are not aware of any issue that would cause the IRS to challenge a tax basis increase, the tax receivable agreement counterparties will not reimburse us for any payments previously made under the tax receivable agreement. As a result, in certain circumstances payments to the counterparties under the tax receivable agreement could be in excess of the corporate taxpayers’ actual cash tax savings. The corporate taxpayers’ ability to achieve benefits from any tax basis increase, and the payments to be made under the tax receivable agreements, will depend upon a number of factors, as discussed above, including the timing and amount of our future income.
If The Blackstone Group L.P. were deemed an “investment company” under the 1940 Act, applicable restrictions could make it impractical for us to continue our business as contemplated and could have a material adverse effect on our business.
An entity will generally be deemed to be an “investment company” for purposes of the 1940 Act if: (a) it is or holds itself out as being engaged primarily, or proposes to engage primarily, in the business of investing, reinvesting or trading in securities, or (b) absent an applicable exemption, it owns or proposes to acquire investment securities having a value exceeding 40% of the value of its total assets (exclusive of U.S. government securities and cash items) on an unconsolidated basis. We believe that we are engaged primarily in the business of providing asset management and capital markets services and not in the business of investing, reinvesting or trading in securities. We also believe that the primary source of income from each of our businesses is properly characterized as income earned in exchange for the provision of services. We hold ourselves out as an asset management and capital markets firm and do not propose to engage primarily in the business of investing, reinvesting or trading in securities. Accordingly, we do not believe that The Blackstone Group L.P. is an “orthodox” investment company as defined in section 3(a)(1)(A) of the 1940 Act and described in clause (a) in the first sentence of this paragraph. Furthermore, The Blackstone Group L.P. does not have any material assets other than its equity interests in certain wholly owned subsidiaries, which in turn will have no material assets (other than intercompany debt) other than general partner interests in the Blackstone Holdings Partnerships. These wholly owned subsidiaries are the sole general partners of the Blackstone Holdings Partnerships and are vested with all management and control over the Blackstone Holdings Partnerships. We do not believe the equity interests of The Blackstone Group L.P. in its wholly owned subsidiaries or the general partner interests of these wholly owned subsidiaries in the Blackstone Holdings Partnerships are investment securities. Moreover, because we believe that the capital interests of the general partners of our funds in their respective funds are neither securities nor investment securities, we believe that less than 40% of The Blackstone Group L.P.’s total assets (exclusive of U.S. government securities and cash items) on an unconsolidated basis are comprised of assets that could be considered investment securities. Accordingly, we do not believe The Blackstone Group L.P. is an inadvertent investment company by virtue of the 40% test in section 3(a)(1)(C) of the 1940 Act as described in clause (b) in the first sentence of this paragraph. In addition, we believe The Blackstone Group L.P. is not an investment company under section 3(b)(1) of the 1940 Act because it is primarily engaged in a non-investment company business.
The 1940 Act and the rules thereunder contain detailed parameters for the organization and operation of investment companies. Among other things, the 1940 Act and the rules thereunder limit or prohibit transactions with affiliates, impose limitations on the issuance of debt and equity securities, generally prohibit the issuance of options and impose certain governance requirements. We intend to conduct our operations so that The Blackstone Group L.P. will not be deemed to be an investment company under the 1940 Act. If anything were to happen which would cause The Blackstone Group L.P. to be deemed to be an investment company under the 1940 Act, requirements
64
Table of Contents
imposed by the 1940 Act, including limitations on our capital structure, ability to transact business with affiliates (including us) and ability to compensate key employees, could make it impractical for us to continue our business as currently conducted, impair the agreements and arrangements between and among The Blackstone Group L.P., Blackstone Holdings and our senior managing directors, or any combination thereof, and materially adversely affect our business, financial condition and results of operations. In addition, we may be required to limit the amount of investments that we make as a principal or otherwise conduct our business in a manner that does not subject us to the registration and other requirements of the 1940 Act.
Risks Related to Our Common Units
Our common unit price may decline due to the large number of common units eligible for future sale and for exchange.
The market price of our common units could decline as a result of sales of a large number of common units in the market in the future or the perception that such sales could occur. These sales, or the possibility that these sales may occur, also might make it more difficult for us to sell common units in the future at a time and at a price that we deem appropriate. We had a total of 587,607,442 voting common units outstanding as of February 17, 2017. Subject to the lock-up restrictions described below, we may issue and sell in the future additional common units. Limited partners of Blackstone Holdings owned an aggregate of 535,415,895 Blackstone Holdings Partnership Units outstanding as of February 17, 2017. In connection with our initial public offering, we entered into an exchange agreement with holders of Blackstone Holdings Partnership Units (other than The Blackstone Group L.P.’s wholly owned subsidiaries) so that these holders, subject to the vesting and minimum retained ownership requirements and transfer restrictions set forth in the partnership agreements of the Blackstone Holdings Partnerships, may up to four times each year (subject to the terms of the exchange agreement) exchange their Blackstone Holdings Partnership Units for The Blackstone Group L.P. common units on a one-for-one basis, subject to customary conversion rate adjustments for splits, unit distributions and reclassifications. A Blackstone Holdings limited partner must exchange one partnership unit in each of the Blackstone Holdings Partnerships to effect an exchange for a common unit. The common units we issue upon such exchanges would be “restricted securities,” as defined in Rule 144 under the Securities Act, unless we register such issuances. However, we have entered into a registration rights agreement with the limited partners of Blackstone Holdings that requires us to register these common units under the Securities Act and we have filed registration statements that cover the delivery of common units issued upon exchange of Blackstone Holdings Partnership Units. See “Part III. Item 13. Certain Relationships and Related Transactions, and Director Independence — Transactions with Related Persons — Registration Rights Agreement.” While the partnership agreements of the Blackstone Holdings Partnerships and related agreements contractually restrict the ability of Blackstone personnel to transfer the Blackstone Holdings Partnership Units or The Blackstone Group L.P. common units they hold and require that they maintain a minimum amount of equity ownership during their employ by us, these contractual provisions may lapse over time or be waived, modified or amended at any time.
In addition, in June 2007, we entered into an agreement with Beijing Wonderful Investments, an investment vehicle established and controlled by The People’s Republic of China, pursuant to which we sold to it non-voting common units. As of February 17, 2017 Beijing Wonderful Investments owned 54,470,009 non-voting common units. We have agreed to provide Beijing Wonderful Investments with registration rights to effect certain sales.
As of February 17, 2017, we had granted 13,726,487 outstanding deferred restricted common units and 44,046,267 outstanding deferred restricted Blackstone Holdings Partnership Units, which are subject to specified vesting requirements, to our non-senior managing director professionals and senior managing directors under The Blackstone Group L.P. 2007 Equity Incentive Plan (“2007 Equity Incentive Plan”). The aggregate number of common units and Blackstone Holdings Partnership Units covered by our 2007 Equity Incentive Plan is increased on the first day of each fiscal year during its term by a number of units equal to the positive difference, if any, of (a) 15% of the aggregate number of common units and Blackstone Holdings Partnership Units outstanding on the last day of the immediately preceding fiscal year (excluding Blackstone Holdings Partnership Units held by The Blackstone Group L.P. or its wholly owned subsidiaries) minus (b) the aggregate number of common units and
65
Table of Contents
Blackstone Holdings Partnership Units covered by our 2007 Equity Incentive Plan as of such date (unless the administrator of the 2007 Equity Incentive Plan should decide to increase the number of common units and Blackstone Holdings Partnership Units covered by the plan by a lesser amount). An aggregate of 167,984,158 additional common units and Blackstone Holdings Partnership Units were available for grant under our 2007 Equity Incentive Plan as of February 17, 2017. We have filed a registration statement and intend to file additional registration statements on Form S-8 under the Securities Act to register common units covered by our 2007 Equity Incentive Plan (including pursuant to automatic annual increases). Any such Form S-8 registration statement will automatically become effective upon filing. Accordingly, common units registered under such registration statement will be available for sale in the open market.
In addition, our partnership agreement authorizes us to issue an unlimited number of additional partnership securities and options, rights, warrants and appreciation rights relating to partnership securities for the consideration and on the terms and conditions established by our general partner in its sole discretion without the approval of any limited partners. In accordance with the Delaware Limited Partnership Act and the provisions of our partnership agreement, we may also issue additional partnership interests that have certain designations, preferences, rights, powers and duties that are different from, and may be senior to, those applicable to common units. Similarly, the Blackstone Holdings partnership agreements authorize the wholly owned subsidiaries of The Blackstone Group L.P. which are the general partners of those partnerships to issue an unlimited number of additional partnership securities of the Blackstone Holdings Partnerships with such designations, preferences, rights, powers and duties that are different from, and may be senior to, those applicable to the Blackstone Holdings Partnership Units, and which may be exchangeable for our common units.
The market price of our common units may be volatile, which could cause the value of your investment to decline.
Securities markets worldwide experience significant price and volume fluctuations. This market volatility, as well as general economic, market or political conditions, could reduce the market price of common units in spite of our operating performance. In addition, our operating results could be below the expectations of public market analysts and investors, and in response the market price of our common units could decrease significantly. You may be unable to resell your common units at or above the price you paid for them.
Risks Related to United States Taxation
Our structure involves complex provisions of U.S. federal income tax law for which no clear precedent or authority may be available. Our structure also is subject to potential legislative, judicial or administrative change and differing interpretations, possibly on a retroactive basis.
The U.S. federal income tax treatment of common unitholders depends in some instances on determinations of fact and interpretations of complex provisions of U.S. federal income tax law for which no clear precedent or authority may be available. The U.S. federal income tax rules are constantly under review by persons involved in the legislative process, the U.S. Internal Revenue Service, or “IRS,” and the U.S. Treasury Department, frequently resulting in revised interpretations of established concepts, statutory changes, revisions to regulations and other modifications and interpretations. The IRS pays close attention to the proper application of tax laws to partnerships. The present U.S. federal income tax treatment of an investment in our common units may be modified by administrative, legislative or judicial interpretation at any time, and any such action may affect investments and commitments previously made. Changes to the U.S. federal income tax laws and interpretations thereof could make it more difficult or impossible to meet the exception for us to be treated as a partnership for U.S. federal income tax purposes that is not taxable as a corporation (referred to as the “Qualifying Income Exception”), affect or cause us to change our investments and commitments, affect the tax considerations of an investment in us, change the character or treatment of portions of our income (including, for instance, the treatment of carried interest as ordinary income rather than capital gain) and adversely affect an investment in our common units. For example, as discussed above under “— In past years, the U.S. Congress has considered legislation that, if enacted, would have (a) for
66
Table of Contents
taxable years beginning ten years after the date of enactment, precluded us from qualifying as a partnership for U.S. federal income tax purposes or required us to hold carried interest through taxable subsidiary corporations and (b) taxed individual holders of common units with respect to certain income and gains at increased rates. If any similar legislation were to be enacted and apply to us, we could incur a material increase in our tax liability and a substantial portion of our income could be taxed at a higher rate to the individual holders of our common units,” the U.S. Congress has considered various legislative proposals to treat all or part of the capital gain and dividend income that is recognized by an investment partnership and allocable to a partner affiliated with the sponsor of the partnership (i.e., a portion of the carried interest) as ordinary income to such partner for U.S. federal income tax purposes. During his presidential campaign, President Trump expressed support for legislation ending treatment of carried interest as capital gain.
Our organizational documents and governing agreements permit our general partner to modify our amended and restated limited partnership agreement from time to time, without the consent of the common unitholders, to address certain changes in U.S. federal income tax regulations, legislation or interpretation. In some circumstances, such revisions could have a material adverse impact on some or all common unitholders. Moreover, we will apply certain assumptions and conventions in an attempt to comply with applicable rules and to report income, gain, deduction, loss and credit to common unitholders in a manner that reflects such common unitholders’ beneficial ownership of partnership items, taking into account variation in unitholder ownership interests during each taxable year because of trading activity. More specifically, our allocations of items of taxable income and loss between transferors and transferees of our units will be determined annually, will be prorated on a monthly basis and will be subsequently apportioned among the unitholders in proportion to the number of units owned by each of them determined as of the opening of trading of our units on the New York Stock Exchange on the first business day of every month. As a result, a unitholder transferring units may be allocated income, gain, loss and deductions realized after the date of transfer. However, those assumptions and conventions may not be in compliance with all aspects of applicable tax requirements. The IRS could potentially assert successfully that the conventions and assumptions used by us do not satisfy the technical requirements of the Internal Revenue Code and/or Treasury regulations and could require that items of income, gain, deductions, loss or credit, including interest deductions, be adjusted, reallocated or disallowed in a manner that adversely affects common unitholders.
If we were treated as a corporation for U.S. federal income tax or state tax purposes, then our distributions to our common unitholders would be substantially reduced and the value of our common units would be adversely affected.
The amount of distributions to our common unitholders and the value of our common units depend in part on our being treated as a partnership for U.S. federal income tax purposes, which requires that 90% or more of our gross income for every taxable year consist of qualifying income, as defined in Section 7704 of the Internal Revenue Code and that The Blackstone Group L.P. not be registered under the 1940 Act. Qualifying income generally includes dividends, interest, capital gains from the sale or other disposition of stocks and securities and certain other forms of investment income. We may not meet these requirements or current law may change so as to cause, in either event, us to be treated as a corporation for U.S. federal income tax purposes or otherwise subject to U.S. federal income tax. We have not requested, and do not plan to request, a ruling from the IRS on this or any other matter affecting us. Moreover, our general partner may elect to take actions that result in our being treated as an entity taxable as a corporation for U.S. federal (and applicable state) income tax purposes without the approval of our common unitholders.
If we were treated as a corporation for U.S. federal income tax purposes, we would pay U.S. federal income tax on our taxable income at the corporate tax rate. Distributions to our common unitholders would generally be taxed again as corporate distributions, and no income, gains, losses, deductions or credits would flow through to you. Because a tax would be imposed upon us as a corporation, our distributions to our common unitholders would be substantially reduced, likely causing a substantial reduction in the value of our common units.
Current law may change, causing us to be treated as a corporation for U.S. federal or state income tax purposes or otherwise subjecting us to entity level taxation. See “— In past years, the U.S. Congress has considered
67
Table of Contents
legislation that, if enacted, would have (a) for taxable years beginning ten years after the date of enactment, precluded us from qualifying as a partnership for U.S. federal income tax purposes or required us to hold carried interest through taxable subsidiary corporations and (b) taxed individual holders of common units with respect to certain income and gains at increased rates. If any similar legislation were to be enacted and apply to us, we could incur a material increase in our tax liability and a substantial portion of our income could be taxed at a higher rate to the individual holders of our common units.” For example, because of widespread state budget deficits, several states have evaluated ways to subject partnerships to entity level taxation through the imposition of state income, franchise or other forms of taxation. If any state were to impose a tax upon us as an entity, our distributions to our common unitholders would be reduced.
Our common unitholders may be subject to U.S. federal income tax on their share of our taxable income, regardless of whether they receive any cash distributions from us.
As long as 90% of our gross income for each taxable year constitutes qualifying income as defined in Section 7704 of the Internal Revenue Code and we are not required to register as an investment company under the 1940 Act on a continuing basis, we will be treated, for U.S. federal income tax purposes, as a partnership and not as an association or a publicly traded partnership taxable as a corporation. Accordingly, each unitholder will be required to take into account its allocable share of items of income, gain, loss and deduction of the Partnership. Distributions to a unitholder will generally be taxable to the unitholder for U.S. federal income tax purposes only to the extent the amount distributed exceeds the unitholder’s tax basis in the unit. That treatment contrasts with the treatment of a shareholder in a corporation. For example, a shareholder in a corporation who receives a distribution of earnings from the corporation will generally report the distribution as dividend income for U.S. federal income tax purposes. In contrast, a holder of our units who receives a distribution of earnings from us will not report the distribution as dividend income (and will treat the distribution as taxable only to the extent the amount distributed exceeds the unitholder’s tax basis in the units), but will instead report the holder’s allocable share of items of our income for U.S. federal income tax purposes. As a result, our common unitholders may be subject to U.S. federal, state, local and possibly, in some cases, foreign income taxation on their allocable share of our items of income, gain, loss, deduction and credit (including our allocable share of those items of any entity in which we invest that is treated as a partnership or is otherwise subject to tax on a flow through basis) for each of our taxable years ending with or within your taxable year, regardless of whether or not a common unitholder receives cash distributions from us.
Our common unitholders may not receive cash distributions equal to their allocable share of our net taxable income or even the tax liability that results from that income. In addition, certain of our holdings, including holdings, if any, in a Controlled Foreign Corporation, or “CFC,” and a Passive Foreign Investment Company, or “PFIC,” may produce taxable income prior to the receipt of cash relating to such income, and common unitholders that are U.S. taxpayers will be required to take such income into account in determining their taxable income. In the event of an inadvertent termination of our partnership status for which the IRS has granted us limited relief, each holder of our common units may be obligated to make such adjustments as the IRS may require to maintain our status as a partnership. Such adjustments may require persons holding our common units to recognize additional amounts in income during the years in which they hold such units.
The Blackstone Group L.P.’s interest in certain of our businesses are held through Blackstone Holdings I/II GP Inc. or Blackstone Holdings IV GP L.P., which are treated as corporations for U.S. federal income tax purposes; such corporations may be liable for significant taxes and may create other adverse tax consequences, which could potentially adversely affect the value of your investment.
In light of the publicly traded partnership rules under U.S. federal income tax law and other requirements, The Blackstone Group L.P. holds its interest in certain of our businesses through Blackstone Holdings I/II GP Inc. or Blackstone Holdings IV GP L.P., which are treated as corporations for U.S. federal income tax purposes. Each such corporation could be liable for significant U.S. federal income taxes and applicable state, local and other taxes that would not otherwise be incurred, which could adversely affect the value of our common units.
68
Table of Contents
Complying with certain tax-related requirements may cause us to invest through foreign or domestic corporations subject to corporate income tax or enter into acquisitions, borrowings, financings or arrangements we may not have otherwise entered into.
In order for us to be treated as a partnership for U.S. federal income tax purposes and not as an association or publicly traded partnership taxable as a corporation, we must meet the Qualifying Income Exception discussed above on a continuing basis and we must not be required to register as an investment company under the 1940 Act. In order to effect such treatment, we (or our subsidiaries) may be required to invest through foreign or domestic corporations subject to corporate income tax, or enter into acquisitions, borrowings, financings or other transactions we may not have otherwise entered into. This may adversely affect our ability to operate solely to maximize our cash flow.
Tax gain or loss on disposition of our common units could be more or less than expected.
If a holder of our common units sells the common units it holds, it will recognize a gain or loss equal to the difference between the amount realized and the adjusted tax basis in those common units. Prior distributions to such common unitholder in excess of the total net taxable income allocated to such common unitholder, which decreased the tax basis in its common units, will in effect become taxable income to such common unitholder if the common units are sold at a price greater than such common unitholder’s tax basis in those common units, even if the price is less than the original cost. A portion of the amount realized, whether or not representing gain, may be ordinary income to such common unitholder.
If we were not to make, or cause to be made, an otherwise available election under Section 754 of the Internal Revenue Code to adjust our asset basis or the asset basis of certain of the Blackstone Holdings Partnerships, a holder of common units could be allocated more taxable income in respect of those common units prior to disposition than if such an election were made.
We currently do not intend to make, or cause to be made, an election to adjust asset basis under Section 754 of the Internal Revenue Code with respect to us, Blackstone Holdings III L.P. or Blackstone Holdings IV L.P. As a result, there will generally be no adjustment to the basis of the assets of Blackstone Holdings III L.P. or Blackstone Holdings IV L.P. upon our acquisition of interests in Blackstone Holdings III L.P. or Blackstone Holdings IV L.P. in connection with our initial public offering, or to our assets or to the assets of Blackstone Holdings III L.P. or Blackstone Holdings IV L.P. upon a subsequent transferee’s acquisition of common units from a prior holder of such common units, even if the purchase price for those interests or units, as applicable, is greater than the share of the aggregate tax basis of our assets or the assets of Blackstone Holdings III L.P. or Blackstone Holdings IV L.P. attributable to those interests or units immediately prior to the acquisition. Consequently, upon a sale of an asset by us, Blackstone Holdings III L.P. or Blackstone Holdings IV L.P., gain allocable to a holder of common units could include built-in gain in the asset existing at the time we acquired those interests, or such holder acquired such units, which built-in gain would otherwise generally be eliminated if a Section 754 election had been made.
Non-U.S. persons face unique U.S. tax issues from owning common units that may result in adverse tax consequences to them.
In light of our investment activities, we will be treated as engaged in a U.S. trade or business for U.S. federal income tax purposes, which may cause some portion of our income to be treated as effectively connected income with respect to non-U.S. holders, or “ECI.” Moreover, dividends paid by an investment that we make in a REIT that are attributable to gains from the sale of U.S. real property interests and sales of certain investments in interests in U.S. real property, including stock of certain U.S. corporations owning significant U.S. real property, may be treated as ECI with respect to certain non-U.S. holders. In addition, certain income of non-U.S. holders from U.S. sources not connected to any such U.S. trade or business conducted by us could be treated as ECI. To the extent our income is treated as ECI, non-U.S. holders generally would be subject to withholding tax on their allocable shares of such income, would be required to file a U.S. federal income tax return for such year reporting their allocable shares of
69
Table of Contents
income effectively connected with such trade or business and any other income treated as ECI, and would be subject to U.S. federal income tax at regular U.S. tax rates on any such income (state and local income taxes and filings may also apply in that event). Non-U.S. holders that are corporations may also be subject to a 30% branch profits tax on their allocable share of such income. In addition, certain income from U.S. sources that is not ECI allocable to non-U.S. holders may be reduced by withholding taxes imposed at the highest effective applicable tax rate. A portion of any gain recognized by a non-U.S. holder on the sale or exchange of common units could also be treated as ECI.
Tax-exempt entities face unique tax issues from owning common units that may result in adverse tax consequences to them.
In light of our investment activities, we will be treated as deriving income that constitutes “unrelated business taxable income,” or “UBTI.” Consequently, a holder of common units that is a tax-exempt organization may be subject to “unrelated business income tax” to the extent that its allocable share of our income consists of UBTI. A tax-exempt partner of a partnership could be treated as earning UBTI if the partnership regularly engages in a trade or business that is unrelated to the exempt function of the tax-exempt partner, if the partnership derives income from debt-financed property or if the partnership interest itself is debt-financed.
We cannot match transferors and transferees of common units, and we have therefore adopted certain income tax accounting positions that may not conform with all aspects of applicable tax requirements. The IRS may challenge this treatment, which could adversely affect the value of our common units.
Because we cannot match transferors and transferees of common units, we have adopted depreciation, amortization and other tax accounting positions that may not conform with all aspects of existing Treasury regulations. A successful IRS challenge to those positions could adversely affect the amount of tax benefits available to our common unitholders. It also could affect the timing of these tax benefits or the amount of gain on the sale of common units and could have a negative impact on the value of our common units or result in audits of and adjustments to our common unitholders’ tax returns.
The sale or exchange of 50% or more of our capital and profit interests will result in the termination of our partnership for U.S. federal income tax purposes. We will be considered to have been terminated for U.S. federal income tax purposes if there is a sale or exchange of 50% or more of the total interests in our capital and profits within a 12-month period. Our termination would, among other things, result in the closing of our taxable year for all common unitholders and could result in a deferral of depreciation deductions allowable in computing our taxable income.
Common unitholders will be subject to state and local taxes and return filing requirements as a result of investing in our common units.
In addition to U.S. federal income taxes, our common unitholders are subject to other taxes, including state and local taxes, unincorporated business taxes and estate, inheritance or intangible taxes that are imposed by the various jurisdictions in which we do business or own property now or in the future, even if our common unitholders do not reside in any of those jurisdictions. Our common unitholders are likely to be required to file state and local income tax returns and pay state and local income taxes in some or all of these jurisdictions. Further, common unitholders may be subject to penalties for failure to comply with those requirements. The filing all U.S. federal, state and local tax returns that may be required of a common unitholder is the responsibility of such common unitholder. Our counsel has not rendered an opinion on the state or local tax consequences of an investment in our common units.
70
Table of Contents
While we anticipate that we will be able to provide to each unitholder specific tax information within 90 days after the close of each calendar year, we cannot guarantee this will be the case. To the extent we are unable to furnish the information within 90 days, holders of common units who are U.S. taxpayers may need to file a request for an extension of the due date of their income return. In addition, common unitholders may be required to file amended income tax returns.
It may require longer than 90 days after the end of our fiscal year to obtain the requisite information from all lower-tier entities so that K-1s may be prepared for the Partnership. For this reason, holders of common units who are U.S. taxpayers should anticipate the need to file annually with the IRS (and certain states) a request for an extension past April 15 or the otherwise applicable due date of their income tax return for the taxable year. In addition, common unitholder may be required to file amended income tax returns as a result of adjustments to items on the corresponding income tax returns of the partnership. Any obligation for a unitholder to file amended income tax returns for that or any other reason, including any costs incurred in the preparation or filing of such returns, is the responsibility of each common unitholder.
Certain U.S. holders of common units are subject to additional tax on “net investment income.”
U.S. holders that are individuals, estates or trusts are currently subject to a Medicare tax of 3.8% on “net investment income” (or undistributed “net investment income,” in the case of estates and trusts) for each taxable year, with such tax applying to the lesser of such income or the excess of such person’s adjusted gross income (with certain adjustments) over a specified amount (although both Congress and President Trump have recently set forth proposals to repeal this Medicare tax). Net investment income includes net income from interest, dividends, annuities, royalties and rents and net gain attributable to the disposition of investment property. Net income and gain attributable to an investment in the Partnership will be included in a U.S. holder’s “net investment income” subject to this Medicare tax.
We may be liable for adjustments to our tax returns as a result of partnership audit legislation.
Legislation enacted in 2015 significantly changed the rules for U.S. federal income tax audits of partnerships. Such audits will continue to be conducted at the partnership level, but with respect to tax returns for taxable years beginning after December 31, 2017, and, unless a partnership qualifies for and affirmatively elects an alternative procedure, any adjustments to the amount of tax due (including interest and penalties) will be payable by the partnership. Under the elective alternative procedure, a partnership would issue information returns to persons who were partners in the audited year, who would then be required to take the adjustments into account in calculating their own tax liability, and the partnership would not be liable for the adjustments. If a partnership elects the alternative procedure for a given adjustment, the amount of taxes for which its partners would be liable would be increased by any applicable penalties and a special interest charge. There can be no assurance that we will be eligible to make such an election or that we will, in fact, make such an election for any given adjustment. If we do not or are not able to make such an election, then (a) our then-current common unitholders, in the aggregate, could indirectly bear income tax liabilities in excess of the aggregate amount of taxes that would have been due had we elected the alternative procedure, and (b) a given common unitholder may indirectly bear taxes attributable to income allocable to other common unitholders or former common unitholders, including taxes (as well as interest and penalties) with respect to periods prior to such holder’s ownership of common units. Amounts available for distribution to our common unitholders may be reduced as a result of our obligation to pay any taxes associated with an adjustment. Many issues and the overall effect of this legislation on us are uncertain, and common unitholders should consult their own tax advisors regarding all aspects of this legislation as it affects their particular circumstances.
| ITEM 1B. | UNRESOLVED STAFF COMMENTS |
None.
71
Table of Contents
| ITEM 2. | PROPERTIES |
Our principal executive offices are located in leased office space at 345 Park Avenue, New York, New York. As of December 31, 2016, we also leased offices in Dublin, Hong Kong, London, Mumbai, Singapore, Tokyo and 23 other cities around the world. We do not own any real property. We consider these facilities to be suitable and adequate for the management and operations of our business.
| ITEM 3. | LEGAL PROCEEDINGS |
We may from time to time be involved in litigation and claims incidental to the conduct of our business. Our businesses are also subject to extensive regulation, which may result in regulatory proceedings against us. See “Item 1A. Risk Factors” above. We are not currently subject to any pending judicial, administrative or arbitration proceedings that we expect to have a material impact on our consolidated financial statements. However, given the inherent unpredictability of these types of proceedings and the potentially large and/or indeterminate amounts that could be sought, an adverse outcome in certain matters could have a material effect on Blackstone’s financial results in any particular period.
| ITEM 4. | MINE SAFETY DISCLOSURES |
Not applicable.
72
Table of Contents
PART II.
| ITEM 5. | MARKET FOR REGISTRANT’S COMMON EQUITY, RELATED STOCKHOLDER MATTERS AND ISSUER PURCHASES OF EQUITY SECURITIES |
Our common units representing limited partner interests are traded on the New York Stock Exchange (“NYSE”) under the symbol “BX.” Our common units began trading on the NYSE on June 22, 2007.
The number of holders of record of our common units as of February 17, 2017 was 76. This does not include the number of unitholders that hold common units in “street name” through banks or broker-dealers.
The following table sets forth the high and low intra-day sales prices per common unit, as reported by the NYSE, and the per unit common unitholder and Blackstone Holdings Partnership unitholder distributions for the periods indicated:
| 2016 | 2015 | |||||||||||||||||||||||||||||||
| Distributions (a) | Distributions (a) | |||||||||||||||||||||||||||||||
| High | Low | Common Unitholder |
Blackstone Holdings Partnership Unitholder (b) |
High | Low | Common Unitholder |
Blackstone Holdings Partnership Unitholder (b) |
|||||||||||||||||||||||||
| First Quarter |
$ | 29.34 | $ | 22.31 | $ | 0.28 | $ | 0.28 | $ | 39.62 | $ | 32.36 | $ | 0.89 | $ | 0.90 | ||||||||||||||||
| Second Quarter |
$ | 29.60 | $ | 23.26 | 0.36 | 0.37 | $ | 44.43 | $ | 38.31 | 0.74 | 0.74 | ||||||||||||||||||||
| Third Quarter |
$ | 28.51 | $ | 22.45 | 0.41 | 0.45 | $ | 42.60 | $ | 28.56 | 0.49 | 0.49 | ||||||||||||||||||||
| Fourth Quarter |
$ | 30.25 | $ | 23.33 | 0.47 | 0.53 | $ | 35.24 | $ | 26.82 | 0.61 | 0.65 | ||||||||||||||||||||
|
|
|
|
|
|
|
|
|
|||||||||||||||||||||||||
| $ | 1.52 | $ | 1.63 | $ | 2.73 | $ | 2.78 | |||||||||||||||||||||||||
|
|
|
|
|
|
|
|
|
|||||||||||||||||||||||||
| (a) | Per unitholder distributions earned in each respective quarter. Each quarter’s distributions are declared and paid in the following quarter. |
| (b) | Represents the per unit amounts paid to Blackstone personnel and others who are limited partners of the Blackstone Holdings Partnerships. |
Cash Distribution Policy
Distributable Earnings, which is a component of Economic Net Income, is the sum across all segments of: (a) Total Management and Advisory Fees, (b) Interest and Dividend Revenue, (c) Other Revenue, (d) Realized Performance Fees, and (e) Realized Investment Income (Loss); less (a) Compensation, excluding the expense of equity-based awards, (b) Realized Performance Fee Compensation, (c) Other Operating Expenses, and (d) Taxes and Payables Under the Tax Receivable Agreement.
Our intention is to distribute quarterly to common unitholders approximately 85% of The Blackstone Group L.P.’s share of Distributable Earnings, subject to adjustment by amounts determined by Blackstone’s general partner to be necessary or appropriate to provide for the conduct of its business, to make appropriate investments in its business and funds, to comply with applicable law, any of its debt instruments or other agreements, or to provide for future cash requirements such as tax-related payments, clawback obligations and distributions to unitholders for any ensuing quarter. The amount distributed could also be adjusted upward in any one quarter.
All of the foregoing is subject to the qualification that the declaration and payment of any distributions are at the sole discretion of our general partner, and our general partner may change our distribution policy at any time, including, without limitation, to eliminate such distributions entirely.
73
Table of Contents
Because The Blackstone Group L.P. is a holding partnership and has no material assets other than its ownership of partnership units in Blackstone Holdings held through wholly owned subsidiaries, we fund distributions by The Blackstone Group L.P., if any, in three steps:
| • | First, we cause Blackstone Holdings to make distributions to its partners, including The Blackstone Group L.P.’s wholly owned subsidiaries. If Blackstone Holdings makes such distributions, the limited partners of Blackstone Holdings will be entitled to receive equivalent distributions pro rata based on their partnership interests in Blackstone Holdings (except as set forth in the following paragraph), |
| • | Second, we cause The Blackstone Group L.P.’s wholly owned subsidiaries to distribute to The Blackstone Group L.P. their share of such distributions, net of the taxes and amounts payable under the tax receivable agreements by such wholly owned subsidiaries, and |
| • | Third, The Blackstone Group L.P. distributes its net share of such distributions to our common unitholders on a pro rata basis. |
Because the wholly owned subsidiaries of The Blackstone Group L.P. must pay taxes and make payments under the tax receivable agreements described in Note 17. “Related Party Transactions” in the “Notes to Consolidated Financial Statements” in “— Item 8. Financial Statements and Supplementary Data,” the amounts ultimately distributed by The Blackstone Group L.P. to its common unitholders are generally expected to be less, on a per unit basis, than the amounts distributed by the Blackstone Holdings Partnerships to the Blackstone personnel and others who are limited partners of the Blackstone Holdings Partnerships in respect of their Blackstone Holdings Partnership Units.
In addition, the partnership agreements of the Blackstone Holdings Partnerships provide for cash distributions, which we refer to as “tax distributions,” to the partners of such partnerships if the wholly owned subsidiaries of The Blackstone Group L.P. which are the general partners of the Blackstone Holdings Partnerships determine that the taxable income of the relevant partnership will give rise to taxable income for its partners. Generally, these tax distributions will be computed based on our estimate of the net taxable income of the relevant partnership allocable to a partner multiplied by an assumed tax rate equal to the highest effective marginal combined U.S. federal, state and local income tax rate prescribed for an individual or corporate resident in New York, New York (taking into account the nondeductibility of certain expenses and the character of our income). The Blackstone Holdings Partnerships will make tax distributions only to the extent distributions from such partnerships for the relevant year were otherwise insufficient to cover such estimated assumed tax liabilities.
Under the Delaware Limited Partnership Act, we may not make a distribution to a partner if after the distribution all our liabilities, other than liabilities to partners on account of their partnership interests and liabilities for which the recourse of creditors is limited to specific property of the partnership, would exceed the fair value of our assets. If we were to make such an impermissible distribution, any limited partner who received a distribution and knew at the time of the distribution that the distribution was in violation of the Delaware Limited Partnership Act would be liable to us for the amount of the distribution for three years. In addition, the terms of our revolving credit facility or other financing arrangements may from time to time include covenants or other restrictions that could constrain our ability to make distributions.
Unit Repurchases in the Fourth Quarter of 2016
In January 2008, the Board of Directors of our general partner, Blackstone Group Management L.L.C., authorized the repurchase of up to $500 million of Blackstone common units and Blackstone Holdings Partnership Units. Under this unit repurchase program, units may be repurchased from time to time in open market transactions, in privately negotiated transactions or otherwise. The timing and the actual number of Blackstone common units and Blackstone Holdings Partnership Units repurchased will depend on a variety of factors, including legal requirements, price and economic and market conditions. The unit repurchase program may be suspended or discontinued at any time and does not have a specified expiration date. During the three months ended
74
Table of Contents
December 31, 2016, no units were repurchased. As of December 31, 2016, the amount remaining under this program available for repurchases was $335.8 million. See “Item 8. Financial Statements and Supplementary Data — Notes to Consolidated Financial Statements — Note 15. Net Income Per Common Unit” and “— Item 7. Management’s Discussion and Analysis of Financial Condition and Results of Operations — Liquidity and Capital Resources — Sources and Uses of Liquidity” for further information regarding this unit repurchase program.
As permitted by our policies and procedures governing transactions in our securities by our directors, executive officers and other employees, from time to time some of these persons may establish plans or arrangements complying with Rule 10b5-1 under the Exchange Act, and similar plans and arrangements relating to our common units and Blackstone Holdings Partnership Units.
75
Table of Contents
| ITEM 6. | SELECTED FINANCIAL DATA |
The consolidated statements of financial condition and income data as of and for each of the five years ended December 31, 2016 have been derived from our consolidated financial statements. The audited Consolidated Statements of Financial Condition as of December 31, 2016 and 2015 and the Consolidated Statements of Operations for the years ended December 31, 2016, 2015 and 2014 are included elsewhere in this Form 10-K. The audited Consolidated Statements of Financial Condition as of December 31, 2014, 2013 and 2012 and the Consolidated Statements of Operations for the years ended December 31, 2013 and 2012 are not included in this Form 10-K. Historical results are not necessarily indicative of results for any future period.
The selected consolidated financial data should be read in conjunction with “— Item 7. Management’s Discussion and Analysis of Financial Condition and Results of Operations” and our consolidated financial statements and related notes included elsewhere in this Form 10-K:
| Year Ended December 31, | ||||||||||||||||||||
| 2016 | 2015 | 2014 | 2013 | 2012 | ||||||||||||||||
| (Dollars in Thousands) | ||||||||||||||||||||
| Revenues |
||||||||||||||||||||
| Management and Advisory Fees, Net |
$ | 2,442,975 | $ | 2,542,505 | $ | 2,497,252 | $ | 2,193,985 | $ | 2,030,693 | ||||||||||
| Performance Fees |
2,176,331 | 1,796,666 | 4,374,262 | 3,544,057 | 1,593,052 | |||||||||||||||
| Investment Income |
356,051 | 204,642 | 534,000 | 800,308 | 350,194 | |||||||||||||||
| Interest and Dividend Revenue and Other |
150,477 | 102,739 | 79,214 | 74,818 | 45,502 | |||||||||||||||
|
|
|
|
|
|
|
|
|
|
|
|||||||||||
| Total Revenues |
5,125,834 | 4,646,552 | 7,484,728 | 6,613,168 | 4,019,441 | |||||||||||||||
|
|
|
|
|
|
|
|
|
|
|
|||||||||||
| Expenses |
||||||||||||||||||||
| Compensation and Benefits |
2,203,430 | 2,290,751 | 3,154,371 | 3,257,667 | 2,605,244 | |||||||||||||||
| General, Administrative and Other |
520,309 | 576,103 | 549,463 | 474,442 | 548,738 | |||||||||||||||
| Interest Expense |
152,654 | 144,522 | 121,524 | 107,973 | 72,870 | |||||||||||||||
| Fund Expenses |
52,181 | 79,499 | 30,498 | 26,658 | 33,829 | |||||||||||||||
|
|
|
|
|
|
|
|
|
|
|
|||||||||||
| Total Expenses |
2,928,574 | 3,090,875 | 3,855,856 | 3,866,740 | 3,260,681 | |||||||||||||||
|
|
|
|
|
|
|
|
|
|
|
|||||||||||
| Other Income |
||||||||||||||||||||
| Reversal of Tax Receivable Agreement Liability |
— | 82,707 | — | 20,469 | — | |||||||||||||||
| Net Gains from Fund Investment Activities |
184,750 | 176,364 | 357,854 | 381,664 | 256,145 | |||||||||||||||
|
|
|
|
|
|
|
|
|
|
|
|||||||||||
| Total Other Income |
184,750 | 259,071 | 357,854 | 402,133 | 256,145 | |||||||||||||||
|
|
|
|
|
|
|
|
|
|
|
|||||||||||
| Income Before Provision for Taxes |
2,382,010 | 1,814,748 | 3,986,726 | 3,148,561 | 1,014,905 | |||||||||||||||
| Provision for Taxes |
132,362 | 190,398 | 291,173 | 255,642 | 185,023 | |||||||||||||||
|
|
|
|
|
|
|
|
|
|
|
|||||||||||
| Net Income |
2,249,648 | 1,624,350 | 3,695,553 | 2,892,919 | 829,882 | |||||||||||||||
| Net Income Attributable to Redeemable Non-Controlling Interests in Consolidated Entities |
3,977 | 11,145 | 74,794 | 183,315 | 103,598 | |||||||||||||||
| Net Income Attributable to Non-Controlling Interests in Consolidated Entities |
246,152 | 219,900 | 335,070 | 198,557 | 99,959 | |||||||||||||||
| Net Income Attributable to Non-Controlling Interests in Blackstone Holdings |
960,284 | 683,516 | 1,701,100 | 1,339,845 | 407,727 | |||||||||||||||
|
|
|
|
|
|
|
|
|
|
|
|||||||||||
| Net Income Attributable to The Blackstone Group L.P. |
$ | 1,039,235 | $ | 709,789 | $ | 1,584,589 | $ | 1,171,202 | $ | 218,598 | ||||||||||
|
|
|
|
|
|
|
|
|
|
|
|||||||||||
| Year Ended December 31, | ||||||||||||||||||||
| 2016 | 2015 | 2014 | 2013 | 2012 | ||||||||||||||||
| Net Income Per Common Unit, Basic and Diluted |
||||||||||||||||||||
| Common Units, Basic |
$ | 1.60 | $ | 1.12 | $ | 2.60 | $ | 2.00 | $ | 0.41 | ||||||||||
|
|
|
|
|
|
|
|
|
|
|
|||||||||||
| Common Units, Diluted |
$ | 1.56 | $ | 1.04 | $ | 2.58 | $ | 1.98 | $ | 0.41 | ||||||||||
|
|
|
|
|
|
|
|
|
|
|
|||||||||||
| Distributions Declared Per Common Unit (a) |
$ | 1.66 | $ | 2.90 | $ | 1.92 | $ | 1.18 | $ | 0.52 | ||||||||||
|
|
|
|
|
|
|
|
|
|
|
|||||||||||
76
Table of Contents
| (a) | Distributions declared reflects the calendar date of declaration for each distribution. The fourth quarter distribution, if any, for any fiscal year will be declared and paid in the subsequent fiscal year. |
| December 31, | ||||||||||||||||||||
| 2016 | 2015 | 2014 | 2013 | 2012 | ||||||||||||||||
| (Dollars in Thousands) | ||||||||||||||||||||
| Statement of Financial Condition Data |
||||||||||||||||||||
| Total Assets (a) |
$ | 26,403,337 | $ | 22,526,080 | $ | 31,497,097 | $ | 29,668,959 | $ | 28,921,060 | ||||||||||
| Senior Notes |
$ | 3,399,922 | $ | 2,797,060 | $ | 2,136,706 | $ | 1,654,659 | $ | 1,660,361 | ||||||||||
| Total Liabilities (a) |
$ | 13,888,404 | $ | 10,295,623 | $ | 14,163,550 | $ | 15,291,288 | $ | 17,706,113 | ||||||||||
| Redeemable Non-Controlling Interests in Consolidated Entities |
$ | 185,390 | $ | 183,459 | $ | 2,441,854 | $ | 1,950,442 | $ | 1,556,185 | ||||||||||
| Total Partners’ Capital |
$ | 12,329,543 | $ | 12,046,998 | $ | 14,891,693 | $ | 12,427,229 | $ | 9,658,762 | ||||||||||
| (a) | The decrease in total assets, total liabilities and redeemable non-controlling interests in consolidated entities from December 31, 2014 to December 31, 2015 was principally due to the adoption as of January 1, 2015 of new accounting consolidation guidance which resulted in the deconsolidation of certain Blackstone Funds. |
77
Table of Contents
| ITEM 7. | MANAGEMENT’S DISCUSSION AND ANALYSIS OF FINANCIAL CONDITION AND RESULTS OF OPERATIONS |
The following discussion and analysis should be read in conjunction with The Blackstone Group L.P.’s consolidated financial statements and the related notes included within this Annual Report on Form 10-K.
Our Business
Blackstone is one of the largest independent managers of private capital in the world. Our business is organized into four segments:
| • | Private Equity. We are a world leader in private equity investing, having managed seven general private equity funds, as well as three sector focused funds, since we established this business in 1987. Our Private Equity segment includes our corporate private equity business, which consists of our flagship corporate private equity funds, Blackstone Capital Partners (“BCP”) funds, our sector-focused corporate private equity funds, including our energy-focused funds, Blackstone Energy Partners (“BEP”) funds and our core private equity fund, Blackstone Core Equity Partners (“BCEP”). In addition, our Private Equity segment includes our opportunistic investment platform that invests globally across asset classes, industries and geographies, Blackstone Tactical Opportunities (“Tactical Opportunities”), our secondary private equity fund of funds business, Strategic Partners Fund Solutions (“Strategic Partners”), a multi-asset investment program for eligible high net worth investors offering exposure to certain of Blackstone’s key illiquid investment strategies through a single commitment, Blackstone Total Alternatives Solutions (“BTAS”) and our capital markets services business, Blackstone Capital Markets (“BXCM”). |
Our corporate private equity business pursues transactions throughout the world across a variety of transaction types, including large buyouts, mid-cap buyouts, buy and build platforms (which involve multiple acquisitions behind a single management team and platform) and growth equity/development projects (which involve significant minority investments in mature companies and greenfield development projects in energy and power). Tactical Opportunities seeks to capitalize on complex and dislocated market situations across asset classes, industries and geographies in a broad range of investments, including private and public securities, and instruments, where the underlying exposure may be to equity, debt, and/or real assets. Strategic Partners focuses on delivering access to a range of opportunities, leveraging its proprietary database to acquire single fund interests or complex portfolios in an efficient and timely manner.
| • | Real Estate. Our Real Estate group is one of the largest real estate investment managers in the world. We operate as one globally integrated business, with investments in North America, Europe, Asia and Latin America. |
Our Blackstone Real Estate Partners (“BREP”) funds are geographically diversified and target a broad range of “opportunistic” real estate and real estate related investments. The BREP funds include global funds as well as funds focused specifically on Europe or Asia investments. We seek to acquire high quality, well-located yet undermanaged assets at an attractive basis, address any property or business issues through active asset management and sell the assets once our business plan is accomplished. BREP has made significant investments in hotels, office buildings, shopping centers, residential and industrial assets, as well as a variety of real estate operating companies.
Our Blackstone Real Estate Debt Strategies (“BREDS”) vehicles target debt investment opportunities collateralized by commercial real estate in both public and private markets, primarily in the U.S. and Europe. BREDS’ scale and investment mandates enable it to provide a variety of lending and investment options including mezzanine loans, senior loans and liquid securities. The BREDS platform includes a number of high yield real estate debt funds, liquid real estate debt funds and BXMT, a NYSE-listed REIT.
Our core+ real estate business, Blackstone Property Partners (“BPP”) has assembled a global portfolio of high quality core+ investments across the U.S., Europe and Asia. Our BPP vehicles target substantially
78
Table of Contents
stabilized assets in prime markets with a focus on office, multifamily, industrial and retail assets. We manage several core+ real estate funds and a non-exchange traded REIT.
| • | Hedge Fund Solutions. Blackstone’s Hedge Fund Solutions segment is comprised principally of Blackstone Alternative Asset Management (“BAAM”). BAAM is the world’s largest discretionary allocator to hedge funds, managing a broad range of commingled and customized hedge fund of fund solutions since its inception in 1990. The Hedge Fund Solutions segment also includes investment platforms that seed new hedge fund businesses, purchase minority ownership interests in more established hedge funds, invest in special situation opportunities, create alternative solutions in regulated structures and trade directly. |
| • | Credit. Our credit business consists principally of GSO Capital Partners LP (“GSO”) which was founded in 2005 and subsequently acquired by Blackstone in 2008. GSO is one of the largest leveraged finance-focused alternative asset managers in the world and is the largest manager of CLOs globally. The investment portfolios of the funds we manage or sub-advise predominantly consist of loans and securities of non-investment grade companies spread across the capital structure including senior debt, subordinated debt, preferred stock and common equity. |
The GSO business is organized into three overarching strategies: performing credit, distressed and long only. Our performing credit strategies include mezzanine lending funds, business development companies that we sub-advise (“BDCs”) and other performing credit strategy funds. Our distressed strategies include hedge fund strategies, rescue lending funds and distressed energy strategies. GSO’s long only strategies consist of CLOs, closed end funds, commingled funds and separately managed accounts.
We generate revenue from fees earned pursuant to contractual arrangements with funds, fund investors and fund portfolio companies (including management, transaction and monitoring fees), and from capital markets services. We invest in the funds we manage and, in most cases, receive a preferred allocation of income (i.e., a carried interest) or an incentive fee from an investment fund in the event that specified cumulative investment returns are achieved (generally collectively referred to as “Performance Fees”). The composition of our revenues will vary based on market conditions and the cyclicality of the different businesses in which we operate. Net investment gains and investment income generated by the Blackstone Funds, principally private equity and real estate funds, are driven by value created by our operating and strategic initiatives as well as overall market conditions. Fair values are affected by changes in the fundamentals of the portfolio company, the portfolio company’s industry, the overall economy and other market conditions.
Business Environment
Blackstone’s businesses are materially affected by conditions in the financial markets and economic conditions in the U.S., Europe, Asia and, to a lesser extent, elsewhere in the world.
2016 was a year of significant financial market volatility and geopolitical change, including, among other major events, the U.S. presidential election and Brexit. The first six weeks of the year marked one of the worst starts to a year for equities in U.S. history on investor concerns of slowing economic growth and a potential looming recession. The S&P 500 fell 10.5% in the first six weeks of the year while the CBOE volatility index gained 54.5%, reaching a peak of 28. Despite this volatile start, U.S. equities later rallied on signs of improving economic growth, a recovery in oil prices and confidence around stabilization of currency and growth outlook in China. The S&P 500 ended 2016 up 9.5% while the CBOE volatility index declined 22.9%. Equity indices outside the U.S. were mixed, with European and Asian stock indices largely flat on the year (MSCI Europe down 0.5% and MSCI Asia up 1.7%), with a notable exception in the U.K. as the FTSE 100 gained 14.4% on the year despite Brexit.
Currency prices also experienced significant volatility in 2016, with sharp swings in traditionally stable currencies like the U.S. dollar, Euro and British pound. Following Brexit, in late June, the British pound fell dramatically, ending the year down 16.3% against the U.S. dollar. The Euro also weakened against the U.S. dollar
79
Table of Contents
post-Brexit, but rebounded later in the year, ending down 3.2%. In November, the U.S. presidential election results advanced hopes for pro-growth policies and economic expansion, supporting a further strengthening of the U.S. dollar index, which surged to its highest level since 2003.
Turmoil in the oil markets continued in 2016, with prices falling during the first six weeks of the year, with the West Texas Intermediate Crude reaching a low of $26 per barrel in February, and then more than doubling to end the year at $53 per barrel. Price declines, led by resilient production in the U.S. and globally, abundant existing supply and reduced demand from key emerging economies such as China and India, reversed during the first quarter due to spending and production cuts. In November, OPEC nations agreed to cut production in 2017, the first such cut in eight years, further buoying oil prices. Prices for other commodities also increased in 2016, with the Bloomberg commodity index rising 11.4% in 2016, marking its first gain in six years.
Despite the tumultuous start to the year, improving global economic prospects in the U.S. led to rising inflation expectations, higher bond yields and tightening corporate credit spreads during the second half of 2016. In November, the U.S. Federal Reserve, citing higher home prices, low unemployment and improving confidence, raised its targeted range by 25 basis points to 0.75%. Most bond sectors posted positive returns for the year, with the Bloomberg Barclays U.S. Aggregate Index up 2.6%, investment grade corporates up 6.1%, and high yield corporates up 17.1%. High yield spreads tightened 281 basis points and issuance, already down significantly in 2015, fell another 9.6% during the year. Global equity capital market activity for both IPOs and follow-ons fell 25% year over year to a four-year low, again driven by declining U.S. and European volumes in the midst of heightened market volatility.
China remained at the forefront as slowing growth and a devaluation of the yuan impacted global equities early in the year. The Shanghai composite fell 22.6% in January, before recovering modestly throughout the year, ending down 12.3%. The People’s Bank of China enacted a number of measures intended to stimulate the economy, including infrastructure spending, easing of property restrictions and auto incentives. The yuan fell 6.7% against the U.S. dollar, the biggest annual decline since 1994. For the full year, China’s GDP grew 6.7%, its slowest pace in 26 years, but within the government’s stated target range of 6.5% to 7%. Continued policy stimulus is expected into 2017 but capital outflows, high levels of debt, geopolitical uncertainties and the potential for continued and additional restrictions on capital outflow from China remain risks to the outlook.
Significant Transactions
On August 31, 2016, Blackstone amended and restated its revolving credit facility to, among other things, increase the amount of the revolving credit facility from $1.1 billion to $1.5 billion and to extend the maturity date of the revolving credit facility from May 29, 2019 to August 31, 2021.
On October 5, 2016, Blackstone issued €600 million in aggregate principal amount of 1.000% senior notes maturing on October 5, 2026.
80
Table of Contents
Organizational Structure
The simplified diagram below depicts our current organizational structure. The diagram does not depict all of our subsidiaries, including intermediate holding companies through which certain of the subsidiaries depicted are held.
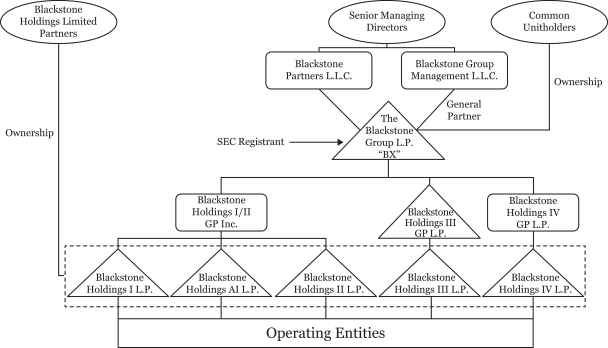
Key Financial Measures and Indicators
We manage our business using traditional financial measures and key operating metrics since we believe these metrics measure the productivity of our investment activities. Our key financial measures and indicators are discussed below.
Revenues
Revenues primarily consist of management and advisory fees, performance fees, investment income, interest and dividend revenue and other. Please refer to “Part I. Item 1. Business — Incentive Arrangements / Fee Structure” and “— Critical Accounting Policies — Revenue Recognition” for additional information regarding the manner in which Base Management Fees and Performance Fees are generated.
Management and Advisory Fees, Net — Management and Advisory Fees, Net are comprised of management fees, including base management fees, transaction and other fees and advisory fees net of management fee reductions and offsets.
The Partnership earns base management fees from limited partners of funds in each of its managed funds, at a fixed percentage of assets under management, net asset value, total assets, committed capital or invested capital, or in some cases, a fixed fee. Base management fees are recognized based on contractual terms specified in the underlying investment advisory agreements.
Transaction and other fees (including monitoring fees) are fees charged directly to managed funds and portfolio companies. The investment advisory agreements generally require that the investment adviser reduce the amount of
81
Table of Contents
management fees payable by the limited partners to the Partnership (“management fee reductions”) by an amount equal to a portion of the transaction and other fees directly paid to the Partnership by the portfolio companies. The amount of the reduction varies by fund, the type of fee paid by the portfolio company and the previously incurred expenses of the fund.
Management fee offsets are reductions to management fees payable by the limited partners of the Blackstone Funds, which are granted based on the amount such limited partners reimburse the Blackstone Funds for placement fees.
Advisory fees consist of transaction-based fee arrangements. Transaction-based fees are recognized when (a) there is evidence of an arrangement with a client, (b) agreed upon services have been provided, (c) fees are fixed or determinable, and (d) collection is reasonably assured.
Accrued but unpaid Management and Advisory Fees, net of management fee reductions and management fee offsets, as of the reporting date are included in Accounts Receivable or Due from Affiliates in the Consolidated Statements of Financial Condition. Management fees paid by limited partners to the Blackstone Funds and passed on to Blackstone are not considered affiliate revenues.
Performance Fees — Performance Fees earned on the performance of Blackstone’s hedge fund structures (“Incentive Fees”) are recognized based on fund performance during the period, subject to the achievement of minimum return levels, or high water marks, in accordance with the respective terms set out in each hedge fund’s governing agreements. Accrued but unpaid Incentive Fees charged directly to investors in Blackstone’s offshore hedge funds as of the reporting date are recorded within Due from Affiliates in the Consolidated Statements of Financial Condition. Accrued but unpaid Incentive Fees on onshore funds as of the reporting date are reflected in Investments in the Consolidated Statements of Financial Condition. Incentive Fees are realized at the end of a measurement period, typically annually. Once realized, such fees are not subject to clawback or reversal.
In certain fund structures, specifically in private equity, real estate and certain hedge fund solutions and credit-focused funds (“carry funds”), performance fees (“Carried Interest”) are allocated to the general partner based on cumulative fund performance to date, subject to a preferred return to limited partners. At the end of each reporting period, the Partnership calculates the Carried Interest that would be due to the Partnership for each fund, pursuant to the fund agreements, as if the fair value of the underlying investments were realized as of such date, irrespective of whether such amounts have been realized. As the fair value of underlying investments varies between reporting periods, it is necessary to make adjustments to amounts recorded as Carried Interest to reflect either (a) positive performance resulting in an increase in the Carried Interest allocated to the general partner or (b) negative performance that would cause the amount due to the Partnership to be less than the amount previously recognized as revenue, resulting in a negative adjustment to Carried Interest allocated to the general partner. In each scenario, it is necessary to calculate the Carried Interest on cumulative results compared to the Carried Interest recorded to date and make the required positive or negative adjustments. The Partnership ceases to record negative Carried Interest allocations once previously recognized Carried Interest allocations for such fund have been fully reversed. The Partnership is not obligated to pay guaranteed returns or hurdles, and therefore, cannot have negative Carried Interest over the life of a fund. Accrued but unpaid Carried Interest as of the reporting date is reflected in Investments in the Consolidated Statements of Financial Condition.
Carried Interest is realized when an underlying investment is profitably disposed of and the fund’s cumulative returns are in excess of the preferred return or, in limited instances, after certain thresholds for return of capital are met. Carried Interest is subject to clawback to the extent that the Carried Interest received to date exceeds the amount due to Blackstone based on cumulative results. As such, the accrual for potential repayment of previously received Carried Interest, which is a component of Due to Affiliates, represents all amounts previously distributed to Blackstone Holdings and non-controlling interest holders that would need to be repaid to the Blackstone carry funds if the Blackstone carry funds were to be liquidated based on the current fair value of the underlying funds’ investments as of the reporting date. The actual clawback liability, however, generally does not become realized
82
Table of Contents
until the end of a fund’s life except for certain funds, including certain Blackstone real estate funds, multi-asset class investment funds and credit-focused funds, which may have an interim clawback liability.
Investment Income (Loss) — Investment Income (Loss) represents the unrealized and realized gains and losses on the Partnership’s principal investments, including its investments in Blackstone Funds that are not consolidated, its equity method investments, and other principal investments. Investment Income (Loss) is realized when the Partnership redeems all or a portion of its investment or when the Partnership receives cash income, such as dividends or distributions. Unrealized Investment Income (Loss) results from changes in the fair value of the underlying investment as well as the reversal of unrealized gain (loss) at the time an investment is realized.
Interest and Dividend Revenue — Interest and Dividend Revenue comprises primarily interest and dividend income earned on principal investments held by Blackstone.
Other Revenue — Other Revenue consists of miscellaneous income and foreign exchange gains and losses arising on transactions denominated in currencies other than U.S. dollars.
Expenses
Compensation and Benefits — Compensation — Compensation and Benefits consists of (a) employee compensation, comprising salary and bonus, and benefits paid and payable to employees and senior managing directors and (b) equity-based compensation associated with the grants of equity-based awards to employees and senior managing directors. Compensation cost relating to the issuance of equity-based awards to senior managing directors and employees is measured at fair value at the grant date, taking into consideration expected forfeitures, and expensed over the vesting period on a straight-line basis, except in the case of (a) equity-based awards that do not require future service, which are expensed immediately, and (b) certain awards to recipients that meet specified criteria making them eligible for retirement treatment (allowing such recipient to keep a percentage of those awards upon departure from Blackstone after becoming eligible for retirement), for which the expense for the portion of the award that would be retained in the event of retirement is either expensed immediately or amortized to the retirement date. Cash settled equity-based awards are classified as liabilities and are remeasured at the end of each reporting period.
Compensation and Benefits — Performance Fee — Performance Fee Compensation consists of Carried Interest (which may be distributed in cash or in-kind) and Incentive Fee allocations, and may in future periods also include allocations of investment income from Blackstone’s firm investments, to employees and senior managing directors participating in certain profit sharing initiatives. Such compensation expense is subject to both positive and negative adjustments. Unlike Carried Interest and Incentive Fees, compensation expense is based on the performance of individual investments held by a fund rather than on a fund by fund basis.
Other Operating Expenses — Other Operating Expenses represents general and administrative expenses including interest expense, occupancy and equipment expenses and other expenses, which consist principally of professional fees, public company costs, travel and related expenses, communications and information services and depreciation and amortization.
Fund Expenses — The expenses of our consolidated Blackstone Funds consist primarily of interest expense, professional fees and other third party expenses.
Non-Controlling Interests in Consolidated Entities
Non-Controlling Interests in Consolidated Entities represent the component of Partners’ Capital in consolidated Blackstone Funds held by third party investors and employees. The percentage interests held by third parties and employees is adjusted for general partner allocations and by subscriptions and redemptions in funds of hedge funds and certain credit-focused funds which occur during the reporting period. In addition, all non-controlling interests in
83
Table of Contents
consolidated Blackstone Funds are attributed a share of income (loss) arising from the respective funds and a share of other comprehensive income, if applicable. Income (Loss) is allocated to non-controlling interests in consolidated entities based on the relative ownership interests of third party investors and employees after considering any contractual arrangements that govern the allocation of income (loss) such as fees allocable to The Blackstone Group L.P.
Redeemable Non-Controlling Interests in Consolidated Entities
Non-controlling interests related to funds of hedge funds are subject to annual, semi-annual or quarterly redemption by investors in these funds following the expiration of a specified period of time, or may be withdrawn subject to a redemption fee during the period when capital may not be withdrawn. As limited partners in these types of funds have been granted redemption rights, amounts relating to third party interests in such consolidated funds are presented as Redeemable Non-Controlling Interests in Consolidated Entities within the Consolidated Statements of Financial Condition. When redeemable amounts become legally payable to investors, they are classified as a liability and included in Accounts Payable, Accrued Expenses and Other Liabilities in the Consolidated Statements of Financial Condition. For all consolidated funds in which redemption rights have not been granted, non-controlling interests are presented within Partners’ Capital in the Consolidated Statements of Financial Condition as Non-Controlling Interests in Consolidated Entities.
Non-Controlling Interests in Blackstone Holdings
Non-Controlling Interests in Blackstone Holdings represent the component of Partners’ Capital in the consolidated Blackstone Holdings Partnerships held by Blackstone personnel and others who are limited partners of the Blackstone Holdings Partnerships.
Certain costs and expenses are borne directly by the Holdings Partnerships. Income (Loss), excluding those costs directly borne by and attributable to the Holdings Partnerships, is attributable to Non-Controlling Interests in Blackstone Holdings. This residual attribution is based on the year to date average percentage of Blackstone Holdings Partnership Units held by Blackstone personnel and others who are limited partners of the Blackstone Holdings Partnerships.
Income Taxes
The Blackstone Holdings Partnerships and certain of their subsidiaries operate in the U.S. as partnerships for U.S. federal income tax purposes and generally as corporate entities in non-U.S. jurisdictions. Accordingly, these entities in some cases are subject to New York City unincorporated business taxes or non-U.S. income taxes. In addition, certain of the wholly owned subsidiaries of the Partnership and the Blackstone Holdings Partnerships will be subject to federal, state and local corporate income taxes at the entity level and the related tax provision attributable to the Partnership’s share of this income tax is reflected in the Consolidated Financial Statements.
Income taxes are accounted for using the asset and liability method of accounting. Under this method, deferred tax assets and liabilities are recognized for the expected future tax consequences of differences between the carrying amounts of assets and liabilities and their respective tax basis, using tax rates in effect for the year in which the differences are expected to reverse. The effect on deferred assets and liabilities of a change in tax rates is recognized in income in the period when the change is enacted. Deferred tax assets are reduced by a valuation allowance when it is more likely than not that some portion or all of the deferred tax assets will not be realized. Current and deferred tax liabilities are recorded within Accounts Payable, Accrued Expenses and Other Liabilities in the Consolidated Statements of Financial Condition.
Blackstone uses the flow-through method to account for investment tax credits. Under this method, the investment tax credits are recognized as a reduction to income tax expense.
84
Table of Contents
Blackstone analyzes its tax filing positions in all of the U.S. federal, state, local and foreign tax jurisdictions where it is required to file income tax returns, as well as for all open tax years in these jurisdictions. Blackstone records uncertain tax positions on the basis of a two-step process: (a) a determination is made whether it is more likely than not that the tax positions will be sustained based on the technical merits of the position and (b) those tax positions that meet the more-likely-than-not threshold are recognized as the largest amount of tax benefit that is greater than 50 percent likely to be realized upon ultimate settlement with the related tax authority. Blackstone recognizes accrued interest and penalties related to uncertain tax positions in General, Administrative, and Other expenses within the Consolidated Statements of Operations.
There remains some uncertainty regarding Blackstone’s future taxation levels. Over the past several years, members of Congress and the administration of former President Obama have made a number of legislative proposals to change the taxation of carried interest that would have, in general, treated income and gains, including gain on sale, attributable to an investment services partnership interest, or “ISPI,” as income subject to a new blended tax rate that is higher than the capital gains rate applicable to such income under current law, except to the extent such ISPI would have been considered under the legislation to be a qualified capital interest. Our common units and the interests that we hold in entities that are entitled to receive carried interest would likely have been classified as ISPIs for purposes of this legislation. During his presidential campaign, President Trump expressed his support for legislation ending treatment of carried interest as capital gain. Whether or when the U.S. Congress will pass such legislation or what provisions will be included in any final legislation if enacted is unclear.
Some of the above legislative proposals have provided that, for taxable years beginning ten years after the date of enactment, income derived with respect to an ISPI that is not a qualified capital interest and that is subject to the foregoing rules would not meet the qualifying income requirements under the publicly traded partnership rules. Therefore, if similar legislation were to be enacted, following such ten-year period, we would be precluded from qualifying as a partnership for U.S. federal income tax purposes or be required to hold all such ISPIs through corporations.
Both President Trump and the Republican members of the U.S. House of Representatives have publicly stated that one of their top legislative priorities is significant reform of the Internal Revenue Code, including significant changes to taxation of business entities. Proposals by members of Congress have included, among other things: (a) reducing corporate tax rates (the highest dropping from 35% to 20%) and reducing individual tax rates (the highest dropping from 39.6% to 33%), (b) changing to a destination-based tax system, which would tax goods where they are consumed rather than produced, by providing for certain border adjustments which would effectively exempt exports from, and subject imports to, U.S. tax, (c) changing to a territorial tax system by exempting dividends from foreign subsidiaries from U.S. tax, but subjecting unrepatriated earnings of foreign subsidiaries to U.S. tax, paid over the course of eight years (8.75% on cash and cash equivalent and 3.5% otherwise), (d) allowing deductions for interest expense only against interest income, with any nondeductible net interest expense being carried forward indefinitely, (e) permitting current deductions for investment in tangible and intangible property (excluding land), (f) eliminating certain “special interest” deductions and credits, (g) taxing the active business income of pass-through entities at a maximum rate, such as 25%, (h) repealing the 3.8% net investment income tax and corporate and individual alternative minimum taxes and (i) extending the carryforward of net operating losses. While President Trump has expressed support for a number of these proposals, he has also set forth ideas for tax reform that differ in key ways. Both the timing and the details of any such tax reform are unclear. The impact of any potential tax reform on us, our portfolio companies and our investors is uncertain and could be adverse. Prospective investors should consult their own tax advisors regarding potential changes in tax laws.
States and other jurisdictions have also considered legislation to increase taxes with respect to carried interest. For example, New York has considered legislation, which could have caused a non-resident of New York who holds our common units to be subject to New York state income tax on carried interest earned by entities in which we hold an indirect interest, thereby requiring the non-resident to file a New York state income tax return reporting such carried interest income. Whether or when similar legislation will be enacted is unclear. Finally, several state and local jurisdictions have evaluated ways to subject partnerships to entity level taxation through the imposition of state or local income, franchise or other forms of taxation or to increase the amount of such taxation.
85
Table of Contents
If we were taxed as a corporation or were forced to hold interests in entities earning income from carried interest through taxable subsidiary corporations, our effective tax rate could increase significantly. The federal statutory rate for corporations is currently 35% (although Congress is considering proposals to lower that rate), and the state and local tax rates, net of the federal benefit, aggregate approximately 5%. If a variation of the above described legislation or any other change in the tax laws, rules, regulations or interpretations preclude us from qualifying for treatment as a partnership for U.S. federal income tax purposes under the publicly traded partnership rules or force us to hold interests in entities earning income from carried interest through taxable subsidiary corporations, this could materially increase our tax liability, and could well result in a reduction in the market price of our common units.
Meaningfully quantifying the potential impact on Blackstone of this potential future legislation or any similar legislation is not possible at this time. Multiple versions of legislation in this area have been proposed over the last few years that have included significantly different provisions regarding effective dates and the treatment of invested capital, tiered entities and cross-border operations, among other matters. Depending upon what version of the legislation, if any, were enacted, the potential impact on a public company such as Blackstone in a given year could differ significantly and could be material. In addition, even if these legislative proposals would not themselves impose a tax on a publicly traded partnership such as Blackstone, they could force Blackstone and other publicly traded partnerships to restructure their operations so as to prevent disqualifying income from reaching the publicly traded partnership in amounts that would disqualify the partnership from treatment as a partnership for U.S. federal income tax purposes. Such a restructuring could result in more income being earned in corporate subsidiaries, thereby increasing corporate income tax liability indirectly borne by the publicly traded partnership. In addition, we, and our common unitholders, could be taxed on any such restructuring. The nature of any such restructuring would depend on the precise provisions of the legislation that was ultimately enacted, as well as the particular facts and circumstances of Blackstone’s operations at the time any such legislation were to take effect, making the task of predicting the amount of additional tax highly speculative.
Congress, the OECD and other government agencies in jurisdictions in which we and our affiliates invest or do business have maintained a focus on issues related to the taxation of multinational companies. The OECD, which represents a coalition of member countries, is contemplating changes to numerous long-standing tax principles through its base erosion and profit shifting project, which is focused on a number of issues, including the shifting of profits between affiliated entities in different tax jurisdictions, interest deductibility and eligibility for the benefits of double tax treaties. A number of European jurisdictions have enacted taxes on financial transactions, and the European Commission has proposed legislation to harmonize these taxes under the so-called “enhanced cooperation procedure,” which provides for adoption of EU-level legislation applicable to some but not all EU Member States. These contemplated changes, if adopted by individual countries, could increase tax uncertainty and/or costs faced by us, our portfolio companies and our investors, change our business model and cause other adverse consequences. The timing or impact of these proposals is unclear at this point. In addition, tax laws, regulations and interpretations are subject to continual changes, which could adversely affect our structures or returns to our investors. For instance, various countries have adopted or proposed tax legislation that may adversely affect portfolio companies and investment structures in countries in which our funds have invested and may limit the benefits of additional investments in those countries.
In addition, legislation enacted in 2015 significantly changed the rules for U.S. federal income tax audits of partnerships. Such audits will continue to be conducted at the partnership level, but with respect to tax returns for taxable years beginning after December 31, 2017, and unless a partnership qualifies for and affirmatively elects an alternative procedure, any adjustments to the amount of tax due (including interest and penalties) will be payable by the partnership. Under the elective alternative procedure, a partnership would issue information returns to persons who were partners in the audited year, who would then be required to take the adjustments into account in calculating their own tax liability, and the partnership would not be liable for the adjustments. If a partnership elects the alternative procedure for a given adjustment, the amount of taxes for which its partners would be liable would be increased by any applicable penalties and a special interest charge. There can be no assurance that we will be eligible to make such an election or that we will, in fact, make such an election for any given adjustment. If we do
86
Table of Contents
not or are not able to make such an election, then (a) our then-current common unitholders, in the aggregate, could indirectly bear income tax liabilities in excess of the aggregate amount of taxes that would have been due had we elected the alternative procedure, and (b) a given common unitholder may indirectly bear taxes attributable to income allocable to other common unitholders or former common unitholders, including taxes (as well as interest and penalties) with respect to periods prior to such holder’s ownership of common units. Amounts available for distribution to our common unitholders may be reduced as a result of our obligation to pay any taxes associated with an adjustment. Many issues with respect to, and the overall effect of, this legislation on us are uncertain, and common unitholders should consult their own tax advisors regarding all aspects of this legislation as it affects their particular circumstances.
Economic Income
Blackstone uses Economic Income (“EI”) as a key measure of value creation, a benchmark of its performance and in making resource deployment and compensation decisions across its four segments. EI represents segment net income before taxes excluding transaction-related charges. Transaction-related charges arise from Blackstone’s IPO and long-term retention programs outside of annual deferred compensation and other corporate actions, including acquisitions. Transaction-related charges include equity-based compensation charges, the amortization of intangible assets and contingent consideration associated with acquisitions. EI presents revenues and expenses on a basis that deconsolidates the investment funds Blackstone manages. Economic Net Income (“ENI”) represents EI adjusted to include current period taxes. Taxes represent the total tax provision calculated under GAAP adjusted to include only the current tax provision (benefit) calculated on Income (Loss) Before Provision for Taxes. EI, our principal segment measure, is derived from and reconciled to, but not equivalent to, its most directly comparable GAAP measure of Income (Loss) Before Provision for Taxes. (See Note 21. “Segment Reporting” in the “Notes to Consolidated Financial Statements” in “— Item 8. Financial Statements and Supplementary Data”.)
Fee Related Earnings
Blackstone uses Fee Related Earnings (“FRE”), which is derived from EI, as a measure to highlight earnings from operations excluding: (a) the income related to performance fees and related performance fee compensation, (b) income earned from Blackstone’s investments in the Blackstone Funds, and (c) net interest income (loss). Management uses FRE as a measure to assess whether recurring revenue from our businesses is sufficient to adequately cover all of our operating expenses and generate profits. FRE equals contractual fee revenues, less (a) compensation expenses (which includes amortization of non-IPO and non-acquisition-related equity-based awards, but excludes amortization of IPO and acquisition-related equity-based awards, carried interest and incentive fee compensation) and (b) non-interest operating expenses. See “— Liquidity and Capital Resources — Sources and Uses of Liquidity” below for our discussion of FRE.
Distributable Earnings
Distributable Earnings, which is derived from our segment reported results, is a supplemental measure to assess performance and amounts available for distributions to Blackstone unitholders, including Blackstone personnel and others who are limited partners of the Blackstone Holdings Partnerships. Distributable Earnings, which is a measure not prepared under GAAP (a “non-GAAP” measure), is intended to show the amount of net realized earnings without the effects of the consolidation of the Blackstone Funds. Distributable Earnings is derived from and reconciled to, but not equivalent to, its most directly comparable GAAP measure of Income (Loss) Before Provision for Taxes. See “— Liquidity and Capital Resources — Sources and Uses of Liquidity” below for our discussion of Distributable Earnings.
Distributable Earnings, which is a component of Economic Net Income, is the sum across all segments of: (a) Total Management and Advisory Fees, (b) Interest and Dividend Revenue, (c) Other Revenue, (d) Realized Performance Fees, and (e) Realized Investment Income (Loss); less (a) Compensation, excluding the expense of equity-based awards, (b) Realized Performance Fee Compensation, (c) Other Operating Expenses, and (d) Taxes and Related Payables Under the Tax Receivable Agreement.
87
Table of Contents
Adjusted Earnings Before Interest, Taxes and Depreciation and Amortization
Adjusted Earnings Before Interest, Taxes and Depreciation and Amortization (“Adjusted EBITDA”), is a supplemental non-GAAP measure derived from our segment reported results and may be used to assess our ability to service our borrowings. Adjusted EBITDA represents Distributable Earnings plus the addition of (a) Interest Expense, (b) Taxes and Related Payables Including Payable Under Tax Receivable Agreement, and (c) Depreciation and Amortization. See “— Liquidity and Capital Resources — Sources and Uses of Liquidity” below for our calculation of Adjusted EBITDA.
Summary Walkdown of GAAP to Non-GAAP Financial Metrics
The relationship of our GAAP to non-GAAP financial measures is presented in the summary walkdown below. The summary walkdown shows how each non-GAAP financial measure is related to the other non-GAAP financial measures. This presentation is not meant to be a detailed calculation of each measure, but to show the relationship between the measures. For the calculation of each of these non-GAAP financial measures and a full reconciliation of Income Before Provision for Taxes to Distributable Earnings, please see “— Liquidity and Capital Resources — Sources and Uses of Liquidity.”
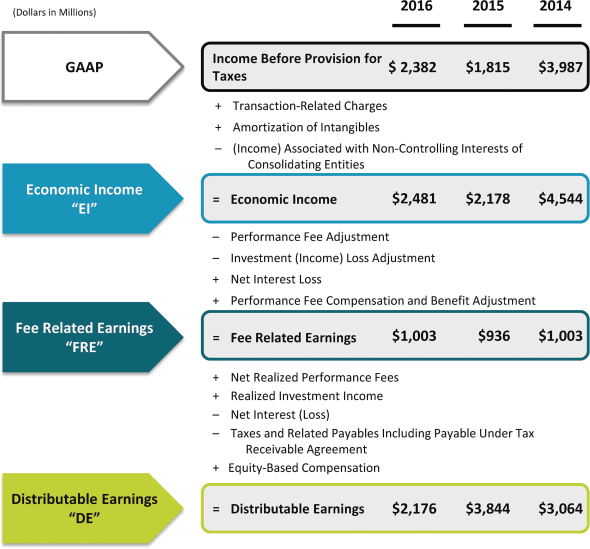
2016 2015 2014 (Dollars in Millions) GAAP Income Before Provision for Taxes $2,382 $1,815 $3,987 + Transaction-Related Charges + Amortization of Intangibles - (Income) Associated with Non-Controlling Interests of Consolidating Entities Economic Income “EI” = Economic Income $2,481 $2,178 $4,544 - Performance Fee Adjustment - Investment (Income) Loss Adjustment + Net Interest Loss + Performance Fee Compensation and Benefit Adjustment Fee Related Earnings “FRE” = Fee Related Earnings $1,003 $936 $1,003 + Net Realized Performance Fees + Realized Investment Income - Net Interest (Loss) - Taxes and Related Payables Including Payable Under Tax Receivable Agreement + Equity-Based Compensation Distributable Earnings “DE” $2,176 $3,844 $3,064 = Distributable Earnings
88
Table of Contents
Operating Metrics
The alternative asset management business is a complex business that is primarily based on managing third party capital and does not require substantial capital investment to support rapid growth. However, there also can be volatility associated with its earnings and cash flows. Since our inception, we have developed and used various key operating metrics to assess and monitor the operating performance of our various alternative asset management businesses in order to monitor the effectiveness of our value creating strategies.
Assets Under Management. Assets Under Management refers to the assets we manage. Our Assets Under Management equals the sum of:
| (a) | the fair value of the investments held by our carry funds and our side-by-side and co-investment entities managed by us, plus the capital that we are entitled to call from investors in those funds and entities pursuant to the terms of their respective capital commitments, including capital commitments to funds that have yet to commence their investment periods, plus for certain credit-oriented funds the amounts available to be borrowed under asset based credit facilities, |
| (b) | the net asset value of our funds of hedge funds, hedge funds, real estate debt carry funds (plus the capital that we are entitled to call from investors in those funds), open ended core+ real estate fund, our Hedge Fund Solutions registered investment companies, and our non-exchange traded REIT, |
| (c) | the invested capital, fair value or net asset value of assets we manage pursuant to separately managed accounts, |
| (d) | the amount of debt and equity outstanding for our CLOs during the reinvestment period, |
| (e) | the aggregate par amount of collateral assets, including principal cash, for our CLOs after the reinvestment period, |
| (f) | the gross or net amount of assets (including leverage where applicable) for our credit-focused registered investment companies, and |
| (g) | the fair value of common stock, preferred stock, convertible debt, or similar instruments issued by BXMT. |
Our carry funds are commitment-based drawdown structured funds that do not permit investors to redeem their interests at their election. Our funds of hedge funds, hedge funds and funds structured like hedge funds in our Hedge Fund Solutions, Credit and Real Estate segments generally have structures that afford an investor the right to withdraw or redeem their interests on a periodic basis (for example, annually or quarterly), typically with 30 to 95 days’ notice, depending on the fund and the liquidity profile of the underlying assets. Investment advisory agreements related to certain separately managed accounts in our Hedge Fund Solutions and Credit segments may generally be terminated by an investor on 30 to 90 days’ notice.
Fee-Earning Assets Under Management. Fee-Earning Assets Under Management refers to the assets we manage on which we derive management and/or performance fees. Our Fee-Earning Assets Under Management equals the sum of:
| (a) | for our Private Equity segment funds and Real Estate segment carry funds including certain real estate debt investment funds and certain of our Hedge Fund Solutions funds, the amount of capital commitments, remaining invested capital, fair value or par value of assets held, depending on the fee terms of the fund, |
| (b) | for our credit-focused carry funds, the amount of remaining invested capital (which may include leverage) or net asset value, depending on the fee terms of the fund, |
| (c) | the remaining invested capital or fair value of assets held in co-investment vehicles managed by us on which we receive fees, |
89
Table of Contents
| (d) | the net asset value of our funds of hedge funds, hedge funds, open ended core+ real estate fund, co-investments managed by us on which we receive fees, certain registered investment companies, and our non-exchange traded REIT, |
| (e) | the invested capital, fair value of assets or the net asset value we manage pursuant to separately managed accounts, |
| (f) | the net proceeds received from equity offerings and accumulated core earnings of BXMT, subject to certain adjustments, |
| (g) | the aggregate par amount of collateral assets, including principal cash, of our CLOs, and |
| (h) | the gross amount of assets (including leverage) or the net assets (plus leverage where applicable) for certain of our credit-focused registered investment companies. |
Each of our segments may include certain Fee-Earning Assets Under Management on which we earn performance fees but not management fees.
Our calculations of assets under management and fee-earning assets under management may differ from the calculations of other asset managers, and as a result this measure may not be comparable to similar measures presented by other asset managers. In addition, our calculation of assets under management includes commitments to, and the fair value of, invested capital in our funds from Blackstone and our personnel, regardless of whether such commitments or invested capital are subject to fees. Our definitions of assets under management and fee-earning assets under management are not based on any definition of assets under management and fee-earning assets under management that is set forth in the agreements governing the investment funds that we manage.
For our carry funds, total assets under management includes the fair value of the investments held, whereas fee-earning assets under management includes the amount of capital commitments, the remaining amount of invested capital at cost depending on whether the investment period has or has not expired or the fee terms of the fund. As such, fee-earning assets under management may be greater than total assets under management when the aggregate fair value of the remaining investments is less than the cost of those investments.
Limited Partner Capital Invested. Limited Partner Capital Invested represents the amount of Limited Partner capital commitments which were invested by our carry and drawdown funds during each period presented, plus the capital invested through co-investments arranged by us that were made by limited partners in investments of our carry funds on which we receive fees or a Carried Interest allocation or Incentive Fee.
The amount of committed undrawn capital available for investment, including general partner and employee commitments, is known as dry powder and is an indicator of the capital we have available for future investments.
90
Table of Contents
Consolidated Results of Operations
Following is a discussion of our consolidated results of operations for each of the years in the three year period ended December 31, 2016. For a more detailed discussion of the factors that affected the results of our four business segments (which are presented on a basis that deconsolidates the investment funds we manage) in these periods, see “— Segment Analysis” below.
The following table sets forth information regarding our consolidated results of operations and certain key operating metrics for the years ended December 31, 2016, 2015 and 2014:
| Year Ended December 31, | 2016 vs. 2015 | 2015 vs. 2014 | ||||||||||||||||||||||||||
| 2016 | 2015 | 2014 | $ | % | $ | % | ||||||||||||||||||||||
| (Dollars in Thousands) | ||||||||||||||||||||||||||||
| Revenues |
||||||||||||||||||||||||||||
| Management and Advisory Fees, Net |
$ | 2,442,975 | $ | 2,542,505 | $ | 2,497,252 | $ | (99,530 | ) | -4 | % | $ | 45,253 | 2 | % | |||||||||||||
|
|
|
|
|
|
|
|
|
|
|
|
|
|
|
|||||||||||||||
| Performance Fees |
||||||||||||||||||||||||||||
| Realized |
||||||||||||||||||||||||||||
| Carried Interest |
1,474,830 | 3,205,290 | 2,450,082 | (1,730,460 | ) | -54 | % | 755,208 | 31 | % | ||||||||||||||||||
| Incentive Fees |
170,537 | 193,238 | 249,005 | (22,701 | ) | -12 | % | (55,767 | ) | -22 | % | |||||||||||||||||
| Unrealized |
||||||||||||||||||||||||||||
| Carried Interest |
481,304 | (1,595,174 | ) | 1,704,924 | 2,076,478 | N/M | (3,300,098 | ) | N/M | |||||||||||||||||||
| Incentive Fees |
49,660 | (6,688 | ) | (29,749 | ) | 56,348 | N/M | 23,061 | -78 | % | ||||||||||||||||||
|
|
|
|
|
|
|
|
|
|
|
|
|
|
|
|||||||||||||||
| Total Performance Fees |
2,176,331 | 1,796,666 | 4,374,262 | 379,665 | 21 | % | (2,577,596 | ) | -59 | % | ||||||||||||||||||
|
|
|
|
|
|
|
|
|
|
|
|
|
|
|
|||||||||||||||
| Investment Income (Loss) |
||||||||||||||||||||||||||||
| Realized |
278,737 | 555,171 | 523,735 | (276,434 | ) | -50 | % | 31,436 | 6 | % | ||||||||||||||||||
| Unrealized |
77,314 | (350,529 | ) | 10,265 | 427,843 | N/M | (360,794 | ) | N/M | |||||||||||||||||||
|
|
|
|
|
|
|
|
|
|
|
|
|
|
|
|||||||||||||||
| Total Investment Income |
356,051 | 204,642 | 534,000 | 151,409 | 74 | % | (329,358 | ) | -62 | % | ||||||||||||||||||
|
|
|
|
|
|
|
|
|
|
|
|
|
|
|
|||||||||||||||
| Interest and Dividend Revenue |
95,724 | 94,957 | 69,809 | 767 | 1 | % | 25,148 | 36 | % | |||||||||||||||||||
| Other |
54,753 | 7,782 | 9,405 | 46,971 | 604 | % | (1,623 | ) | -17 | % | ||||||||||||||||||
|
|
|
|
|
|
|
|
|
|
|
|
|
|
|
|||||||||||||||
| Total Revenues |
5,125,834 | 4,646,552 | 7,484,728 | 479,282 | 10 | % | (2,838,176 | ) | -38 | % | ||||||||||||||||||
|
|
|
|
|
|
|
|
|
|
|
|
|
|
|
|||||||||||||||
| Expenses |
||||||||||||||||||||||||||||
| Compensation and Benefits |
||||||||||||||||||||||||||||
| Compensation |
1,335,408 | 1,726,191 | 1,868,868 | (390,783 | ) | -23 | % | (142,677 | ) | -8 | % | |||||||||||||||||
| Performance Fee Compensation |
||||||||||||||||||||||||||||
| Realized |
||||||||||||||||||||||||||||
| Carried Interest |
455,954 | 793,801 | 815,643 | (337,847 | ) | -43 | % | (21,842 | ) | -3 | % | |||||||||||||||||
| Incentive Fees |
78,096 | 85,945 | 110,099 | (7,849 | ) | -9 | % | (24,154 | ) | -22 | % | |||||||||||||||||
| Unrealized |
||||||||||||||||||||||||||||
| Carried Interest |
312,838 | (312,696 | ) | 379,037 | 625,534 | N/M | (691,733 | ) | N/M | |||||||||||||||||||
| Incentive Fees |
21,134 | (2,490 | ) | (19,276 | ) | 23,624 | N/M | 16,786 | -87 | % | ||||||||||||||||||
|
|
|
|
|
|
|
|
|
|
|
|
|
|
|
|||||||||||||||
| Total Compensation and Benefits |
2,203,430 | 2,290,751 | 3,154,371 | (87,321 | ) | -4 | % | (863,620 | ) | -27 | % | |||||||||||||||||
| General, Administrative and Other |
520,309 | 576,103 | 549,463 | (55,794 | ) | -10 | % | 26,640 | 5 | % | ||||||||||||||||||
| Interest Expense |
152,654 | 144,522 | 121,524 | 8,132 | 6 | % | 22,998 | 19 | % | |||||||||||||||||||
| Fund Expenses |
52,181 | 79,499 | 30,498 | (27,318 | ) | -34 | % | 49,001 | 161 | % | ||||||||||||||||||
|
|
|
|
|
|
|
|
|
|
|
|
|
|
|
|||||||||||||||
| Total Expenses |
2,928,574 | 3,090,875 | 3,855,856 | (162,301 | ) | -5 | % | (764,981 | ) | -20 | % | |||||||||||||||||
|
|
|
|
|
|
|
|
|
|
|
|
|
|
|
|||||||||||||||
| Other Income |
||||||||||||||||||||||||||||
| Reversal of Tax Receivable Agreement Liability |
— | 82,707 | — | (82,707 | ) | -100 | % | 82,707 | N/M | |||||||||||||||||||
| Net Gains from Fund Investment Activities |
184,750 | 176,364 | 357,854 | 8,386 | 5 | % | (181,490 | ) | -51 | % | ||||||||||||||||||
|
|
|
|
|
|
|
|
|
|
|
|
|
|
|
|||||||||||||||
| Total Other Income |
184,750 | 259,071 | 357,854 | (74,321 | ) | -29 | % | (98,783 | ) | -28 | % | |||||||||||||||||
|
|
|
|
|
|
|
|
|
|
|
|
|
|
|
|||||||||||||||
| Income Before Provision for Taxes |
2,382,010 | 1,814,748 | 3,986,726 | 567,262 | 31 | % | (2,171,978 | ) | -54 | % | ||||||||||||||||||
| Provision for Taxes |
132,362 | 190,398 | 291,173 | (58,036 | ) | -30 | % | (100,775 | ) | -35 | % | |||||||||||||||||
|
|
|
|
|
|
|
|
|
|
|
|
|
|
|
|||||||||||||||
| Net Income |
2,249,648 | 1,624,350 | 3,695,553 | 625,298 | 38 | % | (2,071,203 | ) | -56 | % | ||||||||||||||||||
| Net Income Attributable to Redeemable Non-Controlling Interests in Consolidated Entities |
3,977 | 11,145 | 74,794 | (7,168 | ) | -64 | % | (63,649 | ) | -85 | % | |||||||||||||||||
| Net Income Attributable to Non-Controlling Interests in Consolidated Entities |
246,152 | 219,900 | 335,070 | 26,252 | 12 | % | (115,170 | ) | -34 | % | ||||||||||||||||||
| Net Income Attributable to Non-Controlling Interests in Blackstone Holdings |
960,284 | 683,516 | 1,701,100 | 276,768 | 40 | % | (1,017,584 | ) | -60 | % | ||||||||||||||||||
|
|
|
|
|
|
|
|
|
|
|
|
|
|
|
|||||||||||||||
| Net Income Attributable to The Blackstone Group L.P. |
$ | 1,039,235 | $ | 709,789 | $ | 1,584,589 | $ | 329,446 | 46 | % | $ | (874,800 | ) | -55 | % | |||||||||||||
|
|
|
|
|
|
|
|
|
|
|
|
|
|
|
|||||||||||||||
| N/M | Not meaningful. |
91
Table of Contents
Year Ended December 31, 2016 Compared to Year Ended December 31, 2015
Revenues
Total Revenues were $5.1 billion for the year ended December 31, 2016, an increase of $479.3 million, or 10%, compared to $4.6 billion for the year ended December 31, 2015. The increase was primarily attributable to increases in Performance Fees and Investment Income of $379.7 million and $151.4 million, respectively, partially offset by a decrease in Management and Advisory Fees, Net of $99.5 million.
Performance Fees, which are determined on a fund by fund basis, were $2.2 billion for the year ended December 31, 2016, an increase of $379.7 million compared to $1.8 billion for the year ended December 31, 2015. The increase in Performance Fees was primarily due to increases in our Credit and Real Estate segments of $356.1 million and $129.5 million, respectively. These increases were partially offset by a decrease in our Private Equity segment of $87.0 million. Performance Fees increased in our Credit segment due to a significant rebound in energy investments as well as broad based appreciation of funds. The composite net returns of Blackstone’s significant Credit segment funds for the year ended December 31, 2016 were 13.3% for Distressed Strategies and 16.7% for Performing Credit Strategies. The increase in Performance Fees in our Real Estate segment was primarily due to a year over year increase in the net appreciation of investment holdings in our real estate opportunistic funds, which appreciated 11.1%, compared to 9.7% in the prior period. Our core+ real estate funds, real estate debt drawdown and hedge funds appreciated 10.9%, 11.7% and 0.3%, respectively. The decrease in our Private Equity segment was principally due to lower appreciation in BCP V compared to 2015, partially offset by greater appreciation in our BCP VI and BCP IV funds.
Investment Income was $356.1 million for the year ended December 31, 2016, an increase of $151.4 million compared to $204.6 million for the year ended December 31, 2015. The increase in Investment Income was primarily due to an increase in our Real Estate segment of $117.9 million. The increase in our Real Estate segment was primarily due to the net appreciation of investments in BREP VI, in which the general partner has made a larger commitment than in other real estate funds.
Management and Advisory Fees, Net was $2.4 billion for the year ended December 31, 2016, a decrease of $99.5 million compared to $2.5 billion for the year ended December 31, 2015. The decrease in Management and Advisory Fees, Net was primarily due to the spin-off of the operations of our financial advisory business, partially offset by increases in our Real Estate, Private Equity and Credit segments of $130.9 million, $48.5 million and $18.5 million, respectively. The increase in our Real Estate segment was principally due to increased commitments in BREP VIII and an increase in invested capital in BPP, partially offset by realizations across the portfolio. The increase in our Private Equity segment was primarily due to the addition of Fee-Earning Assets Under Management across the segment. The increase in our Credit segment was primarily attributable to the growth in Fee-Earning Assets Under Management for our credit drawdown funds and our BDCs.
Expenses
Expenses were $2.9 billion for the year ended December 31, 2016, a decrease of $162.3 million compared to $3.1 billion for the year ended December 31, 2015. The decrease was primarily attributable to decreases in Compensation, General, Administrative and Other, and Fund Expenses of $390.8 million, $55.8 million and $27.3 million, respectively, partially offset by an increase in Performance Fee Compensation of $303.5 million. The decrease in Compensation was due to lower equity-based compensation expense related to awards granted in connection with Blackstone’s IPO which were fully vested and expensed as of June 30, 2015 as well as the departure of employees due to the October 1, 2015 spin-off of our financial advisory business. The decrease in General, Administrative and Other was primarily due to the spin-off of our financial advisory business and non-recurring costs incurred in 2015 related to the SEC settlement. The decrease in Fund Expenses was primarily attributable to our Credit segment as a result of a decrease in certain CLO-related expenses. Performance Fee Compensation is derived from Performance Fee Revenue. The increase in Performance Fee Compensation was due to the increase in Performance Fees Revenue.
92
Table of Contents
Year Ended December 31, 2015 Compared to Year Ended December 31, 2014
Revenues
Total Revenues were $4.6 billion for the year ended December 31, 2015, a decrease of $2.8 billion, or 38%, compared to $7.5 billion for the year ended December 31, 2014. The decrease was primarily attributable to decreases in Performance Fees and Investment Income of $2.6 billion and $329.4 million, respectively.
Performance Fees, which are determined on a fund by fund basis, were $1.8 billion for the year ended December 31, 2015, a decrease of $2.6 billion compared to $4.4 billion for the year ended December 31, 2014. The decrease in Performance Fees was primarily due to decreases in our Private Equity, Real Estate, and Credit segments of $1.2 billion, $1.0 billion and $270.4 million, respectively. The decrease in our Private Equity segment was principally due to lower net returns in our corporate private equity portfolio, despite overall solid net performance. Performance Fees in our Real Estate segment decreased due to a year over year decrease in the net appreciation of investments in our real estate opportunistic funds from 20.9% to 9.7%. For the year ended December 31, 2015, the increase in carrying value of assets for Blackstone’s contributed real estate opportunistic funds was driven by sustained strong operating fundamentals in the private portfolio resulting in appreciation of 16.6%, offset by public portfolio depreciation of 8.6%, particularly in lodging. Performance Fees decreased in our Credit segment due to our energy investments, overall declines in the credit market, underperformance in certain event-driven assets and technical pressure caused by year end selling.
Investment Income was $204.6 million for the year ended December 31, 2015, a decrease of $329.4 million compared to $534.0 million for the year ended December 31, 2014. The decrease in Investment Income was primarily due to decreases in our Real Estate and Private Equity segments of $246.5 million and $105.5 million, respectively. The decrease in our Real Estate segment was primarily due to a year over year net depreciation of investments in BREP VI, in which the general partner has made a larger commitment than in other real estate funds. The decrease in our Private Equity segment was driven by our BCP V and BCP VI funds which generated strong net returns of 8.1% and 7.9%, respectively, for the year but were slightly lower than the returns generated in the full year 2014 mainly as a result of the lower returns in our public portfolio and certain investment markdowns in energy.
Expenses
Expenses were $3.1 billion for the year ended December 31, 2015, a decrease of $765.0 million compared to $3.9 billion for the year ended December 31, 2014. The decrease was primarily attributable to decreases in Performance Fee Compensation and Compensation of $720.9 million and $142.7 million, respectively, partially offset by increases of $49.0 million and $23.0 million in Fund Expenses and Interest Expense, respectively. Performance Fee Compensation is derived from Performance Fee Revenue. The decrease in Performance Fee Compensation was due to the decrease in Performance Fee Revenue. The decrease in Compensation was primarily due to lower equity-based compensation expense related to awards granted in connection with Blackstone’s IPO, which were fully vested and expensed as of June 30, 2015 and an overall decrease in headcount driven by the October 1, 2015 spin-off of our financial advisory business. The decrease was partially offset by an increase in equity-based amortization charges due to the 2014 change in terms of Deferred Compensation Plan awards which require future service and are therefore expensed over the service period. The increase in General, Administrative and Other was primarily due to transactional charges associated with the spin-off, non-recurring costs related to the SEC settlement, occupancy increases and business development costs. Due to the spin-off, partially offsetting these increases was a reduction in expenses directly incurred by the financial advisory business. The $23.0 million increase in interest expense was primarily related to Blackstone’s issuance of senior notes in the second quarter of 2015. The increase in Fund Expenses primarily occurred in our Credit segment, where it was attributable to newly launched CLOs and an increase in other expenses.
93
Table of Contents
Other Income
Year Ended December 31, 2016 Compared to Year Ended December 31, 2015
Other Income was $184.8 million for the year ended December 31, 2016, a decrease of $74.3 million compared to $259.1 million for the year ended December 31, 2015. The decrease was primarily due to the absence of the Reversal of Tax Receivable Agreement Liability of $82.7 million that was recognized during the year ended December 31, 2015 in connection with the spin-off of our financial advisory business in October 2015. The reversal occurred when we recalculated our liability under the tax receivable agreements as a result of the spin-off of our financial advisory business.
Year Ended December 31, 2015 Compared to Year Ended December 31, 2014
Other Income was $259.1 million for the year ended December 31, 2015, a decrease of $98.8 million compared to $357.9 million for the year ended December 31, 2014. The decrease was due to a decrease in Net Gains from Fund Investment Activities of $181.5 million, partially offset by an increase due to a Reversal of Tax Receivable Agreement Liability of $82.7 million in connection with the spin-off of our financial advisory business in October 2015. The reversal occurred when we recalculated our liability under the tax receivable agreements as a result of the spin-off of our financial advisory business.
Other Income — Net Gains from Fund Investment Activities was $176.4 million for the year ended December 31, 2015, a decrease of $181.5 million compared to $357.9 million for the year ended December 31, 2014. This decrease was primarily comprised of decreases in our Real Estate, Hedge Fund Solutions and Private Equity segments of $148.3 million, $73.8 million and $62.0 million, respectively, partially offset by an increase of $102.7 million in our Credit segment. The Real Estate decrease was primarily the result of the deconsolidation of certain funds as well as a year over year net decreases in the appreciation of investments across our funds. The decrease in our Hedge Fund Solutions segment was primarily the result of a decrease in investment performance and the deconsolidation of a number of funds. The decrease in our Private Equity segment was primarily due to the lower unrealized gains compared to the same period in 2014. The increase in our Credit segment was primarily due to lower valuations on the liabilities of certain consolidated CLO vehicles, which led to increases in unrealized gains.
For the year ended December 31, 2015, there was a Reversal of Tax Receivable Agreement Liability resulting in an increase of $82.7 million.
Provision for Taxes
The following table summarizes Blackstone’s tax position:
| Year Ended December 31, | ||||||||||||
| 2016 | 2015 | 2014 | ||||||||||
| Income Before Provision for Taxes |
$ | 2,382,010 | $ | 1,814,748 | $ | 3,986,726 | ||||||
| Provision for Taxes |
$ | 132,362 | $ | 190,398 | $ | 291,173 | ||||||
| Effective Income Tax Rate |
5.6 | % | 10.5 | % | 7.3 | % | ||||||
The following table reconciles the effective income tax rate to the U.S. federal statutory tax rate:
| Year Ended December 31, | 2016
vs. 2015 |
2015
vs. 2014 |
||||||||||||||||||
| 2016 | 2015 | 2014 | ||||||||||||||||||
| Statutory U.S. Federal Income Tax Rate |
35.0 | % | 35.0 | % | 35.0 | % | — | — | ||||||||||||
| Income Passed Through to Common Unitholders and Non-Controlling Interest Holders (a) |
-28.6 | % | -26.3 | % | -29.2 | % | -2.3 | % | 2.9 | % | ||||||||||
| State and Local Income Taxes |
1.3 | % | 1.8 | % | 1.5 | % | -0.5 | % | 0.3 | % | ||||||||||
| Equity-Based Compensation |
-0.2 | % | 1.8 | % | 1.1 | % | -2.0 | % | 0.7 | % | ||||||||||
| Other |
-1.9 | % | -1.8 | % | -1.1 | % | -0.1 | % | -0.7 | % | ||||||||||
|
|
|
|
|
|
|
|
|
|
|
|||||||||||
| Effective Income Tax Rate |
5.6 | % | 10.5 | % | 7.3 | % | -4.9 | % | 3.2 | % | ||||||||||
|
|
|
|
|
|
|
|
|
|
|
|||||||||||
94
Table of Contents
| (a) | Includes income that is not taxable to the Partnership and its subsidiaries. Such income is directly taxable to the Partnership’s unitholders and the non-controlling interest holders. |
Blackstone’s Provision for Taxes for the years ended December 31, 2016, 2015 and 2014 was $132.4 million, $190.4 million and $291.2 million, respectively. This resulted in an effective tax rate of 5.6%, 10.5% and 7.3%, respectively, based on our Income Before Provision for Taxes of $2.4 billion, $1.8 billion and $4.0 billion, respectively.
The difference in Blackstone’s effective tax rate for the year ended December 31, 2016 compared to the year ended December 31, 2015 resulted primarily from two items. First, the Income Before Provision for Taxes that was not taxable to the Partnership or its subsidiaries (and therefore was passed through to common unitholders and non-controlling interest holders) was $1.9 billion in 2016 (of $2.4 billion of 2016 total pretax income), compared to $1.4 billion in 2015 (of $1.8 billion of 2015 total pretax income). Second, in 2016, the tax deductible equity-based compensation expense exceeded the book equity-based compensation expense, while the reverse occurred in 2014.
The difference in Blackstone’s effective tax rate for the year ended December 31, 2015 compared to the year ended December 31, 2014 period resulted primarily from one item: the Income Before Provision for Taxes that was not taxable to the Partnership or its subsidiaries (and therefore was passed through to common unitholders and non-controlling interest holders) was $1.4 billion in 2015 (of $1.8 billion of 2015 total pretax income), compared to $3.3 billion in 2014 (of $4.0 billion of total pretax income).
All factors except for the reversal of the deferred tax asset are expected to impact the effective tax rate for future years.
Additional information regarding our income taxes can be found in Note 14. “Income Taxes” in the “Notes to Consolidated Financial Statements” in “— Item 8. Financial Statements and Supplementary Data” of this filing.
Non-Controlling Interests in Consolidated Entities
The Net Income Attributable to Redeemable Non-Controlling Interests in Consolidated Entities and Net Income Attributable to Non-Controlling Interests in Consolidated Entities is attributable to the consolidated Blackstone Funds. The amounts of these items vary directly with the performance of the consolidated Blackstone Funds and largely eliminate the amount of Other Income — Net Gains from Fund Investment Activities from the Net Income (Loss) Attributable to The Blackstone Group L.P.
Net Income Attributable to Non-Controlling Interests in Blackstone Holdings is derived from the Income Before Provision for Taxes, excluding the Net Gains from Fund Investment Activities and the percentage allocation of the income between Blackstone Holdings and The Blackstone Group L.P. after considering any contractual arrangements that govern the allocation of income (loss) such as fees allocable to The Blackstone Group L.P.
For the years ended December 31, 2016, 2015 and 2014, the Net Income Before Taxes allocated to Blackstone Holdings was 46.1%, 47.0% and 47.9%, respectively. The decreases of 0.9% and 0.9% were primarily due to conversions of Blackstone Holdings Partnership Units to Blackstone common units and the vesting of common units.
The Other Income — Reversal of Tax Receivable Agreement Liability was entirely allocated to The Blackstone Group L.P.
Operating Metrics
The following graphs and tables summarize the Fee-Earning Assets Under Management by Segment and Total Assets Under Management by Segment, followed by a rollforward of activity for the years ended December 31, 2016, 2015 and 2014. For a description of how Assets Under Management and Fee-Earning Assets Under
95
Table of Contents
Management are determined, please see “— Key Financial Measures and Indicators — Operating Metrics — Assets Under Management and Fee-Earning Assets Under Management.”
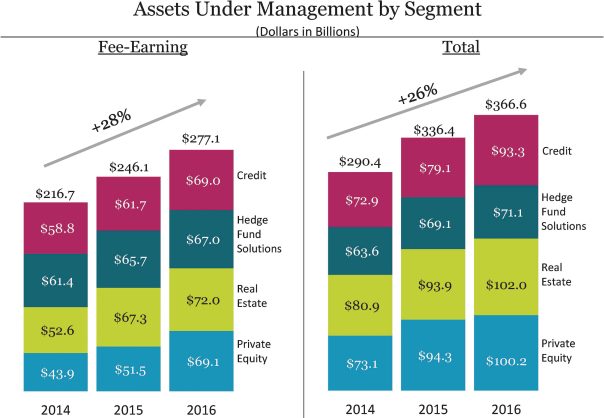
Note: Totals may not add due to rounding.
Assets Under Management by Segment (Dollars in Billions) Fee-Earning Total
96
Table of Contents
| Year Ended December 31, | ||||||||||||||||||||||||||||||||||||||||
| 2016 | 2015 | |||||||||||||||||||||||||||||||||||||||
| Private Equity |
Real Estate | Hedge Fund Solutions |
Credit | Total | Private Equity |
Real Estate | Hedge Fund Solutions |
Credit | Total | |||||||||||||||||||||||||||||||
| (Dollars in Thousands) | ||||||||||||||||||||||||||||||||||||||||
| Fee-Earning Assets Under Management |
||||||||||||||||||||||||||||||||||||||||
| Balance, Beginning of Period |
$ | 51,451,196 | $ | 67,345,357 | $ | 65,665,439 | $ | 61,684,380 | $ | 246,146,372 | $ | 43,890,167 | $ | 52,563,068 | $ | 61,417,558 | $ | 58,821,006 | $ | 216,691,799 | ||||||||||||||||||||
| Inflows, including Commitments (a) |
28,917,902 | 14,230,164 | 10,132,407 | 15,045,180 | 68,325,653 | 13,882,257 | 27,698,203 | 9,667,274 | 17,310,414 | 68,558,148 | ||||||||||||||||||||||||||||||
| Outflows, including Distributions (b) |
(3,154,420 | ) | (2,180,183 | ) | (9,744,077 | ) | (4,756,725 | ) | (19,835,405 | ) | (1,395,020 | ) | (4,165,520 | ) | (5,430,094 | ) | (5,711,573 | ) | (16,702,207 | ) | ||||||||||||||||||||
| Realizations (c) |
(8,193,322 | ) | (8,019,202 | ) | (416,583 | ) | (5,818,135 | ) | (22,447,242 | ) | (5,106,650 | ) | (8,513,771 | ) | (516,619 | ) | (6,318,060 | ) | (20,455,100 | ) | ||||||||||||||||||||
|
|
|
|
|
|
|
|
|
|
|
|
|
|
|
|
|
|
|
|
|
|||||||||||||||||||||
| Net Inflows (Outflows) |
17,570,160 | 4,030,779 | (28,253 | ) | 4,470,320 | 26,043,006 | 7,380,587 | 15,018,912 | 3,720,561 | 5,280,781 | 31,400,841 | |||||||||||||||||||||||||||||
| Market Appreciation (Depreciation) (d)(g) |
92,053 | 653,918 | 1,350,367 | 2,806,956 | 4,903,294 | 180,442 | (236,623 | ) | 527,320 | (2,417,407 | ) | (1,946,268 | ) | |||||||||||||||||||||||||||
|
|
|
|
|
|
|
|
|
|
|
|
|
|
|
|
|
|
|
|
|
|||||||||||||||||||||
| Balance, End of Period (e) |
$ | 69,113,409 | $ | 72,030,054 | $ | 66,987,553 | $ | 68,961,656 | $ | 277,092,672 | $ | 51,451,196 | $ | 67,345,357 | $ | 65,665,439 | $ | 61,684,380 | $ | 246,146,372 | ||||||||||||||||||||
|
|
|
|
|
|
|
|
|
|
|
|
|
|
|
|
|
|
|
|
|
|||||||||||||||||||||
| Increase |
$ | 17,662,213 | $ | 4,684,697 | $ | 1,322,114 | $ | 7,277,276 | $ | 30,946,300 | $ | 7,561,029 | $ | 14,782,289 | $ | 4,247,881 | $ | 2,863,374 | $ | 29,454,573 | ||||||||||||||||||||
| Increase |
34 | % | 7 | % | 2 | % | 12 | % | 13 | % | 17 | % | 28 | % | 7 | % | 5 | % | 14 | % | ||||||||||||||||||||
| Annualized Base Management Fee Rate (f) |
0.93 | % | 1.09 | % | 0.78 | % | 0.79 | % | 0.90 | % | 1.12 | % | 1.19 | % | 0.79 | % | 0.82 | % | 0.97 | % | ||||||||||||||||||||
| Year Ended December 31, | ||||||||||||||||||||
| 2014 | ||||||||||||||||||||
| Private Equity |
Real Estate | Hedge Fund Solutions |
Credit | Total | ||||||||||||||||
| (Dollars in Thousands) | ||||||||||||||||||||
| Fee-Earning Assets Under Management |
||||||||||||||||||||
| Balance, Beginning of Period |
$ | 42,600,515 | $ | 50,792,803 | $ | 52,865,837 | $ | 51,722,584 | $ | 197,981,739 | ||||||||||
| Inflows, including Commitments (a) |
6,757,450 | 11,536,435 | 12,021,209 | 19,845,686 | 50,160,780 | |||||||||||||||
| Outflows, including Distributions (b) |
(1,124,355 | ) | (295,067 | ) | (5,362,968 | ) | (3,458,712 | ) | (10,241,102 | ) | ||||||||||
| Realizations (c) |
(4,733,564 | ) | (8,719,534 | ) | (312,486 | ) | (7,897,115 | ) | (21,662,699 | ) | ||||||||||
|
|
|
|
|
|
|
|
|
|
|
|||||||||||
| Net Inflows |
899,531 | 2,521,834 | 6,345,755 | 8,489,859 | 18,256,979 | |||||||||||||||
| Market Appreciation |
390,121 | (751,569 | ) | 2,205,966 | (1,391,437 | ) | 453,081 | |||||||||||||
|
|
|
|
|
|
|
|
|
|
|
|||||||||||
| Balance, End of Period (e) |
$ | 43,890,167 | $ | 52,563,068 | $ | 61,417,558 | $ | 58,821,006 | $ | 216,691,799 | ||||||||||
|
|
|
|
|
|
|
|
|
|
|
|||||||||||
| Increase |
$ | 1,289,652 | $ | 1,770,265 | $ | 8,551,721 | $ | 7,098,422 | $ | 18,710,060 | ||||||||||
| Increase |
3 | % | 3 | % | 16 | % | 14 | % | 9 | % | ||||||||||
| Annualized Base Management Fee Rate (f) |
0.96 | % | 1.19 | % | 0.81 | % | 0.83 | % | 0.94 | % | ||||||||||
97
Table of Contents
| Year Ended December 31, | ||||||||||||||||||||||||||||||||||||||||
| 2016 | 2015 | |||||||||||||||||||||||||||||||||||||||
| Private Equity |
Real Estate | Hedge Fund Solutions |
Credit | Total | Private Equity |
Real Estate | Hedge Fund Solutions |
Credit | Total | |||||||||||||||||||||||||||||||
| (Dollars in Thousands) | ||||||||||||||||||||||||||||||||||||||||
| Total Assets Under Management |
||||||||||||||||||||||||||||||||||||||||
| Balance, Beginning of Period |
$ | 94,280,074 | $ | 93,917,824 | $ | 69,105,425 | $ | 79,081,252 | $ | 336,384,575 | $ | 73,073,252 | $ | 80,863,187 | $ | 63,585,670 | $ | 72,858,960 | $ | 290,381,069 | ||||||||||||||||||||
| Inflows, including Commitments (a) |
16,867,638 | 19,047,473 | 10,782,839 | 22,962,825 | 69,660,775 | 30,034,911 | 29,473,697 | 11,040,950 | 23,035,118 | 93,584,676 | ||||||||||||||||||||||||||||||
| Outflows, including Distributions (b) |
(1,544,928 | ) | (500,727 | ) | (9,871,709 | ) | (6,514,437 | ) | (18,431,801 | ) | (406,955 | ) | (342,233 | ) | (5,559,483 | ) | (6,372,790 | ) | (12,681,461 | ) | ||||||||||||||||||||
| Realizations (c) |
(14,221,866 | ) | (17,926,238 | ) | (436,973 | ) | (6,673,833 | ) | (39,258,910 | ) | (13,493,163 | ) | (21,016,540 | ) | (554,584 | ) | (7,605,824 | ) | (42,670,111 | ) | ||||||||||||||||||||
|
|
|
|
|
|
|
|
|
|
|
|
|
|
|
|
|
|
|
|
|
|||||||||||||||||||||
| Net Inflows |
1,100,844 | 620,508 | 474,157 | 9,774,555 | 11,970,064 | 16,134,793 | 8,114,924 | 4,926,883 | 9,056,504 | 38,233,104 | ||||||||||||||||||||||||||||||
| Market Appreciation |
4,812,032 | 7,425,320 | 1,540,136 | 4,421,338 | 18,198,826 | 5,072,029 | 4,939,713 | 592,872 | (2,834,212 | ) | 7,770,402 | |||||||||||||||||||||||||||||
|
|
|
|
|
|
|
|
|
|
|
|
|
|
|
|
|
|
|
|
|
|||||||||||||||||||||
| Balance, End of Period (e) |
$ | 100,192,950 | $ | 101,963,652 | $ | 71,119,718 | $ | 93,277,145 | $ | 366,553,465 | $ | 94,280,074 | $ | 93,917,824 | $ | 69,105,425 | $ | 79,081,252 | $ | 336,384,575 | ||||||||||||||||||||
|
|
|
|
|
|
|
|
|
|
|
|
|
|
|
|
|
|
|
|
|
|||||||||||||||||||||
| Increase |
$ | 5,912,876 | $ | 8,045,828 | $ | 2,014,293 | $ | 14,195,893 | $ | 30,168,890 | $ | 21,206,822 | $ | 13,054,637 | $ | 5,519,755 | $ | 6,222,292 | $ | 46,003,506 | ||||||||||||||||||||
| Increase |
6 | % | 9 | % | 3 | % | 18 | % | 9 | % | 29 | % | 16 | % | 9 | % | 9 | % | 16 | % | ||||||||||||||||||||
| Year Ended December 31, | ||||||||||||||||||||
| 2014 | ||||||||||||||||||||
| Private Equity |
Real Estate | Hedge Fund Solutions |
Credit | Total | ||||||||||||||||
| (Dollars in Thousands) | ||||||||||||||||||||
| Total Assets Under Management |
||||||||||||||||||||
| Balance, Beginning of Period |
$ | 65,675,031 | $ | 79,410,788 | $ | 55,657,463 | $ | 65,014,348 | $ | 265,757,630 | ||||||||||
| Inflows, including Commitments (a) |
13,677,363 | 11,080,384 | 11,428,764 | 21,072,694 | 57,259,205 | |||||||||||||||
| Outflows, including Distributions (b) |
(1,624,064 | ) | (896,394 | ) | (5,430,780 | ) | (3,763,200 | ) | (11,714,438 | ) | ||||||||||
| Realizations (c) |
(15,379,066 | ) | (20,389,808 | ) | (416,882 | ) | (9,301,444 | ) | (45,487,200 | ) | ||||||||||
|
|
|
|
|
|
|
|
|
|
|
|||||||||||
| Net Inflows (Outflows) |
(3,325,767 | ) | (10,205,818 | ) | 5,581,102 | 8,008,050 | 57,567 | |||||||||||||
| Market Appreciation (Depreciation) (d)(h) |
10,723,988 | 11,658,217 | 2,347,105 | (163,438 | ) | 24,565,872 | ||||||||||||||
|
|
|
|
|
|
|
|
|
|
|
|||||||||||
| Balance, End of Period (e) |
$ | 73,073,252 | $ | 80,863,187 | $ | 63,585,670 | $ | 72,858,960 | $ | 290,381,069 | ||||||||||
|
|
|
|
|
|
|
|
|
|
|
|||||||||||
| Increase |
$ | 7,398,221 | $ | 1,452,399 | $ | 7,928,207 | $ | 7,844,612 | $ | 24,623,439 | ||||||||||
| Increase |
11 | % | 2 | % | 14 | % | 12 | % | 9 | % | ||||||||||
| (a) | Inflows represent contributions in our hedge funds and closed-end mutual funds, increases in available capital for our carry funds (capital raises, recallable capital and increased side-by-side commitments) and CLOs and increases in the capital we manage pursuant to separately managed account programs. |
| (b) | Outflows represent redemptions in our hedge funds and closed-end mutual funds, client withdrawals from our separately managed account programs and decreases in available capital for our carry funds (expired capital, expense drawdowns and decreased side-by-side commitments). |
| (c) | Realizations represent realizations from the disposition of assets, capital returned to investors from CLOs. |
| (d) | Market appreciation (depreciation) includes realized and unrealized gains (losses) on portfolio investments and the impact of foreign exchange rate fluctuations. |
98
Table of Contents
| (e) | Fee-Earning Assets Under Management and Assets Under Management as of December 31, 2016 included $21.3 million and $44.5 million, respectively, from a joint venture in which we are the minority interest holder. |
| (f) | Represents the annualized current quarter’s Base Management Fee divided by period end Fee-Earning Assets Under Management. |
| (g) | For the year ended December 31, 2016, the impact to Fee-Earning Assets Under Management due to foreign exchange rate fluctuations was $1.0 million, $(463.8) million, $(335.8) million and $(798.5) million for the Private Equity, Real Estate, Credit and Total segments, respectively. For the year ended December 31, 2015, such impact was $(17.0) million, $(642.4) million, $(999.2) million and $(1.7) billion for the Private Equity, Real Estate, Credit and Total segments, respectively. For the year ended December 31, 2014, such impact was $(11.8) million, $(957.4) million, $(1.3) billion and $(2.3) billion for the Private Equity, Real Estate, Credit and Total segments, respectively. |
| (h) | For the year ended December 31, 2016, the impact to Total Assets Under Management due to foreign exchange rate fluctuations was $86.5 million, $(1.4) billion, $(490.4) million and $(1.8) billion for the Private Equity, Real Estate, Credit and Total segments, respectively. For the year ended December 31, 2015, such impact was $(508.1) million, $(1.9) billion, $(1.1) billion and $(3.5) billion for the Private Equity, Real Estate, Credit and Total segments, respectively. For the year ended December 31, 2014, such impact was $(357.1) million, $(2.0) billion, $(1.5) billion and $(3.8) billion for the Private Equity, Real Estate, Credit and Total segments, respectively. |
Fee-Earning Assets Under Management
Fee-Earning Assets Under Management were $277.1 billion at December 31, 2016, an increase of $30.9 billion, or 13%, compared to $246.1 billion at December 31, 2015. The net increase was due to:
| • | Inflows of $68.3 billion related to: |
| • | $28.9 billion in our Private Equity segment primarily due to the commencement of the investment periods of BCP VII and SP VII, which generated inflows of $17.5 billion and $7.3 billion, respectively (these amounts are reflected in Total Assets Under Management at each closing of each respective fund), |
| • | $15.0 billion in our Credit segment driven by $4.8 billion raised due to new CLO launches, $3.3 billion raised from certain other long only strategies, $2.2 billion of capital raised for our BDCs and $1.8 billion raised or invested in our hedge fund strategies, |
| • | $14.2 billion in our Real Estate segment primarily related to $7.2 billion committed in BREP Europe V, $3.2 billion invested across BREDS, $2.5 billion invested in BPP and $755.0 million raised for BREP co-investment, and |
| • | $10.1 billion in our Hedge Fund Solutions segment mainly related to growth in individual investor and specialized solutions of $4.5 billion, customized solutions of $3.1 billion and commingled products of $2.5 billion. |
| • | Market appreciation of $4.9 billion due to: |
| • | $2.8 billion appreciation in our Credit segment due to $2.1 billion in our BDCs, $798.0 million in our hedge fund strategies and $659.6 million from certain long only strategies, partially offset by $335.8 million of foreign exchange depreciation, |
| • | $1.4 billion appreciation in our Hedge Fund Solutions segment due to returns from BAAM’s Principal Solutions Composite of 3.5% gross (2.7% net), and |
| • | $653.9 million in our Real Estate segment primarily due to appreciation of $941.3 million and $248.0 million from BPP and BXMT, respectively, partially offset by $463.8 million of foreign exchange depreciation. |
99
Table of Contents
Offsetting these increases were:
| • | Realizations of $22.4 billion primarily driven by: |
| • | $8.2 billion in our Private Equity segment primarily due to $3.8 billion of realizations from BCP V, $1.7 billion from Strategic Partners, $1.0 billion from BCP VI and $800.9 million from Tactical Opportunities, |
| • | $8.0 billion in our Real Estate segment primarily due to $3.5 billion of realizations across BREP global and European funds (Fee-Earning Assets Under Management only includes the invested capital from funds outside of their investment period while Total Assets Under Management realizations include total proceeds), $2.6 billion of realizations from BREDS and $1.6 billion of realizations from BREP co-investment, and |
| • | $5.8 billion in our Credit segment primarily due to $2.8 billion of capital returned to CLO investors from CLOs that are post their re-investment periods, $1.6 billion of capital returned to investors in drawdown funds and $937.1 million in dividends from BDCs. |
| • | Outflows of $19.8 billion primarily attributable to: |
| • | $9.7 billion in our Hedge Fund Solutions segment, reflecting investors’ liquidity needs and certain strategic shifts in their programs, with outflows of $4.7 billion from individual investor and specialized solutions, $2.7 billion from customized solutions and $2.4 billion from commingled products, |
| • | $4.8 billion in our Credit segment primarily attributable to $1.8 billion from BDCs, $1.6 billion from certain long only strategies and $1.4 billion from hedge fund strategies, |
| • | $3.2 billion in our Private Equity segment primarily due to the end of the investment periods of BCP VI and SP VI, driving outflows of $1.8 billion and $561.4 million, respectively, and |
| • | $2.2 billion in our Real Estate segment primarily due to $2.0 billion of uninvested reserves at the close of BREP Europe IV’s investment period. |
BAAM had net inflows of $824.9 million from January 1 through February 1, 2017.
Fee-Earning Assets Under Management were $246.1 billion at December 31, 2015, an increase of $29.5 billion, or 14%, compared to $216.7 billion at December 31, 2014. The net increase was due to:
| • | Inflows of $68.6 billion related to: |
| • | $27.7 billion in our Real Estate segment primarily related to $15.6 billion raised for BREP VIII, $7.2 billion raised/invested for BPP, $1.5 billion invested for BREP VII post its investment period, $1.1 billion invested for BREDS II and $1.0 billion raised for BXMT, |
| • | $17.3 billion in our Credit segment driven by $4.8 billion raised in CLO launches, $4.8 billion raised in our BDCs, $3.6 billion raised in our drawdown funds and $2.0 billion raised in our Hedge Fund Strategies, |
| • | $13.9 billion in our Private Equity segment primarily due to $5.0 billion raised in Tactical Opportunities, $4.5 billion raised for Blackstone Energy Partners II, $1.0 billion raised from Strategic Partners and $850.3 million of inflows from BTAS, and |
| • | $9.7 billion in our Hedge Fund Solutions segment mainly related to growth in its customized, commingled, and individual investor solutions products, and additional closings on the general partner interests vehicle. |
100
Table of Contents
Offsetting these increases were:
| • | Realizations of $20.5 billion primarily driven by: |
| • | $8.5 billion in our Real Estate segment primarily due to realizations of $4.4 billion in global and European real estate opportunistic funds, $2.6 billion in BREDS and $769.2 million in BREP co investment, |
| • | $6.3 billion in our Credit segment primarily due to $3.8 billion capital returned to CLO investors from CLOs that are post their re-investment periods, $1.4 billion capital returned to investors in drawdown funds and $776.3 million in dividends from BDCs, and |
| • | $5.1 billion in our Private Equity segment primarily due to continued disposition activity across the segment, mainly from BCP V and our Strategic Partners fund of funds. |
| • | Outflows of $16.7 billion primarily attributable to: |
| • | $5.7 billion in our Credit segment, which includes $3.6 billion of redemptions due to investors’ general liquidity needs as well as their paring back in credit investments, |
| • | $5.4 billion in our Hedge Fund Solutions segment primarily due to the liquidity needs of limited partners and certain strategic shifts in their programs, |
| • | $4.2 billion in our Real Estate segment primarily due to $4.0 billion of uninvested reserves at the close of BREP VII’s investment period, and |
| • | $1.4 billion in our Private Equity segment primarily from the end of the investment periods for BEP I and Tactical Opportunities’ initial separately managed accounts, as well as our outflows in our Strategic Partners fund of funds. |
| • | Market depreciation of $1.9 billion principally due to depreciation of $2.4 billion in our Credit segment, partially offset by returns from the BAAM Principal Solutions (“BPS”) Composite funds in our Hedge Fund Solutions segment. The $2.4 billion of depreciation in our Credit segment, which includes $999.2 million of foreign exchange depreciation, is primarily driven by $1.3 billion in market depreciation from our U.S. and Europe CLOs, $613.4 million in market depreciation from our hedge fund strategies and $518.7 million in market depreciation from our BDCs. |
Total Assets Under Management
Total Assets Under Management were $366.6 billion at December 31, 2016, an increase of $30.2 billion, or 9%, compared to $336.4 billion at December 31, 2015. The net increase was due to:
| • | Inflows of $69.7 billion primarily related to: |
| • | $23.0 billion in our Credit segment primarily due to $10.2 billion raised from mezzanine strategies (the majority of which will become Fee-Earning Assets Under Management when it is invested), $4.8 billion raised from CLO launches, $3.4 billion raised in certain other long only strategies, $2.2 billion raised for BDCs and $2.0 billion raised in our hedge fund strategies, |
| • | $19.0 billion in our Real Estate segment attributable to $7.4 billion raised for BREP Europe V, $3.5 billion raised in BREDS III, $2.7 billion raised in core+ real estate funds and $879.1 million in BREP co-investment, |
| • | $16.9 billion in our Private Equity segment primarily related to $8.3 billion raised for Strategic Partners, $3.9 billion raised for core private equity and $2.6 billion raised for Tactical Opportunities, (capital raised is included in Fee-Earning Assets Under Management at the investment period commencement of each fund or at such time indicated in each fund’s limited partnership agreement), and |
| • | $10.8 billion in our Hedge Fund Solutions segment primarily driven by continued platform diversification and growth in customized solutions and individual investor solutions. |
101
Table of Contents
| • | Market appreciation of $18.2 billion due to: |
| • | $7.4 billion appreciation in our Real Estate segment due to a carrying value increase in our opportunistic and core+ real estate funds of 11.1% and 10.9%, respectively, partially offset by $1.4 billion of foreign exchange depreciation, |
| • | $4.8 billion appreciation in our Private Equity segment primarily due to strong fund performance, with an 8.8% overall increase in carrying value, including 10.7% for our Corporate Private Equity funds and 10.9% in Tactical Opportunities, |
| • | $4.4 billion appreciation in our Credit segment due to $2.1 billion in BDCs, $1.1 billion in drawdown funds and $969.6 million in our hedge fund strategies, partially offset by $490.4 million of foreign exchange depreciation, and |
| • | $1.5 billion appreciation in our Hedge Fund Solutions segment primarily due to reasons noted above in Fee-Earning Assets Under Management. |
Offsetting these increases were:
| • | Realizations of $39.3 billion driven by: |
| • | $17.9 billion in our Real Estate segment due to realizations of $12.7 billion across BREP global, European and Asia funds, $2.9 billion within BREP co-investment and $1.9 billion within BREDS, |
| • | $14.2 billion in our Private Equity segment primarily due to continued disposition activity across the segment, mainly $5.3 billion from BCP V fund, $2.1 billion from BCP co-investment, $2.1 billion from BCP VI, $1.9 billion from Strategic Partners funds and $1.3 billion from Tactical Opportunities, and |
| • | $6.7 billion in our Credit segment due to $2.9 billion of realizations from returns to CLO investors, $2.5 billion of realizations from our drawdown funds and $937.1 million from our BDCs. |
| • | Outflows of $18.4 billion primarily attributable to: |
| • | $9.9 billion in our Hedge Fund Solutions segment primarily due to the same reasons in Fee-Earning Assets Under Management above, |
| • | $6.5 billion in our Credit segment primarily due $1.8 billion from BDCs, $1.7 billion from certain long only strategies, $1.5 billion from hedge fund strategies and $1.2 billion from our mezzanine funds, and |
| • | $1.5 billion in our Private Equity segment which includes $804.6 million from Strategic Partners primarily due to expiration of unused commitments. |
Total Assets Under Management were $336.4 billion at December 31, 2015, an increase of $46.0 billion, or 16%, compared to $290.4 billion at December 31, 2014. The net increase was due to:
| • | Inflows of $93.6 billion primarily related to: |
| • | $30.0 billion in our Private Equity segment primarily related to $18.0 billion raised for the seventh private equity fund (the corresponding Fee-Earning Assets Under Management Inflow will occur when the investment period for this fund commences), $7.0 billion raised for Tactical Opportunities, $2.2 billion raised from Strategic Partners and $714.2 million of inflows from BTAS, |
| • | $29.5 billion in our Real Estate segment attributable to $16.0 billion raised for BREP VIII, $6.9 billion raised for BPP, $1.3 billion raised during the initial closing for the third real estate debt strategies fund, $1.0 billion raised for BXMT, and $740.3 million raised for BREP co-investment, |
| • | $23.0 billion in our Credit segment primarily due to $5.0 billion raised from CLO launches, $4.8 billion raised for BDCs, $3.9 billion raised in our energy focused products, $3.6 billion raised in |
102
Table of Contents
| European senior debt strategies, $2.5 billion raised in certain other long only strategies and $2.0 billion raised in hedge fund strategies, and |
| • | $11.0 billion in our Hedge Fund Solutions segment due primarily to the reasons noted above in Fee-Earning Assets Under Management. |
| • | Market appreciation of $7.8 billion due to: |
| • | $5.1 billion appreciation in our Private Equity segment driven by significant returns in funds across the segment, |
| • | $4.9 billion net appreciation in our Real Estate segment driven by sustained strong operating fundamentals in the private portfolio resulting in appreciation of 16.6% offset by public portfolio depreciation of 8.6%, and by $1.9 billion of foreign exchange depreciation, and |
| • | $2.8 billion depreciation in our Credit segment due to reasons noted above in Fee-Earning Asset Under Management, including $1.1 billion attributable to foreign currency depreciation. |
Offsetting these increases were:
| • | Realizations of $42.7 billion driven by: |
| • | $21.0 billion in our Real Estate segment due to realizations across the segment with 78% of realizations generated from the BREP Global and European opportunistic platform, including co-investment, |
| • | $13.5 billion in our Private Equity segment primarily due to continued disposition activity across the segment, mainly from our BCP V fund and Strategic Partners fund of funds, and |
| • | $7.6 billion in our Credit segment due to capital returned to CLO investors from CLOs that are post their reinvestment periods and realizations in our carry funds. |
| • | Outflows of $12.7 billion primarily attributable to: |
| • | $6.4 billion in our Credit segment primarily due to reasons noted above in Fee-Earning Assets Under Management, and |
| • | $5.6 billion in our Hedge Fund Solutions segment due to reasons noted above in Fee-Earning Assets Under Management. |
103
Table of Contents
Limited Partner Capital Invested
The following presents the limited partner capital invested during the respective periods:
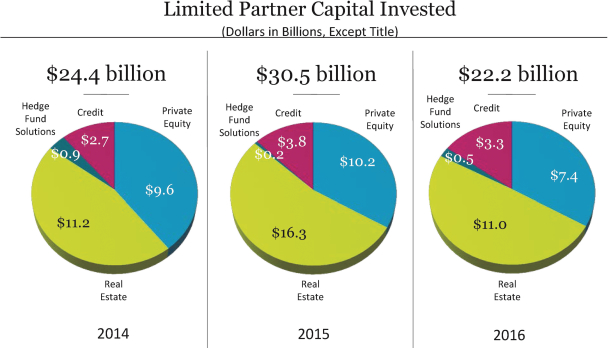
Note: Totals in graph may not add due to rounding.
| Year Ended December 31, | ||||||||||||
| 2014 | 2015 | 2016 | ||||||||||
| Limited Partner Capital Invested |
||||||||||||
| Private Equity |
$ | 9,623,273 | $ | 10,219,178 | $ | 7,443,607 | ||||||
| Real Estate |
11,235,142 | 16,259,362 | 10,969,746 | |||||||||
| Hedge Fund Solutions |
854,128 | 243,241 | 540,343 | |||||||||
| Credit |
2,656,958 | 3,783,265 | 3,254,849 | |||||||||
|
|
|
|
|
|
|
|||||||
| Total |
$ | 24,369,501 | $ | 30,505,046 | $ | 22,208,545 | ||||||
|
|
|
|
|
|
|
|||||||
Limited Partner Capital Invested (Dollars in Billions, Except Title) $24.4 billion $30.5 billion $22.2 billion
104
Table of Contents
The following presents the committed undrawn capital available for investment (“dry powder”) for the respective periods:
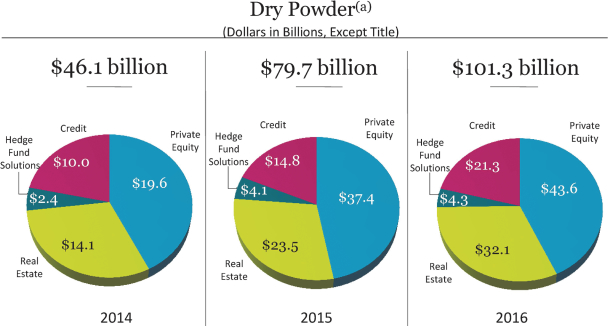
| Note: Totals | may not add due to rounding. Amounts are as of December 31 of each year. |
| (a) | Represents illiquid drawdown funds only; excludes marketable vehicles; includes both Fee-Earning (third party) capital and general partner and employee commitments that do not earn fees. Amounts are reduced by outstanding commitments to invest, but for which capital has not been called. |
| Year Ended December 31, | ||||||||||||
| 2014 | 2015 | 2016 | ||||||||||
| Dry Powder Available for Investment |
||||||||||||
| Private Equity |
$ | 19,605,359 | $ | 37,387,766 | $ | 43,621,447 | ||||||
| Real Estate |
14,139,503 | 23,464,151 | 32,134,990 | |||||||||
| Hedge Fund Solutions |
2,397,158 | 4,066,965 | 4,309,901 | |||||||||
| Credit |
9,999,838 | 14,780,351 | 21,276,719 | |||||||||
|
|
|
|
|
|
|
|||||||
| Total |
$ | 46,141,858 | $ | 79,699,233 | $ | 101,343,057 | ||||||
|
|
|
|
|
|
|
|||||||
Dry Powder(a) (Dollars in Billions, Except Title) $46.1 billion $79.7 billion $101.3 billion
105
Table of Contents
Net Accrued Performance Fees
The following table presents the accrued performance fees, net of performance fee compensation, of the Blackstone Funds as of December 31, 2016 and 2015. Net accrued performance fees presented do not include clawback amounts, if any, which are disclosed in Note 18. “Commitments and Contingencies — Contingencies — Contingent Obligations (Clawback)” in the “Notes to Consolidated Financial Statements” in “— Item 8. Financial Statements and Supplementary Data” of this filing. The net accrued performance fee as of each reporting date is principally unrealized carried interest and incentive fees which, if realized, can be a significant component of Distributable Earnings.
| December 31, | ||||||||
| 2016 | 2015 | |||||||
| (Dollars in Millions) | ||||||||
| Private Equity |
||||||||
| BCP IV Carried Interest |
$ | 186 | $ | 144 | ||||
| BCP V Carried Interest |
323 | 288 | ||||||
| BCP VI Carried Interest |
548 | 359 | ||||||
| BEP I Carried Interest |
71 | 48 | ||||||
| BEP II Carried Interest |
2 | — | ||||||
| Tactical Opportunities Carried Interest |
83 | 52 | ||||||
| BTAS Carried Interest |
17 | 3 | ||||||
| Strategic Partners Carried Interest |
34 | 36 | ||||||
| Other Carried Interest |
4 | 1 | ||||||
|
|
|
|
|
|||||
| Total Private Equity (a) |
1,268 | 931 | ||||||
|
|
|
|
|
|||||
| Real Estate |
||||||||
| BREP IV Carried Interest |
8 | 20 | ||||||
| BREP V Carried Interest |
300 | 497 | ||||||
| BREP VI Carried Interest |
510 | 628 | ||||||
| BREP VII Carried Interest |
504 | 608 | ||||||
| BREP VIII Carried Interest |
143 | 7 | ||||||
| BREP Europe III Carried Interest |
140 | 186 | ||||||
| BREP Europe IV Carried Interest |
184 | 121 | ||||||
| BREP Asia Carried Interest |
79 | 54 | ||||||
| BPP Carried Interest |
57 | 28 | ||||||
| BPP Incentive Fees |
34 | 12 | ||||||
| BREDS Carried Interest |
16 | 12 | ||||||
| BREDS Incentive Fees |
4 | 6 | ||||||
| Asia Platform Incentive Fees |
7 | 7 | ||||||
|
|
|
|
|
|||||
| Total Real Estate (a) |
1,986 | 2,186 | ||||||
|
|
|
|
|
|||||
| Hedge Fund Solutions |
||||||||
| Incentive Fees |
24 | 38 | ||||||
|
|
|
|
|
|||||
| Total Hedge Fund Solutions |
24 | 38 | ||||||
|
|
|
|
|
|||||
| Credit |
||||||||
| Carried Interest |
168 | 77 | ||||||
| Incentive Fees |
24 | 19 | ||||||
|
|
|
|
|
|||||
| Total Credit |
192 | 96 | ||||||
|
|
|
|
|
|||||
| Total Blackstone |
||||||||
| Carried Interest |
3,377 | 3,169 | ||||||
| Incentive Fees |
93 | 82 | ||||||
|
|
|
|
|
|||||
| Net Accrued Performance Fees |
$ | 3,470 | $ | 3,251 | ||||
|
|
|
|
|
|||||
106
Table of Contents
| (a) | Private Equity and Real Estate include Co-Investments. |
Performance Fee Eligible Assets Under Management
The following represents invested and to be invested capital, including closed commitments for funds whose investment period has not yet commenced, on which performance fees could be earned if certain hurdles are met:
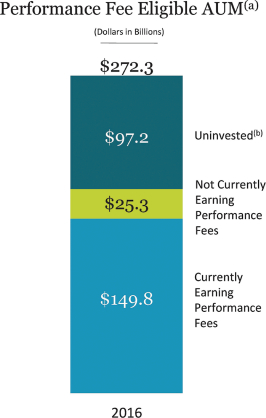
Note: Totals may not add due to rounding. Amounts are as of December 31.
| (a) | Represents invested and to be invested capital at fair value, including closed commitments for funds whose investment period has not yet commenced, on which performance fees could be earned if certain hurdles are met. |
| (b) | Represents dry powder exclusive of non-fee earning general partner and employee commitments. |
Investment Record
Fund returns information for our significant funds is included throughout this discussion and analysis to facilitate an understanding of our results of operations for the periods presented. The fund returns information reflected in this discussion and analysis is not indicative of the financial performance of The Blackstone Group L.P. and is also not necessarily indicative of the future performance of any particular fund. An investment in The Blackstone Group L.P. is not an investment in any of our funds. There can be no assurance that any of our funds or our other existing and future funds will achieve similar returns.
Performance Fee Eligible AUM(a) (Dollars in Billions)
107
Table of Contents
The following table presents the investment record of our significant drawdown funds from inception through December 31, 2016:
| Unrealized Investments | Realized Investments | Total Investments | Net IRRs (c) | |||||||||||||||||||||||||||||||||||||||||
| Fund (Investment Period) |
Committed Capital |
Available Capital (a) |
Value | MOIC (b) | % Public | Value | MOIC (b) | Value | MOIC (b) | Realized | Total | |||||||||||||||||||||||||||||||||
| (Dollars in Thousands, Except Where Noted) | ||||||||||||||||||||||||||||||||||||||||||||
| Private Equity |
||||||||||||||||||||||||||||||||||||||||||||
| BCP I (Oct 1987 / Oct 1993) |
$ | 859,081 | $ | — | $ | — | N/A | — | $ | 1,741,738 | 2.6x | $ | 1,741,738 | 2.6x | 19 | % | 19 | % | ||||||||||||||||||||||||||
| BCP II (Oct 1993 / Aug 1997) |
1,361,100 | — | — | N/A | — | 3,256,819 | 2.5x | 3,256,819 | 2.5x | 32 | % | 32 | % | |||||||||||||||||||||||||||||||
| BCP III (Aug 1997 / Nov 2002) |
3,967,422 | — | — | N/A | — | 9,184,688 | 2.3x | 9,184,688 | 2.3x | 14 | % | 14 | % | |||||||||||||||||||||||||||||||
| BCOM (Jun 2000 / Jun 2006) |
2,137,330 | 24,575 | 22,632 | 1.8x | — | 2,951,018 | 1.4x | 2,973,650 | 1.4x | 6 | % | 6 | % | |||||||||||||||||||||||||||||||
| BCP IV (Nov 2002 / Dec 2005) |
6,773,182 | 216,926 | 1,460,777 | 1.3x | 46 | % | 19,952,530 | 3.1x | 21,413,307 | 2.8x | 41 | % | 36 | % | ||||||||||||||||||||||||||||||
| BCP V (Dec 2005 / Jan 2011) |
21,017,433 | 1,253,663 | 5,957,077 | 1.7x | 72 | % | 31,821,687 | 1.9x | 37,778,764 | 1.9x | 9 | % | 8 | % | ||||||||||||||||||||||||||||||
| BCP VI (Jan 2011 / May 2016) |
15,189,353 | 1,776,532 | 15,854,868 | 1.4x | 22 | % | 3,942,475 | 1.8x | 19,797,343 | 1.5x | 32 | % | 11 | % | ||||||||||||||||||||||||||||||
| BEP I (Aug 2011 / Feb 2015) |
2,436,078 | 187,672 | 2,659,738 | 1.4x | 29 | % | 829,913 | 1.9x | 3,489,651 | 1.5x | 42 | % | 13 | % | ||||||||||||||||||||||||||||||
| BEP II (Feb 2015 / Feb 2021) |
4,951,351 | 4,089,146 | 641,600 | 1.4x | — | — | N/A | 641,600 | 1.4x | N/A | 36 | % | ||||||||||||||||||||||||||||||||
| BCP VII (May 2016 / May 2022) |
18,898,630 | 18,254,809 | 370,284 | 1.1x | — | — | N/A | 370,284 | 1.1x | N/A | N/M | |||||||||||||||||||||||||||||||||
|
|
|
|
|
|
|
|
|
|
|
|
|
|
|
|
|
|
|
|
|
|
|
|||||||||||||||||||||||
| Total Corporate Private Equity |
$ | 77,590,960 | $ | 25,803,323 | $ | 26,966,976 | 1.4x | 34 | % | $ | 73,680,868 | 2.2x | $ | 100,647,844 | 1.9x | 18 | % | 15 | % | |||||||||||||||||||||||||
|
|
|
|
|
|
|
|
|
|
|
|
|
|
|
|
|
|
|
|
|
|
|
|||||||||||||||||||||||
| Tactical Opportunities |
13,447,861 | 6,215,643 | 7,824,565 | 1.2x | 6 | % | 2,247,290 | 1.5x | 10,071,855 | 1.2x | 26 | % | 11 | % | ||||||||||||||||||||||||||||||
| Tactical Opportunities Co-Investment and Other |
2,873,160 | 1,056,397 | 1,752,248 | 1.1x | — | 308,807 | 1.4x | 2,061,055 | 1.1x | N/A | 9 | % | ||||||||||||||||||||||||||||||||
| Strategic Partners I-V and Co-Investment (d) |
12,143,335 | 2,018,981 | 3,120,054 | N/M | — | 14,058,294 | N/M | 17,178,348 | 1.5x | N/A | 13 | % | ||||||||||||||||||||||||||||||||
| Strategic Partners VI LBO, RE and SMA (d) |
7,402,171 | 2,505,871 | 3,532,679 | N/M | — | 1,009,080 | N/M | 4,541,759 | 1.3x | N/A | 24 | % | ||||||||||||||||||||||||||||||||
| Strategic Partners VII (d) |
7,489,970 | 6,822,033 | 374,012 | N/M | — | — | N/A | 374,012 | 1.0x | N/A | N/M | |||||||||||||||||||||||||||||||||
| BCEP (e) |
3,871,770 | 3,871,770 | — | N/A | — | — | N/A | — | N/A | N/A | N/A | |||||||||||||||||||||||||||||||||
| Other Funds and Co-Investment (f) |
1,799,293 | 760,624 | 45,093 | 0.9x | 77 | % | 618,429 | 1.0x | 663,522 | 1.0x | N/M | N/M | ||||||||||||||||||||||||||||||||
| Real Estate |
||||||||||||||||||||||||||||||||||||||||||||
| Dollar |
||||||||||||||||||||||||||||||||||||||||||||
| Pre-BREP |
$ | 140,714 | $ | — | $ | — | N/A | — | $ | 345,190 | 2.5x | $ | 345,190 | 2.5x | 33 | % | 33 | % | ||||||||||||||||||||||||||
| BREP I (Sep 1994 / Oct 1996) |
380,708 | — | — | N/A | — | 1,327,708 | 2.8x | 1,327,708 | 2.8x | 40 | % | 40 | % | |||||||||||||||||||||||||||||||
| BREP II (Oct 1996 / Mar 1999) |
1,198,339 | — | — | N/A | — | 2,531,614 | 2.1x | 2,531,614 | 2.1x | 19 | % | 19 | % | |||||||||||||||||||||||||||||||
| BREP III (Apr 1999 / Apr 2003) |
1,522,708 | — | — | N/A | — | 3,330,406 | 2.4x | 3,330,406 | 2.4x | 21 | % | 21 | % | |||||||||||||||||||||||||||||||
| BREP IV (Apr 2003 / Dec 2005) |
2,198,694 | — | 374,698 | 0.5x | 28 | % | 4,160,509 | 2.2x | 4,535,207 | 1.7x | 31 | % | 12 | % | ||||||||||||||||||||||||||||||
| BREP V (Dec 2005 / Feb 2007) |
5,539,418 | — | 2,771,759 | 2.2x | 24 | % | 10,308,751 | 2.3x | 13,080,510 | 2.3x | 12 | % | 11 | % | ||||||||||||||||||||||||||||||
| BREP VI (Feb 2007 / Aug 2011) |
11,060,444 | 554,233 | 6,109,036 | 2.4x | 68 | % | 20,486,220 | 2.4x | 26,595,256 | 2.4x | 14 | % | 13 | % | ||||||||||||||||||||||||||||||
| BREP VII (Aug 2011 / Apr 2015) |
13,493,022 | 2,291,266 | 14,296,739 | 1.6x | — | 10,966,655 | 1.9x | 25,263,394 | 1.7x | 29 | % | 19 | % | |||||||||||||||||||||||||||||||
| BREP VIII (Apr 2015 / Oct 2020) |
16,152,228 | 10,654,202 | 7,015,649 | 1.3x | 1 | % | 1,753,982 | 1.2x | 8,769,631 | 1.3x | 17 | % | 19 | % | ||||||||||||||||||||||||||||||
|
|
|
|
|
|
|
|
|
|
|
|
|
|
|
|
|
|
|
|
|
|
|
|||||||||||||||||||||||
| Total Global BREP |
$ | 51,686,275 | $ | 13,499,701 | $ | 30,567,881 | 1.6x | 16 | % | $ | 55,211,035 | 2.2x | $ | 85,778,916 | 1.9x | 20 | % | 16 | % | |||||||||||||||||||||||||
|
|
|
|
|
|
|
|
|
|
|
|
|
|
|
|
|
|
|
|
|
|
|
|||||||||||||||||||||||
| Euro |
||||||||||||||||||||||||||||||||||||||||||||
| BREP Int’l (Jan 2001 / Sep 2005) |
€ | 824,172 | € | — | € | — | N/A | — | € | 1,369,016 | 2.1x | € | 1,369,016 | 2.1x | 23 | % | 23 | % | ||||||||||||||||||||||||||
| BREP Int’l II (Sep 2005 / Jun 2008) |
1,629,748 | — | 577,893 | 1.3x | 70 | % | 1,772,031 | 1.9x | 2,349,924 | 1.7x | 8 | % | 6 | % | ||||||||||||||||||||||||||||||
| BREP Europe III (Jun 2008 / Sep 2013) |
3,205,140 | 476,226 | 2,847,028 | 1.8x | — | 2,920,752 | 2.2x | 5,767,780 | 2.0x | 23 | % | 16 | % | |||||||||||||||||||||||||||||||
| BREP Europe IV (Sep 2013 / Dec 2016) |
6,726,403 | 1,677,028 | 7,449,000 | 1.4x | 3 | % | 893,829 | 1.5x | 8,342,829 | 1.4x | 24 | % | 14 | % | ||||||||||||||||||||||||||||||
| BREP Europe V (Dec 2016 / Jun 2022) |
6,588,051 | 6,688,769 | 133,800 | 1.0x | — | — | N/A | 133,800 | 1.0x | N/A | N/A | |||||||||||||||||||||||||||||||||
|
|
|
|
|
|
|
|
|
|
|
|
|
|
|
|
|
|
|
|
|
|
|
|||||||||||||||||||||||
| Total Euro BREP |
€ | 18,973,514 | € | 8,842,023 | € | 11,007,721 | 1.4x | 6 | % | € | 6,955,628 | 2.0x | € | 17,963,349 | 1.6x | 16 | % | 13 | % | |||||||||||||||||||||||||
|
|
|
|
|
|
|
|
|
|
|
|
|
|
|
|
|
|
|
|
|
|
|
|||||||||||||||||||||||
| BREP Co-Investment (g) |
$ | 6,819,065 | $ | 146,573 | $ | 3,997,959 | 1.8x | 40 | % | $ | 9,162,086 | 2.1x | $ | 13,160,045 | 2.0x | 17 | % | 16 | % | |||||||||||||||||||||||||
| BREP Asia (Jun 2013 / Dec 2017) |
5,084,905 | 3,054,509 | 2,931,392 | 1.4x | 1 | % | 1,373,173 | 1.6x | 4,304,565 | 1.5x | 17 | % | 17 | % | ||||||||||||||||||||||||||||||
|
|
|
|
|
|
|
|
|
|
|
|
|
|
|
|
|
|
|
|
|
|
|
|||||||||||||||||||||||
| Total BREP |
$ | 86,954,232 | $ | 25,999,938 | $ | 51,144,228 | 1.5x | 15 | % | $ | 74,961,402 | 2.1x | $ | 126,105,630 | 1.8x | 19 | % | 16 | % | |||||||||||||||||||||||||
|
|
|
|
|
|
|
|
|
|
|
|
|
|
|
|
|
|
|
|
|
|
|
|||||||||||||||||||||||
| BPP (h) |
$ | 13,027,535 | $ | 2,394,321 | $ | 12,533,099 | 1.2x | — | $ | 107,286 | 1.9x | $ | 12,640,385 | 1.2x | 36 | % | 13 | % | ||||||||||||||||||||||||||
| BREDS (i) |
$ | 11,576,788 | $ | 6,996,094 | $ | 2,352,803 | 1.2x | — | $ | 6,632,401 | 1.3x | $ | 8,985,204 | 1.3x | 13 | % | 11 | % | ||||||||||||||||||||||||||
| Hedge Fund Solutions |
||||||||||||||||||||||||||||||||||||||||||||
| BSCH (Dec 2013 / Jun 2020) (j) |
$ | 3,300,600 | $ | 2,630,702 | $ | 677,437 | 1.0x | — | $ | 88,515 | N/A | $ | 765,952 | 1.2x | N/A | 3 | % | |||||||||||||||||||||||||||
| BSCH Co-Investment |
75,500 | 31,237 | 44,495 | 1.0x | — | 1,427 | N/A | 45,922 | 1.0x | N/A | 0 | % | ||||||||||||||||||||||||||||||||
|
|
|
|
|
|
|
|
|
|
|
|
|
|
|
|
|
|
|
|
|
|
|
|||||||||||||||||||||||
| Total Hedge Fund Solutions |
$ | 3,376,100 | $ | 2,661,939 | $ | 721,932 | 1.0x | — | $ | 89,942 | N/A | $ | 811,874 | 1.2x | N/A | 2 | % | |||||||||||||||||||||||||||
|
|
|
|
|
|
|
|
|
|
|
|
|
|
|
|
|
|
|
|
|
|
|
|||||||||||||||||||||||
continued ...
108
Table of Contents
| Unrealized Investments | Realized Investments | Total Investments | Net IRRs (c) | |||||||||||||||||||||||||||||||||||||||||
| Fund (Investment Period) |
Committed Capital |
Available Capital (a) |
Value | MOIC (b) | % Public | Value | MOIC (b) | Value | MOIC (b) | Realized | Total | |||||||||||||||||||||||||||||||||
| (Dollars in Thousands, Except Where Noted) | ||||||||||||||||||||||||||||||||||||||||||||
| Credit (k) |
||||||||||||||||||||||||||||||||||||||||||||
| Dollar |
||||||||||||||||||||||||||||||||||||||||||||
| Mezzanine I (Jul 2007 / Oct 2011) |
$ | 2,000,000 | $ | 99,280 | $ | 194,993 | 1.4x | — | $ | 4,635,213 | 1.6x | $ | 4,830,206 | 1.6x | N/A | 17 | % | |||||||||||||||||||||||||||
| Mezzanine II (Nov 2011 / Nov 2016) |
4,120,000 | 990,002 | 3,354,761 | 1.1x | — | 2,177,780 | 1.5x | 5,532,541 | 1.2x | N/A | 13 | % | ||||||||||||||||||||||||||||||||
| Mezzanine III (Sep 2016 / Sep 2021) |
6,639,133 | 6,331,744 | 316,601 | 1.0x | — | — | N/A | 316,601 | 1.0x | N/A | N/M | |||||||||||||||||||||||||||||||||
| Rescue Lending I (Sep 2009 / May 2013) |
3,253,143 | 400,900 | 1,096,764 | 1.1x | — | 4,826,251 | 1.5x | 5,923,015 | 1.4x | N/A | 11 | % | ||||||||||||||||||||||||||||||||
| Rescue Lending II (Jun 2013 / Jun 2018) |
5,125,000 | 2,072,032 | 3,703,422 | 1.2x | — | 551,534 | 1.2x | 4,254,956 | 1.2x | N/A | 18 | % | ||||||||||||||||||||||||||||||||
| Energy Select Opportunities (Nov 2015 / Nov 2018) |
2,856,866 | 2,541,537 | 438,805 | 1.2x | — | 158,347 | 1.6x | 597,152 | 1.3x | N/A | 36 | % | ||||||||||||||||||||||||||||||||
| Euro |
||||||||||||||||||||||||||||||||||||||||||||
| European Senior Debt Fund (Feb 2015 / Feb 2018) |
€ | 1,964,689 | € | 2,960,224 | € | 855,997 | 1.0x | — | € | 142,288 | 1.2x | € | 998,285 | 1.0x | N/A | 0 | % | |||||||||||||||||||||||||||
|
|
|
|
|
|
|
|
|
|
|
|
|
|
|
|
|
|
|
|
|
|
|
|||||||||||||||||||||||
| Total Credit |
$ | 26,260,552 | $ | 15,567,412 | $ | 10,011,237 | 1.1x | — | $ | 12,506,594 | 1.5x | $ | 22,517,831 | 1.3x | N/A | 14 | % | |||||||||||||||||||||||||||
|
|
|
|
|
|
|
|
|
|
|
|
|
|
|
|
|
|
|
|
|
|
|
|||||||||||||||||||||||
| N/M | Not meaningful. |
| N/A | Not applicable. |
| (a) | Available Capital represents total investable capital commitments, including side-by-side, adjusted for certain expenses and expired or recallable capital and may include leverage, less invested capital. This amount is not reduced by outstanding commitments to investments. |
| (b) | Multiple of Invested Capital (“MOIC”) represents carrying value, before management fees, expenses and Carried Interest, divided by invested capital. |
| (c) | Net Internal Rate of Return (“IRR”) represents the annualized inception to December 31, 2016 IRR on total invested capital based on realized proceeds and unrealized value, as applicable, after management fees, expenses and Carried Interest. |
| (d) | Realizations are treated as return of capital until fully recovered and therefore unrealized and realized MOICs are not meaningful. |
| (e) | BCEP, or Blackstone Core Equity Partners, is a core private equity fund which invests with a more modest risk profile and longer hold period. |
| (f) | Returns for Other Funds and Co-Investment are not meaningful as these funds have limited transaction activity. |
| (g) | BREP Co-Investment represents co-investment capital raised for various BREP investments. The Net IRR reflected is calculated by aggregating each co-investment’s realized proceeds and unrealized value, as applicable, after management fees, expenses and Carried Interest. |
| (h) | BPP represents the core+ real estate funds which invest with a more modest risk profile and lower leverage. |
| (i) | Excludes Capital Trust drawdown funds. |
| (j) | BSCH, or Blackstone Strategic Capital Holdings, is a permanent capital vehicle focused on acquiring strategic minority positions in alternative asset managers. |
| (k) | Funds presented represent the flagship credit drawdown funds only. The Total Credit Net IRR is the combined IRR of the seven credit drawdown funds presented. |
109
Table of Contents
Segment Analysis
Discussed below is our EI for each of our segments. This information is reflected in the manner utilized by our senior management to make operating decisions, assess performance and allocate resources. References to “our” sectors or investments may also refer to portfolio companies and investments of the underlying funds that we manage.
For segment reporting purposes, revenues and expenses are presented on a basis that deconsolidates the investment funds we manage. As a result, segment revenues are greater than those presented on a consolidated GAAP basis because fund management fees recognized in certain segments are received from the Blackstone Funds and eliminated in consolidation when presented on a consolidated GAAP basis. Furthermore, segment expenses are lower than related amounts presented on a consolidated GAAP basis due to the exclusion of fund expenses that are paid by Limited Partners and the elimination of non-controlling interests.
110
Table of Contents
Private Equity
The following table presents the results of operations for our Private Equity segment:
| Year Ended December 31, | 2016 vs. 2015 | 2015 vs. 2014 | ||||||||||||||||||||||||||
| 2016 | 2015 | 2014 | $ | % | $ | % | ||||||||||||||||||||||
| (Dollars in Thousands) | ||||||||||||||||||||||||||||
| Segment Revenues |
||||||||||||||||||||||||||||
| Management Fees, Net |
||||||||||||||||||||||||||||
| Base Management Fees |
$ | 554,134 | $ | 502,640 | $ | 415,841 | $ | 51,494 | 10 | % | $ | 86,799 | 21 | % | ||||||||||||||
| Advisory Fees |
3,207 | 10,561 | 21,903 | (7,354 | ) | -70 | % | (11,342 | ) | -52 | % | |||||||||||||||||
| Transaction and Other Fees, Net |
38,666 | 36,258 | 135,718 | 2,408 | 7 | % | (99,460 | ) | -73 | % | ||||||||||||||||||
| Management Fee Offsets |
(34,810 | ) | (36,760 | ) | (19,146 | ) | 1,950 | -5 | % | (17,614 | ) | 92 | % | |||||||||||||||
|
|
|
|
|
|
|
|
|
|
|
|
|
|
|
|||||||||||||||
| Total Management Fees, Net |
561,197 | 512,699 | 554,316 | 48,498 | 9 | % | (41,617 | ) | -8 | % | ||||||||||||||||||
|
|
|
|
|
|
|
|
|
|
|
|
|
|
|
|||||||||||||||
| Performance Fees |
||||||||||||||||||||||||||||
| Realized |
||||||||||||||||||||||||||||
| Carried Interest |
245,268 | 1,474,987 | 754,402 | (1,229,719 | ) | -83 | % | 720,585 | 96 | % | ||||||||||||||||||
| Unrealized |
||||||||||||||||||||||||||||
| Carried Interest |
424,781 | (717,955 | ) | 1,222,828 | 1,142,736 | N/M | (1,940,783 | ) | N/M | |||||||||||||||||||
|
|
|
|
|
|
|
|
|
|
|
|
|
|
|
|||||||||||||||
| Total Performance Fees |
670,049 | 757,032 | 1,977,230 | (86,983 | ) | -11 | % | (1,220,198 | ) | -62 | % | |||||||||||||||||
|
|
|
|
|
|
|
|
|
|
|
|
|
|
|
|||||||||||||||
| Investment Income (Loss) |
||||||||||||||||||||||||||||
| Realized |
73,377 | 189,649 | 202,719 | (116,272 | ) | -61 | % | (13,070 | ) | -6 | % | |||||||||||||||||
| Unrealized |
(4,843 | ) | (116,338 | ) | (23,914 | ) | 111,495 | -96 | % | (92,424 | ) | 386 | % | |||||||||||||||
|
|
|
|
|
|
|
|
|
|
|
|
|
|
|
|||||||||||||||
| Total Investment Income |
68,534 | 73,311 | 178,805 | (4,777 | ) | -7 | % | (105,494 | ) | -59 | % | |||||||||||||||||
| Interest and Dividend Revenue |
40,271 | 33,218 | 21,993 | 7,053 | 21 | % | 11,225 | 51 | % | |||||||||||||||||||
| Other |
20,458 | 5,854 | 6,569 | 14,604 | 249 | % | (715 | ) | -11 | % | ||||||||||||||||||
|
|
|
|
|
|
|
|
|
|
|
|
|
|
|
|||||||||||||||
| Total Revenues |
1,360,509 | 1,382,114 | 2,738,913 | (21,605 | ) | -2 | % | (1,356,799 | ) | -50 | % | |||||||||||||||||
|
|
|
|
|
|
|
|
|
|
|
|
|
|
|
|||||||||||||||
| Expenses |
||||||||||||||||||||||||||||
| Compensation and Benefits |
||||||||||||||||||||||||||||
| Compensation |
310,457 | 280,248 | 280,499 | 30,209 | 11 | % | (251 | ) | -0 | % | ||||||||||||||||||
| Performance Fee Compensation |
||||||||||||||||||||||||||||
| Realized |
||||||||||||||||||||||||||||
| Carried Interest |
110,882 | 256,922 | 266,393 | (146,040 | ) | -57 | % | (9,471 | ) | -4 | % | |||||||||||||||||
| Unrealized |
||||||||||||||||||||||||||||
| Carried Interest |
163,937 | (10,172 | ) | 210,446 | 174,109 | N/M | (220,618 | ) | N/M | |||||||||||||||||||
|
|
|
|
|
|
|
|
|
|
|
|
|
|
|
|||||||||||||||
| Total Compensation and Benefits |
585,276 | 526,998 | 757,338 | 58,278 | 11 | % | (230,340 | ) | -30 | % | ||||||||||||||||||
| Other Operating Expenses |
196,433 | 199,158 | 143,562 | (2,725 | ) | -1 | % | 55,596 | 39 | % | ||||||||||||||||||
|
|
|
|
|
|
|
|
|
|
|
|
|
|
|
|||||||||||||||
| Total Expenses |
781,709 | 726,156 | 900,900 | 55,553 | 8 | % | (174,744 | ) | -19 | % | ||||||||||||||||||
|
|
|
|
|
|
|
|
|
|
|
|
|
|
|
|||||||||||||||
| Economic Income |
$ | 578,800 | $ | 655,958 | $ | 1,838,013 | $ | (77,158 | ) | -12 | % | $ | (1,182,055 | ) | -64 | % | ||||||||||||
|
|
|
|
|
|
|
|
|
|
|
|
|
|
|
|||||||||||||||
| N/M | Not meaningful. |
111
Table of Contents
Year Ended December 31, 2016 Compared to Year Ended December 31, 2015
Revenues
Revenues were $1.4 billion for the year ended December 31, 2016, a decrease of $21.6 million compared to $1.4 billion for the year ended December 31, 2015. The decrease in revenues was attributable to a decrease in Performance Fees of $87.0 million, partially offset by an increase in Total Management Fees, Net of $48.5 million.
Revenues in our Private Equity segment in 2016 were moderately lower compared to 2015, primarily driven by lower Performance Fees from BCP V as a result of modestly lower appreciation and significant realizations in the year. Although BCP V remained below its accumulated preferred return on a realized basis for a substantial part of 2016, subsequent to the end of the fourth quarter, it made up this shortfall and returned to generating realized carried interest. The market environment in 2016 was and in early 2017 continues to be generally characterized by high prices and as a result, the market for new investments remains challenging, although in 2016 our Private Equity funds were able to take advantage of market dislocation to deploy significant capital, particularly in energy investments. Our portfolio companies continue to operate in a stable, if slow growing, economic environment characterized by uncertainty surrounding governmental and tax policy. Revenues in the Private Equity segment would likely be negatively impacted if the identification of capital deployment opportunities remained challenging, the capital markets experienced another period of volatility, including as a result of uncertainty regarding governmental and tax policy, or market and/or macroeconomic conditions were to deteriorate.
Performance Fees, which are determined on a fund by fund basis, were $670.0 million for the year ended December 31, 2016, a decrease of $87.0 million, compared to $757.0 million for the year ended December 31, 2015, principally due to lower appreciation in BCP V compared to 2015, partially offset by greater appreciation in our BCP VI and BCP IV funds.
Total Management Fees were $561.2 million for the year ended December 31, 2016, an increase of $48.5 million compared to $512.7 million for the year ended December 31, 2015, driven primarily by an increase in Base Management Fees. Base Management Fees were $554.1 million for the year ended December 31, 2016, an increase of $51.5 million compared to $502.6 million for the year ended December 31, 2015, primarily due to the addition of Fee-Earning Assets Under Management across the segment.
The Annualized Base Management Fee Rate decreased from 1.12% at December 31, 2015 to 0.93% at December 31, 2016. The decrease was primarily due to lower fees from BCP VI as a result of the end of its investment period in the second quarter of 2016 and a six month fee holiday for BCP VII, which commenced its investment period in 2016.
Expenses
Expenses were $781.7 million for the year ended December 31, 2016, an increase of $55.6 million, compared to $726.2 million for the year ended December 31, 2015. The increase was primarily attributable to increases in Compensation and Performance Fee Compensation of $30.2 million and $28.1 million, respectively. Compensation increased primarily due to the increase in Management Fee Revenue, on which a portion of compensation is based, as well as an increase in headcount to support the growth of the business. The increase in Performance Fee Compensation was the result of an increase in Performance Fees Revenues from funds with a higher, more normalized compensation ratio.
Year Ended December 31, 2015 Compared to Year Ended December 31, 2014
Revenues
Revenues were $1.4 billion for the year ended December 31, 2015, a decrease of $1.4 billion compared to $2.7 billion for the year ended December 31, 2014. The decrease in revenues was attributable to decreases in Performance Fees, Investment Income, and Total Management Fees, Net of $1.2 billion, $105.5 million and $41.6 million, respectively.
112
Table of Contents
Performance Fees, which are determined on a fund by fund basis, were $757.0 million for the year ended December 31, 2015, a decrease of $1.2 billion, compared to $2.0 billion for the year ended December 31, 2014, principally due to the performance in our corporate private equity funds, which generated overall solid net performance which was, however, lower than the net returns in 2014. The returns in these funds were driven by strong operating performance across most of our private and public portfolios.
Investment Income was $73.3 million for the year ended December 31, 2015, a decrease of $105.5 million, compared to $178.8 million for the year ended December 31, 2014, primarily due to our BCP V and BCP VI funds which generated strong net returns of 8.1% and 7.9%, respectively, for the year, but were slightly lower than the returns generated in the full year 2014 mainly as a result of the lower returns in our public portfolio.
Total Management Fees were $512.7 million for the year ended December 31, 2015, a decrease of $41.6 million compared to $554.3 million for the year ended December 31, 2014, driven primarily by decreases in Transaction and Other Fees, Net and Management Fee Offsets, partially offset by an increase in Base Management Fees. Transaction and Other Fees were $36.3 million for the year ended December 31, 2015, a decrease of $99.5 million compared to $135.7 million for the year ended December 31, 2014, primarily due to the timing of investment closings and the elimination of monitoring fee termination payments. Management Fee Offsets were $(36.8) million for the year ended December 31, 2015, a decrease of $17.6 million compared to $(19.1) million for the year ended December 31, 2014, primarily due to the increased offset rates in recent funds. Base Management Fees were $502.6 million for the year ended December 31, 2015, an increase of $86.8 million compared to $415.8 million for the year ended December 31, 2014, primarily due to the increase in the funds raised for Tactical Opportunities and Strategic Partners.
The Annualized Base Management Fee Rate increased from 0.96% at December 31, 2014 to 1.12% at December 31, 2015. The increase was primarily due to the equalization of Base Management Fees for BTAS in the fourth quarter of 2015 whereby, pursuant to the terms of the applicable fund agreements, limited partners coming into the fund were retroactively charged Base Management Fees back to the inception of the fund.
Expenses
Expenses were $726.2 million for the year ended December 31, 2015, a decrease of $174.7 million, compared to $900.9 million for the year ended December 31, 2014. The decrease was primarily attributable to a decrease of $230.1 million in Performance Fee Compensation, slightly offset by a $55.6 million increase in Other Operating Expenses. Performance Fee Compensation decreased as a result of the decrease in Performance Fees Revenue. The increase in Other Operating Expenses was primarily due to non-recurring costs related to the SEC settlement, an increase in interest allocated to the segment and certain one-time costs associated with fundraising.
Fund Returns
Fund returns information for our significant funds is included throughout this discussion and analysis to facilitate an understanding of our results of operations for the periods presented. The fund returns information reflected in this discussion and analysis is not indicative of the financial performance of The Blackstone Group L.P. and is also not necessarily indicative of the future performance of any particular fund. An investment in The Blackstone Group L.P. is not an investment in any of our funds. There can be no assurance that any of our funds or our other existing and future funds will achieve similar returns.
113
Table of Contents
The following table presents the internal rates of return of our significant private equity funds:
| Year Ended December 31, | December 31, 2016 Inception to Date |
|||||||||||||||||||||||||||||||||||||||
| 2016 | 2015 | 2014 | Realized | Total | ||||||||||||||||||||||||||||||||||||
| Fund (a) |
Gross | Net | Gross | Net | Gross | Net | Gross | Net | Gross | Net | ||||||||||||||||||||||||||||||
| BCP IV |
22 | % | 19 | % | -6 | % | -6 | % | -4 | % | -2 | % | 55 | % | 41 | % | 50 | % | 36 | % | ||||||||||||||||||||
| BCP V |
9 | % | 7 | % | 11 | % | 8 | % | 35 | % | 24 | % | 11 | % | 9 | % | 10 | % | 8 | % | ||||||||||||||||||||
| BCOM |
18 | % | 16 | % | 50 | % | 49 | % | 12 | % | 20 | % | 13 | % | 6 | % | 13 | % | 6 | % | ||||||||||||||||||||
| BCP VI |
12 | % | 9 | % | 11 | % | 8 | % | 24 | % | 18 | % | 42 | % | 32 | % | 17 | % | 11 | % | ||||||||||||||||||||
| BEP I |
9 | % | 7 | % | -5 | % | -4 | % | 15 | % | 12 | % | 44 | % | 42 | % | 17 | % | 13 | % | ||||||||||||||||||||
| BEP II (b) |
93 | % | 51 | % | N/M | N/M | N/A | N/A | N/A | N/A | 90 | % | 36 | % | ||||||||||||||||||||||||||
| Tactical Opportunities |
12 | % | 9 | % | 12 | % | 8 | % | 22 | % | 17 | % | 34 | % | 26 | % | 14 | % | 11 | % | ||||||||||||||||||||
| Strategic Partners |
1 | % | — | 22 | % | 19 | % | 24 | % | 20 | % | N/A | N/A | 17 | % | 14 | % | |||||||||||||||||||||||
The returns presented herein represent those of the applicable Blackstone Funds and not those of The Blackstone Group L.P.
| N/M | Not meaningful. |
| N/A | Not applicable. |
| (a) | Net returns are based on the change in carrying value (realized and unrealized) after management fees, expenses and carried interest allocations. |
| (b) | BEP II’s 2015 investment returns are presented as N/M as all investments in the fund had been held for less than one year. |
The corporate private equity funds within the Private Equity segment have five funds with closed investment periods: BCP IV, BCP V, BCP VI, BCOM and BEP I. As of December 31, 2016, BCP IV was above its carried interest threshold (i.e., the preferred return payable to its limited partners before the general partner is eligible to receive carried interest) and would still be above its carried interest threshold even if all remaining investments were valued at zero. BCP V is comprised of two fund classes based on the timings of fund closings, the BCP V “main fund” and BCP V-AC fund. Within these fund classes, the general partner is subject to equalization such that (a) the general partner accrues carried interest when the total carried interest for the combined fund classes is positive and (b) the general partner realizes carried interest so long as clawback obligations, if any, for the combined fund classes are fully satisfied. During the quarter, both fund classes were above their respective carried interest thresholds. BCP VI is currently above its carried interest threshold. BCOM is currently above its carried interest threshold and has generated inception to date positive returns. We are entitled to retain previously realized carried interest up to 20% of BCOM’s net gains. As a result, Performance Fees are recognized from BCOM on current period gains and losses. BEP I is currently above its carried interest threshold.
114
Table of Contents
Real Estate
The following table presents the results of operations for our Real Estate segment:
| Year Ended December 31, | 2016 vs. 2015 | 2015 vs. 2014 | ||||||||||||||||||||||||||
| 2016 | 2015 | 2014 | $ | % | $ | % | ||||||||||||||||||||||
| (Dollars in Thousands) | ||||||||||||||||||||||||||||
| Segment Revenues |
||||||||||||||||||||||||||||
| Management Fees, Net |
||||||||||||||||||||||||||||
| Base Management Fees |
$ | 795,161 | $ | 668,575 | $ | 628,502 | $ | 126,586 | 19 | % | $ | 40,073 | 6 | % | ||||||||||||||
| Transaction and Other Fees, Net |
95,324 | 110,577 | 91,610 | (15,253 | ) | -14 | % | 18,967 | 21 | % | ||||||||||||||||||
| Management Fee Offsets |
(7,322 | ) | (26,840 | ) | (34,443 | ) | 19,518 | -73 | % | 7,603 | -22 | % | ||||||||||||||||
|
|
|
|
|
|
|
|
|
|
|
|
|
|
|
|||||||||||||||
| Total Management Fees, Net |
883,163 | 752,312 | 685,669 | 130,851 | 17 | % | 66,643 | 10 | % | |||||||||||||||||||
|
|
|
|
|
|
|
|
|
|
|
|
|
|
|
|||||||||||||||
| Performance Fees |
||||||||||||||||||||||||||||
| Realized |
||||||||||||||||||||||||||||
| Carried Interest |
1,203,484 | 1,634,733 | 1,487,762 | (431,249 | ) | -26 | % | 146,971 | 10 | % | ||||||||||||||||||
| Incentive Fees |
29,625 | 17,153 | 11,499 | 12,472 | 73 | % | 5,654 | 49 | % | |||||||||||||||||||
| Unrealized |
||||||||||||||||||||||||||||
| Carried Interest |
(150,997 | ) | (680,542 | ) | 524,046 | 529,545 | -78 | % | (1,204,588 | ) | N/M | |||||||||||||||||
| Incentive Fees |
39,527 | 20,802 | (5,521 | ) | 18,725 | 90 | % | 26,323 | N/M | |||||||||||||||||||
|
|
|
|
|
|
|
|
|
|
|
|
|
|
|
|||||||||||||||
| Total Performance Fees |
1,121,639 | 992,146 | 2,017,786 | 129,493 | 13 | % | (1,025,640 | ) | -51 | % | ||||||||||||||||||
|
|
|
|
|
|
|
|
|
|
|
|
|
|
|
|||||||||||||||
| Investment Income (Loss) |
||||||||||||||||||||||||||||
| Realized |
122,712 | 235,582 | 309,095 | (112,870 | ) | -48 | % | (73,513 | ) | -24 | % | |||||||||||||||||
| Unrealized |
(1,119 | ) | (231,889 | ) | (58,930 | ) | 230,770 | -100 | % | (172,959 | ) | 293 | % | |||||||||||||||
|
|
|
|
|
|
|
|
|
|
|
|
|
|
|
|||||||||||||||
| Total Investment Income |
121,593 | 3,693 | 250,165 | 117,900 | N/M | (246,472 | ) | -99 | % | |||||||||||||||||||
| Interest and Dividend Revenue |
54,240 | 43,990 | 30,197 | 10,250 | 23 | % | 13,793 | 46 | % | |||||||||||||||||||
| Other |
16,523 | (1,422 | ) | 2,863 | 17,945 | N/M | (4,285 | ) | N/M | |||||||||||||||||||
|
|
|
|
|
|
|
|
|
|
|
|
|
|
|
|||||||||||||||
| Total Revenues |
2,197,158 | 1,790,719 | 2,986,680 | 406,439 | 23 | % | (1,195,961 | ) | -40 | % | ||||||||||||||||||
|
|
|
|
|
|
|
|
|
|
|
|
|
|
|
|||||||||||||||
| Expenses |
||||||||||||||||||||||||||||
| Compensation and Benefits |
||||||||||||||||||||||||||||
| Compensation |
385,352 | 358,381 | 326,317 | 26,971 | 8 | % | 32,064 | 10 | % | |||||||||||||||||||
| Performance Fee Compensation |
||||||||||||||||||||||||||||
| Realized |
||||||||||||||||||||||||||||
| Carried Interest |
332,622 | 484,037 | 432,996 | (151,415 | ) | -31 | % | 51,041 | 12 | % | ||||||||||||||||||
| Incentive Fees |
12,085 | 8,678 | 5,980 | 3,407 | 39 | % | 2,698 | 45 | % | |||||||||||||||||||
| Unrealized |
||||||||||||||||||||||||||||
| Carried Interest |
44,775 | (196,347 | ) | 197,174 | 241,122 | N/M | (393,521 | ) | N/M | |||||||||||||||||||
| Incentive Fees |
16,872 | 8,817 | (2,751 | ) | 8,055 | 91 | % | 11,568 | N/M | |||||||||||||||||||
|
|
|
|
|
|
|
|
|
|
|
|
|
|
|
|||||||||||||||
| Total Compensation and Benefits |
791,706 | 663,566 | 959,716 | 128,140 | 19 | % | (296,150 | ) | -31 | % | ||||||||||||||||||
| Other Operating Expenses |
203,962 | 179,175 | 146,083 | 24,787 | 14 | % | 33,092 | 23 | % | |||||||||||||||||||
|
|
|
|
|
|
|
|
|
|
|
|
|
|
|
|||||||||||||||
| Total Expenses |
995,668 | 842,741 | 1,105,799 | 152,927 | 18 | % | (263,058 | ) | -24 | % | ||||||||||||||||||
|
|
|
|
|
|
|
|
|
|
|
|
|
|
|
|||||||||||||||
| Economic Income |
$ | 1,201,490 | $ | 947,978 | $ | 1,880,881 | $ | 253,512 | 27 | % | $ | (932,903 | ) | -50 | % | |||||||||||||
|
|
|
|
|
|
|
|
|
|
|
|
|
|
|
|||||||||||||||
| N/M | Not meaningful. |
115
Table of Contents
Year Ended December 31, 2016 Compared to Year Ended December 31, 2015
Revenues
Revenues were $2.2 billion for the year ended December 31, 2016, an increase of $406.4 million compared to $1.8 billion for the year ended December 31, 2015. The increase in revenues was primarily attributable to increases in Total Management Fees, Net, Performance Fees and Investment Income of $130.9 million, $129.5 million and $117.9 million, respectively.
In 2016, revenues in our Real Estate segment increased primarily due to appreciation in public and private investment holdings in our real estate opportunistic funds and increased management fees primarily from BREP VIII committed capital and BPP invested capital. Overall, operating trends in our Real Estate portfolio remain stable and supply-demand fundamentals remain solid in most markets, although we see decelerating growth in certain geographies. As a result of less distress and rising asset values compared to late 2015 and early 2016, in the U.S., the second half of 2016 was a more challenging opportunistic investment environment. In 2016, our Real Estate funds remained active in both realizations and deployment, though activity decreased moderately compared to 2015. In our real estate debt funds, liquid fund performance continued to improve in the fourth quarter of 2016, recovering from the general market softening earlier in the year. Revenues in our Real Estate segment would likely be negatively impacted if the capital markets experienced a period of prolonged volatility, including as a result of uncertainty regarding governmental and tax policy, or market and/or macroeconomic conditions were to deteriorate.
Total Management Fees, Net were $883.2 million for the year ended December 31, 2016, an increase of $130.9 million compared to $752.3 million for the year ended December 31, 2015, primarily attributable to an increase in Base Management Fees. Base Management Fees were $795.2 million for the year ended December 31, 2016, an increase of $126.6 million compared to $668.6 million for the year ended December 31, 2015. The increase was principally due to increased commitments in BREP VIII and an increase in invested capital in BPP, partially offset by realizations across the portfolio.
The annualized Base Management Fee Rate decreased from 1.19% at December 31, 2015 to 1.09% at December 31, 2016. The decrease was principally due to commencement of the investment period of BREP Europe V in the fourth quarter of 2016, which added Fee-Earning Assets Under Management, the majority of which are under a Base Management Fee holiday until the second quarter of 2017.
Performance Fees, which are determined on a fund by fund basis, were $1.1 billion for the year ended December 31, 2016, an increase of $129.5 million compared to $992.1 million for the year ended December 31, 2015. The increase in Performance Fees was primarily due to a year over year increase in the net appreciation of investment holdings in our real estate opportunistic funds, which appreciated 11.1% compared to 9.7%. in the prior period. Our core+ real estate funds, real estate debt drawdown and hedge funds appreciated 10.9%, 11.7% and 0.3%, respectively.
Investment Income was $121.6 million for the year ended December 31, 2016, an increase of $117.9 million compared to $3.7 million for the year ended December 31, 2015. The increase in Investment Income was primarily due to the net appreciation of investments in BREP VI, in which the general partner has made a larger commitment than in other real estate funds.
Expenses
Expenses were $995.7 million for the year ended December 31, 2016, an increase of $152.9 million, compared to $842.7 million for the year ended December 31, 2015. The increase was primarily attributable to increases in Performance Fee Compensation, Compensation and Other Operating Expenses of $101.2 million, $27.0 million and $24.8 million, respectively. The increase in Performance Fee Compensation was the result of an increase in Performance Fees Revenue. The increase in Compensation was due to an overall increase in Management Fees, on which a portion of compensation is based, as well as an increase in headcount to support the growth of the business.
116
Table of Contents
The increase in Other Operating Expenses was primarily due to an increase in interest and other expenses allocated to the segment.
Year Ended December 31, 2015 Compared to Year Ended December 31, 2014
Revenues
Revenues were $1.8 billion for the year ended December 31, 2015, a decrease of $1.2 billion compared to $3.0 billion for the year ended December 31, 2014. The decrease in revenues was primarily attributable to decreases in Performance Fees and Investment Income of $1.0 billion and $246.5 million, respectively, partially offset by an increase in Total Management Fees, Net of $66.6 million.
Performance Fees, which are determined on a fund by fund basis, were $992.1 million for the year ended December 31, 2015, a decrease of $1.0 billion compared to $2.0 billion for the year ended December 31, 2014. Performance Fees decreased by $1.0 billion due to a year over year decrease in the net appreciation of investments in our real estate opportunistic funds from 20.9% to 9.7%. For the year ended December 31, 2015, the increase in carrying value of assets for Blackstone’s contributed real estate opportunistic funds was driven by sustained strong operating fundamentals in the private portfolio resulting in appreciation of 16.6% offset by public portfolio depreciation of 8.6%. Our BREDS drawdown and real estate hedge funds appreciated 13.0% and 2.9%, respectively.
Investment Income was $3.7 million for the year ended December 31, 2015, a decrease of $246.5 million compared to $250.2 million for the year ended December 31, 2014. The decrease in Investment Income was due to a year over year net depreciation of investments in BREP VI, in which the general partner has made a larger commitment than in other real estate funds.
Total Management Fees, Net were $752.3 million for the year ended December 31, 2015, an increase of $66.6 million compared to $685.7 million for the year ended December 31, 2014, primarily attributable to increases in Base Management Fees. Base Management Fees were $668.6 million for the year ended December 31, 2015, an increase of $40.1 million compared to $628.5 million for the year ended December 31, 2014. The increase was principally due to fees generated from fundraising within BREP VIII, BPP and invested capital within BREDS, partially offset by realizations across the portfolio.
Expenses
Expenses were $842.7 million for the year ended December 31, 2015, a decrease of $263.1 million, compared to $1.1 billion for the year ended December 31, 2014. The decrease was primarily attributable to a decrease of Performance Fee Compensation of $328.2 million, partially offset by increases in Compensation and Other Operating Expenses of $32.1 million and $33.1 million, respectively. The decrease in Performance Fee Compensation is the result of a decrease in Performance Fees Revenue. The increase in Compensation is due to an overall increase in Management Fees, on which a portion of compensation is based, as well as an increase in headcount to support the growth of the business. The increase in Other Operating Expenses was primarily due to an increase in interest expense allocated to the segment and certain one-time costs associated with fundraising.
Fund Returns
Fund return information for our significant funds is included throughout this discussion and analysis to facilitate an understanding of our results of operations for the periods presented. The fund returns information reflected in this discussion and analysis is not indicative of the financial performance of The Blackstone Group L.P. and is also not necessarily indicative of the future performance of any particular fund. An investment in The Blackstone Group L.P. is not an investment in any of our funds. There can be no assurance that any of our funds or our other existing and future funds will achieve similar returns.
117
Table of Contents
The following table presents the internal rates of return of our significant real estate funds:
| Year Ended December 31, | December 31, 2016 Inception to Date |
|||||||||||||||||||||||||||||||||||||||
| 2016 | 2015 | 2014 | Realized | Total | ||||||||||||||||||||||||||||||||||||
| Fund (a) |
Gross | Net | Gross | Net | Gross | Net | Gross | Net | Gross | Net | ||||||||||||||||||||||||||||||
| BREP IV |
-12 | % | -10 | % | -2 | % | -2 | % | 12 | % | 9 | % | 52 | % | 31 | % | 22 | % | 12 | % | ||||||||||||||||||||
| BREP V |
7 | % | 7 | % | 16 | % | 14 | % | 25 | % | 21 | % | 16 | % | 12 | % | 14 | % | 11 | % | ||||||||||||||||||||
| BREP VI |
21 | % | 17 | % | -2 | % | -2 | % | 20 | % | 17 | % | 19 | % | 14 | % | 17 | % | 13 | % | ||||||||||||||||||||
| BREP VII |
7 | % | 4 | % | 19 | % | 14 | % | 33 | % | 25 | % | 40 | % | 29 | % | 26 | % | 19 | % | ||||||||||||||||||||
| BREP VIII |
29 | % | 19 | % | N/M | N/M | N/A | N/A | 27 | % | 17 | % | 31 | % | 19 | % | ||||||||||||||||||||||||
| BREP International II (b) |
23 | % | 23 | % | 20 | % | 17 | % | 27 | % | 25 | % | 10 | % | 8 | % | 7 | % | 6 | % | ||||||||||||||||||||
| BREP Europe III (b) |
-4 | % | -4 | % | 21 | % | 17 | % | 32 | % | 25 | % | 34 | % | 23 | % | 24 | % | 16 | % | ||||||||||||||||||||
| BREP Europe IV (b) |
14 | % | 10 | % | 27 | % | 19 | % | 32 | % | 20 | % | 38 | % | 24 | % | 21 | % | 14 | % | ||||||||||||||||||||
| BREP Co-Investment (c) |
16 | % | 14 | % | — | — | 24 | % | 22 | % | 19 | % | 17 | % | 17 | % | 16 | % | ||||||||||||||||||||||
| BREP Asia |
30 | % | 21 | % | 22 | % | 13 | % | 19 | % | 10 | % | 23 | % | 17 | % | 26 | % | 17 | % | ||||||||||||||||||||
| BPP |
11 | % | 10 | % | 17 | % | 15 | % | 28 | % | 24 | % | 37 | % | 36 | % | 15 | % | 13 | % | ||||||||||||||||||||
| BREDS Drawdown |
14 | % | 10 | % | 14 | % | 9 | % | 15 | % | 10 | % | 17 | % | 13 | % | 16 | % | 11 | % | ||||||||||||||||||||
| BREDS Liquid |
4 | % | 2 | % | 6 | % | 3 | % | 8 | % | 5 | % | N/A | N/A | 12 | % | 8 | % | ||||||||||||||||||||||
The returns presented herein represent those of the applicable Blackstone Funds and not those of The Blackstone Group L.P.
| N/M | Not meaningful. |
| N/A | Not applicable. |
| (a) | Net returns are based on the change in carrying value (realized and unrealized) after management fees, expenses and performance fee allocations. |
| (b) | Euro-based internal rates of return. |
| (c) | Excludes fully realized co-investments prior to Blackstone’s IPO. |
The following table presents the carried interest status of our real estate carry funds with expired investment periods which are currently not generating performance fees as of December 31, 2016:
| Gain to Cross Carried Interest Threshold (a) | ||||||||||||
| Fully Invested Funds |
Amount | % Change in Total Enterprise Value (b) |
% Change in Equity Value |
|||||||||
| (Amounts in Millions) | ||||||||||||
| BREP Int’l II (Sep 2005 / Jun 2008) |
€ | 792 | 42 | % | 149 | % | ||||||
| (a) | The general partner of each fund is allocated carried interest when the annualized returns, net of management fees and expenses, exceed the preferred return as dictated by the fund agreements. The preferred return is calculated for each limited partner individually. The Gain to Cross carried interest Threshold represents the increase in equity at the fund level (excluding our side-by-side investments) that is required for the general partner to begin accruing carried interest, assuming the gain is earned pro rata across the fund’s investments and is achieved at the reporting date. |
| (b) | Total Enterprise Value is the respective fund’s pro rata ownership of the privately held portfolio companies’ Enterprise Value. |
The Real Estate segment has three funds in their investment period, which were above their respective carried interest thresholds as of December 31, 2016: BREP VIII, BREP Asia and BREDS III.
118
Table of Contents
Hedge Fund Solutions
The following table presents the results of operations for our Hedge Fund Solutions segment:
| Year Ended December 31, | 2016 vs. 2015 | 2015 vs. 2014 | ||||||||||||||||||||||||||
| 2016 | 2015 | 2014 | $ | % | $ | % | ||||||||||||||||||||||
| (Dollars in Thousands) | ||||||||||||||||||||||||||||
| Segment Revenues |
||||||||||||||||||||||||||||
| Management Fees, Net |
||||||||||||||||||||||||||||
| Base Management Fees |
$ | 521,736 | $ | 524,386 | $ | 482,981 | $ | (2,650 | ) | -1 | % | $ | 41,405 | 9 | % | |||||||||||||
| Transaction and Other Fees, Net |
1,061 | 317 | 569 | 744 | 235 | % | (252 | ) | -44 | % | ||||||||||||||||||
| Management Fee Offsets |
— | 171 | (5,014 | ) | (171 | ) | -100 | % | 5,185 | N/M | ||||||||||||||||||
|
|
|
|
|
|
|
|
|
|
|
|
|
|
|
|||||||||||||||
| Total Management Fees, Net |
522,797 | 524,874 | 478,536 | (2,077 | ) | -0 | % | 46,338 | 10 | % | ||||||||||||||||||
|
|
|
|
|
|
|
|
|
|
|
|
|
|
|
|||||||||||||||
| Performance Fees |
||||||||||||||||||||||||||||
| Realized |
||||||||||||||||||||||||||||
| Incentive Fees |
42,177 | 68,197 | 140,529 | (26,020 | ) | -38 | % | (72,332 | ) | -51 | % | |||||||||||||||||
| Unrealized |
||||||||||||||||||||||||||||
| Carried Interest |
504 | 2,021 | — | (1,517 | ) | -75 | % | 2,021 | N/M | |||||||||||||||||||
| Incentive Fees |
785 | (8,084 | ) | (879 | ) | 8,869 | N/M | (7,205 | ) | 820 | % | |||||||||||||||||
|
|
|
|
|
|
|
|
|
|
|
|
|
|
|
|||||||||||||||
| Total Performance Fees |
43,466 | 62,134 | 139,650 | (18,668 | ) | -30 | % | (77,516 | ) | -56 | % | |||||||||||||||||
|
|
|
|
|
|
|
|
|
|
|
|
|
|
|
|||||||||||||||
| Investment Income (Loss) |
||||||||||||||||||||||||||||
| Realized |
(7,224 | ) | (12,741 | ) | 21,550 | 5,517 | -43 | % | (34,291 | ) | N/M | |||||||||||||||||
| Unrealized |
15,462 | (1,435 | ) | 5,132 | 16,897 | N/M | (6,567 | ) | N/M | |||||||||||||||||||
|
|
|
|
|
|
|
|
|
|
|
|
|
|
|
|||||||||||||||
| Total Investment Income (Loss) |
8,238 | (14,176 | ) | 26,682 | 22,414 | N/M | (40,858 | ) | N/M | |||||||||||||||||||
| Interest and Dividend Revenue |
23,083 | 17,274 | 11,114 | 5,809 | 34 | % | 6,160 | 55 | % | |||||||||||||||||||
| Other |
8,157 | 200 | 1,855 | 7,957 | N/M | (1,655 | ) | -89 | % | |||||||||||||||||||
|
|
|
|
|
|
|
|
|
|
|
|
|
|
|
|||||||||||||||
| Total Revenues |
605,741 | 590,306 | 657,837 | 15,435 | 3 | % | (67,531 | ) | -10 | % | ||||||||||||||||||
|
|
|
|
|
|
|
|
|
|
|
|
|
|
|
|||||||||||||||
| Expenses |
||||||||||||||||||||||||||||
| Compensation and Benefits |
||||||||||||||||||||||||||||
| Compensation |
185,320 | 179,484 | 131,658 | 5,836 | 3 | % | 47,826 | 36 | % | |||||||||||||||||||
| Performance Fee Compensation |
||||||||||||||||||||||||||||
| Realized |
||||||||||||||||||||||||||||
| Incentive Fees |
19,397 | 27,155 | 42,451 | (7,758 | ) | -29 | % | (15,296 | ) | -36 | % | |||||||||||||||||
| Unrealized |
||||||||||||||||||||||||||||
| Carried Interest |
181 | 823 | — | (642 | ) | -78 | % | 823 | N/M | |||||||||||||||||||
| Incentive Fees |
292 | (2,912 | ) | (273 | ) | 3,204 | N/M | (2,639 | ) | 967 | % | |||||||||||||||||
|
|
|
|
|
|
|
|
|
|
|
|
|
|
|
|||||||||||||||
| Total Compensation and Benefits |
205,190 | 204,550 | 173,836 | 640 | 0 | % | 30,714 | 18 | % | |||||||||||||||||||
| Other Operating Expenses |
108,636 | 90,072 | 86,129 | 18,564 | 21 | % | 3,943 | 5 | % | |||||||||||||||||||
|
|
|
|
|
|
|
|
|
|
|
|
|
|
|
|||||||||||||||
| Total Expenses |
313,826 | 294,622 | 259,965 | 19,204 | 7 | % | 34,657 | 13 | % | |||||||||||||||||||
|
|
|
|
|
|
|
|
|
|
|
|
|
|
|
|||||||||||||||
| Economic Income |
$ | 291,915 | $ | 295,684 | $ | 397,872 | $ | (3,769 | ) | -1 | % | $ | (102,188 | ) | -26 | % | ||||||||||||
|
|
|
|
|
|
|
|
|
|
|
|
|
|
|
|||||||||||||||
N/M Not meaningful.
119
Table of Contents
Year Ended December 31, 2016 Compared to Year Ended December 31, 2015
Revenues
Revenues were $605.7 million for the year ended December 31, 2016, an increase of $15.4 million compared to $590.3 million for the year ended December 31, 2015. The increase in revenues was primarily attributable to increases in Investment Income (Loss), Other Revenue and Interest and Dividend Revenue of $22.4 million, $8.0 million, and $5.8 million, respectively. These increases were partially offset by decreases in Performance Fees of $18.7 million.
Revenues in our Hedge Fund Solutions segment in 2016 were moderately lower than in 2015 primarily driven by lower Performance Fees as a result of the significant volatility in global markets and the decline in equity and fixed income asset prices in the first quarter of 2016. Beginning with the second quarter of 2016, the BPS composite began to rebound, ending the year up 3.5% gross (2.7% net). In addition, in the second half of 2016, a significant portion of Hedge Fund Solutions’ Fee-Earning Assets Under Management eligible for Incentive Fees moved above the high water mark, resulting in approximately 78% of Fee-Earnings Assets Under Management eligible for Incentive Fees being above the high water mark as of the end of the year. Hedge Fund Solutions revenues would likely be negatively impacted if global asset prices experienced another period of extreme volatility or decline, including as a result of uncertainty regarding governmental and tax policy, or liquidity needs caused investors to withdraw assets. Despite challenging market conditions in early 2016, demand for products in Hedge Fund Solutions remained strong throughout the year, and the segment operates multiple business lines, manages strategies that are both long and short asset classes and generates a majority of its revenue through management fees, all of which provide a level of downside protection to Hedge Fund Solutions revenues.
Investment Income (Loss) was $8.2 million for the year ended December 31, 2016, an increase of $22.4 million compared to $(14.2) million for the year ended December 31, 2015. The increase in Investment Income was primarily driven by the year over year net appreciation of investments of which Blackstone owns a share.
Other Revenue was $8.2 million for the year ended December 31, 2016, an increase of $8.0 million compared to $0.2 million for the year ended December 31, 2015. The increase in Other Revenue was primarily driven by an increase in revenue allocations to the segment.
Interest and Dividend Revenue was $23.1 million for the year ended December 31, 2016, an increase of $5.8 million compared to $17.3 million for the year ended December 31, 2015. The increase in Interest and Dividend Revenue was primarily driven by net appreciation of investments of which Blackstone owns a share.
Performance Fees were $43.5 million for the year ended December 31, 2016, a decrease of $18.7 million compared to $62.1 million for the year ended December 31, 2015. The decrease was principally due to lower returns for a number of our funds.
Expenses
Expenses were $313.8 million for the year ended December 31, 2016, an increase of $19.2 million compared to the year ended December 31, 2015. The increase was primarily attributable to an $18.6 million increase in Other Operating Expenses. Other Operating Expenses were $108.6 million for the year ended December 31, 2016, an increase of $18.6 million compared to $90.1 million for the year ended December 31, 2015. The increase in Other Operating Expenses was primarily due to interest and other expenses allocated to the segment.
Year Ended December 31, 2015 Compared to Year Ended December 31, 2014
Revenues
Revenues were $590.3 million for the year ended December 31, 2015, a decrease of $67.5 million compared to $657.8 million for the year ended December 31, 2014. The decrease in revenues was primarily attributable to
120
Table of Contents
decreases in Performance Fees and Investment Income of $77.5 million and $40.9 million, respectively, partially offset by an increase in Total Management Fees, Net of $46.3 million.
Performance Fees were $62.1 million for the year ended December 31, 2015, a decrease of $77.5 million compared to $139.7 million for the year ended December 31, 2014. This was primarily due to lower returns. The net returns of the underlying assets within the BPS Composite funds were 2.1% during the year ended December 31, 2015.
Investment Loss was $14.2 million for the year ended December 31, 2015, a decrease of $40.9 million compared to Investment Income of $26.7 million for the year ended December 31, 2014. The decrease in Investment Income was primarily driven by the year over year net depreciation of investments of which Blackstone owns a share.
Total Management Fees, Net were $524.9 million for the year ended December 31, 2015, an increase of $46.3 million compared to $478.5 million for the year ended December 31, 2014, primarily due to an increase in Base Management Fees. Base Management Fees were $524.4 million for the year ended December 31, 2015, an increase of $41.4 million compared to $483.0 million for the year ended December 31, 2014. This was driven by an increase in Fee-Earning Assets Under Management of 7% from the prior year, which was from net inflows and market appreciation.
Expenses
Expenses were $294.6 million for the year ended December 31, 2015, an increase of $34.7 million compared to the year ended December 31, 2014. The increase was primarily attributable to a $47.8 million increase in Compensation, and a $3.9 million increase in Other Operating Expenses, partially offset by a $17.1 million decrease in Performance Fee Compensation. Compensation was $179.5 million for the year ended December 31, 2015, an increase of $47.8 million compared to $131.7 million for the prior year, due to an overall increase in Management Fees, on which a portion of compensation is based, an increase in headcount to support the growth of the business and a change in the terms of Deferred Compensation Plan awards. Other Operating Expenses were $90.1 million for the year ended December 31, 2015, an increase of $3.9 million compared to $86.1 million for the year ended December 31, 2014. The increase in Other Operating Expenses was primarily due to interest allocated to the segment. Performance Fee Compensation was $25.1 million for the year ended December 31, 2015, a decrease of $17.1 million compared to $42.2 million for the year ended December 31, 2014 due to the decrease in Performance Fees Revenue.
Operating Metrics
The following table presents information regarding our Incentive Fee-Earning Assets Under Management:
| Fee-Earning Assets Under Management Eligible for Incentive Fees |
Estimated % Above High Water Mark/Benchmark (a) |
|||||||||||||||||||||||
| December 31, | December 31, | |||||||||||||||||||||||
| 2014 | 2015 | 2016 | 2014 | 2015 | 2016 | |||||||||||||||||||
| (Dollars in Thousands) | ||||||||||||||||||||||||
| BAAM Managed Funds (b) |
$ | 34,732,386 | $ | 35,831,499 | $ | 36,664,203 | 94 | % | 81 | % | 78 | % | ||||||||||||
| (a) | Estimated % Above High Water Mark/Benchmark represents the percentage of Fee-Earning Assets Under Management Eligible for Incentive Fees that as of the dates presented would earn incentive fees when the applicable BAAM managed fund has positive investment performance relative to a benchmark, where applicable. Incremental positive performance in the applicable Blackstone Funds may cause additional assets to reach their respective High Water Mark or clear a benchmark return, thereby resulting in an increase in Estimated % Above High Water Mark/Benchmark. |
121
Table of Contents
| (b) | For the BAAM managed funds, at December 31, 2016 the incremental appreciation needed for the 22% of Fee-Earning Assets Under Management below their respective High Water Marks/Benchmarks to reach their respective High Water Marks/Benchmarks was $684.3 million, an increase of $447.7 million, compared to $236.6 million at December 31, 2015. Of the Fee-Earning Assets Under Management below their respective High Water Marks/Benchmarks as of December 31, 2016, 37% were within 5% of reaching their respective High Water Mark. |
Composite Returns
Composite returns information is included throughout this discussion and analysis to facilitate an understanding of our results of operations for the periods presented. The composite returns information reflected in this discussion and analysis is not indicative of the financial performance of The Blackstone Group L.P. and is also not necessarily indicative of the future results of any particular fund. An investment in The Blackstone Group L.P. is not an investment in any of our funds or composites. There can be no assurance that any of our funds or composites or our other existing and future funds or composites will achieve similar returns.
The following table presents the return information of the BAAM Principal Solutions Composite:
| Average Annual Returns (a) | ||||||||||||||||||||||||||||||||
| Periods Ended December 31, 2016 |
||||||||||||||||||||||||||||||||
| One Year |
Three Year |
Five Year |
Historical | |||||||||||||||||||||||||||||
| Composite |
Gross | Net | Gross | Net | Gross | Net | Gross | Net | ||||||||||||||||||||||||
| BAAM Principal Solutions Composite (b) |
3 | % | 3 | % | 5 | % | 4 | % | 7 | % | 6 | % | 7 | % | 6 | % | ||||||||||||||||
The returns presented represent those of the applicable Blackstone Funds and not those of The Blackstone Group L.P.
| (a) | Composite returns present a summarized asset-weighted return measure to evaluate the overall performance of the applicable class of Blackstone Funds. |
| (b) | BAAM’s Principal Solutions (“BPS”) Composite covers the period from January 2000 to present, although BAAM’s inception date is September 1990. BPS Composite does not include BAAM’s individual investor solutions (i.e., liquid alternatives), long biased commodities, ventures (i.e., seeding and minority interests), strategic opportunities (i.e., co-investments), Senfina (i.e., direct trading) and advisory (non-discretionary) platforms, except for investments by BPS funds directly into those platforms. BAAM managed funds in liquidation are also excluded. The historical return is from January 1, 2000. |
122
Table of Contents
Credit
The following table presents the results of operations for our Credit segment:
| Year Ended December 31, | 2016 vs. 2015 | 2015 vs. 2014 | ||||||||||||||||||||||||||
| 2016 | 2015 | 2014 | $ | % | $ | % | ||||||||||||||||||||||
| (Dollars in Thousands) | ||||||||||||||||||||||||||||
| Segment Revenues |
||||||||||||||||||||||||||||
| Management Fees, Net |
||||||||||||||||||||||||||||
| Base Management Fees |
$ | 526,748 | $ | 500,982 | $ | 460,205 | $ | 25,766 | 5 | % | $ | 40,777 | 9 | % | ||||||||||||||
| Transaction and Other Fees, Net |
6,600 | 6,371 | 18,161 | 229 | 4 | % | (11,790 | ) | -65 | % | ||||||||||||||||||
| Management Fee Offsets |
(37,512 | ) | (30,065 | ) | (28,168 | ) | (7,447 | ) | 25 | % | (1,897 | ) | 7 | % | ||||||||||||||
|
|
|
|
|
|
|
|
|
|
|
|
|
|
|
|||||||||||||||
| Total Management Fees, Net |
495,836 | 477,288 | 450,198 | 18,548 | 4 | % | 27,090 | 6 | % | |||||||||||||||||||
|
|
|
|
|
|
|
|
|
|
|
|
|
|
|
|||||||||||||||
| Performance Fees |
||||||||||||||||||||||||||||
| Realized |
||||||||||||||||||||||||||||
| Carried Interest |
26,163 | 96,156 | 208,432 | (69,993 | ) | -73 | % | (112,276 | ) | -54 | % | |||||||||||||||||
| Incentive Fees |
100,299 | 109,396 | 109,717 | (9,097 | ) | -8 | % | (321 | ) | -0 | % | |||||||||||||||||
| Unrealized |
||||||||||||||||||||||||||||
| Carried Interest |
206,953 | (198,820 | ) | (37,913 | ) | 405,773 | N/M | (160,907 | ) | 424 | % | |||||||||||||||||
| Incentive Fees |
9,417 | (19,967 | ) | (23,025 | ) | 29,384 | N/M | 3,058 | -13 | % | ||||||||||||||||||
|
|
|
|
|
|
|
|
|
|
|
|
|
|
|
|||||||||||||||
| Total Performance Fees |
342,832 | (13,235 | ) | 257,211 | 356,067 | N/M | (270,446 | ) | N/M | |||||||||||||||||||
|
|
|
|
|
|
|
|
|
|
|
|
|
|
|
|||||||||||||||
| Investment Income (Loss) |
||||||||||||||||||||||||||||
| Realized |
11,004 | 7,186 | 9,354 | 3,818 | 53 | % | (2,168 | ) | -23 | % | ||||||||||||||||||
| Unrealized |
10,921 | (16,258 | ) | 5,055 | 27,179 | N/M | (21,313 | ) | N/M | |||||||||||||||||||
|
|
|
|
|
|
|
|
|
|
|
|
|
|
|
|||||||||||||||
| Total Investment Income (Loss) |
21,925 | (9,072 | ) | 14,409 | 30,997 | N/M | (23,481 | ) | N/M | |||||||||||||||||||
| Interest and Dividend Revenue |
28,289 | 24,599 | 23,040 | 3,690 | 15 | % | 1,559 | 7 | % | |||||||||||||||||||
| Other |
9,574 | 5,171 | (2,310 | ) | 4,403 | 85 | % | 7,481 | N/M | |||||||||||||||||||
|
|
|
|
|
|
|
|
|
|
|
|
|
|
|
|||||||||||||||
| Total Revenues |
898,456 | 484,751 | 742,548 | 413,705 | 85 | % | (257,797 | ) | -35 | % | ||||||||||||||||||
|
|
|
|
|
|
|
|
|
|
|
|
|
|
|
|||||||||||||||
| Expenses |
||||||||||||||||||||||||||||
| Compensation and Benefits |
||||||||||||||||||||||||||||
| Compensation |
202,087 | 190,189 | 188,200 | 11,898 | 6 | % | 1,989 | 1 | % | |||||||||||||||||||
| Performance Fee Compensation |
||||||||||||||||||||||||||||
| Realized |
||||||||||||||||||||||||||||
| Carried Interest |
12,450 | 52,841 | 116,254 | (40,391 | ) | -76 | % | (63,413 | ) | -55 | % | |||||||||||||||||
| Incentive Fees |
46,614 | 50,113 | 61,668 | (3,499 | ) | -7 | % | (11,555 | ) | -19 | % | |||||||||||||||||
| Unrealized |
||||||||||||||||||||||||||||
| Carried Interest |
103,945 | (107,000 | ) | (28,583 | ) | 210,945 | N/M | (78,417 | ) | 274 | % | |||||||||||||||||
| Incentive Fees |
3,970 | (8,395 | ) | (16,252 | ) | 12,365 | N/M | 7,857 | -48 | % | ||||||||||||||||||
|
|
|
|
|
|
|
|
|
|
|
|
|
|
|
|||||||||||||||
| Total Compensation and Benefits |
369,066 | 177,748 | 321,287 | 191,318 | 108 | % | (143,539 | ) | -45 | % | ||||||||||||||||||
| Other Operating Expenses |
120,311 | 93,626 | 90,524 | 26,685 | 29 | % | 3,102 | 3 | % | |||||||||||||||||||
|
|
|
|
|
|
|
|
|
|
|
|
|
|
|
|||||||||||||||
| Total Expenses |
489,377 | 271,374 | 411,811 | 218,003 | 80 | % | (140,437 | ) | -34 | % | ||||||||||||||||||
|
|
|
|
|
|
|
|
|
|
|
|
|
|
|
|||||||||||||||
| Economic Income |
$ | 409,079 | $ | 213,377 | $ | 330,737 | $ | 195,702 | 92 | % | $ | (117,360 | ) | -35 | % | |||||||||||||
|
|
|
|
|
|
|
|
|
|
|
|
|
|
|
|||||||||||||||
N/M Not meaningful.
123
Table of Contents
Year Ended December 31, 2016 Compared to Year Ended December 31, 2015
Revenues
Revenues were $898.5 million for the year ended December 31, 2016, an increase of $413.7 million compared to $484.8 million for the year ended December 31, 2015. The increase in revenues was primarily attributable to increases of $356.1 million in Performance Fees, $31.0 million in Investment Income (Loss) and $18.5 million in Total Management Fees, Net.
Following a challenging credit market in 2015, which continued through early 2016, revenues in our Credit segment increased in 2016 as compared to 2015, driven by improved performance in our performing debt and distressed debt portfolios, with particularly strong performance in our energy investments. Despite the continuing low interest rate environment in 2016, our Credit funds were able to identify attractive investment opportunities by focusing on transactions where our scale and expertise granted us a competitive advantage, particularly in the performing and distressed credit markets. Our Credit segment revenues may, however, be negatively impacted by prolonged periods of market pressure, depressed energy prices, market volatility or uncertainty regarding governmental and tax policy.
Performance Fees were $342.8 million for the year ended December 31, 2016, an increase of $356.1 million compared to $(13.2) million for the year ended December 31, 2015. This increase was primarily due to an appreciation of energy investments and distressed debt positions across funds. The composite net returns of Blackstone’s significant Credit segment funds were 13.3% for Distressed Strategies and 16.7% for Performing Credit Strategies for the year ended December 31, 2016.
Investment Income (Loss) was $21.9 million for the year ended December 31, 2016, an increase of $31.0 million compared to $(9.1) million for the year ended December 31, 2015. This increase was primarily due to unrealized investment gains in hedge fund strategies, rescue lending funds, mezzanine funds and funds in our long only strategies.
Total Management Fees, Net were $495.8 million for the year ended December 31, 2016, an increase of $18.5 million compared to $477.3 million for the year ended December 31, 2015. This increase was primarily attributable to the growth in Fee-Earning Assets Under Management for our credit drawdown funds and our BDCs.
Expenses
Expenses were $489.4 million for the year ended December 31, 2016, an increase of $218.0 million compared to $271.4 million for the year ended December 31, 2015. The increase in expenses was attributable to increases of $191.3 million and $26.7 million in Total Compensation and Benefits and Other Operating Expenses, respectively. The increase in Total Compensation and Benefits was primarily due to an increase in Performance Fee Compensation of $179.4 million. The increase in Performance Fee Compensation was due to the increase in Performance Fee Revenue. The increase in Other Operating Expenses was due to fundraising costs, depreciation and interest and other costs allocated to the segment.
Year Ended December 31, 2015 Compared to December 31, 2014
Revenues
Revenues were $484.8 million for the year ended December 31, 2015, which were $257.8 million lower compared to $742.5 million for the year ended December 31, 2014. The decrease in revenues was primarily attributable to lower Performance Fees and Investment Income of $270.4 million and $23.5 million, respectively, partially offset by an increase of $27.1 million in Total Management Fees, Net.
Performance Fee Losses were $13.2 million for the year ended December 31, 2015, which were $270.4 million lower compared to the prior year. This decrease was primarily due to lower rates of appreciation in our hedge fund
124
Table of Contents
strategies business as well as our mezzanine and rescue lending businesses. The net returns of Blackstone’s significant Credit segment funds were -5.8% for Hedge Fund Strategies, -2.2% for Mezzanine Strategies and -8.8% for Rescue Lending Strategies for the year ended December 31, 2015.
Investment Loss was $9.1 million for the year ended December 31, 2015, which were $23.5 million lower compared to the prior year. This decrease was primarily due to the unrealized investment losses in hedge fund strategies, mezzanine funds and funds in our long only strategies.
Total Management Fees, Net were $477.3 million for the year ended December 31, 2015, an increase of $27.1 million compared to $450.2 million for the year ended December 31, 2014. This increase was primarily attributable to the growth in Fee-Earning Assets Under Management for our hedge fund strategies business and our BDCs.
Expenses
Expenses were $271.4 million for the year ended December 31, 2015, a decrease of $140.4 million compared to $411.8 million for the year ended December 31, 2014. The decrease in expenses was primarily attributable to a decrease of $145.5 million in Performance Fee Compensation. The decrease in Performance Fee Compensation was due to lower Performance Fees Revenue.
Fund Returns
Fund return information for our significant businesses is included throughout this discussion and analysis to facilitate an understanding of our results of operations for the periods presented. The fund returns information reflected in this discussion and analysis is not indicative of the financial performance of The Blackstone Group L.P. and is also not necessarily indicative of the future results of any particular fund. An investment in The Blackstone Group L.P. is not an investment in any of our funds. There can be no assurance that any of our funds or our other existing and future funds will achieve similar returns.
The following table presents combined internal rates of return of the segment’s Performing Credit and Distressed Strategies funds:
| Year Ended December 31, | Inception to December 31, 2016 |
|||||||||||||||||||||||||||||||
| 2016 | 2015 | 2014 | Total | |||||||||||||||||||||||||||||
| Composite (a) |
Gross | Net | Gross | Net | Gross | Net | Gross | Net | ||||||||||||||||||||||||
| Performing Credit Strategies (b) |
23 | % | 17 | % | -1 | % | -5 | % | 10 | % | 6 | % | 16 | % | 9 | % | ||||||||||||||||
| Distressed Strategies (c) |
18 | % | 13 | % | -7 | % | -8 | % | 5 | % | 3 | % | 11 | % | 7 | % | ||||||||||||||||
The returns presented herein represent those of the applicable Blackstone Funds and not those of The Blackstone Group L.P.
| (a) | Net returns are based on the change in carrying value (realized and unrealized) after management fees, expenses and performance fee allocations, net of tax advances. |
| (b) | Performing Credit Strategies include mezzanine lending funds, BDCs and other performing credit strategy funds. Performing Credit Strategies’ returns represent the IRR of the combined cash flows of the fee-earning funds exceeding $100 million of fair value at each respective quarter end excluding the Blackstone Funds that were contributed to GSO as part of Blackstone’s acquisition of GSO in March 2008. The inception to date returns are from July 16, 2007. |
| (c) | Distressed Strategies include rescue lending funds, distressed hedge funds and energy strategies. Distressed Strategies’ returns represent the IRR of the combined cash flows of the fee-earning funds exceeding $100 million of fair value at each respective quarter end. The inception to date returns are from August 1, 2005. |
125
Table of Contents
As of December 31, 2016, there was $23.9 billion of Performance Fee eligible assets under management invested in Credit strategies that were above the hurdle necessary to generate Incentive Fees or carried interest. This represented 43% of the total Performance Fee eligible assets at fair value across all Credit strategies.
Liquidity and Capital Resources
General
Blackstone’s business model derives revenue primarily from third party assets under management. Blackstone is not a capital or balance sheet intensive business and targets operating expense levels such that total management and advisory fees exceed total operating expenses each period. As a result, we require limited capital resources to support the working capital or operating needs of our businesses. We draw primarily on the long-term committed capital of our limited partner investors to fund the investment requirements of the Blackstone Funds and use our own realizations and cash flows to invest in growth initiatives, make commitments to our own funds, where our minimum general partner commitments are generally less than 5% of the limited partner commitments of a fund, and pay distributions to unitholders.
Fluctuations in our statement of financial condition result primarily from activities of the Blackstone Funds which are consolidated as well as business transactions, such as the issuance of senior notes described below. The majority economic ownership interests of the Blackstone Funds are reflected as Redeemable Non-Controlling Interests in Consolidated Entities, and Non-Controlling Interests in Consolidated Entities in the Consolidated Financial Statements. The consolidation of these Blackstone Funds has no net effect on the Partnership’s Net Income or Partners’ Capital. Additionally, fluctuations in our statement of financial condition also include appreciation or depreciation in Blackstone investments in the Blackstone Funds, additional investments and redemptions of such interests in the Blackstone Funds and the collection of receivables related to management and advisory fees.
Total assets were $26.4 billion as of December 31, 2016, an increase $3.9 billion from December 31, 2015. The increase was principally due to an increase in Investments of $3.4 billion.
Total liabilities were $13.9 billion as of December 31, 2016, an increase of $3.6 billion from December 31, 2015. The increase was principally due to an increase in Loans Payable of $2.7 billion.
For the year ended December 31, 2016, we had Total Fee Related Revenues of $2.5 billion and related expenses of $1.5 billion, generating Fee Related Earnings of $1.0 billion and Distributable Earnings of $2.2 billion.
Sources and Uses of Liquidity
We have multiple sources of liquidity to meet our capital needs, including annual cash flows, accumulated earnings in the businesses, the proceeds from our issuances of senior notes, liquid investments we hold on our balance sheet for our own use and access to our $1.5 billion committed revolving credit facility. As of December 31, 2016, Blackstone had $1.8 billion in cash and cash equivalents, $2.8 billion invested in corporate treasury investments, $2.2 billion invested in Blackstone Funds and other investments, against $3.4 billion in borrowings from our bond issuances, and no borrowings outstanding under our revolving credit facility.
In addition to the cash we received from our debt offerings and availability under our committed revolving credit facility, we expect to receive (a) cash generated from operating activities, (b) carried interest and incentive income realizations, and (c) realizations on the carry and hedge fund investments that we make. The amounts received from these three sources in particular may vary substantially from year to year and quarter to quarter depending on the frequency and size of realization events or net returns experienced by our investment funds. Our available capital could be adversely affected if there are prolonged periods of few substantial realizations from our investment funds accompanied by substantial capital calls for new investments from those investment funds. Therefore, Blackstone’s commitments to our funds are taken into consideration when managing our overall liquidity and cash position.
126
Table of Contents
We expect that our primary liquidity needs will be cash to (a) provide capital to facilitate the growth of our existing businesses which principally includes funding our general partner and co-investment commitments to our funds, (b) provide capital to facilitate our expansion into new businesses that are complementary, (c) pay operating expenses, including cash compensation to our employees and other obligations as they arise, (d) fund modest capital expenditures, (e) repay borrowings and related interest costs, (f) pay income taxes, and (g) make distributions to our unitholders and the holders of Blackstone Holdings Partnership Units. Our own capital commitments to our funds, the funds we invest in and our investment strategies as of December 31, 2016 consisted of the following:
| Blackstone and General Partner |
Senior Managing Directors and Certain Other Professionals (a) |
|||||||||||||||
| Fund |
Original Commitment |
Remaining Commitment |
Original Commitment |
Remaining Commitment |
||||||||||||
| (Dollars in Thousands) | ||||||||||||||||
| Private Equity |
||||||||||||||||
| BCP VII |
$ | 500,000 | $ | 496,909 | $ | 225,000 | $ | 223,610 | ||||||||
| BCP VI |
719,718 | 124,402 | 250,000 | 43,194 | ||||||||||||
| BCP V |
629,356 | 40,519 | — | — | ||||||||||||
| BEP I |
50,000 | 4,857 | — | — | ||||||||||||
| BEP II |
80,000 | 72,139 | 26,667 | 24,047 | ||||||||||||
| BCEP |
112,770 | 112,770 | — | — | ||||||||||||
| Tactical Opportunities |
267,454 | 127,866 | 68,933 | 40,197 | ||||||||||||
| Strategic Partners |
346,856 | 269,522 | 58,627 | 47,324 | ||||||||||||
| Other (c) |
231,591 | 25,294 | — | — | ||||||||||||
| Real Estate |
||||||||||||||||
| BREP VIII |
300,000 | 199,225 | 100,000 | 66,410 | ||||||||||||
| BREP VII |
300,000 | 50,074 | 100,000 | 16,690 | ||||||||||||
| BREP VI |
750,000 | 36,809 | 150,000 | 7,362 | ||||||||||||
| BREP Europe III |
100,000 | 13,231 | 35,000 | 4,631 | ||||||||||||
| BREP Europe IV |
130,000 | 28,456 | 43,333 | 9,487 | ||||||||||||
| BREP Europe V |
130,000 | 127,537 | 43,333 | 42,513 | ||||||||||||
| BREP Asia |
50,392 | 30,123 | 16,667 | 10,040 | ||||||||||||
| BREDS II |
50,000 | 27,818 | 16,667 | 9,273 | ||||||||||||
| BREDS III |
50,000 | 48,250 | 16,667 | 16,083 | ||||||||||||
| CT Opportunity Partners I (b) |
25,000 | 25,000 | — | — | ||||||||||||
| Other (c) |
130,271 | 26,487 | — | — | ||||||||||||
| Hedge Fund Solutions |
||||||||||||||||
| Strategic Alliance |
50,000 | 2,033 | — | — | ||||||||||||
| Strategic Alliance II |
50,000 | 1,482 | — | — | ||||||||||||
| Strategic Alliance III |
2,000 | 2,000 | — | — | ||||||||||||
| Strategic Holdings LP |
50,000 | 40,009 | — | — | ||||||||||||
| Other (c) |
800 | 270 | — | — | ||||||||||||
| Credit |
||||||||||||||||
| Capital Opportunities Fund II LP |
120,000 | 46,844 | 110,101 | 42,980 | ||||||||||||
| GSO Capital Solutions II |
125,000 | 72,628 | 119,959 | 69,699 | ||||||||||||
| Blackstone/GSO Capital Solutions |
50,000 | 6,552 | 27,666 | 3,625 | ||||||||||||
| BMezz II |
17,692 | 3,085 | — | — | ||||||||||||
| GSO Credit Alpha Fund LP |
52,102 | 20,852 | 50,247 | 20,110 | ||||||||||||
| GSO Euro Senior Debt Fund LP |
63,000 | 52,764 | 56,623 | 47,423 | ||||||||||||
| GSO Energy Select Opportunities Fund |
80,000 | 72,740 | 74,657 | 67,883 | ||||||||||||
| Capital Opportunities Fund III LP |
132,783 | 126,491 | 29,661 | 28,255 | ||||||||||||
| Other (c) |
93,603 | 45,276 | 23,078 | 9,945 | ||||||||||||
| Other |
||||||||||||||||
| Treasury |
261,999 | 86,664 | — | — | ||||||||||||
|
|
|
|
|
|
|
|
|
|||||||||
| Total |
$ | 6,102,387 | $ | 2,466,978 | $ | 1,642,886 | $ | 850,781 | ||||||||
|
|
|
|
|
|
|
|
|
|||||||||
| (a) | For some of the general partner commitments shown in the table above we require our senior managing directors and certain other professionals to fund a portion of the commitment even though the ultimate |
127
Table of Contents
| obligation to fund the aggregate commitment is ours pursuant to the governing agreements of the respective funds. The amounts of the aggregate applicable general partner original and remaining commitment are shown in the table above. In addition, certain senior managing directors and other professionals are required to fund a de minimis amount of the commitment in the other private equity, real estate and credit-focused carry funds. We expect our commitments to be drawn down over time and to be funded by available cash and cash generated from operations and realizations. Taking into account prevailing market conditions and both the liquidity and cash or liquid investment balances, we believe that the sources of liquidity described above will be more than sufficient to fund our working capital requirements. |
| (b) | Represents a legacy fund managed by us as a result of the 2012 acquisition of the investment advisory business of BXMT. |
| (c) | Represents capital commitments to a number of other funds in each respective segment. |
As of December 31, 2016, Blackstone Holdings Finance Co. L.L.C. (the “Issuer”), an indirect subsidiary of the Partnership, had issued and outstanding the following senior notes (collectively the “Notes”):
| Senior Notes (a) |
Issue Date | Aggregate Principal Amount (Dollars/Euros in Thousands) |
||||||
| 6.625%, Due 8/15/2019 |
8/20/2009 | $ | 600,000 | |||||
| 5.875%, Due 3/15/2021 |
9/15/2010 | $ | 400,000 | |||||
| 4.750%, Due 2/15/2023 |
8/17/2012 | $ | 400,000 | |||||
| 6.250%, Due 8/15/2042 |
8/17/2012 | $ | 250,000 | |||||
| 5.000%, Due 6/15/2044 |
4/7/2014 | $ | 500,000 | |||||
| 4.450%, Due 7/15/2045 |
4/27/2015 | $ | 350,000 | |||||
| 2.000%, Due 5/19/2025 |
5/19/2015 | € | 300,000 | |||||
| 1.000%, Due 10/5/2026 |
10/5/2016 | € | 600,000 | |||||
| (a) | The Notes are unsecured and unsubordinated obligations of the Issuer and are fully and unconditionally guaranteed, jointly and severally, by The Blackstone Group L.P. and each of the Blackstone Holdings Partnerships. The Notes contain customary covenants and financial restrictions that, among other things, limit the Issuer and the guarantors’ ability, subject to certain exceptions, to incur indebtedness secured by liens on voting stock or profit participating equity interests of their subsidiaries or merge, consolidate or sell, transfer or lease assets. The Notes also contain customary events of default. All or a portion of the Notes may be redeemed at our option, in whole or in part, at any time and from time to time, prior to their stated maturity, at the make-whole redemption price set forth in the Notes. If a change of control repurchase event occurs, the Notes are subject to repurchase at the repurchase price as set forth in the Notes. |
Blackstone, through indirect subsidiaries, has a $1.5 billion unsecured revolving credit facility (the “Credit Facility”) with Citibank, N.A., as Administrative Agent with a maturity date of August 31, 2021. Borrowings may also be made in U.K. sterling, euros, Swiss francs or Japanese yen, in each case subject to certain sub-limits. The Credit Facility contains customary representations, covenants and events of default. Financial covenants consist of a maximum net leverage ratio and a requirement to keep a minimum amount of fee-earning assets under management, each tested quarterly.
In January 2008, the Board of Directors of our general partner, Blackstone Group Management L.L.C., authorized the repurchase of up to $500 million of our common units and Blackstone Holdings Partnership Units. Under this unit repurchase program, units may be repurchased from time to time in open market transactions, in privately negotiated transactions or otherwise. The timing and the actual number of Blackstone common units and Blackstone Holdings Partnership Units repurchased will depend on a variety of factors, including legal requirements, price and economic and market conditions. This unit repurchase program may be suspended or discontinued at any time and does not have a specified expiration date. During the year ended December 31, 2016,
128
Table of Contents
no units were repurchased. As of December 31, 2016, the amount remaining under this program available for repurchases was $335.8 million.
Distributable Earnings, Fee Related Earnings and Economic Net Income
We use Distributable Earnings, which is derived from our segment reported results, as a supplemental non-GAAP measure to assess performance and amounts available for distributions to Blackstone unitholders, including Blackstone personnel and others who are limited partners of the Blackstone Holdings Partnerships. Distributable Earnings is intended to show the amount of net realized earnings without the effects of the consolidation of the Blackstone Funds. Distributable Earnings is derived from and reconciled to, but not equivalent to, its most directly comparable GAAP measure of Income (Loss) Before Provision for Taxes. Distributable Earnings, which is a component of Economic Net Income, is the sum across all segments of: (a) Total Management and Advisory Fees, (b) Interest and Dividend Revenue, (c) Other Revenue, (d) Realized Performance Fees, and (e) Realized Investment Income (Loss); less (a) Compensation, excluding the expense of equity-based awards, (b) Realized Performance Fee Compensation, (c) Other Operating Expenses, and (d) Taxes and Related Payables including the Payable Under Tax Receivable Agreement.
129
Table of Contents
The following table calculates Blackstone’s Fee Related Earnings, Distributable Earnings and Economic Net Income:
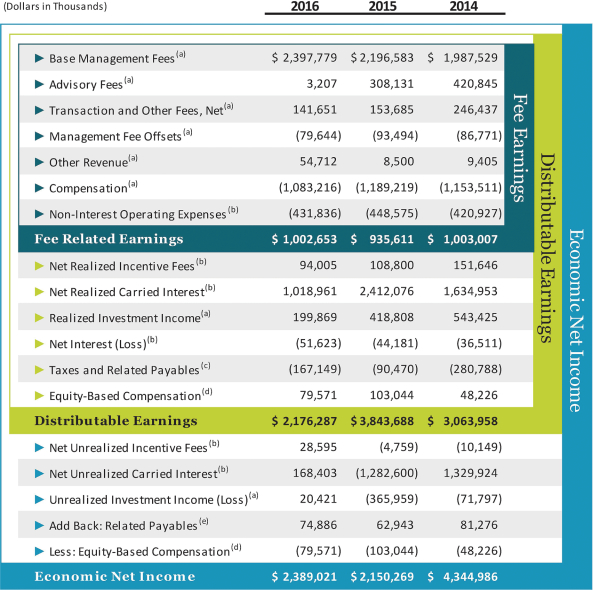
| (a) | Represents the total segment amounts of the respective captions. See Note 21. “Segment Reporting” in the “Notes to Consolidated Financial Statements” in “— Item 8. Financial Statements and Supplementary Data” of this filing. |
| (b) | Detail on this amount is included in the table below. |
| (c) | Taxes and Related Payables Including Payable Under Tax Receivable Agreement represents the total GAAP tax provision adjusted to include only the current tax provision (benefit) calculated on Income (Loss) Before Provision for Taxes and the Payable Under Tax Receivable Agreement. |
| (d) | Represents equity-based award expense included in Economic Income, which excludes all transaction-related equity-based charges. |
| (e) | Represents tax-related payables including the Payable Under Tax Receivable Agreement, which is a component of Taxes and Related Payables. |
(Dollars in Thousands) 2016 2015 2014 Base Management Fees(a) $ 2,397,779 $2,196,583 $ 1,987,529 Advisory Fees(a) 3,207 308,131 420,845 Transaction and Other Fees, Net(a) 141,651 153,685 246,437 Management Fee Offsets(a) (79,644) (93,494) (86,771) Other Revenue(a) 54,712 8,500 9,405 Compensation(a) (1,083,216) (1,189,219) (1,153,511) Non-Interest Operating Expenses(b) (431,836) (448,575) (420,927) Fee Earning Fee Related Earnings $1,002,653 $935,611 $1,003,007 Net Realized Incentive Fees (b) 94,005 108,800 151,646 Net Realized Carried Interest(b) 1,018,961 2,412,076 1,634,953 Realized Investment lncome(a) 199,869 418,808 543,425 Net Interest (Loss)(b) (51,623) (44,181) (36,511) Taxes and Related Payables(c) (167,149) (90,470) (280,788) Equity-Based Compensation(d) 79,571 103,044 48,226 Distributable Earnings Distributable Earnings $2,176,287 $3,843,688 $3,063,958 Net Unrealized Incentive Fees (b) 28,595 (4,759) (10,149) Net Unrealized Carried Interest(b) 168,403 (1,282,600) 1,329,924 Unrealized Investment Income (Loss)(a) 20,421 (365,959) (71,797) Add Back: Related Payables(e) 74,886 62,943 81,276 Less: Equity-Based Compensation(d) (79,571) (103,044) (48,226) Economic Net Income Economic Net Income $2,389,021 $2,150,269 $4,344,986
130
Table of Contents
(Dollars in Thousands) 2016 2015 2014 Operating Expenses(a) $629,342 $624,357 $553,782 Less: Interest Expense (197,506) (175,782) (132,855) Non-Interest Operating Expenses $431,836 $448,575 $420,927 Realized Incentive Fees(a) 172,101 194,746 261,745 Less: Realized Incentive Fee Compensation(a) (78,096) (85,946) (110,099) Net Realized Incentive Fees $94,005 $108,800 $151,646 Realized Carried Interest(a) 1,474,915 3,205,876 2,450,596 Less: Realized Carried Interest Compensation(a) (455,954) (793,800) (815,643) Net Realized Carried Interest $1,018,961 $2,412,076 $1,634,953 Interest Income and Dividend Revenue(a) 145,883 131,601 96,344 Less: Interest Expense (197,506) (175,782) (132,855) Net Interest (Loss) $(51,623) $(44,181) $(36,511) Equity-Based Compensation(b) $79,571 $103,044 $48,226 Taxes and Related Payables(c) $(167,149) $(90,470) $(280,788) Unrealized Incentive Fees(a) 49,729 (7,249) (29,425) Less: Unrealized Incentive Fee Compensation(a) (21,134) 2,490 19,276 Net Unrealized Incentive Fees $28,595 $(4,759) $(10,149) Unrealized Carried Interest(a) 481,241 (1,595,296) 1,708,961 Less: Unrealized Carried Interest Compensation(a) (312,838) 312,696 (379,037) Net Unrealized Carried Interest $168,403 $(1,282,600) $1,329,924 Related Payables(d) $74,886 $62,943 $81,276
The following calculates the components of Fee Related Earnings, Distributable Earnings and Economic Net Income in the above table identified by note (b):
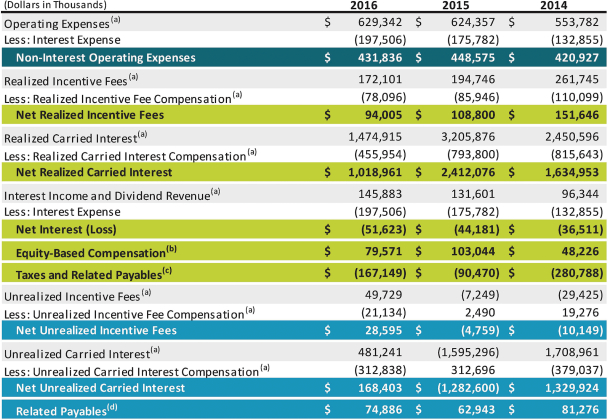
| (a) | Represents the total segment amounts of the respective captions. See Note 21. “Segment Reporting” in the “Notes to Consolidated Financial Statements” in “— Item 8. Financial Statements and Supplementary Data” of this filing. |
| (b) | Represents equity-based award expense included in Economic Income, which excludes all transaction-related equity-based charges. |
| (c) | Taxes and Related Payables Including Payable Under Tax Receivable Agreement represents the total GAAP tax provision adjusted to include only the current tax provision (benefit) calculated on Income (Loss) Before Provision for Taxes and the Payable Under Tax Receivable Agreement. |
| (d) | Represents tax-related payables including the Payable Under Tax Receivable Agreement, which is a component of Taxes and Related Payables. |
131
Table of Contents
The following table is a reconciliation of Net Income (Loss) Attributable to The Blackstone Group L.P. to Economic Income, of Economic Income to Economic Net Income, of Economic Net Income to Fee Related Earnings, of Fee Related Earnings to Distributable Earnings and of Distributable Earnings to Adjusted Earnings Before Interest, Taxes and Depreciation and Amortization:
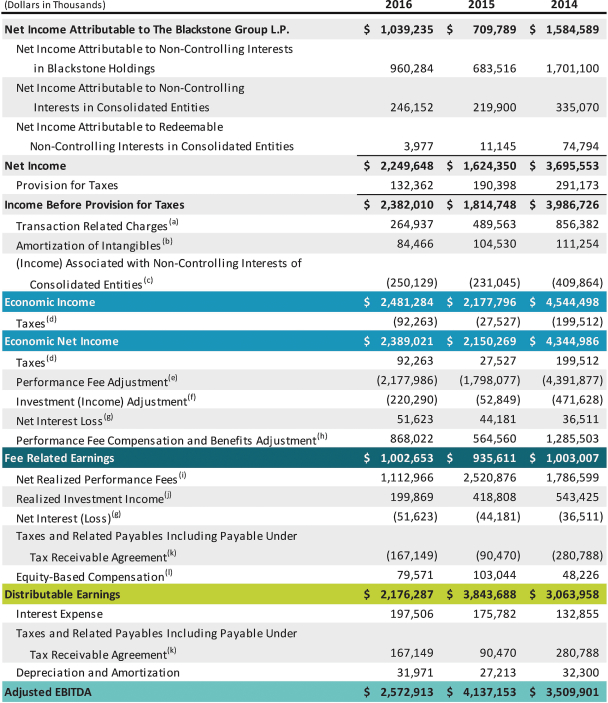
(Dollars in Thousands) 2016 2015 2014 Net Income Attributable to The Blackstone Group L.P. $1,039,235 $709,789 $1,584,589 Net Income Attributable to Non-Controlling Interests in Blackstone Holdings 960,284 683,516 1,701,100 Net Income Attributable to Non-Controlling Interests in Consolidated Entities 246,152 219,900 335,070 Net Income Attributable to Redeemable Non-Controlling Interests in Consolidated Entities 3,977 11,145 74,794 Net Income $2,249,648 $1,624,350 $3,695,553 Provision for Taxes 132,362 190,398 291,173 Income Before Provision for Taxes $2,382,010 $1,814,748 $3,986,726 Transaction Related Charges(a) 264,937 489,563 856,382 Amortization of lntangibles(b) 84,466 104,530 111,254 (Income) Associated with Non-Controlling Interests of Consolidated Entities(c) (250,129) (231,045) (409,864) Economic Income $2,481,284 $2,177,796 $4,544,498 Taxes (d) (92,263) (27,527) (199,512) Economic Net Income $2,389,021 $2,150,269 $4,344,986 Taxes (d) 92,263 27,527 199,512 Performance Fee Adjustment(e) (2,177,986) (1,798,077) (4,391,877) Investment (Income) Adjustment(f) (220,290) (52,849) (471,628) Net Interest Loss (g) 51,623 44,181 36,511 Performance Fee Compensation and Benefits Adjustment(h) 868,022 564,560 1,285,503 Fee Related Earnings $1,002,653 $935,611 $1,003,007 Net Realized Performance Fees(i) 1,112,966 2,520,876 1,786,599 ReaIized Investment Income(j) 199,869 418,808 543,425 Net Interest (Loss)(g) (51,623) (44,181) (36,511) Taxes and Related Payables Including Payable Under Tax Receivable Agreement(k) (167,149) (90,470) (280,788) Equity-Based Compensation(l) 79,571 103,044 48,226 Distributable Earnings $2,176,287 $3,843,688 $3,063,958 Interest Expense 197,506 175,782 132,855 Taxes and Related Payables Including Payable Under Tax Receivable Agreement(k) 167,149 90,470 280,788 Depreciation and Amortization 31,971 27,213 32,300 Adjusted EBITDA $2,572,913 $4,137,153 $3,509,901
132
Table of Contents
| (a) | This adjustment adds back to Income (Loss) Before Provision (Benefit) for Taxes amounts for Transaction-Related Charges which include principally equity-based compensation charges associated with Blackstone’s IPO and long-term retention programs outside of annual deferred compensation and other corporate actions. |
| (b) | This adjustment adds back to Income (Loss) Before Provision (Benefit) for Taxes amounts for the Amortization of Intangibles which are associated with Blackstone’s IPO and other corporate actions. |
| (c) | This adjustment adds back to Income (Loss) Before Provision (Benefit) for Taxes the amount of (Income) Loss Associated with Non-Controlling Interests of Consolidated Entities and includes the amount of Management Fee Revenues associated with consolidated CLO entities. |
| (d) | Taxes represent the total GAAP tax provision adjusted to include only the current tax provision (benefit) calculated on Income (Loss) Before Provision (Benefit) for Taxes. |
| (e) | This adjustment removes from EI the total segment amount of Performance Fees. |
| (f) | This adjustment removes from EI the total segment amount of Investment Income. |
| (g) | This adjustment represents Interest Income and Dividend Revenue less Interest Expense. |
| (h) | This adjustment removes from expenses the compensation and benefit amounts related to Blackstone’s profit sharing plans related to Performance Fees. |
| (i) | Represents the adjustment for realized Performance Fees net of corresponding actual amounts due under Blackstone’s profit sharing plans related thereto. Equals the sum of Net Realized Incentive Fees and Net Realized Carried Interest. |
| (j) | Represents the adjustment for Blackstone’s Realized Investment Income. |
| (k) | Taxes and Related Payables Including Payable Under Tax Receivable Agreement represent the total GAAP tax provision adjusted to include only the current tax provision (benefit) calculated on Income (Loss) Before Provision (Benefit) for Taxes and the Payable Under Tax Receivable Agreement. |
| (l) | Represents equity-based award expense included in EI, which excludes all transaction-related equity-based charges. |
Distributions
Distributable Earnings, which is derived from Blackstone’s segment reported results, is a supplemental measure to assess performance and amounts available for distributions to Blackstone unitholders, including Blackstone personnel and others who are limited partners of the Blackstone Holdings Partnerships. Distributable Earnings is intended to show the amount of net realized earnings without the effects of the consolidation of the Blackstone Funds. Distributable Earnings, which is a component of Economic Net Income, is the sum across all segments of: (a) Total Management and Advisory Fees, (b) Interest and Dividend Revenue, (c) Other Revenue, (d) Realized Performance Fees, and (e) Realized Investment Income (Loss); less (a) Compensation, excluding the expense of equity-based awards, (b) Realized Performance Fee Compensation, (c) Other Operating Expenses, and (d) Taxes and Related Payables Including the Payable Under Tax Receivable Agreement.
Our intention is to distribute quarterly to common unitholders approximately 85% of The Blackstone Group L.P.’s share of Distributable Earnings, subject to adjustment by amounts determined by Blackstone’s general partner to be necessary or appropriate to provide for the conduct of its business, to make appropriate investments in its business and funds, to comply with applicable law, any of its debt instruments or other agreements, or to provide for future cash requirements such as tax-related payments, clawback obligations and distributions to unitholders for any ensuing quarter. The amount to be distributed could also be adjusted upward in any one quarter.
All of the foregoing is subject to the qualification that the declaration and payment of any distributions are at the sole discretion of our general partner, and our general partner may change our distribution policy at any time, including, without limitation, to reduce the quarterly distribution payable to our common unitholders or even to eliminate such distributions entirely.
Because the subsidiaries of The Blackstone Group L.P. must pay taxes and make payments under the tax receivable agreements, the amounts ultimately distributed by The Blackstone Group L.P. to its common unitholders
133
Table of Contents
in respect of each fiscal year are generally expected to be less, on a per unit basis, than the amounts distributed by the Blackstone Holdings Partnerships to the Blackstone personnel and others who are limited partners of the Blackstone Holdings Partnerships in respect of their Blackstone Holdings Partnership Units.
The following graph shows fiscal quarterly and annual per common unitholder distributions for 2014, 2015 and 2016. Distributions are declared and paid in the quarter subsequent to the quarter in which they are earned.
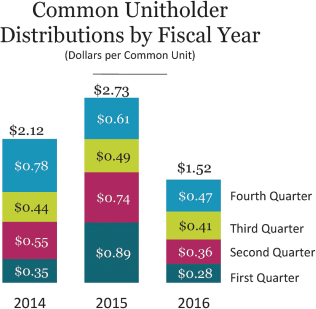
With respect to fiscal year 2016, we have paid to common unitholders distributions of $0.28, $0.36, $0.41 and $0.47 per common unit in respect of the first, second, third and fourth quarters, respectively, aggregating $1.52 per common unit. With respect to fiscal years 2015 and 2014, we paid aggregate common unitholder distributions of $2.73 per common unit and $2.12 per common unit, respectively.
With respect to fiscal year 2016, we have paid to the Blackstone personnel and others who are limited partners of the Blackstone Holdings Partnerships distributions of $0.28, $0.37, $0.45 and $0.53 per Blackstone Holdings Partnership Unit in respect of the first, second, third and fourth quarters, respectively, aggregating $1.63 per Blackstone Holdings Partnership Unit. With respect to fiscal years 2015 and 2014, we paid aggregate distributions of $2.78 per Blackstone Holdings Partnership Unit and $2.46 per Blackstone Holdings Partnership Unit, respectively.
Leverage
We may under certain circumstances use leverage opportunistically and over time to create the most efficient capital structure for Blackstone and our public common unitholders. In addition to the borrowings from our bond issuances and our revolving credit facility, we may use reverse repurchase agreements, repurchase agreements and securities sold, not yet purchased. All of these positions are held in a separately managed portfolio. Reverse repurchase agreements are entered into primarily to take advantage of opportunistic yields otherwise absent in the overnight markets and also to use the collateral received to cover securities sold, not yet purchased. Repurchase agreements are entered into primarily to opportunistically yield higher spreads on purchased securities. The balances held in these financial instruments fluctuate based on Blackstone’s liquidity needs, market conditions and investment risk profiles.
Common Unitholder Distributions by Fiscal Year (Dollars per Common Unit)
134
Table of Contents
Generally our funds in our private equity segment, our opportunistic, real estate funds, funds of hedge funds and certain credit-focused funds have not utilized substantial leverage at the fund level other than for (a) short-term borrowings between the date of an investment and the receipt of capital from the investing fund’s investors, and (b) long-term borrowings for certain investments in aggregate amounts which are generally 1% to 25% of the capital commitments of the respective fund. Our carry funds make direct or indirect investments in companies that utilize leverage in their capital structure. The degree of leverage employed varies among portfolio companies.
Certain of our Real Estate debt hedge funds, Hedge Fund Solutions funds and credit-focused funds use leverage in order to obtain additional market exposure, enhance returns on invested capital and/or to bridge short-term cash needs. The forms of leverage primarily employed by these funds include purchasing securities on margin, utilizing collateralized financing and using derivative instruments.
The following table presents information regarding these financial instruments in our Consolidated Statements of Financial Condition:
| Reverse Repurchase Agreements |
Repurchase Agreements |
Securities Sold, Not Yet Purchased |
||||||||||
| (Dollars in Millions) | ||||||||||||
| Balance, December 31, 2016 |
$ | 118.5 | $ | 75.3 | $ | 215.4 | ||||||
| Balance, December 31, 2015 |
$ | 204.9 | $ | 40.9 | $ | 176.7 | ||||||
| Year Ended December 31, 2016 |
||||||||||||
| Average Daily Balance |
$ | 61.7 | $ | 62.3 | $ | 146.4 | ||||||
| Maximum Daily Balance |
$ | 230.9 | $ | 94.9 | $ | 223.5 | ||||||
Critical Accounting Policies
We prepare our Consolidated Financial Statements in accordance with GAAP. In applying many of these accounting principles, we need to make assumptions, estimates and/or judgments that affect the reported amounts of assets, liabilities, revenues and expenses in our consolidated financial statements. We base our estimates and judgments on historical experience and other assumptions that we believe are reasonable under the circumstances. These assumptions, estimates and/or judgments, however, are often subjective. Actual results may be affected negatively based on changing circumstances. If actual amounts are ultimately different from our estimates, the revisions are included in our results of operations for the period in which the actual amounts become known. We believe the following critical accounting policies could potentially produce materially different results if we were to change underlying assumptions, estimates and/or judgments. (See Note 2. “Summary of Significant Accounting Policies” in the “Notes to Consolidated Financial Statements” in “— Item 8. Financial Statements and Supplementary Data” of this filing.)
Principles of Consolidation
The Partnership consolidates all entities that it controls through a majority voting interest or otherwise, including those Blackstone Funds in which the general partner has a controlling financial interest. The Partnership has a controlling interest in Blackstone Holdings because the limited partners do not have the right to dissolve the partnerships or have substantive kick out rights or participating rights that would overcome the presumption of control by the Partnership. Accordingly, the Partnership consolidates Blackstone Holdings and records non-controlling interests to reflect the economic interests of the limited partners of Blackstone Holdings.
In addition, the Partnership consolidates all variable interest entities (“VIE”) in which it is the primary beneficiary. An enterprise is determined to be the primary beneficiary if it holds a controlling financial interest. A controlling financial interest is defined as (a) the power to direct the activities of a VIE that most significantly impact the entity’s economic performance and (b) the obligation to absorb losses of the entity or the right to receive benefits from the entity that could potentially be significant to the VIE. The consolidation guidance requires an
135
Table of Contents
analysis to determine (a) whether an entity in which the Partnership holds a variable interest is a VIE and (b) whether the Partnership’s involvement, through holding interests directly or indirectly in the entity or contractually through other variable interests (for example, management and performance related fees), would give it a controlling financial interest. Performance of that analysis requires the exercise of judgment.
The Partnership determines whether it is the primary beneficiary of a VIE at the time it becomes involved with a variable interest entity and reconsiders that conclusion continually. In evaluating whether the Partnership is the primary beneficiary, Blackstone evaluates its economic interests in the entity held either directly or indirectly by the Partnership. The consolidation analysis can generally be performed qualitatively; however, if it is not readily apparent that the Partnership is not the primary beneficiary, a quantitative analysis may also be performed. Investments and redemptions (either by the Partnership, affiliates of the Partnership or third parties) or amendments to the governing documents of the respective Blackstone Funds could affect an entity’s status as a VIE or the determination of the primary beneficiary. At each reporting date, the Partnership assesses whether it is the primary beneficiary and will consolidate or deconsolidate accordingly.
Assets of consolidated VIEs that can only be used to settle obligations of the consolidated VIE and liabilities of a consolidated VIE for which creditors (or beneficial interest holders) do not have recourse to the general credit of Blackstone are presented in a separate section in the Consolidated Statements of Financial Condition.
Revenue Recognition
Revenues primarily consist of management and advisory fees, performance fees, investment income, interest and dividend revenue and other. Please refer to “Part I. Item 1. Business — Incentive Arrangements / Fee Structure” for additional information regarding the manner in which Base Management Fees and Performance Fees are generated.
Management and Advisory Fees, Net — Management and Advisory Fees, Net are comprised of management fees, including base management fees, transaction and other fees and advisory fees net of management fee reductions and offsets.
The Partnership earns base management fees from limited partners of funds in each of its managed funds, at a fixed percentage of assets under management, net asset value, total assets, committed capital or invested capital, or in some cases, a fixed fee. Base management fees are recognized based on contractual terms specified in the underlying investment advisory agreements. The range of management fee rates and the calculation base from which they are earned, generally, are as follows:
On private equity, real estate, and certain of our hedge fund solutions and credit-focused funds:
| • | 0.25% to 2.00% of committed capital or invested capital during the investment period, |
| • | 0.50% to 1.75% of invested capital or investment fair value subsequent to the investment period for private equity and real estate funds, and |
| • | 1.00% to 1.50% of invested capital or net asset value subsequent to the investment period for certain credit-focused funds. |
On real estate and credit-focused funds structured like hedge funds:
| • | 0.50% to 1.50% of net asset value. |
On credit-focused separately managed accounts:
| • | 0.35% to 1.50% of net asset value. |
136
Table of Contents
On real estate separately managed accounts:
| • | 0.50% to 2.00% of invested capital, net operating income or net asset value. |
On funds of hedge funds and separately managed accounts invested in hedge funds:
| • | 0.50% to 1.25% of net asset value. |
On CLO vehicles:
| • | 0.40% to 0.65% of the aggregate par amount of collateral assets, including principal cash. |
On credit-focused registered and non-registered investment companies:
| • | 0.35% to 1.50% of total assets or net asset value. |
The investment adviser of BXMT receives annual management fees based upon 1.50% of BXMT’s net proceeds received from equity offerings and accumulated “core earnings” (which is generally equal to its GAAP net income excluding certain non-cash and other items), subject to certain adjustments. The investment adviser of our non-exchange traded REIT receives a management fee of 1.25% per annum of net asset value, payable monthly.
Transaction and other fees (including monitoring fees) are fees charged directly to managed funds and portfolio companies. The investment advisory agreements generally require that the investment adviser reduce the amount of management fees payable by the limited partners to the Partnership (“management fee reductions”) by an amount equal to a portion of the transaction and other fees directly paid to the Partnership by the portfolio companies. The amount of the reduction varies by fund, the type of fee paid by the portfolio company and the previously incurred expenses of the fund.
Management fee offsets are reductions to management fees payable by the limited partners of the Blackstone Funds, which are granted based on the amount such limited partners reimburse the Blackstone Funds for placement fees.
Advisory fees consist of transaction-based fee arrangements. Transaction-based fees are recognized when (a) there is evidence of an arrangement with a client, (b) agreed upon services have been provided, (c) fees are fixed or determinable, and (d) collection is reasonably assured.
Accrued but unpaid Management and Advisory Fees, net of management fee reductions and management fee offsets, as of the reporting date are included in Accounts Receivable or Due from Affiliates in the Consolidated Statements of Financial Condition. Management fees paid by limited partners to the Blackstone Funds and passed on to Blackstone are not considered affiliate revenues.
Performance Fees — Performance Fees earned on the performance of Blackstone’s hedge fund structures (“Incentive Fees”) are recognized based on fund performance during the period, subject to the achievement of minimum return levels, or high water marks, in accordance with the respective terms set out in each hedge fund’s governing agreements. Accrued but unpaid Incentive Fees charged directly to investors in Blackstone’s offshore hedge funds as of the reporting date are recorded within Due from Affiliates in the Consolidated Statements of Financial Condition. Accrued but unpaid Incentive Fees on onshore funds as of the reporting date are reflected in Investments in the Consolidated Statements of Financial Condition. Incentive Fees are realized at the end of a measurement period, typically annually. Once realized, such fees are not subject to clawback or reversal.
In certain fund structures, specifically in private equity, real estate and certain hedge fund solutions and credit-focused funds (“carry funds”), performance fees (“Carried Interest”) are allocated to the general partner based on cumulative fund performance to date, subject to a preferred return to limited partners. At the end of each reporting period, the Partnership calculates the Carried Interest that would be due to the Partnership for each fund, pursuant to
137
Table of Contents
the fund agreements, as if the fair value of the underlying investments were realized as of such date, irrespective of whether such amounts have been realized. As the fair value of underlying investments varies between reporting periods, it is necessary to make adjustments to amounts recorded as Carried Interest to reflect either (a) positive performance resulting in an increase in the Carried Interest allocated to the general partner or (b) negative performance that would cause the amount due to the Partnership to be less than the amount previously recognized as revenue, resulting in a negative adjustment to Carried Interest allocated to the general partner. In each scenario, it is necessary to calculate the Carried Interest on cumulative results compared to the Carried Interest recorded to date and make the required positive or negative adjustments. The Partnership ceases to record negative Carried Interest allocations once previously recognized Carried Interest allocations for such fund have been fully reversed. The Partnership is not obligated to pay guaranteed returns or hurdles, and therefore, cannot have negative Carried Interest over the life of a fund. Accrued but unpaid Carried Interest as of the reporting date is reflected in Investments in the Consolidated Statements of Financial Condition.
Carried Interest is realized when an underlying investment is profitably disposed of and the fund’s cumulative returns are in excess of the preferred return or, in limited instances, after certain thresholds for return of capital are met. Carried Interest is subject to clawback to the extent that the Carried Interest received to date exceeds the amount due to Blackstone based on cumulative results. As such, the accrual for potential repayment of previously received Carried Interest, which is a component of Due to Affiliates, represents all amounts previously distributed to Blackstone Holdings and non-controlling interest holders that would need to be repaid to the Blackstone carry funds if the Blackstone carry funds were to be liquidated based on the current fair value of the underlying funds’ investments as of the reporting date. The actual clawback liability, however, generally does not become realized until the end of a fund’s life except for certain funds, including certain Blackstone real estate funds, multi-asset class investment funds and credit-focused funds, which may have an interim clawback liability.
Investment Income (Loss) — Investment Income (Loss) represents the unrealized and realized gains and losses on the Partnership’s principal investments, including its investments in Blackstone Funds that are not consolidated, its equity method investments, and other principal investments. Investment Income (Loss) is realized when the Partnership redeems all or a portion of its investment or when the Partnership receives cash income, such as dividends or distributions. Unrealized Investment Income (Loss) results from changes in the fair value of the underlying investment as well as the reversal of unrealized gain (loss) at the time an investment is realized.
Interest and Dividend Revenue — Interest and Dividend Revenue comprises primarily interest and dividend income earned on principal investments held by Blackstone.
Other Revenue — Other Revenue consists of miscellaneous income and foreign exchange gains and losses arising on transactions denominated in currencies other than U.S. dollars.
Expenses
Our expenses include compensation and benefits expense and general and administrative expenses. Our accounting policies related thereto are as follows:
Compensation and Benefits — Compensation — Compensation and Benefits consists of (a) employee compensation, comprising salary and bonus, and benefits paid and payable to employees and senior managing directors and (b) equity-based compensation associated with the grants of equity-based awards to employees and senior managing directors. Compensation cost relating to the issuance of equity-based awards to senior managing directors and employees is measured at fair value at the grant date, taking into consideration expected forfeitures, and expensed over the vesting period on a straight-line basis, except in the case of (a) equity-based awards that do not require future service, which are expensed immediately, and (b) certain awards to recipients that meet specified criteria making them eligible for retirement treatment (allowing such recipient to keep a percentage of those awards upon departure from Blackstone after becoming eligible for retirement), for which the expense for the portion of the award that would be retained in the event of retirement is either expensed immediately or amortized to the
138
Table of Contents
retirement date. Cash settled equity-based awards are classified as liabilities and are remeasured at the end of each reporting period.
Compensation and Benefits — Performance Fee — Performance Fee Compensation consists of Carried Interest (which may be distributed in cash or in-kind) and Incentive Fee allocations, and may in future periods also include allocations of investment income from Blackstone’s firm investments, to employees and senior managing directors participating in certain profit sharing initiatives. Such compensation expense is subject to both positive and negative adjustments. Unlike Carried Interest and Incentive Fees, compensation expense is based on the performance of individual investments held by a fund rather than on a fund by fund basis. Compensation received from advisory clients in the form of securities of such clients may also be allocated to employees and senior managing directors.
Fair Value of Financial Instruments
GAAP establishes a hierarchical disclosure framework which prioritizes and ranks the level of market price observability used in measuring financial instruments at fair value. Market price observability is affected by a number of factors, including the type of financial instrument, the characteristics specific to the financial instrument and the state of the marketplace, including the existence and transparency of transactions between market participants. Financial instruments with readily available quoted prices in active markets generally will have a higher degree of market price observability and a lesser degree of judgment used in measuring fair value.
Financial instruments measured and reported at fair value are classified and disclosed based on the observability of inputs used in the determination of fair values, as follows:
| • | Level I — Quoted prices are available in active markets for identical financial instruments as of the reporting date. The types of financial instruments in Level I include listed equities, listed derivatives and mutual funds with quoted prices. The Partnership does not adjust the quoted price for these investments, even in situations where Blackstone holds a large position and a sale could reasonably impact the quoted price. |
| • | Level II — Pricing inputs are other than quoted prices in active markets, which are either directly or indirectly observable as of the reporting date, and fair value is determined through the use of models or other valuation methodologies. Financial instruments which are generally included in this category include corporate bonds and loans, including corporate bonds and loans held within CLO vehicles, government and agency securities, less liquid and restricted equity securities, and certain over-the-counter derivatives where the fair value is based on observable inputs. Senior and subordinated notes issued by CLO vehicles are classified within Level II of the fair value hierarchy. |
| • | Level III — Pricing inputs are unobservable for the financial instruments and includes situations where there is little, if any, market activity for the financial instrument. The inputs into the determination of fair value require significant management judgment or estimation. Financial instruments that are included in this category generally include general and limited partnership interests in private equity and real estate funds, credit-focused funds, distressed debt and non-investment grade residual interests in securitizations, certain corporate bonds and loans held within CLO vehicles, and certain over-the-counter derivatives where the fair value is based on unobservable inputs. |
In certain cases, the inputs used to measure fair value may fall into different levels of the fair value hierarchy. In such cases, the determination of which category within the fair value hierarchy is appropriate for any given financial instrument is based on the lowest level of input that is significant to the fair value measurement. The Partnership’s assessment of the significance of a particular input to the fair value measurement in its entirety requires judgment and considers factors specific to the financial instrument.
Transfers between levels of the fair value hierarchy are recognized at the beginning of the reporting period.
139
Table of Contents
Level II Valuation Techniques
Financial instruments classified within Level II of the fair value hierarchy comprise debt instruments, including certain corporate loans and bonds held by Blackstone’s consolidated CLO vehicles and debt securities sold, not yet purchased. Certain equity securities and derivative instruments valued using observable inputs are also classified as Level II.
The valuation techniques used to value financial instruments classified within Level II of the fair value hierarchy are as follows:
| • | Debt Instruments and Equity Securities are valued on the basis of prices from an orderly transaction between market participants provided by reputable dealers or pricing services. In determining the value of a particular investment, pricing services may use certain information with respect to transactions in such investments, quotations from dealers, pricing matrices and market transactions in comparable investments and various relationships between investments. The valuation of certain equity securities is based on an observable price for an identical security adjusted for the effect of a restriction. |
| • | Freestanding Derivatives are valued using contractual cash flows and observable inputs comprising yield curves, foreign currency rates and credit spreads. |
| • | Senior and subordinate notes issued by CLO vehicles are classified based on the more observable fair value of CLO assets less (a) the fair value of any beneficial interests held by Blackstone, and (b) the carrying value of any beneficial interests that represent compensation for services. |
Level III Valuation Techniques
In the absence of observable market prices, Blackstone values its investments using valuation methodologies applied on a consistent basis. For some investments little market activity may exist; management’s determination of fair value is then based on the best information available in the circumstances, and may incorporate management’s own assumptions and involves a significant degree of judgment, taking into consideration a combination of internal and external factors, including the appropriate risk adjustments for non-performance and liquidity risks. Investments for which market prices are not observable include private investments in the equity of operating companies, real estate properties, certain funds of hedge funds and credit-focused investments.
Private Equity Investments — The fair values of private equity investments are determined by reference to projected net earnings, earnings before interest, taxes, depreciation and amortization (“EBITDA”), the discounted cash flow method, public market or private transactions, valuations for comparable companies and other measures which, in many cases, are based on unaudited information at the time received. Valuations may be derived by reference to observable valuation measures for comparable companies or transactions (for example, multiplying a key performance metric of the investee company, such as EBITDA, by a relevant valuation multiple observed in the range of comparable companies or transactions), adjusted by management for differences between the investment and the referenced comparables, and in some instances by reference to option pricing models or other similar methods. Where a discounted cash flow method is used, a terminal value is derived by reference to EBITDA or price/earnings exit multiples.
Real Estate Investments — The fair values of real estate investments are determined by considering projected operating cash flows, sales of comparable assets, if any, and replacement costs among other measures. The methods used to estimate the fair value of real estate investments include the discounted cash flow method and/or capitalization rates (“cap rates”) analysis. Valuations may be derived by reference to observable valuation measures for comparable companies or assets (for example, multiplying a key performance metric of the investee company or asset, such as EBITDA, by a relevant valuation multiple observed in the range of comparable companies or transactions), adjusted by management for differences between the investment and the referenced comparables, and in some instances by reference to option pricing models or other similar methods. Where a discounted cash flow method is used, a terminal value is derived by reference to an exit EBITDA multiple or capitalization rate.
140
Table of Contents
Additionally, where applicable, projected distributable cash flow through debt maturity will be considered in support of the investment’s fair value.
Credit-Focused Investments — The fair values of credit-focused investments are generally determined on the basis of prices between market participants provided by reputable dealers or pricing services. For credit-focused investments that are not publicly traded or whose market prices are not readily available, Blackstone may utilize other valuation techniques, including the discounted cash flow method or a market approach. The discounted cash flow method projects the expected cash flows of the debt instrument based on contractual terms, and discounts such cash flows back to the valuation date using a market-based yield. The market-based yield is estimated using yields of publicly traded debt instruments issued by companies operating in similar industries as the subject investment, with similar leverage statistics and time to maturity.
The market approach is generally used to determine the enterprise value of the issuer of a credit investment, and considers valuation multiples of comparable companies or transactions. The resulting enterprise value will dictate whether or not such credit investment has adequate enterprise value coverage. In cases of distressed credit instruments, the market approach may be used to estimate a recovery value in the event of a restructuring.
Level III Valuation Process
Investments classified within Level III of the fair value hierarchy are valued on a quarterly basis, taking into consideration factors including any changes in Blackstone’s weighted-average cost of capital assumptions, discounted cash flow projections and exit multiple assumptions, as well as any changes in economic and other relevant conditions, and valuation models are updated accordingly. The valuation process also includes a review by an independent valuation party, at least annually for all investments, and quarterly for certain investments, to corroborate the values determined by management. The valuations of Blackstone’s investments are reviewed quarterly by a valuation committee chaired by Blackstone’s Vice Chairman and includes senior heads of each of Blackstone’s businesses, as well as representatives of legal and finance. Each quarter, the valuations of Blackstone’s investments are also reviewed by the Audit Committee in a meeting attended by the chairman of the valuation committee. The valuations are further tested by comparison to actual sales prices obtained on disposition of the investments.
Investments, at Fair Value
The Blackstone Funds are accounted for as investment companies under the American Institute of Certified Public Accountants Accounting and Auditing Guide, Investment Companies, and reflect their investments, including majority-owned and controlled investments (the “Portfolio Companies”), at fair value. Such consolidated funds’ investments are reflected in Investments on the Consolidated Statements of Financial Condition at fair value, with unrealized gains and losses resulting from changes in fair value reflected as a component of Net Gains (Losses) from Fund Investment Activities in the Consolidated Statements of Operations. Fair value is the amount that would be received to sell an asset or paid to transfer a liability, in an orderly transaction between market participants at the measurement date, at current market conditions (i.e., the exit price).
Blackstone’s principal investments are presented at fair value with unrealized appreciation or depreciation and realized gains and losses recognized in the Consolidated Statements of Operations within Investment Income (Loss).
For certain instruments, the Partnership has elected the fair value option. Such election is irrevocable and is applied on an investment by investment basis at initial recognition. The Partnership has applied the fair value option for certain loans and receivables and certain investments in private debt securities that otherwise would not have been carried at fair value with gains and losses recorded in net income. Accounting for these financial instruments at fair value is consistent with how the Partnership accounts for its other principal investments. Loans extended to third parties are recorded within Accounts Receivable within the Consolidated Statements of Financial Condition. Debt securities for which the fair value option has been elected are recorded within Investments. The methodology
141
Table of Contents
for measuring the fair value of such investments is consistent with the methodology applied to private equity, real estate, credit-focused and funds of hedge funds investments. Changes in the fair value of such instruments are recognized in Investment Income (Loss) in the Consolidated Statements of Operations. Interest income on interest bearing loans and receivables and debt securities on which the fair value option has been elected is based on stated coupon rates adjusted for the accretion of purchase discounts and the amortization of purchase premiums. This interest income is recorded within Interest and Dividend Revenue.
In addition, the Partnership has elected the fair value option for the assets and liabilities of CLO vehicles that are consolidated as of January 1, 2010, as a result of the initial adoption of variable interest entity consolidation guidance. The Partnership has also elected the fair value option for CLO vehicles consolidated as a result of the acquisitions of CLO management contracts or the acquisition of the share capital of CLO managers. Historically, the adjustment resulting from the difference between the fair value of assets and liabilities for each of these events was presented as a transition and acquisition adjustment to Appropriated Partners’ Capital. Assets of the consolidated CLOs are presented within Investments within the Consolidated Statements of Financial Condition and Liabilities within Loans Payable for the amounts due to unaffiliated third parties and Due to Affiliates for the amounts held by non-consolidated affiliates. Changes in the fair value of consolidated CLO assets and liabilities and related interest, dividend and other income subsequent to adoption and acquisition are presented within Net Gains (Losses) from Fund Investment Activities. Expenses of consolidated CLO vehicles are presented in Fund Expenses. Historically, amounts attributable to Non-Controlling Interests in Consolidated Entities had a corresponding adjustment to Appropriated Partners’ Capital. On the adoption of the new CLO measurement guidance, there is no attribution of amounts to Non-Controlling Interests and no corresponding adjustments to Appropriated Partners’ Capital.
The Partnership has elected the fair value option for certain proprietary investments that would otherwise have been accounted for using the equity method of accounting. The fair value of such investments is based on quoted prices in an active market or using the discounted cash flow method. Changes in fair value are recognized in Investment Income (Loss) in the Consolidated Statements of Operations.
Further disclosure on instruments for which the fair value option has been elected is presented in Note 7. “Fair Value Option” in the “Notes to Consolidated Financial Statements” in “— Item 8. Financial Statements and Supplementary Data” of this filing.
The investments of consolidated Blackstone Funds in funds of hedge funds (“Investee Funds”) are valued at net asset value (“NAV”) per share of the Investee Fund. In limited circumstances, the Partnership may determine, based on its own due diligence and investment procedures, that NAV per share does not represent fair value. In such circumstances, the Partnership will estimate the fair value in good faith and in a manner that it reasonably chooses, in accordance with the requirements of GAAP.
Certain investments of Blackstone and of the consolidated Blackstone funds of hedge funds and credit-focused funds measure their investments in underlying funds at fair value using NAV per share without adjustment. The terms of the investee’s investment generally provide for minimum holding periods or lock-ups, the institution of gates on redemptions or the suspension of redemptions or an ability to side pocket investments, at the discretion of the investee’s fund manager, and as a result, investments may not be redeemable at, or within three months of, the reporting date. A side pocket is used by hedge funds and funds of hedge funds to separate investments that may lack a readily ascertainable value, are illiquid or are subject to liquidity restriction. Redemptions are generally not permitted until the investments within a side pocket are liquidated or it is deemed that the conditions existing at the time that required the investment to be included in the side pocket no longer exist. As the timing of either of these events is uncertain, the timing at which the Partnership may redeem an investment held in a side pocket cannot be estimated. Further disclosure on instruments for which fair value is measured using NAV per share is presented in Note 5. “Net Asset Value as Fair Value” in the “Notes to Consolidated Financial Statements” in “— Item 8. Financial Statements and Supplementary Data” of this filing.
142
Table of Contents
Intangibles and Goodwill
Blackstone’s intangible assets consist of contractual rights to earn future fee income, including management and advisory fees, Incentive Fees and Carried Interest. Identifiable finite-lived intangible assets are amortized on a straight-line basis over their estimated useful lives, ranging from 3 to 20 years, reflecting the contractual lives of such assets. Amortization expense is included within General, Administrative and Other in the Consolidated Statements of Operations. The Partnership does not hold any indefinite-lived intangible assets. Intangible assets are reviewed for impairment when events or changes in circumstances indicate that the carrying amount may not be recoverable.
Goodwill comprises goodwill arising from the contribution and reorganization of the Partnership’s predecessor entities in 2007 immediately prior to its IPO, the acquisition of GSO in 2008 and the acquisition of Strategic Partners in 2013. Goodwill is reviewed for impairment at least annually utilizing a qualitative or quantitative approach, and more frequently if circumstances indicate impairment may have occurred. The impairment testing for goodwill under the qualitative approach is based first on a qualitative assessment to determine if it is more likely than not that the fair value of Blackstone’s operating segments is less than their respective carrying values. The operating segment is the reporting level for testing the impairment of goodwill. If it is determined that it is more likely than not that an operating segment’s fair value is less than its carrying value or when the quantitative approach is used, a two-step quantitative assessment is performed to (a) calculate the fair value of the operating segment and compare it to its carrying value, and (b) if the carrying value exceeds its fair value, to measure an impairment loss.
Senior management has organized the firm into four operating segments. All of the components in each segment have similar economic characteristics and senior management makes key operating decisions based on the performance of each segment. Therefore, we believe that operating segment is the appropriate reporting level for testing the impairment of goodwill.
The carrying value of goodwill was $1.7 billion as of December 31, 2016 and 2015. At December 31, 2016 and 2015, we determined that there was no evidence of Goodwill impairment.
Off-Balance Sheet Arrangements
In the normal course of business, we enter into various off-balance sheet arrangements including sponsoring and owning limited or general partner interests in consolidated and non-consolidated funds, entering into derivative transactions, entering into operating leases, and entering into guarantee arrangements. We also have ongoing capital commitment arrangements with certain of our consolidated and non-consolidated drawdown funds. We do not have any off-balance sheet arrangements that would require us to fund losses or guarantee target returns to investors in our funds.
Further disclosure on our off-balance sheet arrangements is presented in the “Notes to Consolidated Financial Statements” in “— Item 8. Financial Statements and Supplementary Data” of this filing as follows:
| • | Note 6. “Derivative Financial Instruments”, |
| • | Note 9. “Variable Interest Entities”, and |
| • | Note 18. “Commitments and Contingencies — Commitments, Operating Leases; — Commitments, Investment Commitments; and — Contingencies, Guarantees.” |
Recent Accounting Developments
Information regarding recent accounting developments and their impact on Blackstone can be found in Note 2. “Summary of Significant Accounting Policies” in the “Notes to Consolidated Financial Statements” in “— Item 8. Financial Statements and Supplementary Data” of this filing.
143
Table of Contents
Contractual Obligations, Commitments and Contingencies
The following table sets forth information relating to our contractual obligations as of December 31, 2016 on a consolidated basis and on a basis deconsolidating the Blackstone Funds:
| Contractual Obligations |
2017 | 2018-2019 | 2020-2021 | Thereafter | Total | |||||||||||||||
| (Dollars in Thousands) | ||||||||||||||||||||
| Operating Lease Obligations (a) |
$ | 73,571 | $ | 138,732 | $ | 138,869 | $ | 414,051 | $ | 765,223 | ||||||||||
| Purchase Obligations |
26,656 | 15,476 | 1,946 | — | 44,078 | |||||||||||||||
| Blackstone Issued Notes and Revolving Credit Facility (b) |
— | 585,000 | 400,000 | 2,446,530 | 3,431,530 | |||||||||||||||
| Interest on Blackstone Issued Notes and Revolving Credit Facility (c) |
150,084 | 300,154 | 210,890 | 1,349,717 | 2,010,845 | |||||||||||||||
| Blackstone Funds and CLO Vehicles Debt Obligations Payable (d) |
426,136 | — | — | 5,083,633 | 5,509,769 | |||||||||||||||
| Interest on Blackstone Funds and CLO Vehicles Debt Obligations Payable (e) |
108,739 | 206,622 | 206,622 | 708,578 | 1,230,561 | |||||||||||||||
| Blackstone Funds Capital Commitments to Investee Funds (f) |
269,905 | — | — | — | 269,905 | |||||||||||||||
| Due to Certain Non-Controlling Interest Holders in Connection with Tax Receivable Agreements (g) |
58,470 | 176,176 | 179,326 | 795,137 | 1,209,109 | |||||||||||||||
| Unrecognized Tax Benefits, Including Interest and Penalties (h) |
6,149 | — | — | — | 6,149 | |||||||||||||||
| Blackstone Operating Entities Capital Commitments to Blackstone Funds and Other (i) |
2,466,978 | — | — | — | 2,466,978 | |||||||||||||||
|
|
|
|
|
|
|
|
|
|
|
|||||||||||
| Consolidated Contractual Obligations |
3,586,688 | 1,422,160 | 1,137,653 | 10,797,646 | 16,944,147 | |||||||||||||||
| Blackstone Funds and CLO Vehicles Debt Obligations Payable (d) |
(426,136 | ) | — | — | (5,083,633 | ) | (5,509,769 | ) | ||||||||||||
| Interest on Blackstone Funds and CLO Vehicles Debt Obligations Payable (e) |
(108,739 | ) | (206,622 | ) | (206,622 | ) | (708,578 | ) | (1,230,561 | ) | ||||||||||
| Blackstone Funds Capital Commitments to Investee Funds (f) |
(269,905 | ) | — | — | — | (269,905 | ) | |||||||||||||
|
|
|
|
|
|
|
|
|
|
|
|||||||||||
| Blackstone Operating Entities Contractual Obligations |
$ | 2,781,908 | $ | 1,215,538 | $ | 931,031 | $ | 5,005,435 | $ | 9,933,912 | ||||||||||
|
|
|
|
|
|
|
|
|
|
|
|||||||||||
| (a) | We lease our primary office space and certain office equipment under agreements that expire through 2030. In connection with certain office space lease agreements, we are responsible for escalation payments. The contractual obligation table above includes only guaranteed minimum lease payments for such leases and does not project potential escalation or other lease-related payments. These leases are classified as operating leases for financial statement purposes and as such are not recorded as liabilities on the Consolidated Statements of Financial Condition. The amounts are presented net of contractual sublease commitments. |
| (b) | Represents the principal amount due on the senior notes we issued. As of December 31, 2016, we had no outstanding borrowings under our revolver. |
| (c) | Represents interest to be paid over the maturity of our senior notes and borrowings under our revolving credit facility which has been calculated assuming no pre-payments are made and debt is held until its final maturity date. These amounts exclude commitment fees for unutilized borrowings under our revolver. |
| (d) | These obligations are those of the Blackstone Funds including the consolidated CLO vehicles. |
| (e) | Represents interest to be paid over the maturity of the related consolidated Blackstone Funds’ and CLO vehicles’ debt obligations which has been calculated assuming no pre-payments will be made and debt will be held until its final maturity date. The future interest payments are calculated using variable rates in effect as of |
144
Table of Contents
| December 31, 2016, at spreads to market rates pursuant to the financing agreements, and range from 1.0% to 9.4%. The majority of the borrowings are due on demand and for purposes of this schedule are assumed to mature within one year. Interest on the majority of these borrowings rolls over into the principal balance at each reset date. |
| (f) | These obligations represent commitments of the consolidated Blackstone Funds to make capital contributions to investee funds and portfolio companies. These amounts are generally due on demand and are therefore presented in the less than one year category. |
| (g) | Represents obligations by the Partnership’s corporate subsidiary to make payments under the Tax Receivable Agreements to certain non-controlling interest holders for the tax savings realized from the taxable purchases of their interests in connection with the reorganization at the time of Blackstone’s IPO in 2007 and subsequent purchases. The obligation represents the amount of the payments currently expected to be made, which are dependent on the tax savings actually realized as determined annually without discounting for the timing of the payments. As required by GAAP, the amount of the obligation included in the Consolidated Financial Statements and shown in Note 17. “Related Party Transactions” (see “Item 8. Financial Statements and Supplementary Data”) differs to reflect the net present value of the payments due to certain non-controlling interest holders. |
| (h) | The total represents gross unrecognized tax benefits of $3.3 million and interest and penalties of $2.9 million. In addition, Blackstone is not able to make a reasonably reliable estimate of the timing of payments in individual years in connection with gross unrecognized benefits of $0.3 million and interest of $0.4 million; therefore, such amounts are not included in the above contractual obligations table. |
| (i) | These obligations represent commitments by us to provide general partner capital funding to the Blackstone Funds, limited partner capital funding to other funds and Blackstone principal investment commitments. These amounts are generally due on demand and are therefore presented in the less than one year category; however, a substantial amount of the capital commitments are expected to be called over the next three years. We expect to continue to make these general partner capital commitments as we raise additional amounts for our investment funds over time. |
Guarantees
Blackstone and certain of its consolidated funds provide financial guarantees. The amounts and nature of these guarantees are described in Note 18. “Commitments and Contingencies — Contingencies — Guarantees” in the “Notes to Consolidated Financial Statements” in “— Item 8. Financial Statements and Supplementary Data” of this filing.
Indemnifications
In many of its service contracts, Blackstone agrees to indemnify the third party service provider under certain circumstances. The terms of the indemnities vary from contract to contract and the amount of indemnification liability, if any, cannot be determined and has not been included in the table above or recorded in our Consolidated Financial Statements as of December 31, 2016.
Clawback Obligations
Carried Interest is subject to clawback to the extent that the Carried Interest received to date with respect to a fund exceeds the amount due to Blackstone based on cumulative results of that fund. The actual clawback liability, however, generally does not become realized until the end of a fund’s life except for certain Blackstone real estate funds, multi-asset class investment funds and credit-focused funds, which may have an interim clawback liability.
For financial reporting purposes, when applicable, the general partners record a liability for potential clawback obligations to the limited partners of some of the carry funds due to changes in the unrealized value of a fund’s remaining investments and where the fund’s general partner has previously received Carried Interest distributions with respect to such fund’s realized investments.
145
Table of Contents
As of December 31, 2016, there were no clawback obligations. If, at December 31, 2016, all of the investments held by our carry funds were deemed worthless, a possibility that management views as remote, the amount of carried interest subject to potential clawback would be $5.0 billion, on an after tax basis where applicable, of which Blackstone Holdings is potentially liable for $4.7 billion if current and former Blackstone personnel default on their share of the liability, a possibility that management also views as remote. (See Note 17. “Related Party Transactions” and Note 18. “Commitments and Contingencies” in the “Notes to Consolidated Financial Statements” in “— Item 8. Financial Statements and Supplementary Data” of this filing.)
| ITEM 7A. | QUANTITATIVE AND QUALITATIVE DISCLOSURES ABOUT MARKET RISK |
Our predominant exposure to market risk is related to our role as general partner or investment adviser to the Blackstone Funds and the sensitivities to movements in the fair value of their investments, including the effect on management fees, performance fees and investment income.
Although the Blackstone Funds share many common themes, each of our alternative asset management operations runs its own investment and risk management processes, subject to our overall risk tolerance and philosophy:
| • | The investment process of our carry funds involves a detailed analysis of potential investments, and asset management teams are assigned to oversee the operations, strategic development, financing and capital deployment decisions of each portfolio investment. Key investment decisions are subject to approval by the applicable investment committee, which is comprised of Blackstone senior managing directors and senior management. |
| • | In our capacity as adviser to certain funds in our Hedge Fund Solutions and Credit segments, we continuously monitor a variety of markets for attractive trading opportunities, applying a number of traditional and customized risk management metrics to analyze risk related to specific assets or portfolios. In addition, we perform extensive credit and cash flow analyses of borrowers, credit-based assets and underlying hedge fund managers, and have extensive asset management teams that monitor covenant compliance by, and relevant financial data of, borrowers and other obligors, asset pool performance statistics, tracking of cash payments relating to investments and ongoing analysis of the credit status of investments. |
Effect on Fund Management Fees
Our management fees are based on (a) third parties’ capital commitments to a Blackstone Fund, (b) third parties’ capital invested in a Blackstone Fund or (c) the net asset value, or NAV, of a Blackstone Fund, as described in our Consolidated Financial Statements. Management fees will only be directly affected by short-term changes in market conditions to the extent they are based on NAV or represent permanent impairments of value. These management fees will be increased (or reduced) in direct proportion to the effect of changes in the fair value of our investments in the related funds. The proportion of our management fees that are based on NAV is dependent on the number and types of Blackstone Funds in existence and the current stage of each fund’s life cycle. For the years ended December 31, 2016 and December 31, 2015, the percentages of our fund management fees based on the NAV of the applicable funds or separately managed accounts, were as follows:
| Year Ended December 31, | ||||||||
| 2016 | 2015 | |||||||
| Fund Management Fees Based on the NAV of the Applicable Funds or Separately Managed Accounts |
35 | % | 34 | % | ||||
146
Table of Contents
Market Risk
The Blackstone Funds hold investments which are reported at fair value. Based on the fair value as of December 31, 2016 and December 31, 2015, we estimate that a 10% decline in fair value of the investments would result in the following declines in Management Fees, Performance Fees, Net of Related Compensation Expense and Investment Income:
| December 31, | ||||||||||||||||||||||||
| 2016 | 2015 | |||||||||||||||||||||||
| Management Fees (a) |
Performance Fees, Net of Related Compensation Expense (b) |
Investment Income (b) |
Management Fees (a) |
Performance Fees, Net of Related Compensation Expense (b) |
Investment Income (b) |
|||||||||||||||||||
| (Dollars in Thousands) | ||||||||||||||||||||||||
| 10% Decline in Fair Value of the Investments |
$ | 95,264 | $ | 1,287,154 | $ | 258,041 | $ | 85,463 | $ | 1,296,886 | $ | 250,246 | ||||||||||||
| (a) | Represents the annualized effect of the 10% decline. |
| (b) | Represents the reporting date effect of the 10% decline. |
Total Assets Under Management, excluding undrawn capital commitments and the amount of capital raised for our CLOs, by segment, and the percentage amount classified as Level III investments as defined within the fair value standards of GAAP, are as follows:
| December 31, 2016 | ||||||||
| Total Assets Under Management, Excluding Undrawn Capital Commitments and the Amount of Capital Raised for CLOs |
Percentage Amount Classified as Level III Investments |
|||||||
| (Dollars in Thousands) | ||||||||
| Private Equity |
$ | 46,827,216 | 64 | % | ||||
| Real Estate |
$ | 68,552,571 | 82 | % | ||||
| Credit |
$ | 50,662,606 | 50 | % | ||||
The fair value of our investments and securities can vary significantly based on a number of factors that take into consideration the diversity of the Blackstone Funds’ investment portfolio and on a number of factors and inputs such as similar transactions, financial metrics, and industry comparatives, among others. (See “Part I. Item 1A. Risk Factors” above. Also see “Item 7. Management’s Discussion and Analysis of Financial Condition and Results of Operations — Critical Accounting Policies — Investments, at Fair Value.”) We believe these fair value amounts should be utilized with caution as our intent and strategy is to hold investments and securities until prevailing market conditions are beneficial for investment sales.
Investors in all of our carry funds (and certain of our credit-focused funds and funds of hedge funds) make capital commitments to those funds that we are entitled to call from those investors at any time during prescribed periods. We depend on investors fulfilling their commitments when we call capital from them in order for those funds to consummate investments and otherwise pay their related obligations when due, including management fees. We have not had investors fail to honor capital calls to any meaningful extent and any investor that did not fund a capital call would be subject to having a significant amount of its existing investment forfeited in that fund; however, if investors were to fail to satisfy a significant amount of capital calls for any particular fund or funds, those funds could be materially and adversely affected.
147
Table of Contents
Exchange Rate Risk
The Blackstone Funds hold investments that are denominated in non-U.S. dollar currencies that may be affected by movements in the rate of exchange between the U.S. dollar and non-U.S. dollar currencies. Additionally, a portion of our management fees are denominated in non-U.S. dollar currencies. We estimate that as of December 31, 2016 and December 31, 2015, a 10% decline in the rate of exchange of all foreign currencies against the U.S. dollar would result in the following declines in Management Fees, Performance Fees, Net of Related Compensation Expense and Investment Income:
| December 31, | ||||||||||||||||||||||||
| 2016 | 2015 | |||||||||||||||||||||||
| Management Fees (a) |
Performance Fees, Net of Related Compensation Expense (b) |
Investment Income (b) |
Management Fees (a) |
Performance Fees, Net of Related Compensation Expense (b) |
Investment Income (b) |
|||||||||||||||||||
| (Dollars in Thousands) | ||||||||||||||||||||||||
| 10% Decline in the Rate of Exchange of All Foreign Currencies Against the U.S. Dollar |
$ | 13,196 | $ | 259,228 | $ | 32,320 | $ | 13,464 | $ | 270,190 | $ | 41,445 | ||||||||||||
| (a) | Represents the annualized effect of the 10% decline. |
| (b) | Represents the reporting date effect of the 10% decline. |
Interest Rate Risk
Blackstone has debt obligations payable that accrue interest at variable rates. Interest rate changes may therefore affect the amount of our interest payments, future earnings and cash flows. Based on our debt obligations payable as of December 31, 2016 and December 31, 2015, we estimate that interest expense relating to variable rates would increase on an annual basis, in the event interest rates were to increase by one percentage point, as follows:
| December 31, | ||||||||
| 2016 | 2015 | |||||||
| (Dollars in Thousands) | ||||||||
| Annualized Increase in Interest Expense Due to a One Percentage Point Increase in Interest Rates |
$ | 28 | $ | 45 | ||||
Blackstone has a diversified portfolio of liquid assets to meet the liquidity needs of various businesses. This portfolio includes cash, open-ended money market mutual funds, open-ended bond mutual funds, marketable investment securities, freestanding derivative contracts, repurchase and reverse repurchase agreements and other investments. If interest rates were to increase by one percentage point, we estimate that our annualized investment income would decrease, offset by an estimated increase in interest income on an annual basis from interest on floating rate assets, as follows:
| December 31, | ||||||||||||||||
| 2016 | 2015 | |||||||||||||||
| Annualized Decrease in Investment Income |
Annualized Increase in Interest Income from Floating Rate Assets |
Annualized Decrease in Investment Income |
Annualized Increase in Interest Income from Floating Rate Assets |
|||||||||||||
| (Dollars in Thousands) | ||||||||||||||||
| One Percentage Point Increase in Interest Rates |
$ | 11,331 | $ | 19,900 | $ | 140 | (a) | $ | 20,486 | |||||||
| (a) | As of December 31, 2016 and 2015, this represents 0.2% and 0.0% of our portfolio of liquid assets, respectively. |
148
Table of Contents
Credit Risk
Certain Blackstone Funds and the Investee Funds are subject to certain inherent risks through their investments.
Our portfolio of liquid assets contain certain credit risks including, but not limited to, exposure to uninsured deposits with financial institutions, unsecured corporate bonds and mortgage-backed securities. These exposures are actively monitored on a continuous basis and positions are reallocated based on changes in risk profile, market or economic conditions.
We estimate that our annualized investment income would decrease, if credit spreads were to increase by one percentage point, as follows:
| December 31, | ||||||||
| 2016 | 2015 | |||||||
| (Dollars in Thousands) | ||||||||
| Decrease in Annualized Investment Income Due to a One Percentage Point Increase in Credit Spreads (a) |
$ | 40,670 | $ | 32,182 | ||||
| (a) | As of December 31, 2016 and 2015, this represents 0.9% and 0.8% of our portfolio of liquid assets, respectively. |
Certain of our entities hold derivative instruments that contain an element of risk in the event that the counterparties may be unable to meet the terms of such agreements. We minimize our risk exposure by limiting the counterparties with which we enter into contracts to banks and investment banks who meet established credit and capital guidelines. We do not expect any counterparty to default on its obligations and therefore do not expect to incur any loss due to counterparty default.
149
Table of Contents
| ITEM 8. | FINANCIAL STATEMENTS AND SUPPLEMENTARY DATA |
INDEX TO CONSOLIDATED FINANCIAL STATEMENTS
150
Table of Contents
Report of Independent Registered Public Accounting Firm
To the General Partner and Unitholders of The Blackstone Group L.P.:
We have audited the accompanying consolidated statements of financial condition of The Blackstone Group L.P. and subsidiaries (“Blackstone”) as of December 31, 2016 and 2015, and the related consolidated statements of operations, comprehensive income, changes in partners’ capital, and cash flows for each of the three years in the period ended December 31, 2016. We also have audited Blackstone’s internal control over financial reporting as of December 31, 2016, based on criteria established in Internal Control — Integrated Framework (2013) issued by the Committee of Sponsoring Organizations of the Treadway Commission. Blackstone’s management is responsible for these financial statements, for maintaining effective internal control over financial reporting, and for its assessment of the effectiveness of internal control over financial reporting, included in the accompanying Management’s Report on Internal Control over Financial Reporting. Our responsibility is to express an opinion on these financial statements and an opinion on Blackstone’s internal control over financial reporting based on our audits.
We conducted our audits in accordance with the standards of the Public Company Accounting Oversight Board (United States). Those standards require that we plan and perform the audit to obtain reasonable assurance about whether the financial statements are free of material misstatement and whether effective internal control over financial reporting was maintained in all material respects. Our audits of the financial statements included examining, on a test basis, evidence supporting the amounts and disclosures in the financial statements, assessing the accounting principles used and significant estimates made by management, and evaluating the overall financial statement presentation. Our audit of internal control over financial reporting included obtaining an understanding of internal control over financial reporting, assessing the risk that a material weakness exists, and testing and evaluating the design and operating effectiveness of internal control based on the assessed risk. Our audits also included performing such other procedures as we considered necessary in the circumstances. We believe that our audits provide a reasonable basis for our opinions.
A company’s internal control over financial reporting is a process designed by, or under the supervision of, the company’s principal executive and principal financial officers, or persons performing similar functions, and effected by the company’s board of directors, management, and other personnel to provide reasonable assurance regarding the reliability of financial reporting and the preparation of financial statements for external purposes in accordance with generally accepted accounting principles. A company’s internal control over financial reporting includes those policies and procedures that (1) pertain to the maintenance of records that, in reasonable detail, accurately and fairly reflect the transactions and dispositions of the assets of the company; (2) provide reasonable assurance that transactions are recorded as necessary to permit preparation of financial statements in accordance with generally accepted accounting principles, and that receipts and expenditures of the company are being made only in accordance with authorizations of management and directors of the company; and (3) provide reasonable assurance regarding prevention or timely detection of unauthorized acquisition, use, or disposition of the company’s assets that could have a material effect on the financial statements.
Because of the inherent limitations of internal control over financial reporting, including the possibility of collusion or improper management override of controls, material misstatements due to error or fraud may not be prevented or detected on a timely basis. Also, projections of any evaluation of the effectiveness of the internal control over financial reporting to future periods are subject to the risk that the controls may become inadequate because of changes in conditions, or that the degree of compliance with the policies or procedures may deteriorate.
In our opinion, the consolidated financial statements referred to above present fairly, in all material respects, the financial position of The Blackstone Group L.P. and subsidiaries as of December 31, 2016 and 2015, and the results of their operations and their cash flows for each of the three years in the period ended December 31, 2016, in conformity with accounting principles generally accepted in the United States of America. Also, in our opinion, Blackstone maintained, in all material respects, effective internal control over financial reporting as of December 31, 2016, based on the criteria established in Internal Control — Integrated Framework (2013) issued by the Committee of Sponsoring Organizations of the Treadway Commission.
/s/ DELOITTE & TOUCHE LLP
New York, New York
February 24, 2017
151
Table of Contents
THE BLACKSTONE GROUP L.P.
Consolidated Statements of Financial Condition
(Dollars in Thousands, Except Unit Data)
| December 31, 2016 |
December 31, 2015 |
|||||||
| Assets |
||||||||
| Cash and Cash Equivalents |
$ | 1,837,253 | $ | 1,837,324 | ||||
| Cash Held by Blackstone Funds and Other |
1,005,161 | 587,132 | ||||||
| Investments (including assets pledged of $119,139 and $64,535 at December 31, 2016 and December 31, 2015, respectively) |
17,694,975 | 14,324,097 | ||||||
| Accounts Receivable |
772,695 | 613,153 | ||||||
| Reverse Repurchase Agreements |
118,495 | 204,893 | ||||||
| Due from Affiliates |
1,442,378 | 1,240,797 | ||||||
| Intangible Assets, Net |
262,604 | 345,547 | ||||||
| Goodwill |
1,718,519 | 1,718,519 | ||||||
| Other Assets |
264,788 | 377,189 | ||||||
| Deferred Tax Assets |
1,286,469 | 1,277,429 | ||||||
|
|
|
|
|
|||||
| Total Assets |
$ | 26,403,337 | $ | 22,526,080 | ||||
|
|
|
|
|
|||||
| Liabilities and Partners’ Capital |
||||||||
| Loans Payable |
$ | 8,866,366 | $ | 6,116,747 | ||||
| Due to Affiliates |
1,321,772 | 1,282,700 | ||||||
| Accrued Compensation and Benefits |
2,327,762 | 2,029,918 | ||||||
| Securities Sold, Not Yet Purchased |
215,398 | 176,667 | ||||||
| Repurchase Agreements |
75,324 | 40,929 | ||||||
| Accounts Payable, Accrued Expenses and Other Liabilities |
1,081,782 | 648,662 | ||||||
|
|
|
|
|
|||||
| Total Liabilities |
13,888,404 | 10,295,623 | ||||||
|
|
|
|
|
|||||
| Commitments and Contingencies |
||||||||
| Redeemable Non-Controlling Interests in Consolidated Entities |
185,390 | 183,459 | ||||||
|
|
|
|
|
|||||
| Partners’ Capital |
||||||||
| The Blackstone Group L.P. Partners’ Capital |
||||||||
| Partners’ Capital (common units: 643,459,542 issued and outstanding as of December 31, 2016; 624,450,162 issued and outstanding as of December 31, 2015) |
6,523,929 | 6,322,307 | ||||||
| Accumulated Other Comprehensive Income |
(62,887 | ) | (52,519 | ) | ||||
|
|
|
|
|
|||||
| Total The Blackstone Group L.P. Partners’ Capital |
6,461,042 | 6,269,788 | ||||||
| Non-Controlling Interests in Consolidated Entities |
2,428,964 | 2,408,701 | ||||||
| Non-Controlling Interests in Blackstone Holdings |
3,439,537 | 3,368,509 | ||||||
|
|
|
|
|
|||||
| Total Partners’ Capital |
12,329,543 | 12,046,998 | ||||||
|
|
|
|
|
|||||
| Total Liabilities and Partners’ Capital |
$ | 26,403,337 | $ | 22,526,080 | ||||
|
|
|
|
|
|||||
continued…
See notes to consolidated financial statements.
152
Table of Contents
THE BLACKSTONE GROUP L.P.
Consolidated Statements of Financial Condition
(Dollars in Thousands)
The following presents the portion of the consolidated balances presented above attributable to consolidated Blackstone Funds which are variable interest entities. The following assets may only be used to settle obligations of these consolidated Blackstone Funds and these liabilities are only the obligations of these consolidated Blackstone Funds and they do not have recourse to the general credit of Blackstone.
| December 31, 2016 |
December 31, 2015 |
|||||||
| Assets |
||||||||
| Cash Held by Blackstone Funds and Other |
$ | 740,760 | $ | 435,775 | ||||
| Investments |
6,459,355 | 4,558,216 | ||||||
| Accounts Receivable |
355,364 | 122,077 | ||||||
| Due from Affiliates |
21,300 | 25,561 | ||||||
| Other Assets |
2,602 | 12,693 | ||||||
|
|
|
|
|
|||||
| Total Assets |
$ | 7,579,381 | $ | 5,154,322 | ||||
|
|
|
|
|
|||||
| Liabilities |
||||||||
| Loans Payable |
$ | 5,466,444 | $ | 3,319,656 | ||||
| Due to Affiliates |
72,609 | 39,532 | ||||||
| Securities Sold, Not Yet Purchased |
81,309 | 58,878 | ||||||
| Repurchase Agreements |
66,221 | 31,417 | ||||||
| Accounts Payable, Accrued Expenses and Other Liabilities |
545,481 | 226,203 | ||||||
|
|
|
|
|
|||||
| Total Liabilities |
$ | 6,232,064 | $ | 3,675,686 | ||||
|
|
|
|
|
|||||
See notes to consolidated financial statements.
153
Table of Contents
THE BLACKSTONE GROUP L.P.
Consolidated Statements of Operations
(Dollars in Thousands, Except Unit and Per Unit Data)
| Year Ended December 31, | ||||||||||||
| 2016 | 2015 | 2014 | ||||||||||
| Revenues |
||||||||||||
| Management and Advisory Fees, Net |
$ | 2,442,975 | $ | 2,542,505 | $ | 2,497,252 | ||||||
|
|
|
|
|
|
|
|||||||
| Performance Fees |
||||||||||||
| Realized |
||||||||||||
| Carried Interest |
1,474,830 | 3,205,290 | 2,450,082 | |||||||||
| Incentive Fees |
170,537 | 193,238 | 249,005 | |||||||||
| Unrealized |
||||||||||||
| Carried Interest |
481,304 | (1,595,174 | ) | 1,704,924 | ||||||||
| Incentive Fees |
49,660 | (6,688 | ) | (29,749 | ) | |||||||
|
|
|
|
|
|
|
|||||||
| Total Performance Fees |
2,176,331 | 1,796,666 | 4,374,262 | |||||||||
|
|
|
|
|
|
|
|||||||
| Investment Income (Loss) |
||||||||||||
| Realized |
278,737 | 555,171 | 523,735 | |||||||||
| Unrealized |
77,314 | (350,529 | ) | 10,265 | ||||||||
|
|
|
|
|
|
|
|||||||
| Total Investment Income |
356,051 | 204,642 | 534,000 | |||||||||
|
|
|
|
|
|
|
|||||||
| Interest and Dividend Revenue |
95,724 | 94,957 | 69,809 | |||||||||
| Other |
54,753 | 7,782 | 9,405 | |||||||||
|
|
|
|
|
|
|
|||||||
| Total Revenues |
5,125,834 | 4,646,552 | 7,484,728 | |||||||||
|
|
|
|
|
|
|
|||||||
| Expenses |
||||||||||||
| Compensation and Benefits |
||||||||||||
| Compensation |
1,335,408 | 1,726,191 | 1,868,868 | |||||||||
| Performance Fee Compensation |
||||||||||||
| Realized |
||||||||||||
| Carried Interest |
455,954 | 793,801 | 815,643 | |||||||||
| Incentive Fees |
78,096 | 85,945 | 110,099 | |||||||||
| Unrealized |
||||||||||||
| Carried Interest |
312,838 | (312,696 | ) | 379,037 | ||||||||
| Incentive Fees |
21,134 | (2,490 | ) | (19,276 | ) | |||||||
|
|
|
|
|
|
|
|||||||
| Total Compensation and Benefits |
2,203,430 | 2,290,751 | 3,154,371 | |||||||||
| General, Administrative and Other |
520,309 | 576,103 | 549,463 | |||||||||
| Interest Expense |
152,654 | 144,522 | 121,524 | |||||||||
| Fund Expenses |
52,181 | 79,499 | 30,498 | |||||||||
|
|
|
|
|
|
|
|||||||
| Total Expenses |
2,928,574 | 3,090,875 | 3,855,856 | |||||||||
|
|
|
|
|
|
|
|||||||
| Other Income |
||||||||||||
| Reversal of Tax Receivable Agreement Liability |
— | 82,707 | — | |||||||||
| Net Gains from Fund Investment Activities |
184,750 | 176,364 | 357,854 | |||||||||
|
|
|
|
|
|
|
|||||||
| Total Other Income |
184,750 | 259,071 | 357,854 | |||||||||
|
|
|
|
|
|
|
|||||||
| Income Before Provision for Taxes |
2,382,010 | 1,814,748 | 3,986,726 | |||||||||
| Provision for Taxes |
132,362 | 190,398 | 291,173 | |||||||||
|
|
|
|
|
|
|
|||||||
| Net Income |
2,249,648 | 1,624,350 | 3,695,553 | |||||||||
| Net Income Attributable to Redeemable Non-Controlling Interests in Consolidated Entities |
3,977 | 11,145 | 74,794 | |||||||||
| Net Income Attributable to Non-Controlling Interests in Consolidated Entities |
246,152 | 219,900 | 335,070 | |||||||||
| Net Income Attributable to Non-Controlling Interests in Blackstone Holdings |
960,284 | 683,516 | 1,701,100 | |||||||||
|
|
|
|
|
|
|
|||||||
| Net Income Attributable to The Blackstone Group L.P. |
$ | 1,039,235 | $ | 709,789 | $ | 1,584,589 | ||||||
|
|
|
|
|
|
|
|||||||
| Net Income Per Common Unit |
||||||||||||
| Common Units, Basic |
$ | 1.60 | $ | 1.12 | $ | 2.60 | ||||||
|
|
|
|
|
|
|
|||||||
| Common Units, Diluted |
$ | 1.56 | $ | 1.04 | $ | 2.58 | ||||||
|
|
|
|
|
|
|
|||||||
| Weighted-Average Common Units Outstanding |
||||||||||||
| Common Units, Basic |
649,475,264 | 634,337,179 | 608,803,111 | |||||||||
|
|
|
|
|
|
|
|||||||
| Common Units, Diluted |
1,195,114,590 | 1,188,085,411 | 613,176,405 | |||||||||
|
|
|
|
|
|
|
|||||||
| Revenues Earned from Affiliates |
||||||||||||
| Management and Advisory Fees, Net |
$ | 185,769 | $ | 210,672 | $ | 327,134 | ||||||
|
|
|
|
|
|
|
|||||||
See notes to consolidated financial statements.
154
Table of Contents
THE BLACKSTONE GROUP L.P.
Consolidated Statements of Comprehensive Income
(Dollars in Thousands)
| Year Ended December 31, | ||||||||||||
| 2016 | 2015 | 2014 | ||||||||||
| Net Income |
$ | 2,249,648 | $ | 1,624,350 | $ | 3,695,553 | ||||||
| Other Comprehensive Loss, Net of Tax — Currency Translation Adjustment |
(22,194 | ) | (49,238 | ) | (57,924 | ) | ||||||
|
|
|
|
|
|
|
|||||||
| Comprehensive Income |
2,227,454 | 1,575,112 | 3,637,629 | |||||||||
| Less: |
||||||||||||
| Comprehensive Income Attributable to Redeemable Non-Controlling Interests in Consolidated Entities |
3,977 | 11,145 | 74,794 | |||||||||
| Comprehensive Income Attributable to Non-Controlling Interests in Consolidated Entities |
234,326 | 202,318 | 301,477 | |||||||||
| Comprehensive Income Attributable to Non-Controlling Interests in Blackstone Holdings |
960,284 | 683,516 | 1,701,100 | |||||||||
|
|
|
|
|
|
|
|||||||
| Comprehensive Income Attributable to The Blackstone Group L.P. |
$ | 1,028,867 | $ | 678,133 | $ | 1,560,258 | ||||||
|
|
|
|
|
|
|
|||||||
See notes to consolidated financial statements.
155
Table of Contents
THE BLACKSTONE GROUP L.P.
Consolidated Statement of Changes in Partners’ Capital
(Dollars in Thousands, Except Unit Data)
| The Blackstone Group L.P. | ||||||||||||||||||||||||||||||||||||
| Common Units |
Partners’ Capital |
Appro- priated Partners’ Capital |
Accumulated Other Compre- hensive Income (Loss) |
Total | Non- Controlling Interests in Consolidated Entities |
Non- Controlling Interests in Blackstone Holdings |
Total Partners’ Capital |
Redeemable Non- Controlling Interests in Consolidated Entities |
||||||||||||||||||||||||||||
| Balance at December 31, 2013 |
572,592,279 | $ | 6,002,592 | $ | 300,708 | $ | 3,466 | $ | 6,306,766 | $ | 2,464,047 | $ | 3,656,416 | $ | 12,427,229 | $ | 1,950,442 | |||||||||||||||||||
| Acquisition Adjustments Relating to Consolidation of CLO Entities |
— | — | 8,398 | — | 8,398 | — | — | 8,398 | — | |||||||||||||||||||||||||||
| Consolidation of Fund Entity |
— | — | — | — | — | 323,158 | — | 323,158 | 30,922 | |||||||||||||||||||||||||||
| Net Income |
— | 1,584,589 | — | — | 1,584,589 | 335,070 | 1,701,100 | 3,620,759 | 74,794 | |||||||||||||||||||||||||||
| Allocation of Losses of Consolidated CLO Entities |
— | — | (111,723 | ) | — | (111,723 | ) | 111,723 | — | — | — | |||||||||||||||||||||||||
| Currency Translation Adjustment |
— | — | — | (24,330 | ) | (24,330 | ) | (33,594 | ) | — | (57,924 | ) | — | |||||||||||||||||||||||
| Allocation of Currency Translation Adjustment of Consolidated CLO Entities |
— | — | (33,594 | ) | — | (33,594 | ) | 33,594 | — | — | — | |||||||||||||||||||||||||
| Reclassification of Currency Translation Adjustment Due to Deconsolidation of CLO Entities |
— | (611 | ) | — | — | (611 | ) | — | — | (611 | ) | — | ||||||||||||||||||||||||
| Capital Contributions |
— | — | — | — | — | 760,357 | — | 760,357 | 851,658 | |||||||||||||||||||||||||||
| Capital Distributions |
— | (1,148,139 | ) | — | — | (1,148,139 | ) | (577,032 | ) | (1,200,457 | ) | (2,925,628 | ) | (465,962 | ) | |||||||||||||||||||||
| Transfer of Non-Controlling Interests in Consolidated Entities |
— | — | — | — | — | (1,885 | ) | — | (1,885 | ) | — | |||||||||||||||||||||||||
| Purchase of Interests from Certain Non-Controlling Interest Holders |
— | (6 | ) | — | — | (6 | ) | — | — | (6 | ) | — | ||||||||||||||||||||||||
| Deferred Tax Effects Resulting from Acquisition of Ownership Interests from Non-Controlling Interest Holders |
— | 22,982 | — | — | 22,982 | — | — | 22,982 | — | |||||||||||||||||||||||||||
| Equity-Based Compensation |
— | 421,363 | — | — | 421,363 | — | 386,703 | 808,066 | — | |||||||||||||||||||||||||||
| Relinquished with Deconsolidation and Liquidation of Partnership |
— | — | (82,488 | ) | — | (82,488 | ) | (82 | ) | — | (82,570 | ) | — | |||||||||||||||||||||||
| Net Delivery of Vested Blackstone Holdings Partnership Units and Blackstone Common Units |
6,407,733 | (35,469 | ) | — | — | (35,469 | ) | — | (783 | ) | (36,252 | ) | — | |||||||||||||||||||||||
| Excess Tax Benefits Related to Equity-Based Compensation, Net |
— | 25,620 | — | — | 25,620 | — | — | 25,620 | — | |||||||||||||||||||||||||||
| Change in The Blackstone Group L.P.’s Ownership Interest |
— | 9,032 | — | — | 9,032 | — | (9,032 | ) | — | — | ||||||||||||||||||||||||||
| Conversion of Blackstone Holdings Partnership Units to Blackstone Common Units |
16,624,843 | 117,877 | — | — | 117,877 | — | (117,877 | ) | — | — | ||||||||||||||||||||||||||
|
|
|
|
|
|
|
|
|
|
|
|
|
|
|
|
|
|
|
|||||||||||||||||||
| Balance at December 31, 2014 |
595,624,855 | $ | 6,999,830 | $ | 81,301 | $ | (20,864 | ) | $ | 7,060,267 | $ | 3,415,356 | $ | 4,416,070 | $ | 14,891,693 | $ | 2,441,854 | ||||||||||||||||||
continued…
See notes to consolidated financial statements.
156
Table of Contents
THE BLACKSTONE GROUP L.P.
Consolidated Statement of Changes in Partners’ Capital
(Dollars in Thousands, Except Unit Data)
| The Blackstone Group L.P. | ||||||||||||||||||||||||||||||||||||
| Common Units |
Partners’ Capital |
Appro- priated Partners’ Capital |
Accumulated Other Compre- hensive (Loss) |
Total | Non- Controlling Interests in Consolidated Entities |
Non- Controlling Interests in Blackstone Holdings |
Total Partners’ Capital |
Redeemable Non- Controlling Interests in Consolidated Entities |
||||||||||||||||||||||||||||
| Balance at December 31, 2014 |
595,624,855 | $ | 6,999,830 | $ | 81,301 | $ | (20,864 | ) | $ | 7,060,267 | $ | 3,415,356 | $ | 4,416,070 | $ | 14,891,693 | $ | 2,441,854 | ||||||||||||||||||
| Deconsolidation of CLOs and Funds on Adoption of ASU 2015-02 |
— | — | (90,928 | ) | — | (90,928 | ) | (1,002,728 | ) | — | (1,093,656 | ) | (2,258,289 | ) | ||||||||||||||||||||||
| Adjustment to Appropriated Partners’ Capital on Adoption of ASU 2014-13 |
— | — | 9,627 | — | 9,627 | — | — | 9,627 | — | |||||||||||||||||||||||||||
| Net Income |
— | 709,789 | — | — | 709,789 | 219,900 | 683,516 | 1,613,205 | 11,145 | |||||||||||||||||||||||||||
| Currency Translation Adjustment |
— | — | — | (31,655 | ) | (31,655 | ) | (39,475 | ) | — | (71,130 | ) | — | |||||||||||||||||||||||
| Capital Contributions |
— | — | — | — | — | 491,456 | — | 491,456 | 2,357 | |||||||||||||||||||||||||||
| Capital Distributions |
— | (1,812,602 | ) | — | — | (1,812,602 | ) | (663,536 | ) | (1,684,744 | ) | (4,160,882 | ) | (13,608 | ) | |||||||||||||||||||||
| Distributions Associated with the Spin-Off |
— | (232,034 | ) | — | — | (232,034 | ) | — | (135,204 | ) | (367,238 | ) | — | |||||||||||||||||||||||
| Transfer of Non-Controlling Interests in Consolidated Entities |
— | — | — | — | — | (12,272 | ) | — | (12,272 | ) | — | |||||||||||||||||||||||||
| Deferred Tax Effects Resulting from Acquisition of Ownership Interests from Non-Controlling Interest Holders |
— | 65,027 | — | — | 65,027 | — | — | 65,027 | — | |||||||||||||||||||||||||||
| Equity-Based Compensation |
— | 356,440 | — | — | 356,440 | — | 315,442 | 671,882 | — | |||||||||||||||||||||||||||
| Net Delivery of Vested Blackstone Holdings Partnership Units and Blackstone Common Units |
12,180,703 | (59,128 | ) | — | — | (59,128 | ) | — | (1,903 | ) | (61,031 | ) | — | |||||||||||||||||||||||
| Excess Tax Benefits Related to Equity-Based Compensation, Net |
— | 70,317 | — | — | 70,317 | — | — | 70,317 | — | |||||||||||||||||||||||||||
| Change in The Blackstone Group L.P.’s Ownership Interest |
— | 92,785 | — | — | 92,785 | — | (92,785 | ) | — | — | ||||||||||||||||||||||||||
| Conversion of Blackstone Holdings Partnership Units to Blackstone Common Units |
16,644,604 | 131,883 | — | — | 131,883 | — | (131,883 | ) | — | — | ||||||||||||||||||||||||||
|
|
|
|
|
|
|
|
|
|
|
|
|
|
|
|
|
|
|
|||||||||||||||||||
| Balance at December 31, 2015 |
624,450,162 | $ | 6,322,307 | $ | — | $ | (52,519 | ) | $ | 6,269,788 | $ | 2,408,701 | $ | 3,368,509 | $ | 12,046,998 | $ | 183,459 | ||||||||||||||||||
continued…
See notes to consolidated financial statements.
157
Table of Contents
THE BLACKSTONE GROUP L.P.
Consolidated Statement of Changes in Partners’ Capital
(Dollars in Thousands, Except Unit Data)
| The Blackstone Group L.P. | ||||||||||||||||||||||||||||||||
| Common Units |
Partners’ Capital |
Accumulated Other Compre- hensive (Loss) |
Total | Non- Controlling Interests in Consolidated Entities |
Non- Controlling Interests in Blackstone Holdings |
Total Partners’ Capital |
Redeemable Non- Controlling Interests in Consolidated Entities |
|||||||||||||||||||||||||
| Balance at December 31, 2015 |
624,450,162 | $ | 6,322,307 | $ | (52,519 | ) | $ | 6,269,788 | $ | 2,408,701 | $ | 3,368,509 | $ | 12,046,998 | $ | 183,459 | ||||||||||||||||
| Net Income |
— | 1,039,235 | — | 1,039,235 | 246,152 | 960,284 | 2,245,671 | 3,977 | ||||||||||||||||||||||||
| Currency Translation Adjustment |
— | — | (10,368 | ) | (10,368 | ) | (11,826 | ) | — | (22,194 | ) | — | ||||||||||||||||||||
| Capital Contributions |
— | — | — | — | 324,630 | — | 324,630 | 15,000 | ||||||||||||||||||||||||
| Capital Distributions |
— | (1,068,017 | ) | — | (1,068,017 | ) | (530,415 | ) | (950,652 | ) | (2,549,084 | ) | (17,046 | ) | ||||||||||||||||||
| Transfer of Non-Controlling Interests in Consolidated Entities |
— | — | — | — | (8,278 | ) | — | (8,278 | ) | — | ||||||||||||||||||||||
| Deferred Tax Effects Resulting from Acquisition of Ownership Interests from Non-Controlling Interest Holders |
— | 5,369 | — | 5,369 | — | — | 5,369 | — | ||||||||||||||||||||||||
| Equity-Based Compensation |
— | 166,206 | — | 166,206 | — | 147,848 | 314,054 | — | ||||||||||||||||||||||||
| Net Delivery of Vested Blackstone Holdings Partnership Units and Blackstone Common Units |
6,241,282 | (26,572 | ) | — | (26,572 | ) | — | (1,051 | ) | (27,623 | ) | — | ||||||||||||||||||||
| Change in The Blackstone Group L.P.’s Ownership Interest |
— | 7,881 | — | 7,881 | — | (7,881 | ) | — | — | |||||||||||||||||||||||
| Conversion of Blackstone Holdings Partnership Units to Blackstone Common Units |
12,768,098 | 77,520 | — | 77,520 | — | (77,520 | ) | — | — | |||||||||||||||||||||||
|
|
|
|
|
|
|
|
|
|
|
|
|
|
|
|
|
|||||||||||||||||
| Balance at December 31, 2016 |
643,459,542 | $ | 6,523,929 | $ | (62,887 | ) | $ | 6,461,042 | $ | 2,428,964 | $ | 3,439,537 | $ | 12,329,543 | $ | 185,390 | ||||||||||||||||
|
|
|
|
|
|
|
|
|
|
|
|
|
|
|
|
|
|||||||||||||||||
See notes to consolidated financial statements.
158
Table of Contents
THE BLACKSTONE GROUP L.P.
Consolidated Statements of Cash Flows
(Dollars in Thousands)
| Year
Ended December 31, |
||||||||||||
| 2016 | 2015 | 2014 | ||||||||||
| Operating Activities |
||||||||||||
| Net Income |
$ | 2,249,648 | $ | 1,624,350 | $ | 3,695,553 | ||||||
| Adjustments to Reconcile Net Income to Net Cash Provided by (Used In) Operating Activities |
||||||||||||
| Unrealized (Appreciation) Depreciation on Investments Allocable to Non-Controlling Interests in Consolidated Entities |
(261,338 | ) | 356,170 | (430,738 | ) | |||||||
| Net Realized Gains on Investments |
(2,023,503 | ) | (4,121,003 | ) | (3,343,635 | ) | ||||||
| Changes in Unrealized Losses on Investments Allocable to The Blackstone Group L.P. |
19,721 | 365,894 | 83,140 | |||||||||
| Non-Cash Performance Fees |
(305,559 | ) | 1,391,946 | (1,317,707 | ) | |||||||
| Non-Cash Performance Fee Compensation |
868,022 | 564,560 | 1,285,503 | |||||||||
| Equity-Based Compensation Expense |
323,651 | 629,642 | 734,733 | |||||||||
| Excess Tax Benefits Related to Equity-Based Compensation |
— | (70,318 | ) | (25,646 | ) | |||||||
| Amortization of Intangibles |
82,943 | 101,437 | 101,915 | |||||||||
| Other Non-Cash Amounts Included in Net Income |
16,711 | 144,657 | 121,808 | |||||||||
| Cash Flows Due to Changes in Operating Assets and Liabilities |
||||||||||||
| Cash Held by Blackstone Funds and Other |
(452,108 | ) | 1,220,959 | (390,092 | ) | |||||||
| Cash Relinquished with Deconsolidation and Liquidation of Partnership |
— | (442,370 | ) | (476,533 | ) | |||||||
| Accounts Receivable |
87,074 | (213,706 | ) | 229,331 | ||||||||
| Reverse Repurchase Agreements |
86,398 | (204,893 | ) | 148,984 | ||||||||
| Due from Affiliates |
(57,907 | ) | (97,487 | ) | 229,837 | |||||||
| Other Assets |
99,108 | (149,732 | ) | (82,890 | ) | |||||||
| Accrued Compensation and Benefits |
(572,814 | ) | (917,428 | ) | (836,852 | ) | ||||||
| Securities Sold, Not Yet Purchased |
42,761 | 96,780 | (144,383 | ) | ||||||||
| Accounts Payable, Accrued Expenses and Other Liabilities |
(214,651 | ) | (474,652 | ) | (305,978 | ) | ||||||
| Repurchase Agreements |
34,286 | 11,012 | (325,199 | ) | ||||||||
| Due to Affiliates |
39,035 | (102,847 | ) | 35,504 | ||||||||
| Investments Purchased |
(8,798,358 | ) | (7,937,114 | ) | (10,979,846 | ) | ||||||
| Cash Proceeds from Sale of Investments |
8,195,594 | 10,621,186 | 13,648,180 | |||||||||
|
|
|
|
|
|
|
|||||||
| Net Cash Provided by (Used in) Operating Activities |
(541,286 | ) | 2,397,043 | 1,654,989 | ||||||||
|
|
|
|
|
|
|
|||||||
| Investing Activities |
||||||||||||
| Purchase of Furniture, Equipment and Leasehold Improvements |
(21,826 | ) | (59,247 | ) | (30,271 | ) | ||||||
| Changes in Restricted Cash |
(7,150 | ) | 5,843 | 5,846 | ||||||||
|
|
|
|
|
|
|
|||||||
| Net Cash Used in Investing Activities |
(28,976 | ) | (53,404 | ) | (24,425 | ) | ||||||
|
|
|
|
|
|
|
|||||||
continued…
See notes to consolidated financial statements.
159
Table of Contents
THE BLACKSTONE GROUP L.P.
Consolidated Statements of Cash Flows
(Dollars in Thousands)
| Year
Ended December 31, |
||||||||||||
| 2016 | 2015 | 2014 | ||||||||||
| Financing Activities |
||||||||||||
| Distributions to Non-Controlling Interest Holders in Consolidated Entities |
$ | (533,925 | ) | $ | (677,110 | ) | $ | (982,405 | ) | |||
| Contributions from Non-Controlling Interest Holders in Consolidated Entities |
329,005 | 479,678 | 1,560,183 | |||||||||
| Purchase of Interests from Certain Non-Controlling Interest Holders |
— | — | (6 | ) | ||||||||
| Cash Relinquished in Conjunction with the Spin-Off |
— | (55,412 | ) | — | ||||||||
| Payments Under Tax Receivable Agreement |
(78,985 | ) | (84,484 | ) | (86,733 | ) | ||||||
| Net Delivery of Vested Common Units and Repurchase of Common and Holdings Units |
(27,623 | ) | (61,031 | ) | (36,252 | ) | ||||||
| Excess Tax Benefits Related to Equity-Based Compensation |
— | 70,318 | 25,646 | |||||||||
| Proceeds from Loans Payable |
3,321,081 | 2,423,614 | 2,635,540 | |||||||||
| Repayment and Repurchase of Loans Payable |
(420,714 | ) | (517,629 | ) | (1,817,284 | ) | ||||||
| Distributions to Unitholders |
(2,018,669 | ) | (3,497,346 | ) | (2,348,596 | ) | ||||||
|
|
|
|
|
|
|
|||||||
| Net Cash Provided by (Used in) Financing Activities |
570,170 | (1,919,402 | ) | (1,049,907 | ) | |||||||
|
|
|
|
|
|
|
|||||||
| Effect of Exchange Rate Changes on Cash and Cash Equivalents |
21 | 615 | (183 | ) | ||||||||
|
|
|
|
|
|
|
|||||||
| Net Increase (Decrease) in Cash and Cash Equivalents |
(71 | ) | 424,852 | 580,474 | ||||||||
| Cash and Cash Equivalents, Beginning of Period |
1,837,324 | 1,412,472 | 831,998 | |||||||||
|
|
|
|
|
|
|
|||||||
| Cash and Cash Equivalents, End of Period |
$ | 1,837,253 | $ | 1,837,324 | $ | 1,412,472 | ||||||
|
|
|
|
|
|
|
|||||||
| Supplemental Disclosure of Cash Flows Information |
||||||||||||
| Payments for Interest |
$ | 151,948 | $ | 126,167 | $ | 116,296 | ||||||
|
|
|
|
|
|
|
|||||||
| Payments for Income Taxes |
$ | 65,790 | $ | 115,814 | $ | 236,718 | ||||||
|
|
|
|
|
|
|
|||||||
| Supplemental Disclosure of Non-Cash Investing and Financing Activities |
||||||||||||
| Non-Cash Contributions from Non-Controlling Interest Holders |
$ | 1,155 | $ | 2,277 | $ | 47,683 | ||||||
|
|
|
|
|
|
|
|||||||
| Non-Cash Distributions to Non-Controlling Interest Holders |
$ | (13,536 | ) | $ | (34 | ) | $ | (60,589 | ) | |||
|
|
|
|
|
|
|
|||||||
| Net Assets Associated with the Spin-Off |
$ | — | $ | (311,826 | ) | $ | — | |||||
|
|
|
|
|
|
|
|||||||
| Net Activities Related to Capital Transactions of Consolidated Blackstone Funds |
$ | — | $ | (295 | ) | $ | 16,181 | |||||
|
|
|
|
|
|
|
|||||||
| Net Assets Related to the Consolidation of CLO Vehicles |
$ | — | $ | — | $ | 8,398 | ||||||
|
|
|
|
|
|
|
|||||||
| Net Assets Related to the Consolidation of Certain Fund Entities |
$ | — | $ | — | $ | 354,080 | ||||||
|
|
|
|
|
|
|
|||||||
| Notes Issuance Costs |
$ | 5,491 | $ | 5,269 | $ | 4,375 | ||||||
|
|
|
|
|
|
|
|||||||
| Transfer of Interests to Non-Controlling Interest Holders |
$ | (8,278 | ) | $ | (12,272 | ) | $ | (1,885 | ) | |||
|
|
|
|
|
|
|
|||||||
| Change in The Blackstone Group L.P.’s Ownership Interest |
$ | 7,881 | $ | 92,785 | $ | 9,032 | ||||||
|
|
|
|
|
|
|
|||||||
| Net Settlement of Vested Common Units |
$ | 101,898 | $ | 139,941 | $ | 69,426 | ||||||
|
|
|
|
|
|
|
|||||||
| Conversion of Blackstone Holdings Units to Common Units |
$ | 77,520 | $ | 131,883 | $ | 117,877 | ||||||
|
|
|
|
|
|
|
|||||||
| Acquisition of Ownership Interests from Non-Controlling Interest Holders |
||||||||||||
| Deferred Tax Asset |
$ | (59,304 | ) | $ | (195,291 | ) | $ | (105,686 | ) | |||
|
|
|
|
|
|
|
|||||||
| Due to Affiliates |
$ | 53,935 | $ | 130,264 | $ | 82,704 | ||||||
|
|
|
|
|
|
|
|||||||
| Partners’ Capital |
$ | 5,369 | $ | 65,027 | $ | 22,982 | ||||||
|
|
|
|
|
|
|
|||||||
See notes to consolidated financial statements.
160
Table of Contents
THE BLACKSTONE GROUP L.P.
Notes to Consolidated Financial Statements
(All Dollars Are in Thousands, Except Unit and Per Unit Data, Except Where Noted)
| 1. | ORGANIZATION |
The Blackstone Group L.P., together with its subsidiaries (“Blackstone” or the “Partnership”), is a leading global manager of private capital. The alternative asset management business includes the management of private equity funds, real estate funds, real estate investment trusts (“REITs”), funds of hedge funds, hedge funds, credit-focused funds, collateralized loan obligation (“CLO”) vehicles, separately managed accounts and registered investment companies (collectively referred to as the “Blackstone Funds”). Blackstone’s business is organized into four segments: private equity, real estate, hedge fund solutions and credit.
The Partnership was formed as a Delaware limited partnership on March 12, 2007. The Partnership is managed and operated by its general partner, Blackstone Group Management L.L.C., which is in turn wholly owned and controlled by one of Blackstone’s founders, Stephen A. Schwarzman (the “Founder”), and Blackstone’s other senior managing directors. The activities of the Partnership are conducted through its holding partnerships: Blackstone Holdings I L.P., Blackstone Holdings AI L.P., Blackstone Holdings II L.P., Blackstone Holdings III L.P. and Blackstone Holdings IV L.P. (collectively, “Blackstone Holdings”, “Blackstone Holdings Partnerships” or the “Holding Partnerships”). The Partnership, through its wholly owned subsidiaries, is the sole general partner in each of these Holding Partnerships.
Generally, holders of the limited partner interests in the Holding Partnerships may, four times each year, exchange their limited partnership interests (“Partnership Units”) for Blackstone common units, on a one-to-one basis, exchanging one Partnership Unit from each of the Holding Partnerships for one Blackstone common unit.
| 2. | SUMMARY OF SIGNIFICANT ACCOUNTING POLICIES |
Basis of Presentation
The accompanying consolidated financial statements of the Partnership have been prepared in accordance with accounting principles generally accepted in the United States of America (“GAAP”).
The consolidated financial statements include the accounts of the Partnership, its wholly owned or majority-owned subsidiaries, the consolidated entities which are considered to be variable interest entities and for which the Partnership is considered the primary beneficiary, and certain partnerships or similar entities which are not considered variable interest entities but in which the general partner is presumed to have control.
All intercompany balances and transactions have been eliminated in consolidation.
Restructurings within consolidated CLOs are treated as investment purchases or sales, as applicable, in the Consolidated Statements of Cash Flows.
Use of Estimates
The preparation of the consolidated financial statements in accordance with GAAP requires management to make estimates that affect the amounts reported in the consolidated financial statements and accompanying notes. Management believes that estimates utilized in the preparation of the consolidated financial statements are prudent and reasonable. Such estimates include those used in the valuation of investments and financial instruments and the accounting for Goodwill and equity-based compensation. Actual results could differ from those estimates and such differences could be material.
161
Table of Contents
THE BLACKSTONE GROUP L.P.
Notes to Consolidated Financial Statements—Continued
(All Dollars Are in Thousands, Except Unit and Per Unit Data, Except Where Noted)
Consolidation
The Partnership consolidates all entities that it controls through a majority voting interest or otherwise, including those Blackstone Funds in which the general partner has a controlling financial interest. The Partnership has a controlling interest in Blackstone Holdings because the limited partners do not have the right to dissolve the partnerships or have substantive kick out rights or participating rights that would overcome the presumption of control by the Partnership. Accordingly, the Partnership consolidates Blackstone Holdings and records non-controlling interests to reflect the economic interests of the limited partners of Blackstone Holdings.
In addition, the Partnership consolidates all variable interest entities (“VIE”) in which it is the primary beneficiary. An enterprise is determined to be the primary beneficiary if it holds a controlling financial interest. A controlling financial interest is defined as (a) the power to direct the activities of a VIE that most significantly impact the entity’s economic performance and (b) the obligation to absorb losses of the entity or the right to receive benefits from the entity that could potentially be significant to the VIE. The consolidation guidance requires an analysis to determine (a) whether an entity in which the Partnership holds a variable interest is a VIE and (b) whether the Partnership’s involvement, through holding interests directly or indirectly in the entity or contractually through other variable interests (for example, management and performance related fees), would give it a controlling financial interest. Performance of that analysis requires the exercise of judgment.
The Partnership determines whether it is the primary beneficiary of a VIE at the time it becomes involved with a variable interest entity and reconsiders that conclusion continually. In evaluating whether the Partnership is the primary beneficiary, Blackstone evaluates its economic interests in the entity held either directly or indirectly by the Partnership. The consolidation analysis can generally be performed qualitatively; however, if it is not readily apparent that the Partnership is not the primary beneficiary, a quantitative analysis may also be performed. Investments and redemptions (either by the Partnership, affiliates of the Partnership or third parties) or amendments to the governing documents of the respective Blackstone Funds could affect an entity’s status as a VIE or the determination of the primary beneficiary. At each reporting date, the Partnership assesses whether it is the primary beneficiary and will consolidate or deconsolidate accordingly.
Assets of consolidated VIEs that can only be used to settle obligations of the consolidated VIE and liabilities of a consolidated VIE for which creditors (or beneficial interest holders) do not have recourse to the general credit of Blackstone are presented in a separate section in the Consolidated Statements of Financial Condition.
Blackstone’s other disclosures regarding VIEs are discussed in Note 9. “Variable Interest Entities”.
Revenue Recognition
Revenues primarily consist of management and advisory fees, performance fees, investment income, interest and dividend revenue and other.
Management and Advisory Fees, Net — Management and Advisory Fees, Net are comprised of management fees, including base management fees, transaction and other fees and advisory fees net of management fee reductions and offsets.
The Partnership earns base management fees from limited partners of funds in each of its managed funds, at a fixed percentage of assets under management, net asset value, total assets, committed capital or invested capital, or in some cases, a fixed fee. Base management fees are recognized based on contractual terms specified in the underlying investment advisory agreements.
162
Table of Contents
THE BLACKSTONE GROUP L.P.
Notes to Consolidated Financial Statements—Continued
(All Dollars Are in Thousands, Except Unit and Per Unit Data, Except Where Noted)
Transaction and other fees (including monitoring fees) are fees charged directly to managed funds and portfolio companies. The investment advisory agreements generally require that the investment adviser reduce the amount of management fees payable by the limited partners to the Partnership (“management fee reductions”) by an amount equal to a portion of the transaction and other fees directly paid to the Partnership by the portfolio companies. The amount of the reduction varies by fund, the type of fee paid by the portfolio company and the previously incurred expenses of the fund.
Management fee offsets are reductions to management fees payable by the limited partners of the Blackstone Funds, which are granted based on the amount such limited partners reimburse the Blackstone Funds for placement fees.
Advisory fees consist of transaction-based fee arrangements. Transaction-based fees are recognized when (a) there is evidence of an arrangement with a client, (b) agreed upon services have been provided, (c) fees are fixed or determinable, and (d) collection is reasonably assured.
Accrued but unpaid Management and Advisory Fees, net of management fee reductions and management fee offsets, as of the reporting date are included in Accounts Receivable or Due from Affiliates in the Consolidated Statements of Financial Condition. Management fees paid by limited partners to the Blackstone Funds and passed on to Blackstone are not considered affiliate revenues.
Performance Fees — Performance Fees earned on the performance of Blackstone’s hedge fund structures (“Incentive Fees”) are recognized based on fund performance during the period, subject to the achievement of minimum return levels, or high water marks, in accordance with the respective terms set out in each hedge fund’s governing agreements. Accrued but unpaid Incentive Fees charged directly to investors in Blackstone’s offshore hedge funds as of the reporting date are recorded within Due from Affiliates in the Consolidated Statements of Financial Condition. Accrued but unpaid Incentive Fees on onshore funds as of the reporting date are reflected in Investments in the Consolidated Statements of Financial Condition. Incentive Fees are realized at the end of a measurement period, typically annually. Once realized, such fees are not subject to clawback or reversal.
In certain fund structures, specifically in private equity, real estate and certain hedge fund solutions and credit-focused funds (“carry funds”), performance fees (“Carried Interest”) are allocated to the general partner based on cumulative fund performance to date, subject to a preferred return to limited partners. At the end of each reporting period, the Partnership calculates the Carried Interest that would be due to the Partnership for each fund, pursuant to the fund agreements, as if the fair value of the underlying investments were realized as of such date, irrespective of whether such amounts have been realized. As the fair value of underlying investments varies between reporting periods, it is necessary to make adjustments to amounts recorded as Carried Interest to reflect either (a) positive performance resulting in an increase in the Carried Interest allocated to the general partner or (b) negative performance that would cause the amount due to the Partnership to be less than the amount previously recognized as revenue, resulting in a negative adjustment to Carried Interest allocated to the general partner. In each scenario, it is necessary to calculate the Carried Interest on cumulative results compared to the Carried Interest recorded to date and make the required positive or negative adjustments. The Partnership ceases to record negative Carried Interest allocations once previously recognized Carried Interest allocations for such fund have been fully reversed. The Partnership is not obligated to pay guaranteed returns or hurdles, and therefore, cannot have negative Carried Interest over the life of a fund. Accrued but unpaid Carried Interest as of the reporting date is reflected in Investments in the Consolidated Statements of Financial Condition.
Carried Interest is realized when an underlying investment is profitably disposed of and the fund’s cumulative returns are in excess of the preferred return or, in limited instances, after certain thresholds for return of capital are
163
Table of Contents
THE BLACKSTONE GROUP L.P.
Notes to Consolidated Financial Statements—Continued
(All Dollars Are in Thousands, Except Unit and Per Unit Data, Except Where Noted)
met. Carried Interest is subject to clawback to the extent that the Carried Interest received to date exceeds the amount due to Blackstone based on cumulative results. As such, the accrual for potential repayment of previously received Carried Interest, which is a component of Due to Affiliates, represents all amounts previously distributed to Blackstone Holdings and non-controlling interest holders that would need to be repaid to the Blackstone carry funds if the Blackstone carry funds were to be liquidated based on the current fair value of the underlying funds’ investments as of the reporting date. The actual clawback liability, however, generally does not become realized until the end of a fund’s life except for certain funds, including certain Blackstone real estate funds, multi-asset class investment funds and credit-focused funds, which may have an interim clawback liability.
Investment Income (Loss) — Investment Income (Loss) represents the unrealized and realized gains and losses on the Partnership’s principal investments, including its investments in Blackstone Funds that are not consolidated, its equity method investments, and other principal investments. Investment Income (Loss) is realized when the Partnership redeems all or a portion of its investment or when the Partnership receives cash income, such as dividends or distributions. Unrealized Investment Income (Loss) results from changes in the fair value of the underlying investment as well as the reversal of unrealized gain (loss) at the time an investment is realized.
Interest and Dividend Revenue — Interest and Dividend Revenue comprises primarily interest and dividend income earned on principal investments held by Blackstone.
Other Revenue — Other Revenue consists of miscellaneous income and foreign exchange gains and losses arising on transactions denominated in currencies other than U.S. dollars.
Fair Value of Financial Instruments
GAAP establishes a hierarchical disclosure framework which prioritizes and ranks the level of market price observability used in measuring financial instruments at fair value. Market price observability is affected by a number of factors, including the type of financial instrument, the characteristics specific to the financial instrument and the state of the marketplace, including the existence and transparency of transactions between market participants. Financial instruments with readily available quoted prices in active markets generally will have a higher degree of market price observability and a lesser degree of judgment used in measuring fair value.
Financial instruments measured and reported at fair value are classified and disclosed based on the observability of inputs used in the determination of fair values, as follows:
| • | Level I — Quoted prices are available in active markets for identical financial instruments as of the reporting date. The types of financial instruments in Level I include listed equities, listed derivatives and mutual funds with quoted prices. The Partnership does not adjust the quoted price for these investments, even in situations where Blackstone holds a large position and a sale could reasonably impact the quoted price. |
| • | Level II — Pricing inputs are other than quoted prices in active markets, which are either directly or indirectly observable as of the reporting date, and fair value is determined through the use of models or other valuation methodologies. Financial instruments which are generally included in this category include corporate bonds and loans, including corporate bonds and loans held within CLO vehicles, government and agency securities, less liquid and restricted equity securities, and certain over-the-counter derivatives where the fair value is based on observable inputs. Senior and subordinated notes issued by CLO vehicles are classified within Level II of the fair value hierarchy. |
| • | Level III — Pricing inputs are unobservable for the financial instruments and includes situations where there is little, if any, market activity for the financial instrument. The inputs into the determination of fair |
164
Table of Contents
THE BLACKSTONE GROUP L.P.
Notes to Consolidated Financial Statements—Continued
(All Dollars Are in Thousands, Except Unit and Per Unit Data, Except Where Noted)
| value require significant management judgment or estimation. Financial instruments that are included in this category generally include general and limited partnership interests in private equity and real estate funds, credit-focused funds, distressed debt and non-investment grade residual interests in securitizations, certain corporate bonds and loans held within CLO vehicles, and certain over-the-counter derivatives where the fair value is based on unobservable inputs. |
In certain cases, the inputs used to measure fair value may fall into different levels of the fair value hierarchy. In such cases, the determination of which category within the fair value hierarchy is appropriate for any given financial instrument is based on the lowest level of input that is significant to the fair value measurement. The Partnership’s assessment of the significance of a particular input to the fair value measurement in its entirety requires judgment and considers factors specific to the financial instrument.
Transfers between levels of the fair value hierarchy are recognized at the beginning of the reporting period.
Level II Valuation Techniques
Financial instruments classified within Level II of the fair value hierarchy comprise debt instruments, including certain corporate loans and bonds held by Blackstone’s consolidated CLO vehicles and debt securities sold, not yet purchased. Certain equity securities and derivative instruments valued using observable inputs are also classified as Level II.
The valuation techniques used to value financial instruments classified within Level II of the fair value hierarchy are as follows:
| • | Debt Instruments and Equity Securities are valued on the basis of prices from an orderly transaction between market participants provided by reputable dealers or pricing services. In determining the value of a particular investment, pricing services may use certain information with respect to transactions in such investments, quotations from dealers, pricing matrices and market transactions in comparable investments and various relationships between investments. The valuation of certain equity securities is based on an observable price for an identical security adjusted for the effect of a restriction. |
| • | Freestanding Derivatives are valued using contractual cash flows and observable inputs comprising yield curves, foreign currency rates and credit spreads. |
| • | Senior and subordinate notes issued by CLO vehicles are classified based on the more observable fair value of CLO assets less (a) the fair value of any beneficial interests held by Blackstone, and (b) the carrying value of any beneficial interests that represent compensation for services. |
Level III Valuation Techniques
In the absence of observable market prices, Blackstone values its investments using valuation methodologies applied on a consistent basis. For some investments little market activity may exist; management’s determination of fair value is then based on the best information available in the circumstances, and may incorporate management’s own assumptions and involves a significant degree of judgment, taking into consideration a combination of internal and external factors, including the appropriate risk adjustments for non-performance and liquidity risks. Investments for which market prices are not observable include private investments in the equity of operating companies, real estate properties, certain funds of hedge funds and credit-focused investments.
Private Equity Investments — The fair values of private equity investments are determined by reference to projected net earnings, earnings before interest, taxes, depreciation and amortization (“EBITDA”), the discounted
165
Table of Contents
THE BLACKSTONE GROUP L.P.
Notes to Consolidated Financial Statements—Continued
(All Dollars Are in Thousands, Except Unit and Per Unit Data, Except Where Noted)
cash flow method, public market or private transactions, valuations for comparable companies and other measures which, in many cases, are based on unaudited information at the time received. Valuations may be derived by reference to observable valuation measures for comparable companies or transactions (for example, multiplying a key performance metric of the investee company such as EBITDA by a relevant valuation multiple observed in the range of comparable companies or transactions), adjusted by management for differences between the investment and the referenced comparables, and in some instances by reference to option pricing models or other similar methods. Where a discounted cash flow method is used, a terminal value is derived by reference to EBITDA or price/earnings exit multiples.
Real Estate Investments — The fair values of real estate investments are determined by considering projected operating cash flows, sales of comparable assets, if any, and replacement costs among other measures. The methods used to estimate the fair value of real estate investments include the discounted cash flow method and/or capitalization rates (“cap rates”) analysis. Valuations may be derived by reference to observable valuation measures for comparable companies or assets (for example, multiplying a key performance metric of the investee company or asset, such as EBITDA, by a relevant valuation multiple observed in the range of comparable companies or transactions), adjusted by management for differences between the investment and the referenced comparables, and in some instances by reference to option pricing models or other similar methods. Where a discounted cash flow method is used, a terminal value is derived by reference to an exit EBITDA multiple or capitalization rate. Additionally, where applicable, projected distributable cash flow through debt maturity will be considered in support of the investment’s fair value.
Credit-Focused Investments — The fair values of credit-focused investments are generally determined on the basis of prices between market participants provided by reputable dealers or pricing services. For credit-focused investments that are not publicly traded or whose market prices are not readily available, Blackstone may utilize other valuation techniques, including the discounted cash flow method or a market approach. The discounted cash flow method projects the expected cash flows of the debt instrument based on contractual terms, and discounts such cash flows back to the valuation date using a market-based yield. The market-based yield is estimated using yields of publicly traded debt instruments issued by companies operating in similar industries as the subject investment, with similar leverage statistics and time to maturity.
The market approach is generally used to determine the enterprise value of the issuer of a credit investment, and considers valuation multiples of comparable companies or transactions. The resulting enterprise value will dictate whether or not such credit investment has adequate enterprise value coverage. In cases of distressed credit instruments, the market approach may be used to estimate a recovery value in the event of a restructuring.
Level III Valuation Process
Investments classified within Level III of the fair value hierarchy are valued on a quarterly basis, taking into consideration factors including any changes in Blackstone’s weighted-average cost of capital assumptions, discounted cash flow projections and exit multiple assumptions, as well as any changes in economic and other relevant conditions, and valuation models are updated accordingly. The valuation process also includes a review by an independent valuation party, at least annually for all investments, and quarterly for certain investments, to corroborate the values determined by management. The valuations of Blackstone’s investments are reviewed quarterly by a valuation committee chaired by Blackstone’s Vice Chairman and includes senior heads of each of Blackstone’s businesses, as well as representatives of legal and finance. Each quarter, the valuations of Blackstone’s investments are also reviewed by the Audit Committee in a meeting attended by the chairman of the valuation committee. The valuations are further tested by comparison to actual sales prices obtained on disposition of the investments.
166
Table of Contents
THE BLACKSTONE GROUP L.P.
Notes to Consolidated Financial Statements—Continued
(All Dollars Are in Thousands, Except Unit and Per Unit Data, Except Where Noted)
Investments, at Fair Value
The Blackstone Funds are accounted for as investment companies under the American Institute of Certified Public Accountants Accounting and Auditing Guide, Investment Companies, and reflect their investments, including majority-owned and controlled investments (the “Portfolio Companies”), at fair value. Such consolidated funds’ investments are reflected in Investments on the Consolidated Statements of Financial Condition at fair value, with unrealized gains and losses resulting from changes in fair value reflected as a component of Net Gains (Losses) from Fund Investment Activities in the Consolidated Statements of Operations. Fair value is the amount that would be received to sell an asset or paid to transfer a liability, in an orderly transaction between market participants at the measurement date, at current market conditions (i.e., the exit price).
Blackstone’s principal investments are presented at fair value with unrealized appreciation or depreciation and realized gains and losses recognized in the Consolidated Statements of Operations within Investment Income (Loss).
For certain instruments, the Partnership has elected the fair value option. Such election is irrevocable and is applied on an investment by investment basis at initial recognition. The Partnership has applied the fair value option for certain loans and receivables and certain investments in private debt securities that otherwise would not have been carried at fair value with gains and losses recorded in net income. Accounting for these financial instruments at fair value is consistent with how the Partnership accounts for its other principal investments. Loans extended to third parties are recorded within Accounts Receivable within the Consolidated Statements of Financial Condition. Debt securities for which the fair value option has been elected are recorded within Investments. The methodology for measuring the fair value of such investments is consistent with the methodology applied to private equity, real estate, credit-focused and funds of hedge funds investments. Changes in the fair value of such instruments are recognized in Investment Income (Loss) in the Consolidated Statements of Operations. Interest income on interest bearing loans and receivables and debt securities on which the fair value option has been elected is based on stated coupon rates adjusted for the accretion of purchase discounts and the amortization of purchase premiums. This interest income is recorded within Interest and Dividend Revenue.
In addition, the Partnership has elected the fair value option for the assets and liabilities of CLO vehicles that are consolidated as of January 1, 2010, as a result of the initial adoption of variable interest entity consolidation guidance. The Partnership has also elected the fair value option for CLO vehicles consolidated as a result of the acquisitions of CLO management contracts or the acquisition of the share capital of CLO managers. Historically, the adjustment resulting from the difference between the fair value of assets and liabilities for each of these events was presented as a transition and acquisition adjustment to Appropriated Partners’ Capital. Assets of the consolidated CLOs are presented within Investments within the Consolidated Statements of Financial Condition and Liabilities within Loans Payable for the amounts due to unaffiliated third parties and Due to Affiliates for the amounts held by non-consolidated affiliates. Changes in the fair value of consolidated CLO assets and liabilities and related interest, dividend and other income subsequent to adoption and acquisition are presented within Net Gains (Losses) from Fund Investment Activities. Expenses of consolidated CLO vehicles are presented in Fund Expenses. Historically, amounts attributable to Non-Controlling Interests in Consolidated Entities had a corresponding adjustment to Appropriated Partners’ Capital. On the adoption of the new CLO measurement guidance, there is no attribution of amounts to Non-Controlling Interests and no corresponding adjustments to Appropriated Partners’ Capital.
The Partnership has elected the fair value option for certain proprietary investments that would otherwise have been accounted for using the equity method of accounting. The fair value of such investments is based on quoted prices in an active market or using the discounted cash flow method. Changes in fair value are recognized in Investment Income (Loss) in the Consolidated Statements of Operations.
167
Table of Contents
THE BLACKSTONE GROUP L.P.
Notes to Consolidated Financial Statements—Continued
(All Dollars Are in Thousands, Except Unit and Per Unit Data, Except Where Noted)
Further disclosure on instruments for which the fair value option has been elected is presented in Note 7. “Fair Value Option” to the Consolidated Financial Statements.
The investments of consolidated Blackstone Funds in funds of hedge funds (“Investee Funds”) are valued at net asset value (“NAV”) per share of the Investee Fund. In limited circumstances, the Partnership may determine, based on its own due diligence and investment procedures, that NAV per share does not represent fair value. In such circumstances, the Partnership will estimate the fair value in good faith and in a manner that it reasonably chooses, in accordance with the requirements of GAAP.
Certain investments of Blackstone and of the consolidated Blackstone funds of hedge funds and credit-focused funds measure their investments in underlying funds at fair value using NAV per share without adjustment. The terms of the investee’s investment generally provide for minimum holding periods or lock-ups, the institution of gates on redemptions or the suspension of redemptions or an ability to side pocket investments, at the discretion of the investee’s fund manager, and as a result, investments may not be redeemable at, or within three months of, the reporting date. A side pocket is used by hedge funds and funds of hedge funds to separate investments that may lack a readily ascertainable value, are illiquid or are subject to liquidity restriction. Redemptions are generally not permitted until the investments within a side pocket are liquidated or it is deemed that the conditions existing at the time that required the investment to be included in the side pocket no longer exist. As the timing of either of these events is uncertain, the timing at which the Partnership may redeem an investment held in a side pocket cannot be estimated. Further disclosure on instruments for which fair value is measured using NAV per share is presented in Note 5. “Net Asset Value as Fair Value”.
Security and loan transactions are recorded on a trade date basis.
Equity Method Investments
Investments in which the Partnership is deemed to exert significant influence, but not control, are accounted for using the equity method of accounting. Under the equity method of accounting, the Partnership’s share of earnings (losses) from equity method investments is included in Investment Income (Loss) in the Consolidated Statements of Operations. The carrying amounts of equity method investments are reflected in Investments in the Consolidated Statements of Financial Condition. As the underlying investments of the Partnership’s equity method investments in Blackstone Funds are reported at fair value, the carrying value of the Partnership’s equity method investments approximates fair value.
Cash and Cash Equivalents
Cash and Cash Equivalents represents cash on hand, cash held in banks, money market funds and liquid investments with original maturities of three months or less. Interest income from cash and cash equivalents is recorded in Interest and Dividend Revenue in the Consolidated Statements of Operations.
Cash Held by Blackstone Funds and Other
Cash Held by Blackstone Funds and Other represents cash and cash equivalents held by consolidated Blackstone Funds and other consolidated entities. Such amounts are not available to fund the general liquidity needs of Blackstone.
Accounts Receivable
Accounts Receivable includes management fees receivable from limited partners, receivables from underlying funds in the fund of hedge funds business, placement and advisory fees receivables, receivables relating to unsettled
168
Table of Contents
THE BLACKSTONE GROUP L.P.
Notes to Consolidated Financial Statements—Continued
(All Dollars Are in Thousands, Except Unit and Per Unit Data, Except Where Noted)
sale transactions and loans extended to unaffiliated third parties. Accounts Receivable, excluding those for which the fair value option has been elected, are assessed periodically for collectability. Amounts determined to be uncollectible are charged directly to General, Administrative and Other Expenses in the Consolidated Statements of Operations.
Intangibles and Goodwill
Blackstone’s intangible assets consist of contractual rights to earn future fee income, including management and advisory fees, Incentive Fees and Carried Interest. Identifiable finite-lived intangible assets are amortized on a straight-line basis over their estimated useful lives, ranging from 3 to 20 years, reflecting the contractual lives of such assets. Amortization expense is included within General, Administrative and Other in the Consolidated Statements of Operations. The Partnership does not hold any indefinite-lived intangible assets. Intangible assets are reviewed for impairment when events or changes in circumstances indicate that the carrying amount may not be recoverable.
Goodwill comprises goodwill arising from the contribution and reorganization of the Partnership’s predecessor entities in 2007 immediately prior to its IPO, the acquisition of GSO in 2008 and the acquisition of Strategic Partners in 2013. Goodwill is reviewed for impairment at least annually utilizing a qualitative or quantitative approach, and more frequently if circumstances indicate impairment may have occurred. The impairment testing for goodwill under the qualitative approach is based first on a qualitative assessment to determine if it is more likely than not that the fair value of Blackstone’s operating segments is less than their respective carrying values. The operating segment is the reporting level for testing the impairment of goodwill. If it is determined that it is more likely than not that an operating segment’s fair value is less than its carrying value or when the quantitative approach is used, a two-step quantitative assessment is performed to (a) calculate the fair value of the operating segment and compare it to its carrying value, and (b) if the carrying value exceeds its fair value, to measure an impairment loss.
Furniture, Equipment and Leasehold Improvements
Furniture, equipment and leasehold improvements consist primarily of leasehold improvements, furniture, fixtures and equipment, computer hardware and software and are recorded at cost less accumulated depreciation and amortization. Depreciation and amortization are calculated using the straight-line method over the assets’ estimated useful economic lives, which for leasehold improvements are the lesser of the lease terms or the life of the asset, generally ten to fifteen years, and three to seven years for other fixed assets. The Partnership evaluates long-lived assets for impairment whenever events or changes in circumstances indicate that the carrying amount of an asset may not be recoverable.
Foreign Currency
In the normal course of business, the Partnership may enter into transactions not denominated in United States dollars. Foreign exchange gains and losses arising on such transactions are recorded as Other Revenue in the Consolidated Statements of Operations. Foreign currency transaction gains and losses arising within consolidated Blackstone Funds are recorded in Net Gains (Losses) from Fund Investment Activities. In addition, the Partnership consolidates a number of entities that have a non-U.S. dollar functional currency. Non-U.S. dollar denominated assets and liabilities are translated to U.S. dollars at the exchange rate prevailing at the reporting date and income, expenses, gains and losses are translated at the prevailing exchange rate on the dates that they were recorded. Cumulative translation adjustments arising from the translation of non-U.S. dollar denominated operations are recorded in Other Comprehensive Income and allocated to Non-Controlling Interests in Consolidated Entities, as applicable.
169
Table of Contents
THE BLACKSTONE GROUP L.P.
Notes to Consolidated Financial Statements—Continued
(All Dollars Are in Thousands, Except Unit and Per Unit Data, Except Where Noted)
Comprehensive Income
Comprehensive Income consists of Net Income and Other Comprehensive Income. The Partnership’s Other Comprehensive Income is comprised of foreign currency cumulative translation adjustments.
Non-Controlling Interests in Consolidated Entities
Non-Controlling Interests in Consolidated Entities represent the component of Partners’ Capital in consolidated Blackstone Funds held by third party investors and employees. The percentage interests held by third parties and employees is adjusted for general partner allocations and by subscriptions and redemptions in funds of hedge funds and certain credit-focused funds which occur during the reporting period. In addition, all non-controlling interests in consolidated Blackstone Funds are attributed a share of income (loss) arising from the respective funds and a share of other comprehensive income, if applicable. Income (Loss) is allocated to non-controlling interests in consolidated entities based on the relative ownership interests of third party investors and employees after considering any contractual arrangements that govern the allocation of income (loss) such as fees allocable to The Blackstone Group L.P.
Redeemable Non-Controlling Interests in Consolidated Entities
Non-controlling interests related to funds of hedge funds are subject to annual, semi-annual or quarterly redemption by investors in these funds following the expiration of a specified period of time, or may be withdrawn subject to a redemption fee during the period when capital may not be withdrawn. As limited partners in these types of funds have been granted redemption rights, amounts relating to third party interests in such consolidated funds are presented as Redeemable Non-Controlling Interests in Consolidated Entities within the Consolidated Statements of Financial Condition. When redeemable amounts become legally payable to investors, they are classified as a liability and included in Accounts Payable, Accrued Expenses and Other Liabilities in the Consolidated Statements of Financial Condition. For all consolidated funds in which redemption rights have not been granted, non-controlling interests are presented within Partners’ Capital in the Consolidated Statements of Financial Condition as Non-Controlling Interests in Consolidated Entities.
Non-Controlling Interests in Blackstone Holdings
Non-Controlling Interests in Blackstone Holdings represent the component of Partners’ Capital in the consolidated Blackstone Holdings Partnerships held by Blackstone personnel and others who are limited partners of the Blackstone Holdings Partnerships.
Certain costs and expenses are borne directly by the Holdings Partnerships. Income (Loss), excluding those costs directly borne by and attributable to the Holdings Partnerships, is attributable to Non-Controlling Interests in Blackstone Holdings. This residual attribution is based on the year to date average percentage of Blackstone Holdings Partnership Units held by Blackstone personnel and others who are limited partners of the Blackstone Holdings Partnerships.
Compensation and Benefits
Compensation and Benefits — Compensation — Compensation and Benefits consists of (a) employee compensation, comprising salary and bonus, and benefits paid and payable to employees and senior managing directors and (b) equity-based compensation associated with the grants of equity-based awards to employees and senior managing directors. Compensation cost relating to the issuance of equity-based awards to senior managing
170
Table of Contents
THE BLACKSTONE GROUP L.P.
Notes to Consolidated Financial Statements—Continued
(All Dollars Are in Thousands, Except Unit and Per Unit Data, Except Where Noted)
directors and employees is measured at fair value at the grant date, taking into consideration expected forfeitures, and expensed over the vesting period on a straight-line basis, except in the case of (a) equity-based awards that do not require future service, which are expensed immediately, and (b) certain awards to recipients that meet specified criteria making them eligible for retirement treatment (allowing such recipient to keep a percentage of those awards upon departure from Blackstone after becoming eligible for retirement), for which the expense for the portion of the award that would be retained in the event of retirement is either expensed immediately or amortized to the retirement date. Cash settled equity-based awards are classified as liabilities and are remeasured at the end of each reporting period.
Compensation and Benefits — Performance Fee — Performance Fee Compensation consists of Carried Interest (which may be distributed in cash or in-kind) and Incentive Fee allocations, and may in future periods also include allocations of investment income from Blackstone’s firm investments, to employees and senior managing directors participating in certain profit sharing initiatives. Such compensation expense is subject to both positive and negative adjustments. Unlike Carried Interest and Incentive Fees, compensation expense is based on the performance of individual investments held by a fund rather than on a fund by fund basis. Compensation received from advisory clients in the form of securities of such clients may also be allocated to employees and senior managing directors.
Other Income
Net Gains (Losses) from Fund Investment Activities in the Consolidated Statements of Operations include net realized gains (losses) from realizations and sales of investments, the net change in unrealized gains (losses) resulting from changes in the fair value of investments and interest income and expense and dividends attributable to the consolidated Blackstone Funds’ investments.
Expenses incurred by consolidated Blackstone funds are separately presented within Fund Expenses in the Consolidated Statements of Operations.
Other Income also includes amounts attributable to the Reversal of the Tax Receivable Agreement Liability. See Note 14. “Income Taxes — Other Income — Reversal of the Tax Receivable Agreement Liability” for additional information.
Income Taxes
The Blackstone Holdings Partnerships and certain of their subsidiaries operate in the U.S. as partnerships for U.S. federal income tax purposes and generally as corporate entities in non-U.S. jurisdictions. Accordingly, these entities in some cases are subject to New York City unincorporated business taxes or non-U.S. income taxes. In addition, certain of the wholly owned subsidiaries of the Partnership and the Blackstone Holdings Partnerships will be subject to federal, state and local corporate income taxes at the entity level and the related tax provision attributable to the Partnership’s share of this income tax is reflected in the Consolidated Financial Statements.
Income taxes are accounted for using the asset and liability method of accounting. Under this method, deferred tax assets and liabilities are recognized for the expected future tax consequences of differences between the carrying amounts of assets and liabilities and their respective tax basis, using tax rates in effect for the year in which the differences are expected to reverse. The effect on deferred assets and liabilities of a change in tax rates is recognized in income in the period when the change is enacted. Deferred tax assets are reduced by a valuation allowance when it is more likely than not that some portion or all of the deferred tax assets will not be realized. Current and deferred tax liabilities are recorded within Accounts Payable, Accrued Expenses and Other Liabilities in the Consolidated Statements of Financial Condition.
171
Table of Contents
THE BLACKSTONE GROUP L.P.
Notes to Consolidated Financial Statements—Continued
(All Dollars Are in Thousands, Except Unit and Per Unit Data, Except Where Noted)
Blackstone uses the flow-through method to account for investment tax credits. Under this method, the investment tax credits are recognized as a reduction to income tax expense.
Blackstone analyzes its tax filing positions in all of the U.S. federal, state, local and foreign tax jurisdictions where it is required to file income tax returns, as well as for all open tax years in these jurisdictions. Blackstone records uncertain tax positions on the basis of a two-step process: (a) determination is made whether it is more likely than not that the tax positions will be sustained based on the technical merits of the position and (b) those tax positions that meet the more-likely-than-not threshold are recognized as the largest amount of tax benefit that is greater than 50 percent likely to be realized upon ultimate settlement with the related tax authority. Blackstone recognizes accrued interest and penalties related to uncertain tax positions in General, Administrative, and Other expenses within the Consolidated Statements of Operations.
Net Income (Loss) Per Common Unit
Basic Income (Loss) Per Common Unit is calculated by dividing Net Income (Loss) Attributable to The Blackstone Group L.P. by the weighted-average number of common units and unvested participating common units outstanding for the period. Diluted Income (Loss) Per Common Unit reflects the assumed conversion of all dilutive securities. Diluted Income (Loss) Per Common Unit excludes the anti-dilutive effect of Blackstone Holdings Partnership Units and deferred restricted common units, as applicable.
Repurchase and Reverse Repurchase Agreements
Securities purchased under agreements to resell (“reverse repurchase agreements”) and securities sold under agreements to repurchase (“repurchase agreements”), comprised primarily of U.S. and non-U.S. government and agency securities, asset-backed securities and corporate debt, represent collateralized financing transactions. Such transactions are recorded in the Consolidated Statements of Financial Condition at their contractual amounts and include accrued interest. The carrying value of repurchase and reverse repurchase agreements approximates fair value.
The Partnership manages credit exposure arising from reverse repurchase agreements and repurchase agreements by, in appropriate circumstances, entering into master netting agreements and collateral arrangements with counterparties that provide the Partnership, in the event of a counterparty default, the right to liquidate collateral and the right to offset a counterparty’s rights and obligations.
The Partnership takes possession of securities purchased under reverse repurchase agreements and is permitted to repledge, deliver or otherwise use such securities. The Partnership also pledges its financial instruments to counterparties to collateralize repurchase agreements. Financial instruments pledged that can be repledged, delivered or otherwise used by the counterparty are recorded in Investments in the Consolidated Statements of Financial Condition. Additional disclosures relating to reverse repurchase and repurchase agreements are discussed in Note 10. “Reverse Repurchase and Repurchase Agreements”.
Blackstone does not offset assets and liabilities relating to reverse repurchase agreements and repurchase agreements in its Consolidated Statements of Financial Condition. Additional disclosures relating to offsetting are discussed in Note 12. “Offsetting of Assets and Liabilities”.
Securities Sold, Not Yet Purchased
Securities Sold, Not Yet Purchased consist of equity and debt securities that the Partnership has borrowed and sold. The Partnership is required to “cover” its short sale in the future by purchasing the security at prevailing
172
Table of Contents
THE BLACKSTONE GROUP L.P.
Notes to Consolidated Financial Statements—Continued
(All Dollars Are in Thousands, Except Unit and Per Unit Data, Except Where Noted)
market prices and delivering it to the counterparty from which it borrowed the security. The Partnership is exposed to loss in the event that the price at which a security may have to be purchased to cover a short sale exceeds the price at which the borrowed security was sold short.
Securities Sold, Not Yet Purchased are recorded at fair value in the Consolidated Statements of Financial Condition.
Derivative Instruments
The Partnership recognizes all derivatives as assets or liabilities on its Consolidated Statements of Financial Condition at fair value. On the date the Partnership enters into a derivative contract, it designates and documents each derivative contract as one of the following: (a) a hedge of a recognized asset or liability (“fair value hedge”), (b) a hedge of a forecasted transaction or of the variability of cash flows to be received or paid related to a recognized asset or liability (“cash flow hedge”), (c) a hedge of a net investment in a foreign operation, or (d) a derivative instrument not designated as a hedging instrument (“freestanding derivative”). For a fair value hedge, Blackstone records changes in the fair value of the derivative and, to the extent that it is highly effective, changes in the fair value of the hedged asset or liability attributable to the hedged risk, in current period earnings in General, Administrative and Other in the Consolidated Statements of Operations. Changes in the fair value of derivatives designated as hedging instruments caused by factors other than changes in the risk being hedged, which are excluded from the assessment of hedge effectiveness, are recognized in current period earnings. Gains or losses on a derivative instrument that is designated as, and is effective as, an economic hedge of a net investment in a foreign operation are reported in the cumulative translation adjustment section of other comprehensive income to the extent it is effective as a hedge. The ineffective portion of a net investment hedge is recognized in current period earnings.
The Partnership formally documents at inception its hedge relationships, including identification of the hedging instruments and the hedged items, its risk management objectives, strategy for undertaking the hedge transaction and the Partnership’s evaluation of effectiveness of its hedged transaction. At least monthly, the Partnership also formally assesses whether the derivative it designated in each hedging relationship is expected to be, and has been, highly effective in offsetting changes in estimated fair values or cash flows of the hedged items using either the regression analysis or the dollar offset method. For net investment hedges, the Partnership uses a method based on changes in spot rates to measure effectiveness. If it is determined that a derivative is not highly effective at hedging the designated exposure, hedge accounting is discontinued. The Partnership may also at any time remove a designation of a fair value hedge. The fair values of hedging derivative instruments are reflected within Other Assets in the Consolidated Statements of Financial Condition.
For freestanding derivative contracts, the Partnership presents changes in fair value in current period earnings. Changes in the fair value of derivative instruments held by consolidated Blackstone Funds are reflected in Net Gains (Losses) from Fund Investment Activities or, where derivative instruments are held by the Partnership, within Investment Income (Loss) in the Consolidated Statements of Operations. The fair value of freestanding derivative assets of the consolidated Blackstone Funds are recorded within Investments, the fair value of freestanding derivative assets that are not part of the consolidated Blackstone Funds are recorded within Other Assets and the fair value of freestanding derivative liabilities are recorded within Accounts Payable, Accrued Expenses and Other Liabilities in the Consolidated Statements of Financial Condition.
The Partnership has elected to not offset derivative assets and liabilities or financial assets in its Consolidated Statements of Financial Condition, including cash, that may be received or paid as part of collateral arrangements, even when an enforceable master netting agreement is in place that provides the Partnership, in the event of counterparty default, the right to liquidate collateral and the right to offset a counterparty’s rights and obligations.
173
Table of Contents
THE BLACKSTONE GROUP L.P.
Notes to Consolidated Financial Statements—Continued
(All Dollars Are in Thousands, Except Unit and Per Unit Data, Except Where Noted)
Blackstone’s other disclosures regarding derivative financial instruments are discussed in Note 6. “Derivative Financial Instruments”.
Blackstone’s disclosures regarding offsetting are discussed in Note 12. “Offsetting of Assets and Liabilities”.
Affiliates
Blackstone considers its Founder, senior managing directors, employees, the Blackstone Funds and the Portfolio Companies to be affiliates.
Distributions
Distributions are reflected in the consolidated financial statements when declared.
Recent Accounting Developments
In May 2014, the Financial Accounting Standards Board (“FASB”) issued amended guidance on revenue from contracts with customers. The guidance requires that an entity should recognize revenue to depict the transfer of promised goods or services to customers in an amount that reflects the consideration to which the entity expects to be entitled in exchange for those goods or services. An entity is required to (a) identify the contract(s) with a customer, (b) identify the performance obligations in the contract, (c) determine the transaction price, (d) allocate the transaction price to the performance obligations in the contract, and (e) recognize revenue when (or as) the entity satisfies a performance obligation. In determining the transaction price, an entity may include variable consideration only to the extent that it is probable that a significant reversal in the amount of cumulative revenue recognized would not occur when the uncertainty associated with the variable consideration is resolved.
The guidance introduces new qualitative and quantitative disclosure requirements about contracts with customers including revenue and impairments recognized, disaggregation of revenue and information about contract balances and performance obligations. Information is required about significant judgments and changes in judgments in determining the timing of satisfaction of performance obligations and determining the transaction price and amounts allocated to performance obligations. Additional disclosures are required about assets recognized from the costs to obtain or fulfill a contract.
In August 2015, the FASB issued new guidance deferring the effective date of the new revenue recognition standard by one year. The new guidance should be applied for annual reporting periods beginning after December 15, 2017, including interim periods within that reporting period.
Blackstone has concluded that capital allocation-based Performance Fees (“Capital Allocation-Based Arrangements”) represent equity method investments that are not in the scope of the amended revenue recognition guidance. Therefore, effective January 1, 2018, Blackstone will amend the recognition and measurement of Capital Allocation-Based Arrangements. This accounting change will not change the timing or amount of revenue recognized related to Capital Allocation-Based Arrangements. These amounts are currently recognized within Realized and Unrealized Performance Fees — Carried Interest and Incentive Fees in the Consolidated Statements of Operations. Under the equity method of accounting Blackstone will recognize its allocations of Carried Interest or Incentive Fees within Investment Income along with the allocations proportionate to Blackstone’s ownership interests in the Blackstone Funds. Blackstone will apply a retrospective application and prior periods shall be restated. The impact of adoption is a reclassification of Carried Interest to Investment Income. This change will
174
Table of Contents
THE BLACKSTONE GROUP L.P.
Notes to Consolidated Financial Statements—Continued
(All Dollars Are in Thousands, Except Unit and Per Unit Data, Except Where Noted)
have no impact on Net Income Attributable to The Blackstone Group L.P. Blackstone has concluded that the majority of its Incentive Fees are not part of a Capital Allocation-Based Arrangement (“Contractual Incentive Fees”), and are within the scope of the amended revenue recognition guidance. This accounting change will delay recognition of Contractual Incentive Fees compared to our current accounting treatment, and it is not expected to have a material impact on Blackstone’s financial statements.
The Partnership is evaluating the impact of the amended revenue recognition guidance on other revenue streams including management fees and considerations for reporting revenue gross versus net.
In February 2016, the FASB issued amended guidance on the accounting for leases. The guidance requires the recognition of lease assets and lease liabilities for those leases classified as operating leases under previous GAAP. The guidance retains a distinction between finance leases and operating leases. The classification criteria for distinguishing between finance leases and operating leases are substantially similar to the classification criteria for distinguishing between capital leases and operating leases under previous GAAP. The recognition, measurement and presentation of expenses and cash flows arising from a lease by a lessee have not changed significantly from previous GAAP.
For operating leases, a lessee is required to do the following: (a) recognize a right-of-use asset and a lease liability, initially measured at the present value of the lease payments, in the Statement of Financial Condition, (b) recognize a single lease cost, calculated so that the cost of the lease is allocated over the lease term on a generally straight-line basis, and (c) classify all cash payments within operating activities in the statement of cash flows.
The guidance is effective for fiscal periods beginning after December 15, 2018. Early application is permitted. Blackstone is evaluating the impact of the amended guidance on the Consolidated Statement of Financial Condition. It is not expected to have a material impact on the Consolidated Statements of Operations or the Consolidated Statements of Cash Flows.
In March 2016, the FASB issued amended guidance on stock compensation. The amendments simplify several aspects of the accounting for share-based payment transactions, including the income tax consequences, classification of awards as either equity or liabilities, and accounting for forfeitures (the amended guidance permits an entity to make an accounting policy election either to estimate the number of forfeitures expected to occur or to account for forfeitures when they occur). The amendments require all excess tax benefits and deficiencies related to share-based payment transactions to be recognized through the Provision for Taxes in the Consolidated Statement of Operations. The amendments also require excess tax benefits related to share-based payment transactions to be presented as operating activities in the Consolidated Statement of Cash Flows with employee taxes paid presented as a financing activity. The guidance is effective for annual periods beginning after December 15, 2016 and interim periods within those annual periods. Blackstone has elected to early adopt the guidance for the quarter ended June 30, 2016 and any adjustments have been reflected prospectively as of January 1, 2016.
Blackstone has made an accounting policy election to continue estimating forfeitures in determining the number of equity-based awards that are expected to vest. Amendments relating to the recognition of excess tax benefits and deficiencies in the Consolidated Statement of Operations and Consolidated Statement of Cash Flows have been applied prospectively. As a result, prior period amounts have not been restated. Application of the guidance did not have a material impact on Blackstone’s Consolidated Statement of Operations or Consolidated Statement of Cash Flows.
In October 2016, the FASB issued amended guidance on consolidation. The amendments do not change the characteristics of a primary beneficiary, however, in evaluating whether an entity has the obligation to absorb losses
175
Table of Contents
THE BLACKSTONE GROUP L.P.
Notes to Consolidated Financial Statements—Continued
(All Dollars Are in Thousands, Except Unit and Per Unit Data, Except Where Noted)
or receive benefits from the VIE that could potentially be significant to the VIE, an entity is now required to evaluate all indirect interests, including those held by a party under common control, on a proportionate basis. The guidance is effective for fiscal years beginning after December 15, 2016. The guidance is not expected to have a material impact on Blackstone’s financial statements.
| 3. | GOODWILL AND INTANGIBLE ASSETS |
The carrying value of goodwill was $1.7 billion as of December 31, 2016 and 2015. At December 31, 2016 and 2015, the Partnership determined there was no evidence of Goodwill impairment.
At December 31, 2016 and 2015, goodwill has been allocated to each of the Partnership’s four segments as follows: Private Equity ($778.3 million), Real Estate ($421.7 million), Hedge Fund Solutions ($172.1 million), and Credit ($346.4 million).
Intangible Assets, Net consists of the following:
| December 31, | ||||||||
| 2016 | 2015 | |||||||
| Finite-Lived Intangible Assets / Contractual Rights |
$ | 1,400,876 | $ | 1,424,226 | ||||
| Accumulated Amortization |
(1,138,272 | ) | (1,078,679 | ) | ||||
|
|
|
|
|
|||||
| Intangible Assets, Net |
$ | 262,604 | $ | 345,547 | ||||
|
|
|
|
|
|||||
Changes in the Partnership’s Intangible Assets, Net consists of the following:
| Year Ended December 31, | ||||||||||||
| 2016 | 2015 | 2014 | ||||||||||
| Balance, Beginning of Year |
$ | 345,547 | $ | 458,833 | $ | 560,748 | ||||||
| Amortization Expense |
(82,943 | ) | (101,437 | ) | (101,915 | ) | ||||||
| Intangibles Transferred to PJT Partners Inc. at Spin-Off |
— | (11,849 | ) | — | ||||||||
|
|
|
|
|
|
|
|||||||
| Balance, End of Year |
$ | 262,604 | $ | 345,547 | $ | 458,833 | ||||||
|
|
|
|
|
|
|
|||||||
Amortization of Intangible Assets held at December 31, 2016 is expected to be $43.9 million, $43.8 million, $43.8 million, $43.8 million, and $43.8 million for each of the years ending December 31, 2017, 2018, 2019, 2020, and 2021, respectively. Blackstone’s intangible assets as of December 31, 2016 are expected to amortize over a weighted-average period of 6.1 years.
| 4. | INVESTMENTS |
Investments consist of the following:
| December 31, | ||||||||
| 2016 | 2015 | |||||||
| Investments of Consolidated Blackstone Funds |
$ | 6,480,674 | $ | 4,613,944 | ||||
| Equity Method Investments |
3,092,378 | 3,110,810 | ||||||
| Corporate Treasury Investments |
2,518,438 | 1,682,259 | ||||||
| Performance Fees |
5,320,994 | 4,757,932 | ||||||
| Other Investments |
282,491 | 159,152 | ||||||
|
|
|
|
|
|||||
| $ | 17,694,975 | $ | 14,324,097 | |||||
|
|
|
|
|
|||||
176
Table of Contents
THE BLACKSTONE GROUP L.P.
Notes to Consolidated Financial Statements—Continued
(All Dollars Are in Thousands, Except Unit and Per Unit Data, Except Where Noted)
Blackstone’s share of Investments of Consolidated Blackstone Funds totaled $384.4 million and $451.9 million at December 31, 2016 and December 31, 2015, respectively.
Investments of Consolidated Blackstone Funds
The following table presents the Realized and Net Change in Unrealized Gains (Losses) on investments held by the consolidated Blackstone Funds and a reconciliation to Other Income (Loss) — Net Gains (Losses) from Fund Investment Activities in the Consolidated Statements of Operations:
| Year Ended December 31, | ||||||||||||
| 2016 | 2015 | 2014 | ||||||||||
| Realized Gains |
$ | 123,524 | $ | 223,078 | $ | 143,194 | ||||||
| Net Change in Unrealized Losses |
(61,045 | ) | (161,398 | ) | (20,127 | ) | ||||||
|
|
|
|
|
|
|
|||||||
| Realized and Net Change in Unrealized Gains from Consolidated Blackstone Funds |
62,479 | 61,680 | 123,067 | |||||||||
| Interest and Dividend Revenue Attributable to Consolidated Blackstone Funds |
122,271 | 114,684 | 234,787 | |||||||||
|
|
|
|
|
|
|
|||||||
| Other Income — Net Gains from Fund Investment Activities |
$ | 184,750 | $ | 176,364 | $ | 357,854 | ||||||
|
|
|
|
|
|
|
|||||||
Equity Method Investments
Blackstone’s equity method investments include its investments in private equity funds, real estate funds, funds of hedge funds and credit-focused funds and other proprietary investments, which are not consolidated but in which the Partnership exerts significant influence.
Blackstone evaluates each of its equity method investments to determine if any were significant as defined by guidance from the United States Securities and Exchange Commission. As of and for the years ended December 31, 2016, 2015 and 2014, no individual equity method investment held by Blackstone met the significance criteria. As such, Blackstone is not required to present separate financial statements for any of its equity method investments.
Blackstone holds a 40% non-controlling equity interest in Pátria Investments Limited and Pátria Investimentos Ltda. (collectively, “Pátria”) and accounts for this interest using the equity method of accounting.
The Partnership recognized net gains related to its equity method investments of $214.4 million, $82.2 million and $297.9 million for the years ended December 31, 2016, 2015 and 2014, respectively.
177
Table of Contents
THE BLACKSTONE GROUP L.P.
Notes to Consolidated Financial Statements—Continued
(All Dollars Are in Thousands, Except Unit and Per Unit Data, Except Where Noted)
The summarized financial information of the Partnership’s equity method investments for December 31, 2016 are as follows:
| December 31, 2016 and the Year Then Ended | ||||||||||||||||||||||||
| Private | Real | Hedge Fund | ||||||||||||||||||||||
| Equity | Estate | Solutions | Credit | Other (a) | Total | |||||||||||||||||||
| Statement of Financial Condition |
||||||||||||||||||||||||
| Assets |
||||||||||||||||||||||||
| Investments |
$ | 49,751,021 | $ | 62,370,093 | $ | 21,007,134 | $ | 17,804,292 | $ | 7,354 | $ | 150,939,894 | ||||||||||||
| Other Assets |
2,815,042 | 4,384,031 | 2,434,590 | 1,478,119 | 173,917 | 11,285,699 | ||||||||||||||||||
|
|
|
|
|
|
|
|
|
|
|
|
|
|||||||||||||
| Total Assets |
$ | 52,566,063 | $ | 66,754,124 | $ | 23,441,724 | $ | 19,282,411 | $ | 181,271 | $ | 162,225,593 | ||||||||||||
|
|
|
|
|
|
|
|
|
|
|
|
|
|||||||||||||
| Liabilities and Partners’ Capital |
||||||||||||||||||||||||
| Debt |
$ | 3,715,079 | $ | 4,034,184 | $ | 73,915 | $ | 2,495,778 | $ | — | $ | 10,318,956 | ||||||||||||
| Other Liabilities |
1,254,211 | 1,591,727 | 1,837,583 | 701,986 | 51,266 | 5,436,773 | ||||||||||||||||||
|
|
|
|
|
|
|
|
|
|
|
|
|
|||||||||||||
| Total Liabilities |
4,969,290 | 5,625,911 | 1,911,498 | 3,197,764 | 51,266 | 15,755,729 | ||||||||||||||||||
|
|
|
|
|
|
|
|
|
|
|
|
|
|||||||||||||
| Partners’ Capital |
47,596,773 | 61,128,213 | 21,530,226 | 16,084,647 | 130,005 | 146,469,864 | ||||||||||||||||||
|
|
|
|
|
|
|
|
|
|
|
|
|
|||||||||||||
| Total Liabilities and Partners’ Capital |
$ | 52,566,063 | $ | 66,754,124 | $ | 23,441,724 | $ | 19,282,411 | $ | 181,271 | $ | 162,225,593 | ||||||||||||
|
|
|
|
|
|
|
|
|
|
|
|
|
|||||||||||||
| Statement of Operations |
||||||||||||||||||||||||
| Interest Income |
$ | 353,179 | $ | 445,166 | $ | 439 | $ | 849,508 | $ | — | $ | 1,648,292 | ||||||||||||
| Other Income |
10,620 | 1,499,503 | 35,264 | 32,628 | 104,669 | 1,682,684 | ||||||||||||||||||
| Interest Expense |
(82,370 | ) | (141,097 | ) | (1,410 | ) | (157,921 | ) | — | (382,798 | ) | |||||||||||||
| Other Expenses |
(473,790 | ) | (605,538 | ) | (150,964 | ) | (224,345 | ) | (56,407 | ) | (1,511,044 | ) | ||||||||||||
| Net Realized and Unrealized Gain from Investments |
4,870,332 | 5,368,361 | 226,368 | 1,186,038 | 515 | 11,651,614 | ||||||||||||||||||
|
|
|
|
|
|
|
|
|
|
|
|
|
|||||||||||||
| Net Income |
$ | 4,677,971 | $ | 6,566,395 | $ | 109,697 | $ | 1,685,908 | $ | 48,777 | $ | 13,088,748 | ||||||||||||
|
|
|
|
|
|
|
|
|
|
|
|
|
|||||||||||||
| (a) | Other represents the summarized financial information of equity method investments whose results, for segment reporting purposes, have been allocated across more than one of Blackstone’s segments. |
178
Table of Contents
THE BLACKSTONE GROUP L.P.
Notes to Consolidated Financial Statements—Continued
(All Dollars Are in Thousands, Except Unit and Per Unit Data, Except Where Noted)
The summarized financial information of the Partnership’s equity method investments for December 31, 2015 are as follows:
| December 31, 2015 and the Year Then Ended | ||||||||||||||||||||||||
| Private | Real | Hedge Fund | ||||||||||||||||||||||
| Equity | Estate | Solutions | Credit | Other (a) | Total | |||||||||||||||||||
| Statement of Financial Condition |
||||||||||||||||||||||||
| Assets |
||||||||||||||||||||||||
| Investments |
$ | 48,210,598 | $ | 61,971,919 | $ | 21,858,491 | $ | 16,136,543 | $ | 11,577 | $ | 148,189,128 | ||||||||||||
| Other Assets |
1,041,591 | 6,210,557 | 1,927,535 | 1,174,601 | 53,825 | 10,408,109 | ||||||||||||||||||
|
|
|
|
|
|
|
|
|
|
|
|
|
|||||||||||||
| Total Assets |
$ | 49,252,189 | $ | 68,182,476 | $ | 23,786,026 | $ | 17,311,144 | $ | 65,402 | $ | 158,597,237 | ||||||||||||
|
|
|
|
|
|
|
|
|
|
|
|
|
|||||||||||||
| Liabilities and Partners’ Capital |
||||||||||||||||||||||||
| Debt |
$ | 2,178,261 | $ | 5,562,806 | $ | 275,068 | $ | 2,086,670 | $ | — | $ | 10,102,805 | ||||||||||||
| Other Liabilities |
1,315,572 | 1,573,370 | 1,462,072 | 956,305 | 52,269 | 5,359,588 | ||||||||||||||||||
|
|
|
|
|
|
|
|
|
|
|
|
|
|||||||||||||
| Total Liabilities |
3,493,833 | 7,136,176 | 1,737,140 | 3,042,975 | 52,269 | 15,462,393 | ||||||||||||||||||
|
|
|
|
|
|
|
|
|
|
|
|
|
|||||||||||||
| Partners’ Capital |
45,758,356 | 61,046,300 | 22,048,886 | 14,268,169 | 13,133 | 143,134,844 | ||||||||||||||||||
|
|
|
|
|
|
|
|
|
|
|
|
|
|||||||||||||
| Total Liabilities and Partners’ Capital |
$ | 49,252,189 | $ | 68,182,476 | $ | 23,786,026 | $ | 17,311,144 | $ | 65,402 | $ | 158,597,237 | ||||||||||||
|
|
|
|
|
|
|
|
|
|
|
|
|
|||||||||||||
| Statement of Operations |
||||||||||||||||||||||||
| Interest Income |
$ | 384,174 | $ | 361,249 | $ | 170 | $ | 533,591 | $ | — | $ | 1,279,184 | ||||||||||||
| Other Income |
8,506 | 1,313,956 | 35,112 | 49,042 | 84,975 | 1,491,591 | ||||||||||||||||||
| Interest Expense |
(33,416 | ) | (91,985 | ) | (3,228 | ) | (61,971 | ) | — | (190,600 | ) | |||||||||||||
| Other Expenses |
(278,911 | ) | (355,617 | ) | (125,393 | ) | (167,385 | ) | (45,203 | ) | (972,509 | ) | ||||||||||||
| Net Realized and Unrealized Gain from Investments |
3,272,934 | 3,740,127 | 449,930 | (954,692 | ) | 17,778 | 6,526,077 | |||||||||||||||||
|
|
|
|
|
|
|
|
|
|
|
|
|
|||||||||||||
| Net Income |
$ | 3,353,287 | $ | 4,967,730 | $ | 356,591 | $ | (601,415 | ) | $ | 57,550 | $ | 8,133,743 | |||||||||||
|
|
|
|
|
|
|
|
|
|
|
|
|
|||||||||||||
| (a) | Other represents the summarized financial information of equity method investments whose results, for segment reporting purposes, have been allocated across more than one of Blackstone’s segments. |
179
Table of Contents
THE BLACKSTONE GROUP L.P.
Notes to Consolidated Financial Statements—Continued
(All Dollars Are in Thousands, Except Unit and Per Unit Data, Except Where Noted)
The summarized financial information of the Partnership’s equity method investments for December 31, 2014 are as follows:
| December 31, 2014 and the Year Then Ended | ||||||||||||||||||||||||
| Private | Real | Hedge Fund | ||||||||||||||||||||||
| Equity | Estate | Solutions | Credit | Other (a) | Total | |||||||||||||||||||
| Statement of Financial Condition |
||||||||||||||||||||||||
| Assets |
||||||||||||||||||||||||
| Investments |
$ | 43,005,350 | $ | 59,117,360 | $ | 15,947,483 | $ | 14,611,539 | $ | 19,594 | $ | 132,701,326 | ||||||||||||
| Other Assets |
667,131 | 3,213,450 | 1,411,406 | 1,751,967 | 53,551 | 7,097,505 | ||||||||||||||||||
|
|
|
|
|
|
|
|
|
|
|
|
|
|||||||||||||
| Total Assets |
$ | 43,672,481 | $ | 62,330,810 | $ | 17,358,889 | $ | 16,363,506 | $ | 73,145 | $ | 139,798,831 | ||||||||||||
|
|
|
|
|
|
|
|
|
|
|
|
|
|||||||||||||
| Liabilities and Partners’ Capital |
||||||||||||||||||||||||
| Debt |
$ | 836,667 | $ | 3,645,998 | $ | 20,550 | $ | 1,254,774 | $ | — | $ | 5,757,989 | ||||||||||||
| Other Liabilities |
100,362 | 617,101 | 919,013 | 827,469 | 24,937 | 2,488,892 | ||||||||||||||||||
|
|
|
|
|
|
|
|
|
|
|
|
|
|||||||||||||
| Total Liabilities |
937,029 | 4,263,099 | 939,563 | 2,082,243 | 24,937 | 8,246,871 | ||||||||||||||||||
|
|
|
|
|
|
|
|
|
|
|
|
|
|||||||||||||
| Partners’ Capital |
42,735,452 | 58,067,711 | 16,419,326 | 14,281,263 | 48,208 | 131,551,960 | ||||||||||||||||||
|
|
|
|
|
|
|
|
|
|
|
|
|
|||||||||||||
| Total Liabilities and Partners’ Capital |
$ | 43,672,481 | $ | 62,330,810 | $ | 17,358,889 | $ | 16,363,506 | $ | 73,145 | $ | 139,798,831 | ||||||||||||
|
|
|
|
|
|
|
|
|
|
|
|
|
|||||||||||||
| Statement of Operations |
||||||||||||||||||||||||
| Interest Income |
$ | 406,255 | $ | 260,683 | $ | 483 | $ | 567,008 | $ | 1 | $ | 1,234,430 | ||||||||||||
| Other Income |
21,305 | 1,030,685 | 125,441 | 52,207 | 118,835 | 1,348,473 | ||||||||||||||||||
| Interest Expense |
(61,855 | ) | (89,842 | ) | (271 | ) | (86,957 | ) | (153 | ) | (239,078 | ) | ||||||||||||
| Other Expenses |
(97,073 | ) | (249,095 | ) | (103,787 | ) | (177,968 | ) | (71,297 | ) | (699,220 | ) | ||||||||||||
| Net Realized and Unrealized Gain from Investments |
8,567,193 | 10,441,009 | 547,982 | 643,080 | 3,263 | 20,202,527 | ||||||||||||||||||
|
|
|
|
|
|
|
|
|
|
|
|
|
|||||||||||||
| Net Income |
$ | 8,835,825 | $ | 11,393,440 | $ | 569,848 | $ | 997,370 | $ | 50,649 | $ | 21,847,132 | ||||||||||||
|
|
|
|
|
|
|
|
|
|
|
|
|
|||||||||||||
| (a) | Other represents the summarized financial information of equity method investments whose results, for segment reporting purposes, have been allocated across more than one of Blackstone’s segments. |
Corporate Treasury Investments
The portion of corporate treasury investments included in Investments represents the Partnership’s investments into primarily fixed income securities, mutual fund interests, and other fund interests. These strategies are managed by a combination of Blackstone personnel and third party advisors. The following table presents the Realized and Net Change in Unrealized Gains (Losses) on these investments:
| Year Ended December 31, | ||||||||||||
| 2016 | 2015 | 2014 | ||||||||||
| Realized Gains (Losses) |
$ | (20,263 | ) | $ | (15,525 | ) | $ | 11,689 | ||||
| Net Change in Unrealized Gains (Losses) |
19,671 | (35,709 | ) | 2,002 | ||||||||
|
|
|
|
|
|
|
|||||||
| $ | (592 | ) | $ | (51,234 | ) | $ | 13,691 | |||||
|
|
|
|
|
|
|
|||||||
180
Table of Contents
THE BLACKSTONE GROUP L.P.
Notes to Consolidated Financial Statements—Continued
(All Dollars Are in Thousands, Except Unit and Per Unit Data, Except Where Noted)
Performance Fees
Performance Fees allocated to the general partner in respect of performance of certain carry funds, funds of hedge funds and credit-focused funds were as follows:
| Private Equity |
Real Estate |
Hedge Fund Solutions |
Credit | Total | ||||||||||||||||
| Performance Fees, December 31, 2015 |
$ | 1,479,443 | $ | 3,101,688 | $ | 9,747 | $ | 167,054 | $ | 4,757,932 | ||||||||||
| Performance Fees Allocated as a Result of Changes in Fund Fair Values |
671,240 | 1,115,487 | 12,206 | 248,969 | 2,047,902 | |||||||||||||||
| Foreign Exchange Loss |
— | (23,570 | ) | — | — | (23,570 | ) | |||||||||||||
| Fund Distributions |
(165,891 | ) | (1,223,157 | ) | (15,821 | ) | (56,401 | ) | (1,461,270 | ) | ||||||||||
|
|
|
|
|
|
|
|
|
|
|
|||||||||||
| Performance Fees, December 31, 2016 |
$ | 1,984,792 | $ | 2,970,448 | $ | 6,132 | $ | 359,622 | $ | 5,320,994 | ||||||||||
|
|
|
|
|
|
|
|
|
|
|
|||||||||||
Other Investments
Other Investments consist primarily of proprietary investment securities held by Blackstone. The following table presents Blackstone’s Realized and Net Change in Unrealized Gains (Losses) in other investments:
| Year Ended December 31, | ||||||||||||
| 2016 | 2015 | 2014 | ||||||||||
| Realized Gains |
$ | 2,495 | $ | 80 | $ | 5,082 | ||||||
| Net Change in Unrealized Gains (Losses) |
11,128 | (4,079 | ) | (6,309 | ) | |||||||
|
|
|
|
|
|
|
|||||||
| $ | 13,623 | $ | (3,999 | ) | $ | (1,227 | ) | |||||
|
|
|
|
|
|
|
|||||||
| 5. | NET ASSET VALUE AS FAIR VALUE |
A summary of fair value by strategy type alongside the remaining unfunded commitments and ability to redeem such investments as of December 31, 2016 is presented below:
| Strategy |
Fair Value | Unfunded Commitments |
Redemption Frequency (if currently eligible) |
Redemption Notice Period |
||||||||||||
| Diversified Instruments |
$ | 164,943 | $ | 129 | (a | ) | (a | ) | ||||||||
| Credit Driven |
203,837 | 268 | (b | ) | (b | ) | ||||||||||
| Equity |
59,268 | — | (c | ) | (c | ) | ||||||||||
| Commodities |
2,062 | — | (d | ) | (d | ) | ||||||||||
|
|
|
|
|
|||||||||||||
| $ | 430,110 | $ | 397 | |||||||||||||
|
|
|
|
|
|||||||||||||
| (a) | Diversified Instruments include investments in funds that invest across multiple strategies. Investments representing 4% of the fair value of the investments in this category may not be redeemed at, or within three months of, the reporting date. The remaining 96% of investments in this category are redeemable as of the reporting date. |
| (b) | The Credit Driven category includes investments in hedge funds that invest primarily in domestic and international bonds. Investments representing 44% of the fair value of the investments in this category may not be redeemed at, or within three months of, the reporting date. The remaining 56% of investments in this category are redeemable as of the reporting date. |
181
Table of Contents
THE BLACKSTONE GROUP L.P.
Notes to Consolidated Financial Statements—Continued
(All Dollars Are in Thousands, Except Unit and Per Unit Data, Except Where Noted)
| (c) | The Equity category includes investments in hedge funds that invest primarily in domestic and international equity securities. Investments representing 100% of the fair value of the investments in this category may not be redeemed at, or within three months of, the reporting date. |
| (d) | The Commodities category includes investments in commodities-focused funds that primarily invest in futures and physical-based commodity driven strategies. Investments representing 100% of the fair value of the investments in this category may not be redeemed at, or within three months of, the reporting date. |
| 6. | DERIVATIVE FINANCIAL INSTRUMENTS |
Blackstone and the Blackstone Funds enter into derivative contracts in the normal course of business to achieve certain risk management objectives and for general investment purposes. Blackstone may enter into derivative contracts in order to hedge its interest rate risk exposure against the effects of interest rate changes. Additionally, Blackstone may also enter into derivative contracts in order to hedge its foreign currency risk exposure against the effects of a portion of its non-U.S. dollar denominated currency net investments. As a result of the use of derivative contracts, Blackstone and the consolidated Blackstone Funds are exposed to the risk that counterparties will fail to fulfill their contractual obligations. To mitigate such counterparty risk, Blackstone and the consolidated Blackstone Funds enter into contracts with certain major financial institutions, all of which have investment grade ratings. Counterparty credit risk is evaluated in determining the fair value of derivative instruments.
Net Investment Hedges
To manage the potential exposure from adverse changes in currency exchange rates arising from Blackstone’s net investment in foreign operations, during December 2014, Blackstone entered into several foreign currency forward contracts to hedge a portion of the net investment in Blackstone’s non-U.S. dollar denominated foreign operations.
Blackstone uses foreign currency forward contracts to hedge portions of Blackstone’s net investments in foreign operations. The gains and losses due to change in fair value attributable to changes in spot exchange rates on foreign currency derivatives designated as net investment hedges were recognized in Other Comprehensive Loss, Net of Tax — Currency Translation Adjustment. For the year ended December 31, 2016 the resulting gain was $2.2 million.
Freestanding Derivatives
Freestanding derivatives are instruments that Blackstone and certain of the consolidated Blackstone Funds have entered into as part of their overall risk management and investment strategies. These derivative contracts are not designated as hedging instruments for accounting purposes. Such contracts may include interest rate swaps, foreign exchange contracts, equity swaps, options, futures and other derivative contracts.
182
Table of Contents
THE BLACKSTONE GROUP L.P.
Notes to Consolidated Financial Statements—Continued
(All Dollars Are in Thousands, Except Unit and Per Unit Data, Except Where Noted)
The table below summarizes the aggregate notional amount and fair value of the derivative financial instruments. The notional amount represents the absolute value amount of all outstanding derivative contracts.
| December 31, 2016 | December 31, 2015 | |||||||||||||||||||||||||||||||
| Assets | Liabilities | Assets | Liabilities | |||||||||||||||||||||||||||||
| Notional | Fair Value |
Notional | Fair Value |
Notional | Fair Value |
Notional | Fair Value |
|||||||||||||||||||||||||
| Net Investment Hedges |
||||||||||||||||||||||||||||||||
| Foreign Currency Contracts |
$ | — | $ | — | $ | 51,267 | $ | 587 | $ | 53,627 | $ | 319 | $ | 138 | $ | 1 | ||||||||||||||||
|
|
|
|
|
|
|
|
|
|
|
|
|
|
|
|
|
|||||||||||||||||
| Freestanding Derivatives |
||||||||||||||||||||||||||||||||
| Blackstone |
||||||||||||||||||||||||||||||||
| Interest Rate Contracts |
2,651,583 | 2,356 | 546,211 | 2,355 | 1,681,533 | 2,212 | 1,054,465 | 4,288 | ||||||||||||||||||||||||
| Foreign Currency Contracts |
164,247 | 1,037 | 127,444 | 966 | 158,684 | 2,088 | 271,891 | 2,042 | ||||||||||||||||||||||||
| Credit Default Swaps |
— | — | 3,819 | 215 | — | — | 19,250 | 2,411 | ||||||||||||||||||||||||
| Investments of Consolidated |
||||||||||||||||||||||||||||||||
| Blackstone Funds |
||||||||||||||||||||||||||||||||
| Foreign Currency Contracts |
254,162 | 25,050 | 136,025 | 3,903 | 124,595 | 1,400 | 92,094 | 6,490 | ||||||||||||||||||||||||
| Credit Default Swaps |
— | — | 113,057 | 3,350 | — | — | 108,786 | 6,275 | ||||||||||||||||||||||||
|
|
|
|
|
|
|
|
|
|
|
|
|
|
|
|
|
|||||||||||||||||
| 3,069,992 | 28,443 | 926,556 | 10,789 | 1,964,812 | 5,700 | 1,546,486 | 21,506 | |||||||||||||||||||||||||
|
|
|
|
|
|
|
|
|
|
|
|
|
|
|
|
|
|||||||||||||||||
| Total |
$ | 3,069,992 | $ | 28,443 | $ | 977,823 | $ | 11,376 | $ | 2,018,439 | $ | 6,019 | $ | 1,546,624 | $ | 21,507 | ||||||||||||||||
|
|
|
|
|
|
|
|
|
|
|
|
|
|
|
|
|
|||||||||||||||||
The table below summarizes the impact to the Consolidated Statements of Operations from derivative financial instruments:
| Year Ended December 31, | ||||||||||||
| 2016 | 2015 | 2014 | ||||||||||
| Net Investment Hedges — Foreign Currency Contracts |
||||||||||||
| Hedge Ineffectiveness |
$ | (108 | ) | $ | 283 | $ | — | |||||
|
|
|
|
|
|
|
|||||||
| Freestanding Derivatives |
||||||||||||
| Realized Gains (Losses) |
||||||||||||
| Interest Rate Contracts |
$ | (1,600 | ) | $ | (8,716 | ) | $ | (1,012 | ) | |||
| Foreign Currency Contracts |
(5,079 | ) | 12,828 | 8,251 | ||||||||
| Credit Default Swaps |
(5,141 | ) | 2,336 | 1,363 | ||||||||
|
|
|
|
|
|
|
|||||||
| (11,820 | ) | 6,448 | 8,602 | |||||||||
|
|
|
|
|
|
|
|||||||
| Net Change in Unrealized Gains (Losses) |
||||||||||||
| Interest Rate Contracts |
1,253 | 3,933 | (7,757 | ) | ||||||||
| Foreign Currency Contracts |
25,839 | (7,930 | ) | (31,728 | ) | |||||||
| Credit Default Swaps |
(3,027 | ) | (7,518 | ) | 5,193 | |||||||
|
|
|
|
|
|
|
|||||||
| 24,065 | (11,515 | ) | (34,292 | ) | ||||||||
|
|
|
|
|
|
|
|||||||
| Total |
$ | 12,245 | $ | (5,067 | ) | $ | (25,690 | ) | ||||
|
|
|
|
|
|
|
|||||||
183
Table of Contents
THE BLACKSTONE GROUP L.P.
Notes to Consolidated Financial Statements—Continued
(All Dollars Are in Thousands, Except Unit and Per Unit Data, Except Where Noted)
Since the inception of the above mentioned fair value hedge designation, Blackstone recognized a $64.2 million increase in the fair value of the hedged borrowing. This basis adjustment is being accreted using the effective interest method through August 15, 2019, the remaining term of the hedged borrowing.
As of December 31, 2016, 2015 and 2014, the Partnership had not designated any derivatives as cash flow hedges.
| 7. | FAIR VALUE OPTION |
The following table summarizes the financial instruments for which the fair value option has been elected:
| December 31, | ||||||||
| 2016 | 2015 | |||||||
| Assets |
||||||||
| Loans and Receivables |
$ | 211,359 | $ | 261,994 | ||||
| Equity and Preferred Securities |
444,713 | 280,879 | ||||||
| Debt Securities |
— | 15,176 | ||||||
| Assets of Consolidated CLO Vehicles |
||||||||
| Corporate Loans |
4,762,071 | 3,087,563 | ||||||
| Corporate Bonds |
710,947 | 379,000 | ||||||
|
|
|
|
|
|||||
| $ | 6,129,090 | $ | 4,024,612 | |||||
|
|
|
|
|
|||||
| Liabilities |
||||||||
| Liabilities of Consolidated CLO Vehicles |
||||||||
| Senior Secured Notes |
$ | 5,125,804 | $ | 3,225,064 | ||||
| Subordinated Notes |
||||||||
| Loans Payable |
337,846 | 90,140 | ||||||
| Due to Affiliates |
7,748 | 8,231 | ||||||
|
|
|
|
|
|||||
| $ | 5,471,398 | $ | 3,323,435 | |||||
|
|
|
|
|
|||||
184
Table of Contents
THE BLACKSTONE GROUP L.P.
Notes to Consolidated Financial Statements—Continued
(All Dollars Are in Thousands, Except Unit and Per Unit Data, Except Where Noted)
The following table presents the Realized and Net Change in Unrealized Gains (Losses) on financial instruments on which the fair value option was elected:
| Year Ended December 31, | ||||||||||||||||||||||||
| 2016 | 2015 | 2014 | ||||||||||||||||||||||
| Realized Gains (Losses) |
Net Change in Unrealized Gains (Losses) |
Realized Gains (Losses) |
Net Change in Unrealized Gains (Losses) |
Realized Gains (Losses) |
Net Change in Unrealized Gains (Losses) |
|||||||||||||||||||
| Assets |
||||||||||||||||||||||||
| Loans and Receivables |
$ | (42 | ) | $ | 3,375 | $ | — | $ | (4,793 | ) | $ | (1,703 | ) | $ | (3,022 | ) | ||||||||
| Equity and Preferred Securities |
(476 | ) | 16,033 | (300 | ) | (17,269 | ) | (2,038 | ) | 6,885 | ||||||||||||||
| Debt Securities |
(2,404 | ) | 426 | — | (426 | ) | — | — | ||||||||||||||||
| Assets of Consolidated CLO Vehicles |
||||||||||||||||||||||||
| Corporate Loans |
(6,128 | ) | 66,601 | (1,895 | ) | (36,502 | ) | (77,041 | ) | (28,054 | ) | |||||||||||||
| Corporate Bonds |
4,793 | 18,859 | (551 | ) | 1,188 | (1,405 | ) | (7,931 | ) | |||||||||||||||
| Other |
264 | — | 4,431 | (3,589 | ) | 22,625 | 17,649 | |||||||||||||||||
|
|
|
|
|
|
|
|
|
|
|
|
|
|||||||||||||
| $ | (3,993 | ) | $ | 105,294 | $ | 1,685 | $ | (61,391 | ) | $ | (59,562 | ) | $ | (14,473 | ) | |||||||||
|
|
|
|
|
|
|
|
|
|
|
|
|
|||||||||||||
| Liabilities |
||||||||||||||||||||||||
| Liabilities of Consolidated CLO Vehicles |
||||||||||||||||||||||||
| Senior Secured Notes |
$ | — | $ | — | $ | — | $ | — | $ | (6,626 | ) | $ | (133,274 | ) | ||||||||||
| Subordinated Notes |
(2,400 | ) | (69,103 | ) | — | 57,119 | — | 108,611 | ||||||||||||||||
|
|
|
|
|
|
|
|
|
|
|
|
|
|||||||||||||
| $ | (2,400 | ) | $ | (69,103 | ) | $ | — | $ | 57,119 | $ | (6,626 | ) | $ | (24,663 | ) | |||||||||
|
|
|
|
|
|
|
|
|
|
|
|
|
|||||||||||||
The following table presents information for those financial instruments for which the fair value option was elected:
| December 31, 2016 | December 31, 2015 | |||||||||||||||||||||||
| For Financial Assets Past Due (a) |
For Financial Assets Past Due (a) |
|||||||||||||||||||||||
| Excess (Deficiency) of Fair Value Over Principal |
Fair Value |
Excess of Fair Value Over Principal |
(Deficiency) of Fair Value Over Principal |
Fair Value |
(Deficiency) of Fair Value Over Principal |
|||||||||||||||||||
| Loans and Receivables |
$ | (6,476 | ) | $ | — | $ | — | $ | (8,845 | ) | $ | — | $ | — | ||||||||||
| Debt Securities |
— | — | — | (426 | ) | — | — | |||||||||||||||||
| Assets of Consolidated CLO Vehicles |
||||||||||||||||||||||||
| Corporate Loans |
2,616 | — | — | (77,900 | ) | 1,088 | (5,620 | ) | ||||||||||||||||
| Corporate Bonds |
7,259 | — | — | (6,046 | ) | — | — | |||||||||||||||||
|
|
|
|
|
|
|
|
|
|
|
|
|
|||||||||||||
| $ | 3,399 | $ | — | $ | — | $ | (93,217 | ) | $ | 1,088 | $ | (5,620 | ) | |||||||||||
|
|
|
|
|
|
|
|
|
|
|
|
|
|||||||||||||
| (a) | Corporate Loans and Corporate Bonds within CLO assets are classified as past due if contractual payments are more than one day past due. |
As of December 31, 2016 and 2015, no Loans and Receivables for which the fair value option was elected were past due or in non-accrual status. As of December 31, 2016, no Corporate Bonds included within the Assets of Consolidated CLO Vehicles for which the fair value option was elected were past due or in non-accrual status.
185
Table of Contents
THE BLACKSTONE GROUP L.P.
Notes to Consolidated Financial Statements—Continued
(All Dollars Are in Thousands, Except Unit and Per Unit Data, Except Where Noted)
| 8. | FAIR VALUE MEASUREMENTS OF FINANCIAL INSTRUMENTS |
The following tables summarize the valuation of the Partnership’s financial assets and liabilities by the fair value hierarchy:
| December 31, 2016 | ||||||||||||||||||||
| Level I | Level II | Level III | NAV | Total | ||||||||||||||||
| Assets |
||||||||||||||||||||
| Cash and Cash Equivalents — Money Market Funds |
$ | 443,442 | $ | — | $ | — | $ | — | $ | 443,442 | ||||||||||
|
|
|
|
|
|
|
|
|
|
|
|||||||||||
| Investments |
||||||||||||||||||||
| Investments of Consolidated Blackstone Funds (a) |
||||||||||||||||||||
| Investment Funds |
— | — | — | 148,993 | 148,993 | |||||||||||||||
| Equity Securities |
76,381 | 70,544 | 93,657 | — | 240,582 | |||||||||||||||
| Partnership and LLC Interests |
— | 29,430 | 337,230 | — | 366,660 | |||||||||||||||
| Debt Instruments |
— | 219,049 | 7,322 | — | 226,371 | |||||||||||||||
| Freestanding Derivatives — Foreign Currency Contracts (a) |
— | 2,327 | — | — | 2,327 | |||||||||||||||
| Assets of Consolidated CLO Vehicles |
||||||||||||||||||||
| Corporate Loans |
— | 4,514,407 | 247,664 | — | 4,762,071 | |||||||||||||||
| Corporate Bonds |
— | 710,947 | — | — | 710,947 | |||||||||||||||
| Freestanding Derivatives — Foreign Currency Contracts |
— | 22,723 | — | — | 22,723 | |||||||||||||||
|
|
|
|
|
|
|
|
|
|
|
|||||||||||
| Total Investments of Consolidated Blackstone Funds |
76,381 | 5,569,427 | 685,873 | 148,993 | 6,480,674 | |||||||||||||||
|
|
|
|
|
|
|
|
|
|
|
|||||||||||
| Corporate Treasury Investments |
||||||||||||||||||||
| Equity Securities |
281,505 | — | — | — | 281,505 | |||||||||||||||
| Debt Instruments |
— | 1,944,171 | 30,424 | 54,907 | 2,029,502 | |||||||||||||||
| Other |
— | — | — | 207,431 | 207,431 | |||||||||||||||
|
|
|
|
|
|
|
|
|
|
|
|||||||||||
| Total Corporate Treasury |
||||||||||||||||||||
| Investments |
281,505 | 1,944,171 | 30,424 | 262,338 | 2,518,438 | |||||||||||||||
|
|
|
|
|
|
|
|
|
|
|
|||||||||||
| Other Investments |
163,548 | — | 100,164 | 18,779 | 282,491 | |||||||||||||||
|
|
|
|
|
|
|
|
|
|
|
|||||||||||
| Total Investments |
521,434 | 7,513,598 | 816,461 | 430,110 | 9,281,603 | |||||||||||||||
|
|
|
|
|
|
|
|
|
|
|
|||||||||||
| Accounts Receivable — Loans and Receivables |
— | — | 211,359 | — | 211,359 | |||||||||||||||
|
|
|
|
|
|
|
|
|
|
|
|||||||||||
| Other Assets |
||||||||||||||||||||
| Freestanding Derivatives |
||||||||||||||||||||
| Interest Rate Contracts |
1,883 | 473 | — | — | 2,356 | |||||||||||||||
| Foreign Currency Contracts |
— | 1,037 | — | — | 1,037 | |||||||||||||||
|
|
|
|
|
|
|
|
|
|
|
|||||||||||
| Total Freestanding Derivatives |
1,883 | 1,510 | — | — | 3,393 | |||||||||||||||
|
|
|
|
|
|
|
|
|
|
|
|||||||||||
| Total Other Assets |
1,883 | 1,510 | — | — | 3,393 | |||||||||||||||
|
|
|
|
|
|
|
|
|
|
|
|||||||||||
| $ | 966,759 | $ | 7,515,108 | $ | 1,027,820 | $ | 430,110 | $ | 9,939,797 | |||||||||||
|
|
|
|
|
|
|
|
|
|
|
|||||||||||
186
Table of Contents
THE BLACKSTONE GROUP L.P.
Notes to Consolidated Financial Statements—Continued
(All Dollars Are in Thousands, Except Unit and Per Unit Data, Except Where Noted)
| December 31, 2016 | ||||||||||||||||
| Level I | Level II | Level III | Total | |||||||||||||
| Liabilities |
||||||||||||||||
| Loans Payable — Liabilities of Consolidated CLO Vehicles (a) |
||||||||||||||||
| Senior Secured Notes (b) |
$ | — | $ | 5,125,804 | $ | — | $ | 5,125,804 | ||||||||
| Subordinated Notes (b) |
— | 337,846 | — | 337,846 | ||||||||||||
|
|
|
|
|
|
|
|
|
|||||||||
| Total Loans Payable |
— | 5,463,650 | — | 5,463,650 | ||||||||||||
|
|
|
|
|
|
|
|
|
|||||||||
| Due to Affiliates — Liabilities of Consolidated CLO Vehicles (a) |
||||||||||||||||
| Subordinated Notes (b) |
— | 7,748 | — | 7,748 | ||||||||||||
|
|
|
|
|
|
|
|
|
|||||||||
| Total Due to Affiliates |
— | 7,748 | — | 7,748 | ||||||||||||
|
|
|
|
|
|
|
|
|
|||||||||
| Securities Sold, Not Yet Purchased |
— | 215,398 | — | 215,398 | ||||||||||||
|
|
|
|
|
|
|
|
|
|||||||||
| Accounts Payable, Accrued Expenses and Other Liabilities of Consolidated Blackstone Funds |
||||||||||||||||
| Freestanding Derivatives (a) |
||||||||||||||||
| Foreign Currency Contracts |
— | 3,903 | — | 3,903 | ||||||||||||
| Credit Default Swaps |
— | 3,350 | — | 3,350 | ||||||||||||
|
|
|
|
|
|
|
|
|
|||||||||
| Total Liabilities of Consolidated Blackstone Funds |
— | 7,253 | — | 7,253 | ||||||||||||
|
|
|
|
|
|
|
|
|
|||||||||
| Freestanding Derivatives |
||||||||||||||||
| Interest Rate Contracts |
750 | 1,605 | — | 2,355 | ||||||||||||
| Foreign Currency Contracts |
— | 966 | — | 966 | ||||||||||||
| Credit Default Swaps |
— | 215 | — | 215 | ||||||||||||
|
|
|
|
|
|
|
|
|
|||||||||
| Total Freestanding Derivatives |
750 | 2,786 | — | 3,536 | ||||||||||||
|
|
|
|
|
|
|
|
|
|||||||||
| Net Investment Hedges — Foreign Currency Contracts |
— | 587 | — | 587 | ||||||||||||
|
|
|
|
|
|
|
|
|
|||||||||
| Total Accounts Payable, Accrued Expenses and Other Liabilities |
750 | 10,626 | — | 11,376 | ||||||||||||
|
|
|
|
|
|
|
|
|
|||||||||
| $ | 750 | $ | 5,697,422 | $ | — | $ | 5,698,172 | |||||||||
|
|
|
|
|
|
|
|
|
|||||||||
187
Table of Contents
THE BLACKSTONE GROUP L.P.
Notes to Consolidated Financial Statements—Continued
(All Dollars Are in Thousands, Except Unit and Per Unit Data, Except Where Noted)
| December 31, 2015 | ||||||||||||||||||||
| Level I | Level II | Level III | NAV | Total | ||||||||||||||||
| Assets |
||||||||||||||||||||
| Cash and Cash Equivalents — Money Market Funds |
$ | 460,233 | $ | — | $ | — | $ | — | $ | 460,233 | ||||||||||
|
|
|
|
|
|
|
|
|
|
|
|||||||||||
| Investments |
||||||||||||||||||||
| Investments of Consolidated Blackstone Funds (a) |
||||||||||||||||||||
| Investment Funds |
— | — | — | 155,512 | 155,512 | |||||||||||||||
| Equity Securities |
82,734 | 53,250 | 80,849 | — | 216,833 | |||||||||||||||
| Partnership and LLC Interests |
— | 101,399 | 472,391 | — | 573,790 | |||||||||||||||
| Debt Instruments |
— | 179,465 | 20,381 | — | 199,846 | |||||||||||||||
| Assets of Consolidated CLO Vehicles |
||||||||||||||||||||
| Corporate Loans |
— | 2,886,792 | 200,771 | — | 3,087,563 | |||||||||||||||
| Corporate Bonds |
— | 379,000 | — | — | 379,000 | |||||||||||||||
| Freestanding Derivatives — Foreign Currency Contracts |
— | 1,400 | — | — | 1,400 | |||||||||||||||
|
|
|
|
|
|
|
|
|
|
|
|||||||||||
| Total Investments of Consolidated Blackstone Funds |
82,734 | 3,601,306 | 774,392 | 155,512 | 4,613,944 | |||||||||||||||
|
|
|
|
|
|
|
|
|
|
|
|||||||||||
| Corporate Treasury Investments |
||||||||||||||||||||
| Equity Securities |
240,464 | — | — | — | 240,464 | |||||||||||||||
| Debt Instruments |
— | 1,069,915 | 54,657 | 115,657 | 1,240,229 | |||||||||||||||
| Other |
— | — | — | 201,566 | 201,566 | |||||||||||||||
|
|
|
|
|
|
|
|
|
|
|
|||||||||||
| Total Corporate Treasury Investments |
240,464 | 1,069,915 | 54,657 | 317,223 | 1,682,259 | |||||||||||||||
|
|
|
|
|
|
|
|
|
|
|
|||||||||||
| Other Investments |
40,261 | — | 101,184 | 17,707 | 159,152 | |||||||||||||||
|
|
|
|
|
|
|
|
|
|
|
|||||||||||
| Total Investments |
363,459 | 4,671,221 | 930,233 | 490,442 | 6,455,355 | |||||||||||||||
|
|
|
|
|
|
|
|
|
|
|
|||||||||||
| Accounts Receivable — Loans and Receivables |
— | — | 261,994 | — | 261,994 | |||||||||||||||
|
|
|
|
|
|
|
|
|
|
|
|||||||||||
| Other Assets |
||||||||||||||||||||
| Freestanding Derivatives |
||||||||||||||||||||
| Interest Rate Contracts |
1,806 | 406 | — | — | 2,212 | |||||||||||||||
| Foreign Currency Contracts |
— | 2,088 | — | — | 2,088 | |||||||||||||||
|
|
|
|
|
|
|
|
|
|
|
|||||||||||
| Total Freestanding Derivatives |
1,806 | 2,494 | — | — | 4,300 | |||||||||||||||
| Net Investment Hedges — Foreign Currency Contracts |
— | 319 | — | — | 319 | |||||||||||||||
|
|
|
|
|
|
|
|
|
|
|
|||||||||||
| Total Other Assets |
1,806 | 2,813 | — | — | 4,619 | |||||||||||||||
|
|
|
|
|
|
|
|
|
|
|
|||||||||||
| $ | 825,498 | $ | 4,674,034 | $ | 1,192,227 | $ | 490,442 | $ | 7,182,201 | |||||||||||
|
|
|
|
|
|
|
|
|
|
|
|||||||||||
188
Table of Contents
THE BLACKSTONE GROUP L.P.
Notes to Consolidated Financial Statements—Continued
(All Dollars Are in Thousands, Except Unit and Per Unit Data, Except Where Noted)
| December 31, 2015 | ||||||||||||||||
| Level I | Level II | Level III | Total | |||||||||||||
| Liabilities |
||||||||||||||||
| Loans Payable — Liabilities of Consolidated CLO Vehicles (a) |
||||||||||||||||
| Senior Secured Notes (b) |
$ | — | $ | 3,225,064 | $ | — | $ | 3,225,064 | ||||||||
| Subordinated Notes (b) |
— | 90,140 | — | 90,140 | ||||||||||||
|
|
|
|
|
|
|
|
|
|||||||||
| Total Loans Payable |
— | 3,315,204 | — | 3,315,204 | ||||||||||||
|
|
|
|
|
|
|
|
|
|||||||||
| Due to Affiliates — Liabilities of Consolidated CLO Vehicles (a) |
||||||||||||||||
| Subordinated Notes (b) |
— | 8,231 | — | 8,231 | ||||||||||||
|
|
|
|
|
|
|
|
|
|||||||||
| Total Due to Affiliates |
— | 8,231 | — | 8,231 | ||||||||||||
|
|
|
|
|
|
|
|
|
|||||||||
| Securities Sold, Not Yet Purchased |
— | 176,667 | — | 176,667 | ||||||||||||
|
|
|
|
|
|
|
|
|
|||||||||
| Accounts Payable, Accrued Expenses and Other Liabilities |
||||||||||||||||
| Liabilities of Consolidated Blackstone Funds |
||||||||||||||||
| Freestanding Derivatives (a) |
||||||||||||||||
| Foreign Currency Contracts |
— | 6,490 | — | 6,490 | ||||||||||||
| Credit Default Swaps |
— | 6,275 | — | 6,275 | ||||||||||||
|
|
|
|
|
|
|
|
|
|||||||||
| Total Liabilities of Consolidated Blackstone Funds |
— | 12,765 | — | 12,765 | ||||||||||||
|
|
|
|
|
|
|
|
|
|||||||||
| Freestanding Derivatives |
||||||||||||||||
| Interest Rate Contracts |
835 | 3,453 | — | 4,288 | ||||||||||||
| Foreign Currency Contracts |
— | 2,042 | — | 2,042 | ||||||||||||
| Credit Default Swaps |
— | 2,411 | — | 2,411 | ||||||||||||
|
|
|
|
|
|
|
|
|
|||||||||
| Total Freestanding Derivatives |
835 | 7,906 | — | 8,741 | ||||||||||||
|
|
|
|
|
|
|
|
|
|||||||||
| Net Investment Hedges — Foreign Currency Contracts |
— | 1 | — | 1 | ||||||||||||
|
|
|
|
|
|
|
|
|
|||||||||
| Total Accounts Payable, Accrued Expenses and Other Liabilities |
835 | 20,672 | — | 21,507 | ||||||||||||
|
|
|
|
|
|
|
|
|
|||||||||
| $ | 835 | $ | 3,520,774 | $ | — | $ | 3,521,609 | |||||||||
|
|
|
|
|
|
|
|
|
|||||||||
| (a) | Pursuant to GAAP consolidation guidance, the Partnership is required to consolidate all VIEs in which it has been identified as the primary beneficiary, including certain CLO vehicles, and other funds in which a consolidated entity of the Partnership, as the general partner of the fund, has a controlling financial interest. While the Partnership is required to consolidate certain funds, including CLO vehicles, for GAAP purposes, the Partnership has no ability to utilize the assets of these funds and there is no recourse to the Partnership for their liabilities since these are client assets and liabilities. |
| (b) | Senior and subordinate notes issued by CLO vehicles are classified based on the more observable fair value of CLO assets less (a) the fair value of any beneficial interests held by Blackstone, and (b) the carrying value of any beneficial interests that represent compensation for services. |
189
Table of Contents
THE BLACKSTONE GROUP L.P.
Notes to Consolidated Financial Statements—Continued
(All Dollars Are in Thousands, Except Unit and Per Unit Data, Except Where Noted)
The following table summarizes the fair value transfers between Level I and Level II for positions that existed as of December 31, 2016 and 2015, respectively:
| Year Ended December 31, | ||||||||
| 2016 | 2015 | |||||||
| Transfers from Level I into Level II (a) |
$ | 2,114 | $ | — | ||||
| Transfers from Level II into Level I (b) |
$ | 39,974 | $ | 32,025 | ||||
| (a) | Transfers out of Level I represent those financial instruments for which restrictions exist and adjustments were made to an otherwise observable price to reflect fair value at the reporting date. |
| (b) | Transfers into Level I represent those financial instruments for which an unadjusted quoted price in an active market became available for the identical asset. |
190
Table of Contents
THE BLACKSTONE GROUP L.P.
Notes to Consolidated Financial Statements—Continued
(All Dollars Are in Thousands, Except Unit and Per Unit Data, Except Where Noted)
The following table summarizes the quantitative inputs and assumptions used for items categorized in Level III of the fair value hierarchy as of December 31, 2016:
| Fair Value | Valuation Techniques |
Unobservable Inputs |
Ranges | Weighted Average (a) |
||||||||||||||||
| Financial Assets |
||||||||||||||||||||
| Investments of Consolidated Blackstone Funds |
||||||||||||||||||||
| Equity Securities |
$ | 58,826 | Discounted Cash Flows | Discount Rate | 7.3% - 28.7% | 12.7% | ||||||||||||||
| Revenue CAGR | -0.2% - 20.1% | 6.3% | ||||||||||||||||||
| Exit Capitalization Rate | 5.0% - 11.4% | 8.5% | ||||||||||||||||||
| Exit Multiple - EBITDA | 4.0x - 20.0x | 10.0x | ||||||||||||||||||
| Exit Multiple - P/E | 10.5x - 17.0x | 11.0x | ||||||||||||||||||
| 2,032 | Market Comparable Companies | Book Value Multiple | 0.9x | N/A | ||||||||||||||||
| 22,843 | Other | N/A | N/A | N/A | ||||||||||||||||
| 9,956 | Transaction Price | N/A | N/A | N/A | ||||||||||||||||
| Partnership and LLC Interests |
303,281 | Discounted Cash Flows | Discount Rate | 3.4% - 27.6% | 9.4% | |||||||||||||||
| Revenue CAGR | -27.1% - 47.3% | 7.2% | ||||||||||||||||||
| Exit Capitalization Rate | 3.0% - 11.0% | 6.0% | ||||||||||||||||||
| Exit Multiple - EBITDA | 3.9x - 18.3x | 10.5x | ||||||||||||||||||
| Exit Multiple - P/E | 9.3x | N/A | ||||||||||||||||||
| 13,945 | Market Comparable Companies | Capitalization Rate | 5.0% - 5.6% | 5.2% | ||||||||||||||||
| 12,916 | Other | N/A | N/A | N/A | ||||||||||||||||
| 1,238 | Third Party Pricing | N/A | N/A | N/A | ||||||||||||||||
| 5,850 | Transaction Price | N/A | N/A | N/A | ||||||||||||||||
| Debt Instruments |
2,227 | Third Party Pricing | N/A | N/A | N/A | |||||||||||||||
| 5,002 | Discounted Cash Flows | Discount Rate | 8.3% - 20.0% | 12.9% | ||||||||||||||||
| Revenue CAGR | 4.8% - 70.8% | 33.8% | ||||||||||||||||||
| Exit Capitalization Rate | 4.7% - 8.3% | 7.5% | ||||||||||||||||||
| Exit Multiple - EBITDA | 9.6x - 12.0x | 11.0x | ||||||||||||||||||
| 93 | Transaction Price | N/A | N/A | N/A | ||||||||||||||||
| Assets of Consolidated CLO Vehicles |
13,723 | Market Comparable Companies | EBITDA Multiple | 9.6x | N/A | |||||||||||||||
| 233,941 | Third Party Pricing | N/A | N/A | N/A | ||||||||||||||||
|
|
|
|||||||||||||||||||
| Total Investments of Consolidated Blackstone Funds |
685,873 | |||||||||||||||||||
continued …
191
Table of Contents
THE BLACKSTONE GROUP L.P.
Notes to Consolidated Financial Statements—Continued
(All Dollars Are in Thousands, Except Unit and Per Unit Data, Except Where Noted)
| Fair Value | Valuation Techniques |
Unobservable Inputs |
Ranges | Weighted | ||||||||||
| Corporate Treasury Investments |
$ | 9,783 | Discounted Cash Flows | Discount Rate |
6.1% - 10.0% | 7.1% | ||||||||
| Default Rate | 1.0% - 2.0% | 1.8% | ||||||||||||
| Pre-payment Rate | 20.0% | N/A | ||||||||||||
| Recovery Lag | 12 Months | N/A | ||||||||||||
| Recovery Rate | 18.5% - 76.5% | 66.4% | ||||||||||||
| Reinvestment Rate | LIBOR + 350 bps - LIBOR + 400 bps |
LIBOR + 390 bps | ||||||||||||
| 20,641 | Third Party Pricing | N/A | N/A | N/A | ||||||||||
| Loans and Receivables |
211,359 | Discounted Cash Flows | Discount Rate | 12.0% - 16.4% | 13.3% | |||||||||
| Other Investments |
78,619 | Discounted Cash Flows | Discount Rate | 1.2% - 15.0% | 3.1% | |||||||||
| Default Rate | 2.0% | N/A | ||||||||||||
| Pre-payment Rate | 20.0% | N/A | ||||||||||||
| Recovery Lag | 12 Months | N/A | ||||||||||||
| Recovery Rate | 70.0% | N/A | ||||||||||||
| Reinvestment Rate | LIBOR + 400 bps | N/A | ||||||||||||
| 21,545 | Transaction Price | N/A | N/A | N/A | ||||||||||
|
|
|
|||||||||||||
| Total |
$ | 1,027,820 | ||||||||||||
|
|
|
|||||||||||||
192
Table of Contents
THE BLACKSTONE GROUP L.P.
Notes to Consolidated Financial Statements—Continued
(All Dollars Are in Thousands, Except Unit and Per Unit Data, Except Where Noted)
The following table summarizes the quantitative inputs and assumptions used for items categorized in Level III of the fair value hierarchy as of December 31, 2015:
| Fair Value | Valuation Techniques |
Unobservable Inputs |
Ranges |
Weighted Average (a) | ||||||||||||
| Financial Assets |
||||||||||||||||
| Investments of Consolidated Blackstone Funds |
||||||||||||||||
| Equity Securities |
$ | 66,962 | Discounted Cash Flows | Discount Rate | 7.8% - 25.0% | 13.6% | ||||||||||
| Revenue CAGR | -5.0% - 61.5% | 10.2% | ||||||||||||||
| Exit Capitalization Rate | 5.5% - 11.4% | 9.0% | ||||||||||||||
| Exit Multiple - EBITDA | 5.0x - 18.2x | 9.6x | ||||||||||||||
| Exit Multiple - P/E | 10.5x - 17.0x | 11.2x | ||||||||||||||
| 1,710 | Market Comparable Companies | EBITDA Multiple | 6.5x - 8.0x | 6.6x | ||||||||||||
| Book Value Multiple | 0.9x | N/A | ||||||||||||||
| 5,426 | Other | N/A | N/A | N/A | ||||||||||||
| 29 | Third Party Pricing | N/A | N/A | N/A | ||||||||||||
| 6,722 | Transaction Price | N/A | N/A | N/A | ||||||||||||
| Partnership and LLC Interests |
423,588 | Discounted Cash Flows | Discount Rate | 2.1% - 25.8% | 9.3% | |||||||||||
| Revenue CAGR | -24.1% - 31.8% | 8.6% | ||||||||||||||
| Exit Capitalization Rate | 2.7% - 12.1% | 6.3% | ||||||||||||||
| Exit Multiple - EBITDA | 0.1x - 23.8x | 9.8x | ||||||||||||||
| Exit Multiple - P/E | 9.3x | N/A | ||||||||||||||
| 1,403 | Other | N/A | N/A | N/A | ||||||||||||
| 16,963 | Third Party Pricing | N/A | N/A | N/A | ||||||||||||
| 30,437 | Transaction Price | N/A | N/A | N/A | ||||||||||||
| Debt Instruments |
4,086 | Discounted Cash Flows | Discount Rate | 6.5% - 52.7% | 14.1% | |||||||||||
| Revenue CAGR | 16.8% | N/A | ||||||||||||||
| Exit Capitalization Rate | 1.0% - 8.3% | 5.8% | ||||||||||||||
| Exit Multiple - EBITDA | 12.0x | N/A | ||||||||||||||
| 16,217 | Third Party Pricing | N/A | N/A | N/A | ||||||||||||
| 78 | Transaction Price | N/A | N/A | N/A | ||||||||||||
| Assets of Consolidated CLO Vehicles |
19,783 | Market Comparable Companies | EBITDA Multiple | 4.5x - 7.0x | 6.5x | |||||||||||
| 180,988 | Third Party Pricing | N/A | N/A | N/A | ||||||||||||
|
|
|
|||||||||||||||
| Total Investments of Consolidated Blackstone Funds |
774,392 | |||||||||||||||
continued …
193
Table of Contents
THE BLACKSTONE GROUP L.P.
Notes to Consolidated Financial Statements—Continued
(All Dollars Are in Thousands, Except Unit and Per Unit Data, Except Where Noted)
| Fair Value | Valuation Techniques |
Unobservable Inputs |
Ranges |
Weighted Average (a) | ||||||||
| Corporate Treasury Investments |
$ | 32,004 | Discounted Cash Flows | Default Rate | 1.0% - 2.0% | 1.9% | ||||||
| Discount Rate | 5.8% - 14.0% | 8.6% | ||||||||||
| Pre-payment Rate | 20.0% | N/A | ||||||||||
| Recovery Lag | 12 months | N/A | ||||||||||
| Recovery Rate | 30.0% - 70.0% | 67.0% | ||||||||||
| Reinvestment Rate | LIBOR + 400 bps | N/A | ||||||||||
| 22,653 | Third Party Pricing | N/A | N/A | N/A | ||||||||
| Loans and Receivables |
241,897 | Discounted Cash Flows | Discount Rate | 6.7% - 20.6% | 11.0% | |||||||
| 20,097 | Third Party Pricing | N/A | N/A | N/A | ||||||||
| Other Investments |
81,984 | Discounted Cash Flows | Default Rate | 2.0% | N/A | |||||||
| Discount Rate | 1.4% - 12.5% | 3.3% | ||||||||||
| Pre-payment Rate | 20.0% | N/A | ||||||||||
| Recovery Lag | 12 months | N/A | ||||||||||
| Recovery Rate | 70.0% | N/A | ||||||||||
| Reinvestment Rate | LIBOR + 400 bps | N/A | ||||||||||
| 19,200 | Transaction Price | N/A | N/A | N/A | ||||||||
|
|
|
|||||||||||
| Total |
$ | 1,192,227 | ||||||||||
|
|
|
|||||||||||
| N/A | Not applicable. | |
| CAGR | Compound annual growth rate. | |
| EBITDA | Earnings before interest, taxes, depreciation and amortization. | |
| Exit Multiple | Ranges include the last twelve months EBITDA, forward EBITDA and price/earnings exit multiples. | |
| Third Party Pricing | Third Party Pricing is generally determined on the basis of unadjusted prices between market participants provided by reputable dealers or pricing services. | |
| Transaction Price | Includes recent acquisitions or transactions. | |
| (a) | Unobservable inputs were weighted based on the fair value of the investments included in the range. |
The significant unobservable inputs used in the fair value measurement of corporate treasury investments, debt instruments and other investments are discount rates, default rates, recovery rates, recovery lag, pre-payment rates and reinvestment rates. Increases (decreases) in any of the discount rates, default rates, recovery lag and pre-payment rates in isolation would result in a lower (higher) fair value measurement. Increases (decreases) in any of the recovery rates and reinvestment rates in isolation would result in a higher (lower) fair value measurement. Generally, a change in the assumption used for default rates may be accompanied by a directionally similar change in the assumption used for recovery lag and a directionally opposite change in the assumption used for recovery rates and pre-payment rates.
The significant unobservable inputs used in the fair value measurement of equity securities, partnership and LLC interests, debt instruments, assets of consolidated CLO vehicles and loans and receivables are discount rates, exit capitalization rates, exit multiples, EBITDA multiples and revenue compound annual growth rates. Increases (decreases) in any of discount rates and exit capitalization rates in isolation can result in a lower (higher) fair value measurement. Increases (decreases) in any of exit multiples and revenue compound annual growth rates in isolation can result in a higher (lower) fair value measurement.
Since December 31, 2015, there have been no changes in valuation techniques within Level II and Level III that have had a material impact on the valuation of financial instruments.
194
Table of Contents
THE BLACKSTONE GROUP L.P.
Notes to Consolidated Financial Statements—Continued
(All Dollars Are in Thousands, Except Unit and Per Unit Data, Except Where Noted)
The following tables summarize the changes in financial assets and liabilities measured at fair value for which the Partnership has used Level III inputs to determine fair value and does not include gains or losses that were reported in Level III in prior years or for instruments that were transferred out of Level III prior to the end of the respective reporting period. Total realized and unrealized gains and losses recorded for Level III investments are reported in either Investment Income (Loss) or Net Gains (Losses) from Fund Investment Activities in the Consolidated Statements of Operations.
| Level III Financial Assets at Fair Value Year Ended December 31, |
||||||||||||||||||||||||||||||||
| 2016 | 2015 | |||||||||||||||||||||||||||||||
| Investments of Consolidated Funds |
Loans and Receivables |
Other Investments (a) |
Total | Investments of Consolidated Funds |
Loans and Receivables |
Other Investments (a) |
Total | |||||||||||||||||||||||||
| Balance, Beginning of Period |
$ | 774,392 | $ | 261,994 | $ | 155,841 | $ | 1,192,227 | $ | 2,394,823 | $ | 40,397 | $ | 189,385 | $ | 2,624,605 | ||||||||||||||||
| Transfer Out Due to Deconsolidation |
— | — | — | — | (1,460,538 | ) | — | — | (1,460,538 | ) | ||||||||||||||||||||||
| Transfer In to Level III (b) |
84,472 | — | 19,691 | 104,163 | 47,097 | — | 31,479 | 78,576 | ||||||||||||||||||||||||
| Transfer Out of Level III (b) |
(97,841 | ) | — | (33,162 | ) | (131,003 | ) | (195,422 | ) | — | (58,158 | ) | (253,580 | ) | ||||||||||||||||||
| Purchases |
373,522 | 546,060 | 24,158 | 943,740 | 328,237 | 233,693 | 47,978 | 609,908 | ||||||||||||||||||||||||
| Sales |
(485,254 | ) | (598,232 | ) | (31,251 | ) | (1,114,737 | ) | (383,302 | ) | (9,535 | ) | (40,000 | ) | (432,837 | ) | ||||||||||||||||
| Settlements |
— | (8,599 | ) | (512 | ) | (9,111 | ) | — | (4,435 | ) | (465 | ) | (4,900 | ) | ||||||||||||||||||
| Changes in Gains (Losses) Included in Earnings and Other Comprehensive Income (Loss) |
36,582 | 10,136 | (4,177 | ) | 42,541 | 43,497 | 1,874 | (14,378 | ) | 30,993 | ||||||||||||||||||||||
|
|
|
|
|
|
|
|
|
|
|
|
|
|
|
|
|
|||||||||||||||||
| Balance, End of Period |
$ | 685,873 | $ | 211,359 | $ | 130,588 | $ | 1,027,820 | $ | 774,392 | $ | 261,994 | $ | 155,841 | $ | 1,192,227 | ||||||||||||||||
|
|
|
|
|
|
|
|
|
|
|
|
|
|
|
|
|
|||||||||||||||||
| Changes in Unrealized Gains (Losses) Included in Earnings Related to Investments Still Held at the Reporting Date |
$ | (36,074 | ) | $ | 10,178 | $ | 3,443 | $ | (22,453 | ) | $ | (5,333 | ) | $ | 1,745 | $ | (3,624 | ) | $ | (7,212 | ) | |||||||||||
|
|
|
|
|
|
|
|
|
|
|
|
|
|
|
|
|
|||||||||||||||||
| Level III Financial Liabilities at Fair Value Year Ended December 31, |
||||||||||||||||||||||||
| 2016 (c) | 2015 (c) | |||||||||||||||||||||||
| Collateralized Loan Obligations Senior Notes |
Collateralized Loan Obligations Subordinated Notes |
Total | Collateralized Loan Obligations Senior Notes |
Collateralized Loan Obligations Subordinated Notes |
Total | |||||||||||||||||||
| Balance, Beginning of Period |
$ | — | $ | — | $ | — | $ | 6,448,352 | $ | 348,752 | $ | 6,797,104 | ||||||||||||
| Transfer Out Due to Deconsolidation |
— | — | — | (4,168,405 | ) | (261,934 | ) | (4,430,339 | ) | |||||||||||||||
| Transfer Out Due to Amended CLO Guidance (d) |
— | — | — | (2,279,947 | ) | (86,818 | ) | (2,366,765 | ) | |||||||||||||||
|
|
|
|
|
|
|
|
|
|
|
|
|
|||||||||||||
| Balance, End of Period |
$ | — | $ | — | $ | — | $ | — | $ | — | $ | — | ||||||||||||
|
|
|
|
|
|
|
|
|
|
|
|
|
|||||||||||||
195
Table of Contents
THE BLACKSTONE GROUP L.P.
Notes to Consolidated Financial Statements—Continued
(All Dollars Are in Thousands, Except Unit and Per Unit Data, Except Where Noted)
| (a) | Represents corporate treasury investments and Other Investments. |
| (b) | Transfers in and out of Level III financial assets and liabilities were due to changes in the observability of inputs used in the valuation of such assets and liabilities. |
| (c) | There were no Level III financial liabilities as of and for the year ended December 31, 2016. There were no changes in unrealized (gains) losses included in earnings related to liabilities still held at either December 31, 2016 or 2015. |
| (d) | Transfers out due to amended CLO measurement guidance represents the transfer out of Level III for liabilities of consolidated CLO vehicles for which fair value is based on the more observable fair value of CLO assets. Such liabilities are classified as Level II within the fair value hierarchy. |
| 9. | VARIABLE INTEREST ENTITIES |
Pursuant to GAAP consolidation guidance, the Partnership consolidates certain VIEs in which it is determined that the Partnership is the primary beneficiary either directly or indirectly, through a consolidated entity or affiliate. VIEs include certain private equity, real estate, credit-focused or funds of hedge funds entities and CLO vehicles. The purpose of such VIEs is to provide strategy specific investment opportunities for investors in exchange for management and performance based fees. The investment strategies of the Blackstone Funds differ by product; however, the fundamental risks of the Blackstone Funds have similar characteristics, including loss of invested capital and loss of management fees and performance based fees. In Blackstone’s role as general partner, collateral manager or investment adviser, it generally considers itself the sponsor of the applicable Blackstone Fund. The Partnership does not provide performance guarantees and has no other financial obligation to provide funding to consolidated VIEs other than its own capital commitments.
The assets of consolidated variable interest entities may only be used to settle obligations of these consolidated Blackstone Funds. In addition, there is no recourse to the Partnership for the consolidated VIEs’ liabilities including the liabilities of the consolidated CLO vehicles.
The Partnership holds variable interests in certain VIEs which are not consolidated as it is determined that the Partnership is not the primary beneficiary. The Partnership’s involvement with such entities is in the form of direct equity interests and fee arrangements. The maximum exposure to loss represents the loss of assets recognized by Blackstone relating to non-consolidated entities, any amounts due to non-consolidated entities and any clawback obligation relating to previously distributed carried interest. The assets and liabilities recognized in the Partnership’s Consolidated Statements of Financial Condition related to the Partnership’s interest in these non-consolidated VIEs and the Partnership’s maximum exposure to loss relating to non-consolidated VIEs were as follows:
| December 31, | ||||||||
| 2016 | 2015 | |||||||
| Investments |
$ | 644,546 | $ | 466,651 | ||||
| Accounts Receivable |
12,308 | 11,726 | ||||||
| Due from Affiliates |
35,099 | 51,029 | ||||||
|
|
|
|
|
|||||
| Total VIE Assets |
691,953 | 529,406 | ||||||
| Due to Affiliates |
577 | 586 | ||||||
| Accounts Payable, Accrued Expenses and Other Liabilities |
38 | 88 | ||||||
| Potential Clawback Obligation |
81,936 | 73,450 | ||||||
|
|
|
|
|
|||||
| Maximum Exposure to Loss |
$ | 774,504 | $ | 603,530 | ||||
|
|
|
|
|
|||||
196
Table of Contents
THE BLACKSTONE GROUP L.P.
Notes to Consolidated Financial Statements—Continued
(All Dollars Are in Thousands, Except Unit and Per Unit Data, Except Where Noted)
| 10. | REVERSE REPURCHASE AND REPURCHASE AGREEMENTS |
At December 31, 2016, the Partnership received securities, primarily U.S. and non-U.S. government and agency securities, asset-backed securities and corporate debt, with a fair value of $117.8 million as collateral for reverse repurchase agreements that could be repledged, delivered or otherwise used. Securities with a fair value of $68.8 million and cash were used to cover Securities Sold, Not Yet Purchased. The Partnership also pledged securities with a carrying value of $119.1 million and cash to collateralize its repurchase agreements. Such securities can be repledged, delivered or otherwise used by the counterparty.
At December 31, 2015, the Partnership pledged securities with a carrying value of $64.5 million and cash to collateralize its repurchase agreements. Such securities can be repledged, delivered or otherwise used by the counterparty.
The following tables provide information regarding the Partnership’s Repurchase Agreements obligation by type of collateral pledged:
| December 31, 2016 | ||||||||||||||||||||
| Remaining Contractual Maturity of the Agreements | ||||||||||||||||||||
| Overnight and Continuous |
Up to 30 Days |
30 - 90 Days |
Greater than 90 days |
Total | ||||||||||||||||
| Repurchase Agreements |
||||||||||||||||||||
| U.S. Treasury and Agency Securities |
$ | 7,034 | $ | — | $ | — | $ | — | $ | 7,034 | ||||||||||
| Asset-Backed Securities |
— | 12,805 | 30,796 | 24,689 | 68,290 | |||||||||||||||
|
|
|
|
|
|
|
|
|
|
|
|||||||||||
| Total |
$ | 7,034 | $ | 12,805 | $ | 30,796 | $ | 24,689 | $ | 75,324 | ||||||||||
|
|
|
|
|
|
|
|
|
|
|
|||||||||||
| Gross Amount of Recognized Liabilities for Repurchase Agreements in Note 12. “Offsetting of Assets and Liabilities” |
|
$ | 75,324 | |||||||||||||||||
|
|
|
|||||||||||||||||||
| Amounts Related to Agreements Not Included in Offsetting Disclosure in Note 12. “Offsetting of Assets and Liabilities” |
|
$ | — | |||||||||||||||||
|
|
|
|||||||||||||||||||
| December 31, 2015 | ||||||||||||||||||||
| Remaining Contractual Maturity of the Agreements | ||||||||||||||||||||
| Overnight and Continuous |
Up to 30 Days |
30 - 90 Days |
Greater than 90 days |
Total | ||||||||||||||||
| Repurchase Agreements |
||||||||||||||||||||
| U.S. Treasury and Agency Securities |
$ | 970 | $ | — | $ | — | $ | — | $ | 970 | ||||||||||
| Asset-Backed Securities |
— | 39,959 | — | — | 39,959 | |||||||||||||||
|
|
|
|
|
|
|
|
|
|
|
|||||||||||
| Total |
$ | 970 | $ | 39,959 | $ | — | $ | — | $ | 40,929 | ||||||||||
|
|
|
|
|
|
|
|
|
|
|
|||||||||||
| Gross Amount of Recognized Liabilities for Repurchase Agreements in Note 12. “Offsetting of Assets and Liabilities” |
|
$ | 40,929 | |||||||||||||||||
|
|
|
|||||||||||||||||||
| Amounts Related to Agreements Not Included in Offsetting Disclosure in Note 12. “Offsetting of Assets and Liabilities” |
|
$ | — | |||||||||||||||||
|
|
|
|||||||||||||||||||
197
Table of Contents
THE BLACKSTONE GROUP L.P.
Notes to Consolidated Financial Statements—Continued
(All Dollars Are in Thousands, Except Unit and Per Unit Data, Except Where Noted)
| 11. | OTHER ASSETS AND ACCOUNTS PAYABLE, ACCRUED EXPENSES AND OTHER LIABILITIES |
Other Assets consists of the following:
| December 31, | ||||||||
| 2016 | 2015 | |||||||
| Furniture, Equipment and Leasehold Improvements |
$ | 338,292 | $ | 317,496 | ||||
| Less: Accumulated Depreciation |
(211,508 | ) | (181,953 | ) | ||||
|
|
|
|
|
|||||
| Furniture, Equipment and Leasehold Improvements, Net |
126,784 | 135,543 | ||||||
| Prepaid Expenses |
96,888 | 190,241 | ||||||
| Other Assets |
37,723 | 46,786 | ||||||
| Freestanding Derivatives |
3,393 | 4,300 | ||||||
| Net Investment Hedges |
— | 319 | ||||||
|
|
|
|
|
|||||
| $ | 264,788 | $ | 377,189 | |||||
|
|
|
|
|
|||||
Depreciation expense of $32.0 million, $26.0 million and $28.6 million related to furniture, equipment and leasehold improvements for the years ended December 31, 2016, 2015 and 2014, respectively, is included in General, Administrative and Other in the Consolidated Statements of Operations.
Accounts Payable, Accrued Expenses and Other Liabilities includes $10.1 million and $53.7 million as of December 31, 2016 and 2015, respectively, relating to redemptions that were legally payable to investors of the consolidated Blackstone Funds and $615.0 million and $187.7 million, respectively, of payables relating to unsettled purchases.
| 12. | OFFSETTING OF ASSETS AND LIABILITIES |
The following tables present the offsetting of assets and liabilities as of December 31, 2016:
| Gross and Net Amounts of Assets Presented in the Statement of Financial Condition |
Gross Amounts Not Offset in the Statement of Financial Condition |
|||||||||||||||
| Financial Instruments |
Cash Collateral Received |
Net Amount |
||||||||||||||
| Assets |
||||||||||||||||
| Freestanding Derivatives |
$ | 5,720 | $ | 1,064 | $ | 2,892 | $ | 1,764 | ||||||||
| Reverse Repurchase Agreements |
118,495 | 117,775 | — | 720 | ||||||||||||
|
|
|
|
|
|
|
|
|
|||||||||
| Total |
$ | 124,215 | $ | 118,839 | $ | 2,892 | $ | 2,484 | ||||||||
|
|
|
|
|
|
|
|
|
|||||||||
| Gross and
Net Amounts of Liabilities Presented in the Statement of Financial Condition |
Gross Amounts Not Offset in the Statement of Financial Condition |
|||||||||||||||
| Financial Instruments |
Cash Collateral Pledged |
Net Amount |
||||||||||||||
| Liabilities |
||||||||||||||||
| Net Investment Hedges |
$ | 587 | $ | — | $ | — | $ | 587 | ||||||||
| Freestanding Derivatives |
6,886 | 1,064 | 5,638 | 184 | ||||||||||||
| Repurchase Agreements |
75,324 | 72,195 | 3,129 | — | ||||||||||||
|
|
|
|
|
|
|
|
|
|||||||||
| Total |
$ | 82,797 | $ | 73,259 | $ | 8,767 | $ | 771 | ||||||||
|
|
|
|
|
|
|
|
|
|||||||||
198
Table of Contents
THE BLACKSTONE GROUP L.P.
Notes to Consolidated Financial Statements—Continued
(All Dollars Are in Thousands, Except Unit and Per Unit Data, Except Where Noted)
The following tables present the offsetting of assets and liabilities as of December 31, 2015:
| Gross and
Net Amounts of Assets Presented in the Statement of Financial Condition |
Gross Amounts Not Offset in the Statement of Financial Condition |
|||||||||||||||
| Financial Instruments |
Cash Collateral Received |
Net Amount |
||||||||||||||
| Assets |
||||||||||||||||
| Net Investment Hedges |
$ | 319 | $ | 1 | $ | — | $ | 318 | ||||||||
| Freestanding Derivatives |
4,300 | 2,149 | 1,310 | 841 | ||||||||||||
| Reverse Repurchase Agreements |
204,893 | 203,938 | — | 955 | ||||||||||||
|
|
|
|
|
|
|
|
|
|||||||||
| Total |
$ | 209,512 | $ | 206,088 | $ | 1,310 | $ | 2,114 | ||||||||
|
|
|
|
|
|
|
|
|
|||||||||
| Gross and
Net Amounts of Liabilities Presented in the Statement of Financial Condition |
Gross Amounts Not Offset in the Statement of Financial Condition |
|||||||||||||||
| Financial Instruments |
Cash Collateral Pledged |
Net Amount |
||||||||||||||
| Liabilities |
||||||||||||||||
| Net Investment Hedges |
$ | 1 | $ | 1 | $ | — | $ | — | ||||||||
| Freestanding Derivatives |
15,016 | 2,149 | 12,076 | 791 | ||||||||||||
| Repurchase Agreements |
40,929 | 40,259 | 670 | — | ||||||||||||
|
|
|
|
|
|
|
|
|
|||||||||
| Total |
$ | 55,946 | $ | 42,409 | $ | 12,746 | $ | 791 | ||||||||
|
|
|
|
|
|
|
|
|
|||||||||
Reverse Repurchase Agreements and Repurchase Agreements are presented separately on the Statements of Financial Condition. Freestanding Derivative assets are included in Other Assets in the Statements of Financial Condition. See Note 11. “Other Assets and Accounts Payable, Accrued Expenses and Other Liabilities” for the components of Other Assets.
Freestanding Derivative liabilities are included in Accounts Payable, Accrued Expenses and Other Liabilities in the Statements of Financial Condition and are not a significant component thereof.
Notional Pooling Arrangement
Blackstone has a notional cash pooling arrangement with a financial institution for cash management purposes. This arrangement allows for cash withdrawals based upon aggregate cash balances on deposit at the same financial institution. Cash withdrawals cannot exceed aggregate cash balances on deposit. The net balance of cash on deposit and overdrafts is used as a basis for calculating net interest expense or income. As of December 31, 2016, the aggregate cash balance on deposit relating to the cash pooling arrangement was $1.4 billion, which was offset with an accompanying overdraft of $1.4 billion.
199
Table of Contents
THE BLACKSTONE GROUP L.P.
Notes to Consolidated Financial Statements—Continued
(All Dollars Are in Thousands, Except Unit and Per Unit Data, Except Where Noted)
| 13. | BORROWINGS |
The Partnership borrows and enters into credit agreements for its general operating and investment purposes and certain Blackstone Funds borrow to meet financing needs of their operating and investing activities. Borrowing facilities have been established for the benefit of selected Blackstone Funds. When a Blackstone Fund borrows from the facility in which it participates, the proceeds from the borrowing are strictly limited for its intended use by the borrowing fund and not available for other Partnership purposes. The Partnership’s credit facilities consist of the following:
| December 31, | ||||||||||||||||||||||||
| 2016 | 2015 | |||||||||||||||||||||||
| Credit Available |
Borrowing Outstanding |
Weighted Average Interest Rate |
Credit Available |
Borrowing Outstanding |
Weighted Average Interest Rate |
|||||||||||||||||||
| Revolving Credit Facility (a) |
$ | 1,500,000 | $ | 683 | 0.88 | % | $ | 1,100,000 | $ | 6,129 | 0.88 | % | ||||||||||||
| Blackstone Issued Senior Notes (b) |
||||||||||||||||||||||||
| 6.625%, Due 8/15/2019 (c) |
585,000 | 585,000 | 6.63 | % | 585,000 | 585,000 | 6.63 | % | ||||||||||||||||
| 5.875%, Due 3/15/2021 |
400,000 | 400,000 | 5.88 | % | 400,000 | 400,000 | 5.88 | % | ||||||||||||||||
| 4.750%, Due 2/15/2023 |
400,000 | 400,000 | 4.75 | % | 400,000 | 400,000 | 4.75 | % | ||||||||||||||||
| 6.250%, Due 8/15/2042 |
250,000 | 250,000 | 6.25 | % | 250,000 | 250,000 | 6.25 | % | ||||||||||||||||
| 5.000%, Due 6/15/2044 |
500,000 | 500,000 | 5.00 | % | 500,000 | 500,000 | 5.00 | % | ||||||||||||||||
| 4.450%, Due 7/15/2045 |
350,000 | 350,000 | 4.45 | % | 350,000 | 350,000 | 4.45 | % | ||||||||||||||||
| 2.000%, Due 5/19/2025 |
315,510 | 315,510 | 2.00 | % | 327,990 | 327,990 | 2.00 | % | ||||||||||||||||
| 1.000%, Due 10/5/2026 |
631,020 | 631,020 | 1.00 | % | — | — | — | |||||||||||||||||
|
|
|
|
|
|
|
|
|
|||||||||||||||||
| 4,931,530 | 3,432,213 | 4.37 | % | 3,912,990 | 2,819,119 | 5.11 | % | |||||||||||||||||
| Blackstone Fund Facilities (d) |
2,793 | 2,793 | 2.32 | % | 4,453 | 4,453 | 1.97 | % | ||||||||||||||||
| CLO Vehicles (e) |
5,506,976 | 5,506,976 | 2.02 | % | 3,914,326 | 3,914,326 | 1.94 | % | ||||||||||||||||
|
|
|
|
|
|
|
|
|
|||||||||||||||||
| $ | 10,441,299 | $ | 8,941,982 | 2.92 | % | $ | 7,831,769 | $ | 6,737,898 | 3.26 | % | |||||||||||||
|
|
|
|
|
|
|
|
|
|||||||||||||||||
| (a) | On August 31, 2016, Blackstone Holdings Finance Co. L.L.C. (the “Issuer”), an indirect subsidiary of the Partnership, entered into an amendment to the Issuer’s revolving credit facility (the “Credit Facility”) with Citibank, N.A., as Administrative Agent. The amendment, among other things, increased the amount of the Credit Facility from $1.1 billion to $1.5 billion and extended the maturity date of the Credit Facility from May 29, 2019 to August 31, 2021. Interest on the borrowings is based on an adjusted LIBOR rate or alternate base rate, in each case plus a margin, and undrawn commitments bear a commitment fee. Borrowings may also be made in U.K. sterling or euros, in each case subject to certain sub-limits. The Credit Facility contains customary representations, covenants and events of default. Financial covenants consist of a maximum net leverage ratio and a requirement to keep a minimum amount of fee-earning assets under management, each tested quarterly. The Borrowing Outstanding at each date represent outstanding but undrawn letters of credit against the credit facility. |
| (b) | Blackstone Holdings Finance Co. L.L.C. (the “Issuer”), an indirect subsidiary of the Partnership, has issued long term borrowings in the form of senior notes (the “Notes”). The Notes are unsecured and unsubordinated obligations of the Issuer. The Notes are fully and unconditionally guaranteed, jointly and severally, by the Partnership, Blackstone Holdings (the “Guarantors”), and the Issuer. The guarantees are unsecured and unsubordinated obligations of the Guarantors. Transaction costs related to the issuance of the Notes have been deducted from the Note liability and are being amortized over the life of the Notes. The indentures include covenants, including limitations on the Issuer’s and the Guarantors’ ability to, subject to exceptions, incur indebtedness secured by liens on voting stock or profit participating equity interests of their subsidiaries or merge, consolidate or sell, transfer or lease assets. The indentures also provide for events of default and further provide that the trustee or the holders of not less than 25% in aggregate principal amount of the outstanding Notes may |
200
Table of Contents
THE BLACKSTONE GROUP L.P.
Notes to Consolidated Financial Statements—Continued
(All Dollars Are in Thousands, Except Unit and Per Unit Data, Except Where Noted)
| declare the Notes immediately due and payable upon the occurrence and during the continuance of any event of default after expiration of any applicable grace period. In the case of specified events of bankruptcy, insolvency, receivership or reorganization, the principal amount of the Notes and any accrued and unpaid interest on the Notes automatically become due and payable. All or a portion of the Notes may be redeemed at the Issuer’s option in whole or in part, at any time and from time to time, prior to their stated maturity, at the make-whole redemption price set forth in the Notes. If a change of control repurchase event occurs, the holders of the Notes may require the Issuer to repurchase the Notes at a repurchase price in cash equal to 101% of the aggregate principal amount of the Notes repurchased plus any accrued and unpaid interest on the Notes repurchased to, but not including, the date of repurchase. Interest expense on the Notes was $145.6 million, $136.5 million and $115.2 million for the years ended December 31, 2016, December 31, 2015 and December 31, 2014, respectively. |
| (c) | The Credit Available and Borrowing Outstanding are determined using the original $600 million par amount less $15 million attributable to these notes which were acquired but not retired by Blackstone during 2012. |
| (d) | Represents borrowing facilities for the various consolidated Blackstone Funds used to meet liquidity and investing needs. Certain borrowings under these facilities were used for bridge financing and general liquidity purposes. Other borrowings were used to finance the purchase of investments with the borrowing remaining in place until the disposition or refinancing event. Such borrowings have varying maturities and are rolled over until the disposition or a refinancing event. Because the timing of such events is unknown and may occur in the near term, these borrowings are considered short-term in nature. Borrowings bear interest at spreads to market rates. Borrowings were secured according to the terms of each facility and are generally secured by the investment purchased with the proceeds of the borrowing and/or the uncalled capital commitment of each respective fund. Certain facilities have commitment fees. When a fund borrows, the proceeds are available only for use by that fund and are not available for the benefit of other funds. Collateral within each fund is also available only against the borrowings by that fund and not against the borrowings of other funds. |
| (e) | Represents borrowings due to the holders of debt securities issued by CLO vehicles consolidated by Blackstone. These amounts are included within Loans Payable and Due to Affiliates within the Consolidated Statements of Financial Condition. |
The following table presents the general characteristics of each of our Notes, as well as their carrying value and fair value. The Notes are included in Loans Payable within the Consolidated Statements of Financial Condition. All of the Notes were issued at a discount. All of the Notes accrue interest from the Issue Date and all pay interest in arrears on a semi-annual basis or annual basis as indicated by the Interest Payment Dates.
| Issue Date |
Interest Payment Dates |
First Interest Payment Date |
December 31, | |||||||||||||||||||||||||
| 2016 | 2015 | |||||||||||||||||||||||||||
| Senior Notes |
Carrying Value |
Fair Value (a) |
Carrying Value (b) |
Fair Value (a) |
||||||||||||||||||||||||
| 6.625%, Due 8/15/2019 (c) |
8/20/2009 | 2/15, 8/15 | 2/15/2010 | $ | 607,121 | $ | 648,765 | $ | 614,996 | $ | 665,438 | |||||||||||||||||
| 5.875%, Due 3/15/2021 |
9/15/2010 | 3/15, 9/15 | 3/15/2011 | 398,105 | 447,600 | 397,720 | 458,680 | |||||||||||||||||||||
| 4.750%, Due 2/15/2023 |
8/17/2012 | 2/15, 8/15 | 2/15/2013 | 393,158 | 426,520 | 392,224 | 430,560 | |||||||||||||||||||||
| 6.250%, Due 8/15/2042 |
8/17/2012 | 2/15, 8/15 | 2/15/2013 | 237,830 | 285,450 | 237,648 | 297,575 | |||||||||||||||||||||
| 5.000%, Due 6/15/2044 |
4/7/2014 | 6/15, 12/15 | 12/15/2014 | 488,337 | 497,200 | 488,119 | 515,050 | |||||||||||||||||||||
| 4.450%, Due 7/15/2045 |
4/27/2015 | 1/15, 7/15 | 1/15/2016 | 343,816 | 322,525 | 343,689 | 332,640 | |||||||||||||||||||||
| 2.000%, Due 5/19/2025 |
5/19/2015 | 5/19 | 5/19/2016 | 310,805 | 331,096 | 322,664 | 327,465 | |||||||||||||||||||||
| 1.000%, Due 10/5/2026 |
10/5/2016 | 10/5 | 10/5/2017 | 620,750 | 598,270 | — | — | |||||||||||||||||||||
|
|
|
|
|
|
|
|
|
|||||||||||||||||||||
| Total |
$ | 3,399,922 | $ | 3,557,426 | $ | 2,797,060 | $ | 3,027,408 | ||||||||||||||||||||
|
|
|
|
|
|
|
|
|
|||||||||||||||||||||
| (a) | Fair value is determined by broker quote and these notes would be classified as Level II within the fair value hierarchy. |
201
Table of Contents
THE BLACKSTONE GROUP L.P.
Notes to Consolidated Financial Statements—Continued
(All Dollars Are in Thousands, Except Unit and Per Unit Data, Except Where Noted)
| (b) | The carrying value has been adjusted to reflect the presentation of debt issuance costs as a direct deduction from the related liability for all periods presented in accordance with amended guidance on simplifying the presentation of such costs. |
| (c) | The carrying and fair values are determined using the original $600 million par amount less $15 million attributable to these notes which were acquired but not retired by Blackstone during 2012. |
Included within Loans Payable and Due to Affiliates within the Consolidated Statements of Financial Condition are amounts due to holders of debt securities issued by Blackstone’s consolidated CLO vehicles. Borrowings through the consolidated CLO vehicles consisted of the following:
| December 31, | ||||||||||||||||||||||||
| 2016 | 2015 | |||||||||||||||||||||||
| Borrowing Outstanding |
Weighted Average Interest Rate |
Weighted Average Remaining Maturity in Years |
Borrowing Outstanding |
Weighted Average Interest Rate |
Weighted Average Remaining Maturity in Years |
|||||||||||||||||||
| Senior Secured Notes |
$ | 5,124,241 | 2.17 | % | 5.4 | $ | 3,687,976 | 1.93 | % | 5.4 | ||||||||||||||
| Subordinated Notes |
382,735 | (a) | N/A | 226,350 | (a) | N/A | ||||||||||||||||||
|
|
|
|
|
|||||||||||||||||||||
| $ | 5,506,976 | $ | 3,914,326 | |||||||||||||||||||||
|
|
|
|
|
|||||||||||||||||||||
| (a) | The Subordinated Notes do not have contractual interest rates but instead receive distributions from the excess cash flows of the CLO vehicles. |
Senior Secured Notes and Subordinated Notes comprise the following amounts:
| December 31, | ||||||||||||||||||||||||
| 2016 | 2015 | |||||||||||||||||||||||
| Amounts Due to Non- Consolidated Affiliates |
Amounts Due to Non- Consolidated Affiliates |
|||||||||||||||||||||||
| Fair Value | Borrowing Outstanding |
Fair Value |
Fair Value | Borrowing Outstanding |
Fair Value |
|||||||||||||||||||
| Senior Secured Notes |
$ | 5,125,804 | $ | — | $ | — | $ | 3,225,064 | $ | — | $ | — | ||||||||||||
| Subordinated Notes |
345,594 | 10,000 | 7,748 | 98,371 | 10,000 | 8,231 | ||||||||||||||||||
|
|
|
|
|
|
|
|
|
|
|
|
|
|||||||||||||
| $ | 5,471,398 | $ | 10,000 | $ | 7,748 | $ | 3,323,435 | $ | 10,000 | $ | 8,231 | |||||||||||||
|
|
|
|
|
|
|
|
|
|
|
|
|
|||||||||||||
The Loans Payable of the consolidated CLO vehicles are collateralized by assets held by each respective CLO vehicle and assets of one vehicle may not be used to satisfy the liabilities of another. As of December 31, 2016 and 2015, the fair value of the consolidated CLO assets was $6.4 billion and $3.9 billion, respectively. This collateral consisted of Cash, Corporate Loans, Corporate Bonds and other securities.
As part of Blackstone’s borrowing arrangements, the Partnership is subject to certain financial and operating covenants. The Partnership was in compliance with all of its loan covenants as of December 31, 2016.
202
Table of Contents
THE BLACKSTONE GROUP L.P.
Notes to Consolidated Financial Statements—Continued
(All Dollars Are in Thousands, Except Unit and Per Unit Data, Except Where Noted)
Scheduled principal payments for borrowings at December 31, 2016 are as follows:
| Operating Borrowings |
Blackstone Fund Facilities / CLO Vehicles |
Total Borrowings | ||||||||||
| 2017 |
$ | — | $ | 426,136 | $ | 426,136 | ||||||
| 2018 |
— | — | — | |||||||||
| 2019 |
585,000 | — | 585,000 | |||||||||
| 2020 |
— | — | — | |||||||||
| 2021 |
400,000 | — | 400,000 | |||||||||
| Thereafter |
2,446,530 | 5,083,633 | 7,530,163 | |||||||||
|
|
|
|
|
|
|
|||||||
| Total |
$ | 3,431,530 | $ | 5,509,769 | $ | 8,941,299 | ||||||
|
|
|
|
|
|
|
|||||||
| 14. | INCOME TAXES |
Income Before Provision for Taxes of $2.4 billion for the year ended December 31, 2016 is comprised of $2.2 billion U.S. domestic income and $166.6 million foreign income. Income Before Provision for Taxes of $1.8 billion for the year ended December 31, 2015 is comprised of $1.8 billion U.S. domestic income and $59.8 million foreign income.
The Provision for Taxes consists of the following:
| Year Ended December 31, | ||||||||||||
| 2016 | 2015 | 2014 | ||||||||||
| Current |
||||||||||||
| Federal Income Tax |
$ | 32,383 | $ | 45,506 | $ | 135,193 | ||||||
| Foreign Income Tax |
17,322 | 16,769 | 24,199 | |||||||||
| State and Local Income Tax |
32,572 | 28,137 | 69,281 | |||||||||
|
|
|
|
|
|
|
|||||||
| 82,277 | 90,412 | 228,673 | ||||||||||
|
|
|
|
|
|
|
|||||||
| Deferred |
||||||||||||
| Federal Income Tax |
42,042 | 80,307 | 54,375 | |||||||||
| Foreign Income Tax |
363 | (398 | ) | (416 | ) | |||||||
| State and Local Income Tax |
7,680 | 20,077 | 8,541 | |||||||||
|
|
|
|
|
|
|
|||||||
| 50,085 | 99,986 | 62,500 | ||||||||||
|
|
|
|
|
|
|
|||||||
| Provision for Taxes |
$ | 132,362 | $ | 190,398 | $ | 291,173 | ||||||
|
|
|
|
|
|
|
|||||||
The following table summarizes Blackstone’s tax position:
| Year Ended December 31, | ||||||||||||
| 2016 | 2015 | 2014 | ||||||||||
| Income Before Provision for Taxes |
$ | 2,382,010 | $ | 1,814,748 | $ | 3,986,726 | ||||||
| Provision for Taxes |
$ | 132,362 | $ | 190,398 | $ | 291,173 | ||||||
| Effective Income Tax Rate |
5.6 | % | 10.5 | % | 7.3 | % | ||||||
203
Table of Contents
THE BLACKSTONE GROUP L.P.
Notes to Consolidated Financial Statements—Continued
(All Dollars Are in Thousands, Except Unit and Per Unit Data, Except Where Noted)
The following table reconciles the effective income tax rate to the U.S. federal statutory tax rate:
| Year Ended December 31, | ||||||||||||
| 2016 | 2015 | 2014 | ||||||||||
| Statutory U.S. Federal Income Tax Rate |
35.0 | % | 35.0 | % | 35.0 | % | ||||||
| Income Passed Through to Common Unitholders and Non-Controlling Interest |
-28.6 | % | -26.3 | % | -29.2 | % | ||||||
| State and Local Income Taxes |
1.3 | % | 1.8 | % | 1.5 | % | ||||||
| Equity-Based Compensation |
-0.2 | % | 1.8 | % | 1.1 | % | ||||||
| Other |
-1.9 | % | -1.8 | % | -1.1 | % | ||||||
|
|
|
|
|
|
|
|||||||
| Effective Income Tax Rate |
5.6 | % | 10.5 | % | 7.3 | % | ||||||
|
|
|
|
|
|
|
|||||||
| (a) | Includes income that is not taxable to the Partnership and its subsidiaries. Such income is directly taxable to the Partnership’s unitholders and the non-controlling interest holders. |
Deferred income taxes reflect the net tax effects of temporary differences that may exist between the carrying amounts of assets and liabilities for financial reporting purposes and the amounts used for income tax purposes using enacted tax rates in effect for the year in which the differences are expected to reverse. A summary of the tax effects of the temporary differences is as follows:
| December 31, | ||||||||
| 2016 | 2015 | |||||||
| Deferred Tax Assets |
||||||||
| Fund Management Fees |
$ | 10,235 | $ | 16,357 | ||||
| Equity-Based Compensation |
68,642 | 57,552 | ||||||
| Amortization and Depreciation |
1,297,669 | 1,326,395 | ||||||
| Net Operating Loss Carry Forward |
17,969 | 15,874 | ||||||
|
|
|
|
|
|||||
| Total Deferred Tax Assets |
1,394,515 | 1,416,178 | ||||||
|
|
|
|
|
|||||
| Deferred Tax Liabilities |
||||||||
| Unrealized Gains from Investments |
72,750 | 105,830 | ||||||
| Other |
35,296 | 32,919 | ||||||
|
|
|
|
|
|||||
| Total Deferred Tax Liabilities |
108,046 | 138,749 | ||||||
|
|
|
|
|
|||||
| Net Deferred Tax Assets |
$ | 1,286,469 | $ | 1,277,429 | ||||
|
|
|
|
|
|||||
As a result of the October 1, 2015 spin-off, the net deferred tax assets were reduced by $70.8 million.
Future realization of tax benefits depends on the expectation of taxable income within a period of time that the tax benefits will reverse. The Partnership has recorded a significant deferred tax asset for the future amortization of tax basis intangibles acquired from the predecessor owners and current owners. The amortization period for these tax basis intangibles is 15 years; accordingly, the related deferred tax assets will reverse over the same period. The Partnership had a taxable loss of $4.0 million for the year ended December 31, 2016, which is available for carryback to 2014 or carryforward to 2017. The Partnership has considered the 15 year amortization period for the tax basis intangibles and the 20 year carryforward period for its taxable loss in evaluating whether it should establish a valuation allowance.
204
Table of Contents
THE BLACKSTONE GROUP L.P.
Notes to Consolidated Financial Statements—Continued
(All Dollars Are in Thousands, Except Unit and Per Unit Data, Except Where Noted)
The Partnership also considers projections of taxable income in evaluating its ability to utilize deferred tax assets. In projecting its taxable income, the Partnership begins with historic results and incorporates assumptions of the amount of future pretax operating income. The assumptions about future taxable income require significant judgment and are consistent with the plans and estimates that the Partnership uses to manage its business. At this time, the Partnership’s projections of future taxable income that include the effects of originating and reversing temporary differences, including those for the tax basis intangibles, indicate that it is more likely than not that the benefits from the deferred tax asset will be realized. Therefore, the Partnership has determined that no valuation allowance is needed at December 31, 2016.
Currently, the Partnership does not believe it meets the indefinite reversal criteria that would cause the Partnership to not recognize a deferred tax liability with respect to its foreign subsidiaries. Where applicable, Blackstone will record a deferred tax liability for any outside basis difference of an investment in a foreign subsidiary.
Blackstone files its tax returns as prescribed by the tax laws of the jurisdictions in which it operates. In the normal course of business, Blackstone is subject to examination by federal and certain state, local and foreign tax regulators. As of December 31, 2016, Blackstone’s U.S. federal income tax returns for the years 2013 through 2015 are open under the normal three-year statute of limitations and therefore subject to examination. State and local tax returns are generally subject to audit from 2012 through 2015. The City of New York is examining certain other subsidiaries’ tax returns for the years 2007 through 2014. The Income Tax Department of the Government of India is examining the tax returns of the Indian subsidiaries for the years 2008 and 2009. Blackstone believes that during 2016 certain tax audits have a reasonable possibility of being completed and does not expect the results of these audits to have a material impact on the consolidated financial statements.
Blackstone’s unrecognized tax benefits, excluding related interest and penalties, were:
| December 31, | ||||||||||||
| 2016 | 2015 | 2014 | ||||||||||
| Unrecognized Tax Benefits — January 1 |
$ | 15,698 | $ | 19,836 | $ | 18,862 | ||||||
| Additions based on Tax Positions Related to Current Year |
902 | 1,031 | 2,104 | |||||||||
| Reductions for Tax Positions of Current Year |
(851 | ) | — | — | ||||||||
| Additions for Tax Positions of Prior Years |
— | — | 4,002 | |||||||||
| Reductions for Tax Positions of Prior Years |
(7,837 | ) | (4,032 | ) | (2,503 | ) | ||||||
| Reductions for Tax Positions as a Result of a Lapse of the Applicable Statute of Limitations |
(3,774 | ) | — | — | ||||||||
| Settlements |
(357 | ) | — | (1,062 | ) | |||||||
| Exchange Rate Fluctuations |
(200 | ) | (1,137 | ) | (1,567 | ) | ||||||
|
|
|
|
|
|
|
|||||||
| Unrecognized Tax Benefits — December 31 |
$ | 3,581 | $ | 15,698 | $ | 19,836 | ||||||
|
|
|
|
|
|
|
|||||||
If the above tax benefits were recognized, $3.6 million and $15.7 million for the years ended December 31, 2016 and 2015, respectively, would reduce the annual effective rate. Blackstone does not believe that it will have a material increase or decrease in its unrecognized tax benefits during the coming year.
The unrecognized tax benefits are recorded in Accounts Payable, Accrued Expense and Other Liabilities in the Consolidated Statements of Financial Condition.
Blackstone recognizes interest and penalties accrued related to unrecognized tax positions in General, Administrative and Other Expenses. During the years ended December 31, 2016, 2015 and 2014, $(4.1) million,
205
Table of Contents
THE BLACKSTONE GROUP L.P.
Notes to Consolidated Financial Statements—Continued
(All Dollars Are in Thousands, Except Unit and Per Unit Data, Except Where Noted)
$(0.4) million and $2.0 million of interest expense were accrued (reversed), respectively. During the years ended December 31, 2016, 2015 and 2014, no penalties were accrued.
Other Income — Reversal of the Tax Receivable Agreement Liability
In 2015, the $82.7 million Reversal of the Tax Receivable Agreement Liability was primarily attributable to the October 1, 2015 spin-off.
| 15. | NET INCOME PER COMMON UNIT |
Basic and diluted net income per common unit for the years ended December 31, 2016, 2015 and 2014 was calculated as follows:
| Year Ended December 31, | ||||||||||||
| 2016 | 2015 | 2014 | ||||||||||
| Net Income for Per Common Unit Calculations |
||||||||||||
| Net Income Attributable to The Blackstone Group L.P., Basic |
$ | 1,039,235 | $ | 709,789 | $ | 1,584,589 | ||||||
| Incremental Net Income from Assumed Exchange of Blackstone Holdings Partnership Units |
828,244 | 524,353 | — | |||||||||
|
|
|
|
|
|
|
|||||||
| Net Income Attributable to The Blackstone Group L.P., Diluted |
$ | 1,867,479 | $ | 1,234,142 | $ | 1,584,589 | ||||||
|
|
|
|
|
|
|
|||||||
| Units Outstanding |
||||||||||||
| Weighted-Average Common Units Outstanding, Basic |
649,475,264 | 634,337,179 | 608,803,111 | |||||||||
| Weighted-Average Unvested Deferred Restricted Common Units |
1,445,277 | 2,993,398 | 4,373,294 | |||||||||
| Weighted-Average Blackstone Holdings Partnership Units |
544,194,049 | 550,754,834 | — | |||||||||
|
|
|
|
|
|
|
|||||||
| Weighted-Average Common Units Outstanding, Diluted |
1,195,114,590 | 1,188,085,411 | 613,176,405 | |||||||||
|
|
|
|
|
|
|
|||||||
| Net Income Per Common Unit, Basic |
$ | 1.60 | $ | 1.12 | $ | 2.60 | ||||||
|
|
|
|
|
|
|
|||||||
| Net Income Per Common Unit, Diluted |
$ | 1.56 | $ | 1.04 | $ | 2.58 | ||||||
|
|
|
|
|
|
|
|||||||
| Distributions Declared Per Common Unit (a) |
$ | 1.66 | $ | 2.90 | $ | 1.92 | ||||||
|
|
|
|
|
|
|
|||||||
| (a) | Distributions declared reflects the calendar date of the declaration for each distribution. The fourth quarter distribution, if any, for any fiscal year will be declared and paid in the subsequent fiscal year. |
The following table summarizes the anti-dilutive securities for the periods indicated:
| Year Ended December 31, | ||||||||||||
| 2016 | 2015 | 2014 | ||||||||||
| Weighted-Average Blackstone Holdings Partnership Units |
— | — | 542,553,088 | |||||||||
Unit Repurchase Program
In January 2008, Blackstone announced that the Board of Directors of its general partner, Blackstone Group Management L.L.C., had authorized the repurchase by Blackstone of up to $500 million of Blackstone common
206
Table of Contents
THE BLACKSTONE GROUP L.P.
Notes to Consolidated Financial Statements—Continued
(All Dollars Are in Thousands, Except Unit and Per Unit Data, Except Where Noted)
units and Blackstone Holdings Partnership Units. Under this unit repurchase program, units may be repurchased from time to time in open market transactions, in privately negotiated transactions or otherwise. The timing and the actual number of Blackstone common units and Blackstone Holdings Partnership Units repurchased will depend on a variety of factors, including legal requirements, price and economic and market conditions. This unit repurchase program may be suspended or discontinued at any time and does not have a specified expiration date.
During the years ended December 31, 2016, 2015 and 2014, no units were repurchased. As of December 31, 2016, the amount remaining available for repurchases under this program was $335.8 million.
| 16. | EQUITY-BASED COMPENSATION |
The Partnership has granted equity-based compensation awards to Blackstone’s senior managing directors, non-partner professionals, non-professionals and selected external advisers under the Partnership’s 2007 Equity Incentive Plan (the “Equity Plan”), the majority of which to date were granted in connection with Blackstone’s initial public offering (“IPO”). The Equity Plan allows for the granting of options, unit appreciation rights or other unit-based awards (units, restricted units, restricted common units, deferred restricted common units, phantom restricted common units or other unit-based awards based in whole or in part on the fair value of the Blackstone common units or Blackstone Holdings Partnership Units) which may contain certain service or performance requirements. As of January 1, 2016, the Partnership had the ability to grant 168,600,140 units under the Equity Plan.
For the years ended December 31, 2016, 2015 and 2014 the Partnership recorded compensation expense of $323.7 million, $629.6 million, and $734.7 million, respectively, in relation to its equity-based awards with corresponding tax benefits of $33.8 million, $41.0 million, and $23.1 million, respectively.
As of December 31, 2016, there was $885.1 million of estimated unrecognized compensation expense related to unvested awards. This cost is expected to be recognized over a weighted-average period of 4.4 years.
Total vested and unvested outstanding units, including Blackstone common units, Blackstone Holdings Partnership Units and deferred restricted common units, were 1,196,549,339 as of December 31, 2016. Total outstanding unvested phantom units were 46,364 as of December 31, 2016.
A summary of the status of the Partnership’s unvested equity-based awards as of December 31, 2016 and of changes during the period January 1, 2016 through December 31, 2016 is presented below:
| Blackstone Holdings | The Blackstone Group L.P. | |||||||||||||||||||||||
| Equity Settled Awards | Cash Settled Awards | |||||||||||||||||||||||
| Unvested Units |
Partnership Units |
Weighted- Average Grant Date Fair Value |
Deferred Restricted Common Units |
Weighted- Average Grant Date Fair Value |
Phantom Units |
Weighted- Average Grant Date Fair Value |
||||||||||||||||||
| Balance, December 31, 2015 |
40,901,755 | $ | 32.98 | 14,342,129 | $ | 22.38 | 27,942 | $ | 28.79 | |||||||||||||||
| Granted |
3,576,676 | 25.04 | 3,581,489 | 26.83 | 14,248 | 27.07 | ||||||||||||||||||
| Vested |
(9,692,698 | ) | 26.35 | (5,230,879 | ) | 19.48 | (1,248 | ) | 16.48 | |||||||||||||||
| Forfeited |
(217,007 | ) | 36.26 | (486,723 | ) | 21.29 | (482 | ) | 28.62 | |||||||||||||||
|
|
|
|
|
|
|
|||||||||||||||||||
| Balance, December 31, 2016 |
34,568,726 | $ | 33.58 | 12,206,016 | $ | 24.65 | 40,460 | $ | 28.14 | |||||||||||||||
|
|
|
|
|
|
|
|||||||||||||||||||
207
Table of Contents
THE BLACKSTONE GROUP L.P.
Notes to Consolidated Financial Statements—Continued
(All Dollars Are in Thousands, Except Unit and Per Unit Data, Except Where Noted)
Units Expected to Vest
The following unvested units, after expected forfeitures, as of December 31, 2016, are expected to vest:
| Units | Weighted-Average Service Period in Years |
|||||||
| Blackstone Holdings Partnership Units |
25,941,573 | 4.1 | ||||||
| Deferred Restricted Blackstone Common Units |
8,838,579 | 1.8 | ||||||
|
|
|
|
|
|||||
| Total Equity-Based Awards |
34,780,152 | 3.5 | ||||||
|
|
|
|
|
|||||
| Phantom Units |
33,455 | 3.4 | ||||||
|
|
|
|
|
|||||
Deferred Restricted Common Units and Phantom Units
The Partnership has granted deferred restricted common units to certain senior and non-senior managing director professionals, analysts and senior finance and administrative personnel and selected external advisers and phantom units (cash settled equity-based awards) to other senior and non-senior managing director employees. Holders of deferred restricted common units and phantom units are not entitled to any voting rights. Only phantom units are to be settled in cash.
The fair values of deferred restricted common units have been derived based on the closing price of Blackstone’s common units on the date of the grant, multiplied by the number of unvested awards and expensed over the assumed service period, which ranges from 1 to 5 years. Additionally, the calculation of the compensation expense assumes forfeiture rates based upon historical turnover rates, ranging from 1.0% to 11.5% annually by employee class, and a per unit discount, ranging from $0.37 to $10.88.
The phantom units vest over the assumed service period, which ranges from 1 to 5 years. On each such vesting date, Blackstone delivered or will deliver cash to the holder in an amount equal to the number of phantom units held multiplied by the then fair market value of the Blackstone common units on such date. Additionally, the calculation of the compensation expense assumes forfeiture rates based upon historical turnover rates, ranging from 9.9% to 11.5% annually by employee class. Blackstone is accounting for these cash settled awards as a liability.
Blackstone paid $0.2 million, $1.1 million and $1.1 million to non-senior managing director employees in settlement of phantom units for the years ended December 31, 2016, 2015 and 2014, respectively.
Blackstone Holdings Partnership Units
At the time of the Reorganization, Blackstone’s predecessor owners and selected advisers received 827,516,625 Blackstone Holdings Partnership Units, of which 387,805,088 were vested and 439,711,537 were to vest over a period of up to eight years from the IPO date. Subsequent to the Reorganization, the Partnership has granted Blackstone Holdings Partnership Units to newly hired and pre-existing senior managing directors. The Partnership has accounted for the unvested Blackstone Holdings Partnership Units as compensation expense over the vesting period. The fair values have been derived based on the closing price of Blackstone’s common units on the date of the grant, or $31 (based on the initial public offering price per Blackstone common unit) for those units issued at the time of the Reorganization, multiplied by the number of unvested awards and expensed over the assumed service period which ranges from 2 to 9 years. Additionally, the calculation of the compensation expense assumes a forfeiture rate of up to 8.4%, based on historical experience.
208
Table of Contents
THE BLACKSTONE GROUP L.P.
Notes to Consolidated Financial Statements—Continued
(All Dollars Are in Thousands, Except Unit and Per Unit Data, Except Where Noted)
In November 2009, the Partnership modified equity awards issued in connection with a deferred compensation plan to, among other things: (a) provide that deferred compensation payments to participating employees and senior managing directors generally would be satisfied by delivery of Blackstone common units instead of delivery of Partnership Units, (b) delay the delivery of common units (following the applicable vesting dates) until anticipated trading window periods, to better facilitate participants’ liquidity to meet tax obligations and (c) ensure compliance with deferred compensation taxation rules. As the fair value of Partnership Units on grant date is based on the closing price of Blackstone common units, there was no change in the fair value of these awards as a result of the modification. As a result, there was no additional impact to compensation expense.
| 17. | RELATED PARTY TRANSACTIONS |
Affiliate Receivables and Payables
Due from Affiliates and Due to Affiliates consisted of the following:
| December 31, | ||||||||
| 2016 | 2015 | |||||||
| Due from Affiliates |
||||||||
| Accrual for Potential Clawback of Previously Distributed Carried Interest |
$ | — | $ | 1,686 | ||||
| Advances Made on Behalf of Certain Non-Controlling Interest Holders and Blackstone Employees Principally for Investments in Blackstone Funds |
342,943 | 331,558 | ||||||
| Amounts Due from Portfolio Companies and Funds |
456,469 | 319,758 | ||||||
| Investments Redeemed in Non-Consolidated Funds of Hedge Funds |
1,552 | 5,931 | ||||||
| Management and Performance Fees Due from Non-Consolidated Funds |
445,280 | 403,538 | ||||||
| Payments Made on Behalf of Non-Consolidated Entities |
196,134 | 178,326 | ||||||
|
|
|
|
|
|||||
| $ | 1,442,378 | $ | 1,240,797 | |||||
|
|
|
|
|
|||||
| December 31, | ||||||||
| 2016 | 2015 | |||||||
| Due to Affiliates |
||||||||
| Due to Certain Non-Controlling Interest Holders in Connection with the Tax Receivable Agreements |
$ | 1,186,145 | $ | 1,201,543 | ||||
| Accrual for Potential Repayment of Previously Received Performance Fees |
— | 3,356 | ||||||
| Due to Note Holders of Consolidated CLO Vehicles |
7,748 | 8,231 | ||||||
| Distributions Received on Behalf of Certain Non-Controlling Interest Holders and Blackstone Employees |
28,012 | 26,593 | ||||||
| Distributions Received on Behalf of Blackstone Entities |
80,034 | 33,160 | ||||||
| Payments Made by Non-Consolidated Entities |
19,833 | 9,817 | ||||||
|
|
|
|
|
|||||
| $ | 1,321,772 | $ | 1,282,700 | |||||
|
|
|
|
|
|||||
Interests of the Founder, Senior Managing Directors, Employees and Other Related Parties
The Founder, senior managing directors, employees and certain other related parties invest on a discretionary basis in the consolidated Blackstone Funds both directly and through consolidated entities. These investments generally are subject to preferential management fee and performance fee arrangements. As of December 31, 2016 and 2015, such investments aggregated $740.3 million and $746.3 million, respectively. Their share of the Net
209
Table of Contents
THE BLACKSTONE GROUP L.P.
Notes to Consolidated Financial Statements—Continued
(All Dollars Are in Thousands, Except Unit and Per Unit Data, Except Where Noted)
Income Attributable to Redeemable Non-Controlling and Non-Controlling Interests in Consolidated Entities aggregated $79.7 million, $49.0 million and $176.0 million for the years ended December 31, 2016, 2015 and 2014, respectively.
Revenues Earned from Affiliates
Management and Advisory Fees, Net earned from affiliates totaled $185.8 million, $210.7 million and $327.1 million for the years ended December 31, 2016, 2015 and 2014, respectively. Fees relate primarily to transaction and monitoring fees which are negotiated in the ordinary course of fundraising and investment activities.
Loans to Affiliates
Loans to affiliates consist of interest bearing advances to certain Blackstone individuals to finance their investments in certain Blackstone Funds. These loans earn interest at Blackstone’s cost of borrowing and such interest totaled $1.4 million, $5.0 million and $2.9 million for the years ended December 31, 2016, 2015 and 2014, respectively.
Contingent Repayment Guarantee
Blackstone and its personnel who have received carried interest distributions have guaranteed payment on a several basis (subject to a cap) to the carry funds of any clawback obligation with respect to the excess carried interest allocated to the general partners of such funds and indirectly received thereby to the extent that either Blackstone or its personnel fails to fulfill its clawback obligation, if any. The Accrual for Potential Repayment of Previously Received Performance Fees represents amounts previously paid to Blackstone Holdings and non-controlling interest holders that would need to be repaid to the Blackstone Funds if the carry funds were to be liquidated based on the fair value of their underlying investments as of December 31, 2016. See Note 18. “Commitments and Contingencies — Contingencies — Contingent Obligations (Clawback)”.
Aircraft and Other Services
In the normal course of business, Blackstone personnel make use of aircraft owned as personal assets by Stephen A. Schwarzman; an aircraft owned jointly as a personal asset by Hamilton E. James, Blackstone’s President and Chief Operating Officer, and a Director of Blackstone, and Jonathan D. Gray, Blackstone’s Global Head of Real Estate and a Director of Blackstone; and an aircraft owned jointly as a personal asset by Bennett J. Goodman, Co-Founder of GSO Capital and a Director of Blackstone, and another senior managing director (each such aircraft, “Personal Aircraft”). Mr. Schwarzman paid for his purchases of his Personal Aircraft himself. Each of Mr. James and Mr. Gray paid for his respective interest in their jointly owned Personal Aircraft. Mr. Goodman paid for his interest in his jointly owned Personal Aircraft. Mr. Schwarzman, Mr. James, Mr. Gray and Mr. Goodman respectively bear operating, personnel and maintenance costs associated with the operation of such Personal Aircraft. Payment by Blackstone for the use of the Personal Aircraft by Blackstone employees is made based on market rates.
In addition, on occasion, certain of Blackstone’s executive officers and employee directors and their families may make personal use of aircraft owned by Blackstone or in which Blackstone owns a fractional interest, as well as other assets of Blackstone. Any such personal use of Blackstone assets is charged to the executive officer or employee director based on market rates and usage. Personal use of Blackstone resources is also reimbursed to Blackstone based on market rates.
210
Table of Contents
THE BLACKSTONE GROUP L.P.
Notes to Consolidated Financial Statements—Continued
(All Dollars Are in Thousands, Except Unit and Per Unit Data, Except Where Noted)
The transactions described herein are not material to the Consolidated Financial Statements.
Tax Receivable Agreements
Blackstone used a portion of the proceeds from the IPO and the sale of non-voting common units to Beijing Wonderful Investments to purchase interests in the predecessor businesses from the predecessor owners. In addition, holders of Blackstone Holdings Partnership Units may exchange their Blackstone Holdings Partnership Units for Blackstone common units on a one-for-one basis. The purchase and subsequent exchanges are expected to result in increases in the tax basis of the tangible and intangible assets of Blackstone Holdings and therefore reduce the amount of tax that Blackstone’s wholly owned subsidiaries would otherwise be required to pay in the future.
One of the subsidiaries of the Partnership which is a corporate taxpayer has entered into tax receivable agreements with each of the predecessor owners and additional tax receivable agreements have been executed, and will continue to be executed, with newly-admitted senior managing directors and others who acquire Blackstone Holdings Partnership Units. The agreements provide for the payment by the corporate taxpayer to such owners of 85% of the amount of cash savings, if any, in U.S. federal, state and local income tax that the corporate taxpayers actually realize as a result of the aforementioned increases in tax basis and of certain other tax benefits related to entering into these tax receivable agreements. For purposes of the tax receivable agreements, cash savings in income tax will be computed by comparing the actual income tax liability of the corporate taxpayers to the amount of such taxes that the corporate taxpayers would have been required to pay had there been no increase to the tax basis of the tangible and intangible assets of Blackstone Holdings as a result of the exchanges and had the corporate taxpayers not entered into the tax receivable agreements.
Assuming no future material changes in the relevant tax law and that the corporate taxpayers earn sufficient taxable income to realize the full tax benefit of the increased amortization of the assets, the expected future payments under the tax receivable agreements (which are taxable to the recipients) will aggregate $1.2 billion over the next 15 years. The after-tax net present value of these estimated payments totals $406.9 million assuming a 15% discount rate and using Blackstone’s most recent projections relating to the estimated timing of the benefit to be received. Future payments under the tax receivable agreements in respect of subsequent exchanges would be in addition to these amounts. The payments under the tax receivable agreements are not conditioned upon continued ownership of Blackstone equity interests by the pre-IPO owners and the others mentioned above.
Amounts related to the deferred tax asset resulting from the increase in tax basis from the exchange of Blackstone Holdings Partnership Units to Blackstone common units, the resulting remeasurement of net deferred tax assets at the Blackstone ownership percentage at the balance sheet date, the due to affiliates for the future payments resulting from the tax receivable agreements and resulting adjustment to partners’ capital are included as Acquisition of Ownership Interests from Non-Controlling Interest Holders in the Supplemental Disclosure of Non-Cash Investing and Financing Activities in the Consolidated Statements of Cash Flows.
Other
Blackstone does business with and on behalf of some of its Portfolio Companies; all such arrangements are on a negotiated basis.
Additionally, please see Note 18. “Commitments and Contingencies — Contingencies — Guarantees” for information regarding guarantees provided to a lending institution for certain loans held by employees.
211
Table of Contents
THE BLACKSTONE GROUP L.P.
Notes to Consolidated Financial Statements—Continued
(All Dollars Are in Thousands, Except Unit and Per Unit Data, Except Where Noted)
| 18. | COMMITMENTS AND CONTINGENCIES |
Commitments
Operating Leases
The Partnership leases office space under non-cancelable lease and sublease agreements, which expire on various dates through 2030. Occupancy lease agreements, in addition to base rentals, generally are subject to escalation provisions based on certain costs incurred by the landlord, and are recognized on a straight-line basis over the term of the lease agreement. Rent expense includes base contractual rent and variable costs such as building expenses, utilities, taxes and insurance. Rent expense for the years ended December 31, 2016, 2015 and 2014, was $97.2 million, $112.0 million and $97.2 million, respectively. At December 31, 2016 and 2015, the Partnership maintained irrevocable standby letters of credit and cash deposits as security for the leases of $11.4 million and $15.7 million, respectively. As of December 31, 2016, the aggregate minimum future payments, net of sublease income, required on the operating leases are as follows:
| 2017 |
$ | 73,571 | ||
| 2018 |
71,289 | |||
| 2019 |
67,443 | |||
| 2020 |
63,868 | |||
| 2021 |
75,001 | |||
| Thereafter |
414,051 | |||
|
|
|
|||
| Total |
$ | 765,223 | ||
|
|
|
Investment Commitments
Blackstone had $2.5 billion of investment commitments as of December 31, 2016 representing general partner capital funding commitments to the Blackstone Funds, limited partner capital funding to other funds and Blackstone principal investment commitments. The consolidated Blackstone Funds had signed investment commitments of $269.9 million as of December 31, 2016 which includes $107.4 million of signed investment commitments for portfolio company acquisitions in the process of closing.
Contingencies
Guarantees
Certain of Blackstone’s consolidated real estate funds guarantee payments to third parties in connection with the on-going business activities and/or acquisitions of their Portfolio Companies. There is no direct recourse to the Partnership to fulfill such obligations. To the extent that underlying funds are required to fulfill guarantee obligations, the Partnership’s invested capital in such funds is at risk. Total investments at risk in respect of guarantees extended by consolidated real estate funds was $3.1 million as of December 31, 2016.
The Blackstone Holdings Partnerships provided guarantees to a lending institution for certain loans held by employees either for investment in Blackstone Funds or for members’ capital contributions to Blackstone Group International Partners LLP. The amount guaranteed as of December 31, 2016 was $148.0 million.
Litigation
From time to time, Blackstone is named as a defendant in legal actions relating to transactions conducted in the ordinary course of business. Although there can be no assurance of the outcome of such legal actions, in the opinion of management, Blackstone does not have a potential liability related to any current legal proceeding or claim that would individually or in the aggregate materially affect its results of operations, financial position or cash flows.
212
Table of Contents
THE BLACKSTONE GROUP L.P.
Notes to Consolidated Financial Statements—Continued
(All Dollars Are in Thousands, Except Unit and Per Unit Data, Except Where Noted)
Contingent Obligations (Clawback)
Carried Interest is subject to clawback to the extent that the Carried Interest received to date with respect to a fund exceeds the amount due to Blackstone based on cumulative results of that fund. The actual clawback liability, however, generally does not become realized until the end of a fund’s life except for certain Blackstone real estate funds, multi-asset class investment funds and credit-focused funds, which may have an interim clawback liability.
For financial reporting purposes, when applicable, the general partners record a liability for potential clawback obligations to the limited partners of some of the carry funds due to changes in the unrealized value of a fund’s remaining investments and where the fund’s general partner has previously received Carried Interest distributions with respect to such fund’s realized investments.
The following table presents the clawback obligations by segment:
| December 31, | ||||||||||||||||||||||||
| 2016 | 2015 | |||||||||||||||||||||||
| Segment |
Blackstone Holdings |
Current and Former Personnel |
Total | Blackstone Holdings |
Current and Former Personnel |
Total | ||||||||||||||||||
| Credit |
$ | — | $ | — | $ | — | $ | 1,670 | $ | 1,686 | $ | 3,356 | ||||||||||||
|
|
|
|
|
|
|
|
|
|
|
|
|
|||||||||||||
For Private Equity, Real Estate, and certain Credit Funds, a portion of the carried interest paid to current and former Blackstone personnel is held in segregated accounts in the event of a cash clawback obligation. These segregated accounts are not included in the Consolidated Financial Statements of the Partnership, except to the extent a portion of the assets held in the segregated accounts may be allocated to a consolidated Blackstone fund of hedge funds. At December 31, 2016, $612.3 million was held in segregated accounts for the purpose of meeting any clawback obligations of current and former personnel if such payments are required.
In the Credit segment, payment of carried interest to the Partnership by the majority of the rescue lending, mezzanine and hedge fund strategies funds is substantially deferred under the terms of the partnership agreements. This deferral mitigates the need to hold funds in segregated accounts in the event of a cash clawback obligation.
If, at December 31, 2016, all of the investments held by our carry funds were deemed worthless, a possibility that management views as remote, the amount of Carried Interest subject to potential clawback would be $5.0 billion, on an after tax basis where applicable, of which Blackstone Holdings is potentially liable for $4.7 billion if current and former Blackstone personnel default on their share of the liability, a possibility that management also views as remote.
| 19. | EMPLOYEE BENEFIT PLANS |
The Partnership provides a 401(k) plan (the “Plan”) for eligible employees in the United States. For certain administrative employees who are eligible for participation in the Plan, the Partnership makes a non-elective contribution of 2% of such employee’s annual compensation up to a maximum of one thousand six hundred dollars regardless of whether the employee makes any elective contributions to the Plan. In addition, the Partnership will also contribute 50% of certain eligible employee’s contribution to the Plan with a maximum matching contribution of one thousand six hundred dollars. For the years ended December 31, 2016, 2015 and 2014, the Partnership incurred expenses of $2.1 million, $2.0 million and $1.9 million in connection with such Plan.
213
Table of Contents
THE BLACKSTONE GROUP L.P.
Notes to Consolidated Financial Statements—Continued
(All Dollars Are in Thousands, Except Unit and Per Unit Data, Except Where Noted)
The Partnership provides a defined contribution plan for eligible employees in the United Kingdom (“U.K. Plan”). All United Kingdom employees are eligible to contribute to the U.K. Plan after three months of qualifying service. The Partnership contributes a percentage of an employee’s annual salary, subject to United Kingdom statutory restrictions, on a monthly basis for administrative employees of the Partnership based upon the age of the employee. For the years ended December 31, 2016, 2015 and 2014, the Partnership incurred expenses of $0.6 million, $0.8 million and $0.7 million, respectively, in connection with the U.K. Plan.
| 20. | REGULATED ENTITIES |
The Partnership has a registered broker-dealer that is subject to the minimum net capital requirements of the United States Securities and Exchange Commission (“SEC”). This entity has continuously operated in excess of these requirements. The Partnership also has certain entities based in the United Kingdom, Hong Kong, Ireland, Australia, Singapore and Japan, which are subject to the capital requirements of the Financial Conduct Authority, the Hong Kong Securities & Future Commission, the Central Bank of Ireland, the Australian Securities and Investments Commission, the Monetary Authority of Singapore and the Japan Financial Services Agency, respectively. These entities have continuously operated in excess of their regulatory capital requirements.
Certain other U.S. and non-U.S. entities are subject to various investment adviser, commodity pool operator and trader regulations. This includes a number of U.S. entities that are registered as investment advisers with the SEC.
The regulatory capital requirements referred to above may restrict the Partnership’s ability to withdraw capital from its entities. At December 31, 2016, $35.7 million of net assets of consolidated entities may be restricted as to the payment of cash dividends and advances to the Partnership.
| 21. | SEGMENT REPORTING |
Blackstone transacts its primary business in the United States and substantially all of its revenues are generated domestically.
Blackstone conducts its alternative asset management businesses through four segments:
| • | Private Equity — Blackstone’s Private Equity segment primarily comprises its management of flagship corporate private equity funds, sector-focused corporate private equity funds, including energy-focused funds, a core private equity fund, an opportunistic investment platform, a secondary private equity fund of funds business, a multi-asset investment program for eligible high net worth investors and a capital markets services business. |
| • | Real Estate — Blackstone’s Real Estate segment primarily comprises its management of global, European focused and Asian focused opportunistic real estate funds, high yield real estate debt funds, liquid real estate debt funds, core+ real estate funds, a NYSE-listed REIT and a non-exchange traded REIT. |
| • | Hedge Fund Solutions — Blackstone’s Hedge Fund Solutions segment is comprised principally of Blackstone Alternative Asset Management (“BAAM”), which manages a broad range of commingled and customized hedge fund of fund solutions and also includes investment platforms that seed new hedge fund businesses, purchase minority ownership interests in more established hedge funds, invest in special situation opportunities, create alternative solutions in regulated structures and trade directly. |
| • | Credit — Blackstone’s Credit segment consists principally of GSO Capital Partners LP (“GSO”), which is organized into performing credit strategies (which include mezzanine lending funds, business |
214
Table of Contents
THE BLACKSTONE GROUP L.P.
Notes to Consolidated Financial Statements—Continued
(All Dollars Are in Thousands, Except Unit and Per Unit Data, Except Where Noted)
| development companies and other performing credit strategies), distressed strategies (which include hedge fund strategies, rescue lending funds and distressed energy strategies) and long only strategies (which consist of CLOs, closed end funds, commingled funds and separately managed accounts). |
These business segments are differentiated by their various sources of income. The Private Equity, Real Estate, Hedge Fund Solutions and Credit segments primarily earn their income from management fees and investment returns on assets under management.
Blackstone uses Economic Income (“EI”) as a key measure of value creation, a benchmark of its performance and in making resource deployment and compensation decisions across its four segments. EI represents segment net income before taxes excluding transaction-related charges. Transaction-related charges arise from Blackstone’s IPO and long-term retention programs outside of annual deferred compensation and other corporate actions, including acquisitions. Transaction-related charges include equity-based compensation charges, the amortization of intangible assets and contingent consideration associated with acquisitions. EI presents revenues and expenses on a basis that deconsolidates the investment funds Blackstone manages. Economic Net Income (“ENI”) represents EI adjusted to include current period taxes. Taxes represent the total tax provision calculated under GAAP adjusted to include only the current tax provision (benefit) calculated on Income (Loss) Before Provision for Taxes.
Senior management makes operating decisions and assesses the performance of each of Blackstone’s business segments based on financial and operating metrics and data that is presented without the consolidation of any of the Blackstone Funds that are consolidated into the Consolidated Financial Statements. Consequently, all segment data excludes the assets, liabilities and operating results related to the Blackstone Funds.
On October 1, 2015, Blackstone completed the spin-off of the operations that historically constituted Blackstone’s Financial Advisory segment, other than Blackstone’s capital markets services business. Blackstone’s capital markets services business was retained and was not part of the spin-off. These historical operations included various financial advisory services, including financial and strategic advisory, restructuring and reorganization advisory and fund placement services. As of October 1, 2015, Blackstone no longer reported a Financial Advisory segment. Results of the historical Financial Advisory segment are included herein for comparative purposes only. The results of Blackstone’s capital markets services business were reclassified from the Financial Advisory segment to the Private Equity segment. All prior periods have been recast to reflect this reclassification.
215
Table of Contents
THE BLACKSTONE GROUP L.P.
Notes to Consolidated Financial Statements—Continued
(All Dollars Are in Thousands, Except Unit and Per Unit Data, Except Where Noted)
The following tables present the financial data for Blackstone’s four segments as of December 31, 2016 and 2015 and for the years ended December 31, 2016, 2015 and 2014.
| December 31, 2016 and the Year Then Ended | ||||||||||||||||||||
| Private Equity |
Real Estate | Hedge Fund Solutions |
Credit | Total Segments |
||||||||||||||||
| Segment Revenues |
||||||||||||||||||||
| Management and Advisory Fees, Net Base Management Fees |
$ | 554,134 | $ | 795,161 | $ | 521,736 | $ | 526,748 | $ | 2,397,779 | ||||||||||
| Advisory Fees |
3,207 | — | — | — | 3,207 | |||||||||||||||
| Transaction and Other Fees, Net |
38,666 | 95,324 | 1,061 | 6,600 | 141,651 | |||||||||||||||
| Management Fee Offsets |
(34,810 | ) | (7,322 | ) | — | (37,512 | ) | (79,644 | ) | |||||||||||
|
|
|
|
|
|
|
|
|
|
|
|||||||||||
| Total Management and Advisory Fees, Net |
561,197 | 883,163 | 522,797 | 495,836 | 2,462,993 | |||||||||||||||
|
|
|
|
|
|
|
|
|
|
|
|||||||||||
| Performance Fees |
||||||||||||||||||||
| Realized |
||||||||||||||||||||
| Carried Interest |
245,268 | 1,203,484 | — | 26,163 | 1,474,915 | |||||||||||||||
| Incentive Fees |
— | 29,625 | 42,177 | 100,299 | 172,101 | |||||||||||||||
| Unrealized |
||||||||||||||||||||
| Carried Interest |
424,781 | (150,997 | ) | 504 | 206,953 | 481,241 | ||||||||||||||
| Incentive Fees |
— | 39,527 | 785 | 9,417 | 49,729 | |||||||||||||||
|
|
|
|
|
|
|
|
|
|
|
|||||||||||
| Total Performance Fees |
670,049 | 1,121,639 | 43,466 | 342,832 | 2,177,986 | |||||||||||||||
|
|
|
|
|
|
|
|
|
|
|
|||||||||||
| Investment Income (Loss) |
||||||||||||||||||||
| Realized |
73,377 | 122,712 | (7,224 | ) | 11,004 | 199,869 | ||||||||||||||
| Unrealized |
(4,843 | ) | (1,119 | ) | 15,462 | 10,921 | 20,421 | |||||||||||||
|
|
|
|
|
|
|
|
|
|
|
|||||||||||
| Total Investment Income |
68,534 | 121,593 | 8,238 | 21,925 | 220,290 | |||||||||||||||
| Interest and Dividend Revenue |
40,271 | 54,240 | 23,083 | 28,289 | 145,883 | |||||||||||||||
| Other |
20,458 | 16,523 | 8,157 | 9,574 | 54,712 | |||||||||||||||
|
|
|
|
|
|
|
|
|
|
|
|||||||||||
| Total Revenues |
1,360,509 | 2,197,158 | 605,741 | 898,456 | 5,061,864 | |||||||||||||||
|
|
|
|
|
|
|
|
|
|
|
|||||||||||
| Expenses |
||||||||||||||||||||
| Compensation and Benefits Compensation |
310,457 | 385,352 | 185,320 | 202,087 | 1,083,216 | |||||||||||||||
| Performance Fee Compensation |
||||||||||||||||||||
| Realized |
||||||||||||||||||||
| Carried Interest |
110,882 | 332,622 | — | 12,450 | 455,954 | |||||||||||||||
| Incentive Fees |
— | 12,085 | 19,397 | 46,614 | 78,096 | |||||||||||||||
| Unrealized |
||||||||||||||||||||
| Carried Interest |
163,937 | 44,775 | 181 | 103,945 | 312,838 | |||||||||||||||
| Incentive Fees |
— | 16,872 | 292 | 3,970 | 21,134 | |||||||||||||||
|
|
|
|
|
|
|
|
|
|
|
|||||||||||
| Total Compensation and Benefits |
585,276 | 791,706 | 205,190 | 369,066 | 1,951,238 | |||||||||||||||
| Other Operating Expenses |
196,433 | 203,962 | 108,636 | 120,311 | 629,342 | |||||||||||||||
|
|
|
|
|
|
|
|
|
|
|
|||||||||||
| Total Expenses |
781,709 | 995,668 | 313,826 | 489,377 | 2,580,580 | |||||||||||||||
|
|
|
|
|
|
|
|
|
|
|
|||||||||||
| Economic Income |
$ | 578,800 | $ | 1,201,490 | $ | 291,915 | $ | 409,079 | $ | 2,481,284 | ||||||||||
|
|
|
|
|
|
|
|
|
|
|
|||||||||||
| Segment Assets as of December 31, 2016 |
$ | 6,493,236 | $ | 7,643,123 | $ | 2,160,688 | $ | 2,905,081 | $ | 19,202,128 | ||||||||||
|
|
|
|
|
|
|
|
|
|
|
|||||||||||
216
Table of Contents
THE BLACKSTONE GROUP L.P.
Notes to Consolidated Financial Statements—Continued
(All Dollars Are in Thousands, Except Unit and Per Unit Data, Except Where Noted)
| December 31, 2015 and the Year Then Ended | ||||||||||||||||||||||||
| Private Equity |
Real Estate | Hedge Fund Solutions |
Credit | Financial Advisory |
Total Segments |
|||||||||||||||||||
| Segment Revenues |
||||||||||||||||||||||||
| Management and Advisory Fees, Net |
||||||||||||||||||||||||
| Base Management Fees |
$ | 502,640 | $ | 668,575 | $ | 524,386 | $ | 500,982 | $ | — | $ | 2,196,583 | ||||||||||||
| Advisory Fees |
10,561 | — | — | — | 297,570 | 308,131 | ||||||||||||||||||
| Transaction and Other Fees, Net |
36,258 | 110,577 | 317 | 6,371 | 162 | 153,685 | ||||||||||||||||||
| Management Fee Offsets |
(36,760 | ) | (26,840 | ) | 171 | (30,065 | ) | — | (93,494 | ) | ||||||||||||||
|
|
|
|
|
|
|
|
|
|
|
|
|
|||||||||||||
| Total Management and Advisory Fees, Net |
512,699 | 752,312 | 524,874 | 477,288 | 297,732 | 2,564,905 | ||||||||||||||||||
|
|
|
|
|
|
|
|
|
|
|
|
|
|||||||||||||
| Performance Fees |
||||||||||||||||||||||||
| Realized |
||||||||||||||||||||||||
| Carried Interest |
1,474,987 | 1,634,733 | — | 96,156 | — | 3,205,876 | ||||||||||||||||||
| Incentive Fees |
— | 17,153 | 68,197 | 109,396 | — | 194,746 | ||||||||||||||||||
| Unrealized |
||||||||||||||||||||||||
| Carried Interest |
(717,955 | ) | (680,542 | ) | 2,021 | (198,820 | ) | — | (1,595,296 | ) | ||||||||||||||
| Incentive Fees |
— | 20,802 | (8,084 | ) | (19,967 | ) | — | (7,249 | ) | |||||||||||||||
|
|
|
|
|
|
|
|
|
|
|
|
|
|||||||||||||
| Total Performance Fees |
757,032 | 992,146 | 62,134 | (13,235 | ) | — | 1,798,077 | |||||||||||||||||
|
|
|
|
|
|
|
|
|
|
|
|
|
|||||||||||||
| Investment Income (Loss) |
||||||||||||||||||||||||
| Realized |
189,649 | 235,582 | (12,741 | ) | 7,186 | (868 | ) | 418,808 | ||||||||||||||||
| Unrealized |
(116,338 | ) | (231,889 | ) | (1,435 | ) | (16,258 | ) | (39 | ) | (365,959 | ) | ||||||||||||
|
|
|
|
|
|
|
|
|
|
|
|
|
|||||||||||||
| Total Investment Income (Loss) |
73,311 | 3,693 | (14,176 | ) | (9,072 | ) | (907 | ) | 52,849 | |||||||||||||||
| Interest and Dividend Revenue |
33,218 | 43,990 | 17,274 | 24,599 | 12,520 | 131,601 | ||||||||||||||||||
| Other |
5,854 | (1,422 | ) | 200 | 5,171 | (1,303 | ) | 8,500 | ||||||||||||||||
|
|
|
|
|
|
|
|
|
|
|
|
|
|||||||||||||
| Total Revenues |
1,382,114 | 1,790,719 | 590,306 | 484,751 | 308,042 | 4,555,932 | ||||||||||||||||||
|
|
|
|
|
|
|
|
|
|
|
|
|
|||||||||||||
| Expenses |
||||||||||||||||||||||||
| Compensation and Benefits |
||||||||||||||||||||||||
| Compensation |
280,248 | 358,381 | 179,484 | 190,189 | 180,917 | 1,189,219 | ||||||||||||||||||
| Performance Fee Compensation |
||||||||||||||||||||||||
| Realized |
||||||||||||||||||||||||
| Carried Interest |
256,922 | 484,037 | — | 52,841 | — | 793,800 | ||||||||||||||||||
| Incentive Fees |
— | 8,678 | 27,155 | 50,113 | — | 85,946 | ||||||||||||||||||
| Unrealized |
||||||||||||||||||||||||
| Carried Interest |
(10,172 | ) | (196,347 | ) | 823 | (107,000 | ) | — | (312,696 | ) | ||||||||||||||
| Incentive Fees |
— | 8,817 | (2,912 | ) | (8,395 | ) | — | (2,490 | ) | |||||||||||||||
|
|
|
|
|
|
|
|
|
|
|
|
|
|||||||||||||
| Total Compensation and Benefits |
526,998 | 663,566 | 204,550 | 177,748 | 180,917 | 1,753,779 | ||||||||||||||||||
| Other Operating Expenses |
199,158 | 179,175 | 90,072 | 93,626 | 62,326 | 624,357 | ||||||||||||||||||
|
|
|
|
|
|
|
|
|
|
|
|
|
|||||||||||||
| Total Expenses |
726,156 | 842,741 | 294,622 | 271,374 | 243,243 | 2,378,136 | ||||||||||||||||||
|
|
|
|
|
|
|
|
|
|
|
|
|
|||||||||||||
| Economic Income |
$ | 655,958 | $ | 947,978 | $ | 295,684 | $ | 213,377 | $ | 64,799 | $ | 2,177,796 | ||||||||||||
|
|
|
|
|
|
|
|
|
|
|
|
|
|||||||||||||
| Segment Assets as of December 31, 2015 |
$ | 5,680,315 | $ | 7,456,507 | $ | 1,916,956 | $ | 2,725,585 | $ | — | $ | 17,779,363 | ||||||||||||
|
|
|
|
|
|
|
|
|
|
|
|
|
|||||||||||||
217
Table of Contents
THE BLACKSTONE GROUP L.P.
Notes to Consolidated Financial Statements—Continued
(All Dollars Are in Thousands, Except Unit and Per Unit Data, Except Where Noted)
| Year Ended December 31, 2014 | ||||||||||||||||||||||||
| Private Equity |
Real Estate | Hedge Fund Solutions |
Credit | Financial Advisory |
Total Segments |
|||||||||||||||||||
| Segment Revenues |
||||||||||||||||||||||||
| Management and Advisory Fees, Net |
||||||||||||||||||||||||
| Base Management Fees |
$ | 415,841 | $ | 628,502 | $ | 482,981 | $ | 460,205 | $ | — | $ | 1,987,529 | ||||||||||||
| Advisory Fees |
21,903 | — | — | — | 398,942 | 420,845 | ||||||||||||||||||
| Transaction and Other Fees, Net |
135,718 | 91,610 | 569 | 18,161 | 379 | 246,437 | ||||||||||||||||||
| Management Fee Offsets |
(19,146 | ) | (34,443 | ) | (5,014 | ) | (28,168 | ) | — | (86,771 | ) | |||||||||||||
|
|
|
|
|
|
|
|
|
|
|
|
|
|||||||||||||
| Total Management and Advisory Fees, Net |
554,316 | 685,669 | 478,536 | 450,198 | 399,321 | 2,568,040 | ||||||||||||||||||
|
|
|
|
|
|
|
|
|
|
|
|
|
|||||||||||||
| Performance Fees |
||||||||||||||||||||||||
| Realized |
||||||||||||||||||||||||
| Carried Interest |
754,402 | 1,487,762 | — | 208,432 | — | 2,450,596 | ||||||||||||||||||
| Incentive Fees |
— | 11,499 | 140,529 | 109,717 | — | 261,745 | ||||||||||||||||||
| Unrealized |
||||||||||||||||||||||||
| Carried Interest |
1,222,828 | 524,046 | — | (37,913 | ) | — | 1,708,961 | |||||||||||||||||
| Incentive Fees |
— | (5,521 | ) | (879 | ) | (23,025 | ) | — | (29,425 | ) | ||||||||||||||
|
|
|
|
|
|
|
|
|
|
|
|
|
|||||||||||||
| Total Performance Fees |
1,977,230 | 2,017,786 | 139,650 | 257,211 | — | 4,391,877 | ||||||||||||||||||
|
|
|
|
|
|
|
|
|
|
|
|
|
|||||||||||||
| Investment Income (Loss) |
||||||||||||||||||||||||
| Realized |
202,719 | 309,095 | 21,550 | 9,354 | 707 | 543,425 | ||||||||||||||||||
| Unrealized |
(23,914 | ) | (58,930 | ) | 5,132 | 5,055 | 860 | (71,797 | ) | |||||||||||||||
|
|
|
|
|
|
|
|
|
|
|
|
|
|||||||||||||
| Total Investment Income |
178,805 | 250,165 | 26,682 | 14,409 | 1,567 | 471,628 | ||||||||||||||||||
| Interest and Dividend Revenue |
21,993 | 30,197 | 11,114 | 23,040 | 10,000 | 96,344 | ||||||||||||||||||
| Other |
6,569 | 2,863 | 1,855 | (2,310 | ) | 428 | 9,405 | |||||||||||||||||
|
|
|
|
|
|
|
|
|
|
|
|
|
|||||||||||||
| Total Revenues |
2,738,913 | 2,986,680 | 657,837 | 742,548 | 411,316 | 7,537,294 | ||||||||||||||||||
|
|
|
|
|
|
|
|
|
|
|
|
|
|||||||||||||
| Expenses |
||||||||||||||||||||||||
| Compensation and Benefits |
||||||||||||||||||||||||
| Compensation |
280,499 | 326,317 | 131,658 | 188,200 | 226,837 | 1,153,511 | ||||||||||||||||||
| Performance Fee Compensation |
||||||||||||||||||||||||
| Realized |
||||||||||||||||||||||||
| Carried Interest |
266,393 | 432,996 | — | 116,254 | — | 815,643 | ||||||||||||||||||
| Incentive Fees |
— | 5,980 | 42,451 | 61,668 | — | 110,099 | ||||||||||||||||||
| Unrealized |
||||||||||||||||||||||||
| Carried Interest |
210,446 | 197,174 | — | (28,583 | ) | — | 379,037 | |||||||||||||||||
| Incentive Fees |
— | (2,751 | ) | (273 | ) | (16,252 | ) | — | (19,276 | ) | ||||||||||||||
|
|
|
|
|
|
|
|
|
|
|
|
|
|||||||||||||
| Total Compensation and Benefits |
757,338 | 959,716 | 173,836 | 321,287 | 226,837 | 2,439,014 | ||||||||||||||||||
| Other Operating Expenses |
143,562 | 146,083 | 86,129 | 90,524 | 87,484 | 553,782 | ||||||||||||||||||
|
|
|
|
|
|
|
|
|
|
|
|
|
|||||||||||||
| Total Expenses |
900,900 | 1,105,799 | 259,965 | 411,811 | 314,321 | 2,992,796 | ||||||||||||||||||
|
|
|
|
|
|
|
|
|
|
|
|
|
|||||||||||||
| Economic Income |
$ | 1,838,013 | $ | 1,880,881 | $ | 397,872 | $ | 330,737 | $ | 96,995 | $ | 4,544,498 | ||||||||||||
|
|
|
|
|
|
|
|
|
|
|
|
|
|||||||||||||
218
Table of Contents
THE BLACKSTONE GROUP L.P.
Notes to Consolidated Financial Statements—Continued
(All Dollars Are in Thousands, Except Unit and Per Unit Data, Except Where Noted)
The following tables reconcile the Total Segments to Blackstone’s Income Before Provision for Taxes for the years ended December 31, 2016, 2015 and 2014 along with Total Assets as of December 31, 2016 and 2015:
| December 31, 2016 and the Year Then Ended | ||||||||||||
| Total Segments |
Consolidation Adjustments and Reconciling Items |
Blackstone Consolidated |
||||||||||
| Revenues |
$ | 5,061,864 | $ | 63,970 | (a) | $ | 5,125,834 | |||||
| Expenses |
$ | 2,580,580 | $ | 347,994 | (b) | $ | 2,928,574 | |||||
| Other Income |
$ | — | $ | 184,750 | (c) | $ | 184,750 | |||||
| Economic Income |
$ | 2,481,284 | $ | (99,274 | )(d) | $ | 2,382,010 | |||||
| Total Assets |
$ | 19,202,128 | $ | 7,201,209 | (e) | $ | 26,403,337 | |||||
| December 31, 2015 and the Year Then Ended | ||||||||||||
| Total Segments |
Consolidation Adjustments and Reconciling Items |
Blackstone Consolidated |
||||||||||
| Revenues |
$ | 4,555,932 | $ | 90,620 | (a) | $ | 4,646,552 | |||||
| Expenses |
$ | 2,378,136 | $ | 712,739 | (b) | $ | 3,090,875 | |||||
| Other Income |
$ | — | $ | 259,071 | (c) | $ | 259,071 | |||||
| Economic Income |
$ | 2,177,796 | $ | (363,048 | )(d) | $ | 1,814,748 | |||||
| Total Assets |
$ | 17,779,363 | $ | 4,746,717 | (e) | $ | 22,526,080 | |||||
| Year Ended December 31, 2014 | ||||||||||||
| Total Segments |
Consolidation Adjustments and Reconciling Items |
Blackstone Consolidated |
||||||||||
| Revenues |
$ | 7,537,294 | $ | (52,566 | )(a) | $ | 7,484,728 | |||||
| Expenses |
$ | 2,992,796 | $ | 863,060 | (b) | $ | 3,855,856 | |||||
| Other Income |
$ | — | $ | 357,854 | (c) | $ | 357,854 | |||||
| Economic Income |
$ | 4,544,498 | $ | (557,772 | )(d) | $ | 3,986,726 | |||||
| (a) | The Revenues adjustment represents management and performance fees earned from Blackstone Funds that were eliminated in consolidation to arrive at Blackstone consolidated revenues, non-segment related Investment Income (Loss), which is included in Blackstone consolidated revenues and the elimination of inter-segment interest income. |
| (b) | The Expenses adjustment represents the addition of expenses of the consolidated Blackstone Funds to the Blackstone unconsolidated expenses, amortization of intangibles, expenses related to transaction-related equity-based compensation and the elimination of inter-segment interest expense to arrive at Blackstone consolidated expenses. |
219
Table of Contents
THE BLACKSTONE GROUP L.P.
Notes to Consolidated Financial Statements—Continued
(All Dollars Are in Thousands, Except Unit and Per Unit Data, Except Where Noted)
| (c) | The Other Income adjustment results from the following: |
| Year Ended December 31, | ||||||||||||
| 2016 | 2015 | 2014 | ||||||||||
| Fund Management Fees and Performance Fees Eliminated in Consolidation and Transactional Investment Income (Loss) |
$ | (65,849 | ) | $ | (100,657 | ) | $ | 52,219 | ||||
| Fund Expenses Added in Consolidation |
7,329 | 48,239 | 19,169 | |||||||||
| Income Associated with Non-Controlling Interests of Consolidated Entities |
250,129 | 231,045 | 409,864 | |||||||||
| Transaction-Related Other Income (Loss) |
(6,859 | ) | 80,444 | (123,398 | ) | |||||||
|
|
|
|
|
|
|
|||||||
| Total Consolidation Adjustments and Reconciling Items |
$ | 184,750 | $ | 259,071 | $ | 357,854 | ||||||
|
|
|
|
|
|
|
|||||||
| (d) | The reconciliation of Economic Income to Income Before Provision for Taxes as reported in the Consolidated Statements of Operations consists of the following: |
| Year Ended December 31, | ||||||||||||
| 2016 | 2015 | 2014 | ||||||||||
| Economic Income |
$ | 2,481,284 | $ | 2,177,796 | $ | 4,544,498 | ||||||
|
|
|
|
|
|
|
|||||||
| Adjustments |
||||||||||||
| Amortization of Intangibles |
(84,466 | ) | (104,530 | ) | (111,254 | ) | ||||||
| Transaction-Related Charges |
(264,937 | ) | (489,563 | ) | (856,382 | ) | ||||||
| Income Associated with Non-Controlling Interests of Consolidated Entities |
250,129 | 231,045 | 409,864 | |||||||||
|
|
|
|
|
|
|
|||||||
| Total Consolidation Adjustments and Reconciling Items |
(99,274 | ) | (363,048 | ) | (557,772 | ) | ||||||
|
|
|
|
|
|
|
|||||||
| Income Before Provision for Taxes |
$ | 2,382,010 | $ | 1,814,748 | $ | 3,986,726 | ||||||
|
|
|
|
|
|
|
|||||||
| (e) | The Total Assets adjustment represents the addition of assets of the consolidated Blackstone Funds to the Blackstone unconsolidated assets to arrive at Blackstone consolidated assets. |
| 22. | SUBSEQUENT EVENTS |
There have been no events since December 31, 2016 that require recognition or disclosure in the Consolidated Financial Statements.
220
Table of Contents
THE BLACKSTONE GROUP L.P.
Notes to Consolidated Financial Statements—Continued
(All Dollars Are in Thousands, Except Unit and Per Unit Data, Except Where Noted)
| 23. | QUARTERLY FINANCIAL DATA (UNAUDITED) |
| Three Months Ended | ||||||||||||||||
| March 31, 2016 (b) |
June 30, 2016 |
September 30, 2016 |
December 31, 2016 |
|||||||||||||
| Revenues |
$ | 932,354 | $ | 1,192,426 | $ | 1,431,685 | $ | 1,569,369 | ||||||||
| Expenses |
617,710 | 712,603 | 773,777 | 824,484 | ||||||||||||
| Other Income |
19,142 | 30,703 | 61,395 | 73,510 | ||||||||||||
|
|
|
|
|
|
|
|
|
|||||||||
| Income Before Provision for Taxes |
$ | 333,786 | $ | 510,526 | $ | 719,303 | $ | 818,395 | ||||||||
|
|
|
|
|
|
|
|
|
|||||||||
| Net Income |
$ | 324,640 | $ | 463,111 | $ | 691,589 | $ | 770,308 | ||||||||
|
|
|
|
|
|
|
|
|
|||||||||
| Net Income Attributable to The Blackstone Group L.P. |
$ | 159,753 | $ | 198,626 | $ | 312,905 | $ | 367,951 | ||||||||
|
|
|
|
|
|
|
|
|
|||||||||
| Net Income Per Common Unit |
||||||||||||||||
| Common Units, Basic |
$ | 0.23 | $ | 0.31 | $ | 0.48 | $ | 0.56 | ||||||||
|
|
|
|
|
|
|
|
|
|||||||||
| Common Units, Diluted |
$ | 0.23 | $ | 0.30 | $ | 0.47 | $ | 0.55 | ||||||||
|
|
|
|
|
|
|
|
|
|||||||||
| Distributions Declared (a) |
$ | 0.61 | $ | 0.28 | $ | 0.36 | $ | 0.41 | ||||||||
|
|
|
|
|
|
|
|
|
|||||||||
| Three Months Ended | ||||||||||||||||
| March 31, 2015 (c) |
June 30, 2015 |
September 30, 2015 |
December 31, 2015 |
|||||||||||||
| Revenues |
$ | 2,512,358 | $ | 1,225,202 | $ | 11,573 | $ | 897,419 | ||||||||
| Expenses |
1,142,568 | 914,432 | 476,997 | 556,878 | ||||||||||||
| Other Income (Loss) |
93,555 | 82,015 | (16,867 | ) | 100,368 | |||||||||||
|
|
|
|
|
|
|
|
|
|||||||||
| Income (Loss) Before Provision for Taxes |
$ | 1,463,345 | $ | 392,785 | $ | (482,291 | ) | $ | 440,909 | |||||||
|
|
|
|
|
|
|
|
|
|||||||||
| Net Income (Loss) |
$ | 1,364,001 | $ | 349,534 | $ | (483,864 | ) | $ | 394,679 | |||||||
|
|
|
|
|
|
|
|
|
|||||||||
| Net Income (Loss) Attributable to The Blackstone Group L.P. |
$ | 629,448 | $ | 134,168 | $ | (254,697 | ) | $ | 200,870 | |||||||
|
|
|
|
|
|
|
|
|
|||||||||
| Net Income (Loss) Per Common Unit |
||||||||||||||||
| Common Units, Basic |
$ | 1.01 | $ | 0.21 | $ | (0.40 | ) | $ | 0.31 | |||||||
|
|
|
|
|
|
|
|
|
|||||||||
| Common Units, Diluted |
$ | 1.00 | $ | 0.21 | $ | (0.40 | ) | $ | 0.23 | |||||||
|
|
|
|
|
|
|
|
|
|||||||||
| Distributions Declared (a) |
$ | 0.78 | $ | 0.89 | $ | 0.74 | $ | 0.49 | ||||||||
|
|
|
|
|
|
|
|
|
|||||||||
| (a) | Distributions declared reflects the calendar date of the declaration of each distribution. |
| (b) | Blackstone adopted new GAAP stock compensation guidance for the quarter ended June 30, 2016 and applied a modified retrospective approach as of January 1, 2016. Adoption changed Provision for Taxes, Net Income, Net Income Attributable to The Blackstone Group L.P. and the number of GAAP Weighted Average Units Outstanding—Diluted for the quarter ended March 31, 2016. Such amounts have been recast here from the amounts originally reported for the quarter ended March 31, 2016. |
| (c) | Blackstone adopted new GAAP consolidation guidance for the quarter ended June 30, 2015 and applied a modified retrospective approach as of January 1, 2015. Adoption did not change Net Income Attributable to The Blackstone Group L.P. for the quarter ended March 31, 2015, but did change Revenues, Expenses, Other Income (Loss), Income (Loss) Before Provision for Taxes and Net Income (Loss). Such amounts have been recast here from the amounts originally reported for the quarter ended March 31, 2015. |
221
Table of Contents
| ITEM 8A. | UNAUDITED SUPPLEMENTAL PRESENTATION OF STATEMENTS OF FINANCIAL CONDITION |
THE BLACKSTONE GROUP L.P.
Unaudited Consolidating Statements of Financial Condition
(Dollars in Thousands)
| December 31, 2016 | ||||||||||||||||
| Consolidated Operating Partnerships |
Consolidated Blackstone Funds (a) |
Reclasses and Eliminations |
Consolidated | |||||||||||||
| Assets |
||||||||||||||||
| Cash and Cash Equivalents |
$ | 1,837,253 | $ | — | $ | — | $ | 1,837,253 | ||||||||
| Cash Held by Blackstone Funds and Other |
261,909 | 743,252 | — | 1,005,161 | ||||||||||||
| Investments |
11,618,729 | 6,474,168 | (397,922 | ) | 17,694,975 | |||||||||||
| Accounts Receivable |
404,843 | 367,852 | — | 772,695 | ||||||||||||
| Reverse Repurchase Agreements |
118,495 | — | — | 118,495 | ||||||||||||
| Due from Affiliates |
1,433,612 | 27,473 | (18,707 | ) | 1,442,378 | |||||||||||
| Intangible Assets, Net |
262,604 | — | — | 262,604 | ||||||||||||
| Goodwill |
1,718,519 | — | — | 1,718,519 | ||||||||||||
| Other Assets |
259,695 | 5,093 | — | 264,788 | ||||||||||||
| Deferred Tax Assets |
1,286,469 | — | — | 1,286,469 | ||||||||||||
|
|
|
|
|
|
|
|
|
|||||||||
| Total Assets |
$ | 19,202,128 | $ | 7,617,838 | $ | (416,629 | ) | $ | 26,403,337 | |||||||
|
|
|
|
|
|
|
|
|
|||||||||
| Liabilities and Partners’ Capital |
||||||||||||||||
| Loans Payable |
$ | 3,399,922 | $ | 5,466,444 | $ | — | $ | 8,866,366 | ||||||||
| Due to Affiliates |
1,253,791 | 86,688 | (18,707 | ) | 1,321,772 | |||||||||||
| Accrued Compensation and Benefits |
2,327,762 | — | — | 2,327,762 | ||||||||||||
| Securities Sold, Not Yet Purchased |
127,710 | 87,688 | — | 215,398 | ||||||||||||
| Repurchase Agreements |
7,034 | 68,290 | — | 75,324 | ||||||||||||
| Accounts Payable, Accrued Expenses and Other Liabilities |
533,101 | 548,681 | — | 1,081,782 | ||||||||||||
|
|
|
|
|
|
|
|
|
|||||||||
| Total Liabilities |
7,649,320 | 6,257,791 | (18,707 | ) | 13,888,404 | |||||||||||
|
|
|
|
|
|
|
|
|
|||||||||
| Redeemable Non-Controlling Interests in Consolidated Entities |
— | 185,390 | — | 185,390 | ||||||||||||
|
|
|
|
|
|
|
|
|
|||||||||
| Partners’ Capital |
||||||||||||||||
| Partners’ Capital |
6,524,607 | 398,001 | (398,679 | ) | 6,523,929 | |||||||||||
| Accumulated Other Comprehensive Income |
(63,644 | ) | — | 757 | (62,887 | ) | ||||||||||
| Non-Controlling Interests in Consolidated Entities |
1,652,308 | 776,656 | — | 2,428,964 | ||||||||||||
| Non-Controlling Interests in Blackstone Holdings |
3,439,537 | — | — | 3,439,537 | ||||||||||||
|
|
|
|
|
|
|
|
|
|||||||||
| Total Partners’ Capital |
11,552,808 | 1,174,657 | (397,922 | ) | 12,329,543 | |||||||||||
|
|
|
|
|
|
|
|
|
|||||||||
| Total Liabilities and Partners’ Capital |
$ | 19,202,128 | $ | 7,617,838 | $ | (416,629 | ) | $ | 26,403,337 | |||||||
|
|
|
|
|
|
|
|
|
|||||||||
222
Table of Contents
THE BLACKSTONE GROUP L.P.
Unaudited Consolidating Statements of Financial Condition
(Dollars in Thousands)
| December 31, 2015 | ||||||||||||||||
| Consolidated Operating Partnerships |
Consolidated Blackstone Funds (a) |
Reclasses and Eliminations |
Consolidated | |||||||||||||
| Assets |
||||||||||||||||
| Cash and Cash Equivalents |
$ | 1,837,324 | $ | — | $ | — | $ | 1,837,324 | ||||||||
| Cash Held by Blackstone Funds and Other |
148,660 | 438,472 | — | 587,132 | ||||||||||||
| Investments |
10,186,419 | 4,591,465 | (453,787 | ) | 14,324,097 | |||||||||||
| Accounts Receivable |
461,610 | 151,543 | — | 613,153 | ||||||||||||
| Reverse Repurchase Agreements |
204,893 | — | — | 204,893 | ||||||||||||
| Due from Affiliates |
1,224,692 | 25,722 | (9,617 | ) | 1,240,797 | |||||||||||
| Intangible Assets, Net |
345,547 | — | — | 345,547 | ||||||||||||
| Goodwill |
1,718,519 | — | — | 1,718,519 | ||||||||||||
| Other Assets |
374,270 | 2,919 | — | 377,189 | ||||||||||||
| Deferred Tax Assets |
1,277,429 | — | — | 1,277,429 | ||||||||||||
|
|
|
|
|
|
|
|
|
|||||||||
| Total Assets |
$ | 17,779,363 | $ | 5,210,121 | $ | (463,404 | ) | $ | 22,526,080 | |||||||
|
|
|
|
|
|
|
|
|
|||||||||
| Liabilities and Partners’ Capital |
||||||||||||||||
| Loans Payable |
$ | 2,797,060 | $ | 3,319,687 | $ | — | $ | 6,116,747 | ||||||||
| Due to Affiliates |
1,244,748 | 50,892 | (12,940 | ) | 1,282,700 | |||||||||||
| Accrued Compensation and Benefits |
2,029,900 | 18 | — | 2,029,918 | ||||||||||||
| Securities Sold, Not Yet Purchased |
99,392 | 77,275 | — | 176,667 | ||||||||||||
| Repurchase Agreements |
970 | 39,959 | — | 40,929 | ||||||||||||
| Accounts Payable, Accrued Expenses and Other Liabilities |
422,905 | 225,757 | — | 648,662 | ||||||||||||
|
|
|
|
|
|
|
|
|
|||||||||
| Total Liabilities |
6,594,975 | 3,713,588 | (12,940 | ) | 10,295,623 | |||||||||||
|
|
|
|
|
|
|
|
|
|||||||||
| Redeemable Non-Controlling Interests in Consolidated Entities |
— | 183,459 | — | 183,459 | ||||||||||||
|
|
|
|
|
|
|
|
|
|||||||||
| Partners’ Capital |
||||||||||||||||
| Partners’ Capital |
6,323,025 | 450,417 | (451,135 | ) | 6,322,307 | |||||||||||
| Accumulated Other Comprehensive Income |
(53,190 | ) | — | 671 | (52,519 | ) | ||||||||||
| Non-Controlling Interests in Consolidated Entities |
1,546,044 | 862,657 | — | 2,408,701 | ||||||||||||
| Non-Controlling Interests in Blackstone Holdings |
3,368,509 | — | — | 3,368,509 | ||||||||||||
|
|
|
|
|
|
|
|
|
|||||||||
| Total Partners’ Capital |
11,184,388 | 1,313,074 | (450,464 | ) | 12,046,998 | |||||||||||
|
|
|
|
|
|
|
|
|
|||||||||
| Total Liabilities and Partners’ Capital |
$ | 17,779,363 | $ | 5,210,121 | $ | (463,404 | ) | $ | 22,526,080 | |||||||
|
|
|
|
|
|
|
|
|
|||||||||
| (a) | The Consolidated Blackstone Funds consisted of the following: |
Blackstone Real Estate Partners VI.C — ESH L.P.
Blackstone Real Estate Special Situations Fund L.P.
Blackstone Real Estate Special Situations Offshore Fund Ltd.
Blackstone Strategic Alliance Fund L.P.
Blackstone/GSO Loan Financing Limited
BSSF I AIV L.P.
BTD CP Holdings, LP
GSO Legacy Associates II LLC
GSO Legacy Associates LLC
223
Table of Contents
Private equity side-by-side investment vehicles
Real estate side-by-side investment vehicles
Mezzanine side-by-side investment vehicles
Collateralized loan obligation vehicles
| ITEM 9. | CHANGES IN AND DISAGREEMENTS WITH ACCOUNTANTS ON ACCOUNTING AND FINANCIAL DISCLOSURE |
None.
| ITEM 9A. | CONTROLS AND PROCEDURES |
We maintain “disclosure controls and procedures,” as such term is defined in Rules 13a-15(e) and 15d-15(e) under the Securities Exchange Act of 1934 (the “Exchange Act”), that are designed to ensure that information required to be disclosed by us in reports that we file or submit under the Exchange Act is recorded, processed, summarized and reported within the time periods specified in Securities and Exchange Commission rules and forms, and that such information is accumulated and communicated to our management, including our Chief Executive Officer and Chief Financial Officer, as appropriate, to allow timely decisions regarding required disclosure. In designing disclosure controls and procedures, our management necessarily was required to apply its judgment in evaluating the cost-benefit relationship of possible disclosure controls and procedures. The design of any disclosure controls and procedures also is based in part upon certain assumptions about the likelihood of future events, and there can be no assurance that any design will succeed in achieving its stated goals under all potential future conditions. Any controls and procedures, no matter how well designed and operated, can provide only reasonable assurance of achieving the desired objectives.
Our management, including our Chief Executive Officer and Chief Financial Officer, evaluated the effectiveness of our disclosure controls and procedures pursuant to Rule 13a-15 under the Exchange Act as of the end of the period covered by this report. Based on that evaluation, our Chief Executive Officer and Chief Financial Officer have concluded that, as of the end of the period covered by this report, our disclosure controls and procedures (as defined in Rule 13a-15(e) under the Exchange Act) are effective at the reasonable assurance level to accomplish their objectives of ensuring that information we are required to disclose in reports that we file or submit under the Exchange Act is recorded, processed, summarized and reported within the time periods specified in Securities and Exchange Commission rules and forms, and that such information is accumulated and communicated to our management, including our Chief Executive Officer and Chief Financial Officer, as appropriate, to allow timely decisions regarding required disclosure.
No changes in our internal control over financial reporting (as such term is defined in Rules 13a — 15(f) and 15d — 15(f) under the Securities Exchange Act) occurred during our most recent quarter, that has materially affected, or is reasonably likely to materially affect, our internal control over financial reporting.
Management’s Report on Internal Control Over Financial Reporting
Management of The Blackstone Group L.P. and subsidiaries (“Blackstone”) is responsible for establishing and maintaining adequate internal control over financial reporting. Blackstone’s internal control over financial reporting is a process designed under the supervision of its principal executive and principal financial officers to provide reasonable assurance regarding the reliability of financial reporting and the preparation of its consolidated financial statements for external reporting purposes in accordance with accounting principles generally accepted in the United States of America.
Blackstone’s internal control over financial reporting includes policies and procedures that pertain to the maintenance of records that, in reasonable detail, accurately and fairly reflect transactions and dispositions of assets; provide reasonable assurances that transactions are recorded as necessary to permit preparation of financial
224
Table of Contents
statements in accordance with generally accepted accounting principles, and that receipts and expenditures are being made only in accordance with authorizations of management and the directors; and provide reasonable assurance regarding prevention or timely detection of unauthorized acquisition, use or disposition of Blackstone’s assets that could have a material effect on its financial statements.
Because of its inherent limitations, internal control over financial reporting may not prevent or detect misstatements. In addition, projections of any evaluation of effectiveness to future periods are subject to the risk that controls may become inadequate because of changes in conditions or that the degree of compliance with the policies or procedures may deteriorate.
Management conducted an assessment of the effectiveness of Blackstone’s internal control over financial reporting as of December 31, 2016 based on the framework established in Internal Control — Integrated Framework (2013) issued by the Committee of Sponsoring Organizations of the Treadway Commission. Based on this assessment, management has determined that Blackstone’s internal control over financial reporting as of December 31, 2016 was effective.
Deloitte & Touche LLP, an independent registered public accounting firm, has audited Blackstone’s financial statements included in this report on Form 10-K and issued its report on the effectiveness of Blackstone’s internal control over financial reporting as of December 31, 2016, which is included herein.
| ITEM 9B. | OTHER INFORMATION |
Section 13(r) Disclosure
Pursuant to Section 219 of the Iran Threat Reduction and Syria Human Rights Act of 2012, which added Section 13(r) of the Exchange Act, Blackstone hereby incorporates by reference herein (i) Exhibit 99.1 of our Quarterly Report on Form 10-Q filed on May 5, 2016, which includes disclosures publicly filed and/or provided to us by Travelport Limited, which may have been at the time of such disclosures considered our affiliate, and NCR Corporation, which may be considered our affiliate and (ii) Exhibit 99.1 of our Quarterly Report on Form 10-Q filed on August 4, 2016, which includes disclosures publicly filed and/or provided to us by NCR Corporation, which may be considered our affiliate.
225
Table of Contents
PART III.
| ITEM 10. | DIRECTORS, EXECUTIVE OFFICERS AND CORPORATE GOVERNANCE |
Directors and Executive Officers of Blackstone Group Management L.L.C.
The directors and executive officers of Blackstone Group Management L.L.C. as of the date of this filing, are:
| Name |
Age |
Position | ||||
| Stephen A. Schwarzman |
70 | Founder, Chairman and Chief Executive Officer and Director | ||||
| Hamilton E. James |
66 | President, Chief Operating Officer and Director | ||||
| J. Tomilson Hill |
68 | Vice Chairman and Director | ||||
| Bennett J. Goodman |
59 | Co-Founder of GSO Capital Partners and Director | ||||
| Jonathan D. Gray |
47 | Global Head of Real Estate and Director | ||||
| Michael S. Chae |
48 | Chief Financial Officer | ||||
| John G. Finley |
60 | Chief Legal Officer | ||||
| Joan Solotar |
52 | Senior Managing Director — Head of Private Wealth Solutions and External Relations | ||||
| James W. Breyer |
55 | Director | ||||
| Peter T. Grauer |
71 | Director | ||||
| Richard H. Jenrette |
87 | Director | ||||
| Rochelle B. Lazarus |
69 | Director | ||||
| Jay O. Light |
75 | Director | ||||
| The Right Honorable Brian Mulroney |
77 | Director | ||||
| William G. Parrett |
71 | Director | ||||
Stephen A. Schwarzman is the Chairman and Chief Executive Officer of Blackstone and the Chairman of the board of directors of our general partner. Mr. Schwarzman was elected Chairman of the board of directors of our general partner effective March 20, 2007. He also sits on the firm’s Management Committee. Mr. Schwarzman is a founder of Blackstone and has been involved in all phases of the firm’s development since its founding in 1985. Mr. Schwarzman began his career at Lehman Brothers, where he was elected Managing Director in 1978. He was engaged principally in the firm’s mergers and acquisitions business from 1977 to 1984, and served as Chairman of the firm’s Mergers & Acquisitions Committee in 1983 and 1984. Mr. Schwarzman is an active philanthropist with a history of supporting education and schools. Whether in business or in philanthropy, he has always attempted to tackle big problems and find transformative solutions. In 2015, Mr. Schwarzman donated $150 million to Yale University to establish the Schwarzman Center, a first-of-its-kind campus center in Yale’s historic “Commons” building. In 2013, he founded an international scholarship program, “Schwarzman Scholars,” at Tsinghua University in Beijing to educate future leaders about China. At $450 million, the program is modeled on the Rhodes Scholarship and is the single largest philanthropic effort in China’s history coming largely from international donors. Mr. Schwarzman currently maintains his position as Co-Chair of the Board of Trustees of Schwarzman Scholars. In 2007, Mr. Schwarzman donated $100 million to the New York Public Library on whose board he serves. Mr. Schwarzman is a member of The Council on Foreign Relations, The Business Council, The Business Roundtable, and The International Business Council of the World Economic Forum. He is co-chair of the Partnership for New York City and serves on the boards of The Asia Society and New York Presbyterian Hospital, as well as on The Advisory Board of the School of Economics and Management at Tsinghua University, Beijing. He is a Trustee of The Frick Collection in New York City and Chairman Emeritus of the Board of Directors of The John F. Kennedy Center for the Performing Arts. In 2007, Mr. Schwarzman was included in TIME’s “100 Most Influential People.” Mr. Schwarzman was awarded the Légion d’Honneur of France in 2007 and promoted to Officier in 2010. In 2016, he topped Forbes Magazine’s list of the most influential people in finance. He is also Chairman of the President’s Strategic and Policy Forum, which is charged with providing direct input to the President of the United States from business leaders through a non-partisan, non-bureaucratic exchange of ideas. Mr. Schwarzman holds a BA from Yale University and an MBA from Harvard Business School. He has served as an adjunct professor at the Yale School of Management and on the Harvard Business School Board of Dean’s Advisors.
226
Table of Contents
Hamilton E. James is President and Chief Operating Officer of Blackstone and a member of the board of directors of our general partner. Mr. James was elected to the board of directors of our general partner effective March 20, 2007. He is also a member of Blackstone’s Management Committee. Prior to joining Blackstone in 2002, Mr. James was Chairman of Global Investment Banking and Private Equity at Credit Suisse First Boston and a member of its executive board. Prior to the acquisition of Donaldson, Lufkin & Jenrette, Inc. (“DLJ”) by Credit Suisse First Boston in 2000, Mr. James was the Chairman of DLJ’s Banking Group, responsible for all the firm’s investment banking and merchant banking activities. Mr. James joined DLJ in 1975 as an Investment Banking associate. He became head of DLJ’s global mergers and acquisitions group in 1982, founded DLJ Merchant Banking, Inc. in 1985, and was named Chairman of the Banking Group in 1995. Mr. James is a director of Costco Wholesale Corporation and has served on a number of other corporate boards. Mr. James is a Commissioner of The Port Authority of New York and New Jersey, a Trustee of The Metropolitan Museum of Art, member of The Boards of Trustees of Mount Sinai Health System, member of The Center for American Progress Board of Trustees, Vice Chairman of Trout Unlimited’s Coldwater Conservations Fund, Trustee of Woods Hole Oceanographic Institution, Trustee of the Wildlife Conservation Society, Advisory Board Member of The Montana Land Reliance and Chairman Emeritus of the Board of Trustees of American Ballet Theatre. He is also a former member of the President’s Export Council — Subcommittee on Technology & Competitiveness. In 2016, Mr. James co-authored Rescuing Retirement, a book proposing a solution to America’s looming retirement crisis. Mr. James received a BA from Harvard College and an MBA from Harvard Business School.
J. Tomilson Hill is President and Chief Executive Officer of the Hedge Fund Solutions group, Vice Chairman of Blackstone and a member of the board of directors of our general partner. Mr. Hill was elected to the board of directors of our general partner effective March 20, 2007. He also sits on the firm’s Management Committee. Mr. Hill previously served as Co-Head of the Corporate and Mergers and Acquisitions Advisory group before assuming his role as Chief Executive Officer of BAAM. In his current capacity, Mr. Hill is responsible for overseeing the day-to-day activities of the group, including investment management, client relationships, product development, marketing, operations and administration. He is a member of the board of directors of Patria Investment Limited. Before joining Blackstone in 1993, Mr. Hill began his career at First Boston, later becoming one of the Co-Founders of its Mergers & Acquisitions Department. After running the Mergers & Acquisitions Department at Smith Barney, he joined Lehman Brothers as a partner in 1982, serving as Co-Head and subsequently Head of Investment Banking. Later, he served as Co-Chief Executive Officer of Lehman Brothers and Co-President and Co-COO of Shearson Lehman Brothers Holding Inc. Mr. Hill is a graduate of Harvard College and the Harvard Business School. He is a member of the Council on Foreign Relations where he is Chairman Emeritus of the Investment Committee and serves on the Council’s board of directors, and is a member of the board of directors of Lincoln Center Theater, where he is Chairman Emeritus. He is Chairman Emeritus of the Hirshhorn Museum and Sculpture Garden in Washington, D.C. He currently serves on the board of The Metropolitan Museum of Art, the Telluride Foundation, the Advantage Testing Foundation, the Friends of the High Line, and of Our Lady Queen of Angels School, a parochial school (K-8th grade) in Spanish Harlem. He is a member of the Advisory Board of Christie’s and a member of the board of directors of First Eagle Investment Management, Hamilton Insurance Group, Limited and Advantage Testing, Inc.
Bennett J. Goodman is a Co-Founder of GSO and a member of the board of directors of our general partner. Mr. Goodman was elected to the board of directors of our general partner effective February 24, 2015. He also sits on the firm’s Management Committee. Since joining Blackstone in 2008, Mr. Goodman has focused on the management of GSO, which is Blackstone’s credit investment platform with over $93 billion of assets under management in various direct lending strategies, leveraged loan vehicles and distressed investment funds. Before co-founding GSO in 2005, Mr. Goodman was the Managing Partner of the Alternative Capital Division of Credit Suisse. Mr. Goodman joined Credit Suisse in November 2000 when they acquired DLJ where he was Global Head of Leveraged Finance. Mr. Goodman joined DLJ in February of 1988 as the founder of the High Yield Capital Markets Group. Prior to joining DLJ, Mr. Goodman worked in the high yield business at Drexel Burnham Lambert from 1984 to 1988. Mr. Goodman is currently on the board of directors of Lincoln Center and the Central Park Conservancy. Mr. Goodman received Institutional Investor’s 2012 Money Manager of The Year Award. He also received the 2004 Lifetime Achievement Award from Euromoney Magazine for his career achievements in the global capital markets. He graduated from Lafayette College and the Harvard Business School.
227
Table of Contents
Jonathan D. Gray is Global Head of Real Estate and a member of the board of directors of our general partner. Mr. Gray was elected to the board of directors of our general partner effective February 24, 2012. He also sits on the firm’s Management Committee. Since joining Blackstone in 1992, Mr. Gray has helped build the largest real estate platform in the world with $102 billion in investor capital under management. Blackstone’s portfolio includes hotel, office, retail, industrial and residential properties in the U.S., Europe, Asia and Latin America. Mr. Gray currently serves as Chairman of the board of directors of Hilton Worldwide Holdings Inc. and Nevada Property 1 LLC (The Cosmopolitan of Las Vegas). He is also a member of the board of directors of Invitation Homes Inc. Mr. Gray also previously served as a board member of Brixmor Property Group Inc. He also serves on the board of Harlem Village Academies and Trinity School. Mr. Gray and his wife, Mindy, established the Basser Center for BRCA at the University of Pennsylvania School of Medicine focused on the prevention and treatment of certain genetically caused cancers. Mr. Gray received a BS in Economics from the Wharton School, as well as a BA in English from the College of Arts and Sciences at the University of Pennsylvania.
Michael S. Chae is Blackstone’s Chief Financial Officer and a member of the firm’s Management Committee. Mr. Chae has management responsibility over the firm’s global finance, treasury, technology and corporate development functions. Since joining Blackstone in 1997, Mr. Chae has served in a broad range of leadership roles including Head of International Private Equity, from 2012 through 2015, Head of Private Equity for Asia/Pacific, from 2011 through 2015, and overseeing Private Equity investments in various sectors and the investment process for Tactical Opportunities. Mr. Chae led or was involved in numerous Blackstone investments over that time period. Before joining Blackstone, Mr. Chae worked at The Carlyle Group, L.P. and prior to that with Dillon, Read & Co. Mr. Chae received an AB from Harvard College, an MPhil. in International Relations from Cambridge University and a JD from Yale Law School. He has served on numerous boards of private and publicly traded portfolio companies. Mr. Chae is a member of the Board of Trustees of the Lawrenceville School and Chairman of its Investment Committee, and a member of the Council on Foreign Relations and the Board of Trustees of the Asia Society.
John G. Finley is Chief Legal Officer of Blackstone and a member of the firm’s Management Committee. Before joining Blackstone in 2010, Mr. Finley had been a partner with Simpson Thacher & Bartlett for 22 years where he was most recently a member of that law firm’s Executive Committee and Head of Global Mergers & Acquisitions. Mr. Finley is a member of the Advisory Board of the Harvard Law School Program on Corporate Governance, the National Advisory Board of the Netter Center for Community Partnerships of the University of Pennsylvania and the Board of Advisors of the University of Pennsylvania Institute of Law and Economics. He is also a guest lecturer at Harvard Law School and Penn Law School. He has served on the Committee of Securities Regulation of the New York State Bar Association, the Board of Advisors of the Knight-Bagehot Fellowship in Economics and Business Journalism at Columbia University and as a Trustee of the Jewish Board of Family and Children Services. He has also served as Chairman of the Annual International Mergers & Acquisitions Conference of the International Bar Association. Mr. Finley received a BS in Economics from the Wharton School of the University of Pennsylvania, a BA in History from the College of Arts and Sciences of the University of Pennsylvania, and a JD from Harvard Law School.
Joan Solotar is a Senior Managing Director, Head of Private Wealth Solutions and External Relations and a member of the firm’s Management Committee. Ms. Solotar oversees the firm’s Private Wealth Solutions business, which develops and distributes products and services to meet the needs of institutional and high net worth clients. Additionally, she manages global shareholder relations, public affairs and corporate services. Before joining Blackstone in 2007, Ms. Solotar was with Bank of America Securities where she was a Managing Director and Head of Equity Research. Prior to joining Bank of America, she was a consistently highly ranked Institutional Investor “All-American Research Team” financial services analyst at DLJ and Credit Suisse First Boston as a Managing Director. Ms. Solotar chairs the board of directors of Blackstone’s Charitable Foundation and is Chairman of the Board of Trustees of the East Harlem Tutorial Program and the East Harlem Scholars Academies. She is the recent author of a Harvard Business Review article entitled “Truths for our Daughters.” Ms. Solotar received a BS in Management Information Systems at the State University of New York at Albany and an MBA in Finance at New York University.
228
Table of Contents
James W. Breyer is a member of the board of directors of our general partner. Mr. Breyer was elected to the board of directors of our general partner effective July 14, 2016. Mr. Breyer is the Founder and Chief Executive Officer of Breyer Capital, a global venture capital fund. Mr. Breyer has been an investor in over 30 public and private consumer internet, media and technology companies, many of which have completed public offerings or successful mergers. He served as Partner at Accel Partners from 1990 to 2016 and Managing Partner from 1995 to 2011. Mr. Breyer has been an active investor in China for over a decade and is lead outside sponsor, partner and investor in IDG China Capital Funds. Mr. Breyer currently serves on the board of directors of Twenty-First Century Fox, Inc. and Circle Internet Financial, Inc. and previously served on the board of directors of Facebook, Inc. from 2005 to 2013, Dell, Inc. from 2009 to 2013, and Wal-Mart Stores, Inc. from 2001 to 2013, as well as a number of other prominent technology and media companies. Mr. Breyer has been ranked #1 on Forbes’ Midas List of top technology investors multiple times and is former Chairman of the National Venture Capital Association and former President of the Western Association of Venture Capitalists. Mr. Breyer is a fellow of the Harvard Corporation, member of the Advisory Board of Stanford University School of Engineering, Trustee of the Metropolitan Museum of Art, Trustee of the San Francisco Museum of Modern Art, member of the Council on Foreign Relations, Chairman of the Advisory Board of the Tsinghua University School of Economics and Management in Beijing, and in 2005 was named an Honorary Professor at the 1,000 year-old Yuelu Academy at Hunan University.
Peter T. Grauer is a member of the board of directors of our general partner. Mr. Grauer was elected to the board of directors of our general partner effective January 26, 2016. Mr. Grauer is Chairman of Bloomberg L.P., a global financial information and media company. A member of the board of Bloomberg L.P. since 1996, Mr. Grauer became Chairman in 2001, and then Chairman, President and Chief Executive Officer in March 2002. Prior to joining Bloomberg L.P., Mr. Grauer was managing director and senior partner at Credit Suisse First Boston from 2000 to 2002, founding both DLJ Merchant Banking Partners and DLJ Investment Partners. He was managing director of DLJ from 1992 until Credit Suisse First Boston acquired it in 2000. Mr. Grauer serves as lead director of DaVita Health Care Partners, Inc. and Senior Independent Non-Executive Director of Glencore. He is a member of the Business Council, the Asia Business Council, the International Business Council of the World Economic Forum and Founding Chairman of the World Economic Forum Community of Chairmen. Mr. Grauer is also President of the Inner-City Scholarship Fund Board of Trustees, Chairman of the Rockefeller Finance & Operations Committee, Chair of the College Advising Corps, and a board member of Room to Read and the Prostate Cancer Foundation. He is Founding U.S. Chair of the 30% Club, a Member of the Advisory Council of Out on the Street, and the McKinsey Advisory Council.
Richard H. Jenrette is a member of the board of directors of our general partner. Mr. Jenrette was elected to the board of directors of our general partner effective July 14, 2008. Mr. Jenrette is the retired former Chairman and Chief Executive Officer of The Equitable Companies Incorporated and the co-founder and retired Chairman and Chief Executive Officer of DLJ. He is also a former Chairman of The Securities Industry Association and has served in the past as a director or trustee of The McGraw-Hill Companies, Advanced Micro Devices Inc., the American Stock Exchange, The Rockefeller Foundation, The Duke Endowment, the University of North Carolina, New York University and The National Trust for Historic Preservation.
Rochelle B. Lazarus is a member of the board of directors of our general partner. Ms. Lazarus was elected to the board of directors of our general partner effective July 9, 2013. Ms. Lazarus is Chairman Emeritus of Ogilvy & Mather and served as Chairman of that company from 1997 to June 2012. Prior to becoming Chief Executive Officer and Chairman, she also served as president of O&M Direct North America, Ogilvy & Mather New York, and Ogilvy & Mather North America. Ms. Lazarus currently serves on the boards of Merck & Co., Inc., General Electric (where she chairs the Governance and Public Affairs Committee), the Financial Industry Regulatory Authority (FINRA), World Wildlife Fund, Defense Business Board, Lincoln Center for the Performing Arts and the Partnership for New York City. She is a trustee of the New York Presbyterian Hospital and is a member of the Board of Overseers of Columbia Business School. She is also a member of the Council on Foreign Relations, The Women’s Forum, Inc. and The Business Council.
Jay O. Light is a member of the board of directors of our general partner. Mr. Light was elected to the board of directors of our general partner effective September 18, 2008. Mr. Light is the Dean Emeritus of Harvard Business
229
Table of Contents
School and the George F. Baker Professor of Administration Emeritus. Prior to that, Mr. Light was the Dean of Harvard Business School from 2006 to 2010. Before becoming the Dean of Harvard Business School, Mr. Light was Senior Associate Dean, Chairman of the Finance Area, and a professor teaching Investment Management, Capital Markets, and Entrepreneurial Finance for 30 years. Mr. Light is the lead director of the board of directors of HCA Holdings, Inc. and a member of the board of advisors of several private firms. Mr. Light was also previously a director of the Harvard Management Company and of Partners HealthCare (the Mass General and Brigham & Women’s Hospitals), where he served as chairman of its Investment Committee until 2015. In prior years until 2008, Mr. Light was a Trustee of the GMO Trusts, a family of mutual funds for institutional investors.
The Right Honorable Brian Mulroney is a member of the board of directors of our general partner. Mr. Mulroney was elected to the board of directors of our general partner effective June 21, 2007. Mr. Mulroney is a senior partner and international business consultant for the Montreal law firm, Norton Rose Canada LLP. Prior to joining Norton Rose Canada, Mr. Mulroney was the eighteenth Prime Minister of Canada from 1984 to 1993 and leader of the Progressive Conservative Party of Canada from 1983 to 1993. He served as the Executive Vice President of the Iron Ore Company of Canada and President beginning in 1977. Prior to that, Mr. Mulroney served on the Cliché Commission of Inquiry in 1974. Mr. Mulroney is a Senior Advisor of Global Affairs at Barrick Gold Corporation, where he previously served as a member of the board of directors, and is the Chairman of their International Advisory Board. Mr. Mulroney is also Chairman of the board of directors of Quebecor Inc. and Quebecor Media Inc. and a member of the board of directors of Wyndham Worldwide Corporation. In prior years until 2009, Mr. Mulroney was a member of the board of directors of Archer Daniels Midland Company and Quebecor World Inc.
William G. Parrett is a member of the board of directors of our general partner. Mr. Parrett was elected to the board of directors of our general partner effective November 9, 2007. Until May 31, 2007, Mr. Parrett served as the Chief Executive Officer of Deloitte Touche Tohmatsu. Certain of the member firms of Deloitte Touche Tohmatsu or their subsidiaries and affiliates provide professional services to Blackstone or its affiliates. Mr. Parrett co-founded the Global Financial Services Industry practice of Deloitte and served as its first Chairman. Mr. Parrett is a member of the board of directors of Thermo Fisher Scientific Inc., where he chairs the audit committee and is a member of the compensation committee, and Eastman Kodak Company, where he chairs the audit committee. Mr. Parrett is also a member of the board of directors of UBS AG, where he chairs the audit committee and is a member of the corporate culture and responsibility and compensation committees. In addition, Mr. Parrett is Chairman of the board of directors of Conduent Inc., where he is a member of the governance and finance committees. Mr. Parrett is a member of the Board of Trustees of Carnegie Hall, a Senior Trustee of the United States Council for International Business and a past Chairman of the Board of Trustees of United Way Worldwide. Mr. Parrett is a Certified Public Accountant with an active license.
Board Composition
Our general partner seeks to ensure that the board of directors of our general partner is composed of members whose particular experience, qualifications, attributes and skills, when taken together, will allow the board to satisfy its oversight responsibilities effectively. In identifying candidates for membership on the board of directors of our general partner, Mr. Schwarzman takes into account (a) minimum individual qualifications, such as strength of character, mature judgment, industry knowledge or experience and an ability to work collegially with the other members of the board of directors, and (b) all other factors he considers appropriate.
After conducting an initial evaluation of a candidate, Mr. Schwarzman will interview that candidate if he believes the candidate might be suitable to be a director and may also ask the candidate to meet with other directors and senior management. If, following such interview and any consultations with senior management, Mr. Schwarzman believes a candidate would be a valuable addition to the board of directors, he will appoint that individual to the board of directors of our general partner.
When considering whether the board’s directors have the experience, qualifications, attributes and skills, taken as a whole, to enable the board to satisfy its oversight responsibilities effectively in light of the Partnership’s
230
Table of Contents
business and structure, Mr. Schwarzman focused on the information described in each of the board members’ biographical information set forth above. In particular, with regard to Mr. Breyer, Mr. Schwarzman considered his extensive financial background and significant investment experience at Breyer Capital and Accel Partners. With regard to Mr. Grauer, Mr. Schwarzman considered his extensive financial background and significant management experience at Bloomberg L.P. With regard to Mr. Jenrette, Mr. Schwarzman considered his extensive financial background and experience in a variety of senior leadership roles, including his roles at DLJ and The Equitable Companies Incorporated. With regard to Ms. Lazarus, Mr. Schwarzman considered her extensive business background and her management experience in a variety of senior leadership roles at Ogilvy & Mather. With regard to Mr. Light, Mr. Schwarzman considered his distinguished career as a professor and dean at Harvard Business School with extensive knowledge and expertise of the investment management and capital markets industries. With regard to Mr. Mulroney, Mr. Schwarzman considered his distinguished career of government service, especially his service as the Prime Minister of Canada. With regard to Mr. Parrett, Mr. Schwarzman considered his significant experience, expertise and background with regard to auditing and accounting matters, his leadership role at Deloitte and his extensive experience serving as a director on boards of directors. With regard to Messrs. James, Hill, Goodman and Gray, Mr. Schwarzman considered their leadership and extensive knowledge of our business and operations gained through their years of service at our firm and with regard to himself, Mr. Schwarzman considered his role as founder and long-time chief executive officer of our firm.
Partnership Management and Governance
Our general partner, Blackstone Group Management L.L.C., manages all of our operations and activities. Our general partner is authorized in general to perform all acts that it determines to be necessary or appropriate to carry out our purposes and to conduct our business. Our partnership agreement provides that our general partner in managing our operations and activities is entitled to consider only such interests and factors as it desires, including its own interests, and will have no duty or obligation (fiduciary or otherwise) to give any consideration to any interest of or factors affecting us or any limited partners, and will not be subject to any different standards imposed by the partnership agreement, the Delaware Limited Partnership Act or under any other law, rule or regulation or in equity. Blackstone Group Management L.L.C. is wholly owned by our senior managing directors and controlled by our founder, Mr. Schwarzman. Our common unitholders have only limited voting rights on matters affecting our business and therefore have limited ability to influence management’s decisions regarding our business. The voting rights of our common unitholders are limited as set forth in our partnership agreement and in the Delaware Limited Partnership Act.
Blackstone Group Management L.L.C. does not receive any compensation from us for services rendered to us as our general partner. Our general partner is reimbursed by us for all expenses it incurs in carrying out its activities as general partner of the Partnership, including compensation paid by the general partner to its directors and the cost of directors and officers liability insurance obtained by the general partner.
The limited liability company agreement of Blackstone Group Management L.L.C. establishes a board of directors that is responsible for the oversight of our business and operations. Our general partner’s board of directors is elected in accordance with its limited liability company agreement, where our senior managing directors have agreed that our founder, Mr. Schwarzman will have the power to appoint and remove the directors of our general partner. The limited liability company agreement of our general partner provides that at such time as Mr. Schwarzman should cease to be a founder, Hamilton E. James will thereupon succeed Mr. Schwarzman as the sole founding member of our general partner, and thereafter such power will revert to the members of our general partner holding a majority in interest in our general partner. We refer to the board of directors of Blackstone Group Management L.L.C. as the “board of directors of our general partner.” The board of directors of our general partner has a total of twelve members, including seven members who are not officers or employees, and are otherwise independent, of Blackstone and its affiliates, including our general partner.
The board of directors of our general partner has three standing committees: the audit committee, the conflicts committee and the executive committee.
231
Table of Contents
Audit Committee. The audit committee consists of Messrs. Parrett (Chairman), Breyer, Grauer, Jenrette and Light and Ms. Lazarus. The purpose of the audit committee is, among other things, to assist the board of directors of Blackstone Group Management L.L.C. in fulfilling its responsibility with respect to its oversight of (a) the quality and integrity of our financial statements, (b) our compliance with legal and regulatory requirements, (c) our independent auditor’s qualification, independence and performance, and (d) the performance of our internal audit function. The audit committee’s responsibilities also include review with management, the independent auditors and internal audit, areas of material risk to our operations and financial results, including major financial risks and exposures and our guidelines and policies with respect to risk assessment and risk management. The members of the audit committee meet the independence standards and financial literacy requirements for service on an audit committee of a board of directors pursuant to the New York Stock Exchange listing standards and SEC rules applicable to audit committees. The board of directors of our general partner has determined that Mr. Parrett is an “audit committee financial expert” within the meaning of Item 407(d)(5) of Regulation S-K. Mr. Parrett serves on the audit committees of four public companies, including Blackstone. The board of directors of our general partner determined at its January 2017 meeting that upon consideration of all relevant facts and circumstances known to the board of directors, Mr. Parrett’s simultaneous service on the audit committees of four public companies does not impair his ability to effectively serve on the audit committee of the board of directors of our general partner. The audit committee has a charter, which is available on our website at http://ir.blackstone.com under “Corporate Governance.”
Conflicts Committee. The conflicts committee consists of Messrs. Parrett (Chairman), Breyer, Grauer, Jenrette and Light and Ms. Lazarus. The conflicts committee reviews specific matters that our general partner’s board of directors believes may involve conflicts of interest. The conflicts committee determines if the resolution of any conflict of interest submitted to it is fair and reasonable to the Partnership. Any matters approved by the conflicts committee are conclusively deemed to be fair and reasonable to us and not a breach by us of any duties we may owe to our common unitholders. In addition, the conflicts committee may review and approve any related person transactions, other than those that are approved pursuant to our related person policy, as described under “— Item 13. Certain Relationships and Related Transactions, and Director Independence,” and may establish guidelines or rules to cover specific categories of transactions. The members of the conflicts committee meet the independence standards for service on an audit committee of a board of directors pursuant to federal and New York Stock Exchange rules relating to corporate governance matters.
Executive Committee. The executive committee of the board of directors of Blackstone Group Management L.L.C. consists of Messrs. Schwarzman, James, Hill, Goodman and Gray. The board of directors has delegated all of the power and authority of the full board of directors to the executive committee to act when the board of directors is not in session.
Code of Business Conduct and Ethics
We have a Code of Business Conduct and Ethics and a Code of Ethics for Financial Professionals, which apply to our principal executive officer, principal financial officer and principal accounting officer. Each of these codes is available on our website at http://ir.blackstone.com under “Corporate Governance.” We intend to disclose any amendment to or waiver of the Code of Ethics for Financial Professionals and any waiver of our Code of Business Conduct and Ethics on behalf of an executive officer or director either on our website or in an 8-K filing.
Corporate Governance Guidelines
The board of directors of our general partner has a governance policy, which addresses matters such as the board of directors’ responsibilities and duties and the board of directors’ composition and compensation. The governance policy is available on our website at http://ir.blackstone.com under “Corporate Governance.”
Communications to the Board of Directors
The non-management members of our general partner’s board of directors meet at least quarterly. The presiding director at these non-management board member meetings is Mr. Parrett. All interested parties, including any employee or unitholder, may send communications to the non-management members of our general partner’s board of directors by writing to: The Blackstone Group L.P., Attn: Audit Committee, 345 Park Avenue, New York, New York 10154.
232
Table of Contents
Section 16(a) Beneficial Ownership Reporting Compliance
Section 16(a) of the Securities Exchange Act of 1934, as amended, requires the executive officers and directors of our general partner, and persons who own more than ten percent of a registered class of the Partnership’s equity securities to file initial reports of ownership and reports of changes in ownership with the SEC and furnish the Partnership with copies of all Section 16(a) forms they file. To our knowledge, based solely on our review of the copies of such reports furnished to us or written representations from such persons that they were not required to file a Form 5 to report previously unreported ownership or changes in ownership, we believe that, with respect to the fiscal year ended December 31, 2016, such persons complied with all such filing requirements, with the exception of the following late filings, in each case due to administrative oversight: a Form 4 report on February 16, 2016 by Ms. Solotar reflecting the exchange of Blackstone Holdings partnership units for an equal number of common units; a Form 4 report on August 26, 2016 by each of Mr. Chae, Ms. Solotar, Mr. Hill and Ms. Kathleen Skero reflecting a grant of Blackstone Holdings partnership units under the 2007 Equity Incentive Plan; and a Form 4 report on December 21, 2016 by Mr. Finley reflecting the exchange of Blackstone Holdings partnership units for an equal number of common units and the sale of units.
| ITEM 11. | EXECUTIVE COMPENSATION |
Compensation Discussion and Analysis
Overview of Compensation Philosophy and Program
The intellectual capital collectively possessed by our senior managing directors (including our named executive officers) and other employees is the most important asset of our firm. We invest in people. We hire qualified people, train them, encourage them to provide their best thinking to the firm for the benefit of the investors in the funds we manage, and compensate them in a manner designed to retain and motivate them and align their interests with those of the investors in our funds.
Our overriding compensation philosophy for our senior managing directors and certain other employees is that compensation should be composed primarily of (a) annual cash bonus payments tied to the performance of the applicable business unit(s) in which such employee works, (b) performance interests (composed primarily of carried interest and incentive fee interests) tied to the performance of the investments made by the funds in the business unit in which such employee works or for which he or she has responsibility, (c) deferred equity awards reflecting the value of our common units, and (d) additional cash payments and equity awards tied to extraordinary performance of such employee or other circumstances (for example, if there has been a change of role or responsibility). We believe base salary should represent a significantly lesser component of total compensation. We believe the appropriate combination of annual cash bonus payments and performance interests or deferred equity awards encourages our senior managing directors and other employees to focus on the underlying performance of our investment funds, as well as the overall performance of the firm and interests of our common unitholders. To that end, the primary form of compensation to our senior managing directors and other employees who work in our carry fund operations is generally a combination of annual cash bonus payments related to the performance of those carry fund operations, carried interest or incentive fee interests and, in specified cases, deferred equity awards. Along the same lines, the primary form of compensation to our senior managing directors and other employees who do not work in our carry fund operations is generally a combination of annual cash bonus payments tied to the performance of the applicable business unit in which such employee works and deferred equity awards.
Employees at higher total compensation levels are generally targeted to receive a greater percentage of their total compensation payable in annual cash bonuses, participation in performance interests, and deferred equity awards and a lesser percentage in the form of base salary compared to employees who are paid less. We believe that the proportion of compensation that is “at risk” should increase as an employee’s level of responsibility rises.
Our compensation program includes significant elements that discourage excessive risk taking and aligns the compensation of our employees with the long-term performance of the firm. For example, notwithstanding the fact
233
Table of Contents
that for accounting purposes we accrue compensation for the Performance Plans (as defined below) related to our carry funds as increases in the carrying value of the portfolio investments are recorded in those carry funds, we only make cash payments to our employees related to carried interest when profitable investments have been realized and cash is distributed first to the investors in our funds, followed by the firm and only then to employees of the firm. Moreover, if a carry fund fails to achieve specified investment returns due to diminished performance of later investments, our Performance Plans entitle us to “clawback” carried interest payments previously made to an employee for the benefit of the limited partner investors in that fund, and we escrow a portion of all carried interest payments made to employees to help fund their potential future “clawback” obligations, all of which further discourages excessive risk-taking by our employees. Similarly, for our investment funds that pay incentive fees, those incentive fees are only paid to the firm and employees of the firm to the extent an applicable fund’s portfolio of investments has profitably appreciated in value (in most cases above a specified level) during the applicable period. In addition, and as noted below with respect to our named executive officers, the requirement that we have our professional employees invest in certain of the funds they manage directly aligns the interests of our professionals and our investors. In most cases, these investments represent a significant percentage of employees’ after-tax compensation. Lastly, because our equity awards have significant vesting or deferral provisions, the actual amount of compensation realized by the recipient will be tied directly to the long-term performance of our common units. In addition, in applicable jurisdictions, specifically in the European Union, our compensation program includes additional remuneration policies that may limit or otherwise alter the compensation for certain employees consistent with local regulatory requirements and aimed at, among other things, discouraging inappropriate risk taking and aligning compensation with the firm’s strategy and long-term interests consistent with our general compensation program.
We believe our current compensation and benefit allocations for senior professionals are best in class and are consistent with companies in the alternative asset management industry. We do not generally rely on compensation surveys or compensation consultants. Our senior management periodically reviews the effectiveness and competitiveness of our compensation program, and such reviews may in the future involve the assistance of independent consultants.
Personal Investment Obligations. As part of our compensation philosophy and program, we require our named executive officers to personally invest their own capital in and alongside the funds that we manage. We believe that this strengthens the alignment of interests between our executive officers and the investors in those investment funds. (See “— Item 13. Certain Relationships and Related Transactions, and Director Independence — Investment in or Alongside Our Funds”.) In determining compensation for our named executive officers, we do not take into account the gains or losses attributable to the personal investments by our named executive officers in our investment funds.
For equity awards granted in 2014 and prior years, we also require each of our named executive officers to hold at least 25% of their vested units (other than vested units awarded under our Deferred Compensation Plan) throughout their employment with the firm and generally for one year following the termination of employment. We believe the continued ownership by our named executive officers of significant amounts of our equity through their direct and indirect interests in the Blackstone Holdings Partnerships affords significant alignment of interests with our common unitholders. For equity awards granted in 2015 and onward our named executive officers are required to hold 25% of their vested units (other than vested units awarded under our Deferred Compensation Plan) until the earlier of (1) ten years after the applicable vesting date and (2) one year following termination of employment.
234
Table of Contents
Named Executive Officers
In 2016, our named executive officers were:
| Executive |
Title | |
| Stephen A. Schwarzman | Chairman and Chief Executive Officer | |
| Hamilton E. James | President, Chief Operating Officer | |
| J. Tomilson Hill | Vice Chairman | |
| Michael S. Chae | Chief Financial Officer | |
| Joan Solotar | Senior Managing Director — Head of Private Wealth Solutions and External Relations |
Compensation Elements for Named Executive Officers
The key elements of the compensation of the named executive officers listed in the tables below for 2016 were base compensation, which is composed of base salary, cash bonus and equity-based compensation, and performance compensation, which is composed of carried interest and incentive fee allocations:
1. Base Salary. Each named executive officer received a $350,000 annual base salary in 2016, which equals the total yearly partnership drawings that were received by each of our senior managing directors prior to our initial public offering in 2007. In keeping with historical practice, we continue to pay this amount as a base salary.
2. Annual Cash Bonus Payments / Deferred Equity Awards. Since our initial public offering, Mr. Schwarzman has not received any cash compensation other than the $350,000 annual salary described above and the actual realized carried interest distributions or incentive fees he may receive in respect of his participation in the carried interest or incentive fees earned from our funds through our Performance Plans described below. We believe that having Mr. Schwarzman’s compensation largely based on ownership of a portion of the carried interest or incentive fees earned from our funds aligns his interests with those of the investors in our funds and our common unitholders.
Each of our named executive officers other than Mr. Schwarzman received annual cash bonus payments in 2016 in addition to their base salary. These cash payments included participation interests in the earnings of the firm’s various investment businesses. Mr. Hill, who has primary responsibility for Hedge Fund Solutions, our funds of hedge funds operation, received a majority of his cash payments based upon the performance of that business. Indicative participation interests for each year were disclosed to a named executive officer at the beginning of such year and represented estimates of the expected percentage participation that such named executive officer may have had in the relevant business unit(s)’ earnings for that same year. However, the ultimate cash payments paid to the named executive officers at the end of the year in respect of their participation interests were determined in the discretion of Mr. Schwarzman, and Mr. James, as described below. Earnings for a business unit are calculated based on the annual operating income of that business unit and are generally a function of the performance of such business unit, which is evaluated by Mr. Schwarzman and subject to modification by the firm in its sole discretion. The ultimate cash payment amounts were based on (a) the prior and anticipated performance of the named executive officer, (b) the prior and anticipated performance of the segments and product lines in which the officer serves and for which he has responsibility, and (c) the estimated participation interests given to the officer at the beginning of the year in respect of the investments to be made in that year. We make annual cash bonus payments in the first quarter of the ensuing year to reward individual performance for the prior year. The ultimate cash payments that are made are fully discretionary as further discussed below under “— Determination of Incentive Compensation.”
For 2016, all employees other than Mr. Schwarzman and Mr. James were deemed eligible to participate in the Deferred Compensation Plan. The Deferred Compensation Plan provides for the deferral of a portion of each participant’s annual cash bonus payment. The portion deferred is prescribed under the Deferred Compensation Plan and is subject to certain adjustments, including reductions for mandatory contributions to our investment funds. By deferring a portion of a participant’s compensation for three years, the Deferred Compensation Plan acts as an employment retention mechanism and thereby enhances the alignment of interests between such participant and the firm. Many asset managers that are public companies utilize deferred compensation plans as a means of retaining and motivating their professionals, and we believe that it is in the interest of our common unitholders to do the same for our personnel.
235
Table of Contents
On January 13, 2017, Messrs. Hill, Chae and Ms. Solotar each received a deferral award under the Deferred Compensation Plan of deferred restricted common units in respect of their service in 2016. The amount of each participant’s annual cash bonus payment deferred under the Deferred Compensation Plan is calculated pursuant to a deferral rate table using the participant’s total annual incentive compensation, which generally includes such participant’s annual cash bonus payment and any incentive fees earned in connection with our investment funds and is subject to certain adjustments, including reductions for mandatory contributions to our investment funds. The percentage of the named executive officer’s 2016 annual cash bonus payment mandatorily deferred into deferred restricted common units was approximately 40.9% for Mr. Hill, 10.1% for Mr. Chae and 23.1% for Ms. Solotar. These awards are reflected as stock awards for fiscal 2016 in the Summary Compensation Table and in the Grants of Plan-Based Awards in 2016 table.
3. Discretionary Equity Awards. In January 2016, Messrs. Hill, Chae and Ms. Solotar were each awarded a discretionary award of 54,986, 981,883 and 39,276 deferred restricted Blackstone Holdings Partnership Units, respectively. These awards reflected 2015 performance and were also intended to further promote retention and to incentivize future performance. In addition, with respect to Mr. Chae, the award was granted in recognition of his appointment to Chief Financial Officer effective August 7, 2015. The awards were granted under the 2007 Equity Incentive Plan on July 1, 2016, subject to the named executive officer’s continued employment through such date. Other than with respect to Mr. Chae, whose outstanding award will vest annually in substantially equal installments over six years beginning in 2019, the awards will have the same vesting and other terms as the discretionary awards granted to Messrs. Hill and Solotar in 2015 in respect of 2014 performance, which terms are described under the caption “Narrative Disclosure to Summary Compensation Table and Grants of Plan-Based Awards in 2016 — Terms of Blackstone Holdings Partnership Units Granted in 2016 and Prior Years” below. These awards are reflected as stock awards for fiscal 2016 in the Summary Compensation Table and in the Grants of Plan-Based Awards in 2016 table.
In January 2017, Mr. Hill and Ms. Solotar were each awarded a discretionary award of deferred restricted Blackstone Holdings Partnership Units with a value of $1,500,000 and $1,000,000, respectively. These awards reflected 2016 performance and are also intended to further promote retention and to incentivize future performance. The awards will be granted under the 2007 Equity Incentive Plan and are expected to be granted on July 1, 2017, subject to the named executive officer’s continued employment through such date. The awards will have the same vesting and other terms as the discretionary awards granted in 2016 in respect of 2015 performance. These awards will be reflected as stock awards for fiscal 2017 in the Summary Compensation Table and in the Grants of Plan-Based Awards in 2017 table.
4. Participation in Performance Fees. During 2016, all of our named executive officers participated in the carried interest of our carry funds or the incentive fees of our funds that pay incentive fees through their participation interests in the carry or incentive fee pools generated by these funds. The carry or incentive fee pool with respect to each fund in a given year is funded by a fixed percentage of the total amount of carried interest or incentive fees earned by Blackstone for such fund in that year. We refer to these pools and employee participation therein as our “Performance Plans” and payments made thereunder as performance payments. Because the aggregate amount of performance payments payable through our Performance Plans is directly tied to the performance of the funds, we believe this fosters a strong alignment of interests between the investors in those funds and these named executive officers, and therefore benefits our unitholders. In addition, most alternative asset managers, including several of our competitors, use participation in carried interest or incentive fees as a central means of compensating and motivating their professionals, and we believe that we must do the same in order to attract and retain the most qualified personnel. For purposes of our financial statements, we are treating the income allocated to all our personnel who have participation interests in the carried interest or incentive fees generated by our funds as compensation, and the amounts of carried interest and incentive fees earned by named executive officers are reflected as “All Other Compensation” in the Summary Compensation Table. Cash payments in respect of our Performance Plans for each named executive officer are determined on the basis of the percentage participation in the relevant investments previously allocated to that named executive officer, which percentage participations are established in January in each year in respect of the investments to be made in that year. The
236
Table of Contents
percentage participation for a named executive officer may vary from year to year and fund to fund due to several factors, and may include changes in the size and composition of the pool of Blackstone personnel participating in such Performance Plan in a given year, the performance of our various businesses, new developments in our businesses and product lines, and the named executive officer’s leadership and oversight of the business or corporate function for which the named executive officer is responsible and such named executive officer’s contributions with respect to our strategic initiatives and development. In addition, certain of our employees, including our named executive officers, may participate in profit sharing initiatives whereby these individuals may receive allocations of investment income from Blackstone’s firm investments. Our employees, including our named executive officers, may also receive equity awards in our investment advisory clients and/or be allocated securities of such clients that we have received.
(a) Carried Interest. Distributions of carried interest in cash (or, in some cases, in-kind) to our named executive officers and other employees who participate in our Performance Plans relating to our carry funds depends on the realized proceeds and timing of the cash realizations of the investments owned by the carry funds in which they participate. Our carry fund agreements also set forth specified preconditions to a carried interest distribution, which typically include that there must have been a positive return on the relevant investment and that the fund must be above its carried interest hurdle rate. In addition, as described below, employees or senior managing directors may also be required to have fulfilled specified service requirements in order to be eligible to receive carried interest distributions. For our carry funds, carried interest distributions for the named executive officer’s participation interests are generally made to the named executive officer following the actual realization of the investment, although a portion of such carried interest is held back by the firm in respect of any future “clawback” obligation related to the fund. In allocating participation interests in the carry pools, we have not historically taken into account or based such allocations on any prior or projected triggering of any “clawback” obligation related to any fund. To the extent any “clawback” obligation were to be triggered, carried interest previously distributed to a named executive officer would have to be returned to the limited partners of such fund, thereby reducing the named executive officer’s overall compensation for any such year. Moreover, because a carried interest recipient (including Blackstone itself) may have to fund more than his or her respective share of a “clawback” obligation under the governing documents (generally, up to an additional 50%), there is the possibility that the compensation paid to a named executive officer for any given year could be significantly reduced or even negative in the event a “clawback” obligation were to arise.
Participation in carried interest generated by our carry funds for all participating named executive officers other than Mr. Schwarzman is subject to vesting. Vesting serves as an employment retention mechanism and thereby enhances the alignment of interests between a participant in our Performance Plans and the firm. For carried interest allocated on or prior to December 31, 2012 and carried interest earned in certain of our credit funds, each participating named executive officer (other than Mr. Schwarzman) vests in 25% of the carried interest related to an investment immediately upon the closing of the investment by a carry fund with the remainder vesting in equal installments on the first through third anniversary of the closing of that investment (unless an investment is realized prior to the expiration of such three-year anniversary, in which case such active executive officer is deemed 100% vested in the proceeds of such realizations). For carried interest allocated after December 31, 2012, the carried interest related to an investment vests in equal installments on the first through fourth anniversary of the closing of that investment (unless an investment is realized prior to the expiration of such four-year anniversary, in which case such active executive officer is deemed 100% vested in the proceeds of such realizations). In addition, any named executive officer who is retirement eligible will automatically vest in 50% of their otherwise unvested carried interest allocation upon retirement. (See “— Non-Competition and Non-Solicitation Agreements — Retirement.”) We believe that vesting of carried interest participation enhances the stability of our senior management team and provides greater incentives for our named executive officers to remain at the firm. Due to his unique status as a founder and the long-time chief executive officer of our firm, Mr. Schwarzman vests in 100% of his carried interest participation related to any investment by a carry fund upon the closing of that investment.
(b) Incentive Fees. Cash distributions of incentive fees to our named executive officers and other employees who participate in our Performance Plans relating to the funds that pay incentive fees depends on the performance of
237
Table of Contents
the investments owned by those funds in which they participate. For our investment funds that pay incentive fees, those incentive fees are only paid to the firm and employees of the firm to the extent an applicable fund’s portfolio of investments has profitably appreciated in value (in most cases above a specified level) during the applicable period and following the calculation of the profit split (if any) between the fund’s general partner or investment adviser and the fund’s investors, which occurs once a year (generally December 31 or June 30 of each year).
(c) Investment Advisory Client Interests. BXMT is an investment advisory client of Blackstone. Compensation we receive from investment advisory clients in the form of securities may be allocated to employees and senior managing directors. For example, in 2016, Messrs. Schwarzman, James, Chae and Ms. Solotar were allocated restricted shares of listed common stock of BXMT in connection with investment advisory services provided by Blackstone to BXMT. The value of these allocated restricted shares is reflected as “All Other Compensation” in the Summary Compensation Table.
5. Other Benefits. Upon the consummation of our initial public offering in June 2007, we entered into a founding member agreement with our founder, Mr. Schwarzman, which provides specified benefits to him following his retirement. (See “— Narrative Disclosure to Summary Compensation Table and Grants of Plan-Based Awards in 2016 — Schwarzman Founding Member Agreement”.) Mr. Schwarzman is provided certain security services, including home security systems and monitoring, and personal and related security services. These security services are provided for our benefit, and the board of directors of our general partner considers the related expenses to be appropriate business expenses rather than personal benefits for Mr. Schwarzman. Nevertheless, the expenses associated with these security services are reflected in the “All Other Compensation” column of the Summary Compensation Table below.
Determination of Incentive Compensation
As our founder, Mr. Schwarzman sets his own compensation and reserves final approval of each named executive officer’s compensation, based on recommendations from Mr. James. For 2016, these decisions were based primarily on Mr. Schwarzman’s and Mr. James’s assessment of such named executive officer’s individual performance, operational performance for the segments or product lines in which the officer serves or for which he has responsibility, and the officer’s potential to enhance investment returns for the investors in our funds and service to our advisory clients, and to contribute to long-term unitholder value. In evaluating these factors, Mr. Schwarzman and Mr. James relied upon their judgment to determine the ultimate amount of a named executive officer’s annual cash bonus payment and participation in carried interest, incentive fees and investment advisory client interests that was necessary to properly induce the named executive officer to seek to achieve our objectives and reward a named executive officer in achieving those objectives over the course of the prior year. Key factors that Mr. Schwarzman considered in making such determination with respect to Mr. James were his service as President and Chief Operating Officer, his role in overseeing the growth and operations of the firm, and his leadership on the strategic direction of the firm generally. Key factors that Mr. Schwarzman and Mr. James considered in making such determinations with respect to Mr. Hill were his leadership and oversight of our Hedge Fund Solutions business, including his role in the oversight and development of new products and strategies, and his leadership on strategic initiatives undertaken by the firm. Key factors that Mr. Schwarzman and Mr. James considered in making such determinations with respect to Mr. Chae were his leadership and oversight of our global finance, treasury, technology and corporate development function and his role in strategic initiatives undertaken by the firm. Key factors that Mr. Schwarzman and Mr. James considered in making such determinations with respect to Ms. Solotar were her leadership and oversight of our external relations function, her role, as the head of Private Wealth Solutions, in expanding our delivery of products to meet the needs of individual investors and smaller institutions, as well as her role in strategic initiatives undertaken by the firm. For 2016, Mr. Schwarzman and Mr. James also considered each named executive officer’s prior-year annual cash bonus payments, indicative participation interests disclosed to the named executive officer at the beginning of the year, his allocated share of performance interests through participation in our Performance Plans, the appropriate balance between incentives for long-term and short-term performance, and the compensation paid to the named executive officer’s peers within the firm.
238
Table of Contents
Minimum Retained Ownership Requirements
The minimum retained ownership requirements for our named executive are described below under “— Narrative Disclosure to Summary Compensation Table and Grants of Plan-Based Awards in 2016 — Terms of Blackstone Holdings Partnership Units Granted in 2016 and Prior Years — Minimum Retained Ownership Requirements.”
Compensation Committee Report
The board of directors of our general partner does not have a compensation committee. The members of the executive committee of the board of directors identified below have reviewed and discussed with management the foregoing Compensation Discussion and Analysis and, based on such review and discussion, have determined that the Compensation Discussion and Analysis should be included in this annual report.
Stephen A. Schwarzman, Chairman
Hamilton E. James
J. Tomilson Hill
Bennett J. Goodman
Jonathan D. Gray
Compensation Committee Interlocks and Insider Participation
As described above, we do not have a compensation committee. Our founder Mr. Schwarzman makes all such compensation determinations based in large part on recommendations from Mr. James. For a description of certain transactions between us and Mr. Schwarzman, see “— Item 13. Certain Relationships and Related Transactions, and Director Independence.”
Summary Compensation Table
The following table provides summary information concerning the compensation of our Chief Executive Officer, our Chief Financial Officer and each of our three other most highly compensated employees who served as executive officers at December 31, 2016, for services rendered to us. These individuals are referred to as our named executive officers in this annual report.
| Name and Principal Position |
Year | Salary | Bonus (a) | Stock Awards (b) |
All Other Compensation (c) |
Total | ||||||||||||||||||
| Stephen A. Schwarzman |
2016 | $ | 350,000 | $ | — | $ | — | $ | 46,618,924 | $ | 46,968,924 | |||||||||||||
| Chairman and Chief Executive Officer | 2015 | $ | 350,000 | $ | — | $ | — | $ | 89,137,817 | $ | 89,487,817 | |||||||||||||
| 2014 | $ | 350,000 | $ | — | $ | — | $ | 85,538,640 | $ | 85,888,640 | ||||||||||||||
| Hamilton E. James |
2016 | $ | 350,000 | $ | 37,497,853 | $ | — | $ | 20,446,203 | $ | 58,294,056 | |||||||||||||
| President Chief Operating Officer | 2015 | $ | 350,000 | $ | 35,246,105 | $ | — | $ | 40,312,608 | $ | 75,908,713 | |||||||||||||
| 2014 | $ | 350,000 | $ | 37,435,891 | $ | 679,326 | $ | 39,866,813 | $ | 78,332,030 | ||||||||||||||
| J. Tomilson Hill |
2016 | $ | 350,000 | $ | 7,524,212 | $ | 6,975,943 | $ | 1,551,849 | $ | 16,402,004 | |||||||||||||
| Vice Chairman |
2015 | $ | 350,000 | $ | 9,253,650 | $ | 5,521,215 | $ | 1,634,816 | $ | 16,759,681 | |||||||||||||
| 2014 | $ | 350,000 | $ | 13,557,310 | $ | 11,243,928 | $ | 789,052 | $ | 25,940,290 | ||||||||||||||
| Michael S. Chae |
2016 | $ | 350,000 | $ | 5,144,258 | $ | 24,681,013 | $ | 2,585,167 | $ | 32,760,438 | |||||||||||||
| Chief Financial Officer | 2015 | $ | 350,000 | $ | 4,650,000 | $ | — | $ | 6,976,078 | $ | 11,976,078 | |||||||||||||
| Joan Solotar |
2016 | $ | 350,000 | $ | 3,557,217 | $ | 2,121,750 | $ | 1,025,358 | $ | 7,054,325 | |||||||||||||
| Head of Private Wealth Solutions and External Relations | 2015 | $ | 350,000 | $ | 3,154,837 | $ | 3,755,578 | $ | 1,423,016 | $ | 8,683,431 | |||||||||||||
| 2014 | $ | 350,000 | $ | 3,731,393 | $ | 2,049,828 | $ | 1,396,998 | $ | 7,528,219 | ||||||||||||||
| (a) | The amounts reported in this column reflect the annual cash bonus payments made for performance in the indicated year. |
239
Table of Contents
The amounts reported as “bonus” for 2016 for Messrs. Hill, Chae and Ms. Solotar are shown net of their respective mandatory deferral pursuant to the Deferred Compensation Plan. The deferred amounts for 2016 were as follows: Mr. Hill, $5,207,936, Mr. Chae, $578,159 and Ms. Solotar, $1,072,783. For additional information on the Deferred Compensation Plan, see “— Nonqualified Deferred Compensation for 2016 — Narrative to Nonqualified Deferred Compensation for 2016 Table.”
| (b) | The reference to “stock” in this table refers to deferred restricted Blackstone Holdings Partnership Units or deferred restricted common units. The amounts reported in this column represent the grant date fair value of stock awards granted for financial statement reporting purposes in accordance with GAAP pertaining to equity-based compensation. The assumptions used in determining the grant date fair value are set forth in Note 16. “Equity-Based Compensation” in the “Notes to Consolidated Financial Statements” in “Part II. Item 8. Financial Statements and Supplementary Data.” |
Amounts reported for 2016 reflect the following deferred equity awards granted on January 13, 2017 for 2016 performance pursuant to the Deferred Compensation Plan: Mr. Hill, 187,065 deferred restricted common units with a grant date fair value of $5,628,786, Mr. Chae, 20,767 deferred restricted common units with a grant date fair value of $624,879 and Ms. Solotar, 38,534 deferred restricted common units with a grant date fair value of $1,159,488. The grant date fair value of the stock award reflecting the deferred bonus amount is computed in accordance with GAAP and generally differs from the dollar amount of the portion of the bonus that is required to be deferred under the Deferred Compensation Plan. For additional information on the Deferred Compensation Plan, see “— Nonqualified Deferred Compensation for 2016 — Narrative to Nonqualified Deferred Compensation for 2016 Table.”
Amounts reported for 2016 also reflect the following discretionary equity awards granted on July 1, 2016 under the 2007 Equity Incentive Plan: Mr. Hill, 54,986 deferred restricted Blackstone Holdings Partnership Units, Mr. Chae, 981,883 deferred restricted Blackstone Holdings Partnership Units and Ms. Solotar, 39,726 deferred restricted Blackstone Holdings Partnership Units. The July 1, 2016 grant date fair value of the stock award reflecting the discretionary equity award amount is computed in accordance with GAAP and generally differs from the dollar amount of the discretionary equity award which was determined in January 2016.
| (c) | Amounts reported for 2016 include cash payments in respect of carried interest or incentive fee allocations relating to our Performance Plans to the named executive officer in 2016 as follows: $45,645,844 for Mr. Schwarzman, $20,266,590 for Mr. James, $2,535,126 for Mr. Chae, $1,551,849 for Mr. Hill and $1,005,342 for Ms. Solotar, respectively. Any in-kind distributions in respect of carried interest are reported based on the market value of the securities distributed as of the date of distribution. For 2016, Messrs. Schwarzman, James and Chae were the only named executive officers who received such in-kind distributions. We have determined to present compensation relating to carried interest and incentive fees within the Summary Compensation Table in the year in which such compensation is paid to the named executive officer under the terms of the relevant Performance Plan. Accordingly, the amounts presented in the table differ from the compensation expense recorded by us on an accrual basis for such year in respect of carried interest and incentive fees allocable to a named executive officer, which accrued amounts for 2016 are separately disclosed in this footnote to the Summary Compensation Table. We believe that the presentation of the actual amounts of carried interest- and incentive fee-related compensation paid to a named executive officer during the year, instead of the amounts of compensation expense we have recorded on an accrual basis, most appropriately reflects the actual compensation received by the named executive officer and represents the amount most directly aligned with the named executive officer’s actual performance. By contrast, the amount of compensation expense accrued in respect of carried interest and incentive fees allocable to a named executive officer can be highly volatile from year to year, with amounts accrued in one year being reversed in a following year, and vice versa, causing such amounts to be less useful as a measure of the compensation actually earned by a named executive officer in any particular year. |
To the extent compensation expense recorded by us on an accrual basis in respect of carried interest or incentive fee allocations (rather than cash payments) were to be included for 2016, the amounts would be $72,907,527 for Mr. Schwarzman, $39,398,580 for Mr. James, $2,972,262 for Mr. Hill, $7,654,408 for
240
Table of Contents
Mr. Chae and $1,634,927 for Ms. Solotar. For financial statement reporting purposes, the accrual of compensation expense is equal to the amount of carried interest and incentive fees related to performance fee revenues as of the last day of the relevant period as if the performance fee revenues in the funds generating such carried interest or incentive fees were realized as of the last day of the relevant period.
With respect to Messrs. Schwarzman, James, Chae and Ms. Solotar, amounts shown for 2016 also include the value of restricted shares of listed common stock of BXMT allocated to such named executive officers based on the closing price of BXMT’s common stock on the date of the award as follows: $857,991 for Mr. Schwarzman, $179,613 for Mr. James, $50,041 for Mr. Chae and $20,016 for Ms. Solotar. These restricted shares will vest over three years with one-third of the shares vesting at the end of the first year after the date of the award and the remaining shares vesting in eight equal quarterly installments thereafter.
With the exception of $115,088 of expenses related to security services for Mr. Schwarzman in 2016, perquisites and other personal benefits to the named executive officers were less than $10,000 and information regarding perquisites and other personal benefits has therefore not been included. As noted above under “— Compensation Discussion and Analysis — Compensation Elements for Named Executive Officers — Other Benefits,” we consider the expenses for security services for Mr. Schwarzman to be for our benefit, and the board of directors of our general partner considers the related expenses to be appropriate business expenses rather than personal benefits for Mr. Schwarzman. Mr. Schwarzman makes business and personal use of a car and driver and he and members of his family also make occasional business and personal use of an airplane in which we have a fractional interest and in each case he bears the full cost of such personal usage. In addition, certain Blackstone personnel administer personal matters for Mr. Schwarzman and certain matters for the Stephen A. Schwarzman Education Foundation (“SASEF”), and Mr. Schwarzman and SASEF, respectively, bear the full incremental cost to us of such personnel. There is no incremental expense incurred by us in connection with the use of any car and driver, airplane or personnel by Mr. Schwarzman, as described above.
During 2016, cash distributions to our named executive officers in respect of Blackstone legacy funds and investments that were not contributed to Blackstone Holdings pursuant to the reorganization were $24,466 to Mr. Schwarzman, $1,048 to Mr. James, $5,041 to Mr. Hill and $485 to Ms. Solotar.
Grants of Plan-Based Awards in 2016
The following table provides information concerning unit awards granted in 2016 or, for deferred restricted common units granted under the Deferred Compensation Plan, with respect to 2016, to our named executive officers:
| Name |
Grant Date | All Other Stock Awards: Number of Shares of Stock or Units (a) |
Grant Date Fair Value of Stock and Option Awards (a) |
|||||||||
| Stephen A. Schwarzman |
— | — | $ | — | ||||||||
| Hamilton E. James |
— | — | $ | — | ||||||||
| J. Tomilson Hill |
7/1/2016 | 54,986 | (b) | $ | 1,347,157 | |||||||
| 1/13/2017 | 187,065 | (c) | $ | 5,628,786 | ||||||||
| Michael S. Chae |
7/1/2016 | 981,883 | (b) | $ | 24,056,134 | |||||||
| 1/13/217 | 20,767 | (c) | $ | 624,879 | ||||||||
| Joan Solotar |
7/1/2016 | 39,276 | (b) | $ | 962,262 | |||||||
| 1/13/2017 | 38,534 | (c) | $ | 1,159,488 | ||||||||
| (a) | The references to “stock” or “shares” in this table refer to deferred restricted Blackstone Holdings Partnership Units or our deferred restricted common units. |
| (b) | Represents deferred restricted Blackstone Holdings Partnership Units granted under our 2007 Equity Incentive Plan and reflects 2015 performance. |
241
Table of Contents
| (c) | Represents deferred restricted common units granted in 2016 under the Deferred Compensation Plan for 2016 performance. (See “— Nonqualified Deferred Compensation for 2016 — Narrative to Nonqualified Deferred Compensation for 2016 Table.”) These grants are reflected in the “Stock Awards” column of the Summary Compensation Table in 2016. |
Narrative Disclosure to Summary Compensation Table and Grants of Plan-Based Awards in 2016
Terms of Blackstone Holdings Partnership Units Granted in 2016 and Prior Years
Our pre-IPO owners, including our named executive officers other than Ms. Solotar, received Blackstone Holdings Partnership Units in the reorganization in exchange for the contribution of their equity interests in our operating subsidiaries to Blackstone Holdings and in exchange for their interests in carried interest relating to investments made by our carry funds prior to the date of the contribution. Ms. Solotar received grants of Blackstone Holdings Partnership Units following the commencement of her employment with us under our 2007 Equity Incentive Plan. Subject to the vesting and minimum retained ownership requirements and transfer restrictions set forth in the partnership agreements of the Blackstone Holdings Partnerships, these partnership units may be exchanged for our common units as described under “— Item 13. Certain Relationships and Related Transactions, and Director Independence — Exchange Agreement” below.
Vesting Provisions. All of the Blackstone Holdings Partnership Units received in the reorganization by the named executive officers (other than Ms. Solotar) in exchange for the contribution of their equity interests in our operating subsidiaries to Blackstone Holdings are now fully vested. All of the Blackstone Holdings Partnership Units received in exchange for their interests in carried interest relating to investments made by our carry funds prior to the date of the contribution were fully vested. All of the Blackstone Holdings Partnership Units granted to Ms. Solotar following the commencement of her employment with us are also now fully vested.
The 40,907 deferred restricted Blackstone Holdings Partnership Units granted to Ms. Solotar in 2012 under the 2007 Equity Incentive Plan vested 20% on July 1, 2015, 30% on July 1, 2016 and vest 50% on July 1, 2017. The 11,578 deferred restricted Blackstone Holdings Partnership Units granted to Ms. Solotar, in 2013 under the 2007 Equity Incentive Plan vested 20% on July 1, 2016, vest 30% on July 1, 2017 and 50% on July 1, 2018. The 31,071 deferred restricted Blackstone Holdings Partnership Units granted to Ms. Solotar in 2014 under the 2007 Equity Incentive Plan vest 20% on July 1, 2017, 30% on July 1, 2018 and 50% on July 1, 2019. The 23,558 and 70,674 deferred restricted Blackstone Holdings Partnership Units granted in 2015 to Mr. Hill and Ms. Solotar, respectively, under the 2007 Equity Incentive Plan vest 20% on July 1, 2018, 30% on July 1, 2019 and 50% on July 1, 2020. The 54,986 and 39,276 deferred restricted Blackstone Holdings Partnership Units granted to Mr. Hill and Ms. Solotar, respectively, in 2016 under the 2007 Equity Incentive Plan vest 20% on July 1, 2019, 30% on July 1, 2020 and 50% on July 1, 2021. The 981,883 deferred restricted Blackstone Holdings Partnership Units granted to Mr. Chae in 2016 under the 2007 Equity Incentive Plan vest annually in substantially equal installments over six years beginning in 2019.
Except as described below, unvested deferred restricted Blackstone Holdings Partnership Units are generally forfeited upon termination of employment. With respect to Ms. Solotar, the deferred restricted Blackstone Holdings Partnership Units granted to her in 2013 and 2014 will become fully vested if she is terminated by us without cause. In addition, upon the death or permanent disability of a named executive officer, all of his unvested deferred restricted Blackstone Holdings Partnership Units held at that time will vest immediately. In connection with a named executive officer’s termination of employment due to qualifying retirement, with respect to unvested deferred restricted Blackstone Holdings Partnership Units granted in 2014 and prior years, 50% of such units will generally be entitled to accelerated vesting and, with respect to unvested deferred restricted Blackstone Holdings Partnership Units granted in 2015 and 2016, 50% of such units will continue to vest and be delivered over the vesting period, subject to forfeiture if the named executive officer violates any applicable provision of his employment agreement or engages in any competitive activity (as such term is defined in the applicable award agreement). (See “Non-Competition and Non-Solicitation Agreements — Retirement.”) Further, in the event of a
242
Table of Contents
change in control (defined in the Blackstone Holdings partnership agreements as the occurrence of any person becoming the general partner of The Blackstone Group L.P. other than a person approved by the current general partner), any Blackstone Holdings Partnership Units and deferred restricted Blackstone Holdings Partnership Units will automatically be deemed vested as of immediately prior to such change in control.
All vested and unvested Blackstone Holdings Partnership Units and deferred restricted Blackstone Holdings Partnership Units (and our common units received in exchange for such Blackstone Holdings Partnership Units) held by a named executive officer will be immediately forfeited in the event he materially breaches any of his restrictive covenants set forth in the non-competition and non-solicitation agreement outlined under “Non-Competition and Non-Solicitation Agreements” or his service is terminated for cause.
Cash Distribution Equivalents. All unvested Blackstone Holdings Partnership Units and deferred restricted Blackstone Holdings Partnership Units are entitled to the payment of current cash distribution equivalents. In accordance with the SEC’s rules, the current cash distribution equivalents are not required to be reported in the Summary Compensation Table because the amounts of future cash distributions are factored into the grant date fair value of the awards.
Minimum Retained Ownership Requirements. For units granted in 2014 and prior years, while employed by us and generally for one year following the termination of employment, each of our named executive officers (except as otherwise provided below) will be required to continue to hold (and may not transfer) at least 25% of all vested units (other than vested units awarded under our Deferred Compensation Plan) received by him. For units granted in 2015 and future years each of our named executive officers (except as otherwise provided below) will be required to hold 25% of their vested units (other than vested units awarded under our Deferred Compensation Plan) until the earlier of (1) ten years after the applicable vesting date and (2) one year following termination of employment. The requirement that one continue to hold at least 25% of such vested units is subject to the qualification in Mr. Schwarzman’s case that in no event will he be required to hold units having a market value greater than $1.5 billion. Each of our named executive officers is in compliance with these minimum retained ownership requirements.
Transfer Restrictions. None of our named executive officers may transfer Blackstone Holdings Partnership Units other than pursuant to transactions or programs approved by our general partner.
This transfer restriction applies to sales, pledges of Blackstone Holdings Partnership Units, grants of options, rights or warrants to purchase Blackstone Holdings Partnership Units or swaps or other arrangements that transfer to another, in whole or in part, any of the economic consequences of ownership of the Blackstone Holdings Partnership Units other than as approved by our general partner. We expect that our general partner will approve pledges or transfers to personal planning vehicles beneficially owned by the families of our pre-IPO owners and charitable gifts, provided that the pledgee, transferee or donee agrees to be subject to the same transfer restrictions (except as specified above with respect to Mr. Schwarzman). Transfers to Blackstone are also exempt from the transfer restrictions.
The transfer restrictions set forth above will continue to apply generally for one year following the termination of employment of a named executive officer other than Mr. Schwarzman for any reason, except that the transfer restrictions set forth above will lapse upon death or permanent disability. The transfer restrictions will lapse in the event of a change in control (as defined above).
The Blackstone Holdings Partnership Units received by other Blackstone personnel in the reorganization and pursuant to the 2007 Equity Incentive Plan are also generally subject to the vesting and minimum retained ownership requirements and transfer restrictions applicable to our named executive officers other than Mr. Schwarzman, although non-senior managing directors are also generally subject to vesting in respect of a portion of the Blackstone Holdings Partnership Units received by such personnel in the reorganization in exchange for their interests in carried interest.
243
Table of Contents
Schwarzman Founding Member Agreement
Upon the consummation of our initial public offering, we entered into a founding member agreement with Mr. Schwarzman. Mr. Schwarzman’s agreement provides that he will remain our Chairman and Chief Executive Officer while continuing service with us and requires him to give us six months’ prior written notice of intent to terminate service with us. The agreement provides that following retirement, Mr. Schwarzman will be provided with specified retirement benefits, including that he will be permitted until the third anniversary of his retirement date to retain his current office and will be provided with a car and driver. Commencing on the third anniversary of his retirement date and continuing until the tenth anniversary thereof, we will provide him with an appropriate office if he so requests. Additionally, Mr. Schwarzman will be provided with an assistant and access to office services during the ten-year period following his retirement date.
Mr. Schwarzman will also continue to receive health benefits following his retirement until his death, subject to his continuing payment of the related health insurance premiums consistent with current policies. Additionally, before his retirement and during the ten-year period thereafter, Mr. Schwarzman and any foundations he may establish may continue to invest in our investment funds on a basis generally consistent with that of other partners.
Senior Managing Director Agreements
Upon the consummation of our initial public offering, we entered into substantially similar senior managing director agreements with each of our named executive officers and other senior managing directors other than our founder and Ms. Solotar. Senior managing directors who have joined the firm after our initial public offering (including Ms. Solotar) have also entered into senior managing director agreements. The agreements generally provide that each senior managing director will devote substantially all of his or her business time, skill, energies and attention to us in a diligent manner. Each senior managing director will be paid distributions and benefits in amounts determined by Blackstone from time to time in its sole discretion. The agreements require us to provide the senior managing director with 90 days’ prior written notice prior to terminating his or her service with us (other than a termination for cause). Additionally, the agreements require each senior managing director to give us 90 days’ prior written notice of intent to terminate service with us and require the senior managing director to be placed on a 90-day period of “garden leave” following the senior managing director’s termination of service (as further described under the caption “— Non-Competition and Non-Solicitation Agreements” below).
Outstanding Equity Awards at 2016 Fiscal Year End
The following table provides information regarding outstanding unvested equity awards made to our named executive officers as of December 31, 2016.
| Stock Awards (a) | ||||||||
| Name |
Number of Shares or Units of Stock That Have Not Vested |
Market Value of Shares or Units of Stock That Have Not Vested (b) |
||||||
| Stephen A. Schwarzman |
— | $ | — | |||||
| Hamilton E. James (c) |
— | $ | — | |||||
| J. Tomilson Hill (c) |
245,455 | $ | 6,634,649 | |||||
| Michael Chae |
1,002,650 | $ | 27,165,177 | |||||
| Joan Solotar |
267,968 | $ | 7,361,089 | |||||
| (a) | The references to “stock” or “shares” in this table refer to unvested deferred restricted Blackstone Holdings Partnership Units and unvested deferred restricted common units granted under the Deferred Compensation Plan (including deferred restricted common units granted to Mr. Chae and Ms. Solotar in 2017 in respect of 2016 performance and the unvested premium portion of deferred restricted common units granted to Mr. Hill under the Deferred Compensation Plan). The vesting terms of these awards are described under the captions “Narrative Disclosure to Summary Compensation Table and Grants of Plan-Based Awards in 2016 — Terms of |
244
Table of Contents
| Blackstone Holdings Partnership Units Granted in 2016 and Prior Years” above and “— Nonqualified Deferred Compensation for 2016 — Narrative to Nonqualified Deferred Compensation for 2016 Table” below. |
| (b) | The dollar amounts shown under this column were calculated by multiplying the number of unvested deferred restricted Blackstone Holdings Partnership Units or unvested deferred restricted common units held by the named executive officer by the closing market price of $27.03 per Blackstone common unit on December 31, 2016, the last trading day of 2016, other than the deferred restricted common units granted in 2017 in respect of 2016 performance, which are valued as of the date of their grant. |
| (c) | This table does not reflect (1) undelivered deferred restricted common units that were granted to Messrs. James and Hill in 2015 pursuant to the Deferred Compensation Plan in respect of 2014 performance that were considered vested on the date of grant due to their retirement eligibility, (2) undelivered deferred restricted common units that were granted to Mr. Hill pursuant to the Deferred Compensation Plan in 2017 in respect of 2016 performance and in 2016 in respect of 2015 performance that, in each case, were considered vested on the date of grant due to his retirement eligibility and (3) mandatorily deferred and vested, but undelivered, deferred restricted common units that were granted to Mr. Hill pursuant to the Deferred Compensation Plan in respect of 2013 and 2012. These deferred restricted common units are reflected in the Nonqualified Deferred Compensation for 2016 Table below. |
Option Exercises and Stock Vested in 2016
The following table provides information regarding the number of outstanding initially unvested equity awards made to our named executive officers that vested during 2016 or, for deferred restricted common units granted to Mr. Hill under the Deferred Compensation Plan, with respect to 2016:
| Stock Awards (a) | ||||||||
| Name |
Number of Shares Acquired on Vesting |
Value Realized on Vesting (b) |
||||||
| Stephen A. Schwarzman |
— | $ | — | |||||
| Hamilton E. James |
— | $ | — | |||||
| J. Tomilson Hill (c) |
214,558 | $ | 6,302,364 | |||||
| Michael S. Chae |
— | $ | — | |||||
| Joan Solotar |
234,715 | $ | 6,745,454 | |||||
| (a) | The references to “stock” or “shares” in this table refer to deferred restricted Blackstone Holdings Partnership Units and our deferred restricted common units. |
| (b) | The value realized on vesting is based on the closing market prices of our common units on the day of vesting. |
| (c) | For Mr. Hill, includes 187,065 deferred restricted common units granted pursuant to the Deferred Compensation Plan in 2017 in respect of 2016 performance, with a value realized on vesting of $5,628,786, which were all considered vested and undelivered on the date of grant due to Mr. Hill’s retirement eligibility. These deferred restricted common units are scheduled to be delivered in equal annual installments over the three year deferral period and are reflected in the Nonqualified Deferred Compensation for 2016 Table below. |
245
Table of Contents
Nonqualified Deferred Compensation for 2016
The following table provides information with respect to (1) undelivered deferred restricted common units that were granted to Messrs. James and Hill in 2015 pursuant to the Deferred Compensation Plan in respect of 2014 performance that were considered vested on the date of grant due to their retirement eligibility, (2) undelivered deferred restricted common units that were granted to Mr. Hill pursuant to the Deferred Compensation Plan in 2017 in respect of 2016 performance and in 2016 in respect of 2015 performance that, in each case, were considered vested on the date of grant due to his retirement eligibility and (3) mandatorily deferred and vested, but undelivered, deferred restricted common units that were granted to Mr. Hill pursuant to the Deferred Compensation Plan in respect of 2013 and 2012.
| Name |
Executive Contributions in 2016 |
Registrant Contributions in 2016 (a) |
Aggregate Earnings (Losses) in 2016 (b) |
Aggregate Withdrawals/ Distributions (c) |
Aggregate Balance at December 31, 2016 (d) |
|||||||||||||||
| Stephen A. Schwarzman |
$ | — | $ | — | $ | — | $ | — | $ | — | ||||||||||
| Hamilton E. James |
$ | — | $ | — | $ | (15,100 | ) | $ | 214,895 | $ | 369,338 | |||||||||
| J. Tomilson Hill |
$ | — | $ | 5,628,786 | $ | (463,687 | ) | $ | 8,831,973 | $ | 24,792,380 | |||||||||
| Michael S. Chae |
$ | — | $ | — | $ | — | $ | — | $ | — | ||||||||||
| Joan Solotar |
$ | — | $ | — | $ | — | $ | — | $ | — | ||||||||||
| (a) | This column represents the mandatory deferral of a portion of Mr. Hill’s annual cash bonuses for 2016 into 187,065 deferred restricted common units pursuant to our Deferred Compensation Plan. These units were granted to Mr. Hill in 2017 in respect of 2016 performance. These deferred restricted common units are deemed vested due to retirement eligibility, but will be delivered in equal annual installments over three years. This amount is also reflected in the “Stock Awards” column of the Summary Compensation Table for the last completed fiscal year (see footnote (b) to the Summary Compensation Table). |
| (b) | This column represents (1) the earnings/(losses) during 2016 on deferred restricted common units granted to Messrs. James and Hill pursuant to our Deferred Compensation Plan through the earlier of their delivery or December 31, 2016 and (2) the payment of current cash distribution equivalents on deferred restricted common units granted to Messrs. James and Hill pursuant to the Deferred Compensation Plan in 2015 in respect of 2014 and in 2016 in respect of 2015 through the earlier of their delivery or December 31, 2016. No portion of any earnings would be considered above-market or preferential and, accordingly, no earnings are reflected in the Summary Compensation Table. |
| (c) | This column represents (1) the value of 6,833 and 300,351 deferred common units that were delivered to Messrs. James and Hill, respectively, in 2016 based on the closing market price per Blackstone common unit on the date(s) of delivery and (2) the payment of current cash distribution equivalents on deferred restricted common units granted to Messrs. James and Hill pursuant to the Deferred Compensation Plan in 2015 in respect of 2014 and in 2016 in respect of 2015. |
| (d) | Represents the value as of December 31, 2016 of 13,664 deferred restricted common units granted to Mr. James and 896,040 deferred restricted common units granted to Mr. Hill. With respect to Messrs. James and Hill, $452,862 and $19,128,306 has been previously reported in the “Stock Awards” column of the Summary Compensation Table, respectively. The values set forth in this column are based on the closing market price of $27.03 per Blackstone common units on December 30, 2016, other than the units granted in 2017 in respect of 2016 performance, which are valued as of the date of their grant. |
Narrative to Nonqualified Deferred Compensation for 2016 Table
In 2007, we established our Deferred Compensation Plan (which we also refer to as our “Bonus Deferral Plan”) for certain eligible employees of Blackstone and certain of its affiliates in order to provide such eligible employees with a pre-tax deferred incentive compensation opportunity and to enhance the alignment of interests between such eligible employees and Blackstone and its affiliates. The Deferred Compensation Plan is an unfunded, nonqualified deferred compensation plan which provides for the automatic, mandatory deferral of a portion of each participant’s annual cash bonus payment.
246
Table of Contents
At the end of each year, the Plan Administrator (as defined in the Deferred Compensation Plan) selects plan participants in its sole discretion and notifies such individuals that they have been selected to participate in the Deferred Compensation Plan for such year. Participation is mandatory for those employees selected by the Plan Administrator to be participants. An individual, if selected, may not decline to participate in the Deferred Compensation Plan and an individual who is not so selected may not elect to participate in the Deferred Compensation Plan. The selection of participants is made on an annual basis; an individual selected to participate in the Deferred Compensation Plan for a given year may not necessarily be selected to participate in a subsequent year. For 2016, all employees other than Mr. Schwarzman and Mr. James were deemed eligible to participate in the Deferred Compensation Plan, with the deferred amount (if any) determined in accordance with the table described below. Accordingly, Messrs. Hill, Chae and Ms. Solotar each participated in the Deferred Compensation Plan for 2016.
In respect of the deferred portion of his or her annual cash bonus payment, each participant receives deferral units which represent rights to receive in the future a specified amount of common units or Blackstone Holdings Partnership Units or other equity-based awards under our 2007 Equity Incentive Plan, subject to vesting provisions described below. The amount of each participant’s annual cash bonus payment deferred under the Deferred Compensation Plan is calculated pursuant to a deferral rate table using the participant’s total annual incentive compensation, which generally includes such participant’s annual cash bonus payment and any incentive fees earned in connection with our investment funds, and is subject to certain adjustments, including reductions for mandatory contributions to our investment funds. For deferrals of 2016 annual cash bonus payments, the deferral percentage was calculated on the basis set forth in the following table (or such other table that may be adopted by the Plan Administrator).
| Portion of Annual Incentive |
Marginal Deferral Rate Applicable to Such Portion |
Effective Deferral Rate for Entire Annual Bonus (a) |
||||||
| $0 - 100,000 |
0 | % | 0.0 | % | ||||
| $100,001 - 200,000 |
15 | % | 7.5 | % | ||||
| $200,001 - 500,000 |
20 | % | 15.0 | % | ||||
| $500,001 - 750,000 |
30 | % | 20.0 | % | ||||
| $750,001 - 1,250,000 |
40 | % | 28.0 | % | ||||
| $1,250,001 - 2,000,000 |
45 | % | 34.4 | % | ||||
| $2,000,001 - 3,000,000 |
50 | % | 39.6 | % | ||||
| $3,000,001 - 4,000,000 |
55 | % | 43.4 | % | ||||
| $4,000,001 - 5,000,000 |
60 | % | 46.8 | % | ||||
| $5,000,000 + |
65 | % | 52.8 | % | ||||
| (a) | Effective deferral rates are shown for illustrative purposes only and are based on an annual cash payment equal to the maximum amount in the range shown in the far left column (which is assumed to be $7,500,000 for the last range shown). |
Mandatory Deferral Awards. Generally, deferral units are satisfied by delivery of our common units in equal annual installments over the deferral period, which was three years for grants made in respect of years prior to 2012 and four years for grants made in respect of years 2012 and 2013 (with no partial-year delivery). In 2015, the Deferred Compensation Plan was amended to return the deferral period to three years for grants made in respect of 2014 and subsequent years. Delivery of our common units underlying vested deferral units is delayed until anticipated trading window periods to better facilitate the participant’s liquidity to meet tax obligations. If the participant’s employment is terminated for cause, the participant’s undelivered deferral units (vested and unvested) will be immediately forfeited. Upon a change in control or termination of the participant’s employment because of death, any undelivered deferral units (vested and unvested) will become immediately deliverable. With respect to deferral units granted in respect of 2013 and prior years, if the participant’s employment is terminated without cause
247
Table of Contents
or because of resignation, qualifying retirement or disability, the participant’s deferral units will continue to be delivered over the applicable deferral period. However, if, following a termination of employment without cause or because of resignation, qualifying retirement or disability, the participant violates any applicable provision of his or her employment agreement (or, in the case of a resignation, engages in a competitive business (as such term is defined in his or her employment agreement)), then any deferral units that remain undelivered as of the date of such violation, will be immediately forfeited. In 2015, the Deferred Compensation Plan was amended to modify the terms of the mandatorily deferred restricted common units to provide that unvested bonus deferral awards in respect of 2014 and subsequent years will now be forfeited upon resignation, will immediately vest and be delivered if the participant’s employment is terminated without cause or because of disability and, in connection with a qualifying retirement, will continue to vest and be delivered over the applicable deferral period, subject to forfeiture if the participant violates any applicable provision of his her employment agreement or engages in any competitive activity (as such term is defined in the Deferred Compensation Plan).
The 59,301 deferred restricted common units granted under the Deferred Compensation Plan to Mr. Chae and Ms. Solotar in 2017 for 2016 performance vest 33.3% on January 1, 2018, 33.3% on January 1, 2019 and 33.4% on January 1, 2020.
Premium Awards. Prior to deferrals in respect of 2014 performance, each plan participant was eligible to receive a premium award in the amount equal to a percentage of his or her deferral amount. The percentage was selected by the Plan Administrator. Generally, except in respect of 2012, the premium award percentage was 20%. Generally, the premium award percentage in respect of 2012 was 25%. The deferral amount plus the premium award yielded the total amount of deferral units that a participant was awarded for any given year. The entire premium portion of such deferral units is, with specified exceptions, subject to continued employment of such participant through the end of the applicable deferral period and vests and is delivered at the end of such deferral period. As is the case with respect to the mandatory deferral units, delivery of our common units underlying the vested premium portion of the participant’s deferral units is delayed until anticipated trading window periods to better facilitate the participant’s liquidity to meet tax obligations. If the participant’s employment is terminated for cause, the premium portion of the participant’s undelivered deferral units (vested and unvested) will be immediately forfeited. In connection with a participant’s termination of employment without cause or because of resignation, the entire unvested premium portion of the participant’s deferral units will be immediately forfeited. In connection with a participant’s termination of employment due to qualifying retirement, 50% of the unvested premium portion of the participant’s deferral units will continue to vest at the end of the applicable deferral period and be delivered on the applicable delivery date. In connection with a participant’s termination of employment due to disability, the entire unvested premium portion of the participant’s deferral units will continue to vest at the end of the applicable deferral period and be delivered on the applicable delivery date. However, if, following a termination of employment because of qualifying retirement or disability, the participant violates any applicable provision of his or her employment agreement, including specified restrictive covenants such as a non-compete, then any such deferral units that remain undelivered as of the date of such violation will be immediately forfeited. Upon a change in control or termination of the participant’s employment because of death, the entire unvested premium portion of the participant’s deferral units will immediately vest and become deliverable. In 2015, the Deferred Compensation Plan was amended to replace the premium award component of the plan with the payment of current cash distribution equivalents on both vested and unvested deferred awards beginning with awards granted in 2015 in respect of 2014. As a result, no premium awards were granted in 2016 in respect of 2015 performance.
The 166,537 deferred restricted common units granted to Mr. Hill as premium awards under the Deferred Compensation Plan, vested 50.2% on January 1, 2017 and the remaining 49.8% vest on January 13, 2018.
Potential Payments Upon Termination of Employment or Change in Control
Upon a change of control event where any person (other than a person approved by our general partner) becomes our general partner or a termination of employment because of death, any unvested deferred restricted Blackstone Holdings Partnership Units or unvested deferred restricted common units held by any of our named
248
Table of Contents
executive officers will automatically be deemed vested as of immediately prior to such occurrence of such change of control or such termination of employment. Had such a change of control or such a termination of employment occurred on December 30, 2016, the last business day of 2016, each of our named executive officers would have vested in the following numbers of deferred restricted Blackstone Holdings Partnership Units and deferred restricted common units, having the following values based on our closing market price of $27.03 per Blackstone common unit on December 30, 2016, other than the deferred restricted common units granted in 2017 in respect of 2016 performance, which are valued as of the date of their grant: Messrs. Schwarzman and James had no outstanding unvested units at December 31, 2016; Mr. Hill — 78,918 deferred restricted Blackstone Holdings Partnership Units and 166,537 deferred restricted common units, representing the premium portion of his deferred restricted common units, with an aggregate value of $6,634,649; Mr. Chae — 981,883 deferred restricted Blackstone Holdings Partnership Units and 20,767 deferred restricted common units with an aggregate value of $27,165,177 and Ms. Solotar — 172,827 deferred restricted Blackstone Holdings Partnership Units and 95,141 deferred restricted common units with an aggregate value of $7,361,089. In addition, the Deferred Compensation Plan provides that upon a change in control or termination of the participant’s employment because of death, any fully vested but undelivered deferred restricted common units will become immediately deliverable. Therefore, had a change of control or such termination of employment occurred on December 30, 2016, Mr. James and Mr. Hill would also have been entitled to accelerated delivery of the 13,664 and 605,115 deferred restricted common units, respectively, that were granted to them pursuant to the Deferred Compensation Plan, and were considered vested on the date of grant due to their retirement eligibility. Mr. Hill would also have been entitled to accelerated delivery of his 290,925 mandatorily deferred and vested, but undelivered, deferred restricted common units granted to him under the Deferred Compensation Plan in respect of 2013 and 2012 that were outstanding as of December 31, 2016.
Upon a termination of employment because of disability, any unvested deferred restricted Blackstone Holdings Partnership Units or unvested deferred restricted common units granted under the Deferred Compensation Plan in respect of 2014 and subsequent years will also automatically be deemed vested. However, with respect to the premium portion of deferred restricted common units granted under the Deferred Compensation Plan in respect of 2013 and prior years, in connection with a participant’s termination of employment due to disability, such deferral units will continue to vest at the end of the applicable deferral period and be delivered on the applicable delivery date, subject to the participant not violating any applicable provision of his or her employment agreement. Therefore, had a termination of employment because of disability occurred on December 30, 2016, each of our named executive officers would have vested in the numbers of deferred restricted Blackstone Holdings Partnership Units and deferred restricted common units set forth in the paragraph immediately above, having the values set forth above, but Mr. Hill would not have immediately vested in his 166,537 unvested deferred restricted common units, which represent the premium portion of his deferred restricted common units. In addition, Mr. James and Mr. Hill would also have been entitled to accelerated delivery in the numbers of deferred restricted common units set forth in the paragraph immediately above that were granted to them pursuant to the Deferred Compensation Plan, which are considered vested due to their retirement eligibility.
In connection with a named executive officer’s termination of employment due to qualifying retirement, a named executive officer will generally immediately vest in 50% of their unvested deferred restricted Blackstone Holdings Partnership Units granted in 2014 and prior years and, with respect to unvested deferred restricted Blackstone Holdings Partnership Units granted in 2015 and 2016. 50% of such units will continue to vest and be delivered over the vesting period, subject to forfeiture if the named executive officer violates any applicable provision of his employment agreement or engages in any competitive activity (as such term is defined in the applicable award agreement). (See “Non-Competition and Non-Solicitation Agreements — Retirement.”) As of December 30, 2016, Mr. James and Mr. Hill were retirement eligible. Mr. James had no outstanding unvested units at December 30, 2016. If Mr. Hill had retired on December 30, 2016, then the Deferred Compensation Plan provides that 50% of the unvested premium portion of his deferred restricted common units would continue to vest at the end of the applicable deferral period and be delivered on the applicable delivery date, subject to forfeiture of any deferral units which remain undelivered as of the date of the breach of any applicable provision of his employment agreement.
249
Table of Contents
Upon a termination of Mr. Chae’s and Ms. Solotar’s employment without cause, the deferred restricted common units granted to them under the Deferred Compensation Plan in respect of 2016, 2015 and 2014, as applicable, will become fully vested. Upon a termination of Ms. Solotar’s employment without cause, the unvested deferred restricted the Blackstone Holdings Partnership Units granted to her in 2013 and 2014 will become fully vested. Had such a termination of employment occurred on December 30, 2016, the last business day of 2016, each of Mr. Chae and Ms. Solotar would have vested in the following numbers of deferred restricted Blackstone Holdings Partnership Units and deferred restricted common units, respectively, having the following values based on our closing market price of $27.03 per Blackstone common unit on December 30, 2016, other than the deferred restricted common units granted in 2017 in respect of 2016 performance, which are valued as of the date of their grant: Mr. Chae — 20,767 deferred restricted common units with a value of $624,879 and Ms. Solotar — 40,975 deferred restricted Blackstone Holdings Partnership Units with a value of $1,107,554 and 95,141 deferred restricted common units with an aggregate value of $2,689,575.
Upon a termination without cause, Mr. James and Mr. Hill would have been entitled to accelerated delivery in the numbers of deferred restricted common units set forth above in the first paragraph of this section that were granted to them pursuant to the Deferred Compensation Plan and were considered vested on the date of grant due to their retirement eligibility.
In addition, except as described below, unvested carried interest in our carry funds is generally forfeited upon termination of employment. Upon the death or disability of any named executive officer who participates in the carried interest of our carry funds, the named executive officer will be deemed 100% vested in any unvested portion of carried interest in our carry funds. Furthermore, any named executive officer that is retirement eligible will automatically vest in 50% of their otherwise unvested carried interest allocation upon retirement. (See “—Non-Competition and Non-Solicitation Agreements — Retirement.”) As of December 30, 2016, Mr. James and Mr. Hill were retirement eligible for purposes of their carried interest allocations.
In addition, pursuant to Mr. Schwarzman’s Founding Member Agreement described above under “Narrative Disclosure to Summary Compensation Table and Grants of Plan-Based Awards in 2016 — Schwarzman Founding Member Agreement,” following retirement, Mr. Schwarzman will be provided with specified retirement benefits, including an assistant during the ten-year period following his retirement and a car and driver during the three-year period following his retirement. As of December 30, 2016, the aggregate present value of these expected costs was $1.6 million, for which $209,000, $158,000 and $180,000 were expensed for financial statement purposes in each of the years ended December 31, 2016, 2015 and 2014, respectively.
Non-Competition and Non-Solicitation Agreements
Upon the consummation of our initial public offering, we entered into a non-competition and non-solicitation agreement with our founder, our other senior managing directors, most of our other professional employees and specified senior administrative personnel to whom we refer collectively as “Contracting Employees.” Contracting Employees who have joined the firm after our initial public offering have also executed non-competition and non-solicitation agreements. The following are descriptions of the material terms of each such non-competition and non-solicitation agreement. With the exception of the few differences noted in the description below, the terms of each non-competition and non-solicitation agreement are generally in relevant part similar.
Full-Time Commitment. Each Contracting Employee agrees to devote substantially all of his or her business time, skill, energies and attention to his or her responsibilities at Blackstone in a diligent manner. Our founder Mr. Schwarzman has agreed that our business will be his principal business pursuit and that he will devote such time and attention to the business of the firm as may be reasonably requested by us.
Confidentiality. Each Contracting Employee is required, whether during or after his or her employment with us, to protect and only use “confidential information” in accordance with strict restrictions placed by us on its use and disclosure. (Every employee of ours is subject to similar strict confidentiality obligations imposed by our Code of Conduct applicable to all Blackstone personnel.)
250
Table of Contents
Notice of Termination. Each Contracting Employee is required to give us prior written notice of his or her intention to leave our employ — six months in the case of Mr. Schwarzman, 90 days for all of our other senior managing directors and between 30 and 60 days in the case of all other Contracting Employees.
Garden Leave. Upon his or her voluntary departure from our firm, a Contracting Employee is required to take a prescribed period of “garden leave.” The period of garden leave is 90 days for our non-founding senior managing directors and between 30 and 60 days for all other Contracting Employees. During this period the Contracting Employee will continue to receive some of his or her Blackstone compensation and benefits, but is prohibited from commencing employment with a new employer until the garden leave period has expired. The period of garden leave for each Contracting Employee will run coterminously with the non-competition Restricted Period that applies to him or her as described below. Our founder Mr. Schwarzman is subject to non-competition covenants but not garden leave requirements.
Non-Competition. During the term of employment of each Contracting Employee, and during the Restricted Period (as such term is defined below) immediately thereafter, he or she will not, directly or indirectly:
| • | engage in any business activity in which we operate, including any competitive business, |
| • | render any services to any competitive business, or |
| • | acquire a financial interest in or become actively involved with any competitive business (other than as a passive investor holding minimal percentages of the stock of public companies). |
“Competitive business” means any business that competes, during the term of employment through the date of termination, with our business, including any businesses that we are actively considering conducting at the time of the Contracting Employee’s termination of employment, so long as he or she knows or reasonably should have known about such plans, in any geographical or market area where we or our affiliates provide our products or services.
Non-Solicitation. During the term of employment of each Contracting Employee, and during the Restricted Period immediately thereafter, he or she will not, directly or indirectly, in any manner solicit any of our employees to leave their employment with us, or hire any such employee who was employed by us as of the date of his or her termination or who left employment with us within one year prior to or after the date of his or her termination. Additionally, each Contracting Employee may not solicit or encourage to cease to work with us any consultant or senior advisers that he or she knows or should know is under contract with us.
In addition, during the term of employment of each Contracting Employee, and during the Restricted Period immediately thereafter, he or she will not, directly or indirectly, in any manner solicit the business of any client or prospective client of ours with whom he or she, employees reporting to him or her, or anyone whom he or she had direct or indirect responsibility over had personal contact or dealings on our behalf during the three-year period immediately preceding his or her termination. Contracting Employees who are employed in our asset management businesses are subject to a similar non-solicitation covenant with respect to investors and prospective investors in our investment funds.
Non-Interference and Non-Disparagement. During the term of employment of each Contracting Employee, and during the Restricted Period immediately thereafter, he or she may not interfere with business relationships between us and any of our clients, customers, suppliers or partners. Each Contracting Employee is also prohibited from disparaging us in any way.
251
Table of Contents
Restricted Period. For purposes of the foregoing covenants, the “Restricted Period” will be:
| Covenant |
Stephen A. Schwarzman |
Other Senior |
Other
Contracting | |||
| Non-competition |
Two years after termination of employment. | One year (six months for senior managing directors who are eligible to retire, as defined below) after termination of employment. | Between 90 days and six months after termination of employment. | |||
| Non-solicitation of Blackstone employees |
Two years after termination of employment. | Two years after termination of employment. | Generally one year after termination of employment. | |||
| Non-solicitation of Blackstone clients or investors |
Two years after termination of employment. | One year after termination of employment. | Generally between six months and one year after termination of employment. | |||
| Non-interference with business relationships |
Two years after termination of employment. | One year after termination of employment. | Generally between six months and one year after termination of employment. | |||
Retirement. Blackstone personnel are eligible to retire if they have satisfied either of the following tests: (a) one has reached the age of 65 and has at least five full years of service with our firm; or (b) generally one has reached the age of 55 and has at least five full years of service with our firm and the sum of his or her age plus years of service with our firm totals at least 65.
Intellectual Property. Each Contracting Employee is subject to customary intellectual property covenants with respect to works created, invented, designed or developed by him or her that are relevant to or implicated by his or her employment with us.
Specific Performance. In the case of any breach of the confidentiality, non-competition, non-solicitation, non-interference, non-disparagement or intellectual property provisions by a Contracting Employee, the breaching individual agrees that we will be entitled to seek equitable relief in the form of specific performance, restraining orders, injunctions or other equitable remedies.
Director Compensation in 2016
No additional remuneration is paid to our employees for services as a director of our general partner. In 2016, each of our non-employee directors received an annual cash retainer of $150,000 and a grant of deferred restricted common units equivalent in value to $150,000, with a grant date fair value determined as described in footnote (a) to the first table below. An additional $30,000 annual cash retainer was paid to the Chairman of the Audit Committee during 2016. An additional $25,000 annual cash retainer was paid to Mr. Light in connection with his service on the executive committee of Blackstone Group International Partners LLP.
252
Table of Contents
The following table provides the director compensation for our directors for 2016:
| Name |
Fees Earned or Paid in Cash |
Stock Awards (a) (b) |
Total | |||||||||
| Bennett J. Goodman (c) |
$ | — | $ | — | $ | — | ||||||
| Jonathan D. Gray (c) |
$ | — | $ | — | $ | — | ||||||
| James W. Breyer (d) |
$ | 69,758 | $ | 149,718 | $ | 219,476 | ||||||
| Peter T. Grauer (d) |
$ | 139,919 | $ | 153,192 | $ | 293,111 | ||||||
| Richard Jenrette |
$ | 150,000 | $ | 149,718 | $ | 299,718 | ||||||
| Rochelle B. Lazarus |
$ | 150,000 | $ | 151,200 | $ | 301,200 | ||||||
| Jay O. Light |
$ | 175,000 | $ | 150,825 | $ | 325,825 | ||||||
| The Right Honorable Brian Mulroney |
$ | 150,000 | $ | 148,552 | $ | 298,552 | ||||||
| William G. Parrett |
$ | 180,000 | $ | 149,910 | $ | 329,910 | ||||||
| (a) | The references to “stock” in this table refer to our deferred restricted common units. Amounts for 2016 represent the grant date fair value of stock awards granted in the year, computed in accordance with GAAP, pertaining to equity-based compensation. The assumptions used in determining the grant date fair value are set forth in Note 16. “Equity-Based Compensation” in the “Notes to Consolidated Financial Statements” in “Part II. Item 8. Financial Statements and Supplementary Data.” These deferred restricted common units vest, and the underlying Blackstone common units will be delivered, on the first anniversary of the date of the grant, subject to the outside director’s continued service on the board of directors of our general partner. |
| (b) | Each of our non-employee directors was granted deferred restricted common units upon appointment as a director. In 2016, in connection with the anniversary of his or her initial grant or, in the case of Messrs. Grauer and Breyer, upon appointment, each of the following directors was granted deferred restricted common units: Mr. Mulroney — 5,867 units; Mr. Parrett — 6,328 units; Mr. Jenrette — 5,972 units; Mr. Light — 5,855 units; Ms. Lazarus — 6,300 units; Mr. Grauer — 5,827 units; and Mr. Breyer — 5,972 units. The amounts of our non-employee directors’ compensation were approved by the board of directors of our general partner upon the recommendation of our founder following his review of directors’ compensation paid by comparable companies. |
The following table provides information regarding outstanding unvested equity awards made to our directors as of December 31, 2016:
| Stock Awards (1) | ||||||||
| Name |
Number of Shares or Units of Stock That Have Not Vested (2) |
Market Value of Shares or Units of Stock That Have Not Vested (3) |
||||||
| James W. Breyer |
5,972 | $ | 161,423 | |||||
| Peter T. Grauer |
5,827 | $ | 157,504 | |||||
| Richard Jenrette |
5,972 | $ | 161,423 | |||||
| Rochelle B. Lazarus |
6,300 | $ | 170,289 | |||||
| Jay O. Light |
5,855 | $ | 158,261 | |||||
| The Right Honorable Brian Mulroney |
5,867 | $ | 158,585 | |||||
| William G. Parrett |
6,328 | $ | 171,046 | |||||
| (1) | The references to “stock” or “shares” in this table refer to our deferred restricted common units. |
| (2) | The dollar amounts shown in this column were calculated by multiplying the number of unvested deferred restricted common units held by the director by the closing market price of $27.03 per Blackstone common unit on December 30, 2016, the last trading day of 2016. |
| (c) | Mr. Gray and Mr. Goodman are employees and no additional remuneration is paid to them for service as directors of our general partner. Mr. Gray’s and Mr. Goodman’s employee compensation is discussed in “— Item 13. Certain Relationships and Related Transactions, and Director Independence.” |
253
Table of Contents
| (d) | Messrs. Breyer and Grauer were appointed to Blackstone’s Board of Directors on July 14, 2016 and January 26, 2016, respectively. Therefore, the amounts reported for Messrs. Breyer and Grauer reflect the pro-rated portion of their respective annual cash retainers earned from the date of their respective appointments. |
| ITEM 12. | SECURITY OWNERSHIP OF CERTAIN BENEFICIAL OWNERS AND MANAGEMENT AND RELATED STOCKHOLDER MATTERS |
The following table sets forth information regarding the beneficial ownership of our common units and Blackstone Holdings Partnership Units as of February 17, 2017 by:
| • | each person known to us to beneficially own 5% of any class of the outstanding voting securities of The Blackstone Group L.P.; |
| • | each member of our general partner’s board of directors; |
| • | each of the named executive officers of our general partner; and |
| • | all directors and executive officers of our general partner as a group. |
The amounts and percentage of units beneficially owned are reported on the basis of regulations of the SEC governing the determination of beneficial ownership of securities. Under the rules of the SEC, a person is deemed to be a “beneficial owner” of a security if that person has or shares “voting power,” which includes the power to vote or to direct the voting of such security, or “investment power,” which includes the power to dispose of or to direct the disposition of such security. A person is also deemed to be a beneficial owner of any securities of which that person has a right to acquire beneficial ownership within 60 days of February 17, 2017. Under these rules, more than one person may be deemed a beneficial owner of the same securities and a person may be deemed a beneficial owner of securities as to which he has no economic interest. Except as indicated by footnote, the persons named in the table below have sole voting and investment power with respect to all units shown as beneficially owned by them, subject to community property laws where applicable. Unless otherwise included, for purposes of this table, the principal business address for each such person is c/o The Blackstone Group L.P., 345 Park Avenue, New York, New York 10154.
| Common Units, Beneficially Owned |
Blackstone Holdings Partnership Units Beneficially Owned (a) |
|||||||||||||||
| Name of Beneficial Owner |
Number | % of Class |
Number | % of Class |
||||||||||||
| 5% Unitholders: |
||||||||||||||||
| FMR LLC (b) |
40,628,071 | 7.0 | % | — | — | |||||||||||
| Directors and Executive Officers (c)(d) |
||||||||||||||||
| Stephen A. Schwarzman (e)(f) |
— | — | 231,924,793 | 46.1 | % | |||||||||||
| Hamilton E. James (f) |
13,665 | * | 32,180,300 | 6.4 | % | |||||||||||
| J. Tomilson Hill (f)(g) |
2,446,716 | * | 14,445,085 | 2.9 | % | |||||||||||
| Bennett J. Goodman (f)(g) |
707,092 | * | 3,571,818 | * | ||||||||||||
| Jonathan D. Gray (f) |
15,605 | — | 40,585,300 | 8.1 | % | |||||||||||
| Michael S. Chae (f) |
— | — | 5,831,432 | 1.2 | % | |||||||||||
| Joan Solotar |
107,883 | * | 354,394 | * | ||||||||||||
| James W. Breyer |
— | * | — | — | ||||||||||||
| Peter T. Grauer |
5,827 | * | — | — | ||||||||||||
| Richard Jenrette |
44,206 | * | — | — | ||||||||||||
| Rochelle B. Lazarus |
27,426 | * | — | — | ||||||||||||
| Jay O. Light |
44,021 | * | — | — | ||||||||||||
| The Right Honorable Brian Mulroney |
149,679 | * | — | — | ||||||||||||
| William G. Parrett |
69,604 | * | — | — | ||||||||||||
| All executive officers and directors as a group (15 persons) |
3,745,428 | * | 329,247,801 | 65.5 | % | |||||||||||
254
Table of Contents
| * | Less than one percent |
| (a) | Subject to certain requirements and restrictions, the partnership units of Blackstone Holdings are exchangeable for common units of The Blackstone Group L.P. on a one-for-one basis. A Blackstone Holdings limited partner must exchange one partnership unit in each of the five Blackstone Holdings Partnerships to effect an exchange for a common unit. See “Item 13. Certain Relationships and Related Transactions, and Director Independence — Exchange Agreement.” Beneficial ownership of Blackstone Holdings Partnership Units reflected in this table has not been also reflected as beneficial ownership of the common units of The Blackstone Group L.P. for which such units may be exchanged. |
| (b) | Reflects units beneficially owned by FMR, LLC and its subsidiaries based on the Schedule 13G filed by FMR, LLC on February 14, 2017. The address of FMR, LLC is 245 Summer Street, Boston, Massachusetts 02210. |
| (c) | The units beneficially owned by the directors and executive officers reflected above do not include the following number of units that will be delivered to the respective individual more than 60 days after February 17, 2017: Mr. James — 6,832 deferred restricted common units; Mr. Hill — 78,918 deferred restricted Blackstone Holdings Partnership Units and 614,654 deferred restricted common units; Mr. Chae — 981,883 deferred restricted Blackstone Holdings Partnership Units — 20,767 deferred restricted common units; Mr. Goodman — 3,872,678 deferred restricted Blackstone Holdings Partnership Units; Mr. Gray — 307,518 deferred restricted common units; Ms. Solotar — 172,827 deferred restricted Blackstone Holdings Partnership Units — 72,898 deferred restricted common units ; Mr. Mulroney — 5,867 deferred restricted common units; Mr. Parrett — 6,328 deferred restricted common units; Mr. Jenrette — 5,972 deferred restricted common units; Ms. Lazarus — 6,300 deferred restricted common units; Mr. Light — 5,855 deferred restricted common units; Mr. Grauer — 4,811 deferred restricted common units; Mr. Breyer — 5,972 deferred restricted common units; and all other executive officers and directors as a group — 230,856 deferred restricted Blackstone Holdings Partnership Units and 87,852 deferred restricted common units. |
| (d) | The Blackstone Holdings Partnership Units shown in the table above include the following number of vested units being held back under our minimum retained ownership requirements that are required to be held throughout employment with the firm and generally for one year following termination of employment: Mr. Schwarzman — 49,636,003 Blackstone Holdings Partnership Units; Mr. James — 14,648,744 Blackstone Holdings Partnership Units; Mr. Hill — 4,654,018 Blackstone Holdings Partnership Units; Mr. Goodman — 1,105,386 Blackstone Holdings Partnership Units; Mr. Gray — 11,477,971 Blackstone Holdings Partnership Units; Mr. Chae — 3,182,160 Blackstone Holdings Partnership Units; Ms. Solotar — 111,083 Blackstone Holdings Partnership Units; and all other executive officers and directors as a group — 130,170 Blackstone Holdings Partnership Units. |
| (e) | On those few matters that may be submitted for a vote of the limited partners of The Blackstone Group L.P., Blackstone Partners L.L.C., an entity wholly owned by our senior managing directors, holds a special voting unit in The Blackstone Group L.P. that provides it with an aggregate number of votes on any matter that may be submitted for a vote of our common unitholders that is equal to the aggregate number of vested and unvested Blackstone Holdings Partnership Units held by the limited partners of Blackstone Holdings on the relevant record date and entitles it to participate in the vote on the same basis as our common unitholders. Our senior managing directors have agreed in the limited liability company agreement of Blackstone Partners L.L.C. that our founder, Mr. Schwarzman, will have the power to determine how the special voting unit held by Blackstone Partners L.L.C. will be voted. Following the withdrawal, death or disability of Mr. Schwarzman (and any successor founder), this power will revert to the members of Blackstone Partners L.L.C. holding a majority in interest in that entity. The limited liability company agreement of Blackstone Partners L.L.C. provides that at such time as Mr. Schwarzman should cease to be a founding member, Hamilton E. James will thereupon succeed Mr. Schwarzman as the sole founding member of Blackstone Partners L.L.C. If Blackstone Partners L.L.C. directs us to do so, we will issue special voting units to each of the limited partners of Blackstone Holdings, whereupon each special voting unitholder will be entitled to a number of votes that is equal to the number of vested and unvested Blackstone Holdings Partnership Units held by such special voting unitholder on the relevant record date. |
| (f) | The Blackstone Holdings Partnership Units shown in the table above for such named executive officers and directors include (a) the following units held for the benefit of family members with respect to which the |
255
Table of Contents
| named executive officer or director, as applicable, disclaims beneficial ownership: Mr. Schwarzman — 1,666,666 units held in various trusts for which Mr. Schwarzman is the investment trustee, Mr. James — 10,657,207 units held in various trusts for which Mr. James and his brother are trustees (but Mr. James does not have or share investment control with respect to the units), Mr. Hill — 5,636,348 units held in various trusts for which Mr. Hill’s spouse is the investment trustee and 2,683,308 units held in a family limited liability company, Mr. Chae — 1,150,070 units held in a trust for which Mr. Chae is the investment trustee, Mr. Gray — 4,566,437 units held in a trust for which Mr. Gray is the investment trustee and Ms. Solotar — 81,812 units held in a trust for which Ms. Solotar is the investment trustee, (b) the following units held in grantor retained annuity trusts for which the named executive officer or director, as applicable, is the investment trustee: Mr. Schwarzman — 3,176,778 units, Mr. James — 4,000,000 units, Mr. Gray — 23,296,432 units and Ms. Solotar — 150,454 units, and (c) the following units held by a corporation for which the named executive officer is a controlling shareholder: Mr. Schwarzman — 1,438,529 units and Mr. Goodman — 1,737,550 units owned by family limited liability companies. Mr. Schwarzman also directly, or through a corporation for which he is the controlling shareholder, beneficially owns an additional 364,278 partnership units in each of Blackstone Holdings II L.P., Blackstone Holdings III L.P. and Blackstone Holdings IV L.P. In addition, with respect to Mr. Schwarzman, the above table excludes partnership units of Blackstone Holdings held by his children or in trusts for the benefit of his family as to which he has no voting or investment control. |
| (g) | The Blackstone common units shown in the table above for each named executive officer and director include the following units held for the benefit of family members with respect to which the named executive officer or director, as applicable, disclaims beneficial ownership: Mr. Hill — 1,698,442 units held in family limited liability companies and Mr. Goodman — 707,092 units held in family limited liability companies. |
In addition, as of February 17, 2017, Beijing Wonderful Investments, an investment vehicle established and controlled by the People’s Republic of China, holds 54,470,009 of our non-voting common units and may from time to time make open market purchases or sales of our voting common units.
Securities Authorized for Issuance under Equity Compensation Plans
The table set forth below provides information concerning the awards that may be issued under the 2007 Equity Incentive Plan as of December 31, 2016:
| Number of Securities to be Issued Upon Exercise of Outstanding Options, Warrants and Rights (a) |
Weighted-Average Exercise Price of Outstanding Options, Warrants and Rights |
Number of Securities Remaining Available for Future Issuance Under Equity Compensation Plans (excluding securities reflected in column (a)) (b) |
||||||||||
| Equity Compensation Plans Approved by Security Holders |
60,523,916 | — | 161,427,727 | |||||||||
| Equity Compensation Plans Not Approved by Security Holders |
— | — | — | |||||||||
|
|
|
|
|
|
|
|||||||
| Total |
60,523,916 | — | 161,427,727 | |||||||||
|
|
|
|
|
|
|
|||||||
| (a) | Reflects the outstanding number of our deferred restricted common units and deferred restricted Blackstone Holdings Partnership Units granted under the 2007 Equity Incentive Plan as of December 31, 2016. |
| (b) | The aggregate number of our common units and Blackstone Holdings Partnership Units covered by the 2007 Equity Incentive Plan is increased on the first day of each fiscal year during its term by a number of units equal to the positive difference, if any, of (a) 15% of the aggregate number of our common units and Blackstone Holdings Partnership Units outstanding on the last day of the immediately preceding fiscal year (excluding Blackstone Holdings Partnership Units held by The Blackstone Group L.P. or its wholly owned subsidiaries) minus (b) the aggregate number of our common units and Blackstone Holdings Partnership Units covered by the 2007 Equity Incentive Plan as of such date (unless the administrator of the 2007 Equity Incentive Plan |
256
Table of Contents
| should decide to increase the number of our common units and Blackstone Holdings Partnership Units covered by the plan by a lesser amount). As of January 1, 2017, pursuant to this formula, 170,379,944 units, which is equal to 0.15 times the number of our common units and Blackstone Holdings Partnership Units outstanding on December 31, 2016, were available for issuance under the 2007 Equity Incentive Plan. We have filed a registration statement and intend to file additional registration statements on Form S-8 under the Securities Act to register common units covered by the 2007 Equity Incentive Plan (including pursuant to automatic annual increases). Any such Form S-8 registration statement will automatically become effective upon filing. Accordingly, common units registered under such registration statement will be available for sale in the open market. |
| ITEM 13. | CERTAIN RELATIONSHIPS AND RELATED TRANSACTIONS, AND DIRECTOR INDEPENDENCE |
Transactions with Related Persons
Tax Receivable Agreements
We used a portion of the proceeds from the IPO and the sale of non-voting common units to Beijing Wonderful Investments to purchase interests in the predecessor businesses from the pre-IPO owners. In addition, holders of Blackstone Holdings Partnership Units (other than The Blackstone Group L.P.’s wholly owned subsidiaries), subject to the vesting and minimum retained ownership requirements and transfer restrictions set forth in the partnership agreements of the Blackstone Holdings partnerships, may up to four times each year (subject to the terms of the exchange agreement) exchange their Blackstone Holdings Partnership Units for The Blackstone Group L.P. common units on a one-for-one basis. A Blackstone Holdings limited partner must exchange one partnership unit in each of the Blackstone Holdings partnerships to effect an exchange for a common unit. Blackstone Holdings I L.P. and Blackstone Holdings II L.P. have made an election under Section 754 of the Internal Revenue Code effective for each taxable year in which an exchange of partnership units for common units occurs, which may result in an adjustment to the tax basis of the assets of such Blackstone Holdings partnerships at the time of an exchange of partnership units. The purchase and subsequent exchanges are expected to result in increases in the tax basis of the tangible and intangible assets of Blackstone Holdings that otherwise would not have been available. These increases in tax basis may increase (for tax purposes) depreciation and amortization and therefore reduce the amount of tax that certain of Blackstone’s wholly owned subsidiaries that are taxable as corporations for U.S. federal income purposes would otherwise be required to pay in the future. One of the subsidiaries of The Blackstone Group L.P. which is a corporate taxpayer has entered into a tax receivable agreement with holders of Blackstone Holdings Partnership Units that provides for the payment by the corporate taxpayer to such holders of 85% of the amount of cash savings, if any, in U.S. federal, state and local income tax that the corporate taxpayers actually realize (or are deemed to realize in the case of an early termination payment by the corporate taxpayers or a change in control, as discussed below) as a result of these increases in tax basis and of certain other tax benefits related to our entering into tax receivable agreements, including tax benefits attributable to payments under the tax receivable agreement. Additional tax receivable agreements have been executed, and will continue to be executed, with newly admitted Blackstone senior managing directors and certain others who acquire Blackstone Holdings Partnership Units. This payment obligation is an obligation of the corporate taxpayer and not of Blackstone Holdings. The corporate taxpayers expect to benefit from the remaining 15% of cash savings, if any, in income tax that they realize. For purposes of the tax receivable agreement, cash savings in income tax will be computed by comparing the actual income tax liability of the corporate taxpayers to the amount of such taxes that the corporate taxpayer would have been required to pay had there been no increase to the tax basis of the tangible and intangible assets of Blackstone Holdings as a result of the exchanges and had the corporate taxpayers not entered into the tax receivable agreement. A limited partner of Blackstone Holdings may also elect to exchange his or her Blackstone Holdings Partnership Units in a tax-free transaction where the limited partner is making a charitable contribution. In such a case, the exchange will not result in an increase in the tax basis of the assets of Blackstone Holdings and no payments will be made under the tax receivable agreement. The term of the tax receivable agreement commenced upon consummation of our IPO and will continue until all such tax benefits have been utilized or expired, unless the corporate taxpayers exercise their right to terminate the tax receivable agreement for an amount based on the agreed payments remaining to be made under the agreement.
257
Table of Contents
Assuming no future material changes in the relevant tax law and that the corporate taxpayers earn sufficient taxable income to realize the full tax benefit of the increased amortization of the assets, the expected future payments under the tax receivable agreement (which are taxable to the recipients) in respect of the purchase and exchanges will aggregate $1.2 billion over the next 15 years. The after-tax net present value of these estimated payments totals $406.9 million assuming a 15% discount rate and using an estimate of timing of the benefit to be received. Future payments under the tax receivable agreement in respect of subsequent exchanges would be in addition to these amounts. The payments under the tax receivable agreement are not conditioned upon continued ownership of Blackstone equity interests by the pre-IPO owners and the others mentioned above.
There was a reduction of $82.7 million to the tax receivable agreement liability to the pre-IPO owners and others mentioned above that resulted primarily from the October 1, 2015 spin-off of the financial and strategic advisory services, restructuring services and reorganization advisory services and Park Hill Group businesses.
Subsequent to December 31, 2016, payments totaling $59.7 million were made to certain pre-IPO owners and others mentioned above in accordance with the tax receivable agreement and related to tax benefits the Partnership received for the 2015 taxable year. Those payments included payments of $7.5 million to Stephen A. Schwarzman and investment vehicles controlled by relatives of Mr. Schwarzman; $2.1 million to Hamilton E. James and a trust for which Mr. James is the investment trustee; $0.9 million to J. Tomilson Hill and his trusts for which Mr. Hill is the investment trustee; $0.6 million to Michael S. Chae and $0.2 million to Bennett J. Goodman and a limited liability company controlled by a family member of Mr. Goodman.
In addition, the tax receivable agreement provides that upon certain mergers, asset sales, other forms of business combinations or other changes of control, the corporate taxpayers’ (or their successors’) obligations with respect to exchanged or acquired units (whether exchanged or acquired before or after such transaction) would be based on certain assumptions, including that the corporate taxpayers would have sufficient taxable income to fully utilize the benefits arising from the increased tax deductions and tax basis and other similar benefits. Upon a subsequent actual exchange, any additional increase in tax deductions, tax basis and other similar benefits in excess of the amounts assumed at the change in control will also result in payments under the tax receivable agreement.
Decisions we make in the course of running our business, such as with respect to mergers, asset sales, other forms of business combinations or other changes in control, may influence the timing and amount of payments that are received by an exchanging or selling holder of Blackstone Holdings Partnership Units, under the tax receivable agreement. For example, the earlier disposition of assets following an exchange or acquisition transaction will generally accelerate payments under a tax receivable agreement and increase the present value of such payments, and the disposition of assets before an exchange or acquisition transaction will increase the tax liability of a holder of Blackstone Holdings Partnership Units without giving rise to any rights of a holder of Blackstone Holdings Partnership Units to receive payments under any tax receivable agreements.
Although we are not aware of any issue that would cause the IRS to challenge a tax basis increase, the corporate taxpayers will not be reimbursed for any payments previously made under a tax receivable agreement. As a result, in certain circumstances, payments could be made under a tax receivable agreement in excess of the corporate taxpayers’ cash tax savings.
Registration Rights Agreement
In connection with the restructuring and IPO, we entered into a registration rights agreement with our pre-IPO owners pursuant to which we granted them, their affiliates and certain of their transferees the right, under certain circumstances and subject to certain restrictions, to require us to register under the Securities Act common units delivered in exchange for Blackstone Holdings Partnership Units or common units (and other securities convertible into or exchangeable or exercisable for our common units) otherwise held by them. In addition, newly admitted Blackstone senior managing directors and certain others who acquire Blackstone Holdings Partnership Units have subsequently become parties to the registration rights agreement. Under the registration rights agreement, we agreed
258
Table of Contents
to register the exchange of Blackstone Holdings Partnership Units for common units by our holders of Blackstone Holdings Partnership Units. In June 2008, we filed a registration statement on Form S-3 with the Securities and Exchange Commission to cover future issuances from time to time of up to 818,008,105 common units to holders of Blackstone Holdings Partnership Units upon exchange of up to an equal number of such Blackstone Holdings Partnership Units. In addition, our founder, Stephen A. Schwarzman, has the right to request that we register the sale of common units held by holders of Blackstone Holdings Partnership Units an unlimited number of times and may require us to make available shelf registration statements permitting sales of common units into the market from time to time over an extended period. In addition, Mr. Schwarzman has the ability to exercise certain piggyback registration rights in respect of common units held by holders of Blackstone Holdings Partnership Units in connection with registered offerings requested by other registration rights holders or initiated by us.
Swift River Investments
Swift River Investments, Inc. (“Swift River”) is a private family investment firm that manages capital on behalf of our President, Chief Operating Officer and Director, Hamilton E. James and his brother, David R. James,. While Hamilton E. James has a majority economic interest in Swift River, the day-to-day business of Swift River is managed by his brother, David R. James.
Allied Horizontal Wireline Services, LLC (“Allied”) is an oilfield services company that specializes in providing wireline services to oil and gas companies. FS Energy & Power Fund (“FSEP”), a closed-end management investment company that has elected to be regulated as a business development company under the 1940 Act to which GSO serves as a non-discretionary sub-advisor, participated in a financing transaction pursuant to which FSEP committed to provide $1.2 million in a rights offering of Allied Downhole Technologies, the parent of Allied. Allied Energy Investors LP and Allied Energy Investors II LP (collectively, “Allied Energy Investors”), Turnbridge Capital investment vehicles in which Swift River is a limited partner, also participated in the rights offering. Prior to the financing transaction described above, Swift River held a 30.1% interest in Allied through Allied Energy Investors. In connection with the rights offering, Swift River invested an additional $5.3 million in Allied through Allied Energy Investors. Pursuant to the terms of the transaction, the first half of the capital committed by participants in the rights offering, including FSEP and Swift River (via Allied Energy Investors), was drawn down in August 2016. Subject to the liquidity needs of Allied, the remaining half will be drawn down on or prior to May 15, 2017. Prior to the August 2016 offering, FSEP and Swift River had participated in a 2014 financing transaction of Allied, the details of which were disclosed in our Annual Report on Form 10-K for the year ended December 31, 2014. Subsequent to the August 2016 offering, FSEP and Swift River own 6.5% and 27.8% of Allied, respectively. If the May 2017 offering is completed, Swift River will own 26.2% of Allied. Mr. Hamilton E. James did not participate in the negotiation or execution of the transaction in any manner for any party. The transaction was reviewed and approved by the Conflicts Committee of the board of directors of our general partner.
Tsinghua University Education Foundation
As part of an initiative announced in 2013, Mr. Schwarzman, through the Stephen A. Schwarzman Education Foundation, personally committed $100 million to create and endow a post-graduate scholarship program at Tsinghua University in Beijing, entitled “Schwarzman Scholars,” and fund the construction of a residential and academic building. He is leading a fundraising campaign to raise $450 million to support the “Schwarzman Endowment Fund.” The Tsinghua University Education Foundation (“TUEF”) will hold the Schwarzman Endowment Fund and has agreed to delegate management of the fund to Blackstone. We have agreed that TUEF, and certain entities affiliated with TUEF, will not be required to pay Blackstone a management fee for managing the Schwarzman Endowment Fund and, to the extent Blackstone allocates and invests assets of the Schwarzman Endowment Fund in our funds, which may take the form of funded or unfunded general partner commitments to our investment funds, we anticipate that such investments will be subject to reduced or waived management fees and/or carried interest.
259
Table of Contents
Executive Advisor Agreement with Andrew Lapham
From April 17, 2014 through December 31, 2016, Andrew Lapham was an Executive Advisor to Blackstone. In his role as an Executive Advisor, Mr. Lapham focused primarily on sourcing and evaluating the firm’s investment opportunities in Canada. Mr. Lapham is the son-in-law of Mr. Mulroney, who has been a member of the board of directors of our general partner since 2007. Pursuant to the terms of his Executive Advisor Agreement, in respect of his services in 2016, Mr. Lapham was entitled to a $350,000 annual retainer and a bonus, which for 2016 was $400,000, and which will be paid in 2017. With respect to each investment sourced by him, Mr. Lapham was entitled to receive a transaction fee and, subject to a required capital contribution by Mr. Lapham, a profit sharing percentage of the net profits realized from such investment by the relevant fund. In 2016, we paid Mr. Lapham $700,277, which represented his annual retainer, the bonus paid in 2016 in respect of his services in 2015 and his profit sharing percentage.
Bennett J. Goodman
On February 24, 2015, Bennett J. Goodman was appointed to the board of directors of Blackstone Group Management L.L.C., the general partner of The Blackstone Group L.P. Mr. Goodman joined Blackstone in 2008 and is a Senior Managing Director and Co-Founder of GSO Capital Partners. For 2016, Mr. Goodman received a base salary of $350,000 and an annual cash bonus payment of $453,911. The cash payment was based upon the performance of the Credit segment, including the contribution of all current and past funds within the segment. The ultimate cash payment to Mr. Goodman was, however, determined in the discretion of Mr. Schwarzman and Mr. James.
Mr. Goodman also participated in the performance fees of our funds, consisting of carried interest in our carry funds and incentive fees in our funds that pay incentive fees. The compensation paid to Mr. Goodman in respect of carried interest in our carry funds primarily relates to Mr. Goodman’s participation in the credit funds. The amount of cash payments in respect of carried interest or incentive fee allocations to Mr. Goodman for 2016 was $3,545,756. See “Executive Compensation — Compensation Elements for Named Executive Officers” in this report for additional discussion of the elements of our compensation program.
Jonathan D. Gray
On February 24, 2012, Jonathan D. Gray was appointed to the board of directors of Blackstone Group Management L.L.C., the general partner of The Blackstone Group L.P. Mr. Gray joined Blackstone in 1992 and is a Senior Managing Director and Global Head of Real Estate. For 2016, Mr. Gray received a base salary of $350,000 and an annual cash bonus payment of $21,608,501, net of his mandatory deferral pursuant to the Deferred Compensation Plan. The cash payment was based upon the performance of the Real Estate segment, including the contribution of all current and past funds within the segment dating back to before the IPO. The ultimate cash payment to Mr. Gray was, however, determined in the discretion of Mr. Schwarzman and Mr. James. On January 13, 2017, Mr. Gray was granted 276,309 deferred restricted common units with a grant date fair value of $8,314,138, reflecting the portion of his annual cash bonus payment mandatorily deferred into deferred restricted common units pursuant to the Deferred Compensation Plan.
Mr. Gray also participated in the performance fees of our funds, consisting of carried interest in our carry funds and incentive fees in our funds that pay incentive fees. The compensation paid to Mr. Gray in respect of carried interest in our carry funds primarily relates to Mr. Gray’s participation in the real estate funds (which were formed both before and after the IPO). The amount of payments in respect of carried interest (whether in cash or in-kind) or incentive fee allocations to Mr. Gray for 2016 was $55,455,692. Any in-kind distributions in respect of carried interest are reported based on the market value of the securities distributed as of the date of distribution. In 2016, in connection with investment advisory services provided by Blackstone to BXMT, Mr. Gray was also allocated restricted shares of listed common stock of BXMT with a value of $904,006 based on the closing price of BXMT’s common stock on the date of the award. These restricted shares will vest over three years with one-third of the
260
Table of Contents
shares vesting at the end of one year after the date of the award and the remaining shares vesting in eight equal quarterly installments thereafter. See “Executive Compensation — Compensation Elements for Named Executive Officers” in this report for additional discussion of the elements of our compensation program.
Blackstone Holdings Partnership Agreements
As a result of the reorganization and the IPO, The Blackstone Group L.P. became a holding partnership and, through wholly owned subsidiaries, held equity interests in the five holdings partnerships (i.e., Blackstone Holdings I L.P., Blackstone Holdings II L.P., Blackstone Holdings III L.P., Blackstone Holdings IV L.P. and Blackstone Holdings V L.P.). On January 1, 2009, in order to simplify our structure and ease the related administrative burden and costs, we effected an internal restructuring to reduce the number of holding partnerships from five to four by causing Blackstone Holdings III L.P. to transfer all of its assets and liabilities to Blackstone Holdings IV L.P. In connection therewith, Blackstone Holdings IV L.P. was renamed Blackstone Holdings III L.P. and Blackstone Holdings V L.P. was renamed Blackstone Holdings IV L.P. On October 1, 2015, Blackstone formed a new holding partnership, Blackstone Holdings AI L.P., which holds certain operating entities and operates in a manner similar to the other Blackstone Holdings Partnerships. The economic interests of The Blackstone Group L.P. in Blackstone’s business remains entirely unaffected. “Blackstone Holdings” refers to (a) Blackstone Holdings I L.P., Blackstone Holdings II L.P., Blackstone Holdings III L.P., Blackstone Holdings IV L.P. and Blackstone Holdings V L.P. prior to the January 2009 reorganization, (b) Blackstone Holdings I L.P., Blackstone Holdings II L.P., Blackstone Holdings III L.P. and Blackstone Holdings IV L.P. from January 1, 2009 through October 1, 2015 and (c) Blackstone Holdings I L.P., Blackstone Holdings II L.P., Blackstone Holdings III L.P., Blackstone Holdings IV L.P. and Blackstone Holdings AI L.P. subsequent to the October 2015 creation of Blackstone Holdings AI L.P.
Wholly owned subsidiaries of The Blackstone Group L.P. which are the general partners of those partnerships have the right to determine when distributions will be made to the partners of Blackstone Holdings and the amount of any such distributions. If a distribution is authorized, such distribution will be made to the partners of Blackstone Holdings pro rata in accordance with the percentages of their respective partnership interests as described under “Part II. Item 5. Market for Registrant’s Common Equity, Related Stockholder Matters and Issuer Purchases of Equity Securities — Cash Distribution Policy.”
Each of the Blackstone Holdings Partnerships has an identical number of partnership units outstanding, and we use the terms “Blackstone Holdings Partnership Unit” or “partnership unit in/of Blackstone Holdings” to refer, collectively, to a partnership unit in each of the Blackstone Holdings Partnerships. The holders of partnership units in Blackstone Holdings, including The Blackstone Group L.P.’s wholly owned subsidiaries, will incur U.S. federal, state and local income taxes on their proportionate share of any net taxable income of Blackstone Holdings. Net profits and net losses of Blackstone Holdings will generally be allocated to its partners (including The Blackstone Group L.P.’s wholly owned subsidiaries) pro rata in accordance with the percentages of their respective partnership interests as described under “Part II. Item 5. Market for Registrant’s Common Equity, Related Stockholder Matters and Issuer Purchases of Equity Securities — Cash Distribution Policy.” The partnership agreements of the Blackstone Holdings Partnerships provide for cash distributions, which we refer to as “tax distributions,” to the partners of such partnerships if the wholly owned subsidiaries of The Blackstone Group L.P. which are the general partners of the Blackstone Holdings Partnerships determine that the taxable income of the relevant partnership will give rise to taxable income for its partners. Generally, these tax distributions are computed based on our estimate of the net taxable income of the relevant partnership allocable to a partner multiplied by an assumed tax rate equal to the highest effective marginal combined U.S. federal, state and local income tax rate prescribed for an individual or corporate resident in New York, New York (taking into account the non-deductibility of certain expenses and the character of our income). Tax distributions are made only to the extent all distributions from such partnerships for the relevant year are insufficient to cover such tax liabilities.
Subject to the vesting and minimum retained ownership requirements and transfer restrictions set forth in the partnership agreements of the Blackstone Holdings Partnerships, Blackstone Holdings Partnership Units may be exchanged for The Blackstone Group L.P. common units as described under “— Exchange Agreement” below. In
261
Table of Contents
addition, the Blackstone Holdings partnership agreements authorize the wholly owned subsidiaries of The Blackstone Group L.P. which are the general partners of those partnerships to issue an unlimited number of additional partnership securities of the Blackstone Holdings Partnerships with such designations, preferences, rights, powers and duties that are different from, and may be senior to, those applicable to the Blackstone Holdings Partnership Units, and which may be exchangeable for our common units.
See “— Item 11. Executive Compensation — Narrative Disclosure to Summary Compensation Table and Grants of Plan-Based Awards in 2016 — Terms of Blackstone Holdings Partnership Units Granted in 2016 and Prior Years” for a discussion of vesting provisions applicable to Blackstone personnel in respect of the Blackstone Holdings Partnership Units received by them in the reorganization and for a discussion of minimum retained ownership requirements and transfer restrictions applicable to the Blackstone Holdings Partnership Units. The generally applicable vesting and minimum retained ownership requirements and transfer restrictions are outlined in the sections referenced in the preceding sentence. There may be some different arrangements for some individuals in some instances. In addition, we may waive these requirements and restrictions from time to time.
In addition, substantially all of our expenses, including substantially all expenses solely incurred by or attributable to The Blackstone Group L.P. but not including obligations incurred under the tax receivable agreement by The Blackstone Group L.P.’s wholly owned subsidiaries, income tax expenses of The Blackstone Group L.P.’s wholly owned subsidiaries and payments on indebtedness incurred by The Blackstone Group L.P.’s wholly owned subsidiaries, are borne by Blackstone Holdings.
Exchange Agreement
In connection with the reorganization and IPO, we entered into an exchange agreement with the holders of partnership units in Blackstone Holdings (other than The Blackstone Group L.P.’s wholly owned subsidiaries). In addition, newly admitted Blackstone senior managing directors and certain others who acquire Blackstone Holdings Partnership Units have subsequently become parties to the exchange agreement. Under the exchange agreement, subject to the vesting and minimum retained ownership requirements and transfer restrictions set forth in the partnership agreements of the Blackstone Holdings Partnerships, each such holder of Blackstone Holdings Partnership Units (and certain transferees thereof) may up to four times each year (subject to the terms of the exchange agreement) exchange these partnership units for The Blackstone Group L.P. common units on a one-for-one basis, subject to customary conversion rate adjustments for splits, unit distributions and reclassifications. Under the exchange agreement, to effect an exchange a holder of partnership units in Blackstone Holdings must simultaneously exchange one partnership unit in each of the Blackstone Holdings Partnerships. As a holder exchanges its Blackstone Holdings Partnership Units, The Blackstone Group L.P.’s indirect interest in the Blackstone Holdings Partnerships will be correspondingly increased.
Firm Use of Private Aircraft
Certain entities controlled by Mr. Schwarzman wholly own aircraft that we use for business purposes in the course of our operations. Mr. Schwarzman paid for his respective ownership interests in the aircraft himself and bore his respective share of all operating, personnel and maintenance costs associated with their operation. The hourly payments we made for such use were based on current market rates. In 2016, we made payments of $4.2 million for the use of such aircraft, which included $2.0 million paid directly to the managers of the aircraft.
An entity jointly controlled by Mr. James and Mr. Gray wholly owns an airplane that we use for business purposes in the course of our operations. Each of Mr. James and Mr. Gray paid for his respective ownership interest in the aircraft himself and bore his respective share of the operating, personnel and maintenance costs associated with its operation. The hourly payments we made for such use were based on current market rates. In 2016, we made payments of $0.6 million to the manager of the aircraft for such use.
An entity controlled by Mr. Goodman, jointly with an entity controlled by another senior managing director of Blackstone, owns an airplane that we use for business purposes in the course of our operations. Mr. Goodman paid
262
Table of Contents
for his ownership interest in the aircraft himself and bore his respective share of the operating, personnel and maintenance costs associated with its operation. The hourly payments we made for such use were based on current market rates. In 2016, we made payments of $0.5 million to the manager of the aircraft for such use.
Investment in or Alongside Our Funds
Our directors and executive officers may invest their own capital in or alongside our carry funds and other of our investment vehicles without being subject to management fees or carried interest. For our carry funds, these investments may be made through the applicable fund general partner and fund a portion of the general partner capital commitments to our funds. In addition, our directors and executive officers may invest their own capital in our funds of hedge funds and credit-focused funds that are structured as hedge funds, in some instances, not subject to management fees or carried interest. These investment opportunities are available to all of our senior managing directors and to those of our employees whom we have determined to have a status that reasonably permits us to offer them these types of investments in compliance with applicable laws. During the year ended December 31, 2016, our directors and executive officers (and, in some cases, certain investment trusts or other family vehicles or charitable organizations controlled by them or their immediate family members) had the following net contributions or net distributions relating to their personal investments (and the investments of any such trusts) in Blackstone-managed investment funds: Mr. Schwarzman, Mr. James, Mr. Gray, Mr. Hill, Mr. Mulroney, Ms. Solotar, Mr. Finley, Mr. Light and Mr. Parrett received net distributions of $45.0 million, $18.9 million, $19.4 million, $11.8 million, $0.5 million, $0.5 million, $0.4 million, $0.3 million and $0.3 million, respectively, and Mr. Goodman and Mr. Chae made net contributions of $5.8 million and $1.6 million, respectively.
Statement of Policy Regarding Transactions with Related Persons
The board of directors of our general partner has adopted a written statement of policy regarding transactions with related persons, which we refer to as our “related person policy.” Our related person policy requires that a “related person” (as defined as in paragraph (a) of Item 404 of Regulation S-K) must promptly disclose to the Chief Legal Officer of our general partner any “related person transaction” (defined as any transaction that is reportable by us under Item 404(a) of Regulation S-K in which we were or are to be a participant and the amount involved exceeds $120,000 and in which any related person had or will have a direct or indirect material interest) and all material facts with respect thereto. The Chief Legal Officer will then promptly communicate that information to the board of directors of our general partner. No related person transaction will be consummated without the approval or ratification of the board of directors of our general partner or any committee of the board of directors consisting exclusively of disinterested directors. It is our policy that directors interested in a related person transaction will recuse themselves from any vote of a related person transaction in which they have an interest.
Indemnification of Directors and Officers
Under our partnership agreement, in most circumstances we will indemnify the following persons, to the fullest extent permitted by law, from and against all losses, claims, damages, liabilities, joint or several, expenses (including legal fees and expenses), judgments, fines, penalties, interest, settlements or other amounts: our general partner; any departing general partner; any person who is or was an affiliate of a general partner or any departing general partner; any person who is or was a member, partner, tax matters partner, officer, director, employee, agent, fiduciary or trustee of us or our subsidiaries, the general partner or any departing general partner or any affiliate of ours or our subsidiaries, the general partner or any departing general partner; any person who is or was serving at the request of a general partner or any departing general partner or any affiliate of a general partner or any departing general partner as an officer, director, employee, member, partner, agent, fiduciary or trustee of another person; or any person designated by our general partner. We have agreed to provide this indemnification to the extent such person acted in good faith and in a manner he or she reasonably believed to be in or not opposed to the best interests of the partnership, and with respect to any alleged conduct resulting in a criminal proceeding against such person, to deny indemnification if such person had reasonable cause to believe that his or her conduct was unlawful. We have
263
Table of Contents
also agreed to provide this indemnification for criminal proceedings. Any indemnification under these provisions will only be out of our assets. Unless it otherwise agrees, the general partner will not be personally liable for, or have any obligation to contribute or loan funds or assets to us to enable it to effectuate indemnification. We may purchase insurance against liabilities asserted against and expenses incurred by persons for our activities, regardless of whether we would have the power to indemnify the person against liabilities under our partnership agreement.
We will also indemnify any of our employees who personally becomes subject to a “clawback” obligation to one of our investment funds in respect of carried interest that we have received. See “Part I. Item 1. Business — Incentive Arrangements / Fee Structure.”
Non-Competition and Non-Solicitation Agreements
We have entered into a non-competition and non-solicitation agreement with each of our professionals and other senior employees, including each of our executive officers. See “— Item 11. Executive Compensation — Non-Competition and Non-Solicitation Agreements” for a description of the material terms of such agreements.
Director Independence
Because we are a publicly traded limited partnership, the NYSE rules do not require our general partner’s board to be made up of a majority of independent directors. All of the non-management directors of our general partner’s board of directors satisfy the independence requirements of the NYSE. These directors are Messrs. Breyer. Grauer, Jenrette, Light, Mulroney and Parrett and Ms. Lazarus. Based on all relevant facts and circumstances, our general partner’s board of directors affirmatively determined that the independent directors have no material relationship with us or our general partner. In making a determination with regard to Mr. Grauer’s independence, our general partner’s board of directors considered Mr. Grauer’s role as a member of the Board of Trustees of the Inner-City Scholarship Fund and Mr. Schwarzman’s past and currently pledged contributions to the Inner-City Scholarship Fund. The board of directors of our general partner follows the following standards in determining director independence:
Under any circumstances, a director is not independent if:
| • | the director is, or has been within the preceding three years, employed by our general partner or us, |
| • | an immediate family member of the director was employed as an executive officer of our general partner or us within the preceding three years, |
| • | the director, or an immediate family member of that director, received within the preceding three years more than $120,000 in any twelve-month period in direct compensation from us, other than director and committee fees and pension or other forms of deferred compensation for prior service (provided such compensation is not contingent in any way on continued service), |
| • | the director is a current partner or employee of a firm that is our internal or external auditor; the director has an immediate family member who is a current partner of such a firm; the director has an immediate family member who is a current employee of such a firm and personally works on our audit; or the director or an immediate family member of that director was within the last three years a partner or employee of such a firm and personally worked on our or a predecessor’s audit within that time, |
| • | the director or an immediate family member is, or has been within the preceding three years, employed as an executive officer of another company where any of our general partner’s present executive officers at the same time serves or served on such other company’s compensation committee, or |
| • | the director is a current employee, or an immediate family member is a current executive officer, of a company that has made payments to, or received payments from, us for property or services in an amount which, in any of the preceding three fiscal years, exceeds the greater of $1,000,000 or two percent (2%) of the consolidated gross revenues of the other company. |
264
Table of Contents
The following commercial or charitable relationships will not be considered to be material relationships that would impair a director’s independence:
| • | if the director or an immediate family member of that director serves as an executive officer, director or trustee of a charitable organization, and our annual charitable contributions to that organization (excluding contributions by us under any established matching gift program) are less than the greater of $1,000,000 or two percent (2%) of that organization’s consolidated gross revenues in its most recent fiscal year, and |
| • | if the director or an immediate family member of that director (or a company for which the director serves as a director or executive officer) invests in or alongside of one or more investment funds or investment companies managed by us or any of our subsidiaries, whether or not fees or other incentive arrangements for us or our subsidiaries are borne by the investing person. |
| ITEM 14. | PRINCIPAL ACCOUNTING FEES AND SERVICES |
The following table summarizes the aggregate fees for professional services provided by Deloitte & Touche LLP, the member firms of Deloitte Touche Tohmatsu and their respective affiliates (collectively, the “Deloitte Entities”):
| Year Ended December 31, 2016 | ||||||||||||||||
| The Blackstone Group L.P. |
Blackstone Entities, Principally Fund Related (d) |
Blackstone Funds, Transaction Related (e) |
Total | |||||||||||||
| (Dollars in Thousands) | ||||||||||||||||
| Audit Fees |
$ | 9,725 | (a) | $ | 31,629 | $ | — | $ | 41,354 | |||||||
| Audit-Related Fees |
195 | (b) | 151 | 11,976 | 12,322 | |||||||||||
| Tax Fees |
1,105 | (c) | 57,103 | 13,188 | 71,396 | |||||||||||
|
|
|
|
|
|
|
|
|
|||||||||
| Total |
$ | 11,025 | $ | 88,883 | $ | 25,164 | $ | 125,072 | ||||||||
|
|
|
|
|
|
|
|
|
|||||||||
| Year Ended December 31, 2015 | ||||||||||||||||
| The Blackstone Group L.P. |
Blackstone Entities, Principally Fund Related (d) |
Blackstone Funds, Transaction Related (e) |
Total | |||||||||||||
| (Dollars in Thousands) | ||||||||||||||||
| Audit Fees |
$ | 10,305 | (a) | $ | 33,745 | $ | — | $ | 44,050 | |||||||
| Audit-Related Fees |
207 | (b) | 244 | 10,862 | 11,313 | |||||||||||
| Tax Fees |
538 | (c) | 57,914 | 7,235 | 65,687 | |||||||||||
|
|
|
|
|
|
|
|
|
|||||||||
| Total |
$ | 11,050 | $ | 91,903 | $ | 18,097 | $ | 121,050 | ||||||||
|
|
|
|
|
|
|
|
|
|||||||||
| (a) | Audit Fees consisted of fees for (1) the audits of our consolidated financial statements in our Annual Report on Form 10-K and services attendant to, or required by, statute or regulation, (2) reviews of the interim condensed consolidated financial statements included in our quarterly reports on Form 10-Q, and (3) consents and other services related to SEC and other regulatory filings. |
| (b) | Audit-Related Fees include risk advisory services. |
| (c) | Tax Fees consisted of fees for services rendered for tax compliance and tax planning and advisory services. |
| (d) | The Deloitte Entities also provide audit, audit-related and tax services (primarily tax compliance and related services) to certain Blackstone funds and other corporate entities. Also included in these amounts are audit and tax fees related to the spin-off of Blackstone’s financial advisory practice in 2015. |
| (e) | Audit-Related and Tax Fees included merger and acquisition due diligence services provided in connection with potential acquisitions of portfolio companies for investment purposes primarily to certain private equity and real estate funds managed by Blackstone in its capacity as the general partner. In addition, the Deloitte |
265
Table of Contents
| Entities provide audit, audit-related, tax and other services to the portfolio companies, which are approved directly by the portfolio company’s management and are not included in the amounts presented here. |
Our audit committee charter, which is available on our website at http://ir.blackstone.com under “Corporate Governance,” requires the audit committee to approve in advance all audit and non-audit related services to be provided by our independent registered public accounting firm in accordance with the audit and non-audit related services pre-approval policy. All services reported in the Audit, Audit-Related, Tax and All Other Fees categories above were approved by the audit committee.
266
Table of Contents
PART IV.
| ITEM 15. | EXHIBITS, FINANCIAL STATEMENT SCHEDULES |
| (a) | The following documents are filed as part of this annual report. |
| 1. | Financial Statements: |
See Item 8 above.
| 2. | Financial Statement Schedules: |
Schedules for which provision is made in the applicable accounting regulations of the SEC are not required under the related instructions or are not applicable, and therefore have been omitted.
| 3. | Exhibits: |
| Exhibit Number |
Exhibit Description | |
| 3.1 | Certificate of Limited Partnership of The Blackstone Group L.P. (incorporated herein by reference to Exhibit 3.1 to the Registrant’s Registration Statement on Form S-1 (File No. 333-141504) filed with the SEC on March 22, 2007). | |
| 3.2 | Amended and Restated Agreement of Limited Partnership of The Blackstone Group L.P. (incorporated herein by reference to Exhibit 3.1 to Form 8-K (File No. 001-33551) filed with the SEC on June 27, 2007). | |
| 3.2.1 | Amendment No. 1 to the Amended and Restated Agreement of Limited Partnership of The Blackstone Group L.P., dated as of November 3, 2009 (incorporated herein by reference to Exhibit 3.2.1 to the Registrant’s Quarterly Report on Form 10-Q for the quarter ended September 30, 2009 (File No. 001-33551) filed with the SEC on November 6, 2009). | |
| 3.2.2 | Amendment No. 2 to the Amended and Restated Agreement of Limited Partnership of The Blackstone Group L.P., dated as of November 4, 2011 (incorporated herein by reference to Exhibit 3.2.2 to the Registrant’s Quarterly Report on Form 10-Q for the quarter ended September 30, 2011 (File No. 001-33551) filed with the SEC on November 9, 2011). | |
| 4.1 | Indenture dated as of August 20, 2009 among Blackstone Holdings Finance Co. L.L.C., The Blackstone Group L.P., Blackstone Holdings I L.P., Blackstone Holdings II L.P., Blackstone Holdings III L.P., Blackstone Holdings IV L.P. and The Bank of New York Mellon, as trustee (incorporated by reference to Exhibit 4.1 to the Registrant’s Current Report on Form 8-K dated August 20, 2009). | |
| 4.2 | First Supplemental Indenture dated as of August 20, 2009 among Blackstone Holdings Finance Co. L.L.C., The Blackstone Group L.P., Blackstone Holdings I L.P., Blackstone Holdings II L.P., Blackstone Holdings III L.P., Blackstone Holdings IV L.P. and The Bank of New York Mellon, as trustee (incorporated by reference to Exhibit 4.2 to the Registrant’s Current Report on Form 8-K dated August 20, 2009). | |
| 4.3 | Form of 6.625% Senior Note due 2019 (included in Exhibit 4.2 and incorporated by reference to Exhibit 4.2 to the Registrant’s Current Report on Form 8-K dated August 20, 2009). | |
| 4.4 | Second Supplemental Indenture dated as of September 20, 2010, among Blackstone Holdings Finance Co. L.L.C., The Blackstone Group L.P., Blackstone Holdings I L.P., Blackstone Holdings II L.P., Blackstone Holdings III L.P., Blackstone Holdings IV L.P. and The Bank of New York Mellon, as trustee (incorporated herein by reference to Exhibit 4.2 to the Registrant’s Current Report on Form 8-K (File No. 001-33551) filed with the SEC on September 22, 2010). | |
| 4.5 | Form of 5.875% Senior Note due 2021 (included in Exhibit 4.4 hereto). | |
267
Table of Contents
| Exhibit Number |
Exhibit Description | |
| 4.6 | Third Supplemental Indenture dated as of August 17, 2012 among Blackstone Holdings Finance Co. L.L.C., The Blackstone Group L.P., Blackstone Holdings I L.P., Blackstone Holdings II L.P., Blackstone Holdings III L.P., Blackstone Holdings IV L.P. and The Bank of New York Mellon, as trustee (incorporated herein by reference to Exhibit 4.2 to the Registrant’s Current Report on Form 8-K (File No. 001-33551) filed with the SEC on August 17, 2012). | |
| 4.7 | Form of 4.75% Senior Note due 2023 (included in Exhibit 4.6 hereto). | |
| 4.8 | Fourth Supplemental Indenture dated as of August 17, 2012 among Blackstone Holdings Finance Co. L.L.C., The Blackstone Group L.P., Blackstone Holdings I L.P., Blackstone Holdings II L.P., Blackstone Holdings III L.P., Blackstone Holdings IV L.P. and The Bank of New York Mellon, as trustee (incorporated herein by reference to Exhibit 4.4 to the Registrant’s Current Report on Form 8-K (File No. 001-33551) filed with the SEC on August 17, 2012). | |
| 4.9 | Form of 6.25% Senior Note due 2042 (included in Exhibit 4.8 hereto). | |
| 4.10 | Fifth Supplemental Indenture dated as of April 7, 2014 among Blackstone Holdings Finance Co. L.L.C., The Blackstone Group L.P., Blackstone Holdings I L.P., Blackstone Holdings II L.P., Blackstone Holdings III L.P., Blackstone Holdings IV L.P. and The Bank of New York Mellon, as trustee (incorporated herein by reference to Exhibit 4.2 to the Registrant’s Current Report on Form 8-K (File No. 001-33551) filed with the SEC on April 7, 2014). | |
| 4.11 | Form of 5.000% Senior Note due 2044 (included in Exhibit 4.10 hereto). | |
| 4.12 | Sixth Supplemental Indenture dated as of April 27, 2015 among Blackstone Holdings Finance Co. L.L.C., The Blackstone Group L.P., Blackstone Holdings I L.P., Blackstone Holdings II L.P., Blackstone Holdings III L.P., Blackstone Holdings IV L.P. and The Bank of New York Mellon, as trustee (incorporated herein by reference to Exhibit 4.2 to the Registrant’s Current Report on Form 8-K (File No. 001-33551) filed with the SEC on April 27, 2015). | |
| 4.13 | Form of 4.450% Senior Note due 2045 (included in Exhibit 4.12 hereto). | |
| 4.14 | Seventh Supplemental Indenture dated as of May 19, 2015 among Blackstone Holdings Finance Co. L.L.C., The Blackstone Group L.P., Blackstone Holdings I L.P., Blackstone Holdings II L.P., Blackstone Holdings III L.P., Blackstone Holdings IV L.P., The Bank of New York Mellon, as trustee, and The Bank of New York Mellon, London Branch, as paying agent (incorporated herein by reference to Exhibit 4.2 to the Registrant’s Current Report on Form 8-K (File No. 001-33551) filed with the SEC on May 19, 2015). | |
| 4.15 | Form of 2.000% Senior Note due 2025 (included in Exhibit 4.14 hereto). | |
| 4.16 | Guarantor Joinder Agreement dated as of October 1, 2015 among Blackstone Holdings Finance Co. L.L.C., Blackstone Holdings I L.P., Blackstone Holdings II L.P., Blackstone Holdings III L.P., Blackstone Holdings IV L.P., Blackstone Holdings AI L.P. and Citibank, N.A., as administrative agent (incorporated herein by reference to Exhibit 4.16 to the Registrant’s Annual Report on Form 10-K for the year ended December 31, 2015 (File No. 001-33551) filed with the SEC on February 26, 2016). | |
| 4.17 | Eighth Supplemental Indenture dated as of October 1, 2015 among Blackstone Holdings Finance Co. L.L.C., The Blackstone Group L.P., Blackstone Holdings I L.P., Blackstone Holdings II L.P., Blackstone Holdings III L.P., Blackstone Holdings IV L.P., Blackstone Holdings AI L.P. and The Bank of New York Mellon, as Trustee (incorporated herein by reference to Exhibit 4.17 to the Registrant’s Annual Report on Form 10-K for the year ended December 31, 2015 (File No. 001-33551) filed with the SEC on February 26, 2016). | |
268
Table of Contents
| Exhibit Number |
Exhibit Description | |
| 4.18 | Ninth Supplemental Indenture dated as of October 5, 2016 among Blackstone Holdings Finance Co. L.L.C., The Blackstone Group L.P., Blackstone Holdings I L.P., Blackstone Holdings AI L.P., Blackstone Holdings II L.P., Blackstone Holdings III L.P., Blackstone Holdings IV L.P., The Bank of New York Mellon, as trustee, and The Bank of New York Mellon, London Branch, as paying agent (incorporated by reference to Exhibit 4.2 to the Registrant’s Current Report on Form 8-K (File No. 001-33551) filed with the SEC on October 5, 2016). | |
| 4.19 | Form of 1.000% Senior Note due 2026 (included in Exhibit 4.18 hereto). | |
| 10.1 | Amended and Restated Limited Partnership Agreement of Blackstone Holdings I L.P., dated as of June 18, 2007, by and among Blackstone Holdings I/II GP Inc. and the limited partners of Blackstone Holdings I L.P. party thereto (incorporated herein by reference to Exhibit 10.1 to the Registrant’s Quarterly Report on Form 10-Q for the quarter ended June 30, 2007 (File No. 001-33551) filed with the SEC on August 13, 2007). | |
| 10.1.1 | Amendment No. 1 to the Amended and Restated Agreement of Limited Partnership of Blackstone Holdings I L.P., dated as of November 3, 2009 (incorporated herein by reference to Exhibit 10.1.1 to the Registrant’s Quarterly Report on Form 10-Q for the quarter ended September 30, 2009 (File No. 001-33551) filed with the SEC on November 6, 2009). | |
| 10.2 | Amended and Restated Limited Partnership Agreement of Blackstone Holdings II L.P., dated as of June 18, 2007, by and among Blackstone Holdings I/II GP Inc. and the limited partners of Blackstone Holdings II L.P. party thereto (incorporated herein by reference to Exhibit 10.2 to the Registrant’s Quarterly Report on Form 10-Q for the quarter ended June 30, 2007 (File No. 001-33551) filed with the SEC on August 13, 2007). | |
| 10.2.1 | Amendment No. 1 to the Amended and Restated Agreement of Limited Partnership of Blackstone Holdings II L.P., dated as of November 3, 2009 (incorporated herein by reference to Exhibit 10.2.1 to the Registrant’s Quarterly Report on Form 10-Q for the quarter ended September 30, 2009 (File No. 001-33551) filed with the SEC on November 6, 2009). | |
| 10.3 | Second Amended and Restated Limited Partnership Agreement of Blackstone Holdings III L.P., dated as of January 1, 2009, by and among Blackstone Holdings III GP L.L.C. and the limited partners of Blackstone Holdings III L.P. party thereto (incorporated herein by reference to Exhibit 10.3 to the Registrant’s Annual Report on Form 10-K for the year ended December 31, 2008 (File No. 001-33551) filed with the SEC on March 2, 2009). | |
| 10.3.1 | Amendment No. 1 to the Second Amended and Restated Agreement of Limited Partnership of Blackstone Holdings III L.P., dated as of November 3, 2009 (incorporated herein by reference to Exhibit 10.3.1 to the Registrant’s Quarterly Report on Form 10-Q for the quarter ended September 30, 2009 (File No. 001-33551) filed with the SEC on November 6, 2009). | |
| 10.4 | Second Amended and Restated Limited Partnership Agreement of Blackstone Holdings IV L.P., dated as of January 1, 2009, by and among Blackstone Holdings IV GP L.P. and the limited partners of Blackstone Holdings IV L.P. party thereto (incorporated herein by reference to Exhibit 10.4 to the Registrant’s Annual Report on Form 10-K for the year ended December 31, 2008 (File No. 001- 33551) filed with the SEC on March 2, 2009). | |
| 10.4.1 | Amendment No. 1 to the Second Amended and Restated Agreement of Limited Partnership of Blackstone Holdings IV L.P., dated as of November 3, 2009 (incorporated herein by reference to Exhibit 10.4.1 to the Registrant’s Quarterly Report on Form 10-Q for the quarter ended September 30, 2009 (File No. 001-33551) filed with the SEC on November 6, 2009). | |
269
Table of Contents
| Exhibit Number |
Exhibit Description | |
| 10.5 | Amended and Restated Limited Partnership Agreement of Blackstone Holdings AI L.P., dated as of October 1, 2015 (incorporated herein by reference to Exhibit 10.5 to the Registrant’s Annual Report on Form 10-K for the year ended December 31, 2015 (File No. 001-33551) filed with the SEC on February 26, 2016). | |
| 10.6 | Tax Receivable Agreement, dated as of June 18, 2007, by and among Blackstone Holdings I/II GP Inc., Blackstone Holdings I L.P., Blackstone Holdings II L.P. and the limited partners of Blackstone Holdings I L.P. and Blackstone Holdings II L.P. party thereto (incorporated herein by reference to Exhibit 10.6 to the Registrant’s Quarterly Report on Form 10-Q for the quarter ended June 30, 2007 (File No. 001-33551) filed with the SEC on August 13, 2007). | |
| 10.7 | Third Amended and Restated Exchange Agreement, dated as of October 1, 2015, among The Blackstone Group L.P., Blackstone Holdings AI L.P., Blackstone Holdings I L.P., Blackstone Holdings II L.P., Blackstone Holdings III L.P., Blackstone Holdings IV L.P. and the Blackstone Holdings Limited Partners party thereto (incorporated herein by reference to Exhibit 10.7 to the Registrant’s Annual Report on Form 10-K for the year ended December 31, 2015 (File No. 001-33551) filed with the SEC on February 26, 2016). | |
| 10.8 | Registration Rights Agreement, dated as of June 18, 2007 (incorporated herein by reference to Exhibit 10.8 to the Registrant’s Quarterly Report on Form 10-Q for the quarter ended June 30, 2007 (File No. 001-33551) filed with the SEC on August 13, 2007). | |
| 10.9.1+ | The Blackstone Group L.P. Amended and Restated 2007 Equity Incentive Plan (incorporated herein by reference to Exhibit 10.1 to the Registrant’s Current Report on Form 8-K (File No. 001-33551) filed with the SEC on July 9, 2014). | |
| 10.10+ | The Blackstone Group L.P. Sixth Amended and Restated Bonus Deferral Plan effective as of December 1, 2014 (incorporated herein by reference to Exhibit 10.9 to the Registrant’s Annual Report on Form 10-K for the year ended December 31, 2014 (File No. 001-33551) filed with the SEC on February 27, 2015). | |
| 10.11+ | Founding Member Agreement of Stephen A. Schwarzman, dated as of June 18, 2007, by and among Blackstone Holdings I L.P. and Stephen A. Schwarzman (incorporated herein by reference to Exhibit 10.10 to the Registrant’s Quarterly Report on Form 10-Q for the quarter ended June 30, 2007 (File No. 001-33551) filed with the SEC on August 13, 2007). | |
| 10.12+ | Form of Senior Managing Director Agreement by and among Blackstone Holdings I L.P. and each of the Senior Managing Directors from time to time party thereto (incorporated herein by reference to Exhibit 10.12 to the Registrant’s Registration Statement on Form S-1/A (File No. 333-141504) filed with the SEC on June 14, 2007). (Applicable to all executive officers other than Messrs. Schwarzman and Peterson.) | |
| 10.13+ | Form of Deferred Restricted Common Unit Award Agreement (Directors) (incorporated herein by reference to Exhibit 10.36 to the Registrant’s Quarterly Report on Form 10-Q for the quarter ended June 30, 2008 (File No. 001-33551) filed with the SEC on August 8, 2008). | |
| 10.14+ | Form of Deferred Restricted Blackstone Holdings Unit Award Agreement for Executive Officers (incorporated herein by reference to Exhibit 10.37 to the Registrant’s Quarterly Report on Form 10-Q for the quarter ended September 30, 2008 (File No. 001-33551) filed with the SEC on November 7, 2008). | |
270
Table of Contents
| Exhibit Number |
Exhibit Description | |
| 10.15 | Amended and Restated Credit Agreement dated as of March 23, 2010, as amended and restated as of May 29, 2014, and as further amended and restated as of August 31, 2016, among Blackstone Holdings Finance Co. L.L.C., as borrower, Blackstone Holdings I L.P., Blackstone Holdings II L.P., Blackstone Holdings AI L.P., Blackstone Holdings III L.P. and Blackstone Holdings IV L.P., as guarantors, Citibank, N.A., as administrative agent and the lenders party thereto (incorporated herein by reference to Exhibit 10.1 to the Registrant’s Current Report on Form 8-K (File No. 001-33551) filed with the SEC on September 7, 2016). | |
| 10.16 | Letter Agreement between The Blackstone Group L.P. and the Beijing Wonderful Investments Ltd, dated May 22, 2007 (incorporated herein by reference to Exhibit 10.12 to the Registrant’s Registration Statement on Form S-1/A (File No. 333-141504) filed with the SEC on June 4, 2007). | |
| 10.17 | Letter Agreement, dated October 16, 2008, between The Blackstone Group L.P. and Beijing Wonderful Investments Ltd, amending the Letter Agreement, dated May 22, 2007, between The Blackstone Group L.P. and Beijing Wonderful Investments Ltd (incorporated herein by reference to Exhibit 10.16.1 to the Registrants’ Current Report on Form 8-K filed with the SEC on October 16, 2008). | |
| 10.18+ | Second Amended and Restated Limited Liability Company Agreement of BMA V L.L.C., dated as of May 31, 2007, by and among Blackstone Holdings III L.P. and certain members of BMA V L.L.C. (incorporated herein by reference to Exhibit 10.12 to the Registrant’s Quarterly Report on Form 10-Q for the quarter ended June 30, 2007 (File No. 001-33551) filed with the SEC on August 13, 2007). | |
| 10.19+ | Second Amended and Restated Agreement of Limited Partnership of Blackstone Real Estate Management Associates International L.P., dated as of May 31, 2007, by and among BREA International (Cayman) Ltd. and certain limited partners (incorporated herein by reference to Exhibit 10.13 to the Registrant’s Quarterly Report on Form 10-Q for the quarter ended June 30, 2007 (File No. 001-33551) filed with the SEC on August 13, 2007). | |
| 10.19.1+ | Amendment No. 1 dated as of January 1, 2008 to the Second Amended and Restated Agreement of Limited Partnership of Blackstone Real Estate Management Associates International L.P., dated as of May 31, 2007, by and among BREA International (Cayman) Ltd. and certain limited partners (incorporated herein by reference to Exhibit 10.19.1 to the Registrant’s Quarterly Report on Form 10-Q for the quarter ended March 31, 2008 (File No. 001-33551) filed with the SEC on May 15, 2008). | |
| 10.20+ | Second Amended and Restated Agreement of Limited Partnership of Blackstone Real Estate Management Associates International II L.P., dated as of May 31, 2007, by and among BREA International (Cayman) II Ltd. and certain limited partners (incorporated herein by reference to Exhibit 10.14 to the Registrant’s Quarterly Report on Form 10-Q for the quarter ended June 30, 2007 (File No. 001-33551) filed with the SEC on August 13, 2007). | |
| 10.21.1+ | Amendment No. 1 dated as of January 1, 2008 to the Second Amended and Restated Agreement of Limited Partnership of Blackstone Real Estate Management Associates International II L.P., dated as of May 31, 2007, by and among BREA International (Cayman) II Ltd. and certain limited partners (incorporated herein by reference to Exhibit 10.20.1 to the Registrant’s Quarterly Report on Form 10-Q for the quarter ended March 31, 2008 (File No. 001-33551) filed with the SEC on May 15, 2008). | |
| 10.22+ | Second Amended and Restated Limited Liability Company Agreement of Blackstone Management Associates IV L.L.C., dated as of May 31, 2007, by and among Blackstone Holdings III L.P. and certain members of Blackstone Management Associates IV L.L.C. (incorporated herein by reference to Exhibit 10.15 to the Registrant’s Quarterly Report on Form 10-Q for the quarter ended June 30, 2007 (File No. 001-33551) filed with the SEC on August 13, 2007). | |
271
Table of Contents
| Exhibit Number |
Exhibit Description | |
| 10.23+ | Second Amended and Restated Limited Liability Company Agreement of Blackstone Mezzanine Management Associates L.L.C., dated as of May 31, 2007, by and among Blackstone Holdings III L.P. and certain members of Blackstone Mezzanine Management Associates L.L.C. (incorporated herein by reference to Exhibit 10.16 to the Registrant’s Quarterly Report on Form 10-Q for the quarter ended June 30, 2007 (File No. 001-33551) filed with the SEC on August 13, 2007). | |
| 10.24+ | Second Amended and Restated Limited Liability Company Agreement of Blackstone Mezzanine Management Associates II L.L.C., dated as of May 31, 2007, by and among Blackstone Holdings III L.P. and certain members of Blackstone Mezzanine Management Associates II L.L.C. (incorporated herein by reference to Exhibit 10.17 to the Registrant’s Quarterly Report on Form 10-Q for the quarter ended June 30, 2007 (File No. 001-33551) filed with the SEC on August 13, 2007). | |
| 10.25+ | Second Amended and Restated Limited Liability Company Agreement of BREA IV L.L.C., dated as of May 31, 2007, by and among Blackstone Holdings III L.P. and certain members of BREA IV L.L.C. (incorporated herein by reference to Exhibit 10.18 to the Registrant’s Quarterly Report on Form 10-Q for the quarter ended June 30, 2007 (File No. 001-33551) filed with the SEC on August 13, 2007). | |
| 10.26+ | Second Amended and Restated Limited Liability Company Agreement of BREA V L.L.C., dated as of May 31, 2007, by and among Blackstone Holdings III L.P. and certain members of BREA V L.L.C. (incorporated herein by reference to Exhibit 10.19 to the Registrant’s Quarterly Report on Form 10-Q for the quarter ended June 30, 2007 (File No. 001-33551) filed with the SEC on August 13, 2007). | |
| 10.27+ | Second Amended and Restated Limited Liability Company Agreement of BREA VI L.L.C., dated as of May 31, 2007, by and among Blackstone Holdings III L.P. and certain members of BREA VI L.L.C. (incorporated herein by reference to Exhibit 10.20 to the Registrant’s Quarterly Report on Form 10-Q for the quarter ended June 30, 2007 (File No. 001-33551) filed with the SEC on August 13, 2007). | |
| 10.27.1+ | Amendment No. 1 dated as of January 1, 2008 to the Second Amended and Restated Limited Liability Company Agreement of BREA VI L.L.C., dated as of May 31, 2007, by and among Blackstone Holdings III L.P. and certain members of BREA VI L.L.C. (incorporated herein by reference to Exhibit 10.26.1 to the Registrant’s Quarterly Report on Form 10-Q for the quarter ended March 31, 2008 (File No. 001-33551) filed with the SEC on May 15, 2008). | |
| 10.28 | Second Amended and Restated Limited Liability Company Agreement of Blackstone Communications Management Associates I L.L.C., dated as of May 31, 2007, by and among Blackstone Holdings III L.P. and certain members of Blackstone Communications Management Associates I L.L.C. (incorporated herein by reference to Exhibit 10.21 to the Registrant’s Quarterly Report on Form 10-Q for the quarter ended June 30, 2007 (File No. 001-33551) filed with the SEC on August 13, 2007). | |
| 10.29+ | Amended and Restated Limited Liability Company Agreement of BCLA L.L.C., dated as of April 15, 2008, by and among Blackstone Holdings III L.P. and certain members of BCLA L.L.C. (incorporated herein by reference to Exhibit 10.28 to the Registrant’s Quarterly Report on Form 10-Q for the quarter ended March 31, 2008 (File No. 001-33551) filed with the SEC on May 15, 2008). | |
| 10.30+ | Third Amended and Restated Agreement of Limited Partnership of Blackstone Real Estate Management Associates Europe III L.P., dated as of June 30, 2008 (incorporated herein by reference to Exhibit 10.28 to the Registrant’s Quarterly Report on Form 10-Q for the quarter ended June 30, 2008 (File No. 001-33551) filed with the SEC on August 8, 2008). | |
272
Table of Contents
| Exhibit Number |
Exhibit Description | |
| 10.31+ | Second Amended and Restated Limited Liability Company Agreement of Blackstone Real Estate Special Situations Associates L.L.C., dated as of June 30, 2008 (incorporated herein by reference to Exhibit 10.29 to the Registrant’s Quarterly Report on Form 10-Q for the quarter ended June 30, 2008 (File No. 001-33551) filed with the SEC on August 8, 2008). | |
| 10.32+ | BMA VI L.L.C. Amended and Restated Limited Liability Company Agreement, dated as of July 31, 2008 (incorporated herein by reference to Exhibit 10.30 to the Registrant’s Quarterly Report on Form 10-Q for the quarter ended September 30, 2008 (File No. 001-33551) filed with the SEC on November 7, 2008). | |
| 10.33+ | Fourth Amended and Restated Limited Liability Company Agreement of GSO Associates LLC, dated as of March 3, 2008 (incorporated herein by reference to Exhibit 10.33 to the Registrant’s Annual Report on Form 10-K for the year ended December 31, 2008 (File No. 001- 33551) filed with the SEC on March 2, 2009). | |
| 10.34+ | Amended and Restated Limited Liability Company Agreement of GSO Overseas Associates LLC, dated as of March 3, 2008 (incorporated herein by reference to Exhibit 10.34 to the Registrant’s Annual Report on Form 10-K for the year ended December 31, 2008 (File No. 001-33551) filed with the SEC on March 2, 2009). | |
| 10.35+ | Third Amended and Restated Limited Liability Company Agreement of GSO Capital Opportunities Associates LLC, dated as of March 3, 2008 (incorporated herein by reference to Exhibit 10.36 to the Registrant’s Annual Report on Form 10-K for the year ended December 31, 2008 (File No. 001- 33551) filed with the SEC on March 2, 2009). | |
| 10.36+ | Third Amended and Restated Limited Liability Company Agreement of GSO Capital Opportunities Overseas Associates LLC, dated as of March 3, 2008 (incorporated herein by reference to Exhibit 10.37 to the Registrant’s Annual Report on Form 10-K for the year ended December 31, 2008 (File No. 001-33551) filed with the SEC on March 2, 2009). | |
| 10.37+ | Amended and Restated Limited Liability Company Agreement of GSO Liquidity Overseas Associates LLC, dated as of March 3, 2008 (incorporated herein by reference to Exhibit 10.39 to the Registrant’s Annual Report on Form 10-K for the year ended December 31, 2008 (File No. 001-33551) filed with the SEC on March 2, 2009). | |
| 10.38+ | Blackstone / GSO Capital Solutions Associates LLC Second Amended and Restated Limited Liability Company Agreement, dated as of May 22, 2009 (incorporated herein by reference to Exhibit 10.40 to the Registrant’s Quarterly Report on Form 10-Q for the quarter ended June 30, 2009 (File No. 001-33551) filed with the SEC on August 7, 2009). | |
| 10.39+ | Blackstone / GSO Capital Solutions Overseas Associates LLC Second Amended and Restated Limited Liability Company Agreement, dated as of July 10, 2009 (incorporated herein by reference to Exhibit 10.41 to the Registrant’s Quarterly Report on Form 10-Q for the quarter ended June 30, 2009 (File No. 001-33551) filed with the SEC on August 7, 2009). | |
| 10.40+ | Blackstone Real Estate Special Situations Associates II L.L.C. Amended and Restated Limited Liability Company Agreement, dated as of June 30, 2009 (incorporated herein by reference to Exhibit 10.42 to the Registrant’s Quarterly Report on Form 10-Q for the quarter ended June 30, 2009 (File No. 001-33551) filed with the SEC on August 7, 2009). | |
| 10.41+ | Blackstone Real Estate Special Situations Management Associates Europe L.P. Amended and Restated Agreement of Limited Partnership, dated as of June 30, 2009 (incorporated herein by reference to Exhibit 10.43 to the Registrant’s Quarterly Report on Form 10-Q for the quarter ended June 30, 2009 (File No. 001-33551) filed with the SEC on August 7, 2009). | |
273
Table of Contents
| Exhibit Number |
Exhibit Description | |
| 10.42+ | BRECA L.L.C. Amended and Restated Limited Liability Company Agreement, dated as of May 1, 2009 (incorporated herein by reference to Exhibit 10.44 to the Registrant’s Quarterly Report on 10-Q for the quarter ended June 30, 2009 (File No. 001-33551) filed with the SEC on August 7, 2009). | |
| 10.43 | GSO Targeted Opportunity Associates LLC Amended and Restated Limited Liability Company Agreement, dated as of December 9, 2009 (incorporated herein by reference to Exhibit 10.48 to the Registrant’s Quarterly Report on Form 10-Q for the quarter ended March 31, 2010 (File No. 001-33551) filed with the SEC on May 10, 2010). | |
| 10.44 | GSO Targeted Opportunity Overseas Associates LLC Amended and Restated Limited Liability Company Agreement, dated as of December 9, 2009 (incorporated herein by reference to Exhibit 10.49 to the Registrant’s Quarterly Report on Form 10-Q for the quarter ended March 31, 2010 (File No. 001-33551) filed with the SEC on May 10, 2010). | |
| 10.45 | BCVA L.L.C. Amended and Restated Limited Liability Company Agreement, dated as of July 8, 2010 (incorporated herein by reference to Exhibit 10.50 to the Registrant’s Quarterly Report on Form 10-Q for the quarter ended June 30, 2010 (File No. 001-33551) filed with the SEC on August 6, 2010). | |
| 10.46 | Amended and Restated Agreement of Exempted Limited Partnership of MB Asia REA L.P., dated November 23, 2010 (incorporated herein by reference to Exhibit 10.51 to the Registrant’s Annual Report on Form 10-K for the year ended December 31, 2010 (File No. 001-33551) filed with the SEC on February 25, 2011). | |
| 10.47 | Amended and Restated Limited Liability Company Agreement of GSO SJ Partners Associates LLC, dated December 7, 2010, by and among GSO Holdings I L.L.C. and certain members of GSO SJ Partners Associates LLC thereto (incorporated herein by reference to Exhibit 10.4 to the Registrant’s Quarterly Report on Form 10-Q for the quarter ended March 31, 2011 (File No. 001-33551) filed with the SEC on May 6, 2011). | |
| 10.48+ | Amended and Restated Exempted Limited Partnership Agreement of GSO Capital Opportunities Associates II LP, dated as of December 31, 2015 (incorporated herein by reference to Exhibit 10.53 to the Registrant’s Annual Report on Form 10-K for the year ended December 31, 2015 (File No. 001-33551) filed with the SEC on February 26, 2016). | |
| 10.49 | Blackstone EMA L.L.C. Amended and Restated Limited Liability Company Agreement, dated as of August 1, 2011 (incorporated herein by reference to Exhibit 10.1 to the Registrant’s Quarterly Report on Form 10-Q for the quarter ended September 30, 2011 (File No. 001-33551) filed with the SEC on November 9, 2011). | |
| 10.50 | Blackstone Real Estate Associates VII L.P. Amended and Restated Agreement of Limited Partnership, dated as of September 1, 2011 (incorporated herein by reference to Exhibit 10.3 to the Registrant’s Quarterly Report on Form 10-Q for the quarter ended September 30, 2011 (File No. 001-33551) filed with the SEC on November 9, 2011). | |
| 10.50.1 | Blackstone Real Estate Associates VII L.P. Second Amended and Restated Agreement of Limited Partnership, dated as of September 1, 2011 (incorporated herein by reference to Exhibit 10.53.1 to the Registrant’s Annual Report on Form 10 K for the year ended December 31, 2011 (File No. 001-33551) filed with the SEC on February 28, 2012). | |
| 10.51 | GSO Energy Partners-A Associates LLC Second Amended and Restated Limited Liability Company Agreement, dated as of February 28, 2012 (incorporated herein by reference to Exhibit 10.1 to the Registrant’s Quarterly Report on Form 10-Q for the quarter ended March 31, 2012 (File No. 001-33551) filed with the SEC on May 7, 2012). | |
274
Table of Contents
| Exhibit Number |
Exhibit Description | |
| 10.52 | BTOA L.L.C. Amended and Restated Limited Liability Company Agreement, dated as of February 15, 2012 (incorporated herein by reference to Exhibit 10.2 to the Registrant’s Quarterly Report on Form 10-Q for the quarter ended March 31, 2012 (File No. 001-33551) filed with the SEC on May 7, 2012). | |
| 10.53+ | Form of Deferred Holdings Unit Agreement for Senior Managing Directors (incorporated herein by reference to Exhibit 10.2 to the Registrant’s Quarterly Report on Form 10-Q for the quarter ended June 30, 2012 (File No. 001-33551) filed with the SEC on August 7, 2012). | |
| 10.54+ | Amended and Restated Limited Liability Company Agreement of Blackstone Commercial Real Estate Debt Associates L.L.C., dated as of November 12, 2010 (incorporated herein by reference to Exhibit 10.3 to the Registrant’s Quarterly Report on Form 10-Q for the quarter ended June 30, 2012 (File No. 001-33551) filed with the SEC on August 7, 2012). | |
| 10.55+ | Limited Liability Company Agreement of Blackstone Innovations L.L.C., dated November 2, 2012 (incorporated herein by reference to Exhibit 10.1 to the Registrant’s Quarterly Report on Form 10-Q for the quarter ended September 30, 2012 (File No. 001-33551) filed with the SEC on November 2, 2012). | |
| 10.56+ | Amended and Restated Agreement of Exempted Limited Partnership of Blackstone Innovations (Cayman) III L.P., dated November 2, 2012 (incorporated herein by reference to Exhibit 10.2 to the Registrant’s Quarterly Report on Form 10-Q for the quarter ended September 30, 2012 (File No. 001-33551) filed with the SEC on November 2, 2012). | |
| 10.57+ | GSO Foreland Resources Co-Invest Associates LLC Amended and Restated Limited Liability Company Agreement, dated as of August 10, 2012 (incorporated herein by reference to Exhibit 10.60 to the Registrant’s Annual Report on Form 10 K for the year ended December 31, 2012 (File No. 001-33551) filed with the SEC on March 1, 2013). | |
| 10.58+ | GSO Palmetto Opportunistic Associates LLC Amended and Restated Limited Liability Company Agreement, dated as of July 31, 2012 (incorporated herein by reference to Exhibit 10.61 to the Registrant’s Annual Report on Form 10 K for the year ended December 31, 2012 (File No. 001-33551) filed with the SEC on March 1, 2013). | |
| 10.59+ | Second Amended and Restated Agreement of Exempted Limited Partnership of Blackstone Real Estate Associates Asia L.P., dated February 26, 2014 (incorporated herein by reference to Exhibit 10.63 to the Registrant’s Annual Report on Form 10-K for the year ended December 31, 2013 (File No. 001-33551) filed with the SEC on February 28, 2014). | |
| 10.60+ | Amended and Restated Agreement of Exempted Limited Partnership of Blackstone Real Estate Associates Europe IV L.P., dated February 26, 2014 (incorporated herein by reference to Exhibit 10.64 to the Registrant’s Annual Report on Form 10-K for the year ended December 31, 2013 (File No. 001-33551) filed with the SEC on February 28, 2014). | |
| 10.61+ | Aircraft Dry Lease Agreement between XB Partners LLC and Blackstone Administrative Services Partnership L.P. dated as of February 27, 2015 (incorporated herein by reference to Exhibit 10.65 to the Registrant’s Annual Report on Form 10-K for the year ended December 31, 2014 (File No. 001-33551) filed with the SEC on February 27, 2015). | |
| 10.62+ | Form of GSO Senior Managing Director Agreement by and among Blackstone Holdings I L.P. and each of the Senior Managing Directors from time to time party thereto (incorporated herein by reference to Exhibit 10.66 to the Registrant’s Annual Report on Form 10-K for the year ended December 31, 2014 (File No. 001-33551) filed with the SEC on February 27, 2015). | |
275
Table of Contents
| Exhibit Number |
Exhibit Description | |
| 10.63+ | Form of GSO Senior Managing Director Non-Compensation and Non-Solicitation Agreement by and among Blackstone Holdings I L.P., Blackstone Holdings II L. P., Blackstone Holdings III L.P., Blackstone Holdings IV L.P. and each of the Senior Managing Directors from time to time party thereto (incorporated herein by reference to Exhibit 10.67 to the Registrant’s Annual Report on Form 10-K for the year ended December 31, 2014 (File No. 001-33551) filed with the SEC on February 27, 2015). | |
| 10.64+ | Form of Performance Earn Out Letter Agreement by and among Blackstone Holdings I L.P., GSO Holdings I L.L.C. and each of the GSO individuals party thereto (incorporated herein by reference to Exhibit 10.1 to the Registrant’s Quarterly Report on Form 10-Q for the quarter ended March 31, 2015 (File No. 001-33551) filed with the SEC on May 8, 2015). | |
| 10.65+ | Performance Earn Out Side Letter by and between Blackstone Holdings I L.P., Blackstone Holdings II L.P., Blackstone Holdings III L.P. and Blackstone Holdings IV L.P. and Bennett J. Goodman dated February 24, 2015 (incorporated herein by reference to Exhibit 10.2 to the Registrant’s Quarterly Report on Form 10-Q for the quarter ended March 31, 2015 (File No. 001-33551) filed with the SEC on May 8, 2015). | |
| 10.66+ | Form of Deferred Holdings Unit Agreement between The Blackstone Group L.P. and each GSO participant party thereto (incorporated herein by reference to Exhibit 10.3 to the Registrant’s Quarterly Report on Form 10-Q for the quarter ended March 31, 2015 (File No. 001-33551) filed with the SEC on May 8, 2015). | |
| 10.67 | Aircraft Dry Lease Agreement between 113CS LLC and Blackstone Administrative Services Partnership L.P., dated as of January 15, 2015 (incorporated herein by reference to Exhibit 10.4 to the Registrant’s Quarterly Report on Form 10-Q for the quarter ended March 31, 2015 (File No. 001-33551) filed with the SEC on May 8, 2015). | |
| 10.68+ | Form of Special Equity Award — Deferred Holdings Unit Agreement under The Blackstone Group L.P. 2007 Equity Incentive Plan (incorporated herein by reference to Exhibit 10.1 to the Registrant’s Quarterly Report on Form 10-Q for the quarter ended June 30, 2015 (File No. 001-33551) filed with the SEC on August 6, 2015). | |
| 10.69+ | Amended and Restated Agreement of Limited Partnership of BREP Edens Associates L.P., dated as of December 18, 2013 (incorporated herein by reference to Exhibit 10.76 to the Registrant’s Annual Report on Form 10-K for the year ended December 31, 2015 (File No. 001-33551) filed with the SEC on February 26, 2016). | |
| 10.70+ | Amended and Restated Agreement of Exempt Limited Partnership of Blackstone AG Associates L.P., dated as of February 16, 2016 and deemed effective as of May 30, 2014 (incorporated herein by reference to Exhibit 10.77 to the Registrant’s Annual Report on Form 10-K for the year ended December 31, 2015 (File No. 001-33551) filed with the SEC on February 26, 2016). | |
| 10.71+ | Amended and Restated Agreement of Limited Partnership of BREP OMP Associates L.P., dated as of June 27, 2014 (incorporated herein by reference to Exhibit 10.78 to the Registrant’s Annual Report on Form 10-K for the year ended December 31, 2015 (File No. 001-33551) filed with the SEC on February 26, 2016). | |
| 10.72+ | Amended and Restated Agreement of Exempted Limited Partnership of Blackstone OBS Associates L.P., dated as of February 16, 2016 and deemed effective July 25, 2014 (incorporated herein by reference to Exhibit 10.79 to the Registrant’s Annual Report on Form 10-K for the year ended December 31, 2015 (File No. 001-33551) filed with the SEC on February 26, 2016). | |
276
Table of Contents
| Exhibit Number |
Exhibit Description | |
| 10.73+ | Amended and Restated Limited Liability Company Agreement of Blackstone EMA II L.L.C., dated as of October 21, 2014 (incorporated herein by reference to Exhibit 10.80 to the Registrant’s Annual Report on Form 10-K for the year ended December 31, 2015 (File No. 001-33551) filed with the SEC on February 26, 2016). | |
| 10.74+ | Second Amended and Restated Agreement of Limited Partnership of Blackstone Liberty Place Associates L.P., dated as of February 9, 2015 (incorporated herein by reference to Exhibit 10.81 to the Registrant’s Annual Report on Form 10-K for the year ended December 31, 2015 (File No. 001-33551) filed with the SEC on February 26, 2016). | |
| 10.75+ | Second Amended and Restated Agreement of Exempted Limited Partnership of BPP Core Asia Associates L.P., dated February 16, 2016 and deemed effective March 18, 2015 (incorporated herein by reference to Exhibit 10.82 to the Registrant’s Annual Report on Form 10-K for the year ended December 31, 2015 (File No. 001-33551) filed with the SEC on February 26, 2016). | |
| 10.76+ | Second Amended and Restated Agreement of Exempted Limited Partnership of BPP Core Asia Associates-NQ L.P., dated as of February 16, 2016 and deemed effective March 18, 2015 (incorporated herein by reference to Exhibit 10.83 to the Registrant’s Annual Report on Form 10-K for the year ended December 31, 2015 (File No. 001-33551) filed with the SEC on February 26, 2016). | |
| 10.77+ | Amended and Restated Agreement of Limited Partnership of Blackstone Real Estate Associates VIII L.P., dated as of March 27, 2015 (incorporated herein by reference to Exhibit 10.84 to the Registrant’s Annual Report on Form 10-K for the year ended December 31, 2015 (File No. 001-33551) filed with the SEC on February 26, 2016). | |
| 10.78+ | Amended and Restated Limited Liability Company Agreement of BMA VII L.L.C., dated as of May 13, 2015 (incorporated herein by reference to Exhibit 10.85 to the Registrant’s Annual Report on Form 10-K for the year ended December 31, 2015 (File No. 001-33551) filed with the SEC on February 26, 2016). | |
| 10.79+ | Amended and Restated Agreement of Exempt Limited Partnership of Blackstone Property Associates International L.P., dated as of February 16, 2016 and deemed effective as of July 15, 2015 (incorporated herein by reference to Exhibit 10.86 to the Registrant’s Annual Report on Form 10-K for the year ended December 31, 2015 (File No. 001-33551) filed with the SEC on February 26, 2016). | |
| 10.80+ | Amended and Restated Agreement of Exempt Limited Partnership of Blackstone Property Associates International-NQ L.P., dated as of February 16, 2016 and deemed effective July 28, 2015 (incorporated herein by reference to Exhibit 10.87 to the Registrant’s Annual Report on Form 10-K for the year ended December 31, 2015 (File No. 001-33551) filed with the SEC on February 26, 2016). | |
| 10.81+ | BTOA II L.L.C. Amended and Restated Limited Liability Company Agreement, dated as of December 19, 2014 (incorporated herein by reference to Exhibit 10.1 to the Registrant’s Quarterly Report on Form 10-Q for the quarter ended March 31, 2016 (File No. 001-33551) filed with the SEC on May 4, 2015). | |
| 10.82+* | Special Equity Award - Deferred Holdings Unit Agreement under The Blackstone Group L.P. 2007 Equity Incentive Plan (Chief Financial Officer). | |
| 10.83+* | Form of Deferred Holdings Unit Agreement under The Blankspace Group L.P. 2007 Equity Incentive Plan (2013 and 2014 awards). | |
| 21.1* | Subsidiaries of the Registrant. | |
| 23.1* | Consent of Deloitte & Touche LLP. | |
277
Table of Contents
| Exhibit Number |
Exhibit Description | |
| 31.1* | Certification of the Chief Executive Officer pursuant to Rule 13a-14(a). | |
| 31.2* | Certification of the Chief Financial Officer pursuant to Rule 13a-14(a). | |
| 32.1* | Certification of the Chief Executive Officer pursuant to 18 U.S.C. Section 1350, as adopted pursuant to Section 906 of the Sarbanes-Oxley Act of 2002 (furnished herewith). | |
| 32.2* | Certification of the Chief Financial Officer pursuant to 18 U.S.C. Section 1350, as adopted pursuant to Section 906 of the Sarbanes-Oxley Act of 2002 (furnished herewith). | |
| 101.INS* | XBRL Instance Document. | |
| 101.SCH* | XBRL Taxonomy Extension Schema Document. | |
| 101.CAL* | XBRL Taxonomy Extension Calculation Linkbase Document. | |
| 101.DEF* | XBRL Taxonomy Extension Definition Linkbase Document. | |
| 101.LAB* | XBRL Taxonomy Extension Label Linkbase Document. | |
| 101.PRE* | XBRL Taxonomy Extension Presentation Linkbase Document. | |
| * | Filed herewith. |
| + | Management contract or compensatory plan or arrangement in which directors or executive officers are eligible to participate. |
The agreements and other documents filed as exhibits to this report are not intended to provide factual information or other disclosure other than with respect to the terms of the agreements or other documents themselves, and you should not rely on them for that purpose. In particular, any representations and warranties made by us in these agreements or other documents were made solely within the specific context of the relevant agreement or document and may not describe the actual state of affairs as of the date they were made or at any other time.
| ITEM 16. | FORM 10-K SUMMARY |
None.
278
Table of Contents
Pursuant to the requirements of Section 13 or 15(d) of the Securities Exchange Act of 1934, the Registrant has duly caused this report to be signed on its behalf by the undersigned, thereunto duly authorized.
Date: February 24, 2017
| The Blackstone Group L.P. | ||
| By: | Blackstone Group Management L.L.C., | |
| its General Partner | ||
| /s/ Michael S. Chae | ||
| Name: | Michael S. Chae | |
| Title: | Chief Financial Officer | |
| (Principal Financial Officer and Authorized Signatory) | ||
Pursuant to the requirements of the Securities Exchange Act of 1934, this report has been signed below by the following persons on behalf of the registrant and in the capacities indicated on this 24th day of February, 2017.
| Signature |
Title | |
| /s/ Stephen A. Schwarzman Stephen A. Schwarzman |
Chief Executive Officer and Chairman of the Board of Directors (Principal Executive Officer) | |
| /s/ Bennett J. Goodman Bennett J. Goodman |
Director | |
| /s/ Jonathan D. Gray Jonathan D. Gray |
Director | |
| /s/ J. Tomilson Hill J. Tomilson Hill |
Director | |
| /s/ Hamilton E. James Hamilton E. James |
Director | |
| /s/ James W. Breyer James W. Breyer |
Director | |
| /s/ Peter T. Grauer Peter T. Grauer |
Director | |
| /s/ Richard Jenrette Richard Jenrette |
Director | |
| /s/ Rochelle B. Lazarus Rochelle B. Lazarus |
Director | |
| /s/ Jay O. Light Jay O. Light |
Director | |
279
Table of Contents
| Signature |
Title | |
| /s/ Brian Mulroney Brian Mulroney |
Director | |
| /s/ William G. Parrett William G. Parrett |
Director | |
| /s/ Michael S. Chae Michael S. Chae |
Chief Financial Officer (Principal Financial Officer) | |
| /s/ Kathleen Skero Kathleen Skero |
Principal Accounting Officer (Principal Accounting Officer) | |
280