Attached files
| file | filename |
|---|---|
| 8-K - FORM 8-K - PERCEPTRON INC/MI | f8k_040418.htm |
Exhibit 99.1
Investor Presentation April 2018 Dave Watza, President & CEO Rick Van Valkenburg , Vice President of Global Sales & Marketing
Cautionary Statement Certain statements made or incorporated by reference in this presentation reflects management’s estimates and beliefs and are intended to be, and are hereby identified as, “Forward - Looking Statements” under the meaning of the Private Securities Litigation Reform Act of 1995 . Whenever possible, we have identified these forward - looking statements by words such as “target,” “will,” “should,” “could,” “believes,” “expects,” “anticipates,” “estimates,” “prospects,” “outlook,” “guidance” or similar expressions . While we believe that our forward - looking statements are reasonable, you should not place undue reliance on any such forward - looking statements, which speak only as of the date made . Because these forward - looking statements are based on estimates and assumptions that are subject to significant business, economic and competitive uncertainties, many of which are beyond our control or are subject to change, actual results could be materially different . Please see our SEC filings for factors that may cause such a difference, including those listed in “Item 1 A – Risk Factors” section of our Annual Report on Form 10 - K and Quarterly Reports on Form 10 - Q . Except as required by applicable law, we do not undertake, and expressly disclaim, any obligation to publicly update or alter our statements whether as a result of new information, events or circumstances occurring after the date of this report or otherwise . 2 Safe Harbor Statement
• Develops , produces and sells automated industrial metrology products and solutions to manufacturing organizations for 100% dimensional gauging and / or inspection and 3D scanning. • Products include: • 3D machine vision solutions • Robot guidance • Coordinate measuring machines • Laser scanning • Advanced analysis software • Global manufacturing companies rely on Perceptron's metrology solutions to assist in managing their complex manufacturing processes to improve quality, shorten product launch times and reduce costs. • Headquartered in Plymouth, Michigan 3 Perceptron, Inc. (Nasdaq: PRCP) Overview
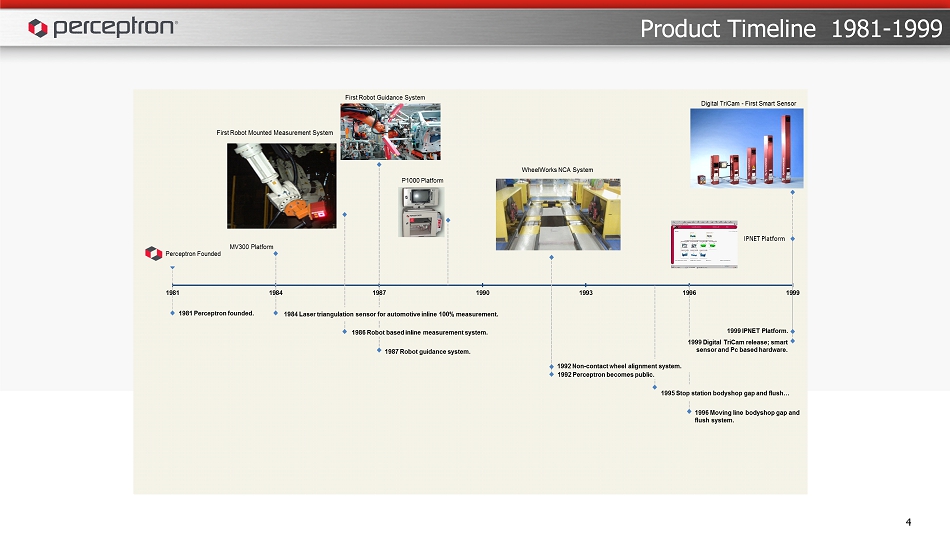
4 Product Timeline 1981 - 1999
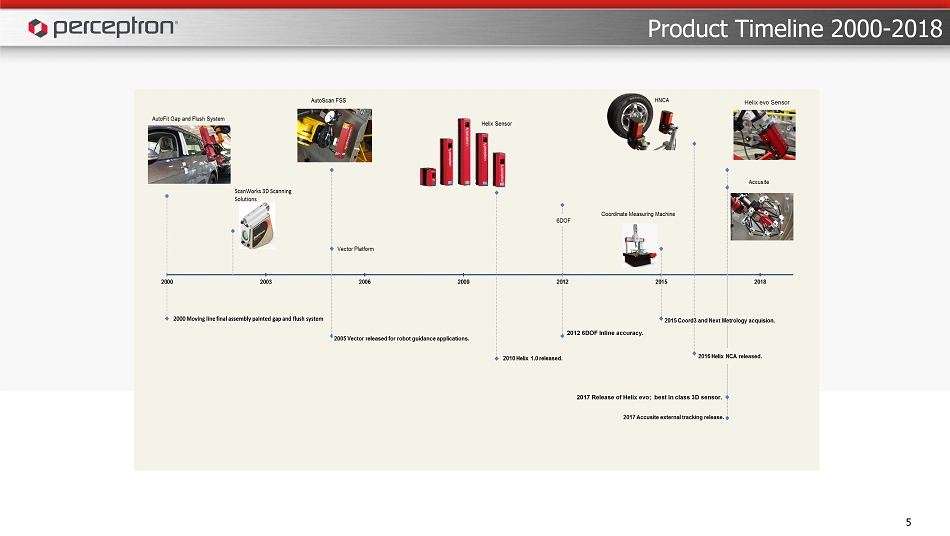
5 Product Timeline 2000 - 2018 2017 Release of Helix evo ; best in class 3D sensor. Helix evo Sensor 2012 6DOF Inline accuracy.
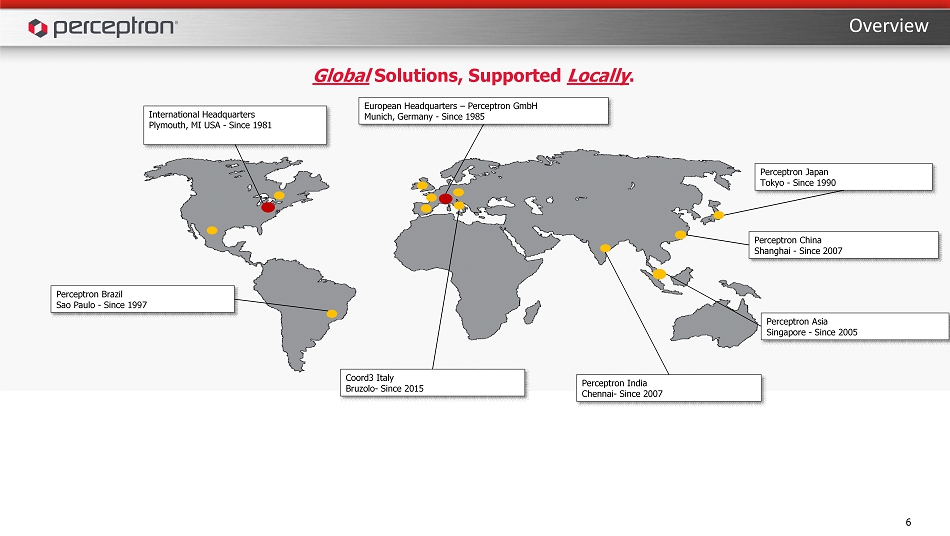
Overview Global Solutions, Supported Locally . International Headquarters Plymouth, MI USA - Since 1981 Perceptron Brazil Sao Paulo - Since 1997 European Headquarters – Perceptron GmbH Munich, Germany - Since 1985 Perceptron Asia Singapore - Since 2005 Perceptron Japan Tokyo - Since 1990 Perceptron China Shanghai - Since 2007 Perceptron India Chennai - Since 2007 Coord3 Italy Bruzolo - Since 2015 6
• Maintain and grow market leadership in core technologies • Expand footprint within automotive • Continue on diversification path into newer industries • Aspire to grow bookings and revenue equal to or faster than the growth in the global markets we serve – Goal of >10% revenue growth through expanded operating income • Gross profit growth should reflect efficiencies and volume gains – Goal of > 40 % gross margins 7 Strategic Direction
• Continuous investment in engineering capabilities to further expand technical advantages in hardware and software technologies – Targeted product development – Strong brands and technologies • Broaden the product offering to automotive customers and expand the addressable market in pursuit of double digit revenue growth – Long - term growth potential of Global Automotive Industry – Favorable macro trends (automation, cost savings, quality) • Tenaciously pursue greater cost efficiencies through lean practices • Prudent management of working capital to maximize free cash flows and reinvest in the growth areas of the business 8 Strategic Direction
• Our team and culture provide additional competitive strengths – Fact - based decision making and accountability – Optimize resources in every area through continuous improvement – Reinvestment in growth areas of business (Engineering, Sales & Marketing, Business Development) – Leveraging support areas of business (Administration, Accounting, Distribution, Information Technology, Manufacturing, Procurement) – Consciously create a path for high performers 9 Strategic Direction
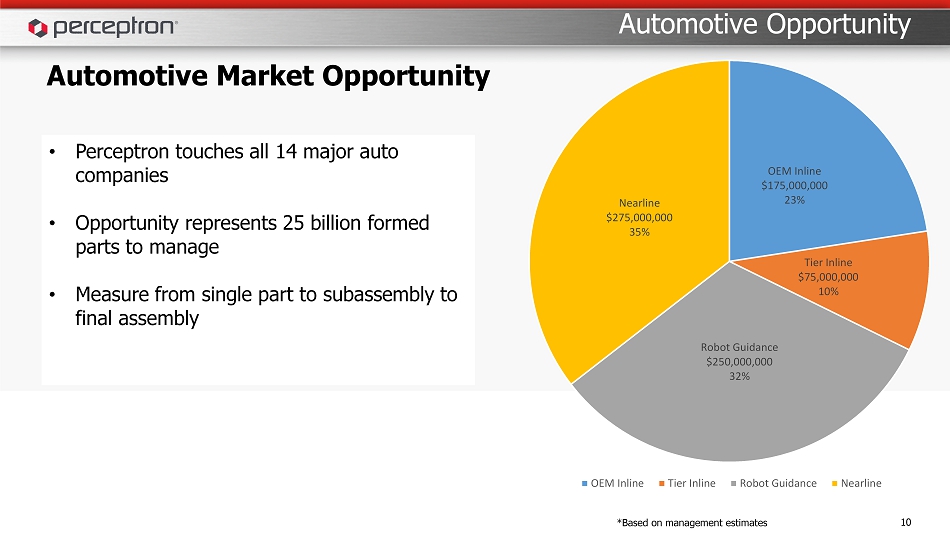
Automotive Market Opportunity 10 Automotive Opportunity OEM Inline $175,000,000 23% Tier Inline $75,000,000 10% Robot Guidance $250,000,000 32% Nearline $275,000,000 35% OEM Inline Tier Inline Robot Guidance Nearline • Perceptron touches all 14 major auto companies • Opportunity represents 25 billion formed parts to manage • Measure from single part to subassembly to final assembly *Based on management estimates
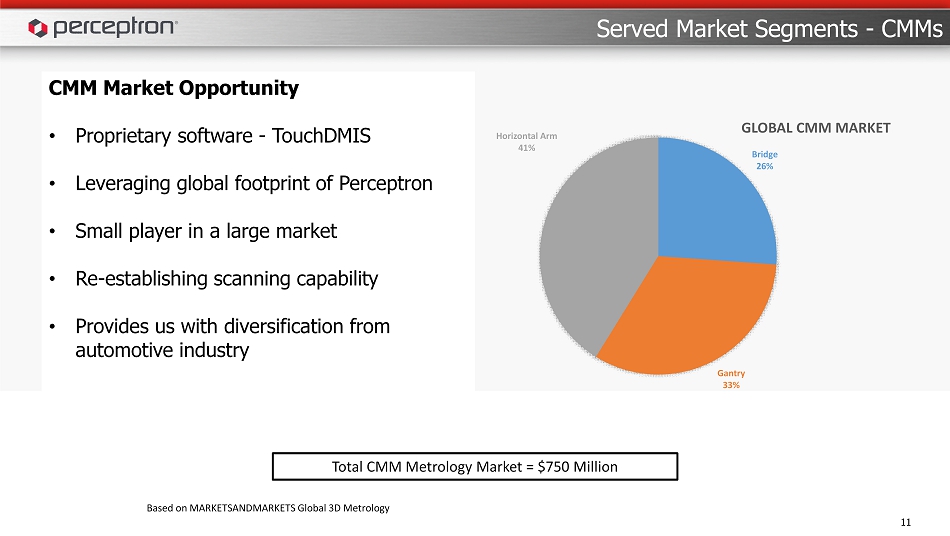
Served Market Segments - CMMs 11 Based on MARKETSANDMARKETS Global 3D Metrology Total CMM Metrology Market = $750 Million Bridge 26% Gantry 33% Horizontal Arm 41% GLOBAL CMM MARKET CMM Market Opportunity • Proprietary software - TouchDMIS • Leveraging global footprint of Perceptron • Small player in a large market • Re - establishing scanning capability • Provides us with diversification from automotive industry
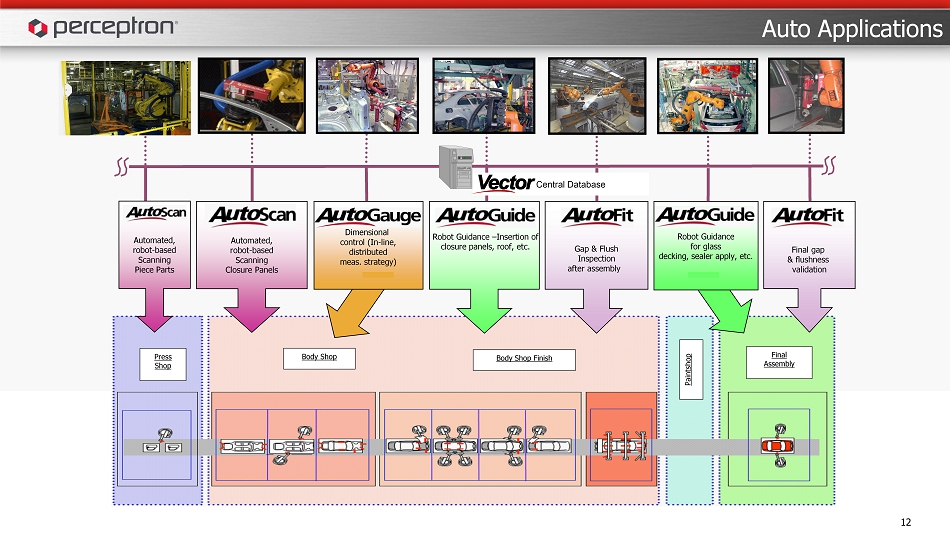
Auto Applications 12 Press Shop Final Assembly Body Shop Body Shop Finish Paintshop Final gap & flushness validation Gap & Flush Inspection after assembly Automated, robot - based Scanning Closure Panels Dimensional control (In - line, distributed meas. strategy) Robot Guidance – Insertion of closure panels, roof, etc. Central Database Robot Guidance for glass decking, sealer apply, etc. Automated, robot - based Scanning Piece Parts
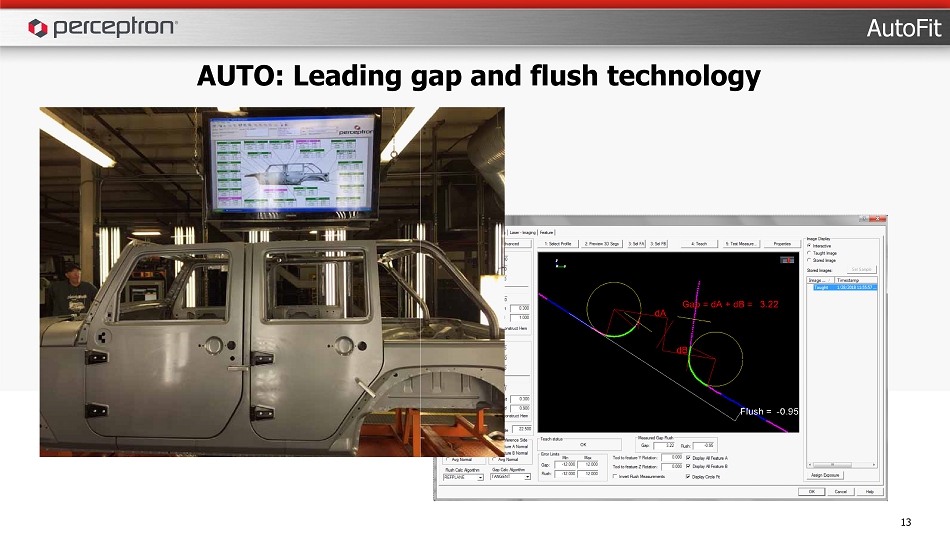
13 AUTO: Leading gap and flush technology AutoFit
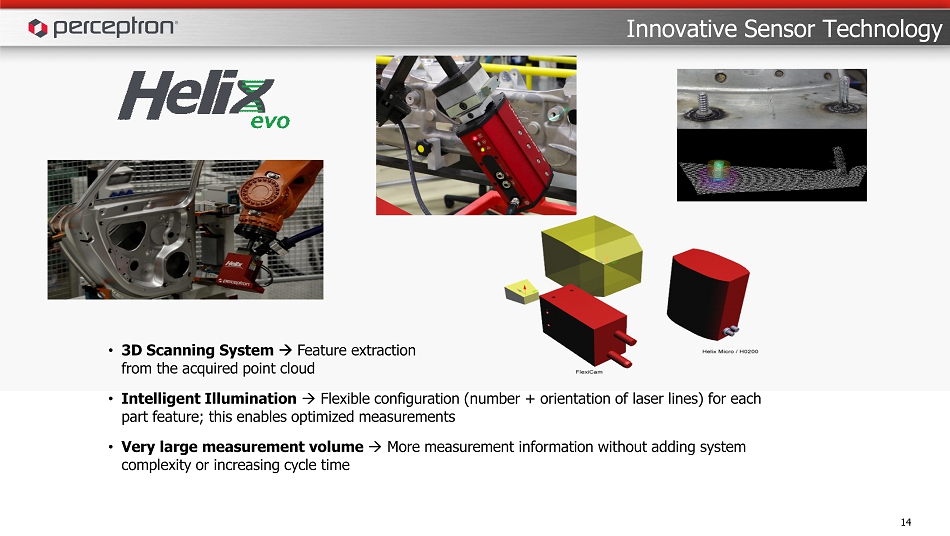
Innovative Sensor Technology • 3D Scanning System Feature extraction from the acquired point cloud • Intelligent Illumination Flexible configuration (number + orientation of laser lines) for each part feature; this enables optimized measurements • Very large measurement volume More measurement information without adding system complexity or increasing cycle time 14
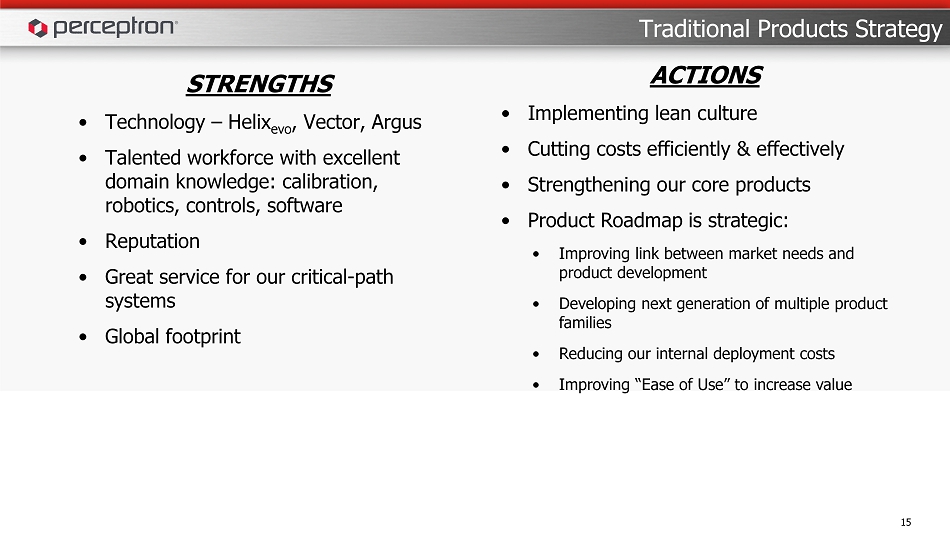
STRENGTHS • Technology – Helix evo , Vector, Argus • Talented workforce with excellent domain knowledge: calibration, robotics, controls, software • Reputation • Great service for our critical - path systems • Global footprint 15 Traditional Products Strategy ACTIONS • Implementing lean culture • Cutting costs efficiently & effectively • Strengthening our core products • Product Roadmap is strategic : • Improving link between market needs and product development • Developing next generation of multiple product families • Reducing our internal deployment costs • Improving “Ease of Use” to increase value
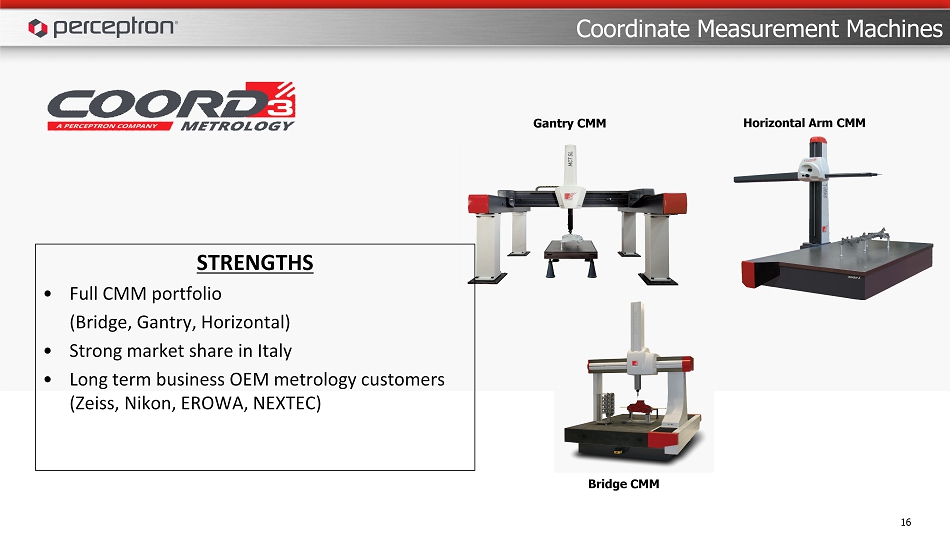
Coordinate Measurement Machines Bridge CMM Gantry CMM Horizontal Arm CMM STRENGTHS • Full CMM portfolio (Bridge, Gantry, Horizontal) • Strong market share in Italy • Long term business OEM metrology customers (Zeiss, Nikon, EROWA, NEXTEC) 16
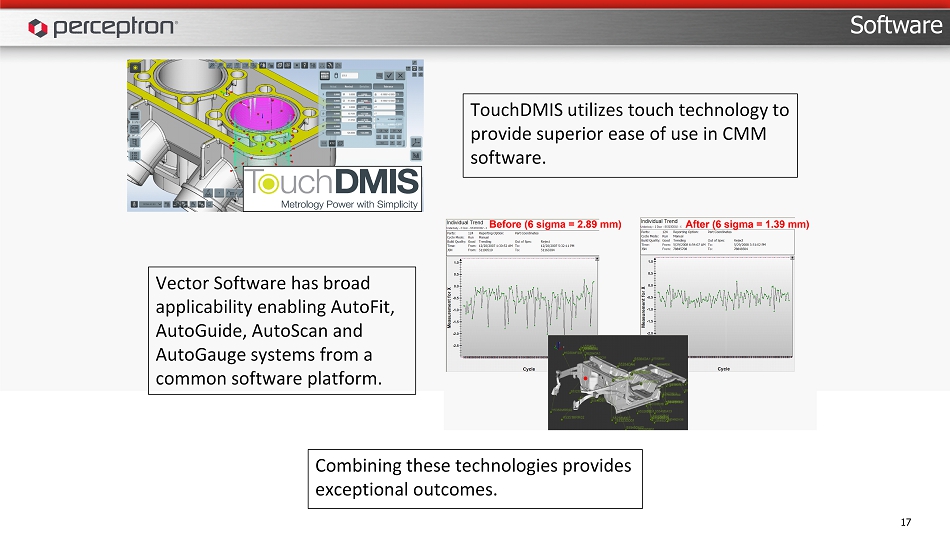
Software 17 TouchDMIS utilizes touch technology to provide superior ease of use in CMM software. Vector Software has broad applicability enabling AutoFit, AutoGuide, AutoScan and AutoGauge systems from a common software platform. Combining these technologies provides exceptional outcomes .
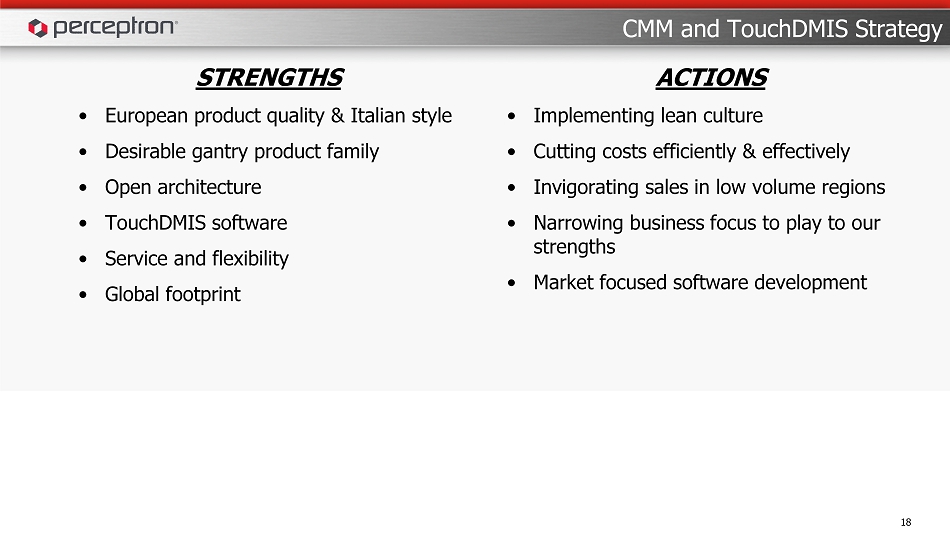
STRENGTHS • European product quality & Italian style • Desirable gantry product family • Open architecture • TouchDMIS software • Service and flexibility • Global footprint 18 CMM and TouchDMIS Strategy ACTIONS • Implementing lean culture • Cutting costs efficiently & effectively • Invigorating sales in low volume regions • Narrowing business focus to play to our strengths • Market focused software development
Financial Results 19
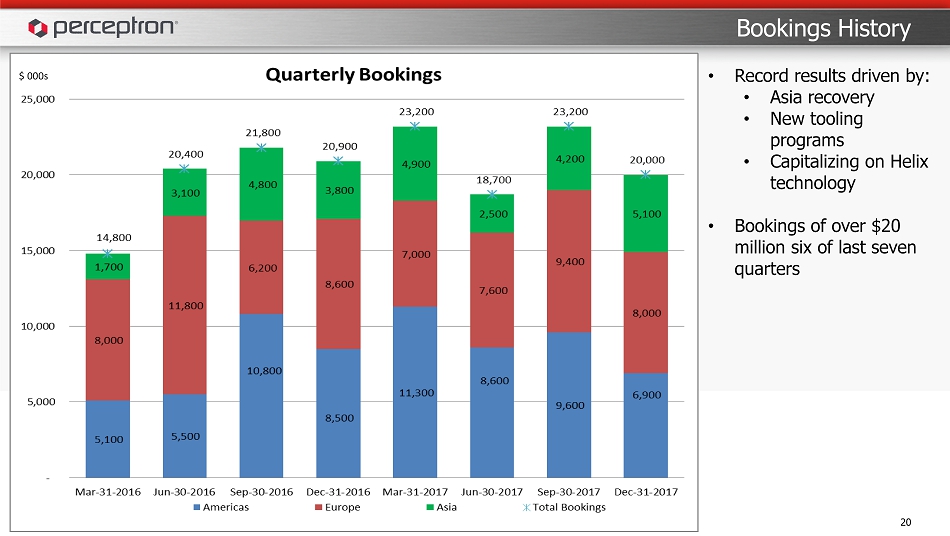
20 Bookings History $ 000s • Record results driven by: • Asia recovery • New tooling programs • Capitalizing on Helix technology • Bookings of over $20 million six of last seven quarters
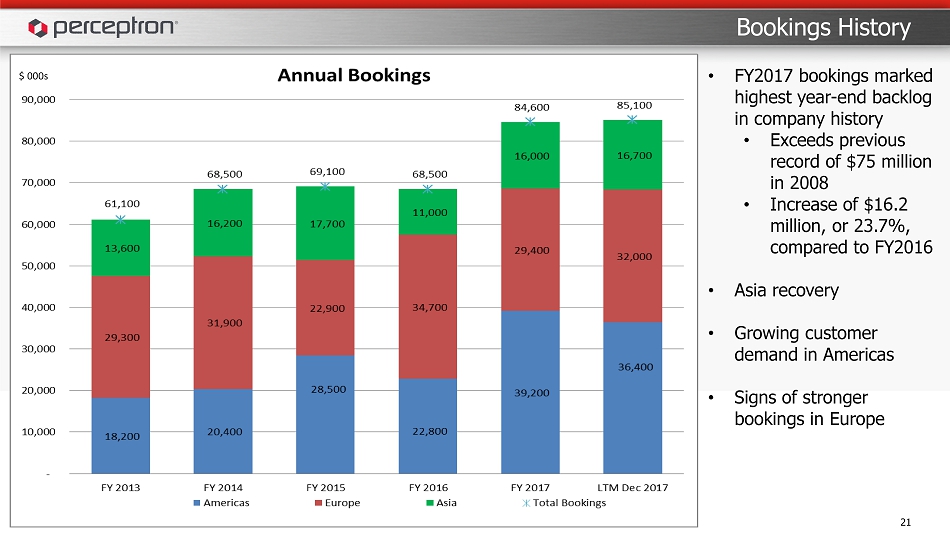
21 Bookings History $ 000s • FY2017 bookings marked highest year - end backlog in company history • Exceeds previous record of $75 million in 2008 • Increase of $16.2 million, or 23.7%, compared to FY2016 • Asia recovery • Growing customer demand in Americas • Signs of stronger bookings in Europe
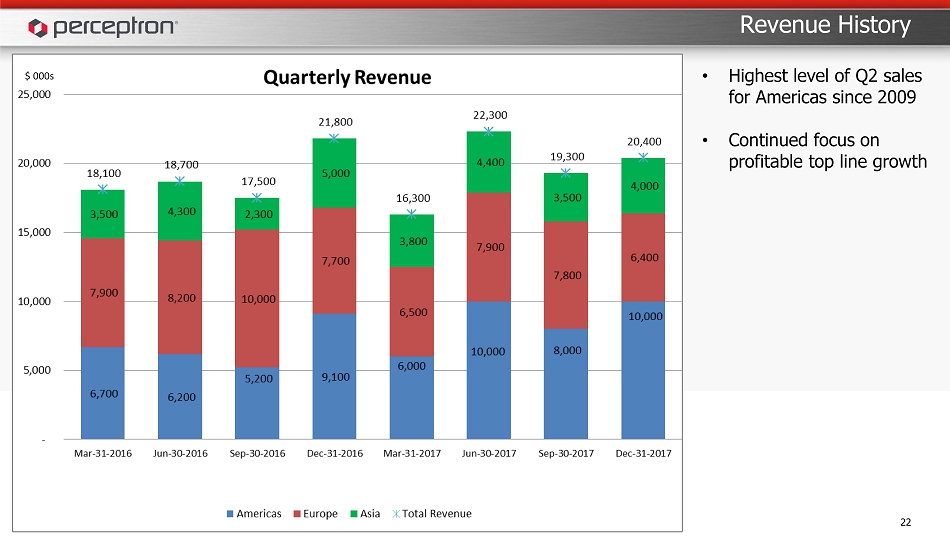
22 Revenue History $ 000s • Highest level of Q2 sales for Americas since 2009 • Continued focus on profitable top line growth
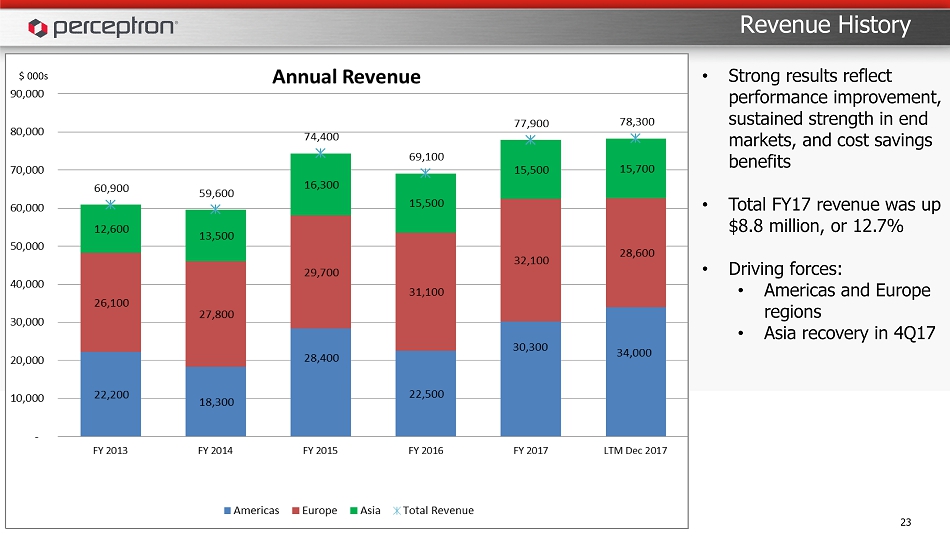
23 Revenue History $ 000s • Strong results reflect performance improvement, sustained strength in end markets, and cost savings benefits • Total FY17 revenue was up $8.8 million, or 12.7% • Driving forces: • Americas and Europe regions • Asia recovery in 4Q17
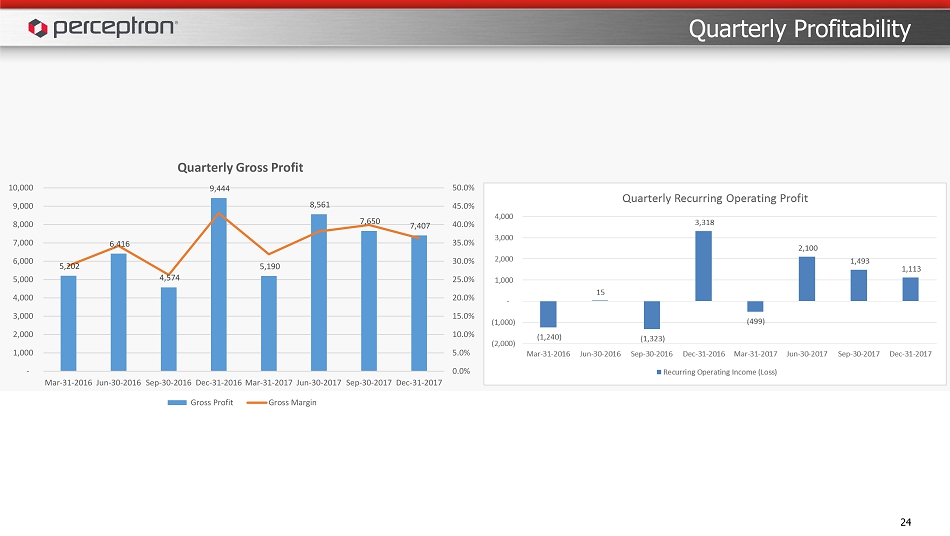
24 Quarterly Profitability 5,202 6,416 4,574 9,444 5,190 8,561 7,650 7,407 0.0% 5.0% 10.0% 15.0% 20.0% 25.0% 30.0% 35.0% 40.0% 45.0% 50.0% - 1,000 2,000 3,000 4,000 5,000 6,000 7,000 8,000 9,000 10,000 Mar-31-2016 Jun-30-2016 Sep-30-2016 Dec-31-2016 Mar-31-2017 Jun-30-2017 Sep-30-2017 Dec-31-2017 Quarterly Gross Profit Gross Profit Gross Margin
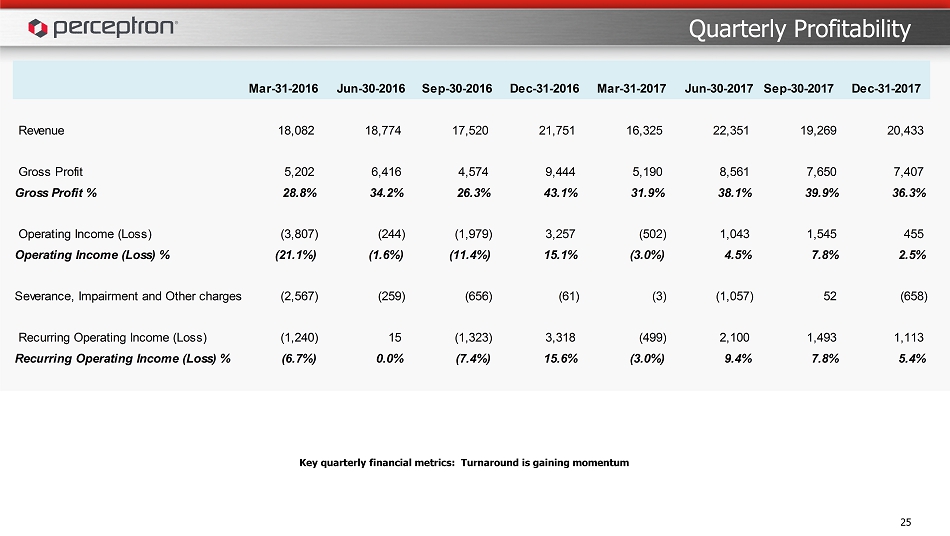
25 Quarterly Profitability Key quarterly financial metrics: Turnaround is gaining momentum Mar-31-2016 Jun-30-2016 Sep-30-2016 Dec-31-2016 Mar-31-2017 Jun-30-2017 Sep-30-2017 Dec-31-2017 Revenue 18,082 18,774 17,520 21,751 16,325 22,351 19,269 20,433 Gross Profit 5,202 6,416 4,574 9,444 5,190 8,561 7,650 7,407 Gross Profit % 28.8% 34.2% 26.3% 43.1% 31.9% 38.1% 39.9% 36.3% Operating Income (Loss) (3,807) (244) (1,979) 3,257 (502) 1,043 1,545 455 Operating Income (Loss) % (21.1%) (1.6%) (11.4%) 15.1% (3.0%) 4.5% 7.8% 2.5% Severance, Impairment and Other charges (2,567) (259) (656) (61) (3) (1,057) 52 (658) Recurring Operating Income (Loss) (1,240) 15 (1,323) 3,318 (499) 2,100 1,493 1,113 Recurring Operating Income (Loss) % (6.7%) 0.0% (7.4%) 15.6% (3.0%) 9.4% 7.8% 5.4%
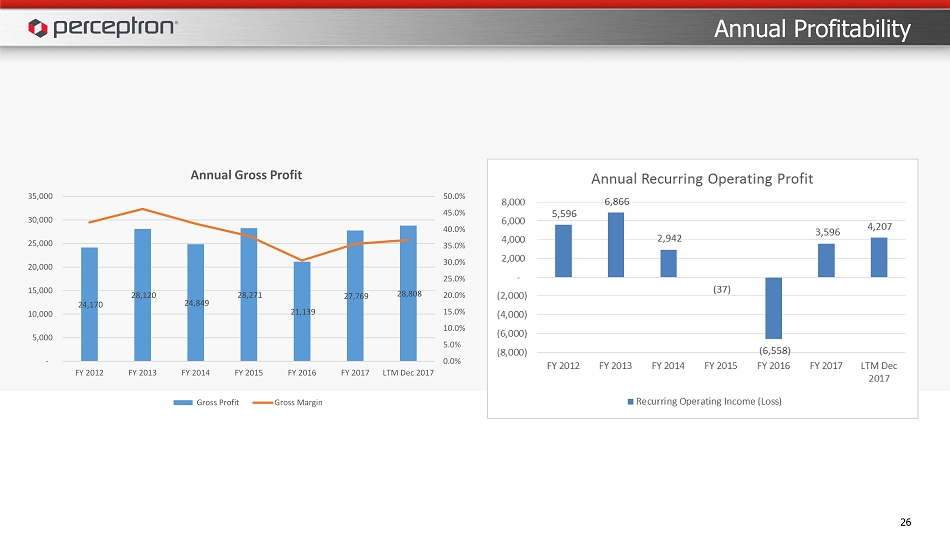
26 Annual Profitability 24,170 28,120 24,849 28,271 21,139 27,769 28,808 0.0% 5.0% 10.0% 15.0% 20.0% 25.0% 30.0% 35.0% 40.0% 45.0% 50.0% - 5,000 10,000 15,000 20,000 25,000 30,000 35,000 FY 2012 FY 2013 FY 2014 FY 2015 FY 2016 FY 2017 LTM Dec 2017 Annual Gross Profit Gross Profit Gross Margin
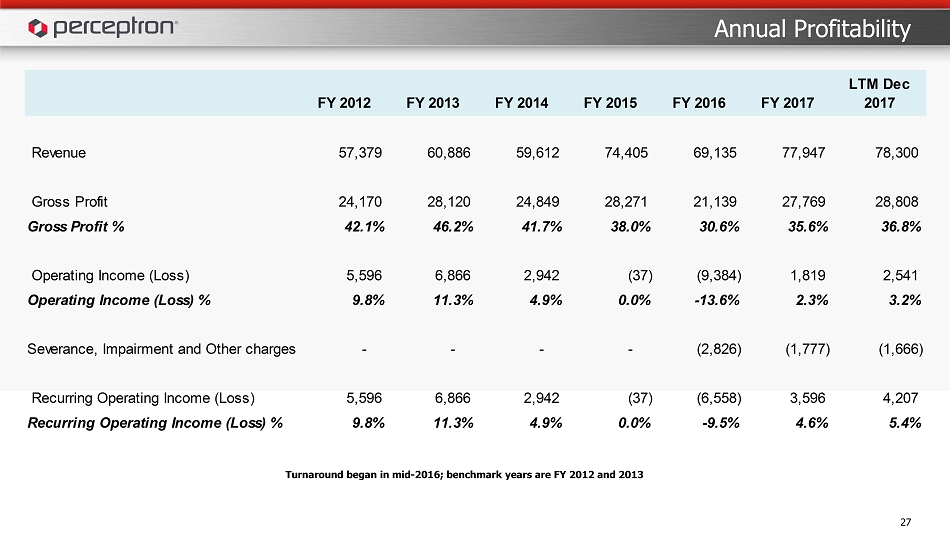
27 Annual Profitability Turnaround began in mid - 2016; benchmark years are FY 2012 and 2013 FY 2012 FY 2013 FY 2014 FY 2015 FY 2016 FY 2017 LTM Dec 2017 Revenue 57,379 60,886 59,612 74,405 69,135 77,947 78,300 Gross Profit 24,170 28,120 24,849 28,271 21,139 27,769 28,808 Gross Profit % 42.1% 46.2% 41.7% 38.0% 30.6% 35.6% 36.8% Operating Income (Loss) 5,596 6,866 2,942 (37) (9,384) 1,819 2,541 Operating Income (Loss) % 9.8% 11.3% 4.9% 0.0% -13.6% 2.3% 3.2% Severance, Impairment and Other charges - - - - (2,826) (1,777) (1,666) Recurring Operating Income (Loss) 5,596 6,866 2,942 (37) (6,558) 3,596 4,207 Recurring Operating Income (Loss) % 9.8% 11.3% 4.9% 0.0% -9.5% 4.6% 5.4%
Our current outlook for the remainder of fiscal 2018 is based on our internal projections about the market and related economic conditions, estimated foreign currency exchange rate effects, as well as our understanding of our key customers’ plans for their retooling projects. • For full fiscal year 2018, we expect revenue growth to be in the mid - single digits compared to fiscal 2017 as we anticipate capitalizing on the successes we had in fiscal 2017 • After giving recognition to the factors discussed above, we expect that the full fiscal year of 2018 operating income could improve compared to fiscal 2017. • Based on our business plan, we believe our level of cash, cash equivalents, short - term investments, credit facilities and expected cash flows in each jurisdiction is sufficient to fund our fiscal 2018 cash flow requirements. • Importantly , we will continue to evaluate business opportunities that fit our strategic plans. 28 Perceptron is reconfirming the following guidance for FY18 : Guidance

• Small supplier in huge and technologically advancing industries • Favorable macro trends • Excellent brand name, leading technology and reputation in the automotive industry • Continuous investment in our engineering capabilities to further expand our technical advantages in hardware and software technologies • Development opportunities in additional areas beyond automotive to expand addressable sales opportunities 29 Summary
30 Questions Thank you for your time and interest in our company! investors@perceptron.com (734) 414 - 6100