Attached files
| file | filename |
|---|---|
| EX-32.1 - EX-32.1 - PERCEPTRON INC/MI | prcp-ex321_7.htm |
| EX-31.1 - EX-31.1 - PERCEPTRON INC/MI | prcp-ex311_6.htm |
| EX-23 - EX-23 - PERCEPTRON INC/MI | prcp-ex23_8.htm |
| EX-21 - EX-21 - PERCEPTRON INC/MI | prcp-ex21_9.htm |
UNITED STATES
SECURITIES AND EXCHANGE COMMISSION
WASHINGTON, D.C. 20549
FORM 10-K
(Mark One)
|
☒ |
ANNUAL REPORT PURSUANT TO SECTION 13 OR 15(d) OF THE SECURITIES EXCHANGE ACT OF 1934 |
For the fiscal year ended June 30, 2018
OR
|
☐ |
TRANSITION REPORT PURSUANT TO SECTION 13 OR 15(d) OF THE SECURITIES EXCHANGE ACT OF 1934 |
For the transition period from ________ to ________.
Commission File Number: 0-20206
PERCEPTRON, INC.
(Exact Name of Registrant as Specified in Its Charter)
|
Michigan |
|
38-2381442 |
|
(State or Other Jurisdiction of Incorporation or Organization) |
|
(I.R.S. Employer Identification No.) |
47827 Halyard Drive
Plymouth, Michigan 48170-2461
(Address of Principal Executive Offices)
(734) 414-6100
(Registrant’s telephone number, including area code)
Securities registered pursuant to section 12(b) of the Act:
|
Title of Each Class |
|
Name of Each Exchange on Which Registered |
|
Common Stock, $0.01 par value |
|
The NASDAQ Stock Market LLC |
|
Rights to Purchase Preferred Stock |
|
(NASDAQ Global Market) |
Securities registered pursuant to section 12(g) of the Act: None
Indicate by check mark if the registrant is a well-known seasoned issuer, as defined in Rule 405 of the Securities Act. Yes ☐ No ☒
Indicate by check mark if the registrant is not required to file reports pursuant to Section 13 or Section 15(d) of the Exchange Act. Yes ☐ No ☒
Indicate by check mark whether the registrant (1) has filed all reports required to be filed by Section 13 or 15(d) of the Securities Exchange Act of 1934 during the preceding 12 months (or for such shorter period that the registrant was required to file such reports), and (2) has been subject to such filing requirements for the past 90 days. Yes ☒ No ☐
Indicate by check mark whether the registrant has submitted electronically and posted on its website, if any, every Interactive Data File required to be submitted and posted pursuant to Rule 405 of Regulation S-T during the preceding 12 months (or for such shorter period that the registrant was required to submit and post such files). Yes ☒ No ☐
Indicate by check mark if disclosure of delinquent filers pursuant to item 405 of Regulation S-K is not contained herein, and will not be contained, to the best of registrant’s knowledge, in definitive proxy or information statements incorporated by reference in Part III of this Form 10-K or any amendment to this Form 10-K. ☒
Indicate by check mark whether the registrant is a large accelerated filer, an accelerated filer, a non-accelerated filer, a smaller reporting company, or an emerging growth company. See the definitions of “large accelerated filer”, “accelerated filer”, “smaller reporting company”, and “emerging growth company” in Rule 12b-2 of the Exchange Act.
|
Large Accelerated Filer |
☐ |
Accelerated Filer |
☒ |
Non-Accelerated Filer |
☐ |
Smaller Reporting Company |
☐ |
Emerging growth Company |
☐ |
If an emerging growth company, indicate by check mark if the registrant has elected not to use the extended transition period for complying with any new or revised financial accounting standards provided pursuant to Section 13(a) of the Exchange Act. ☐
Indicate by check mark whether the registrant is a shell company (as defined in Rule 12b-2 of the Exchange Act). Yes ☐ No ☒
The aggregate market value of the voting stock held as of the registrant’s most recently completed second fiscal quarter by non-affiliates of the registrant, based upon the closing sale price of the Common Stock on December 31, 2017, as reported by the NASDAQ Global Market, was approximately $84,000,000 (assuming, but not admitting for any purpose, that all directors and executive officers of the registrant are affiliates).
The number of shares of Common Stock, $0.01 par value, issued and outstanding as of August 21, 2018, was 9,555,767.
DOCUMENTS INCORPORATED BY REFERENCE
Portions of the following document, to the extent specified in this report, are incorporated by reference in Part III of this report:
|
Document |
|
|
Incorporated by reference in: |
|
Proxy Statement for 2018 |
|
|
Part III, Items 10-14 |
|
Annual Meeting of Shareholders |
|
|
|
|
|
|
|
Page |
|
Part I. |
|
|
|
|
Item 1. |
|
2 |
|
|
Item 1A. |
|
6 |
|
|
Item 1B. |
|
12 |
|
|
Item 2. |
|
12 |
|
|
Item 3. |
|
12 |
|
|
Item 4. |
|
12 |
|
|
|
|
|
|
|
Part II. |
|
|
|
|
Item 5. |
Market for the Registrant’s Common Equity, Related Stockholder Matters and Issuer Purchases of Equity Securities |
|
13 |
|
Item 6. |
|
16 |
|
|
Item 7. |
Management’s Discussion and Analysis of Financial Condition and Results of Operations |
|
17 |
|
Item 7A. |
|
28 |
|
|
Item 8. |
|
29 |
|
|
Item 9. |
Changes in and Disagreements with Accountants on Accounting and Financial Disclosures |
|
55 |
|
Item 9A. |
|
55 |
|
|
Item 9B. |
|
57 |
|
|
|
|
|
|
|
Part III. |
|
|
|
|
Item 10. |
|
57 |
|
|
Item 11. |
|
57 |
|
|
Item 12. |
Security Ownership of Certain Beneficial Owners and Management and Related Stockholder Matters |
|
58 |
|
Item 13. |
Certain Relationships and Related Transactions, and Director Independence |
|
58 |
|
Item 14. |
|
58 |
|
|
|
|
|
|
|
Part IV. |
|
|
|
|
Item 15. |
|
59 |
|
|
|
|
65 |
General
Perceptron, Inc. (“Perceptron”, “we”, “us” or “our”) develops, produces and sells a comprehensive range of automated industrial metrology products and solutions to manufacturing organizations for dimensional gauging, dimensional inspection and 3D scanning. Products include 3D machine vision solutions, robot guidance, coordinate measuring machines, laser scanning and advanced analysis software. Our customers which include global automotive, aerospace and other manufacturing companies, rely on Perceptron's metrology solutions to assist in managing their complex manufacturing processes to improve quality, shorten product launch times and reduce costs. Headquartered in Plymouth, Michigan, Perceptron has subsidiary operations in Brazil, China, Czech Republic, France, Germany, India, Italy, Japan, Slovakia, Spain and the United Kingdom.
Our products are categorized as follows:
In-Line, Near-Line and Off-Line Measurement Solutions (“Measurement Solutions”). Sales of these products involve the development, manufacture and installation of:
|
|
• |
In-Line fixed and robot-mounted laser-based, non-contact dimensional gauging systems used in original equipment manufacturing plants and component supplier plants; |
|
|
• |
In-Line laser-based, non-contact systems that perform gauging for and intelligent guidance of industrial robots in the performance of a variety of complex automated assembly operations; |
|
|
• |
Near-Line robot-mounted laser-based, non-contact dimensional gauging systems used in original equipment manufacturing plants and component supplier plants; and |
|
|
• |
Off-Line inspection and gauging cells comprising Coordinate Measuring Machines (“CMM”) or industrial and collaborative robotic solutions integrated with laser-based non-contact scanning sensors. |
3D Scanning Solutions. Sales of these products involve the development, manufacture and marketing of laser-based sensors and software for the following applications:
|
|
• |
Laser scanning sensors and metrology software for three-dimensional measurement on CMM for the reverse engineering and automated component inspection markets; |
|
|
• |
Laser scanning sensors integrated into vehicle wheel-alignment machines installed in automotive assembly plants. |
Value Added Services. Perceptron offers the following value added services to customers:
|
|
• |
Training; |
|
|
• |
Field Service and Calibration; |
|
|
• |
Launch Support Services; |
|
|
• |
Consulting Services; and |
|
|
• |
Equipment and Software Maintenance Agreements. |
Markets
Perceptron has a long history serving the global automotive manufacturing market with advanced technology. In fiscal 2018, 2017 and 2016, automotive sales represented approximately 82%, 85% and 65% of total sales, respectively. We have product offerings encompassing numerous manufacturing processes, including complex part assembly, automotive body construction, industrial robotic guidance for complex assembly applications, gauging cells, coordinate measuring solutions and reverse engineering.
Products and Applications
Measurement Solutions
Perceptron’s In-Line and Near-Line measurement solutions are based on our scanning sensors and software developed by combining Helix® and TriCam® sensors with Vector software. Our Off-Line measurement solutions are based on a full CMM line plus measuring software. Measurement Solutions in our fiscal year 2018, 2017, and 2016 represented 91%, 90% and 90% of total sales, respectively.
In-Line and Near-Line
AutoGauge®: Our dimensional gauging systems are used in assembly and fabrication plants to contain, correct and control the quality of complex assemblies. AutoGauge® systems are placed directly in the manufacturing line or near the line to automatically measure critical dimensional characteristics of parts using non-contact, laser triangulation sensors.
2
AutoGauge®ACF: Our near-line robotic systems utilize Perceptron’s AccuSiteTM optical tracking technology to eliminate the need to correlate to a CMM by making all measurements accurate. These systems are used in assembly and manufacturing facilities to replace traditional checking fixtures. Virtually everything about AutoGauge®ACF is automatic – from high speed data collection, to real-time reporting and analysis. AutoGauge®ACF measures parts within minutes, greatly increasing inspection throughput compared to CMMs, ring gauges, manual tools and other optical metrology systems. This is a newer product that we launched during our fiscal year ending June 30, 2018.
AutoFit®: Our gap and flush systems are primarily used in automotive manufacturing plants to contain, correct and control the fit of exterior body panels. These systems automatically measure, record and display the gap and flushness of parts most visible to the automobile consumer such as gaps between front and rear doors, hoods and fenders as well as deck lids and rear quarter panels. These measurements can be conducted throughout the manufacturing process, including in the body shop during assembly of non-painted vehicles and in the final assembly area after the vehicle has been painted. AutoFit® can measure vehicles while in motion along the assembly line or in a stationary position. During our fiscal year ending June 30, 2018, we made significant advancements in the algorithms that we use to process the data gathered by our sensors which results in significantly improved information for our customers.
AutoGuide®: Our robot guidance systems are used by manufacturing companies for flexible automated assembly applications. These systems utilize Perceptron sensors and measurement technology to guide and control robotic assembly operations. AutoGuide® systems calculate the difference between theoretical and actual relationships of a robot to the part being assembled and communicate compensation data in six degrees of freedom to the robot. AutoGuide® supports numerous robotic assembly applications including automotive windshield insertion, roof loading, hinge mounting, door attachment and sealant application. During our fiscal year ending June 30, 2018, we reworked and optimized our robot guidance platform for the simpler requirements of de-racking, seam sealing and glue bead applications. The large field of view Helix®evo X300 sensor and one-glance dashboard eliminate the need for precision fixtures, large conveyors and station operators and part handlers. With the streamlined interface for these specific applications, station setup time can now be completed in hours, not days.
Helix®evo: Our Helix®evo sensor family takes 3D scanning to the next level, improving performance through faster measuring and increased overall system robustness. Helix®evo utilizes a green laser to measure the multitude of materials used in today’s manufacturing, such as chrome, aluminum, sheet metal and painted surfaces. Its scan acquisition provides accurate feature extraction along with the pristine scan quality required for form analysis. Helix®evo also uses a single power over ethernet cable which reduces the number of auxiliary components required and is designed for fast and accurate measurement on the plant floor.
Off-Line
Coord3®: The Coord3 CMM product line includes bridge, gantry and horizontal style machines. Bench-top CMM are used for small part inspection while very large CMM are used in aerospace, defense and heavy equipment industries. CMM can be equipped with tactile scanning probes and our TouchDMIS™ measuring software.
TouchDMISTM : TouchDMIS™ measuring software simplifies CMM measurement by incorporating a 100% touch interface with the TouchCADTM quick programming module. TouchDMIS™ is the world’s first all-touch CMM software.
3D Scanning Solutions
3D Scanning Solutions in our fiscal year 2018, 2017, and 2016 represented 3%, 7% and 6% of total sales, respectively.
WheelWorks®: WheelWorks® software and sensors offer a fast, accurate, non-contact method of measuring wheel position for use in automated or manual wheel alignment machines in automotive assembly plants. Perceptron supplies sensors and software to a number of wheel alignment equipment manufacturers in Europe, Asia and North America who in turn sell alignment systems to automotive manufacturers.
Value Added Services
Value Added Services: Value Added Services sales in our fiscal year 2018, 2017, and 2016 represented 6%, 3% and 4% of total sales, respectively. Value Added Services include training, field service, calibration, launch support services, consulting services, maintenance agreements and repairs.
Sales and Marketing
We market our in-line and near-line products directly to end-user Original Equipment Manufacturer (“OEM”) customers and through manufacturing line builders and system integrators. We market our Coord3 CMM product line through both direct sales and value added resellers.
3
Perceptron’s principal customers for measurement solution products have historically been automotive manufacturing companies that we either sell to directly or through manufacturing line builders, system integrators or assembly equipment manufacturers. These products are typically purchased for installation in connection with retooling programs undertaken by these companies. Because sales are dependent on the timing of customers’ retooling programs, sales by customer vary significantly from year to year. For our fiscal years 2018, 2017 and 2016, approximately 41%, 36% and 34%, respectively, of our “Net Sales” on our Consolidated Statements of Operations were derived from sales directly to our four largest automotive end-user customers. We also sell to manufacturing line builders, system integrators and assembly equipment manufacturers, who in turn sell to our automotive customers. For our fiscal years 2018, 2017 and 2016, approximately 7%, 11% and 8%, respectively, of our net sales were to manufacturing line builders, system integrators and original equipment manufacturers for the benefit of the same four largest automotive end-user customers in each respective year. During our fiscal years 2018, 2017 and 2016, direct sales to General Motors Company accounted for approximately 17%, 14% and 12%, respectively, and direct sales to Volkswagen Group accounted for approximately 15%, 16% and 17%, respectively, of our total net sales.
Manufacturing and Suppliers
Our manufacturing operations consist primarily of final assembly and calibration of hardware components and the development, testing and integration of our software with these hardware components. We build our products from a combination of commercially available parts and uniquely-designed and manufactured parts. The components are primarily manufactured by third parties. Individual components such as printed circuit boards are manufactured and supplied by third parties. We believe a low level of vertical integration gives us significant manufacturing and inventory flexibility and minimizes total product costs.
We purchase certain component parts and assemblies from single and multi-source suppliers. With respect to the majority of our components, we believe that alternative suppliers could be found if existing suppliers could not ship to us. Many of our components are customized for our specific manufacturing needs. Due to these specifications, various lead times would be required, based on the specific component that needed to be re-sourced. Component supply shortages in certain industries, including the electronics industry, have occurred in the past and are possible in the future due to imbalances in supply and demand. We use global purchasing sources to minimize the risk of part shortages. We have not experienced significant component supply shortages from single source suppliers in recent years. However, in fiscal 2017 some of our suppliers informed us that a few of our components were at “end-of-life” and so have been discontinued. We have launched new products that do not require these “end-of-life” components in significant quantities going forward. Significant delays or interruptions in the delivery of components, assemblies or products by suppliers, or difficulties or delays in shifting manufacturing capacity to new suppliers, could have a material adverse effect on us.
International Operations
Europe: Our European operations contributed approximately 40%, 41% and 45%, of our net sales during our fiscal years ended June 30, 2018, 2017, and 2016, respectively. Our wholly-owned subsidiary, Perceptron Europe B.V. (“Perceptron B.V.”), formed in The Netherlands, holds a 100% equity interest in Perceptron (Europe) GmbH (“Perceptron GmbH”) and Coord3 s.r.l. (“Coord3”). Perceptron GmbH is located in Munich, Germany and is the operational headquarters for our European market. We own subsidiaries that operate direct sales, application and support offices in Vélizy-Villacoublay, France, Barcelona, Spain, Birmingham, UK and Bratislava, Slovakia. Coord3 is a CMM designer and manufacturer in Bruzolo, Italy. Furthermore, we own a software development company, Next Metrology Software s.r.o. in Prague, Czech Republic. At June 30, 2018, we had 138 employees in our European operations.
Asia: Our Asian operations contributed approximately 19%, 20% and 22% of our net sales during our fiscal years ended June 30, 2018, 2017, and 2016, respectively. We own subsidiaries that operate direct sales, application and support offices in Tokyo, Japan; Shanghai and Beijing, China; and Delhi and Chennai, India to service our customers in Asia. At June 30, 2018, we had 61 employees in our Asian operations.
South America: We have a direct sales, application and support office in Sao Paulo, Brazil to service customers in South America. At June 30, 2018, we had 5 employees in our Brazilian operations.
Our foreign operations are subject to certain risks typically encountered in such operations, including fluctuations in foreign currency exchange rates and controls, expropriation and other economic and local policies of foreign governments and the laws and policies of the U.S. and local governments affecting foreign trade and investment. For information regarding net sales and identifiable assets of our non-U.S. based operations, see Note 19, of the Notes to the Consolidated Financial Statements, “Segment and Geographic Information”, contained in Item 8 of this Annual Report on Form 10-K.
Competition
We believe our products provide cost-efficient and complete solutions for our customers in terms of system capabilities, level of support and competitive pricing for the value provided, which we believe are the principal competitive factors in our markets. We also believe the technology within our products is more advanced than our competition.
There are a number of companies that sell similar and/or alternative technologies and methods into the same markets and regions as Perceptron. We believe there may be entities, some of which may be larger and have greater resources than our resources, that could develop technology and products which could prove to be competitive with us. We also believe that certain existing or potential customers may be capable of internally developing their own technology. See Item 1A: “Risk Factors” titled “There are a number of companies offering competitive products in our markets, or developing products to compete with our products, which could result in a reduction in our revenues through lost sales or a reduction in prices”.
4
As of June 30, 2018, we had a backlog of $47.5 million, compared to $45.0 million at June 30, 2017. Most of our backlog is subject to cancellation or delay by the customer, often with limited or no penalties. Historically, cancellations of orders once they have been booked have been very infrequent although several cancellations have occurred during the last two fiscal years. The level of our backlog at any particular time is not necessarily indicative of our future operating performance. We expect to be able to fill substantially all of the orders in our backlog by June 30, 2019.
Research and Development
During fiscal year 2018, our research and development efforts focused on developing new and improved hardware and software subsystems to support the range of our industry-proven solutions. Developments accomplishments included:
|
|
• |
The release of the Helix®evo sensor family that increases the accuracy, speed and robustness of this unique 3D scanner. |
|
|
• |
The employment of lean, single-piece flow manufacturing for the construction of Helix®evo, resulting in substantially reduced labor, reduced lead time and increased product uniformity. |
|
|
• |
The creation of a cost-reduced and mass-optimized family of Helix®evo sensor mounts that reduces the material and labor required when installing systems in our customers’ plants. |
|
|
• |
The development of a modular family of plant-floor ready 3D image processing computers that allows tight control of the cost of a delivered system. |
|
|
• |
The addition of the X0300 member of the Helix®evo family that, when combined with an advanced set of algorithms, facilitates robot guidance applications in the de-racking arena. |
|
|
• |
The completion of the AccuSite™ external tracking hardware and software suite that is being delivered to a global automotive OEM of luxury vehicles to control dimensions of closure panels for a new auto platform. |
We continue to focus on value engineering our hardware and software solutions to remove costs from all phases of our product lifecycle. We believe this investment in our products provides ongoing competitive advantages in all our markets.
As of June 30, 2018, 54 of our employees were focused primarily on research, development and engineering. For our fiscal years ended June 30, 2018, 2017 and 2016, our research, development and engineering expenses were $8.0 million, $6.8 million and $7.4 million, respectively.
Patents, Trade Secrets and Confidentiality Agreements
As of June 30, 2018, we own 18 U.S. patents that have been granted to us which relate to various products and processes manufactured, used, and/or sold. We also own 5 foreign patents that have been granted to us in Europe, China and Japan and we have 5 patent applications pending in foreign locations. The U.S. and foreign patents expire from 2018 through 2031. In addition, we hold perpetual licenses to more than 35 other U.S. patents including rights to practice 7 U.S. patents for non-forest product related applications that were assigned in conjunction with the sale of a previous business unit in 2002, and rights to practice 9 U.S. patents that were sold in conjunction with the sale of another prior business line in August 2012. The expiration dates for these licensed patents range from 2018 to 2031.
Perceptron has registered, and continues to register, various trade names and trademarks including Perceptron®, Powered by Perceptron®, AutoGauge®, AutoFit®, AutoGuide®, AutoScan®, Contour Probe®, ScanWorks®, TriCam®, WheelWorks®, Visual Fixturing®, Helix®, Intelligent Illumination®, TouchDMIS™, and Coord3™, among others, which are used in connection with the conduct of our business.
Our software products are copyrighted and generally licensed to our customers pursuant to license agreements that restrict the use of the products to the customer’s own internal purposes on designated Perceptron equipment.
We also use proprietary information and invention agreements and non-disclosure agreements with employees, consultants and other parties to protect our intellectual property.
There can be no assurance that any of the above measures will be adequate to protect our intellectual property or other proprietary rights. Effective patent, trademark, copyright and trade secret protection may be unavailable in certain foreign countries.
Employees
During our fiscal year 2016, we implemented a financial improvement plan that resulted in a reduction in global headcount of approximately 10%. The plan was implemented to re-align our fixed costs with our near-to mid-term expectations for our business. The financial improvement plan included headcount reductions and position eliminations spread across our geographic regions, departments and roles. In fiscal 2018, we announced that we were substantially complete with this plan and we started to invest in additional resources to develop new products. This investment has primarily been in the form of hiring additional full-time staff in our Engineering, Research and Development area.
5
As of June 30, 2018, we have 337 employees worldwide. All of our employees were employed on a full-time basis and 133 are located in North America. The remainder are distributed across the globe as identified above in International Operations. In Italy, we have 57 employees covered by Italy’s National Collective Bargaining Agreement for employees in the mechanical engineering industry. The agreement was signed in November 2016 and it will be valid for 3 years. None of our other employees are covered by a collective bargaining agreement. We believe our relations with our employees are good.
Available Information
Perceptron’s Internet address is www.perceptron.com. On our website, we make available, free of charge, our Annual Report on Form 10-K, quarterly reports on Form 10-Q, current reports on Form 8-K and any amendments to those reports, as soon as reasonably practicable after we electronically file such material with, or furnish it to, the Securities and Exchange Commission (“SEC”). These reports can be accessed through the “Investor Relations” section of our website under “SEC Filings”. The information found on our website is not part of this or any report we file with, or furnish to, the SEC.
An investment in our Common Stock involves numerous risks and uncertainties. You should carefully consider the following information about these risks. Any of the risks described below could result in a significant or material adverse effect on our future results of operations, cash flows or financial condition. The risks and uncertainties described below are not the only ones we face. Additional risks and uncertainties that we are unaware of, or that we currently deem immaterial, also may become important factors that adversely affect our business in the future. We believe that the most significant of the risks and uncertainties we face are as follows:
Our future commercial success depends upon our ability to maintain a competitive technological position in our markets, which are characterized by continual technological change.
Technology plays a key role in the systems and solutions that we produce. The ability to sell our products to customers is directly influenced by the technology used in our systems and solutions. With the rapid pace at which technology is changing, there is a possibility that our customers may require more technologically advanced systems and solutions than we may be capable of producing.
Technological developments could render our actual and proposed products or technologies as uneconomical or obsolete. There is also a possibility that we may not be able to keep pace with our competitors’ products. In that case, our competitors may make technological improvements to their products that make them more desirable than our products.
Our growth and future financial performance depend upon our ability to introduce new products and enhance existing products that include the latest technological advances and customer requirements. We may not be able to introduce new products successfully or achieve market acceptance for such products. Any failure by us to anticipate or respond adequately to changes in technology and customer preferences, or any significant delays in product development or introduction, could have a material adverse effect on our business. Accordingly, we believe that our future commercial success will depend upon our continued ability to develop and introduce new cost-effective products and maintain a competitive technological position.
Our future success is dependent upon our ability to implement our long-term growth strategy.
Our future success is dependent upon our ability to implement our long-term strategy, which includes growing our customer base in the automotive market and expanding into new markets. However, there are a number of uncertainties involved in our long-term strategy over which we have no or limited control, including:
|
|
• |
The quality and cost of competitive products already in existence or developed in the future |
|
|
• |
The level of interest that existing and potential new customers may have in our existing and new products and technologies |
|
|
• |
Our ability to resolve technical issues inherent in the development of new products and technologies |
|
|
• |
Our ability to identify and satisfy market needs |
|
|
• |
Our ability to identify satisfactory distribution networks |
|
|
• |
General product development and commercialization difficulties |
|
|
• |
Rapid or unexpected technological changes |
|
|
• |
General product demand and market acceptance risks |
|
|
• |
Our ability to successfully compete with alternative and similar technologies |
|
|
• |
Our ability to attract and retain the appropriate personnel to effectively represent, install and service our products |
|
|
• |
The effect of economic conditions |
Even if we are able to expand our customer base and markets, the new revenues we derive may not offset declines in revenues from our current products. We also may not be able to generate profits from these new customers or markets at the same level as we generate from our current business. There can be no assurance that we will be able to expand our customer base and markets or successfully execute our strategies in a fashion to maintain or increase our revenues and profits.
6
We are dependent on proprietary technology. If our competitors develop competing products that violate our intellectual property rights or successfully challenge those rights, our revenues and profits may be adversely affected.
Our products contain features that are protected by patents, trademarks, trade secrets, copyrights and contractual rights. Despite these protections, there is still a chance that competitors may use these protected features in their products as a result of our inability to keep our trade secrets confidential, or in violation of our intellectual property rights or following a successful challenge to those rights. The prosecution of infringement claims against third parties and the defense of legal actions challenging our intellectual property rights could be costly and require significant attention from management. Because of the small size of our management team, this could result in the diversion of management’s attention from day-to-day operations.
There also is the possibility that competitors may develop technology that performs the same functions as our products without infringing upon our exclusive rights. It is possible that competitors may reverse engineer those features of our products that are not protected by patents, trademarks and trade secrets. If a competitor is able to reverse engineer an unprotected feature successfully, the competitor may gain an understanding of how our feature works and introduce similar products to compete with our products.
Because our products are sold globally, we are at risk of competitors misappropriating our intellectual property included in those products or reverse engineering those products. As a result, we may have a more limited ability, and significantly greater costs, to enforce our intellectual property rights in those products. Constant technological improvement of those products will be particularly important to keep our products competitive in their markets.
There are a number of companies offering competitive products in our markets, or developing products to compete with our products, which could result in a reduction in our revenues through lost sales or a reduction in prices.
We are aware of a number of companies in our markets selling products using similar or alternative technologies and methods. We believe that there may be other companies, some of whom may be substantially larger and have significantly greater resources than us, which may be engaged in the development of technology and products for some of our markets that could prove to be competitive with ours. We believe that the principal competitive factor in our markets is the total capability that a product offers. In some markets, a competitive price for the level of functionality and reliability provided are the principal competitive factors. While we believe that our products compete favorably, it is possible that these competitors could capture some of our sales opportunities or force us to reduce prices in order to complete the sale.
We believe that certain existing and potential customers may be capable of internally developing their own technology. This could cause a decline in sales of our products to those customers.
A significant percentage of our revenue is derived from a small number of customers, so that the loss of any one of these customers could result in a significant reduction in our revenues and profits.
A majority of our revenue in fiscal 2018 was derived from the sale of systems and solutions to a small number of customers that consist primarily of automotive manufacturers and suppliers in North America, Western Europe and Asia.
With such a large percentage of our revenues coming from such a small and highly concentrated group of customers, we are susceptible to a substantial risk of losing revenues if these customers stop purchasing our products or reduce their purchases of our products. In addition, we have no control over whether these customers will continue to purchase our products, systems and solutions in volumes or at prices sufficient to generate profits for us.
Because a large portion of our revenues are generated from a limited number of sizeable orders, our revenues and profits may vary widely from quarter to quarter and year to year.
A large portion of our revenue is generated from a limited number of sizeable orders that are placed by a small number of customers. If the timing of these orders is delayed from one quarter to the next or from one year to the next, we may experience fluctuations in our quarterly and annual revenues and operating results. Because our order terms vary from project to project, the application of our revenue recognition accounting policies to our orders can cause the timing for the recognition of revenue from an order to vary significantly. This may cause our revenues and operating results to vary significantly from quarter to quarter and year to year.
The amount of revenues that we earn in any given quarter may vary based in part on the timing of new vehicle programs in the global automotive industry. In contrast, many of our operating expenses are fixed and will not vary from quarter to quarter. As a result, our operating results may vary significantly from quarter to quarter and from year to year.
We have operations outside the United States, increasing the possibility that our business could be adversely affected by risks of doing business in foreign countries.
We have significant operations outside of the United States.
7
Our foreign operations are subject to risks customarily encountered in such operations. For instance, we may encounter fluctuations in foreign currency exchange rates, differences in the level of protection available for our intellectual property, the impact of differences in language and local business and social customs on our ability to market and sell our products in these markets, the inability to recruit qualified personnel in a specific country or region, more stringent employment regulations and local labor conditions and difficulties in repatriating cash earned in other countries back to the United States. In addition, we may be affected by U.S. laws and policies that impact foreign trade and investment. Finally, we may be adversely affected by laws and policies imposed by foreign governments in the countries where we have business operations or sell our products.
If the suppliers and subcontractors we rely on for component parts or products delay deliveries, fail to deliver parts or products meeting our requirements or stop supplying parts or products altogether, we may not be able to deliver products to our customers in a timely fashion and our revenues and profits could be reduced.
We rely on subcontractors for certain components of our products, including outside subcontracting assembly houses to produce the circuit boards that we use in our products. As a result, we have limited control over the quality and the delivery schedules of components or products purchased from third parties. In addition, we purchase a number of component parts from single source suppliers. If our supplies of component parts or products meeting our requirements are significantly delayed or interrupted, or our subcontractors choose to terminate their supply contracts, we may not be able to deliver products to our customers in a timely fashion. This could result in a reduction in revenues and profits for these periods. The termination of or material change in the purchase terms of any single source supplier could have a similar impact on us. It is also possible, if our delay in delivering products to our customer is too long, the customer could cancel their order or potentially charge us with penalties, resulting in a permanent loss of revenue and/or profit from that sale. Although we have not experienced significant supply shortages from single source suppliers in recent years, from time to time, we have experienced significant delays in the receipt of certain components. Furthermore, some of our suppliers have informed us that a few of our components are at “end-of-life”, therefore, we may need to find an alternative supplier or change our product design. Finally, although we believe that alternative suppliers are available for the components in our products, difficulties or delays may arise if we shift manufacturing capacity to new suppliers.
Because of our significant foreign operations, our revenues and profits can vary significantly as a result of fluctuations in the value of the United States Dollar against other currencies.
Products that we sell in foreign markets are typically priced in the currency of the country where the customer is located. To the extent that the U.S. Dollar fluctuates against these currencies, the costs of our products sold in those countries’ currencies also will fluctuate. As a result, revenue and profits on the sale of our products could vary based on these fluctuations. Accordingly, we could experience unanticipated gains or losses in our profits that could have a material impact on our results of operations.
In addition, because a significant portion of our assets are denominated in foreign currencies, we face exposure to foreign currency exchange rate fluctuations. These fluctuations have, in the past, resulted in material adverse foreign currency translations adjustments to our comprehensive net income or loss as well as had a material negative impact on our reported levels of cash and cash equivalents.
A change in our effective tax rate can have a significant adverse impact on our business.
A number of factors may adversely impact our future effective tax rates, such as the future valuation of our deferred tax assets which are predominantly in the U.S. and the valuation can vary significantly, positively or negatively, depending on future periods of taxable income or taxable losses in each tax jurisdiction in which we operate; the geographic composition of our pre-tax income and the various tax rates in those countries; changes in available tax credits, changes in tax laws and rates, and the repatriation of earnings from outside the U.S. for which we have not previously provided for U.S. taxes. A change in our effective tax rate can adversely impact our net income.
On December 22, 2017, the Tax Cuts and Jobs Act (the “Act”) was enacted by the U.S. The Act implements comprehensive tax legislation which, among other changes, imposes a tax on the untaxed foreign earnings of foreign subsidiaries of U.S. companies by deeming those earnings to be repatriated (the “Transition Tax”). The changes in the Act are broad and complex. We have estimated the impact of the Transition Tax by incorporating assumptions made based upon our current interpretation and analysis to-date of the Act and have determined that our foreign tax credits would completely offset any Transition Tax calculated, and therefore, we do not expect to make any cash payments related to the Transition Tax.
From time to time, we may make forward looking statements and provide estimates as to the impact of the Act on us. The final impacts of the Act may differ from such statements or estimates, possibly materially, as allowed under Staff Accounting Bulletin No. 118 (“SAB 118”), due to, among other things, further refinements of our calculations, changes in interpretations and assumptions we have made, guidance that may be issued and actions we may take as a result of the Act.
8
The occurrence of business system disruptions or information security breaches could adversely affect our business.
To our knowledge, we have not been subject to any material information security breaches; however, many other companies have experienced such breaches because of illegal hacking, computer viruses or acts of vandalism or terrorism. While we have implemented security measures to protect against such breaches, it is possible that our security measures may not detect or prevent such breaches. Any such compromise to our information security could result in an interruption in our operations, the unauthorized publication of our confidential business or proprietary information, the unauthorized release of customer, vendor, or employee data, the violation of privacy or other laws and the exposure to litigation, any of which could harm our business and operating results. A disruption to our management information systems could cause significant disruption to our business, including our ability to receive and ship orders, receive and process payments and timely report our financial results. Any disruption occurring with these systems may have a material adverse effect on our results of operations.
Our ability to increase sales of our CMM products depends on our ability to successfully expand our distribution channels.
With the acquisitions of Coord3 and NMS in fiscal 2015, we expanded our product lines to include the design, manufacture and sale of CMM products. We market our line of CMM products directly to end users and through distributors and resellers. Growth of our sales of this product line depends upon our ability to expand our distribution channels by identifying, developing and maintaining relationships with distributors and resellers. In addition, our distributors and resellers can potentially sell products offered by our competitors. If we are not able to successfully expand our distribution channels for our CMM products, or if our distributors or resellers do not or are not able to successfully sell our CMM products, our strategic plan to expand our revenues will be adversely affected.
We are subject to risks related to litigation.
From time to time, we are subject to lawsuits and other claims arising out of our business operations. Adverse judgments in one or more of these lawsuits could require us to pay significant damage amounts. The outcome of lawsuits is inherently uncertain and typically a loss cannot be reasonably estimated or accrued by us. Accordingly, if the outcome of a legal proceeding is adverse to us, we would have to record a charge for the matter at the time the legal proceeding is resolved and generally in the full amount at which it is resolved. In addition, the expenses related to these lawsuits may be significant. Lawsuits can have a material adverse effect on our business and operating results, particularly where we have not established an accrual or a sufficient accrual for damages, settlements or expenses. See “Item 3 – Legal Proceedings” and Item 7, “Management’s Discussion and Analysis of Financial Condition and Results of Operations – Critical Accounting Policies – Litigation and Other Contingencies” below for a discussion of our policies in accounting for lawsuits and other claims.
Our revenues are highly influenced by the sale of products for use in the global automotive market, particularly by manufacturers based in the United States, China and Western Europe. These manufacturers have experienced periodic downturns in their businesses that could adversely affect their level of purchases of our products.
Due to our significant revenue from the automotive industry, our ability to sell our systems and solutions to automotive manufacturers and suppliers is affected by periodic downturns in the global automotive industry, such as what occurred in 2009-2010.
New vehicle tooling programs are the most important selling opportunity for our automotive-related sales. The number and timing of new vehicle tooling programs can be influenced by a number of economic factors. Our customers only launch a limited number of new car programs in any given year because of the time and financial resources required. From a macro perspective, we continue to assess the global economy and its likely effect on our automotive customers and markets served. We continue to view the automotive industry’s focus on introducing new vehicles more frequently to satisfy their customers’ changing requirements, as well as their continuing focus on improved quality, as positive indicators for new business. However, because of periodic economic downturns experienced by our customers, our customers could decide to reduce their number of new car programs. The automobile industry is a very cost competitive industry. Pricing pressures could adversely affect the margins we realize on the sale of our products, and ultimately, our profitability.
We may not be able to complete business opportunities and our profits could be negatively affected if we do not successfully integrate those that we do complete.
We will evaluate, from time to time, business opportunities that fit our strategic plans. There can be no assurance that we will identify any opportunities that fit our strategic plans or be able to enter into agreements with identified business opportunities on terms acceptable to us. We may incur significant development and other costs with no assurance that a business opportunity will be realized after incurring these costs.
We intend to finance any such business opportunities from available cash on hand, existing credit facilities, issuance of additional stock or additional sources of financing, as circumstances warrant. The issuance of additional equity securities to finance business opportunities could be substantially dilutive to our current stockholders. In addition, if the business opportunities do not perform as expected, we could incur charges with no future benefits. If we are not successful in generating additional profits from these items, this dilution and these additional costs could cause our Common Stock price to drop.
9
Global economic conditions may negatively impact our results of operations.
Our revenue levels are impacted by global economic conditions, as we have a significant business in many countries throughout the world. In fiscal 2018, only 40% of our sales were generated in North America and as a result, a significant decline in global economic conditions could have a material adverse impact on our results of operations.
A significant amount of our assets represent goodwill and intangible assets, and our net income would be reduced if our goodwill or intangible assets become impaired.
As of June 30, 2018, we had $8.0 million of net goodwill and $3.8 million of net intangible assets. Our acquisitions of Coord3 and NMS resulted in goodwill as the cost exceeded the fair value of the net tangible and identifiable intangible assets acquired. Goodwill is subject to an impairment analysis at least annually based on the fair value of the reporting unit. Intangible assets relate primarily to trademarks, customer relationships and software acquired and are subject to an impairment analysis whenever events or changes in circumstances exist that indicate that the carrying value of the intangible asset might not be recoverable. If we determine that any intangible assets or goodwill is impaired, we would be required to take a related charge to earnings that could have a material adverse effect on our results of operations. For example, in the third quarter of fiscal 2016, we recorded an impairment charge in the amount of $0.7 million related to previously capitalized software related to a product line that was discontinued.
We face various risks arising from the legal, regulatory and tax requirements imposed on our operations in the various countries in which we conduct our business operations.
We are subject to various risks relating to our compliance with existing and new laws, rules and regulations implemented in the countries in which we conduct our business operations, including anti-corruption, anti-bribery, tax, material composition of our products, such as restrictions on lead and other substances, environmental, safety and export control regulations.
We are subject to the United States Foreign Corrupt Practices Act (“FCPA”), which generally prohibits companies and their intermediaries from making improper payments to foreign officials for the purpose of obtaining or keeping business or other benefits. As a result of our foreign operations, we may have contact with persons who are considered foreign officials under the FCPA, putting us at an increased risk of potential FCPA violations.
The U.S. proposed significant increases in tariffs on certain imports, which prompted retaliatory measures from major U.S. trading partners. Our earnings and sales could be affected by changes to international trade agreements in North America and elsewhere, including potential increases of import tariffs. Changes in government policies in these areas might cause a decrease in our sales, operating income and net earnings.
Our failure or inability to comply with any of these laws, rules or regulations could subject us to civil or criminal penalties, other remedial measures or financial or regulatory obligations that may adversely affect our results of operations, financial position, reputation or ability to conduct business. We may receive audit notices or other inquiries from governmental or regulatory authorities, and we may participate in voluntary disclosure programs, related to legal, regulatory or tax compliance matters. These audits, inquiries or disclosure programs or any non-compliance with applicable laws, rules or regulations could result in our incurring material expense, including investigation costs, defense costs, assessments and penalties, or other consequences that could have a materially adverse effect on our results of operations, financial position, reputation or ability to conduct business.
Failure to comply with U.S. federal, state and international laws and regulations relating to privacy or data protection, or the expansion of current or the enactment of new laws or regulations relating to privacy or data protection, could adversely affect our business and our financial condition.
A variety of U.S. federal, state and international laws and regulations govern the collection, use, retention, sharing and security of data. Laws and regulations relating to privacy and data protection are evolving and subject to potentially differing interpretations. These requirements may be interpreted and applied in a manner that is inconsistent from one jurisdiction to another or may conflict with other rules or our practices. As a result, our practices may not have complied or may not comply in the future with all such laws, regulations, requirements and obligations. Any failure, or perceived failure, by us to comply with our posted privacy policies or with any federal, state or international privacy or data protection related laws, regulations, industry self-regulatory principles, industry standards or codes of conduct, regulatory guidance, orders to which we may be subject or other legal obligations relating to privacy or data protection could adversely affect our reputation and business, and may result in claims, proceedings or actions against us by governmental entities or others or other liabilities or require us to change our operations and/or cease using certain data sets. Any such claim, proceeding or action could hurt our reputation and business, force us to incur significant expenses in defense of such proceedings, distract our management, increase our costs of doing business, result in a loss of customers and suppliers and may result in the imposition of monetary penalties. We may also be contractually required to indemnify and hold harmless third parties from the costs or consequences of non-compliance with any laws, regulations or other legal obligations relating to privacy or data protection or any inadvertent or unauthorized use or disclosure of data that we store or handle as part of operating our business.
Foreign data protection, privacy and other laws and regulations are often more restrictive than those in the U.S. The European Union, for example, traditionally has imposed stricter obligations under its laws and regulations relating to privacy and data protection than the U.S., most recently adopting the General Data Protection Regulation (GDPR) throughout Europe in May 2018. Individual European Union member countries have discretion with respect to their interpretation and implementation of these laws and the penalties for breach and have their own regulators with differing attitudes towards enforcement, which results in varying privacy standards and enforcement risk from country to country.
10
We may have additional tax liabilities, which could adversely affect our results of operations.
We are subject to income taxes in the U.S. and other jurisdictions, including Germany, Italy and China. In determining our provisions for income taxes, we make judgments regarding various tax positions reported on our tax returns. As a result, there are transactions and calculations where the ultimate tax determination is uncertain. Our tax returns are regularly under audit by tax authorities. Because of these uncertain tax positions, the final determination of these tax audits could be materially different than is reflected in our financial statements and could have a material adverse effect on our provisions for income taxes, results of operations or cash flows.
We may need replacement or additional financing in the future to meet our operational needs, including working capital or capital expenditures and such financing may not be available on terms favorable to us, if at all, and may be dilutive to existing shareholders.
Our credit facilities in the U.S. and Brazil are on-demand facilities and may be cancelled by either party at any time. We may need to seek additional financing for our general corporate purposes. For example, we may need to increase our investment in research and development activities or need funds to support working capital or capital expenditure needs. Furthermore, in fiscal 2017, we terminated our German credit facility at the request of the lender, and in fiscal 2018, two of the credit lines in Brazil were closed. We may be unable to obtain any desired replacement or additional financing on terms favorable to us, if at all. If adequate funds are not available on acceptable terms, we may be unable to fund our operations, successfully develop or enhance products or respond to competitive pressures, any of which could negatively affect our business. If we raise additional funds through the issuance of equity securities, our shareholders will experience dilution of their ownership interest. If we raise additional funds by issuing debt, we may be subject to further limitations on our operations due to restrictive covenants.
We could become involved in costly litigation alleging patent infringement.
In the past, we had been informed that certain of our customers have received allegations of possible patent infringement involving processes and methods used in our products. Certain of these customers, including a customer who was a party to a patent infringement suit relating to this matter, settled such claims. We believe that the processes used in our products were independently developed without utilizing any previous patented process or technology. However, it is possible, that in the future, we or our customers could receive allegations of possible patent infringement or could be parties to patent infringement litigation relating to our products.
The defense of patent infringement litigation could be costly and require significant attention from management. Because of the small size of our management team, this could result in the diversion of management’s attention from day-to-day operations or could have a material adverse effect on our results of operations.
Our business depends on our ability to attract and retain key personnel.
Our success depends in large part upon the continued service of our executives and key employees, including those in engineering, software engineering, sales and marketing positions, as well as our ability to attract such additional employees in the future. At times and in certain geographic markets, competition for the type of highly skilled employees we require can be significant. The loss of key personnel or the inability to attract new qualified key employees could adversely affect our ability to implement our long-term growth strategy and have a material adverse effect on our business.
Because of the limited trading in our Common Stock, it may be difficult for shareholders to dispose of a large number of shares of our Common Stock in a short period of time or at then current prices.
Because of the limited number of shares of our Common Stock outstanding and the limited number of holders of our Common Stock, only a limited number of shares of our Common Stock trade on a daily basis. This limited trading in our Common Stock makes it difficult to dispose of a large number of shares in a short period of time. In addition, it is possible that the sale by a shareholder of a large number of shares of our Common Stock over an extended period would depress the price of our Common Stock.
The trading price of our stock has been volatile.
The following factors may affect the market price of our Common Stock, which can vary widely over time:
|
|
• |
announcements of new products by us |
|
|
• |
announcements of new products by our competitors |
|
|
• |
variances in our operating results |
|
|
• |
market conditions in the electronic and sensing industry and/or automotive industry |
|
|
• |
announcements by our largest customers that have a significant impact on their operations |
|
|
• |
market conditions and stock prices in general |
|
|
• |
the volume of our Common Stock traded |
11
Market volatility adversely impacts the market price of our Common Stock.
The capital and credit markets are subject to volatility and disruption. During such a period, the volatility and disruption could reach unprecedented levels, which would exert downward pressures on stock prices, including the market price of our Common Stock.
The Board of Directors has the right to issue up to 1,000,000 shares of preferred stock without further action by shareholders. The issuance of those shares could cause the market price of our Common Stock to drop significantly and could be used to prevent or frustrate shareholders’ attempts to replace or remove current management.
Although no preferred stock currently is outstanding, we are authorized to issue up to 1,000,000 shares of preferred stock. Preferred stock may be issued in one or more series, the terms of which may be determined at the time of issuance by the Board of Directors, without further action by shareholders, and may include voting rights (including the right to vote as a series on particular matters), the dividends payable thereon, liquidation payments, preferences as to dividends and liquidation, conversion rights and redemption rights. In the event that preferred stock is issued, the rights of the common stockholders may be adversely affected. This could result in a reduction in the value of our Common Stock.
The preferred stock could be issued to discourage, delay or prevent a change in control. This may be beneficial to our management or Board of Directors in a hostile tender offer or other takeover attempt and may have an adverse impact on shareholders who may want to participate in the tender offer or who favor the takeover attempt.
Our rights plan could be used to discourage hostile tender offers.
We maintain a rights plan. Under the plan, if any person acquires 20% or more of our outstanding Common Stock, our shareholders, other than the acquirer, will have the right to purchase shares of our Common Stock at half their market price. The rights plan discourages potential acquirers from initiating tender offers for our Common Stock without the approval of the Board of Directors. This may be beneficial to our management or Board of Directors in a hostile tender offer or other takeover attempt and may have an adverse impact on shareholders who may want to participate in the tender offer or who favor the takeover attempt.
Not applicable.
Our principal domestic facility consists of a 70,000 square foot building located in Plymouth, Michigan, owned by us. In addition, we own a 3,100 square meter facility in Bruzolo, Italy. We lease a 1,576 square meter facility in Munich, Germany and we lease office space in Sao Paulo, Brazil; Tokyo, Japan; Prague, Czech Republic; Shanghai, China; and Chennai and New Delhi, India. We plan to move our German facility during fiscal 2019. We believe our current and expected facilities will be sufficient to accommodate our requirements through fiscal 2019.
See Note 14, of the Notes to the Consolidated Financial Statements, “Commitments and Contingencies”, contained in Item 8 of this Annual Report on Form 10-K.
Not applicable.
12
|
ITEM 5: |
MARKET FOR THE REGISTRANT’S COMMON EQUITY, RELATED STOCKHOLDER MATTERS AND ISSUER PURCHASES OF EQUITY SECURITIES |
Perceptron’s Common Stock is traded on The NASDAQ Stock Market’s Global Market under the symbol “PRCP”. The following table shows the reported high and low sales prices of Perceptron’s Common Stock for fiscal 2018 and 2017:
|
|
|
Prices |
|
|||||
|
Fiscal 2018 |
|
High |
|
|
Low |
|
||
|
Quarter through September 30, 2017 |
|
$ |
7.99 |
|
|
$ |
6.80 |
|
|
Quarter through December 31, 2017 |
|
$ |
10.71 |
|
|
$ |
7.26 |
|
|
Quarter through March 31, 2018 |
|
$ |
10.81 |
|
|
$ |
8.20 |
|
|
Quarter through June 30, 2018 |
|
$ |
10.60 |
|
|
$ |
8.51 |
|
|
|
|
|
|
|
|
|
|
|
|
Fiscal 2017 |
|
High |
|
|
Low |
|
||
|
Quarter through September 30, 2016 |
|
$ |
7.00 |
|
|
$ |
4.60 |
|
|
Quarter through December 31, 2016 |
|
$ |
6.97 |
|
|
$ |
5.59 |
|
|
Quarter through March 31, 2017 |
|
$ |
8.87 |
|
|
$ |
5.96 |
|
|
Quarter through June 30, 2017 |
|
$ |
8.95 |
|
|
$ |
7.18 |
|
In fiscal 2015, the Board of Directors elected to not pay a dividend and to end our dividend program for the foreseeable future; as a result, no dividend was paid in fiscal 2018. Based upon a review of our capital allocations, we believe it is better to invest in our growth and diversification strategy rather than a dividend strategy.
Under the terms of our Loan Agreement with Chemical Bank, we are not permitted to pay dividends. See “Item 7 – Management’s Discussion and Analysis of Financial Condition and Results of Operations – Liquidity and Capital Resources”.
The approximate number of shareholders of record on August 21, 2018, was 106.
The information pertaining to the securities we have authorized for issuance under equity plans is hereby incorporated by reference to Item 12, "Security Ownership of Certain Beneficial Owners and Management and Related Stockholder Matters – Equity Compensation Plan Information”. For more information about our equity compensation plans, see Note 17, of the Notes to the Consolidated Financial Statements, “Stock Based Compensation”, contained in Item 8 of this Annual Report on Form 10-K.
STOCK PRICE PERFORMANCE GRAPH
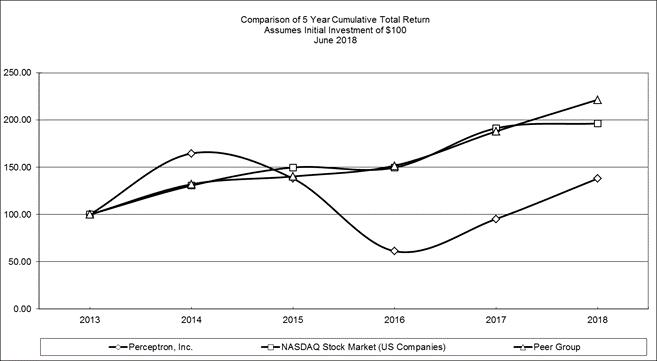
The following graph compares the cumulative 5-year total return attained by shareholders on our Common Stock relative to the cumulative total returns of The Nasdaq Stock Market (U.S.) Index (the “Nasdaq U.S. Index”) and a peer group of companies consisting of all U.S. exchange traded companies with standard industrial classification codes 3823 (Industrial Instruments for Measurement, Display, and Control of Process Variables; and Related Products), 3827 (Optical Instruments and Lenses) and 3829 (Measuring and Controlling Devices) (the “Peer Group Index”). The returns of each company in the Peer Group Index have been weighted according to their respective stock market capitalization. The graph assumes that the value of the investment in our Common Stock, the Peer Group Index and the Nasdaq U.S. Index was $100 on June 30, 2013 and that all dividends were reinvested.
13
COMPARISON OF 5 YEAR CUMULATIVE TOTAL RETURN*
Among Perceptron, Inc., the Nasdaq U.S. Index,
and a Peer Group Index
|
* |
$100 invested on June 30, 2013 in stock or index, including reinvestment of dividends. Fiscal year ending June 30. |
|
CUMULATIVE TOTAL RETURN |
|
||||||||||||||||||||||
|
|
6/30/2013 |
|
|
6/30/2014 |
|
|
6/30/2015 |
|
|
6/30/2016 |
|
|
6/30/2017 |
|
|
6/30/2018 |
|
||||||
|
Perceptron, Inc. |
|
100.00 |
|
|
|
164.65 |
|
|
|
138.19 |
|
|
|
61.24 |
|
|
|
95.27 |
|
|
|
138.06 |
|
|
Nasdaq U.S. Index |
|
100.00 |
|
|
|
130.62 |
|
|
|
149.82 |
|
|
|
149.63 |
|
|
|
191.33 |
|
|
|
196.38 |
|
|
Peer Group Index |
|
100.00 |
|
|
|
132.03 |
|
|
|
140.31 |
|
|
|
151.72 |
|
|
|
188.03 |
|
|
|
221.48 |
|
The graph displayed above is presented in accordance with applicable legal requirements. Shareholders are cautioned against drawing any conclusions from the data contained in the graph, as past results are not necessarily indicative of future performance. The graph in no way reflects our forecast of future financial performance.
14
The Peer Group consists of the following companies:
|
• Abaxis, Inc. (ABAX) |
• Attune RTD, Inc (AURT) |
|
• Camtek, Ltd (CAMT) |
• Cemtrex Inc. (CETX) |
|
• Cognex Corp. (CGNX) |
• Clearsign Combustion Corp. (CLIR) |
|
• Cubic Corporation (CUB) |
• CyberOptics Corp. (CYBE) |
|
• Danaher Corp. (DHR) |
• Electro-Sensors, Inc. (ELSE), |
|
• Esterline Technologies Corp. (ESL) |
• EcoLogix Resource Group, Inc. (EXRG) |
|
• Faro Technologies Inc. (FARO) |
• Flexpoint Sensor Systems, Inc. (FLXT) |
|
• Fortive Corporation (FTV) |
• Geospace Technologies Corporation (GEOS) |
|
• Hickok, Inc. (HICKA) |
• Hurco Companies Inc. (HURC) |
|
• INFICON Holding AG (IFCN.SW) |
• II-VI Inc. (IIVI) |
|
• International Isotopes, Inc. (INIS) |
• Integral Vision, Inc. (INVI) |
|
• Image Sensing Systems, Inc. (ISNS) |
• Keysight Technologies, Inc. (KEYS) |
|
• KLA–Tencor Corp. (KLAC) |
• Know Labs, Inc. (KNWN) |
|
• Lifeline Biotechnologies, Inc. (LLBO) |
• Maclos Capital Inc. (LMSMF) |
|
• Midwest Energy Emissions Corp. (MEEC) |
• Mikros Systems Corp (MKRS) |
|
• MKS Instruments, Inc. (MKSI) |
• Mechanical Technology, Incorporated (MKTY) |
|
• Mesa Laboratories Inc. (MLAB) |
• MTS Systems Corporation (MTSC) |
|
• Nanometrics Incorporated (NANO) |
• National Energy Services, Inc. (NESV) |
|
• Nova Measuring Instruments Ltd. (NVMI) |
• OPT-Sciences Corporation (OPST) |
|
• Optex Systems Holdings, Inc. (OPXS) |
• Orbotech Ltd. (ORBK) |
|
• Rockwell Automation Inc. (ROK) |
• Roper Technologies Inc. (ROP) |
|
• Rudolph Technologies Inc. (RTEC) |
• Senseonics Holdings, Inc. (SENS) |
|
• Signal Advance, Inc. (SIGL) |
• Schmitt Industries, Inc. (SMIT) |
|
• Sierra Monitor Corp. (SRMC) |
• Sensata Technologies Holding NV (ST) |
|
• ProPhotonix Limited (STKR) |
• SheerVision, Inc. (SVSO) |
|
• Sypris Solutions Inc. (SYPR) |
• Thermo Fisher Scientific, Inc. (TMO) |
|
• Trimble Navigation Limited (TRMB) |
• US Nuclear Corp (UCLE) |
|
• Universal Dectection Technology (UNDT) |
|
The following companies that were included in the Peer Group used in preparing the Stock Price Performance Graph contained in the Company’s 2017 Form 10-K were excluded from the Peer Group used in preparing the graph displayed above:
|
• AmbiCom Holdings, Inc. ((ABHI) – Revoked |
• CDEX Inc. (CDEX) – Revoked |
|
• Elbit Vision Systems Ltd. (EVSNF) – Acquired |
• Landauer Inc. (LDR) – Acquired |
|
• Secure Point Technologies Inc. (IMSCQ) - Bankruptcy |
• Smart Energy Solutions, Inc. (SMGY) – Reporting under a difference SIC code |
|
• Visualant, Inc. (VSUL) – Now known as Know Labs, Inc. (KNWN) and is included under its new name |
• Winland Electronics, Inc. (WELX) - Reporting under a different SIC code |
15
ITEM 6:SELECTED FINANCIAL DATA
The selected Statement of Operations and Balance Sheet data presented below are derived from our Consolidated Financial Statements and should be read in conjunction with our Consolidated Financial Statements and notes thereto and Item 7, “Management’s Discussion and Analysis of Financial Condition and Results of Operations” included in this Annual Report on Form 10-K.
|
|
|
Fiscal Years Ended June 30, |
|
|||||||||||||||||
|
Statement of Operations Data |
|
2018 |
|
2017 |
|
2016 (1) |
|
2015 (2) |
|
2014 |
|
|||||||||
|
|
(In Thousands, Except Per Share Amounts) |
|
||||||||||||||||||
|
Net Sales |
|
$ |
84,693 |
|
|
$ |
77,947 |
|
|
$ |
69,135 |
|
|
$ |
74,405 |
|
|
$ |
59,612 |
|
|
Gross Profit |
|
|
32,000 |
|
|
|
27,769 |
|
|
|
21,139 |
|
|
|
28,271 |
|
|
|
24,849 |
|
|
Operating Income (Loss) |
|
|
4,948 |
|
|
|
1,819 |
|
|
|
(9,384 |
) |
|
|
(37 |
) |
|
|
2,942 |
|
|
Income (Loss) Before Income Taxes |
|
|
4,489 |
|
|
|
1,262 |
|
|
|
(9,217 |
) |
|
|
(835 |
) |
|
|
3,002 |
|
|
Net Income (Loss) |
|
|
3,716 |
|
|
|
(168 |
) |
|
|
(22,113 |
) |
|
|
(461 |
) |
|
|
2,427 |
|
|
Income (Loss) Per Common Share: |
|
|
|
|
|
|
|
|
|
|
|
|
|
|
|
|
|
|
|
|
|
Basic |
|
$ |
0.39 |
|
|
$ |
(0.02 |
) |
|
$ |
(2.36 |
) |
|
$ |
(0.05 |
) |
|
$ |
0.27 |
|
|
Diluted |
|
$ |
0.39 |
|
|
$ |
(0.02 |
) |
|
$ |
(2.36 |
) |
|
$ |
(0.05 |
) |
|
$ |
0.26 |
|
|
Weighted Average Common Shares Outstanding: |
|
|
|
|
|
|
|
|
|
|
|
|
|
|
|
|
|
|
|
|
|
Basic |
|
|
9,469 |
|
|
|
9,382 |
|
|
|
9,360 |
|
|
|
9,252 |
|
|
|
8,983 |
|
|
Diluted |
|
|
9,579 |
|
|
|
9,382 |
|
|
|
9,360 |
|
|
|
9,252 |
|
|
|
9,210 |
|
|
|
|
|
|
|
|
|
|
|
|
|
|
|
|
|
|
|
|
|
|
|
|
|
|
As of June 30, |
|
|||||||||||||||||
|
Balance Sheet Data |
|
2018 |
|
2017 |
|
2016 |
|
2015 |
|
2014 |
|
|||||||||
|
|
(In Thousands, Except Per Share Amounts) |
|
||||||||||||||||||
|
Working Capital |
|
$ |
28,168 |
|
|
$ |
22,483 |
|
|
$ |
21,326 |
|
|
$ |
32,978 |
|
|
$ |
46,454 |
|
|
Total Assets |
|
|
74,204 |
|
|
|
70,615 |
|
|
|
67,922 |
|
|
|
94,938 |
|
|
|
80,066 |
|
|
Long-Term Taxes Payable |
|
|
450 |
|
|
|
969 |
|
|
|
1,714 |
|
|
|
3,056 |
|
|
|
- |
|
|
Shareholders' Equity |
|
|
45,598 |
|
|
|
39,835 |
|
|
|
38,554 |
|
|
|
60,792 |
|
|
|
62,780 |
|
|
Annual Dividend Declared Per Common Share |
|
$ |
- |
|
|
$ |
- |
|
|
$ |
- |
|
|
$ |
- |
|
|
$ |
0.15 |
|
|
(1) |
The net loss in fiscal 2016 is primarily due to the recording of a $16.3 million deferred tax valuation allowance (see Note 18, of the Notes to the Consolidated Financial Statements, “Income Taxes” in Item 8 of this Annual Report on Form 10-K). |
|
(2) |
In the third quarter of fiscal 2015, we acquired Next Metrology Software s.r.o. (“NMS”) and Coord3 Industries s.r.l. (“Coord3”). |
16
SAFE HARBOR STATEMENT
Certain statements in this report, including statements made in this Management’s Discussion and Analysis of Financial Condition and Results of Operations, may be “forward-looking statements” within the meaning of the Securities Exchange Act of 1934, including our expectation as to our fiscal year 2019 and future results, operating data, new order bookings, revenue, expenses, net income and backlog levels, trends affecting our future revenue levels, the rate of new orders, the timing of revenue and net income increases from new products which we have recently released or will release in the future, the timing of the introduction of new products and our ability to fund our fiscal year 2019 and future cash flow requirements. We may also make forward-looking statements in our press releases or other public or shareholder communications. Whenever possible, we have identified these forward-looking statements by words such as “target,” “will,” “should,” “could,” “believes,” “expects,” “anticipates,” “aspirations,” “estimates,” “prospects,” “outlook,” “guidance” or similar expressions. We claim the protection of the safe harbor for forward-looking statements contained in the Private Securities Litigation Reform Act of 1995 for all of our forward-looking statements. While we believe that our forward-looking statements are reasonable, you should not place undue reliance on any such forward-looking statements, which speak only as of the date made. Because these forward-looking statements are based on estimates and assumptions that are subject to significant business, economic and competitive uncertainties, many of which are beyond our control or are subject to change, actual results could be materially different. Factors that might cause such a difference include, without limitation, the risks and uncertainties discussed from time to time in our periodic reports filed with the Securities and Exchange Commission, including those listed in “Item 1A: Risk Factors” of this report. Except as required by applicable law, we do not undertake, and expressly disclaim, any obligation to publicly update or alter our statements whether as a result of new information, events or circumstances occurring after the date of this report or otherwise.
Executive Summary
Perceptron, Inc. (“Perceptron”, “we”, “us” or “our”) develops, produces and sells a comprehensive range of automated industrial metrology products and solutions to manufacturing organizations for dimensional gauging, dimensional inspection and 3D scanning. Our primary operations are in North America, Europe and Asia. All of our products rely on our core technologies and are divided into the following customer solution categories:
|
|
• |
In-Line and Near-Line Measurement Solutions - engineered metrology systems for industrial automated process control and assembly using fixed and robot mounted laser scanners. We also provide Value Added Services including training, field service, calibration, launch support services, consulting services, maintenance agreements and repairs related to our In-Line and Near-Line Measurement Solutions. |
|
|
• |
Off-Line Measurement Solutions - tailored metrology products for industrial gauging and dimensional inspection using standalone robot-mounted laser scanners and Coordinate Measuring Machines (“CMM”). We also provide Value Added Services including training, calibration, maintenance agreements and repairs related to our Off-Line Measurement Solutions. |
|
|
• |
3D Scanning Solutions - laser scanner products that target the digitizing, reverse engineering, inspection and original equipment manufacturers wheel alignment markets. |
The largest end-use market we serve is the automotive industry. New automotive tooling programs represent the most important selling opportunity for our In-Line and Near-Line Measurement Solutions. The number and timing of new vehicle tooling programs vary based on the plans of individual automotive manufacturers. The existing installed base of In-Line and Near-Line Measurement Solutions also provides a continuous revenue stream in the form of system additions, upgrades and modifications as well as Value Added Services such as customer training and support.
Our Off-Line Measurement and 3D Scanning Solutions are utilized by a wide variety of targeted industrial customers, with the automotive industry representing the largest market for our industrial metrology products.
We have continued to make measured improvements across the organization over the past five years. In fiscal 2014, we developed a strategic plan designed to expand revenues and increase shareholder value over the longer term. The following year, we made significant progress in implementing this strategic plan. Specifically, we completed our first acquisitions in over 15 years, introduced numerous new products, launched a global Enterprise Resource Planning (“ERP”) system implementation and diversified our customer and industry base.
In fiscal 2016, we introduced a broadly focused Financial Improvement Plan designed to reduce fixed costs, improve our profitability and cash flow, while also driving our ability to optimize the value of our business diversification strategy. While adhering to this plan and our strategic objectives, we achieved record-level bookings in fiscal 2017 and then set a new record-level bookings in fiscal year 2018. The strategic plan we put into place has continued to drive strength in key customer demand metrics, as evidenced by our robust sales, profitability and backlog results.
17
This year’s results represented continued progress in our turnaround, reflecting performance improvement, sustained strength in our end markets and persistent cost savings. Our bookings have exceeded $20 million in seven out of the last nine quarters starting with the fourth quarter of fiscal year 2016. This sustained, historic performance led to record-level bookings for fiscal 2018 of $87.2 million, surpassing fiscal 2017’s record level of $84.6 million. Furthermore, we are starting our fiscal 2019 with a backlog level of $47.5 million, the highest year-end backlog in our history. Finally, operating income improved by $3.1 million when comparing our fiscal year 2018 to our fiscal year 2017, while we also generated strong operating cash flows throughout the fiscal year. These strong cash flows allow us to invest for growth, especially in our engineering and research and development area. We believe these investments will drive new product launches and will yield increasing returns to our shareholders.
We continue to set our long-term aspirations for sustained high single-digit revenue growth and resulting double-digit earnings growth. As such, our focus remains on product development and improvement efforts for our core automotive market and adjacent markets, as well as with our existing customers, potential new automotive customers and their suppliers. We are confident that a relentless focus in these markets will continue to provide sustainable and profitable long-term growth opportunities.
Results of Operations
Fiscal Year Ended June 30, 2018, Compared to Fiscal Year Ended June 30, 2017
Overview –We reported a net income of $3.7 million, or $0.39 per diluted share, for the fiscal year ended June 30, 2018 compared with a net loss of $0.2 million, or $0.02 per diluted share, for the fiscal year ended June 30, 2017.
Bookings – Bookings represent new orders received from our customers. We expect the level of new orders to fluctuate from period to period and do not believe new order bookings during any particular period are indicative of our future operating performance.
Bookings by geographic location were (in millions):
|
|
|
Fiscal Years Ended June 30, |
|
|
|
|
|
|
|
|
|
|
|||||||||||||
|
|
|
2018 |
|
|
2017 |
|
|
|
Increase/(Decrease) |
|
|||||||||||||||
|
Geographic Region |
|
|
|
|
|
|
|
|
|
|
|
|
|
|
|
|
|
|
|
|
|
|
|
|
|
|
Americas |
|
$ |
35.0 |
|
|
|
40.1 |
% |
|
$ |
39.2 |
|
|
|
46.3 |
% |
|
|
$ |
(4.2 |
) |
|
|
(10.7 |
%) |
|
Europe |
|
|
36.1 |
|
|
|
41.4 |
% |
|
|
29.4 |
|
|
|
34.8 |
% |
|
|
|
6.7 |
|
|
|
22.8 |
% |
|
Asia |
|
|
16.1 |
|
|
|
18.5 |
% |
|
|
16.0 |
|
|
|
18.9 |
% |
|
|
|
0.1 |
|
|
|
0.6 |
% |
|
Totals |
|
$ |
87.2 |
|
|
|
100.0 |
% |
|
$ |
84.6 |
|
|
|
100.0 |
% |
|
|
$ |
2.6 |
|
|
|
3.1 |
% |
We achieved a record bookings level in fiscal 2018, primarily due to strong market activity in our Europe region. The increase in bookings for fiscal 2018 as compared to fiscal 2017 of $2.6 million, including a favorable currency impact of $4.2 million, is primarily due to an increase of $4.8 million in our Off-Line Measurement Solutions, an increase of $1.1 million in our In-Line and Near-Line Measurement Solutions and an increase of $0.1 million in our Value Added Services, partially offset by a decrease of $3.4 million in our 3D Scanning Solutions. On a geographic basis, the $6.7 million increase in our Europe region is primarily due to an increase of $4.5 million in our In-Line and Near-Line Measurement Solutions, an increase of $1.8 million in our Off-Line Measurement Solutions, an increase of $0.3 million in our Value Added Services and an increase of $0.1 million in our 3D Scanning Solutions. The $0.1 million increase in our Asia region is due to an increase of $2.7 million in our Off-Line Measurement Solutions, partially offset by a decrease of $1.6 million in our 3D Scanning Solutions and a decrease of $1.0 million in our In-Line and Near-Line Measurement Solutions. The $4.2 million decrease in our America region is primarily due to a decrease of $2.4 million in our In-Line and Near-Line Measurement Solutions, a decrease of $1.9 million in our 3D Scanning Solutions and a decrease of $0.2 million in our Value Added Services, partially offset by an increase of $0.3 million in our Off-Line Measurement Solutions.
Backlog – Backlog represents orders or bookings we have received but have not yet been filled. We believe that the level of backlog during any particular period is not necessarily indicative of our future operating performance. Although most of the backlog is subject to cancellation by our customers, we expect to fill substantially all of the orders in our backlog during the next twelve months.
Backlog by geographic location was (in millions):
|
|
|
As of June 30, |
|
|
|
|
|
|
|
|
|
|
|||||||||||||
|
|
|
2018 |
|
2017 |
|
|
|
Increase/(Decrease) |
|
||||||||||||||||
|
Geographic Region |
|
|
|
|
|
|
|
|
|
|
|
|
|
|
|
|
|
|
|
|
|
|
|
|
|
|
Americas |
|
$ |
19.8 |
|
|
|
41.7 |
% |
|
$ |
19.5 |
|
|
|
43.3 |
% |
|
|
$ |
0.3 |
|
|
|
1.5 |
% |
|
Europe |
|
|
19.0 |
|
|
|
40.0 |
% |
|
|
16.4 |
|
|
|
36.5 |
% |
|
|
|
2.6 |
|
|
|
15.9 |
% |
|
Asia |
|
|
8.7 |
|
|
|
18.3 |
% |
|
|
9.1 |
|
|
|
20.2 |
% |
|
|
|
(0.4 |
) |
|
|
(4.4 |
%) |
|
Totals |
|
$ |
47.5 |
|
|
|
100.0 |
% |
|
$ |
45.0 |
|
|
|
100.0 |
% |
|
|
$ |
2.5 |
|
|
|
5.6 |
% |
18
The current year ending backlog increased by $2.5 million or 5.6% compared to the ending backlog at June 30, 2017. The increase in our backlog was primarily due to an increase of $2.7 million in our Off-Line Measurement Solutions and an increase of $1.3 million in our In-Line and Near-Line Measurement Solutions, partially offset by a decrease of $1.1 million in our Value Added Services and a decrease of $0.4 million in in our 3D Scanning Solutions. On a geographic basis, the $2.6 million increase in our Europe region is primarily due to an increase of $1.5 million in our In-Line and Near-Line Measurement Solutions, an increase of $1.2 million in our Off-Line Measurement Solutions and an increase of $0.1 million in our 3D Scanning Solutions, partially offset by a decrease of $0.2 million in our Value Added Services. The $0.3 million increase in our America region is primarily due to an increase of $1.5 million in our In-Line and Near-Line Measurement Solutions, partially offset by a decrease of $0.6 million in our Value Added Services, a decrease of $0.4 million in our 3D Scanning Solutions and a decrease of $0.2 million in our Off-Line Measurement Solutions. The $0.4 million decrease in our Asia region is primarily due to a decrease of $1.7 million in our In-Line and Near-Line Measurement Solutions, a decrease of $0.3 million in our Value Added Services and a decrease of $0.1 million in our 3D Scanning Solutions, partially offset by an increase of $1.7 million in our Off-Line Measurement Solutions.
A summary of our operating results is shown below (in millions):
|
|
|
Fiscal Year Ended June 30, |
|
|||||||||||||
|
|
|
2018 |
|
|
% of Sales |
|
|
2017 |
|
|
% of Sales |
|
||||
|
Americas Sales |
|
$ |
34.7 |
|
|
|
41.0 |
% |
|
$ |
30.3 |
|
|
|
38.9 |
% |
|
Europe Sales |
|
33.5 |
|
|
|
39.5 |
% |
|
32.1 |
|
|
|
41.2 |
% |
||
|
Asia Sales |
|
16.5 |
|
|
|
19.5 |
% |
|
15.5 |
|
|
|
19.9 |
% |
||
|
Net Sales |
|
$ |
84.7 |
|
|
|
100.0 |
% |
|
$ |
77.9 |
|
|
|
100.0 |
% |
|
Cost of Sales |
|
|
52.7 |
|
|
|
62.2 |
% |
|
|
50.2 |
|
|
|
64.4 |
% |
|
Gross Profit |
|
|
32.0 |
|
|
|
37.8 |
% |
|
|
27.7 |
|
|
|
35.6 |
% |
|
Operating Expenses |
|
|
|
|
|
|
|
|
|
|
|
|
|
|
|
|
|
Selling, General and Administrative |
|
|
18.5 |
|
|
|
21.8 |
% |
|
|
17.3 |
|
|
|
22.2 |
% |
|
Engineering, Research and Development |
|
|
8.0 |
|
|
|
9.5 |
% |
|
|
6.8 |
|
|
|
8.8 |
% |
|
Severance, Impairment and Other Charges |
|
|
0.6 |
|
|
|
0.7 |
% |
|
|
1.8 |
|
|
|
2.3 |
% |
|
Operating Income |
|
|
4.9 |
|
|
|
5.8 |
% |
|
|
1.8 |
|
|
|
2.3 |
% |
|
Other Income and (Expenses), net |
|
|
|
|
|
|
|
|
|
|
|
|
|
|
|
|
|
Interest Expense, net |
|
|
(0.2 |
) |
|
|
(0.2 |
%) |
|
|
(0.3 |
) |
|
|
(0.4 |
%) |
|
Foreign Currency Gain (Loss), net |
|
|
(0.3 |
) |
|
|
(0.4 |
%) |
|
|
(0.3 |
) |
|
|
(0.4 |
%) |
|
Other Income and (Expense), net |
|
|
0.1 |
|
|
|
0.1 |
% |
|
|
0.0 |
|
|
|
0.0 |
% |
|
Income Before Income Taxes |
|
|
4.5 |
|
|
|
5.3 |
% |
|
|
1.2 |
|
|
|
1.5 |
% |
|
Income Tax Expense |
|
|
(0.8 |
) |
|
|
(0.9 |
%) |
|
|
(1.4 |
) |
|
|
(1.8 |
%) |
|
Net Income (Loss) |
|
$ |
3.7 |
|
|
|
4.4 |
% |
|
$ |
(0.2 |
) |
|
|
(0.3 |
%) |
Sales – Net sales of $84.7 million for our fiscal year 2018 increased $6.8 million, or 8.7%, including a favorable currency impact of $3.4 million. The improvement is primarily due to an increase of $5.5 million in our In-Line and Near-Line Measurement Solutions, an increase of $2.0 million in our Off-Line Measurement Solutions and an increase of $2.0 million in Value Added Services, partially offset by a decrease of $2.7 million in our 3D Scanning Solutions. On a geographic basis, the $4.4 million increase in our Americas region is primarily due to an increase of $4.9 million in our In-Line and Near-Line Measurement Solutions and an increase of $0.9 million in our Value Added Services, partially offset by a decrease of $1.4 million in our 3D Scanning Solutions. The $1.4 million increase in our Europe region is primarily due to an increase of $1.1 million in our Value Added Services and an increase of $0.4 million in our In-Line and Near-Line Measurement Solutions, partially offset by a decrease of $0.1 million in our Off-Line Measurement Solutions. The $1.0 million increase in our Asia region is primarily due to an increase of $2.1 million in our Off-Line Measurement Solutions and an increase of $0.2 million in our In-Line and Near-Line Measurement Solutions, partially offset by a decrease of $1.3 million in our 3D Scanning Solutions.
Gross Profit – Gross profit percentage was 37.8% of sales in the fiscal year ended June 30, 2018, compared to 35.6% of sales in the fiscal year ended June 30, 2017. The higher gross margin percentage in fiscal 2018 was primarily due to the increase and mix of our revenue, the timing of certain expenses in our cost of goods sold as well as lower material costs resulting from improved efficiencies, partially offset by increased warranty expenses.
Selling, General and Administrative (SG&A) Expenses – SG&A expenses were approximately $18.5 million for our fiscal year 2018, an increase of $1.2 million compared to our fiscal year 2017. The increase is primarily due to increases in employee-related costs of $1.0 million, including a higher accrual for our short-term incentive compensation plan due to improved financial results, an increase in contractor services of $0.4 million, an increase in our allowance for doubtful accounts of $0.2 million and an increase in Board of Director fees of $0.2 million, partially offset by decreased spending in legal and audit fees of $0.3 million, advertising and marketing costs of $0.1 million, building and rent expenses of $0.1 million and lower financing expenses of $0.1 million.
Engineering, Research and Development (R&D) Expenses – Engineering, research and development expenses were approximately $8.0 million in our fiscal year 2018, compared to $6.8 million in our fiscal year 2017. This increase is primarily due to higher employee-related costs due to recent investments in additional resources to develop new products.
19
Severance, Impairment and Other Charges – Severance, impairment and other charges for fiscal 2018 were approximately $0.6 million, primarily due to the charge we recorded related to an award of attorney fees in a trade secrets case brought by us, as described in Item 7 “Management’s Discussion and Analysis of Financial Condition and Results of Operations - Liquidity and Capital Resources – Commitments and Contingencies”, partially offset by an adjustment related to severance at our Chinese location, a collection of an accounts receivable balance that was previously written off, as well as a reduction in the inventory write-off due to finding other uses for some of the inventory originally designated as impaired. We have incurred $3.5 million of expense related to the financial improvement plan that commenced in March 2016, and we have substantially completed the plan that was announced. See Note 10, of the Notes to the Consolidated Financial Statements, “Severance, Impairment and Other Charges”, contained in Item 8 of this Annual Report on Form 10-K for further discussion.
Interest Expense, net – Net interest expense was $0.2 million in fiscal 2018, compared with net interest expense of $0.3 million in fiscal 2017. The improvement was primarily due to the continued pay-down of liabilities assumed in the acquisition of Coord3, as well as due to fiscal year 2017 interest expense related to a tax audit at our German location.
Foreign Currency Gain (Loss), net – Foreign currency gain (loss) was a net loss of $0.3 million in fiscal 2018, flat compared to the net loss in fiscal 2017. The net loss in fiscal 2018 was primarily related to the Euro and Brazilian Real compared to the U.S. Dollar. The net loss in fiscal 2017 was primarily related to the Japanese Yen, Euro and Brazilian Real.
Other Income and (Expense), net – Net other income was $0.1 million in fiscal 2018 compared to an immaterial amount in fiscal 2017. The net other income in fiscal 2018 was primarily due to receiving a dividend related to our long-term investment.
Income Tax Expense – Our effective tax rate for fiscal year ended June 30, 2018 was 17.2% compared to 113.1% in fiscal year 2017. We have previously established full valuation allowances against our U.S. Federal, Germany, Japan, Singapore and Brazil net deferred tax assets. The effective tax rate in fiscal 2018 is impacted by not recognizing tax expenses on pre-tax income in these jurisdictions. Furthermore, due to the passage of the U.S. Tax Cuts and Jobs Act, in the second quarter of fiscal 2018, we were able to reverse a valuation allowance of $0.3 million that we had previously recorded on AMT credit carryforwards. See Note 18, of the Notes to the Consolidated Financial Statements, “Income Taxes”, contained in Item 8 of this Annual Report on Form 10-K for further discussion. The effective tax rate for fiscal 2017 was impacted by not being able to recognize tax benefits on pre-tax losses in the jurisdictions with full valuation allowances as well as tax expense related to a tax audit at our German location and normal levels of tax expense from the locations that do not have a valuation allowance.
Results of Operations
Fiscal Year Ended June 30, 2017, Compared to Fiscal Year Ended June 30, 2016
Overview –We reported a net loss of $0.2 million, or $0.02 per diluted share, for the fiscal year ended June 30, 2017 compared with net loss of $22.1 million, or $2.36 per diluted share, for the fiscal year ended June 30, 2016.
Bookings – Bookings represent new orders received from our customers. We expect the level of new orders to fluctuate from period to period and do not believe new order bookings during any particular period are indicative of our future operating performance.
Bookings by geographic location were (in millions):
|
|
|
Fiscal Years Ended June 30, |
|
|
|
|
|
|
|
|
|||||||||||||
|
|
|
2017 |
|
|
2016 |
|
|
Increase/(Decrease) |
|
||||||||||||||
|
Geographic Region |
|
|
|
|
|
|
|
|
|
|
|
|
|
|
|
|
|
|
|
|
|
|
|
|
Americas |
|
$ |
39.2 |
|
|
|
46.3 |
% |
|
$ |
22.7 |
|
|
|
33.2 |
% |
|
$ |
16.5 |
|
|
72.7 |
% |
|
Europe |
|
|
29.4 |
|
|
|
34.8 |
% |
|
|
34.7 |
|
|
|
50.7 |
% |
|
|
(5.3 |
) |
|
(15.3 |
%) |
|
Asia |
|
|
16.0 |
|
|
|
18.9 |
% |
|
|
11.0 |
|
|
|
16.1 |
% |
|
|
5.0 |
|
|
45.5 |
% |
|
Totals |
|
$ |
84.6 |
|
|
|
100.0 |
% |
|
$ |
68.4 |
|
|
|
100.0 |
% |
|
$ |
16.2 |
|
|
23.7 |
% |
|
Originally Reported Bookings |
|
|
|
|
|
|
|
|
|
$ |
70.8 |
|
|
|
|
|
|
|
|
|
|
|
|
Fiscal Year 2016’s Bookings have been updated to reflect corrections to calculations.
In fiscal 2017, we achieved a record bookings level, which was then surpassed in fiscal 2018. This strong level of bookings was primarily due to strong market activity in our Americas region. The increase in bookings for fiscal 2017 as compared to fiscal 2016 of $16.2 million, including an unfavorable currency impact of $0.7 million, is primarily due to an increase of $13.7 million in our In-Line and Near-Line Measurement Solutions, an increase of $2.2 million in our 3D Scanning Solutions and an increase of $1.2 million in our Value Added Services, partially offset by a decrease of $0.9 million in our Off-Line Measurement Solutions. On a geographic basis, the $16.5 million increase in our America region is primarily due to an increase of $17.0 million in our In-Line and Near-Line Measurement Solutions, an increase of $1.0 million in our 3D Scanning Solutions and an increase of $0.4 million in our Value Added Services, partially offset by a decrease of 1.9 million in our Off-Line Measurement Solutions. The $5.0 million increase in our Asia region is due to an increase of $2.3 million in our Off-Line Measurement Solutions, an increase of $1.2 million in our In-Line and Near-Line Measurement Solutions, an increase of $1.2 million in our 3D Scanning Solutions and an increase of $0.3 million in our Value Added Services. The $5.3 million decrease in our Europe region is primarily due to a decrease of $4.5 million in our In-Line and Near-Line Measurement Solutions and a decrease of $1.3 million in our Off-Line Measurement Solutions, partially offset by an increase of $0.5 million in our Value Added Services.
20
Backlog – Backlog represents orders or bookings we have received but have not yet been filled. We believe that the level of backlog during any particular period is not necessarily indicative of our future operating performance. Although most of the backlog is subject to cancellation by our customers, we expect to fill substantially all of the orders in our backlog during the next twelve months.
Backlog by geographic location was (in millions):
|
|
|
As of June 30, |
|
|
|
|
|
|
|
|
|||||||||||||
|
|
|
2017 |
|
|
2016 |
|
|
Increase/(Decrease) |
|
||||||||||||||
|
Geographic Region |
|
|
|
|
|
|
|
|
|
|
|
|
|
|
|
|
|
|
|
|
|
|
|
|
Americas |
|
$ |
19.5 |
|
|
|
43.3 |
% |
|
$ |
10.6 |
|
|
|
27.7 |
% |
|
$ |
8.9 |
|
|
84.0 |
% |
|
Europe |
|
|
16.4 |
|
|
|
36.5 |
% |
|
|
19.1 |
|
|
|
49.9 |
% |
|
|
(2.7 |
) |
|
(14.1 |
%) |
|
Asia |
|
|
9.1 |
|
|
|
20.2 |
% |
|
|
8.6 |
|
|
|
22.4 |
% |
|
|
0.5 |
|
|
5.8 |
% |
|
Totals |
|
$ |
45.0 |
|
|
|
100.0 |
% |
|
$ |
38.3 |
|
|
|
100.0 |
% |
|
$ |
6.7 |
|
|
17.5 |
% |
|
Originally Reported Backlog |
|
|
|
|
|
|
|
|
|
$ |
40.6 |
|
|
|
|
|
|
|
|
|
|
|
|
Fiscal Year 2016’s Bookings has been updated to reflect corrections to prior calculations.
The ending backlog at June 30, 2017 increased by $6.7 million or 17.5% compared to the ending backlog at June 30, 2016. The increase in our backlog was primarily due to an increase of $5.5 million in our In-Line and Near-Line Measurement Solutions and an increase of $1.5 million in our Value Added Services, partially offset by a decrease of $0.2 million in our Off-Line Measurement Solutions and a decrease of $0.1 million in our 3D Scanning Solutions. On a geographic basis, the $8.9 million increase in our America region is primarily due to an increase of $8.8 million in our In-Line and Near-Line Measurement Solutions and an increase of $0.6 million in our Value Added Services, partially offset by a decrease of $0.5 million in our Off-Line Measurement Solutions. The $0.5 million increase in our Asia region is primarily due to an increase of $0.9 million in our Off-Line Measurement Solutions and an increase of $0.2 million in our 3D Scanning Solutions, partially offset by a decrease of $0.6 million in our In-Line and Near-Line Measurement Solutions. The $2.7 million decrease in our Europe region is primarily due to a decrease of $2.7 million in our In-Line and Near-Line Measurement Solutions, a decrease of $0.6 million in our Off-Line Measurement Solutions and a decrease of $0.3 million in our 3D Scanning Solutions, partially offset by an increase of $0.9 million in our Value Added Services.
A summary of our operating results is shown below (in millions):
|
|
|
Fiscal Year Ended June 30, |
|
|||||||||||||
|
|
|
2017 |
|
|
% of Sales |
|
|
2016 |
|
|
% of Sales |
|
||||
|
Americas Sales |
|
$ |
30.3 |
|
|
|
38.9 |
% |
|
$ |
22.5 |
|
|
|
32.6 |
% |
|
Europe Sales |
|
32.1 |
|
|
|
41.2 |
% |
|
31.1 |
|
|
|
45.0 |
% |
||
|
Asia Sales |
|
15.5 |
|
|
|
19.9 |
% |
|
15.5 |
|
|
|
22.4 |
% |
||
|
Net Sales |
|
$ |
77.9 |
|
|
|
100.0 |
% |
|
$ |
69.1 |
|
|
|
100.0 |
% |
|
Cost of Sales |
|
|
50.2 |
|
|
|
64.4 |
% |
|
|
48.0 |
|
|
|
69.5 |
% |
|
Gross Profit |
|
|
27.7 |
|
|
|
35.6 |
% |
|
|
21.1 |
|
|
|
30.5 |
% |
|
Operating Expenses |
|
|
|
|
|
|
|
|
|
|
|
|
|
|
|
|
|
Selling, General and Administrative |
|
|
17.3 |
|
|
|
22.2 |
% |
|
|
20.3 |
|
|
|
29.4 |
% |
|
Engineering, Research and Development |
|
|
6.8 |
|
|
|
8.8 |
% |
|
|
7.4 |
|
|
|
10.7 |
% |
|
Severance, Impairment and Other Charges |
|
|
1.8 |
|
|
|
2.3 |
% |
|
|
2.8 |
|
|
|
4.0 |
% |
|
Operating Income (Loss) |
|
|
1.8 |
|
|
|
2.3 |
% |
|
|
(9.4 |
) |
|
|
(13.6 |
%) |
|
Other Income and (Expenses), net |
|
|
|
|
|
|
|
|
|
|
|
|
|
|
|
|
|
Interest Income (Expense), net |
|
|
(0.3 |
) |
|
|
(0.4 |
%) |
|
|
(0.1 |
) |
|
|
(0.1 |
%) |
|
Foreign Currency Gain (Loss), net |
|
|
(0.3 |
) |
|
|
(0.4 |
%) |
|
|
0.1 |
|
|
|
0.1 |
% |
|
Other Income and (Expense), net |
|
|
0.0 |
|
|
|
(0.0 |
%) |
|
|
0.2 |
|
|
|
0.3 |
% |
|
Income (Loss) Before Income Taxes |
|
|
1.2 |
|
|
|
1.5 |
% |
|
|
(9.2 |
) |
|
|
(13.3 |
%) |
|
Income Tax Expense |
|
|
(1.4 |
) |
|
|
(1.8 |
%) |
|
|
(12.9 |
) |
|
|
(18.7 |
%) |
|
Net Loss |
|
$ |
(0.2 |
) |
|
|
(0.3 |
%) |
|
$ |
(22.1 |
) |
|
|
(32.0 |
%) |
Sales – Net sales of $77.9 million for our fiscal year 2017 increased $8.8 million, or 12.7%. The currency impact on sales compared to fiscal 2016, was immaterial. The improvement is primarily due to an increase of $8.0 million in our In-Line and Near-Line Measurement Solutions and an increase of $1.6 million in our 3D Scanning Solutions, partially offset by a decrease of $0.5 million in our Off-Line Measurement Solutions and a decrease of $0.3 million in Value Added Services. On a geographic basis, the $7.8 million increase in our Americas region is primarily due to an increase of $8.3 million in our In-Line and Near-Line Measurement Solutions and an increase of $1.1 million in our 3D Scanning Solutions, partially offset by a decrease of $1.3 million in our Off-Line Measurement Solutions and a decrease of $0.3 million in our Value Added Services. The $1.0 million increase in our Europe region is primarily due to an increase of $2.0 million in our In-Line and Near-Line Measurement Solutions, partially offset by a decrease of $1.0 million in our Off-Line Measurement Solutions. Our Asia region was flat primarily due to an increase of $1.8 million in our Off-Line Measurement Solutions and an increase of $0.5 million in our 3D Scanning Solutions, offset by a decrease of $2.3 million in our In-Line and Near-Line Measurement Solutions.
21
Gross Profit – Gross profit percentage was 35.6% of sales in the fiscal year ended June 30, 2017, compared to 30.5% of sales in the fiscal year ended June 30, 2016. The higher gross margin percentage in fiscal 2017 was primarily due to the increase and mix of our revenue, the timing of certain expenses in our cost of goods sold as well as lower employee-related operating costs resulting from our previously announced financial improvement plan, partially offset by increased warranty costs in fiscal year 2017.
Selling, General and Administrative (SG&A) Expenses – SG&A expenses were approximately $17.3 million for our fiscal year 2017, a decrease of $3.0 million compared to our fiscal year 2016. The decrease is primarily due to cost savings from the reduction in force related to our previously announced financial improvement plan including declines in employee-related costs of $1.3 million and contractor services of $0.8 million. Other decreases in SG&A include lower advertising and marketing costs of $0.5 million, legal and audit fees of $0.2 million and financing expenses of $0.2 million.
Engineering, Research and Development (R&D) Expenses – Engineering, research and development expenses were approximately $6.8 million in our fiscal year 2017, compared to $7.4 million in our fiscal year 2016. This decrease is primarily due to declines in employee-related costs and contractor services of $0.3 million and the expenses related to the timing of certain development efforts of $0.3 million.
Severance, Impairment and Other Charges – Severance, impairment and other charges for fiscal 2017 were approximately $1.8 million. A charge of $1.0 million was related to our legal settlement with 3CEMS and a charge of $0.3 million was related to finalizing severance agreements at our U.S., China and German locations related to the financial improvement plan we announced in the third quarter of fiscal 2016. In addition, during fiscal 2017, we decided to terminate the production and marketing of a specific product line due to limitations in its design. As a result of this decision, we wrote off inventory of $0.3 million and impaired certain customer receivable balances in the amount of $0.2 million.
Interest Income (Expense), net – Net interest expense was $0.3 million in fiscal 2017, compared with net interest expense of $0.1 million in fiscal 2016. This change was due to a decrease in interest income because of lower invested cash balances in fiscal 2017 compared to fiscal 2016, as well as the addition of interest expense on Coord3’s purchase of their current manufacturing facility, the utilization of the U.S. credit facility during fiscal 2017, as well as interest expense related to a tax audit completed in the third quarter of fiscal 2017 at our German location.
Foreign Currency Gain (Loss) – Foreign currency gain (loss) was a net loss of $0.3 million in fiscal 2017 compared with a net gain of $0.1 million in fiscal 2016. The unfavorable change was primarily related to the Japanese Yen, Euro and Brazilian Real compared to the U.S. Dollar in fiscal 2017.
Income Tax Expense – Our effective tax rate for fiscal year ended June 30, 2017 was 113.1% compared to (139.9%) in fiscal year 2016. Our fiscal year 2016 effective tax rate was primarily driven by the establishment of a full valuation allowance against our U.S. Federal, Germany and Brazil net deferred tax assets. Furthermore, in fiscal 2017, we also established full valuation allowances against our Japan and Singapore net deferred tax assets. The effective tax rate for fiscal 2017 is impacted by not being able to recognize tax benefits on pre-tax losses in these jurisdictions as well as tax expense related to a tax audit at our German location and normal levels of tax expense from the locations that do not have a valuation allowance.
Liquidity and Capital Resources
Our primary liquidity needs are to fund product development and capital expenditures as well as support working capital requirements. In general, our principal sources of liquidity are cash and cash equivalents on hand, cash flows from operating activities and borrowings under available credit facilities.
Cash on Hand. Our cash and cash equivalents were $5.8 million at June 30, 2018 compared to $3.7 million at June 30, 2017 and $6.8 million at June 30, 2016.
Cash Flow. The $2.1 million increase in cash from June 30, 2017 to June 30, 2018 was primarily related to $3.8 million of cash provided by operations, partially offset by $1.2 million of cash used for financing activities, $0.4 million used for investing activities, and $0.1 million impact from changes in exchange rates.
During fiscal 2018, cash provided by operations resulted from net income of $3.7 million and adjustments from non-cash items of $2.8 million, partially offset by working capital changes of $2.7 million. Changes in working capital items resulted from cash used for inventories of $2.3 million, accounts payable of $0.8 million and other assets and liabilities of $0.5 million, partially offset by cash provided from accrued liabilities and expenses of $0.8 million and deferred revenue of $0.1 million. The increase in inventory relates to required inventory levels to support our new product launches and increased revenue levels as well as higher inventory needed to mitigate supplier part obsolescence, while the decrease in accounts payable represents fluctuations in the timing of receipts of goods and the related payments. The change in other assets and liabilities is primarily related to the legal settlement with 3CEMS that was announced in July 2017 and payments on the previously announced financial improvement plan, partially offset by the charge we recorded related to an award of attorney fees in a trade secrets case brought by us. The change in accrued liabilities and expenses relates primarily to the timing of payments of local value-added taxes at one of our non-U.S. locations and a higher accrual for our short-term incentive compensation plan due to improved financial results. Finally, the decrease in deferred revenue is due to the timing of revenue recognition on projects that had started in previous periods compared to new projects commencing in fiscal 2018.
22
Cash used for investing activities in fiscal 2018 is due to capital expenditures of $1.1 million, partially offset by the net sale of short-term investments of $0.7 million. Cash used for financing activities in fiscal year 2018 was primarily due to cash paid against our line of credit in the U.S. of $1.5 million, and payments of $0.2 million on the note payable related to the manufacturing facility in Italy, partially offset by cash received from our stock compensation plans of $0.5 million.
During fiscal 2017, cash used for operations resulted from a use of cash related to working capital changes of $7.5 million and our net loss of $0.2 million, partially offset by $4.0 million in adjustments from non-cash items. Changes in working capital items resulted from cash used from accounts receivable of $7.9 million and accounts payable of $0.6 million, partially offset by cash provided from inventories of $0.5 million and other current assets and liabilities of $0.5 million. The decrease in inventory relates to the timing of projects shipped close to the end of our fiscal year 2017 and the careful monitoring of our working capital levels, while the decrease in accounts payable represents fluctuations in the timing of receipts of goods and the related payments. The increase in accounts receivable relates to the timing of our projects which shipped close to the end of our fiscal year 2017 and cash collections. Finally, the change in other current assets and liabilities relates primarily to the timing of our revenue recognition and the accrual needed for the legal settlement.
Cash used for investing activities in fiscal 2017 is due to net purchase of short-term investments of $0.1 million and capital expenditures of $0.7 million. Cash provided from financing activities in fiscal year 2017 was primarily due to cash received under our borrowing agreement in the U.S. of $1.5 million and cash from our stock plans of $0.1 million, partially offset by $0.2 million of cash related to the payments on the note payable related to the manufacturing facility in Italy.
Working Capital Reserves. We provide a reserve for obsolescence to recognize inventory impairment for the effects of engineering change orders as well as the age and usage of inventory that affect the value of the inventory. The reserve for obsolescence creates a new cost basis for the impaired inventory. When inventory that has previously been impaired is sold or disposed, the related obsolescence reserve is reduced resulting in the reduced cost basis being reflected in cost of goods sold. A detailed review of the inventory is performed annually with quarterly updates for known changes that have occurred since the annual review. During fiscal year 2018, we increased our reserve for obsolescence by $0.2 million. See Note 4, of the Notes to the Consolidated Financial Statements, “Inventory”, contained in Item 8 of this Annual Report on Form 10-K.
We determine our allowance for doubtful accounts by considering a number of factors, including the length of time trade accounts receivable are past due, our previous loss history, our customer’s current ability to pay their outstanding balance due to us, and the condition of the general economy and the industry as a whole. We write off accounts receivable when they become uncollectible, and payments subsequently received on such receivables are credited to the allowance for doubtful accounts. During fiscal year 2018, we increased our allowance for doubtful accounts by $0.2 million. See Note 3, of the Notes to the Consolidated Financial Statements, “Allowance For Doubtful Accounts”, contained in Item 8 of this Annual Report on Form 10-K.
Investments. At June 30, 2018, we had short-term investments totaling $0.9 million and a long-term investment recorded at $0.7 million compared to short-term investments totaling $1.6 million and a long-term investment recorded at $0.7 million at June 30, 2017. See Note 6, of the Notes to the Consolidated Financial Statements, “Short-Term and Long-Term Investments”, contained in Item 8 of this Annual Report on Form 10-K for further information on our investments and their current valuation. The market for our long-term investment is currently illiquid. We have $0.2 million of our short-term investments serving as collateral for bank guarantees for certain customer obligations in China. The cash is restricted as to withdrawal or use while the related bank guarantee is outstanding. Interest is earned on the restricted cash and recorded as interest income.
Credit Facilities. We had $0.2 million and $1.7 million in our lines of credit and short-term notes payable outstanding at June 30, 2018 and 2017, respectively. In addition, we had zero and $0.2 million in long-term debt outstanding included in “Other Long-Term Liabilities” at June 30, 2018 and 2017, respectively, on our Consolidated Balance Sheet.
On December 4, 2017, we entered into a Loan Agreement (the “Loan Agreement”) with Chemical Bank (“Chemical”), and related documents, including a Promissory Note. The Loan Agreement is an on-demand line of credit and is cancelable at any time by either Perceptron or Chemical and any amounts outstanding would be immediately due and payable. The Loan Agreement is guaranteed by our U.S. subsidiaries. The Loan Agreement allows for maximum permitted borrowings of $8.0 million. The borrowing base is calculated at the lesser of (i) $8.0 million or (ii) the sum of 80% of eligible accounts receivable balances of U.S. customers and, subject to limitations, certain foreign customers, plus the lesser of 50% of eligible inventory or $3.0 million. At June 30, 2018, our additional available borrowing under this facility was approximately $6.8 million. Security for the Loan Agreement is substantially all of our assets in the U.S. Interest is calculated at 2.65% above the 30 day LIBOR rate. We are not allowed to pay cash dividends under the Loan Agreement. We had zero in borrowings outstanding under our Loan Agreement at June 30, 2018.
Prior to December 4, 2017, we were party to an Amended and Restated Credit Agreement with Comerica Bank. We had $1.5 million outstanding at June 30, 2017 under this agreement. On December 4, 2017, in connection with entering into the Loan Agreement, we repaid in full and terminated our Amended and Restated Credit Agreement with Comerica Bank and related documents. There were no prepayment fees payable in connection with the repayment of the loan.
During the third quarter of fiscal 2016, our Italian subsidiary, Coord3, exercised an option to purchase their current manufacturing facility. The total remaining principal payments of €0.2 million (equivalent to approximately $0.2 million) payable over the next 10 months at a 7.0% annual interest rate are recorded in “Lines of credit and short-term notes payable” on our Consolidated Balance Sheet at June 30, 2018.
23
Our Brazilian subsidiary (“Brazil”) has a credit line and overdraft facility with their local bank. Brazil can borrow a total of B$0.2 million (equivalent to approximately $0.1 million). The Brazil facility is cancelable at any time by either Brazil or the bank and any amount then outstanding would become immediately due and payable. The monthly interest rate for this facility is 12.30%. Brazil previously had two additional credit lines that were cancelled in June 2018. We had no borrowings under these facilities at June 30, 2018 and 2017, respectively.
Commitments and Contingencies. In May 2017, a judge in a trade secrets case brought by Perceptron granted the defendants’ motions for summary disposition and in January 2018 granted their motion for recovery of their attorney fees in the amount of $0.7 million, plus interest. We are appealing the court’s decision to grant summary disposition and the award of attorney fees. In the second quarter of fiscal 2018, we recorded a charge in the amount of $0.7 million relating to this matter.
In the third quarter of fiscal 2018, the Canadian Revenue Agency (“CRA”) completed a Goods and Services Tax/Harmonized Sales Tax Returns (GST/HST) audit. Based on this audit, the CRA preliminarily proposed to assess us approximately CAD $1.2 million (equivalent to approximately $0.9 million) in taxes plus interest and penalties related to sales from 2013 through 2018. CRA has indicated that we are entitled to invoice our customers to recover this amount and our customers are required to remit payment. Our response to the CRA preliminary assessment was delivered in April 2018. In June 2018, we received the final assessment, which confirmed the preliminary assessment. In August 2018, we filed a formal appeal request and posted a surety bond as security for this claim. We have not recorded an accrual related to this audit finding because we are disputing several of the CRA’s conclusions, and, in addition, if our dispute is not resolved to our satisfaction, we expect to ultimately receive the funds from our customers (excluding any interest or penalties), although there may be a timing difference between when we must pay the CRA and when we collect the funds from our customers.
See Item 3, “Legal Proceedings” and Note 14 of the Notes to the Consolidated Financial Statements, “Commitments and Contingencies”, contained in Item 8 of this Annual Report on Form 10-K, for a discussion of certain other contingencies relating to our liquidity, financial position and results of operations. See also, Item 7, “Management’s Discussion and Analysis of Financial Condition and Results of Operations – Critical Accounting Policies - Litigation and Other Contingencies”.
Capital Spending. We spent $0.7 million on capital equipment and $0.4 million on intangible projects in our fiscal year 2018 compared to $0.7 million in our fiscal 2017 as we continue to closely scrutinize all potential capital projects compared to our current cash balances.
Capital Resources and Outlook. Information in this “Outlook” section should be read in conjunction with the “Safe Harbor Statement,” cautionary statements and discussion of risk factors included in “Item 1A: Risk Factors” of this report.
At June 30, 2018, we had $6.7 million in cash, cash equivalents and short-term investments of which $5.5 million, or approximately 82%, was held in foreign bank accounts. We have not been repatriating our foreign earnings. On December 22, 2017, the Tax Cuts and Jobs Act (the “Act”) was enacted by the U.S. The Act implements comprehensive tax legislation which, among other changes, imposes a tax on the untaxed foreign earnings of foreign subsidiaries of U.S. companies by deeming those earnings to be repatriated (the “Transition Tax”). Foreign earnings held in the form of cash and cash equivalents are taxed at a 15.5% rate and the remaining earnings are taxed at an 8% rate. In calculating the Transition Tax, we must calculate the cumulative earnings and profits and related tax pools of each of our non-U.S. subsidiaries back to 1987. We would have the option to either pay any such Transition Tax over an eight year period or to use our net operating loss carry forwards included in our existing deferred tax assets to offset the taxable income resulting from the Transition Tax. In addition, as a result of the Act and the payment of any Transition Tax due, we may be in a position to repatriate our past and future foreign earnings to the U.S. in a more cost-effective manner than under prior law, which could positively impact our liquidity in the U.S. Any such repatriation may be subject to taxation under foreign laws or the laws of the State of Michigan.
We have estimated the impact of the Transition Tax by incorporating assumptions made based upon our current interpretation and analysis to-date of the Act and have determined that our foreign tax credits would completely offset any Transition Tax calculated, and therefore, we do not expect to make any cash payments related to the Transition Tax. The actual impact of the Act may differ from our estimates due to, among other things, further refinement of our calculations as allowed under Staff Accounting Bulletin No. 118 (“SAB 118”), changes in interpretations and assumptions we have made, guidance that may be issued and actions we may take as a result of the Act. See Note 18, of the Notes to the Consolidated Financial Statements, “Income Taxes,” and Item 1A, “Risk Factors titled “A change in our effective tax rate can have a significant adverse impact on our business”, contained in this Annual Report on Form 10-K for further discussion.
Our current outlook for our fiscal 2019 is based on our internal projections about the market and related economic conditions, estimated foreign currency exchange rate effects, as well as our understanding of our key customers’ plans for their retooling projects. If our key customers’ plans differ from our understanding, this could have an adverse impact on our outlook.
Sales in the fourth quarter of fiscal 2018 increased by 5.6% to $23.6 million, when compared to the same period a year ago. We believe our sales for the first quarter of fiscal 2019 will be in the range of $18.0 million to $21.0 million after considering the new revenue recognition rules that we will implement as of July 1, 2018 under Accounting Standards Update No. 2014-19, Revenue from Contracts with Customers (ASU 2014-09). We will make a one-time adjustment to reflect this change that will immediately strengthen our balance sheet as we expect to recognize approximately $3.9 to $4.2 million of gross revenue. This adjustment will be recorded directly to retained earnings, net of associated costs, at an expected amount between $1.8 million to $2.3 million. See Note 1, of the Notes to the Consolidated Financial Statements, “New Accounting Pronouncements,” contained in this Annual Report on Form 10-K for further discussion. For our full fiscal year 2019, we expect revenue growth to be in the mid-single digits compared to fiscal 2018 as we consider the impact of ASU 2014-09 on our revenue levels in addition to our anticipation of benefiting from the new products we launched during fiscal 2018 combined with our current products and solutions and considering our current backlog levels.
24
After giving recognition to the factors discussed above, we expect that the full fiscal year of 2019 operating income could improve compared to fiscal 2018, if we are successful at identifying and implementing efficiencies and cost reductions as well as continue to progress with our long-term growth strategy and diversification program. Based on our business plan, we believe our level of cash, cash equivalents, short-term investments, credit facilities and expected cash flows in each jurisdiction is sufficient to fund our fiscal 2019 cash flow requirements. We continue to expect capital spending, including development of intangible assets, to be less than $1.7 million during fiscal 2019, although there is no binding commitment to do so. Furthermore, the level of our capital spending is dependent on our financial results.
We will evaluate business development and opportunities that fit our strategic plans. There can be no assurance that we will identify items that fit our strategic plans or that we will be able to complete on terms acceptable to us. We anticipate that we would finance any such business development or opportunities from available cash on hand, borrowing from existing credit facilities, identifying additional sources of financing, or issuance of additional shares of our stock, as circumstances warrant.
Contractual Obligations
The following summarizes our contractual obligations at June 30, 2018, and the effect such obligations are expected to have on our liquidity and cash flow in future periods (in thousands):
|
|
|
|
|
|
|
Less than |
|
|
|
|
|
|
|
|
|
|
More than |
|
||
|
|
|
Total |
|
|
1 Year |
|
|
1-3 Years |
|
|
3-5 Years |
|
|
5 Years |
|
|||||
|
Purchase Obligations |
(1) |
$ |
14,137 |
|
|
$ |
14,137 |
|
|
$ |
|
|
|
$ |
|
|
|
$ |
|
|
|
Operating Leases |
(2) |
|
2,087 |
|
|
|
966 |
|
|
|
944 |
|
|
|
177 |
|
|
|
- |
|
|
Other Contractual Obligations |
(3) |
|
976 |
|
|
|
526 |
|
|
|
450 |
|
|
|
- |
|
|
|
- |
|
|
Note Payable |
(4) |
|
175 |
|
|
|
175 |
|
|
|
|
|
|
|
- |
|
|
|
- |
|
|
Total |
|
$ |
17,375 |
|
|
$ |
15,804 |
|
|
$ |
1,394 |
|
|
$ |
177 |
|
|
$ |
|
|
|
(1) |
A purchase obligation is defined as an agreement to purchase goods or services that is enforceable and legally binding. Included in the purchase obligations category above are obligations related to purchase orders for inventory purchases under our standard terms and conditions and under negotiated agreements with vendors. We expect to receive consideration (products or services) for these purchase obligations. The purchase obligation amounts do not represent all anticipated purchases in the future, but represent only those items for which we were contractually obligated at June 30, 2018. |
|
(2) |
Operating leases represent commitments to lease building space, office equipment and motor vehicles. |
|
(3) |
Other contractual obligations referred to above represent government authorized installment payment plans for income and payroll tax liabilities that were acquired by us as part of our purchase of Coord3. These amounts are reported in our Consolidated Balance Sheet as “Current portion of taxes payable” and “Long-Term Taxes Payable”. We have excluded long-term deferred income taxes of $1.7 million as well as $0.6 million of statutory severance liabilities that are included in “Other Long-Term Liabilities” on our Consolidated Balance Sheet because we are unable to reasonably estimate the timing of future payments. |
|
(4) |
During the third quarter of fiscal 2016, Coord3 exercised an option to purchase their current manufacturing facility. The total remaining payments are due over the next 10 months at a 7.0% annual interest rate. |
Critical Accounting Policies
Our discussion and analysis of our financial condition and results of operations are based upon our financial statements and accompanying notes, which have been prepared in accordance with accounting principles generally accepted in the United States (U.S. GAAP). Our significant accounting policies are discussed in Note 1 of the Notes to Consolidated Financial Statements, “Summary of Significant Accounting Policies” contained in Item 8 of this Annual Report on Form 10-K. Our significant accounting policies are subject to judgments and uncertainties, which affect the application of these policies and require us to make estimates based on assumptions that affect the reported amounts of assets, liabilities, revenues and expenses. We base our estimates on historical experience and on various assumptions that we believe to be reasonable under the circumstances. On an ongoing basis, we evaluate these estimates and underlying assumptions. In the event any estimate or underlying assumption proves to be different from actual amounts, adjustments are made in the subsequent period to reflect more current information. We believe that the following significant accounting policies involve our most difficult, subjective or complex judgments or involve the greatest uncertainty.
Revenue Recognition. Revenue related to products and services is recognized upon shipment when title and risk of loss has passed to the customer or upon completion of the service, there is persuasive evidence of an arrangement, the sales price is fixed or determinable, collection of the related receivable is reasonably assured and customer acceptance criteria, if any, have been successfully demonstrated.
We also have multiple element arrangements in our Measurement Solutions product line which may include elements such as: equipment, installation, labor support and/or training. Each element has value on a stand-alone basis and the delivered elements do not include general rights of return. Accordingly, each element is considered a separate unit of accounting. When available, we allocate arrangement consideration to each element in a multiple element arrangement based upon vendor specific objective evidence (“VSOE”) of fair value of the respective elements. When VSOE cannot be established, we attempt to establish the selling price of each element based on relevant third-party evidence. Our products contain a significant level of proprietary technology, customization or differentiation, therefore, comparable pricing of products with similar functionality cannot typically be obtained. In these cases, we utilize our best estimate of selling price (“BESP”). We determine the BESP for a product or service by considering multiple factors including, but not limited to, pricing practices, internal costs, geographies and gross margin.
25
For multiple element arrangements, we defer from revenue recognition the greater of the relative fair value of any undelivered elements of the contract or the portion of the sales price of the contract that is not payable until the undelivered elements are completed. As part of this evaluation, we limit the amount of revenue recognized for delivered elements to the amount that is not contingent on the future delivery of products or services, including a consideration of payment terms that delay payment until those future deliveries are completed.
Some multiple element arrangements contain installment payment terms with a final payment (“final buy-off”) due upon the completion of all elements in the arrangement or when the customer’s final acceptance is received by us. We recognize revenue for each completed element of a contract when it is both earned and realizable. A provision for final customer acceptance generally does not preclude revenue recognition for the delivered equipment element because we rigorously test equipment prior to shipment to ensure it will function in our customer’s environment. The final acceptance amount is assigned to specific element(s) identified in the contract, or if not specified in the contract, to the last element or elements to be delivered that represent an amount at least equal to the final payment amount.
Our Measurement Solutions are designed and configured to meet each customer’s specific requirements. Timing for the delivery of each element in the arrangement is primarily determined by the customer’s requirements and the number of elements ordered. Delivery of all of the multiple elements in an order will typically occur over a three to 15-month period after the order is received. We do not have price protection agreements or requirements to buy back inventory. Our history demonstrates that sales returns have been insignificant.
We exercise judgment in connection with the determination of the amount of revenue to be recognized in each period. Such judgments include, but are not limited to, allocating arrangement consideration to each element in a multiple element arrangement, determining an estimated selling price for each such element, determining the relative fair value of undelivered elements in a multiple element arrangement, determining if customer acceptance criteria preclude revenue recognition and interpreting various commercial terms to determine if all criteria for revenue recognition have been met. Any material changes in these judgments could impact the timing of revenue recognition, which could have a material effect on our financial position and results of operations.
Goodwill. Goodwill represents the excess purchase price over the fair value of the net amounts assigned to assets acquired and liabilities assumed in connection with our acquisitions. Under the Financial Accounting Standards Board (“FASB”) Accounting Standards Codification (“ASC”) Topic 805 “Business Combinations”, we are required to test goodwill for impairment annually, or more frequently whenever events occur or circumstances change that would more likely than not reduce the fair value of a reporting unit with goodwill below its carrying amount. Application of the goodwill impairment test requires judgment, including assignment of assets and liabilities to reporting units, assignment of goodwill to reporting units and determination of the fair value of each reporting unit. The qualitative events or circumstances that could affect the fair value of a reporting unit could include economic conditions; industry and market considerations, including competition; increases in raw materials, labor, or other costs; overall financial performance such as negative or declining cash flows; relevant entity-specific events such as changes in management, key personnel, strategy, or customers; sale or disposition of a significant portion of a reporting unit; and regulatory or political developments.
Companies have the option to evaluate goodwill based upon these qualitative factors, and if it is more likely than not that the fair value of the reporting unit is greater than its carrying amount, then no further goodwill impairment tests are necessary. If the qualitative review indicates it is more likely than not that the fair value of the reporting unit is less than its carrying amount, or if we choose not to perform a qualitative assessment, a quantitative impairment test is performed to identify potential goodwill impairment and measure the amount of goodwill impairment loss to be recognized, if any. During the fourth quarter of fiscal 2018, we elected to complete a quantitative goodwill impairment test which resulted in no impairment.
In conjunction with our goodwill impairment test, we early adopted Accounting Standards Update No. 2017-04, Intangibles – Goodwill and Other: Simplifying the Test for Goodwill Impairment (Topic 350) (ASU 2017-04) as of April 1, 2018, the beginning of our fourth quarter. ASU 2017-04 requires goodwill impairment to be measured as the excess of the carrying value over the fair value of the reporting unit, not to exceed the carrying amount of goodwill. Previously, goodwill impairment was measured as the excess of carrying value over the implied fair value of goodwill. The adoption of ASU 2017-04 had no impact on our financial statements.
The quantitative goodwill impairment test contains estimates regarding future revenue growth and expense levels. To the extent that actual results do not meet projected results, it could result in a material impairment to goodwill which could negatively impact our results of operations. See Note 1, of the Notes to the Consolidated Financial Statements, “Summary of Significant Accounting Policies – Goodwill”, contained in Item 8 of this Annual Report on Form 10-K.
Intangibles. Intangibles are susceptible to shortened estimated useful lives and changes in fair value due to changes in their use, market or economic changes, or other events or circumstances. We evaluate the potential impairment of these intangible assets whenever events or circumstances indicate their carrying value may not be recoverable. Factors that could trigger an impairment review include historical or projected results that are less than the assumptions used in the original valuation of an intangible asset, a change in our business strategy or our use of an intangible asset or negative economic or industry trends.
26
If an event or circumstance indicates that the carrying value of an intangible asset may not be recoverable, we assess the recoverability of the asset or asset group by comparing the carrying value of the asset or asset group to the sum of the undiscounted future cash flows that the asset or asset group is expected to generate over its remaining economic life. If the carrying value exceeds the sum of the undiscounted future cash flows, we compare the fair value of the intangible asset or asset group to the carrying value and record an impairment loss for the difference. We generally estimate the fair value of our intangible assets or asset groups using the income approach based upon a discounted cash flow model. The income approach requires the use of many assumptions and estimates including future revenues and expenses, discount factors, income tax rates, the identification of groups of assets with highly independent cash flows and assets’ economic lives. Volatility in the global economy makes these assumptions and estimates more judgmental. Actual future operating results and remaining economic lives of our intangible assets could differ from those used in assessing the recoverability of these assets and could result in an impairment of our intangible assets in future periods, negatively impacting our financial position and results of operations. There were no impairment of our intangibles during fiscal year ended June 30, 2018, 2017 and 2016. See Note 5 of the Notes to the Consolidated Financial Statements, “Intangibles”, contained in Item 8 of this Annual Report on Form 10-K.
Deferred Income Taxes. Deferred income tax assets and liabilities represent the estimated future income tax effect in each jurisdiction that we operate of temporary differences between the book and tax basis of our assets and liabilities, assuming they will be realized and settled at the amounts reported in our financial statements. We record a valuation allowance to reduce our deferred tax assets to the amount that we believe is more likely than not to be realized. This assessment includes consideration of cumulative losses in recent years, the scheduled reversal of temporary taxable differences, projected future taxable income and the impact of tax planning. We adjust this valuation allowance periodically based upon changes in these considerations. See Note 18, of the Notes to the Consolidated Financial Statements, “Income Taxes”, contained in Item 8 of this Annual Report on Form 10-K. If actual long-term future taxable income is lower than our estimates, or we revise our initial estimates, we may be required to record material adjustments to our deferred tax assets, resulting in a charge to income in the period of determination and negatively impacting our financial position and results of operations.
Litigation and Other Contingencies. From time to time, we are subject to certain legal proceedings and other contingencies, the outcomes of which are subject to significant uncertainty. We accrue for estimated losses if it is probable that a liability has been incurred and the amount of the loss can be reasonably estimated. We use judgment and evaluate, with the assistance of legal counsel, whether a loss contingency arising from litigation should be disclosed or recorded. The outcome of legal proceedings and other contingencies is inherently uncertain and therefore a loss cannot always be reasonably estimated. Accordingly, if the outcome of legal proceedings and other contingencies is different than we anticipate, we would have to record a charge for the matter, potentially in the full amount at which it was resolved, in the period resolved, negatively impacting our results of operations and financial position for the period. See Note 14, of the Notes to the Consolidated Financial Statements, “Commitments and Contingencies”, contained in Item 8 of this Annual Report on Form 10-K for a discussion of current material claims.
Stock-Based Compensation. The Company accounts for non-cash stock-based compensation in accordance with ASC 718, "Compensation - Stock Compensation". Under the fair value recognition provisions of this statement, share-based compensation cost is measured at the grant date based on the value of the award and is recognized as expense over the vesting period. Determining the fair value of share-based awards at the grant date requires judgment, including estimating the number of share-based awards that are expected to be forfeited. The estimated forfeiture rate may change from time to time based upon our actual experience. An increase in the forfeiture rate would require us to reverse a portion of our prior expense for non-cash stock-based compensation, which would positively impact our results of operations. See Note 17, of the Notes to the Consolidated Financial Statements, “Stock Based Compensation”, contained in Item 8 of this Annual Report on Form 10-K.
27
Our primary market risk is related to foreign exchange rates. The foreign exchange risk is derived from our operations outside the U.S., which are primarily located in Germany, Italy and China. We may, from time to time, have interest rate risk in connection with the investment of our available cash balances.
Foreign Currency Risk. We have foreign currency exchange risk in our international operations arising from the time period between sales commitment and delivery for contracts in currencies other than the U.S. Dollar. For sales backlog entered into in currencies other than the U.S. Dollar, the currency rate risk exposure is predominantly less than one year with the majority in the 120 to 150-day range. At June 30, 2018, our backlog in currencies other than the U.S. Dollar was approximately 60.5% or $28.7 million, compared to 58.5% or $26.3 million at June 30, 2017. We are most vulnerable to changes in U.S. Dollar/Euro, U.S. Dollar/Chinese Yuan and U.S. Dollar/Japanese Yen exchange rates.
The potential change in our net income that would result from a hypothetical 10% adverse change in quoted foreign currency exchange rates related to the translation of foreign denominated revenues and expenses into U.S. Dollars for our fiscal years ended June 30, 2018, 2017 and 2016, would have been approximately $0.1 million, $0.1 million and $0.7 million, respectively. This sensitivity analysis assumes there are no changes other than the exchange rates. This analysis has inherent limitations, including that it disregards the possibility that (i) the exchange rates of multiple foreign currencies may not always move in the same direction or the percentage relative to the value of the U.S. Dollar and (ii) changes in exchange rates may impact the volume of sales.
Interest Rate Risk. We invest our cash and cash equivalents in high quality, short-term investments with primarily a term of three months or less. Based on our outstanding credit facilities and invested cash balances at June 30, 2018, a 1% increase in interest rates would have an immaterial impact on our interest expense and a 1% decrease in interest rates would have an immaterial effect on our interest income. As a result, we do not currently hedge these interest rate exposures.
Uncertainties in Credit Markets. At June 30, 2018, we hold a long-term investment in preferred stock that is not registered under the Securities Act of 1933 and may not be offered or sold in the United States absent registration or an applicable exemption from registration requirements. Our long-term investment is subject to risk due to a decline in value of the investment. The investment is currently recorded at $0.7 million after consideration of impairment charges recorded in fiscal 2008 and 2009.
Based on our current business plan, cash and cash equivalents as well as our short-term investments of $6.7 million at June 30, 2018 and our existing unused credit facilities, we do not currently anticipate that the lack of liquidity in this long-term investment will affect our ability to operate or fund our currently anticipated fiscal 2019 cash flow requirements.
New Accounting Pronouncements
For a discussion of new accounting pronouncements, see Note 1 of the Notes to the Consolidated Financial Statements, “Summary of Significant Accounting Policies – New Accounting Pronouncements”, contained in Item 8 of this Annual Report on Form 10-K.
28
29
Report of Independent Registered Public Accounting Firm
Board of Directors and Stockholders
Perceptron, Inc.
Plymouth, Michigan
Opinion on the Consolidated Financial Statements
We have audited the accompanying consolidated balance sheets of Perceptron, Inc. (the “Company”) and subsidiaries as of June 30, 2018 and 2017, the related consolidated statements of operations, comprehensive income, shareholders’ equity, and cash flows for each of the three years in the period ended June 30, 2018, and the related notes (collectively referred to as the “consolidated financial statements”). In our opinion, the consolidated financial statements present fairly, in all material respects, the financial position of the Company and subsidiaries at June 30, 2018 and 2017, and the results of their operations and their cash flows for each of the three years in the period ended June 30, 2018, in conformity with accounting principles generally accepted in the United States of America.
We also have audited, in accordance with the standards of the Public Company Accounting Oversight Board (United States) (“PCAOB”), the Company's internal control over financial reporting as of June 30, 2018, based on criteria established in Internal Control – Integrated Framework (2013) issued by the Committee of Sponsoring Organizations of the Treadway Commission (“COSO”) and our report dated August 30, 2018 expressed an unqualified opinion thereon.
Basis for Opinion
These consolidated financial statements are the responsibility of the Company’s management. Our responsibility is to express an opinion on the Company’s consolidated financial statements based on our audits. We are a public accounting firm registered with the PCAOB and are required to be independent with respect to the Company in accordance with the U.S. federal securities laws and the applicable rules and regulations of the Securities and Exchange Commission and the PCAOB.
We conducted our audits in accordance with the standards of the PCAOB. Those standards require that we plan and perform the audit to obtain reasonable assurance about whether the consolidated financial statements are free of material misstatement, whether due to error or fraud.
Our audits included performing procedures to assess the risks of material misstatement of the consolidated financial statements, whether due to error or fraud, and performing procedures that respond to those risks. Such procedures included examining, on a test basis, evidence regarding the amounts and disclosures in the consolidated financial statements. Our audits also included evaluating the accounting principles used and significant estimates made by management, as well as evaluating the overall presentation of the consolidated financial statements. We believe that our audits provide a reasonable basis for our opinion.
/s/ BDO USA, LLP
We have served as the Company’s auditor since 2013.
Troy, Michigan
August 30, 2018
30
PERCEPTRON, INC. AND SUBSIDIARIES
(In Thousands, Except Per Share Amount)
|
|
As of June 30, |
|
||||||
|
|
|
2018 |
|
|
2017 |
|
||
|
ASSETS |
|
|
|
|
|
|
|
|
|
Current Assets |
|
|
|
|
|
|
|
|
|
Cash and cash equivalents |
|
$ |
5,830 |
|
|
$ |
3,704 |
|
|
Short-term investments |
|
|
877 |
|
|
|
1,572 |
|
|
Receivables: |
|
|
|
|
|
|
|
|
|
Billed receivables, net of allowance for doubtful accounts |
|
|
31,797 |
|
|
|
31,776 |
|
|
of $404 and $253, respectively |
|
|
|
|
|
|
|
|
|
Other receivables |
|
|
346 |
|
|
|
167 |
|
|
Inventories, net of reserves of $2,115 and $1,918, respectively |
|
|
13,829 |
|
|
|
11,466 |
|
|
Short-term deferred income tax asset |
|
|
- |
|
|
|
438 |
|
|
Other current assets |
|
|
1,327 |
|
|
|
1,515 |
|
|
Total current assets |
|
|
54,006 |
|
|
|
50,638 |
|
|
|
|
|
|
|
|
|
|
|
|
Property and Equipment, Net |
|
|
6,613 |
|
|
|
7,377 |
|
|
Goodwill |
|
|
7,985 |
|
|
|
7,793 |
|
|
Intangible Assets, Net |
|
|
3,820 |
|
|
|
4,073 |
|
|
Long-Term Investments |
|
|
725 |
|
|
|
725 |
|
|
Long-Term Deferred Income Tax Asset |
|
|
1,055 |
|
|
|
9 |
|
|
|
|
|
|
|
|
|
|
|
|
Total Assets |
|
$ |
74,204 |
|
|
$ |
70,615 |
|
|
|
|
|
|
|
|
|
|
|
|
LIABILITIES AND SHAREHOLDERS' EQUITY |
|
|
|
|
|
|
|
|
|
Current Liabilities |
|
|
|
|
|
|
|
|
|
Line of credit and short-term notes payable |
|
$ |
175 |
|
|
$ |
1,705 |
|
|
Accounts payable |
|
|
7,592 |
|
|
|
8,280 |
|
|
Accrued liabilities and expenses |
|
|
4,256 |
|
|
|
3,952 |
|
|
Accrued compensation |
|
|
3,155 |
|
|
|
2,600 |
|
|
Current portion of taxes payable |
|
|
526 |
|
|
|
791 |
|
|
Short-term deferred income tax liability |
|
|
- |
|
|
|
752 |
|
|
Income taxes payable |
|
|
768 |
|
|
|
477 |
|
|
Reserves for restructuring and other charges |
|
|
675 |
|
|
|
1,113 |
|
|
Deferred revenue |
|
|
8,691 |
|
|
|
8,485 |
|
|
Total current liabilities |
|
|
25,838 |
|
|
|
28,155 |
|
|
|
|
|
|
|
|
|
|
|
|
Long- Term Taxes Payable |
|
|
450 |
|
|
|
969 |
|
|
Long-Term Deferred Income Tax Liability |
|
|
1,717 |
|
|
|
871 |
|
|
Other Long-Term Liabilities |
|
|
601 |
|
|
|
785 |
|
|
Total Liabilities |
|
$ |
28,606 |
|
|
$ |
30,780 |
|
|
|
|
|
|
|
|
|
|
|
|
Shareholders' Equity |
|
|
|
|
|
|
|
|
|
Preferred stock, no par value, authorized 1,000 shares, issued none |
|
$ |
- |
|
|
$ |
- |
|
|
Common stock, $0.01 par value, authorized 19,000 shares, issued |
|
|
|
|
|
|
|
|
|
and outstanding 9,554 and 9,438, respectively |
|
|
96 |
|
|
|
94 |
|
|
Accumulated other comprehensive loss |
|
|
(2,098 |
) |
|
|
(2,721 |
) |
|
Additional paid-in capital |
|
|
48,110 |
|
|
|
46,688 |
|
|
Retained deficit |
|
|
(510 |
) |
|
|
(4,226 |
) |
|
Total shareholders' equity |
|
|
45,598 |
|
|
|
39,835 |
|
|
|
|
|
|
|
|
|
|
|
|
Total Liabilities and Shareholders' Equity |
|
$ |
74,204 |
|
|
$ |
70,615 |
|
The notes to the consolidated financial statements are an integral part of these statements.
31
PERCEPTRON, INC. AND SUBSIDIARIES
CONSOLIDATED STATEMENTS OF OPERATIONS
(In Thousands, Except Per Share Amounts)
|
|
|
Years Ended June 30, |
|
|||||||||
|
|
|
2018 |
|
|
2017 |
|
|
2016 |
|
|||
|
Net Sales |
|
$ |
84,693 |
|
|
$ |
77,947 |
|
|
$ |
69,135 |
|
|
Cost of Sales |
|
|
52,693 |
|
|
|
50,178 |
|
|
|
47,996 |
|
|
Gross Profit |
|
|
32,000 |
|
|
|
27,769 |
|
|
|
21,139 |
|
|
|
|
|
|
|
|
|
|
|
|
|
|
|
|
Operating Expenses |
|
|
|
|
|
|
|
|
|
|
|
|
|
Selling, general and administrative |
|
|
18,469 |
|
|
|
17,347 |
|
|
|
20,316 |
|
|
Engineering, research and development |
|
|
7,980 |
|
|
|
6,826 |
|
|
|
7,381 |
|
|
Severance, impairment and other charges |
|
|
603 |
|
|
|
1,777 |
|
|
|
2,826 |
|
|
Total operating expenses |
|
|
27,052 |
|
|
|
25,950 |
|
|
|
30,523 |
|
|
|
|
|
|
|
|
|
|
|
|
|
|
|
|
Operating Income (Loss) |
|
|
4,948 |
|
|
|
1,819 |
|
|
|
(9,384 |
) |
|
|
|
|
|
|
|
|
|
|
|
|
|
|
|
Other Income and (Expense) |
|
|
|
|
|
|
|
|
|
|
|
|
|
Interest expense, net |
|
|
(181 |
) |
|
|
(264 |
) |
|
|
(148 |
) |
|
Foreign currency gain (loss), net |
|
|
(397 |
) |
|
|
(333 |
) |
|
|
144 |
|
|
Other income (expense), net |
|
|
119 |
|
|
|
40 |
|
|
|
171 |
|
|
Total other income and (expense) |
|
|
(459 |
) |
|
|
(557 |
) |
|
|
167 |
|
|
|
|
|
|
|
|
|
|
|
|
|
|
|
|
Income (Loss) Before Income Taxes |
|
|
4,489 |
|
|
|
1,262 |
|
|
|
(9,217 |
) |
|
|
|
|
|
|
|
|
|
|
|
|
|
|
|
Income Tax Expense |
|
|
(773 |
) |
|
|
(1,430 |
) |
|
|
(12,896 |
) |
|
|
|
|
|
|
|
|
|
|
|
|
|
|
|
Net Income (Loss) |
|
$ |
3,716 |
|
|
$ |
(168 |
) |
|
$ |
(22,113 |
) |
|
|
|
|
|
|
|
|
|
|
|
|
|
|
|
Income (Loss) Per Common Share |
|
|
|
|
|
|
|
|
|
|
|
|
|
Basic |
|
$ |
0.39 |
|
|
$ |
(0.02 |
) |
|
$ |
(2.36 |
) |
|
Diluted |
|
$ |
0.39 |
|
|
$ |
(0.02 |
) |
|
$ |
(2.36 |
) |
|
|
|
|
|
|
|
|
|
|
|
|
|
|
|
Weighted Average Common Shares Outstanding |
|
|
|
|
|
|
|
|
|
|
|
|
|
Basic |
|
|
9,469 |
|
|
|
9,382 |
|
|
|
9,360 |
|
|
Dilutive effect of stock options |
|
|
110 |
|
|
|
- |
|
|
|
- |
|
|
Diluted |
|
|
9,579 |
|
|
|
9,382 |
|
|
|
9,360 |
|
The notes to the consolidated financial statements are an integral part of these statements.
32
PERCEPTRON, INC. AND SUBSIDIARIES
CONSOLIDATED STATEMENTS OF COMPREHENSIVE INCOME (LOSS)
(In Thousands)
|
|
|
Years ended June 30, |
|
|||||||||
|
|
|
2018 |
|
|
2017 |
|
|
2016 |
|
|||
|
Net Income (Loss) |
|
$ |
3,716 |
|
|
$ |
(168 |
) |
|
$ |
(22,113 |
) |
|
Other Comprehensive Income (Loss): |
|
|
|
|
|
|
|
|
|
|
|
|
|
Foreign currency translation adjustments |
|
|
623 |
|
|
|
499 |
|
|
|
(849 |
) |
|
|
|
|
|
|
|
|
|
|
|
|
|
|
|
Comprehensive Income (Loss) |
|
$ |
4,339 |
|
|
$ |
331 |
|
|
$ |
(22,962 |
) |
The notes to the consolidated financial statements are an integral part of these statements.
33
PERCEPTRON, INC. AND SUBSIDIARIES
CONSOLIDATED STATEMENTS OF CASH FLOW
(In Thousands)
|
|
|
Years Ended June 30, |
|
|||||||||
|
|
|
2018 |
|
|
2017 |
|
|
2016 |
|
|||
|
|
|
|
|
|
|
|
|
|
|
|
|
|
|
Cash Flows from Operating Activities |
|
|
|
|
|
|
|
|
|
|
|
|
|
Net income (loss) |
|
$ |
3,716 |
|
|
$ |
(168 |
) |
|
$ |
(22,113 |
) |
|
Adjustments to reconcile net income (loss) to net cash provided from |
|
|
|
|
|
|
|
|
|
|
|
|
|
(used for) operating activities: |
|
|
|
|
|
|
|
|
|
|
|
|
|
Depreciation and amortization |
|
|
2,276 |
|
|
|
2,194 |
|
|
|
2,137 |
|
|
Stock compensation expense |
|
|
954 |
|
|
|
797 |
|
|
|
649 |
|
|
Asset impairment and related inventory write-down |
|
|
(59 |
) |
|
|
476 |
|
|
|
858 |
|
|
Deferred income taxes |
|
|
(544 |
) |
|
|
496 |
|
|
|
12,521 |
|
|
Loss (gain) on disposal of assets |
|
|
28 |
|
|
|
(5 |
) |
|
|
201 |
|
|
Allowance for doubtful accounts |
|
|
151 |
|
|
|
(16 |
) |
|
|
(128 |
) |
|
Changes in assets and liabilities |
|
|
|
|
|
|
|
|
|
|
|
|
|
Receivables |
|
|
21 |
|
|
|
(7,991 |
) |
|
|
5,496 |
|
|
Inventories |
|
|
(2,286 |
) |
|
|
520 |
|
|
|
(537 |
) |
|
Accounts payable |
|
|
(761 |
) |
|
|
(586 |
) |
|
|
1,201 |
|
|
Accrued liabilities and expenses |
|
|
780 |
|
|
|
180 |
|
|
|
(2,626 |
) |
|
Deferred revenue |
|
|
141 |
|
|
|
744 |
|
|
|
(1,048 |
) |
|
Other assets and liabilities |
|
|
(553 |
) |
|
|
(388 |
) |
|
|
(2,059 |
) |
|
Net cash provided from (used for) operating activities |
|
|
3,864 |
|
|
|
(3,747 |
) |
|
|
(5,448 |
) |
|
|
|
|
|
|
|
|
|
|
|
|
|
|
|
Cash Flows from Investing Activities |
|
|
|
|
|
|
|
|
|
|
|
|
|
Purchases of short-term investments |
|
|
(4,789 |
) |
|
|
(4,371 |
) |
|
|
(3,353 |
) |
|
Sales of short-term investments |
|
|
5,535 |
|
|
|
4,290 |
|
|
|
5,788 |
|
|
Capital expenditures |
|
|
(735 |
) |
|
|
(682 |
) |
|
|
(1,641 |
) |
|
Capital expenditures-intangibles |
|
|
(418 |
) |
|
|
- |
|
|
|
(129 |
) |
|
Net cash (used for) provided from investing activities |
|
|
(407 |
) |
|
|
(763 |
) |
|
|
665 |
|
|
|
|
|
|
|
|
|
|
|
|
|
|
|
|
Cash Flows from Financing Activities |
|
|
|
|
|
|
|
|
|
|
|
|
|
(Payments to) proceeds from lines of credit and short-term borrowings, net |
|
|
(1,715 |
) |
|
|
1,303 |
|
|
|
(83 |
) |
|
Proceeds from stock plans |
|
|
489 |
|
|
|
157 |
|
|
|
75 |
|
|
Cash payments for shares surrendered upon vesting of restricted |
|
|
|
|
|
|
|
|
|
|
|
|
|
stock units to cover taxes |
|
|
(19 |
) |
|
|
- |
|
|
|
- |
|
|
Net cash (used for) provided from financing activities |
|
|
(1,245 |
) |
|
|
1,460 |
|
|
|
(8 |
) |
|
|
|
|
|
|
|
|
|
|
|
|
|
|
|
Effect of Exchange Rate Changes on Cash and Cash Equivalents |
|
|
(86 |
) |
|
|
(33 |
) |
|
|
76 |
|
|
|
|
|
|
|
|
|
|
|
|
|
|
|
|
Net Increase (Decrease) in Cash and Cash Equivalents |
|
|
2,126 |
|
|
|
(3,083 |
) |
|
|
(4,715 |
) |
|
Cash and Cash Equivalents, July 1 |
|
|
3,704 |
|
|
|
6,787 |
|
|
|
11,502 |
|
|
Cash and Cash Equivalents, June 30 |
|
$ |
5,830 |
|
|
$ |
3,704 |
|
|
$ |
6,787 |
|
|
|
|
|
|
|
|
|
|
|
|
|
|
|
|
Non-Cash Investing and Financing Activity: |
|
|
|
|
|
|
|
|
|
|
|
|
|
Debt related to Purchase of Building |
|
$ |
- |
|
|
$ |
- |
|
|
$ |
585 |
|
|
|
|
|
|
|
|
|
|
|
|
|
|
|
|
Supplemental Disclosure of Cash Flow Information |
|
|
|
|
|
|
|
|
|
|
|
|
|
Cash paid during the year for interest |
|
|
260 |
|
|
$ |
274 |
|
|
$ |
261 |
|
|
Cash paid during the year for income taxes |
|
|
847 |
|
|
$ |
555 |
|
|
$ |
1,144 |
|
The notes to the consolidated financial statements are an integral part of these statements.
34
PERCEPTRON, INC. AND SUBSIDIARIES
CONSOLIDATED STATEMENTS OF SHAREHOLDERS' EQUITY
(In Thousands)
|
|
|
|
|
|
|
|
|
|
|
Accumulated |
|
|
|
|
|
|
|
|
|
|
|
|
|
|
|
|
|
|
|
|
|
|
|
|
|
Other |
|
|
Additional |
|
|
Retained |
|
|
Total |
|
||||
|
|
|
Common Stock |
|
|
Comprehensive |
|
|
Paid-In |
|
|
Earnings |
|
|
Shareholders' |
|
|||||||||
|
|
|
Shares |
|
|
Amount |
|
|
Income (Loss) |
|
|
Capital |
|
|
(Deficit) |
|
|
Equity |
|
||||||
|
Balances, June 30, 2015 |
|
|
9,348 |
|
|
$ |
93 |
|
|
$ |
(2,371 |
) |
|
$ |
45,015 |
|
|
$ |
18,055 |
|
|
$ |
60,792 |
|
|
|
|
|
|
|
|
|
|
|
|
|
|
|
|
|
|
|
|
|
|
|
|
|
|
|
|
Net loss |
|
|
- |
|
|
|
- |
|
|
|
- |
|
|
|
- |
|
|
|
(22,113 |
) |
|
|
(22,113 |
) |
|
Other comprehensive loss |
|
|
- |
|
|
|
- |
|
|
|
(849 |
) |
|
|
- |
|
|
|
- |
|
|
|
(849 |
) |
|
Stock-based compensation |
|
|
- |
|
|
|
- |
|
|
|
- |
|
|
|
649 |
|
|
|
- |
|
|
|
649 |
|
|
Stock plans |
|
|
22 |
|
|
|
1 |
|
|
|
- |
|
|
|
74 |
|
|
|
- |
|
|
|
75 |
|
|
|
|
|
|
|
|
|
|
|
|
|
|
|
|
|
|
|
|
|
|
|
|
|
|
|
|
Balances, June 30, 2016 |
|
|
9,370 |
|
|
$ |
94 |
|
|
$ |
(3,220 |
) |
|
$ |
45,738 |
|
|
$ |
(4,058 |
) |
|
$ |
38,554 |
|
|
|
|
|
|
|
|
|
|
|
|
|
|
|
|
|
|
|
|
|
|
|
|
|
|
|
|
Net loss |
|
|
- |
|
|
|
- |
|
|
|
- |
|
|
|
- |
|
|
|
(168 |
) |
|
|
(168 |
) |
|
Other comprehensive income |
|
|
- |
|
|
|
- |
|
|
|
499 |
|
|
|
- |
|
|
|
- |
|
|
|
499 |
|
|
Stock-based compensation |
|
|
- |
|
|
|
- |
|
|
|
- |
|
|
|
523 |
|
|
|
- |
|
|
|
523 |
|
|
Stock plans |
|
|
68 |
|
|
|
- |
|
|
|
- |
|
|
|
427 |
|
|
|
- |
|
|
|
427 |
|
|
|
|
|
|
|
|
|
|
|
|
|
|
|
|
|
|
|
|
|
|
|
|
|
|
|
|
Balances, June 30, 2017 |
|
|
9,438 |
|
|
$ |
94 |
|
|
$ |
(2,721 |
) |
|
$ |
46,688 |
|
|
$ |
(4,226 |
) |
|
$ |
39,835 |
|
|
|
|
|
|
|
|
|
|
|
|
|
|
|
|
|
|
|
|
|
|
|
|
|
|
|
|
Net income |
|
|
- |
|
|
|
- |
|
|
|
- |
|
|
|
- |
|
|
|
3,716 |
|
|
|
3,716 |
|
|
Other comprehensive income |
|
|
- |
|
|
|
- |
|
|
|
623 |
|
|
|
- |
|
|
|
- |
|
|
|
623 |
|
|
Stock-based compensation |
|
|
- |
|
|
|
- |
|
|
|
- |
|
|
|
697 |
|
|
|
- |
|
|
|
697 |
|
|
Stock plans |
|
|
116 |
|
|
|
2 |
|
|
|
- |
|
|
|
725 |
|
|
|
- |
|
|
|
727 |
|
|
|
|
|
|
|
|
|
|
|
|
|
|
|
|
|
|
|
|
|
|
|
|
|
|
|
|
Balances, June 30, 2018 |
|
|
9,554 |
|
|
$ |
96 |
|
|
$ |
(2,098 |
) |
|
$ |
48,110 |
|
|
$ |
(510 |
) |
|
$ |
45,598 |
|
The notes to the consolidated financial statements are an integral part of these statements.
35
PERCEPTRON, INC. AND SUBSIDIARIES
NOTES TO THE CONSOLIDATED FINANCIAL STATEMENTS
1.Summary of Significant Accounting Policies
Operations
Perceptron, Inc. (“Perceptron” “we”, “us” or “our”) develops, produces and sells a comprehensive range of automated industrial metrology products and solutions to manufacturers for dimensional gauging, dimensional inspection and 3D scanning. Our products provide solutions for manufacturing process control as well as sensor and software technologies for non-contact measurement, scanning and inspection applications. We also offer value added services such as training and customer support.
Basis of Presentation and Principles of Consolidation
The Consolidated Financial Statements and accompanying notes have been prepared in accordance with generally accepted accounting principles in the United States of America (“U.S. GAAP”). Our Consolidated Financial Statements include the accounts of Perceptron and our wholly-owned subsidiaries. All significant intercompany accounts and transactions have been eliminated in consolidation.
Management is required to make certain estimates and assumptions under U.S. GAAP during the preparation of these Consolidated Financial Statements. These estimates and assumptions may affect the reported amounts of assets and liabilities as well as the disclosure of contingent assets and liabilities at the date of the financial statements and the reported amounts of revenues and expenses during the reporting period. Actual results could differ from those estimates.
Revenue Recognition
Revenue related to products and services is recognized upon shipment when title and risk of loss has passed to the customer or upon completion of the service, there is persuasive evidence of an arrangement, the sales price is fixed or determinable, collection of the related receivable is reasonably assured and customer acceptance criteria, if any, have been successfully demonstrated.
We also have multiple element arrangements in our Measurement Solutions product line which may include elements such as: equipment, installation, labor support and/or training. Each element has value on a stand-alone basis and the delivered elements do not include general rights of return. Accordingly, each element is considered a separate unit of accounting. When available, we allocate arrangement consideration to each element in a multiple element arrangement based upon vendor specific objective evidence (“VSOE”) of fair value of the respective elements. When VSOE cannot be established, we attempt to establish the selling price of each element based on relevant third-party evidence. Our products contain a significant level of proprietary technology, customization or differentiation; therefore, comparable pricing of products with similar functionality cannot be obtained. In these cases, we utilize our best estimate of selling price (“BESP”). We determine the BESP for a product or service by considering multiple factors including, but not limited to, pricing practices, internal costs, geographies and gross margin.
For multiple element arrangements, we defer from revenue recognition the greater of the relative fair value of any undelivered elements of the contract or the portion of the sales price of the contract that is not payable until the undelivered elements are completed. As part of this evaluation, we limit the amount of revenue recognized for delivered elements to the amount that is not contingent on the future delivery of products or services, including a consideration of payment terms that delay payment until those future deliveries are completed.
Some multiple element arrangements contain installment payment terms with a final payment (“final buy-off”) due upon the completion of all elements in the arrangement or when the customer’s final acceptance is received. We recognize revenue for each completed element of a contract when it is both earned and realizable. A provision for final customer acceptance generally does not preclude revenue recognition for the delivered equipment element because we rigorously test equipment prior to shipment to ensure it will function in our customer’s environment. The final acceptance amount is assigned to specific element(s) identified in the contract, or if not specified in the contract, to the last element or elements to be delivered that represent an amount at least equal to the final payment amount.
Our Measurement Solutions are designed and configured to meet each customer’s specific requirements. Timing for the delivery of each element in the arrangement is primarily determined by the customer’s requirements and the number of elements ordered. Delivery of all of the multiple elements in an order will typically occur over a three to 15-month period after the order is received. We do not have price protection agreements or requirements to buy back inventory. Our history demonstrates that sales returns have been insignificant.
Research and Development
In the first half of fiscal 2016, in connection with our NMS acquisition, costs incurred after technological feasibility for certain new products were capitalized. In the third quarter of fiscal 2016, we recorded an impairment charge of $694,000 for one of these products. The remaining capitalized costs will continue to be amortized to cost of goods sold over the estimated lives of these products. All other internal research and development costs, including future software development costs, are expensed as incurred, however, when we utilize outside resources to develop certain new products, including software development, costs incurred after technological feasibility will be capitalized.
36
The financial statements of our wholly-owned foreign subsidiaries are translated in accordance with the FASB ASC 830, “Foreign Currency Translation Matters”. The functional currency of most of our non-U.S. subsidiaries is the local currency. Under this standard, translation adjustments are accumulated in a separate component of shareholders’ equity until disposal of the subsidiary. Gains and losses on foreign currency transactions are included in our Consolidated Statement of Operations under “Foreign currency gain (loss), net”.
Earnings Per Share
Basic earnings per share (“EPS”) is calculated by dividing net income by the weighted average number of common shares outstanding during the period. Other obligations, such as stock options and restricted stock awards, are considered to be potentially dilutive common shares. Diluted EPS assumes the issuance of potential dilutive common shares outstanding during the period and adjusts for any changes in income and the repurchase of common shares that would have occurred from the assumed issuance, unless such effect is anti-dilutive. The calculation of diluted shares also takes into effect the average unrecognized non-cash stock-based compensation expense and additional adjustments for tax benefits related to non-cash stock-based compensation expense. Furthermore, we exclude all outstanding options to purchase common stock from the computation of diluted EPS in periods of net losses because the effect is anti-dilutive.
Options to purchase 23,000, 119,000 and 194,000 shares of common stock for the fiscal years ended June 30, 2018, 2017 and 2016, respectively, were not included in the computation of diluted EPS because the effect would have been anti-dilutive.
Cash and Cash Equivalents
We consider all highly liquid investments purchased with maturities of three months or less to be cash equivalents. Fair value approximates carrying value because of the short maturity of the cash equivalents. At June 30, 2018, we had $5,830,000 in cash and cash equivalents of which $4,631,000 was held in foreign bank accounts. We maintain our cash in bank deposit accounts, which, at times, may exceed federally insured limits. We have not experienced any losses in such accounts.
Accounts Receivable and Concentration of Credit Risk
We market and sell our products principally to automotive manufacturers, line builders, system integrators, original equipment manufacturers and value-added resellers. Our accounts receivable are principally from a small number of large customers. We perform ongoing credit evaluations of our customers. Accounts receivable are generally due within 30 to 60 days and are stated at amounts due from customers, net of an allowance for doubtful accounts. Accounts receivable outstanding longer than the contractual payment terms are considered past due. We determine our allowance for doubtful accounts by considering a number of factors, including the length of time trade accounts receivable are past due, our previous loss history, our customers’ current ability to pay their outstanding balance due to us and the condition of the general economy and the industry as a whole. We write-off accounts receivable when they become uncollectible, and payments subsequently received on such receivables are credited to the allowance for doubtful accounts.
Short-Term and Long-Term Investments
We account for our investments in accordance with ASC 320, “Investments – Debt and Equity Securities”. Investments with a term to maturity between three months to one year are considered short-term investments and are classified as available-for-sale investments. Investments with a term to maturity beyond one year may be classified as available for sale if we reasonably expect the investment to be realized in cash or sold or consumed during the normal operating cycle of the business. Investments are classified as held-to-maturity if the term to maturity is greater than one year and we have the intent and ability to hold such investments to maturity. All investments are initially recognized at fair value. Subsequent measurement for available-for-sale investments is recorded at fair value. Unrealized gains and losses on available-for-sale investments are recorded in other comprehensive income. Held-to-maturity investments are subsequently measured at amortized cost. At each balance sheet date, we evaluate all investments for possible other-than-temporary impairment which involves significant judgment. In making this judgment, we review factors such as the length of time and extent to which fair value has been below the cost basis, the anticipated recovery period, the financial condition of the issuer, the credit rating of the instrument and our ability and intent to hold the investment for a period of time which may be sufficient for recovery of the cost basis. Any losses determined to be other-than-temporary are charged as an impairment loss and recorded in earnings. If market, industry, and/or investee conditions deteriorate, future impairments may be incurred.
Inventory
Inventory is stated at the lower of cost or net realizable value using the first-in, first-out (“FIFO”) method. We provide a reserve for obsolescence to recognize inventory impairment for the effects of engineering change orders, age and use of inventory that affect the value of the inventory. The reserve for obsolescence creates a new cost basis for the impaired inventory. When inventory that has previously been impaired is sold or disposed of, the related obsolescence reserve is reduced resulting in the reduced cost basis being reflected in cost of goods sold. A detailed review of the inventory is performed annually with quarterly updates for known changes that have occurred since the annual review.
37
The carrying amounts of our financial instruments, which include cash and cash equivalents, short-term investments, accounts receivable, accounts payable and amounts due to banks or other lenders, approximate their fair values at June 30, 2018 and 2017. See “Short-Term and Long-Term Investments” for a discussion of our investments. Fair values have been determined through information obtained from market sources and management estimates.
We follow the provisions of ASC 820, “Fair Value Measurements and Disclosures” for all financial assets and liabilities as well as nonfinancial assets and liabilities that are recognized or disclosed at fair value in the financial statements on a recurring basis. ASC 820 defines fair value, establishes a framework for measuring fair value and required specific disclosures about fair value measurements. Our financial instruments include investments classified as available for sale, mutual funds, fixed deposits and certificate of deposits at June 30, 2018.
ASC 820 establishes a hierarchy of valuation techniques based upon whether the inputs to those valuation techniques reflect assumptions other market participants would use based upon market data obtained from independent sources (observable inputs), or reflect our assumptions of market participant valuation (unobservable inputs). These two types of inputs create the following fair value hierarchy:
|
|
• |
Level 1 – Quoted prices in active markets that are unadjusted and accessible at the measurement date for identical, unrestricted assets or liabilities. |
|
|
• |
Level 2 – Quoted prices for identical assets and liabilities in markets that are not active, quoted prices for similar assets and liabilities in active markets or financial instruments for which significant inputs are observable, either directly or indirectly. |
|
|
• |
Level 3 – Prices or valuations that require inputs that are both significant to the fair value measurement and unobservable and reflect management’s estimates and assumptions. |
ASC 820 requires the use of observable market data if such data is available without undue cost and effort.
Property and Equipment
Property and equipment are recorded at historical cost. Depreciation related to machinery and equipment and furniture and fixtures is primarily computed on a straight-line basis over estimated useful lives ranging from 3 to 15 years. Depreciation on buildings is computed on a straight-line basis over 40 years. Depreciation on building improvements is computed on a straight-line basis over estimated useful lives ranging from 10 to 15 years. We review our property and equipment for impairment whenever events or changes in circumstances indicate the carrying amount of an asset may not be recoverable. Recoverability of these assets is measured by comparison of their carrying amounts to future undiscounted cash flows the assets are expected to generate. If any of these assets would be considered impaired, the impairment that would be recognized would equal the amount by which the carrying value of the asset exceeds its fair value.
Goodwill
Goodwill represents the excess purchase price over the fair value of the net amounts assigned to assets acquired and liabilities assumed in connection with our acquisitions. Under the Financial Accounting Standards Board (“FASB”) Accounting Standards Codification (“ASC”) Topic 805 “Business Combinations”, we are required to test goodwill for impairment annually, or more frequently whenever events occur or circumstances change that would more likely than not reduce the fair value of a reporting unit with goodwill below its carrying amount. Application of the goodwill impairment test requires judgment, including assignment of assets and liabilities to reporting units, assignment of goodwill to reporting units and determination of the fair value of each reporting unit. The qualitative events or circumstances that could affect the fair value of a reporting unit could include economic conditions; industry and market considerations, including competition; increases in raw materials, labor, or other costs; overall financial performance such as negative or declining cash flows; relevant entity-specific events such as changes in management, key personnel, strategy, or customers; sale or disposition of a significant portion of a reporting unit; and regulatory or political developments.
Companies have the option to evaluate goodwill based upon these qualitative factors, and if it is more likely than not that the fair value of the reporting unit is greater than its carrying amount, then no further goodwill impairment tests are necessary. If the qualitative review indicates it is more likely than not that the fair value of the reporting unit is less than its carrying amount, or if we choose not to perform a qualitative assessment, a quantitative impairment test is performed to identify potential goodwill impairment and measure the amount of goodwill impairment loss to be recognized, if any. During the fourth quarter of fiscal 2018, we elected to complete a quantitative goodwill impairment test, which resulted in no impairment.
In conjunction with our annual goodwill impairment test, we early adopted Accounting Standards Update No. 2017-04, Intangibles – Goodwill and Other: Simplifying the Test for Goodwill Impairment (Topic 350) (ASU 2017-04) as of April 1, 2018, the beginning of our fourth quarter. ASU 2017-04 requires goodwill impairment to be measured as the excess of the carrying value over the fair value of the reporting unit, not to exceed the carrying amount of goodwill. Previously, goodwill impairment was measured as the excess of carrying value over the implied fair value of goodwill. The adoption of ASU 2017-04 had no impact on our financial statements.
38
The quantitative goodwill impairment test contains estimates regarding future revenue growth and expense levels. To the extent that actual results do not meet projected results, it could result in a material impairment to goodwill which could negatively impact our results of operations.
Goodwill is recorded on the local books of Coord3 and NMS and foreign currency effects will impact the balance of goodwill in future periods. As of June 30, 2018 and 2017, our goodwill balance is $7,985,000 and $7,793,000, respectively, with the increase due to the differences in foreign currency rates at June 30, 2018 compared to June 30, 2017.
Intangibles
We acquired intangible assets in addition to goodwill in connection with the acquisitions of Coord3 and NMS in the third quarter of fiscal 2015. Furthermore, we continue to develop intangibles, primarily software. These assets are susceptible to shortened estimated useful lives and changes in fair value due to changes in their use, market or economic changes, or other events or circumstances. We evaluate the potential impairment of these intangible assets whenever events or circumstances indicate their carrying value may not be recoverable. Factors that could trigger an impairment review include historical or projected results that are less than the assumptions used in the original valuation of an intangible asset, a change in our business strategy or our use of an intangible asset or negative economic or industry trends.
If an event or circumstance indicates that the carrying value of an intangible asset may not be recoverable, we assess the recoverability of the asset or asset group by comparing the carrying value of the asset or asset group to the sum of the undiscounted future cash flows that the asset or asset group is expected to generate over its remaining economic life. If the carrying value exceeds the sum of the undiscounted future cash flows, we compare the fair value of the intangible asset or asset group to the carrying value and record an impairment loss for the difference. We generally estimate the fair value of our intangible assets or asset groups using the income approach based upon a discounted cash flow model. The income approach requires the use of many assumptions and estimates including future revenues and expenses, discount factors, income tax rates, the identification of groups of assets with highly independent cash flows and assets’ economic lives. Volatility in the global economy makes these assumptions and estimates more judgmental. Actual future operating results and remaining economic lives of our intangible assets could differ from those used in assessing the recoverability of these assets and could result in an impairment of our intangible assets in future periods, negatively impacting our financial position and results of operations. There were no impairment of our intangibles during fiscal years ended June 30, 2018 and 2017, respectively.
The amortization periods for customer/distributor relationships, trade name and software are five years, ten years and five years, respectively.
Deferred Income Taxes
Deferred tax assets and liabilities are recognized for the future tax consequences attributable to differences between the financial statement carrying amounts of existing assets and liabilities and their respective tax basis and the effects of operating losses and tax credit carry-forwards. Deferred tax assets and liabilities are measured using enacted tax rates expected to apply to taxable income in the years in which those temporary differences are expected to be recovered or settled. The effect on deferred tax assets and liabilities of a change in tax rates is recognized in income in the period that includes the enactment date. A valuation allowance is provided for deferred tax assets if it is more likely than not that these items will either expire before we are able to realize their benefit or future deductibility is uncertain (see Note 18 “Income Taxes” for further discussion).
Warranty
Our In-Line and Near-Line Measurement Solutions generally carry a one to three-year warranty for parts and a one-year warranty for labor and travel related to warranty. Product sales to the forest products industry carry a three-year warranty for TriCam® sensors. Sales of ScanWorks® have a one-year warranty for parts. Sales of WheelWorks® products have a two-year warranty for parts. Our Off-Line Measurement Solutions generally carry a twelve-month warranty after the machine passes the acceptance test or a fifteen-month warranty from the date of shipment, whichever date comes first, on parts only. We provide a reserve for warranty based on our experience and knowledge.
Factors affecting our warranty reserve include the number of units sold or in-service as well as historical and anticipated rates of claims and cost per claim. We periodically assess the adequacy of our warranty reserve based on changes in these factors. If a special circumstance arises which requires a higher level of warranty, we make a special warranty provision commensurate with the facts.
Self–Insurance
Since January 1, 2017, we have used a fully-insured model for health and vision coverages we offer our U.S employees. We are currently self-insured for any short-term disability claims we may have outstanding.
39
In May 2014, the Financial Accounting Standards Board (“FASB”) issued Accounting Standards Update No. 2014-09, Revenue from Contracts with Customers (ASU 2014-09), which supersedes nearly all existing revenue recognition guidance under U.S. GAAP. The core principle of ASU 2014-09 is to recognize revenues when promised goods or services are transferred to customers in an amount that reflects the consideration to which an entity expects to be entitled for those goods or services. ASU 2014-09 defines a five step process to achieve this core principle and, in doing so, more judgment and estimates may be required within the revenue recognition process than are required under existing U.S. GAAP. In March 2016, the FASB issued the final guidance to clarify the principal versus agent guidance (i.e., whether an entity should report revenue gross or net). In April 2016, the FASB issued final guidance to clarify identifying performance obligation and the licensing implementation guidance. In May 2016, FASB updated the guidance in ASU No. 2014-09, which updated implementation of certain narrow topics within ASU 2014-09. Finally, in December 2016, the FASB issued several technical corrections and improvements, which clarify the previously issued standards and corrected unintended application of previous guidance. These standards (collectively “ASC 606”) will be effective for annual periods beginning after December 15, 2017 (as amended in August 2015, by ASU 2015-14, Deferral of the Effective Date), and interim periods therein, using either of the following transition methods: (i) a full retrospective approach reflecting the applications of the standard in each prior reporting period with the option to elect certain practical expedients, or (ii) a retrospective approach with the cumulative effect of initially adopting ASU 2014-09 recognized at the date of adoption (which includes additional footnote disclosures). We will adopt the new standard effective July 1, 2018 using the modified retrospective transition method with the cumulative effect recorded to the opening balance of retained earnings as of the date of adoption. We have established a project management team to analyze the impact of the new standard. The team has evaluated our different revenue streams and reviewed representative contracts with customers to identify if there are differences that would result from the application of the new standard as compared to our current accounting policies and practices. Certain services will be recognized over time instead of at a point in time upon completion of those services under current guidance. Additionally, for our multiple element contracts in which the payment terms do not correspond with performance, we will no longer be required to limit the revenue recognized for delivered elements to the amount that is not contingent on the future delivery of products or services. Instead, we will record revenue for each of the performance obligations as control transfers to the customers, which will generally accelerate the revenue recognized for such contracts. We will also capitalize amounts related to certain commissions paid which qualify as “costs to obtain a contract”. We are finalizing the quantification of the effects on our consolidated financial statements. We anticipate that a new positive transition adjustment will be recorded to retained earnings at July 1, 2018 between the amounts of $1.8 million and $2.3 million. We have also implemented new business processes and internal controls in order to recognize revenue in accordance with the new standard.
In January 2016, the FASB issued Accounting Standards Update No. 2016-01, Financial Instruments – Overall (Subtopic 825-10): Recognition and Measurement of Financial Assets and Financial Liabilities (ASU 2016-01), which amends certain aspects of recognition, measurement, presentation and disclosure of financial instruments. In February 2018, the FASB issued Accounting Standards Update No. 2018-03 —Technical Corrections and Improvements to Financial Instruments—Overall (Subtopic 825-10): Recognition and Measurement of Financial Assets and Financial Liabilities (ASU 2018-03), which contains technical corrections and improvements related to ASU 2016-01. Both ASU 2016-01 and ASU 2018-03, are effective for Perceptron on July 1, 2018 and are not expected to have a significant impact on our consolidated financial statements or disclosures.
In February 2016, the FASB issued Accounting Standards Update No. 2016-02 Leases (ASU 2016-2), which establishes a right-of-use (ROU) model that requires a lessee to record a ROU asset and a lease liability on the balance sheet for all leases with terms longer than 12 months. ASU 2016-02 is effective for fiscal years beginning after December 15, 2018, including interim periods within those fiscal years, with early adoption permitted. A modified retrospective transition approach is required for lessees with capital and operating leases existing at, or entered into after, the beginning of the earliest comparative period presented in the financial statements. In January 2018, the FASB issued Accounting Standards Update No. 2018-01, Leases (Topic 842): Land Easement Practical Expedient for Transition to Topic 842, which permits an entity to elect an optional transition practical expedient to not evaluate land easements under Topic 842. In July 2018, the FASB issued Accounting Standards Updates No. 2018-11 and 2018-10, Leases (Topic 842): Targeted Improvements and Codification Improvements to Topic 842, Leases. Both of these ASUs are effective at the same time as when we adopt ASU 2016-02. We are currently evaluating the impact of the adoption of ASU 2016-02 and the related Updates on our consolidated financial statements.
In June 2016, the FASB issued Accounting Standards Update No. 2016-13, Financial Instruments – Credit Losses (Topic 326) (ASU 2016-13), which requires the measurement of all expected credit losses for financial assets held at the reporting date to be based on historical experience, current conditions as well as reasonable and supportable forecasts. ASU 2016-13 is effective for fiscal years beginning after December 15, 2019 including interim periods within those fiscal years, with early adoption permitted. We are currently evaluating the impact of the adoption of ASU 2016-13 on our consolidated financial statements.
In August 2016, the FASB issued Accounting Standards Update No. 2016-15, Statement of Cash Flows (Topic 230): Classification of Certain Cash Receipts and Cash Payments (ASU 2016-15), which will make eight targeted changes to how cash receipts and cash payments are presented and classified in the statement of cash flows. ASU 2016-15 is effective for Perceptron beginning on July 1, 2018 and requires us to utilize a retrospective adoption unless it is impracticable for us to apply, in which case, we would be required to apply the amendment prospectively as of the earliest date practicable. ASU 2016-15 is not expected to have a significant impact on our consolidated financial statements or disclosures.
40
In October 2016, the FASB issued Accounting Standards Update No. 2016-16, Income Taxes (Topic 740): Intra-Entity Transfers of Assets Other Than Inventory (ASU 2016-16), which requires that an entity should recognize the income tax consequences of an intra-entity transfer of an asset other than inventory when the transfer occurs. ASU 2016-16 is effective for annual reporting periods beginning after December 15, 2017, with early adoption permitted as of the beginning of an annual reporting period for which financial statements (interim or annual) have not been issued or made available for issuance. ASU 2016-16 is effective for Perceptron on July 1, 2018 and is not expected to have a significant impact on our consolidated financial statements.
In November 2016, the FASB issued Accounting Standards Update No. 2016-18, Statement of Cash Flows (Topic 230): Restricted Cash (ASU 2016-18), which requires a company to present their Statement of Cash Flows including amounts generally described as restricted cash or restricted cash equivalents with cash and cash equivalents when reconciling the beginning-of-period and end-of-period total amounts shown on the statement of cash flows. ASU 2016-18 is effective for annual reporting periods beginning after December 15, 2017, with early adoption permitted. We hold restricted cash in short-term bank guarantees to provide financial assurance that we will fulfill certain customer obligations in China. These balances are currently part of ‘Short-term investments’ on our Consolidated Balance Sheet and the movement is part of ‘Purchases of short-term investments’ and ‘Sales of short-term investments’ in the investing activities section of our Consolidated Statement of Cash Flow. This balance will be reclassified into “Cash and cash equivalents” on our Consolidated Balance Sheet as of July 1, 2018 and will no longer be considered an investing activity on our Consolidated Statement of Cash Flow.
In January 2017, the FASB issued Accounting Standards Update No. 2017-01, Business Combinations (Topic 805): Clarifying the Definition of a Business (ASU 2017-01), which clarifies the definition of a business with the objective of adding guidance to assist entities with evaluating whether transactions should be accounted for as acquisitions (or disposals) of assets or businesses. ASU 2017-01 is effective for Perceptron on July 1, 2018 and is not expected to have a significant impact on our consolidated financial statements or disclosures.
In February 2017, the FASB issued Accounting Standards Update No. 2017-05, Other Income—Gains and Losses from the Derecognition of Nonfinancial Assets (ASU 2017-05), which clarifies the scope of Subtopic 610-20 and adds guidance for partial sales of nonfinancial assets. Subtopic 610-20, which was issued in May 2014 as a part of Accounting Standards Update No. 2014-09, provides guidance for recognizing gains and losses from the transfer of nonfinancial assets in contracts with noncustomers. ASU 2017-05 is effective for annual reporting periods beginning after December 15, 2017, including interim periods within that reporting period with early application permitted only as of annual reporting periods beginning after December 15, 2016. We do not expect ASU 2017-05 to have a significant impact on our consolidated financial statements or disclosures.
In May 2017, the FASB issued Accounting Standards Update No. 2017-09, Compensation—Stock Compensation (Topic 718): Scope of Modification Accounting (ASU 2017-09), which provide clarity and reduce both (1) diversity in practice and (2) cost and complexity when applying the guidance in Topic 718, Compensation—Stock Compensation, to a change to the terms or conditions of a share-based payment award. ASU 2017-09 is effective for annual periods, and interim periods within those annual periods, beginning after December 15, 2017. We do not expect ASU 2017-09 to have a significant impact on our consolidated financial statements or disclosures.
In February 2018, the FASB issued Accounting Standards Update 2018-02—Income Statement—Reporting Comprehensive Income (Topic 220): Reclassification of Certain Tax Effects from Accumulated Other Comprehensive Income (ASU 2018-02), which allows for a reclassification from accumulated other comprehensive income to retained earnings for stranded tax effects resulting from the Tax Cuts and Jobs Act. ASU 2018-02 is effective for Perceptron on July 1, 2019 and is not expected to have a significant impact on our consolidated financial statements or disclosures.
In July 2018, the FASB issued Accounting Standards Update No. 2018-09, Codification Improvements (ASU 2018-09), which clarifies, corrects and makes minor improvements a wide variety of Topics in the Codification. The amendments make the Codification easier to understand and apply by eliminating inconsistencies and providing clarifications. The transition and effective dates is based on the facts and circumstances of each amendment, including some amendments that will be effective upon issuance of the Update and many of them will be effective for annual periods beginning after December 31, 2018. We are currently evaluating the impact of the adoption of ASU 2018-09 on our consolidated financial statements and disclosures.
Recently Adopted Accounting Pronouncements
In July 2015, the FASB issued Accounting Standards Update No. 2015-11, Simplifying the Measurement of Inventory (ASU 2015-11), which requires an entity to measure inventory at the lower of cost and net realizable value. Net realizable value is defined as the estimated selling prices in the ordinary course of business, less reasonably predictable costs of completion, disposal, and transportation. We adopted this standard on July 1, 2017. Adoption of this guidance did not have a material impact on our consolidated financial statements.
In November 2015, the FASB issued Accounting Standards Update No. 2015-17, Balance Sheet Classification of Deferred Taxes (ASU 2015-17), which requires all deferred tax assets and liabilities, including related valuation allowances, be classified as non-current on our consolidated balance sheets. We adopted this standard on July 1, 2017, and as a result, reclassified $438,000 of previously “Short-term deferred income tax assets” to “Long-Term Deferred Income Tax Asset” and reclassified $752,000 of previously “Short-term deferred income tax liability” to “Long-Term Deferred Income Tax Liability” on our consolidated balance sheet. Our Consolidated Balance Sheets as of June 30, 2017 and 2016 were not retrospectively adjusted.
41
In March 2016, the FASB issued Accounting Standards Update No. 2016-09, Compensation - Stock Compensation (Topic 718) (ASU 2016-09), which simplifies several aspects of accounting for share-based payment award transactions, including income tax consequences, classification of awards as either equity or liabilities and classification on the statement of cash flows. Certain of these changes are required to be applied retrospectively, while other changes are required to be applied prospectively. We adopted this standard on July 1, 2017. ASU 2016-09 requires prospective recognition of excess tax benefits and deficiencies in the income statement. Due to the fact that our U.S. Federal Deferred Taxes have a full valuation allowance, there was no net impact to our consolidated financial statements related to our adoption of ASU 2016-09. We elected to continue to estimate forfeiture rates at the time of grant, instead of accounting for them as they occur. Finally, as excess tax benefits are no longer recognized in additional paid-in capital, we excluded the excess tax benefits from the assumed proceeds available to repurchase shares in the computation of diluted earnings per share for the fiscal year ended June 30, 2018.
In January 2017, the FASB issued Accounting Standards Update No. 2017-04, Intangibles—Goodwill and Other: Simplifying the Test for Goodwill Impairment (ASU 2017-04). ASU. 2017-04 simplified wording and removes Step 2 of the Goodwill Impairment Test. A goodwill impairment will now be the amount by which a reporting unit’s carrying value exceeds its fair value, not to exceed the carrying amount of goodwill. ASU 2017-04 is effective for annual reporting periods beginning after December 15, 2019 with early adoption permitted for interim or annual goodwill impairment tests performed on testing dates after January 1, 2017. We adopted this standard on April 1, 2018, in conjunction with our annual goodwill impairment test for fiscal 2018. Adoption of this guidance did not have a material impact on our consolidated financial statements.
2.Information About Major Customers
Our sales efforts for in-line and near-line products are led by account teams that focus on automotive OEMs. These products are typically purchased for installation in connection with retooling programs undertaken by these companies. Because sales are dependent on the timing of customers’ retooling programs, sales by customer vary significantly from year to year, as do our largest customers.
For the fiscal years 2018, 2017 and 2016, approximately 41%, 36% and 34%, respectively, of our “Net Sales” on our Consolidated Statements of Operations were derived from sales directly to our four largest automotive end-user customers. We also sell to manufacturing line builders, system integrators or assembly equipment manufacturers, who in turn sell to our automotive customers. For the fiscal years 2018, 2017 and 2016, approximately 7%, 11% and 8%, respectively, of net sales were to manufacturing line builders, system integrators and original equipment manufacturers for the benefit of the same four largest automotive end user customers in each respective year. During the fiscal years ended June 30, 2018, 2017 and 2016, direct sales to General Motors Company accounted for approximately 17%, 14% and 12%, respectively of our total net sales and Volkswagen Group accounted for approximately 15%, 16% and 17%, respectively of our total net sales.
3.Allowance for Doubtful Accounts
Changes in our allowance for doubtful accounts are as follows (in thousands):
|
|
|
Beginning |
|
|
Costs and |
|
|
|
|
|
|
Ending |
|
|||
|
|
|
Balance |
|
|
Expenses |
|
|
Charge-offs |
|
|
Balance |
|
||||
|
Fiscal year ended June 30, 2018 |
|
$ |
253 |
|
|
$ |
195 |
|
|
$ |
(44 |
) |
|
$ |
404 |
|
|
Fiscal year ended June 30, 2017 |
|
$ |
269 |
|
|
$ |
22 |
|
|
$ |
(38 |
) |
|
$ |
253 |
|
|
Fiscal year ended June 30, 2016 |
|
$ |
214 |
|
|
$ |
137 |
|
|
$ |
(82 |
) |
|
$ |
269 |
|
4.Inventory
Inventory, net of reserves of $2,115,000 and $1,918,000 at June 30, 2018 and June 30, 2017, respectively, is comprised of the following (in thousands):
|
|
|
June 30, 2018 |
|
|
June 30, 2017 |
|
||
|
Component parts |
|
$ |
5,156 |
|
|
$ |
4,445 |
|
|
Work in process |
|
|
3,525 |
|
|
|
3,864 |
|
|
Finished goods |
|
|
5,148 |
|
|
|
3,157 |
|
|
Total |
|
$ |
13,829 |
|
|
$ |
11,466 |
|
Changes in our reserve for obsolescence is as follows (in thousands):
|
|
|
Beginning |
|
|
Costs and |
|
|
|
|
|
|
Ending |
|
|||
|
|
|
Balance |
|
|
Expenses |
|
|
Charge-offs |
|
|
Balance |
|
||||
|
Fiscal year ended June 30, 2018 |
|
$ |
1,918 |
|
|
$ |
785 |
|
|
|
(588 |
) |
|
$ |
2,115 |
|
|
Fiscal year ended June 30, 2017 |
|
$ |
1,608 |
|
|
$ |
375 |
|
|
$ |
(65 |
) |
|
$ |
1,918 |
|
|
Fiscal year ended June 30, 2016 |
|
$ |
1,436 |
|
|
$ |
465 |
|
|
$ |
(293 |
) |
|
$ |
1,608 |
|
42
Our intangible assets as of June 30, 2018 and 2017 are as follows (in thousands):
|
|
|
June 30, 2018 |
|
|
June 30, 2017 |
|
||||||||||||||||||
|
|
|
Gross |
|
|
|
|
|
|
Net |
|
|
Gross |
|
|
|
|
|
|
Net |
|
||||
|
|
|
Carrying |
|
|
Accumulated |
|
|
Carrying |
|
|
Carrying |
|
|
Accumulated |
|
|
Carrying |
|
||||||
|
|
|
Amount |
|
|
Amortization |
|
|
Amount |
|
|
Amount |
|
|
Amortization |
|
|
Amount |
|
||||||
|
Customer/Distributor Relationships |
|
$ |
3,329 |
|
|
$ |
(2,219 |
) |
|
$ |
1,110 |
|
|
$ |
3,263 |
|
|
$ |
(1,524 |
) |
|
$ |
1,739 |
|
|
Trade Name |
|
|
2,586 |
|
|
|
(862 |
) |
|
|
1,724 |
|
|
|
2,533 |
|
|
|
(591 |
) |
|
|
1,942 |
|
|
Software |
|
|
1,490 |
|
|
|
(504 |
) |
|
|
986 |
|
|
|
677 |
|
|
|
(312 |
) |
|
|
365 |
|
|
Other |
|
|
124 |
|
|
|
(124 |
) |
|
|
— |
|
|
|
121 |
|
|
|
(94 |
) |
|
|
27 |
|
|
Total |
|
$ |
7,529 |
|
|
$ |
(3,709 |
) |
|
$ |
3,820 |
|
|
$ |
6,594 |
|
|
$ |
(2,521 |
) |
|
$ |
4,073 |
|
Amortization expense for the fiscal years ended June 30, 2018, 2017 and 2016 was $1,168,000, $1,073,000 and $1,121,000, respectively.
The estimated amortization of the remaining intangible assets by year is as follows (in thousands):
|
Years Ending June 30, |
|
Amount |
|
|
|
2019 |
|
|
1,229 |
|
|
2020 |
|
|
865 |
|
|
2021 |
|
|
421 |
|
|
2022 |
|
|
421 |
|
|
2023 |
|
|
377 |
|
|
after 2023 |
|
|
507 |
|
|
|
|
$ |
3,820 |
|
Collectively, the weighted average amortization period of intangible assets subject to amortization is approximately 3.1 years. The intangible assets are amortized over the period of economic benefit or on a straight line basis.
6.Short-Term and Long-Term Investments
As of June 30, 2018 and 2017, we held restricted cash in short-term bank guarantees. The restricted cash provides financial assurance that we will fulfill certain customer obligations in China. The cash is restricted as to withdrawal or use while the related bank guarantee is outstanding. Interest is earned on the restricted cash and recorded as interest income. As of June 30, 2018 and June 30, 2017 we had short-term bank guarantees of $166,000 and $239,000 respectively.
At June 30, 2018, we held a long-term investment in preferred stock that is not registered under the Securities Act of 1933, as amended and may not be offered or sold in the United States absent registration or an applicable exemption from registration requirements. The preferred stock investment is currently recorded at $725,000 after consideration of impairment charges recorded in fiscal 2008 and 2009. We estimated that the fair market value of this investment at June 30, 2018 exceeded $725,000 based on an internal valuation model which included the use of a discounted cash flow model. The fair market analysis considered the following key inputs:
|
|
(i) |
the underlying structure of the security; |
|
|
(ii) |
the present value of the future principal discounted at rates considered to reflect current market conditions; and |
|
|
(iii) |
the time horizon that the market value of the security could return to its cost and be sold. |
Under ASC 820, “Fair Value Measurements” (“ASC 820”) such valuation assumptions are defined as Level 3 inputs.
43
The following table presents our Short-Term and Long-Term Investments by category at June 30, 2018 and 2017 (in thousands):
|
|
|
June 30, 2018 |
|
|||||
|
Short-Term Investments |
|
Cost |
|
|
Fair Value or Carrying Value |
|
||
|
Bank Guarantees |
|
$ |
166 |
|
|
$ |
166 |
|
|
Mutual Funds |
|
|
23 |
|
|
|
23 |
|
|
Time/Fixed Deposits |
|
|
688 |
|
|
|
688 |
|
|
Total Short-Term Investments |
|
$ |
877 |
|
|
$ |
877 |
|
|
|
|
|
|
|
|
|
|
|
|
Long-Term Investments |
|
|
|
|
|
|
|
|
|
Preferred Stock |
|
$ |
3,700 |
|
|
$ |
725 |
|
|
Total Long-Term Investments |
|
$ |
3,700 |
|
|
$ |
725 |
|
|
|
|
|
|
|
|
|
|
|
|
Total Investments |
|
$ |
4,577 |
|
|
$ |
1,602 |
|
|
|
|
|
|
|
|
|
|
|
|
|
|
June 30, 2017 |
|
|||||
|
Short-Term Investments |
|
Cost |
|
|
Fair Value or Carrying Value |
|
||
|
Bank Guarantees |
|
$ |
239 |
|
|
$ |
239 |
|
|
Time/Fixed Deposits |
|
|
1,333 |
|
|
|
1,333 |
|
|
Total Short-Term Investments |
|
$ |
1,572 |
|
|
$ |
1,572 |
|
|
|
|
|
|
|
|
|
|
|
|
Long-Term Investments |
|
|
|
|
|
|
|
|
|
Preferred Stock |
|
$ |
3,700 |
|
|
$ |
725 |
|
|
Total Long-Term Investments |
|
$ |
3,700 |
|
|
$ |
725 |
|
|
|
|
|
|
|
|
|
|
|
|
Total Investments |
|
$ |
5,272 |
|
|
$ |
2,297 |
|
7.Financial Instruments
The following table presents our investments at June 30, 2018 and 2017 that are measured and recorded at fair value on a recurring basis consistent with the fair value hierarchy provisions of ASC 820 (in thousands). The fair value of our short-term investments approximates their cost basis.
|
Description |
|
June 30, 2018 |
|
|
Level 1 |
|
|
Level 2 |
|
|
Level 3 |
|
||||
|
Mutual funds |
|
$ |
23 |
|
|
$ |
23 |
|
|
$ |
- |
|
|
$ |
- |
|
|
Time/Fixed Deposits and Bank Guarantees |
|
|
854 |
|
|
|
- |
|
|
|
854 |
|
|
|
- |
|
|
Preferred Stock |
|
|
725 |
|
|
|
- |
|
|
|
- |
|
|
|
725 |
|
|
Total |
|
$ |
1,602 |
|
|
$ |
23 |
|
|
$ |
854 |
|
|
$ |
725 |
|
|
|
|
|
|
|
|
|
|
|
|
|
|
|
|
|
|
|
|
Description |
|
June 30, 2017 |
|
|
Level 1 |
|
|
Level 2 |
|
|
Level 3 |
|
||||
|
Time/Fixed Deposits and Bank Guarantees |
|
$ |
1,572 |
|
|
$ |
- |
|
|
$ |
1,572 |
|
|
$ |
- |
|
|
Preferred Stock |
|
|
725 |
|
|
|
- |
|
|
|
- |
|
|
|
725 |
|
|
Total |
|
$ |
2,297 |
|
|
$ |
- |
|
|
$ |
1,572 |
|
|
$ |
725 |
|
Fair value estimates are made at a specific point in time based on relevant market information and information about the financial instrument. These estimates are subjective in nature and involve uncertainties and matters of significant judgment and therefore, cannot be determined with precision. Changes in assumptions could significantly affect these estimates. During fiscal years 2018 and 2017, we did not record any other-than-temporary impairments on our financial assets required to be measured on a recurring basis.
44
Changes to our warranty reserve is as follows (in thousands):
|
|
|
Beginning |
|
|
Accruals - |
|
|
Settlements/Claims |
|
|
Effect of Foreign |
|
|
Ending |
|
|||||
|
|
|
Balance |
|
|
Current Year |
|
|
(in cash or in kind) |
|
|
Currency |
|
|
Balance |
|
|||||
|
Fiscal year ended June 30, 2018 |
|
$ |
548 |
|
|
$ |
844 |
|
|
$ |
(1,006 |
) |
|
$ |
5 |
|
|
$ |
391 |
|
|
Fiscal year ended June 30, 2017 |
|
$ |
370 |
|
|
$ |
631 |
|
|
$ |
(453 |
) |
|
$ |
— |
|
|
$ |
548 |
|
|
Fiscal year ended June 30, 2016 |
|
$ |
192 |
|
|
$ |
451 |
|
|
$ |
(272 |
) |
|
$ |
(1 |
) |
|
$ |
370 |
|
9.Property and Equipment
Our property and equipment consisted of the following as of June 30, 2018 and 2017 (in thousands):
|
|
|
|
|
|
|
|
|
|
|
|
|
June 30, 2018 |
|
|
June 30, 2017 |
|
||
|
Building and Land |
|
$ |
7,844 |
|
|
$ |
7,788 |
|
|
Machinery and Equipment |
|
|
14,578 |
|
|
|
16,414 |
|
|
Furniture and Fixtures |
|
|
1,060 |
|
|
|
1,054 |
|
|
Total Property and Equipment, gross |
|
|
23,482 |
|
|
|
25,256 |
|
|
Less: Accumulated Depreciation |
|
|
(16,869 |
) |
|
|
(17,879 |
) |
|
Total Property and Equipment, net |
|
$ |
6,613 |
|
|
$ |
7,377 |
|
Depreciation expense for the years ended June 30, 2018, 2017, and 2016 was $1,108,000, $1,121,000, and $1,016,000, respectively.
10.Severance, Impairment and Other Charges
During the third quarter of fiscal 2016, we announced a financial improvement plan that resulted in a reduction in global headcount of approximately 11%. This plan was implemented to re-align our fixed costs with our near-to mid-term expectations for our business. In addition, during the first quarter of fiscal 2017, we decided to terminate production and marketing of a specific product line due to limitations in its design. Since this decision was made, we have written off $290,000, net related to inventory and impaired certain customer receivable balances in the amount of $127,000. By the second quarter of fiscal 2018, we had substantially completed the plan that was announced; we incurred total pre-tax cash and non-cash charges related to the original restructuring plan, as well as the additional charges from the terminated product line, of $3,531,000.
In July 2017, we entered into an agreement to settle the civil suit that was filed by 3CEMS, a Cayman Island and People’s Republic of China corporation, in January 2015 (see Note 14 “Commitments and Contingencies – Legal Proceedings” for further discussion). The settlement of $1,000,000 was recorded as expense in fiscal 2017.
In January 2018, a judge in a trade secrets case brought by Perceptron granted the defendants’ motions for recovery of their attorney fees (see Note 14 “Commitments and Contingencies – Legal Proceedings” for further discussion relating to this matter). A charge in the amount of $675,000 was recorded as a liability in the second quarter of fiscal 2018. We have appealed the court’s decision to grant summary disposition and the award of the attorney fees.
The charges recorded as Severance, Impairment and Other Charges are as follows (in thousands):
|
|
|
Fiscal Years Ended June 30, |
|
|||||||||
|
|
|
2018 |
|
|
2017 |
|
|
2016 |
|
|||
|
Severance and Related Costs |
|
$ |
(13 |
) |
|
$ |
301 |
|
|
$ |
1,968 |
|
|
Court Award |
|
|
675 |
|
|
|
- |
|
|
|
- |
|
|
Legal Settlement |
|
|
- |
|
|
|
1,000 |
|
|
|
- |
|
|
Impairment |
|
|
(42 |
) |
|
|
169 |
|
|
|
694 |
|
|
Inventory Write-Off |
|
|
(17 |
) |
|
|
307 |
|
|
|
164 |
|
|
Total |
|
$ |
603 |
|
|
$ |
1,777 |
|
|
$ |
2,826 |
|
Severance expense for the fiscal year ended June 30, 2018 was associated with adjustments at our China (income of $15,000) and U.S. (expense of $2,000) locations as we reached final settlements related to several individuals impacted by the reduction in force. The decrease in the impairment for the fiscal year ended June 30, 2018 was due to a collection of an accounts receivable balance that was previously written off. The decrease of the inventory write-off was due to finding other uses for some of the inventory originally designated as impaired.
45
Severance expense for the fiscal year ended June 30, 2017 was associated with adjustments at our U.S. location (expense of $312,000), our China location (expense of $82,000) and our German location (income of $93,000), primarily as we reached final settlements related to several individuals impacted by the reduction in force.
Severance expense for the fiscal year ended June 30, 2016 was associated with a reduction in force at our U.S. location ($1,395,000), our German location ($472,000) and our China location ($101,000). We also recorded an impairment charge of previously capitalized software and wrote-off inventory in the amount of $858,000 related to a product line that was discontinued in the third quarter of fiscal 2016.
The following table reconciles the activity for the Reserve for Restructuring and Other Charges (in thousands):
|
|
|
2018 |
|
|
2017 |
|
||
|
Balance at June 30 |
|
$ |
1,113 |
|
|
$ |
814 |
|
|
Accruals - Severance Related |
|
|
(13 |
) |
|
|
301 |
|
|
Accruals - Court Award |
|
|
675 |
|
|
|
- |
|
|
Accruals - Legal Settlement |
|
|
- |
|
|
|
1,000 |
|
|
Payments |
|
|
(1,100 |
) |
|
|
(1,002 |
) |
|
Balance at June 30, |
|
$ |
675 |
|
|
$ |
1,113 |
|
The remaining accrued balance at June 30, 2018 is the accrual for the judgment related to the trade secrets case. Due to our appeal of the court decisions in this case, the timing of any payments related to this matter is unknown to us at this time.
11.Credit Facilities
We had approximately $175,000 and $1,705,000 outstanding under our lines of credit and short-term notes payable at June 30, 2018 and 2017, respectively. In addition, we had zero and $171,000 in long-term debt outstanding included in ‘Other Long-Term Liabilities’ at June 30, 2018 and 2017, respectively, on our Consolidated Balance Sheet.
On December 4, 2017, we entered into a Loan Agreement (the “Loan Agreement”) with Chemical Bank (“Chemical”), and related documents, including a Promissory Note. The Loan Agreement is an on-demand line of credit and is cancelable at any time by either Perceptron or Chemical and any amounts outstanding would be immediately due and payable. The Loan Agreement is guaranteed by our U.S. subsidiaries. The Loan Agreement allows for maximum permitted borrowings of $8.0 million. The borrowing base is calculated at the lesser of (i) $8.0 million or (ii) the sum of 80% of eligible accounts receivable balances of U.S. customers, and subject to limitations, certain foreign customers, plus the lesser of 50% of eligible inventory or $3.0 million. At June 30, 2018, our additional available borrowing under this facility was approximately $6.8 million. Security for the Loan Agreement is substantially all of our assets in the U.S. Interest is calculated at 2.65% above the 30 day LIBOR Rate. We are not allowed to pay cash dividends under the Loan Agreement. We had zero in borrowings outstanding under the Loan Agreement at June 30, 2018.
Prior to December 4, 2017, we were party to an Amended and Restated Credit Agreement with Comerica Bank. We had $1,500,000 outstanding at June 30, 2017 under this agreement. On December 4, 2017, in connection with entering into the Loan Agreement, we repaid in full and terminated our Amended and Restated Credit Agreement with Comerica Bank and related documents. There were no prepayment fees payable in connection with the repayment of the loan.
During the third quarter of fiscal 2016, our Italian subsidiary, Coord3, exercised an option to purchase their current manufacturing facility. The total remaining principal payments of €150,000 (equivalent to approximately $175,000) payable over the next 10 months at a 7.0% annual interest rate are recorded in “Lines of credit and short-term notes payable” on our Consolidated Balance Sheet at June 30, 2018.
Our Brazilian subsidiary (“Brazil”) has a credit line and overdraft facility with their local bank. Brazil can borrow a total of B$200,000 (equivalent to approximately $52,000). This Brazil facility is cancelable at any time by either Brazil or the bank and any amount then outstanding would become immediately due and payable. The monthly interest rate for the current facility is 12.30%. Brazil previously had two additional credit lines that were cancelled in June 2018. We had no borrowings under these facilities at June 30, 2018 and 2017, respectively.
12.Current and Long-Term Taxes Payable
We acquired current and long-term taxes payable as part of the purchase of Coord3. The tax liabilities represent income and payroll related taxes that are payable in accordance with government authorized installment payment plans. These installment plans require varying monthly payments through January 2021.
13.Other Long-Term Liabilities
Other long-term liabilities at June 30, 2018 and 2017 include $601,000 and $614,000, respectively for long-term contractual and statutory severance liabilities acquired as part of the purchase of Coord3 that represent amounts that will be payable to employees upon termination of employment.
46
14.Commitments and Contingencies
Leases
We lease building space, office equipment and motor vehicles under operating leases. Lease terms generally cover periods from two to five years and may contain renewal options. The following is a summary, as of June 30, 2018, of the future minimum annual lease payments required under our operating leases having initial or remaining non-cancelable terms in excess of one year (in thousands):
|
Years Ending June 30, |
|
Minimum Rentals |
|
|
|
2019 |
|
$ |
966 |
|
|
2020 |
|
|
573 |
|
|
2021 |
|
|
371 |
|
|
2022 |
|
|
177 |
|
|
2023 and beyond |
|
|
- |
|
|
|
|
$ |
2,087 |
|
Rental expenses for operating leases in the fiscal years ended June 30, 2018, 2017 and 2016 were $884,000, $943,000 and $1,097,000, respectively.
Legal Proceedings
We may, from time to time, be subject to litigation and other claims in the ordinary course of our business. We accrue for estimated losses arising from such litigation or claims if it is probable that an asset has been impaired or a liability has been incurred and the amount of the loss can be reasonably estimated. To estimate whether a loss contingency should be accrued by a charge to income, we evaluate, among other factors, the degree of probability of an unfavorable outcome and the ability to make a reasonable estimate of the amount of the loss. Since the outcome of litigation and claims is subject to significant uncertainty, changes in the factors used in our evaluation could materially impact our financial position or results of operations.
We were a party to a civil suit filed by 3CEMS, a Cayman Islands and People’s Republic of China corporation, in the U.S. District Court for the Eastern District of Michigan and served on us on or about January 7, 2015. The suit alleged that we breached our contractual obligations by failing to pay for component parts to be used to manufacture optical video scopes for our discontinued Commercial Products Business Unit. 3CEMS alleged that it purchased the component parts in advance of the receipt of orders based upon instructions they claimed to have received from us. The suit alleged damages of not less than $4.0 million. In July 2017, we entered into an agreement with 3CEMS to settle this suit and recorded the expense in the fourth quarter of fiscal 2017. As part of the settlement, we agreed to pay 3CEMS $1,000,000 in four equal payments of $250,000 each over a period of ten months beginning in August 2017. As of June 30, 2018, this settlement was paid in full (see Note 10 ‘Severance, Impairment and Other Charges’ for further discussion).
We are currently unaware of any significant pending litigation affecting us other than the matters set forth below.
In May 2017, a judge in a trade secrets case brought by Perceptron granted the defendants’ motions for summary disposition. Furthermore, in January 2018 the judge granted the defendants’ motions for recovery of their attorney fees in the amount of $675,000, plus interest. We are appealing the court’s decision to grant summary disposition and the award of the attorney fees. In the second quarter of fiscal 2018, we recorded a charge in the amount of $675,000 relating to this matter (see Note 10 ‘Severance, Impairment and Other Charges’ for further discussion). Due to our appeal of the court decisions in the trade secrets case, the timing of any payments related to this matter is unknown to us at this time.
As part of routine evaluation procedures, we identified a potential concern regarding the employment status and withholding for several individuals in one of our foreign jurisdictions. During fiscal 2015, we estimated a range of the potential financial liability related to this matter of €486,000 to €1 million. We were not able to reasonably estimate the amount within this range that we would be required to pay for this matter. As a result, in fiscal 2015, we recorded a reserve of €486,000 (equivalent to approximately $582,000) representing the minimum amount we estimated would be paid. In the fourth quarter of fiscal 2016, we received the final notice regarding this issue, and as a result, we recorded an additional expense of €227,000 (equivalent to approximately $272,000). To date, we have paid €677,000 (equivalent to approximately $810,000). We believe that the Slovakian authorities have closed this issue and therefore, in the second quarter of fiscal 2018, we reversed the remaining accrual.
In the third quarter of fiscal 2018, the Canadian Revenue Agency (“CRA”) completed a Goods and Services Tax/Harmonized Sales Tax Returns (GST/HST) audit. Based on this audit, the CRA preliminarily proposed to assess us approximately CAD $1,218,000 (equivalent to approximately $923,000) in taxes plus interests and penalties related to sales from 2013 through 2018. CRA has indicated that we are entitled to invoice our customers to recover this amount and our customers are required to remit payment. Our response to the CRA preliminary assessment was delivered in April 2018. In June 2018, we received the final assessment, which confirmed the preliminary assessment. In August 2018, we filed a formal appeal request and posted a surety bond as security for this claim. We have not recorded an accrual related to this preliminary audit finding because we are disputing several of the CRA’s conclusions, and, in addition, if our dispute is not resolved to our satisfaction, we expect to ultimately receive the funds from our customers (excluding any interest or penalties), although there may be a timing difference between when we must pay the CRA and when we collect the funds from our customers.
47
We have a 401(k) tax deferred savings plan that covers all eligible employees based in the U.S. As part of our financial improvement plan announced in the third quarter of fiscal 2016, we ceased making discretionary contributions at that time. In December 2016, we reinstated discretionary contributions which we expect to continue into our fiscal year 2019. Our contributions during fiscal years 2018, 2017 and 2016 were $281,000, $171,000 and $385,000, respectively.
16.Employee Stock Purchase Plan
We have an Employee Stock Purchase Plan for all U.S.-based employees meeting certain eligibility criteria. Under the Plan, eligible employees may purchase shares of our common stock at 85% of the market value at the beginning of a six-month election period. Purchases are limited to 10% of an employee's eligible compensation and the shares purchased are restricted from being sold for one year from the purchase date. At June 30, 2018, 124,433 shares remained available under the Plan.
Activity under this Plan is shown in the following table (in thousands, except per share amount):
|
|
|
Purchase Period Ended |
|
|||||||||
|
|
|
June 30, |
|
|||||||||
|
|
|
2018 |
|
|
2017 |
|
|
2016 |
|
|||
|
Non-cash stock based compensation expense |
|
$ |
10 |
|
|
$ |
4 |
|
|
$ |
19 |
|
|
Common shares purchased |
|
|
5 |
|
|
|
4 |
|
|
|
2 |
|
|
Average purchase price per share |
|
$ |
5.95 |
|
|
$ |
3.86 |
|
|
$ |
8.50 |
|
17.Stock Based Compensation
We maintain a 2004 Stock Incentive Plan (“2004 Plan”) covering substantially all company employees, non-employee directors and certain other key persons. All Options previously granted under a 1998 Global Team Member Stock Option Plan (“1998 Plan”) were exercised, cancelled or expired before March 31, 2017. The 2004 Plan is administered by a committee of our Board of Directors: The Management Development, Compensation and Stock Option Committee (“MDCSOC”).
Awards under the 2004 Plan may be in the form of stock options, stock appreciation rights, restricted stock or restricted stock units, performance share awards, director stock purchase rights and deferred stock units; or any combination thereof. The terms of the awards are determined by the MDCSOC, except as otherwise specified in the 2004 Plan.
Stock Options
Options outstanding under the 2004 Plan generally become exercisable at 25% or 33 1/3 % per year beginning one year after the date of grant and expire ten years after the date of grant. Option prices from options granted under this plan must not be less than fair market value of our stock on the date of grant. We use the Black-Scholes model for determining stock option valuations. The Black-Scholes model requires subjective assumptions, including future stock price volatility and expected time to exercise, which affect the calculated values. The expected term of option exercises is derived from historical data regarding employee exercises and post-vesting employment termination behavior. The risk-free rate of return is based on published U.S. Treasury rates in effect for the corresponding expected term. The expected volatility is based on historical volatility of our stock price. These factors could change in the future, which would affect the stock-based compensation expense in future periods.
We recognized operating expense for non-cash stock-based compensation costs related to stock options in the amount of $336,000, $374,000 and $428,000 for the fiscal years ended June 30, 2018, 2017 and 2016, respectively. As of June 30, 2018, the total remaining unrecognized compensation cost related to non-vested stock-based compensation amounted to $292,000. We expect to recognize this cost over a weighted average vesting period of 1.8 years.
We received $458,000 in cash from option exercises under all stock option payment arrangements for the twelve months ended June 30, 2018. The actual tax benefit realized related to tax deductions for non-qualified options exercised and disqualifying dispositions under all stock option payment arrangements totaled approximately $87,000 for fiscal 2018.
48
Activity under these Plans is shown in the following tables:
|
|
|
Fiscal Year 2018 |
|
|
Fiscal Year 2017 |
|
||||||||||||||||||
|
|
|
|
|
|
|
Weighted |
|
|
Aggregate |
|
|
|
|
|
|
Weighted |
|
|
Aggregate |
|
||||
|
|
|
|
|
|
|
Average |
|
|
Intrinsic |
|
|
|
|
|
|
Average |
|
|
Intrinsic |
|
||||
|
|
|
|
|
|
|
Exercise |
|
|
Value (1) |
|
|
|
|
|
|
Exercise |
|
|
Value (1) |
|
||||
|
Shares subject to option |
|
Shares |
|
|
Price |
|
|
($000) |
|
|
Shares |
|
|
Price |
|
|
($000) |
|
||||||
|
Outstanding at beginning of period |
|
|
622,636 |
|
|
$ |
7.26 |
|
|
|
|
|
|
|
635,158 |
|
|
$ |
7.53 |
|
|
|
|
|
|
|
|
|
|
|
|
|
|
|
|
|
|
|
|
|
|
|
|
|
|
|
|
|
|
|
|
New Grants (based on fair value of common stock at dates of grant) |
|
|
100,000 |
|
|
$ |
7.95 |
|
|
|
|
|
|
|
166,500 |
|
|
$ |
6.63 |
|
|
|
|
|
|
Exercised |
|
|
(52,000 |
) |
|
$ |
8.81 |
|
|
|
|
|
|
|
(28,916 |
) |
|
$ |
4.89 |
|
|
|
|
|
|
Expired |
|
|
(34,000 |
) |
|
$ |
9.99 |
|
|
|
|
|
|
|
(115,635 |
) |
|
$ |
8.28 |
|
|
|
|
|
|
Forfeited |
|
|
(1,600 |
) |
|
$ |
10.55 |
|
|
|
|
|
|
|
(34,471 |
) |
|
$ |
7.69 |
|
|
|
|
|
|
|
|
|
|
|
|
|
|
|
|
|
|
|
|
|
|
|
|
|
|
|
|
|
|
|
|
Outstanding at end of period |
|
|
635,036 |
|
|
$ |
7.02 |
|
|
$ |
2,269 |
|
|
|
622,636 |
|
|
$ |
7.26 |
|
|
$ |
279 |
|
|
Exercisable at end of period |
|
|
384,805 |
|
|
$ |
6.87 |
|
|
$ |
1,445 |
|
|
|
336,022 |
|
|
$ |
7.50 |
|
|
$ |
279 |
|
|
|
|
|
|
|
|
|
|
|
|
|
|
|
|
|
|
|
|
|
|
|
|
|
|
|
|
|
|
Fiscal Year 2016 |
|
|
|
|
||||||||||||||||||
|
|
|
|
|
|
|
Weighted |
|
|
Aggregate |
|
|
|
|
|
|
|
|
|
|
|
||||
|
|
|
|
|
|
|
Average |
|
|
Intrinsic |
|
|
|
|
|
|
|
|
|
|
|
||||
|
|
|
|
|
|
|
Exercise |
|
|
Value (1) |
|
|
|
|
|
|
|
|
|
|
|
||||
|
Shares subject to option |
|
Shares |
|
|
Price |
|
|
($000) |
|
|
|
|
|
|
|
|
|
|
|
|||||
|
Outstanding at beginning of period |
|
|
658,641 |
|
|
$ |
8.53 |
|
|
|
|
|
|
|
|
|
|
|
|
|
|
|
|
|
|
|
|
|
|
|
|
|
|
|
|
|
|
|
|
|
|
|
|
|
|
|
|
|
|
|
|
New Grants (based on fair value of common stock at dates of grant) |
|
|
511,197 |
|
|
$ |
7.35 |
|
|
|
|
|
|
|
|
|
|
|
|
|
|
|
|
|
|
Exercised |
|
|
(9,748 |
) |
|
$ |
5.92 |
|
|
|
|
|
|
|
|
|
|
|
|
|
|
|
|
|
|
Expired |
|
|
(123,833 |
) |
|
$ |
9.08 |
|
|
|
|
|
|
|
|
|
|
|
|
|
|
|
|
|
|
Forfeited |
|
|
(401,099 |
) |
|
$ |
8.48 |
|
|
|
|
|
|
|
|
|
|
|
|
|
|
|
|
|
|
|
|
|
|
|
|
|
|
|
|
|
|
|
|
|
|
|
|
|
|
|
|
|
|
|
|
Outstanding at end of period |
|
|
635,158 |
|
|
$ |
7.53 |
|
|
$ |
54 |
|
|
|
|
|
|
|
|
|
|
|
|
|
|
Exercisable at end of period |
|
|
329,210 |
|
|
$ |
7.78 |
|
|
$ |
54 |
|
|
|
|
|
|
|
|
|
|
|
|
|
|
(1) |
The intrinsic value of a stock option is the amount by which the current market value of the underlying stock exceeds the exercise price of the option. The total intrinsic value of stock options exercised during the fiscal years ended June 30, 2018, 2017 and 2016, were $87,000, $58,000 and $24,000, respectively. The total fair value of shares vested during the fiscal years ended June 30, 2018, 2017 and 2016, were $400,000, $409,000 and $323,000, respectively. |
The estimated fair value as of the date options were granted during the periods presented using the Black-Scholes option-pricing model, was as follows:
|
|
|
2018 |
|
|
2017 |
|
|
2016 |
|
|||
|
Weighted average estimated fair value per |
|
|
|
|
|
|
|
|
|
|
|
|
|
share of options granted during the period |
|
$ |
3.96 |
|
|
$ |
3.02 |
|
|
$ |
2.94 |
|
|
Assumptions: |
|
|
|
|
|
|
|
|
|
|
|
|
|
Dividend yield |
|
|
- |
|
|
|
- |
|
|
|
- |
|
|
Common stock price volatility |
|
|
49.01 |
% |
|
|
48.25 |
% |
|
|
45.43 |
% |
|
Risk free rate of return |
|
|
1.81 |
% |
|
|
1.81 |
% |
|
|
1.55 |
% |
|
Expected option term (in years) |
|
|
5.4 |
|
|
|
5.5 |
|
|
|
5.7 |
|
49
The following table summarizes information about stock options at June 30, 2018:
|
|
|
|
|
|
|
|
|
|
|
|
Options Outstanding |
|
|
Options Exercisable |
|
||||||||||||||
|
|
|
|
|
|
|
|
|
|
|
|
|
|
|
|
Weighted |
|
|
Weighted |
|
|
|
|
|
|
Weighted |
|
|||
|
|
|
|
|
|
|
|
|
|
|
|
|
|
|
|
Average |
|
|
Average |
|
|
|
|
|
|
Average |
|
|||
|
|
|
|
|
|
|
|
|
|
|
|
|
|
|
|
Remaining |
|
|
Exercise |
|
|
|
|
|
|
Exercise |
|
|||
|
Range of Exercise Prices |
|
|
Shares |
|
|
Contractual Life |
|
|
Price |
|
|
Shares |
|
|
Price |
|
|||||||||||||
|
$ |
2.80 |
|
|
to |
|
$ |
|
4.87 |
|
|
|
40,400 |
|
|
|
4.20 |
|
|
$ |
3.95 |
|
|
|
33,733 |
|
|
$ |
3.77 |
|
|
|
5.70 |
|
|
to |
|
|
|
8.81 |
|
|
|
555,136 |
|
|
|
7.31 |
|
|
$ |
6.94 |
|
|
|
311,572 |
|
|
$ |
6.65 |
|
|
|
8.94 |
|
|
to |
|
|
|
14.01 |
|
|
|
39,500 |
|
|
|
5.20 |
|
|
$ |
11.25 |
|
|
|
39,500 |
|
|
$ |
11.25 |
|
|
$ |
2.80 |
|
|
to |
|
$ |
|
14.01 |
|
|
|
635,036 |
|
|
|
6.98 |
|
|
$ |
7.02 |
|
|
|
384,805 |
|
|
$ |
6.87 |
|
Restricted Stock and Restricted Stock Units
Our restricted stock and restricted stock units under the 2004 Plan generally have been awarded by four methods as follows:
|
(1) |
Awards that are earned based on achieving certain individual and financial performance goals during the initial fiscal year with either a subsequent one-year service vesting period or with a one-third vesting requirement on the first, second and third anniversaries of the issuance, provided the individual’s employment has not terminated prior to the vesting date and are freely transferable after vesting; |
|
(2) |
Awards that are earned based on achieving certain revenue and operating income results with a subsequent one-third vesting requirement on the first, second and third anniversaries of the issuance, provided the individual’s employment has not terminated prior to the vesting date and are freely transferable after vesting; |
|
(3) |
Awards to non-management members of our Board of Directors with a subsequent one-third vesting requirement on the first, second and third anniversaries of the issuance provided the service of the non-management member of our Board of Directors has not terminated prior to the vesting date and are freely transferable after vesting; and |
|
(4) |
Awards that are granted with a one-third vesting requirement on the first, second and third anniversaries of the issuance provided the individual’s employment has not terminated prior to the vesting date and are freely transferable after vesting, including restricted stock units granted as part of the Fiscal Year 2018 Long-Term Incentive Compensation Plan. |
The grant date fair value associated with the restricted stock is calculated in accordance with ASC 718 “Compensation – Stock Compensation”. Compensation expense related to restricted stock awards is based on the closing price of our Common Stock on the grant date authorized by our MDCSOC, multiplied by the number of restricted stock and restricted stock unit award expected to be issued and vested and is amortized over the combined performance and service periods. The non-cash stock-based compensation expense recorded for restricted stock and restricted stock unit awards for the fiscal years ended June 30, 2018, 2017 and 2016 was $186,000, $145,000 and $221,000, respectively. As of June 30, 2018, the total remaining unrecognized compensation cost related to restricted stock and restricted stock unit awards is approximately $251,000. We expect to recognize this cost over a weighted average vesting period of 2.3 years.
A summary of the status of restricted stock and restricted stock unit awards issued at June 30, 2018 is presented in the table below:
|
|
|
|
|
|
|
|
Weighted Average |
|
|
|
|
|
Nonvested |
|
|
|
Grant Date |
|
||
|
|
|
Shares |
|
|
|
Fair Value |
|
||
|
Nonvested at June 30, 2017 |
|
|
11,776 |
|
|
|
$ |
8.08 |
|
|
Granted |
|
|
88,112 |
|
|
|
|
7.72 |
|
|
Vested |
|
|
(21,518 |
) |
|
|
|
7.75 |
|
|
Forfeited or expired |
|
|
(800 |
) |
|
|
|
7.95 |
|
|
Nonvested at June 30, 2018 |
|
|
77,570 |
|
|
|
$ |
7.77 |
|
Performance Stock Units
During the second quarter of fiscal 2018, the MDCSOC granted certain employees 40,150 shares of Performance Share Units (“PSUs”) as part of the Fiscal Year 2018 Long-Term Incentive Compensation Plan. The Performance Measures were defined by the MDCSOC as a specific Target level of Revenue and Operating Income for each of the following: fiscal year 2018, fiscal year 2019 and fiscal year 2020. Up to one-third of the PSUs can be earned each year based upon actual performance levels achieved in that fiscal year. One half of the award earned each fiscal year is based upon the achievement of the two Performance Targets in that fiscal year, provided that a minimum level of Operating Income is achieved for that fiscal year. The actual award level for each fiscal year can range from 50% to 150% (for Revenue Target) or 75% to 200% (for Operating Income Target) of the target awards depending on actual performance levels achieved in each fiscal year compared to that year’s target. The non-cash stock-based compensation expense recorded for performance share unit awards for the fiscal years ended June 30, 2018 was $165,000. As of June 30, 2018, the total remaining unrecognized compensation cost related to performance share unit awards is approximately $213,000. We expect to recognize this cost over a weighted average vesting period of 1.5 years.
50
Our Board of Directors’ fees are typically payable in cash on September 1, December 1, March 1, and June 1 of each fiscal year; however, under our 2004 Plan each director can elect to receive our stock in lieu of cash on a calendar year election. Each of our Directors elected stock for the calendar year of 2017 and cash for calendar year of 2018. We issued 29,527 shares to our directors and recorded expense of $257,000 related to the portion of our fiscal year 2018 that fell in calendar year 2017.
Available Shares
At June 30, 2018, the 2004 Plan had 883,229 shares available for future grants.
18.Income Taxes
Income (loss) from our operations before income taxes for U.S. and foreign operations was as follows (in thousands):
|
|
|
2018 |
|
|
2017 |
|
|
2016 |
|
|||
|
U.S. |
|
$ |
2,228 |
|
|
$ |
(732 |
) |
|
$ |
(5,828 |
) |
|
Foreign |
|
|
2,261 |
|
|
|
1,994 |
|
|
|
(3,389 |
) |
|
Total |
|
$ |
4,489 |
|
|
$ |
1,262 |
|
|
$ |
(9,217 |
) |
The income tax (provision) benefit reflected in the statement of income consists of the following (in thousands):
|
|
|
2018 |
|
|
2017 |
|
|
2016 |
|
|||
|
Current (provision) benefit: |
|
|
|
|
|
|
|
|
|
|
|
|
|
U.S. Federal, State & Other |
|
$ |
(75 |
) |
|
$ |
(127 |
) |
|
$ |
(116 |
) |
|
Foreign |
|
|
(1,213 |
) |
|
|
(727 |
) |
|
|
(185 |
) |
|
Deferred taxes |
|
|
|
|
|
|
|
|
|
|
|
|
|
U.S. |
|
|
308 |
|
|
|
— |
|
|
|
(11,349 |
) |
|
Foreign |
|
|
207 |
|
|
|
(576 |
) |
|
|
(1,246 |
) |
|
Total (provision) benefit |
|
$ |
(773 |
) |
|
$ |
(1,430 |
) |
|
$ |
(12,896 |
) |
The components of deferred taxes were as follows (in thousands):
|
|
|
2018 |
|
|
2017 |
|
|
2016 |
|
|||
|
Benefit of net operating losses |
|
$ |
7,334 |
|
|
$ |
8,787 |
|
|
$ |
9,268 |
|
|
Tax credit carry-forwards |
|
|
7,475 |
|
|
|
5,284 |
|
|
|
5,451 |
|
|
Deferred revenue |
|
|
1,668 |
|
|
|
2,073 |
|
|
|
1,434 |
|
|
Impaired investment |
|
|
677 |
|
|
|
1,054 |
|
|
|
1,060 |
|
|
Property and intangible assets |
|
|
61 |
|
|
|
187 |
|
|
|
242 |
|
|
Other |
|
|
1,885 |
|
|
|
2,161 |
|
|
|
3,029 |
|
|
Deferred tax asset |
|
|
19,100 |
|
|
|
19,546 |
|
|
|
20,484 |
|
|
Valuation allowance |
|
|
(17,845 |
) |
|
|
(19,099 |
) |
|
|
(19,453 |
) |
|
Total deferred tax assets |
|
|
1,255 |
|
|
|
447 |
|
|
|
1,031 |
|
|
Deferred tax liabilities - basis difference and amortization |
|
|
(1,917 |
) |
|
|
(1,623 |
) |
|
|
(1,631 |
) |
|
Net deferred taxes |
|
$ |
(662 |
) |
|
$ |
(1,176 |
) |
|
$ |
(600 |
) |
The reconciliation of income tax rate to effective tax rate was as follows (in thousands):
|
|
|
2018 |
|
|
2017 |
|
|
2016 |
|
|||
|
Provision at U.S. statutory rate |
|
|
28.1 |
% |
|
|
34.0 |
% |
|
|
34.0 |
% |
|
Net effect of taxes on foreign activities |
|
|
8.4 |
% |
|
|
49.5 |
% |
|
|
(5.9 |
%) |
|
Tax effect of U.S. permanent differences |
|
|
0.5 |
% |
|
|
14.7 |
% |
|
|
2.6 |
% |
|
State taxes and other, net |
|
|
0.2 |
% |
|
|
4.9 |
% |
|
|
(1.5 |
%) |
|
Stock based compensation |
|
|
1.3 |
% |
|
|
56.9 |
% |
|
|
0.0 |
% |
|
Other |
|
|
(6.2 |
%) |
|
|
(1.3 |
%) |
|
|
3.8 |
% |
|
Valuation allowance |
|
|
(15.1 |
%) |
|
|
(45.6 |
%) |
|
|
(172.9 |
%) |
|
Effective tax rate |
|
|
17.2 |
% |
|
|
113.1 |
% |
|
|
(139.9 |
%) |
51
On December 22, 2017, the Tax Cuts and Jobs Act (the “Act”) was enacted by the U.S. The Act implements comprehensive tax legislation which, among other changes, reduces the federal statutory corporate tax rate from 35% to 21% and implements a territorial tax system that eliminates the ability to credit certain foreign taxes. Additionally, in December 2017, the Securities and Exchange Commission staff issued Staff Accounting Bulletin No. 118 (“SAB 118”), which addresses how a company recognizes provisional amounts when a company does not have the necessary information available, prepared or analyzed (including computations) in reasonable detail to complete its accounting for the effect of the changes in the Tax Act. The measurement period, as defined in SAB 118, ends when a company has obtained, prepared and analyzed the information necessary to finalize its accounting, but cannot extend beyond one year.
As we have a June 30 fiscal year end, the lower income tax rates will be phased in, resulting in a blended rate for fiscal 2018 and a 21% rate for years thereafter. Based on the provisions of the Act, we re-measured our U.S. deferred tax assets and related valuation allowance at the date of enactment. The re-measurement of U.S. deferred tax assets and related valuation allowance at the lower enacted corporate tax rate resulted in a net change of zero.
Furthermore, the new Act repeals the Alternative Minimum Tax (“AMT”) on corporations. Any AMT credit carryforwards can be used to offset regular tax for any tax year and is refundable, subject to limitation in 2018 - 2021. With this change, we expect to be able to use or monetize the AMT credit in the next four years, and therefore, the valuation allowance recorded against the credit was removed. As a result, we recorded a tax benefit in the amount of $279,000 in the second quarter of fiscal 2018.
The Act also imposes a tax on the untaxed foreign earnings of foreign subsidiaries of U.S. companies by deeming those earnings to be repatriated (the “Transition Tax”). Generally, foreign earnings held in the form of cash and cash equivalents are taxed by the U.S. at a 15.5% rate and the remaining earnings are taxed at an 8% rate. The Transition Tax generally may be paid in installments over an eight-year period. At the date of enactment, we were not in a position to present either a final or provisional estimate with respect to the Transition Tax. As of June 30, we have estimated the impact of the Transition Tax by incorporating assumptions made based upon our current interpretation and analysis to-date of the Act and have determined that our foreign tax credits would completely offset any Transition Tax calculated, and therefore, we do not expect to make any cash payments related to the Transition Tax. The actual impact of the Act may differ from our estimates due to, among other things, further refinement of our calculations as allowed under SAB 118, changes in interpretations and assumptions we have made, guidance that may be issued and actions we may take as a result of the Act.
At June 30, 2018, we had net operating loss carry-forwards for U.S. federal income tax purposes of $25.8 million that expire in the years 2022 through 2036 and tax credit carry-forwards of $7.5 million of which $5.0 million expire in the years 2019 through 2036. Included in the U.S. federal net operating loss carry-forward is $8.3 million from the exercise of employee stock options, the tax benefit of which was recognized on July 1, 2017 in accordance with ASU 2016-09. A corresponding valuation allowance was also recorded.
Our deferred tax assets are substantially represented by the tax benefit of U.S. net operating losses “(NOL’s”), tax credit carry-forwards and the tax benefit of future deductions represented by timing differences for deferred revenue, inventory obsolescence, allowances for bad debts, warranty expenses and unrealized losses on investments. We assess the realizability of the NOL’s and tax credit carry-forwards based on a number of factors including our net operating history, the volatility of our earnings, our accuracy of forecasted earnings for future periods and the general business climate. We also have a deferred tax liability related to the basis difference in the Coord3 intangible assets acquired.
As of the end of our fiscal year 2016, we had been in a three-year cumulative loss position in the U.S., therefore, at that time, we determined that it was not more likely than not that any of our U.S. deferred tax assets would be realized as benefits in the future. Accordingly, we established a full valuation allowance against our U.S. net deferred tax assets as of June 30, 2016 and this valuation allowance remains at June 30, 2018. Additionally, during fiscal years 2016 and 2017, we established full valuation allowances against our Germany, Japan, Singapore and Brazil net deferred tax assets for similar reasons. While our U.S. and Germany locations had pre-tax income during fiscal year 2018, both are still in a three-year cumulative loss position as of June 30, 2018 and we have determined that it is not likely than not that any of our deferred tax assets, except for the U.S. AMT credit, will be realized as benefits in the future. The net change in the total valuation allowance for the fiscal years ended June 30, 2018, 2017 and 2016 was ($1,254,000), ($354,000), and $16,349,000, respectively.
On June 30, 2018 and 2017, we had $73,000 and $120,000 of unrecognized tax benefits that would affect the effective tax rate if recognized absent valuation considerations. Our policy is to classify interest and penalties related to unrecognized tax benefits as interest expense and income tax expense, respectively. As of June 30, 2018, there was no accrued interest or penalties related to uncertain tax positions recorded on our Consolidated Balance Sheets or Consolidated Statements of Operations. For U.S. federal income tax purposes, the tax years 2015 through 2018 remain open to examination by government tax authorities. For German income tax purposes, tax years 2014 through 2018 remain open to examination by government tax authorities. For our China income tax purposes, tax years 2015 through 2018 remain open to examination by government tax authorities generally.
The aggregate changes in the balance of unrecognized tax benefits were as follows (in thousands):
|
|
|
2018 |
|
|
|
Balance, at June 30, 2017 |
|
$ |
120 |
|
|
Increases for tax positions related to the current year |
|
|
- |
|
|
Decreases for tax positions related to the prior year |
|
|
(47 |
) |
|
Balance, at June 30, 2018 |
|
$ |
73 |
|
52
19.Segment and Geographic Information
We manage our business under three operating segments: Americas, Europe and Asia. All of our operating segments rely on our core technologies and sell the same products primarily in the global automotive industry. The segments also possess similar economic characteristics, resulting in similar long-term expected financial performance. In addition, we sell to the same customers in all of our operating segments. Accordingly, our operating segments are aggregated into one reportable segment.
We account for geographic sales based on the country from which the sale is invoiced rather than the country to which the product is shipped. We operate in three geographic areas: The Americas (substantially all of which is the United States, with less than 10% from net sales in Brazil), Europe and Asia. Sales and Long-lived assets, net by our geographical regions are as follows (in thousands):
|
|
|
|
|
|
|
|
|
|
|
|
|
|
|
|
|
|
|
Geographical Regions |
|
Americas |
|
|
Europe (1) |
|
|
Asia (2) |
|
|
Consolidated |
|
||||
|
Twelve months ended June 30, 2018 |
|
|
|
|
|
|
|
|
|
|
|
|
|
|
|
|
|
Net sales |
|
$ |
34,720 |
|
|
$ |
33,492 |
|
|
$ |
16,481 |
|
|
$ |
84,693 |
|
|
Long-lived assets, net |
|
|
5,608 |
|
|
|
1,541 |
|
|
|
189 |
|
|
|
7,338 |
|
|
|
|
|
|
|
|
|
|
|
|
|
|
|
|
|
|
|
|
Twelve months ended June 30, 2017 |
|
|
|
|
|
|
|
|
|
|
|
|
|
|
|
|
|
Net sales |
|
$ |
30,311 |
|
|
$ |
32,139 |
|
|
$ |
15,497 |
|
|
$ |
77,947 |
|
|
Long-lived assets, net |
|
|
6,202 |
|
|
|
1,638 |
|
|
|
262 |
|
|
|
8,102 |
|
|
|
|
|
|
|
|
|
|
|
|
|
|
|
|
|
|
|
|
Twelve months ended June 30, 2016 |
|
|
|
|
|
|
|
|
|
|
|
|
|
|
|
|
|
Net sales |
|
$ |
22,523 |
|
|
$ |
31,087 |
|
|
$ |
15,525 |
|
|
$ |
69,135 |
|
|
Long-lived assets, net |
|
|
6,607 |
|
|
|
1,696 |
|
|
|
393 |
|
|
|
8,696 |
|
|
(1) |
Our German subsidiary had net external sales of $23.2 million, $21.8 million and $19.7 million in the fiscal years ended June 30, 2018, 2017 and 2016, respectively. Long-lived assets, net of our German subsidiary were $173,000, $285,000 and $395,000 as of June 30, 2018, 2017 and 2016, respectively. Our Italian subsidiary had net external sales of $10.3 million, $10.3 million, and $11.4 in the fiscal years ended June 30, 2018, 2017 and 2016, respectively. Long-lived assets, net of our Italian subsidiary were $1,263,000, $1,245,000 and $1,201,000 as of June 30, 2018, 2017 and 2016, respectively. |
|
(2) |
Our Chinese subsidiary had net external sales of $14.0 million, $11.5 million and $11.8 million in the fiscal years ended June 30, 2018, 2017 and 2016, respectively. Long-lived assets, net of our Chinese subsidiary were $71,000, $165,000 and $295,000 as of June 30, 2018, 2017 and 2016, respectively. |
We have three major product lines: Measurement Solutions, 3D Scanning Solutions and Value Added Services. Sales by our product lines are as follows (in thousands):
|
|
|
Fiscal Year Ended, June 30, |
|
|||||||||
|
Product Lines |
|
2018 |
|
|
2017 |
|
|
2016 |
|
|||
|
Measurement Solutions |
|
$ |
77,235 |
|
|
$ |
69,731 |
|
|
$ |
62,268 |
|
|
3D Scanning Solutions |
|
|
2,729 |
|
|
|
5,490 |
|
|
|
3,936 |
|
|
Value Added Service |
|
|
4,729 |
|
|
|
2,726 |
|
|
|
2,931 |
|
|
Total Net Sales |
|
$ |
84,693 |
|
|
$ |
77,947 |
|
|
$ |
69,135 |
|
53
20.Selected Quarterly Financial Data (Unaudited)
Selected unaudited quarterly financial data for the fiscal years ended June 30, 2018 and 2017 are as follows (in thousands, except per share amounts):
|
|
|
Quarter Ended |
|
|||||||||||||
|
Fiscal Year 2018 |
|
9/30/2017 |
|
|
12/31/2017 |
|
|
3/31/2018 |
|
|
6/30/2018 |
|
||||
|
Net Sales |
|
$ |
19,269 |
|
|
$ |
20,433 |
|
|
$ |
21,397 |
|
|
$ |
23,594 |
|
|
Gross Profit |
|
|
7,650 |
|
|
|
7,407 |
|
|
|
7,922 |
|
|
|
9,021 |
|
|
Net Income |
|
|
1,558 |
|
|
|
366 |
|
|
|
1,020 |
|
|
|
772 |
|
|
Net Income Per Common Share |
|
|
|
|
|
|
|
|
|
|
|
|
|
|
|
|
|
Basic |
|
|
0.16 |
|
|
|
0.04 |
|
|
|
0.11 |
|
|
|
0.08 |
|
|
Diluted |
|
|
0.16 |
|
|
|
0.04 |
|
|
|
0.11 |
|
|
|
0.08 |
|
|
|
|
|
|
|
|
|
|
|
|
|
|
|
|
|
|
|
|
Fiscal Year 2017 |
|
9/30/2016 |
|
|
12/31/2016 |
|
|
3/31/2017 |
|
|
6/30/2017 |
|
||||
|
Net Sales |
|
$ |
17,520 |
|
|
$ |
21,751 |
|
|
$ |
16,325 |
|
|
$ |
22,351 |
|
|
Gross Profit |
|
|
4,574 |
|
|
|
9,444 |
|
|
|
5,190 |
|
|
|
8,561 |
|
|
Net (Loss) Income |
|
|
(2,355 |
) |
|
|
2,524 |
|
|
|
(598 |
) |
|
|
261 |
|
|
Net (Loss) Income Per Common Share |
|
|
|
|
|
|
|
|
|
|
|
|
|
|
|
|
|
Basic |
|
|
(0.25 |
) |
|
|
0.27 |
|
|
|
(0.06 |
) |
|
|
0.03 |
|
|
Diluted |
|
|
(0.25 |
) |
|
|
0.27 |
|
|
|
(0.06 |
) |
|
|
0.03 |
|
54
None.
Evaluation Of Disclosure Controls And Procedures
We carried out an evaluation, under the supervision and with the participation of our management, including our Chief Executive Officer and Chief Financial Officer, of the effectiveness of the design and operation of our disclosure controls and procedures pursuant to Rule 13a-15 of the Securities Exchange Act of 1934 (the “1934 Act”). Based upon that evaluation, our Chief Executive Officer and Chief Financial Officer concluded that, as of June 30, 2018, our disclosure controls and procedures were effective. Rule 13a-15(e) of the 1934 Act defines “disclosure controls and procedures” as controls and other procedures that are designed to ensure that information required to be disclosed by us in the reports that we file or submit under the 1934 Act is recorded, processed, summarized and reported, within the time periods specified in the Securities and Exchange Commission’s rules and forms. Disclosure controls and procedures include, without limitation, controls and procedures designed to ensure that information required to be disclosed by us in the reports that we file or submit under the 1934 Act is accumulated and communicated to our management, including our Chief Executive Officer and Chief Financial Officer, as appropriate to allow timely decisions regarding required disclosure.
Report Of Management On Internal Control Over Financial Reporting
Our management is responsible for establishing and maintaining effective internal controls over financial reporting, as such term is defined in Rules 13a-15(f) under the Securities Exchange Act of 1934, as amended.
Internal control over financial reporting is a process designed to provide reasonable assurance regarding the reliability of our financial reporting and the preparation of financial statements for external purposes in accordance with accounting principles generally accepted in the United States of America. Because of its inherent limitations, internal control over financial reporting may not prevent or detect misstatements. Also, projections of any evaluation of effectiveness to future periods are subject to the risk that controls may become inadequate because of changes in conditions, or that the degree of compliance with the policies or procedures may deteriorate.
Our internal control over financial reporting includes those policies and procedures that (1) pertain to the maintenance of records that, in reasonable detail, accurately and fairly reflect the transactions and dispositions of the assets of Perceptron, Inc.; (2) provide reasonable assurance that transactions are recorded as necessary to permit preparation of financial statements in accordance with generally accepted accounting principles and that receipts and expenditures are being made only in accordance with authorizations of our management and directors; and (3) provide reasonable assurance regarding prevention or timely detection of unauthorized acquisition, use or disposition of our assets that could have a material effect on our financial statements.
Management, with the participation of our principal executive and principal financial officers, conducted an assessment of the effectiveness of the Company’s internal control over financial reporting as of June 30, 2018. This assessment was performed using the criteria established under the Internal Control-Integrated Framework (2013) established by the Committee of Sponsoring Organizations of the Treadway Commission, or COSO.
Based on this assessment, management concluded that our internal control over financial reporting was effective as of June 30, 2018.
BDO USA LLP, the independent registered public accounting firm that audited the financial statements included in this Annual Report on Form 10-K for the fiscal year ended June 30, 2018, has issued an audit report on the effectiveness of our internal control over financial reporting as of June 30, 2018. Such report appears immediately below.
55
Report of Independent Registered Public Accounting Firm
Board of Directors and Stockholders
Perceptron, Inc.
Plymouth, Michigan
Opinion on Internal Control over Financial Reporting
We have audited Perceptron, Inc.’s (the “Company’s”) internal control over financial reporting as of June 30, 2018, based on criteria established in Internal Control – Integrated Framework (2013) issued by the Committee of Sponsoring Organizations of the Treadway Commission (the “COSO criteria”). In our opinion, the Company maintained, in all material respects, effective internal control over financial reporting as of June 30, 2018, based on the COSO criteria.
We also have audited, in accordance with the standards of the Public Company Accounting Oversight Board (United States) (“PCAOB”), the consolidated balance sheets of the Company and subsidiaries as of June 30, 2018 and 2017, the related consolidated statements of operations, comprehensive income, stockholders’ equity, and cash flows for each of the three years in the period ended June 30, 2018, and the related notes and our report dated August 30, 2018 expressed an unqualified opinion thereon.
Basis for Opinion
The Company’s management is responsible for maintaining effective internal control over financial reporting and for its assessment of the effectiveness of internal control over financial reporting, included in the accompanying Item 9A, Report of Management on Internal Control Over Financial Reporting. Our responsibility is to express an opinion on the Company’s internal control over financial reporting based on our audit. We are a public accounting firm registered with the PCAOB and are required to be independent with respect to the Company in accordance with U.S. federal securities laws and the applicable rules and regulations of the Securities and Exchange Commission and the PCAOB.
We conducted our audit of internal control over financial reporting in accordance with the standards of the PCAOB. Those standards require that we plan and perform the audit to obtain reasonable assurance about whether effective internal control over financial reporting was maintained in all material respects. Our audit included obtaining an understanding of internal control over financial reporting, assessing the risk that a material weakness exists, and testing and evaluating the design and operating effectiveness of internal control based on the assessed risk. Our audit also included performing such other procedures as we considered necessary in the circumstances. We believe that our audit provides a reasonable basis for our opinion.
Definition and Limitations of Internal Control over Financial Reporting
A company’s internal control over financial reporting is a process designed to provide reasonable assurance regarding the reliability of financial reporting and the preparation of financial statements for external purposes in accordance with generally accepted accounting principles. A company’s internal control over financial reporting includes those policies and procedures that (1) pertain to the maintenance of records that, in reasonable detail, accurately and fairly reflect the transactions and dispositions of the assets of the company; (2) provide reasonable assurance that transactions are recorded as necessary to permit preparation of financial statements in accordance with generally accepted accounting principles, and that receipts and expenditures of the company are being made only in accordance with authorizations of management and directors of the company; and (3) provide reasonable assurance regarding prevention or timely detection of unauthorized acquisition, use, or disposition of the company’s assets that could have a material effect on the financial statements.
Because of its inherent limitations, internal control over financial reporting may not prevent or detect misstatements. Also, projections of any evaluation of effectiveness to future periods are subject to the risk that controls may become inadequate because of changes in conditions, or that the degree of compliance with the policies or procedures may deteriorate.
/s/ BDO USA, LLP
Troy, Michigan
August 30, 2018
56
Changes In Internal Control Over Financial Reporting
There have been no changes in our internal control over financial reporting during the quarter ended June 30, 2018 identified in connection with our evaluation that has materially affected, or is reasonably likely to materially affect, our internal control over financial reporting.
None.
PART III
The information contained under the captions “Matters to Come Before the Meeting – Proposal 1: Election of Directors”, “Corporate Governance”, “Section 16(a) Beneficial Ownership Reporting Compliance”, “Corporate Governance – Code of Ethics” and “Executive Officers”, of the Company’s proxy statement for our 2018 Annual Meeting of Shareholders (the “Proxy Statement”) is incorporated herein by reference.
The information required by Part III, Item 10 with respect to our nominating committee, audit committee and the audit committee’s financial expert is set forth in the Proxy Statement under the captions “Corporate Governance – Board Leadership Structure and Board and Committee Information – Audit Committee”, “Corporate Governance – Board Leadership Structure and Board and Committee Information – Nominating and Corporate Governance Committee” and “Corporate Governance – Audit Committee Report”, which paragraphs are incorporated herein by reference.
We have adopted a Code of Business Conduct and Ethics that applies to all of our directors, executive and financial officers and employees. The Code of Business Conduct and Ethics has been posted to our website at www.perceptron.com in the “Investor Relations” section under “Corporate Governance” and is available free of charge through our website. We will post information regarding any amendment to, or waiver from, our Code of Business Conduct and Ethics for executive and financial officers and directors on our website in the “Investor Relations” section under “Corporate Governance”.
The information contained under the captions “Matters to Come Before the Meeting – Proposal 1: Election of Directors – Director Compensation for Fiscal 2018”, “Matters to Come Before the Meeting – Proposal 1: Election of Directors – Standard Director Compensation Arrangements”, “Corporate Governance – Management Development, Compensation and Stock Option Committee Interlocks and Insider Participation” and “Compensation of Executive Officers” of the Proxy Statement is incorporated herein by reference.
57
|
ITEM 12: |
SECURITY OWNERSHIP OF CERTAIN BENEFICIAL OWNERS AND MANAGEMENT AND RELATED STOCKHOLDER MATTERS |
The information contained under the captions “Share Ownership of Management and Certain Shareholders – Principal Shareholders” and “Share Ownership of Management and Certain Shareholders – Beneficial Ownership by Directors and Executive Officers” of the Proxy Statement is incorporated herein by reference.
EQUITY COMPENSATION PLAN INFORMATION
The following table gives information about our Common Stock that may be issued upon the exercise of options, warrants and rights under all of our existing equity compensation plans as of June 30, 2018, including the 2004 Stock Incentive Plan and the Employee Stock Purchase Plan (together, the “Plans”):
|
|
|
|
|
|
|
|
Weighted |
|
|
Number of securities |
|
||
|
|
|
|
|
|
|
|
average exercise |
|
|
remaining available for |
|
||
|
|
|
Number of securities |
|
|
|
price of |
|
|
future issuance under |
|
|||
|
|
|
to be issued upon |
|
|
|
outstanding |
|
|
equity compensation |
|
|||
|
|
|
exercise of |
|
|
|
options, |
|
|
plans (excluding |
|
|||
|
|
|
outstanding options, |
|
|
|
warrants and |
|
|
securities reflected in |
|
|||
|
Plan Category |
|
warrants and rights |
|
|
|
rights |
|
|
column (a)) |
|
|||
|
|
|
(a) |
|
|
|
(b) |
|
|
(c) |
|
|||
|
Equity compensation plans approved by shareholders: |
|
|
|
|
|
|
|
|
|
|
|
|
|
|
2004 Stock Incentive Plan |
|
|
635,036 |
|
(1) |
|
$ |
7.02 |
|
|
|
883,229 |
|
|
Employee Stock Purchase Plan |
|
|
- |
|
(2) |
|
|
- |
|
|
|
122,564 |
|
|
Total equity compensation plans approved |
|
|
|
|
|
|
|
|
|
|
|
|
|
|
by shareholders |
|
|
635,036 |
|
|
|
$ |
7.02 |
|
|
|
1,005,793 |
|
|
(1) |
Awards under the 2004 Stock Incentive Plan may be in the form of stock options, stock appreciation rights, restricted stock or restricted stock units, performance share awards, director stock purchase rights and deferred stock units; or any combination thereof. |
|
(2) |
Does not include an undeterminable number of shares subject to a payroll deduction election under the Employee Stock Purchase Plan for the period from July 1, 2018 until December 31, 2018, which will not be issued until January 2019. |
The information contained under the captions “Corporate Governance – Board Leadership Structure and Board and Committee Information” and “Related Party Transactions” of the Proxy Statement is incorporated herein by reference.
The information contained under the captions “Matters to Come Before the Meeting – Proposal 4: Ratification of Company’s Independent Registered Public Accounting Firm,” “Independent Registered Public Accounting Firm – Policy for Pre-Approval of Audit and Non-Audit Services” and “Independent Registered Public Accounting Firm – Fees Paid to Independent Registered Public Accounting Firm” of the Proxy Statement is incorporated herein by reference.
58
|
(a) |
(1) |
Financial Statements |
|
|
|
|
|
|
|
See Item 8 of this report. |
|
|
|
|
|
|
(2) |
Financial Statement Schedules |
|
|
|
|
|
|
|
Financial statement schedules have been omitted since they are either not required, not applicable, or the information is otherwise included. |
|
|
|
|
|
|
(3) |
Exhibits |
|
|
|
|
|
|
|
|
59
|
|
|
|
|
Exhibit No |
|
Description of Exhibits |
|
|
|
|
|
3. |
|
Restated Articles of Incorporation and Bylaws. |
|
|
|
|
|
3.1 |
|
|
|
|
|
|
|
3.2 |
|
|
|
|
|
|
|
4. |
|
Instruments Defining the Rights of Securities Holders. |
|
|
|
|
|
4.1 |
|
|
|
|
|
|
|
4.2 |
|
|
|
|
|
|
|
4.3 |
|
|
|
|
|
|
|
4.4 |
|
|
|
|
|
|
|
4.5 |
|
|
|
|
|
|
|
4.6 |
|
|
|
|
|
|
|
4.7 |
|
|
|
|
|
|
|
4.8 |
|
Certain instruments defining the rights of holders of the long-term debt of the Company and its subsidiaries are omitted pursuant to section (b)(4)(iii)(A) of Item 601 of Regulation S-K. The Company hereby agrees to furnish copies of these instruments to the Securities and Exchange Commission upon request. |
|
|
|
|
|
10. |
|
Material Contracts. |
|
|
|
|
|
10.1 |
|
Registration Agreement, dated as of June 13, 1985, as amended, among the Company and the Purchasers identified therein, is incorporated by reference to Exhibit 10.3 of the Company's Form S-1 Registration Statement (amended by Exhibit 10.2) No. 33-47463. (P) |
|
|
|
|
|
10.2@ |
|
Form of Proprietary Information and Inventions Agreement between the Company and all of the employees of the Company is incorporated herein by reference to Exhibit 10.11 of the Company’s Form S-1 Registration Statement No. 33-47463. (P) |
|
|
|
|
|
10.3@ |
|
Form of Confidentiality and Non-Disclosure Agreement between the Company and certain vendors and customers of the Company is incorporated herein by reference to Exhibit 10.12 of the Company's Form S-1 Registration Statement No. 33-47463. (P) |
|
|
|
|
60
|
|
||
|
|
|
|
|
10.5@ |
|
|
|
|
|
|
|
10.6@ |
|
|
|
|
|
|
|
10.7@ |
|
|
|
|
|
|
|
10.8@ |
|
|
|
|
|
|
|
10.9@ |
|
|
|
|
|
|
|
10.10@ |
|
|
|
|
|
|
|
10.11@ |
|
|
|
|
|
|
|
10.12@ |
|
|
|
|
|
|
|
10.13@ |
|
|
|
|
|
|
|
10.14@ |
|
|
|
|
|
|
|
10.15@ |
|
|
|
|
|
|
|
10.16@ |
|
|
|
|
|
|
|
10.17@ |
|
|
|
|
|
|
|
10.18@ |
|
|
|
|
|
|
|
10.19@ |
|
|
|
|
|
|
|
10.20@ |
|
|
|
|
|
|
61
|
|
||
|
|
|
|
|
10.22@ |
|
|
|
|
|
|
|
10.23@ |
|
|
|
|
|
|
|
10.24@ |
|
|
|
|
|
|
|
10.25@ |
|
|
|
|
|
|
|
10.26@ |
|
|
|
|
|
|
|
10.27@ |
|
|
|
|
|
|
|
10.28@ |
|
|
|
|
|
|
|
10.29@ |
|
|
|
|
|
|
|
10.30@ |
|
|
|
|
|
|
|
10.31@ |
|
|
|
|
|
|
|
10.32@ |
|
|
|
|
|
|
|
10.33@ |
|
|
|
|
|
|
|
10.34@ |
|
|
|
|
|
|
|
10.35 |
|
|
|
|
|
|
|
10.36 |
|
|
|
|
|
|
|
10.37 |
|
|
|
|
|
|
|
10.38 |
|
62
|
|
|
|
|
10.39 |
|
|
|
|
|
|
|
10.40 |
|
|
|
|
|
|
|
10.41 |
|
|
|
|
|
|
|
10.42 |
|
|
|
|
|
|
|
10.43 |
|
|
|
|
|
|
|
10.44 |
|
|
|
|
|
|
|
10.45 |
|
|
|
|
|
|
|
10.46 |
|
|
|
|
|
|
|
10.47 |
|
|
|
|
|
|
|
10.48 |
|
|
|
|
|
|
|
10.49 |
|
|
|
|
|
|
|
10.50 |
|
|
|
|
|
|
|
10.51 |
|
|
|
|
|
|
|
10.52 |
|
|
|
|
|
|
|
10.53 |
|
|
|
|
|
|
|
10.54 |
|
|
|
|
|
|
|
10.55@ |
|
63
|
21.* |
|
|
|
|
|
|
|
23.* |
|
|
|
|
|
|
|
31.1* |
|
|
|
|
|
|
|
32.1* |
|
|
|
|
|
|
101.INS* |
|
XBRL Instance Document |
|
|
|
|
|
101.SCH* |
|
XBRL Taxonomy Extension Schema |
|
|
|
|
|
101.CAL* |
|
XBRL Taxonomy Extension Calculation Linkbase |
|
|
|
|
|
101.LAB* |
|
XBRL Taxonomy Extension Label Linkbase |
|
|
|
|
|
101.PRE* |
|
XBRL Taxonomy Extension Presentation Linkbase |
* Filed herewith
@ Indicates a management contract, compensatory plan or arrangement.
(P) Paper exhibits
64
Pursuant to the requirements of Section 13 or 15(d) of the Securities Exchange Act of 1934, the Registrant has duly caused this Annual Report on Form 10-K to be signed on its behalf by the undersigned, thereunto duly authorized.
|
|
|
|
|
Perceptron, Inc. |
|
|
|
|
|
(Registrant) |
|
|
|
|
|
|
|
Date: August 30, 2018 |
|
By: |
|
/s/ David L. Watza |
|
|
|
|
|
David L. Watza |
|
|
|
|
|
President, Chief Executive Officer and Chief Financial Officer |
|
|
|
|
|
(Principal Executive and Financial Officer) |
Pursuant to the requirements of the Securities Exchange Act of 1934, this report has been signed below by the following persons on behalf of the Registrant and in the capacities and on the dates indicated.
|
Signatures |
|
Title |
|
Date |
|
|
|
|
|
|
|
/s/ David L. Watza |
|
President, Chief Executive Officer, Chief Financial Officer |
|
August 30, 2018 |
|
David L. Watza |
|
and Director (Principal Executive and Financial Officer) |
|
|
|
|
|
|
|
|
|
/s/ Michelle O. Wright |
|
Corporate Controller and Chief Accounting Officer |
|
August 30, 2018 |
|
Michelle O. Wright |
|
(Principal Accounting Officer) |
|
|
|
|
|
|
|
|
|
/s/ W. Richard Marz |
|
Chairman of the Board |
|
August 30, 2018 |
|
W. Richard Marz |
|
|
|
|
|
|
|
|
|
|
|
/s/ John F. Bryant |
|
Director |
|
August 30, 2018 |
|
John F. Bryant |
|
|
|
|
|
|
|
|
|
|
|
/s/ C. Richard Neely, Jr. |
|
Director |
|
August 30, 2018 |
|
C. Richard Neely, Jr. |
|
|
|
|
|
|
|
|
|
|
|
/s/ Robert S. Oswald |
|
Director |
|
August 30, 2018 |
|
Robert S. Oswald |
|
|
|
|
|
|
|
|
|
|
|
/s/ James A. Ratigan |
|
Director |
|
August 30, 2018 |
|
James A. Ratigan |
|
|
|
|
|
|
|
|
|
|
|
/s/ William C. Taylor |
|
Director |
|
August 30, 2018 |
|
William C. Taylor |
|
|
|
|
65