Attached files
| file | filename |
|---|---|
| EXCEL - IDEA: XBRL DOCUMENT - PERCEPTRON INC/MI | Financial_Report.xls |
| EX-23.1 - EX-23.1 - PERCEPTRON INC/MI | prcp-20140630ex2311c2736.htm |
| EX-32.2 - EX-32.2 - PERCEPTRON INC/MI | prcp-20140630ex3224ae1c7.htm |
| EX-31.2 - EX-31.2 - PERCEPTRON INC/MI | prcp-20140630ex312d31f00.htm |
| EX-23.2 - EX-23.2 - PERCEPTRON INC/MI | prcp-20140630ex2328765d9.htm |
| EX-32.1 - EX-32.1 - PERCEPTRON INC/MI | prcp-20140630ex32101e4f3.htm |
| EX-31.1 - EX-31.1 - PERCEPTRON INC/MI | prcp-20140630ex311cecef3.htm |
SECURITIES AND EXCHANGE COMMISSION
WASHINGTON, D.C. 20549
FORM 10-K
(Mark One)
☒ ANNUAL REPORT PURSUANT TO SECTION 13 OR 15(d) OF THE SECURITIES EXCHANGE ACT OF 1934
For the fiscal year ended June 30, 2014OR
☐TRANSITION REPORT PURSUANT TO SECTION 13 OR 15(d) OF THE SECURITIES EXCHANGE ACT OF 1934
For the transition period from ________ to ________.
|
Commission File Number: 0-20206 |
||
|
PERCEPTRON, INC. |
||
|
(Exact Name of Registrant as Specified in Its Charter) |
||
|
Michigan |
|
38-2381442 |
|
(State or Other Jurisdiction of |
|
(I.R.S. Employer Identification No.) |
|
Incorporation or Organization) |
|
|
|
47827 Halyard Drive |
||
|
Plymouth, Michigan 48170-2461 |
||
|
(Address of Principal Executive Offices) |
||
|
(734) 414-6100 |
||
|
(Registrant’s telephone number, including area code) |
||
|
|
|
|
|
|
|
|
|
Securities registered pursuant to section 12(b) of the Act: |
||||
|
Title of Each Class Common Stock, $0.01 par value |
Name of Each Exchange on Which Registered |
|||
|
Rights to Purchase Preferred Stock |
The NASDAQ Stock Market LLC |
|||
|
(NASDAQ Global Market) |
||||
|
Securities registered pursuant to section 12(g) of the Act: None |
||||
Indicate by check mark if the registrant is a well-known seasoned issuer, as defined in Rule 405 of the Securities Act.
|
Yes ☐ |
|
No ☒ |
Indicate by check mark if the registrant is not required to file reports pursuant to Section 13 or Section 15(d) of the Exchange Act.
|
Yes ☐ |
|
No ☒ |
Indicate by check mark whether the registrant (1) has filed all reports required to be filed by Section 13 or 15(d) of the Securities Exchange Act of 1934 during the preceding 12 months (or for such shorter period that the registrant was required to file such reports), and (2) has been subject to such filing requirements for the past 90 days.
|
Yes ☒ |
|
No ☐ |
Indicate by check mark whether the registrant has submitted electronically and posted on its website, if any, every Interactive Data File required to be submitted and posted pursuant to Rule 405 of Regulation S-T during the preceding 12 months (or for such shorter period that the registrant was required to submit and post such files).
|
Yes ☒ |
|
No ☐ |
Indicate by check mark if disclosure of delinquent filers pursuant to item 405 of Regulation S-K is not contained herein, and will not be contained, to the best of registrant’s knowledge, in definitive proxy or information statements incorporated by reference in Part III of this Form 10-K or any amendment to this Form 10-K. ☐
Indicate by check mark whether the registrant is a large accelerated filer, an accelerated filer, a non-accelerated filer, or a smaller reporting company. See the definition of “large accelerated filer”, “accelerated filer”, and “smaller reporting company” in Rule 12b-2 of the Exchange Act.
Large Accelerated Filer ☐ Accelerated Filer ☒ Non-Accelerated Filer ☐ Smaller Reporting Company ☐
Indicate by check mark whether the registrant is a shell company (as defined in Rule 12b-2 of the Exchange Act).
|
Yes ☐ |
|
No ☒ |
The aggregate market value of the voting stock held as of the registrant’s most recently completed second fiscal quarter by non-affiliates of the registrant, based upon the closing sale price of the Common Stock on December 31, 2013, as reported by the NASDAQ Global Market, was approximately $119,100,000 (assuming, but not admitting for any purpose, that all directors and executive officers of the registrant are affiliates).
The number of shares of Common Stock, $0.01 par value, issued and outstanding as of September 8, 2014, was 9,151,956.
DOCUMENTS INCORPORATED BY REFERENCE
Portions of the following document, to the extent specified in this report, are incorporated by reference in Part III of this report:
|
Document |
|
Incorporated by reference in: |
|
Proxy Statement for 2014 |
|
|
|
Annual Meeting of Shareholders |
|
Part III, Items 10-14 |
1
PART I
ITEM 1:BUSINESS
General
Perceptron, Inc. (“Perceptron” or the “Company”) develops, produces and sells non-contact measurement and inspection solutions for industrial applications. Perceptron products provide solutions for manufacturing process control as well as sensor and software technologies for non-contact measurement, scanning and inspection applications. These products are used by the Company’s customers throughout the world to help manage their complex manufacturing processes to improve quality, shorten product launch times, reduce overall manufacturing costs and for digitizing and reverse engineering applications. The Company services multiple markets, with the largest being the automotive industry. The Company’s primary operations are in North America, Europe and Asia.
The Company’s products are categorized as follows:
In Process and Offline Measurement Solutions. Sales of these products involve the development, manufacture and installation of:
|
· |
In Process fixed and robot-mounted laser-based, non-contact dimensional gauging systems used in original equipment manufacturing plants and component supplier plants; and |
|
· |
In Process laser-based, non-contact systems that guide robots in a variety of automated assembly applications. |
|
· |
Offline fixed and robot-mounted laser-based, non-contact dimensional gauging systems used in original equipment manufacturing plants and component supplier plants. |
3D Scanning Products. Perceptron develops, manufactures and markets laser-based sensors and software used:
|
· |
As the critical sensing component on automotive assembly plant wheel-alignment machines, |
|
· |
As the critical component for 3-dimensional scanning on coordinate measurement machines (“CMM”) for the reverse engineering and inspection markets; and |
|
· |
As the critical component for 3-dimensional scanning on portable CMMs for the reverse engineering and inspection markets. |
Value Added Services. Perceptron also offers the following value added services:
|
· |
Training |
|
· |
Field Service |
|
· |
Launch Support Services |
|
· |
Consulting Services |
|
· |
Maintenance Agreements; and |
|
· |
Repairs. |
On August 30, 2012, the Company sold substantially all of the assets of its Commercial Products Business Unit (“CBU”). CBU financial information is presented as a discontinued operation in the financial statements included in this Form 10-K for fiscal year 2014 and prior year results are presented on a comparable basis.
The Company was incorporated in Michigan in 1981 and is headquartered at 47827 Halyard Drive, Plymouth, Michigan 48170-2461, (734) 414-6100. The Company also has operations in Munich, Germany; Voisins le Bretonneux, France; Barcelona, Spain; Sao Paulo, Brazil; Tokyo, Japan; Shanghai, China; Singapore and Chennai, India.
Markets
The Company primarily services the automotive manufacturing market but the Company’s technology is also applicable to a variety of other manufacturing industries. The Company has product offerings encompassing many manufacturing processes, including complex part assembly, automotive body construction, construction of automotive closures, closure installation and fitting, glass installation, adhesive and sealer application and laser cutting.
2
Products and Applications
In Process and Offline Measurement Solutions
All of the measurement solutions are based on Perceptron’s sensors and software. Solutions are developed by the Company’s engineers applying Helix® and TriCam® sensors with Vector software. Measurement solutions in fiscal 2014, 2013, and 2012 represented 85%, 84% and 80% of total sales, respectively.
AutoGauge®: These systems are used in the assembly and fabrication plants of many of the world’s leading automotive manufacturers to contain, correct and control the quality of complex assemblies. AutoGauge® systems are placed directly in the manufacturing line or near the line to automatically measure critical dimensional characteristics of parts using non-contact, laser triangulation sensors. AutoGauge® can be installed as a “multi-sensor system” with fixed-mounted sensors, as a “robotic system” utilizing only robot-mounted sensors, or as a “hybrid system” involving both fixed-mounted sensors and robot-mounted sensors. This ability provides manufacturers with the flexibility to measure multiple part types on a single manufacturing line while maintaining high-speed production rates.
AutoGauge® Plus: This system offers inline freeform surface scanning and discrete feature measurement in one solution. Users of AutoGauge® Plus can create a fully-customized gauging solution that automatically converts from collecting precise, discrete measurements to capturing complete 3D point clouds. AutoGauge® Plus delivers both the speed of in-line measurement and the data density of automated scanning.
AutoFit®: These systems are used in automotive manufacturing plants to contain, correct and control the fit of exterior body panels. The system automatically measures, records and displays the gap and flushness of parts most visible to the automobile consumer such as gaps between front and rear doors, hoods and fenders, and deck lids and rear quarter panels. The Company’s laser triangulation sensors have been enhanced to enable gap and flushness to be measured in multiple parts of the manufacturing process: in the body shop during assembly of non-painted vehicles, and in the final assembly area after the vehicle has been painted. AutoFit® has the ability to measure vehicles while in motion along the assembly line or in a stationary position.
AutoScan®: These systems provide a fast, non-contact method of gathering data for the analysis of the surface contour of a part or product such as automotive closure panels including doors, deck lids, and hoods. These systems use robot-mounted sensors specifically designed to “scan” a part as the robot moves throughout its path. The AutoScan® system collects the “point cloud data” required for contour analysis and dimensional feature extraction. This allows the part’s shape to be automatically scanned and compared to a computer-generated design and to report specific measurements on the part.
AutoGuide®: These robot guidance systems were developed in response to the increasing use of robots for flexible, automated assembly applications. These systems utilize Perceptron sensors and measurement technology to improve the performance of robotic assembly operations. AutoGuide® systems calculate the difference between theoretical and actual relationships of a robot and the part being assembled and send compensation data, in six degrees of freedom, to the robot. Robotic applications supported by AutoGuide® include windshield insertion, roof loading, hinge mounting, door attachment, sealant application and many others.
Helix®: Is an innovative and versatile 3D metrology solution that enables manufacturers to perform their most challenging measurement tasks with greater ease and precision. Helix® solutions offer Intelligent Illumination® allowing the user to choose the quantity, density and orientation of the sensor's laser lines on an individual inspection point level without moving the sensor. By customizing the sensor's laser lines through a simple user interface, image acquisition is optimized on a feature-by-feature basis. The user can configure tightly spaced laser lines for small, complex features, increase the number of laser lines to robustly measure challenging materials, and alter the orientation of the laser lines to accommodate the differences between multiple parts manufactured on the same assembly line.
3D Scanning Products
3D Scanning Products in fiscal 2014, 2013, and 2012 represented 10%, 11% and 14% of total sales, respectively.
ScanWorks®: The Company provides ScanWorks® products to a variety of markets through third party original equipment manufacturers and value-added resellers. These products target the digitizing, reverse engineering, and inspection markets. ScanWorks® is a hardware/software component set that allows customers to add digitizing capabilities to their machines or systems. The use of the ScanWorks® software and the Contour Probe® sensor enables technicians to collect, display, manipulate and export large sets of “point cloud data” from optical tracking devices, portable CMMs or CMMs. The majority of ScanWorks® sales occur outside of the automotive industry.
3
ScanWorks®xyz: This product is a 3D scanning solution designed for retrofitting 3-axis machines. It features all of the components required to add non-contact scanning capability to 1-, 2- or 3-axis CMMs, computer numerical controls, and layout machines in a cost-effective manner. The retrofitting of these machines with ScanWorks®xyz allows end users to repurpose their existing equipment and increase their throughput by scanning more parts in less time.
WheelWorks®: WheelWorks® software and sensors offer a fast, accurate, non-contact method of measuring wheel position for use in automated or manual wheel alignment machines in automotive assembly plants. The Company supplies sensors and software to a number of wheel alignment equipment manufacturers in Europe, Asia and North America who in turn sell alignment systems to automotive manufacturers.
Value Added Services
Value Added Services: Value Added Services sales in fiscal 2014, 2013, and 2012 represented 5%, 5% and 6% of total sales, respectively. Value Added Services include training, field service, launch support services, consulting services, maintenance agreements and repairs.
Sales and Marketing
The Company markets its products directly to end user customers, and through manufacturing line builders, system integrators, value-added resellers and original equipment manufacturers.
The Company’s sales efforts are led by account managers who develop a close consultative selling relationship with the Company’s customers. The Company’s principal customers have historically been automotive manufacturing companies that the Company either sells to directly or through manufacturing line builders, system integrators or assembly equipment manufacturers. The Company’s products are typically purchased for installation in connection with retooling programs undertaken by these companies. Because sales are dependent on the timing of customers’ retooling programs, sales by customer vary significantly from year to year, as do the Company’s largest customers. For the fiscal years 2014, 2013 and 2012, approximately 43%, 46% and 51%, respectively, of net sales were derived from the Company’s four largest automotive end user customers. The Company also sells to manufacturing line builders, system integrators or original equipment manufacturers, who in turn sell to the Company’s automotive customers. For the fiscal years 2014, 2013 and 2012, approximately 16%, 7% and 13%, respectively, of net sales were to manufacturing line builders, system integrators and original equipment manufacturers for the benefit of the same four largest automotive end user customers in each respective year. During the fiscal year ended June 30, 2014, direct sales to Volkswagen Group accounted for approximately 30% of the Company’s total net sales. At June 30, 2014, accounts receivable from Volkswagen Group totaled approximately $4.7 million.
Manufacturing and Suppliers
The Company’s manufacturing operations consist primarily of pre- and final assembly of hardware components and the testing and integration of the Company’s software with the hardware components. The Company builds its products from a combination of commercially available parts and uniquely designed parts. The components are primarily manufactured by third parties. Individual components such as printed circuit boards are manufactured by third parties according to the Company’s designs. The Company believes a low level of vertical integration gives it significant manufacturing flexibility and minimizes total product costs.
The Company purchases certain component parts and assemblies from single source suppliers. With respect to most of its components, the Company believes that alternative suppliers are readily available. Component supply shortages in certain industries, including the electronics industry, have occurred in the past and are possible in the future due to imbalances in supply and demand. The Company uses global purchasing sources to minimize the risk of part shortages. The Company has not experienced significant component supply shortages from single source suppliers in recent years. Significant delays or interruptions in the delivery of components, assemblies or products by suppliers, or difficulties or delays in shifting manufacturing capacity to new suppliers, could have a material adverse effect on the Company.
International Operations
Europe: The Company’s European operations contributed approximately 47%, 43% and 32%, of the Company’s net sales during the fiscal years ended June 30, 2014, 2013, and 2012, respectively. The Company’s wholly-owned subsidiary, Perceptron Europe B.V. (“Perceptron B.V.”), formed in The Netherlands, holds a 100% equity interest in Perceptron (Europe) GmbH (“Perceptron GmbH”). Perceptron GmbH is located in Munich, Germany and is the operational headquarters for the European market. Perceptron GmbH holds a 100% interest in Perceptron E.U.R.L. located in Voisins le Bretonneux, France and a 100% interest in Perceptron Iberica SL located in Barcelona, Spain. At June 30, 2014, the Company employed 71 people in its European operations.
4
Asia: The Company’s Asian operations contributed approximately 23%, 21% and 22% of the Company’s net sales during the fiscal years ended June 30, 2014, 2013, and 2012, respectively. The Company operates direct sales, application and support offices in Tokyo, Japan; Shanghai, China; Singapore; and Chennai, India to service customers in Asia. At June 30, 2014, the Company employed 41 people in its Asian operations.
South America: The Company has a direct sales, application and support office in Sao Paulo, Brazil to service customers in South America. At June 30, 2014, the Company employed 5 people in its Brazilian operations.
The Company’s foreign operations are subject to certain risks typically encountered in such operations, including fluctuations in foreign currency exchange rates and controls, expropriation and other economic and local policies of foreign governments, and the laws and policies of the U.S. and local governments affecting foreign trade and investment. For information regarding net sales and identifiable assets of the Company’s foreign operations, see Note 12 of the Notes to the Consolidated Financial Statements, “Segment and Geographic Information”, included in item 8 of this report.
Competition
The Company believes that its products provide the best and most complete solutions for its customers in terms of system capabilities, levels of support, and competitive pricing for the value provided, which it believes are the principal competitive factors in its markets. The Company also believes it is further along in the development of its technology for certain of its products than any of its competition.
There are a number of companies that sell similar and/or alternative technologies and methods into the same markets and regions as the Company. The Company believes that there may be other entities, some of which may be larger and have greater resources than the Company, that could develop technology and products, which could prove to be competitive with those of the Company. The Company also believes that certain existing or potential customers may be capable of internally developing their own technology. In addition, certain automotive original equipment manufacturers have not yet adopted in-line dimensional metrology into their assembly process and use a combination of hand-held gauges and off-line sampling of parts to control process variation in place of Perceptron’s technology. The Company believes these original equipment manufacturers represent an opportunity for further penetration and growth in the automotive industry. See Item 1A: “Risk Factors” titled “There are a number of companies offering competitive products in our markets, or developing products to compete with our products, which could result in a reduction in our revenues through lost sales or a reduction in prices”.
Backlog
As of June 30, 2014, the Company had a backlog of $39.3 million, compared to $30.4 million at June 30, 2013. Most of the backlog is subject to cancellation by the customer with penalty provisions. The level of order backlog at any particular time is not necessarily indicative of the future operating performance of the Company. The Company expects to be able to fill substantially all of the orders in its backlog by June 30, 2015.
Research and Development
In fiscal year 2014, research and development focused primarily on the Company’s innovative Helix® 3D metrology solution. Helix® solutions offer Intelligent Illumination®, a patented breakthrough that allows users to control the sensor's calibrated light source. By customizing the quantity, density, and orientation of the sensor's laser lines through a simple user interface, image acquisition is optimized on a feature-by-feature basis. The user can configure tightly spaced laser lines for small, complex features, increase the number of laser lines to robustly measure challenging materials, and alter the orientation of the laser lines to accommodate the differences between multiple parts manufactured on the same assembly line. That customization ability translates directly into better measurements, better information and better process control decisions. Helix® sensors offer an expansive measurement volume. A large measurement volume provides customers with more measurement points using fewer sensors than existing solutions. Helix® is expected, over time, to replace all of the Company’s current Measurement Solutions beginning with AutoGauge®.
As of June 30, 2014, 41 persons employed by the Company were focused primarily on research, development and engineering. For the fiscal years ended June 30, 2014, 2013 and 2012, the Company’s research, development and engineering expenses were $6.7 million, $6.8 million and $5.6 million, respectively.
Patents, Trade Secrets and Confidentiality Agreements
As of June 30, 2014, the Company owns 19 U.S. patents that have been granted to it, and has 3 U.S. patent applications pending, which relate to various products and processes manufactured, used, and/or sold by the Company. The Company also owns 4 foreign patents that have been granted to it in Europe, China and Japan and has 14 patent applications pending in foreign locations. The U.S. and foreign patents expire from 2016 through 2031. In addition, the Company holds perpetual
5
licenses to more than 25 other U.S. patents including rights to practice 7 U.S. patents for non-forest product related applications that were assigned to USNR in conjunction with the sale of the Forest Products business unit in 2002, and rights to practice 9 U.S. patents that were sold in conjunction with the sale of CBU in August 2012. The expiration dates for these licensed patents range from 2014 to 2030.
The Company has registered, and continues to register, various trade names and trademarks including Perceptron®, Powered by Perceptron®, AutoGauge®, AutoFit®, AutoGuide®, AutoScan®, AutoSolve®, Contour Probe®, ScanWorks®, TriCam®, WheelWorks®, Visual Fixturing®, Helix®, and Intelligent Illumination®, among others, which are used in connection with the conduct of its business.
Perceptron’s products include hardware (camera, lens, etc.) for scanning an image and imbedded software (extraction software algorithms) to convey the results of the scan to the customer. The hardware and software operate and are sold as one product. Perceptron generally does not market its software algorithms as a separate item distinct from the scanning product. The Company’s software products are copyrighted and generally licensed to customers pursuant to license agreements that restrict the use of the products to the customer’s own internal purposes on designated Perceptron equipment.
The Company also uses proprietary information and invention agreements and non-disclosure agreements with employees, consultants and other parties.
There can be no assurance that any of the above measures will be adequate to protect the Company’s intellectual property or other proprietary rights. Effective patent, trademark, copyright and trade secret protection may be unavailable in certain foreign countries.
In the past, the Company had been informed that certain of its customers had received allegations of possible patent infringement involving processes and methods used in the Company’s products. Certain of these customers, including customers who were parties to patent infringement suits relating to this matter, settled such claims. Management believes that the processes used in the Company’s products were independently developed without utilizing any previously patented process or technology.
Employees
As of June 30, 2014, the Company employed 245 persons, 242 of whom were employed on a full-time basis with 128 located in North America and the remainder distributed across the globe as identified above in International Operations. None of the employees are covered by a collective bargaining agreement and the Company believes its relations with its employees to be good.
Available Information
The Company’s Internet address is www.perceptron.com. On the website, the Company makes available, free of charge, its annual report on Form 10-K, quarterly reports on Form 10-Q, current reports on Form 8-K and any amendments to those reports, as soon as reasonably practicable after the Company electronically files such material with, or furnishes it to, the Securities and Exchange Commission (“SEC”). These reports can be accessed through the “Investors” section of the Company’s website under “SEC Filings”. The information found on the Company’s website is not part of this or any report the Company files with, or furnishes to, the SEC.
ITEM 1A:RISK FACTORS
An investment in our Common Stock involves numerous risks and uncertainties. You should carefully consider the following information about these risks. Any of the risks described below could result in a significant or material adverse effect on our future results of operations, cash flows or financial condition. The risks and uncertainties described below are not the only ones we face. Additional risks and uncertainties that we are unaware of, or that we currently deem immaterial, also may become important factors that adversely affect our business in the future. We believe that the most significant of the risks and uncertainties we face are as follows:
Our revenues are highly influenced by the sale of products for use in the global automotive market, particularly by manufacturers based in the United States, China, and Western Europe. These manufacturers have experienced periodic downturns in their businesses that could adversely affect their level of purchases of our products.
Our revenues are highly influenced by the sale of products for use in the automotive industry, particularly to manufacturers based in the United States, China and Western Europe. As a result, our ability to sell our systems and solutions to automotive manufacturers and suppliers is affected by periodic downturns in the global automotive industry, such as those that occurred in 2009-2010 in the United States automotive industry.
6
New vehicle tooling programs are the most important selling opportunity for our automotive-related sales. The number and timing of new vehicle tooling programs can be influenced by a number of economic factors. Our customers only launch a limited number of new car programs in any given year because of the time and financial resources required. From a macro perspective we continue to assess the global economy and its likely effect on our automotive customers and markets served. We continue to view the automotive industry’s focus on introducing new vehicles more frequently to satisfy their customers’ changing requirements, as well as their continuing focus on improved quality, as positive indicators for new business. However, because of periodic economic downturns experienced by our customers, our customers could determine to reduce their number of new car programs. The automobile industry is a very cost competitive industry. Pricing pressures could adversely affect the margins we realize on the sale of our products, and ultimately, our profitability.
Global economic conditions may negatively impact our results of operations.
Our revenue levels are impacted by global economic conditions, as we have a significant business presence in many countries throughout the world. In 2009-2010, the global economic crisis resulted in significantly lower demand for our products, as our automotive customers experienced deterioration in their business. Although our business has recovered since that time, global economic conditions have not fully recovered in certain regions. The automotive industry, which represents our largest market, is particularly impacted by changing global economic conditions and consumer spending. As a result, a significant decline in global economic conditions could have a material adverse impact on our results of operations.
Current levels of market volatility adversely impact the market price of our Common Stock.
The capital and credit markets are subject to volatility and disruption. During such a period, the volatility and disruption could reach unprecedented levels, which would exert downward pressures on stock prices, including the market price of our Common Stock.
Our future success is dependent upon our ability to implement our long-term growth strategy.
We realize that we are vulnerable to fluctuations in the global automotive industry. Our future success is dependent upon our ability to implement our long-term strategy that includes expanding our customer base in our automotive markets and expanding into new markets. Currently, we are focusing on our plans to achieve sales growth in automotive markets through expansion in automotive markets in Asia and the expansion of our business with current customers in North America, South America and Europe. We also continue to explore opportunities for expansion into non-automotive markets through our existing and new products. However, there are a number of uncertainties involved in our long-term strategy over which we have no or limited control, including:
•The quality and cost of competitive products already in existence or developed in the future.
•The level of interest existing and potential new customers may have in our existing and new products and technologies.
•Our ability to resolve technical issues inherent in the development of new products and technologies.
•Our ability to identify and satisfy market needs.
•Our ability to identify satisfactory distribution networks.
•General product development and commercialization difficulties.
•Rapid or unexpected technological changes.
•General product demand and market acceptance risks.
•Our ability to successfully compete with alternative and similar technologies.
•Our ability to attract the appropriate personnel to effectively represent, install and service our products.
•The effect of economic conditions.
Even if we are able to expand our customer base and markets, the new revenues we derive may not offset declines in revenues from our current products. We also may not be able to generate profits from these new customers or markets at the same level as we generate from our current business. There can be no assurance that we will be able to expand our customer base and markets or successfully execute our strategies in a fashion to maintain or increase our revenues and profits.
A significant percentage of our revenues are derived from a small number of customers, so that the loss of any one of these customers could result in a significant reduction in our revenues and profits.
A majority of our revenues is derived from the sale of systems and solutions to a small number of customers that consist primarily of automotive manufacturers and suppliers in North America, Western Europe and Asia.
With such a large percentage of our revenues coming from such a small and highly concentrated group of customers, we are susceptible to a substantial risk of losing revenues if these customers stop purchasing our products or reduce their purchases
7
of our products. In addition, we have no control over whether these customers will continue to purchase our products, systems and solutions in volumes or at prices sufficient to generate profits for us.
Our future commercial success depends upon our ability to maintain a competitive technological position in our markets, which are characterized by continual technological change.
Technology plays a key role in the systems and solutions that we produce. Our ability to sell our products to customers is directly influenced by the technology used in our systems and solutions. With the rapid pace at which technology is changing, there is a possibility that our customers may require more technologically advanced systems and solutions than what we may be capable of producing.
Technological developments could render actual and proposed products or technologies of ours uneconomical or obsolete. There also is a possibility that we may not be able to keep pace with our competitors’ products. In that case, our competitors may make technological improvements to their products that make them more desirable than our products.
Our growth and future financial performance depend upon our ability to introduce new products and enhance existing products that include the latest technological advances and customer requirements. We may not be able to introduce new products successfully or achieve market acceptance for such products. Any failure by us to anticipate or respond adequately to changes in technology and customer preferences, or any significant delays in product development or introduction, could have a material adverse effect on our business. Accordingly, we believe that our future commercial success will depend upon our continued ability to develop and introduce new cost-effective products and maintain a competitive technological position.
We are dependent on proprietary technology. If our competitors develop competing products that do not violate our intellectual property rights or successfully challenge those rights, our revenues and profits may be adversely affected.
Our products contain features that are protected by patents, trademarks, trade secrets, copyrights, and contractual rights. Despite these protections, there is still a chance that competitors may use these protected features in their products as a result of our inability to keep our trade secrets confidential, or in violation of our intellectual property rights or following a successful challenge to those rights. The prosecution of infringement claims against third parties and the defense of legal actions challenging our intellectual property rights could be costly and require significant attention from management. Because of the small size of our management team, this could result in the diversion of management’s attention from day-to-day operations.
There also is a chance that competitors may develop technology that performs the same functions as our products without infringing upon our exclusive rights. It is possible that competitors may reverse engineer those features of our products that are not protected by patents, trademarks and trade secrets. If a competitor is able to reverse engineer an unprotected feature successfully, the competitor may gain an understanding of how the feature works and introduce similar products to compete with our products.
Because some of our products are sold in China, we are at risk of competitors misappropriating our intellectual property included in those products or reverse engineering those products. As a result, we may have a more limited ability, and significantly greater costs, to enforce our intellectual property rights in those products. Constant technological improvement of those products will be particularly important to keep the products competitive in their markets.
We are subject to risks related to litigation.
From time to time, we are subject to lawsuits and other claims arising out of our business operations. Adverse judgments in one or more of these lawsuits could require us to pay significant damage amounts. The outcome of lawsuits is inherently uncertain and typically a loss cannot be reasonably estimated or accrued by us relating to lawsuits. Accordingly, if the outcome of a legal proceeding is adverse to the Company, we would have to record a charge for the matter at the time the legal proceeding is resolved and generally in the full amount at which it is resolved. In addition, the expenses related to these lawsuits may be significant. Lawsuits can have a material adverse effect on our business and operating results, particularly where we have not established an accrual or a sufficient accrual for damages, settlements, or expenses. See “Item 3 – Legal Proceedings” and Item 7, “Management’s Discussion and Analysis of Financial Condition and Results of Operations – Critical Accounting Policies – Litigation and Other Contingencies” below for a discussion of the Company’s policies in accounting for lawsuits and other claims.
We could become involved in costly litigation alleging patent infringement.
In the past, we had been informed that certain of our customers have received allegations of possible patent infringement involving processes and methods used in our products. Certain of these customers, including one customer who was a party to a patent infringement suit relating to this matter, settled such claims. We believe that the processes used in our products were independently developed without utilizing any previous patented process or technology. However, it is possible that in the future
8
we or our customers could receive allegations of possible patent infringement or could be parties to patent infringement litigation relating to our products.
The defense of patent infringement litigation could be costly and require significant attention from management. Because of the small size of our management team, this could result in the diversion of management’s attention from day-to-day operations.
There are a number of companies offering competitive products in our markets, or developing products to compete with our products, which could result in a reduction in our revenues through lost sales or a reduction in prices.
We are aware of a number of companies in our markets selling products using similar or alternative technologies and methods. We believe that there may be other companies, some of whom may be substantially larger and have substantially greater resources than us, which may be engaged in the development of technology and products for some of our markets that could prove to be competitive with ours. We believe that the principal competitive factor in our markets is the total capability that a product offers. In some markets, a competitive price for the level of functionality and reliability provided are the principal competitive factors. While we believe that our products compete favorably, it is possible that these competitors could capture some of our sales opportunities or force us to reduce prices in order to complete the sale.
We believe that certain existing and potential customers may be capable of internally developing their own technology. This could cause a decline in sales of our products to those customers.
Our business depends on our ability to attract and retain key personnel.
Our success depends in large part upon the continued service of our executives and key employees, including those in engineering, technical, sales and marketing positions, as well as our ability to attract such additional employees in the future. At times and in certain geographic markets, competition for the type of highly skilled employees we require can be significant. The loss of key personnel or the inability to attract new qualified key employees could adversely affect our ability to implement our long-term growth strategy and have a material adverse effect on our business.
We may not be able to complete business opportunities and acquisitions and our profits could be negatively affected if we do not successfully operate those that we do complete.
We will evaluate from time to time business opportunities that fit our strategic plans. There can be no assurance that we will identify any opportunities that fit our strategic plans or will be able to enter into agreements with identified business opportunities on terms acceptable to us. The Company may incur significant due diligence and legal costs with no assurance that an acquisition or business opportunity will be consummated after incurring these costs. If we are unable to identify and complete acquisitions that fit our strategic plans, we may not be able to fully implement our expansion plans for the Company.
There is also no assurance that we will be able to effectively integrate businesses that we may acquire due to the significant challenges in consolidating functions and integrating procedures, personnel, product lines, technologies and operations in a timely and efficient manner. The integration process may require significant attention from management and devotion of resources. Because of the small size of our management team, this could result in the diversion of management’s attention from day-to-day operations and impair our relationships with current employees and customers.
We intend to finance any such business opportunities from available cash on hand, existing credit facilities, issuance of additional stock or additional sources of financing, as circumstances warrant. We could use a significant portion of our available cash on hand and incur substantial debt or other contingent liabilities in connection with these acquisition opportunities. The issuance of additional equity securities to finance an acquisition could be substantially dilutive to our stockholders. In addition, our profitability may suffer because of acquisition-related costs, debt service requirements or amortization costs for acquired intangible assets. In addition, if the business opportunities do not perform as expected, we could incur impairment charges related to goodwill or other intangibles acquired by us. If we are not successful in generating additional profits from these transactions, this dilution and these additional costs could cause our Common Stock price to drop.
We are expanding our foreign operations, increasing the possibility that our business could be adversely affected by risks of doing business in foreign countries.
We have significant operations outside of the United States and are currently implementing a strategy to expand our operations outside of the United States, especially in Asia.
Our foreign operations are subject to risks customarily encountered in such foreign operations. For instance, we may encounter fluctuations in foreign currency exchange rates, differences in the level of protection available for our intellectual property, the impact of differences in language and local business and social customs on our ability to market and sell our products in these markets, the inability to recruit qualified personnel in a specific country or region, more stringent employment regulations and
9
local labor conditions and difficulties in repatriating cash earned in other countries back to the United States. In addition, we may be affected by U.S. laws and policies that impact foreign trade and investment. Finally, we may be adversely affected by laws and policies imposed by foreign governments in the countries where we have business operations or sell our products. These laws and policies vary from jurisdiction to jurisdiction.
Because of our significant foreign operations, our revenues and profits can vary significantly as a result of fluctuations in the value of the United States dollar against foreign currencies.
Products that we sell in foreign markets are sometimes priced in currency of the country where the customer is located. To the extent that the dollar fluctuates against these foreign currencies, the prices of our products in U.S. dollars also will fluctuate. As a result, our return on the sale of our products may vary based on these fluctuations. Accordingly, we could experience unanticipated foreign currency gains or losses that could have a material impact on our results of operations.
We face various risks arising from the legal, regulatory and tax requirements imposed on our operations in the various countries in which we conduct our business operations.
We are subject to various risks relating to our compliance with existing and new laws, rules and regulations implemented in the countries in which we conduct our business operations, including anti-corruption, anti-bribery, tax, material composition of our products, such as restrictions on lead and other substances, environmental, safety and export control regulations.
We are subject to the United States Foreign Corrupt Practices Act, or FCPA, which generally prohibits companies and their intermediaries from making improper payments to foreign officials for the purpose of obtaining or keeping business or other benefits. As a result of our foreign operations, we may have contact with persons who are considered foreign officials under the FCPA, putting us at an increased risk of potential FCPA violations.
Our failure or inability to comply with any of these laws, rules or regulations could subject us to civil or criminal penalties, other remedial measures or financial or regulatory obligations that may adversely affect our results of operations, financial position, reputation or ability to conduct business. We may receive audit notices or other inquiries from governmental or regulatory authorities, and we may participate in voluntary disclosure programs, related to legal, regulatory or tax compliance matters. These audits, inquiries or disclosure programs or any non-compliance with applicable laws, rules or regulations could result in our incurring material expense, including investigation costs, defense costs, assessments and penalties, or other consequences that could materially adversely affect our results of operations, financial position, reputation or ability to conduct business.
Because a large portion of our revenues are generated from a limited number of sizeable orders, our revenues and profits may vary widely from quarter to quarter and year to year.
A large portion of our revenues are generated from a limited number of sizeable orders that are placed by a small number of customers. If the timing of these orders is delayed from one quarter to the next or from one year to the next, we may experience fluctuations in our quarterly and annual revenues and operating results. Because our order terms vary from project to project, the application of the Company’s revenue recognition accounting policies to those orders can cause the timing for our recognition of revenue from an order to vary significantly between orders. This may cause our revenues and operating results to vary significantly from quarter to quarter and year to year.
The amount of revenues that we earn in any given quarter may vary based in part on the timing of new vehicle programs in the global automotive industry. In contrast, many of our operating expenses are fixed and will not vary from quarter to quarter. As a result, our operating results may vary significantly from quarter to quarter and from year to year.
We could experience losses in connection with sales of our investments.
The Company has a long-term investment that was exchanged for preferred stock of a reinsurance company. This investment has not been registered under the Securities Act of 1933 and may not be offered or sold in the United States absent registration or an applicable exemption from the registration requirements. The issuer of this security is not obligated to register the security. There is no regular trading market for these securities. As a result, we will have limited ability to liquidate the investment. This lack of liquidity, as well as negative changes in the financial condition of the issuer of the security and credit rating, has adversely impacted the value of the security. In the event that the financial condition of the issuer should continue to deteriorate, we may have to record additional impairment charges relating to the security, which would negatively impact our stockholders’ equity and net income. See Item 7 “Management’s Discussion and Analysis of Financial Condition and Results of Operations – Liquidity and Capital Resources”.
The trading price of our stock has been volatile.
The following factors may affect the market price of our Common Stock, which can vary widely over time:
10
•announcements of new products by us;
•announcements of new products by our competitors;
•variations in our operating results;
•market conditions in the electronic and sensing industry and/or automotive industry;
•market conditions and stock prices in general; and
•the volume of our Common Stock traded.
Because of the limited trading in our Common Stock, it may be difficult for shareholders to dispose of a large number of shares of our Common Stock in a short period of time or at then current prices.
Because of the limited number of shares of our Common Stock outstanding and the limited number of holders of our Common Stock, only a limited number of shares of our Common Stock trade on a daily basis. This limited trading in our Common Stock makes it difficult to dispose of a large number of shares in a short period of time. In addition, it is likely that the sale by a shareholder of a large number of shares of our Common Stock over an extended period would depress the price of our Common Stock.
We may decide not to pay dividends on our common stock in the future.
Holders of our common stock are only entitled to receive such dividends when and if they are declared by our Board of Directors. Our Board of Directors may change the Company’s dividend policy and dividend amounts at any time, or discontinue the payment of dividends altogether, due to a number of factors, including covenants in the Company’s loan agreement requiring the approval of the Company’s bank prior to the payment of dividends above stated levels, the Company’s levels of available capital, the Company’s future operating results, or the determination to use or reserve the Company’s cash resources for other purposes. This could adversely affect the market price of our common stock.
We may be restricted under our loan agreement from paying higher dividends.
The Company’s Amended and Restated Credit Agreement allows the Company to declare and pay dividends of up to $2.5 million for each fiscal year, provided the Company maintains a minimum Tangible Net Worth as defined in the Credit Agreement. In the event the Board of Directors decided to declare a cash dividend in the future in excess of these levels, we would have to seek a waiver from the covenant in our bank agreement. Our bank may not be willing to waive the restriction.
As permitted under Michigan law, our directors are not liable to Perceptron for monetary damages resulting from their actions or inactions.
Under our articles of incorporation, as permitted under the Michigan Business Corporation Act, members of our Board of Directors are not liable for monetary damages for any negligent or grossly negligent action that the director takes, or for any negligent or grossly negligent failure of a director to take any action. However, a director will remain liable for:
•intentionally inflicting harm on Perceptron or its shareholders;
•distributions that the director makes in violation of the Michigan Business Corporation Act; and
•intentional criminal acts that the director commits.
However, we or our shareholders may seek an injunction, or other appropriate equitable relief, against a director. Finally, liability may be imposed against members of the Board of Directors under the federal securities laws.
We are required to indemnify our officers and directors if they are involved in litigation as a result of their serving as officers or directors of Perceptron or as officers or directors of other corporations at our behest, which could reduce our profits and cash available to operate our business.
Our by-laws require us to indemnify our officers and directors. We may be required to pay judgments, fines and expenses incurred by an officer or director, including reasonable attorneys’ fees, as a result of actions or proceedings in which such officers or directors are involved by reason of being or having been an officer or director of Perceptron or other corporations at our behest.
Funds paid in satisfaction of judgments, fines and expenses would reduce our profits and may be funds we need for the operation of our business and the development of products. This could cause our stock price to drop.
A change in our effective tax rate can have a significant adverse impact on our business.
11
A number of factors may adversely impact our future effective tax rates, such as the future valuation of our deferred tax assets which are predominantly in the United States and are dependent on our ability to generate sufficient future taxable income in the United States; the geographic composition of our pre-tax income and the various tax rates in those countries; changes in available tax credits, changes in tax laws and rates, and the repatriation of earnings from outside the United States for which we have not previously provided for United States taxes. A change in our effective tax rate can adversely impact our net income.
We may have additional tax liabilities, which could adversely affect our results of operations.
We are subject to income taxes in the United States and foreign jurisdictions, including Germany and China. In determining our provisions for income taxes, we make judgments regarding various tax positions reported on our tax returns. As a result, there are transactions and calculations where the ultimate tax determination is uncertain. Our tax returns are regularly under audit by tax authorities. Because of these uncertain tax positions, the final determination of these tax audits could be materially different than is reflected in our financial statements and could have a material adverse effect on our provisions for income taxes, results of operations, or cash flows.
Our profits could be reduced as a result of our compliance with SEC rules relating to our internal control over financial reporting.
Current SEC rules require our independent registered public accounting firm auditing our financial statements to provide an attestation report on our internal control over financial reporting in our annual reports.
For the fiscal years 2009 through 2013, the Company was not required to have an attestation report from our independent registered public accounting firm on our internal controls. Because the Company’s common stock held by non-affiliates exceeded $75 million at December 31, 2013, we have to comply with these requirements in fiscal year 2014 and thereafter. We may have to expend significant resources in future fiscal years in connection with ongoing compliance with these requirements, which could adversely affect our profitability.
If management is not able to provide a positive report on our internal control over financial reporting, and our independent registered public accounting firm is not able to provide an unqualified opinion regarding our internal control over financial reporting, shareholders and others may lose confidence in our financial statements, which could cause our stock price to drop.
Because of our relatively small size, we are unable to have financial personnel in positions that are devoted solely to internal controls over financial reporting. However, management has had a continuous program in effect to evaluate and test internal controls through the utilization of outside, independent accountants.
In fiscal 2008 through fiscal 2014, management provided positive reports on our internal control over financial reporting and we received in fiscal 2008 and 2014 an unqualified opinion from our independent registered public accounting firm regarding our internal control over financial reporting. In fiscal 2009 through fiscal 2013, our auditors were not required to give an opinion on our internal control over financial reporting following SEC rules for companies that had a market value of common stock held by non-affiliates that was less than $75 million as of the companies’ second fiscal quarter in any given fiscal year. The Company’s Common Stock held by non-affiliates exceeded $75 million at December 31, 2013. Accordingly, we will comply with these requirements beginning in fiscal year 2014 and thereafter. There can be no positive assurance that, in the future, management will provide a positive report on our internal control over financial reporting or that we will receive an unqualified opinion from our independent registered public accounting firm regarding our internal control over financial reporting. In the event we identify significant deficiencies or material weaknesses in our internal controls that we cannot remediate in a timely manner, investors and others may lose confidence in the reliability of our financial statements. This could cause our stock price to drop.
If the subcontractors we rely on for component parts or products delay deliveries or fail to deliver parts or products meeting our requirements, we may not be able to deliver products to our customers in a timely fashion and our revenues and profits could be reduced.
We rely on subcontractors for certain components of our products, including outside subcontracting assembly houses to produce the circuit boards that we use in our products. As a result, we have limited control over the quality and the delivery schedules of components or products purchased from third parties. In addition, we purchase a number of component parts from single source suppliers. If our supplies of component parts or products meeting our requirements are significantly delayed or interrupted, or our subcontractors choose to terminate their supply contracts, we may not be able to deliver products to our customers in a timely fashion. This could result in a reduction in revenues and profits for these periods. The termination of or material change in the purchase terms of any single source supplier could have a similar impact on us. It is also possible, if our delay in delivering products to our customer is too long, the customer could cancel its order, resulting in a permanent loss of revenue and profit from that sale. Although we have not experienced significant supply shortages from single source suppliers in recent years, from time to time, we have experienced significant delays in the receipt of certain components.
12
Finally, although we believe that alternative suppliers are available, difficulties or delays may arise if we shift manufacturing capacity to new suppliers.
New regulations related to conflict minerals may adversely affect us.
The Dodd-Frank Wall Street Reform and Consumer Protection Act requires us to disclose whether our products contain “conflict minerals” mined from the Democratic Republic of Congo and adjoining countries (“DRC”), whether or not the components of our products are manufactured by us or third parties. In 2014, to meet the initial disclosure requirements, we began due diligence to determine the sources of the conflict minerals in our products. Because our supply chain is very complex, we may not be able to verify all the metals used in our products or the origin of all metals used in our products. The pricing, sourcing and availability of conflict minerals used in the manufacture of our products could be impacted by these new requirements. There are additional costs associated with complying with the disclosure requirements, such as costs related to our due diligence to determine the source of any conflict minerals used in our products. We may not be able to sufficiently verify the origins of all conflict metals used in our products and confirm that they are DRC conflict mineral free, which may adversely affect our reputations with our customers and shareholders.
Our failure to accurately forecast customer demand could result in excess or obsolete inventory and related write-downs or charges.
From time to time, we may strategically enter into non-cancelable commitments with vendors to purchase materials for our products in advance of demand to take advantage of favorable pricing or address concerns about long lead times for components used in our products that are purchased from third parties. Our failure to accurately forecast customer demand has led to, and may again in the future lead to, an increased risk of excess or obsolete inventory. This could result in write-downs of inventory and other related charges that would negatively affect our results of operations.
The occurrence of business system disruptions or information security breaches could adversely affect our business.
To our knowledge, we have not been subject to information security breaches; however, many other companies have experienced such breaches because of illegal hacking, computer viruses, or acts of vandalism or terrorism. While we have implemented security measures to protect against such breaches, it is possible that our security measures may not detect or prevent such breaches. Any such compromise to our information security could result in an interruption in our operations, the unauthorized publication of our confidential business or proprietary information, the unauthorized release of customer, vendor, or employee data, the violation of privacy or other laws, and the exposure to litigation, any of which could harm our business and operating results. A disruption to our management information systems could cause significant disruption to our business, including our ability to receive and ship orders, receive and process payments and timely report our financial results. Any disruption occurring with these systems may have a material adverse effect on our results of operations.
The Board of Directors has the right to issue up to 1,000,000 shares of preferred stock without further action by shareholders. The issuance of those shares could cause the market price of our Common Stock to drop significantly and could be used to prevent or frustrate shareholders’ attempts to replace or remove current management.
Although no preferred stock currently is outstanding, we are authorized to issue up to 1,000,000 shares of preferred stock. Preferred stock may be issued in one or more series, the terms of which may be determined at the time of issuance by the Board of Directors, without further action by shareholders, and may include voting rights (including the right to vote as a series on particular matters), the dividends payable thereon, liquidation payments, preferences as to dividends and liquidation, conversion rights and redemption rights. In the event that preferred stock is issued, the rights of the common stockholders may be adversely affected. This could result in a reduction in the value of our Common Stock.
The preferred stock could be issued to discourage, delay or prevent a change in control of Perceptron. This may be beneficial to our management or Board of Directors in a hostile tender offer or other takeover attempt and may have an adverse impact on shareholders who may want to participate in the tender offer or who favor the takeover attempt.
Our common stock rights plan could be used to discourage hostile tender offers.
We maintain a common stock rights plan. Under the plan, if any person acquires 15% or more of our outstanding Common Stock, our shareholders, other than the acquirer, will have the right to purchase shares of our Common Stock at half their market price. The common stock rights plan discourages potential acquirers from initiating tender offers for our Common Stock without the approval of the Board of Directors. This may be beneficial to our management or Board of Directors in a hostile tender offer or other takeover attempt and may have an adverse impact on shareholders who may want to participate in the tender offer or who favor the takeover attempt.
13
ITEM 1B:UNRESOLVED STAFF COMMENTS
Not applicable.
ITEM 2:PROPERTIES
Perceptron’s principal domestic facility consists of a 70,000 square foot building located in Plymouth, Michigan, owned by the Company. In addition, the Company leases a 1,576 square meter facility in Munich, Germany and leases office space in Voisins le Bretonneux, France; Sao Paulo, Brazil; Tokyo, Japan; Singapore; Shanghai, China; and Chennai, India. The Company believes that its current facilities are sufficient to accommodate its requirements through fiscal 2015.
ITEM 3:LEGAL PROCEEDINGS
On July 19, 2013, a civil suit was filed against the Company by 3CEMS, a Cayman Islands and People’s Republic of China corporation, with the U.S. District Court for the Eastern District of Michigan. The suit alleged that the Company breached its contractual obligations by failing to pay for component parts to be used to manufacture optical video scopes for the Company’s discontinued Commercial Products Business Unit. 3CEMS alleged that it purchased the component parts in advance of the receipt of orders from the Company based upon instructions they claimed to have received from the Company. The suit alleged damages of not less than $4.5 million. Effective December 6, 2013, a Tolling Agreement (the “Tolling Agreement”) was entered into between the Company and 3CEMS. The Tolling Agreement provided that 3CEMS would dismiss the suit against the Company without prejudice, permitting the parties to continue to discuss the dispute outside of litigation. On January 13, 2014, based upon 3CEMS’ voluntary dismissal, the Court entered an order of dismissal of the suit against the Company without prejudice. The Company has agreed that should 3CEMS subsequently seek to assert claims against the Company related to such suit the Company will not oppose the claims based on the statute of limitations or any other time-based defense, based upon the passage of time from July 19, 2013 to the date the Tolling Agreement is terminated. The Tolling Agreement terminates on December 31, 2014 or, if earlier upon 20 days’ notice by either party. See Note 5 of the Notes to the Consolidated Financial Statements, “Contingencies”, included in Item 8 of this report.
ITEM 4:MINE SAFETY DISCLOSURES
Not applicable.
14
PART II
ITEM 5:MARKET FOR THE REGISTRANT’S COMMON EQUITY, RELATED STOCKHOLDER MATTERS AND ISSUER
PURCHASES OF EQUITY SECURITIES
Perceptron’s Common Stock is traded on The NASDAQ Stock Market’s Global Market under the symbol “PRCP”. The following table shows the reported high and low sales prices of Perceptron’s Common Stock for fiscal 2014 and 2013:
|
Prices |
|||||
|
Fiscal 2014 |
Low |
High |
|||
|
Quarter through September 30, 2013 |
$ |
6.86 |
$ |
11.73 | |
|
Quarter through December 31, 2013 |
$ |
9.01 |
$ |
14.89 | |
|
Quarter through March 31, 2014 |
$ |
11.53 |
$ |
18.24 | |
|
Quarter through June 30, 2014 |
$ |
10.00 |
$ |
13.60 | |
|
Fiscal 2013 |
|||||
|
Quarter through September 30, 2012 |
$ |
4.98 |
$ |
6.26 | |
|
Quarter through December 31, 2012 |
$ |
4.91 |
$ |
6.31 | |
|
Quarter through March 31, 2013 |
$ |
5.68 |
$ |
9.30 | |
|
Quarter through June 30, 2013 |
$ |
6.60 |
$ |
8.05 | |
On May 21, 2014, the Board of Directors declared an annual dividend of fifteen cents ($0.15) per share of Common Stock. The annual dividend was paid on June 26, 2014 to shareholders of record at the close of business on June 5, 2014.
On May 7, 2013, the Board of Directors declared an annual dividend of fifteen cents ($0.15) per share of Common Stock. The annual dividend was paid on June 27, 2013 to shareholders of record at the close of business on June 6, 2013.
On September 27, 2012, the Board of Directors declared a special dividend of twenty-five cents ($0.25) per share of Common Stock. The special dividend was paid on November 1, 2012 to shareholders of record at the close of business on October 10, 2012.
The Company’s Amended and Restated Credit Agreement allowed the Company to declare and pay dividends of up to $3.7 million in fiscal 2013 and up to $2.5 million for each fiscal year thereafter, provided the Company maintains a minimum Tangible Net Worth as defined in the Credit Agreement. The Company may change the dividend policy and dividend amounts at any time, or discontinue the payment of dividends altogether. See “Item 1A – Risk Factors – We may decide not to pay dividends on our common stock in the future” and “We may be restricted under our loan agreement from paying higher dividends.”
The approximate number of shareholders of record on September 8, 2014, was 156.
The information pertaining to the securities the Company has authorized for issuance under equity plans is hereby incorporated by reference to Item 12, "Security Ownership of Certain Beneficial Owners and Management and Related Stockholder Matters – Equity Compensation Plan Information”. For more information about the Company’s equity compensation plans, see Note 8 of the Notes to the Consolidated Financial Statements, “Stock Based Compensation”, included in Item 8 of this report.
STOCK PRICE PERFORMANCE GRAPH
The following graph compares the cumulative 5-year total return attained by shareholders on the Company’s Common Stock relative to the cumulative total returns of The Nasdaq Stock Market (U.S.) Index (the “Nasdaq U.S. Index”) and a peer group of companies consisting of all U.S. exchange traded companies with standard industrial classification codes 3823 (Industrial Instruments for Measurement, Display, and Control of Process Variables; and Related Products), 3827 (Optical Instruments and Lenses) and 3829 (Measuring and Controlling Devices) (the “Peer Group Index”). The returns of each company in the Peer Group Index have been weighted according to their respective stock market capitalization. The graph assumes that the value of the investment in the Company’s Common Stock, the Peer Group Index and the Nasdaq U.S. Index was $100 on June 30, 2009 and that all dividends were reinvested.
15
COMPARISON OF 5 YEAR CUMULATIVE TOTAL RETURN*
Among Perceptron, Inc., the Nasdaq U.S. Index,
and a Peer Group Index
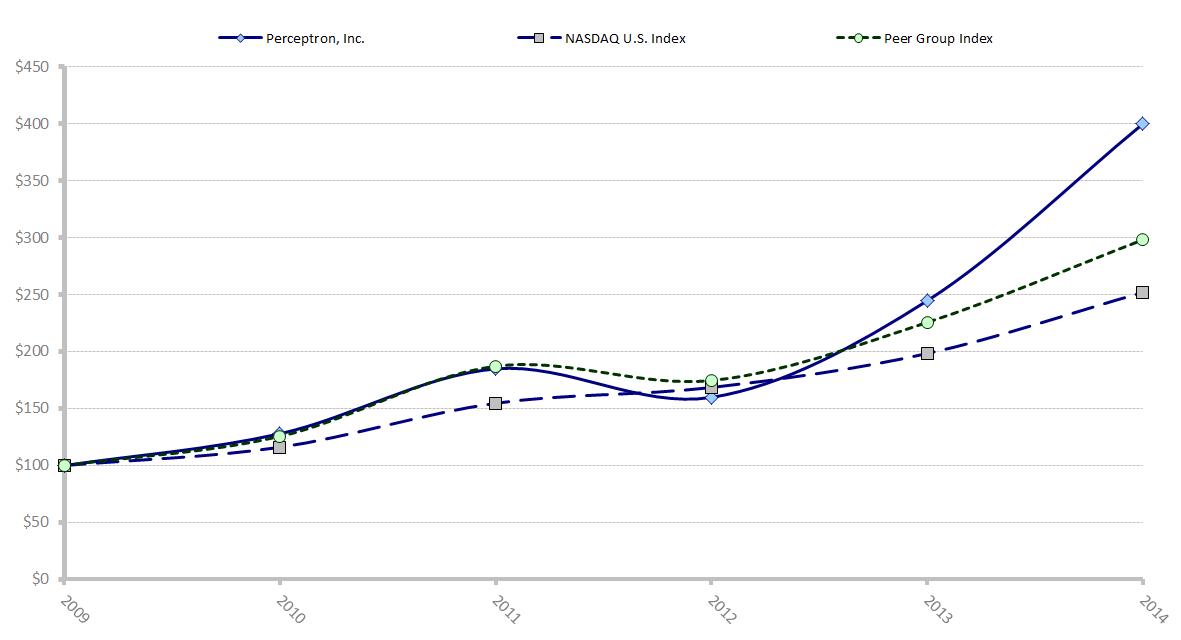
* $100 invested on June 30, 2009 in stock or index, including reinvestment of dividends. Fiscal year ending June 30.
|
CUMULATIVE TOTAL RETURN |
|||||||||||
|
6/30/2009 |
6/30/2010 |
6/30/2011 |
6/30/2012 |
6/30/2013 |
6/30/2014 |
||||||
|
Perceptron, Inc. |
100.00 | 127.91 | 184.88 | 159.88 | 244.78 | 400.22 | |||||
|
Nasdaq U.S. Index |
100.00 | 116.08 | 154.72 | 168.57 | 198.38 | 252.10 | |||||
|
Peer Group Index |
100.00 | 125.54 | 187.23 | 174.71 | 225.72 | 298.29 | |||||
The graph displayed above is presented in accordance with applicable legal requirements. Shareholders are cautioned against drawing any conclusions from the data contained in the graph, as past results are not necessarily indicative of future performance. The graph in no way reflects the Company’s forecast of future financial performance.
The Peer Group consists of the following companies: Schmitt Industries, Inc. (SMIT), Esterline Technologies Corp. (ESL), MKS Instruments, Inc. (MKSI), Sensata Technologies Holding NV (ST), Hurco Companies Inc. (HURC), Abaxis, Inc. (ABAX), II-VI Incorporated (IIVI), Electro-Sensors Inc. (ELSE), KLA–Tencor Corp. (KLAC), Orbotech Ltd. (ORBK), Mocon Inc. (MOCO), Thermo Fisher Scientific, Inc. (TMO), Nova Measuring Instruments Ltd. (NVMI), Sypris Solutions Inc. (SYPR), Camtek, Ltd (CAMT), Mesa Laboratories Inc. (MLAB), Rudolph Technologies Inc. (RTEC), Metro Storm Limited (MTSXY), Sutron Corporation (STRN), Cognex Corp. (CGNX), Faro Technologies Inc. (FARO), Clearsign Combustion Corp. (CLIR), Geospace Technologies Corporation (GEOS), Rockwell Automation Inc. (ROK), Cubic Corporation (CUB), Landauer Inc. (LDR), Trimble Navigation Limited (TRMB), Roper Industries Inc. (ROP), MTS Systems Corporation (MTSC), CyberOptics Corp. (CYBE), Measurement Specialties Inc. (MEAS), Sequenom Inc. (SQNM), Danaher Corp. (DHR), Image Sensing Systems, Inc. (ISNS) and Nanometrics Incorporated (NANO).
16
ITEM 6:SELECTED FINANCIAL DATA
The selected statement of operations and balance sheet data presented below are derived from the Company’s consolidated financial statements and should be read in conjunction with the Company’s consolidated financial statements and notes thereto and Item 7, “Management’s Discussion and Analysis of Financial Condition and Results of Operations” included in this report.
|
Fiscal Years Ended |
||||||||||||||
|
June 30, |
||||||||||||||
|
Statement of Operations Data |
2014 |
2013 |
2012 |
2011 |
2010 |
|||||||||
|
(In Thousands, Except Per Share Amounts) |
||||||||||||||
|
Net sales |
$ |
59,612 |
$ |
60,886 |
$ |
57,379 |
$ |
50,847 |
$ |
40,199 | ||||
|
Gross profit |
24,849 | 28,120 | 24,170 | 22,622 | 16,126 | |||||||||
|
Operating income (loss) |
2,942 | 6,866 | 5,596 | 3,386 | (2,118) | |||||||||
|
Income (loss) from continuing operations |
||||||||||||||
|
before income taxes |
3,002 | 7,531 | 5,375 | 4,103 | (1,676) | |||||||||
|
Income from continuing operations |
2,427 | 6,130 | 2,827 | 2,650 | 70 | |||||||||
|
Discontinued operations |
- |
80 | (3,160) | (824) | (875) | |||||||||
|
Net income (loss) |
2,427 | 6,210 | (333) | 1,826 | (805) | |||||||||
|
Earnings (loss) per basic share: |
||||||||||||||
|
Continuing operations |
$ |
0.27 |
$ |
0.72 |
$ |
0.34 |
$ |
0.30 |
$ |
0.01 | ||||
|
Discontinued operations |
- |
0.01 | (0.38) | (0.09) | (0.10) | |||||||||
|
Net income (loss) |
$ |
0.27 |
$ |
0.73 |
$ |
(0.04) |
$ |
0.21 |
$ |
(0.09) | ||||
|
Earnings (loss) per diluted share: |
||||||||||||||
|
Continuing operations |
$ |
0.26 |
$ |
0.71 |
$ |
0.34 |
$ |
0.29 |
$ |
0.01 | ||||
|
Discontinued operations |
- |
0.01 | (0.38) | (0.09) | (0.10) | |||||||||
|
Net income (loss) |
$ |
0.26 |
$ |
0.72 |
$ |
(0.04) |
$ |
0.20 |
$ |
(0.09) | ||||
|
Weighted average common shares outstanding: |
||||||||||||||
|
Basic |
8,983 | 8,512 | 8,433 | 8,879 | 8,923 | |||||||||
|
Diluted |
9,210 | 8,588 | 8,433 | 9,050 | 8,923 | |||||||||
|
As of June 30, |
||||||||||||||
|
Balance Sheet Data |
2014 |
2013 |
2012 |
2011 |
2010 |
|||||||||
|
(In Thousands, Except Per Share Amounts) |
||||||||||||||
|
Working capital |
$ |
46,454 |
$ |
41,294 |
$ |
35,923 |
$ |
40,349 |
$ |
36,854 | ||||
|
Total assets |
80,066 | 73,639 | 66,259 | 69,301 | 64,037 | |||||||||
|
Shareholders' equity |
62,780 | 56,895 | 52,259 | 55,480 | 53,476 | |||||||||
|
Annual dividend declared per common share |
$ |
0.15 |
$ |
0.15 |
$ |
- |
$ |
- |
$ |
- |
||||
|
Special dividend declared per common share |
- |
0.25 |
- |
- |
- |
|||||||||
|
Total dividends declared per common share |
$ |
0.15 |
$ |
0.40 |
$ |
- |
$ |
- |
$ |
- |
||||
17
ITEM 7:MANAGEMENT’S DISCUSSION AND ANALYSIS OF FINANCIAL CONDITION AND RESULTS OF OPERATIONS
SAFE HARBOR STATEMENT
We make statements in this Management’s Discussion and Analysis of Financial Condition and Results of Operations that may be “forward-looking statements” within the meaning of the Securities Exchange Act of 1934, including the Company’s expectation as to its fiscal year 2015 and future new order bookings, revenue, expenses, net income and backlog levels, future dividend payments, trends affecting its future revenue levels, the rate of new orders, the timing of revenue and net income increases from new products which we have recently released or have not yet released, the timing of the introduction of new products, the rate of adoption of our Helix® technology, and our ability to fund our fiscal year 2015 and future cash flow requirements. We may also make forward-looking statements in our press releases or other public or shareholder communications. When we use words such as “will,” “should,” “believes,” “expects,” “anticipates,” “estimates” “prospects” or similar expressions, we are making forward-looking statements. We claim the protection of the safe harbor for forward-looking statements contained in the Private Securities Litigation Reform Act of 1995 for all of our forward-looking statements. While we believe that our forward-looking statements are reasonable, you should not place undue reliance on any such forward-looking statements, which speak only as of the date made. Because these forward-looking statements are based on estimates and assumptions that are subject to significant business, economic and competitive uncertainties, many of which are beyond our control or are subject to change, actual results could be materially different. Factors that might cause such a difference include, without limitation, the risks and uncertainties discussed from time to time in our reports filed with the Securities and Exchange Commission, including those listed in “Item 1A – Risk Factors” in this report. Other factors not currently anticipated by management may also materially and adversely affect our financial condition, liquidity or results of operations. Except as required by applicable law, we do not undertake, and expressly disclaim, any obligation to publicly update or alter our statements whether as a result of new information, events or circumstances occurring after the date of this report or otherwise. The Company's expectations regarding future bookings and revenues are projections developed by the Company based upon information from a number of sources, including, but not limited to, customer data and discussions. These projections are subject to change based upon a wide variety of factors, a number of which are discussed above. Certain of these new orders have been delayed in the past and could be delayed in the future. Because the Company's products are typically integrated into larger systems or lines, the timing of new orders is dependent on the timing of completion of the overall system or line. In addition, because the Company's products have shorter lead times than other components and are required later in the process, orders for the Company's products tend to be given later in the integration process. A significant portion of the Company’s projected revenues and net income may depend upon the Company’s ability to successfully develop and introduce new products, expand into new geographic markets, and expand or continue sales with its’ current or future customers. Because a significant portion of the Company’s revenues are denominated in foreign currencies and are translated for financial reporting purposes into U.S. dollars, the level of the Company’s reported net sales, operating profits and net income are affected by changes in currency exchange rates, principally between the U.S. Dollar, Euro, Chinese Yuan and Japanese Yen. Currency exchange rates are subject to significant fluctuations, due to a number of factors beyond the control of the Company, including general economic conditions in the United States and other countries. Because the Company’s expectations regarding future revenues, order bookings, backlog and operating results are based upon assumptions as to the levels of such currency exchange rates, actual results could differ materially from the Company’s expectations.
Overview
Perceptron, Inc. (“Perceptron” or the “Company”) develops, produces and sells non-contact measurement and inspection solutions for industrial applications. The Company’s primary operations are in North America, Europe and Asia. While the Company has one operating segment, its non-contact measurement solutions are divided into In Process and Offline Measurement Solutions and 3D Scanning Products. In Process and Offline Measurement Solutions consist of a number of complete metrology systems for industrial process control including, AutoGauge, AutoGauge Plus, AutoFit, AutoScan, AutoGuide and Helix® systems. These products are primarily used by the Company’s customers to improve product quality, shorten product launch cycles, reduce overall manufacturing costs, and manage complex manufacturing processes. 3D Scanning Products include ScanWorks®, ScanWorks®xyz, and WheelWorks® products that target the digitizing, reverse engineering, inspection and original equipment manufacturers wheel alignment markets. Additionally, the Company provides a number of Value Added Services that are primarily related to In Process and Offline Measurement Solutions. The largest market served by the Company is the automotive market.
New vehicle tooling programs represent the most important selling opportunity for the Company’s automotive-related sales. The number and timing of new vehicle tooling programs varies in accordance with individual automotive manufacturers’ plans. The existing installed base of In Process and Offline Measurement Solutions also provides a continuous revenue stream in the form of system additions, upgrades, modifications, and Value Added Services such as customer training and support. Opportunities for 3D Scanning Products include growth from reverse engineering and inspection markets using coordinate measurement machines.
18
During fiscal year 2014, the Company expanded the sales of its Helix® sensors deploying the technology in a broader range of customer applications. The Helix® product is an innovative and versatile 3D metrology solution that enables manufacturers to perform their most challenging measurement tasks with greater ease and precision. The Company has continued research and development plans for the Helix® technology for use in additional applications.
Fiscal year 2014 was a transitional year for the Company, as it built its new management team and put in place a strategic plan designed to expand revenues and increase shareholder value over the longer term. The four elements of the plan are: continuing to expand profitability in our core markets, pursuing prudent diversification, extending our technological leadership, and maintaining fiscal discipline to ensure strong profitability.
On August 30, 2012, the Company completed the sale of substantially all of the assets of its Commercial Products Business Unit (“CBU”). CBU’s financial results are reported as a discontinued operation and prior year results are presented on a consistent basis. See Note 11 of the Notes to the Consolidated Financial Statements, “Discontinued Operations” for further information regarding the sale of the CBU assets.
Results of Operations
Fiscal Year Ended June 30, 2014, Compared to Fiscal Year Ended June 30, 2013
Overview – The full year of fiscal 2014 was a profitable period for Perceptron, illustrating the strength of the base on which the Company is building. During the 2014 fourth quarter, several customers delayed system installations, pushing certain revenue into fiscal 2015 and constraining margins due to fixed costs. Profitability was also impeded by additional operating costs, primarily related to the management changes made over the course of the year, higher costs associated with additional Sarbanes Oxley compliance requirements and investments the Company is making to implement its new strategic plan. The Company reported net income of $2.4 million, or $0.26 per diluted share, for the fiscal year ended June 30, 2014 compared with net income of $6.2 million, or $0.72 per diluted share, for the fiscal year ended June 30, 2013. Income from continuing operations was $2.4 million, or $0.26 per diluted share, in the current fiscal year compared with $6.1 million, or $0.71 per diluted share, for the prior fiscal year. Specific line item results are described below.
Bookings – Bookings represent new orders received from customers. During fiscal 2014, the Company had a record year of bookings from its continuing operations, with bookings totaling $68.5 million. This compares with $61.1 million in fiscal 2013, the third highest year of bookings from continuing operations in the Company’s history. It should be noted that the Company’s level of new orders fluctuates from period to period and the amount of new order bookings during any particular period is not necessarily indicative of the future operating performance of the Company. The following table sets forth comparison data for the Company’s bookings by geographic location.
|
Bookings (by location) |
|||||||||||||||||
|
(in millions) |
2014 |
2013 |
Increase/(Decrease) |
||||||||||||||
|
Americas |
$ |
20.4 | 29.8% |
$ |
18.2 | 29.8% |
$ |
2.2 | 12.1% | ||||||||
|
Europe |
31.9 | 46.6% | 29.3 | 47.9% | 2.6 | 8.9% | |||||||||||
|
Asia |
16.2 | 23.6% | 13.6 | 22.3% | 2.6 | 19.1% | |||||||||||
|
Totals |
$ |
68.5 | 100.0% |
$ |
61.1 | 100.0% |
$ |
7.4 | 12.1% | ||||||||
The $7.4 million bookings increase from fiscal 2013 was primarily due to an $8.2 million increase in orders for Measurement Solutions products, partially offset by a $1.1 million decrease in orders for 3D Scanning Products. On a geographic basis, booking records were set in both Europe and Asia. Increased orders for Measurement Solutions products in Asia, Europe and the Americas, were partially offset by a decrease in orders for 3D Scanning Products, primarily in Asia. Highlights include regaining a major North American automotive customer and growth with a major Japanese OEM.
Backlog – Backlog represents orders or bookings received by the Company that have not yet been filled. The Company's backlog was $39.3 million at June 30, 2014 and was a record fiscal year ending backlog for the Company. This compares with a backlog of $30.4 million at June 30, 2013, which was the previous record year ending backlog. The level of backlog during any particular period is not necessarily indicative of the future operating performance of the Company. Most of the backlog is subject to cancellation by the customer. The Company generally expects to be able to fill substantially all of the orders in backlog during the following twelve months. The following table sets forth comparison data for the Company’s backlog by geographic location
19
|
Backlog (by location) |
|||||||||||||||||
|
(in millions) |
2014 |
2013 |
Increase/(Decrease) |
||||||||||||||
|
Americas |
$ |
10.3 | 26.2% |
$ |
8.2 | 27.0% |
$ |
2.1 | 25.6% | ||||||||
|
Europe |
17.3 | 44.0% | 13.1 | 43.1% | 4.2 | 32.1% | |||||||||||
|
Asia |
11.7 | 29.8% | 9.1 | 29.9% | 2.6 | 28.6% | |||||||||||
|
Totals |
$ |
39.3 | 100.0% |
$ |
30.4 | 100.0% |
$ |
8.9 | 29.3% | ||||||||
The increased backlog of $8.9 million was primarily related to $8.8 million in backlog related to the Company’s Measurement Solutions products. The Company’s backlog increased in all geographic locations. Europe’s backlog also increased approximately $780,000 due to the valuation effect of the higher Euro at June 30, 2014 than at June 30, 2013.
Sales – Net sales of $59.6 million for fiscal 2014 decreased $1.3 million, or 2.1%, compared with the same period a year ago. The following tables set forth comparison data for the Company’s net sales by geographic location.
|
Sales (by location) |
|||||||||||||||||
|
(in millions) |
2014 |
2013 |
Increase/(Decrease) |
||||||||||||||
|
Americas |
$ |
18.3 | 30.7% |
$ |
22.2 | 36.4% |
$ |
(3.9) |
(17.6)% |
||||||||
|
Europe |
27.8 | 46.6% | 26.1 | 42.9% | 1.7 | 6.5% | |||||||||||
|
Asia |
13.5 | 22.7% | 12.6 | 20.7% | 0.9 | 7.1% | |||||||||||
|
Totals |
$ |
59.6 | 100.0% |
$ |
60.9 | 100.0% |
$ |
(1.3) |
(2.1)% |
||||||||
The sales decrease of $1.3 million was primarily due to lower sales of 3D Scanning Products and to a lesser extent lower Measurement Solutions products. Also impacting the year-over-year comparison was that fiscal 2013 was a record sales level for the Company’s continuing operations. On a geographic basis, sales in the Americas decreased $3.9 million from the prior year, primarily related to lower sales of Measurement Solutions products. Higher sales in Europe of $1.7 million over the prior year were primarily the result of higher sales of Measurement Solutions products. The stronger Euro exchange rate in fiscal 2014 compared to fiscal 2013 had the effect of increasing European sales by approximately $1.4 million. Sales in Asia increased $900,000 primarily due to an increase in sales of Measurement Solutions products of $2.0 million that was partially offset by a decrease in sales of 3D Scanning Products of $1.1 million.
Gross Profit – Gross profit was $24.8 million, or 41.7% of sales, in the fiscal year ended June 30, 2014, as compared to $28.1 million, or 46.2% of sales, in the fiscal year ended June 30, 2013. The $3.3 million gross profit decrease reflected the fiscal 2014 lower sales level and higher cost of sales compared to fiscal 2013. The increase in cost of sales in fiscal 2014 was primarily due to product mix and higher operating costs for year-over-year salary increases, project-related travel, warranty costs and project-related overtime. Also affecting the comparison was higher profit sharing expense of $586,000 in fiscal 2013. The stronger Euro average exchange rate in fiscal year 2014 compared to fiscal 2013 also had the effect of increasing operating costs in fiscal 2014 by approximately $430,000.
Selling, General and Administrative (SG&A) Expenses – SG&A expenses of $15.2 million in fiscal 2014 were approximately $740,000 higher than SG&A costs in fiscal 2013. The increase in costs was primarily due to higher recruiting and contract services costs principally related to the recent changes in the Company’s executive officers, and to a lesser extent, year-over-year salary increases and higher costs related to Sarbanes-Oxley compliance. Also impacting the year-over-year comparison was higher profit sharing expense of $840,000 in fiscal 2013 that was not incurred in fiscal 2014. The stronger average foreign exchange rate of the Euro for fiscal year 2014 compared to fiscal year 2013 increase costs in fiscal 2014 by approximately $210,000.
Engineering, Research and Development (R&D) Expenses – Engineering and R&D expenses were $6.7 million in fiscal 2014, compared with $6.8 million in fiscal 2013. The higher costs incurred in fiscal 2013 primarily related to a $400,000 profit sharing accrual that was not incurred in fiscal 2014. Partially offsetting the reduction in profit sharing costs were higher year-over-year salary increases and salary related costs of approximately $380,000 in fiscal 2014. Fiscal 2014 also had lower engineering materials of $140,000 compared to fiscal 2013.
20
Interest Income, net – Net interest income was $188,000 in fiscal 2014, compared with $173,000 in fiscal 2013. The increase in interest income for fiscal year 2014 compared to fiscal 2013 was principally due to higher average invested cash balances in 2014.
Foreign Currency Gain (Loss) – There was a net foreign currency loss of $127,000 in fiscal 2014 compared with a loss of $647,000 in fiscal 2013. The loss in fiscal 2014 primarily related to the Yen and the Euro. The loss in fiscal 2013 related primarily to the Yen and the Real, that were partially offset by a foreign currency gain in the Euro. Foreign currency effects are primarily due to the difference in foreign exchange rates between the time the Company’s foreign subsidiaries receive material or services denominated in U.S. dollars and when funds are converted to U.S. dollars to pay for the material or services received.
Gain on Redemption of Investment – In June 2013, a long-term investment was redeemed, at par, for $2.6 million. The Company recorded an impairment charge on the carrying value of this investment in fiscal 2009 of $1.1 million, establishing a new cost basis of $1.5 million. As a result of the redemption at par, the Company recorded a gain of $1.1 million in fiscal 2013.
Income Tax Expense – The effective income tax rate in fiscal 2014 was 19.2% compared to 18.6% in fiscal 2013. Both fiscal 2014 and 2013 reflected the effect of the mix of pre-tax income and loss across the Company’s tax jurisdictions and their respective tax rates. Fiscal 2013 was also favorably impacted by the reversal of $468,000 in the Company’s valuation allowance related to the long-term investment redemption and improved operations in a foreign subsidiary. The effective tax rate for fiscal 2013 excluding the valuation allowance reversal, was 24.8%. See Note 9 of the Notes to the Consolidated Financial Statements, “Income Taxes”.
Outlook – Perceptron is a strong global company with great technology, competitive advantages, world class customers and a talented, committed workforce. Fiscal 2014 was a year of transition as the Company built a new management team and put in place a strategic plan designed to expand revenues and increase shareholder value over the longer term. The Company expects solid contributions over the next several years from each of the four elements of the plan: continuing to expand profitability in our core markets, pursuing prudent diversification, extending our technological leadership, and maintaining fiscal discipline to ensure strong profitability. In the shorter term, given our record bookings, present backlog, and new strategy, the Company expects that fiscal 2015 will show revenue growth. The Company believes this higher revenue will drive improvement in profitability in fiscal 2015 over the levels reported for fiscal 2014.
The Company continues to maintain a strong and flexible financial position. The Company also had no debt and total liquidity remained historically high at June 30, 2014, with cash and short-term investments of $33.9 million.
Results of Operations
Fiscal Year Ended June 30, 2013, Compared to Fiscal Year Ended June 30, 2012
Overview – The Company reported net income of $6.2 million, or $0.72 per diluted share, for the fiscal year ended June 30, 2013 compared with a net loss of $333,000, or $0.04 per diluted share, for the fiscal year ended June 30, 2012. Income from continuing operations was $6.1 million, or $0.71 per diluted share, in the current fiscal year compared with $2.8 million, or $0.34 per diluted share, for the prior fiscal year. Specific line item results are described below.
Bookings – Bookings represent new orders received from customers. During fiscal 2013 the Company had its second highest year of bookings from its continuing operations with $61.1 million. This compares with $63.7 million in fiscal 2012, the highest year of bookings from continuing operations in the Company’s history. It should be noted that the Company’s level of new orders fluctuates from period to period and the amount of new order bookings during any particular period is not necessarily indicative of the future operating performance of the Company. The following table sets forth comparison data for the Company’s bookings by geographic location.
|
Bookings (by location) |
|||||||||||||||||
|
(in millions) |
2013 |
2012 |
Increase/(Decrease) |
||||||||||||||
|
Americas |
$ |
18.2 | 29.8% |
$ |
30.8 | 48.4% |
$ |
(12.6) |
(40.9)% |
||||||||
|
Europe |
29.3 | 47.9% | 19.7 | 30.9% | 9.6 | 48.7% | |||||||||||
|
Asia |
13.6 | 22.3% | 13.2 | 20.7% | 0.4 | 3.0% | |||||||||||
|
Totals |
$ |
61.1 | 100.0% |
$ |
63.7 | 100.0% |
$ |
(2.6) |
(4.1)% |
||||||||
21
The $2.6 million bookings decrease from fiscal 2012 was primarily due to lower orders for Measurement Solutions products and to a lesser extent lower orders for 3D Scanning Products. On a geographic basis, increased orders for Measurement Solutions in Europe and Asia were offset by lower orders for Measurement Solutions products in the Americas. The decrease of $12.6 million in the Americas was the result of an especially high level of bookings in fiscal 2012 that were mainly due to several orders for light truck projects.
Backlog – Backlog represents orders or bookings received by the Company that have not yet been filled. The Company's backlog was $30.4 million at June 30, 2013 compared with $30.2 million at June 30, 2012. The level of backlog during any particular period is not necessarily indicative of the future operating performance of the Company. Most of the backlog is subject to cancellation by the customer. The Company generally expects to be able to fill substantially all of the orders in backlog during the following twelve months. The following table sets forth comparison data for the Company’s backlog by geographic location.
|
Backlog (by location) |
|||||||||||||||||
|
(in millions) |
2013 |
2012 |
Increase/(Decrease) |
||||||||||||||
|
Americas |
$ |
8.2 | 27.0% |
$ |
12.2 | 40.4% |
$ |
(4.0) |
(32.8)% |
||||||||
|
Europe |
13.1 | 43.1% | 9.9 | 32.8% | 3.2 | 32.3% | |||||||||||
|
Asia |
9.1 | 29.9% | 8.1 | 26.8% | 1.0 | 12.3% | |||||||||||
|
Totals |
$ |
30.4 | 100.0% |
$ |
30.2 | 100.0% |
$ |
0.2 | 0.7% | ||||||||
The $30.4 million backlog at June 30, 2013 represented a record year ending backlog for the Company which followed a previous record year ending backlog at June 30, 2012 of $30.2 million. Increased backlog for 3D Scanning Products and Value Added Services was almost offset by a lower backlog for Measurement Solutions products. Europe’s backlog and bookings increased approximately $500,000 due to the revaluation effect of the higher Euro at June 30, 2013 than at June 30, 2012.
Sales – Net sales of $60.9 million for fiscal 2013 increased $3.5 million, or 6.1%, compared with the same period a year ago and represented a record sales level for the Company’s continuing operations. The following tables set forth comparison data for the Company’s net sales by geographic location.
|
Sales (by location) |
|||||||||||||||||
|
(in millions) |
2013 |
2012 |
Increase/(Decrease) |
||||||||||||||
|
Americas |
$ |
22.2 | 36.4% |
$ |
26.3 | 45.8% |
$ |
(4.1) |
(15.6)% |
||||||||
|
Europe |
26.1 | 42.9% | 18.4 | 32.1% | 7.7 | 41.8% | |||||||||||
|
Asia |
12.6 | 20.7% | 12.7 | 22.1% | (0.1) |
(0.8)% |
|||||||||||
|
Totals |
$ |
60.9 | 100.0% |
$ |
57.4 | 100.0% |
$ |
3.5 | 6.1% | ||||||||
The sales increase of $3.5 million was due to higher sales of Measurement Solutions products, primarily from higher sales for upgrades of systems in fiscal 2013. The increase was partially offset by a decline in sales of 3D Scanning Products that primarily resulted from a customer’s decision to use a lower performance, internally developed product in place of one of the Company’s products. This customer continues to purchase the Company’s product when it requires higher performance scanning capabilities. On a geographic basis, Europe’s sales increased $7.7 million over the prior year. The European sales increase was primarily from higher Measurement Solutions sales. The effect of the lower Euro exchange rate in fiscal 2013 compared to fiscal 2012 reduced fiscal 2013 revenue by approximately $650,000. Partially offsetting the increase in sales in Europe was a decrease of $4.1 million in sales in the Americas. The Americas sales decrease was primarily from lower sales of Measurement Solutions and to a lesser extent Value Added Services. The Company experienced more European customers increasing or maintaining their capital expenditures for in-line dimensional gauging in fiscal year 2013 than those that decreased their capital expenditures, which fueled the Company’s European sales. Conversely customers in the Americas invested in several large tooling projects over the last couple of years and lowered their investments in tooling projects in fiscal year 2013 as part of their normal investment cycle. Sales in Asia were essentially flat on a comparison basis and represented lower sales of 3D Scanning Products that were almost offset by increased sales of Measurement Solutions products.
Gross Profit – Gross profit was $28.1 million, or 46.1% of sales, in the fiscal year ended June 30, 2013, as compared to $24.2 million, or 42.1% of sales, in the fiscal year ended June 30, 2012. The $4.0 million gross profit increase primarily reflected the higher sales levels in fiscal 2013 compared to fiscal 2012. The increase in the gross profit percentage in fiscal 2013 compared to fiscal 2012 was primarily due to better margins on Measurement Solutions products. Partially offsetting the higher gross profit
22
in fiscal 2013 was higher profit sharing expense of $586,000. The weaker average foreign exchange rate of the Euro for the full year, compared to fiscal year 2012, also decreased gross profit for fiscal year 2013 by approximately $300,000.
Selling, General and Administrative (SG&A) Expenses – SG&A expenses of $14.5 million in fiscal 2013 were approximately $1.5 million higher than SG&A costs in fiscal 2012. The increase in costs was primarily due to higher profit sharing expense in fiscal 2013 of $840,000. Also contributing to the increase in costs in fiscal 2013 was the effect of salary increases, and higher international general and administrative costs to support continued growth.
Engineering, Research and Development (R&D) Expenses – Engineering and R&D expenses were $6.8 million in fiscal 2013, compared with $5.6 million in fiscal 2012. The $1.2 million increase in costs was primarily due to $584,000 in higher salary and salary related costs from year-over-year merit increases and additional staff for engineering research and development related to Helix® and $400,000 for increased profit sharing expense in fiscal 2013 compared to fiscal 2012.
Interest Income, net – Net interest income was $173,000 in fiscal 2013, compared with $245,000 in fiscal 2012. The decrease in interest income for fiscal year 2013 compared to fiscal 2012 was principally due to lower interest rates on invested cash in 2013.
Foreign Currency Gain (Loss) – There was a net foreign currency loss of $647,000 in fiscal 2013 compared with a loss of $629,000 in fiscal 2012. The loss in fiscal 2013 primarily related to the Yen and the Real that were partially offset by a foreign currency gain in the Euro. The loss in fiscal 2012 related primarily to the Euro and, to a lesser extent, the Indian Rupee and Brazilian Real. Foreign currency effects are primarily due to the difference in foreign exchange rates between the time the Company’s foreign subsidiaries receive material or services denominated in U.S. dollars and when funds are converted to U.S. dollars to pay for the material or services received.
Gain on Redemption of Investment – In June 2013, a long-term investment was redeemed, at par, for $2.6 million. The Company recorded an impairment charge on the carrying value of this investment in fiscal 2009 of $1.1 million, establishing a new cost basis of $1.5 million. As a result of the redemption at par, the Company recorded a gain of $1.1 million in fiscal 2013.
Income Tax Expense – The effective income tax rate in fiscal 2013 was 18.6% and was favorably impacted by the reversal of $468,000 in the Company’s valuation allowance related to the long-term investment redemption and improved operations in a foreign subsidiary. The effective income tax rate in fiscal 2012 was 47.4% and was negatively impacted by a $1.2 million tax expense for the establishment of a valuation allowance on the Company’s deferred tax assets that was based on the determination that it was unlikely that the Company would be able to fully utilize the tax benefit in the next few years. The effective tax rates for fiscal 2013 and 2012, excluding the valuation allowance effect for each respective period, were 24.8% and 24.9%, respectively. See Note 9 of the Notes to the Consolidated Financial Statements, “Income Taxes”.
Discontinued Operations
On August 30, 2012, the Company completed the sale of substantially all of the assets of its Commercial Products Business Unit (“CBU”). CBU’s financial results are reported as a discontinued operation and results for all periods are presented on a consistent basis. During fiscal 2013, the Company reported $80,000 of income, net of taxes, related to CBU operations and the sale of CBU assets.
In fiscal year 2012, the Company made the decision to sell CBU and recorded a loss of $1.1 million, net of tax, related to the operations of CBU and a loss from the write-down of CBU assets held for sale of $1.1 million, net of tax, for a total loss of $2.2 million, net of tax.
In fiscal year 2012, the Company recorded a loss of $1.0 million, net of tax, from discontinued operations that primarily related to the settlement of a lawsuit filed in 2002 involving the Company’s discontinued Forest Product Business Unit. The Company also had previously accrued approximately $500,000 related to this matter. On October 28, 2011, the Company paid the litigation settlement in full for $2.0 million.
See Note 11 of the Notes to the Consolidated Financial Statements, “Discontinued Operations”.
Liquidity and Capital Resources
The Company’s cash and cash equivalents were $23.1 million at June 30, 2014 compared to $13.4 million at June 30, 2013. Cash increased from cash provided from operations of $5.1 million, proceeds received from stock plans of $3.6 million and $2.9 million from net sales of short-term investments. Cash was used to pay $1.4 million in dividends to shareholders and for capital expenditure purchases of $678,000. Favorable foreign exchange rates increased cash and cash equivalents by $134,000.
23
The $5.1 million in cash provided from operations represented $2.4 million of net income less the change in non-cash items totaling $74,000, plus $2.7 million generated from net working capital changes. The $2.7 million generated from net working capital changes, resulted primarily from a $2.9 million decrease in net receivables and $532,000 from a favorable change in other current assets and liabilities, partially offset by a decrease in accounts payable of $558,000 and $147,000 for inventory purchases. The $2.9 million generated from net receivables resulted from cash collections on the higher sales in the fourth quarter of fiscal 2013 compared to the fourth quarter of fiscal 2014. Inventory increased as a result of the Company building to stock certain levels of its Helix® sensors. The increase in other current assets and liabilities primarily represented higher accrued deferred revenue of $1.6 million and accrued liabilities including income taxes totaling $1.1 million that were partially offset by lower accrued compensation for profit sharing of $1.7 million. The decrease in accounts payable related to normal fluctuations in the timing of payments.
The Company provides a reserve for obsolescence to recognize inventory impairment for the effects of engineering change orders, age and use of inventory that affect the value of the inventory. The reserve for obsolescence creates a new cost basis for the impaired inventory. When inventory that has previously been impaired is sold or disposed of, the related obsolescence reserve is reduced resulting in the reduced cost basis being reflected in cost of goods sold. A detailed review of the inventory is performed annually with quarterly updates for known changes that have occurred since the annual review. During fiscal year 2014, the Company increased its reserve for inventory obsolescence by a net $61,000, which resulted from additional reserves for obsolescence of approximately $342,000 less disposals and the effect of changes in foreign currency of $281,000.
The Company determines its allowance for doubtful accounts by considering a number of factors, including the length of time trade accounts receivable are past due, the Company’s previous loss history, the customer’s current ability to pay its obligation to the Company, and the condition of the general economy and the industry as a whole. The Company writes off accounts receivable when they become uncollectible, and payments subsequently received on such receivables are credited to the allowance for doubtful accounts. During fiscal year 2014, the Company reduced its allowance for doubtful accounts reserve by a net $28,000.
Financing activities during fiscal year 2014 reflected cash received under the Company’s stock plans of $3.6 million that was partially offset by cash used to pay dividends to common shareholders totaling $1.4 million.
At June 30, 2014, the Company had $33.9 million in cash, cash equivalents and short-term investments of which $23.9 million or 70% was held in foreign bank accounts. The Company does not repatriate its foreign earnings and based on its business plan, current cash, cash equivalents and short-term investments, the level of cash, cash equivalents and short-term investments in foreign bank accounts is not expected to have an impact on the Company’s liquidity.
The Company had no debt outstanding at June 30, 2014 and June 30, 2013. The Company has a $6.0 million secured credit agreement with Comerica Bank (“Credit Agreement”) which expires on November 2, 2015. Proceeds under the Credit Agreement may be used for working capital and capital expenditures. Security for the Credit Agreement is substantially all non-real estate assets of the Company held in the United States. Borrowings are designated as a Libor-based Advance or as a Prime-based Advance if the Libor-based Advance is not available. Interest on Libor-based Advances is calculated at 2.35% above the Libor Rate offered at the time for the period chosen, and is payable on the last day of the applicable period. Quarterly, the Company pays a commitment fee of 0.15% per annum on the average daily unused portion of the revolving credit commitment. The Credit Agreement requires the Company to maintain a minimum Tangible Net Worth of not less than $33.2 million. The Company was in compliance with this financial covenant at June 30, 2014. The Company is permitted to declare dividends of up to $2.5 million in any fiscal year provided the Company maintains the required minimum Tangible Net Worth. The Company is also required to have no advances outstanding under the Credit Agreement for 30 days (which need not be consecutive) during each calendar year.
June 30, 2014, the Company's German subsidiary (“GmbH”) had an unsecured credit facility totaling 350,000 Euros (equivalent to approximately $478,000). The facility allows 100,000 Euros to be used to finance working capital needs and equipment purchases or capital leases. The facility allows up to 250,000 Euros to be used for providing bank guarantees. Any borrowings for working capital needs will bear interest at 7.15%. Any outstanding bank guarantees will bear interest at 2.0%. The German credit facility is cancelable at any time by either GmbH or the bank and any amounts then outstanding would become immediately due and payable. At June 30, 2014 and 2013, GmbH had no borrowings or bank guarantees outstanding.
As part of routine evaluation procedures, the Company identified a potential concern regarding the employment status and withholding for several individuals in one of the Company’s foreign jurisdictions. The Company has begun a review of the matter, and expects resolution in the next few months. At this time, because the Company has not completed its evaluation, the Company is not able to determine an amount or range of its financial liability relating to this matter. The Company does not expect that the resolution of this matter will have a detrimental effect on the conduct of the Company’s business in this foreign jurisdiction. See Item 3, “Legal Proceedings” and Note 5 of the Notes to the Consolidated Financial Statements, “Contingencies”, for a discussion of certain other contingencies relating to the Company’s liquidity, financial position and results of operations.
24
See also, Item 7, "Management’s Discussion and Analysis of Financial Condition and Results of Operations – Critical Accounting Policies - Litigation and Other Contingencies”.
At June 30, 2014, the Company had short-term investments totaling $10.8 million and a long-term investment recorded at $725,000. See Note 1 to the Consolidated Financial Statements, “Short-term and Long-term Investments”, for further information on the Company’s investments and their current valuation. The market for the long-term investment is currently illiquid.
On May 21, 2014, the Board of Directors declared an annual dividend of fifteen cents ($0.15) per share of Common Stock. The annual dividend was paid on June 26, 2014 to shareholders of record at the close of business on June 5, 2014. The Company may change the dividend policy and dividend amounts at any time, or discontinue the payment of dividends altogether.
The Company expects to spend up to approximately $1.8 million during fiscal year 2015 for capital equipment, although there is no binding commitment to do so. Based on the Company’s current business plan, the Company believes that available cash on hand and existing credit facilities will be sufficient to fund anticipated fiscal year 2015 cash flow requirements, except to the extent that the Company implements new business development opportunities, which would be financed as discussed below. The Company does not believe that inflation has significantly impacted historical operations and does not expect any significant near-term inflationary impact.
The Company will consider evaluating business opportunities that fit its strategic plans. There can be no assurance that the Company will identify any opportunities that fit its strategic plans or will be able to enter into agreements with identified business opportunities on terms acceptable to the Company. The Company anticipates that it would finance any such business opportunities from available cash on hand, issuance of additional shares of its stock or additional sources of financing, as circumstances warrant.
Contractual Obligations
The following summarizes the Company’s contractual obligations at June 30, 2014, and the effect such obligations are expected to have on its liquidity and cash flow in future periods (in thousands):
|
Less than |
More than |
||||||||||||||
|
Total |
1 Year |
1-3 Years |
3-5 Years |
5 Years |
|||||||||||
|
Purchase Obligations |
(1) |
$ |
7,684 |
$ |
6,589 |
$ |
1,095 |
$ |
- |
$ |
- |
||||
|
Operating Leases |
(2) |
1,499 | 906 | 553 | 40 |
- |
|||||||||
|
Total |
$ |
9,183 |
$ |
7,495 |
$ |
1,648 |
$ |
40 |
$ |
- |
|||||
|
(1) |
A purchase obligation is defined as an agreement to purchase goods or services that is enforceable and legally binding. Included in the purchase obligations category above are obligations related to purchase orders for inventory purchases under the Company’s standard terms and conditions and under negotiated agreements with vendors. The Company expects to receive consideration (products or services) for these purchase obligations. The purchase obligation amounts do not represent all anticipated purchases in the future, but represent only those items for which the Company was contractually obligated at June 30, 2014. |
|
(2) |
Operating leases represent commitments to lease building space, office equipment and motor vehicles. |
Critical Accounting Policies
The Company’s discussion and analysis of its financial condition and results of operations are based upon the Company’s financial statements and accompanying notes, which have been prepared in accordance with accounting principles generally accepted in the United States (U.S. GAAP). The Company’s significant accounting policies are discussed in Note 1 of the Notes to Consolidated Financial Statements, “Summary of Significant Accounting Policies”. Certain of the Company’s significant accounting policies are subject to judgments and uncertainties, which affect the application of these policies and require the Company to make estimates based on assumptions that affect the reported amounts of assets, liabilities, revenues and expenses. The Company bases its estimates on historical experience and on various assumptions that are believed to be reasonable under the circumstances. On an ongoing basis, the Company evaluates its estimates and underlying assumptions. In the event estimates or underlying assumptions prove to be different from actual amounts, adjustments are made in the subsequent period to reflect more current information. The Company believes that the following significant accounting policies involve management’s most difficult, subjective or complex judgments or involve the greatest uncertainty.
Revenue Recognition. Revenue related to products and services is recognized upon shipment when title and risk of loss has passed to the customer or upon completion of the service, there is persuasive evidence of an arrangement, the sales price is
25
fixed or determinable, collection of the related receivable is reasonably assured and customer acceptance criteria, if any, have been successfully demonstrated.
The Company also has multiple element arrangements in its Measurement Solutions product line that may include elements such as, equipment, installation, labor support and/or training. Each element has value on a stand-alone basis and the delivered elements do not include general rights of return. Accordingly, each element is considered a separate unit of accounting. When available, the Company allocates arrangement consideration to each element in a multiple element arrangement based upon vendor specific objective evidence (“VSOE”) of fair value of the respective elements. When VSOE cannot be established, the Company attempts to establish the selling price of each element based on relevant third-party evidence. Because the Company’s products contain a significant level of proprietary technology, customization or differentiation such that comparable pricing of products with similar functionality cannot be obtained, the Company uses, in these cases, its best estimate of selling price (“BESP”). The Company determines the BESP for a product or service by considering multiple factors including, but not limited to, pricing practices, internal costs, geographies and gross margin.
For multiple element arrangements, the Company defers from revenue recognition the greater of the relative fair value of any undelivered elements of the contract or the portion of the sales price of the contract that is not payable until the undelivered elements are completed. As part of this evaluation, the Company limits the amount of revenue recognized for delivered elements to the amount that is not contingent on the future delivery of products or services, including a consideration of payment terms that delay payment until those future deliveries are completed.
Some multiple element arrangements contain installment payment terms with a final payment (“final buy-off”) due upon the Company’s completion of all elements in the arrangement or when the customer’s final acceptance is received. The Company recognizes revenue for each completed element of a contract when it is both earned and realizable. A provision for final customer acceptance generally does not preclude revenue recognition for the delivered equipment element because the Company rigorously tests equipment prior to shipment to ensure it will function in the customer’s environment. The final acceptance amount is assigned to specific element(s) identified in the contract, or if not specified in the contract, to the last element or elements to be delivered that represent an amount at least equal to the final payment amount.
The Company’s Measurement Solutions products are designed and configured to meet each customer’s specific requirements. Timing for the delivery of each element in the arrangement is primarily determined by the customer’s requirements and the number of elements ordered. Delivery of all of the multiple elements in an order will typically occur over a three to 15 month period after the order is received.
The Company does not have price protection agreements or requirements to buy back inventory. The Company’s history demonstrates that sales returns have been insignificant.
Management exercises judgment in connection with the determination of the amount of revenue to be recognized in each period. Such judgments include, but are not limited to, allocating arrangement consideration to each element in a multiple element arrangement, determining an estimated selling price for each such element, determining the relative fair value of undelivered elements in a multiple element arrangement, determining if customer acceptance criteria preclude revenue recognition and interpreting various commercial terms to determine if all criteria for revenue recognition have been met. Any material changes in these judgments could impact the timing of revenue recognition, which could have a material effect on the Company’s financial position and results of operations.
Stock-Based Compensation. The Company accounts for non-cash stock-based compensation in accordance with ASC 718, "Compensation - Stock Compensation". Under the fair value recognition provisions of this statement, share-based compensation cost is measured at the grant date based on the value of the award and is recognized as expense over the vesting period. Determining the fair value of share-based awards at the grant date requires judgment, including estimating the amount of share-based awards that is expected to be forfeited. The estimated forfeiture rate may change from time to time based upon the Company’s actual experience. An increase in the forfeiture rate would require the Company to reverse a portion of its prior expense for non-cash stock-based compensation, which would positively impact the Company’s results of operations. Because the Company currently experiences a low forfeiture rate, a reduction in the estimated forfeiture rate would not have a material impact on the Company’s results of operations.
Accounts Receivable. The Company monitors its accounts receivable and charges to expense an amount equal to its estimate of potential credit losses. The Company considers a number of factors in determining its estimates, including, the length of time trade accounts receivable are past due, the Company’s previous loss history, the customer’s current ability to pay its obligation and the condition of the general economy and the industry as a whole. The use of different estimates for future credit losses would result in different charges to selling, general and administrative expense in each period presented and could negatively affect the Company’s results of operations for the period. In addition, if actual experience differs materially from the Company’s estimates, the Company could be required to record large credit losses that could negatively affect the Company’s results of operations for the period.
26
Inventories. Inventory is stated at the lower of cost or market. The cost of inventory is determined by the first-in, first-out (“FIFO”) method. The Company provides a reserve for obsolescence to recognize inventory impairment for the effects of engineering change orders, age and use of inventory that affect the value of the inventory. The reserve for obsolescence creates a new cost basis for the impaired inventory. When inventory that has previously been impaired is sold or disposed of, the related obsolescence reserve is reduced resulting in the reduced cost basis being reflected in cost of goods sold. A detailed review of the inventory is performed annually with quarterly updates for known changes that have occurred since the annual review. The use of different assumptions in determining slow-moving and obsolete inventories could result in different charges to cost of sales in each period presented and could negatively affect the Company’s results of operations for the period. In addition, if actual experience differs materially from the Company’s estimates, the Company could be required to record large losses that could negatively affect the Company’s results of operations for the period. See Note 1 of the Notes to the Consolidated Financial Statements, “Summary of Significant Accounting Policies – Inventory”.
Short-Term and Long-Term Investments. The Company accounts for its investments in accordance with ASC 320, “Investments – Debt and Equity Securities”. Investments with a maturity of greater than three months but less than one year are classified as short-term investments. Investments with maturities beyond one year may be classified as short-term if the Company reasonably expects the investment to be realized in cash or sold or consumed during the normal operating cycle of the business. Investments available for sale are recorded at market value using the specific identification method. Investments expected to be held to maturity or until market conditions improve are measured at amortized cost in the statement of financial position if it is the Company’s intent and ability to hold those securities long-term. At each balance sheet date, the Company evaluates its investments for possible other-than-temporary impairment which involves significant judgment. In making this judgment, management reviews factors such as the length of time and extent to which fair value has been below the cost basis, the anticipated recovery period, the financial condition of the issuer, the credit rating of the instrument and the Company’s ability and intent to hold the investment for a period of time which may be sufficient for recovery of the cost basis. Any unrealized gains and losses on securities are reported as other comprehensive income as a separate component of shareholders’ equity until realized or until a decline in fair value is determined to be other than temporary. Once a decline in fair value is determined to be other than temporary, an impairment charge is recorded in the income statement. Any material changes in management’s judgments regarding its investments, including, but not limited to, the amount of any impairment or whether the impairment is other-than-temporary, could have a material adverse effect on the Company’s financial position and results of operations. See Note 1 of the Notes to the Consolidated Financial Statements, “Summary of Significant Accounting Policies – Short-term and Long-term Investments”. See also Item 7, “Management’s Discussion and Analysis of Financial Condition and Results of Operations – Fiscal Year ended June 30, 2014 compared with Fiscal Year ended June 30, 2013 – Gain on Redemption of Investment” for a discussion of the impact of a reversal of an impairment charge recorded on a long-term investment.
Deferred Income Taxes. Deferred income tax assets and liabilities represent the estimated future income tax effect of temporary differences between the book and tax basis of the Company’s assets and liabilities, assuming they will be realized and settled at the amounts reported in the Company’s financial statements. The Company records a valuation allowance to reduce its deferred tax assets to the amount that it believes is more likely than not to be realized. This assessment includes consideration for the scheduled reversal of temporary taxable differences, projected future taxable income and the impact of tax planning. The Company adjusts this valuation allowance periodically based upon changes in these considerations. See Note 9 of the Notes to the Consolidated Financial Statements, “Income Taxes”. If actual long-term future taxable income is lower than the Company’s estimate, or the Company revises its initial estimates, the Company may be required to record material adjustments to the deferred tax assets, resulting in a charge to income in the period of determination and negatively impacting the Company’s results of operations and financial position for the period. See Item 7, “Management’s Discussion and Analysis of Financial Condition and Results of Operations - Results of Operations – Fiscal Year ended June 30, 2013 compared with Fiscal Year ended June 30, 2012 – Income Tax Expense” for a discussion of the impact of an establishment of a valuation allowance on the Company’s deferred tax assets.
Litigation and Other Contingencies. From time to time, the Company is subject to certain legal proceedings and other contingencies, the outcomes of which are subject to significant uncertainty. The Company accrues for estimated losses if it is probable that an asset has been impaired or a liability has been incurred and the amount of the loss can be reasonably estimated. The Company uses judgment and evaluates, with the assistance of legal counsel, whether a loss contingency arising from litigation should be disclosed or recorded. The outcome of legal proceedings and other contingencies is inherently uncertain and so typically a loss cannot be reasonably estimated. Accordingly, if the outcome of legal proceedings and other contingencies is different than is anticipated by the Company, the Company would have to record a charge for the matter, generally in the full amount at which it was resolved, in the period resolved, negatively impacting the Company’s results of operations and financial position for the period. See Item 7, “Management’s Discussion and Analysis of Financial Condition and Results of Operations – Fiscal Year ended June 30, 2013 compared with Fiscal Year ended June 30, 2012 – Discontinued Operations” for a discussion of the impact of a settlement of a legal proceeding. See Note 5 of the Notes to the Consolidated Financial Statements, “Contingencies” for a discussion of current claims.
27
Market Risk Information
Perceptron’s primary market risk is related to foreign exchange rates. The foreign exchange risk is derived from the operations of its international subsidiaries, which are primarily located in Germany, China and Japan and for which products are produced in the U.S. The Company may from time to time have interest rate risk in connection with the investment of its cash.
Foreign Currency Risk
The Company has foreign currency exchange risk in its international operations arising from the time period between sales commitment and delivery for contracts in non-United States currencies. For sales commitments entered into in non-United States currencies, the currency rate risk exposure is predominantly less than one year with the majority in the 120 to 150 day range. At June 30, 2014, the Company’s percentage of sales commitments in non-United States currencies was approximately 74.2% or $29.2 million, compared to 74.5% or $22.7 million at June 30, 2013. The Company is most vulnerable to changes in U.S. dollar/Euro, U.S. dollar/Chinese Yuan and U.S. dollar/Japanese Yen exchange rates.
The Company’s potential loss in net income that would have resulted from a hypothetical 10% adverse change in quoted foreign currency exchange rates related to the translation of foreign denominated revenues and expenses into U.S. dollars for the fiscal years ended June 30, 2014, 2013 and 2012, would have been approximately $368,000, $486,000 and $170,000, respectively. This sensitivity analysis assumes there are no changes other than the exchange rates. This analysis has inherent limitations, including that it disregards the possibility that (i) the exchange rates of multiple foreign currencies may not always move in the same direction or percentage amount relative to the value of the U.S. dollar and (ii) changes in exchange rates may impact the volume of sales.
Interest Rate Risk
The Company invests its cash and cash equivalents in high quality, short-term investments with primarily a term of three months or less. A 100 basis point rise in interest rates would not be expected to have a material adverse impact on the fair value of the Company’s cash and cash equivalents. As a result, the Company does not currently hedge these interest rate exposures.
Uncertainties in Credit Markets
At June 30, 2014, the Company holds a long-term investment in preferred stock that is not registered under the Securities Act of 1933 and may not be offered or sold in the United States absent registration or an applicable exemption from registration requirements. The Company’s long-term investment is subject to risk due to a decline in value of the investment. The investment is currently recorded at $725,000 after consideration of impairment charges recorded in fiscal 2008 and 2009.
Based on the Company’s current business plan, cash and short-term investments of $33.9 million at June 30, 2014 and its existing unused credit facilities, the Company does not currently anticipate that the lack of liquidity in its long-term investment will affect the Company’s ability to operate or fund its currently anticipated fiscal 2015 cash flow requirements.
New Accounting Pronouncements
For a discussion of new accounting pronouncements, see Note 1 of the Notes to the Consolidated Financial Statements, “Summary of Significant Accounting Policies – New Accounting Pronouncements”.
ITEM 8:FINANCIAL STATEMENTS AND SUPPLEMENTARY DATA
28
Report of Independent Registered Public Accounting Firm
Board of Directors and Stockholders
Perceptron, Inc.
Plymouth, Michigan
We have audited the accompanying consolidated balance sheets of Perceptron, Inc. as of June 30, 2014 and 2013 and the related consolidated statements of income, comprehensive income, shareholders’ equity, and cash flows for each of the two years in the period ended June 30, 2014. These financial statements are the responsibility of the Company’s management. Our responsibility is to express an opinion on these financial statements based on our audits.
We conducted our audits in accordance with the standards of the Public Company Accounting Oversight Board (United States). Those standards require that we plan and perform the audit to obtain reasonable assurance about whether the financial statements are free of material misstatement. An audit also includes examining, on a test basis, evidence supporting the amounts and disclosures in the financial statements, assessing the accounting principles used and significant estimates made by management, as well as evaluating the overall financial statement presentation. We believe that our audits provide a reasonable basis for our opinion.
In our opinion, the consolidated financial statements referred to above present fairly, in all material respects, the financial position of Perceptron, Inc. at June 30, 2014 and 2013, and the results of its operations and its cash flows for each of the two years in the period ended June 30, 2014, in conformity with accounting principles generally accepted in the United States of America.
We also have audited, in accordance with the standards of the Public Company Accounting Oversight Board (United States), Perceptron, Inc.’s internal control over financial reporting as of June 30, 2014, based on criteria established in Internal Control – Integrated Framework (1992) issued by the Committee of Sponsoring Organizations of the Treadway Commission (COSO) and our report dated September 15, 2014 expressed an unqualified opinion thereon.
/s/ BDO USA, LLP
Troy, Michigan
September 15, 2014
29
[GRANT THORNTON LETTERHEAD]
REPORT OF INDEPENDENT REGISTERED PUBLIC ACCOUNTING FIRM
Board of Directors and Shareholders
Perceptron, Inc.
We have audited the consolidated statement of income, comprehensive income, cash flows and shareholders’ equity of Perceptron, Inc. (a Michigan corporation) and subsidiaries for the year ended June 30, 2012. These consolidated financial statements are the responsibility of the Company’s management. Our responsibility is to express an opinion on these financial statements based on our audit.
We conducted our audit in accordance with the standards of the Public Company Accounting Oversight Board (United States). Those standards require that we plan and perform the audit to obtain reasonable assurance about whether the financial statements are free of material misstatement. We were not engaged to perform an audit of the Company’s internal control over financial reporting as of June 30, 2012. Our audit included consideration of internal control over financial reporting as a basis for designing audit procedures that are appropriate in the circumstances, but not for the purpose of expressing an opinion on the effectiveness of the Company’s internal control over financial reporting. Accordingly, we express no such opinion. An audit also includes examining, on a test basis, evidence supporting the amounts and disclosures in the financial statements, assessing the accounting principles used and significant estimates made by management, as well as evaluating the overall financial statement presentation. We believe that our audit provides a reasonable basis for our opinion.
In our opinion, the consolidated financial statements referred to above present fairly, in all material respects, the results of operations and cash flows of Perceptron, Inc. and subsidiaries for the year ended June 30, 2012 in conformity with accounting principles generally accepted in the United States of America.
/s/ GRANT THORNTON LLP
Southfield, Michigan
September 28, 2012
30
|
CONSOLIDATED BALANCE SHEETS |
||||||
|
(In Thousands, Except Per Share Amount) |
||||||
|
As of June 30, |
2014 |
2013 |
||||
|
ASSETS |
||||||
|
Current Assets |
||||||
|
Cash and cash equivalents |
$ |
23,070 |
$ |
13,364 | ||
|
Short-term investments |
10,822 | 13,321 | ||||
|
Receivables: |
||||||
|
Billed receivables, net of allowance for doubtful accounts |
19,185 | 21,499 | ||||
|
of $146 and $174, respectively |
||||||
|
Other receivables |
276 | 261 | ||||
|
Inventories, net of reserves of $1,185 and $1,124, respectively |
7,049 | 6,783 | ||||
|
Deferred taxes |
1,687 | 1,342 | ||||
|
Other current assets |
1,651 | 1,468 | ||||
|
Total current assets |
63,740 | 58,038 | ||||
|
Property and Equipment |
||||||
|
Building and land |
6,438 | 6,422 | ||||
|
Machinery and equipment |
13,916 | 13,301 | ||||
|
Furniture and fixtures |
1,156 | 1,137 | ||||
| 21,510 | 20,860 | |||||
|
Less - Accumulated depreciation and amortization |
(15,970) | (15,282) | ||||
|
Net property and equipment |
5,540 | 5,578 | ||||
|
Long-term Investments |
725 | 725 | ||||
|
Deferred Tax Asset |
10,061 | 9,298 | ||||
|
Total Assets |
$ |
80,066 |
$ |
73,639 | ||
|
LIABILITIES AND SHAREHOLDERS' EQUITY |
||||||
|
Current Liabilities |
||||||
|
Accounts payable |
$ |
2,081 |
$ |
2,561 | ||
|
Accrued liabilities and expenses |
4,287 | 3,794 | ||||
|
Accrued compensation |
1,630 | 3,324 | ||||
|
Income taxes payable |
1,717 | 1,075 | ||||
|
Deferred revenue |
7,571 | 5,990 | ||||
|
Total current liabilities |
17,286 | 16,744 | ||||
|
Shareholders' Equity |
||||||
|
Preferred stock, no par value, authorized 1,000 shares, issued none |
- |
- |
||||
|
Common stock, $0.01 par value, authorized 19,000 shares, issued |
||||||
|
and outstanding 9,149 and 8,619, respectively |
91 | 86 | ||||
|
Accumulated other comprehensive income (loss) |
573 | (94) | ||||
|
Additional paid-in capital |
43,600 | 39,442 | ||||
|
Retained earnings |
18,516 | 17,461 | ||||
|
Total shareholders' equity |
62,780 | 56,895 | ||||
|
Total Liabilities and Shareholders' Equity |
$ |
80,066 |
$ |
73,639 | ||
|
The notes to the consolidated financial statements are an integral part of these statements. |
||||||
31
|
CONSOLIDATED STATEMENTS OF INCOME |
|||||||||
|
(In Thousands, Except Per Share Amounts) |
|||||||||
|
Years ended June 30, |
2014 |
2013 |
2012 |
||||||
|
Net Sales |
$ |
59,612 |
$ |
60,886 |
$ |
57,379 | |||
|
Cost of Sales |
34,763 | 32,766 | 33,209 | ||||||
|
Gross Profit |
24,849 | 28,120 | 24,170 | ||||||
|
Operating Expenses |
|||||||||
|
Selling, general and administrative |
15,216 | 14,473 | 12,983 | ||||||
|
Engineering, research and development |
6,691 | 6,781 | 5,591 | ||||||
|
Total operating expenses |
21,907 | 21,254 | 18,574 | ||||||
|
Operating Income |
2,942 | 6,866 | 5,596 | ||||||
|
Other Income and (Expenses) |
|||||||||
|
Interest income, net |
188 | 173 | 245 | ||||||
|
Foreign currency loss |
(127) | (647) | (629) | ||||||
|
Gain on Redemption of Investment |
- |
1,134 |
- |
||||||
|
Other |
(1) | 5 | 163 | ||||||
|
Total other income (expense) |
60 | 665 | (221) | ||||||
|
Income from Continuing Operations Before Income Taxes |
3,002 | 7,531 | 5,375 | ||||||
|
Income Tax Expense |
(575) | (1,401) | (2,548) | ||||||
|
Income from Continuing Operations |
2,427 | 6,130 | 2,827 | ||||||
|
Discontinued Operations |
|||||||||
|
Litigation Settlement from Forest Products Business Unit |
|||||||||
|
net of taxes of $520 (Note 11) |
- |
- |
(1,009) | ||||||
|
Commercial Products Business Unit net of taxes of |
|||||||||
|
$41, and $1,104, respectively |
- |
80 | (2,151) | ||||||
|
Total discontinued operations (Note 11) |
- |
80 | (3,160) | ||||||
|
Net Income (Loss) |
$ |
2,427 |
$ |
6,210 |
$ |
(333) | |||
|
Basic Earnings (Loss) Per Common Share |
|||||||||
|
Continuing operations |
$ |
0.27 |
$ |
0.72 |
$ |
0.34 | |||
|
Discontinued operations |
- |
0.01 | (0.38) | ||||||
|
Net Income (Loss) |
$ |
0.27 |
$ |
0.73 |
$ |
(0.04) | |||
|
Diluted Earnings (Loss) Per Common Share |
|||||||||
|
Continuing operations |
$ |
0.26 |
$ |
0.71 |
$ |
0.34 | |||
|
Discontinued operations |
- |
0.01 | (0.38) | ||||||
|
Net Income (Loss) |
$ |
0.26 |
$ |
0.72 |
$ |
(0.04) | |||
|
Weighted Average Common Shares Outstanding |
|||||||||
|
Basic |
8,983 | 8,512 | 8,433 | ||||||
|
Dilutive effect of stock options |
227 | 76 |
- |
||||||
|
Diluted |
9,210 | 8,588 | 8,433 | ||||||
|
The notes to the consolidated financial statements are an integral part of these statements. |
|||||||||
32
|
CONSOLIDATED STATEMENTS OF COMPREHENSIVE INCOME |
|||||||||
|
(In Thousands) |
|||||||||
|
Years ended June 30, |
2014 |
2013 |
2012 |
||||||
|
Net Income (Loss) |
$ |
2,427 |
$ |
6,210 |
$ |
(333) | |||
|
Other Comprehensive Income (Loss): |
|||||||||
|
Foreign currency translation adjustments |
667 | 799 | (1,999) | ||||||
|
Comprehensive Income (Loss) |
$ |
3,094 |
$ |
7,009 |
$ |
(2,332) | |||
|
The notes to the consolidated financial statements are an integral part of these statements. |
|||||||||
33
|
CONSOLIDATED STATEMENTS OF CASH FLOW |
|||||||||
|
(In Thousands) |
|||||||||
|
Years ended June 30, |
2014 |
2013 |
2012 |
||||||
|
Cash Flows from Operating Activities |
|||||||||
|
Net income (loss) |
$ |
2,427 |
$ |
6,210 |
$ |
(333) | |||
|
(Income) loss from discontinued operations |
- |
(80) | 3,160 | ||||||
|
Adjustments to reconcile net income to net cash provided from |
|||||||||
|
(used for) operating activities: |
|||||||||
|
Depreciation and amortization |
726 | 660 | 597 | ||||||
|
Stock compensation expense |
515 | 201 | 255 | ||||||
|
Deferred income taxes |
(1,117) | 277 | 469 | ||||||
|
Disposal of assets and other |
(165) | 83 | 88 | ||||||
|
Allowance for doubtful accounts |
(33) | (92) | 142 | ||||||
|
Changes in assets and liabilities |
|||||||||
|
Receivables, net |
2,881 | (6,082) | (801) | ||||||
|
Inventories |
(147) | (1,340) | 58 | ||||||
|
Accounts payable |
(558) | 1,702 | 842 | ||||||
|
Other current assets and liabilities |
532 | 2,609 | 371 | ||||||
|
Net cash provided from operating activities-continuing operations |
5,061 | 4,148 | 4,848 | ||||||
|
Net cash used for operating activities-discontinued operations |
- |
(835) | (1,938) | ||||||
|
Net cash provided from operating activities |
5,061 | 3,313 | 2,910 | ||||||
|
Cash Flows from Financing Activities |
|||||||||
|
Proceeds from stock plans |
3,648 | 842 | 204 | ||||||
|
Repurchase of company stock |
- |
- |
(1,348) | ||||||
|
Payment of cash dividend |
(1,372) | (3,416) |
- |
||||||
|
Net cash provided from (used for) financing activities |
2,276 | (2,574) | (1,144) | ||||||
|
Cash Flows from Investing Activities |
|||||||||
|
Purchases of short-term investments |
(23,748) | (21,080) | (29,467) | ||||||
|
Sales of short-term investments |
26,661 | 20,698 | 29,830 | ||||||
|
Capital expenditures |
(678) | (731) | (594) | ||||||
|
Proceeds from sale of Commercial Products Business Unit assets (Note 11) |
- |
838 |
- |
||||||
|
Net cash provided from (used for) investing activities |
2,235 | (275) | (231) | ||||||
|
Effect of Exchange Rate Changes on Cash and Cash Equivalents |
134 | (84) | (656) | ||||||
|
Net Increase in Cash and Cash Equivalents |
9,706 | 380 | 879 | ||||||
|
Cash and Cash Equivalents, July 1 |
13,364 | 12,984 | 12,105 | ||||||
|
Cash and Cash Equivalents, June 30 |
$ |
23,070 |
$ |
13,364 |
$ |
12,984 | |||
|
Supplemental Disclosure of Cash Flow Information |
|||||||||
|
Cash paid during the year for interest |
$ |
- |
$ |
8 |
$ |
7 | |||
|
Cash paid during the year for income taxes |
1,072 | 1,002 | 497 | ||||||
|
The notes to the consolidated financial statements are an integral part of these statements. |
|||||||||
34
|
CONSOLIDATED STATEMENTS OF SHAREHOLDERS' EQUITY |
||||||||||||||||
|
(In Thousands) |
||||||||||||||||
|
Accumulated |
||||||||||||||||
|
Other |
Additional |
Total |
||||||||||||||
|
Common Stock |
Comprehensive |
Paid-In |
Retained |
Shareholders' |
||||||||||||
|
Shares |
Amount |
Income (Loss) |
Capital |
Earnings |
Equity |
|||||||||||
|
Balances, June 30, 2011 |
8,566 |
$ |
86 |
$ |
1,106 |
$ |
39,288 |
$ |
15,000 |
$ |
55,480 | |||||
|
Net loss |
(333) | (333) | ||||||||||||||
|
Other comprehensive income |
(1,999) | (1,999) | ||||||||||||||
|
Stock-based compensation |
255 | 255 | ||||||||||||||
|
Stock plans |
71 |
- |
204 | 204 | ||||||||||||
|
Stock repurchase |
(235) | (2) | (1,346) | (1,348) | ||||||||||||
|
Balances, June 30, 2012 |
8,402 |
$ |
84 |
$ |
(893) |
$ |
38,401 |
$ |
14,667 |
$ |
52,259 | |||||
|
Net income |
6,210 | 6,210 | ||||||||||||||
|
Other comprehensive income |
799 | 799 | ||||||||||||||
|
Dividend |
(3,416) | (3,416) | ||||||||||||||
|
Stock-based compensation |
201 | 201 | ||||||||||||||
|
Stock plans |
217 | 2 | 840 | 842 | ||||||||||||
|
Balances, June 30, 2013 |
8,619 |
$ |
86 |
$ |
(94) |
$ |
39,442 |
$ |
17,461 |
$ |
56,895 | |||||
|
Net income |
2,427 | 2,427 | ||||||||||||||
|
Other comprehensive income |
667 | 667 | ||||||||||||||
|
Dividend |
(1,372) | (1,372) | ||||||||||||||
|
Stock-based compensation |
515 | 515 | ||||||||||||||
|
Stock plans |
530 | 5 | 3,643 | 3,648 | ||||||||||||
|
Balances, June 30, 2014 |
9,149 |
$ |
91 |
$ |
573 |
$ |
43,600 |
$ |
18,516 |
$ |
62,780 | |||||
|
The notes to the consolidated financial statements are an integral part of these statements. |
||||||||||||||||
35
PERCEPTRON, INC. AND SUBSIDIARIES
NOTES TO THE CONSOLIDATED FINANCIAL STATEMENTS
1.Summary of Significant Accounting Policies
Operations
Perceptron, Inc. (“Perceptron” or the “Company”) develops, produces, and sells non-contact measurement and inspection solutions for industrial applications. The Company’s products provide solutions for manufacturing process control as well as sensor and software technologies for non-contact measurement, scanning and inspection applications. The Company also offers Value Added Services such as training and customer support services.
Basis of Presentation and Principles of Consolidation
The consolidated financial statements and accompanying notes are prepared in accordance with accounting principles generally accepted in the United States of America (“U.S. GAAP”). The consolidated financial statements include the accounts of the Company and its wholly-owned subsidiaries. All significant intercompany accounts and transactions have been eliminated in consolidation. Certain accrued unbilled receivables for prior periods have been reclassified to conform to the current period presentation.
On August 30, 2012, the Company sold substantially all of the assets of its Commercial Products Business Unit (“CBU”). See also Note 11, “Discontinued Operations”. Accordingly, CBU financial information included in this Form 10-K for fiscal year 2014 and prior periods is presented as a discontinued operation.
The preparation of financial statements in conformity with generally accepted accounting principles requires management to make estimates and assumptions that affect the reported amounts of assets and liabilities and disclosure of contingent assets and liabilities at the date of the financial statements and the reported amounts of revenues and expenses during the reporting period. Actual results could differ from those estimates.
Revenue Recognition
Revenue related to products and services is recognized upon shipment when title and risk of loss has passed to the customer or upon completion of the service, there is persuasive evidence of an arrangement, the sales price is fixed or determinable, collection of the related receivable is reasonably assured and customer acceptance criteria, if any, have been successfully demonstrated.
The Company also has multiple element arrangements in its Measurement Solutions product line that may include elements such as, equipment, installation, labor support and/or training. Each element has value on a stand-alone basis and the delivered elements do not include general rights of return. Accordingly, each element is considered a separate unit of accounting. When available, the Company allocates arrangement consideration to each element in a multiple element arrangement based upon vendor specific objective evidence (“VSOE”) of fair value of the respective elements. When VSOE cannot be established, the Company attempts to establish the selling price of each element based on relevant third-party evidence. Because the Company’s products contain a significant level of proprietary technology, customization or differentiation such that comparable pricing of products with similar functionality cannot be obtained, the Company uses, in these cases, its best estimate of selling price (“BESP”). The Company determines the BESP for a product or service by considering multiple factors including, but not limited to, pricing practices, internal costs, geographies and gross margin.
For multiple element arrangements, the Company defers from revenue recognition the greater of the relative fair value of any undelivered elements of the contract or the portion of the sales price of the contract that is not payable until the undelivered elements are completed. As part of this evaluation, the Company limits the amount of revenue recognized for delivered elements to the amount that is not contingent on the future delivery of products or services, including a consideration of payment terms that delay payment until those future deliveries are completed.
Some multiple element arrangements contain installment payment terms with a final payment (“final buy-off”) due upon the Company’s completion of all elements in the arrangement or when the customer’s final acceptance is received. The Company recognizes revenue for each completed element of a contract when it is both earned and realizable. A provision for final customer acceptance generally does not preclude revenue recognition for the delivered equipment element because the Company rigorously tests equipment prior to shipment to ensure it will function in the customer’s environment. The final acceptance amount is assigned to specific element(s) identified in the contract, or if not specified in the contract, to the last element or elements to be delivered that represent an amount at least equal to the final payment amount.
The Company’s Measurement Solutions products are designed and configured to meet each customer’s specific requirements. Timing for the delivery of each element in the arrangement is primarily determined by the customer’s requirements and the
36
number of elements ordered. Delivery of all of the multiple elements in an order will typically occur over a three to 15 month period after the order is received. The Company does not have price protection agreements or requirements to buy back inventory. The Company’s history demonstrates that sales returns have been insignificant.
Research and Development
Research and development costs, including software development costs, are expensed as incurred.
Foreign Currency
The financial statements of the Company’s wholly-owned foreign subsidiaries have been translated in accordance with ASC 830, “Foreign Currency Translation Matters” where the functional currency is the local currency in the foreign country. Under this standard, translation adjustments are accumulated in a separate component of shareholders’ equity until disposal of the subsidiary. Gains and losses on foreign currency transactions are included in the consolidated statement of income under “Other Income and Expenses”.
Earnings Per Share
Basic earnings per share (“EPS”) is calculated by dividing net income by the weighted average number of common shares outstanding during the period. Other obligations, such as stock options and restricted stock awards, are considered to be potentially dilutive common shares. Diluted EPS assumes the issuance of potential dilutive common shares outstanding during the period and adjusts for any changes in income and the repurchase of common shares that would have occurred from the assumed issuance, unless such effect is anti-dilutive. The calculation of diluted shares also takes into effect the average unrecognized non-cash stock-based compensation expense and additional adjustments for tax benefits related to non-cash stock-based compensation expense.
Options to purchase 196,000, 988,000, and 909,000 shares of common stock outstanding in the fiscal years ended June 30, 2014, 2013 and 2012, respectively, were not included in the computation of diluted EPS because the effect would have been anti-dilutive.
Cash and Cash Equivalents
The Company considers all highly liquid investments purchased with maturities of three months or less to be cash equivalents. Fair value approximates carrying value because of the short maturity of the cash equivalents. At June 30, 2014, the Company had $23.1 million in cash and cash equivalents of which $14.6 million was held in foreign bank accounts. The Company maintains its cash in bank deposit accounts, which, at times, may exceed federally insured limits. The Company has not experienced any losses in such accounts.
Accounts Receivable and Concentration of Credit Risk
The Company markets and sells its products principally to automotive manufacturers, line builders, system integrators, original equipment manufacturers and value-added resellers. The Company’s accounts receivable are principally from a small number of large customers. The Company performs ongoing credit evaluations of its customers. Accounts receivable are generally due within 30 to 60 days and are stated at amounts due from customers net of an allowance for doubtful accounts. Accounts receivable outstanding longer than the contractual payment terms are considered past due. The Company determines its allowance for doubtful accounts by considering a number of factors, including the length of time trade accounts receivable are past due, the Company’s previous loss history, the customer’s current ability to pay its obligation to the Company, and the condition of the general economy and the industry as a whole. The Company writes-off accounts receivable when they become uncollectible, and payments subsequently received on such receivables are credited to the allowance for doubtful accounts. Changes in the Company’s allowance for doubtful accounts are as follows (in thousands):
|
Beginning |
Costs and |
Less |
Ending |
||||||||
|
Balance |
Expenses |
Charge-offs |
Balance |
||||||||
|
Fiscal year ended June 30, 2014 |
$ |
174 |
$ |
(34) |
$ |
(6) |
$ |
146 | |||
|
Fiscal year ended June 30, 2013 |
$ |
263 |
$ |
69 |
$ |
158 |
$ |
174 | |||
|
Fiscal year ended June 30, 2012 |
$ |
314 |
$ |
41 |
$ |
92 |
$ |
263 | |||
Short-Term and Long-Term Investments
The Company accounts for its investments in accordance with ASC 320, “Investments – Debt and Equity Securities.” Investments with a maturity of greater than three months to one year are classified as short-term investments. Investments with
37
maturities beyond one year may be classified as short-term if the Company reasonably expects the investment to be realized in cash or sold or consumed during the normal operating cycle of the business. Investments available for sale are recorded at market value using the specific identification method. Investments expected to be held to maturity or until market conditions improve are measured at amortized cost in the statement of financial position if it is the Company’s intent and ability to hold those securities long-term. Each balance sheet date, the Company evaluates its investments for possible other-than-temporary impairment which involves significant judgment. In making this judgment, management reviews factors such as the length of time and extent to which fair value has been below the cost basis, the anticipated recovery period, the financial condition of the issuer, the credit rating of the instrument and the Company’s ability and intent to hold the investment for a period of time which may be sufficient for recovery of the cost basis. Any unrealized gains and losses on securities are reported as other comprehensive income as a separate component of shareholders’ equity until realized or until a decline in fair value is determined to be other than temporary. Once a decline in fair value is determined to be other-than-temporary, an impairment charge is recorded in the income statement. If market, industry, and/or investee conditions deteriorate, future impairments may be incurred.
At June 30, 2014, the Company had $9.2 million of short-term investments in time deposits or certificates of deposit, $1.3 million in variable rate demand notes, $236,000 in a repurchase investment and $96,000 in mutual funds. Included in short-term investments is cash on deposit that serves as collateral for bank guarantees that provide financial assurance that the Company will fulfill certain customer obligations in China for fiscal year 2014 and China and India for fiscal year 2013. The cash earns interest while on deposit but the Company is restricted from withdrawing the cash while the related bank guarantees are outstanding. At June 30, 2014 and June 30, 2013, restricted cash was $520,000 and $772,000 respectively.
During fiscal 2013, a long-term investment in preferred stock was redeemed, at par, for $2.6 million. Previously the Company had recorded an impairment charge on the carrying value of this investment in fiscal 2009. As a result of the redemption, the Company recorded a gain of $1.1 million in fiscal 2013. At June 30, 2014, the Company holds a long-term investment in preferred stock that is not registered under the Securities Act of 1933 and may not be offered or sold in the United States absent registration or an applicable exemption from registration requirements. The investment is currently recorded at $725,000 after consideration of impairment charges recorded in fiscal 2008 and 2009. The Company estimated that the fair market value of this investment at June 30, 2014 exceeded $725,000 based on observable market activity and an internal valuation model which included the use of a discounted cash flow model. The fair market analysis considered the following key inputs, (i) the underlying structure of the security; (ii) the present value of the future principal discounted at rates considered to reflect current market conditions; and (iii) the time horizon that the market value of the security could return to its cost and be sold. Under ASC 820, “Fair Value Measurements”, such valuation assumptions are defined as Level 3 inputs.
|
Unrealized |
||||||||
|
Gains |
||||||||
|
Long-term Investments |
Cost |
(Losses) |
Book Value |
|||||
|
(in thousands) |
||||||||
|
June 30, 2014 and 2013 |
||||||||
|
Preferred Stock |
$ |
3,700 |
$ |
(2,975) |
$ |
725 | ||
Inventory
Inventory is stated at the lower of cost or market. The cost of inventory is determined by the first-in, first-out (“FIFO”) method. The Company provides a reserve for obsolescence to recognize inventory impairment for the effects of engineering change orders, age and use of inventory that affect the value of the inventory. The reserve for obsolescence creates a new cost basis for the impaired inventory. When inventory that has previously been impaired is sold or disposed of, the related obsolescence reserve is reduced resulting in the reduced cost basis being reflected in cost of goods sold. A detailed review of the inventory is performed annually with quarterly updates for known changes that have occurred since the annual review. Inventory, net of reserves of $1,185,000 and $1,124,000 at June 30, 2014 and June 30, 2013 respectively, is comprised of the following (in thousands):
|
At June 30, |
|||||
|
2014 |
2013 |
||||
|
Component parts |
$ |
2,813 |
$ |
2,648 | |
|
Work in process |
562 | 376 | |||
|
Finished goods |
3,674 | 3,759 | |||
|
Total |
$ |
7,049 |
$ |
6,783 | |
38
Changes in the Company’s reserves for obsolescence are as follows (in thousands):
|
Beginning |
Costs and |
Less |
Ending |
||||||||
|
Balance |
Expenses |
Charge-offs |
Balance |
||||||||
|
Fiscal year ended June 30, 2014 |
$ |
1,124 |
$ |
342 |
$ |
281 |
$ |
1,185 | |||
|
Fiscal year ended June 30, 2013 |
$ |
1,200 |
$ |
96 |
$ |
172 |
$ |
1,124 | |||
|
Fiscal year ended June 30, 2012 |
$ |
1,477 |
$ |
95 |
$ |
372 |
$ |
1,200 | |||
Property and Equipment
Property and equipment are recorded at cost. Depreciation related to machinery and equipment and furniture and fixtures is primarily computed on a straight-line basis over estimated useful lives ranging from 3 to 15 years. Depreciation on buildings is computed on a straight-line basis over 40 years.
When assets are retired, the costs of such assets and related accumulated depreciation or amortization are eliminated from the respective accounts, and the resulting gain or loss is reflected in the consolidated statement of income.
Deferred Income Taxes
Deferred tax assets and liabilities are recognized for the future tax consequences attributable to differences between the financial statement carrying amounts of existing assets and liabilities and their respective tax basis, and the effects of operating losses and tax credit carry-forwards. Deferred tax assets and liabilities are measured using enacted tax rates expected to apply to taxable income in the years in which those temporary differences are expected to be recovered or settled. The effect on deferred tax assets and liabilities of a change in tax rates is recognized in income in the period that includes the enactment date. A valuation allowance is provided for deferred tax assets if it is more likely than not that these items will either expire before the Company is able to realize their benefit, or future deductibility is uncertain.
Financial Instruments
The carrying amounts of the Company’s financial instruments, which include cash and cash equivalents, short-term investments, accounts receivable, accounts payable and amounts due to banks or other lenders, approximate their fair values at June 30, 2014 and 2013. See “Short-Term and Long-Term Investments” for a discussion of long-term investments. Fair values have been determined through information obtained from market sources and management estimates.
The Company follows the provisions of ASC 820, “Fair Value Measurements and Disclosures” for all financial assets and liabilities and nonfinancial assets and liabilities that are recognized or disclosed at fair value in the financial statements on a recurring basis. ASC 820, defines fair value, establishes a framework for measuring fair value and expands disclosures about fair value measurements. Financial instruments held by the Company at June 30, 2014 include investments classified as held for sale, mutual funds, fixed deposits, certificate of deposits, variable rate demand notes, and repurchase agreements.
ASC 820 establishes a hierarchy of valuation techniques based upon whether the inputs to those valuation techniques reflect assumptions other market participants would use based upon market data obtained from independent sources (observable inputs), or reflect the Company’s own assumptions of market participant valuation (unobservable inputs). These two types of inputs create the following fair value hierarchy:
|
· |
Level 1 – Quoted prices in active markets that are unadjusted and accessible at the measurement date for identical, unrestricted assets or liabilities. |
|
· |
Level 2 – Quoted prices for identical assets and liabilities in markets that are not active, quoted prices for similar assets and liabilities in active markets or financial instruments for which significant inputs are observable, either directly or indirectly. |
|
· |
Level 3 – Prices or valuations that require inputs that are both significant to the fair value measurement and unobservable and reflect management’s estimates and assumptions. |
ASC 820 requires the use of observable market data if such data is available without undue cost and effort.
The following table presents the Company’s investments at June 30, 2014 and June 30, 2013 that are measured and recorded at fair value on a recurring basis consistent with the fair value hierarchy provisions of ASC 820, “Fair Value Measurements and Disclosures” (in thousands).
39
|
Description |
June 30, 2014 |
Level 1 |
Level 2 |
Level 3 |
|||||||
|
Mutual funds |
$ |
96 |
$ |
96 |
$ |
- |
$ |
- |
|||
|
Fixed deposits and certificates of deposit |
9,165 |
- |
9,165 |
- |
|||||||
|
Variable rate demand notes |
1,325 |
- |
1,325 |
- |
|||||||
|
Repurchase agreements |
236 |
- |
236 |
- |
|||||||
|
Total |
$ |
10,822 |
$ |
96 |
$ |
10,726 |
$ |
- |
|||
|
Description |
June 30, 2013 |
Level 1 |
Level 2 |
Level 3 |
|||||||
|
Mutual funds |
$ |
25 |
$ |
25 |
$ |
- |
$ |
- |
|||
|
Fixed deposits and certificates of deposit |
9,581 |
- |
9,581 |
- |
|||||||
|
Variable rate demand notes |
1,715 |
- |
1,715 |
- |
|||||||
|
Repurchase agreements |
2,000 |
- |
2,000 |
- |
|||||||
|
Total |
$ |
13,321 |
$ |
25 |
$ |
13,296 |
$ |
- |
|||
During fiscal years 2014 and 2013, the Company did not record any other-than-temporary impairments on the financial assets required to be measured on a nonrecurring basis.
Warranty
Measurement Solutions products generally carry a two or three-year warranty for parts and a one-year warranty for labor and travel related to warranty. Product sales to the forest products industry carry a three-year warranty for TriCam® sensors. Sales of ScanWorks® have a one-year warranty for parts; sales of WheelWorks® products have a two-year warranty for parts. The Company provides a reserve for warranty based on its experience and knowledge. Factors affecting the Company’s warranty liability include the number of units sold or in service and historical and anticipated rates of claims and cost per claim. The Company periodically assesses the adequacy of its warranty liability based on changes in these factors. If a special circumstance arises requiring a higher level of warranty, the Company would make a special warranty provision commensurate with the facts. Changes to the Company’s warranty liability are as follows (in thousands):
|
Beginning |
Costs and |
Less |
Ending |
||||||||
|
Balance |
Expenses |
Charge-offs |
Balance |
||||||||
|
Fiscal year ended June 30, 2014 |
$ |
63 |
$ |
305 |
$ |
281 |
$ |
87 | |||
|
Fiscal year ended June 30, 2013 |
$ |
63 |
$ |
123 |
$ |
123 |
$ |
63 | |||
|
Fiscal year ended June 30, 2012 |
$ |
63 |
$ |
146 |
$ |
146 |
$ |
63 | |||
Advertising Expense
The Company charges advertising expense in the period incurred. As of June 30, 2014, 2013, and 2012, advertising expense was $35,000, $53,000, and $13,000, respectively.
Self–Insurance
The Company is self-insured for health, vision and short-term disability costs up to a certain stop-loss level per claim and on an aggregate basis of a percentage of estimated annual costs. The estimated liability is based upon review by management and an independent insurance consultant of claims filed and claims incurred but not yet reported.
New Accounting Pronouncements
In May 2014, the FASB issued Accounting Standards Update No. 2014-09, Revenue from Contracts with Customers (ASU 2014-09), which supersedes nearly all existing revenue recognition guidance under U.S. GAAP. The core principle of ASU 2014-09 is to recognize revenues when promised goods or services are transferred to customers in an amount that reflects the consideration to which an entity expects to be entitled for those goods or services. ASU 2014-09 defines a five step process to achieve this core principle and, in doing so, more judgment and estimates may be required within the revenue recognition process than are required under existing U.S. GAAP. The standard will be effective for annual periods beginning after December 15, 2016, and interim periods therein, using either of the following transition methods: (i) a full retrospective approach reflecting the applications of the standard in each prior reporting period with the option to elect certain practical expedients, or (ii) a retrospective approach with the cumulative effect of initially adopting ASU 2014-09 recognized at the date of adoption (which includes additional footnote disclosures). We are currently evaluating the impact of our pending adoption of ASU 2014-09 on our consolidated financial statements and have not yet determined the method by which we will adopt the standard in fiscal year 2018.
In March 2013, the FASB issued guidance on a parent’s accounting for the cumulative translation adjustment upon derecognition of a subsidiary or group of assets within a foreign entity. This new guidance requires that the parent release any related cumulative translation adjustment into net income only if the sale or transfer results in the complete or substantially complete liquidation of the foreign entity in which the subsidiary or group of assets had resided. The new guidance will be effective for the Company beginning July 1, 2014. The Company does not anticipate material impacts on its financial statements upon adoption.
40
2. Leases
The Company leases building space, office equipment and motor vehicles under operating leases. Lease terms generally cover periods from two to five years and may contain renewal options. The following is a summary, as of June 30, 2014, of the future minimum annual lease payments required under the Company’s operating leases having initial or remaining non-cancelable terms in excess of one year:
|
Year |
Minimum Rentals |
|
|
2015 |
$ |
906,188 |
|
2016 |
402,243 | |
|
2017 |
112,391 | |
|
2018 |
38,017 | |
|
2019 and beyond |
39,986 | |
|
Total minimum lease payments |
$ |
1,498,825 |
Rental expenses for operating leases in the fiscal years ended June 30, 2014, 2013 and 2012 were $1,018,000, $955,000 and $998,000, respectively.
3.Credit Facilities
The Company had no debt outstanding at June 30, 2014 and June 30, 2013.
The Company has a $6.0 million secured credit agreement with Comerica Bank (“Credit Agreement”) which expires on November 2, 2015. Proceeds under the Credit Agreement may be used for working capital and capital expenditures. Security for the Credit Agreement is substantially all non-real estate assets of the Company held in the United States. Borrowings are designated as a Libor-based Advance or as a Prime-based Advance if the Libor-based Advance is not available. Interest on Libor-based Advances is calculated at 2.35% above the Libor Rate offered at the time for the period chosen, and is payable on the last day of the applicable period. Quarterly, the Company pays a commitment fee of 0.15% per annum on the average daily unused portion of the revolving credit commitment. The Credit Agreement requires the Company to maintain a minimum Tangible Net Worth of not less than $33.2 million. The Company was in compliance with this financial covenant at June 30, 2014. The Company is permitted to declare dividends of up to $2.5 million in any fiscal year provided the Company maintains the required minimum Tangible Net Worth. The Company is also required to have no advances outstanding under the Credit Agreement for 30 days (which need not be consecutive) during each calendar year.
At June 30, 2014, the Company's German subsidiary (“GmbH”) had an unsecured credit facility totaling 350,000 Euros (equivalent to approximately $478,000). The facility allows 100,000 Euros to be used to finance working capital needs and equipment purchases or capital leases. The facility allows up to 250,000 Euros to be used for providing bank guarantees. Any borrowings for working capital needs will bear interest at 7.15%. Any outstanding bank guarantees will bear interest at 2.0%. The German credit facility is cancelable at any time by either GmbH or the bank and any amounts then outstanding would become immediately due and payable. At June 30, 2014 and 2013, GmbH had no borrowings or bank guarantees outstanding.
4.Information About Major Customers
The Company’s sales efforts are led by account managers who develop a close consultative selling relationship with the Company’s customers. The Company’s principal customers have historically been automotive manufacturing companies that the Company either sells to directly or through manufacturing line builders, system integrators or original equipment manufacturers. The Company’s products are typically purchased for installation in connection with retooling programs undertaken by these companies. Because sales are dependent on the timing of customers’ retooling programs, sales by customer vary significantly from year to year, as do the Company’s largest customers.
For the fiscal years 2014, 2013 and 2012, approximately 43%, 46% and 51%, respectively, of net sales were derived from the Company’s four largest automotive end user customers. The Company also sells to manufacturing line builders, system integrators or assembly equipment manufacturers, who in turn sell to the Company’s automotive customers. For the fiscal years 2014, 2013 and 2012, approximately 16%, 7% and 13%, respectively, of net sales were to manufacturing line builders, system integrators and original equipment manufacturers for the benefit of the same four largest automotive end user customers in each respective year. During the fiscal year ended June 30, 2014, direct sales to Volkswagen Group accounted for approximately 30% of the Company’s total net sales. At June 30, 2014, accounts receivable from Volkswagen Group totaled approximately $4.7 million.
41
5.Contingencies
The Company may, from time to time, be subject to litigation and other claims in the ordinary course of its business. The Company accrues for estimated losses arising from such litigation or claims if it is probable that an asset has been impaired or a liability has been incurred and the amount of the loss can be reasonably estimated. To estimate whether a loss contingency should be accrued by a charge to income, the Company evaluates, among other factors, the degree of probability of an unfavorable outcome and the ability to make a reasonable estimate of the amount of the loss. Since the outcome of litigation and claims is subject to significant uncertainty, changes in the factors used in the Company’s evaluation could materially impact the Company’s financial position or results of operations.
Management is currently unaware of any significant pending litigation affecting the Company.
On July 19, 2013, a civil suit was filed against the Company by 3CEMS, a Cayman Islands and People’s Republic of China corporation, with the U.S. District Court for the Eastern District of Michigan. The suit alleged that the Company breached its contractual obligations by failing to pay for component parts to be used to manufacture optical video scopes for the Company’s discontinued Commercial Products Business Unit. 3CEMS alleged that it purchased the component parts in advance of the receipt of orders from the Company based upon instructions they claimed to have received from the Company. The suit alleged damages of not less than $4.5 million. Effective December 6, 2013, a Tolling Agreement (the “Tolling Agreement”) was entered into between the Company and 3CEMS. The Tolling Agreement provided that 3CEMS would dismiss the suit against the Company without prejudice, permitting the parties to continue to discuss the dispute outside of litigation. On January 13, 2014, based upon 3CEMS’ voluntary dismissal, the Court entered an order of dismissal of the suit against the Company without prejudice. The Company has agreed that should 3CEMS subsequently seek to assert claims against the Company related to such suit the Company will not oppose the claims based on the statute of limitations or any other time-based defense, based upon the passage of time from July 19, 2013 to the date the Tolling Agreement is terminated. The Tolling Agreement terminates on December 31, 2014 or, if earlier upon 20 days’ notice by either party.
Because of the inherent uncertainty of litigation and claims such as the 3CEMS Matter, the Company is unable to reasonably estimate a possible loss or range of loss relating to the 3CEMS Matter.
As part of routine evaluation procedures, the Company identified a potential concern regarding the employment status and withholding for several individuals in one of the Company’s foreign jurisdictions. The Company has begun a review of the matter, and expects resolution in the next few months. At this time, because the Company has not completed its evaluation, the Company is not able to determine an amount or range of its financial liability relating to this matter. The Company does not expect that the resolution of this matter will have a detrimental effect on the conduct of the Company’s business in this foreign jurisdiction.
6. 401(k) Plan
The Company has a 401(k) tax deferred savings plan that covers all eligible employees. The Company may make discretionary contributions to the plan. The Company’s contribution during fiscal years 2014, 2013 and 2012 were $577,000, $522,000 and $190,000, respectively.
7.Employee Stock Purchase Plan
The Company has an Employee Stock Purchase Plan for all employees meeting certain eligibility criteria. Under the Plan, eligible employees may purchase shares of the Company's common stock at 85% of its market value at the beginning of the six-month election period. Purchases are limited to 10% of an employee's eligible compensation and the shares purchased are restricted from being sold for one year from the purchase date. At June 30, 2014, 136,044 shares remained available under the Plan.
Activity under this Plan is shown in the following table:
|
Purchase Period Ended |
||||||||
|
June 30, |
||||||||
|
2014 |
2013 |
2012 |
||||||
|
Non-cash stock based compensation expense |
$ |
30,571 |
$ |
34,829 |
$ |
6,653 | ||
|
Common shares purchased |
14,672 | 8,876 | 7,626 | |||||
|
Average purchase price per share |
$ |
5.74 |
$ |
4.35 |
$ |
4.22 | ||
42
8. Stock Based Compensation
The Company maintains a 2004 Stock Incentive Plan (“2004 Plan”) covering substantially all company employees, non-employee directors and certain other key persons. Options previously granted under a 1998 Global Team Member Stock Option Plan (“1998 Plan”) and a Directors Stock Option Plan (“Directors Plan”) will continue to be maintained until all options are exercised, cancelled or expire. No further grants are permitted to be made under the terms of the 1998 and Directors Plans. The 2004 and Directors Plans are administered by a committee of the Board of Directors, the Management Development, Compensation and Stock Option Committee. The 1998 Plan is administered by the President of the Company.
Awards under the 2004 Plan may be in the form of stock options, stock appreciation rights, restricted stock or restricted stock units, performance share awards, director stock purchase rights and deferred stock units; or any combination thereof. The terms of the awards will be determined by the Management Development, Compensation and Stock Option Committee, except as otherwise specified in the 2004 Plan.
Stock Options
Options outstanding under the 2004 Plan generally become exercisable at 25% per year beginning one year after the date of grant and expire ten years after the date of grant. All options outstanding under the 1998 and Directors Plans are vested and expire ten years from the date of grant. Option prices from options granted under these plans must not be less than fair market value of the Company’s stock on the date of grant. The Company uses the Black-Scholes model for determining stock option valuations. The Black-Scholes model requires subjective assumptions, including future stock price volatility and expected time to exercise, which affect the calculated values. The expected term of option exercises is derived from historical data regarding employee exercises and post-vesting employment termination behavior. The risk-free rate of return is based on published U.S. Treasury rates in effect for the corresponding expected term. The expected volatility is based on historical volatility of the Company’s stock price. These factors could change in the future, which would affect the stock-based compensation expense in future periods.
The Company recognized operating expense for non-cash stock-based compensation costs related to stock options in the amount of $255,000, $166,000 and $210,000 for the fiscal years ended June 30, 2014, 2013 and 2012, respectively. As of June 30, 2014, the total remaining unrecognized compensation cost related to non-vested stock based compensation amounted to $753,000. The Company expects to recognize this cost over a weighted average vesting period of 2.9 years.
The Company received $3,561,000 in cash from option exercises under all stock option payment arrangements for the twelve months ended June 30, 2014. The actual tax benefit realized, that related to tax deductions for non-qualified options exercised and disqualifying dispositions under all stock option payment arrangements, totaled approximately, $692,000 for fiscal 2014.
Activity under these Plans is shown in the following tables:
43
|
Fiscal Year 2014 |
Fiscal Year 2013 |
|||||||||||||||
|
Weighted |
Aggregate |
Weighted |
Aggregate |
|||||||||||||
|
Average |
Intrinsic |
Average |
Intrinsic |
|||||||||||||
|
Exercise |
Value (1) |
Exercise |
Value (1) |
|||||||||||||
|
Shares subject to option |
Shares |
Price |
($000) |
Shares |
Price |
($000) |
||||||||||
|
Outstanding at beginning of period |
1,122,675 |
$ |
7.07 | 1,162,996 |
$ |
6.81 | ||||||||||
|
New Grants (based on fair value |
||||||||||||||||
|
of common stock at dates of grant) |
214,000 |
$ |
10.80 | 164,000 |
$ |
5.76 | ||||||||||
|
Exercised |
(497,446) |
$ |
7.16 | (171,066) |
$ |
3.79 | ||||||||||
|
Expired |
(18,743) |
$ |
9.14 | (30,705) |
$ |
8.79 | ||||||||||
|
Forfeited |
(55,000) |
$ |
5.89 | (2,550) |
$ |
2.93 | ||||||||||
|
Outstanding at end of period |
765,486 |
$ |
8.09 |
$ |
3,614 | 1,122,675 |
$ |
7.07 |
$ |
1,502 | ||||||
|
Exercisable at end of period |
407,236 |
$ |
7.47 |
$ |
2,148 | 846,175 |
$ |
7.47 |
$ |
940 | ||||||
|
Fiscal Year 2012 |
||||||||||||||||
|
Weighted |
Aggregate |
|||||||||||||||
|
Average |
Intrinsic |
|||||||||||||||
|
Exercise |
Value (1) |
|||||||||||||||
|
Shares subject to option |
Shares |
Price |
($000) |
|||||||||||||
|
Outstanding at beginning of period |
1,122,919 |
$ |
6.60 | |||||||||||||
|
New Grants (based on fair value |
||||||||||||||||
|
of common stock at dates of grant) |
158,000 |
$ |
6.00 | |||||||||||||
|
Exercised |
(56,504) |
$ |
1.54 | |||||||||||||
|
Expired |
(33,119) |
$ |
6.67 | |||||||||||||
|
Forfeited |
(28,300) |
$ |
4.49 | |||||||||||||
|
Outstanding at end of period |
1,162,996 |
$ |
6.81 |
$ |
678 | |||||||||||
|
Exercisable at end of period |
963,271 |
$ |
7.13 |
$ |
552 | |||||||||||
(1) The intrinsic value of a stock option is the amount by which the current market value of the underlying stock exceeds the exercise price of the option. The total intrinsic value of stock options exercised during the fiscal years ended June 30, 2014, 2013 and 2012, were $2,034,000, $466,000 and $220,000, respectively. The total fair value of shares vested during the fiscal years ended June 30, 2014, 2013 and 2012, were $182,000, $148,000 and $313,000, respectively.
The estimated fair value as of the date options were granted during the periods presented using the Black-Scholes option-pricing model, was as follows:
|
2014 |
2013 |
2012 |
|||||||
|
Weighted average estimated fair value per |
|||||||||
|
share of options granted during the period |
$ |
10.80 |
$ |
2.27 |
$ |
2.46 | |||
|
Assumptions: |
|||||||||
|
Dividend yield |
2.10 |
- |
- |
||||||
|
Common stock price volatility |
38.88% | 44.86% | 46.14% | ||||||
|
Risk free rate of return |
1.53% | 0.62% | 0.90% | ||||||
|
Expected option term (in years) |
5 | 5 | 5 | ||||||
The following table summarizes information about stock options at June 30, 2014:
44
|
Options Outstanding |
Options Exercisable |
|||||||||||||||||
|
Weighted |
Weighted |
Weighted |
||||||||||||||||
|
Average |
Average |
Average |
||||||||||||||||
|
Remaining |
Exercise |
Exercise |
||||||||||||||||
|
Range of Exercise Prices |
Shares |
Contractual Life |
Price |
Shares |
Price |
|||||||||||||
|
$ |
2.80 |
to |
$ |
5.26 | 71,650 | 4.83 |
$ |
3.26 | 69,150 |
$ |
3.19 | |||||||
| 5.70 |
to |
8.81 | 404,836 | 5.18 |
$ |
6.91 | 260,086 |
$ |
7.47 | |||||||||
| 8.92 |
to |
14.01 | 264,000 | 7.56 |
$ |
10.63 | 78,000 |
$ |
11.30 | |||||||||
| 14.33 |
to |
14.33 | 25,000 | 9.68 |
$ |
14.33 |
- |
$ |
- |
|||||||||
|
$ |
2.80 |
to |
$ |
14.33 | 765,486 | 6.12 |
$ |
8.09 | 407,236 |
$ |
7.47 | |||||||
Restricted Shares
Restricted stock awards under the 2004 Plan are earned based on an individual’s achievement of performance goals during the initial fiscal year with a subsequent one year service vesting period. The grant date fair value associated with the restricted stock is calculated in accordance with ASC 718 “Compensation – Stock Compensation”. Compensation expense related to restricted stock awards is based on the closing price of the Company’s Common Stock on the grant date authorized by the Company’s Board of Directors, multiplied by the number of restricted stock awards expected to be issued and vested and is amortized over the combined performance and service periods. The non-cash stock based compensation expense recorded for restricted stock awards for the fiscal years ended June 30, 2014 and 2013 was $161,000 and $68,000, respectively. As of June 30, 2014, the total remaining unrecognized compensation cost related to restricted stock awards amounted to $263,000.
A summary of the status of restricted shares issued at June 30, 2014 is presented in the table below.
|
Weighted Average |
|||||
|
Nonvested |
Grant Date |
||||
|
Shares |
Fair Value |
||||
|
Nonvested at June 30, 2013 |
- |
$ |
- |
||
|
Granted |
22,550 | 5.39 | |||
|
Vested |
- |
- |
|||
|
Forfeited or expired |
(4,600) | 5.39 | |||
|
Nonvested at June 30, 2014 |
17,950 |
$ |
5.39 | ||
Available Shares
At June 30, 2014, the 2004 Plan had 795,624 shares available for future grants, including restricted stock or stock options that could be issued in the first quarter of fiscal 2014.
9.Income Taxes
Income from continuing operations before income taxes for U.S. and foreign operations was as follows (in thousands):
|
2014 |
2013 |
2012 |
||||||
|
U.S. |
$ |
(2,124) |
$ |
1,272 |
$ |
3,192 | ||
|
Foreign |
5,126 | 6,259 | 2,183 | |||||
|
Total |
$ |
3,002 |
$ |
7,531 |
$ |
5,375 | ||
45
The income tax (provision) benefit reflected in the statement of income consists of the following (in thousands):
|
2014 |
2013 |
2012 |
||||||
|
Current (provision) benefit: |
||||||||
|
U.S. Federal & State |
$ |
(102) |
$ |
39 |
$ |
(1,614) | ||
|
Foreign |
(1,581) | (977) | (829) | |||||
|
Deferred taxes |
||||||||
|
U.S. |
969 | (48) | (444) | |||||
|
Foreign |
139 | (415) | 339 | |||||
|
Total provision |
$ |
(575) |
$ |
(1,401) |
$ |
(2,548) | ||
The Company’s deferred tax assets are substantially represented by the tax benefit of net operating losses, tax credit carry-forwards and the tax benefit of future deductions represented by timing differences for deferred revenue, inventory obsolescence, allowances for bad debts, warranty expenses, and unrealized losses on investments. The Company has a valuation allowance for tax credit carry-forwards in the United States that it expects will more likely than not expire prior to the tax benefit being realized. The components of deferred tax assets were as follows (in thousands):
|
2014 |
2013 |
2012 |
||||||
|
Benefit of net operating losses |
$ |
7,149 |
$ |
6,617 |
$ |
6,136 | ||
|
Tax credit carry-forwards |
4,928 | 4,866 | 4,685 | |||||
|
Other, principally reserves |
2,774 | 2,381 | 3,973 | |||||
|
Deferred tax asset |
14,851 | 13,864 | 14,794 | |||||
|
Valuation allowance |
(3,103) | (3,224) | (3,691) | |||||
|
Net deferred tax asset |
$ |
11,748 |
$ |
10,640 |
$ |
11,103 | ||
|
Rate Reconciliation: |
||||||||
|
Provision at U.S. statutory rate |
34.0% | 34.0% | 34.0% | |||||
|
Net effect of taxes on foreign activities |
(10.0)% |
(7.7)% |
(1.1)% |
|||||
|
Tax effect of U.S. permanent differences |
(0.4)% |
0.2% |
(4.1)% |
|||||
|
State taxes and other, net |
(0.7)% |
(1.9)% |
0.6% | |||||
|
Adjustment of federal/foreign income taxes related to prior years |
0.3% | 0.2% | 0.1% | |||||
|
Valuation allowance |
(4.0)% |
(6.2)% |
17.9% | |||||
|
Effective tax rate |
19.2% | 18.6% | 47.4% | |||||
The amount of earnings retained for use by the Company’s foreign subsidiaries for which no tax provision has been made amounted to approximately $18.1 million as of June 30, 2014. The Company may be subject to United States income taxes and foreign withholding taxes if these earnings are distributed in the future. It is not practicable to estimate the amount of unrecognized deferred tax liability for the undistributed foreign earnings. At June 30, 2014, the Company had net operating loss carry-forwards for U.S. federal income tax purposes of $22.1 million that expire in the years 2022 through 2034 and tax credit carry-forwards of $4.9 million of which $4.7 million expire in the years 2018 through 2033. Included in the U.S. federal net operating loss carry-forward is $8.7 million from the exercise of employee stock options, the tax benefit of which, when recognized, will be accounted for as an increase to additional paid-in-capital rather than a reduction of the income tax provision. The net change in the total valuation allowance for the fiscal years ended June 30, 2014, 2013 and 2012 was a decrease of $121,000 and $467,000, and an increase of $961,000, respectively.
On June 30, 2014 and 2013, the Company had $1.3 million and $1.2 million of unrecognized tax benefits that would affect the effective tax rate if recognized. The Company’s policy is to classify interest and penalties related to unrecognized tax benefits as interest expense and income tax expense, respectively. As of June 30, 2014 there was no accrued interest or penalties related to uncertain tax positions recorded on the Company’s financial statements. For U.S. federal income tax purposes, the tax years 2011 through 2014 remain open to examination by government tax authorities. For German income tax purposes, tax years 2011 through 2014 remain open to examination by government tax authorities. At June 30, 2014, China has no tax years open to examination.
The aggregate changes in the balance of unrecognized tax benefits were as follows (in thousands):
|
Year End June 30 |
2014 |
|
|
Balance, beginning of year |
$ |
1,237 |
|
Increases for tax positions related to the current year |
31 | |
|
Balance, year end |
$ |
1,268 |
46
10.Dividends
In fiscal years 2014 and 2013, the Company’s Board of Directors declared the following dividends.
|
Dividend |
||||||||||
|
Declaration date |
Per Share |
Record Date |
Total Amount |
Payment Date |
||||||
|
(in thousands) |
||||||||||
|
May 21, 2014 |
$ |
0.15 |
June 5, 2014 |
$ |
1,372 |
June 26, 2014 |
||||
|
May 7, 2013 |
$ |
0.15 |
June 6, 2013 |
$ |
1,292 |
June 27, 2013 |
||||
|
September 27, 2012 |
$ |
0.25 |
October 10, 2012 |
$ |
2,124 |
November 1, 2012 |
||||
11.Discontinued Operations
During the fourth quarter of fiscal 2012, the Company decided to sell the Commercial Products Business Unit (“CBU”) and accordingly began reporting the operations of CBU as discontinued. On August 30, 2012, the Company completed the sale of substantially all of the assets of CBU. The sale price was approximately $838,000 in cash. In addition, Perceptron retained CBU’s accounts receivable balance of approximately $608,000 that existed at the time of sale. The purchaser acquired the inventory, tooling, customer contracts, patents, trademarks, and other assets associated with CBU’s business operations. Under the agreement, the purchaser also assumed all of CBU’s service parts and warranty obligations and vendor commitments.
Based on the foregoing, and in conformity with applicable accounting guidance, the CBU segment qualifies as a discontinued operation. Accordingly, financial results of CBU have been reported as discontinued operations in the accompanying consolidated statements of income for all periods presented. Information regarding revenue and operating results of CBU included in discontinued operations is as follows (in thousands):
|
Fiscal Year ended June 30, |
||||||||
|
2014 |
2013 |
2012 |
||||||
|
Net Sales |
$ |
- |
$ |
595 |
$ |
5,749 | ||
|
Operating Income/(Loss) |
$ |
- |
$ |
28 |
$ |
(1,638) | ||
The operating loss reported for CBU above does not include corporate costs previously allocated between the Company’s operating segments, which remain with the Company. Additionally, in fiscal 2012, the Company also recorded a $1.6 million charge, or $1.1 million, net of taxes related to the write-down of CBU assets held for sale.
At June 30, 2014 and 2013, the Company’s balance sheets did not have any assets or liabilities related to CBU.
In fiscal 2012, the Company recorded a $957,000 loss from discontinued operations, net of $493,000 in taxes, that related to a settlement of a lawsuit filed in 2002 by Industries GDS, Inc., Bois Granval GDS Inc., and Centre de Preparation GDS, Inc. (collectively, “GDS”) on or about November 21, 2002 in the Superior Court of the Judicial District of Quebec, Canada against the Company, Carbotech, Inc. (“Carbotech”), and U.S. Natural Resources, Inc. (“USNR”), among others. The suit alleged that the Company breached its contractual and warranty obligations as a manufacturer in connection with the sale and installation of three systems for trimming and edging wood products involving the Company’s discontinued Forest Product Business Unit. The Company agreed to settle the suit for $2.0 million Canadian dollars (approximately $1.9 million using a September 30, 2011 exchange rate). The Company also had accruals related to this matter of approximately $500,000. The Company paid the litigation settlement in full for $2.0 million on October 28, 2011 and the Company incurred a foreign currency loss on the transaction of $52,000, net of $27,000 in taxes, in the second quarter of fiscal 2012.
12.Segment and Geographic Information
The Company’s business is substantially all in the global automotive market and its business segment is the automotive industry. In the fourth quarter of fiscal year 2012, the Company decided to sell its Commercial Products Business Unit (“CBU”). Previous periods have been restated on the face of the financial statements to show the CBU as a discontinued operation. The Company primarily accounts for geographic sales based on the country from which the sale is invoiced rather than the country to which the product is shipped. The Company operates in three primary geographic areas: The Americas (substantially all of which is the United States, with less than 10% from net sales in Brazil), Europe, and Asia.
47
|
Geographical Regions ($000) |
Americas |
Europe (1) |
Asia (2) |
Consolidated |
||||||||
|
Twelve months ended June 30, 2014 |
||||||||||||
|
Net sales |
$ |
18,278 |
$ |
27,807 |
$ |
13,527 |
$ |
59,612 | ||||
|
Long-lived assets, net |
5,662 | 396 | 207 | 6,265 | ||||||||
|
Twelve months ended June 30, 2013 |
||||||||||||
|
Net sales |
$ |
22,170 |
$ |
26,118 |
$ |
12,598 |
$ |
60,886 | ||||
|
Long-lived assets, net |
5,710 | 434 | 159 | 6,303 | ||||||||
|
Twelve months ended June 30, 2012 |
||||||||||||
|
Net sales |
$ |
26,247 |
$ |
18,375 |
$ |
12,757 |
$ |
57,379 | ||||
|
Long-lived assets, net |
7,088 | 392 | 209 | 7,689 | ||||||||
|
(1) |
The Company’s German subsidiary had net external sales of $27.8 million, $26.1 million and $18.4 million in the fiscal years ended June 30, 2014, 2013 and 2012, respectively. Long-lived assets of the Company’s German subsidiary were $385,000, $418,000 and $373,000 as of June 30, 2014, 2013 and 2012, respectively. |
|
(2) |
The Company’s Chinese subsidiary had net external sales of $10.0 million, $9.1 million and $8.7 million in the fiscal years ended June 30, 2014, 2013 and 2012, respectively. Long-lived assets of the Company’s Chinese subsidiary were $110,000, $117,000 and $135,000 as of June 30, 2014, 2013 and 2012, respectively. |
13.Selected Quarterly Financial Data
Selected unaudited quarterly financial data for the fiscal years ended June 30, 2014 and 2013 are as follows (in thousands, except per share amounts):
|
Quarter Ended |
||||||||||||
|
Fiscal Year 2014 |
9/30/2013 |
12/31/2013 |
3/31/2014 |
6/30/2014 |
||||||||
|
Net sales |
$ |
12,372 |
$ |
12,519 |
$ |
17,328 |
$ |
17,393 | ||||
|
Gross profit |
4,287 | 4,976 | 8,162 | 7,424 | ||||||||
|
Net income (loss) |
(588) | (407) | 2,481 | 941 | ||||||||
|
Earnings (loss) per share |
||||||||||||
|
Basic |
(0.07) | (0.05) | 0.27 | 0.10 | ||||||||
|
Diluted |
(0.07) | (0.05) | 0.26 | 0.10 | ||||||||
|
Fiscal Year 2013 (1) |
9/30/2012 |
12/31/2012 |
3/31/2013 |
6/30/2013 |
||||||||
|
Net sales |
$ |
12,148 |
$ |
13,229 |
$ |
14,765 |
$ |
20,744 | ||||
|
Gross profit |
5,597 | 5,199 | 7,345 | 9,979 | ||||||||
|
Income from continuing operations |
629 | 184 | 1,336 | 3,981 |
(2) |
|||||||
|
Income from discontinued operations |
26 |
- |
31 | 23 | ||||||||
|
Net income |
655 | 184 | 1,367 | 4,004 | ||||||||
|
Earnings per share from continuing operations |
||||||||||||
|
Basic |
0.08 | 0.02 | 0.16 | 0.46 | ||||||||
|
Diluted |
0.08 | 0.02 | 0.16 | 0.46 | ||||||||
|
Earnings per share |
||||||||||||
|
Basic |
0.08 | 0.02 | 0.16 | 0.46 | ||||||||
|
Diluted |
0.08 | 0.02 | 0.16 | 0.46 | ||||||||
(1) During the first quarter of fiscal 2013, the Company sold substantially all of the assets of its Commercial Products business unit (see Note 11). Fiscal 2013 quarters reflect the operations of the Commercial Products business unit as discontinued.
(2) In the fourth quarter of fiscal 2013, a long-term investment in preferred stock was redeemed at par resulting in a $1.1 million gain when a previous impairment charge was reversed (see Note 1)
48
ITEM 9:CHANGES IN AND DISAGREEMENTS WITH ACCOUNTANTS ON ACCOUNTING AND FINANCIAL DISCLOSURES
None.
ITEM 9A:CONTROLS AND PROCEDURES
Evaluation Of Disclosure Controls And Procedures
The Company carried out an evaluation, under the supervision and with the participation of the Company’s management, including its Chief Executive Officer and Chief Financial Officer, of the effectiveness of the design and operation of the Company’s disclosure controls and procedures pursuant to Rule 13a-15 of the Securities Exchange Act of 1934 (the “1934 Act”). Based upon that evaluation, the Company’s Chief Executive Officer and Chief Financial Officer concluded that, as of June 30, 2014, the Company’s disclosure controls and procedures were effective. Rule 13a-15(e) of the 1934 Act defines “disclosure controls and procedures” as controls and other procedures of the Company that are designed to ensure that information required to be disclosed by the Company in the reports that it files or submits under the 1934 Act is recorded, processed, summarized and reported, within the time periods specified in the Securities and Exchange Commission’s rules and forms. Disclosure controls and procedures include, without limitation, controls and procedures designed to ensure that information required to be disclosed by the Company in the reports that it files or submits under the 1934 Act is accumulated and communicated to the Company’s management, including its Chief Executive Officer and Chief Financial Officer, as appropriate to allow timely decisions regarding required disclosure.
Report Of Management On Internal Control Over Financial Reporting
Our management is responsible for establishing and maintaining effective internal controls over financial reporting, as such term is defined in Rules 13a-15(f) under the Securities Exchange Act of 1934, as amended.
Internal control over financial reporting is a process designed to provide reasonable assurance regarding the reliability of our financial reporting and the preparation of financial statements for external purposes in accordance with accounting principles generally accepted in the United States of America. Because of its inherent limitations, internal control over financial reporting may not prevent or detect misstatements. Also, projections of any evaluation of effectiveness to future periods are subject to the risk that controls may become inadequate because of changes in conditions, or that the degree of compliance with the policies or procedures may deteriorate.
The Company’s internal control over financial reporting includes those policies and procedures that (1) pertain to the maintenance of records that, in reasonable detail, accurately and fairly reflect the transactions and dispositions of the assets of the Company; (2) provide reasonable assurance that transactions are recorded as necessary to permit preparation of financial statements in accordance with generally accepted accounting principles, and that receipts and expenditures of the Company are being made only in accordance with authorizations of management and directors of the Company; and (3) provide reasonable assurance regarding prevention or timely detection of unauthorized acquisition, use, or disposition of the Company’s assets that could have a material effect on the Company’s financial statements.
Management, with the participation of the Company’s principal executive and principal financial officers, assessed the effectiveness of the Company’s internal control over financial reporting as of June 30, 2014. This assessment was performed using the criteria established under the Internal Control-Integrated Framework (1992) established by the Committee of Sponsoring Organizations of the Treadway Commission, or COSO.
Based on the assessment performed using the criteria established by COSO, management has concluded that the Company maintained effective internal control over financial reporting as of June 30, 2014.
BDO USA LLP, the independent registered public accounting firm that audited the financial statements included in this Annual Report on Form 10-K for the fiscal year ended June 30, 2014, has issued an audit report on the effectiveness of the Company’s internal control over financial reporting as of June 30, 2014. Such report appears immediately below.
49
Report of Independent Registered Public Accounting Firm
Board of Directors and Stockholders
Perceptron, Inc.
Plymouth, Michigan
We have audited Perceptron, Inc.’s internal control over financial reporting as of June 30, 2014, based on criteria established in Internal Control – Integrated Framework (1992) issued by the Committee of Sponsoring Organizations of the Treadway Commission (the COSO criteria). Perceptron, Inc.’s management is responsible for maintaining effective internal control over financial reporting and for its assessment of the effectiveness of internal control over financial reporting, included in the accompanying Item 9A, Management’s Report on Internal Control Over Financial Reporting. Our responsibility is to express an opinion on the company’s internal control over financial reporting based on our audit.
We conducted our audit in accordance with the standards of the Public Company Accounting Oversight Board (United States). Those standards require that we plan and perform the audit to obtain reasonable assurance about whether effective internal control over financial reporting was maintained in all material respects. Our audit included obtaining an understanding of internal control over financial reporting, assessing the risk that a material weakness exists, and testing and evaluating the design and operating effectiveness of internal control based on the assessed risk. Our audit also included performing such other procedures as we considered necessary in the circumstances. We believe that our audit provides a reasonable basis for our opinion.
A company’s internal control over financial reporting is a process designed to provide reasonable assurance regarding the reliability of financial reporting and the preparation of financial statements for external purposes in accordance with generally accepted accounting principles. A company’s internal control over financial reporting includes those policies and procedures that (1) pertain to the maintenance of records that, in reasonable detail, accurately and fairly reflect the transactions and dispositions of the assets of the company; (2) provide reasonable assurance that transactions are recorded as necessary to permit preparation of financial statements in accordance with generally accepted accounting principles, and that receipts and expenditures of the company are being made only in accordance with authorizations of management and directors of the company; and (3) provide reasonable assurance regarding prevention or timely detection of unauthorized acquisition, use, or disposition of the company’s assets that could have a material effect on the financial statements.
Because of its inherent limitations, internal control over financial reporting may not prevent or detect misstatements. Also, projections of any evaluation of effectiveness to future periods are subject to the risk that controls may become inadequate because of changes in conditions, or that the degree of compliance with the policies or procedures may deteriorate.
In our opinion, Perceptron, Inc. maintained, in all material respects, effective internal control over financial reporting as of June 30, 2014, based on the COSO criteria.
We also have audited, in accordance with the standards of the Public Company Accounting Oversight Board (United States), the consolidated balance sheets of Perceptron, Inc. as of June 30, 2014 and 2013, and the related consolidated statements of income, comprehensive income, shareholders’ equity, and cash flows for each of the two years in the period ended June 30, 2014, and our report dated September 15, 2014 expressed an unqualified opinion thereon.
/s/ BDO USA, LLP
Troy, Michigan
September 15, 2014
50
Changes In Internal Control Over Financial Reporting
There have been no changes in the Company’s internal control over financial reporting during the quarter ended June 30, 2014 identified in connection with the Company’s evaluation that has materially affected, or is reasonably likely to materially affect, the Company’s internal control over financial reporting.
ITEM 9B: OTHER INFORMATION
None.
PART III
ITEM 10: DIRECTORS, EXECUTIVE OFFICERS AND CORPORATE GOVERNANCE
The information contained under the captions “Matters to Come before the Meeting – Proposal 1: Election of Directors”, “Corporate Governance”, “Executive Officers”, “Section 16(a) Beneficial Ownership Reporting Compliance” and “Corporate Governance – Code of Ethics” of the registrant’s proxy statement for 2014 Annual Meeting of Shareholders (the “Proxy Statement”) is incorporated herein by reference.
The information required by Part III, Item 10 with respect to the Company’s nominating committee, audit committee and the audit committee’s financial expert is set forth in the Proxy Statement under the captions “Corporate Governance – Board Leadership Structure and Board and Committee Information – Audit Committee”, “Corporate Governance – Board Leadership Structure and Board and Committee Information – Nominating and Corporate Governance Committee” and “Corporate Governance – Audit Committee Report”, which paragraphs are incorporated herein by reference.
The Company has adopted a Code of Business Conduct and Ethics that applies to all of the Company’s directors, executive and financial officers and employees. The Code of Business Conduct and Ethics has been posted to the Company’s website at www.perceptron.com in the “Investors” section under “Corporate Governance” and is available free of charge through the Company’s website. The Company will post information regarding any amendment to, or waiver from, the Company’s Code of Business Conduct and Ethics for executive and financial officers and directors on the Company’s website in the Company section under “Investors”.
ITEM 11: EXECUTIVE COMPENSATION
The information contained under the captions “Matters to Come before the Meeting – Proposal 1: Election of Directors – Director Compensation for Fiscal 2014”, “Matters to Come before the Meeting – Proposal 1: Election of Directors – Standard Director Compensation Arrangements”, “Compensation of Executive Officers” and “Corporate Governance – Management Development, Compensation and Stock Option Committee Interlocks and Insider Participation” of the Proxy Statement is incorporated herein by reference.
ITEM 12: SECURITY OWNERSHIP OF CERTAIN BENEFICIAL OWNERS AND MANAGEMENT AND RELATED STOCKHOLDER MATTERS
The information contained under the captions “Share Ownership of Management and Certain Shareholders – Principal Shareholders” and “Share Ownership of Management and Certain Shareholders – Beneficial Ownership by Directors and Executive Officers” of the Proxy Statement is incorporated herein by reference.
51
EQUITY COMPENSATION PLAN INFORMATION
The following table gives information about the Company’s Common Stock that may be issued upon the exercise of options, warrants and rights under all of the Company’s existing equity compensation plans as of June 30, 2014, including the 2004 Stock Incentive Plan, the Directors Stock Option Plan, the 1998 Global Team Member Stock Option Plan, and the Employee Stock Purchase Plan (together, the “Plans”):
|
Weighted |
Number of securities |
|||||||
|
average exercise |
remaining available for |
|||||||
|
Number of securities |
price of |
future issuance under |
||||||
|
to be issued upon |
outstanding |
equity compensation |
||||||
|
exercise of |
options, |
plans (excluding |
||||||
|
outstanding options, |
warrants and |
securities reflected in |
||||||
|
Plan Category |
warrants and rights |
rights |
column (a)) |
|||||
|
(a) |
(b) |
(c) |
||||||
|
Equity compensation plans approved |
||||||||
|
by shareholders: |
||||||||
|
2004 Stock Incentive Plan |
703,250 |
(1) (2) |
$ |
8.16 | 795,624 | |||
|
Directors Stock Option Plan |
12,000 |
(3) |
$ |
6.85 |
- |
|||
|
Employee Stock Purchase Plan |
2,781 |
(4) |
$ |
10.63 | 136,044 | |||
|
Total of equity compensation plans |
||||||||
|
approved by shareholders |
718,031 |
$ |
8.14 | 931,668 | ||||
|
Equity compensation plans not |
||||||||
|
approved by shareholders: |
||||||||
|
1998 Global Team Member |
||||||||
|
Stock Option Plan |
50,236 |
(5) |
$ |
7.53 |
- |
|||
|
Total: |
768,267 |
$ |
8.10 | 931,668 | ||||
(1) Awards under the 2004 Stock Incentive Plan may be in the form of stock options, stock appreciation rights, restricted stock or restricted stock units, performance share awards, director stock purchase rights and deferred stock units; or any combination thereof.
(2) After June 30, 2014, options and restricted stock for 6,000 shares of Common Stock were granted under the 2004 Stock Plan to executive officers, other officers and team members of the Company.
(3) The 2004 Stock Incentive Plan replaced the Directors Stock Option Plan effective December 7, 2004. No further grants under the Directors Stock Option Plan will be made.
(4) Does not include an undeterminable number of shares subject to a payroll deduction election under the Employee Stock Purchase Plan for the period from July 1, 2014 until December 31, 2014, which will not be issued until January 2015.
(5) The 1998 Global Team Member Stock Option Plan expired on February 25, 2008. No further grants under this plan will be made.
1998 Global Team Member Stock Option Plan
On February 26, 1998, the Company’s Board of Directors approved the 1998 Global Team Member Stock Option Plan (the “1998 Plan”), pursuant to which non-qualified stock options could be granted to employees who were not officers or directors or subject to Section 16 of the Exchange Act. The 1998 Plan has been amended by the Board of Directors on several occasions thereafter. The 1998 Plan expired on February 25, 2008. No further grants under this plan will be made. The expiration of the 1998 Plan does not affect any awards previously granted under the 1998 Plan.
The purpose of the 1998 Plan was to promote the Company’s success by linking the personal interests of non-executive employees to those of the Company’s shareholders and by providing participants with an incentive for outstanding performance. The 1998 Plan authorized the granting of non-qualified stock options only. The President of the Company administers the 1998 Plan and had the power to set the terms of any grants under the 1998 Plan. The exercise price of an option could not be less than the fair market value of the underlying stock on the date of grant and no option has a term of more than ten years. All of the options that are currently outstanding under the 1998 Plan are fully vested and expire ten years from the date of grant.
The exercise price is payable in full in cash at the time of exercise; or in shares of Common Stock, (but generally, only if such shares have been owned for at least six months or, if they have not been owned by the optionee for at least six months, the optionee then owns, and has owned for at least six months, at least an equal number of shares of Common Stock as the option shares being delivered); or the exercise price may be paid by delivery to the Company of a properly executed exercise notice,
52
together with irrevocable instructions to the participant’s broker to deliver to the Company sufficient cash to pay the exercise price and any applicable income and employment withholding taxes, in accordance with a written agreement between the Company and the brokerage firm (“cashless exercise” procedure).
Generally, if the employment by the Company of any optionee who is an employee terminates for any reason, other than by death or total and permanent disability, any option which the optionee is entitled to exercise on the date of employment termination may be exercised by the optionee at any time on or before the earlier of the expiration date of the option or three months after the date of employment termination, but only to the extent of the accrued right to purchase at the date of such termination. In addition, the President of the Company has the discretionary power to extend the date to exercise beyond three months after the date of employment termination. If the employment of any optionee who is an employee is terminated because of total and permanent disability, the option may be exercised by the optionee at any time on or before the earlier of the expiration date of the option or one year after the date of termination of employment, but only to the extent of the accrued right to purchase at the date of such termination. If any optionee dies while employed by the Company and, if at the date of death, the optionee is entitled to exercise an option, such option may be exercised by any person who acquires the option by bequest or inheritance or by reason of the death of the optionee, or by the executor or administrator of the estate of the optionee, at any time before the earlier of the expiration date of the option or one year after the date of death of the optionee, but only to the extent of the accrued right to purchase at the date of death.
The Board of Directors may amend or terminate the 1998 Plan at any time without shareholder approval, but no amendment or termination of the 1998 Plan or any award agreement may adversely affect any award previously granted under the 1998 Plan without the consent of the participant. The NASDAQ listing requirements prohibit the Company from amending the 1998 Plan to add additional shares of Common Stock without shareholder approval.
ITEM 13: CERTAIN RELATIONSHIPS AND RELATED TRANSACTIONS, AND DIRECTOR INDEPENDENCE
The information contained under the captions “Corporate Governance – Board Leadership Structure and Board and Committee Information” and “Related Party Transactions” of the Proxy Statement is incorporated herein by reference.
ITEM 14: PRINCIPAL ACCOUNTANT FEES AND SERVICES
The information contained under the captions “Matters to Come Before the Meeting – Proposal 3: Ratification of Company’s Independent Registered Public Accounting Firm,” “Independent Accountants – Policy for Pre-Approval of Audit and Non-Audit Services” and “Independent Accountants – Fees Paid to Independent Registered Public Accounting Firm” of the Proxy Statement is incorporated herein by reference.
PART IV
ITEM 15: EXHIBITS AND FINANCIAL STATEMENT SCHEDULES
A.Financial Statements and Schedules Filed
Financial Statements - see Item 8 of this report. Financial statement schedules have been omitted since they are either not required, not applicable, or the information is otherwise included.
|
B. |
Exhibits: |
Exhibits - the exhibits filed in response to Item 601 of Regulation S-K with this report are listed on pages 55 through 59. The Exhibit List is incorporated herein by reference.
53
SIGNATURES
Pursuant to the requirements of Section 13 or 15(d) of the Securities Exchange Act of 1934, the Registrant has duly caused this Annual Report on Form 10-K to be signed on its behalf by the undersigned, thereunto duly authorized.
|
|
Perceptron, Inc. |
|
|
|
|
(Registrant) |
|
|
|
By: |
/S/ Jeffrey M. Armstrong |
||
|
Jeffrey M. Armstrong, President and Chief Executive Officer (Principal Executive Officer) |
|||
|
Date: September 15, 2014 |
|||
Pursuant to the requirements of the Securities Exchange Act of 1934, this report has been signed below by the following persons on behalf of the Registrant and in the capacities and on the dates indicated.
|
Signatures |
|
Title |
|
Date |
|
|
|
|
|
|
|
/S/ Jeffrey M. Armstrong |
|
President, Chief Executive Officer and |
|
September 15, 2014 |
|
Jeffrey M. Armstrong |
|
Director (Principal Executive Officer) |
|
|
|
|
|
|
|
|
|
/S/ Keith R. Marchiando |
|
Vice President and Chief Financial Officer |
|
September 15, 2014 |
|
Keith R. Marchiando |
|
(Principal Financial Officer) |
|
|
|
|
|
|
|
|
|
/S/ Sylvia M. Smith |
Vice President and Controller (Principal |
September 15, 2014 |
||
|
Sylvia M. Smith |
|
Accounting Officer) |
|
|
|
|
|
|
|
|
|
/S/ W. Richard Marz |
|
Chairman of the Board and Director |
|
September 15, 2014 |
|
W. Richard Marz |
|
|
|
|
|
|
|
|
|
|
|
/S/ David J. Beattie |
|
Director |
|
September 15, 2014 |
|
David J. Beattie |
|
|
|
|
|
|
|
|
|
|
|
/S/ Kenneth R. Dabrowski |
|
Director |
|
September 15, 2014 |
|
Kenneth R. Dabrowski |
|
|
|
|
|
|
|
|
|
|
|
/S/ Philip J. DeCocco |
|
Director |
|
September 15, 2014 |
|
Philip J. DeCocco |
|
|
|
|
|
|
|
|
|
|
|
/S/ C. Richard Neely, Jr. |
|
Director |
|
September 15, 2014 |
|
C. Richard Neely, Jr. |
|
|
|
|
|
|
|
|
|
|
|
/S/ Robert S. Oswald |
|
Director |
|
September 15, 2014 |
|
Robert S. Oswald |
|
|
|
|
|
|
|
|
|
|
|
/S/ Terryll R. Smith |
|
Director |
|
September 15, 2014 |
|
Terryll R. Smith |
|
|
|
|
54
EXHIBIT INDEX
|
|
|
|
|
Exhibit No |
|
Description of Exhibits |
|
2. |
|
Plan of Acquisition, Reorganization, Arrangement, Liquidation or Succession. |
|
|
|
|
|
2.1 |
|
Asset Purchase Agreement, dated August 30, 2012 between Inspectron Inc. and Perceptron, Inc., is incorporated by reference to Exhibit 2.1 of the Company’s Current Report on Form 8-K filed on September 6, 2012. |
|
|
|
|
|
3. |
|
Restated Articles of Incorporation and Bylaws. |
|
|
|
|
|
3.1 |
|
Restated Articles of Incorporation, as amended to date, are incorporated herein by reference to Exhibit 3.1 of the Company's Report on Form 10-Q for the Quarter Ended March 31, 1998. |
|
|
|
|
|
3.2 |
|
Amended and Restated Bylaws, as amended to date, are incorporated herein by reference to Exhibit 3.1 of the Company's Report on Form 10-Q for the Quarter Ended September 30, 2007. |
|
|
|
|
|
4 |
|
Instruments Defining the Rights of Securities Holders. |
|
|
|
|
|
4.1 |
|
Articles IV, V and VI of the Company's Restated Articles of Incorporation are incorporated herein by reference to Exhibit 3.1 of the Company's Report on Form 10-Q for the Quarter Ended March 31, 1998. |
|
|
|
|
|
4.2 |
|
Articles I, II, III, VI, VII, X and XI of the Company's Amended and Restated Bylaws are incorporated herein by reference to Exhibit 3.1 of the Company's Report on Form 10-Q for the Quarter Ended September 30, 2007. |
|
|
|
|
|
4.3 |
|
Amended and Restated Credit Agreement, dated November 15, 2010, between the Company and Comerica Bank, is incorporated by reference to Exhibit 10.1 of the Company’s Current Report on Form 8-K filed on November 16, 2010. |
|
|
|
|
|
4.4 |
|
Revolving Credit Note dated January 6, 2012, between the Company and Comerica Bank, is incorporated by reference to Exhibit 10.2 of the Company’s Current Report on Form 8-K filed on January 6, 2012. |
|
|
|
|
|
4.5 |
|
Amendment to Revolving Credit Note, dated January 6, 2012, between Perceptron, Inc. and Comerica Bank, is incorporated by reference to Exhibit 10.3 of the Company’s Current Report on Form 8-K filed on October 31, 2012. |
|
|
|
|
|
4.6 |
|
Amendment to Revolving Credit Note, dated January 6, 2012, between Perceptron, Inc. and Comerica Bank, is incorporated by reference to Exhibit 10.2 of the Company’s Current Report on Form 8-K filed on November 6, 2013. |
|
|
|
|
|
4.7 |
|
First Amendment to the Amended and Restated Credit Agreement, dated November 16, 2010, between the Company and Comerica Bank, is incorporated by reference to Exhibit 10.1 of the Company’s Current Report on Form 8-K filed on January 6, 2012. |
|
|
|
|
|
4.8 |
|
Second Amendment to the Amended and Restated Credit Agreement, dated November 16, 2010, between the Company and Comerica Bank, is incorporated by reference to Exhibit 10.6 of the Company’s Current Report on Form 8-K filed on September 6, 2012. |
|
|
|
|
|
4.9 |
|
Third Amendment to the Amended and Restated Credit Agreement, dated November 16, 2010, between the Company and Comerica Bank, is incorporated by reference to Exhibit 10.1 of the Company’s Current Report on Form 8-K filed on October 31, 2012. |
|
|
|
|
|
4.10 |
|
Fourth Amendment to the Amended and Restated Credit Agreement, dated November 16, 2010, between the Company and Comerica Bank, is incorporated by reference to Exhibit 10.1 of the Company’s Current Report on Form 8-K filed on October 31, 2012. |
|
|
|
|
|
|
|
|
55
|
4.11 |
|
Fifth Amendment to the Amended and Restated Credit Agreement, dated November 16, 2010, between the Company and Comerica Bank, is incorporated by reference to Exhibit 10.1 of the Company’s Current Report on Form 8-K filed on May 8, 2013. |
|
|
|
|
|
4.12 |
|
Sixth Amendment to the Amended and Restated Credit Agreement, dated November 16, 2010, between the Company and Comerica Bank, is incorporated by reference to Exhibit 10.1 of the Company’s Current Report on Form 8-K filed on November 6, 2013. |
|
|
|
|
|
4.13 |
|
Form of certificate representing Rights (included as Exhibit B to the Amendment to Rights Agreement filed as Exhibit 4.6) is incorporated herein by reference to Exhibit 3 of the Company’s Form 8-A/A filed March 20, 2008. Pursuant to the Rights Agreement, Rights Certificates will not be mailed until after the earlier of (i) the tenth business day after the Shares Acquisition Date (or, if such Shares Acquisition Date results from the consummation of a Permitted Offer, such later date as may be determined by the Board of Directors, with the concurrence of a majority of the Continuing Directors), or (ii) the tenth business day (or such later date as may be determined by the Board of Directors, with the concurrence of a majority of the Continuing Directors, prior to such time as any person becomes an Acquiring Person) after the date of the commencement of, or first public announcement of the intent to commence, a tender or exchange offer by any person if, upon consummation thereof, such person would be an Acquiring Person, other than as a result of a Permitted Offer. |
|
|
|
|
|
4.14 |
|
Rights Agreement, dated as of March 24, 1998, between Perceptron, Inc. and American Stock Transfer & Trust Company, as Rights Agent, is incorporated herein by reference to Exhibit 2 of the Company’s Current Report on Form 8-K filed March 24, 1998. |
|
|
|
|
|
4.15 |
|
Amendment to Rights Agreement, dated as of March 17, 2008, between Perceptron, Inc. and American Stock Transfer & Trust Company, as Rights Agent, is incorporated herein by reference to Exhibit 3 of the Company’s Form 8-A/A filed on March 20, 2008. |
|
|
|
|
|
10. |
|
Material Contracts. |
|
|
|
|
|
10.1 |
|
Registration Agreement, dated as of June 13, 1985, as amended, among the Company and the Purchasers identified therein, is incorporated by reference to Exhibit 10.3 of the Company's Form S-1 Registration Statement (amended by Exhibit 10.2) No. 33-47463. |
|
|
|
|
|
10.2 |
|
Form of Proprietary Information and Inventions Agreement between the Company and all of the employees of the Company is incorporated herein by reference to Exhibit 10.11 of the Company's Form S-1 Registration Statement No. 33-47463. |
|
|
|
|
|
10.3 |
|
Form of Confidentiality and Non-Disclosure Agreement between the Company and certain vendors and customers of the Company is incorporated herein by reference to Exhibit 10.12 of the Company's Form S-1 Registration Statement No. 33-47463. |
|
|
|
|
|
10.4 |
|
Form of Executive Agreement Not to Compete between the Company and certain officers of the Company is incorporated herein by reference to Exhibit 10.5 of the Company's Annual Report on Form 10-K for the Year Ended June 30, 2005. |
|
|
|
|
|
10.5@ |
|
Perceptron, Inc. First Amended and Restated 2004 Stock Incentive Plan is incorporated by reference to Exhibit 10.1 of the Company’s Report on Form 8-K filed October 10, 2008. |
|
|
|
|
|
10.6@ |
|
First Amendment to Perceptron, Inc. First Amended and Restated 2004 Stock Incentive Plan is incorporated by reference to Exhibit 10.12 of the Company’s Report on Form 8-K filed October 10, 2008. |
|
|
|
|
|
10.7@ |
|
Second Amendment to Perceptron, Inc. First Amended and Restated 2004 Stock Incentive Plan, is incorporated by reference to Exhibit 10.39 of the Company’s Report on Form 10-Q for the Quarter Ended December 31, 2011. |
|
|
|
|
|
10.8@ |
|
Third Amendment to Perceptron, Inc. First Amended and Restated 2004 Stock Incentive Plan dated as of August 27, 2013 is incorporated by reference to Exhibit 10.1 of the Company’s Current Report on Form 8-K filed August 30, 2013. |
|
|
|
|
56
|
10.9@ |
Form of Incentive Stock Option Agreement Terms for Officers under the Perceptron, Inc. 2004 Stock Incentive Plan is incorporated by reference to Exhibit 10.2 of the Company’s Report on Form 8-K filed January 5, 2005. |
|
|
|
|
|
|
10.10@ |
|
Form of Nonqualified Stock Option Agreement Terms for Officers under the Perceptron, Inc. 2004 Stock Incentive Plan is incorporated by reference to Exhibit 10.3 of the Company’s Report on Form 8-K filed January 5, 2005. |
|
|
|
|
|
10.11@ |
|
Form of Incentive Stock Option Agreement Terms for Officers under the Perceptron, Inc. 2004 Stock Incentive Plan is incorporated by reference to Exhibit 10.3 of the Company’s Report on Form 8-K filed December 27, 2005. |
|
|
|
|
|
10.12@ |
|
Form of Nonqualified Stock Option Agreement Terms for Officers under the Perceptron, Inc. 2004 Stock Incentive Plan is incorporated by reference to Exhibit 10.2 of the Company’s Report on Form 8-K filed December 27, 2005. |
|
|
|
|
|
10.13@ |
|
Form of Nonqualified Stock Option Agreement Terms – Board of Directors under the Perceptron, Inc. 2004 Stock Incentive Plan is incorporated by reference to Exhibit 10.1 of the Company’s Report on Form 8-K filed August 10, 2006. |
|
|
|
|
|
10.14@ |
|
Form of the Restricted Stock Award Agreement for Team Members under the Perceptron, Inc. First Amended and Restated 2004 Incentive Plan is incorporated by reference to Exhibit 10.3 of the Company’s Current Report on Form 8-K filed August 30, 2013. |
|
|
|
|
|
10.15@ |
|
Form of the Restricted Stock Award Agreement for Non-Employee Directors under the Perceptron, Inc. First Amended and Restated 2004 Incentive Plan is incorporated by reference to Exhibit 10.4 of the Company’s Current Report on Form 8-K filed August 30, 2013. |
|
|
|
|
|
10.16@ |
|
1998 Global Team Member Stock Option Plan and Form of Non-Qualified Stock Option Agreements under such Plan is incorporated herein by reference to Exhibit 10.20 to the Company’s Annual Report on Form 10-K for the Year Ended December 31, 1997. |
|
|
|
|
|
10.17@ |
|
First Amendment to the 1998 Global Team Member Stock Option Plan is incorporated by reference to Exhibit 10.28 of the Company’s Report on Form 10-K for the Transition Period Ended June 30, 1999. |
|
|
|
|
|
10.18@ |
|
Second Amendment to the 1998 Global Team Member Stock Option Plan is incorporated by reference to Exhibit 10.29 of the Company’s Report on Form 10-K for the Transition Period Ended June 30, 1999. |
|
|
|
|
|
10.19@ |
|
Third Amendment to the 1998 Global Team Member Stock Option Plan is incorporated by reference to Exhibit 99.6 of the Company’s Form S-8 Registration Statement No. 333-55164. |
|
|
|
|
|
10.20@ |
|
Fourth Amendment to the 1998 Global Team Member Stock Option Plan is incorporated by reference to Exhibit 99.7 of the Company’s S-8 Registration Statement No. 333-76194. |
|
|
|
|
|
10.21@ |
|
Form of Non-Qualified Stock Option Agreements under 1998 Global Team Member Stock Option Plan after September 1, 1999 is incorporated by reference to Exhibit 10.31 of the Company’s Report on Form 10-Q for the Quarter Ended September 30, 1999. |
|
|
|
|
|
10.22@ |
|
Form of Non-Qualified Stock Option Agreements under 1998 Global Team Member Stock Option Plan after January 1, 2006 is incorporated by reference to Exhibit 10.47 of the Company’s Report on Form 10-Q for the Quarter Ended March 31, 2006. |
|
|
|
|
|
10.23@ |
|
Perceptron, Inc. Employee Stock Purchase Plan, as amended and restated as of October 22, 2004, is incorporated by reference to Exhibit 10.2 of the Company’s Current Report on Form 8-K filed December 10, 2004. |
|
|
|
|
57
|
|
|
|
|||
|
10.24@ |
|
Amendment No. 1 to Perceptron, Inc. Employee Stock Purchase Plan is incorporated by reference to Exhibit 10.1 of the Company’s Current Report on Form 8-K filed July 2, 1010. |
|||
|
|
|
|
|||
|
10.25@ |
|
Second Amendment of Perceptron, Inc. Employee Stock Purchase Plan dated as of August 27, 2013 is incorporated by reference to Exhibit 10.2 of the Company’s Current Report on Form 8-K on August 30, 2013. |
|||
|
|
|
|
|||
|
10.32@ |
|
Amended and Restated Directors Stock Option Plan is incorporated by reference to Exhibit 10.56 to the Company’s Report on Form 10-Q for the Quarter Ended September 30, 1996. |
|||
|
|
|
|
|||
|
10.33@ |
|
First Amendment to Amended and Restated Directors Stock Option Plan is incorporated by reference to Exhibit 10.27 of the Company’s Report on Form 10-Q for the Quarter Ended March 31, 1999. |
|||
|
|
|
|
|||
|
10.34@ |
|
Second Amendment to the Perceptron, Inc. Directors Stock Option Plan (Amended and Restated October 31, 1996) is incorporated by reference to Exhibit 10.33 of the Company’s Report on Form 10-Q for the Quarter Ended March 31, 2000. |
|||
|
|
|
|
|||
|
10.35@ |
|
Forms of Non-Qualified Stock Option Agreements under the Directors Stock Option Plan after September 1, 1999 is incorporated by reference to Exhibit 10.32 of the Company’s Report on Form 10-Q for the Quarter Ended December 31, 1999. |
|||
|
|
|
|
|||
|
10.36@ |
|
Summary of Fiscal 2012 Annual Incentive and Profit Sharing Plans is incorporated by reference to Exhibit 10.1 of the Company’s Current Report on Form 8-K filed on February 28, 2012. |
|||
|
|
|
|
|||
|
|
|
|
|||
|
10.37@ |
|
Written Description of Fiscal 2013 Annual Incentive and Profit Sharing Plans is incorporated by reference to Exhibit 10.1 of the Company’s Current Report on Form 8-K filed on November 19, 2012. |
|||
|
|
|
|
|||
|
10.38@ |
|
Written Description of Fiscal 2014 Annual Incentive and Profit Sharing Plans is incorporated by reference to Exhibit 10.1 of the Company’s Current Report on Form 8-K filed on June 19, 2013. |
|||
|
|
|
|
|||
|
10.39@ |
|
Severance Agreement, dated December 18, 2008, between the Company and Mark S. Hoefing is incorporated by reference to Exhibit 10.3 of the Company’s Report on Form 8-K filed on December 24, 2008. |
|||
|
|
|
|
|||
|
10.40 |
|
License Agreement (from Inspectron to Perceptron), dated August 30, 2012, between Inspectron Inc. and Perceptron, Inc., is incorporated by reference to Exhibit 10.2 of the Company’s Report on Form 8-K filed on September 6, 2012. |
|||
|
|
|
|
|||
|
10.41@ |
|
Offer Letter dated October 24, 2013 between Jeffrey M. Armstrong and the Company is incorporated by reference to Exhibit 10.1 of the Company’s Current Report on Form 8-K filed on October 31, 2013. |
|||
|
|
|
|
|||
|
10.42@ |
|
Severance Agreement dated October 24, 2013 between Jeffrey M. Armstrong and the Company is incorporated by reference to Exhibit 10.2 of the Company’s Current Report on Form 8-K filed on October 31, 2013. |
|||
|
|
|
|
|||
|
10.43@ |
|
Consulting Agreement and related Release Agreement dated October 31, 2013 between Harry T. Rittenour and the Company is incorporated by reference to Exhibit 10.3 of the Company’s Current Report on Form 8-K filed on October 31, 2013. |
|||
|
|
|
|
|||
|
10.44@ |
|
Offer Letter dated February 4, 2014 between Keith R. Marchiando and the Company is incorporated by reference to Exhibit 10.1 of the Company’s Current Report on Form 8-K filed on February 13, 2014. |
|||
|
|
|
|
|||
|
10.45@ |
|
Severance Agreement dated February 11, 2014 between Keith R. Marchiando and the Company is incorporated by reference to Exhibit 10.2 of the Company’s Current Report Form 8-K filed on February 13, 2014. |
|||
|
|
|
|
|||
|
|
|
|
|||
|
21. |
|
A list of subsidiaries of the Company is incorporated by reference to Exhibit 21 of the Company’s Report on Form 10-K for the Year Ended June 30, 2008. |
|||
|
|
|
|
|||
|
23. |
|
Consent of Experts and Counsel. |
|||
|
|
|
|
|||
58
|
23.1* |
|
Consent of the Company’s Independent Registered Public Accounting Firm, BDO USA, LLP. |
||
|
|
|
|
||
|
23.2* |
|
Consent of the Company’s Independent Registered Public Accounting Firm, Grant Thornton LLP. |
||
|
|
|
|
||
|
31. |
|
Rule 13a-14(a)/15d-14(a) Certifications. |
||
|
|
|
|
||
|
31.1* |
|
Certification by the Chief Executive Officer of the Company pursuant to Rule 13a-14(a) and Rule 15d-14(a). |
||
|
|
|
|
||
|
31.2* |
|
Certification by the Chief Financial Officer of the Company pursuant to Rule 13a-14(a) and Rule 15d-14(a). |
||
|
|
|
|
||
|
32. |
|
Section 1350 Certifications. |
||
|
|
|
|
||
|
32.1* |
|
Certification by the Chief Executive Officer of the Company pursuant to Rule 13a-14(a) and Rule 15d-14(a). |
||
|
|
|
|
||
|
32.2* |
|
Certification by the Chief Financial Officer of the Company pursuant to Rule 13a-14(a) and Rule 15d-14(a). |
||
|
|
|
|
||
|
101.INS** |
|
XBRL Instance Document |
||
|
|
|
|
||
|
101.SCH** |
|
XBRL Taxonomy Extension Schema |
||
|
|
|
|
||
|
101.CAL** |
|
XBRL Taxonomy Extension Calculation Linkbase |
||
|
|
|
|
||
|
101.LAB** |
|
XBRL Taxonomy Extension Label Linkbase |
||
|
|
|
|
||
|
101.PRE** |
|
XBRL Taxonomy Extension Presentation Linkbase |
||
|
|
|
|
||
|
|
|
|
||
_____________________
*Filed with the Company’s Annual Report on Form 10-K for the fiscal year ended June 30, 2014.
** XBRL (Extensible Business Reporting Language) information is furnished and not filed herewith, is not a part of a registration statement or prospectus for purposes of sections 11 or 12 of the Securities Act of 1933, is deemed not filed for purposes of section 18 of the Securities Exchange Act of 1934, and otherwise is not subject to liability under these sections.
@Indicates a management contract, compensatory plan or arrangement.
59