Attached files
| file | filename |
|---|---|
| EX-14.2 - Firsthand Technology Value Fund, Inc. | fp0032019_ex142.htm |
| EX-3.3 - Firsthand Technology Value Fund, Inc. | fp0032019_ex33.htm |
UNITED STATES
SECURITIES AND EXCHANGE COMMISSION
Washington, D.C. 20549
Form 10-K
(Mark One)
| [X] | ANNUAL REPORT PURSUANT TO SECTION 13 OR 15(d) OF THE SECURITIES EXCHANGE ACT OF 1934 |
For the fiscal year ended December 31, 2014
or
| [ ] | TRANSITION REPORT PURSUANT TO SECTION 13 OR 15(d) OF THE SECURITIES EXCHANGE ACT OF 1934 |
For the transition period from to
Commission file number: 814-00830
Firsthand Technology Value Fund, Inc.
(Exact name of registrant as specified in its charter)
| Maryland | 27-3008946 |
|
(State or other jurisdiction of incorporation or organization) |
(I.R.S. Employer Identification No.) |
150 Almaden Boulevard, Suite 1250
San Jose, California 95113
(Address and zip code of principal executive offices)
(408) 886-7096
(Registrant’s telephone number, including area code)
Securities registered pursuant to Section 12(b) of the Act:
|
Title of each class
|
Name of each exchange on which registered
|
| Common Stock, $0.001 par value | The NASDAQ Global Market |
Securities registered pursuant to Section 12(g) of the Act:
None
Indicate by check mark if the registrant is a well-known seasoned issuer, as defined in Rule 405 of the Securities Act. Yes [ ] No [X]
Indicate by check mark if the registrant is not required to file reports pursuant to Section 13 or 15(d) of the Act. Yes [ ] No [X]
Indicate by check mark whether the registrant (1) has filed all reports required to be filed by Section 13 or 15(d) of the Securities Exchange Act of 1934 during the preceding 12 months (or for such shorter period that the registrant was required to file such reports), and (2) has been subject to such filing requirements for the past 90 days. Yes [X] No [ ]
Indicate by check mark whether the issuer has submitted electronically and posted on its corporate Web site, if any, every Interactive Data File required to be submitted and posted pursuant to Rule 405 of Regulation S-T (Section 232.405 of this chapter) during the preceding 12 months (or for such shorter period that the registrant was required to submit and post such files). Yes [X] No [ ]
Indicate by check mark if disclosure of delinquent
filers pursuant to Item 405 of Regulation S-K is not contained herein, and will not be contained, to the best of the registrant’s
knowledge, in the definitive proxy or information statements incorporated by reference in Part III of this Form 10-K or any amendment
to this Form 10-K.
[ ]
Indicate by check mark whether the registrant is a large accelerated filer, an accelerated filer, a non-accelerated filer, or a smaller reporting company. See the definitions of “large accelerated filer,” “accelerated filer,” and “smaller reporting company” in Rule 12b-2 of the Exchange Act). (check one):
| Large accelerated filer [ ] | Accelerated filer [X] |
Non-accelerated filer [ ] (Do not check if a smaller |
Smaller reporting company [ ] |
Indicate by check mark whether the registrant is a shell company (as defined in Rule 12b-2 of the Act). Yes [ ] No [X]
The aggregate market value of the Common Stock held by non-affiliates of the registrant as of December 31, 2017 was approximately $66 million (computed using the closing price of $8.96 per share of Common Stock on December 29, 2017, as reported by the NASDAQ Global Market).
As of March 9, 2018, Firsthand Technology Value Fund had 7,302,146 shares of common stock, par value $0.001 per share, outstanding. of the registrant’s definitive proxy statement prepared in connection with the Annual Meeting of Stockholders to be held in 2017 are incorporated by reference in Part III of this Form 10-K.

DEAR FELLOW SHAREHOLDERS
The Roku IPO in September 2017 punctuated what was otherwise an up-and-down year for Firsthand Technology Value Fund. In addition to Roku, the Fund enjoyed an IPO exit from Cloudera (NYSE: CLDR) and the acquisition of Turn by Amobee. I am pleased to report that the Fund’s net asset value (NAV) appreciated 18.9% for the year ended December 31, 2017, while SVVC stock was up 16.8% for the period.
POSITIVE PERFORMERS
The biggest newsmaker for the Fund in 2017 was Roku, which went public in late September. Our initial investment in the streaming video hardware and software company came in 2015, and our total investment was approximately $2.3 million (or roughly $9.25 per share). Roku went public at $14.00 per share and closed the year at $51.78 per share (note that the Fund currently values Roku at a 10% discount to reflect the fact that we currently hold restricted shares). Roku is a prime beneficiary of the trend toward over-the-top (OTT) delivery of television and movie/video content and is among the industry leaders in streaming hardware and software.
With expectations for continued outperformance, we held the majority of our position in Nutanix (NASDAQ: NTNX) throughout 2017. We were rewarded with appreciation of 32.8% for the year, and we forecast continued revenue growth and shrinking losses for the company through 2018.
We received a dose of good news early in the year when Amobee announced that it was acquiring Turn, an advertising technology company in which we invested in 2013. The Fund’s total investment in Turn was approximately $15.6 million. Although the investment, at best, may yield a small profit, we are pleased with the valuation that management was able to achieve in a very challenging market environment for adtech companies. We believe that it is sometimes better to cash out and redeploy assets than to hang on and hope for a profit down the road.
Two of our semiconductor industry holdings were also strong performers in 2017. Pivotal Systems’ continued growth and market momentum propelled it to a record-high valuation to close the year. We believe that Pivotal currently is the best-positioned company in our portfolio for a near-term exit, based on the maturity of its business. Revasum, a relatively recent investment (November 2016) for the Fund, posted a strong performance in its first full year of operations and raised a new round of growth capital late in the year. The company’s wafer grinders and chemical-mechanical planarization (CMP) tools are used by semiconductor manufacturers worldwide.
Although we achieved an IPO exit with Cloudera (NYSE: CLDR), the investment had very little impact on portfolio performance, given its relatively small size.
A FEW DISAPPOINTMENTS
After a prolonged period of product and financial struggles, Jawbone called it quits in 2017. We received in July a Notice of Assignment for the Benefit of Creditors from the company, explaining that Jawbone’s assets are being liquidated and the company is being wound down. We do not expect to receive any proceeds from the liquidation.
One of the Fund’s early stage investments, Rorus, also discontinued operations late in the year. The maker of low-cost water filtration systems was unable to get a toehold in a marketplace marked by intense competition.
We purchased shares of Sunrun in 2013, and the company went public in August 2015. We closed our position in Sunrun common stock during 2017, realizing a loss of approximately $2.7 million.
TAKING LONGER
One of the primary risks involved in investing in small, private companies is that they may take longer than expected to develop their technology or establish a market for their products or services. Frustratingly, we find several of our portfolio companies in this position, and their changing valuations throughout the year reflect this reality. Companies such as Hera Systems, QMAT, Silicon Genesis, and Wrightspeed have faced more difficulty than expected in bringing their technologies out of the lab. Still others, including
CONTINUED ON INSIDE BACK COVER
DOCUMENTS INCORPORATED BY REFERENCE
Portions of the registrant’s definitive proxy statement prepared in connection with the Annual Meeting of Stockholders to be held in 2018 are incorporated by reference in Part III of this Form 10-K.
2
TABLE OF CONTENTS
3
FORWARD LOOKING STATEMENTS
This report, and other statements that we may make, may contain forward-looking statements, which relate to future events or our future performance or financial condition. We use words such as “anticipates,” “believes,” “expects,” “plans,” “will,” “may,” “continues,” “seeks,” “likely,” “intends,” and similar expressions to identify forward-looking statements. The forward-looking statements contained in this Annual Report on Form 10-K involve risks and uncertainties, including forward-looking statements as to:
| ● | our future operating results, |
| ● | our business prospects and the prospects of our prospective portfolio companies, |
| ● | the impact of investments that we expect to make, |
| ● | our contractual arrangements and relationships with third parties, |
| ● | the dependence of our future success on the general economy and its impact on the industries in which we invest, |
| ● | the ability of our prospective portfolio companies to achieve their objectives, |
| ● | our expected financings and investments, |
| ● | the adequacy of our cash resources and working capital, and |
| ● | the timing of cash flows, if any, from the operations of our prospective portfolio companies. |
Our actual results could differ materially from those projected in the forward-looking statements for any reason, including the factors set forth in “Risk Factors” and elsewhere in this Annual Report on Form 10-K. In addition, several factors that could materially affect our actual results are the ability of the portfolio companies in which we invest to achieve their objectives; our ability to source favorable private investments; changes in the securities markets, especially the markets for technology companies including those that may be early stage or micro-cap companies; the dependence of our future success of the general economy and its impact on the industries in which we invest and other factors discussed in our periodic filings with the Securities and Exchange Commission (the “SEC”).
Unpredictable or unknown factors could also have material adverse effects on us. Since our actual results, performance or achievements could differ materially from those expressed in, or implied by, these forward-looking statements, we cannot give any assurance that any of the events anticipated by the forward-looking statements will occur, or, if any of them do, what impact they will have on our results of operations and financial condition. All forward-looking statements included in this Annual Report on Form 10-K are expressly qualified in their entirety by the foregoing cautionary statements. You are cautioned not to place undue reliance on these forward-looking statements, which speak only as of the date hereof. We do not undertake any obligation to update, amend or clarify these forward-looking statements or the risk factors contained in this Annual Report on Form 10-K, whether as a result of new information, future events or otherwise, except as may be required under the federal securities laws. Although we undertake no obligation to revise or update any forward-looking statements, whether as a result of new information, future events or otherwise, you are advised to consult any additional disclosures that we may make directly to you or through reports that we in the future may file with the SEC.
GENERAL
Firsthand Technology Value Fund, Inc. (“we,” “us,” “our,” the “Company” or “SVVC”) is an externally managed, closed-end, non-diversified management investment company organized as a Maryland corporation that has elected to be treated as a business development company (“BDC”) under the Investment Company Act of 1940 (the “1940 Act”). As such, we are required to comply with certain regulatory requirements. For instance, we generally have to invest at least 70 percent of our total assets in “qualifying assets,” including securities of private or micro-cap public U.S. companies, cash, cash equivalents, U.S. government securities and high-quality debt investments that mature in one year or less. In addition, for tax purposes we have elected to be treated as a regulated investment company, or RIC, under Subchapter M of the Internal Revenue Code of 1986, as amended, which we refer to as the “Code.” Firsthand Capital Management, Inc. (the “Investment Adviser”, the “Adviser”, or “FCM”) serves as our investment adviser and manages the investment process on a daily basis.
4
We were incorporated under the Maryland General Corporation Law in April 2010 and acquired our initial portfolio of securities through the reorganization (the “Reorganization”) into us of Firsthand Technology Value Fund (“TVF”), an open-end mutual fund and a series of Firsthand Funds, which is a Delaware statutory trust. The reorganization was completed on April 15, 2011 and we commenced operations on April 18, 2011.
Our investment objective is to seek long-term growth of capital, principally by seeking capital gains on our equity and equity-related investments. There can be no assurance that we will achieve our investment objective. Under normal circumstances, we invest at least 80 percent of our total assets for investment purposes in technology companies. We consider technology companies to be those companies that derive at least 50 percent of their revenues from products and/or services within the information technology sector and in the “cleantech” sector. Information technology companies include, but are not limited to, those focused on computer hardware, software, telecommunications, networking, Internet, and consumer electronics. While there is no standard definition of cleantech, it is generally regarded as including goods and services designed to harness renewable energy and materials, eliminate emissions and waste, and reduce the use of natural resources. In addition, under normal circumstances we invest at least 70 percent of our assets in privately held companies and public companies with market capitalizations less than $250 million. Our portfolio is primarily composed of equity and equity derivative securities of technology and cleantech companies (as defined above). These investments generally range between $1 million and $10 million each, although the investment size will vary proportionately with the size of our capital base. We acquire our investments through direct investments in private companies, negotiations with selling shareholders, and in organized secondary marketplaces for private securities.
While our primary focus is to invest in illiquid private technology and cleantech companies, we may also invest in micro-cap publicly traded companies. In addition, we may invest up to 30% of the portfolio in opportunistic investments that do not constitute the private companies and micro-cap public companies described above. These other investments may include investments in securities of public companies that are actively traded. These other investments may also include investments in high-yield bonds, distressed debt, or securities of public companies that are actively traded; and securities of companies located outside of the United States. Our investment activities are managed by FCM.
Neither our investments nor an investment in us are intended to constitute a balanced investment program. We expect to be risk-seeking rather than risk-averse in our investment approach. There is no assurance that our investment objective will be achieved.
We invest a substantial portion of our assets in securities that we consider to be private venture capital equity investments. These private venture capital equity investments usually do not pay interest or dividends and usually are subject to legal or contractual restrictions on resale that may adversely affect the liquidity and marketability of such securities. We expect to make speculative venture capital investments with limited marketability and a greater risk of investment loss than less-speculative investments. Subject to the diversification requirements applicable to a regulated investment company (“RIC”), we may commit all of our assets to only a few investments.
Subject to continuing to meet the compliance tests applicable to BDCs, there are no limitations on the types of securities or other assets in which we may invest. Investments may include the following:
| ● | Venture capital investments, whether in corporate, partnership, or other form, including development-stage or start-up entities; |
| ● | Equity, equity-related securities (including options and warrants), and debt with equity features from either private or public issuers; |
| ● | Debt obligations of all types having varying terms with respect to security or credit support, subordination, purchase price, interest payments, and maturity; |
| ● | Foreign securities; |
| ● | Intellectual property or patents or research and development in technology or product development that may lead to patents or other marketable technology; and |
| ● | Miscellaneous investments. |
5
The table below provides a summary of our investments as of December 31, 2017.
| INVESTMENT | BUSINESS DESCRIPTION | FAIR VALUE1 | ||||
| AliphCom, Inc. | Consumer Electronics | $ | 0 | |||
| EQX Capital, Inc. | Equipment Leasing | 4,020,010 | ||||
| Fidelity Investments Money Market Treasury Portfolio - Class I2 | Investment Company | 1,705,375 | ||||
| Hera Systems, Inc. | Aerospace | 2,144,610 | ||||
| Hightail, Inc. | Cloud Computing | 8,561,704 | ||||
| IntraOp Medical Corp. | Medical Devices | 20,979,677 | ||||
| Nutanix, Inc. 2 | Networking | 16,185,476 | ||||
| Phunware, Inc. | Mobile Computing | 12,018,563 | ||||
| Pivotal Systems Corp. | Semiconductor Equipment | 34,653,460 | ||||
| QMAT, Inc. | Advanced Materials | 23,359,026 | ||||
| QuickLogic Corp. 2 | Semiconductors | 2,088,000 | ||||
| Revasum, Inc. | Semiconductor Equipment | 14,803,056 | ||||
| Roku, Inc. | Consumer Electronics | 11,650,500 | ||||
| Rorus, Inc. | Water Purification | 0 | ||||
| Silicon Genesis Corp. | Intellectual Property | 6,094,569 | ||||
| SVXR, Inc. | Semiconductor Equipment | 2,000,000 | ||||
| Telepathy Investors, Inc. | Consumer Electronics | 1,503,650 | ||||
| UCT Coatings, Inc. | Advanced Materials | 922,054 | ||||
| Vufine, Inc. | Consumer Electronics | 1,434,160 | ||||
| Wrightspeed, Inc. | Automotive | 10,715,635 | ||||
| 1 | Fair value for our private company holdings was determined in good faith by our board of directors on December 31, 2017. For public companies, the figure represents the market value of our securities on December 31, 2017, less any discount due to resale restriction on the security. |
| 2 | Public company. |
INVESTMENTS AND STRATEGIES
The following is a summary description of the types of assets in which we may invest, the investment strategies we may use, and the attendant risks associated with our investments and strategies.
VENTURE CAPITAL INVESTMENTS
We define venture capital as the money and resources made available to privately held start-up firms and privately held and publicly traded small businesses with exceptional growth potential. These businesses can range in stage from pre-revenue to generating positive cash flow. Most of our long-term venture capital investments are in thinly capitalized, unproven, small companies focused on commercializing risky technologies. These businesses also tend to lack management depth, have limited or no history of operations, and have not attained profitability. Because of the speculative nature of these investments, these securities have a significantly greater risk of loss than traditional investment securities. Some of our venture capital investments will never realize their potential, and some will be unprofitable or result in the complete loss of our investment.
We acquire our investments through direct investments in private companies, negotiations with selling shareholders, and in organized secondary marketplaces for private securities. Our current focus is on investing in late-stage private companies, particularly those with potential for near-term realizations by way of IPO or acquisition.
6
In connection with our venture capital investments, we may participate in providing a variety of services to our portfolio companies, including the following:
| ● | Recruiting management, |
| ● | Formulating operating strategies, |
| ● | Formulating intellectual property strategies, |
| ● | Assisting in financial planning, |
| ● | Providing management in the initial start-up stages, and |
| ● | Establishing corporate goals. |
We may assist in raising additional capital for these companies from other potential investors and may subordinate our own investment to that of other investors. We typically find it necessary or appropriate to provide additional capital of our own. We may introduce these companies to potential joint venture partners, suppliers, and customers. In addition, we may assist in establishing relationships with investment bankers and other professionals. We may also assist with mergers and acquisitions (“M&As”). We do not currently derive income from these companies for the performance of any of the above services.
We may control, be represented on, or have observer rights on the Board of Directors of a portfolio company through one or more of our officers or directors, who may also serve as officers of the portfolio company. We indemnify our officers and directors for serving on the Boards of Directors or as officers of portfolio companies, which exposes us to additional risks. Particularly during the early stages of an investment, we may, in rare instances, in effect be conducting the operations of the portfolio company. Our goal is to assist each company in establishing its own independent capitalization, management, and Board of Directors. As a venture capital-backed company emerges from the developmental stage with greater management depth and experience, we expect that our role in the portfolio company's operations will diminish.
EQUITY, EQUITY-RELATED SECURITIES AND DEBT WITH EQUITY FEATURES
We may invest in equity, equity-related securities, and debt with equity features. These securities include common stock, preferred stock, debt instruments convertible into common or preferred stock, limited partnership interests, other beneficial ownership interests and warrants, options, or other rights to acquire any of the foregoing.
We may make investments in companies with operating histories that are unprofitable or marginally profitable, that have negative net worth, or that are involved in bankruptcy or reorganization proceedings. These investments would involve businesses that management believes have potential through the infusion of additional capital and management assistance. In addition, we may make investments in connection with the acquisition or divestiture of companies or divisions of companies. There is a significantly greater risk of loss with these types of securities than is the case with traditional investment securities.
Warrants, options, and convertible or exchangeable securities generally give the investor the right to acquire specified equity securities of an issuer at a specified price during a specified period or on a specified date. Warrants and options fluctuate in value in relation to the value of the underlying security and the remaining life of the warrant or option, while convertible or exchangeable securities fluctuate in value both in relation to the intrinsic value of the security without the conversion or exchange feature and in relation to the value of the conversion or exchange feature, which is like a warrant or an option. When we invest in these securities, we incur the risk that the option feature will expire worthless, thereby either eliminating or diminishing the value of our investment.
Most of our current portfolio company investments are in the equity securities of private companies. Investments in equity securities of private companies often involve securities that are restricted as to sale and cannot be sold in the open market without registration under the Securities Act of 1933 or pursuant to a specific exemption from these registrations. Opportunities for sale are more limited than in the case of marketable securities, although these investments may be purchased at more advantageous prices and may offer attractive investment opportunities. Even if one of our portfolio companies completes an IPO, we are typically subject to a lock-up agreement for 180 days, and the stock price may decline substantially before we are free to sell.
We may also invest in publicly traded securities of whatever nature, including relatively small, emerging growth companies that management believes have long-term growth potential. These investments may be through open-market transactions or through private placements in publicly traded companies (“PIPEs”). Securities purchased in PIPE transactions are typically subject to a lock-up agreement for 180 days, or are issued as unregistered securities that are not freely available for six months.
7
Even if we have registration rights to make our investments in privately held and publicly traded companies more marketable, a considerable amount of time may elapse between a decision to sell or register the securities for sale and the time when we are able to sell the securities. The prices obtainable upon sale may be adversely affected by market conditions or negative conditions affecting the issuer during the intervening time. We may elect to hold formerly restricted securities after they have become freely marketable, either because they remain relatively illiquid or because we believe that they may appreciate in value, during which holding period they may decline in value and be especially volatile as unseasoned securities. If we need funds for investment or working capital purposes, we might need to sell marketable securities at disadvantageous times or prices.
DEBT OBLIGATIONS
We may hold debt securities, including in privately held and thinly traded public companies, for income and as a reserve pending more speculative investments. Debt obligations may include U.S. government and agency securities, commercial paper, bankers' acceptances, receivables or other asset-based financing, notes, bonds, debentures, or other debt obligations of any nature and repurchase agreements related to these securities. These obligations may have varying terms with respect to security or credit support; subordination; purchase price; interest payments; and maturity from private, public, or governmental issuers of any type located anywhere in the world. We may invest in debt obligations of companies with operating histories that are unprofitable or marginally profitable, that have negative net worth or are involved in bankruptcy or reorganization proceedings, or that are start-up or development-stage entities. In addition, we may participate in the acquisition or divestiture of companies or divisions of companies through issuance or receipt of debt obligations. As of December 31, 2017, the debt obligations held in our portfolio consisted of convertible bridge notes and term notes. The convertible bridge notes generally do not generate cash payments to us, nor are they held for that purpose. Our convertible bridge notes and the interest accrued thereon are held for the purpose of potential conversion into equity at a future date. The term notes we hold are income generating.
Our investments in debt obligations may be of varying quality, including non-rated, unsecured, highly speculative debt investments with limited marketability. Investments in lower-rated and non-rated securities, commonly referred to as “junk bonds,” including our venture debt investments, are subject to special risks, including a greater risk of loss of principal and non-payment of interest. Generally, lower-rated securities offer a higher return potential than higher-rated securities, but involve greater volatility of price and greater risk of loss of income and principal, including the possibility of default or bankruptcy of the issuers of these securities. Lower-rated securities and comparable non-rated securities will likely have large uncertainties or major risk exposure to adverse conditions and are predominantly speculative with respect to the issuer's capacity to pay interest and repay principal in accordance with the terms of the obligation. The occurrence of adverse conditions and uncertainties to issuers of lower-rated securities would likely reduce the value of lower-rated securities held by us, with a commensurate effect on the value of our shares.
The markets in which lower-rated securities or comparable non-rated securities are traded generally are more limited than those in which higher-rated securities are traded. The existence of limited markets for these securities may restrict our ability to obtain accurate market quotations for the purposes of valuing lower-rated or non-rated securities and calculating net asset value or to sell securities at their fair value. Any economic downturn could adversely affect the ability of issuers' lower-rated securities to repay principal and pay interest thereon. The market values of lower-rated and non-rated securities also tend to be more sensitive to individual corporate developments and changes in economic conditions than higher-rated securities. In addition, lower-rated securities and comparable non- rated securities generally present a higher degree of credit risk. Issuers of lower-rated securities and comparable non-rated securities are often highly leveraged and may not have more traditional methods of financing available to them, so that their ability to service their debt obligations during an economic downturn or during sustained periods of rising interest rates may be impaired. The risk of loss owing to default by these issuers is significantly greater because lower-rated securities and comparable non-rated securities generally are unsecured and frequently are subordinated to the prior payment of senior indebtedness. We may incur additional expenses to the extent that we are required to seek recovery upon a default in the payment of principal or interest on our portfolio holdings.
The market value of investments in debt securities that carry no equity participation usually reflects yields generally available on securities of similar quality and type at the time purchased. When interest rates decline, the market value of a debt portfolio already invested at higher yields can be expected to rise if the securities are protected against early call. Similarly, when interest rates increase, the market value of a debt portfolio already invested at lower yields can be expected to decline. Deterioration in credit quality also generally causes a decline in market value of the security, while an improvement in credit quality generally leads to increased value.
8
FOREIGN SECURITIES
We may make investments in securities of issuers whose principal operations are conducted outside the United States, and whose earnings and securities are stated in foreign currency. In order to maintain our status as a BDC, our investments in non-qualifying assets, including the securities of companies organized outside the U.S., would be limited to 30 percent of our assets, because we must invest at least 70 percent of our assets in “qualifying assets,” and securities of foreign companies are not “qualifying assets.”
Compared to otherwise comparable investments in securities of U.S. issuers, currency exchange risk of securities of foreign issuers is a significant variable. The value of these investments to us will vary with the relation of the currency in which they are denominated to the U.S. dollar, as well as with intrinsic elements of value such as credit risk, interest rates, and performance of the issuer. Investments in foreign securities also involve risks relating to economic and political developments, including nationalization, expropriation of assets, currency exchange freezes, and local recession. Securities of many foreign issuers are less liquid and more volatile than those of comparable U.S. issuers. Interest and dividend income and capital gains on our foreign securities may be subject to withholding and other taxes that may not be recoverable by us. We may seek to hedge all or part of the currency risk of our investments in foreign securities through the use of futures, options, and forward currency purchases or sales.
INTELLECTUAL PROPERTY
We believe there is a role for organizations that can assist in technology transfer. Scientists and institutions that develop and patent intellectual property perceive the need for and rewards of entrepreneurial commercialization of their inventions. Our form of investment may be:
| ● | Funding research and development in the development of a technology, |
| ● | Obtaining licensing rights to intellectual property or patents, |
| ● | Acquiring intellectual property or patents, or |
| ● | Forming and funding companies or joint ventures to commercialize further intellectual property. |
Income from our investments in intellectual property or its development may take the form of participation in licensing or royalty income, fee income, or some other form of remuneration. In order to satisfy RIC requirements, these investments will normally be held in an entity taxable as a corporation. Investment in developmental intellectual property rights involves a high degree of risk that can result in the loss of our entire investment as well as additional risks, including uncertainties as to the valuation of an investment and potential difficulty in liquidating an investment. Further, investments in intellectual property generally require investor patience, as investment return may be realized only after or over a long period. At some point during the commercialization of a technology, our investment may be transformed into ownership of securities of a development-stage or start-up company, as discussed under “Venture Capital Investments” above.
REPURCHASE OF SHARES
Our shareholders do not have the right to compel us to redeem our shares. We may, however, purchase outstanding shares of our common stock from time to time, subject to approval of our Board of Directors and in compliance with applicable corporate and securities laws. The Board of Directors may authorize public open-market purchases or privately negotiated transactions from time to time when deemed to be in the best interest of our shareholders. Public purchases would be conducted only after notification to shareholders through a press release or other means. The Board of Directors may or may not decide to undertake any purchases of our common stock.
Our repurchases of our common shares would decrease our total assets and would therefore likely have the effect of increasing our expense ratio. Subject to our investment restrictions, we may borrow money to finance the repurchase of our common stock in the open market pursuant to any tender offer. Interest on any borrowings to finance share repurchase transactions would reduce our net assets. If, because of market fluctuations or other reasons, the value of our assets falls below the required 1940 Act coverage requirements, we may have to reduce our borrowed debt to the extent necessary to comply with the requirement. To achieve a reduction, it is possible that we may be required to sell portfolio securities at inopportune times when it may be disadvantageous to do so.
9
PORTFOLIO COMPANY TURNOVER
Changes with respect to portfolio companies will be made as our management considers necessary in seeking to achieve our investment objective. The rate of portfolio turnover will not be treated as a limiting or relevant factor when circumstances exist that are considered by management to make portfolio changes advisable.
Although we expect that many of our investments will be relatively long term in nature, we may make changes in particular portfolio holdings whenever it is considered that an investment no longer has substantial growth potential or has reached its anticipated level of performance, or (especially when cash is not otherwise available) that another investment appears to have a relatively greater opportunity for capital appreciation. We may also make general portfolio changes to increase our cash to position us in a defensive posture. We may make portfolio changes without regard to the length of time we have held an investment, or whether a sale results in profit or loss, or whether a purchase results in the reacquisition of an investment that we may have only recently sold. Our investments in privately held companies are illiquid, which limits portfolio turnover. The portfolio turnover rate may vary greatly during a year as well as from year to year and may also be affected by cash requirements.
COMPETITION
We compete for investments with a number of business development companies and other investment funds (including private equity funds and venture capital funds), reverse merger and special purpose acquisition company (“SPACs”) sponsors, investment bankers that underwrite initial public offerings, hedge funds that invest in private investments in public equities (PIPEs), traditional financial services companies such as commercial banks, and other sources of financing. Many of these entities have greater financial and managerial resources than we do. Furthermore, many of our competitors are not subject to the regulatory restrictions that the 1940 Act will impose on us as a business development company. We believe we compete with these entities primarily on the basis of our willingness to make smaller, non-controlling investments, the experience and contacts of our investment professionals within our targeted industries, our responsive and efficient investment analysis and decision-making processes, and the investment terms that we offer. We do not seek to compete primarily on the deal terms we offer to potential portfolio companies. We use the industry information available to FCM to assess investment risks and determine appropriate pricing for our investments in portfolio companies. In addition, we believe that the relationships of Kevin Landis (FCM's President and Chief Investment Officer), and the other senior investment professionals FCM retains, enable us to learn about, and compete effectively for, financing opportunities with attractive companies in the industries in which we seek to invest. For additional information concerning the competitive risks we face, see “Risk Factors—Risks relating to our business and structure—We operate in a highly competitive market for investment opportunities.”
REGULATION
The Small Business Investment Incentive Act of 1980 added the provisions of the 1940 Act applicable only to BDCs. BDCs are a special type of investment company. After a company files its election to be treated as a BDC, it may not withdraw its election without first obtaining the approval of holders of a majority of its outstanding voting securities. The following is a brief description of the 1940 Act provisions applicable to BDCs, qualified in its entirety by reference to the full text of the 1940 Act and the rules issued thereunder by the Securities and Exchange Commission (“SEC”).
Generally, to be eligible to elect BDC status, a company must primarily engage in the business of furnishing capital and making significant managerial assistance available to companies that do not have ready access to capital through conventional financial channels. Such companies that satisfy certain additional criteria described below are termed “eligible portfolio companies.” In general, in order to qualify as a BDC, a company must: (i) be a domestic company; (ii) have registered a class of its securities pursuant to Section 12 of the Securities Exchange Act of 1934 (the “Exchange Act”); (iii) operate for the purpose of investing in the securities of certain types of portfolio companies, including early-stage or emerging companies and businesses suffering or just recovering from financial distress (see following paragraph); (iv) make available significant managerial assistance to such portfolio companies; and (v) file a proper notice of election with the SEC.
An eligible portfolio company generally is a domestic company that is not an investment company or a company excluded from investment company status pursuant to exclusions for certain types of financial companies (such as brokerage firms, banks, insurance companies, and investment banking firms) and that: (i) has a fully diluted market capitalization of less than $250 million and has a class of equity securities listed on a national securities exchange, (ii) does not have a class of securities listed on a national securities exchange, or (iii) is controlled by the BDC by itself or together with others (control under the 1940 Act is presumed to exist where a person owns at least 25 percent of the outstanding voting securities of the portfolio company) and the BDC has a representative on the Board of Directors of such company.
10
We may be examined periodically by the SEC for compliance with the 1940 Act.
As with other companies regulated by the 1940 Act, a BDC must adhere to certain substantive regulatory requirements. A majority of our directors must be persons who are not interested persons, as that term is defined in the 1940 Act. Additionally, we are required to provide and maintain a bond issued by a reputable fidelity insurance company to protect the BDC. Furthermore, as a BDC, we are prohibited from protecting any director or officer against any liability to us or our shareholders arising from willful malfeasance, bad faith, gross negligence, or reckless disregard of the duties involved in the conduct of such person's office.
The 1940 Act provides that we may not make an investment in non-qualifying assets unless at the time at least 70 percent of the value of our total assets (measured as of the date of our most recently filed financial statements) consists of qualifying assets. Qualifying assets include: (i) securities of eligible portfolio companies; (ii) securities of certain companies that were eligible portfolio companies at the time we initially acquired their securities and in which we retain a substantial interest; (iii) securities of certain controlled companies; (iv) securities of certain bankrupt, insolvent, or distressed companies; (v) securities received in exchange for or distributed in or with respect to any of the foregoing; and (vi) cash items, U.S. government securities, and high quality short-term debt. The SEC has adopted a rule permitting a BDC to invest its cash in certain money market funds. The 1940 Act also places restrictions on the nature of the transactions in which, and the persons from whom, securities can be purchased in some instances in order for the securities to be considered qualifying assets.
We are permitted by the 1940 Act, under specified conditions, to issue multiple classes of debt and a single class of preferred stock if our asset coverage, as defined in the 1940 Act, is at least 200 percent after the issuance of the debt or the preferred stock (i.e., such senior securities may not be in excess of our net assets). Under specific conditions, we are also permitted by the 1940 Act to issue warrants.
Except under certain conditions, we may sell our securities at a price that is below the prevailing net asset value per share only during the 12-month period after (i) a majority of our directors and our disinterested directors have determined that such sale would be in the best interest of us and our stockholders, and (ii) the holders of a majority of our outstanding voting securities and the holders of a majority of our voting securities held by persons who are not affiliated persons of ours approve our ability to make such issuances. A majority of the disinterested directors must determine in good faith that the price of the securities being sold is not less than a price that closely approximates the market value of the securities, less any distribution discount or commission.
Certain transactions involving certain closely related persons of the Company, including its directors, officers, and employees, may require the prior approval of the SEC. However, the 1940 Act ordinarily does not restrict transactions between us and our portfolio companies.
SUBCHAPTER M STATUS
We elected to be treated as a RIC, taxable under Subchapter M of the Internal Revenue Code of 1986 (the “Code”), for federal income tax purposes. In general, a RIC is not taxable on its income or gains to the extent it distributes such income or gains to its shareholders. In order to qualify as a RIC, we must, in general, (1) annually derive at least 90 percent of our gross income from dividends, interest, and gains from the sale of securities and similar sources (the “Income Source Rule”); (2) quarterly meet certain investment asset diversification requirements; and (3) annually distribute at least 90 percent of our investment company taxable income as a dividend (the “Income Distribution Rule”). Any taxable investment company income not distributed will be subject to corporate level tax. Any taxable investment company income distributed generally will be taxable to shareholders as dividend income.
11
Although we may retain income and gains subject to the limitations described above (including paying corporate level tax on such amounts), we could be subject to an additional four percent excise tax if we fail to distribute 98 percent of our aggregate annual taxable income.
As noted above, in order to qualify as a RIC, we must meet certain investment asset diversification requirements each quarter. Because of the specialized nature of our investment portfolio, in some years we have been able to satisfy the diversification requirements under Subchapter M of the Code primarily as a result of receiving certifications from the SEC under the Code with respect to each taxable year beginning after 1998 that we were “principally engaged in the furnishing of capital to other corporations which are principally engaged in the development or exploitation of inventions, technological improvements, new processes, or products not previously generally available” for such year.
Although we generally intend to qualify as a RIC for each taxable year, under certain circumstances we may choose to take action with respect to one or more taxable years to ensure that we would be taxed under Subchapter C of the Code (rather than Subchapter M) for such year or years. We will choose to take such action only if we determine that the result of the action will benefit us and our shareholders.
INVESTMENT OPPORTUNITY
SVVC invests primarily in equity securities of private technology companies in the United States. We believe that the growth potential exhibited by private technology companies, including cleantech companies, creates an attractive investment environment for SVVC.
The last 15 years has been marked by dramatic changes in the initial public offering (“IPO”) market. Since the dot-com bubble burst in 2000, emerging technology companies have often chosen to stay private longer. The combination of volatile equity markets, increased regulatory requirements (such as the Sarbanes-Oxley Act of 2002), and a lack of investment research coverage has made it less attractive for companies to access the public markets through an IPO. We believe the result is an environment with more opportunities to invest in relatively mature private companies, either directly via primary investments or by purchasing shares in the growing secondary market.
At the same time we believe there are a number of powerful trends creating opportunities for innovative companies and investors alike. The dramatic growth of social networking, cloud computing, and powerful, connected mobile computing devices has enabled new ways of communicating, doing business, and accessing information anytime, anywhere. The Company was established to benefit from convergence of exciting technologies and the growth of private investment opportunities.
COMPETITIVE ADVANTAGES
We believe that we have the following competitive advantages over other capital providers in technology and cleantech companies:
MANAGEMENT EXPERTISE
Kevin Landis, our Chief Executive Officer and Chief Financial Officer, has principal management responsibility for Firsthand Capital Management, Inc. as its owner, President and Chief Investment Officer. Mr. Landis has more than 20 years of experience in technology sector investing, and he intends to dedicate a substantial portion of his time to managing the Company. Mr. Landis controls FCM and is a trustee of Firsthand Funds and a director of the Company.
DISCIPLINED INVESTMENT APPROACH
The Investment Adviser employs a disciplined approach in selecting investments. The Investment Adviser's investment philosophy focuses on ensuring that our investments have an appropriate return profile relative to risk. When market conditions make it difficult for us to invest according to our criteria, the Investment Adviser intends to be highly selective in deploying our capital. We believe this approach enables us to build an attractive investment portfolio that meets our return and value criteria over the long term.
12
We believe it is critical to conduct extensive due diligence on investment targets. In evaluating new investments we, through the Investment Adviser, conduct a rigorous due diligence process that draws from the Investment Adviser’s investment experience, industry expertise, and network of contacts.
FOCUSING ON INVESTMENTS THAT CAN GENERATE POSITIVE RISK-ADJUSTED RETURNS
The Investment Adviser seeks to maximize the potential for capital appreciation. In making investment decisions the Investment Adviser seeks to pursue and invest in companies that meet several of the following criteria:
| ● | outstanding technology, |
| ● | barriers to entry (i.e., patents and other intellectual property rights), |
| ● | experienced management team, |
| ● | established financial sponsors that have a history of creating value with portfolio companies, |
| ● | strong and competitive industry position, and |
| ● | viable exit strategy. |
Assuming a potential investment meets most or all of our investment criteria, the Investment Adviser intends to be flexible in adopting transaction structures that address the needs of prospective portfolio companies and their owners. Our investment philosophy is focused on internal rates of return over the life of an investment. Given our investment criteria and due diligence process, we structure our investments so they correlate closely with the success of our portfolio companies.
ABILITY TO SOURCE AND EVALUATE TRANSACTIONS THROUGH THE INVESTMENT ADVISER'S RESEARCH CAPABILITY AND ESTABLISHED NETWORK
FCM's investment management team has overseen investments in dozens of private companies across various industries while employed by FCM and its affiliates since 1994. We believe the expertise of the Investment Adviser's management team enables FCM to identify, assess, and structure investments successfully across all levels of a company's capital structure and to manage potential risk and return at all stages of the economic cycle.
We seek to identify potential investments both through active origination and through dialogue with numerous management teams, members of the financial community, and corporate partners with whom Mr. Landis has long-standing relationships. We believe that the team's broad network of contacts within the investment, commercial banking, private equity and investment management communities in combination with their strong reputation in investment management, enables us to attract well-positioned prospective portfolio companies.
LONGER INVESTMENT HORIZON WITH ATTRACTIVE PUBLICLY TRADED MODEL
Unlike private equity and venture capital funds, we are not subject to standard periodic capital return requirements. Such requirements typically stipulate that funds raised by a private equity or venture capital fund, together with any capital gains on such invested funds, must be returned to investors after a pre-agreed time period. These provisions often force private equity and venture capital funds to seek returns on their investments through mergers, public equity offerings, or other liquidity events more quickly than they otherwise might, potentially resulting in both a lower overall return to investors and an adverse impact on their portfolio companies. While we are required to distribute substantially all realized gains, we believe that with our dividend reinvestment plan and our flexibility to make investments with a long-term view and without the capital return requirements of traditional private investment vehicles provide us with the opportunity to generate returns on invested capital and at the same time enable us to be a better long-term partner for our portfolio companies.
INVESTMENTS
FCM seeks to create a diversified portfolio of equity securities by making initial investments of approximately $1 million to $10 million of capital, on average, in the securities of micro-cap public and private companies.
Our portfolio consists primarily of equity securities of private companies and cash and we expect that our portfolio will continue to consist primarily of, equity positions in private companies and cash. These investments include holdings in several private technology and cleantech companies. Moreover, we may acquire investments in the secondary market and, in analyzing such investments, we will employ the same analytical process as we use for our primary investments. For description of our current investments, see “Portfolio Investments.”
13
We generally seek to invest in companies from the broad variety of industries in which the Investment Adviser has expertise. The following is a representative list of the industries in which we may elect to invest.
| ● | Advanced Materials |
| ● | Advertising Technology |
| ● | Automotive |
| ● | Biofuels |
| ● | Cloud Computing |
| ● | Computer Hardware |
| ● | Computer Peripherals |
| ● | Computer Software |
| ● | Electronic Components |
| ● | Energy Efficiency |
| ● | Fuel Cells |
| ● | Medical Devices |
| ● | Mobile Computing |
| ● | Semiconductors |
| ● | Social Networking |
| ● | Solar Photovoltaics |
| ● | Solid-state Lighting |
| ● | Telecommunications |
| ● | Water Purification |
| ● | Wearable Technology |
| ● | Wind-Generated Electricity |
We may invest in other industries if we are presented with attractive opportunities.
We may on a limited basis purchase or sell options on indexes or securities. We may engage in these transactions to manage risks or otherwise protect the value of the portfolio, and to use these strategies to a limited extent on an opportunistic basis.
INVESTMENT SELECTION
The Investment Adviser seeks to maximize the potential for capital appreciation.
PROSPECTIVE PORTFOLIO COMPANY CHARACTERISTICS
We have identified several criteria that we believe are important in identifying and investing in prospective portfolio companies. These criteria provide general guidelines for our investment decisions; however, we caution you that no single portfolio company (or prospective portfolio company) will meet all of these criteria. Generally, we use our experience and access to market information generated to identify investment candidates and to structure investments quickly and effectively.
Outstanding Technology
Our investment philosophy places a premium on identifying companies that have developed disruptive technologies, that is, technologies with the potential to dramatically alter the economics or performance of a particular type of product or service.
Barriers to Entry
We believe having defensible barriers to entry, in the form of patents or other intellectual property rights, is critically important in technology industries, in which change happens very rapidly. We seek out companies that have secured protection of key technologies through patents, trademarks, or other means.
14
Experienced management and established financial sponsor relationship
We generally require that our portfolio companies have an experienced management team. We also require the portfolio companies to have in place proper incentives to induce management to succeed and to act in concert with our interests as investors, including having significant equity interests. In addition, we focus our investments in companies backed by strong financial sponsors that have a history of creating value and with whom members of our investment adviser have an established relationship.
Strong and defensible competitive market position in industry
We seek to invest in target companies that have developed leading market positions within their respective markets and are well positioned to capitalize on growth opportunities. We seek companies that demonstrate significant competitive advantages versus their competitors, which should help to protect their market position and profitability.
Viable exit strategy
We seek to invest in companies that we believe will provide a steady stream of cash flow to reinvest in their respective businesses. In addition, we also seek to invest in companies whose business models and expected future cash flows offer attractive exit possibilities. These companies include candidates for strategic acquisition by other industry participants and companies that may repay our investments through an initial public offering of common stock or another capital market transaction. In today's market environment, we believe that a strategic sale is more likely than an IPO for many of our portfolio companies, although IPOs cannot be ruled out. We believe that an acquisition by a strategic buyer is possible at any time for any of our companies.
DUE DILIGENCE
We believe it is critical to conduct extensive due diligence on investment targets. In evaluating new investments, we, through the Investment Adviser, conduct a rigorous due diligence process that draws from the Investment Adviser's investment experience, industry expertise, and network of contacts. The Investment Adviser conducts extensive due diligence investigations in their investment activities. In conducting due diligence, the Investment Adviser uses publicly available information as well as information from its relationships with former and current management teams, consultants, competitors, and investment bankers.
Our due diligence typically includes:
| ● | review of historical and prospective financial information; |
| ● | review of technology, product, and business plan; |
| ● | on-site visits; |
| ● | interviews with management, employees, customers, and vendors of the potential portfolio company; |
| ● | background checks; and |
| ● | research relating to the company's management, industry, markets, products and services, and competitors. |
Upon the completion of due diligence, the Investment Adviser's investment committee determines whether to pursue the potential investment. Additional due diligence with respect to any investment may be conducted on our behalf by attorneys and accountants prior to the closing of the investment, as well as other outside consultants, experts, and/or advisers, as appropriate. To the extent unaffiliated, third-party consultants, experts, and/or advisers are used, we will be responsible for those expenses.
INVESTMENT STRUCTURE
Once we have determined that a prospective portfolio company is suitable for investment, we work with the management of that company and its other capital providers to structure an investment. We negotiate among these parties to agree on how our investment is expected to perform relative to the other capital in the portfolio company's capital structure.
MANAGERIAL ASSISTANCE
As a business development company, we offer, and must provide upon request, managerial assistance to certain of our portfolio companies. This assistance could involve, among other things, monitoring the operations of our portfolio companies, participating in board and management meetings, consulting with and advising officers of portfolio companies, and providing other organizational and financial guidance. We may receive fees for these services. FCM will provide such managerial assistance on our behalf to portfolio companies that request this assistance. For a description of relationships between us and our portfolio companies, please see “Portfolio Companies.”
15
ONGOING RELATIONSHIPS WITH PORTFOLIO COMPANIES
Monitoring
FCM monitors our portfolio companies on an ongoing basis. Specifically, FCM monitors the financial trends of each portfolio company to determine if they are meeting their respective business plans and to assess the appropriate course of action for each company.
FCM has several methods of evaluating and monitoring the performance and fair value of our investments, which may include the following:
| ● | Assessment of success in adhering to portfolio company's technology development, business plan and compliance with covenants; |
| ● | Periodic and regular contact with portfolio company management and, if appropriate, the financial or strategic sponsor, to discuss financial position, requirements, and accomplishments; |
| ● | Comparisons to other portfolio companies in the industry, if any; |
| ● | Attendance at and participation in board meetings; and |
| ● | Review of monthly and quarterly financial statements and financial projections for portfolio companies. |
Valuation Process
The following is a description of the steps we take each quarter to determine the value of our portfolio. Investments for which market quotations are readily available are recorded in our financial statements at such market quotations. With respect to investments for which market quotations are not readily available, our board of directors undertakes a multi-step valuation process each quarter, as described below under “Determination of Net Asset Value.” Currently, our Board of Directors solicits valuation recommendations from a third-party valuation firm on a quarterly basis.
We expect that all of our portfolio investments will be recorded at fair value as determined under the valuation process discussed above. As a result, there will be uncertainty with respect to the value of our portfolio investments.
INVESTMENT MANAGEMENT AGREEMENT
MANAGEMENT SERVICES
FCM has entered into an Investment Management Agreement (the “Investment Management Agreement”) with us whereby FCM provides investment management services. Subject to the overall supervision of our board of directors, the Investment Adviser manages the day-to-day operations of, provides investment management services to, and serves as portfolio manager for us. Mr. Landis, FCM's President and Chief Investment Officer, has been primarily responsible for our portfolio management since our inception. Under the terms of the Investment Management Agreement, FCM will:
| ● | determine the composition of our portfolio, the nature and timing of the changes to our portfolio, and the manner of implementing such changes; |
| ● | identify, evaluate and negotiate the structure of the investments we make (including performing due diligence on our prospective portfolio companies); and |
| ● | close and monitor the investments we make. |
FCM's services under the Investment Management Agreement are not exclusive, and it is free to furnish similar services to other entities so long as its services to us are not impaired. FCM currently serves as investment manager to Firsthand Funds, a family of open-end mutual funds.
INVESTMENT MANAGEMENT FEE
Pursuant to the Investment Management Agreement, we pay FCM a fee for investment management services consisting of two components—a base management fee and an incentive fee.
The base management fee will be calculated at an annual rate of 2.00% of our gross assets. For services rendered under the Investment Management Agreement, the base management fee will be payable quarterly in arrears. The base management fee will be calculated based on the average of (1) the value of our gross assets at the end of the current calendar quarter and (2) the value of our gross assets at the end of the preceding calendar quarter; and appropriately adjusted for any share issuances or repurchases during the current calendar quarter. Base management fees for any partial month or quarter will be pro-rated. The incentive fee is determined and payable in arrears as of the end of each calendar year (or upon termination of the Investment Management Agreement, as of the termination date), and equals 20% of our realized capital gains, if any, on a cumulative basis from inception through the end of each calendar year, computed net of all realized capital losses and unrealized capital depreciation on a cumulative basis, less the aggregate amount of any previously paid incentive fees.
16
Mathematically, the formula for computing the annual incentive fee can be written as:
| Incentive fee | = | 20% | x | ( | Cumulative realized gains | - | Cumulative realized losses | - | Unrealized depreciation | ) | - | Previously paid incentive fees |
For the purposes of calculating realized capital gains, the cost basis of each security acquired in the Reorganization shall be equal to the greater of the original purchase price of that security by Firsthand Funds or the fair market value of the security at the time of the Reorganization.
EXAMPLE INCENTIVE FEE CALCULATION
EXAMPLE: INCENTIVE FEE ON CAPITAL GAINS:
Assumptions
Year 1 = no net realized capital gains or losses
Year 2 = $50,000 realized capital gains and $20,000 realized capital losses and unrealized capital depreciation. Capital gain incentive fee = 20% x (realized capital gains for year computed net of all realized capital losses and unrealized capital depreciation at year end)
Calculation of Incentive Fee
| Year 1 incentive fee | = 20% x (0) | |
| = 0 | ||
| = no incentive fee | ||
| Year 2 incentive fee | = 20% x ($50,000 - $20,000) | |
| = 20% x $30,000 | ||
| = $6,000 |
AVAILABLE INFORMATION
Additional information about us, including quarterly reports on Form 10-Q, current reports on Form 8-K, and amendments to those reports filed or furnished pursuant to Section 13(a) or 15(d) of the Exchange Act, are available free of charge on our website at www.firsthandtvf.com. Information on our website is not part of this Annual Report on Form 10-K.
EMPLOYEES
We do not currently have any direct employees. Mr. Landis, our chief executive officer, is the majority owner and chief investment officer of the Investment Adviser. The Investment Adviser currently employs a staff of 12, including investment, legal, and administrative professionals.
17
Investing in Firsthand Technology Value Fund involves a number of significant risks relating to our business and investment objective. As a result, there can be no assurance that we will achieve our investment objective.
RISKS RELATING TO OUR BUSINESS AND STRUCTURE
WE HAVE A LIMITED OPERATING HISTORY.
We were incorporated in April 2010 and commenced operations on April 15, 2011. We are subject to all of the business risks and uncertainties associated with any business, including the risk that we will not achieve our investment objective and that the value of your investment could decline substantially. The net assets of SVVC, as of December 31, 2017, were approximately $174 million.
WE ARE DEPENDENT UPON FCM'S KEY PERSONNEL FOR OUR FUTURE SUCCESS.
If the Investment Adviser is unable to hire and retain qualified personnel, or if it loses any key member of its management team, our ability to achieve our investment objective could be significantly impaired.
We depend on the diligence, skill, and access to the network of business contacts of the management of FCM, including Mr. Landis, the owner, president and chief executive officer of FCM. We also depend, to a significant extent, on FCM's access to the investment information and deal flow generated by Mr. Landis and any other investment professionals of FCM. Mr. Landis and other management personnel of FCM evaluate, negotiate, structure, close, and monitor our investments. Our future success depends on the continued service of Mr. Landis and other management personnel of FCM. The resignation of FCM, or the departure of Mr. Landis or any other key managers hired by FCM could have a material adverse effect on our ability to achieve our investment objective. In addition, we can offer no assurance that FCM will remain the Investment Adviser.
THE INVESTMENT ADVISER AND ITS MANAGEMENT HAS LIMITED EXPERIENCE MANAGING A BUSINESS DEVELOPMENT COMPANY.
The 1940 Act imposes numerous constraints on the operations of business development companies. For example, business development companies are required to invest at least 70% of their total assets primarily in securities of private or micro-cap U.S. public companies, cash, cash equivalents, U.S. government securities, and other high quality debt investments that mature in one year or less. These constraints may hinder the Investment Adviser's ability to take advantage of attractive investment opportunities and to achieve our investment objective. Under the 1940 Act, our ability to own publicly-traded securities with market capitalizations in excess of $250 million is limited. While Mr. Landis has more than 20 years of experience managing technology stock mutual funds investments and more than 15 years of experience managing private equity investments, Mr. Landis and FCM have only managed a business development company since April 2011, when they began managing SVVC. The investment philosophy and techniques used by Mr. Landis and FCM may differ from those of other funds. Accordingly, we can offer no assurance that SVVC will replicate the historical performance of other investment companies with which Mr. Landis has been affiliated, and we caution you that our investment returns could be substantially lower than the returns achieved by such other companies.
THE INVESTMENT ADVISER AND ITS MANAGEMENT MANAGE OTHER FUNDS.
In addition to managing SVVC, FCM is also the investment adviser to two open-end mutual funds in the Firsthand Funds family: Firsthand Technology Opportunities Fund and Firsthand Alternative Energy Fund. Mr. Landis, who has primary responsibility for SVVC, also serves as portfolio manager of Firsthand Alternative Energy Fund and Firsthand Technology Opportunities Fund. This may reduce the time FCM and its investment management team have to devote to the affairs of SVVC. The other funds managed by FCM have stated investment objectives which differ from our own. Accordingly, there may be times when the interests of FCM's management team differ from our interests.
THE INVESTMENT ADVISER MAY NOT BE ABLE TO ACHIEVE THE SAME OR SIMILAR RETURNS TO THOSE ACHIEVED BY ITS INVESTMENT PROFESSIONALS WHILE THEY WERE EMPLOYED AT PRIOR JOBS.
Although Mr. Landis has been a portfolio manager of a number of open-end mutual funds in the Firsthand Funds family, Mr. Landis's track record and achievements are not necessarily indicative of future results that will be achieved by FCM on our behalf. FCM and its investment professionals' skills and expertise may not be as well suited to our objectives, strategies and requirements as they are for certain other funds. FCM and many of its investment professionals are relatively inexperienced in managing closed end funds and our investment objectives, policies and regulatory limitations differ substantially from the other funds FCM and its investment professionals have managed. Similarly, while the research and operational professionals that support Mr. Landis in his management of Firsthand Funds are substantially the same individuals that will be supporting us, there is no assurance that they will be able to provide the same level of services to us as they did (or currently do) for Firsthand Funds.
18
OUR FINANCIAL CONDITION AND RESULTS OF OPERATION WILL DEPEND ON OUR ABILITY TO MANAGE FUTURE GROWTH EFFECTIVELY.
Our ability to achieve our investment objective will depend on our ability to grow, which will depend, in turn, on FCM's ability to identify, invest in, and monitor companies that meet our investment criteria.
Accomplishing this result on a cost-effective basis will be largely a function of FCM's structuring of the investment process, its ability to provide competent, attentive, and efficient services to us and our access to financing on acceptable terms. The management team of FCM will have substantial responsibilities under the Investment Management Agreement. In addition, the employees of FCM may also be called upon to provide managerial assistance to our portfolio companies as the principals of our administrator. Such demands on their time may distract them or slow our rate of investment. Any failure to manage our future growth effectively could have a material adverse effect on our business, financial condition, and results of operations.
WE OPERATE IN A HIGHLY COMPETITIVE MARKET FOR INVESTMENT OPPORTUNITIES.
A number of entities will compete with us to make the types of investments that we plan to make. We will compete with other venture capital firms and venture capital funds, various public and private investment funds, including hedge funds, other business development companies, commercial and investment banks, commercial financing companies, and various technology and alternative energy companies' internal venture capital arms. Many of our potential competitors are substantially larger and have considerably greater financial, technical and marketing resources than we do. For example, some competitors may have a stronger network of contacts and better connections for deal flows or have access to funding sources that are not available to us. In addition, some of our competitors have higher risk tolerances or different risk assessments, which could allow them to consider a wider variety of investments and establish more relationships than us. Furthermore, many of our competitors are not subject to the regulatory restrictions that the 1940 Act will impose on us as a business development company. We cannot assure you that the competitive pressures we face will not have a material adverse effect on our business, financial condition and results of operations. Also, as a result of this competition, we may not be able to take advantage of attractive investment opportunities from time to time, and we can offer no assurance that we will be able to identify and make investments that are consistent with our investment objective.
REGULATIONS GOVERNING OUR OPERATION AS A BUSINESS DEVELOPMENT COMPANY WILL AFFECT OUR ABILITY TO, AND THE WAY IN WHICH WE, RAISE ADDITIONAL CAPITAL.
We are not generally able to issue and sell our common stock at a price below net asset value per share. We may, however, sell our common stock at a price below the current net asset value of the common stock, or sell warrants, options, or rights to acquire such common stock, at a price below the current net asset value of the common stock if our board of directors determines that such sale is in the best interests SVVC, and our stockholders approve SVVC's policy and practice of making such sales. Our stockholders have not approved a policy or practice of selling our common stock below our net asset value per share. However, our board of directors may ask our stockholders to vote on such a policy and practice at upcoming stockholders meetings. In any such case, the price at which our securities are to be issued and sold may not be less than a price which, in the determination of our board of directors, closely approximates the market value of such securities (less any distributing commission or discount).
WE INTEND TO ELECT TO BE TREATED AS A REGULATED INVESTMENT COMPANY (RIC), AND WE WILL BE SUBJECT TO CORPORATE-LEVEL INCOME TAX IF WE ARE UNABLE TO QUALIFY AS A RIC.
To qualify as a RIC under the Code and obtain RIC tax benefits, we must meet certain income source, asset diversification, and annual distribution requirements. The annual distribution requirement for a RIC is satisfied if we distribute at least 90% of our ordinary income and realized net short-term capital gains in excess of realized net long-term capital losses, if any, to our stockholders on an annual basis. To qualify as a RIC, we must also meet certain asset diversification requirements at the end of each calendar quarter. Failure to meet these tests may result in our having to dispose of certain investments quickly in order to prevent the loss of RIC status. Any such dispositions could be made at disadvantageous prices and may result in losses. If we fail to qualify for RIC tax benefits for any reason and remain or become subject to corporate income tax, the resulting corporate taxes could substantially reduce our net assets, the amount of income available for distribution, and the amount of our distributions. Such a failure would have a material adverse effect on us and our stockholders.
19
ANY FAILURE ON OUR PART TO MAINTAIN OUR STATUS AS A BUSINESS DEVELOPMENT COMPANY WOULD REDUCE OUR OPERATING FLEXIBILITY.
If we do not remain a business development company, we might be regulated as a closed-end investment company under the 1940 Act, which would subject us to substantially more regulatory restrictions under the 1940 Act and correspondingly decrease our operating flexibility and increase our cost of doing business. Furthermore, any failure to comply with the requirements imposed on business development companies by the 1940 Act could cause the SEC to bring an enforcement action against us or expose us to claims of private litigants.
IF WE DO NOT INVEST A SUFFICIENT PORTION OF OUR ASSETS IN QUALIFYING ASSETS, WE COULD FAIL TO QUALIFY AS A BUSINESS DEVELOPMENT COMPANY OR BE PRECLUDED FROM INVESTING ACCORDING TO OUR CURRENT BUSINESS STRATEGY.
As a business development company, we may not acquire any assets other than “qualifying assets” unless, at the time of and after giving effect to such acquisition, at least 70% of our total assets are qualifying assets. See “Regulation.”
We may be precluded from investing in what we believe are attractive investments if such investments are not qualifying assets for purposes of the 1940 Act. If we do not invest a sufficient portion of our assets in qualifying assets, we could lose our status as a business development company, which would have a material adverse effect on our business, financial condition, and results of operations. Similarly, these rules could prevent us from making follow-on investments in existing portfolio companies (which could result in the dilution of our position) or could require us to dispose of investments at inappropriate times in order to comply with the 1940 Act. If we need to dispose of such investments quickly, it would be difficult to dispose of such investments on favorable terms. For example, we may have difficulty in finding a buyer and, even if we do find a buyer, we may have to sell the investments at a substantial loss.
WE ARE A NON-DIVERSIFIED INVESTMENT COMPANY WITHIN THE MEANING OF THE 1940 ACT, AND THEREFORE WE ARE NOT LIMITED WITH RESPECT TO THE PROPORTION OF OUR ASSETS THAT MAY BE INVESTED IN SECURITIES OF A SINGLE ISSUER.
We are classified as a non-diversified investment company within the meaning of the 1940 Act, which means that we are not limited by the 1940 Act with respect to the proportion of our assets that we may invest in securities of a single issuer. To the extent that we assume large positions in the securities of a small number of issuers, our net asset value may fluctuate to a greater extent than that of a diversified investment company as a result of changes in the financial condition or the market's assessment of the issuer. We may also be more susceptible to any single economic or regulatory occurrence than a diversified investment company. Beyond our income tax diversification requirements, we do not have fixed guidelines for diversification, and our investments could be concentrated in relatively few portfolio companies.
WE WILL NEED TO RAISE ADDITIONAL CAPITAL TO GROW.
We will need additional capital to fund growth in our investments once we have fully invested the cash (and other liquid assets, if any) received, we may issue equity securities in order to obtain this additional capital. A reduction in the availability of new capital could limit our ability to grow or pursue business opportunities. We will be required to distribute at least 90% of our ordinary income and realized net short-term capital gains in excess of realized net long-term capital losses, if any, to our stockholders to maintain our RIC status. As a result, if stockholders opt out of reinvesting those distributions back into SVVC, these earnings will not be available to fund new investments. If we fail to obtain additional capital to fund our investments, this could limit our ability to grow, which may have an adverse effect on the value of our securities.
MANY OF OUR PORTFOLIO INVESTMENTS WILL BE RECORDED AT FAIR VALUE AS DETERMINED IN GOOD FAITH BY OUR BOARD OF DIRECTORS. AS A RESULT, THERE WILL BE UNCERTAINTY AS TO THE VALUE OF OUR PORTFOLIO INVESTMENTS.
A large percentage of our portfolio investments will be in the form of securities that are not publicly traded. The fair value of securities and other investments that are not publicly traded may not be readily determinable. We will value these securities quarterly at fair value according to our written valuation procedures and as determined in good faith by our board of directors. Our board of directors may use the services of a nationally recognized independent valuation firm to aid it in determining the fair value of these securities. The methods for valuing these securities may include: fundamental analysis (sales, income, or earnings multiples, etc.), discounts from market prices of similar securities, purchase price of securities, subsequent private transactions in the security or related securities, or discounts applied to the nature and duration of restrictions on the disposition of the securities, as well as a combination of these and other factors. Because such valuations, and particularly valuations of private securities and private companies, are inherently uncertain, may fluctuate over short periods of time, and may be based on estimates, our determinations of fair value may differ materially from the values that would have been used if a ready market for these securities existed. Our net asset value could be adversely affected if our determinations regarding the fair value of our investments were materially higher than the values that we ultimately realize upon the disposal of such securities.
20
THE LACK OF LIQUIDITY IN OUR INVESTMENTS MAY ADVERSELY AFFECT OUR BUSINESS.
We primarily make investments in private companies. Substantially all of these securities will be subject to legal and other restrictions on resale or will otherwise be less liquid than publicly traded securities. The illiquidity of our investments may make it difficult for us to sell such investments if the need arises. In addition, if we are required to liquidate all or a portion of our portfolio quickly, we may realize significantly less than the value at which we have previously recorded our investments. In addition, we may face other restrictions on our ability to liquidate an investment in a portfolio company to the extent that we have material non-public information regarding such portfolio company.
WE MAY EXPERIENCE FLUCTUATIONS IN OUR QUARTERLY RESULTS.
We could experience fluctuations in our quarterly operating results due to a number of factors, including the performance of the portfolio securities we hold; the level of our expenses; variations in, and the timing of the recognition of, realized and unrealized gains or losses; the degree to which we encounter competition in our markets and general economic conditions. As a result of these factors, results for any period should not be relied upon as being indicative of performance in future periods.
THERE ARE SIGNIFICANT POTENTIAL CONFLICTS OF INTEREST THAT COULD IMPACT OUR INVESTMENT RETURNS.
Our executive officers and directors may serve as officers, directors or principals of entities that operate in the same or a related line of business as we do or of investment funds managed by affiliates of FCM that may be formed in the future. Accordingly, if this occurs, they may have obligations to investors in those entities, the fulfillment of which might not be in the best interests of us or our stockholders.
In the course of our investing activities, we will pay investment management and incentive fees to FCM, and will reimburse FCM for certain expenses it incurs. As a result, investors in our common stock will invest on a “gross” basis and receive distributions on a “net” basis after expenses, resulting in a lower rate of return than an investor might achieve through direct investments. Accordingly, there may be times when the management team of FCM has interests that differ from those of our stockholders, giving rise to a conflict.
Several members of the board of directors of the Company are also trustees of the Board of Trustees of Firsthand Funds. Of the five directors of the Company, Messrs. Landis, Burglin, and Lee all serve as both directors for the Company and trustees for Firsthand Funds. Messrs. Petredis and Yee are the only directors of the Company who are not also trustees of Firsthand Funds. The Company believes such a commonality of the board brings continuity of oversight and allows the board of the Company to maintain the institutional knowledge and experience of overseeing illiquid securities and their pricing methods.
OUR INCENTIVE FEE MAY INDUCE FCM TO MAKE SPECULATIVE INVESTMENTS AND THESE FEES WILL, IN EFFECT, BE BORNE BY OUR COMMON STOCKHOLDERS.
The incentive fee payable by us to FCM may create an incentive for FCM to make investments on our behalf that are risky or more speculative than would be the case in the absence of such compensation arrangement. The incentive fee payable to the Investment Adviser is calculated based on a percentage of our return on invested capital. This may encourage the Investment Adviser to invest in higher risk investments in the hope of securing higher returns.
We may invest, to the extent permitted by law, in the securities and instruments of other investment companies, including private funds, as well as other special purpose vehicles set up by third parties for investment in a particular private company. To the extent we so invest, we will bear our ratable share of any such investment company's expenses, including management and incentive fees. We will also remain obligated to pay investment advisory fees, consisting of a base management fee and incentive fees, to FCM with respect to the assets invested in the securities and instruments of other investment companies under the Investment Management Agreement (as defined under “Discussion of Expected Operating Plans—Contractual Obligations”). With respect to any such investments, each of our stockholders will bear his or her share of the investment advisory fees of FCM as well as indirectly bearing the investment advisory fees and other expenses of any investment companies in which we invest.
CHANGES IN LAWS OR REGULATIONS GOVERNING OUR OPERATIONS MAY ADVERSELY AFFECT OUR BUSINESS.
We and our portfolio companies will be subject to regulation by laws at the local, state, and federal levels. These laws and regulations, as well as their interpretation, may be changed from time to time. Accordingly, any change in these laws or regulations could materially and adversely affect our business.
21
PROVISIONS OF THE MARYLAND GENERAL CORPORATION LAW AND OF OUR CHARTER AND BYLAWS COULD DETER TAKEOVER ATTEMPTS AND HAVE AN ADVERSE IMPACT ON THE PRICE OF OUR COMMON STOCK.
The Maryland General Corporation Law, our charter, and our bylaws contain provisions that may discourage, delay or make more difficult a change in control of the Company or the removal of the Company's directors. We are subject to the Maryland Business Combination Act, the application of which is subject to any requirements of the 1940 Act. Our board of directors has adopted a resolution exempting from the Maryland Business Combination Act any business combination between us and any other person, subject to prior approval of such business combination by our board, including approval by a majority of our disinterested directors. If the resolution exempting business combinations is repealed or our board does not approve a business combination, the Maryland Business Combination Act may discourage third parties from trying to acquire control of us and increase the difficulty of consummating such an offer. Our bylaws exempt from the Maryland Control Share Acquisition Act acquisitions of our common stock by any person. If we amend our bylaws to repeal the exemption from the Maryland Control Share Acquisition Act, the Maryland Control Share Acquisition Act also may make it more difficult for a third party to obtain control of us and increase the difficulty of consummating such an offer.
We have also adopted other measures that may make it difficult for a third party to obtain control of us, including provisions of our charter classifying our board of directors in three classes serving staggered three-year terms and until their successors are duly elected and qualify, and provisions of our charter authorizing our board of directors (all without stockholder approval) to classify or reclassify shares of our stock in one or more classes or series, to cause the issuance of additional shares of our stock, and to amend our charter to increase or decrease the number of shares of stock that we have authority to issue. These provisions, as well as other provisions of our charter and bylaws, may delay, defer, or prevent a transaction or a change in control that might otherwise be in the best interests of our stockholders.
OUR BOARD OF DIRECTORS MAY CHANGE OUR INVESTMENT OBJECTIVE, OPERATING POLICIES, AND STRATEGIES WITHOUT PRIOR NOTICE OR STOCKHOLDER APPROVAL.
Our board of directors has the authority to modify or waive certain of our operating policies and strategies without prior notice and without stockholder approval (except as required by the 1940 Act). However, absent stockholder approval, we may not change the nature of our business so as to cease to be, or withdraw our election as, a business development company. We cannot predict the effect any changes to our current operating policies and strategies would have on our business, operating results, and value of our stock. Nevertheless, the effects may adversely affect our business and impact our ability to make distributions.
RISKS RELATED TO OUR INVESTMENTS
OUR INVESTMENTS IN PROSPECTIVE PORTFOLIO COMPANIES MAY BE RISKY, AND YOU COULD LOSE ALL OR PART OF YOUR INVESTMENT.
Equity Investments. We make equity investments primarily in equity securities and equity derivatives (such as options, warrants, rights, etc.) of privately placed venture capital stage technology and alternative energy companies as well as publicly traded micro-cap companies (those with market capitalizations of less than $250 million). Our goal is ultimately to dispose of these equity interests and realize gains upon our disposition of such interests. However, the equity interests we receive may not appreciate in value and, in fact, may decline in value or lose all value. Accordingly, we may not be able to realize gains from our equity interests, and any gains that we do realize on the disposition of any equity interests may not be sufficient to offset any other losses we experience.
In addition, investing in privately placed technology and clean tech companies involves a number of significant risks, including that private companies generally have limited operating history and are not as well capitalized as public companies. In addition, private company valuations may fluctuate more dramatically than those of public companies and they frequently have less diverse product lines and smaller market presence than larger competitors. These factors could adversely affect our investment returns as compared to companies investing primarily in the securities of public companies.
WE MAY INVEST IN MICRO-CAP PUBLIC COMPANIES AND COMPANIES WE MAY HOPE WILL HAVE SUCCESSFUL INITIAL PUBLIC OFFERINGS.
Although micro-cap companies may have potential for rapid growth, they are subject to wider price fluctuations due to factors inherent in their size, such as lack of management experience and financial resources and limited trade volume and frequency. To make a large sale of securities of micro-cap companies that trade in limited volumes, SVVC may need to sell portfolio holdings at a discount or make a series of small sales over an extended period of time.
22
We have invested in, and we expect to continue to invest in, companies that we believe are likely to issue securities in initial public offerings (“IPOs”). Although there is a potential the pre-IPO securities that we buy may increase in value if the company does issue securities in an IPO, IPOs are risky and volatile and may cause the value of our securities to fall dramatically. Also, because securities of pre-IPO companies are generally not freely or publicly tradeable, we may not have access to purchase securities in these companies in the amounts or at the prices we desire. Securities issued by these privately-held companies have no trading history, and information about such companies may be available for very limited periods. The companies that we anticipate holding successful IPOs may not ever issues shares in an IPO and a liquid market for their securities may never develop, which may negatively affect the price at which we can sell any such securities and make it more difficult to sell such securities, which could also adversely affect our liquidity.
WE EXPECT TO PURCHASE SECURITIES IN IPOS, WHICH INVOLVE SIGNIFICANT RISKS FOR US, AND WE MAY NOT BE ABLE TO PARTICIPATE IN OFFERINGS TO THE EXTENT DESIRED OR AT ALL.
Securities purchased in IPOs are often subject to the general risk associated with investments in companies with smaller market capitalizations, and typically to a heightened degree. Securities issued in IPOs have no trading history, and information about companies may be available for very limited periods. In addition, under certain market conditions, a relatively small number of companies may issue securities in IPOs. Our investment performance during periods when we are unable to invest significantly or at all in IPOs may be lower than during periods when we are able to do so.
IPO securities may be volatile, and we cannot predict whether investments in IPOs will be successful. If the Company grows in size, the possible positive effects of IPO investments on the Company may decrease.
WE HAVE NOT YET IDENTIFIED ALL OF THE PORTFOLIO COMPANY INVESTMENTS WE INTEND TO ACQUIRE
The Investment Adviser will select our investments, and our stockholders will have no input with respect to such investment decisions. These factors increase the uncertainty, and thus the risk, of investing in our shares.
ECONOMIC RECESSIONS OR DOWNTURNS COULD IMPAIR OUR PORTFOLIO COMPANIES AND HARM OUR OPERATING RESULTS.
Many of our portfolio companies are susceptible to economic slowdowns or recessions and may fail or require additional capital investments from us during those periods. Therefore, our non-performing assets are likely to increase and the value of our portfolio is likely to decrease during these periods. These events could harm our operating results.
OUR FAILURE TO MAKE FOLLOW-ON INVESTMENTS IN OUR PORTFOLIO COMPANIES COULD IMPAIR THE VALUE OF OUR PORTFOLIO.
Following an initial investment in a portfolio company, we may make additional investments in that portfolio company as “follow-on” investments, in order to:
| ● | increase or maintain in whole or in part our equity ownership percentage; or |
| ● | exercise warrants, options, or convertible securities that were acquired in the original or subsequent financing. |
We have the discretion to make any follow-on investments, subject to the availability of capital resources and the availability of securities in the applicable public company. We may elect not to make follow-on investments in a portfolio company and we may lack sufficient funds to make those investments. The failure to make follow-on investments may, in some circumstances, jeopardize the continued viability of a portfolio company and our initial investment, or may result in a missed opportunity for us to increase our participation in a successful operation. Even if we have sufficient capital to make a desired follow-on investment, we may elect not to make a follow-on investment because we may not want to increase our concentration of risk, because we prefer other opportunities, or because we are inhibited by compliance with business development company requirements or the desire to maintain our tax status.
WE FREQUENTLY DO NOT HOLD CONTROLLING EQUITY INTERESTS IN OUR PORTFOLIO COMPANIES AND WE MAY NOT BE IN A POSITION TO EXERCISE CONTROL OVER OUR PORTFOLIO COMPANIES OR TO PREVENT DECISIONS BY MANAGEMENT OF OUR PORTFOLIO COMPANIES THAT COULD DECREASE THE VALUE OF OUR INVESTMENTS.
Although we may do so occasionally, we do not anticipate routinely taking controlling equity positions in our portfolio companies. As a result, we will be subject to the risk that a portfolio company may make business decisions with which we disagree, and the stockholders and management of a portfolio company may take risks or otherwise act in ways that are adverse to our interests. Due to the lack of liquidity for the equity investments that we will typically hold in our portfolio companies, we may not be able to dispose of our investments in the event we disagree with the actions of a portfolio company, and may therefore suffer a decrease in the value of our investments.
23
AN INVESTMENT STRATEGY FOCUSED PRIMARILY ON PRIVATELY HELD COMPANIES PRESENTS CERTAIN CHALLENGES, INCLUDING THE LACK OF AVAILABLE INFORMATION ABOUT THESE COMPANIES, A DEPENDENCE ON THE TALENTS AND EFFORTS OF ONLY A FEW KEY PORTFOLIO COMPANY PERSONNEL, AND A GREATER VULNERABILITY TO ECONOMIC DOWNTURNS.
We invest primarily in privately held companies. Generally, little public information exists about these companies, and we will be required to rely on the ability of FCM's investment professionals to obtain adequate information to evaluate the potential returns from investing in these companies. If we are unable to uncover all material information about these companies, we may not make a fully informed investment decision, and we may lose money on our investments. Also, privately held companies frequently have less diverse product lines and a smaller market presence than larger competitors. These factors could adversely affect our investment returns as compared to companies investing primarily in the securities of public companies.
OUR PORTFOLIO COMPANIES MAY ISSUE ADDITIONAL SECURITIES OR INCUR DEBT THAT RANKS EQUAL OR SENIOR TO OUR INVESTMENTS IN SUCH COMPANIES.
We also invest primarily in equity securities issued by our portfolio companies. The portfolio companies may be permitted to issue additional securities or incur other debt that ranks equally with, or senior to, the equity securities in which we invest. By their terms, such other securities (especially if they are debt securities) may provide that the holders are entitled to receive payment of interest or principal before we are entitled to receive any distribution from the portfolio companies. Also, in the event of insolvency, liquidation, dissolution, reorganization, or bankruptcy of a portfolio company, holders of debt instruments ranking senior to our equity investment in that portfolio company would typically be entitled to receive payment in full before equity investors like us may receive any distribution in respect of our investment. After repaying such senior creditors, the portfolio company may not have any remaining assets to distribute to us.
WE MAY PURCHASE OR SELL OPTIONS ON SECURITIES AND INDEXES, WHICH MAY EXPOSE US, AND YOUR INVESTMENT IN OUR COMMON STOCK, TO CERTAIN RISKS.
We may on a limited basis purchase or sell options on indexes or securities. The use of options has risks and our ability to successfully use these techniques depends on our ability to predict pertinent market movements, which cannot be assured. The use of options may result in losses greater than if they had not been used, may require us to sell or purchase portfolio securities at inopportune times or for prices other than current market values, may limit the amount of appreciation we can realize on an investment or may cause us to hold a security we might otherwise sell.
OUR INVESTMENTS IN FOREIGN SECURITIES MAY INVOLVE SIGNIFICANT RISKS IN ADDITION TO THE RISKS INHERENT IN U.S. INVESTMENTS.
Our investment strategy involves potential investments in equity securities of foreign companies. Investing in foreign companies may expose us to additional risks not typically associated with investing in U.S. companies. These risks include changes in exchange control regulations; political and social instability; expropriation; imposition of foreign taxes; less liquid markets and less available information than is generally the case in the United States; higher transaction costs; less government supervision of exchanges, brokers and issuers; less developed bankruptcy laws; difficulty in enforcing contractual obligations; lack of uniform accounting and auditing standards; and greater price volatility.
Although most of our investments will be U.S. dollar-denominated, any investments denominated in a foreign currency will be subject to the risk that the value of a particular currency will change in relation to one or more other currencies. Among the factors that may affect currency values are trade balances, the level of short-term interest rates, differences in relative values of similar assets in different currencies, long-term opportunities for investment and capital appreciation, and political developments. We may employ hedging techniques to minimize these risks, but we can offer no assurance that we will, in fact, hedge currency risk, or, if we do, that such strategies will be effective.
24
Under the terms of the Investment Management Agreement, Firsthand Capital Management, Inc. is responsible for providing office space to the Company and for the costs associated with providing such space. Our offices are located at 150 Almaden Blvd., Suite 1250, San Jose, CA 95113.
We are not currently subject to any material pending legal proceedings.
Item 4. Mine Safety Disclosures
Not applicable.
Item 5. Market for Registrant’s Common Equity, Related Stockholder Matters, and Issuer Purchases of Equity Securities
MARKET INFORMATION
Our common stock is traded on the Nasdaq Global Market under the symbol “SVVC.” The following table sets forth the range of the high and low closing sales prices of the Company’s shares during each quarter during the last fiscal year, as reported by Nasdaq Global Market. The quarterly stock prices quoted represent interdealer quotations and do not include markups, markdowns, or commissions.
| 2017 Quarter Ending | Low | High |
| March 31 | $7.67 | $8.52 |
| June 30 | $7.99 | $8.56 |
| September 30 | $7.33 | $8.37 |
| December 31 | $7.89 | $8.96 |
SHAREHOLDERS
As of February 28, 2018, there were approximately 1,700 shareholders of record and approximately 13,400 beneficial owners of the Company’s common stock.
DIVIDENDS
There were no distributions in 2017.
RECENT SALES OF UNREGISTERED SECURITIES
The Company did not issue any unregistered securities during the year ended December 31, 2017.
25
PERFORMANCE GRAPH
The graph and table below compares the cumulative total return of holders of our common stock with the cumulative total returns of the S&P 500 Index and the NASDAQ Composite Index. The comparison assumes that the value of the investment in our common stock and in the index (including reinvestment of dividends) was $10,000 on April 18, 2011 (our inception date), and tracks it through December 31, 2017.
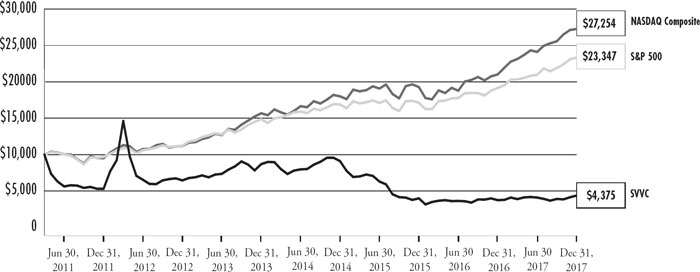
We, however, do not believe either the S&P 500 Index or the NASDAQ Composite Index to be appropriate comparable indices of the Company’s benchmark results. The Company is a publicly traded venture capital fund that invests primarily in private and micro cap technology companies. The S&P 500 Index and the NASDAQ Composite Index are both indices of publicly traded large capitalization companies, with performance predominantly driven by the largest companies in the index. Nevertheless, we do not believe there is currently a widely accessible and generally accepted index that tracks publicly traded venture capital funds. When compared to the S&P 500 Index and the NASDAQ Composite Index, we have underperformed those broad market indices because equity securities of the private companies in our portfolio have not appreciated substantially during the recent bull market for publicly traded stocks.
STOCK TRANSFER AGENT
BNY Mellon Shareowner Services, 301 Bellevue Parkway, Wilmington, Delaware 19809 (1.800.331.1710) serves as our transfer agent.
Item 6. Selected Financial Data
The information below was derived from the audited Consolidated Financial Statements included in this report. This information should be read in conjunction with those Consolidated Financial Statements and Supplementary Data and the notes thereto. These historical results are not necessarily indicative of the results to be expected in the future.
26
Firsthand Technology Value Fund, Inc.
Consolidated Statements of Assets and Liabilities
| AS OF DECEMBER 31, 2017 | AS OF DECEMBER 31, 2016 | |||||||
| ASSETS | ||||||||
| Investment securities: | ||||||||
| Unaffiliated investments at acquisition cost | $ | 33,014,039 | * | $ | 66,336,448 | * | ||
| Affiliated investments at acquisition cost | 24,035,159 | 11,898,906 | ||||||
| Controlled investments at acquisition cost | 117,890,661 | 96,551,795 | ||||||
| Total acquisition cost | $ | 174,939,859 | $ | 174,787,149 | ||||
| Unaffiliated investments at market value | $ | 40,191,055 | * | $ | 51,202,592 | * | ||
| Affiliated investments at market value | 24,656,252 | 10,410,045 | ||||||
| Controlled investments at market value | 109,992,218 | 85,918,212 | ||||||
| Total market value ** (Note 6) | 174,839,525 | 147,530,849 | ||||||
| Cash | 110,077 | 1,934,247 | ||||||
| Receivable from dividends and interest | 1,794,003 | 820,824 | ||||||
| Other assets | 27,985 | 28,513 | ||||||
| Total Assets | 176,771,590 | 150,314,433 | ||||||
| LIABILITIES | ||||||||
| Payable for securities purchased | — | 395,532 | ||||||
| Incentive fees payable (Note 4) | 1,691,040 | — | ||||||
| Payable to affiliates (Note 4) | 879,085 | 796,533 | ||||||
| Consulting fee payable | 21,000 | 27,250 | ||||||
| Accrued expenses and other payables | 186,876 | 182,727 | ||||||
| Total Liabilities | 2,778,001 | 1,402,042 | ||||||
| NET ASSETS | $ | 173,993,589 | $ | 148,912,391 | ||||
| Net Assets consist of: | ||||||||
| Common Stock, par value $0.001 per share 100,000,000 shares authorized | $ | 7,302 | $ | 7,431 | ||||
| Paid-in-capital | 180,772,769 | 184,698,313 | ||||||
| Accumulated net investment loss | (1,691,040 | ) | — | |||||
| Accumulated net realized loss from security transactions | (4,995,108 | ) | (8,537,053 | ) | ||||
| Net unrealized depreciation on investments and warrants transactions | (100,334 | ) | (27,256,300 | ) | ||||
| NET ASSETS | $ | 173,993,589 | $ | 148,912,391 | ||||
| Shares of Common Stock outstanding | 7,302,146 | 7,430,697 | ||||||
| Net asset value per share (Note 2) | $ | 23.83 | $ | 20.04 | ||||
| * | Includes Fidelity Investment Money Market Treasury Portfolio - Class I, which invests primarily in U.S. Treasury securities. The yields as of 12/31/17 and 12/31/16 were 1.14% and 0.35%, respectively. Please see https://fundresearch.fidelity.com/ mutual-funds/ summary/316175504 for additional information. |
| ** | Includes warrants whose primary exposure is equity risk. |
See accompanying notes to financial statements
27
Firsthand Technology Value Fund, Inc.
Consolidated Statements of Operations
| FOR THE YEAR ENDED DECEMBER 31, 2017 | FOR THE YEAR ENDED DECEMBER 31, 2016 | FOR THE YEAR ENDED DECEMBER 31, 2015 | ||||||||||
| INVESTMENT INCOME | ||||||||||||
| Unaffiliated dividends | $ | 24,180 | $ | 28,213 | $ | 148,000 | ||||||
| Unaffiliated interest | 1,522 | 19,133 | 21,381 | |||||||||
| Affiliated/controlled interest | 1,540,089 | 830,677 | 1,895,384 | |||||||||
| Royalty income | — | — | 35,977 | |||||||||
| TOTAL INVESTMENT INCOME | 1,565,791 | 878,023 | 2,100,742 | |||||||||
| EXPENSES | ||||||||||||
| Investment advisory fees (Note 4) | 2,975,982 | 3,281,617 | 3,826,904 | |||||||||
| Administration fees | 187,846 | 165,024 | 150,861 | |||||||||
| Custody fees | 22,152 | 11,334 | 15,363 | |||||||||
| Transfer agent fees | 33,017 | 27,283 | 35,225 | |||||||||
| Registration and filing fees | 23,100 | 23,100 | 23,000 | |||||||||
| Professional fees | 535,293 | 779,689 | 668,836 | |||||||||
| Printing fees | 195,892 | 40,835 | 121,631 | |||||||||
| Trustees fees | 137,500 | 100,000 | 100,000 | |||||||||
| Compliance fees | 107,640 | 188,569 | — | |||||||||
| Miscellaneous fees | 174,670 | 96,075 | 85,675 | |||||||||
| TOTAL GROSS EXPENSES | 4,393,092 | 4,713,526 | 5,027,495 | |||||||||
| Incentive fee adjustments (Note 4) | 1,691,040 | — | (2,478,204 | ) | ||||||||
| TOTAL NET EXPENSES | 6,084,132 | 4,713,526 | 2,549,291 | |||||||||
| NET INVESTMENT LOSS | (4,518,341 | ) | (3,835,503 | ) | (448,549 | ) | ||||||
| Net Realized and Unrealized Gains (Losses) on Investments: | ||||||||||||
| Net realized gains (losses) from security transactions | ||||||||||||
| Affiliated/controlled | 5,058,105 | (3,035,229 | ) | — | ||||||||
| Non-affiliated and other assets | (1,516,161 | ) | (3,132,110 | ) | (2,822,722 | ) | ||||||
| Net realized gains from written option transactions (1) | — | — | 624,994 | |||||||||
| Net change in unrealized appreciation (depreciation) on investments | 19,408,570 | 1,088,815 | (13,582,787 | ) | ||||||||
| Net change in unrealized appreciation (depreciation) on affiliated/controlled investments | 1,138,114 | (20,524,969 | ) | 2,003,664 | ||||||||
| Net change in unrealized appreciation (depreciation) on affiliated/controlled warrants investments (1) | 6,609,282 | 4,777,442 | 74,700 | |||||||||
| Net Realized and Unrealized Gain (Losses) on Investments | 30,697,910 | (20,826,051 | ) | (13,702,151 | ) | |||||||
| Net Increase (Decrease) In Net Assets Resulting From Operations | $ | 26,179,569 | $ | (24,661,554 | ) | $ | (14,150,700 | ) | ||||
| Net Increase (Decrease) In Net Assets Per Share Resulting From Operations (2) | $ | 3.59 | $ | (3.26 | ) | $ | (1.82 | ) | ||||
| (1) | Primary exposure is equity risk. |
| (2) | Per share results are calculated based on weighted average shares outstanding for each period. |
See accompanying notes to financial statements
28
Item 7. Management’s Discussion and Analysis of Financial Condition and Results of Operations
The information contained in this section should be read in conjunction with our 2017 Consolidated Financial Statements and notes thereto.
OVERVIEW
We are an externally managed, closed-end, non-diversified management investment company organized as a Maryland corporation that has elected to be treated as a BDC under the 1940 Act. As such, we are required to comply with certain regulatory requirements. For instance, we generally have to invest at least 70% of our total assets in “qualifying assets,” including securities of private or micro-cap public U.S. companies, cash, cash equivalents, U.S. government securities and high-quality debt investments that mature in one year or less. In addition, for tax purposes we have elected to be treated as a RIC under Subchapter M of the Code. FCM serves as our investment adviser and manages the investment process on a daily basis.
Our investment objective is to seek long-term growth of capital, principally by seeking capital gains on our equity and equity-related investments. There can be no assurance that we will achieve our investment objective. Under normal circumstances, we invest at least 80% of our net assets for investment purposes in technology companies. We consider technology companies to be those companies that derive at least 50% of their revenues from products and/or services within the information technology sector or in the “cleantech” sector. Information technology companies include, but are not limited to, those focused on computer hardware, software, telecommunications, networking, Internet, and consumer electronics. While there is no standard definition of cleantech, it is generally regarded as including goods and services designed to harness renewable energy and materials, eliminate emissions and waste, and reduce the use of natural resources. In addition, under normal circumstances we invest at least 70% of our total assets in privately held companies and public companies with market capitalizations of less than $250 million. Our portfolio is primarily composed of equity and equity derivative securities of technology and cleantech companies (as defined above). These investments generally range between $1 million and $10 million each, although the investment size will vary proportionately with the size of our capital base. We acquire our investments through direct investments in private companies, negotiations with selling shareholders, and in organized secondary marketplaces for private securities.
While our primary focus is to invest in illiquid private technology and cleantech companies, we also may invest in micro-cap publicly traded companies. In addition, we may invest up to 30 percent of the portfolio in opportunistic investments that do not constitute the private companies and micro-cap public companies described above. These other investments may include investments in securities of public companies that are actively traded or in actively traded derivative securities such as options on securities or security indices. These other investments may also include investments in high-yield bonds, distressed debt, or securities of public companies that are actively traded and securities of companies located outside of the United States. Our investment activities are managed by FCM.
The following table summarizes the fair value of our investment portfolio by industry sector as of December 31, 2017 and December 31, 2016.
| December 31, 2017 | December 31, 2016 | |
| Semiconductor Equipment | 29.6% | 18.1% |
| Advanced Materials | 13.9% | 9.1% |
| Medical Devices | 12.1% | 19.2% |
| Networking | 9.3% | 7.4% |
| Consumer Electronics | 8.4% | 6.5% |
| Mobile Computing | 6.9% | 4.9% |
| Automotive | 6.2% | 7.0% |
| Cloud Computing | 4.9% | 5.7% |
| Intellectusl Property | 3.5% | 4.1% |
| Equipment Leasing | 2.3% | 2.7% |
| Aerospace | 1.2% | 0.4% |
29
| continued | December 31, 2017 | December 31, 2016 |
| Semiconductor | 1.2% | 0.3% |
| Renewable Energys | 0.0% | 2.4% |
| Advertising Technology | 0.0% | 6.9% |
| Other Electronics | 0.0% | 0.9% |
| Computer Storage | 0.0% | 0.1% |
| Water Purification | 0.0% | 0.0% |
| Software | 0.0% | 0.2% |
| Exchange-Traded/Money Market Funds | 1.0% | 3.2% |
| (Liabilities)/Other Assets | (0.5%) | 0.9% |
| Net Assets | 100.0% | 100.0% |
Certain trends in the technology industry may have an impact on the portfolio in coming quarters. In particular, the semiconductor industry, which has historically been a highly cyclical industry, has enjoyed a period of strong growth over the past several years. Given the substantial weighting of semiconductor investments in the current portfolio, the Fund will be sensitive to changes in this industry. Fund performance may also be impacted by the speed of adoption of certain new technologies, including, but not limited to: electric drivetrains for trucks, electron intra-operative radiation for cancer treatment, micro-LEDs, hyperconverged networking equipment, and streaming video.
MATURITY OF PRIVATE COMPANIES IN THE CURRENT PORTFOLIO
The Fund invests in private companies at various stages of maturity. As our portfolio companies mature, they move from the “early (development) stage” to the “middle (revenue) stage” and then to the “late stage.” We expect that this continuous progression may create a pipeline of potential exit opportunities through initial public offerings (IPOs) or acquisitions. Of course, some companies do not progress.
The illustration below describes typical characteristics of companies at each stage of maturity and where we believe our current portfolio companies fit within these categories. We expect some of our portfolio companies to transition between stages of maturity over time. The transition may be forward if the company is maturing and is successfully executing its business plan or may be backward if the company is not successfully executing its business plan or decides to change its business plan substantially from its original plan.
30
| EARLY STAGE | MIDDLE STAGE | LATE STAGE |
| Developing product
or service for market, high level of research and development, little or no revenue. |
Established product,
customers, business model; limited revenues. |
Appreciable revenue;
may be break-even or profitable; IPO or acquisition candidate. |
RESULTS OF OPERATIONS
The following information is a comparison for the year ended December 31, 2017, December 31, 2016, and December 31, 2015.
INVESTMENT INCOME
For the year ended December 31, 2017, we had investment income of $1,565,791 primarily attributable to interest accrued on convertible/term note investments with IntraOp Medical Corp, QMAT, and Telepathy Investors.
For the year ended December 31, 2016, we had investment income of $878,023 primarily attributable to interest accrued on convertible/term note investments with Telepathy Investors, Pivotal Systems, Vufine, and IntraOp Medical Corp.
For the year ended December 31, 2015, we had investment income of $2,100,742 primarily attributable to interest accrued on convertible/term note investments with Silicon Genesis Corporation, Pivotal Systems and IntraOp Medical Corp.
The higher level of investment income in the year ended December 31, 2017 compared to the year ended December 31, 2016 was due to increasing principal amounts on notes issued by IntraOp, QMAT, Revasum and SVXR.
31
The lower level of investment income in the year ended December 31, 2016 compared to the year ended December 31, 2015 was due to notes with Silicon Genesis being converted into equity in 2016.
OPERATING EXPENSES
Operating expenses totaled approximately $6,084,132 during the year ended December 31, 2017, $4,713,526 during the year ended December 31, 2016 and $2,549,291 during the year ended December 31, 2015.
Significant components of operating expenses for the year ended December 31, 2017, were a management fee expense of $2,975,982, professional fees (audit, legal, accounting, and consulting) of $535,293, and incentive fees (which was accrued but is not payable until gains in the portfolio are realized) of $1,691,040. Significant components of operating expenses for the year ended December 31, 2016, were a management fee expense of $3,281,617 and professional fees (audit, legal, accounting, and consulting) of $779,689. Significant components of operating expenses for the year ended December 31, 2015, were an incentive fee adjustment (which was accrued but is not payable until gains in the portfolio are realized) of $(2,478,204), management fee expense of $3,826,904 and professional fees (audit, legal, accounting, and consulting) of $668,836.
The higher level of operating expenses for the year ended December 31, 2017 compared to the year ended December 31, 2016 is primarily attributable to the incentive fee accrual in 2017, which is a quarterly accrual based on what the incentive fee would be if the entire portfolio were liquidated at fair market value.
The higher level of operating expenses for the year ended December 31, 2016 compared to the year ended December 31, 2015 is primarily attributable to the incentive fee adjustment in 2015, which is a quarterly adjustment based on what the incentive fee would be if the entire portfolio were liquidated at fair market value.
NET INVESTMENT LOSS
The net investment loss was $4,518,341 for the year ended December 31, 2017, $3,835,503 for the year ended December 31, 2016 and $448,549 for the year ended December 31, 2015.
The greater net investment loss in the year ended December 31, 2017 compared to the year ended December 31, 2016 is primarily due to the accrual of an incentive fee in 2017 which was accrued but is not payable until gains in the portfolio are realized.
The greater net investment loss in the year ended December 31, 2016 compared to the year ended December 31, 2015 is primarily due to the adjustment in an incentive fee in 2015 which was accrued but is not payable until gains in the portfolio are realized.
NET INVESTMENT REALIZED GAINS AND LOSSES AND UNREALIZED APPRECIATION AND DEPRECIATION
A summary of the net realized and unrealized gains and loss on investments for the years ended December 31, 2017, December 31, 2016, and December 31, 2015, is shown below.
| Year Ended December 31, 2017 | ||||
| Realized gains | $ | 3,541,944 | ||
| Net change in unrealized depreciation on investments | $ | 27,155,966 | ||
| Net realized and unrealized gain on investments | $ | 30,697,910 | ||
| As of December 31, 2017 | ||||
| Gross unrealized appreciation on portfolio investments | $ | 44,878,771 | ||
| Gross unrealized depreciation on portfolio investments | $ | (44,979,105 | ) | |
| Net unrealized depreciation on portfolio investments, warrants, and other assets | $ | (100,334 | ) | |
32
| Year Ended December 31, 2016 | ||||
| Realized losses | $ | (6,167,339 | ) | |
| Net change in unrealized depreciation on investments | $ | (14,658,712 | ) | |
| Net realized and unrealized loss on investments | $ | (20,826,051 | ) | |
| As of December 31, 2016 | ||||
| Gross unrealized appreciation on portfolio investments | $ | 13,265,628 | ||
| Gross unrealized depreciation on portfolio investments | $ | (40,521,928 | ) | |
| Net unrealized depreciation on portfolio investments, warrants, and other assets | $ | (27,256,300 | ) | |
| Year Ended December 31, 2015 | ||||
| Realized losses | $ | (2,197,728 | ) | |
| Net change in unrealized depreciation on investments | $ | (11,504,423 | ) | |
| Net realized and unrealized loss on investments | $ | (13,702,151 | ) | |
| As of December 31, 2015 | ||||
| Gross unrealized appreciation on portfolio investments | $ | 16,224,066 | ||
| Gross unrealized depreciation on portfolio investments | $ | (28,821,654 | ) | |
| Net unrealized depreciation on portfolio investments, warrants, and other assets | $ | (12,597,588 | ) |
During the year ended December 31, 2017, we recognized net realized gains of approximately $3,541,944 from the sale of investments. Realized gains were higher compared to the loss in 2016 due to the buyout of our Gilt Groupe position and the sale of our Invensense common stock in 2016 which created realized losses in 2016.
During the year ended December 31, 2017, net unrealized depreciation on total investments decreased by $27,155,966. The change in net unrealized appreciation and depreciation of our private investments is based on portfolio asset valuations determined in good faith by our Board of Directors. The decrease in unrealized depreciation on total investments during the year is due primarily to the increase in value of our investments, most notably, Pivotal, QMAT, Revasum, Nutanix, Roku and Phunware.
During the year ended December 31, 2016, we recognized net realized losses of approximately $6,167,339 from the sale of investments. Realized losses were substantially higher compared to the loss in 2015 due to the buyout of our Gilt Groupe position and the sale of our Invensense common stock in 2016.
During the year ended December 31, 2016, net unrealized depreciation on total investments increased by $14,658,712. The change in net unrealized appreciation and depreciation of our private investments is based on portfolio asset valuations determined in good faith by our Board of Directors. The increase in unrealized depreciation on total investments during the year is due primarily to the decline in value of our investments, most notably, Turn, Aliphcom, Sunrun, QMAT and Telepathy Investors.
During the year ended December 31, 2015, we recognized net realized losses of approximately $2,197,728 from the sale of investments.
During the year ended December 31, 2015, net unrealized depreciation on total investments increased by $11,504,423. The change in net unrealized appreciation and depreciation of our private investments is based on portfolio asset valuations determined in good faith by our Board of Directors. The increase in unrealized depreciation on total investments during the year is due primarily to the decline in value of our investments, most notably, Gilt Groupe, Aliphcom, Sunrun and Phunware.
33
INCOME AND EXCISE TAXES
It is our intent to continue to qualify as a RIC under Subchapter M of the Code; accordingly, the Company does not provide for income taxes. The Company does, however, recognize interest and penalties in income tax expense.
NET INCREASE/(DECREASE) IN ASSETS RESULTING FROM OPERATIONS AND CHANGE IN NET ASSETS PER SHARE
For the year ended December 31, 2017, net increase in net assets resulting from operations totaled $26,179,569 and basic and fully diluted net change in net assets per share for the year ended December 31, 2017 was $3.59.
For the year ended December 31, 2016, net decrease in net assets resulting from operations totaled $24,661,554 and basic and fully diluted net change in net assets per share for the year ended December 31, 2016 was $(3.26).
For the year ended December 31, 2015, net decrease in net assets resulting from operations totaled $14,150,700 and basic and fully diluted net change in net assets per share for the year ended December 31, 2015 was $(1.82).
The greater increase in net assets resulting from operations for the year ended December 31, 2017 as compared to the year ended December 31, 2016, is due primarily to increases in security valuations, most notably, Pivotal, QMAT, Revasum, Nutanix, Roku and Phunware.
The greater decline in net assets resulting from operations for the year ended December 31, 2016 as compared to the year ended December 31, 2015, is due primarily to decreases in security valuations, most notably, Turn, Aliphcom, Sunrun, QMAT and Telepathy Investors.
FINANCIAL CONDITION, LIQUIDITY AND CAPITAL RESOURCES
Our liquidity and capital resources are generated primarily from sales or liquidation proceeds of our investments. In management’s view, we have sufficient liquidity and capital resources to pay our operating expenses and conduct investment activities over the next twelve months.
Our primary uses of cash are to make investments, pay our operating expenses, and make distributions to our stockholders. For the years ended December 31, 2017, 2016, and 2015, our operating expenses were $4,393,092, $4,713,526, and $5,027,495, respectively.
For the year ended December 31, 2017, our total cash reserves and liquid securities increased approximately 65%, primarily due to the restriction being removed from one of the portfolio investments. We believe that our current liquid assets are sufficient to meet the Company’s short-term financing needs.
During the year ended December 31, 2017, cash and cash equivalents decreased to $1,815,452 at the end of the year, from $6,682,097 at the beginning of the year. The decrease in cash and cash equivalents primarily resulted from our operating expenses and the stock buyback we initiated in November 2017.
At December 31, 2017, we had investments in public and private securities totaling approximately $174.8 million. Also, at December 31, 2017, we had approximately $0.1 million in cash. We primarily invest cash on hand in money market treasury portfolios. We expect the portion of our portfolio consisting of cash and cash equivalents to decrease as we become fully invested.
As of December 31, 2017, net assets totaled approximately $174.0 million, with an NAV per share of $23.83. Our primary use of funds will be investments in portfolio companies and payments of fees and other operating expenses we incur. Additionally, we expect to raise additional capital to support our future growth through future equity offerings. To the extent we determine to raise additional equity through an offering of our common stock at a price below NAV, existing investors will experience dilution.
34
PORTFOLIO INVESTMENTS
PRIVATE INVESTMENTS
We make investments in securities of both public and private companies. December 31, 2017, we had investments in the following private companies:
Aliphcom, Inc.
Aliphcom, Inc. (“Aliphcom”), San Francisco, California, designs and markets consumer electronics products under the Jawbone brand.
At December 31, 2017, our investment in Aliphcom consisted of 2,128,005 shares of common stock with an aggregate fair value of approximately $0.
EQX Capital, Inc.
EQX Capital, Inc. (“EQX”), San Francisco, California, is an equipment leasing company.
At December 31, 2017, our investment in EQX consisted of 4,000,000 shares of Series A preferred stock and 100,000 shares of common stock with an aggregate fair value of approximately $4.0 million.
Hera Systems, Inc.
Hera Systems, Inc. (“Hera”), San Jose, CA, is currently developing a constellation of micro satellites to launch into low Earth orbit with imaging and communications capabilities.
At December 31, 2017, our investment in Hera consisted of 3,642,324 shares of Series A preferred stock, 2,039,203 shares of Series B preferred stock and 6,914,922 shares of Series B warrants with an aggregate fair value of approximately $2.1 million.
Hightail, Inc.
Hightail, Inc. (“Hightail”), Campbell, California, provides services that enable users to share large files via “the cloud” — offsite data storage that users access remotely.
At December 31, 2017, our investments in Hightail consisted of 2,268,602 shares of Series E preferred stock with an aggregate fair value of approximately $8.6 million.
IntraOp Medical Corp.
IntraOp Medical Corporation (“IntraOp”), Sunnyvale, California, manufactures and markets the Mobetron, a medical device for delivering Intra Operative Electron Radiation Therapy to cancer patients.
At December 31, 2017, our investment in IntraOp consisted of 26,856,187 shares of Series C preferred stock, $3,000,000 par value term note, $2,000,000 par value term note, $1,000,000 par value convertible note, $1,000,000 par value convertible note, $1,500,000 par value convertible note and a $1,000,000 par value convertible note with a combined aggregate fair value of approximately $21.0 million.
Phunware, Inc.
Phunware, Inc. (“Phunware”), Austin, Texas, is a software company that develops tools and services to enable mobile computing applications.
At December 31, 2017, our investments in Phunware consisted of 3,257,328 shares of Series E preferred stock with an aggregate fair value of approximately $12.0 million.
Pivotal Systems Corp.
Pivotal Systems, Corporation (“Pivotal Systems”), Fremont, California, provides monitoring and process control technologies for the semiconductor manufacturing industry.
35
At December 31, 2017, our investment in Pivotal Systems consisted of 11,914,217 shares of Series A preferred stock, 13,065,236 shares of Series B preferred stock, 2,291,260 shares of Series C preferred stock, 6,237,978 shares of Series D preferred stock, a warrant to purchase 18,180,475 shares of Class B common stock and a warrant to purchase 4,158,654 shares of Series D preferred stock with a combined fair value of approximately $34.7 million.
QMAT, Inc.
QMAT, Inc. (“QMAT”), Santa Clara, California, is developing advanced materials technologies for applications in the electronics industry.
At December 31, 2017, our investment in QMAT consisted of 16,000,240 shares of Series A preferred stock, 2,000,000 shares of Series B preferred stock, warrants to purchase up to 2,000,000 shares of Series A preferred stock, and $2,745,485 par value convertible note with a combined fair value of approximately $23.4 million.
Revasum, Inc.
Revasum, (“Revasum”), San Luis Obispo, California, designs CMP and grinding technology for the semiconductor equipment industry.
At December 31, 2017, our investment in Revasum consisted of 10,000 shares of common stock, 2,200,000 shares of Series Seed preferred stock, 441,998 shares of Series A preferred stock, 313,719 shares of Series B preferred stock and a $1,000,000 par value term note with an aggregate fair value of approximately $14.8 million
Rorus, Inc.
Rorus, Inc., (“Rorus”),Pittsburgh, Pennsylvania, designs portable and household water filters designed to disinfect and purify water.
At December 31, 2017, our investment in Rorus consisted of a $50,000 par value convertible note with an aggregate fair value of approximately $0.
Silicon Genesis Corp.
Silicon Genesis Corporation (“SiGen”), San Jose, CA, provides engineered substrate process technology for the semiconductor, display, optoelectronics, and solar markets.
At December 31, 2017, our investments in SiGen consisted of 82,914 shares of Series 1-C preferred stock, 850,830 shares of Series 1-D preferred stock, 5,704,480 shares of Series 1-E preferred stock, 912,453 shares of Series 1-F preferred stock, 48,370,793 shares of Series 1-G preferred stock, 837,942 shares of Series 1-H preferred stock, 921,892 shares of common stock, and warrants for 8,037,982 shares of common stock with a combined fair value of approximately $6.1 million.
SVXR, Inc.
SVXR, Inc. (“SVXR”), San Jose, California, is an X-ray inspection tool manufacturer whose products are used for inline product monitoring, defect detection, and metrology.
At December 31, 2017, our investment in SVXR consisted of 2,013,491 shares of Series A preferred stock, and a $1,000,000 par value convertible note with a combined fair value of approximately $2.0 million.
Telepathy Investors, Inc.
Telepathy Investors, Inc. (“Telepathy”), Sunnyvale, California, is developing wearable consumer electronics products.
At December 31, 2017, our investment in Telepathy consisted of 15,238,000 shares of Series A preferred stock, a $2,000,000 par value convertible note, a $500,000 par value convertible note, a $500,000 par value convertible note, a $300,000 par value convertible note, a $300,000 par value convertible note and a $150,000 par value convertible note with a combined fair value of approximately $1.5 million.
36
UCT Coatings, Inc.
UCT Coatings, Inc. (“UCT”), Stuart, Florida, is a leader in the development of metal coatings that reduce friction and improve efficiency in mechanical systems.
At December 31, 2017, our investments in UCT consisted of 1,500,000 shares of common stock and warrants to purchase 2,283 shares of common stock, with a combined fair value of approximately $922 thousand.
Vufine, Inc.
Vufine, Inc. (“Vufine”), Sunnyvale, CA, is developing a wearable high-definition display that clips on to existing eyewear.
At December 31, 2017, our investment in Vufine consisted of 22,500,000 shares of Series A preferred stock, 750,000 shares of common stock, a $250,000 par value convertible note and a $1,500,000 par value convertible note with a combined aggregate fair value of approximately $1.4 million.
Wrightspeed, Inc.
Wrightspeed, Inc. (“Wrightspeed”), San Jose, California, is a supplier of electric drivetrains for medium-duty trucks.
At December 31, 2017, our investments in Wrightspeed consisted of 2,267,659 shares of Series C preferred stock, 1,100,978 shares of Series D preferred stock, 450,814 shares of Series E preferred stock, 90,707 shares of Series F preferred stock, and a warrant to purchase 18,141 shares of Series F preferred stock with a combined fair value of approximately $10.7 million.
PUBLIC INVESTMENTS
At December 31, 2017, we had investments in the following public securities:
Nutanix, Inc.
Nutanix, Inc. (“Nutanix”), San Jose, CA, provides “hyperconverged” data center equipment that merges computing, storage, and networking capabilities in a single piece of equipment.
At December 31, 2017, our investment in Nutanix consisted of 458,772 shares of common stock with an aggregate market value of approximately $16.2 million.
Quicklogic Corp.
QuickLogic Corp. (“QuickLogic”) (NASDAQ: QUIK), Sunnyvale, CA, designs and markets system-on-a-chip (“SOC”) semiconductor solutions for smartphones, wearable and “Internet-of-things” devices, and other applications.
At December 31, 2017, our investment in Quicklogic consisted of 1,200,000 shares of common stock with a market value of approximately $2.1 million.
Roku, Inc.
Roku, Inc. (“Roku”), Saratoga, CA, makes Internet streaming devices and software that enable consumers to access streaming content on their televisions.
At December 31, 2017, our investment in Roku consisted of 250,000 shares of restricted common stock with an aggregate fair value of approximately $11.7 million.
Fidelity Investments Money Market Treasury Portfolio - Class I
Fidelity Investments Money Market Treasury Portfolio - Class I (“Money Market”) is a money market portfolio that invests primarily in U.S. treasury securities.
At December 31, 2017, our investment in Money Market consisted of 1,705,375 shares of the money market fund with a market value of approximately $1.7 million.
37
DISTRIBUTION POLICY
Our board of directors will determine the timing and amount, if any, of our distributions. We intend to pay distributions on an annual basis out of assets legally available therefore. In order to qualify as a RIC and to avoid corporate-level tax on our income, we must distribute to our stockholders at least 90% of our ordinary income and realized net short-term capital gains in excess of realized net long-term capital losses, if any, on an annual basis. In addition, we also intend to distribute any realized net capital gains (i.e., realized net long-term capital gains in excess of realized net short-term capital losses) at least annually.
CONTRACTUAL OBLIGATIONS
The Fund does not have any Contractual Obligations that meet the requirements for disclosure under Item 303 of Regulation S-K.
OFF-BALANCE SHEET ARRANGEMENTS
The Fund does not have any Off-Balance Sheet Arrangements.
CRITICAL ACCOUNTING POLICIES
This discussion of our financial condition and results of operations is based upon our financial statements, which are prepared in accordance with accounting principles generally accepted in the United States of America, or GAAP. The preparation of these financial statements will require management to make estimates and assumptions that affect the reported amounts of assets, liabilities, revenues, and expenses. Changes in the economic environment, financial markets, and any other parameters used in determining such estimates could cause actual results to differ. In addition to the discussion below, we will describe our critical accounting policies in the notes to our future financial statements.
Valuation of Portfolio Investments
As a business development company, we generally invest in illiquid equity and equity derivatives of securities of venture capital stage technology companies. Under written procedures established by our board of directors, securities traded on stock exchanges, or quoted by NASDAQ, are valued according to the NASDAQ Stock Market, Inc. (“NASDAQ”) official closing price, if applicable, or at their last reported sale price as of the close of trading on the New York Stock Exchange (“NYSE”) (normally 4:00 P.M. Eastern Time). If a security is not traded that day, the security will be valued at its most recent bid price. Securities traded in the over-the-counter market, but not quoted by NASDAQ, are valued at the last sale price (or, if the last sale price is not readily available, at the most recent closing bid price as quoted by brokers that make markets in the securities) at the close of trading on the NYSE. Securities traded both in the over-the-counter market and on a stock exchange are valued according to the broadest and most representative market. We obtain these market values from an independent pricing service or at the mean between the bid and ask prices obtained from at least two brokers or dealers (if available, otherwise by a principal market maker or a primary market dealer). In addition, a large percentage of our portfolio investments are in the form of securities that are not publicly traded. The fair value of securities and other investments that are not publicly traded may not be readily determinable. We value these securities quarterly at fair value as determined in good faith by our board of directors. Our board of directors may use the services of a nationally recognized independent valuation firm to aid it in determining the fair value of these securities. The methods for valuing these securities may include: fundamental analysis (sales, income, or earnings multiples, etc.), discounts from market prices of similar securities, purchase price of securities, subsequent private transactions in the security or related securities, or discounts applied to the nature and duration of restrictions on the disposition of the securities, as well as a combination of these and other factors. Because such valuations, and particularly valuations of private securities and private companies, are inherently uncertain, may fluctuate over short periods of time, and may be based on estimates, our determinations of fair value may differ materially from the values that would have been used if a ready market for these securities existed. Our net asset value could be adversely affected if our determinations regarding the fair value of our investments were materially higher than the values that we ultimately realize upon the disposal of such securities.
Revenue Recognition
We record interest income on an accrual basis and dividend income on the ex-dividend date to the extent that we expect to collect such amounts. We do not accrue as a receivable interest on loans and debt securities if we have reason to doubt our ability to collect such interest. Loan origination fees, original issue discount, and market discount are capitalized, and we amortize any such amounts as interest income. Upon the prepayment of a loan or debt security, any unamortized loan origination is recorded as interest income. We will record prepayment premiums on loans and debt securities as interest income when we receive such amounts.
38
Net Realized Gains or Losses and Net Change in Unrealized Appreciation or Depreciation
We measure realized gains or losses by the difference between the net proceeds from the repayment or sale and the cost basis of the investment, without regard to unrealized appreciation or depreciation previously recognized. Net change in unrealized appreciation or depreciation reflects the change in portfolio investment values during the reporting period, including any reversal of previously recorded unrealized appreciation or depreciation, when gains or losses are realized.
Recently Issued Accounting Standards
From time to time, new accounting pronouncements are issued by the FASB or other standards setting bodies that are adopted by us as of the specified effective date. We believe that the impact of recently issued standards that are not yet effective will not have a material impact on our financial statements upon effectiveness.
Inflation
Inflation has not had a significant effect on our results of operations in any of the reporting periods presented herein. However, our portfolio companies have experienced, and may in the future experience, the impacts of inflation on their operating results.
SUBSEQUENT EVENTS
Subsequent to the close of the year on December 31, 2017, and through the date of the issuance of the financial statements included herein, a number of material events related to our portfolio of investments occurred, consisting primarily of purchased and sold securities. Since that date, we have purchased private securities with an aggregate cost of approximately $5.0 million. Since that date, we have sold public securities with an aggregate value of approximately $1.5 million and private securities with an aggregate value of approximately $3.2 million.
On February 14, 2018, OpenText Corp. announced that it had purchased Hightail, Inc., a portfolio holding since 2014. We currently anticipate receiving between $5 and $6 million in proceeds from this transaction.
On March 12, 2018, Pivotal Systems announced it has engaged two investment banks for the purpose of exploring a 2018 listing on the Australian Securities Exchange.
39
REPORT OF INDEPENDENT REGISTERED PUBLIC ACCOUNTING FIRM
TO THE SHAREHOLDERS AND BOARD OF DIRECTORS
Firsthand
Technology Value Fund, Inc.
San Jose, California
OPINION ON THE FINANCIAL STATEMENTS
We have audited the accompanying consolidated statements of assets and liabilities of Firsthand Technology Value Fund, Inc. (the “Company”), including the consolidated schedules of investments, as of December 31, 2017 and 2016, and the related consolidated statements of operations, changes in net assets, and cash flows for each of the years in the three-year period ended December 31, 2017, and the financial highlights (consolidated for the years ended December 31, 2017, 2016, and 2015) for each of the years in the five-year period ended December 31, 2017, and the related notes (collectively referred to as the consolidated financial statements). In our opinion, the consolidated financial statements present fairly, in all material respects, the financial position of the Company as of December 31, 2017 and 2016, the results of its operations, the changes in its net assets, and its cash flows for each of the years in the three-year period ended December 31, 2017, and the financial highlights for each of the years in the five-year period ended December 31, 2017, in conformity with accounting principles generally accepted in the United States of America.
We also have audited, in accordance with the standards of the Public Company Accounting Oversight Board (United States) (PCAOB), the Company’s internal control over financial reporting as of December 31, 2017, based on the criteria established in Internal Control-Integrated Framework (2013) issued by the Committee of Sponsoring Organizations of the Treadway Commission (COSO), and our report dated March 15, 2018 expressed an unqualified opinion.
EMPHASIS OF MATTER
As explained in Note 6, the financial statements include investments valued at $154,860,674 (89.00% of net assets), whose fair values have been estimated under procedures established by the Board of Directors in the absence of readily ascertainable fair values. These estimated values may differ significantly from the values that would have been used had a ready market for the investments existed, and the differences could be material. Our opinion is not modified with respect to this matter.
BASIS FOR OPINION
These consolidated financial statements are the responsibility of the Company’s management. Our responsibility is to express an opinion on the Company’s consolidated financial statements based on our audits. We are a public accounting firm registered with the PCAOB and are required to be independent with respect to the Company in accordance with the U.S. federal securities laws and the applicable rules and regulations of the Securities and Exchange Commission and the PCAOB. We have served as the Company’s auditor since 1997.
We conducted our audits in accordance with the standards of the PCAOB. Those standards require that we plan and perform the audits to obtain reasonable assurance about whether the financial statements are free of material misstatement, whether due to error or fraud. Our audits included performing procedures to assess the risks of material misstatement of the consolidated financial statements, whether due to error or fraud, and performing procedures that respond to those risks. Such procedures included examining, on a test basis, evidence regarding the amounts and disclosures in the consolidated financial statements. Our procedures included confirmation of securities owned as of December 31, 2017 by correspondence with the custodian, portfolio companies and brokers; when replies were not received from brokers, we performed other auditing procedures. Our audits also included evaluating the accounting principles used and significant estimates made by management, as well as evaluating the overall presentation of the consolidated financial statements. We believe that our audits provide a reasonable basis for our opinion.
TAIT, WELLER & BAKER LLP
Philadelphia,
Pennsylvania
March 15, 2018
See accompanying notes to financial statements
40
REPORT OF INDEPENDENT REGISTERED PUBLIC ACCOUNTING FIRM
TO THE SHAREHOLDERS AND BOARD OF DIRECTORS
Firsthand
Technology Value Fund, Inc.
San Jose, California
OPINION ON INTERNAL CONTROL OVER FINANCIAL REPORTING
We have audited the internal control over financial reporting of Firsthand Technology Value Fund, Inc. (the “Company”) as of December 31, 2017, based on criteria established in Internal Control—Integrated Framework (2013) issued by the Committee of Sponsoring Organizations of the Treadway Commission (COSO). In our opinion, the Company maintained, in all material respects, effective internal control over financial reporting as of December 31, 2017, based on the criteria established in Internal Control—Integrated Framework (2013) issued by COSO.
We also have audited, in accordance with the standards of the Public Company Accounting Oversight Board (United States) (PCAOB), the consolidated statements of assets and liabilities, including the consolidated schedules of investments, as of December 31, 2017 and 2016, and the related consolidated statements of operations, changes in net assets, and cash flows for each of the years in the three-year period ended December 31, 2017, and the financial highlights (consolidated for the years ended December 31, 2017, 2016 and 2015) for each of the years in the five-year period ended December 31, 2017, and the related notes (collectively referred to as the consolidated financial statements) of the Company, and our report dated March 15, 2018 expressed an unqualified opinion.
BASIS FOR OPINION
The Company’s management is responsible for maintaining effective internal control over financial reporting and for its assessment of the effectiveness of internal control over financial reporting, included in the accompanying Management’s Report on Internal Control Over Financial Reporting. Our responsibility is to express an opinion on the Company’s internal control over financial reporting based on our audit. We are a public accounting firm registered with the PCAOB and are required to be independent with respect to the Company in accordance with the U.S. federal securities laws and the applicable rules and regulations of the Securities and Exchange Commission and the PCAOB. We have served as the Company’s auditor since 1997.
We conducted our audit in accordance with the standards of the PCAOB. Those standards require that we plan and perform the audit to obtain reasonable assurance about whether effective internal control over financial reporting was maintained in all material respects. Our audit of internal control over financial reporting included obtaining an understanding of internal control over financial reporting, assessing the risk that a material weakness exists, and testing and evaluating the design and operating effectiveness of internal control based on the assessed risk. Our audit also included performing such other procedures as we considered necessary in the circumstances. We believe that our audit provides a reasonable basis for our opinion.
DEFINITION AND LIMITATIONS OF INTERNAL CONTROL OVER FINANCIAL REPORTING
A company’s internal control over financial reporting is a process designed to provide reasonable assurance regarding the reliability of financial reporting and the preparation of financial statements for external purposes in accordance with generally accepted accounting principles. A company’s internal control over financial reporting includes those policies and procedures that (1) pertain to the maintenance of records that, in reasonable detail, accurately and fairly reflect the transactions and dispositions of the assets of the company; (2) provide reasonable assurance that transactions are recorded as necessary to permit preparation of financial statements in accordance with generally accepted accounting principles, and that receipts and expenditures of the company are being made only in accordance with authorizations of management and directors of the company; and (3) provide reasonable assurance regarding prevention or timely detection of unauthorized acquisition, use, or disposition of the company’s assets that could have a material effect on the financial statements.
Because of the inherent limitations, internal control over financial reporting may not prevent or detect misstatements. Also, projections of any evaluation of effectiveness to future periods are subject to the risk that controls may become inadequate because of changes in conditions, or that the degree of compliance with the policies or procedures may deteriorate.
TAIT, WELLER & BAKER LLP
Philadelphia,
Pennsylvania
March 15, 2018
See accompanying notes to financial statements
41
Item 8. FINANCIAL STATEMENTS AND SUPPLEMENTAL DATA
Firsthand Technology Value Fund, Inc.
Consolidated Statements of Assets and Liabilities
| AS OF DECEMBER 31, 2017 | AS OF DECEMBER 31, 2016 | |||||||
| ASSETS | ||||||||
| Investment securities: | ||||||||
| Unaffiliated investments at acquisition cost | $ | 33,014,039 | * | $ | 66,336,448 | * | ||
| Affiliated investments at acquisition cost | 24,035,159 | 11,898,906 | ||||||
| Controlled investments at acquisition cost | 117,890,661 | 96,551,795 | ||||||
| Total acquisition cost | $ | 174,939,859 | $ | 174,787,149 | ||||
| Unaffiliated investments at market value | $ | 40,191,055 | * | $ | 51,202,592 | * | ||
| Affiliated investments at market value | 24,656,252 | 10,410,045 | ||||||
| Controlled investments at market value | 109,992,218 | 85,918,212 | ||||||
| Total market value ** (Note 6) | 174,839,525 | 147,530,849 | ||||||
| Cash | 110,077 | 1,934,247 | ||||||
| Receivable from dividends and interest | 1,794,003 | 820,824 | ||||||
| Other assets | 27,985 | 28,513 | ||||||
| Total Assets | 176,771,590 | 150,314,433 | ||||||
| LIABILITIES | ||||||||
| Payable for securities purchased | — | 395,532 | ||||||
| Incentive fees payable (Note 4) | 1,691,040 | — | ||||||
| Payable to affiliates (Note 4) | 879,085 | 796,533 | ||||||
| Consulting fee payable | 21,000 | 27,250 | ||||||
| Accrued expenses and other payables | 186,876 | 182,727 | ||||||
| Total Liabilities | 2,778,001 | 1,402,042 | ||||||
| NET ASSETS | $ | 173,993,589 | $ | 148,912,391 | ||||
| Net Assets consist of: | ||||||||
| Common Stock, par value $0.001 per share 100,000,000 shares authorized | $ | 7,302 | $ | 7,431 | ||||
| Paid-in-capital | 180,772,769 | 184,698,313 | ||||||
| Accumulated net investment loss | (1,691,040 | ) | — | |||||
| Accumulated net realized loss from security transactions | (4,995,108 | ) | (8,537,053 | ) | ||||
| Net unrealized depreciation on investments and warrants transactions | (100,334 | ) | (27,256,300 | ) | ||||
| NET ASSETS | $ | 173,993,589 | $ | 148,912,391 | ||||
| Shares of Common Stock outstanding | 7,302,146 | 7,430,697 | ||||||
| Net asset value per share (Note 2) | $ | 23.83 | $ | 20.04 | ||||
| * | Includes Fidelity Investment Money Market Treasury Portfolio - Class I, which invests primarily in U.S. Treasury securities. The yields as of 12/31/17 and 12/31/16 were 1.14% and 0.35%, respectively. Please see https://fundresearch.fidelity.com/ mutual-funds/ summary/316175504 for additional information. |
| ** | Includes warrants whose primary exposure is equity risk. |
See accompanying notes to financial statements
42
Firsthand
Technology Value Fund, Inc.
Consolidated Schedule of Investments
DECEMBER 31, 2017
| PORTFOLIO COMPANY (% OF NET ASSETS) AND INDUSTRY | TYPE OF INVESTMENT | ACQUISITION DATE | SHARES/PAR VALUE ($) | COST BASIS | VALUE | |||||||||||
| ALIPHCOM, INC. (0.0%) | Common Stock*(1)(7) | 08/20/13 | 2,128,005 | $ | 10,108,024 | $ | 0 | |||||||||
| Consumer Electronics | ||||||||||||||||
| EQX CAPITAL, INC. | Common Stock*(1)(2)(7) | 06/10/16 | 100,000 | 20,000 | 44,810 | |||||||||||
| (2.3%) | Preferred Stock - Series A *(1)(2)(7) | 06/10/16 | 4,000,000 | 4,000,000 | 3,975,200 | |||||||||||
| Equipment Leasing | ||||||||||||||||
| 4,020,010 | ||||||||||||||||
| HERA SYSTEMS, INC. | Preferred Stock - Series A*(1)(2)(7) | 09/18/15 | 3,642,324 | 2,000,000 | 154,799 | |||||||||||
| (1.2%) | Preferred Stock - Series B*(1)(2)(7) | 08/07/17 - 09/28/17 | 2,039,203 | 1,587,102 | 453,315 | |||||||||||
| Aerospace | Preferred Stock Warrants - Series B*(1)(2)(7) | 08/07/17 | 6,214,922 | 0 | 1,380,956 | |||||||||||
| Preferred Stock Warrants - Series B*(1)(2)(7) | 09/28/17 | 700,000 | 0 | 155,540 | ||||||||||||
| 2,144,610 | ||||||||||||||||
| HIGHTAIL, INC. (4.9%) Cloud Computing | Preferred Stock - Series E *(1)(4)(7) | 03/27/14 | 2,268,602 | 9,620,188 | 8,561,704 | |||||||||||
| INTRAOP MEDICAL CORP. (12.1%) Medical Devices | Convertible Note (1)(2)(7) Matures June 2020 Interest Rate 15% | 05/31/17 | 1,000,000 | 1,000,000 | 1,000,000 | |||||||||||
| Convertible Note (1)(2)(7) Matures June 2020 Interest Rate 15% | 09/28/17 | 1,500,000 | 1,500,000 | 1,500,000 | ||||||||||||
| Convertible Note (1)(2)(7) Matures June 2020 Interest Rate 15% | 07/13/17 | 1,000,000 | 1,000,000 | 1,000,000 | ||||||||||||
| Convertible Note (1)(2)(7) Matures June 2020 Interest Rate 15% | 07/08/14 | 1,000,000 | 1,000,000 | 1,000,000 | ||||||||||||
| Preferred Stock - Series C *(1)(2)(7) | 07/12/13 | 26,856,187 | 26,299,938 | 11,479,677 | ||||||||||||
| Term Note (1)(2) Matures February 2020 Interest Rate 8% | 02/10/17 | 2,000,000 | 2,000,000 | 2,000,000 | ||||||||||||
| Term Note (1)(2)(7) Matures February 2020 Interest Rate 8% | 02/28/14 | 3,000,000 | 3,000,000 | 3,000,000 | ||||||||||||
| 20,979,677 | ||||||||||||||||
See accompanying notes to financial statements
43
Firsthand Technology Value Fund, Inc.
Consolidated Schedule of Investments - continued
DECEMBER 31, 2017
| PORTFOLIO COMPANY (% OF NET ASSETS)AND INDUSTRY | TYPE OF INVESTMENT | ACQUISITION DATE | SHARES/PAR VALUE ($) | COST BASIS | VALUE | |||||||||||
| NUTANIX, INC. (9.3%) Networking | Common Stock* | 05/15/15 - 08/23/16 | 458,772 | $ | 7,358,112 | $ | 16,185,476 | |||||||||
| PHUNWARE, INC. (6.9%) Mobile Computing | Preferred Stock - Series E*(1)(3)(7) | 03/14/14 | 3,257,328 | 9,999,997 | 12,018,563 | |||||||||||
| PIVOTAL SYSTEMS CORP. (19.9%) | Common Stock Warrants - Class B*(1)(2)(7) | 02/12/16 | 18,180,475 | 0 | 8,741,172 | |||||||||||
| Semiconductor Equipment | Preferred Stock Warrants - Series D*(1)(2)(7) | 09/02/16 | 4,158,654 | 0 | 618,392 | |||||||||||
| Preferred Stock - Series A*(1)(2)(7) | 11/28/12 - 04/30/14 | 11,914,217 | 6,000,048 | 8,453,614 | ||||||||||||
| Preferred Stock - Series B*(1)(2)(7) | 04/30/14 | 13,065,236 | 6,321,482 | 9,270,308 | ||||||||||||
| Preferred Stock - Series C*(1)(2)(7) | 12/31/14 | 2,291,260 | 2,657,862 | 2,560,254 | ||||||||||||
| Preferred Stock - Series D*(1)(2)(7) | 09/02/16 | 6,237,978 | 3,975,801 | 5,009,720 | ||||||||||||
| 34,653,460 | ||||||||||||||||
| QMAT, INC. (13.4%) | Preferred Stock - Series A*(1)(2)(7) | 12/14/12 - 04/28/16 | 16,000,240 | 16,000,240 | 17,394,341 | |||||||||||
| Advanced Materials | Preferred Stock - Series B*(1)(2) (7) | 09/28/16 - 11/07/16 | 2,000,000 | 2,000,000 | 2,132,600 | |||||||||||
| Preferred Stock Warrants - Series A*(1)(2) | 12/14/12 | 2,000,000 | 0 | 1,086,600 | ||||||||||||
| Convertible Note Matures March 2019 Interest Rate 8% (1)(2)(7) | 12/29/17 | 2,745,485 | 2,745,485 | 2,745,485 | ||||||||||||
| 23,359,026 | ||||||||||||||||
| QUICKLOGIC CORP. (1.2%) | Common Stock * | 12/27/16 - 11/09/17 | 1,200,000 | 1,859,835 | 2,088,000 | |||||||||||
| Semiconductors | ||||||||||||||||
| REVASUM, INC. (8.5%) Semiconductor | Preferred Stock - Series B (1)(2)(7)(8) | 10/27/17 - 12/20/17 | 313,719 | 2,550,033 | 2,550,033 | |||||||||||
| Equipment | Common Stock*(1)(2)(7) | 11/14/16 | 10,000 | 1,000 | 29,908 | |||||||||||
| Preferred Stock - Series A*(1)(2)(7) | 03/01/17 | 441,998 | 1,999,997 | 2,256,355 | ||||||||||||
| Term Note (1)(2)(7) Matures February 2020 Interest Rate 5% | 03/01/17 | 1,000,000 | 1,000,000 | 1,000,000 | ||||||||||||
| Preferred Stock - Series Seed* (1)(2)(7) | 11/14/16 | 2,200,000 | 7,284,145 | 8,966,760 | ||||||||||||
| 14,803,056 | ||||||||||||||||
See accompanying notes to financial statements
44
Firsthand Technology Value Fund, Inc.
Consolidated Schedule of Investments - continued
DECEMBER 31, 2017
| PORTFOLIO COMPANY (% OF NET ASSETS)AND INDUSTRY | TYPE OF INVESTMENT | ACQUISITION DATE | SHARES/PAR VALUE ($) | COST BASIS | VALUE | |||||||||||
| ROKU, INC. (6.7%) | Common Stock*(1)(7) | 05/26/15 - 08/06/15 | 250,000 | $ | 2,312,500 | $ | 11,650,500 | |||||||||
| Consumer Electronics | ||||||||||||||||
| RORUS, INC. (0.0%)Water Purification | Convertible Note (1)(7) Matures June 2021 Interest Rate 2% | 10/04/16 | 50,000 | 50,000 | 0 | |||||||||||
| SILICON GENESIS CORP. | Common Stock*(1)(2)(7) | 04/18/11 | 921,892 | 169,045 | 16,871 | |||||||||||
| (3.5%) | Common Stock Warrants*(1)(2)(7) | 04/18/11 | 5,000,000 | 0 | 11,000 | |||||||||||
| Intellectual Property | Common Stock Warrants*(1)(2)(7) | 10/13/11 | 37,982 | 6,678 | 357 | |||||||||||
| Common Stock Warrants*(1)(2)(7) | 02/06/12 | 3,000,000 | 0 | 6,600 | ||||||||||||
| Preferred Stock - Series 1-C*(1)(2)(7) | 04/18/11 | 82,914 | 109,518 | 74,258 | ||||||||||||
| Preferred Stock - Series 1-D*(1)(2)(7) | 04/18/11 | 850,830 | 431,901 | 205,646 | ||||||||||||
| Preferred Stock - Series 1-E*(1)(2)(7) | 04/18/11 | 5,704,480 | 2,459,808 | 2,063,310 | ||||||||||||
| Preferred Stock - Series 1-F*(1)(2)(7) | 04/18/11 | 912,453 | 475,674 | 456,318 | ||||||||||||
| Preferred Stock - Series | ||||||||||||||||
| 1-G*(1)(2)(5)(7) | 03/10/16 | 48,370,793 | 4,583,405 | 3,023,658 | ||||||||||||
| Preferred Stock - Series 1-H*(1)(2)(7) | 03/10/16 | 837,942 | 946,502 | 236,551 | ||||||||||||
| 6,094,569 | ||||||||||||||||
| SVXR, INC. (1.2%) | Preferred Stock - Series A*(1)(3)(7) | 01/11/17 | 2,013,491 | 1,000,000 | 1,000,000 | |||||||||||
| Semiconductor Equipment | Convertible Note (1)(2)(7) Matures December 2018 Interest Rate 10% (1)(2)(7) | 12/21/17 | 1,000,000 | 1,000,000 | 1,000,000 | |||||||||||
| 2,000,000 | ||||||||||||||||
See accompanying notes to financial statements
45
Firsthand Technology Value Fund, Inc.
Consolidated Schedule of Investments - continued
DECEMBER 31, 2017
| PORTFOLIO COMPANY (% OF NET ASSETS)AND INDUSTRY | TYPE OF INVESTMENT | ACQUISITION DATE | SHARES/PAR VALUE ($) | COST BASIS | VALUE | |||||||||||
| TELEPATHY INVESTORS, INC. (0.9%) Consumer Electronics | Convertible Note (1)(2)(7) Matures January 2018 Interest Rate 10% | 01/29/16 | 300,000 | $ | 300,000 | $ | 45,321 | |||||||||
| Convertible Note (1)(2)(7) Matures January 2018 Interest Rate 10% | 04/20/16 | 500,000 | 500,000 | 75,535 | ||||||||||||
| Convertible Note (1)(2)(7) Matures January 2018 Interest Rate 10% | 06/21/16 | 150,000 | 150,000 | 22,661 | ||||||||||||
| Convertible Note (1)(2)(7) Matures January 2018 Interest Rate 10% | 12/13/16 | 500,000 | 500,000 | 75,535 | ||||||||||||
| Convertible Note (1)(2)(7) Matures January 2018 Interest Rate 10% | 06/23/15 | 2,000,000 | 2,000,000 | 302,140 | ||||||||||||
| Convertible Note (1)(2)(7) Matures January 2018 Interest Rate 10% | 05/03/17 | 300,000 | 300,000 | 45,321 | ||||||||||||
| Preferred Stock - Series A*(1)(2)(7) | 07/29/14 | 15,238,000 | 3,999,999 | 937,137 | ||||||||||||
| 1,503,650 | ||||||||||||||||
| UCT COATINGS, INC. | Common Stock*(1)(3)(7) | 04/18/11 | 1,500,000 | 662,235 | 922,050 | |||||||||||
| (0.5%) | Common Stock Warrants*(1)(3)(7) | 04/18/11 | 2,283 | 67 | 4 | |||||||||||
| Advanced Materials | ||||||||||||||||
| 922,054 | ||||||||||||||||
| VUFINE, INC. (0.8%) | Common Stock*(1)(2)(7) | 02/26/15 | 750,000 | 15,000 | 0 | |||||||||||
| Consumer Electronics | Convertible Note (1)(2)(7) Matures July 2019 Interest Rate 6% | 07/10/17 | 1,500,000 | 1,500,000 | 1,229,280 | |||||||||||
| Preferred Stock - Series A*(1)(2)(7) | 03/04/15 - 02/18/16 | 22,500,000 | 2,250,000 | 0 | ||||||||||||
| Convertible Note (1)(2)(7) Matures October 2019 Interest Rate 12% | 10/16/17 | 250,000 | 250,000 | 204,880 | ||||||||||||
| 1,434,160 | ||||||||||||||||
| WRIGHTSPEED, INC. | Preferred Stock - Series C*(1)(3)(4)(7) | 04/11/13 | 2,267,659 | 6,837,983 | 5,704,296 | |||||||||||
| (6.2%) | Preferred Stock - Series D *(1)(3)(7) | 12/15/14 | 1,100,978 | 3,375,887 | 3,161,018 | |||||||||||
| Automotive | Preferred Stock - Series E *(1)(3)(7) | 07/10/15 | 450,814 | 1,658,996 | 1,350,323 | |||||||||||
| Preferred Stock - Series F *(1)(3)(7) | 08/31/17 | 90,707 | 499,995 | 471,295 | ||||||||||||
| Preferred Stock Warrants - | 08/31/17 | |||||||||||||||
| Series F*(1)(3)(7) | 18,141 | 0 | 28,703 | |||||||||||||
| 10,715,635 | ||||||||||||||||
See accompanying notes to financial statements
46
Firsthand Technology Value Fund, Inc.
Consolidated Schedule of Investments - continued
DECEMBER 31, 2017
| PORTFOLIO COMPANY (% OF NET ASSETS) AND INDUSTRY | TYPE OF INVESTMENT | ACQUISITION DATE | SHARES/PAR VALUE ($) | COST BASIS | VALUE | |||||||||||
| INVESTMENT COMPANY (1.0%) | Fidelity Investments Money Market Treasury Portfolio - Class I (6) | Various | 1,705,375 | $ | 1,705,375 | $ | 1,705,375 | |||||||||
| TOTAL INVESTMENTS (Cost $174,939,859)— 100.5% | 174,839,525 | |||||||||||||||
| LIABILITIES IN EXCESS OF OTHER ASSETS — (0.5)% | (845,936 | ) | ||||||||||||||
| NET ASSETS — 100.0% | ||||||||||||||||
| $ | 173,993,589 | |||||||||||||||
| * | Non-income producing security. |
| (1) | Restricted security. Fair Value is determined by or under the direction of the Company’s Board of Directors (see Note 3). At December 31, 2017, we held $154,860,674 (or 89.0% of net assets) in restricted securities (see Note 2). |
| (2) | Controlled Investments. |
| (3) | Affiliated issuer. |
| (4) | A portion represents position held in Firsthand Holdings, Ltd. (see Note 1). |
| (5) | A portion represents position held in Firsthand Development, Ltd. (see Note 1). |
| (6) | The Fidelity Investments Money Market Portfolio invests primarily in U.S. Treasury securities. |
| (7) | Fair Value Level 3 Security. |
| (8) | A portion represents position held in Firsthand Investments, Ltd. (see Note 1). |
See accompanying notes to financial statements
47
Firsthand Technology Value Fund, Inc.
Schedule of Investments
DECEMBER 31, 2016
| PORTFOLIO COMPANY (% OF NET ASSETS) AND INDUSTRY | TYPE OF INVESTMENT | SHARES/PAR VALUE ($) | COST BASIS | VALUE | ||||||||||
| ALIPHCOM, INC. (0.9%) | Common Stock *(1) | 2,128,005 | $ | 10,108,024 | $ | 1,339,366 | ||||||||
| Consumer Electronics | ||||||||||||||
| CLOUDERA, INC. (0.2%) | Common Stock *(1) | 20,000 | 580,000 | 245,466 | ||||||||||
| Software | ||||||||||||||
| EQX CAPITAL, INC. (2.7%) | Preferred Stock - Series A *(1)(2) | 4,000,000 | 4,000,000 | 3,975,600 | ||||||||||
| Equipment Leasing | Common Stock *(1)(2) | 100,000 | 20,000 | 44,430 | ||||||||||
| 4,020,030 | ||||||||||||||
| HERA SYSTEMS, INC. (0.4%) Aerospace | Term Note (1)(2) Matures May 2017 Interest Rate 3% | 41,208 | 41,208 | 41,208 | ||||||||||
| Preferred Stock - Series A (1)(2) | 3,642,324 | 2,000,000 | 445,456 | |||||||||||
| Convertible Note (1)(2) Matures August 2017 Interest Rate 6% | 30,000 | 30,000 | 30,000 | |||||||||||
| 516,664 | ||||||||||||||
| HIGHTAIL, INC. (5.7%) Cloud Computing | Preferred Stock - Series E *(1)(4) | 2,268,602 | 9,620,188 | 8,550,361 | ||||||||||
| INTEVAC, INC. (0.9%) Other Electronics | Common Stock * | 163,883 | 1,828,934 | 1,401,200 | ||||||||||
| INTRAOP MEDICAL CORP. (19.2%) Medical Devices | Term Note (1)(2) Matures February 2017 Interest Rate 8% | 3,000,000 | 3,000,000 | 3,000,000 | ||||||||||
| Convertible Note (1)(2) Matures July 2017 Interest Rate 15% | 1,000,000 | 1,000,000 | 1,000,000 | |||||||||||
| Preferred Stock - Series C *(1)(2) | 26,856,187 | 26,299,938 | 24,511,642 | |||||||||||
| 28,511,642 | ||||||||||||||
| NUTANIX, INC. (7.4%) Networking | Common Stock *(1) | 459,772 | 7,376,112 | 10,990,390 | ||||||||||
| PHUNWARE, INC. (4.9%) Mobile Computing | Preferred Stock - Series E *(1) | 3,257,328 | 9,999,997 | 7,365,796 | ||||||||||
See accompanying notes to financial statements
48
Firsthand Technology Value Fund, Inc.
Consolidated Schedule of Investments - continued
DECEMBER 31, 2016
| PORTFOLIO COMPANY (% OF NET ASSETS) AND INDUSTRY | TYPE OF INVESTMENT | SHARES/PAR VALUE ($) | COST BASIS | VALUE | ||||||||||
| PIVOTAL SYSTEMS CORP. (16.6%) | Preferred Stock - Series D *(1)(2) | 6,237,978 | $ | 3,975,801 | $ | 4,060,924 | ||||||||
| Semiconductor Equipment | Preferred Stock - Series C *(1)(2) | 2,291,260 | 2,657,862 | 2,273,159 | ||||||||||
| Preferred Stock - Series B *(1)(2) | 13,065,236 | 6,321,482 | 6,985,982 | |||||||||||
| Preferred Stock - Series A *(1)(2) | 11,914,217 | 6,000,048 | 6,370,532 | |||||||||||
| Common Stock Warrants - Class B *(1)(2) | 18,180,475 | 0 | 4,743,286 | |||||||||||
| Preferred Stock Warrants - Series D *(1)(2) | 4,158,654 | 0 | 284,036 | |||||||||||
| 24,717,919 | ||||||||||||||
| PURE STORAGE, INC. (0.1%) | Common Stock * | 14,000 | 336,000 | 158,340 | ||||||||||
| Computer Storage | ||||||||||||||
| QMAT, INC. (8.8%) | Preferred Stock - Series A *(1)(2) | 16,000,240 | 16,000,240 | 10,724,961 | ||||||||||
| Advanced Materials | Preferred Stock Warrants - Series A *(1)(2) | 2,000,000 | 0 | 376,400 | ||||||||||
| Preferred Stock - Series B *(1)(2) | 2,000,000 | 2,000,000 | 2,000,000 | |||||||||||
| 13,101,361 | ||||||||||||||
| QUICKLOGIC CORP. (0.3%) | Common Stock * | 270,000 | 395,532 | 375,300 | ||||||||||
| Semiconductors | ||||||||||||||
| REVASUM, INC. (1.5%) | Common Stock *(1)(2) | 10,000 | 1,000 | 7,524 | ||||||||||
| Semiconductor Equipment | Preferred Stock - Series A *(1)(2) | 2,200,000 | 2,200,000 | 2,193,400 | ||||||||||
| 2,200,924 | ||||||||||||||
| ROKU, INC. (1.1%) | Common Stock *(1) | 1,500,000 | 2,312,500 | 1,683,750 | ||||||||||
| Consumer Electronics | ||||||||||||||
| RORUS, INC. (0.0%) Water Purification | Convertible Note (1) Matures June 2021 Interest Rate 2% | 50,000 | 50,000 | 50,000 | ||||||||||
| SILICON GENESIS CORP. (4.1%) | Preferred Stock - Series 1-E *(1)(2) | 5,704,480 | 2,946,535 | 2,134,616 | ||||||||||
| Intellectual Property | Preferred Stock - Series 1-C *(1)(2) | 82,914 | 109,518 | 70,444 | ||||||||||
| Preferred Stock Series 1-G *(1)(2)(5) | 48,370,793 | 5,042,479 | 3,032,848 | |||||||||||
| Preferred Stock - Series 1-H *(1)(2) | 837,942 | 1,000,000 | 240,238 | |||||||||||
| Preferred Stock -Series 1-D *(1)(2) | 850,830 | 431,901 | 195,606 | |||||||||||
| Common Stock *(1)(2) | 921,892 | 169,045 | 14,750 | |||||||||||
| Common Stock Warrants *(1)(2) | 37,982 | 6,678 | 319 | |||||||||||
| Preferred Stock -Series 1-F *(1)(2) | 912,453 | 583,060 | 464,165 | |||||||||||
| Common Stock Warrants *(1)(2) | 5,000,000 | 0 | 10,000 | |||||||||||
| Common Stock Warrants *(1)(2) | 3,000,000 | 0 | 6,000 | |||||||||||
| 6,168,986 | ||||||||||||||
See accompanying notes to financial statements
49
Firsthand Technology Value Fund, Inc.
Consolidated Schedule of Investments - continued
DECEMBER 31, 2016
| PORTFOLIO COMPANY (% OF NET ASSETS)AND INDUSTRY | TYPE OF INVESTMENT | SHARES | COST BASIS | VALUE | ||||||||||
| SUNRUN, INC. (2.4%) | Common Stock * | 674,820 | $ | 6,417,495 | $ | 3,583,294 | ||||||||
| Renewable Energy | ||||||||||||||
| TELEPATHY INVESTORS, INC. (2.7%) Consumer Electronics | Convertible Note (1)(2) Matures June 2018 Interest Rate 10% | 500,000 | 500,000 | 277,335 | ||||||||||
| Preferred Stock - Series A *(1)(2) | 15,238,000 | 3,999,999 | 2,096,749 | |||||||||||
| Convertible Note (1)(2) Matures June 2017 Interest Rate 10% | 2,000,000 | 2,000,000 | 1,109,340 | |||||||||||
| Convertible Note (1)(2) Matures January 2018 Interest Rate 10% | 300,000 | 300,000 | 166,401 | |||||||||||
| Convertible Note (1)(2) Matures January 2018 Interest Rate 10% | 500,000 | 500,000 | 277,335 | |||||||||||
| Convertible Note (1)(2) Matures January 2018 Interest Rate 10% | 150,000 | 150,000 | 83,201 | |||||||||||
| 4,010,361 | ||||||||||||||
| TURN INC. (6.9%) | Preferred Stock - Series E *(1)(5) | 1,798,562 | 11,339,911 | 9,757,918 | ||||||||||
| Advertising Technology | Convertible Note (1) Matures March 2023 Interest Rate 1.48% | 559,360 | 559,360 | 559,360 | ||||||||||
| 10,317,278 | ||||||||||||||
| UCT COATINGS, INC. (0.3%) | Common Stock Warrants *(1) | 2,283 | 67 | 1 | ||||||||||
| Advanced Materials | Common Stock *(1) | 1,500,000 | 662,235 | 394,200 | ||||||||||
| 394,201 | ||||||||||||||
| VUFINE, INC. (1.8%) | Common Stock *(1)(2) | 750,000 | 15,000 | 14,325 | ||||||||||
| Consumer Electronics | Preferred Stock - Series A *(1)(2) | 22,500,000 | 2,250,000 | 1,656,000 | ||||||||||
| Convertible Note (1)(2) Matures September 2017 Interest Rate 6% | 1,000,000 | 1,000,000 | 1,000,000 | |||||||||||
| 2,670,325 | ||||||||||||||
| WRIGHTSPEED, INC. (7.0%) | Preferred Stock - Series C *(1)(3)(4) | 2,267,659 | 6,864,023 | 5,811,783 | ||||||||||
| Automotive | Preferred Stock - Series D *(1)(3) | 1,100,978 | 3,375,887 | 3,221,792 | ||||||||||
| Preferred Stock - Series E *(1)(3) | 450,814 | 1,658,996 | 1,376,470 | |||||||||||
| 10,410,045 | ||||||||||||||
See accompanying notes to financial statements
50
Firsthand Technology Value Fund, Inc.
Consolidated Schedule of Investments - continued
DECEMBER 31, 2016
| PORTFOLIO COMPANY (% OF NET ASSETS)AND INDUSTRY | TYPE OF INVESTMENT | SHARES/PAR VALUE ($) | COST BASIS | VALUE | ||||||||||
| EXCHANGE TRADED FUNDS (3.2%) | iShares Short Treasury Bond ETF | 21,500 | $ | 2,371,613 | $ | 2,371,450 | ||||||||
| SPDR Bloomberg Barclays 1-3 Month T-Bill ETF | 52,000 | 2,378,480 | 2,376,400 | |||||||||||
| 4,747,850 | ||||||||||||||
| TOTAL INVESTMENTS (Cost $174,787,149) —99.1% | 147,530,849 | |||||||||||||
| OTHER ASSETS IN EXCESS OF LIABILITIES — 0.9% | 1,381,542 | |||||||||||||
| NET ASSETS — 100.0% | $ | 148,912,391 | ||||||||||||
| * | Non-income producing security. |
| (1) | Restricted security. Fair Value is determined by or under the direction of the Company’s Board of Directors (see note 3). (2) Controlled investments. |
| (3) | Affiliated issuer. |
| (4) | A portion represents position held in Firsthand Holdings, Ltd. (See Note 1). |
| (5) | A portion represents position held in Firsthand Development, Ltd. (See Note 1). |
| ETF | Exchange Traded Fund |
| SPDR | Standard & Poor’s Depositary Receipt |
See accompanying notes to financial statements
51
Firsthand Technology Value Fund, Inc.
Consolidated Statements of Operations
| FOR THE YEAR ENDED DECEMBER 31, 2017 | FOR THE YEAR ENDED DECEMBER 31, 2016 | FOR THE YEAR ENDED DECEMBER 31, 2015 | ||||||||||
| INVESTMENT INCOME | ||||||||||||
| Unaffiliated dividends | $ | 24,180 | $ | 28,213 | $ | 148,000 | ||||||
| Unaffiliated interest | 1,522 | 19,133 | 21,381 | |||||||||
| Affiliated/controlled interest | 1,540,089 | 830,677 | 1,895,384 | |||||||||
| Royalty income | — | — | 35,977 | |||||||||
| TOTAL INVESTMENT INCOME | 1,565,791 | 878,023 | 2,100,742 | |||||||||
| EXPENSES | ||||||||||||
| Investment advisory fees (Note 4) | 2,975,982 | 3,281,617 | 3,826,904 | |||||||||
| Administration fees | 187,846 | 165,024 | 150,861 | |||||||||
| Custody fees | 22,152 | 11,334 | 15,363 | |||||||||
| Transfer agent fees | 33,017 | 27,283 | 35,225 | |||||||||
| Registration and filing fees | 23,100 | 23,100 | 23,000 | |||||||||
| Professional fees | 535,293 | 779,689 | 668,836 | |||||||||
| Printing fees | 195,892 | 40,835 | 121,631 | |||||||||
| Trustees fees | 137,500 | 100,000 | 100,000 | |||||||||
| Compliance fees | 107,640 | 188,569 | — | |||||||||
| Miscellaneous fees | 174,670 | 96,075 | 85,675 | |||||||||
| TOTAL GROSS EXPENSES | 4,393,092 | 4,713,526 | 5,027,495 | |||||||||
| Incentive fee adjustments (Note 4) | 1,691,040 | — | (2,478,204 | ) | ||||||||
| TOTAL NET EXPENSES | 6,084,132 | 4,713,526 | 2,549,291 | |||||||||
| NET INVESTMENT LOSS | (4,518,341 | ) | (3,835,503 | ) | (448,549 | ) | ||||||
| Net Realized and Unrealized Gains (Losses) on Investments: | ||||||||||||
| Net realized gains (losses) from security transactions Affiliated/controlled | 5,058,105 | (3,035,229 | ) | — | ||||||||
| Non-affiliated and other assets | (1,516,161 | ) | (3,132,110 | ) | (2,822,722 | ) | ||||||
| Net realized gains from written option transactions (1) | — | — | 624,994 | |||||||||
| Net change in unrealized appreciation (depreciation) on investments | 19,408,570 | 1,088,815 | (13,582,787 | ) | ||||||||
| Net change in unrealized appreciation (depreciation) on affiliated/controlled investments | 1,138,114 | (20,524,969 | ) | 2,003,664 | ||||||||
| Net change in unrealized appreciation (depreciation) on affiliated/controlled warrants investments (1) | 6,609,282 | 4,777,442 | 74,700 | |||||||||
| Net Realized and Unrealized Gain (Losses) on Investments | 30,697,910 | (20,826,051 | ) | (13,702,151 | ) | |||||||
| Net Increase (Decrease) In Net Assets Resulting From Operations | $ | 26,179,569 | $ | (24,661,554 | ) | $ | (14,150,700 | ) | ||||
| Net Increase (Decrease) In Net Assets Per Share Resulting From | ||||||||||||
| Operations (2) | $ | 3.59 | $ | (3.26 | ) | $ | (1.82 | ) | ||||
(1) | Primary exposure is equity risk. |
| (2) | Per share results are calculated based on weighted average shares outstanding for each period. |
See accompanying notes to financial statements
52
Firsthand Technology Value Fund, Inc.
Consolidated Statements of Cash Flows
| FOR THE YEAR ENDED DECEMBER 31, 2017 | FOR THE YEAR ENDED DECEMBER 31, 2016 | FOR THE YEAR ENDED DECEMBER 31, 2015 | ||||||||||
| CASH FLOWS FROM OPERATING ACTIVITIES | ||||||||||||
| Net increase (decrease) in Net Assets resulting from operations | $ | 26,179,569 | $ | (24,661,554 | ) | $ | (14,150,700 | ) | ||||
| Adjustments to reconcile net increase (decrease) in Net Assets derived from operations to net cash provided by (used in) operating activities: | ||||||||||||
| Purchases of investments | (30,958,618 | ) | (76,522,603 | ) | (40,491,729 | ) | ||||||
| Proceeds from disposition of investments | 34,282,019 | 80,015,681 | 48,643,893 | |||||||||
| Net purchases/sales from short-term investments | 65,833 | (1,171,203 | ) | (1,500,000 | ) | |||||||
| Net proceeds from written options | — | — | 624,994 | |||||||||
| Proceeds from litigation claim | — | — | 7,783 | |||||||||
| (Decrease) increase in dividends, interest, and reclaims receivable | (973,179 | ) | 2,615,902 | (707,451 | ) | |||||||
| (Decrease) increase in restricted cash | — | 1,000,000 | (1,000,000 | ) | ||||||||
| Increase (decrease) in payable for investment purchased | (395,532 | ) | 395,532 | (38,253,718 | ) | |||||||
| Increase (decrease) in payable to affiliates | 82,552 | (98,839 | ) | (399,109 | ) | |||||||
| Increaes (decrease) in incentive fees payable | 1,691,040 | — | (13,716,658 | ) | ||||||||
| (Decrease) increase in other assets | 528 | 757,955 | (756,475 | ) | ||||||||
| Increase (decrease) in accrued expenses and other payables | (2,101 | ) | 15,473 | (249,814 | ) | |||||||
| Net realized gain (loss) from investments | (3,541,944 | ) | 6,167,339 | 2,822,721 | ||||||||
| Net realized gain from written options | — | — | (624,994 | ) | ||||||||
| Net unrealized appreciation (depreciation) from investments, other | ||||||||||||
| assets, and warrants transactions | (27,155,966 | ) | 14,658,712 | 11,504,423 | ||||||||
| Net cash provided by (used in) operating activities | (725,799 | ) | 3,172,395 | (48,246,834 | ) | |||||||
| CASH FLOWS FROM FINANCING ACTIVITIES | ||||||||||||
| Cost of shares repurchased | (1,098,371 | ) | (2,005,434 | ) | (19,999,992 | ) | ||||||
| Net cash (used in) financing activities | (1,098,371 | ) | (2,005,434 | ) | (19,999,992 | ) | ||||||
| Net increase (decrease) in cash | (1,824,170 | ) | 1,166,961 | (68,246,826 | ) | |||||||
| Cash - beginning of year | 1,934,247 | 767,286 | 69,014,110 | |||||||||
| Cash - end of year | $ | 110,077 | $ | 1,934,247 | $ | 767,286 | ||||||
See accompanying notes to financial statements
53
Firsthand Technology Value Fund, Inc.
Consolidated Statements of Changes in Net Assets
| FOR THE YEAR ENDED DECEMBER 31, 2017 | FOR THE YEAR ENDED DECEMBER 31, 2016 | FOR THE YEAR ENDED DECEMBER 31, 2015 | ||||||||||
| FROM OPERATIONS: | ||||||||||||
| Net investment loss | $ | (4,518,341 | ) | $ | (3,835,503 | ) | $ | (448,549 | ) | |||
| Net realized gains (losses) from security transactions, written options, and warrants transactions | 3,541,944 | (6,167,339 | ) | (2,197,728 | ) | |||||||
| Net change in unrealized appreciation (depreciation) on investments and warrants transactions | 27,155,966 | (14,658,712 | ) | (11,504,423 | ) | |||||||
| Net increase (decrease) in net assets from operations | 26,179,569 | (24,661,554 | ) | (14,150,700 | ) | |||||||
| FROM CAPITAL SHARE TRANSACTIONS: | ||||||||||||
| Value of shares repurchased | (1,098,371 | ) | (2,005,434 | ) | (19,999,992 | ) | ||||||
| Net decrease in net assets from capital share transactions | (1,098,371 | ) | (2,005,434 | ) | (19,999,992 | ) | ||||||
| TOTAL INCREASE (DECREASE) IN NET ASSETS | 25,081,198 | (26,666,988 | ) | (34,150,692 | ) | |||||||
| NET ASSETS: | ||||||||||||
| Beginning of year | 148,912,391 | 175,579,379 | 209,730,071 | |||||||||
| End of year | $ | 173,993,589 | $ | 148,912,391 | $ | 175,579,379 | ||||||
| Accumulated Net Investment Loss | $ | (1,691,040 | ) | $ | — | $ | — | |||||
| COMMON STOCK ACTIVITY: | ||||||||||||
| Shares repurchased | (128,551 | ) | (272,008 | ) | (859,468 | ) | ||||||
| Net decrease in shares outstanding | (128,551 | ) | (272,008 | ) | (859,468 | ) | ||||||
| Shares outstanding, beginning of year | 7,430,697 | 7,702,705 | 8,562,173 | |||||||||
| Shares outstanding, end of year | 7,302,146 | 7,430,697 | 7,702,705 | |||||||||
See accompanying notes to financial statements
54
Firsthand Technology Value Fund, Inc.
Financial Highlights
Selected per share data and ratios for a share outstanding throughout each year
| FOR THE YEAR ENDED DECEMBER 31, 2017* | FOR THE YEAR ENDED DECEMBER 31, 2016* | FOR THE YEAR ENDED DECEMBER 31, 2015* | FOR THE YEAR ENDED DECEMBER 31, 2014 | FOR THE YEAR ENDED DECEMBER 31, 2013 | ||||||||||||||||
| Net asset value at beginning of period | $ | 20.04 | $ | 22.79 | $ | 24.49 | $ | 28.32 | $ | 22.90 | ||||||||||
| Income from investment operations: | ||||||||||||||||||||
| Net investment loss | (0.62 | ) | (0.52 | ) | (0.06) (1) | (1.26 | ) | (1.42 | ) | |||||||||||
| Net realized and unrealized gains (losses) on investments | 4.21 | (2.76 | ) | (1.78 | ) | 3.04 | 7.16 | |||||||||||||
| Total from investment operations | 3.59 | (3.28 | ) | (1.84 | ) | 1.78 | 5.74 | |||||||||||||
| Distributions from: | ||||||||||||||||||||
| Realized capital gains | — | — | — | (5.86 | ) | (0.32 | ) | |||||||||||||
| Premiums from shares sold in offerings | — | — | — | — | — | (2) | ||||||||||||||
| Anti-dilutive effect from capital share transactions | 0.20 | 0.53 | 0.14 | 0.25 | — | |||||||||||||||
| Net asset value at end of year | $ | 23.83 | $ | 20.04 | $ | 22.79 | $ | 24.49 | $ | 28.32 | ||||||||||
| Market value at end of year | $ | 8.96 | $ | 7.67 | $ | 8.17 | $ | 18.65 | $ | 23.17 | ||||||||||
| Total return | ||||||||||||||||||||
| Based on Net Asset Value | 18.91 | % | (12.07 | )% | (6.94 | )% | 12.54 | % | 25.30 | % | ||||||||||
| Based on Market Value | 16.82 | % | (6.12 | )% | (56.19 | )% | 4.76 | % | 34.61 | % | ||||||||||
| Net assets at end of year (millions) | $ | 174.0 | $ | 148.9 | $ | 175.6 | $ | 209.7 | $ | 256.9 | ||||||||||
| Ratio of total expenses to average net assets | 4.13 | %(3) | 2.90 | % | 1.36 | % (3) | 5.29 | % (3) | 6.52 | % (3) | ||||||||||
| Ratio of total expenses to average net assets, excluding incentive fees | 2.98 | % | 2.90 | % | 2.68 | % | 3.12 | % | 2.67 | % | ||||||||||
| Ratio of net investment loss to average net assets | (3.07 | )% | (2.36 | )% | (0.24 | )% | (4.31 | )% | (5.96 | )% | ||||||||||
| Portfolio turnover rate | 22 | % | 49 | % | 22 | % | 95 | % | 17 | % | ||||||||||
| * | Consolidated. |
| (1) | Calculated using average shares outstanding. |
| (2) | Less than $0.005 per share. |
| (3) | Amount includes the incentive fee. For the year ended December 31, 2017, the year ended December 31, 2015, the year ended December 31, 2014 and the year December 31, 2013, the ratio of the incentive fee to average net assets was 1.15%, (1.32)%, 2.17% and 3.85%, respectively. |
See accompanying notes to financial statements
55
Firsthand Technology Value Fund, Inc.
Notes to Financial Statements
DECEMBER 31, 2017
NOTE 1. THE COMPANY
Firsthand Technology Value Fund, Inc. (the “Company,” “us,” “our,” and “we”), is a Maryland corporation and an externally managed, non-diversified, closed-end management investment company that has elected to be treated as a business development company (“BDC”) under the Investment Company Act of 1940, as amended (the “1940 Act”). The Company acquired its initial portfolio of securities through the reorganization of Firsthand Technology Value Fund, a series of Firsthand Funds, into the Company. The reorganization was completed on April 15, 2011. The Company commenced operations on April 18th, 2011. Under normal circumstances, the Company will invest at least 80% of its assets for investment purposes in technology companies, which are considered to be those companies that derive at least 50% of their revenues from products and/ or services within the information technology sector or the “cleantech” sector. Information technology companies include, but are not limited to, those focused on computer hardware, software, telecommunications, networking, Internet, and consumer electronics. While there is no standard definition of cleantech, it is generally regarded as including goods and services designed to harness renewable energy and materials, eliminate emissions and waste, and reduce the use of natural resources. In addition, under normal circumstances we will invest at least 70% of our assets in privately held companies and in public companies with market capitalizations less than $250 million. Our portfolio is primarily composed of equity and equity derivative securities of technology and cleantech companies (as defined above). These investments generally range between $1 million and $10 million each, although the investment size will vary proportionately with the size of the Company’s capital base. The Company’s shares are listed on the NASDAQ Global Market under the symbol “SVVC.”
The Company is an investment company and follows accounting and reporting guidance in the Financial Accounting Standards Board (“FASB”) Accounting Standards Codification Topic 946.
CONSOLIDATION OF SUBSIDIARIES. On May 8, 2015, the Board of Directors of the Company approved the formation of a fully owned and controlled subsidiary (as defined by the 1940 Act) of the Company named Firsthand Venture Investors (“FVI”), a California general partnership formed on March 30, 2015. After the closing of business on June 30, 2015, the Company contributed substantially all of its assets to FVI in return for a controlling general partner ownership interest in FVI. The transaction was completed July 1, 2015. Under this new structure, we will have all or substantially all of our investment activities conducted through our fully owned subsidiary, FVI.
On June 10, 2016, the Board of Directors of the Company approved the formation of a fully owned and controlled subsidiary (as defined by the 1940 Act) of FVI named Firsthand Holdings, Ltd. (“FHL”), a Cayman Islands corporation formed on May 4, 2016. Under this structure, we may from time to time transfer investments in the Company held in the Company or FVI to FHL in return for ownership interests in FHL. The net assets of FHL at December 31, 2017, were $5,987,340 or 3.4% of the Company’s consolidated net assets. On September 27, 2016, the Board of Directors of the Company approved the formation of a fully owned and controlled subsidiary (as defined by the 1940 Act) of FVI named Firsthand Development, Ltd (“FDL”), a Cayman Islands corporation formed on September 22, 2016. Under this structure, we may from time to time transfer investments in the Company held in the Company or FVI to FDL in return for ownership interests in FDL. The net assets of FDL at December 31, 2017, were $2,690,950 or 1.5% of the Company’s consolidated net assets. On November 10, 2017, the Board of Directors of the Company approved the formation of a fully owned and controlled subsidary (as defined by the 1940 Act) of FVI named Firsthand Investments, Ltd. (“FIL”), a Cayman Islands corporation formed on November 15, 2017. The net assets of FIL at December 31, 2017, were $6,725,070 or 3.9% of the Company’s consolidated net assets. The financial statements of the Company, FVI, FHL, FDL, and FIL are presented in the report on a consolidated basis.
FHL, FDL, and FIL are all treated as controlled foreign corporations under the Internal Revenue Code and are not expected to be subject to U.S. federal income tax. FVI is treated as a U.S. shareholder of each of FHL, FDL, and FIL. As a result, FVI is required to include in gross income for U.S. federal tax purposes all of FHL, FDL, and FIL’s income, whether or not such income is distributed by FHL, FDL, or FIL. If a net loss is realized by FHL, FDL, or FIL, such loss is not generally available to offset the income earned by FVI.
56
Firsthand Technology Value Fund, Inc.
Notes to Financial Statements - continued
DECEMBER 31, 2017
NOTE 2. SUMMARY OF SIGNIFICANT ACCOUNTING POLICIES
The following is a summary of significant accounting policies followed in the preparation of the Company’s financial statements included in this report:
USE OF ESTIMATES. The preparation of financial statements in conformity with accounting principles generally accepted in the United States of America requires management to make estimates and assumptions that affect the reported amounts of assets and liabilities at the date of the financial statements and the reported amounts of income and expenses during the reporting period. Actual results could differ from those estimates.
PORTFOLIO INVESTMENT VALUATIONS. Investments are stated at “value” as defined in the 1940 Act and in the applicable regulations of the Securities and Exchange Commission and in accordance with GAAP. Value, as defined in Section 2(a)(41) of the 1940 Act, is (i) the market value of those securities for which a market quotation is readily available and (ii) the fair value as determined in good faith by, or under the direction of, the board of directors for all other securities and assets. On December 31, 2017, our financial statements include venture capital investments valued at approximately $143.2 million. The fair values of our venture capital investments were determined in good faith by, or under the direction of, the Board. Upon sale of these investments, the values that are ultimately realized may be different from what is presently estimated. The difference could be material. Also see note 6 regarding the fair value of the company’s investments.
CASH AND CASH EQUIVALENTS. The Company considers liquid assets deposited with a bank, investments in money market funds, and certain short-term debt instruments with maturities of three months or less to be cash equivalents. These investments represent amounts held with financial institutions that are readily accessible to pay our expenses or purchase investments. Cash and cash equivalents are valued at cost plus accrued interest, which approximates market value.
RESTRICTED SECURITIES. At December 31, 2017, we held $154,860,674 in restricted securities. At December 31, 2016, we held $137,264,865 in restricted securities.
INCOME RECOGNITION. Dividend income is recorded on the ex-dividend date. Interest income is accrued as earned. Discounts and premiums on securities purchased are amortized over the lives of the respective securities. Other non-cash dividends are recognized as investment income at the fair value of the property received. When debt securities are determined to be non-income producing, the Company ceases accruing interest and writes off any previously accrued interest. These write-offs are recorded as a debit to interest income.
SHARE VALUATION. The net asset value (“NAV”) per share of the Fund is calculated by dividing the sum of the value of the securities held by the Fund, plus cash or other assets, minus all liabilities (including estimated accrued expenses) by the total number of shares outstanding of the Fund, rounded to the nearest cent.
REALIZED GAIN OR LOSS AND UNREALIZED APPRECIATION OR DEPRECIATION OF PORTFOLIO INVESTMENTS. A realized gain or loss is recognized when an investment is disposed of and is computed as the difference between the Company’s cost basis in the investment at the disposition date and the net proceeds received from such disposition. Realized gains and losses are calculated on a specific identification basis. Unrealized appreciation or depreciation is computed as the difference between the fair value of the investment and the cost basis of such investment.
INCOME TAXES. As we intend to continue to qualify as a regulated investment company (“RIC”) under Subchapter M of the Internal Revenue Code of 1986, as amended (the “Code”), the Company does not provide for income taxes. The Company recognizes interest and penalties in income tax expense.
57
Firsthand Technology Value Fund, Inc.
Notes to Financial Statements - continued
DECEMBER 31, 2017
FOREIGN CURRENCY TRANSLATION. The accounting records of the Company are maintained in U.S. dollars. All assets and liabilities denominated in foreign currencies are translated into U.S. dollars based on the rate of exchange of such currencies against U.S. dollars on the date of valuation.
SECURITIES TRANSACTIONS. Securities transactions are accounted for on the date the transaction for the purchase or sale of the securities is entered into by the Company (i.e., trade date).
CONCENTRATION OF CREDIT RISK. The Company places its cash and cash equivalents with financial institutions and, at times, cash held in checking accounts may exceed the Federal Deposit Insurance Corporation insured limit.
OPTIONS. The Company is subject to equity price risk in the normal course of pursuing its investment objectives and may enter into options written to hedge against changes in the value of equities. The Company may purchase put and call options to attempt to provide protection against adverse price effects from anticipated changes in prevailing prices of securities or stock indices. The Company may also write put and call options. When the Company writes an option, an amount equal to the premium received by the Company is recorded as a liability and is subsequently adjusted to the current fair value of the option written.
Premiums received from writing options that expire unexercised are treated by the Company on the expiration date as realized gains from investments. The difference between the premium and the amount paid on effecting a closing purchase transaction, including brokerage commissions, is also treated as a realized gain, or, if the premium is less than the amount paid for the closing purchase transaction, as a realized loss. If a call option is exercised, the premium is added to the proceeds from the sale of the underlying security or currency in determining whether the Company has realized a gain or loss. The Company as writer of an option bears the market risk of an unfavorable change in the price of the security underlying the written option.
The Company had no option transactions for the years ended December 31, 2017, and December 31, 2016.
The average volume of the Company’s derivatives during the year ended December 31, 2017 is as follows:
| PURCHASED OPTIONS (CONTRACTS) | WARRANTS (NOTIONAL VALUE) | WRITTEN OPTIONS (CONTRACTS) | |||||||||||
| Firsthand Technology Value Fund, Inc. | — | 7,060,230 | — | ||||||||||
The average volume of the Company’s derivatives during the year ended December 31, 2016 is as follows:
| PURCHASED OPTIONS (CONTRACTS) | WARRANTS (NOTIONAL VALUE) | WRITTEN OPTIONS (CONTRACTS) | |||||||||||
| Firsthand Technology Value Fund, Inc. | — | 4,862,753 | — | ||||||||||
NOTE 3. BUSINESS RISKS AND UNCERTAINTIES
We plan to invest a substantial portion of our assets in privately-held companies, the securities of which are inherently illiquid. We also seek to invest in small publicly-traded companies that we believe have exceptional growth potential and to make opportunistic investments in publicly-traded companies, both large and small. In the case of investments in small publicly-traded companies, although these companies are publicly traded, their stock may not trade at high volumes, and prices can be volatile, which may restrict our ability to sell our positions. These privately held and publicly traded businesses tend to lack management depth, have limited or no history of operations and typically have not attained profitability. Because of the speculative nature of our investments and the lack of public markets for privately held investments, there is greater risk of loss than is the case with traditional investment securities.
58
Firsthand Technology Value Fund, Inc.
Notes to Financial Statements - continued
DECEMBER 31, 2017
We do not choose investments based on a strategy of diversification. We also do not rebalance the portfolio should one of our portfolio companies increase in value substantially relative to the rest of the portfolio. Therefore, the value of our portfolio may be more vulnerable to events affecting a single sector, industry or portfolio company and, therefore, may be subject to greater volatility than a company that follows a diversification strategy.
Because there is typically no public or readily-ascertainable market for our interests in the small privately-held companies in which we invest, the valuation of those securities is determined in good faith by the Valuation Committee, comprised of all members of the Board who are not “interested persons” of the Company, as such term is defined in Section 2(a)(19) of the 1940 Act, in accordance with our Valuation Procedures and is subject to significant estimates and judgments. The determined value of the securities in our portfolio may differ significantly from the values that would be placed on these securities if a ready market for the securities existed. Any changes in valuation are recorded in our Statement of Operations as “Net increase (decrease) in unrealized appreciation on investments.” Changes in valuation of any of our investments in privately-held companies from one period to another may be volatile.
The Board may, from time to time, engage an independent valuation firm to provide it with valuation assistance with respect to certain of our portfolio investments. The Company intends to continue to engage an independent valuation firm to provide us with assistance regarding our determination of the fair value of select portfolio investments each quarter unless directed by the Board to cancel such valuation services. The scope of the services rendered by an independent valuation firm is at the discretion of the Board. The Board is ultimately and solely responsible for determining the fair value of the Company’s investments in good faith.
With respect to investments for which market quotations are not readily available or when such market quotations are deemed not to represent fair value, the Board has approved a multi-step valuation process to be followed each quarter, as described below:
| (1) | each quarter the valuation process begins with each portfolio company or investment being initially valued by the Adviser Valuation Committee or the independent valuation firm; |
| (2) | the Valuation Committee of the Board on a quarterly basis reviews the preliminary valuation of the Adviser Valuation Committee and that of the independent valuation firms and makes the fair value determination, in good faith, based on the valuation recommendations of the Adviser Valuation Committee and the independent valuation firms; and |
| (3) | at each quarterly Board meeting, the Board considers the valuations recommended by the Adviser Valuation Committee and the independent valuation firms that were previously submitted to the Valuation Committee of the Board and ratifies the fair value determinations made by the Valuation Committee of the Board. |
NOTE 4. INVESTMENT MANAGEMENT FEE
The Company has entered into an investment management agreement (the “Investment Management Agreement”) with Firsthand Capital Management, Inc., which was previously known as SiVest Group, Inc. (“FCM” or the “Adviser”), pursuant to which the Company will pay FCM a fee for providing investment management services consisting of two components—a base management fee and an incentive fee.
59
Firsthand Technology Value Fund, Inc.
Notes to Financial Statements - continued
DECEMBER 31, 2017
The base management fee will be calculated at an annual rate of 2.00% of our gross assets. For services rendered under the Investment Management Agreement, the base management fee will be payable quarterly in arrears. The base management fee will be calculated based on the average of (1) the value of our gross assets at the end of the current calendar quarter and (2) the value of the Company’s gross assets at the end of the preceding calendar quarter; and will be appropriately adjusted for any share issuances or repurchases during the current calendar quarter. Base management fees for any partial month or quarter will be pro-rated.
The incentive fee is determined and payable in arrears as of the end of each calendar year (or upon termination of the Investment Management Agreement, as of the termination date), commencing on April 15, 2011, and equals 20% of the Company’s realized capital gains, if any, on a cumulative basis from inception through the end of each calendar year, computed net of all realized capital losses and unrealized capital depreciation on a cumulative basis, less the aggregate amount of any previously paid incentive fees, provided that the incentive fee determined as of December 31, 2016, will be calculated for a period of shorter than twelve calendar months to take into account any realized gains computed net of all realized capital losses and unrealized capital depreciation from inception. As of December 31, 2017, there was an incentive fee expensed for $1,691,040. As of December 31, 2016, there was an incetive fee expensed for $0. As of December 31, 2015, there was an incentive fee expensed for $(2,478,204).
NOTE 5. DEBT
The Company currently has no plan to use leverage and does not have any significant outstanding debt obligations (other than normal operating expense accruals).
NOTE 6. FAIR VALUE
Securities traded on stock exchanges, or quoted by NASDAQ, are valued according to the NASDAQ Stock Market, Inc. (“NASDAQ”) official closing price, if applicable, or at their last reported sale price as of the close of trading on the New York Stock Exchange (“NYSE”) (normally 4:00 P.M. Eastern Time). If a security is not traded that day, the security will be valued at its most recent bid price.
Securities traded in the over-the-counter market, but not quoted by NASDAQ, are valued at the last sale price (or, if the last sale price is not readily available, at the most recent closing bid price as quoted by brokers that make markets in the securities) at the close of trading on the NYSE.
Securities traded both in the over-the-counter market and on a stock exchange are valued according to the broadest and most representative market.
Securities and other assets that do not have market quotations readily available are valued at their fair value as determined in good faith by the Board of Directors of the Company (the “Board”) in accordance with the Valuation Procedures adopted by the Valuation Committee, a committee of the Board.
In pricing illiquid, privately placed securities, the Board of Directors is responsible for (1) determining overall valuation guidelines and (2) ensuring that the investments of the Company are valued within the prescribed guidelines.
The Valuation Committee, comprised of all of the independent Board members, is responsible for determining the valuation of the Company’s assets within the guidelines established by the Board of Directors. The Valuation Committee receives information and recommendations from the Adviser and an independent valuation firm.
60
Firsthand Technology Value Fund, Inc.
Notes to Financial Statements - continued
DECEMBER 31, 2017
The values assigned to these investments are based on available information and do not necessarily represent amounts that might ultimately be realized when that investment is sold, as such amounts depend on future circumstances and cannot reasonably be determined until the individual investments are actually liquidated or become readily marketable.
APPROACHES TO DETERMINING FAIR VALUE. GAAP defines fair value as the price that would be received to sell an asset or paid to transfer a liability in an orderly transaction between market participants at the measurement date (exit price). In effect, GAAP applies fair value terminology to all valuations whereas the 1940 Act applies market value terminology to readily marketable assets and fair value terminology to other assets.
The main approaches to measuring fair value utilized are the market approach, the income approach, and the asset-based approach. The choice of which approach to use in a particular situation depends on the specific facts and circumstances associated with the company, as well as the purpose for which the valuation analysis is being conducted. Firsthand and the independent valuation firm rely primarily on the market approach. We also considered the income and asset-based approaches in our analysis because certain of the portfolio companies do not have substantial operating earnings relative to the value of their underlying assets.
| - | Market Approach (M): The market approach uses prices and other relevant information generated by market transactions involving identical or comparable assets or liabilities. For example, the market approach often uses market multiples derived from a set of comparables. Multiples might lie in ranges with a different multiple for each comparable. The selection of where within the range each appropriate multiple falls requires the use of judgment in considering factors specific to the measurement (qualitative and quantitative). |
| - | Income Approach (I): The income approach uses valuation techniques to convert future amounts (for example, cash flows or earnings) to a single present value amount (discounted). The measurement is based on the value indicated by current market expectations about those future amounts. Those valuation techniques include present value techniques; option-pricing models, such as the Black-Scholes-Merton formula (a closed-form model) and a binomial model (a lattice model), which incorporate present value techniques; and the multi-period excess earnings method, which is used to measure the fair value of certain assets. |
| - | Asset-Based Approach (A): The asset-based approach examines the value of a company’s assets net of its liabilities to derive a value for the equity holders. |
FAIR VALUE MEASUREMENT. In accordance with the guidance from the Financial Accounting Standards Board on fair value measurements and disclosures under GAAP, the Company discloses the fair value of its investments in a hierarchy that prioritizes the inputs to valuation techniques used to measure the fair value. The hierarchy gives the highest priority to valuations based upon unadjusted quoted prices in active markets for identical assets or liabilities (Level 1 measurement) and the lowest priority to valuations based upon unobservable inputs that are significant to the valuation (Level 3 measurements).
The guidance establishes three levels of the fair value hierarchy as follows:
| Level 1 - | Unadjusted quoted prices in active markets for identical assets or liabilities that the Company has the ability to access at the date of measurement. |
61
Firsthand Technology Value Fund, Inc.
Notes to Financial Statements - continued
DECEMBER 31, 2017
| Level 2 - | Observable inputs other than quoted prices included in Level 1 that are observable for the asset or liability, either directly or indirectly. These inputs may include quoted prices for the identical instrument in an inactive market, prices for similar instruments in an active or inactive market, interest rates, prepayment speeds, credit risks, yield curves, default rates, and similar data. |
| Level 3 - | Unobservable inputs for the asset or liability, to the extent relevant observable inputs are not available, representing the Company’s own assumptions about the assumptions a market participant would use in valuing the asset or liability based on the best information available. |
The availability of observable inputs can vary from security to security and is affected by a wide variety of factors, including, for example, the type of security, whether the security is new and not yet established in the marketplace, the liquidity of markets, and other characteristics particular to the security. To the extent that valuation is based on models or inputs that are less observable or unobservable in the market, the determination of fair value requires more judgment. Accordingly, the degree of judgment exercised in determining fair value is greatest for instruments categorized in Level 3.
The inputs used to measure fair value may fall into different levels of the fair value hierarchy. In such cases, for disclosure purposes, the level in the fair value hierarchy within which the fair value measurement falls in its entirety, is determined based on the lowest level input that is significant to the fair value measurement in its entirety.
The inputs or methodology used for valuing securities are not necessarily an indication of the risk associated with investing in those securities. The following is a summary of the inputs used to value the Company’s net assets as of December 31, 2017:
| ASSETS | LEVEL 1 QUOTED PRICES | LEVEL 2 OTHER SIGNIFICANT OBSERVABLE INPUTS | LEVEL 3 SIGNIFICANT UNOBSERVABLE INPUTS | |||||||||
| Common Stocks | ||||||||||||
| Advanced Materials | $ | — | $ | — | $ | 922,050 | ||||||
| Consumer Electronics | — | — | 11,650,500 | |||||||||
| Equipment Leasing | — | — | 44,810 | |||||||||
| Intellectual Property | — | — | 16,871 | |||||||||
| Networking | 16,185,476 | — | — | |||||||||
| Semiconductors | 2,088,000 | — | — | |||||||||
| Semiconductor Equipment | — | — | 29,908 | |||||||||
| Total Common Stocks | 18,273,476 | — | 12,664,139 | |||||||||
| Preferred Stocks | ||||||||||||
| Advanced Materials | — | — | 19,526,941 | |||||||||
| Aerospace | — | — | 608,114 | |||||||||
| Automotive | — | — | 10,686,932 | |||||||||
| Cloud Computing | — | — | 8,561,704 | |||||||||
| Consumer Electronics | — | — | 937,137 | |||||||||
| Equipment Leasing | — | — | 3,975,200 | |||||||||
| Intellectual Property | — | — | 6,059,741 | |||||||||
| Medical Devices | — | — | 11,479,677 | |||||||||
| Mobile Computing | — | — | 12,018,563 | |||||||||
| Semiconductor Equipment | — | — | 40,067,044 | |||||||||
| Total Preferred Stocks | — | — | 113,921,053 | |||||||||
62
Firsthand Technology Value Fund, Inc.
Notes to Financial Statements - continued
DECEMBER 31, 2017
| ASSETS | LEVEL 1 QUOTED PRICES | LEVEL 2 OTHER SIGNIFICANT OBSERVABLE INPUTS | LEVEL 3 SIGNIFICANT UNOBSERVABLE INPUTS | |||||||||
| Asset Derivatives * | ||||||||||||
| Equity Contracts | $ | — | $ | — | $ | 12,029,324 | ||||||
| Total Asset Derivatives | — | — | 12,029,324 | |||||||||
| Convertible Notes | ||||||||||||
| Advanced Materials | — | — | 2,745,485 | |||||||||
| Consumer Electronics | — | — | 2,000,673 | |||||||||
| Medical Devices | — | — | 9,500,000 | |||||||||
| Semiconductor Equipment | — | — | 2,000,000 | |||||||||
| Total Convertible Notes | — | — | 16,246,158 | |||||||||
| Mutual Funds | 1,705,375 | — | — | |||||||||
| Total | $ | 19,978,851 | $ | — | $ | 154,860,674 | ||||||
| * | Asset derivatives include warrants. |
At the end of each calendar quarter, management evaluates the Level 2 and Level 3 assets and liabilities for changes in liquidity, including but not limited to: whether a broker is willing to execute at the quoted price, the depth and consistency of prices from third party services, and the existence of contemporaneous, observable trades in the market. Additionally, management evaluates the Level 1 and Level 2 assets and liabilities on a quarterly basis for changes in listings or delistings on national exchanges. Transfers in and out of the levels are recognized at the value at the end of the period. There were no transfers between Levels 1 and 2 as of December 31, 2017.
The following is a summary of the inputs used to value the Company’s net assets as of December 31, 2016:
| ASSETS | LEVEL 1 QUOTED PRICES | LEVEL
2 OTHER SIGNIFICANT OBSERVABLE INPUTS | LEVEL
3 SIGNIFICANT UNOBSERVABLE INPUTS | |||||||||
| Common Stocks | ||||||||||||
| Advanced Materials | $ | — | $ | — | $ | 394,200 | ||||||
| Computer Storage | 158,340 | — | — | |||||||||
| Consumer Electronics | — | — | 3,037,441 | |||||||||
| Equipment Leasing | — | — | 44,430 | |||||||||
| Intellectual Property | — | — | 14,750 | |||||||||
| Networking | — | — | 10,990,390 | |||||||||
| Other Electronics | 1,401,200 | — | — | |||||||||
| Renewable Energy | 3,583,294 | — | — | |||||||||
| Semiconductor Equipment | — | — | 7,524 | |||||||||
| Semiconductors | 375,300 | — | — | |||||||||
| Software | — | — | 245,466 | |||||||||
| Total Common Stocks | 5,518,134 | — | 14,734,201 | |||||||||
63
Firsthand Technology Value Fund, Inc.
Notes to Financial Statements - continued
DECEMBER 31, 2017
| ASSETS | LEVEL 1 QUOTED PRICES | LEVEL 2 OTHER SIGNIFICANT OBSERVABLE INPUTS |
LEVEL 3 SIGNIFICANT UNOBSERVABLE INPUTS |
|||||||
| Preferred Stocks | ||||||||||
| Advanced Materials | $ | — | $ | — | $ | 12,724,961 | ||||
| Advertising Technology | — | — | 9,757,918 | |||||||
| Aerospace | — | — | 445,456 | |||||||
| Automotive | — | — | 10,410,045 | |||||||
| Cloud Computing | — | — | 8,550,361 | |||||||
| Consumer Electronics | — | — | 3,752,749 | |||||||
| Equipment Leasing | — | — | 3,975,600 | |||||||
| Intellectual Property | — | — | 6,137,917 | |||||||
| Medical Devices | — | — | 24,511,642 | |||||||
| Mobile Computing | — | — | 7,365,796 | |||||||
| Semiconductor Equipment | — | — | 21,883,997 | |||||||
| Total Preferred Stocks | — | — | 109,516,442 | |||||||
| Asset Derivatives * | ||||||||||
| Equity Contracts | — | — | 5,420,042 | |||||||
| Total Asset Derivatives | — | — | 5,420,042 | |||||||
| Convertible Notes | ||||||||||
| Advertising Technology | — | — | 559,360 | |||||||
| Aerospace | — | — | 71,208 | |||||||
| Consumer Electronics | — | — | 2,913,612 | |||||||
| Medical Devices | — | — | 4,000,000 | |||||||
| Water Purification | — | — | 50,000 | |||||||
| Total Convertible Notes | — | — | 7,594,180 | |||||||
| Exchange-Traded Funds | 4,747,850 | — | — | |||||||
| Total | $ | 10,265,984 | $ | — | $ | 137,264,865 | ||||
| * | Asset derivatives include warrants. |
At the end of each calendar quarter, management evaluates the Level 2 and Level 3 assets and liabilities for changes in liquidity, including but not limited to: whether a broker is willing to execute at the quoted price, the depth and consistency of prices from third party services, and the existence of contemporaneous, observable trades in the market. Additionally, management evaluates the Level 1 and Level 2 assets and liabilities on a quarterly basis for changes in listings or delistings on national exchanges. Transfers in and out of the levels are recognized at the value at the end of the period. There were [no transfers] between Levels 1 and 2 as of December 31, 2016.
Following is a reconciliation of Level 3 assets (at either the beginning or the ending of the period) for which significant unobservable inputs were used to determine fair value.
64
Firsthand Technology Value Fund, Inc.
Notes to Financial Statements - continued
DECEMBER 31, 2017
INVESTMENTS AT FAIR VALUE USING SIGNIFICANT UNOBSERVABLE INPUTS (LEVEL 3) | BALANCE AS OF 12/31/16 | NET PURCHASES/ CONVERSION | NET SALES/ CONVERSION | NET REALIZED GAINS /(LOSSES) | NET UNREALIZED APPRECIATION (DEPRECIATION) (1) | TRANSFERS IN (OUT)OF LEVEL 3 | BALANCE AS OF 12/31/17 | |||||||||||||||||||||
| Common Stocks | ||||||||||||||||||||||||||||
| Advanced Materials | $ | 394,200 | $ | — | $ | — | $ | — | $ | 527,850 | $ | — | $ | 922,050 | ||||||||||||||
| Consumer Electronics | 3,037,441 | — | — | — | 8,613,059 | — | 11,650,500 | |||||||||||||||||||||
| Equipment Leasing | 44,430 | — | — | — | 380 | — | 44,810 | |||||||||||||||||||||
| Intellectual Property | 14,750 | — | — | — | 2,121 | — | 16,871 | |||||||||||||||||||||
| Networking | 10,990,390 | — | — | — | (696,095 | ) | (10,294,295 | ) | — | |||||||||||||||||||
| Semiconductor Equipment | 7,524 | — | — | — | 22,384 | — | 29,908 | |||||||||||||||||||||
| Software | 245,466 | — | (315,561 | ) | (264,439 | ) | 334,534 | — | — | |||||||||||||||||||
| Preferred Stocks | ||||||||||||||||||||||||||||
| Advanced Materials | 12,724,961 | — | — | — | 6,801,980 | — | 19,526,941 | |||||||||||||||||||||
| Advertising Technology | 9,757,918 | — | (12,355,330 | ) | 1,015,419 | 1,581,993 | — | — | ||||||||||||||||||||
| Aerospace | 445,456 | 1,587,102 | — | — | (1,424,444 | ) | — | 608,114 | ||||||||||||||||||||
| Automotive | 10,410,045 | 1,029,175 | (529,180 | ) | — | (223,108 | ) | — | 10,686,932 | |||||||||||||||||||
| Cloud Computing | 8,550,361 | — | — | — | 11,343 | — | 8,561,704 | |||||||||||||||||||||
| Consumer Electronics | 3,752,749 | — | — | — | (2,815,612 | ) | — | 937,137 | ||||||||||||||||||||
| Equipment Leasing | 3,975,600 | — | — | — | (400 | ) | — | 3,975,200 | ||||||||||||||||||||
| Intellectual Property | 6,137,917 | — | (1,112,885 | ) | — | 1,034,709 | — | 6,059,741 | ||||||||||||||||||||
| Medical Devices | 24,511,642 | — | — | — | (13,031,965 | ) | — | 11,479,677 | ||||||||||||||||||||
| Mobile Computing | 7,365,796 | — | — | — | 4,652,767 | — | 12,018,563 | |||||||||||||||||||||
| Semiconductor Equipment | 21,883,997 | 12,284,175 | (6,734,146 | ) | 5,084,145 | 7,548,873 | — | 40,067,044 | ||||||||||||||||||||
65
Firsthand Technology Value Fund, Inc.
Notes to Financial Statements - continued
DECEMBER 31, 2017
| INVESTMENTS AT FAIR VALUE USING SIGNIFICANT UNOBSERVABLE INPUTS (LEVEL 3) | BALANCE AS OF 12/31/16 | NET PURCHASES/ CONVERSION | NET SALES/ CONVERSION | NET REALIZED GAINS /(LOSSES) | NET UNREALIZED APPRECIATION (DEPRECIATION) (1) | TRANSFERS IN (OUT) OF LEVEL 3 | BALANCE AS OF 12/31/17 | |||||||||||||||||||||
| Asset Derivatives | ||||||||||||||||||||||||||||
| Equity Contracts | $ | 5,420,042 | $ | — | $ | — | $ | — | $ | 6,609,282 | $ | — | $ | 12,029,324 | ||||||||||||||
| Convertible Notes | ||||||||||||||||||||||||||||
| Advanced Materials | — | 4,595,485 | (1,850,000 | ) | — | — | — | 2,745,485 | ||||||||||||||||||||
| Advertising Technology | 559,360 | — | (1,118,720 | ) | 559,360 | — | — | — | ||||||||||||||||||||
| Aerospace | 71,208 | 405,000 | (476,208 | ) | — | — | — | — | ||||||||||||||||||||
| Automotive | — | 200,000 | (200,000 | ) | — | — | — | — | ||||||||||||||||||||
| Consumer Electronics | 2,913,612 | 2,550,000 | (1,500,000 | ) | — | (1,962,939 | ) | — | 2,000,673 | |||||||||||||||||||
| Medical Devices | 4,000,000 | 5,500,000 | — | — | — | — | 9,500,000 | |||||||||||||||||||||
| Semiconductor Equipment | — | 2,000,000 | — | — | — | — | 2,000,000 | |||||||||||||||||||||
| Water Purification | 50,000 | — | — | — | (50,000 | ) | — | — | ||||||||||||||||||||
| Total | $ | 137,264,865 | $ | 30,150,937 | $ | (26,192,030 | ) | $ | 6,394,485 | $ | 17,536,712 | $ | (10,294,295 | ) | $ | 154,860,674 | ||||||||||||
| (1) | The net change in unrealized depreciation from Level 3 instruments held as of December 31, 2017, was $17,425,619. |
Following is a reconciliation of Level 3 assets (at either the beginning or the ending of the period) for which significant unobservable inputs were used to determine fair value.
| INVESTMENTS AT FAIR VALUE USING SIGNIFICANT UNOBSERVABLE INPUTS (LEVEL 3) | BALANCE AS OF 12/31/15 | NET PURCHASES/ CONVERSION | NET SALES/ CONVERSION | NET REALIZED GAINS /(LOSSES) | NET UNREALIZED APPRECIATION (DEPRECIATION) (1) | TRANSFERS IN (OUT) OF LEVEL 3 | BALANCE AS OF 12/31/16 | |||||||||||||||||||||
| Common Stocks | ||||||||||||||||||||||||||||
| Advanced Materials | $ | 203,901 | $ | — | $ | — | $ | — | $ | 190,299 | $ | — | $ | 394,200 | ||||||||||||||
| Computer Storage | 185,283 | — | — | — | 150,717 | (336,000 | ) | — | ||||||||||||||||||||
| Consumer Electronics | 6,171,863 | 1,000,000 | — | — | (4,134,422 | ) | — | 3,037,441 | ||||||||||||||||||||
| Equipment Leasing | — | 20,000 | — | — | 24,430 | — | 44,430 | |||||||||||||||||||||
| Intellectual Property | — | — | — | — | 14,750 | — | 14,750 | |||||||||||||||||||||
| Internet | 333,317 | — | (689,999 | ) | (8,426,224 | ) | 8,782,906 | — | — | |||||||||||||||||||
| Networking | 4,772,712 | 5,176,125 | — | — | 1,041,553 | — | 10,990,390 | |||||||||||||||||||||
| Renewable Energy | 7,148,368 | 13,775 | — | — | (7,162,143 | ) | — | — | ||||||||||||||||||||
| Semiconductor Equipment | — | 1,000 | — | — | 6,524 | — | 7,524 | |||||||||||||||||||||
| Software | 557,216 | — | — | — | (311,750 | ) | — | 245,466 | ||||||||||||||||||||
66
Firsthand Technology Value Fund, Inc.
Notes to Financial Statements - continued
DECEMBER 31, 2017
| INVESTMENTS AT FAIR VALUE USING SIGNIFICANT UNOBSERVABLE INPUTS (LEVEL 3) | BALANCE AS OF 12/31/15 | NET PURCHASES/ CONVERSION | NET SALES/ CONVERSION | NET REALIZED GAINS /(LOSSES) | NET UNREALIZED APPRECIATION (DEPRECIATION) (1) | TRANSFERS IN (OUT) OF LEVEL 3 | BALANCE AS OF 12/31/16 | |||||||||||||||||||||
| Preferred Stocks | ||||||||||||||||||||||||||||
| Advanced Materials | $ | 14,000,240 | $ | 7,500,000 | $ | — | $ | — | $ | (8,775,279 | ) | $ | — | $ | 12,724,961 | |||||||||||||
| Advertising Technology | 24,708,708 | 4,346,304 | (40,091,196 | ) | 11,784,839 | 9,009,263 | — | 9,757,918 | ||||||||||||||||||||
| Aerospace | 2,000,000 | — | — | — | (1,554,544 | ) | — | 445,456 | ||||||||||||||||||||
| Automotive | 12,928,943 | 4,779,956 | (4,779,956 | ) | 864,024 | (3,382,922 | ) | — | 10,410,045 | |||||||||||||||||||
| Cloud Computing | 9,999,998 | 2,705,790 | (2,264,990 | ) | (379,810 | ) | (1,510,627 | ) | — | 8,550,361 | ||||||||||||||||||
| Consumer Electronics | 7,438,704 | 750,000 | (5 | ) | (2,124,069 | ) | (2,311,881 | ) | — | 3,752,749 | ||||||||||||||||||
| Equipment Leasing | — | 4,000,000 | — | — | (24,400 | ) | — | 3,975,600 | ||||||||||||||||||||
| Intellectual Property | — | 12,251,478 | (2,670,500 | ) | (3,538,500 | ) | 95,439 | — | 6,137,917 | |||||||||||||||||||
| Medical Devices | 22,655,879 | — | — | — | 1,855,763 | — | 24,511,642 | |||||||||||||||||||||
| Mobile Computing | 7,110,747 | — | — | — | 255,049 | — | 7,365,796 | |||||||||||||||||||||
| Semiconductor Equipment | 23,370,825 | 6,175,801 | — | — | (7,662,629 | ) | — | 21,883,997 | ||||||||||||||||||||
| Asset Derivatives | ||||||||||||||||||||||||||||
| Equity Contracts | 642,600 | — | — | — | 4,777,442 | — | 5,420,042 | |||||||||||||||||||||
| Convertible Notes | ||||||||||||||||||||||||||||
| Advertising Technology | — | 2,321,564 | — | — | (1,762,204 | ) | — | 559,360 | ||||||||||||||||||||
| Aerospace | — | 80,500 | (8,792 | ) | — | (500 | ) | — | 71,208 | |||||||||||||||||||
| Consumer Electronics | 2,000,000 | 3,560,000 | (5 | ) | (99,995 | ) | (2,546,388 | ) | — | 2,913,612 | ||||||||||||||||||
| Intellectual Property | 3,630,383 | — | (5,250,000 | ) | (360,753 | ) | 1,980,370 | — | — | |||||||||||||||||||
| Medical Devices | 4,000,000 | — | — | — | — | — | 4,000,000 | |||||||||||||||||||||
| Semiconductor Equipment | — | 2,940,462 | (1,381,102 | ) | — | (1,559,360 | ) | — | — | |||||||||||||||||||
| Water Purification | — | 50,000 | — | — | — | — | 50,000 | |||||||||||||||||||||
| Total | $ | 153,859,687 | $ | 57,672,755 | $ | (57,136,545 | ) | $ | (2,280,488 | ) | $ | (14,514,544 | ) | $ | (336,000 | ) | $ | 137,264,865 | ||||||||||
| (1) | The net change in unrealized appreciation from Level 3 instruments held as of December 31, 2016, was $(22,130,823). |
67
Firsthand Technology Value Fund, Inc.
Notes to Financial Statements - continued
DECEMBER 31, 2017
The below chart represents quantitative disclosure about significant unobservable inputs for Level 3 fair value measurements:
| FAIR VALUE AT 12/31/17 | VALUATION TECHNIQUES | UNOBSERVABLE INPUTS | RANGE (WEIGHTED AVG.) | |||||||
| Direct venture capital investments: Advanced Materials | $ | 24.3 | M | Market Comparable Companies Prior Transaction Analysis Probability-Weighted Expected Return Option Pricing Model | EBITDA Multiple Years to Maturity Volatility Risk-Free Rate Going Concern Probability Discount for Lack of Marketability | 9.7x - 10.7x (10.1x) 5 years (5 years) 50.0% (50%) 2.20% (2.20%) 90% - 100% (90%) 22.7% (22.7%) | ||||
| Direct venture capital investments: Aerospace | $ | 2.1 | M | Prior Transaction Analysis Option Pricing Model | Years to Maturity Volatility Risk-Free Rate | 5 years (5 years) 60.0% (60.0%) 2.20% (2.20%) | ||||
| Direct venture capital investments: Automotive | $ | 10.7 | M | Prior Transaction Analysis Option Pricing Model | Years to Maturity Volatility Risk-Free Rate | 3 years (3 years) 55.0% (55.0%) 1.98% (1.98%) | ||||
| Direct venture capital investments: Cloud Computing | $ | 8.6 | M | Market Comparable Companies Option Pricing Model | Revenue Multiple Years to Maturity Volatility Risk-Free Rate | 1.8x - 2.2x (2.0x) 2 years (2 years) 40.0% (40.0%) 1.89% (1.89%) | ||||
| Direct venture capital investments: Consumer Electronics | $ | 14.6 | M | Market Comparable Companies Probability-Weighted Expected Return Invested Capital(Cost) Option Pricing Model | Revenue Mulitple Going Concern Probability Years to Maturity Volatility Risk-Free Rate Discount for Lack of Marketability | 0.9x - 1.8x (1.4x) 30% - 100% (64%) 1 year - 5 years (3.0 years) 60.0% - 70.0% (65.1%) 1.75% - 2.2% (1.97%) 0.0% - 10.0% (8.0%) | ||||
| Direct venture capital investments: Equipment Leasing | $ | 4.0 | M | Prior Transaction Analysis Option Pricing Model | Years to Maturity Volatility Risk-Free Rate | 5 years (5 years) 50.0% (50.0%) 2.2% (2.2%) | ||||
| Direct venture capital investments: Intellectual Property | $ | 6.1 | M | Prior Transaction Analysis Option Pricing Model | Years to Maturity Volatility Risk-Free Rate Discount for Lack of Marketability Adjustment for Market Movement | 5 years (5 years) 55% (55%) 2.2% (2.2%) 24.3% (24.3%) (-21.2%) | ||||
68
Firsthand Technology Value Fund, Inc.
Notes to Financial Statements - continued
DECEMBER 31, 2017
| Continued | FAIR VALUE AT 12/31/17 | VALUATION TECHNIQUES | UNOBSERVABLE INPUTS | RANGE (WEIGHTED AVG.) | ||||||
| Direct venture capital investments: Medical Devices | $ | 21.0 | M | Market Comparable Companies Option Pricing Model | Revenue Multiple Years to Maturity Volatility Risk-Free Rate | 2.6x - 3.0x (2.8x) 4 years (4 years) 50.0% (50.0%) 2.09% (2.09%) | ||||
| Direct venture capital investments: Mobile Computing | $ | 12.0 | M | Prior Transaction Analysis Probability-Weighted Expected Return Option Pricing Model | Years to Maturity Volatility Risk-Free Rate Transaction Completion Probability | 2 years (2 years) 60.0% (60.0%) 1.89% (1.89%) 50.0% (50.0%) | ||||
| Direct venture capital investments: Semiconductor Equipment | $ | 51.5 | M | Market Comparable Companies Prior Transaction Analysis Option Pricing Model | Revenue Multiple Years to Maturity Volatility Risk-Free Rate Discount for Lack of Marketability | 2.9x - 3.4x (3.2x) 2 years - 5 years (3.0 years) 40.0% - 60.0% (52.5%) 1.89% - 2.20% (1.99%) 0.0% - 15.5% (2.8%) | ||||
The below chart represents quantitative disclosure about significant unobservable inputs for Level 3 fair value measurements for 2016:
FAIR VALUE AT 12/31/16 | VALUATION TECHNIQUES | UNOBSERVABLE INPUTS | RANGE (WEIGHTED AVG.) | |||||||||
| Direct venture capital investments: Advanced Materials | $13.5M | Market Comparable Companies Prior Transaction Analysis Option Pricing Model | Revenue Multiple Years to Expiration Volatility Risk-Free Rate Discount for Lack of Marketability | 0.6x 5 years 55.0% 1.93% 31.90% | ||||||||
| Direct venture capital investments: Advertising Technology | $10.3M | Market Comparable Companies Option Pricing Model | Revenue Multiple Years to Expiration Volatility Risk-Free Rate | 0.3x 2 years 55.0% 1.20% | ||||||||
| Direct venture capital investments: Aerospace | $0.5M | Prior Transaction Analysis Probability-Weighted Expected Return Option Pricing Model | Going Concern Probability Years to Expiration Volatility Risk-Free Rate Discount for Lack of Marketability | 30% 5 years 60.0% 1.93% 25.8% | ||||||||
| Direct venture capital investments: Automotive | $10.4M | Prior Transaction Analysis Option Pricing Model | Years to Expiration Volatility Risk-Free Rate | 3 years 55.0% 1.47% | ||||||||
69
Firsthand Technology Value Fund, Inc.
Notes to Financial Statements - continued
DECEMBER 31, 2017
| continued | FAIR VALUE AT 12/31/16 |
VALUATION TECHNIQUES | UNOBSERVABLE INPUTS | RANGE (WEIGHTED AVG.) | |||
| Direct venture capital | $8.6M | Market Comparable | Revenue Multiple | 1.3x - 1.5x | |||
| investments: Cloud | Companies | Years to Expiration | 2 years | ||||
| Computing | Prior Transaction | Volatility | 40.0% | ||||
| Analysis | Risk-Free Rate | 1.2% | |||||
| Option Pricing Model | |||||||
| Direct venture capital | $9.7M | Market Comparable | Revenue Mulitple | 0.9x | |||
| investments: Consumer Electronics | Companies | IPO Exit Probability | 75% | ||||
| Prior Transaction | Merger & Acquisition Probability | 25% | |||||
| Analysis | Going Concern Probability | 60% - 100% | |||||
| Probability-Weighted | Years to Expiration | 1 year - 5 years | |||||
| Expected Return | Volatility | 50.0% - 70.0% | |||||
| Invested Capital(Cost) | Risk-Free Rate | 0.85% - 1.93% | |||||
| Option Pricing Model | Discount for Lack of Marketability | 0.0% - 31.9% | |||||
| Direct venture capital | $4.0M | Prior Transaction | Years to Expiration | 5 years | |||
| investments: Equipment | Analysis | Volatility | 50.0% | ||||
| Leasing | Risk-Free Rate | 1.93% | |||||
| Direct venture capital | $6.2M | Prior Transaction | Years to Expiration | 5 years | |||
| investments: Intellectual | Analysis | Volatility | 55% | ||||
| Property | Option Pricing Model | Risk-Free Rate | 1.93% | ||||
| Discount for Lack of Marketability | 31.9% | ||||||
| Adjustment for Market Movement | (19.8%) | ||||||
| Direct venture capital | $28.5M | Market Comparable | Revenue Multiple | 2.7x - 3.1x | |||
| investments: Medical | Companies | Years to Expiration | 4 years | ||||
| Devices | Prior Transaction | Volatility | 50.0% | ||||
| Analysis | Risk-Free Rate | 1.70% | |||||
| Option Pricing Model | |||||||
| Direct venture capital | $7.4M | Prior Transaction | Years to Expiration | 2 years | |||
| investments: Mobile | Analysis | Volatility | 60.0% | ||||
| Computing | Option Pricing Model | Risk-Free Rate | 1.20% | ||||
| Direct venture capital | $11.0M | Prior Transaction | Discount for Lack of Marketability | 10% | |||
| investments: Networking | Analysis | ||||||
| Direct venture capital | $26.9M | Prior Transaction | Years to Expiration | 2 years - 5 years | |||
| investments: Semiconductor | Analysis | Volatility | 50.0 - 55.0% | ||||
| Equipment | Option Pricing Model | Risk-Free Rate | 1.20% - 1.93% | ||||
| Discount for Lack of Marketability | 0.0% - 20.80% | ||||||
70
Firsthand Technology Value Fund, Inc.
Notes to Financial Statements - continued
DECEMBER 31, 2017
| continued | FAIR VALUE AT 12/31/16 | VALUATION TECHNIQUES | UNOBSERVABLE INPUTS | RANGE (WEIGHTED AVG.) | |||
| Direct venture capital | $0.2M | Prior Transaction | Years to Expiration | 1 year | |||
| investments: Software | Analysis | Volatility | 55.0% | ||||
| Option Pricing Model | Risk-Free Rate | 0.85% | |||||
| Direct venture capital | $0.1M | Prior Transaction | Years to Expiration | 5 years | |||
| investments: Water | Analysis | Volatility | 40.0% | ||||
| Purification | Option Pricing Model | Risk-Free Rate | 1.93% |
NOTE 7. FEDERAL INCOME TAXES
The Company has elected, and intends to qualify annually, for the special tax treatment afforded regulated investment companies under the Internal Revenue Code of 1986, as amended (the “Code”). As provided in the Code, in any fiscal year in which a BDC so qualifies and distributes at least 90% of its taxable net income, the BDC (but not the shareholders) will be relieved of federal income tax on the income distributed. Accordingly, no provision for income taxes has been made. To avoid imposition of the excise tax applicable to regulated investment companies, the Company intends to declare as dividends in each calendar year at least 98% of its net investment income (earned during the calendar year) and 98.2% of its net realized capital gains (earned during the 12 months ended October 31) plus undistributed amounts, if any, from prior years.
The reorganization described in Note 1 (the formation of FVI as a fully owned subsidiary for investment activities) was structured to avoid any adverse tax consequences for the Company and its shareholders. The Company’s engaging in investment activities through FVI does not, in our view, jeopardize the Company’s ability to continue to qualify as a RIC under the Code.
TAX TABLES
Reclassification of Capital Accounts
Permanent book and tax differences resulted in reclassifications for the year ended December 31, 2017 as follows:
| INCREASE (DECREASE) | |||||||||||||
| Paid-in-Capital | Accumulated Net Investment Income (Loss) | Accumulated Net Realized Gain (Loss) | |||||||||||
| Firsthand Technology Value Fund | $ | (2,827,302 | ) | $ | 2,827,301 | $ | 1 | ||||||
As of December 31, 2017, the Fund utilized capital loss carry forwards for federal income tax purposes in the amount of $958,645.
Permanent book and tax differences resulted in reclassifications for the year ended December 31, 2016 as follows:
| INCREASE (DECREASE) | ||||||||||||
| Paid-in-Capital | Accumulated Net Investment Income (Loss) | Accumulated Net | ||||||||||
| Realized Gain (Loss) | ||||||||||||
| Firsthand Technology Value Fund | $ | (3,835,503 | ) | $ | 3,835,503 | $ | — | |||||
71
Firsthand Technology Value Fund, Inc.
Notes to Financial Statements - continued
DECEMBER 31, 2017
As of December 31, 2016, the Fund had short-term and long-term capital loss carryforwards for federal income tax purposes in the amounts of $(211,156) and $(747,488), respectively, which do not expire.
As of December 31, 2016, the Fund utilized capital loss carry forwards for federal income tax purposes in the amount of $2,004,970.
Components of Distributable Earnings as of 12/31/17
| FIRSTHAND TECHNOLOGY VALUE FUND, INC. | ||||
| Net Unrealized Appreciation (Depreciation) | $ | (5,341,142 | ) | |
| Long-Term Capital Gains | 245,701 | |||
| Other Temporary Differences | (1,691,040 | ) | ||
| Total Distributable Earnings | $ | (6,786,481 | ) | |
As of December 31, 2017, the Fund paid $245,701 of long-term capital gains.
| FIRSTHAND TECHNOLOGY VALUE FUND, INC. | ||||
| Gross unrealized appreciation | $ | 44,878,772 | ||
| Gross unrealized depreciation | (50,219,914 | ) | ||
| Net unrealized depreciation | $ | (5,341,142 | ) | |
| Federal income tax cost, Investments | $ | 180,180,668 | ||
The Company is subject to tax provisions that establish a minimum threshold for recognizing, and a system for measuring, the benefits of a tax position taken or expected to be taken in a tax return. Taxable years ending 2014, 2015, and 2016 remain open to federal and state audit. As of December 31, 2017, management has evaluated the application of these provisions to the Company, and has determined that no provision for income tax is required in the Company’s financial statements for uncertain tax provisions.
Components of Distributable Earnings as of 12/31/16
| FIRSTHAND TECHNOLOGY VALUE FUND, INC. | ||||
| Net Unrealized Appreciation (Depreciation) | $ | (34,834,709 | ) | |
| Capital Loss Carryforwards | (958,644 | ) | ||
| Total Distributable Earnings | $ | (35,793,353 | ) | |
As of December 31, 2016, the Fund did not pay any long-term capital gains.
| FIRSTHAND TECHNOLOGY VALUE FUND, INC. | ||||
| Gross unrealized appreciation | $ | 13,265,628 | ||
| Gross unrealized depreciation | (48,100,337 | ) | ||
| Net unrealized depreciation | $ | (34,834,709 | ) | |
| Federal income tax cost, Investments | $ | 182,365,558 | ||
72
Firsthand Technology Value Fund, Inc.
Notes to Financial Statements - continued
DECEMBER 31, 2017
NOTE 8. INVESTMENT TRANSACTIONS
Investment transactions (excluding short-term investments) were as follows for the year ended December 31, 2017.
| PURCHASES AND SALES | ||||
| Purchases of investment securities | $ | 30,958,618 | ||
| Proceeds from sales and maturities of investment securities | $ | 34,282,019 | ||
NOTE 9. SHARE BUYBACKS
SHARE BUYBACKS. On April 26, 2016, the Board of Directors of the Fund approved a discretionary share repurchase plan (the “Plan”). Pursuant to the Plan, the Fund was authorized to purchase in the open market up to $2 million worth of its common stock. The Plan allowed the Fund to acquire its own shares at certain thresholds below its net asset value (NAV) per share, in accordance with the guidelines specified in Rule 10b-18 of the Securities Act of 1934, as amended. The intent of the Plan was to increase NAV per share and thereby enhance shareholder value. The Fund completed the repurchase plan in September 2016, having repurchased and retired a total of 272,008 shares of stock, at a total cost of approximately $2 million.
On November 10, 2017, the Board of Directors of the Fund approved a discretionary share purchase plan (the “Plan”). Pursuant to the Plan, the Fund was authorized to purchase in the open market up to $2 million worth of its common stock. The Plan allowed the Fund to acquire its own shares in accordance with the guidelines specified in Rule 10b-18 of the Securities Act of 1934, as amended. The intent of the Plan was to increase NAV per share and thereby enhance shareholder value. As of December 31, 2017, the Fund had repurchased and retired 128,551 shares of stock at a total cost of approximately $1.1 million. The Fund had 7,302,146 shares outstanding as of December 31, 2017.
TENDER OFFER. In connection with our agreement with a shareholder, we agreed to commence an issuer tender offer for up to $20 million of our shares of common stock at a purchase price per share equal to 95% of the Fund’s net asset value per share (“NAV”) as of the close of ordinary trading on the NASDAQ Global Market on December 31, 2014 (the “Offer”). On December 22, 2014, the Fund commenced a tender offer to purchase up to $20 million of its issued and outstanding common shares for cash at a price per share equal to 95% of the NAV determined on December 31, 2014 ($23.2702 per share). The tender offer, which expired on January 22, 2015 at 12:00 midnight, New York City time, was oversubscribed. Because the number of shares tendered exceeded the maximum amount of its offer, the Fund purchased shares from tendering shareholders on a pro-rata basis based on the number of shares properly tendered. Of the 5,044,728 shares properly tendered, the Fund purchased 859,468 shares of common stock pursuant to the tender offer.
NOTE 10. INVESTMENTS IN AFFILIATES AND CONTROLLED INVESTMENTS
Under the 1940 Act, the Company is required to identify investments where it owns greater than 5% (but less than 25%) of the portfolio company’s outstanding voting shares as an affiliate of the Company. Also, under the 1940 Act, the Company is required to identify investments where it owns greater than 25% of the portfolio company’s outstanding voting shares as a controlled investment of the Company. A summary of the Company’s investments in affiliates and controlled investments for the period from December 31, 2016, through December 31, 2017, is noted below:
73
Firsthand Technology Value Fund, Inc.
Notes to Financial Statements - continued
DECEMBER 31, 2017
| AFFILIATE/CONTROLLED INVESTMENT* | VALUE AT 12/31/16 | PURCHASES/ MERGER | INTEREST | SALES/ MATURITY/ EXPIRATION | REALIZED GAIN (LOSS) | CHANGE IN APPRECIATION/ (DEPRECIATION) | VALUE 12/31/17 | SHARES HELD AT 12/31/17 | ||||||||||||||||||||||||
| EQX, Inc. Common Stock* | $ | 44,430 | $ | - | $ | - | $ | - | $ | - | $ | 380 | $ | 44,810 | 100,000 | |||||||||||||||||
| EQX, Inc. Preferred Stock - Series A* | 3,975,600 | - | - | - | - | (400 | ) | 3,975,200 | 4,000,000 | |||||||||||||||||||||||
| Hera Systems, Inc.Term Note* | 41,208 | - | 70 | 41,208 | - | - | - | - | ||||||||||||||||||||||||
| Hera Systems, Inc. Series A Preferred* | 445,456 | - | - | - | - | (290,657 | ) | 154,799 | 3,642,324 | |||||||||||||||||||||||
| Hera Systems, Inc. Convertible Note* | 30,000 | - | 1,080 | 30,000 | - | - | - | - | ||||||||||||||||||||||||
| Hera Systems, Inc. Series B Preferred* | - | 1,587,102 | - | - | - | (1,133,787 | ) | 453,315 | 2,039,203 | |||||||||||||||||||||||
| Hera Systems, Inc. Series B Warrants* | - | - | - | - | - | 155,540 | 155,540 | 700,000 | ||||||||||||||||||||||||
| Hera Systems, Inc. Series B Warrants* | - | - | - | - | - | 1,380,956 | 1,380,956 | 6,214,922 | ||||||||||||||||||||||||
| IntraOp Medical Corp. Series C Preferred* | 24,511,642 | - | - | - | - | (13,031,965 | ) | 11,479,677 | 26,856,187 | |||||||||||||||||||||||
| IntraOp Medical Corp. Convertible Note* | 1,000,000 | - | 258,935 | - | - | - | 1,000,000 | 1,000,000 | ||||||||||||||||||||||||
| IntraOp Medical Corp. Convertible Note* | - | 1,000,000 | 88,356 | - | - | - | 1,000,000 | 1,000,000 | ||||||||||||||||||||||||
| IntraOp Medical Corp. Convertible Note* | - | 1,500,000 | 58,562 | - | - | - | 1,500,000 | 1,500,000 | ||||||||||||||||||||||||
| IntraOp Medical Corp. Convertible Note* | - | 1,000,000 | 70,685 | - | - | - | 1,000,000 | 1,000,000 | ||||||||||||||||||||||||
| IntraOp Medical Corp. Term Note* | 3,000,000 | - | 240,000 | - | - | - | 3,000,000 | 3,000,000 | ||||||||||||||||||||||||
| IntraOp Medical Corp. Term Note* | - | 2,000,000 | 142,466 | - | - | - | 2,000,000 | 2,000,000 | ||||||||||||||||||||||||
| Phunware, Inc., Preferred Stock Series E | 7,365,796 | - | - | - | - | 4,652,767 | 12,018,563 | 3,257,328 | ||||||||||||||||||||||||
74
Firsthand Technology Value Fund, Inc.
Notes to Financial Statements - continued
DECEMBER 31, 2017
| AFFILIATE/CONTROLLED INVESTMENT* | VALUE AT 12/31/16 | PURCHASES/ MERGER | INTEREST | SALES/ MATURITY/ EXPIRATION | REALIZED GAIN (LOSS) | CHANGE IN APPRECIATION/ (DEPRECIATION) | VALUE 12/31/17 | SHARES HELD AT 12/31/17 | ||||||||||||||||||||||||
| Pivotal Systems,Series A Preferred* | $ | 6,370,532 | $ | - | $ | - | $ | - | $ | - | $ | 2,083,082 | $ | 8,453,614 | 11,914,217 | |||||||||||||||||
| Pivotal Systems,Series B Preferred* | 6,985,982 | - | - | - | - | 2,284,326 | 9,270,308 | 13,065,236 | ||||||||||||||||||||||||
| Pivotal Systems,Series C Preferred* | 2,273,159 | - | - | - | - | 287,095 | 2,560,254 | 2,291,260 | ||||||||||||||||||||||||
| Pivotal Systems,Series D Preferred* | 4,060,924 | - | - | - | - | 948,796 | 5,009,720 | 6,237,978 | ||||||||||||||||||||||||
| Pivotal Systems,Series D Warrants* | 284,036 | - | - | - | - | 334,356 | 618,392 | 4,158,654 | ||||||||||||||||||||||||
| Pivotal Systems,Common Stocks Warrants -Class B* | 4,743,286 | - | - | - | - | 3,997,886 | 8,741,172 | 18,180,475 | ||||||||||||||||||||||||
| QMAT, Preferred Stock Series A* | 10,724,961 | - | - | - | - | 6,669,380 | 17,394,341 | 16,000,240 | ||||||||||||||||||||||||
| QMAT, Preferred Stock Series B* | 2,000,000 | - | - | - | - | 132,600 | 2,132,600 | 2,000,000 | ||||||||||||||||||||||||
| QMAT, Series A Warrant* | 376,400 | - | - | - | - | 710,200 | 1,086,600 | 2,000,000 | ||||||||||||||||||||||||
| QMAT, Convertible Note* | - | 2,745,485 | 1,805 | - | - | - | 2,745,485 | 2,745,485 | ||||||||||||||||||||||||
| Revasum, Term Note* | - | 1,000,000 | 41,667 | - | - | - | 1,000,000 | 1,000,000 | ||||||||||||||||||||||||
| Revasum, Common Stock* | 7,524 | - | - | - | - | 22,384 | 29,908 | 10,000 | ||||||||||||||||||||||||
| Revasum, Preferred Stock - Series Seed* | 2,193,400 | 6,734,145 | - | 6,734,145 | 5,084,145 | 1,689,215 | 8,966,760 | 2,200,000 | ||||||||||||||||||||||||
| Revasum, Preferred Stock Series A* | - | 1,999,996 | - | - | - | 256,359 | 2,256,355 | 441,998 | ||||||||||||||||||||||||
| Revasum, Preferred Stock Series B* | - | 2,550,033 | - | - | - | - | 2,550,033 | 313,719 | ||||||||||||||||||||||||
| Silicon Genesis Corp., Common * | 14,750 | - | - | - | - | 2,121 | 16,871 | 921,892 | ||||||||||||||||||||||||
| Silicon Genesis Corp., Common Warrants* | 319 | - | - | - | - | 38 | 357 | 37,982 | ||||||||||||||||||||||||
| Silicon Genesis Corp., Common Warrants* | 10,000 | - | - | - | - | 1,000 | 11,000 | 5,000,000 | ||||||||||||||||||||||||
75
Firsthand Technology Value Fund, Inc.
Notes to Financial Statements - continued
DECEMBER 31, 2017
| AFFILIATE/CONTROLLED INVESTMENT* | VALUE AT 12/31/16 | PURCHASES/ MERGER | INTEREST | SALES/ MATURITY/ EXPIRATION | REALIZED GAIN (LOSS) | CHANGE IN APPRECIATION/ (DEPRECIATION) | VALUE 12/31/17 | SHARES HELD AT 12/31/17 | ||||||||||||||||||||||||
| Silicon Genesis Corp., Common Warrants* | $ | 6,000 | $ | - | $ | - | $ | - | $ | - | $ | 600 | $ | 6,600 | 3,000,000 | |||||||||||||||||
| Silicon Genesis Corp., Series 1-C Preferred* | 70,444 | - | - | - | - | 3,814 | 74,258 | 82,914 | ||||||||||||||||||||||||
| Silicon Genesis Corp., Series 1-D Preferred* | 195,606 | - | - | - | - | 10,040 | 205,646 | 850,830 | ||||||||||||||||||||||||
| Silicon Genesis Corp., Series 1-E Preferred* | 2,134,616 | - | - | 486,730 | - | 415,424 | 2,063,310 | 5,704,480 | ||||||||||||||||||||||||
| Silicon Genesis Corp., Series 1-F Preferred* | 464,165 | - | - | 107,386 | - | 99,539 | 456,318 | 912,453 | ||||||||||||||||||||||||
| Silicon Genesis Corp., Series 1-G Preferred* | 3,032,848 | - | - | 459,073 | - | 449,883 | 3,023,658 | 48,370,793 | ||||||||||||||||||||||||
| Silicon Genesis Corp., Series 1-H Preferred* | 240,238 | - | - | 53,499 | - | 49,812 | 236,551 | 837,942 | ||||||||||||||||||||||||
| SVXR, Inc.Preferred Stock - Series A | - | 1,000,000 | - | - | - | - | 1,000,000 | 2,013,491 | ||||||||||||||||||||||||
| SVXR, Inc., Convertible Note* | - | 1,000,000 | 3,014 | - | - | - | 1,000,000 | 1,000,000 | ||||||||||||||||||||||||
| Telepathy Investors, Inc. Convertible Note* | 1,109,340 | - | 237,933 | - | - | (807,200 | ) | 302,140 | 2,000,000 | |||||||||||||||||||||||
| Telepathy Investors, Inc. Convertible Note* | 83,201 | - | 15,797 | - | - | (60,540 | ) | 22,661 | 150,000 | |||||||||||||||||||||||
| Telepathy Investors, Inc. Convertible Note* | 277,335 | - | 50,260 | - | - | (201,800 | ) | 75,535 | 500,000 | |||||||||||||||||||||||
| Telepathy Investors, Inc. Convertible Note* | 166,401 | - | 32,777 | - | - | (121,080 | ) | 45,321 | 300,000 | |||||||||||||||||||||||
| Telepathy Investors, Inc. Convertible Note* | - | 300,000 | 20,250 | - | - | (254,679 | ) | 45,321 | 300,000 | |||||||||||||||||||||||
76
Firsthand Technology Value Fund, Inc.
Notes to Financial Statements - continued
DECEMBER 31, 2017
| AFFILIATE/CONTROLLED INVESTMENT* | VALUE AT 12/31/16 | PURCHASES/ MERGER | INTEREST | SALES/ MATURITY/ EXPIRATION | REALIZED GAIN (LOSS) | CHANGE IN APPRECIATION/ (DEPRECIATION) | VALUE 12/31/17 | SHARES HELD AT 12/31/17 | ||||||||||||||||||||||||
| Telepathy Investors,Inc. Convertible Note* | $ | 277,335 | $ | — | $ | 53,507 | $ | — | $ | — | $ | (201,800 | ) | $ | 75,535 | 500,000 | ||||||||||||||||
| Telepathy Investors, Inc. Series A Preferred* | 2,096,749 | — | — | — | — | (1,159,612 | ) | 937,137 | 15,238,000 | |||||||||||||||||||||||
| UCT Coatings, Inc. Common Stock | 394,200 | — | — | — | — | 527,850 | 922,050 | 1,500,000 | ||||||||||||||||||||||||
| UCT Coatings, Inc. Common Stock Warrants | 1 | — | — | — | — | 3 | 4 | 2,283 | ||||||||||||||||||||||||
| Vufine, Inc., Series A Preferred Stock* | 1,656,000 | — | — | — | — | (1,656,000 | ) | — | 22,500,000 | |||||||||||||||||||||||
| Vufine, Inc., Convertible Note*Vufine, Inc., | — | 1,500,000 | 86,301 | — | — | (270,720 | ) | 1,229,280 | 1,500,000 | |||||||||||||||||||||||
| Common Stock* | 14,325 | — | — | — | — | (14,325 | ) | — | 750,000 | |||||||||||||||||||||||
| Vufine, Inc., Convertible Note* | 1,000,000 | — | 31,726 | 1,000,000 | — | — | — | — | ||||||||||||||||||||||||
| Vufine, Inc., Convertible Note* | — | 250,000 | 6,329 | — | — | (45,120 | ) | 204,880 | 250,000 | |||||||||||||||||||||||
| Wrightspeed, Inc., Series C Preferred Stock | 5,811,783 | 503,140 | — | 503,140 | (26,040 | ) | (81,447 | ) | 5,704,296 | 2,267,659 | ||||||||||||||||||||||
| Wrightspeed, Inc., Series D Preferred Stock | 3,221,792 | — | — | — | — | (60,774 | ) | 3,161,018 | 1,100,978 | |||||||||||||||||||||||
| Wrightspeed, Inc., Series E Preferred Stock | 1,376,470 | — | — | — | — | (26,147 | ) | 1,350,323 | 450,814 | |||||||||||||||||||||||
| Wrightspeed, Inc., Series F Preferred Stock | — | 499,994 | — | — | — | (28,699 | ) | 471,295 | 90,707 | |||||||||||||||||||||||
| Wrightspeed, Inc. Series F Warrants | — | — | — | — | — | 28,703 | 28,703 | 18,141 | ||||||||||||||||||||||||
| Total Affiliates and Controlled Investments | $ | 104,088,254 | $ | 1,441,520 | $ | 5,058,105 | $ | 7,747,397 | $ | 134,648,470 | ||||||||||||||||||||||
| Total Affiliates | $ | 18,170,042 | $ | 3,014 | $ | (26,040 | ) | $ | 5,012,256 | $ | 24,656,252 | |||||||||||||||||||||
| Total Controlled Investments | $ | 85,918,212 | $ | 1,438,506 | $ | 5,084,145 | $ | 2,735,141 | $ | 109,992,218 | ||||||||||||||||||||||
| * | Controlled investment. |
77
Firsthand Technology Value Fund, Inc.
Notes to Financial Statements - continued
DECEMBER 31, 2017
As of December 31, 2017, Kevin Landis represented the Company and sat on the board of directors of Hera Systems, Inc.; IntraOp Medical, Inc.; Phunware, Inc. (he resigned his dictatorship on February 26, 2018); Pivotal Systems, Inc.; QMAT, Inc.; Revasum, Inc.; Silicon Genesis Corp.; Telepathy Investors, Inc.; Vufine, Inc.; and Wrightspeed, Inc. Serving on boards of directors of portfolio companies may cause conflicts of interest. The Adviser has adopted various procedures to ensure that the Company will not be unfavorably affected by these potential conflicts.
In accordance with the SEC’s Regulation S-X and GAAP, we are not permitted to consolidate any subsidiary or other entity that is not an investment company, including those in which we have a controlling interest. We had certain unconsolidated subsidiaries for the year ended December 31, 2017, that met at least one of the significant conditions of the SEC’s Regulation S-X. Accordingly, pursuant to Regulation S-X, summarized, comparative financial information is presented below for our unconsolidated significant subsidiaries as of December 31, 2017 and 2016 and for the years ended December 31, 2017, 2016 and 2015.
INTRAOP MEDICAL
| BALANCE SHEET DATA AS OF: | 12/31/17 | 12/31/16 | ||||||||||
| Total Current Assets | 6,500,945 | 5,457,189 | ||||||||||
| Total Non-Current Assets | 12,058,410 | 14,941,785 | ||||||||||
| Total Current Liabilities | 2,121,546 | 5,063,450 | ||||||||||
| Total Non-Current Liabilities | 10,718,566 | 3,401,347 | ||||||||||
| Non-controlling interest | - | - | ||||||||||
| INCOME STATEMENT DATA FOR THE YEARS ENDED: | 12/31/17 | 12/31/16 | 12/31/15 | |||||||||
| Revenue | 4,825,402 | 7,976,800 | 5,398,766 | |||||||||
| Gross Profit | 2,515,074 | 3,818,884 | 1,713,042 | |||||||||
| Income/(loss) from operations | (6,382,834 | ) | (6,560,818 | ) | (5,598,932 | ) | ||||||
| Total net income/(loss) including net income/(loss) attributable to non-controlling interest | (6,395,400 | ) | (6,609,744 | ) | (5,601,180 | ) | ||||||
| Net income/(loss) attibutable to non-controlling interest | - | - | - | |||||||||
PIVOTAL SYSTEMS
| BALANCE SHEET DATA AS OF: | 12/31/17 | 12/31/16 | ||||||||||
| Total Current Assets | 8,611,281 | 10,188,775 | ||||||||||
| Total Non-Current Assets | 7,364,374 | 7,166,157 | ||||||||||
| Total Current Liabilities | 5,856,123 | 5,870,765 | ||||||||||
| Total Non-Current Liabilities | 9,513,252 | 7,429,919 | ||||||||||
| Non-controlling interest | - | - | ||||||||||
| INCOME STATEMENT DATA FOR THE YEARS ENDED: | 12/31/17 | 12/31/16 | 12/31/15 | |||||||||
| Revenue | 15,320,814 | 8,325,619 | 4,804,844 | |||||||||
| Gross Profit | 3,762,837 | 1,109,514 | 763,269 | |||||||||
| Income/(loss) from operations | (3,558,642 | ) | (5,428,305 | ) | (4,643,859 | ) | ||||||
| Total net income/(loss) including net income/(loss) attributable to | (3,734,109 | ) | (5,833,910 | ) | (4,820,394 | ) | ||||||
| non-controlling interest | ||||||||||||
| Net income/(loss) attibutable to non-controlling interest | - | - | - | |||||||||
78
Firsthand Technology Value Fund, Inc.
Notes to Financial Statements - continued
DECEMBER 31, 2017
QMAT
| BALANCE SHEET DATA AS OF: | 12/31/17 | 12/31/16 | ||||||||||
| Total Current Assets | 538,957 | 1,731,176 | ||||||||||
| Total Non-Current Assets | 717,641 | 977,246 | ||||||||||
| Total Current Liabilities | 600,362 | 317,978 | ||||||||||
| Total Non-Current Liabilities | 5,327,861 | 2,477,655 | ||||||||||
| Non-controlling interest | - | - | ||||||||||
| INCOME STATEMENT DATA FOR THE YEARS ENDED: | 12/31/17 | 12/31/16 | 12/31/15 | |||||||||
| Revenue | - | - | - | |||||||||
| Gross Profit | - | - | - | |||||||||
| Income/(loss) from operations | (4,467,110 | ) | (5,214,013 | ) | (4,353,564 | ) | ||||||
| Total net income/(loss) including net income/(loss) attributable to non-controlling interest | (4,584,413 | ) | (5,209,776 | ) | (4,264,787 | ) | ||||||
| Net income/(loss) attibutable to non-controlling interest | - | - | - | |||||||||
A summary of the Company’s investments in affiliates and controlled investments for the period from December 31, 2015, through December 31, 2016, is noted below:
| SHARES/PAR ACTIVITY | ||||||||||||||||||||||||||||||||
| AFFILIATE/CONTROLLED INVESTMENT* | BALANCE AT 12/31/15 | PURCHASES/ MERGER | SALES/ MATURITY/ EXPIRATION | BALANCE AT 12/31/16 | REALIZED GAIN (LOSS) | INTEREST | VALUE 12/31/16 | ACQUISITION COST | ||||||||||||||||||||||||
| EQX, Inc. Common Stock* | — | 100,000 | — | 100,000 | $ | — | $ | — | $ | 44,430 | $ | 20,000 | ||||||||||||||||||||
| EQX, Inc. Preferred Stock - Series A* | — | 4,000,000 | — | 4,000,000 | — | — | 3,975,600 | 4,000,000 | ||||||||||||||||||||||||
| Hera Systems, Inc. Term Note* | — | 50,000 | (8,792 | ) | 41,208 | — | 210 | 41,208 | 41,208 | |||||||||||||||||||||||
| Hera Systems, Inc. Series A Preferred* | 3,642,324 | — | — | 3,642,324 | — | — | 445,456 | 2,000,000 | ||||||||||||||||||||||||
| Hera Systems, Inc. Convertible Note* | — | 30,000 | — | 30,000 | — | 681 | 30,000 | 30,000 | ||||||||||||||||||||||||
| IntraOp Medical Corp. Series C Preferred* | 26,856,187 | — | — | 26,856,187 | — | — | 24,511,642 | 26,299,938 | ||||||||||||||||||||||||
| IntraOp Medical Corp. Convertible Note* | 1,000,000 | — | — | 1,000,000 | — | 195,204 | 1,000,000 | 1,000,000 | ||||||||||||||||||||||||
| IntraOp Medical Corp. Term Note* | 3,000,000 | — | — | 3,000,000 | — | 240,658 | 3,000,000 | 3,000,000 | ||||||||||||||||||||||||
| Pivotal Systems, Series A Preferred* | 11,914,217 | — | — | 11,914,217 | — | — | 6,370,532 | 6,000,048 | ||||||||||||||||||||||||
| Pivotal Systems, Series B Preferred* | 13,065,236 | — | — | 13,065,236 | — | — | 6,985,982 | 6,321,483 | ||||||||||||||||||||||||
79
Firsthand Technology Value Fund, Inc.
Notes to Financial Statements - continued
DECEMBER 31, 2017
| SHARES/PAR ACTIVITY | ||||||||||||||||||||||||||||||||
| AFFILIATE/CONTROLLED INVESTMENT* | BALANCE AT 12/31/15 | PURCHASES/ MERGER | SALES/ MATURITY/ EXPIRATION | BALANCE AT 12/31/16 | REALIZED GAIN (LOSS) | INTEREST | VALUE 12/31/16 | ACQUISITION COST | ||||||||||||||||||||||||
| Pivotal Systems, Series C Preferred* | 2,291,260 | — | — | 2,291,260 | $ | — | $ | — | $ | 2,273,159 | $ | 2,657,862 | ||||||||||||||||||||
| Pivotal Systems, Series D Preferred* | — | 6,237,978 | — | 6,237,978 | — | — | 4,060,924 | 3,975,801 | ||||||||||||||||||||||||
| Pivotal Systems, Convertible Note* | — | 500,000 | (500,000 | ) | — | — | 39,178 | — | — | |||||||||||||||||||||||
| Pivotal Systems, Convertible Note* | — | 881,102 | (881,102 | ) | — | — | 55,521 | — | — | |||||||||||||||||||||||
| Pivotal Systems, Common Stocks Warrants* | — | 4,158,654 | — | 4,158,654 | — | — | 284,036 | — | ||||||||||||||||||||||||
| Pivotal Systems, Common Stocks Warrants* | — | 18,180,475 | — | 18,180,475 | — | — | 4,743,286 | — | ||||||||||||||||||||||||
| QMAT, Preferred Stock Series A* | 14,000,240 | 2,000,000 | — | 16,000,240 | — | — | 10,724,961 | 16,000,240 | ||||||||||||||||||||||||
| QMAT, Preferred Stock Series B* | — | 2,000,000 | — | 2,000,000 | — | — | 2,000,000 | 2,000,000 | ||||||||||||||||||||||||
| QMAT, Series A Warrant* | 2,000,000 | — | — | 2,000,000 | — | — | 376,400 | — | ||||||||||||||||||||||||
| Revasum, Common Stock* | — | 10,000 | — | 10,000 | — | — | 7,524 | 1,000 | ||||||||||||||||||||||||
| Revasum, Preferred Stock Series A* | — | 2,200,000 | — | 2,200,000 | — | — | 2,193,400 | 2,200,000 | ||||||||||||||||||||||||
| Silicon Genesis Corp., Common * | 921,892 | — | — | 921,892 | — | — | 14,750 | 169,045 | ||||||||||||||||||||||||
| Silicon Genesis Corp., Convertible Note* | 1,250,000 | — | (1,250,000 | ) | — | (360,753 | ) | — | — | — | ||||||||||||||||||||||
| Silicon Genesis Corp., Convertible Note* | 1,000,000 | — | (1,000,000 | ) | — | — | — | — | — | |||||||||||||||||||||||
| Silicon Genesis Corp., Term Note* | 3,000,000 | — | (3,000,000 | ) | — | — | — | — | — | |||||||||||||||||||||||
| Silicon Genesis Corp., Common Warrant* | 37,982 | — | — | 37,982 | — | — | 319 | 6,678 | ||||||||||||||||||||||||
| Silicon Genesis Corp., Common Warrant* | 5,000,000 | — | — | 5,000,000 | — | — | 10,000 | — | ||||||||||||||||||||||||
| Silicon Genesis Corp., Common Warrant* | 3,000,000 | — | — | 3,000,000 | — | — | 6,000 | — | ||||||||||||||||||||||||
| Silicon Genesis Corp., Series 1-C Preferred* | 82,914 | — | — | 82,914 | — | — | 70,444 | 109,518 | ||||||||||||||||||||||||
| Silicon Genesis Corp., Series 1-D Preferred* | 850,830 | — | — | 850,830 | — | — | 195,606 | 431,901 | ||||||||||||||||||||||||
| Silicon Genesis Corp., Series 1-E Preferred* | 5,704,480 | — | — | 5,704,480 | — | — | 2,134,616 | 2,946,535 | ||||||||||||||||||||||||
| Silicon Genesis Corp., Series 1-F Preferred* | 912,453 | — | — | 912,453 | — | — | 464,165 | 583,060 | ||||||||||||||||||||||||
80
Firsthand Technology Value Fund, Inc.
Notes to Financial Statements - continued
DECEMBER 31, 2017
| SHARES/PAR ACTIVITY | ||||||||||||||||||||||||||||||||
| AFFILIATE/CONTROLLED INVESTMENT* | BALANCE AT 12/31/15 | PURCHASES/ MERGER | SALES/ MATURITY/ EXPIRATION | BALANCE AT 12/31/16 | REALIZED GAIN (LOSS) | INTEREST | VALUE 12/31/16 | ACQUISITION COST | ||||||||||||||||||||||||
| Silicon Genesis Corp., Series 1-G Preferred* | — | 83,370,793 | (35,000,000 | ) | 48,370,793 | $ | (3,538,500 | ) | $ | — | $ | 3,032,848 | $ | 5,042,479 | ||||||||||||||||||
| Silicon Genesis Corp., Series 1-H Preferred* | — | 837,942 | — | 837,942 | — | — | 240,238 | 1,000,000 | ||||||||||||||||||||||||
| Telepathy Investors, Inc. Convertible Note* | 2,000,000 | — | — | 2,000,000 | — | 209,033 | 1,109,340 | 2,000,000 | ||||||||||||||||||||||||
| Telepathy Investors, Inc. Convertible Note* | — | 150,000 | — | 150,000 | — | 7,973 | 83,201 | 150,000 | ||||||||||||||||||||||||
| Telepathy Investors, Inc. Convertible Note* | — | 500,000 | — | 500,000 | — | 35,068 | 277,335 | 500,000 | ||||||||||||||||||||||||
| Telepathy Investors, Inc. Convertible Note* | — | 300,000 | — | 300,000 | — | 27,781 | 166,401 | 300,000 | ||||||||||||||||||||||||
| Telepathy Investors, Inc. Convertible Note* | — | 500,000 | — | 500,000 | — | 2,603 | 277,335 | 500,000 | ||||||||||||||||||||||||
| Telepathy Investors, Inc. Series A Preferred* | 15,238,000 | — | — | 15,238,000 | — | — | 2,096,749 | 3,999,999 | ||||||||||||||||||||||||
| Vufine, Inc., Series A Preferred* | 15,000,000 | 7,500,000 | — | 22,500,000 | — | — | 1,656,000 | 2,250,000 | ||||||||||||||||||||||||
| Vufine, Inc., Common Stock* | 750,000 | — | — | 750,000 | — | — | 14,325 | 15,000 | ||||||||||||||||||||||||
| Vufine, Inc., Convertible Note* | — | 1,000,000 | — | 1,000,000 | — | 16,767 | 1,000,000 | 1,000,000 | ||||||||||||||||||||||||
| Wrightspeed, Inc. Series C Preferred | 2,267,659 | 1,480,000 | (1,480,000 | ) | 2,267,659 | 864,024 | — | 5,811,783 | 6,864,023 | |||||||||||||||||||||||
| Wrightspeed, Inc. Series D Preferred | 1,100,978 | — | — | 1,100,978 | — | — | 3,221,792 | 3,375,887 | ||||||||||||||||||||||||
| Wrightspeed, Inc. Series E Preferred | 450,814 | — | — | 450,814 | — | — | 1,376,470 | 1,658,996 | ||||||||||||||||||||||||
| Total Affiliates and Controlled Investments | $ | (3,035,229 | ) | $ | 830,677 | $ | 96,328,257 | $ | 108,450,701 | |||||||||||||||||||||||
| Total Affiliates | $ | 864,024 | $ | — | $ | 10,410,045 | $ | 11,898,906 | ||||||||||||||||||||||||
| Total Controlled | ||||||||||||||||||||||||||||||||
| Investments | $ | (3,899,253 | ) | $ | 830,677 | $ | 85,918,212 | $ | 96,551,795 | |||||||||||||||||||||||
| * | Controlled investment. |
As of December 31, 2016, Kevin Landis represents the Company and sits on the board of directors of Hera Systems, Inc.; IntraOp Medical, Inc.; Phunware, Inc.; Pivotal Systems, Inc.; QMAT, Inc.; Revasum, Inc.; Silicon Genesis Corp.; Telepathy Investors, Inc.; Vufine, Inc.; and Wrightspeed, Inc. Serving on boards of directors of portfolio companies may cause conflicts of interest. The Adviser has adopted various procedures to ensure that the Company will not be unfavorably affected by these potential conflicts.
81
Firsthand Technology Value Fund, Inc.
Notes to Financial Statements - continued
DECEMBER 31, 2017
NOTE 11. SUBSEQUENT EVENTS
On February 14, 2018, OpenText Corp. announced that it had purchased Hightail, Inc., a portfolio holding since 2014. We currently anticipate receiving between $5 and $6 million in proceeds from this transaction.
On March 12, 2018, Pivotal Systems announced it has engaged two investment banks for the purpose of exploring a 2018 listing on the Australian Securities Exchange.
82
Item 9. CHANGES IN AND DISAGREEMENTS WITH ACCOUNTANTS ON ACCOUNTING AND FINANCIAL DISCLOSURE
None
Item 9A. CONTROLS AND PROCEDURES
DISCLOSURE CONTROLS AND PROCEDURES
Our Chief Executive Officer and Chief Financial Officer performed an evaluation of the effectiveness of our disclosure controls and procedures (as defined in Rules 13a-15(e) and 15d-15(e) under the Securities Exchange Act of 1934, as amended) as of December 31, 2017, and, based on that evaluation, have concluded that the disclosure controls and procedures are effective.
REPORT OF MANAGEMENT ON INTERNAL CONTROL OVER FINANCIAL REPORTING
Our management is responsible for establishing and maintaining adequate internal control over financial reporting (as defined in Rules 13a-15(f) and 15d-15(f) of the Exchange Act). Internal control over financial reporting is a process designed by, or under the supervision of, our principal executive and financial officer, or persons performing similar functions, and effected by our board of directors, management, and other personnel, to provide reasonable assurance regarding the reliability of financial reporting and the preparation of financial statements for external purposes in accordance with generally accepted accounting principles and includes those policies and procedures that (i) pertain to the maintenance of records that in reasonable detail accurately and fairly reflect the transactions and dispositions of our assets; (ii) provide reasonable assurance that the transactions are recorded as necessary to permit preparation of financial statements in accordance with generally accepted accounting principles, and that our receipts and expenditures are being made only in accordance with authorizations of our management and our directors; and (iii) provide reasonable assurance regarding prevention or timely detection of unauthorized acquisition, use or disposition of our assets that could have a material effect on the consolidated financial statements.
Our management evaluated as of December 31, 2017, the effectiveness of our internal control over financial reporting using the criteria set forth by the Committee of Sponsoring Organizations of the Treadway Commission (COSO) in Internal Control — Integrated Framework. Based on this evaluation, our management concluded that our internal control over financial reporting was effective as of December 31, 2017. Our independent registered public accounting firm, Tait, Weller & Baker LLP, issued a report on the effectiveness of our internal control over financial reporting as of December 31, 2017, which appears on page 39 herein.
INHERENT LIMITATIONS OF EFFECTIVENESS OF CONTROLS
Our management, including our Chief Executive Officer and Chief Financial Officer, do not expect that our disclosure controls and procedures or our internal control over financial reporting will prevent all errors and all fraud. A control system, no matter how well conceived and operated, can provide only reasonable, not absolute, assurance that the objectives of the control system are met. Further, the benefits of controls must be considered relative to their costs. Because of the inherent limitations in all control systems, no evaluation of controls can provide absolute assurance that all control issues and instances of fraud, if any, have been detected. These inherent limitations include the realities that judgments in decision-making can be faulty, and that breakdowns can occur because of simple errors or mistakes. Additionally, controls can be circumvented by the individual acts of some persons, by collusion of two or more people or by management override of the control. The design of any system of controls is also based in part upon certain assumptions about the likelihood of future events, and there can be no assurance that any design will succeed in achieving its stated goals under all potential future conditions. Projections of any evaluation of controls effectiveness to future periods are subject to risks. Over time, controls may become inadequate because of changes in conditions or deterioration in the degree of compliance with policies or procedures.
CHANGES IN INTERNAL CONTROL OVER FINANCIAL REPORTING
There have been no changes in our internal control over financial reporting that occurred during our fourth quarter ended December 31, 2017, that have materially affected, or are reasonably likely to materially affect, our internal control over financial reporting.
None
83
Item 10. DIRECTORS, EXECUTIVES OFFICERS AND CORPORATE GOVERNANCE
Reference is made to the information with respect to “Directors and Executive officers of the Registrant” to be contained in the Company’s proxy statement to be filed with the SEC, in connection with the Company’s annual meeting of shareholders to be held in 2018 (the “2018 Proxy Statement”), which information is incorporated herein by reference.
The Company has adopted a code of ethics that applies to the Company’s chief executive officer, a copy of which is posted on our website http://www.firsthandtvf.com.
Our CEO certifies the accuracy of the financial statements contained in our periodic reports, and so certified in this Form 10-K through the filing of Section 302 certifications as exhibits to this Form 10-K.
Section 16(a) Beneficial Ownership Reporting Compliance
Section 16(a) of the Securities Exchange Act of 1934 requires the Company’s officers and directors, and persons who own more than ten percent of a registered class of the Company’s equity securities, to file with the Securities and Exchange Commission and the Nasdaq Stock Market reports of ownership of the Company’s securities and changes in reported ownership. Officers, directors and greater than ten percent shareholders are required by SEC rules to furnish the Company with copies of all Section 16(a) reports they file.
Based solely on a review of the reports furnished to the Company, or written representations from reporting persons that all reportable transaction were reported, the Company believes that during the fiscal year ended December 31, 2017, the Company’s officers, directors and greater than ten percent owners timely filed all reports they were required to file under Section 16(a).
Item 11. EXECUTIVE COMPENSATION
Reference is made to the information with respect to “Compensation of Directors” to be contained in the 2018 Proxy Statement, which information is incorporated herein by reference.
Item 12. SECURITY OWNERSHIP OF CERTAIN BENEFICIAL OWNERS AND MANAGEMENT AND RELATED STOCKHOLDER MATTERS
The information set forth under the caption “How Many Shares Do the Company’s Principal Shareholders, Directors and Executive Officers Own?” in the 2018 Proxy Statement is herein incorporated by reference.
Item
13. CERTAIN RELATIONSHIPS AND RELATED TRANSACTIONS, AND
DIRECTOR INDEPENDENCE
The information set forth under the captions “Nominees” and “Related Party Transactions” in the 2018 Proxy Statement is herein incorporated by reference.
Item 14. PRINCIPAL ACCOUNTANT FEES AND SERVICES
The information set forth under the captions “Audit Committee’s Pre-Approval Procedures” and “Fees Paid to Tait, Weller & Baker LLP for 2017” in the 2018 Proxy Statement is herein incorporated by reference.
84
Item 15. EXHIBITS AND FINANCIAL STATEMENTS SCHEDULES
1. Financial Statements
The following financial statements of Firsthand Technology Value Fund, Inc. (the “Company” or the “Registrant”) are filed herewith:
| AUDITED FINANCIAL STATEMENTS | |
| Report of Independent Registered Public Accounting Firm | 40 |
| Statement of Assets and Liabilities as of December 31, 2017 | 42 |
| Schedule of Investments as of December 31, 2017 | 43 |
| Statement of Operations as of December 31, 2017 | 52 |
| Statement of Cash Flows as of December 31, 2017 | 53 |
| Statement of Changes in Net Assets as of December 31, 2017 | 54 |
| Financial Highlights | 55 |
| Notes to Financial Statements | 56 |
2. The following financial statement schedule is filed herewith:
Schedule 12-14 Investments In and Advances to Affiliates
3. Exhibits required to be filed by Item 601 of Regulation S-K.
| Number | Description | |
| 3.1. | Registrant’s Articles of Amendment and Restatement are incorporated by reference to Exhibit (a)(2) of Pre-Effective Amendment No. 1 to the Registrant’s Registration Statement on Form N-2 (File No. 333-168195) as filed with the Securities and Exchange Commission on September 24, 2010. |
| 3.2 | Certificate of Correction to Registrant’s Articles of Amendment and Restatement is incorporated by reference to Exhibit (a)(2) of Registration statement for closed-end investment companies on Form N-2 (File No. 333-179606) as filed with the Securities and Exchange Commission on February 21, 2012. |
| 3.3 | Registrant’s Amended and Restated Bylaws last amended March 16, 2018 — filed herewith. |
| 10.1 | Registrant’s Dividend Reinvestment Plan is incorporated by reference to Exhibit (e) of Pre-Effective Amendment to the Registrant’s Registration Statement on Form N-2 (File No. 333-168195) as filed with the Securities and Exchange Commission on September 24, 2010. |
| 10.2 | Form of Investment Management Agreement between Registrant and SiVest Group, Inc. (now known as Firsthand Capital Management, Inc.) is incorporated by reference to Exhibit (g) of Pre-Effective Amendment to the Registrant’s Registration Statement on Form N-2 (File No. 333-168195) as filed with the Securities and Exchange Commission on September 24, 2010. |
| 10.3 | Form of Custodian Services Agreement between Registrant and PFPC Trust Company is incorporated by reference to Exhibit (j) of Pre-Effective Amendment to the Registrant’s Registration Statement on Form N-2 (File No. 333-168195) as filed with the Securities and Exchange Commission on September 24, 2010. 10.4 Form of Administration and Accounting Agreement between Registrant and BNY Mellon Investment Servicing (US), Inc. is incorporated by reference to Exhibit (k)(1) of Pre-Effective Amendment to the Registrant’s Registration Statement on Form N-2 (File No. 333-168195) as filed with the Securities and Exchange Commission on September 24, 2010. |
| 10.5 | Notice of Assignment dated February 9, 2011 by PFPC Trust Company assigning Custodian Services Agreement is incorporated by reference to the Registrant’s Registration Statement on Form N-2 (File No. 333-179606) as filed with the Securities and Exchange Commission on February 21, 2012. |
85
| 10.6 | Form of Transfer Agency Services Agreement between Registrant and BNY Mellon Investment Servicing (US), Inc. is incorporated by reference to Exhibit (k)(2) of Pre-Effective Amendment to the Registrant’s Registration Statement on Form N-2 (File No. 333-168195) as filed with the Securities and Exchange Commission on September 24, 2010. |
| 14.1 | Registrant’s Code of Ethics for Principal Executives and Senior Financial Officers is incorporated by reference to Exhibit 14.1 to the Registrant’s Form 10-K as filed with the Securities and Exchange Commission on March 21, 2012. |
| 14.2 | Registrant’s Code of Ethics last amended August 4, 2017 — filed herewith. |
| 24.1 | Power of Attorney is incorporated by reference to exhibit 24.1 to the registrant’s Form 10-K as filed with the Securities and Exchange Commission on March 16, 2015. |
| 31.1 | Certification by Chief Executive Officer and Chief Financial Officer pursuant to Exchange Act Rule 13a-14(a), as adopted pursuant to Section 302 of the Sarbanes-Oxley Act of 2002 — filed herewith. |
| 32.1 | Certification by Chief Executive Officer and Chief Financial Officer pursuant to 18 U.S.C. Section 1350, as adopted pursuant to Section 906 of the Sarbanes-Oxley Act of 2002 — filed herewith. |
Pursuant to the requirements of Section 13 or 15(d) of the Securities Exchange Act of 1934, the Company has duly caused this report to be signed on its behalf by the undersigned, thereunto duly authorized.
| FIRSTHAND TECHNOLOGY VALUE FUND, INC. | |||
| Date: March 16, 2018 | By: |  |
|
| Kevin Landis | |||
| President | |||
Pursuant to the requirements of the Securities Exchange Act of 1934, this report has been signed below by the following persons on behalf of the Company and in the capacities and on the dates indicated.
| Signatures | Title | Date | ||
| /s/ Kevin Landis | Chairman of the Board and Chief Executive Officer | March 16, 2018 | ||
| Kevin Landis | and Chief Financial Officer | |||
| * | Director | March 16, 2018 | ||
| Greg Burglin | ||||
| * | Director | March 16, 2018 | ||
| Kimun Lee | ||||
| * | Director | March 16, 2018 | ||
| Nicholas Petredis | ||||
| * | Director | March 16, 2018 | ||
| Rodney Yee |
| * | Signed by Kevin Landis pursuant to powers of attorney. |
86
EXHIBIT INDEX
| Exhibit Number | Descriptions | |
| 3.3 | Registrant’s Amended and Restated Bylaws last amended March 16, 2018. | |
| 14.2 | Registrant’s Code of Ethics last amended August 4, 2017. | |
| 31.1 | Certification by Chief Executive Officer pursuant to Exchange Act Rule 13a-14(a), as adopted pursuant to Section 302 of the Sarbanes-Oxley Act of 2002 | |
| 32.1 | Certification by Chief Executive Officer and Chief Financial Officer pursuant to 18 U.S.C. Section 1350, as adopted pursuant to Section 906 of the Sarbanes-Oxley Act of 2002 |
87
Privacy Notice
FIRSTHAND TECHNOLOGY VALUE FUND, INC.
| FACTS | WHAT DOES FIRSTHAND TECHNOLOGY VALUE FUND, INC. DO WITH YOUR PERSONAL INFORMATION? |
| Why? | Financial companies choose how they share your personal information. Federal law gives consumers the right to limit some but not all sharing. Federal law also requires us to tell you how we collect, share, and protect your personal information. Please read this notice carefully to understand what we do. |
| What? | The types of personal information we collect and share depend on the product or service you have with us. This information can include: |
| ► Social Security number | |
| ► Banking information | |
| ► Account transactions | |
| ► Retirement assets | |
| How? | All financial companies need to share customers’ personal information to run their everyday business. In the section below, we list the reasons financial companies can share their customers’ personal information; the reasons Firsthand Capital management, Inc. chooses to share; and whether you can limit this sharing. |
| Reasons we can share your personal information | Does Firsthand Technology Value Fund, Inc. share? | Can you limit this sharing? |
| For our everyday business purposes—such as to process your transactions, maintain your account(s), respond to court orders and legal investigations | Yes | No |
| For our marketing purposes—to offer our products and services to you | No | N/A |
| For joint marketing with other financial companies | No | N/A |
| For our Affiliates’ everyday business purposes—information about your transactions and experiences | No | N/A |
| For our Affiliates’ everyday business purposes—information about your creditworthiness | No | N/A |
| For our Affiliates to market to you | No | N/A |
| For nonAffiliates to market to you | No | N/A |
| Who we are | |
| Who is providing this notice? | Firsthand Technology Value Fund, Inc. is a publically traded venture capital fund, listed on NASDAQ, that is a business development company under the Investment Company Act of 1940 |
| What we do | |
| How does Firsthand Technology Value Fund, Inc. protect my personal information? | To protect your personal information from unauthorized access and use, we use security measures that comply with federal law. These measures include computer safeguards and secured files and buildings. |
| How does Firsthand Technology Value Fund, Inc. collect my personal information? | We
collect your personal information, for example, when you |
| Why can’t I limit all sharing? | Federal law gives you the right to limit only |
| ► sharing for Affiliates’ everyday business purposes—information about your creditworthiness | |
| ► Affiliates from using your information to market to you | |
| ► sharing for nonAffiliates to market to you | |
| State laws and individual companies may give you additional rights to limit sharing. |
| Definitions | |
| Affiliates | Companies related by common ownership or control. They can be financial and nonfinancial companies. |
| ► Firsthand Capital Management, Inc. and Firsthand Funds | |
| NonAffiliates | Companies not related by common ownership or control. They can be financial and nonfinancial companies. |
| ►BNY Mellon Investment Servicing (U.S.) Inc. (Transfer Agent for Firsthand Technology Value Fund, Inc. and Firsthand Funds) | |
| Joint marketing | A formal agreement between nonaffiliated financial companies that together market financial products or services to you. |
| Other important information | |
| This notice applies to individual consumers who are customers or former customers. This notice replaces all previous notices of our consumer privacy policy, and may be amended at any time. We will keep you informed of changes or amendments as required by law. | |
LETTER TO SHAREHOLDERS - CONTINUED FROM INSIDE FRONT COVER
IntraOp Medical, Phunware, Telepathy, and Vufine, have struggled with developing markets for their new technologies. By and large, we believe these companies remain on the right track, and we are hopeful that our patience will be rewarded.
FUTURE CATALYSTS
As we have stated in the past, our continued success is driven by companies progressing through the various stages of development (see illustration on page 31). Over the past couple of years, we have witnessed several of our later stage companies, including Roku, Nutanix, Cloudera, Pure Storage, and Turn, achieve IPOs or M&As. While this temporarily leaves our portfolio tilted more toward early- and mid-stage companies, several other companies, including Pivotal, Revasum, and Wrightspeed, are poised to reach a level of maturity normally associated with late-stage companies. We would be surprised if one of the companies from this group is not the next exit for the Fund.
In November, our Board approved a plan to repurchase up to $2 million worth of SVVC stock in the open market by March 30, 2018. As of December 31, 2017, the Fund had repurchased and retired 128,551 shares of stock at a total cost of approximately $1.1 million. So far, this repurchase plan has added $0.20 per share to the Fund’s NAV. We continue to examine and consider other ways to deliver value to shareholders and will do what we think is best for long-term investors in the Fund.
On a personal level, I was again an active buyer of SVVC stock in 2017 and now own more than 260,000 shares of our stock. While our compliance rules prohibit my purchasing additional stock while the Fund is conducting its open market activities, I am a firm believer in the future prospects for our current holdings and I intend to continue purchasing shares during 2018.
Finally, I wish to thank you for entrusting your investment dollars to us. We believe the future is bright, and we are working hard every day make good investments in some of the most exciting technology companies in the world.
Sincerely,

Kevin
Landis
CEO and President
Firsthand Technology Value Fund, Inc.