Attached files
| file | filename |
|---|---|
| EX-32.2 - EX-32.2 - CSB BANCORP INC /OH | d505077dex322.htm |
| EX-32.1 - EX-32.1 - CSB BANCORP INC /OH | d505077dex321.htm |
| EX-31.2 - EX-31.2 - CSB BANCORP INC /OH | d505077dex312.htm |
| EX-31.1 - EX-31.1 - CSB BANCORP INC /OH | d505077dex311.htm |
| EX-23.1 - EX-23.1 - CSB BANCORP INC /OH | d505077dex231.htm |
| EX-21 - EX-21 - CSB BANCORP INC /OH | d505077dex21.htm |
| 10-K - 10-K - CSB BANCORP INC /OH | d505077d10k.htm |
Exhibit 13

CSB BANCORP, INC. BUILDING OUR WAY TO EXCELLENCE 2017 REPORT TO SHAREHOLDERS

| TABLE OF |
| CONTENTS
|
| 2017 Financial Highlights |
3 | |||
| 2017 Letter to Shareholders |
4 | |||
| 2017 Financial Review |
7 | |||
| Report on Management’s Assessment of Internal Control over Financial Reporting | 22 | |||
| Report of Independent Registered Public Accounting Firm | 23 | |||
| Consolidated Balance Sheets |
25 | |||
| Consolidated Statements of Income |
26 | |||
| Consolidated Statements of Comprehensive Income | 27 | |||
| Consolidated Statements of Changes in Shareholders’ Equity | 27 | |||
| Consolidated Statements of Cash Flows |
28 | |||
| Notes to Consolidated Financial Statements |
30 | |||
| Officers of The Commercial and Savings Bank | 60 | |||
| Shareholders and General Inquiries |
61 | |||
| Board of Directors |
62 | |||
| 2017 Milestones |
63 | |||
| Banking Center Information |
64 | |||
2
2017 Report to Shareholders | CSB Bancorp, Inc.

|
2017 FINANCIAL HIGHLIGHTS |

| For the Year Ended December 31 | 2017 | 2016 | % CHANGE | |||||||||
|
|
||||||||||||
| (Dollars in thousands, except per share data) | ||||||||||||
| CONSOLIDATED RESULTS |
||||||||||||
| Net interest income |
$ | 24,452 | $ | 22,159 | 10% | |||||||
| Net interest income – fully taxable-equivalent (FTE) basis |
24,833 | 22,531 | 10 | |||||||||
| Noninterest income |
4,340 | 4,296 | 1 | |||||||||
| Provision for loan losses |
1,145 | 493 | 132 | |||||||||
| Noninterest expense |
17,316 | 16,255 | 7 | |||||||||
| Net income |
7,101 | 6,738 | 5 | |||||||||
|
|
||||||||||||
| AT YEAR-END |
||||||||||||
| Loans, net |
$ | 511,226 | $ | 470,158 | 9% | |||||||
| Assets |
707,063 | 669,978 | 6 | |||||||||
| Deposits |
583,259 | 540,785 | 8 | |||||||||
| Shareholders’ equity |
70,532 | 65,415 | 8 | |||||||||
| Cash dividends declared |
0.84 | 0.78 | 8 | |||||||||
| Book value |
25.72 | 23.85 | 8 | |||||||||
| Tangible book value |
23.90 | 21.99 | 9 | |||||||||
| Market price |
33.11 | 31.00 | 7 | |||||||||
| Basic and diluted earnings per share |
2.59 | 2.46 | 5 | |||||||||
|
|
||||||||||||
| FINANCIAL PERFORMANCE |
||||||||||||
| Return on average assets |
1.02 | % | 1.03 | % | ||||||||
| Return on average equity |
10.33 | 10.44 | ||||||||||
| Net interest margin, FTE |
3.80 | 3.67 | ||||||||||
| Efficiency ratio |
58.96 | 60.14 | ||||||||||
|
|
||||||||||||
| CAPITAL RATIOS |
||||||||||||
| Risk-based capital: |
||||||||||||
| Common equity tier 1 |
12.70 | % | 12.58 | % | ||||||||
| Tier 1 |
12.70 | 12.58 | ||||||||||
| Total |
13.78 | 13.67 | ||||||||||
| Leverage |
9.31 | 9.30 | ||||||||||
2017 Report to Shareholders | CSB Bancorp, Inc.
3
|
|
LETTER TO SHAREHOLDERS | |
|
DEAR FELLOW SHAREHOLDER: CSB’s forward momentum continued in 2017 as the Company again achieved new milestones in size, earnings, and influence in our markets. Average loan balances during the year increased 11%, and average deposit balances were up 6%. This growth was a key factor in delivering record earnings of $7.1 million. Total shareholders’ equity grew by 7.8% to $71 million, and the Board of Directors approved a dividend increase for the fourth year in a row.
| ||
| FINANCIAL PERFORMANCE TRENDS AT A GLANCE: 11th Consecutive Year of Record Average Assets 10th Consecutive Year of Record Average Equity 9th Consecutive Year of Record Average Deposits 7th Consecutive Year of Record Revenue [Net Interest Income (fte) + Other Income] 6th Consecutive Year of Record Net Income 6th Consecutive Year of Efficiency Ratio Below 65% 4th Consecutive Year of Greater Than 10% Return on Equity 2nd Consecutive Year of Greater Than 1% Return on Assets 1st Year of Efficiency Ratio Below 60%
| ||
| STOCK PERFORMANCE We continue to generate value for shareholders. The Company’s stock price has been trending upward for the past several years. The market price increased 55% from the beginning of 2015 to the end of 2017; and total return, with dividend reinvestment, amounted to 70% for the three year period. With price-to-book and price-to-earnings multiples that tend to be lower than the overall stock market, we believe CSB stock remains a good value.
| ||
| OUR OPERATING MODEL We run the bank with a customer centric focus, deployed through a talented, highly committed workforce visible in the community. We gather deposits and lend locally. In fact, well over 80% of our deposits and loans are sourced right in the four primary counties we serve. Household deposits amount to roughly one half of our FDIC-insured deposits, with businesses, organizations, and municipalities comprising the other half. Our loan portfolio contains about 2/3 business loans and 1/3 household consumer loans. These ratios have been largely unchanged for over a decade and have served us well through changing economic conditions. | ||
| To be good stewards of the capital and trust provided by our stakeholders, we intentionally focus on being efficient throughout the organization. We have been targeting an Efficiency Ratio of 60% or below for several years, and in 2017 we hit that marker for the first time. Our Efficiency Ratio of 59% remains better than average. Each year has its own distinct set of challenges and opportunities, and some years require changes that are not as efficient in the short term, but can yield better results in the long run. As such, we may not always achieve an Efficiency Ratio at or below 60%, but we will always endeavor to maintain an operating model that is both effective and sensibly efficient. | ||
| Part of being an efficient and strong bank involves effective use of technology, both in operations and in providing easy-to-use and reliable digital service channels. Convenience and “on demand” services rank high on customer priority lists. We strive to provide products and services customers desire, when and where they want them, with platforms that provide safe and secure transactions. As such, we are continually evolving our digital channels to further enhance the user experience. Customer response has been very positive. Additionally, we have increased the size of our very talented team supporting the rapidly increasing volumes of cash management transactions.
| ||
| KEY ACTIVITIES AND EVENTS OF 2017 In 2017, we rolled out a reengineered website and interface for online banking, and launched CSB’s social media presence. Both platforms have been successful in expanding customer engagement. We increased traditional and digital marketing in geographic areas targeted for growing CSB’s brand recognition. We have also been focusing on bolstering our trust and brokerage areas, and are happy to report improved momentum across our wealth management activities. Trust operations ended the year with more than $100 million in fiduciary, safekeeping, and custody account balances. |
4
2017 Report to Shareholders | CSB Bancorp, Inc.
| LETTER TO SHAREHOLDERS | ||
Our facilities continue to be an important presence in the markets we serve. During 2017, we consolidated two facilities that we have been leasing in the greater Orrville area into a newly constructed banking center on property that we own in downtown Orrville. We were also able to purchase the Charm banking center which we had leased for many years.
At the end of the year, Congress enacted the Tax Cuts and Jobs Act, which among other things, reduced the statutory corporate federal income tax rate from 35% to 21% of taxable income beginning in 2018. The reduction is welcome, as commercial banks have for many years carried a significant federal income tax burden. CSB’s effective tax rate has ranged between 30% and 33% for the past ten years, amounting to $22 million of federal income tax expense during that period. The new tax structure will reduce the Company’s effective tax rate to approximately 20%. Going forward, the change in effective tax rate will generate approximately $1 million of expense savings annually on a current proforma basis. This in turn will allow us to further invest in talent, technology, and the markets we serve, while at the same time augmenting after tax earnings in such a way that our share price and dividend paths should be supported.
THE BANKING ENVIRONMENT
Overall credit quality remains acceptable, but a mixed picture. The financial health of businesses and households as a whole continues to improve, both nationally and locally. Consumer debt is increasing, and average credit card balances are near historical highs. Within our loan portfolio, early stage delinquencies declined during 2017, while nonaccrual loan dollars (loan balances with signs of significant distress) increased. The nonaccrual loans in our portfolio at year end are limited to several relationships and appear manageable within our normal course of business. There is no general pattern of concern within the loan portfolio, but we are vigilantly watching loan categories, business sectors, and large customers for any signs of stress. The current economic expansion is one of the longest on record and may be getting into the later stage of its cycle; it would not be a surprise if the next economic slowdown also shifts the credit cycle into a bit more challenging environment.
Competition is fairly keen in our markets, with about 25 different banks and 220 bank branches in the four counties we call home. Total bank deposits grew by 5.5% in those counties over the FDIC’s past two year measurement period, while CSB’s deposits grew by 10%. There is a lot of room for CSB to increase deposit share within our markets, but we are pleased to have improved from the 7th largest deposit share in our four county area to the 6th position, with one out of every twenty FDIC-insured dollars in the market now on deposit at CSB. 2017 was the 9th consecutive year that CSB’s total deposit market share was the highest of any community bank with operations in the four county area. Coupled with loan balances that grew more than 20% in the past two years, the numbers indicate that our focus on providing noticeably different service is being met with favorable market response.
Interest rates have clearly shifted into a rising trajectory. The Federal Reserve expects to continue gradually raising the Federal Funds rate for some period of time, and financial markets have responded by driving yields on short and medium term securities higher. As a result, interest rates on loans and deposits began to rise during 2017 and we would not be surprised to see the pattern of higher cost loans and better yielding deposit rates continue for the next year or more.
Various federal regulatory agencies are evaluating a number of initiatives aimed at finding the “right balance” of prudential oversight. We do not expect a significant relaxation of consumer protections or safety and soundness expectations, nor do we think a broad relaxation would be appropriate given some of the publicized problems within the industry over the past several years. But more importantly, compliance is aligned with CSB’s core values of integrity and honesty in all we do, and doing the right things are engrained within our business strategy. It’s who we are and who we strive to be.

|
|
||||
|
LETTER TO SHAREHOLDERS | ||||
|
Cyber risk (the risk of financial loss, disruption, or damage to an individual or organization from some sort of failure of information technology) is pervasive and continues to proliferate. We are committed to protecting the nonpublic, personally identifiable information and financial assets entrusted to us. Toward that end, we continue to strengthen internal controls, vendor controls, and monitoring systems and protocols. We are happy to speak with any stakeholder about the efforts each of us can make to reduce the risk of loss from a fraudulent transaction, scam, or breach of security. Industry consolidation has also been a steady presence in banking for quite some time. Roughly 4% of banks have been merging out of existence in recent years; 4.3% disappeared in 2017, while 30% of banks have dropped out in the past eight years. M&A activity in Ohio has also been fairly steady, but at a bit slower pace. Deal pricing increased in 2017, with average deal multiples about 20% higher on a price-to-book basis than in the prior year. We continuously watch for potentially attractive merger and acquisition opportunities, always evaluating such scenarios through the lens of our commitment to add value for our shareholders as an independent community bank. | ||||
|
BUILDING OUR WAY TO EXCELLENCE This Company’s path to enduring greatness rests upon its ability to perpetually develop capable, committed, and courageous leaders throughout the organization. We are proud to report that we continue to see outstanding leadership development among CSB team members. The Company was also honored as a recipient of the NorthCoast 99 award in 2017, recognizing CSB as one of the best workplaces for top talent in northeast Ohio. Continuous improvement is incumbent upon organizations that seek to thrive not only in the present, but going forward in the future. By definition, continuous improvement is not a short term initiative; however, in our view it is worthy of our sustained best efforts at building an ever-better banking experience for CSB stakeholders. We are therefore committed to work smart and maintain organizational agility by making prudent and timely systems improvements, investing wisely in market growth, and developing and supporting outstanding talent. | ||||
|
WORDS OF GRATITUDE CSB’s board of directors provides diligent governance oversight of the company, and we thank them for their continuous work. Two new directors, Ms. Vikki Briggs and Ms. Cheryl Kirkbride, were recently elected to the board; and Mr. Ron Holtman will conclude a 17 year tenure of outstanding board service as of this year’s annual shareholder meeting. Please note the inset honoring Director Holtman on page 62. Finally, thank you for being a shareholder of CSB. You help provide the capital required for CSB to carry out its purpose-driven work. We believe community-based banks are significant contributors to the health and well-being of local markets, and we are proud to give our best efforts in helping sustain the areas we serve while generating increasing shareholder value. | ||||
|
EDDIE STEINER President and Chief Executive Officer |
ROBERT “ROC” BAKER Chairman of the Board of Directors | |||


6
2017 Report to Shareholders | CSB Bancorp, Inc.
|
2017 FINANCIAL REVIEW
|
| |
| INTRODUCTION CSB Bancorp, Inc. (the “Company” or “CSB”) was incorporated under the laws of the State of Ohio in 1991 and is a registered financial holding company. The Company’s wholly-owned subsidiaries are The Commercial and Savings Bank (the “Bank”) and CSB Investment Services, LLC. The Bank is chartered under the laws of the State of Ohio and was organized in 1879. The Bank is a member of the Federal Reserve System, with deposits insured by the Federal Deposit Insurance Corporation, and its primary regulators are the Ohio Division of Financial Institutions and the Federal Reserve Board. The Company, through the Bank, provides retail and commercial banking services to its customers including checking and savings accounts, time deposits, cash management, safe deposit facilities, personal loans, commercial loans, real estate mortgage loans, installment loans, IRAs, night depository facilities, and trust and brokerage services. Its customers are located primarily in Holmes, Tuscarawas, Wayne, Stark, and portions of surrounding counties in Ohio. |
||
| Economic activity in the Company’s market area has continued to strengthen at a steady pace for the past nine years. The expansion has been most prevalent in small to mid-sized manufacturing and across various professional and non-professional service sectors. Reported unemployment levels at December 2017 ranged from 3.1% to 5% in the four primary counties served by the Company. These levels declined slightly from December 2016. Labor markets continued to tighten during the year. Wage pressure has increased for most entry-level jobs and to a lesser extent middle-skills jobs in certain sectors such as banking and construction. The local housing market continues to improve. Higher costs of building materials and higher fuel costs have contributed to increased housing construction costs. Consumer confidence in the economy has been a primary driver for the strong housing demand and higher consumer spending. |
||
|
FORWARD-LOOKING STATEMENTS Certain statements contained in Management’s Discussion and Analysis of Financial Condition and Results of Operations are not related to historical results, but are forward-looking statements within the meaning of the Private Securities Litigation Reform Act of 1995. These statements involve a number of risks and uncertainties. Any forward-looking statements made by the Company herein and in future reports and statements are not guarantees of future performance. Actual results may differ materially from those in forward-looking statements because of various risk factors as discussed in this annual report and the Company’s Annual Report on Form 10-K. The Company does not undertake, and specifically disclaims, any obligation to publicly release the result of any revisions to any forward-looking statements to reflect the occurrence of unanticipated events or circumstances after the date of such statements. |
||
|
|
||
|
|
||
|
|
||
2017 Report to Shareholders | CSB Bancorp, Inc.
7
2017 FINANCIAL REVIEW
SELECTED FINANCIAL DATA
The following table sets forth certain selected consolidated financial information:
| (Dollars in thousands, except share data) | 2017 | 2016 | 2015 | 2014 | 2013 | |||||||||||||||
|
|
||||||||||||||||||||
| Statements of income: |
||||||||||||||||||||
| Total interest income |
$ | 26,440 | $ | 23,632 | $ | 21,997 | $ | 21,656 | $ | 21,138 | ||||||||||
| Total interest expense |
1,988 | 1,473 | 1,567 | 1,729 | 2,255 | |||||||||||||||
|
|
|
|
|
|
|
|
|
|
|
|||||||||||
| Net interest income |
24,452 | 22,159 | 20,430 | 19,927 | 18,883 | |||||||||||||||
| Provision for loan losses |
1,145 | 493 | 389 | 643 | 840 | |||||||||||||||
|
|
|
|
|
|
|
|
|
|
|
|||||||||||
| Net interest income after provision for loan losses |
23,307 | 21,666 | 20,041 | 19,284 | 18,043 | |||||||||||||||
| Noninterest income |
4,340 | 4,296 | 4,424 | 4,250 | 4,318 | |||||||||||||||
| Noninterest expense |
17,316 | 16,255 | 15,796 | 15,082 | 14,848 | |||||||||||||||
|
|
|
|
|
|
|
|
|
|
|
|||||||||||
| Income before income taxes |
10,331 | 9,707 | 8,669 | 8,452 | 7,513 | |||||||||||||||
| Income tax provision |
3,230 | 2,969 | 2,647 | 2,568 | 2,273 | |||||||||||||||
|
|
|
|
|
|
|
|
|
|
|
|||||||||||
| Net income |
$ | 7,101 | $ | 6,738 | $ | 6,022 | $ | 5,884 | $ | 5,240 | ||||||||||
|
|
|
|
|
|
|
|
|
|
|
|||||||||||
| Per share of common stock: |
||||||||||||||||||||
| Basic income per share |
$ | 2.59 | $ | 2.46 | $ | 2.20 | $ | 2.15 | $ | 1.91 | ||||||||||
| Diluted income per share |
2.59 | 2.46 | 2.20 | 2.15 | 1.91 | |||||||||||||||
| Dividends |
0.84 | 0.78 | 0.76 | 0.74 | 0.72 | |||||||||||||||
| Book value |
25.72 | 23.85 | 22.35 | 20.97 | 19.15 | |||||||||||||||
| Average basic common shares outstanding |
2,742,242 | 2,742,028 | 2,739,470 | 2,737,636 | 2,736,473 | |||||||||||||||
| Average diluted common shares outstanding |
2,742,242 | 2,742,028 | 2,742,108 | 2,739,078 | 2,728,477 | |||||||||||||||
| Year-end balances: |
||||||||||||||||||||
| Loans, net |
$ | 511,226 | $ | 470,158 | $ | 418,209 | $ | 406,522 | $ | 374,040 | ||||||||||
| Securities |
128,124 | 132,372 | 166,402 | 143,038 | 151,535 | |||||||||||||||
| Total assets |
707,063 | 669,978 | 650,314 | 620,981 | 596,465 | |||||||||||||||
| Deposits |
583,259 | 540,785 | 525,042 | 500,075 | 480,933 | |||||||||||||||
| Borrowings |
50,889 | 61,127 | 62,063 | 61,580 | 61,130 | |||||||||||||||
| Shareholders’ equity |
70,532 | 65,415 | 61,266 | 57,450 | 52,411 | |||||||||||||||
| Average balances: |
||||||||||||||||||||
| Loans, net |
$ | 491,258 | $ | 443,862 | $ | 407,517 | $ | 400,876 | $ | 369,889 | ||||||||||
| Securities |
131,512 | 147,649 | 151,181 | 145,065 | 138,976 | |||||||||||||||
| Total assets |
692,859 | 651,318 | 633,298 | 604,605 | 581,150 | |||||||||||||||
| Deposits |
553,228 | 519,941 | 505,913 | 479,330 | 468,395 | |||||||||||||||
| Borrowings |
68,255 | 64,528 | 65,515 | 67,657 | 57,882 | |||||||||||||||
| Shareholders’ equity |
68,738 | 64,524 | 59,799 | 55,529 | 52,787 | |||||||||||||||
| Select ratios: |
||||||||||||||||||||
| Net interest margin, tax equivalent basis |
3.80 | % | 3.67 | % | 3.48 | % | 3.56 | % | 3.51 | % | ||||||||||
| Return on average total assets |
1.02 | 1.03 | 0.95 | 0.97 | 0.90 | |||||||||||||||
| Return on average shareholders’ equity |
10.33 | 10.44 | 10.07 | 10.60 | 9.93 | |||||||||||||||
| Average shareholders’ equity as a percent of average total assets |
9.92 | 9.91 | 9.44 | 9.18 | 9.08 | |||||||||||||||
| Net loan charge-offs as a percent of average loans |
0.17 | (0.03 | ) | 0.03 | 0.33 | 0.09 | ||||||||||||||
| Allowance for loan losses as a percent of loans at year-end |
1.08 | 1.11 | 1.10 | 1.07 | 1.34 | |||||||||||||||
| Shareholders’ equity as a percent of total year-end assets |
9.98 | 9.76 | 9.42 | 9.25 | 8.79 | |||||||||||||||
| Dividend payout ratio |
32.45 | 31.71 | 34.55 | 34.42 | 37.60 | |||||||||||||||
8
2017 Report to Shareholders | CSB Bancorp, Inc.
2017 FINANCIAL REVIEW
RESULTS OF OPERATIONS
Net Income
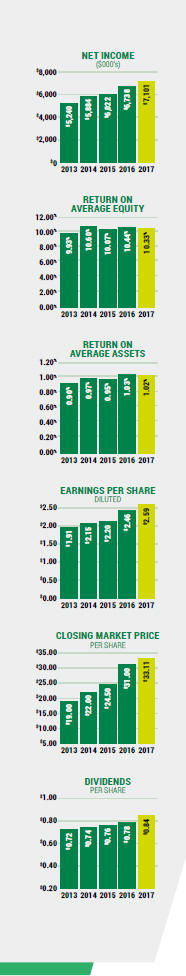
CSB’s 2017 net income was $7.1 million compared to $6.7 million for 2016, an increase of 5%. Total revenue, net interest income plus noninterest income, increased 9% over the prior year. Expense increases included the provision for loan losses of $652 thousand, noninterest expenses of $1.1 million and the provision for income tax of $261 thousand. Basic and diluted earnings per share were $2.59, up 5% from the prior year. The return on average assets was 1.02% in 2017 compared to 1.03% in 2016 and return on average equity was 10.33% in 2017 compared to 10.44% in 2016.
Net income for 2016 was $6.7 million while basic and diluted earnings per share were $2.46 as compared to $6.0 million, or $2.20 per share, for the year ended December 31, 2015. Net income increased 12% during 2016 as compared to 2015 due primarily to a $1.7 million increase in total net interest income partially offset by increases of $104 thousand in the provision for loan losses, $459 thousand in noninterest expenses, and $322 thousand in federal income taxes. Return on average assets was 1.03% in 2016 compared to 0.95% in 2015 and return on average shareholders’ equity was 10.44% in 2016 as compared to 10.07% in 2015.
Net Interest Income
| (Dollars in thousands) | 2017 | 2016 | 2015 | |||||||||
|
|
||||||||||||
| Net interest income |
$ | 24,452 | $ | 22,159 | $ | 20,430 | ||||||
| Taxable equivalent1 |
381 | 372 | 328 | |||||||||
|
|
|
|
|
|
|
|||||||
| Net interest income, fully taxable equivalent |
$ | 24,833 | $ | 22,531 | $ | 20,758 | ||||||
|
|
|
|
|
|
|
|||||||
| Net interest margin |
3.74 | % | 3.61 | % | 3.42 | % | ||||||
| Taxable equivalent adjustment1 |
0.06 | 0.06 | 0.06 | |||||||||
|
|
|
|
|
|
|
|||||||
| Net interest margin-taxable equivalent |
3.80 | % | 3.67 | % | 3.48 | % | ||||||
|
|
|
|
|
|
|
|||||||
1Taxable equivalent adjustments have been computed assuming a 34% tax rate.
Net interest income is the largest source of the Company’s revenue and consists of the difference between interest income generated on earning assets and interest expense incurred on liabilities (deposits, short-term and long-term borrowings). Volumes, interest rates, composition of interest-earning assets, and interest-bearing liabilities affect net interest income.
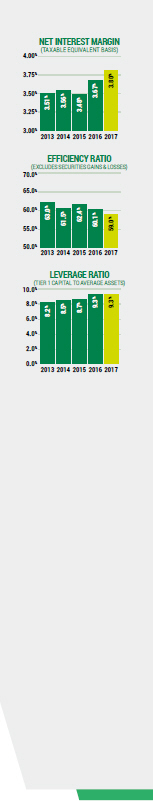
Net interest income increased $2.3 million, or 10%, in 2017 compared to 2016 primarily due to an 11% increase in average loan balances and an increase of 13 basis points in the average rate earned on loans. The net interest margin increased to 3.80% from 3.67% in 2016.
Net interest income increased $1.8 million, or 9%, in 2016 compared to 2015 partially due to a 9% increase in average loan balances and a decrease of 3 basis points in the average rate paid on interest-bearing liabilities. The net interest margin increased to 3.67% from 3.48% in 2015.
Interest income increased $2.8 million, or 12%, in 2017 compared to 2016 due to a $39 million increase in average interest-earning asset balances. The increase in average loan volume throughout the year helped mitigate the low interest rate environment.
Interest income increased $1.6 million, or 7%, in 2016 compared to 2015 due to a $37 million increase in average loan balances. The increase in average loan volume throughout the year helped mitigate the low interest rate environment. In 2016, interest rates paid on deposits hit their lowest point with the first increases to deposit rates starting in December 2016.
Interest expense increased $515 thousand, or 35%, in 2017 as compared to 2016 due to rate increases of 7 basis points on deposits and 22 basis points on other borrowed funds. Long term advances of $10 million were borrowed during second quarter 2017 in advance of a December 2017 advance maturity providing a future rate decrease of 148 basis points. Total average time deposits continued to decline as customers anticipate rising interest rates.
Interest expense decreased $94 thousand, or 6%, in 2016 as compared to 2015 due to decreases in time deposits and other borrowed funds and a continued shift in the liability mix towards less expensive, noninterest bearing demand deposits. Total average time deposits continued to decline as customers anticipate rising interest rates.
2017 Report to Shareholders | CSB Bancorp, Inc.
9
2017 FINANCIAL REVIEW
The following table provides detailed analysis of changes in average balances, yield, and net interest income:
AVERAGE BALANCE SHEETS AND NET INTEREST MARGIN ANALYSIS
| 2017 | 2016 | 2015 | ||||||||||||||||||||||||||||||||||||||||||
| (Dollars in thousands)
|
Average
|
Interest
|
Average
|
Average
|
Interest
|
Average
|
Average
|
Interest
|
Average
|
|||||||||||||||||||||||||||||||||||
| Interest-earning assets |
||||||||||||||||||||||||||||||||||||||||||||
| Federal funds sold |
$ | 575 | $ | 6 | 0.96% | $ | 732 | $ | 3 | 0.44% | $ | 982 | $ | 2 | 0.23% | |||||||||||||||||||||||||||||
| Interest-earning deposits |
23,780 | 283 | 1.19 | 16,946 | 107 | 0.63 | 32,395 | 94 | 0.29 | |||||||||||||||||||||||||||||||||||
| Securities: |
||||||||||||||||||||||||||||||||||||||||||||
| Taxable |
99,981 | 2,374 | 2.37 | 119,701 | 2,598 | 2.17 | 129,700 | 2,790 | 2.15 | |||||||||||||||||||||||||||||||||||
| Tax exempt |
31,531 | 1,030 | 3.27 | 27,948 | 985 | 3.52 | 21,481 | 854 | 3.97 | |||||||||||||||||||||||||||||||||||
| Loans3 |
497,048 | 23,128 | 4.65 | 448,941 | 20,311 | 4.52 | 412,147 | 18,585 | 4.51 | |||||||||||||||||||||||||||||||||||
|
|
|
|
|
|
|
|
|
|
|
|
|
|||||||||||||||||||||||||||||||||
| Total interest-earning assets |
652,915 | 26,821 | 4.11% | 614,268 | 24,004 | 3.91% | 596,705 | 22,325 | 3.74% | |||||||||||||||||||||||||||||||||||
| Noninterest-earning assets |
||||||||||||||||||||||||||||||||||||||||||||
| Cash and due from banks |
14,677 | 13,914 | 13,661 | |||||||||||||||||||||||||||||||||||||||||
| Bank premises and equipment, net |
8,817 | 8,531 | 8,290 | |||||||||||||||||||||||||||||||||||||||||
| Other assets |
22,240 | 19,684 | 19,272 | |||||||||||||||||||||||||||||||||||||||||
| Allowance for loan losses |
(5,790 | ) | (5,079 | ) | (4,630 | ) | ||||||||||||||||||||||||||||||||||||||
|
|
|
|
|
|
|
|||||||||||||||||||||||||||||||||||||||
| Total assets |
$ | 692,859 | $ | 651,318 | $ | 633,298 | ||||||||||||||||||||||||||||||||||||||
|
|
|
|
|
|
|
|||||||||||||||||||||||||||||||||||||||
| Interest-bearing liabilities |
||||||||||||||||||||||||||||||||||||||||||||
| Demand deposits |
$ | 101,081 | 129 | 0.13% | $ | 83,956 | 33 | 0.04% | $ | 77,689 | 27 | 0.03% | ||||||||||||||||||||||||||||||||
| Savings deposits |
170,694 | 302 | 0.18 | 163,271 | 123 | 0.08 | 158,531 | 113 | 0.07 | |||||||||||||||||||||||||||||||||||
| Time deposits |
111,650 | 913 | 0.82 | 116,427 | 850 | 0.73 | 125,180 | 941 | 0.75 | |||||||||||||||||||||||||||||||||||
| Borrowed funds |
68,255 | 644 | 0.94 | 64,528 | 467 | 0.72 | 65,515 | 486 | 0.74 | |||||||||||||||||||||||||||||||||||
|
|
|
|
|
|
|
|
|
|
|
|
|
|||||||||||||||||||||||||||||||||
| Total interest-bearing liabilities |
451,680 | 1,988 | 0.44% | 428,182 | 1,473 | 0.34% | 426,915 | 1,567 | 0.37% | |||||||||||||||||||||||||||||||||||
|
|
|
|
|
|
|
|
|
|
|
|
|
|||||||||||||||||||||||||||||||||
| Noninterest-bearing liabilities and shareholders’ equity |
||||||||||||||||||||||||||||||||||||||||||||
| Demand deposits |
169,803 | 156,287 | 144,513 | |||||||||||||||||||||||||||||||||||||||||
| Other liabilities |
2,638 | 2,325 | 2,071 | |||||||||||||||||||||||||||||||||||||||||
| Shareholders’ equity |
68,738 | 64,524 | 59,799 | |||||||||||||||||||||||||||||||||||||||||
|
|
|
|
|
|
|
|||||||||||||||||||||||||||||||||||||||
| Total liabilities and equity |
$ | 692,859 | $ | 651,318 | $ | 633,298 | ||||||||||||||||||||||||||||||||||||||
|
|
|
|
|
|
|
|||||||||||||||||||||||||||||||||||||||
| Net interest income4 |
$ | 24,833 | $ | 22,531 | $ | 20,758 | ||||||||||||||||||||||||||||||||||||||
|
|
|
|
|
|
|
|||||||||||||||||||||||||||||||||||||||
| Net interest margin |
3.80% | 3.67% | 3.48% | |||||||||||||||||||||||||||||||||||||||||
| Net interest spread |
3.67% | 3.57% | 3.37% | |||||||||||||||||||||||||||||||||||||||||
1Average balances have been computed on an average daily basis.
2Average rates have been computed based on the amortized cost of the corresponding asset or liability.
3Average loan balances include nonaccrual loans.
4Net interest income is shown on a fully tax-equivalent basis.
10
2017 Report to Shareholders | CSB Bancorp, Inc.
2017 FINANCIAL REVIEW
The following table compares the impact of changes in average rates and changes in average volumes on net interest income:
RATE/VOLUME ANALYSIS OF CHANGES IN INCOME AND EXPENSE1
| 2017 v. 2016 |
2016 v. 2015 | ||||||||||||||||||||||||||||||||||
| (Dollars in thousands) |
Net Increase
|
Volume
|
Rate
|
Net Increase
|
Volume
|
Rate | |||||||||||||||||||||||||||||
| Increase (decrease) in interest income: |
|||||||||||||||||||||||||||||||||||
| Federal funds |
$ | 3 | $ | (2 | ) | $ | 5 | $ | 1 | $ | (1 | ) | $ | 2 | |||||||||||||||||||||
| Interest-earning deposits |
176 | 82 | 94 | 13 | (98 | ) | 111 | ||||||||||||||||||||||||||||
| Securities: |
|||||||||||||||||||||||||||||||||||
| Taxable |
(224 | ) | (469 | ) | 245 | (192 | ) | (217 | ) | 25 | |||||||||||||||||||||||||
| Tax exempt |
45 | 117 | (72 | ) | 131 | 228 | (97 | ) | |||||||||||||||||||||||||||
| Loans |
2,817 | 2,245 | 572 | 1,726 | 1,665 | 61 | |||||||||||||||||||||||||||||
|
|
|
|
|
|
|
|
|
|
|
|
|
||||||||||||||||||||||||
| Total interest income change |
2,817 | 1,973 | 844 | 1,679 | 1,577 | 102 | |||||||||||||||||||||||||||||
|
|
|
|
|
|
|
|
|
|
|
|
|
||||||||||||||||||||||||
| Increase (decrease) in interest expense: |
|||||||||||||||||||||||||||||||||||
| Demand deposits |
96 | 22 | 74 | 6 | 2 | 4 | |||||||||||||||||||||||||||||
| Savings deposits |
179 | 13 | 166 | 10 | 4 | 6 | |||||||||||||||||||||||||||||
| Time deposits |
63 | (39 | ) | 102 | (91 | ) | (64 | ) | (27 | ) | |||||||||||||||||||||||||
| Other borrowed funds |
177 | 35 | 142 | (19 | ) | (7 | ) | (12 | ) | ||||||||||||||||||||||||||
|
|
|
|
|
|
|
|
|
|
|
|
|
||||||||||||||||||||||||
| Total interest expense change |
515 | 31 | 484 | (94 | ) | (65 | ) | (29) | |||||||||||||||||||||||||||
|
|
|
|
|
|
|
|
|
|
|
|
|
||||||||||||||||||||||||
| Net interest income change |
$ | 2,302 | $ | 1,942 | $ | 360 | $ | 1,773 | $ | 1,642 | $ | 131 | |||||||||||||||||||||||
|
|
|
|
|
|
|
|
|
|
|
|
|
||||||||||||||||||||||||
1Changes attributable to both volume and rate, which cannot be segregated, have been allocated based on the absolute value of the change due to volume and the change due to rate.
Provision For Loan Losses
The provision for loan losses is determined by management as the amount required to bring the allowance for loan losses to a level considered appropriate to absorb probable future net charge-offs inherent in the loan portfolio as of period end. The provision for loan losses was $1.1 million in 2017, $493 thousand in 2016, and $389 thousand in 2015. Higher provision expense in 2017 and 2016 reflects an increasing volume in the loan portfolio, higher loan losses, and an increase in nonperforming loans. See “Financial Condition – Allowance for Loan Losses” for additional discussion and information relative to the provision for loan losses.
Noninterest Income
| YEAR ENDED DECEMBER 31 | |||||||||||||||||||||||||||||||||||
| Change from 2016 | Change from 2015 | ||||||||||||||||||||||||||||||||||
| (Dollars in thousands) | 2017 | Amount
|
%
|
2016
|
Amount
|
%
|
2015
| ||||||||||||||||||||||||||||
| Service charges on deposit accounts |
$ | 1,133 | $ | (33 | ) | (2.8 | )% | $ | 1,166 | $ (37 | ) | (3.1 | )% | $ | 1,203 | ||||||||||||||||||||
| Trust services |
687 | (174 | ) | (20.2 | ) | 861 | 1 | 0.0 | 860 | ||||||||||||||||||||||||||
| Debit card interchange fees |
1,193 | 106 | 9.8 | 1,087 | 99 | 10.0 | 988 | ||||||||||||||||||||||||||||
| Gain on sale of loans, including MSRs |
296 | (13 | ) | (4.2 | ) | 309 | (54 | ) | (14.9 | ) | 363 | ||||||||||||||||||||||||
| Earnings on bank-owned life insurance |
357 | 81 | 29.3 | 276 | 6 | 2.2 | 270 | ||||||||||||||||||||||||||||
| Securities gains |
– | (1 | ) | (100.0 | ) | 1 | (55 | ) | (98.2 | ) | 56 | ||||||||||||||||||||||||
| Other |
674 | 78 | 13.1 | 596 | (88 | ) | (12.9 | ) | 684 | ||||||||||||||||||||||||||
|
|
|
|
|
|
|
|
|
|
|
||||||||||||||||||||||||||
| Total noninterest income |
$ | 4,340 | $ | 44 | 1.0 | % | $ | 4,296 | $ (128 | ) | (2.9 | )% | $ | 4,424 | |||||||||||||||||||||
|
|
|
|
|
|
|
|
|
|
|
||||||||||||||||||||||||||
2017 Report to Shareholders | CSB Bancorp, Inc.
11
2017 FINANCIAL REVIEW
Noninterest income increased $44 thousand, or 1%, in 2017 compared to the same period in 2016. Gains on sales of mortgage loans including mortgage servicing rights (“MSRs”) decreased 4% due to decreasing sales of real estate mortgage loans into the secondary market and customers opting into variable rate mortgages that have been retained by the Bank. The Bank originated and sold $11 million in mortgage loans in 2017 as compared to the sale of $11 million of loans in 2016. Service charges on deposits, which are primarily customer overdraft fees, decreased 3% in 2017, with a 3% decrease in overdraft fees due to improving consumer deposit balances. Debit card interchange fees increased 10% in 2017 compared to 2016 due to volume increases. Earnings on bank owned life insurance increased $81 thousand with the addition of $2.5 million in policy values in 2017. Trust and brokerage services decreased 20% as a reorganization of the departments was completed with fees declining through third quarter 2017 and then stabilizing in fourth quarter 2017 over fourth quarter 2016.
Noninterest income decreased $128 thousand, or 3%, in 2016 compared to the same period in 2015. Gains on sales of mortgage loans including MSRs decreased 15% due to decreasing sales of real estate mortgage loans into the secondary market and customers opting into variable rate mortgages that have been retained by the Bank. The Bank originated and sold $11 million in mortgage loans in 2016 as compared to the sale of $12 million of loans in 2015. Service charges on deposits, which are primarily customer overdraft fees, decreased 3% in 2016, with a 6% decrease in overdraft fees due to increasing health of consumer deposit balances. Debit card interchange fees increase 10% in 2016 compared to 2015 due to increased volume.
Noninterest Expenses
|
YEAR ENDED DECEMBER 31 | |||||||||||||||||||||||||||||||||||
| Change from 2016
|
Change from 2015
|
||||||||||||||||||||||||||||||||||
| (Dollars in thousands) | 2017
|
Amount
|
%
|
2016
|
Amount
|
%
|
2015
| ||||||||||||||||||||||||||||
| Salaries and employee benefits |
$ | 10,009 | $ | 655 | 7.0 | % | $ | 9,354 | $ | 535 | 6.1 | % | $ | 8,819 | |||||||||||||||||||||
| Occupancy expense |
869 | (104 | ) | (10.7 | ) | 973 | (54 | ) | (5.3 | ) | 1,027 | ||||||||||||||||||||||||
| Equipment expense |
665 | (14 | ) | (2.1 | ) | 679 | 16 | 2.4 | 663 | ||||||||||||||||||||||||||
| Professional and director fees |
963 | 131 | 15.7 | 832 | 2 | 0.2 | 830 | ||||||||||||||||||||||||||||
| Financial institutions tax |
523 | 96 | 22.5 | 427 | 27 | 6.8 | 400 | ||||||||||||||||||||||||||||
| Marketing and public relations |
401 | (14 | ) | (3.4 | ) | 415 | (4 | ) | (1.0 | ) | 419 | ||||||||||||||||||||||||
| Software expense |
879 | 80 | 10.0 | 799 | (2 | ) | (0.2 | ) | 801 | ||||||||||||||||||||||||||
| Debit card expense |
535 | 90 | 20.2 | 445 | 32 | 7.7 | 413 | ||||||||||||||||||||||||||||
| FDIC insurance |
225 | (57 | ) | (20.2 | ) | 282 | (75 | ) | (21.0 | ) | 357 | ||||||||||||||||||||||||
| Amortization of intangible assets |
116 | (5 | ) | (4.1 | ) | 121 | (4 | ) | (3.2 | ) | 125 | ||||||||||||||||||||||||
| Other |
2,131 | 203 | 10.5 | 1,928 | (14 | ) | (0.7 | ) | 1,942 | ||||||||||||||||||||||||||
|
|
|
|
|
|
|
|
|
|
|
||||||||||||||||||||||||||
| Total noninterest expenses |
$ | 17,316 | $ | 1,061 | 6.5 | % | $ | 16,255 | $ | 459 | 2.9 | % | $ | 15,796 | |||||||||||||||||||||
|
|
|
|
|
|
|
|
|
|
|
||||||||||||||||||||||||||
Noninterest expense increased $1.1 million, or 7%, in 2017 compared to 2016. Salaries and employee benefits increased $655 thousand due to base compensation increasing $432 thousand as a result of additional full-time employees and annual adjustments. Increases in 2017 include retirement benefits and incentive compensation of $112 thousand, medical and dental expense rising $41 thousand, and employment taxes rising $11 thousand. The capitalization of employee costs of loan originations contributed to an increase in salary expense of $54 thousand. Professional and director fees increased $131 thousand primarily due to increased accounting and audit fees of $145 thousand, due to the outsourcing of internal audit and first year expenses for the internal control audit, required under Section 404(b) of the Sarbanes-Oxley Act. Debit card expense increased $90 thousand in 2017. At the end of 2017, all customers had been issued debit cards with embedded chips that protect cardholder data. An increase in the Ohio financial institutions tax was recognized as capital increased. Equipment expense decreased $14 thousand in 2017, as compared to 2016, due to a decline in depreciation expense of $66 thousand partially offset by increases in maintenance, repair, and small equipment replacement. The FDIC insurance assessment decreased $57 thousand, or 20%, due to a rate reduction that started July 1, 2016. Occupancy expense continued to decrease primarily with a reduction of branch facility costs, which included a full year savings on a branch relocation. Other expenses increased $203 thousand including an increase of $64 thousand start-up costs for an employee wellness program, $37 thousand in fraud check losses, and $22 thousand in paper and printing costs.
Noninterest expense increased $459 thousand, or 3%, in 2016 compared to 2015. Salaries and employee benefits increased $535 thousand due to base compensation increasing $436 thousand as a result of additional full-time employees and annual adjustments. Other increases in 2016 included medical and dental expense of $45 thousand and employment taxes of $38 thousand. The capitalization of employee costs of loan originations contributed to a decrease in salary expense of $109 thousand. Debit card expense increased $32 thousand in 2016, with increased costs due to the migration to EMV chip cards. Debit cards are being issued with embedded chips that protect cardholder data. An increase in the Ohio financial institutions tax was recognized as capital increased. Equipment expense
12
2017 Report to Shareholders | CSB Bancorp, Inc.
2017 FINANCIAL REVIEW
increased $16 thousand in 2016, as compared to 2015, with small equipment replacement. The FDIC insurance assessment decreased $75 thousand, or 21%, due to a rate reduction starting July 1, 2016. Occupancy expense decreased primarily with a reduction of branch facility costs, which included a branch relocation and the purchase of a branch office that had been previously leased.
Income Taxes
The provision for income taxes amounted to $3.2 million in 2017, $3.0 million in 2016, and $2.6 million in 2015. The increase in 2017 included the Tax Cuts and Jobs Act (“TCJA”) income tax increase adjustment of $101 thousand resulting from the write down of a deferred tax asset of $109 thousand related to unrealized losses on securities, as the valuation rate on this future tax deduction was reduced from 34% to 21% in accordance with the TCJA. The effective tax rate, without the TCJA adjustment, decreased slightly with an increase in tax exempt income.
FINANCIAL CONDITION
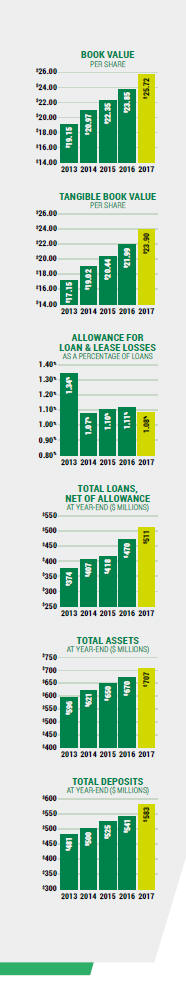
Total assets of the Company were $707 million at December 31, 2017, compared to $670 million at December 31, 2016, representing an increase of $37 million, or 6%. Net loans increased $41 million, or 9%, while investment securities decreased $4 million, or 3%, and interest-earning deposits with other banks decreased $4 million, which was offset by a $4 million increase in cash and due from banks. Deposits increased $42 million and short-term borrowings decreased $9 million, while other borrowings from the Federal Home Loan Bank (“FHLB”) decreased by $1 million, or 8%.
Securities
Total investment securities decreased $4 million, or 3%, to $128 million at year-end 2017. CSB’s portfolio is primarily comprised of agency mortgage-backed securities, obligations of state and political subdivisions, other government agencies’ debt, and corporate bonds. Restricted securities consist primarily of FHLB stock.
The Company has no exposure to government-sponsored enterprise preferred stocks, collateralized debt obligations, or trust preferred securities. The Company’s municipal bond portfolio consists of both taxable and tax-exempt general obligation and revenue bonds. As of December 31, 2017, $26 million, or 82%, held an S&P or Moody’s investment grade rating and $6 million, or 18%, were non-rated. The municipal portfolio includes a broad spectrum of counties, towns, universities, and school districts with 88% of the portfolio originating in Ohio, and 12% in Pennsylvania. Gross unrealized security losses within the portfolio were 1% of total securities at December 31, 2017, reflecting interest rate fluctuations, not credit downgrades.
One of the primary functions of the securities portfolio is to provide a source of liquidity and it is structured such that maturities and cash flows track the Company’s liquidity needs and asset/liability management requirements.
Loans
Total loans increased $41 million, or 9%, during 2017 with increases in all loan categories, except for a small decrease in construction and land development. Volume increases were recognized as follows: residential real estate loans increased $13 million, or 9%, commercial loans increased $6 million, or 4%, and commercial real estate loans increased $20 million, or 13%. Aided by low interest rates, business expansion and consumer borrowing continued to increase throughout 2017.
Attractive interest rates in the secondary market continued to drive consumer demand for longer-term 1-4 family fixed rate residential mortgages during 2017. The Company sold $11 million of originated mortgages into the secondary market, as compared to $11 million in 2016. The Company originated $29 million of portfolio mortgage loans, which were predominately variable rate in 2017 as compared to 2016 origination of $36 million for the Company’s portfolio. Demand for home equity loans improved in 2017, with balances increasing $351 thousand. Installment lending continued to improve with consumer loans increasing 23% on a year-over-year basis to $16 million at December 31, 2017. This growth is primarily from RV finance loans, originated in northeast Ohio.
Management anticipates the Company’s local service areas will continue to exhibit modest economic growth in line with the past three years. Commercial and commercial real estate loans comprise approximately 62% of the total loan portfolio at year-end 2017 and 2016, respectively. Residential real estate loans remained stable at approximately 31% of the total loan portfolio. Construction and land development loans declined to 4% of the total portfolio at December 31, 2017. The Company is well within the respective regulatory guidelines for investment in construction, development, and investment property loans that are not owner occupied.
Most of the Company’s lending activity is with customers primarily located within Holmes, Tuscarawas, Wayne, and Stark counties in Ohio. Credit concentrations, including commitments, as determined using North American Industry Classification Codes (NAICS), to the four largest industries compared to total loans at December 31, 2017, included $41 million, or 8%, of total loans to lessors of non-residential buildings or dwellings; $30 million, or 6%, of total loans to borrowers in the hotel, motel, and lodging business; $26 million, or 5%, of total loans to logging, sawmills, and timber tract operations; and $21 million, or 4%, of total loans to lessors of residential real estate. These loans are generally secured by real property and equipment, with repayment expected from operational cash flow. Credit evaluation is based on a review of cash flow coverage of principal, interest payments, and the adequacy of the collateral received.
2017 Report to Shareholders | CSB Bancorp, Inc.
13
2017 FINANCIAL REVIEW
Nonperforming Assets, Impaired Loans, and Loans Past Due 90 Days or More
Nonperforming assets consist of nonaccrual loans, loans past due 90 days and still accruing, and other real estate acquired through or in lieu of foreclosure. Other impaired loans include certain loans that are internally classified as substandard or doubtful. Loans are placed on nonaccrual status when they become past due 90 days or more, or when mortgage loans are past due as to principal and interest 120 days or more, unless they are both well secured and in the process of collection.
The increase in nonperforming loans year-over-year is primarily due to three lending relationships comprised of several loans. Approximately $2.9 million of the nonperforming loan total is guaranteed by either the USDA or the SBA.
| NONPERFORMING ASSETS | DECEMBER 31 | |||||||
| (Dollars in thousands)
|
2017
|
2016
|
||||||
|
|
||||||||
| Nonaccrual loans |
||||||||
|
Commercial
|
$ | 1,152 | $ | 425 | ||||
| Commercial real estate
|
4,384 | 497 | ||||||
| Residential real estate
|
487 | 490 | ||||||
| Construction & land development
|
– | – | ||||||
| Consumer
|
58 | 37 | ||||||
| Loans past due 90 days or more and still accruing
|
||||||||
| Commercial
|
– | – | ||||||
| Commercial real estate
|
40 | 39 | ||||||
| Residential real estate
|
401 | 196 | ||||||
| Construction & land development |
– | – | ||||||
|
|
|
|
|
|||||
| Total nonperforming loans
|
6,522 | 1,684 | ||||||
| Other real estate owned |
– | – | ||||||
|
|
|
|
|
|||||
| Total nonperforming assets |
$ | 6,522 | $ | 1,684 | ||||
|
|
|
|
|
|||||
| Nonperforming assets as a percentage of loans plus other real estate |
1.26 | % | 0.35 | % | ||||
Allowance for Loan Losses
The allowance for loan losses is maintained at a level considered by management to be adequate to cover loan losses that are currently anticipated based on past loss experience, general economic conditions, changes in mix and size of the loan portfolio, information about specific borrower situations, and other factors and estimates which are subject to change over time. Management periodically reviews selected large loans, delinquent and other problem loans, and selected other loans. Collectability of these loans is evaluated by considering the current financial position and performance of the borrower, estimated market value of the collateral, the Company’s collateral position in relationship to other creditors, guarantees, and other potential sources of repayment. Management forms judgments, which are in part subjective, as to the probability of loss and the amount of loss on these loans as well as other loans taken together. The Company’s Allowance for Loan Losses Policy includes, among other items, provisions for classified loans, and a provision for the remainder of the portfolio based on historical data, including past charge-offs.
14
2017 Report to Shareholders | CSB Bancorp, Inc.
2017 FINANCIAL REVIEW
| ALLOWANCE FOR LOAN LOSSES | FOR THE YEAR ENDED | |||||||
| (Dollars in thousands)
|
2017 | 2016 | ||||||
|
|
||||||||
| Beginning balance of allowance for loan losses
|
$ | 5,291 | $ | 4,662 | ||||
| Provision for loan losses
|
1,145 | 493 | ||||||
| Charge-offs:
|
||||||||
| Commercial
|
1,184 | 297 | ||||||
| Commercial real estate
|
– | 50 | ||||||
| Residential real estate & home equity
|
– | 12 | ||||||
| Construction & land development
|
– | – | ||||||
| Consumer
|
20 | 59 | ||||||
| Credit cards |
– | – | ||||||
|
|
|
|
|
|||||
| Total charge-offs
|
1,204 | 418 | ||||||
| Recoveries:
|
||||||||
| Commercial
|
361 | 214 | ||||||
| Commercial real estate
|
– | 334 | ||||||
| Residential real estate & home equity
|
8 | 5 | ||||||
| Construction & land development
|
– | – | ||||||
| Consumer
|
3 | 1 | ||||||
| Credit cards |
– | – | ||||||
|
|
|
|
|
|||||
| Total recoveries |
372 | 554 | ||||||
|
|
|
|
|
|||||
| Net (recoveries) charge-offs |
832 | (136 | ) | |||||
|
|
|
|
|
|||||
| Ending balance of allowance for loan losses |
$ | 5,604 | $ | 5,291 | ||||
|
|
|
|
|
|||||
| Net charge-offs as a percentage of average total loans
|
0.17 | % | (0.03 | )% | ||||
| Allowance for loan losses as a percentage of total loans
|
1.08 | 1.11 | ||||||
| Allowance for loan losses to total nonperforming loans
|
0.86 | x | 3.14 | x | ||||
| Components of the allowance for loan losses:
|
||||||||
| General reserves
|
$ | 5,360 | $ | 4,562 | ||||
| Specific reserve allocations |
244 | 729 | ||||||
|
|
|
|
|
|||||
| Total allowance for loan losses |
$ | 5,604 | $ | 5,291 | ||||
|
|
|
|
|
|||||
The allowance for loan losses totaled $5.6 million, or 1.08%, of total loans at year-end 2017 as compared to $5.3 million, or 1.11%, of total loans at year-end 2016. The Bank had net charge-offs of $832 thousand for 2017 as compared to net recoveries of $136 thousand in 2016.
The Company maintains an internal watch list on which it places loans where management’s analysis of the borrower’s operating results and financial condition indicates the borrower’s cash flows are inadequate to meet its debt service requirements and loans where there exists an increased risk that such a shortfall may occur. Nonperforming loans, which consist of loans past due 90 days or more and nonaccrual loans, aggregated $6.5 million, or 1.26%, of loans at year-end 2017 as compared to $1.7 million, or 0.35% of loans at year-end 2016. Impaired loans were $7.9 million at year-end 2017 as compared to $7.2 million at year-end 2016. Management has assigned loss allocations to absorb the estimated losses on impaired loans. These allocations are included in the total allowance for loan losses balance.
Other Assets
Net premises and equipment increased $495 thousand to $9.2 million at year-end 2017 primarily because of the construction of a branch facility that consolidated two previously leased facilities in 2016. There was no other real estate owned at December 31, 2017 or 2016. At December 31, 2017, the Company recognized a net deferred tax asset of $162 thousand as compared to a net deferred tax asset of $603 thousand at December 31, 2016.
2017 Report to Shareholders | CSB Bancorp, Inc.
15
2017 FINANCIAL REVIEW
Deposits
The Company’s deposits are obtained primarily from individuals and businesses located in its market area. For deposits, the Company must compete with products offered by other financial institutions, as well as alternative investment options. Demand and savings deposits increased for the year ended 2017, due to focused retail and business banking strategies to obtain more account relationships as well as customers reflecting their preference for shorter maturities.
| December 31 | Change from 2016 | |||||||||||||||
| (Dollars in thousands)
|
2017
|
2016
|
Amount
|
%
|
||||||||||||
|
|
||||||||||||||||
|
Noninterest-bearing demand
|
$ | 173,671 | $ | 167,824 | $ | 5,847 | 3.5 | % | ||||||||
| Interest-bearing demand
|
119,579 | 97,683 | 21,896 | 22.4 | ||||||||||||
| Traditional savings
|
108,468 | 95,275 | 13,193 | 13.8 | ||||||||||||
| Money market savings
|
71,749 | 67,894 | 3,855 | 5.7 | ||||||||||||
| Time deposits in excess of $250,000
|
12,026 | 13,102 | (1,076 | ) | (8.2 | ) | ||||||||||
| Other time deposits
|
97,766 | 99,007 | (1,241 | ) | (1.3 | ) | ||||||||||
|
|
|
|
|
|
|
|||||||||||
| Total deposits |
$ | 583,259 | $ | 540,785 | $ | 42,474 | 7.9 | % | ||||||||
|
|
|
|
|
|
|
|||||||||||
Other Funding Sources
The Company obtains additional funds through securities sold under repurchase agreements, overnight borrowings from the FHLB or other financial institutions, and advances from the FHLB. Short-term borrowings, consisting of securities sold under repurchase agreements, decreased $9 million. During 2017, a new corporate overnight cash management product was established within interest-bearing checking and at December 31, 2017 the new product had balances of $21.8 million. Other borrowings, consisting of FHLB advances, decreased $1 million as the result of maturities and principal repayments. All FHLB borrowings at December 31, 2017 have long term maturities with monthly amortizing payments.
CAPITAL RESOURCES
Total shareholders’ equity increased to $70.5 million at December 31, 2017, as compared to $65.4 million at December 31, 2016. This increase was primarily due to $7.1 million of net income, which was partially offset by the payment of $2.3 million of cash dividends in 2017. The Board of Directors approved a Stock Repurchase Program on July 7, 2005 that allowed the repurchase of up to 10% of the Company’s then-outstanding common shares. Repurchased shares are to be held as treasury stock and are available for general corporate purposes. At December 31, 2017, approximately 41 thousand shares could still be repurchased under the current authorized program. No shares were repurchased in 2017 or 2016.
Effective January 1, 2015, the Federal Reserve adopted final rules implementing Basel III and regulatory capital changes required by the Dodd-Frank Act. The rules apply to both the Company and the Bank. The rules established minimum risk-based and leverage capital requirements for all banking organizations.
The new rules include (a) a new common equity tier 1 capital ratio of at least 4.5%, (b) a tier 1 capital ratio of at least 6.0%, rather than the former 4.0%, (c) a minimum total capital ratio that remains at 8.0%, and (d) a minimum leverage ratio of 4%.
Under the guidelines, capital is compared to the relative risk related to the balance sheet. To derive the risk included in the balance sheet, one of several risk weights is applied to different balance sheet and off-balance sheet assets primarily based on the relative credit risk of the counterparty. The capital amounts and classifications are also subject to qualitative judgments by the regulators about components, risk weightings, and other factors.
The new rules also place restrictions on the payment of capital distributions, including dividends, and certain discretionary bonus payments to executive officers if the company does not hold a capital conservation buffer of greater than 2.5% composed of common equity tier 1 capital above its minimum risk-based capital requirements, or if its eligible retained income is negative in that quarter and its capital conservation buffer ratio was less than 2.5% at the beginning of the quarter. The capital conservation buffer on January 1, 2018, is 1.875%. The Company and Bank’s actual and required capital amounts are disclosed in Note 12 to the consolidated financial statements.
Dividends paid by the Bank to CSB are the primary source of funds available to the Company for payment of dividends to shareholders and for other working capital needs. The payment of dividends by the Bank to the Company is subject to restrictions by regulatory authorities, which generally limit dividends to current year net income and the prior two years net retained earnings, as defined by regulation. In addition, dividend payments generally cannot reduce regulatory capital levels below the minimum regulatory guidelines discussed above.
16
2017 Report to Shareholders | CSB Bancorp, Inc.
2017 FINANCIAL REVIEW
LIQUIDITY
|
December 31 |
Change | |||||||||||||||||
| (Dollars in millions)
|
2017
|
2016
|
from 2016 | |||||||||||||||
|
|
||||||||||||||||||
| Cash and cash equivalents
|
$ | 36 | $ | 37 | $ | (1 | ) | |||||||||||
| Unused lines of credit
|
82 | 66 | 16 | |||||||||||||||
| Unpledged securities at fair market value |
31 | 37 | (6 | ) | ||||||||||||||
|
|
|
|
|
|
|
|||||||||||||
| $ | 149 | $ | 140 | $ | 9 | |||||||||||||
|
|
|
|
|
|
|
|||||||||||||
| Net deposits and short-term liabilities |
$ | 557 | $ | 533 | $ | 24 | ||||||||||||
|
|
|
|
|
|
|
|||||||||||||
| Liquidity ratio
|
26.8 | % | 26.1 | % | ||||||||||||||
| Minimum board approved liquidity ratio |
20.0 | % | 20.0 | % | ||||||||||||||
Liquidity refers to the Company’s ability to generate sufficient cash to fund current loan demand, meet deposit withdrawals, pay operating expenses, and meet other obligations. Liquidity is monitored by CSB’s Asset Liability Committee. The Company was within all Board-approved limits at December 31, 2017 and 2016. Additional sources of liquidity include net income, loan repayments, the availability of borrowings, and adjustments of interest rates to attract deposit accounts.
As summarized in the Consolidated Statements of Cash Flows, the most significant investing activities for the Company in 2017 included net loan originations of $42 million, securities purchases of $18 million, offset by maturities and repayment of securities totaling $22 million. The Company’s financing activities included a $42 million increase in deposits, $2 million in cash dividends paid, and a $1 million net decrease in FHLB advances.
QUANTITATIVE AND QUALITATIVE DISCLOSURES ABOUT MARKET RISK
The most significant market risk the Company is exposed to is interest rate risk. The business of the Company and the composition of its balance sheet consist of investments in interest-earning assets (primarily loans and securities), which are funded by interest-bearing liabilities (deposits and borrowings). These financial instruments have varying levels of sensitivity to changes in the market rates of interest, resulting in market risk. None of the Company’s financial instruments are held for trading purposes.
The Board of Directors establishes policies and operating limits with respect to interest rate risk. The Company manages interest rate risk regularly through its Asset Liability Committee. The Committee meets periodically to review various asset and liability management information including, but not limited to, the Company’s liquidity position, projected sources and uses of funds, interest rate risk position, and economic conditions.
Interest rate risk is monitored primarily through the use of an earnings simulation model. The model is highly dependent on various assumptions, which change regularly as the balance sheet and market interest rates change. The earnings simulation model projects changes in net interest income resulting from the effect of changes in interest rates. The analysis is performed quarterly over a twenty-four month horizon. The analysis includes two balance sheet models, one based on a static balance sheet and one on a dynamic balance sheet with projected growth in assets and liabilities. This analysis is performed by estimating the expected cash flows of the Company’s financial instruments using interest rates in effect at year-end 2017 and 2016. Interest rate risk policy limits are tested by measuring the anticipated change in net interest income over a two year period. The tests assume a quarterly ramped 100, 200, 300, and 400 basis point increase and a 100 basis point decrease in 2017 in market interest rates as compared to a stable rate environment or base model. The following table reflects the change to interest income for the first twelve month period of the twenty-four month horizon.
2017 Report to Shareholders | CSB Bancorp, Inc.
17
2017 FINANCIAL REVIEW
Net Interest Income at Risk
| December 31, 2017 | ||||||||||||||||||||
| Change In Interest Rates (Basis Points)
|
Net Interest Income
|
Dollar Change
|
Percentage Change
|
Board Policy Limits
|
||||||||||||||||
|
|
||||||||||||||||||||
| (Dollars in thousands) | + 400 | $ | 28,329 | $ | 1,666 | 6.2% | ± 25% | |||||||||||||
| + 300 | 27,944 | 1,281 | 4.8 | ± 15 | ||||||||||||||||
| + 200 | 27,552 | 889 | 3.3 | ± 10 | ||||||||||||||||
| + 100 | 27,123 | 460 | 1.7 | ± 5 | ||||||||||||||||
| 0 | 26,663 | – | – | |||||||||||||||||
| – 100 | 25,996 | (667 | ) | (2.5) | ± 5 | |||||||||||||||
| December 31, 2016 | ||||||||||||||||||||
|
|
||||||||||||||||||||
| + 400 | $ | 25,519 | $ | 1,889 | 8.0% | ± 25% | ||||||||||||||
| + 300 | 25,063 | 1,433 | 6.1 | ± 15 | ||||||||||||||||
| + 200 | 24,577 | 947 | 4.0 | ± 10 | ||||||||||||||||
| + 100 | 24,092 | 462 | 2.0 | ± 5 | ||||||||||||||||
| 0 | 23,630 | – | – | |||||||||||||||||
| – 100 | 22,841 | (789 | ) | (3.3) | ± 5 | |||||||||||||||
|
Management reviews Net Interest Income at Risk with the Board on a periodic basis. The Company was within all Board-approved limits at December 31, 2017 and 2016.
Economic Value of Equity at Risk
|
| |||||||||||||||||||
| December 31, 2017 | ||||||||||||||||||||
| Change In Interest Rates (Basis Points)
|
Percentage Change
|
Board Policy Limits
|
||||||||||||||||||
|
|
||||||||||||||||||||
| + 400 | 20.0 | % | ± 35% | |||||||||||||||||
| + 300 | 16.2 | ± 30 | ||||||||||||||||||
| + 200 | 11.9 | ± 20 | ||||||||||||||||||
| + 100 | 6.6 | ± 15 | ||||||||||||||||||
| – 100 | (8.1 | ) | ± 15 | |||||||||||||||||
| December 31, 2016
|
||||||||||||||||||||
|
|
||||||||||||||||||||
| + 400 | 18.1 | % | ± 35% | |||||||||||||||||
| + 300 | 14.9 | ± 30 | ||||||||||||||||||
| + 200 | 11.0 | ± 20 | ||||||||||||||||||
| + 100 | 6.1 | ± 15 | ||||||||||||||||||
| – 100 | (7.6 | ) | ± 15 | |||||||||||||||||
18
2017 Report to Shareholders | CSB Bancorp, Inc.
2017 FINANCIAL REVIEW
The economic value of equity is calculated by subjecting the period-end balance sheet to changes in interest rates and measuring the impact of the changes on the values of the assets and liabilities. Hypothetical changes in interest rates are then applied to the financial instruments. Then the cash flows and fair values are again estimated using these hypothetical rates. For the net interest income estimates, the hypothetical rates are applied to the financial instruments based on the assumed cash flows.
Management periodically measures and reviews the Economic Value of Equity at Risk with the Board. At December 31, 2017, the market value of equity as a percent of base in a 400 basis point rising rate environment indicates an increase of 20.0% and 18.1% as of December 31, 2017 and 2016, respectively. The Company was within all Board-approved limits at December 31, 2017 and 2016.
SIGNIFICANT ASSUMPTIONS AND OTHER CONSIDERATIONS
The above analysis is based on numerous assumptions, including relative levels of market interest rates, loan prepayments, and reactions of depositors to changes in interest rates and this should not be relied upon as being indicative of actual results. Further, the analysis does not contemplate all actions the Company may undertake in response to changes in interest rates.
U.S. Treasury securities, obligations of U.S. Government corporations and agencies, and obligations of states and political subdivisions will generally repay at their stated maturity or if callable prior to their final maturity date. Mortgage-backed security payments increase when interest rates are low and decrease when interest rates rise. Most of the Company’s loans permit the borrower to prepay the principal balance prior to maturity without penalty. The likelihood of prepayment depends on a number of factors: current interest rate and interest rate index (if any) on the loan, the financial ability of the borrower to refinance, the economic benefit to be obtained from refinancing, availability of refinancing at attractive terms, as well as economic conditions in specific geographic areas, which affect the sales and price levels of residential, and commercial property. In a changing interest rate environment, prepayments may increase or decrease on fixed and adjustable rate loans depending on the current relative levels and expectations of future short-term and long-term interest rates. Prepayments on adjustable rate loans generally increase when long-term interest rates fall or are at historically low levels relative to short-term interest rates, thus making fixed rate loans more desirable. While savings and checking deposits generally may be withdrawn upon the customer’s request without prior notice, a continuing relationship with customers resulting in future deposits and withdrawals is generally predictable, leading to a dependable and uninterrupted source of funds. Time deposits generally have early withdrawal penalties, which discourage customer withdrawal prior to maturity. Short-term borrowings have fixed maturities. Certain advances from the FHLB carry prepayment penalties and are expected to be repaid in accordance with their contractual terms.
FAIR VALUE MEASUREMENTS
The Company discloses the estimated fair value of its financial instruments at December 31, 2017 and 2016 in Note 15 to the consolidated financial statements.
OFF-BALANCE SHEET ARRANGEMENTS, CONTRACTUAL OBLIGATIONS, AND CONTINGENT LIABILITIES AND COMMITMENTS
The following table summarizes the Company’s loan commitments, including letters of credit, as of December 31, 2017:
| Amount of Commitment to Expire Per Period
|
||||||||||||||||||||
|
|
|
|||||||||||||||||||
| (Dollars in thousands)
Type of Commitment
|
Total Amount
|
Less than 1 year
|
1 to 3 Years
|
3 to 5 Years
|
Over 5 Years
|
|||||||||||||||
|
|
||||||||||||||||||||
| Commercial lines of credit
|
$ | 110,804 | $ | 99,585 | $ | 381 | $ | 76 | $ | 10,762 | ||||||||||
| Real estate lines of credit
|
54,374 | 1,582 | 5,118 | 7,219 | 40,455 | |||||||||||||||
| Consumer lines of credit
|
740 | 740 | – | – | – | |||||||||||||||
| Credit cards lines of credit
|
4,475 | 4,475 | – | – | – | |||||||||||||||
| Overdraft privilege
|
6,961 | 6,961 | – | – | – | |||||||||||||||
| Commercial real estate loan commitments
|
– | – | – | – | – | |||||||||||||||
| Letters of credit |
849 | 671 | 20 | 143 | 15 | |||||||||||||||
|
|
|
|
|
|
|
|
|
|
|
|||||||||||
| Total commitments |
$ | 178,203 | $ | 114,014 | $ | 5,519 | $ | 7,438 | $ | 51,232 | ||||||||||
|
|
|
|
|
|
|
|
|
|
|
|||||||||||
All lines of credit represent either fee-paid or legally binding loan commitments for the loan categories noted. Letters of credit are also included in the amounts noted in the table since the Company requires that each letter of credit be supported by a loan agreement. The commercial and consumer lines represent both unsecured and secured obligations. The real estate lines are secured by mortgages on residential property. It is anticipated that a significant portion of these lines will expire without being drawn upon.
2017 Report to Shareholders | CSB Bancorp, Inc.
19
2017 FINANCIAL REVIEW
The following table summarizes the Company’s other contractual obligations, exclusive of interest, as of December 31, 2017:
| Payment Due by Period | ||||||||||||||||||||
|
|
|
|||||||||||||||||||
| (Dollars in thousands)
Contractual Obligations
|
Total
|
Less than
|
1 to 3
|
3 to 5
|
Over 5
|
|||||||||||||||
|
|
||||||||||||||||||||
|
Total time deposits
|
$ | 109,792 | $ | 61,124 | $ | 32,239 | $ | 16,429 | $ | – | ||||||||||
| Short-term borrowings
|
39,480 | 39,480 | – | – | – | |||||||||||||||
| Other borrowings
|
11,409 | 2,884 | 3,860 | 2,203 | 2,462 | |||||||||||||||
| Operating leases
|
321 | 108 | 142 | 71 | – | |||||||||||||||
|
|
|
|
|
|
|
|
|
|
|
|||||||||||
| Total obligations |
$ | 161,002 | $ | 103,596 | $ | 36,241 | $ | 18,703 | $ | 2,462 | ||||||||||
|
|
|
|
|
|
|
|
|
|
|
|||||||||||
The other borrowings noted in the preceding table represent borrowings from the FHLB. The notes require payment of interest on a monthly basis with principal due in monthly installments. The obligations bear stated fixed interest rates and stipulate a prepayment penalty if the note’s interest rate exceeds the current market rate for similar borrowings at the time of repayment. As the notes mature, the Company evaluates the liquidity and interest rate circumstances, at that time, to determine whether to pay off or renew the note. The evaluation process typically includes: the strength of current and projected customer loan demand, the Company’s federal funds sold or purchased position, projected cash flows from maturing investment securities, the current and projected market interest rate environment, local and national economic conditions, and customer demand for the Company’s deposit product offerings.
CRITICAL ACCOUNTING POLICIES
The Company’s consolidated financial statements are prepared in accordance with U.S. generally accepted accounting principles and follow general practices within the commercial banking industry. Application of these principles requires management to make estimates, assumptions, and judgments that affect the amounts reported in the financial statements. These estimates, assumptions, and judgments are based upon the information available as of the date of the financial statements.
The most significant accounting policies followed by the Company are presented in the Summary of Significant Accounting Policies. These policies, along with the other disclosures presented in the Notes to Consolidated Financial Statements and the 2017 Financial Review, provide information about how significant assets and liabilities are valued in the financial statements and how those values are determined. Management has identified the other-than-temporary impairment of securities, allowance for loan losses, goodwill, and the fair value of financial instruments as the accounting areas that require the most subjective and complex estimates, assumptions and judgments and, as such, could be the most subject to revision as new information becomes available.
Securities are evaluated periodically to determine whether a decline in their value is other-than-temporary. Management utilizes criteria such as the magnitude and duration of the decline, in addition to the reasons underlying the decline, to determine whether the loss in value is other-than-temporary. The term “other-than-temporary” is not intended to indicate that the decline is permanent, but indicates that the prospect for a near-term recovery of value is not necessarily favorable, or that there is a lack of evidence to support a realizable value equal to or greater than the carrying value of the investment. Once a decline in value is determined to be other-than-temporary, the value of the security is reduced and a corresponding charge to earnings is recognized.
As previously noted in the section entitled Allowance for Loan Losses, management performs an analysis to assess the adequacy of its allowance for loan losses. This analysis encompasses a variety of factors including: the potential loss exposure for individually reviewed loans, the historical loss experience, the volume of nonperforming loans (i.e., loans in nonaccrual status or past due 90 days or more), the volume of loans past due, any significant changes in lending or loan review staff, an evaluation of current and future local and national economic conditions, any significant changes in the volume or mix of loans within each category, a review of the significant concentrations of credit, and any legal, competitive, or regulatory concerns.
The Company accounts for business combinations using the acquisition method of accounting. Goodwill and intangible assets with indefinite useful lives are not amortized. Intangible assets with finite useful lives, consisting of core deposit intangibles, are amortized using accelerated methods over their estimated weighted-average useful lives, approximating ten years. Additional information is presented in Note 5, Core Deposit Intangible Assets.
The Company groups financial assets and financial liabilities measured at fair value in three levels based on the markets in which the assets and liabilities are traded and the reliability of the assumptions used to determine fair value. Level I valuations are obtained from readily available pricing sources for market transactions involving identical assets or liabilities. Level II valuations are for instruments that trade in less active dealer or broker markets and incorporate values obtained for identical or comparable instruments. Level III valuations are derived from other valuation methodologies, including discounted cash flow models and similar techniques, and not based on market exchange, dealer, or broker traded transactions. Level III valuations incorporate certain assumptions and projections in determining the fair value assigned to each instrument.
20
2017 Report to Shareholders | CSB Bancorp, Inc.
2017 FINANCIAL REVIEW
IMPACT OF INFLATION AND CHANGING PRICES
The consolidated financial statements and related data presented herein have been prepared in accordance with U.S. generally accepted accounting principles, requiring measurement of financial position, and results of operations primarily in terms of historical dollars without considering changes in the relative purchasing power of money over time due to inflation. Most assets and liabilities of the Company are monetary in nature. Therefore, interest rates have a more significant impact on the Company’s performance than the effects of general levels of inflation. Interest rates do not necessarily move in the same direction or magnitude as prices of goods and services. The liquidity, maturity structure, and quality of the Company’s assets and liabilities are critical to maintenance of acceptable performance levels.
COMMON STOCK AND SHAREHOLDER INFORMATION
Common shares of the Company are not traded on an established market. Shares are traded on the OTC market through broker/ dealers under the symbol “CSBB” and through private transactions. The table below represents the range of high and low prices paid for transactions known to the Company. Management does not have knowledge of prices paid on all transactions. Because of the lack of an established market, these prices may not reflect the prices at which stock would trade in an active market. These quotations reflect interdealer prices, without mark-up, mark-down, or commission, and may not represent actual transactions. The table specifies cash dividends declared by the Company to its shareholders during 2017 and 2016. No assurances can be given that future dividends will be declared, or if declared, what the amount of any such dividends will be. Additional information concerning restrictions over the payment of dividends is included in Note 12 of the consolidated financial statements.
Quarterly Common Stock Price and Dividend Data
| Quarter Ended
|
High
|
Low
|
Dividends
|
Dividends
| ||||||||||||||||
|
March 31, 2017 |
$ | 32.70 | $ | 26.00 | $ | 0.20 | $ | 548,449 | ||||||||||||
|
June 30, 2017 |
34.50 | 29.55 | 0.20 | 548,449 | ||||||||||||||||
|
September 30, 2017 |
30.60 | 28.04 | 0.22 | 603,293 | ||||||||||||||||
|
December 31, 2017 |
34.66 | 30.00 | 0.22 | 603,293 | ||||||||||||||||
| March 31, 2016 |
$ | 24.50 | $ | 22.10 | $ | 0.19 | $ | 521,026 | ||||||||||||
|
June 30, 2016 |
26.00 | 23.27 | 0.19 | 521,026 | ||||||||||||||||
|
September 30, 2016 |
26.00 | 23.80 | 0.20 | 548,449 | ||||||||||||||||
|
December 31, 2016 |
33.50 | 25.17 | 0.20 | 548,449 | ||||||||||||||||
As of December 31, 2017, the Company had 1,199 shareholders of record and 2,742,242 outstanding shares of common stock.
2017 Report to Shareholders | CSB Bancorp, Inc.
21
REPORT ON MANAGEMENT’S ASSESSMENT OF
INTERNAL CONTROL OVER FINANCIAL REPORTING
The management of CSB Bancorp, Inc. is responsible for establishing and maintaining adequate internal control over financial reporting as defined in Rules 13a-15(f) and 15d-15(f) of the Securities Exchange Act of 1934, as amended. The Company’s internal control over financial reporting is designed to provide reasonable assurance that our published financial statements are fairly presented, in all material respects, in conformity with generally accepted accounting principles.
Because of its inherent limitations, internal control over financial reporting may not prevent or detect misstatements. Also, projections of any evaluation of effectiveness to future periods are subject to the risk that controls may become inadequate because of changes in conditions, or that the degree of compliance with the policies or procedures may deteriorate.
Management conducted the required assessment of the effectiveness of the Company’s internal control over financial reporting as of December 31, 2017. Management’s assessment did not identify any material weaknesses in the Company’s internal control over financial reporting. In making this assessment, management used the criteria set forth by the Committee of Sponsoring Organizations of the Treadway Commission (COSO) in the 2013 Internal Control-Integrated Framework. Based upon this assessment, management believes that the Company’s internal control over financial reporting is effective as of December 31, 2017.
The Company’s internal control over financial reporting as of December 31, 2017 has been audited by S.R. Snodgrass, P.C. an independent registered public accounting firm, as stated in their report appearing on the next page.

|
| |
| Eddie L. Steiner | Paula J. Meiler | |
| President, | Senior Vice President, | |
| Chief Executive Officer | Chief Financial Officer | |

22
2017 Report to Shareholders | CSB Bancorp, Inc.
REPORT OF INDEPENDENT REGISTERED PUBLIC ACCOUNTING FIRM

To the Shareholders and the Board of Directors
of CSB Bancorp, Inc.
Opinion on Internal Control over Financial Reporting
We have audited CSB Bancorp, Inc. and subsidiaries’ (the “Company”) internal control over financial reporting as of December 31, 2017, based on criteria established in Internal Control – Integrated Framework issued by the Committee of Sponsoring Organizations of the Treadway Commission in 2013. In our opinion, the Company maintained, in all material respects, effective internal control over financial reporting as of December 31, 2017, based on criteria established in Internal Control – Integrated Framework issued by the Committee of Sponsoring Organizations of the Treadway Commission in 2013.
We have also audited, in accordance with the standards of the Public Company Accounting Oversight Board (United States) (PCAOB), the consolidated balance sheets of the Company as of December 31, 2017 and 2016, and the related consolidated statements of income, comprehensive income, changes in shareholders’ equity, and cash flows for each of the three years in the period ended December 31, 2017, of the Company and our report dated March 1, 2018, expressed an unqualified opinion.
Basis for Opinion
The Company’s management is responsible for maintaining effective internal control over financial reporting and for its assessment of the effectiveness of internal control over financial reporting in the accompanying Report on Management’s Assessment of Internal Control over Financial Reporting. Our responsibility is to express an opinion on the Company’s internal control over financial reporting based on our audit. We are a public accounting firm registered with the PCAOB and are required to be independent with respect to the Company in accordance with U.S. federal securities laws and the applicable rules and regulations of the Securities and Exchange Commission and the PCAOB.
We conducted our audit in accordance with the standards of the PCAOB. Those standards require that we plan and perform the audit to obtain reasonable assurance about whether effective internal control over financial reporting was maintained in all material respects. Our audit included obtaining an understanding of internal control over financial reporting, assessing the risk that a material weakness exists, and testing and evaluating the design and operating effectiveness of internal control based on the assessed risk. Our audit also included performing such other procedures as we considered necessary in the circumstances. We believe that our audit provides a reasonable basis for our opinion.
Definition and Limitations of Internal Control over Financial Reporting
A company’s internal control over financial reporting is a process designed to provide reasonable assurance regarding the reliability of financial reporting and the preparation of financial statements for external purposes in accordance with generally accepted accounting principles. A company’s internal control over financial reporting includes those policies and procedures that (1) pertain to the maintenance of records that, in reasonable detail, accurately and fairly reflect the transactions and dispositions of the assets of the company; (2) provide reasonable assurance that transactions are recorded as necessary to permit preparation of financial statements in accordance with generally accepted accounting principles, and that receipts and expenditures of the company are being made only in accordance with authorizations of management and directors of the company; and (3) provide reasonable assurance regarding prevention or timely detection of unauthorized acquisition, use or disposition of the company’s assets that could have a material effect on the financial statements.
Because of its inherent limitations, internal control over financial reporting may not prevent or detect misstatements. Also, projections of any evaluation of effectiveness to future periods are subject to the risk that controls may become inadequate because of changes in conditions, or that the degree of compliance with the policies or procedures may deteriorate.

Cranberry Township, Pennsylvania
March 1, 2018
2017 Report to Shareholders | CSB Bancorp, Inc.
23
REPORT OF INDEPENDENT REGISTERED PUBLIC ACCOUNTING FIRM
To the Shareholders and the Board of Directors
of CSB Bancorp, Inc.
Opinion on the Financial Statements
We have audited the accompanying consolidated balance sheets of CSB Bancorp, Inc. and subsidiaries (the “Company”) as of December 31, 2017 and 2016; the related consolidated statements of income, comprehensive income, changes in shareholders’ equity, and cash flows for each of the three years in the period ended December 31, 2017; and the related notes to the consolidated financial statements (collectively, the “financial statements”). In our opinion, the financial statements present fairly, in all material respects, the financial position of the Company as of December 31, 2017 and 2016, and the results of its operations and its cash flows for each of the three years in the period ended December 31, 2017, in conformity with accounting principles generally accepted in the United States of America.
We have also audited, in accordance with the standards of the Public Company Accounting Oversight Board (United States) (PCAOB), the Company’s internal control over financial reporting as of December 31, 2017, based on criteria established in Internal Control – Integrated Framework issued by the Committee of Sponsoring Organizations of the Treadway Commission in 2013, and our report dated March 1, 2018, expressed an unqualified opinion on the effectiveness of the Company’s internal control over financial reporting.
Basis for Opinion
These financial statements are the responsibility of the Company’s management. Our responsibility is to express an opinion on the Company’s financial statements based on our audits. We are a public accounting firm registered with the Public Company Accounting Oversight Board (United States) (PCAOB) and are required to be independent with respect to the Company in accordance with U.S. federal securities laws and the applicable rules and regulations of the Securities and Exchange Commission and the PCAOB.
We conducted our audits in accordance with the standards of the PCAOB. Those standards require that we plan and perform the audit to obtain reasonable assurance about whether the financial statements are free of material misstatement, whether due to error or fraud. Our audits included performing procedures to assess the risks of material misstatement of the financial statements, whether due to error or fraud, and performing procedures that respond to those risks.
Such procedures included examining, on a test basis, evidence regarding the amounts and disclosures in the financial statements. Our audits also included evaluating the accounting principles used and significant estimates made by management, as well as evaluating the overall presentation of the financial statements. We believe that our audits provide a reasonable basis for our opinion.
We have served as the Company’s auditor since 2005.

Cranberry Township, Pennsylvania
March 1, 2018
24
2017 Report to Shareholders | CSB Bancorp, Inc.
CONSOLIDATED BALANCE SHEETS
December 31, 2017 and 2016
| (Dollars in thousands, except share data)
|
2017
|
2016
|
||||||
|
|
||||||||
|
ASSETS |
||||||||
|
Cash and cash equivalents |
||||||||
|
Cash and due from banks |
$ | 17,255 | $ | 13,590 | ||||
|
Interest-earning deposits in other banks |
19,165 | 23,248 | ||||||
|
|
|
|
|
|||||
|
Total cash and cash equivalents |
36,420 | 36,838 | ||||||
|
|
|
|
|
|||||
| Securities |
||||||||
|
Available-for-sale, at fair value |
97,752 | 103,875 | ||||||
|
Held-to-maturity; fair value of $25,491 in 2017 and $23,444 in 2016 |
25,758 | 23,883 | ||||||
|
Restricted stock, at cost |
4,614 | 4,614 | ||||||
|
|
|
|
|
|||||
|
Total securities |
128,124 | 132,372 | ||||||
|
|
|
|
|
|||||
| Loans held for sale |
246 | – | ||||||
| Loans |
516,830 | 475,449 | ||||||
|
Less allowance for loan losses |
5,604 | 5,291 | ||||||
|
|
|
|
|
|||||
|
Net loans |
511,226 | 470,158 | ||||||
|
|
|
|
|
|||||
| Premises and equipment, net |
9,244 | 8,749 | ||||||
|
Core deposit intangible |
268 | 383 | ||||||
|
Goodwill |
4,728 | 4,728 | ||||||
|
Bank-owned life insurance |
13,218 | 10,361 | ||||||
|
Accrued interest receivable and other assets |
3,589 | 6,389 | ||||||
|
|
|
|
|
|||||
|
TOTAL ASSETS |
$ | 707,063 | $ | 669,978 | ||||
|
|
|
|
|
|||||
| LIABILITIES AND SHAREHOLDERS’ EQUITY |
||||||||
| LIABILITIES |
||||||||
|
Deposits |
||||||||
|
Noninterest-bearing |
$ | 173,671 | $ | 167,824 | ||||
|
Interest-bearing |
409,588 | 372,961 | ||||||
|
|
|
|
|
|||||
| Total deposits |
583,259 | 540,785 | ||||||
|
|
|
|
|
|||||
| Short-term borrowings |
39,480 | 48,742 | ||||||
|
Other borrowings |
11,409 | 12,385 | ||||||
|
Accrued interest payable and other liabilities |
2,383 | 2,651 | ||||||
|
|
|
|
|
|||||
|
Total liabilities |
636,531 | 604,563 | ||||||
|
|
|
|
|
|||||
| SHAREHOLDERS’ EQUITY |
||||||||
| Common stock, $6.25 par value. Authorized 9,000,000 shares; issued 2,980,602 shares in 2017 and 2016 |
18,629 | 18,629 | ||||||
|
Additional paid-in capital |
9,815 | 9,815 | ||||||
|
Retained earnings |
47,535 | 42,629 | ||||||
|
Treasury stock at cost – 238,360 shares in 2017 and 2016 |
(4,784 | ) | (4,784 | ) | ||||
|
Accumulated other comprehensive loss |
(663 | ) | (874 | ) | ||||
|
|
|
|
|
|||||
|
Total shareholders’ equity |
70,532 | 65,415 | ||||||
|
|
|
|
|
|||||
|
TOTAL LIABILITIES AND SHAREHOLDERS’ EQUITY |
$ | 707,063 | $ | 669,978 | ||||
|
|
|
|
|
|||||
These consolidated financial statements should be read in connection with the accompanying summary of significant accounting policies and notes to the consolidated financial statements.
2017 Report to Shareholders | CSB Bancorp, Inc.
25
CONSOLIDATED STATEMENTS OF INCOME
Years Ended December 31, 2017, 2016, and 2015
| (Dollars in thousands, except per share data)
|
2017
|
2016
|
2015
|
|||||||||
|
|
||||||||||||
|
INTEREST AND DIVIDEND INCOME
|
||||||||||||
| Loans, including fees
|
$ | 23,097 | $ | 20,278 | $ | 18,548 | ||||||
| Taxable securities
|
2,374 | 2,598 | 2,790 | |||||||||
| Nontaxable securities
|
680 | 646 | 563 | |||||||||
| Other |
289 | 110 | 96 | |||||||||
|
|
|
|
|
|
|
|||||||
| Total interest and dividend income |
26,440 | 23,632 | 21,997 | |||||||||
|
|
|
|
|
|
|
|||||||
| INTEREST EXPENSE |
||||||||||||
| Deposits
|
1,344 | 1,006 | 1,081 | |||||||||
| Short-term borrowings
|
149 | 73 | 71 | |||||||||
| Other borrowings |
495 | 394 | 415 | |||||||||
|
|
|
|
|
|
|
|||||||
| Total interest expense |
1,988 | 1,473 | 1,567 | |||||||||
|
|
|
|
|
|
|
|||||||
| NET INTEREST INCOME
|
24,452 | 22,159 | 20,430 | |||||||||
| PROVISION FOR LOAN LOSSES |
1,145 | 493 | 389 | |||||||||
|
|
|
|
|
|
|
|||||||
| Net interest income, after provision for loan losses |
23,307 | 21,666 | 20,041 | |||||||||
|
|
|
|
|
|
|
|||||||
| NONINTEREST INCOME
|
||||||||||||
| Service charges on deposit accounts
|
1,133 | 1,166 | 1,203 | |||||||||
| Trust services
|
687 | 861 | 860 | |||||||||
| Debit card interchange fees
|
1,193 | 1,087 | 988 | |||||||||
| Securities gains
|
– | 1 | 56 | |||||||||
| Gain on sale of loans, net
|
296 | 309 | 363 | |||||||||
| Earnings on bank-owned life insurance
|
357 | 276 | 270 | |||||||||
| Other income |
674 | 596 | 684 | |||||||||
|
|
|
|
|
|
|
|||||||
| Total noninterest income |
4,340 | 4,296 | 4,424 | |||||||||
|
|
|
|
|
|
|
|||||||
| NONINTEREST EXPENSES
|
||||||||||||
| Salaries and employee benefits
|
10,009 | 9,354 | 8,819 | |||||||||
| Occupancy expense
|
869 | 973 | 1,027 | |||||||||
| Equipment expense
|
665 | 679 | 663 | |||||||||
| Professional and director fees
|
963 | 832 | 830 | |||||||||
| Financial institutions and franchise tax
|
523 | 427 | 400 | |||||||||
| Marketing and public relations
|
401 | 415 | 419 | |||||||||
| Software expense
|
879 | 799 | 801 | |||||||||
| Debit card expense
|
535 | 445 | 413 | |||||||||
| Amortization of intangible assets
|
116 | 121 | 125 | |||||||||
| FDIC insurance expense
|
225 | 282 | 357 | |||||||||
| Other expenses |
2,131 | 1,928 | 1,942 | |||||||||
|
|
|
|
|
|
|
|||||||
| Total noninterest expenses |
17,316 | 16,255 | 15,796 | |||||||||
|
|
|
|
|
|
|
|||||||
| INCOME BEFORE INCOME TAXES
|
10,331 | 9,707 | 8,669 | |||||||||
| FEDERAL INCOME TAX PROVISION |
3,230 | 2,969 | 2,647 | |||||||||
|
|
|
|
|
|
|
|||||||
| NET INCOME |
$ | 7,101 | $ | 6,738 | $ | 6,022 | ||||||
|
|
|
|
|
|
|
|||||||
| NET INCOME PER SHARE
|
||||||||||||
| Basic |
$ | 2.59 | $ | 2.46 | $ | 2.20 | ||||||
|
|
|
|
|
|
|
|||||||
| Diluted |
$ | 2.59 | $ | 2.46 | $ | 2.20 | ||||||
|
|
|
|
|
|
|
|||||||
These consolidated financial statements should be read in connection with the accompanying summary of significant accounting policies and notes to the consolidated financial statements.
26
2017 Report to Shareholders | CSB Bancorp, Inc.
CONSOLIDATED STATEMENTS OF COMPREHENSIVE INCOME
Years Ended December 31, 2017, 2016, and 2015
| (Dollars in thousands)
|
2017
|
2016
|
2015
|
|||||||||
| Net income |
$ | 7,101 | $ | 6,738 | $ | 6,022 | ||||||
|
|
|
|
|
|
|
|||||||
| Other comprehensive income (loss) |
||||||||||||
| Unrealized gains (losses) arising during the period |
376 | (1,221 | ) | (551 | ) | |||||||
| Amounts reclassified from accumulated other comprehensive income, held-to-maturity |
108 | 530 | 403 | |||||||||
| Income tax effect at 34% |
(164 | ) | 235 | 50 | ||||||||
| Reclassification adjustment for gains on available-for-sale securities included in net income |
– | (1 | ) | (56 | ) | |||||||
| Income tax effect |
– | – | 19 | |||||||||
|
|
|
|
|
|
|
|||||||
| Other comprehensive income (loss) |
320 | (457 | ) | (135 | ) | |||||||
|
|
|
|
|
|
|
|||||||
| Total comprehensive income |
$ | 7,421 | $ | 6,281 | $ | 5,887 | ||||||
|
|
|
|
|
|
|
|||||||
CONSOLIDATED STATEMENTS OF CHANGES IN SHAREHOLDERS’ EQUITY
Years Ended December 31, 2017, 2016, and 2015
| (Dollars in thousands)
|
Common
|
Additional
|
Retained
|
Treasury Stock
|
Accumulated
|
Total
| ||||||||||||||||||||||||
| BALANCE AT DECEMBER 31, 2014 |
$18,629 | $ | 9,884 | $34,090 | $(4,871) | $ | (282 | ) | $ | 57,450 | ||||||||||||||||||||
| Net income |
– | – | 6,022 | – | – | 6,022 | ||||||||||||||||||||||||
| Other comprehensive loss |
– | – | – | – | (135 | ) | (135 | ) | ||||||||||||||||||||||
| Stock options issued, 1,591 shares |
– | (38 | ) | – | 49 | – | 11 | |||||||||||||||||||||||
| Cash dividends declared, $0.76 per share |
– | – | (2,082 | ) | – | – | (2,082 | ) | ||||||||||||||||||||||
|
|
|
|
|
|
|
|
|
|
|
|
|
|||||||||||||||||||
| BALANCE AT DECEMBER 31, 2015 |
$ | 18,629 | $ | 9,846 | $ | 38,030 | $ | (4,822 | ) | $ | (417 | ) | $ | 61,266 | ||||||||||||||||
| Net income |
– | – | 6,738 | – | – | 6,738 | ||||||||||||||||||||||||
| Other comprehensive loss |
– | – | – | – | (457 | ) | (457 | ) | ||||||||||||||||||||||
| Stock options issued, 1,246 shares |
– | (31 | ) | – | 38 | – | 7 | |||||||||||||||||||||||
| Cash dividends declared, $0.78 per share |
– | – | (2,139 | ) | – | – | (2,139 | ) | ||||||||||||||||||||||
|
|
|
|
|
|
|
|
|
|
|
|
|
|||||||||||||||||||
| BALANCE AT DECEMBER 31, 2016 |
$ | 18,629 | $ | 9,815 | $ | 42,629 | $ | (4,784 | ) | $ | (874 | ) | $ | 65,415 | ||||||||||||||||
| Net income |
– | – | 7,101 | – | – | 7,101 | ||||||||||||||||||||||||
| Reclassification of tax effect from AOCI to retained earnings |
– | – | 109 | – | (109 | ) | – | |||||||||||||||||||||||
| Other comprehensive income |
– | – | – | – | 320 | 320 | ||||||||||||||||||||||||
| Cash dividends declared, $0.84 per share |
– | – | (2,304 | ) | – | – | (2,304 | ) | ||||||||||||||||||||||
|
|
|
|
|
|
|
|
|
|
|
|
|
|||||||||||||||||||
| BALANCE AT DECEMBER 31, 2017 |
$ | 18,629 | $ | 9,815 | $ | 47,535 | $ | (4,784) | $ | (663 | ) | $ | 70,532 | |||||||||||||||||
|
|
|
|
|
|
|
|
|
|
|
|
|
|||||||||||||||||||
These consolidated financial statements should be read in connection with the accompanying summary of significant accounting policies and notes to the consolidated financial statements.
2017 Report to Shareholders | CSB Bancorp, Inc.
27
CONSOLIDATED STATEMENTS OF CASH FLOWS
Years Ended December 31, 2017, 2016, and 2015
| (Dollars in thousands)
|
2017
|
2016
|
2015
|
|||||||||
| CASH FLOWS FROM OPERATING ACTIVITIES |
||||||||||||
| Net income |
$ | 7,101 | $ | 6,738 | $ | 6,022 | ||||||
| Adjustments to reconcile net income to net cash provided by operating activities: |
||||||||||||
| Depreciation and amortization of premises, equipment and software |
865 | 905 | 916 | |||||||||
| Deferred income taxes |
(167 | ) | (4 | ) | 83 | |||||||
| Provision for loan losses |
1,145 | 493 | 389 | |||||||||
| Gain on sale of loans, net |
(296 | ) | (309 | ) | (363 | ) | ||||||
| Securities gains |
– | (1 | ) | (56 | ) | |||||||
| Security amortization, net of accretion |
556 | 802 | 575 | |||||||||
| Secondary market loan sale proceeds |
10,790 | 10,985 | 12,414 | |||||||||
| Originations of secondary market loans held-for-sale |
(10,793 | ) | (10,682 | ) | (12,083 | ) | ||||||
| Bank-owned life insurance |
(357 | ) | (276 | ) | (270 | ) | ||||||
| Effects of changes in operating assets and liabilities: |
||||||||||||
| Net deferred loan (fees) costs |
(57 | ) | (262 | ) | (89 | ) | ||||||
| Accrued interest receivable |
(135 | ) | 103 | (184 | ) | |||||||
| Accrued interest payable |
14 | (4 | ) | (4 | ) | |||||||
| Other assets and liabilities |
289 | (1,521 | ) | 316 | ||||||||
|
|
|
|
|
|
|
|||||||
| Net cash provided by operating activities |
$ | 8,955 | $ | 6,967 | $ | 7,666 | ||||||
|
|
|
|
|
|
|
|||||||
| CASH FLOWS FROM INVESTING ACTIVITIES |
||||||||||||
| Securities: |
||||||||||||
| Proceeds from repayments, available-for-sale |
$ | 19,019 | $ | 49,870 | $ | 39,187 | ||||||
| Proceeds from repayments, held-to-maturity |
2,885 | 19,404 | 14,834 | |||||||||
| Purchases, available-for-sale |
(13,028 | ) | (27,741 | ) | (69,684 | ) | ||||||
| Purchases, held-to-maturity |
(4,700 | ) | (8,998 | ) | (10,000 | ) | ||||||
| Proceeds from sale of securities |
– | 1 | 1,576 | |||||||||
| Loan originations, net of repayments |
(42,156 | ) | (52,213 | ) | (6,023 | ) | ||||||
| Purchase of residential real estate loans |
– | – | (5,964 | ) | ||||||||
| Proceeds from sale of other real estate |
– | 26 | – | |||||||||
| Property, equipment, and software acquisitions |
(1,325 | ) | (1,418 | ) | (611 | ) | ||||||
|
|
|
|
|
|
|
|||||||
| Net cash used in investing activities |
$ | (39,305 | ) | $ | (21,069 | ) | $ | (36,685 | ) | |||
|
|
|
|
|
|
|
|||||||
These consolidated financial statements should be read in connection with the accompanying summary of significant accounting policies and notes to the consolidated financial statements.
28
2017 Report to Shareholders | CSB Bancorp, Inc.
CONSOLIDATED STATEMENTS OF CASH FLOWS
Years Ended December 31, 2017, 2016, and 2015
| (Dollars in thousands)
|
|
2017
|
|
|
2016
|
|
|
2015
|
| |||
|
|
||||||||||||
| CASH FLOWS FROM FINANCING ACTIVITIES |
||||||||||||
| Net change in deposits |
$ | 42,474 | $ | 15,743 | $ | 24,967 | ||||||
| Net change in short-term borrowings |
(9,262 | ) | 144 | 1,971 | ||||||||
| Proceeds from other borrowings |
10,000 | – | – | |||||||||
| Repayment of other borrowings |
(10,976 | ) | (1,080 | ) | (1,488 | ) | ||||||
| Cash dividends paid |
(2,304 | ) | (2,139 | ) | (2,082 | ) | ||||||
|
|
|
|
|
|
|
|||||||
| Net cash provided by financing activities |
$ | 29,932 | $ | 12,668 | $ | 23,368 | ||||||
|
|
|
|
|
|
|
|||||||
| NET DECREASE IN CASH AND CASH EQUIVALENTS |
(418 | ) | (1,434 | ) | (5,651 | ) | ||||||
| CASH AND CASH EQUIVALENTS AT BEGINNING OF YEAR |
36,838 | 38,272 | 43,923 | |||||||||
|
|
|
|
|
|
|
|||||||
| CASH AND CASH EQUIVALENTS AT END OF YEAR |
$ | 36,420 | $ | 36,838 | $ | 38,272 | ||||||
|
|
|
|
|
|
|
|||||||
| SUPPLEMENTAL DISCLOSURES |
||||||||||||
| Cash paid during the year for: |
||||||||||||
| Interest |
$ | 1,973 | $ | 1,477 | $ | 1,571 | ||||||
| Income taxes |
3,320 | 2,650 | 2,180 | |||||||||
| Noncash investing activities: |
||||||||||||
| Transfer of loans to other real estate owned |
– | 72 | – | |||||||||
| Purchase of bank-owned life insurance |
2,500 | – | – | |||||||||
These consolidated financial statements should be read in connection with the accompanying summary of significant accounting policies and notes to the consolidated financial statements.
2017 Report to Shareholders | CSB Bancorp, Inc.
29
NOTES TO CONSOLIDATED FINANCIAL STATEMENTS
NOTE 1 – SUMMARY OF SIGNIFICANT ACCOUNTING POLICIES
CSB Bancorp, Inc. (the “Company” or “CSB”) was incorporated in 1991 in the State of Ohio, and is a registered bank holding company. The Company’s wholly-owned subsidiaries are The Commercial and Savings Bank of Millersburg, Ohio (the “Bank”) and CSB Investment Services, LLC. The Company, through its subsidiaries, operates in one industry segment; the commercial banking industry.
The Bank, an Ohio-chartered bank organized in 1879, provides financial services through its fifteen Banking Centers located in Holmes, Tuscarawas, Wayne, and Stark counties. These communities are the source of a substantial majority of the Bank’s deposit, loan, and trust activities. The majority of the Bank’s income is derived from commercial and retail lending activities, and investments in securities. Its primary deposit products are checking, savings, and term certificate accounts. Its primary lending products are residential real estate, commercial real estate, commercial, and installment loans. Substantially, all loans are secured by specific items of collateral including business assets, consumer assets, and real estate. Commercial loans are expected to be repaid with cash flow from business operations. Real estate loans are secured by both residential and commercial real estate.
Significant accounting policies followed by the Company are presented below:
USE OF ESTIMATES IN PREPARING FINANCIAL STATEMENTS
In preparing the Consolidated Financial Statements, in conformity with accounting principles generally accepted in the United States of America, management makes estimates and assumptions that affect the reported amounts of assets and liabilities as of the date of the Consolidated Balance Sheets and reported amounts of revenues and expenses during each reporting period. Actual results could differ from those estimates. The most significant estimates susceptible to change in the near term relate to management’s determination of the allowance for loan losses and the fair value of financial instruments.
PRINCIPLES OF CONSOLIDATION
The Consolidated Financial Statements include the accounts of the Company and its wholly-owned subsidiaries. All significant inter-company balances and transactions have been eliminated in consolidation.
The Bank has a trust department and the assets held by the Bank in fiduciary or agency capacities for its customers are not included in the Consolidated Balance Sheets as such items are not assets of the Bank.
CASH AND CASH EQUIVALENTS
For purposes of the Consolidated Statements of Cash Flows, cash, and cash equivalents include cash on hand and amounts due from banks which mature overnight or within ninety days.
CASH RESERVE REQUIREMENTS
The Bank generally is required by the Federal Reserve to maintain reserves consisting of cash on hand and noninterest-earning balances on deposit with the Federal Reserve Bank. There was no required reserve balance at December 31, 2017 and 2016.
SECURITIES
At the time of purchase all securities are evaluated and designated as available-for-sale or held-to-maturity. Securities designated as available-for-sale are carried at fair value with unrealized gains and losses on such securities, net of applicable income taxes, recognized as other comprehensive income (loss). Held-to-maturity securities are carried at their fair value on the date of transfer or at amortized cost if security purchases are designated as held-to-maturity. At December 31, 2017, 20% of the total investment portfolio was classified as held-to-maturity.
The amortized cost of debt securities is adjusted for the accretion of discounts to maturity and the amortization of premiums to the earlier of a bonds call date or maturity based on the interest method. Such amortization and accretion is included in interest and dividends on securities.
Gains and losses on sales of securities are accounted for on a trade date basis, using the specific identification method, and are included in noninterest income. Securities are periodically reviewed for other-than-temporary impairment based upon a number of factors, including, but not limited to: the length of time and extent to which the market value has been less than cost, the financial condition of the underlying issuer, the receipt of principal and interest according to the contractual terms, the ability of the issuer to meet contractual obligations, the likelihood of the security’s ability to recover any decline in its market value and management’s intent, and ability to hold the security for a period of time sufficient to allow for a recovery in market value. Among the factors that are considered in determining management’s intent and ability to hold the security is a review of the Company’s capital adequacy, interest rate risk position, and liquidity. The assessment of a security’s ability to recover any decline in market value, the ability of the issuer to meet contractual obligations, and management’s intent and ability to hold the security requires considerable judgment. A decline in value that is considered to be other-than-temporary is recorded as a loss within noninterest income in the Consolidated Statements of Income.
30
2017 Report to Shareholders | CSB Bancorp, Inc.
NOTES TO CONSOLIDATED FINANCIAL STATEMENTS
NOTE 1 – SUMMARY OF SIGNIFICANT ACCOUNTING POLICIES (CONTINUED)
Investments in FHLB and Federal Reserve Bank stock are classified as restricted stock, carried at cost, and evaluated for impairment. The Bank is required to maintain an investment in common stock of the FHLB and Federal Reserve Bank because the Bank is a member of the FHLB and the Federal Reserve System.
LOANS
Loans that management has the intent and ability to hold for the foreseeable future, until maturity, or pay-off, generally are stated at their outstanding principal amount, adjusted for charge-offs, the allowance for loan losses, and any deferred loan fees or costs on originated loans. Interest is accrued based upon the daily outstanding principal balance. Loan origination fees and certain direct origination costs are capitalized and recognized as an adjustment of the yield over the life of the related loan.
Interest income is not reported when full repayment is in doubt, typically when the loan is impaired or payments are past due over 90 days. All interest accrued but not collected for loans that are placed on nonaccrual or charged-off is reversed against interest income. The interest on these loans is accounted for on the cash-basis or cost-recovery method, until qualifying for return to accrual. Loans are returned to accrual status when all the principal and interest amounts contractually due are brought current and future payments are reasonably assured.
At origination, a determination is made whether a loan will be held in the Bank’s portfolio or is intended for sale in the secondary market. Mortgage loans held for sale are recorded at the lower of the aggregate cost or fair value. Generally these loans are held for sale for less than three days. The Bank recognizes gains and losses on sales of the loans held for sale when the sale is completed.
ALLOWANCE FOR LOAN LOSSES
The allowance for loan losses is established as losses are estimated to have occurred through a provision for loan losses charged to income. Loan losses are charged against the allowance when management believes the uncollectibility of a loan balance is confirmed. Subsequent recoveries, if any, are credited to the allowance.
The allowance for loan losses is evaluated on a regular basis by management and is based upon management’s periodic review of the collectability of the loans in light of historical experience, the nature and volume of the loan portfolio, adverse situations that may affect borrowers’ ability to repay, estimated value of any underlying collateral, and prevailing economic conditions. This evaluation is inherently subjective as it requires estimates that are susceptible to significant revision as more information becomes available.
A loan is considered impaired when, based on current information and events, it is probable that the Company will be unable to collect the scheduled payments of principal or interest when due according to the contractual terms of the loan agreement. Factors considered by management in determining impairment include payment status, collateral value and the probability of collecting scheduled principal and interest payments when due. Loans that experience insignificant payment delays and payment shortfalls generally are not classified as impaired. Management determines the significance of payment delays and payment shortfalls on a case-by-case basis, taking into consideration all of the circumstances surrounding the loan and the borrower, including the length of the delay, the reasons for the delay, the borrower’s prior payment record and the amount of the shortfall in relation to the principal and interest owed. Impairment is measured on a loan-by-loan basis for commercial, commercial real estate, construction loans, and troubled debt restructurings by either the present value of expected future cash flows discounted at the loan’s effective interest rate, the loan’s obtainable market price, or the fair value of the collateral if the loan is collateral dependent.
Large groups of smaller balance homogeneous loans are collectively evaluated for impairment. Accordingly, the Company does not separately identify individual residential real estate or consumer loans for impairment disclosures.
OTHER REAL ESTATE OWNED
Other real estate acquired through or in lieu of foreclosure is initially recorded at fair value, less estimated costs to sell, and any loan balance in excess of fair value is charged to the allowance for loan losses. Subsequent valuations are periodically performed and write-downs are included in noninterest expenses, as well as expenses related to maintenance of the properties. Gains or losses upon sale are recorded through noninterest income. There was no other real estate owned at December 31, 2017 and 2016.
PREMISES AND EQUIPMENT
Premises and equipment are stated at cost, less accumulated depreciation and, amortization. Land is carried at cost. Depreciation and amortization is determined based on the estimated useful lives of the individual assets (typically 20 to 40 years for buildings and 3 to 10 years for equipment) and is computed using the straight-line method. Leasehold improvements are amortized over the useful life of the asset, or lease term, whichever is shorter.
2017 Report to Shareholders | CSB Bancorp, Inc.
31
NOTES TO CONSOLIDATED FINANCIAL STATEMENTS
NOTE 1 – SUMMARY OF SIGNIFICANT ACCOUNTING POLICIES (CONTINUED)
GOODWILL AND CORE DEPOSIT INTANGIBLE ASSETS
Goodwill is not amortized, but is tested for impairment at least annually in the fourth quarter or more frequently if indicators of impairment are present. The evaluation for impairment involves comparing the current fair value of the reporting unit to its carrying value, including goodwill. If the current fair value of a reporting unit exceeds its carrying value, no additional testing is required and an impairment loss is not recorded. The Company uses market capitalization and multiples of tangible book value methods to determine the estimated current fair value of its reporting unit. Based on this analysis no impairment was recorded in 2017 or 2016.
The core deposit intangible assets are assigned useful lives, which are amortized on an accelerated basis over their weighted average lives. The Company periodically reviews the intangible asset for impairment as events or changes in circumstances indicate that the carrying amount of such assets may not be recoverable.
MORTGAGE SERVICING RIGHTS
Mortgage servicing rights (“MSRs”) represent the right to service loans for third party investors. MSRs are recognized as a separate asset upon the sale of mortgage loans to a third party investor with the servicing rights retained by the Company. Originated MSRs are recorded at allocated fair value at the time of the sale of the loans to the third party investor. MSRs are amortized in proportion to and over the estimated period of net servicing income. MSRs are carried at amortized cost, less a valuation allowance for impairment, if any. MSRs are evaluated on a discounted earnings basis to determine the present value of future earnings of the underlying serviced mortgages. All assumptions are reviewed annually, or more frequently if necessary, adjusted to reflect current, and anticipated market conditions.
BANK-OWNED LIFE INSURANCE
The cash surrender value of bank-owned life insurance policies is included as an asset on the Consolidated Balance Sheets and any increases in the cash surrender value are recorded as noninterest income on the Consolidated Statements of Income. In the event of the death of an individual insured under these policies, the Company would receive a death benefit, which would be recorded as noninterest income.
REPURCHASE AGREEMENTS
Substantially all securities sold under repurchase agreements represent amounts advanced by various customers. Securities owned by the Bank are pledged to secure those obligations. Repurchase agreements are not deposits and are not covered by federal deposit insurance.
ADVERTISING COSTS
All advertising costs are expensed as incurred. Advertising expenses amounted to $168 thousand, $215 thousand, and $229 thousand for the years ended 2017, 2016, and 2015, respectively.
FEDERAL INCOME TAXES
The Company and its subsidiaries file a consolidated tax return. Deferred income taxes are provided on temporary differences between financial statement and income tax reporting. Temporary differences are differences between the amounts of assets and liabilities reported for financial statement purposes, and their respective tax bases. Deferred tax assets are recognized for temporary differences that will be deductible in future years’ tax returns and for operating loss and tax credit carry forwards. Deferred tax assets are reduced by a valuation allowance if it is deemed more likely than not that some or all of the deferred tax assets will not be realized. Deferred tax liabilities are recognized for temporary differences that will be taxable in future years’ tax returns.
The Bank, domiciled in Ohio, is not currently subject to state and local income taxes.
STOCK-BASED COMPENSATION
The Company previously sponsored a stock-based compensation plan that expired in 2013. All outstanding awards at December 31, 2015 were exercised during the first quarter of 2016. There were no stock options outstanding at December 31, 2017. The Company recorded no stock-based compensation expense for 2017, 2016, or 2015.
COMPREHENSIVE INCOME
The Company includes recognized revenue, expenses, gains, and losses in net income. Although certain changes in assets and liabilities, such as unrealized gains and losses on available-for-sale securities, are reported as a separate component of the equity section of the Consolidated Balance Sheets, these items along with net income are components of comprehensive income.
32
2017 Report to Shareholders | CSB Bancorp, Inc.
NOTES TO CONSOLIDATED FINANCIAL STATEMENTS
NOTE 1 – SUMMARY OF SIGNIFICANT ACCOUNTING POLICIES (CONTINUED)
TRANSFERS OF FINANCIAL ASSETS
Transfers of financial assets are accounted for as sales when control over the assets has been surrendered. Control over transferred assets is deemed to be surrendered when (1) the assets have been isolated from the Company, (2) the transferee obtains the right (free of conditions that constrain it from taking advantage of that right) to pledge or exchange the transferred assets, and (3) the Company does not maintain effective control over the transferred assets through an agreement to repurchase them before their maturity.
PER SHARE DATA
Basic net income per share is computed based on the weighted average number of shares of common stock outstanding during each year. Diluted income per common share includes the dilutive effect of additional potential common shares issuable under stock options.
The weighted average number of common shares outstanding for basic and diluted earnings per share computations was as follows:
| 2017 | 2016 | 2015 | ||||||||||
|
|
||||||||||||
| Weighted average common shares |
2,980,602 | 2,980,602 | 2,980,602 | |||||||||
| Average treasury shares |
(238,360 | ) | (238,574 | ) | (241,132 | ) | ||||||
|
|
|
|
|
|
|
|||||||
| Total weighted average common shares outstanding (basic) |
2,742,242 | 2,742,028 | 2,739,470 | |||||||||
| Dilutive effect of assumed exercise of stock options |
– | – | 2,638 | |||||||||
|
|
|
|
|
|
|
|||||||
| Weighted average common shares outstanding (diluted) |
2,742,242 | 2,742,028 | 2,742,108 | |||||||||
|
|
|
|
|
|
|
|||||||
Dividends per share are based on the number of shares outstanding at the declaration date.
There were no stock options outstanding at December 31, 2017 and 2016 with 5,952 stock options outstanding at December 31, 2015.
RECENTLY ISSUED ACCOUNTING PRONOUNCEMENTS
ASU 2014-09 – Revenue from Contracts with Customers. The amendments in ASU 2014-09 require an entity to recognize revenue upon the transfer of goods or services to customers in an amount that reflects the consideration to which the entity expects to be entitled in exchange for those goods or services. In addition, this Update specifies the accounting for certain costs to obtain or fulfill a contract with a customer and expands disclosure requirements for revenue recognition. FASB issued a one-year deferral for implementation, for public entities with a calendar year-end, the new guidance is effective in the quarter and year beginning January 1, 2018. Because the guidance does not apply to revenue associated with financial instruments, including loans and securities, we do not expect the new standard, or any of the amendments, to result in a material change from our current accounting for revenue because the majority of the Company’s financial instruments are not within the scope of Topic 606. However, we do expect that the standard will result in new disclosure requirements, which are currently being evaluated.
ASU 2016-01 – Recognition and Measurement of Financial Assets and Financial Liabilities. This Update sets forth targeted improvements to GAAP including, but not limited to, requiring an entity to recognize the changes in fair value of equity investments in the income statement, requiring public business entities to use the exit price when measuring the fair value of financial instruments for financial statement disclosure purposes, eliminating certain disclosures required by existing GAAP, and providing for additional disclosures. The Update is effective for fiscal years beginning after December 15, 2017, including interim periods within those fiscal years. The Company is currently evaluating the impact the adoption of the standard will have on the Company’s financial position or results of operations.
ASU 2016-02 – Leases. This Update sets forth a new lease accounting model for lessors and lessees. For lessees, virtually all leases will be required to be recognized on the balance sheet by recording a right-of-use asset. Subsequent accounting for leases varies depending on whether the lease is an operating lease or a finance lease. The accounting provided by a lessor is largely unchanged from that applied under the existing guidance. The ASU requires additional qualitative and quantitative disclosures with the objective of enabling users of financial statements to assess the amount, timing, and uncertainty of cash flows arising from leases. The Update is effective for fiscal years beginning after December 15, 2018, with early application permitted. Based on the Company’s preliminary analysis of its current portfolio, the impact to the Company’s balance sheet is estimated to result in less than a 1 percent increase in assets and liabilities. This Update is not expected to have a significant impact on the Company’s financial statements.
ASU 2016-13 – Financial Instruments – Credit Losses. The Update requires that financial assets be presented at the net amount expected to be collected (i.e. net of expected credit losses), eliminating the probable recognition threshold for credit losses on financial assets measured at amortized cost. The measurement of expected credit losses should be based on relevant information about past events, including historical experience, current conditions, and reasonable and supportable forecasts that affect the collectability of the reported amount. The Update is effective for annual and interim periods beginning after December 15, 2019.
2017 Report to Shareholders | CSB Bancorp, Inc.
33
NOTES TO CONSOLIDATED FINANCIAL STATEMENTS
NOTE 1 – SUMMARY OF SIGNIFICANT ACCOUNTING POLICIES (CONTINUED)
Early adoption is permitted for annual and interim periods beginning after December 15, 2018. We expect the Update will result in an increase in the allowance for credit losses for the estimated life of the financial asset, including an estimate for debt securities. The amount of the increase will be impacted by the portfolio composition and quality at the adoption date, as well as economic conditions and forecasts at that time. A cumulative-effect adjustment to retained earnings is required as of the beginning of the year of adoption. The Company expects to recognize a one-time cumulative effect adjustment to the allowance for loan losses, but cannot yet determine the magnitude of any such one-time adjustment or the overall impact of the new guidance on the consolidated financial statements.
ASU 2016-15 – Classification of Certain Cash Receipts and Cash Payments. The amendments in this Update add or clarify guidance on the classification of certain cash receipts and payments in the statement of cash flows. Current guidance lacks consistent principles for evaluating the classification of cash payments and receipts in the statement of cash flows. FASB issued the ASU with the intent of reducing diversity in practice with respect to several types of cash flows. The amendments in this Update are effective using a retrospective transition approach for fiscal years beginning after December 15, 2017, and interim periods within those fiscal years. Early adoption is permitted, including adoption in an interim period. If an entity early adopts the amendments in an interim period, any adjustments should be reflected as of the beginning of the fiscal year that includes that interim period. The Company is currently evaluating the impact the adoption of the standard will have on the Company’s statement of cash flows.
ASU 2017-04 – Simplifying the Test for Goodwill Impairment. The Update simplifies the goodwill impairment test. Under the new guidance, Step 2 of the goodwill impairment process that requires an entity to determine the implied fair value of its goodwill by assigning fair value to all its assets and liabilities is eliminated. Instead, the entity should recognize an impairment charge for the amount by which the carrying amount exceeds the reporting unit’s fair value. An entity still has the option to perform the qualitative assessment for a reporting unit to determine if the quantitative impairment test is necessary. The new guidance is effective for annual and interim goodwill tests performed in fiscal years beginning after December 15, 2019. Early adoption is permitted. This Update is not expected to have a material impact on the Company’s financial statements.
ASU 2017-08 – Premium Amortization on Purchased Callable Debt Securities. The Update amends the guidance related to amortization for certain callable debt securities held at a premium. The new guidance requires the premium to be amortized to the earliest call date. The guidance does not require an accounting change for securities held at a discount. The Update was adopted in the current reporting period and did not have a significant impact on the Company’s financial statements.
RECLASSIFICATION OF COMPARATIVE AMOUNTS
Certain comparative amounts from the prior years have been reclassified to conform to current year classifications. Such classifications had no effect on net income or shareholders’ equity.
34
2017 Report to Shareholders | CSB Bancorp, Inc.
NOTES TO CONSOLIDATED FINANCIAL STATEMENTS
NOTE 2 – SECURITIES
Securities consisted of the following at December 31:
| (Dollars in thousands)
|
Amortized
|
Gross
|
Gross
|
Fair
| ||||||||||||||||
| 2017 |
||||||||||||||||||||
|
Available-for-sale |
||||||||||||||||||||
| U.S. Treasury security |
$ | 999 | $ | – | $ | 1 | $ | 998 | ||||||||||||
| U.S. Government agencies |
8,350 | – | 121 | 8,229 | ||||||||||||||||
| Mortgage-backed securities of government agencies |
50,136 | 146 | 581 | 49,701 | ||||||||||||||||
| Asset-backed securities of government agencies |
1,168 | 1 | – | 1,169 | ||||||||||||||||
| State and political subdivisions |
27,020 | 224 | 103 | 27,141 | ||||||||||||||||
| Corporate bonds |
10,532 | 35 | 142 | 10,425 | ||||||||||||||||
| Equity securities |
53 | 36 | – | 89 | ||||||||||||||||
|
|
|
|
|
|
|
|
|
|||||||||||||
| Total available-for-sale |
98,258 | 442 | 948 | 97,752 | ||||||||||||||||
|
Held-to-maturity |
||||||||||||||||||||
| U.S. Government agencies |
9,477 | 16 | 228 | 9,265 | ||||||||||||||||
| Mortgage-backed securities of government agencies |
11,581 | 95 | 145 | 11,531 | ||||||||||||||||
| State and political subdivisions |
4,700 | – | 5 | 4,695 | ||||||||||||||||
| Total held-to-maturity |
25,758 | 111 | 378 | 25,491 | ||||||||||||||||
| Restricted stock |
4,614 | – | – | 4,614 | ||||||||||||||||
|
|
|
|
|
|
|
|
|
|||||||||||||
| Total securities |
$ | 128,630 | $ | 553 | $ | 1,326 | $ | 127,857 | ||||||||||||
|
|
|
|
|
|
|
|
|
|||||||||||||
| 2016 |
||||||||||||||||||||
|
Available-for-sale |
||||||||||||||||||||
| U.S. Treasury security |
$ | 1,001 | $ | – | $ | – | $ | 1,001 | ||||||||||||
| U.S. Government agencies |
6,500 | – | 98 | 6,402 | ||||||||||||||||
| Mortgage-backed securities of government agencies |
56,187 | 239 | 589 | 55,837 | ||||||||||||||||
| Other mortgage-backed securities |
65 | – | – | 65 | ||||||||||||||||
| Asset-backed securities of government agencies |
1,312 | – | 46 | 1,266 | ||||||||||||||||
| State and political subdivisions |
30,007 | 140 | 439 | 29,708 | ||||||||||||||||
| Corporate bonds |
9,632 | 28 | 144 | 9,516 | ||||||||||||||||
| Equity securities |
53 | 27 | – | 80 | ||||||||||||||||
|
|
|
|
|
|
|
|
|
|||||||||||||
| Total available-for-sale |
104,757 | 434 | 1,316 | 103,875 | ||||||||||||||||
|
Held-to-maturity |
||||||||||||||||||||
| U.S. Government agencies |
9,472 | 17 | 396 | 9,093 | ||||||||||||||||
| Mortgage-backed securities of government agencies |
14,411 | 141 | 201 | 14,351 | ||||||||||||||||
|
|
|
|
|
|
|
|
|
|||||||||||||
| Total held-to-maturity |
23,883 | 158 | 597 | 23,444 | ||||||||||||||||
| Restricted stock |
4,614 | – | – | 4,614 | ||||||||||||||||
|
|
|
|
|
|
|
|
|
|||||||||||||
| Total securities |
$ | 133,254 | $ | 592 | $ | 1,913 | $ | 131,933 | ||||||||||||
|
|
|
|
|
|
|
|
|
|||||||||||||
2017 Report to Shareholders | CSB Bancorp, Inc.
35
NOTES TO CONSOLIDATED FINANCIAL STATEMENTS
NOTE 2 – SECURITIES (CONTINUED)
The amortized cost and fair value of debt securities at December 31, 2017, by contractual maturity, are shown below. Actual maturities may differ from contractual maturities because borrowers may have the right to call or prepay obligations with or without call or prepayment penalties.
| (Dollars in thousands)
|
Amortized
|
Fair Value
|
||||||
|
Available-for-sale |
||||||||
| Due in one year or less |
$ | 5,121 | $ | 5,122 | ||||
| Due after one through five years |
17,239 | 17,211 | ||||||
| Due after five through ten years |
29,540 | 29,508 | ||||||
| Due after ten years |
46,305 | 45,822 | ||||||
|
|
|
|
|
|||||
| Total debt securities available-for-sale |
$ | 98,205 | $ | 97,663 | ||||
|
|
|
|
|
|||||
|
Held-to-maturity |
||||||||
| Due in one year or less |
$ | 4,700 | $ | 4,695 | ||||
| Due after one through five years |
478 | 494 | ||||||
| Due after five through ten years |
3,000 | 2,887 | ||||||
| Due after ten years |
17,580 | 17,415 | ||||||
|
|
|
|
|
|||||
| Total debt securities held-to-maturity |
$ | 25,758 | $ | 25,491 | ||||
|
|
|
|
|
|||||
Securities with a carrying value of approximately $94.0 million and $94.8 million were pledged at December 31, 2017 and 2016 respectively, to secure public deposits, as well as other deposits and borrowings as required or permitted by law.
Restricted stock primarily consists of investments in FHLB and Federal Reserve Bank stock. The Bank’s investment in FHLB stock amounted to $4.1 million at December 31, 2017 and 2016, respectively. Federal Reserve Bank stock was $471 thousand at December 31, 2017 and 2016.
The following table shows the proceeds from sales of available-for-sale securities and the gross realized gains and losses on the sales of those securities that have been included in earnings as a result of the sales in 2016 and 2015. There were no sales in 2017.
| (Dollars in thousands)
|
|
2016
|
|
|
2015
|
| ||
| Proceeds |
$ | 1 | $ | 1,576 | ||||
| Realized gains |
$ | 1 | $ | 56 | ||||
| Realized losses |
– | – | ||||||
|
|
|
|
|
|||||
| Net securities gains |
$ | 1 | $ | 56 | ||||
|
|
|
|
|
|||||
36
2017 Report to Shareholders | CSB Bancorp, Inc.
NOTES TO CONSOLIDATED FINANCIAL STATEMENTS
NOTE 2 – SECURITIES (CONTINUED)
The following table presents gross unrealized losses, fair value of securities, aggregated by investment category, and length of time that individual securities have been in a continuous unrealized loss position, at December 31:
Securities in a Continuous Unrealized Loss Position
| Less Than 12 Months | 12 Months Or More | Total | ||||||||||||||||||||||||||||
| (Dollars in thousands) | Gross Unrealized Losses |
Fair Value |
Gross Unrealized Losses |
Fair Value |
Gross Unrealized Losses |
Fair Value | ||||||||||||||||||||||||
| 2017 |
||||||||||||||||||||||||||||||
|
Available-for-sale |
||||||||||||||||||||||||||||||
| U.S. Treasury security |
$ | 1 | $ | 998 | $ | – | $ | – | $ | 1 | $ | 998 | ||||||||||||||||||
| U.S. Government agencies |
46 | 3,804 | 75 | 4,425 | 121 | 8,229 | ||||||||||||||||||||||||
| Mortgage-backed securities of government agencies |
145 | 16,872 | 436 | 17,259 | 581 | 34,131 | ||||||||||||||||||||||||
| State and political subdivisions |
26 | 4,400 | 77 | 3,752 | 103 | 8,152 | ||||||||||||||||||||||||
| Corporate bonds |
2 | 2,912 | 140 | 2,360 | 142 | 5,272 | ||||||||||||||||||||||||
|
Held-to-maturity |
||||||||||||||||||||||||||||||
| U.S. Government agencies |
15 | 1,985 | 213 | 6,785 | 228 | 8,770 | ||||||||||||||||||||||||
| Mortgage-backed securities of government agencies |
18 | 1,818 | 127 | 3,116 | 145 | 4,934 | ||||||||||||||||||||||||
| State and political subdivisions |
5 | 4,695 | – | – | 5 | 4,695 | ||||||||||||||||||||||||
|
|
|
|
|
|
|
|
|
|
|
|
|
|||||||||||||||||||
| Total temporarily impaired securities |
$ | 258 | $ | 37,484 | $ | 1,068 | $ | 37,697 | $ | 1,326 | $ | 75,181 | ||||||||||||||||||
|
|
|
|
|
|
|
|
|
|
|
|
|
|||||||||||||||||||
| 2016 |
||||||||||||||||||||||||||||||
|
Available-for-sale |
||||||||||||||||||||||||||||||
| U.S. Government agencies |
98 | 6,402 | – | – | 98 | 6,402 | ||||||||||||||||||||||||
| Mortgage-backed securities of government agencies |
589 | 27,243 | – | – | 589 | 27,243 | ||||||||||||||||||||||||
| Asset-backed securities of government agencies |
– | – | 46 | 1,266 | 46 | 1,266 | ||||||||||||||||||||||||
| State and political subdivisions |
439 | 19,328 | – | – | 439 | 19,328 | ||||||||||||||||||||||||
| Corporate bonds |
33 | 3,593 | 111 | 1,889 | 144 | 5,482 | ||||||||||||||||||||||||
|
Held-to-maturity |
||||||||||||||||||||||||||||||
| U.S. Government agencies |
396 | 8,602 | – | – | 396 | 8,602 | ||||||||||||||||||||||||
| Mortgage-backed securities of government agencies |
28 | 2,018 | 173 | 3,621 | 201 | 5,639 | ||||||||||||||||||||||||
|
|
|
|
|
|
|
|
|
|
|
|
|
|||||||||||||||||||
| Total temporarily impaired securities |
$ | 1,583 | $ | 67,186 | $ | 330 | $ | 6,776 | $ | 1,913 | $ | 73,962 | ||||||||||||||||||
|
|
|
|
|
|
|
|
|
|
|
|
|
|||||||||||||||||||
There were seventy-four (74) securities in an unrealized loss position at December 31, 2017, thirty-three (33) of which were in a continuous loss position for twelve or more months. At least quarterly, the Company conducts a comprehensive security-level impairment assessment. The assessments are based on the nature of the securities, the extent and duration of the securities, the extent and duration of the loss, and management’s intent to sell or if it is more likely than not that management will be required to sell a security before recovery of its amortized cost basis, which may be maturity. Management believes the Company will fully recover the cost of these securities and it does not intend to sell these securities and likely will not be required to sell them before the anticipated recovery of the remaining amortized cost basis, which may be maturity. As a result, management concluded that these securities were not other-than-temporarily impaired at December 31, 2017.
2017 Report to Shareholders | CSB Bancorp, Inc.
37
NOTES TO CONSOLIDATED FINANCIAL STATEMENTS
NOTE 3 – LOANS
Loans consisted of the following at December 31:
| (Dollars in thousands)
|
2017
|
2016
|
||||||
|
|
||||||||
| Commercial |
$ | 140,273 | $ | 134,268 | ||||
| Commercial real estate |
179,663 | 159,475 | ||||||
| Residential real estate |
157,172 | 144,489 | ||||||
| Construction & land development |
22,886 | 23,428 | ||||||
| Consumer |
16,306 | 13,308 | ||||||
|
|
|
|
|
|||||
| Total loans before deferred costs |
516,300 | 474,968 | ||||||
| Deferred loan costs |
530 | 481 | ||||||
|
|
|
|
|
|||||
| Total loans |
$ | 516,830 | $ | 475,449 | ||||
|
|
|
|
|
|||||
Loan Origination/Risk Management
The Company has certain lending policies and procedures in place that are designed to maximize loan income within an acceptable level of risk. Management reviews and the Board of Directors approves these policies and procedures on a regular basis. A reporting system supplements the review process by providing management with frequent reports related to loan production, loan quality, concentrations of credit, loan delinquencies, and non-performing and potential problem loans. Diversification in the loan portfolio is a means of managing risk associated with fluctuations in economic conditions.
Commercial loans are underwritten after evaluating and understanding the borrower’s ability to operate profitably and prudently expand their business. Underwriting standards are designed to promote relationship banking rather than transactional banking. The Company’s management examines current and occasionally projected cash flows to determine the ability of the borrower to repay their obligations as agreed. Commercial loans are primarily made based on the identified cash flows of the borrower and secondarily on the underlying collateral provided by the borrower. However, the cash flows of borrowers may not be as expected and the collateral securing these loans may fluctuate in value. Most commercial loans are secured by the assets being financed or other business assets, such as accounts receivable or inventory, and may incorporate a personal guarantee; however, some short-term loans may be made on an unsecured basis. In the case of loans secured by accounts receivable, the availability of funds for the repayment of these loans may be substantially dependent on the ability of the borrower to collect amounts due from its customers.
Commercial real estate loans are subject to underwriting standards and processes similar to commercial loans, in addition to those of real estate loans. These loans are viewed primarily as cash flow loans and secondarily as loans secured by real estate. Commercial real estate lending typically involves higher loan principal amounts and the repayment of these loans is largely dependent on the successful operation of the property securing the loan or the business conducted on the property securing the loan. Commercial real estate loans may be adversely affected by conditions in the real estate markets or in the general economy. The properties securing the Company’s commercial real estate portfolio are diverse in terms of type. This diversity helps reduce the Company’s exposure to adverse economic events that affect any single industry. Management monitors and evaluates commercial real estate loans based on collateral, geography, and risk grade criteria.
With respect to loans to developers and builders that are secured by non-owner occupied properties, the Company generally requires the borrower to have had an existing relationship with the Company and have a proven record of success. Construction and land development loans are underwritten utilizing independent appraisal reviews, sensitivity analysis of absorption, lease rates, and financial analysis of developers and property owners. Construction and land development loans are generally based upon estimates of costs and value associated with the completed project. These estimates may be inaccurate. Construction and land development loans often involve the disbursement of substantial funds with repayment substantially dependent on the success of the project. Sources of repayment for these types of loans may be pre-committed permanent loans from approved long-term lenders, sales of developed property, or permanent financing from the Company. These loans are closely monitored by on-site inspections and are considered to have higher risk than other real estate loans due to their ultimate repayment being sensitive to interest rate changes, governmental regulation of real property, general economic conditions, and the availability of long-term financing.
The Company originates consumer loans utilizing a judgmental underwriting process. Policies and procedures are developed and modified, as needed, by management to monitor and manage consumer loan risk. This activity, coupled with relatively small loan amounts that are spread across many individual borrowers, minimizes risk.
The Company engages an independent loan review vendor that reviews and validates the credit risk program on a periodic basis. Results of these reviews are presented to management and the Audit Committee. The loan review process complements and reinforces the risk identification and assessment decisions made by lenders and credit personnel, as well as the Company’s policies and procedures.
38
2017 Report to Shareholders | CSB Bancorp, Inc.
NOTES TO CONSOLIDATED FINANCIAL STATEMENTS
NOTE 3 – LOANS (CONTINUED)
Concentrations of Credit
Nearly all of the Company’s lending activity occurs within the State of Ohio, including the four counties of Holmes, Stark, Tuscarawas, and Wayne, as well as other markets. The majority of the Company’s loan portfolio consists of commercial and industrial and commercial real estate loans. See concentration of credit discussion included in the 2017 Financial Review.
Allowance for Loan Losses
The following table details activity in the allowance for loan losses by portfolio segment for the years ended December 31, 2017, 2016, and 2015. Allocation of a portion of the allowance to one category of loans does not preclude its availability to absorb losses in other categories.
During 2017, the increase in the provision for loan losses related to commercial loans was primarily due to the net charge-offs of loans in this category. The increase related to commercial real estate loans was due to the increase of nonperforming loans in this category, as well as the increase in the specific allocation to one commercial real estate loan. The increase in the provision amounts allocated to the remaining loan categories, primarily relate to loan growth.
During 2016, the largest increase in the provision for loan losses occurred in the commercial loan category. The increase was primarily due to the specific allocation related to one loan relationship along with charge-offs of loans in this category. The increase in the provision amounts allocated to the remaining loan categories, primarily relate to loan growth. The decrease in the provision amount allocated to the commercial real estate category is primarily due to the recovery of prior loan charge-offs.
During 2015, the increase in the provision for loan losses related to commercial loans was primarily due to an increase in the specific allowance related to impaired loans in this category. The decrease in the provision related to commercial real estate loans was due to the improved credit quality of loans in this category. The increase in the provision related to residential real estate loans was due to the increase in net charge-offs of loans in this category as well as the increase in loan volume.
Summary of Allowance for Loan Losses
| (Dollars in thousands) | Commercial | Commercial Real Estate |
Residential Real Estate |
Construction & Land |
Consumer | Unallocated | Total | ||||||||||||||||||||||||||||
| December 31, 2017 |
|||||||||||||||||||||||||||||||||||
| Beginning balance |
$ | 2,207 | $ | 1,264 | $ | 1,189 | $ | 178 | $ | 141 | $ | 312 | $ | 5,291 | |||||||||||||||||||||
| Provision for loan losses |
429 | 471 | 76 | 59 | 51 | 59 | 1,145 | ||||||||||||||||||||||||||||
| Charge-offs |
(1,184) | – | – | – | (20) | (1,204) | |||||||||||||||||||||||||||||
| Recoveries |
361 | – | 8 | – | 3 | 372 | |||||||||||||||||||||||||||||
|
|
|
|
|
|
|
|
|
|
|
|
|
|
|
||||||||||||||||||||||
| Net charge-offs |
(823) | – | 8 | – | (17) | (832) | |||||||||||||||||||||||||||||
|
|
|
|
|
|
|
|
|
|
|
|
|
|
|
||||||||||||||||||||||
| Ending balance |
$ 1,813 | $ | 1,735 | $ | 1,273 | $ | 237 | $ | 175 | $ | 371 | $ | 5,604 | ||||||||||||||||||||||
|
|
|
|
|
|
|
|
|
|
|
|
|
|
|
||||||||||||||||||||||
| December 31, 2016 |
|||||||||||||||||||||||||||||||||||
| Beginning balance |
$ | 1,664 | $ | 1,271 | $ | 1,086 | $ | 123 | $ | 86 | $ | 432 | $ | 4,662 | |||||||||||||||||||||
| Provision for loan losses |
626 | (291) | 110 | 55 | 113 | (120) | 493 | ||||||||||||||||||||||||||||
| Charge-offs |
(297) | (50) | (12) | – | (59) | (418) | |||||||||||||||||||||||||||||
| Recoveries |
214 | 334 | 5 | – | 1 | 554 | |||||||||||||||||||||||||||||
|
|
|
|
|
|
|
|
|
|
|
|
|
|
|
||||||||||||||||||||||
| Net charge-offs |
(83) | 284 | (7) | – | (58) | 136 | |||||||||||||||||||||||||||||
|
|
|
|
|
|
|
|
|
|
|
|
|
|
|
||||||||||||||||||||||
| Ending balance |
$ | 2,207 | $ | 1,264 | $ | 1,189 | $ | 178 | $ | 141 | $ | 312 | $ | 5,291 | |||||||||||||||||||||
|
|
|
|
|
|
|
|
|
|
|
|
|
|
|
||||||||||||||||||||||
| December 31, 2015 |
|||||||||||||||||||||||||||||||||||
| Beginning balance |
$ | 1,289 | $ | 1,524 | $ | 1,039 | $ | 142 | $ | 60 | $ | 327 | $ | 4,381 | |||||||||||||||||||||
| Provision for loan losses |
285 | (205) | 161 | (19) | 62 | 105 | 389 | ||||||||||||||||||||||||||||
| Charge-offs |
(109) | (61) | (132) | – | (46) | (348) | |||||||||||||||||||||||||||||
| Recoveries |
199 | 13 | 18 | – | 10 | 240 | |||||||||||||||||||||||||||||
|
|
|
|
|
|
|
|
|
|
|
|
|
|
|
||||||||||||||||||||||
| Net charge-offs |
90 | (48) | (114) | – | (36) | (108) | |||||||||||||||||||||||||||||
|
|
|
|
|
|
|
|
|
|
|
|
|
|
|
||||||||||||||||||||||
| Ending balance |
$ | 1,664 | $ | 1,271 | $ | 1,086 | $ | 123 | $ | 86 | $ | 432 | $ | 4,662 | |||||||||||||||||||||
|
|
|
|
|
|
|
|
|
|
|
|
|
|
|
||||||||||||||||||||||
2017 Report to Shareholders | CSB Bancorp, Inc.
39
NOTES TO CONSOLIDATED FINANCIAL STATEMENTS
NOTE 3 – LOANS (CONTINUED)
The following table presents the balance in the allowance for loan losses and the ending loan balances by portfolio segment and impairment method as of December 31:
| (Dollars in thousands) | Commercial | Commercial Real Estate |
Residential Real Estate |
Construction & Land |
Consumer | Unallocated | Total | ||||||||||||||||||||||||||||
| 2017 |
|||||||||||||||||||||||||||||||||||
| Allowance for loan losses: |
|||||||||||||||||||||||||||||||||||
| Ending allowance balances attributable to loans: |
|||||||||||||||||||||||||||||||||||
| Individually evaluated for impairment |
$ | 74 | $ | 151 | $ | 19 | $ | – | $ | – | $ | – | $ | 244 | |||||||||||||||||||||
| Collectively evaluated for impairment |
1,739 | 1,584 | 1,254 | 237 | 175 | 371 | 5,360 | ||||||||||||||||||||||||||||
|
|
|
|
|
|
|
|
|
|
|
|
|
|
|
||||||||||||||||||||||
| Total ending allowance balance |
$ | 1,813 | $ | 1,735 | $ | 1,273 | $ | 237 | $ | 175 | $ | 371 | $ | 5,604 | |||||||||||||||||||||
|
|
|
|
|
|
|
|
|
|
|
|
|
|
|
||||||||||||||||||||||
| Loans: |
|||||||||||||||||||||||||||||||||||
| Loans individually evaluated for impairment |
$ | 1,726 | $ | 4,686 | $ | 1,470 | $ | – | $ | – | $ | 7,882 | |||||||||||||||||||||||
| Loans collectively evaluated for impairment |
138,547 | 174,977 | 155,702 | 22,886 | 16,306 | 508,418 | |||||||||||||||||||||||||||||
|
|
|
|
|
|
|
|
|
|
|
|
|
||||||||||||||||||||||||
| Total ending loans balance |
$ | 140,273 | $ | 179,663 | $ | 157,172 | $ | 22,886 | $ | 16,306 | $ | 516,300 | |||||||||||||||||||||||
|
|
|
|
|
|
|
|
|
|
|
|
|
||||||||||||||||||||||||
| 2016 |
|||||||||||||||||||||||||||||||||||
| Allowance for loan losses: |
|||||||||||||||||||||||||||||||||||
| Ending allowance balances attributable to loans: |
|||||||||||||||||||||||||||||||||||
| Individually evaluated for impairment |
$ | 705 | $ | – | $ | 24 | $ | – | $ | – | $ | – | $ | 729 | |||||||||||||||||||||
| Collectively evaluated for impairment |
1,502 | 1,264 | 1,165 | 178 | 141 | 312 | 4,562 | ||||||||||||||||||||||||||||
|
|
|
|
|
|
|
|
|
|
|
|
|
|
|
||||||||||||||||||||||
| Total ending allowance balance |
$ | 2,207 | $ | 1,264 | $ | 1,189 | $ | 178 | $ | 141 | $ | 312 | $ | 5,291 | |||||||||||||||||||||
|
|
|
|
|
|
|
|
|
|
|
|
|
|
|
||||||||||||||||||||||
| Loans: |
|||||||||||||||||||||||||||||||||||
| Loans individually evaluated for impairment |
$ | 5,028 | $ | 621 | $ | 1,507 | $ | – | $ | – | $ | 7,156 | |||||||||||||||||||||||
| Loans collectively evaluated for impairment |
129,240 | 158,854 | 142,982 | 23,428 | 13,308 | 467,812 | |||||||||||||||||||||||||||||
|
|
|
|
|
|
|
|
|
|
|
|
|
||||||||||||||||||||||||
| Total ending loans balance |
$ | 134,268 | $ | 159,475 | $ | 144,489 | $ | 23,428 | $ | 13,308 | $ | 474,968 | |||||||||||||||||||||||
|
|
|
|
|
|
|
|
|
|
|
|
|
||||||||||||||||||||||||
40
2017 Report to Shareholders | CSB Bancorp, Inc.
NOTES TO CONSOLIDATED FINANCIAL STATEMENTS
NOTE 3 – LOANS (CONTINUED)
The following table presents loans individually evaluated for impairment by class of loans as of December 31:
| (Dollars in thousands) | Unpaid Principal Balance |
Recorded Investment With No Allowance |
Recorded Investment With Allowance |
Total Recorded Investment1 |
Related Allowance |
Average Recorded Investment |
Interest Income Recognized | ||||||||||||||||||||||||||||
| 2017 |
|||||||||||||||||||||||||||||||||||
| Commercial |
$ | 3,352 | $ | 1,329 | $ | 399 | $ | 1,728 | $ | 74 | $ | 2,884 | $ | 52 | |||||||||||||||||||||
| Commercial real estate |
4,826 | 3,117 | 1,566 | 4,683 | 151 | 3,213 | 14 | ||||||||||||||||||||||||||||
| Residential real estate |
1,654 | 1,119 | 352 | 1,471 | 19 | 1,476 | 57 | ||||||||||||||||||||||||||||
| Construction & land development |
– | – | – | – | – | – | – | ||||||||||||||||||||||||||||
|
|
|
|
|
|
|
|
|
|
|
|
|
|
|
||||||||||||||||||||||
| Total impaired loans |
$ | 9,832 | $ | 5,565 | $ | 2,317 | $ | 7,882 | $ | 244 | $ | 7,573 | $ | 123 | |||||||||||||||||||||
|
|
|
|
|
|
|
|
|
|
|
|
|
|
|
||||||||||||||||||||||
| 2016 |
|||||||||||||||||||||||||||||||||||
| Commercial |
$ | 5,476 | $ | 1,690 | $ | 3,354 | $ | 5,044 | $ | 705 | $ | 6,609 | $ | 241 | |||||||||||||||||||||
| Commercial real estate |
796 | 600 | 21 | 621 | – | 786 | 10 | ||||||||||||||||||||||||||||
| Residential real estate |
1,681 | 1,036 | 472 | 1,508 | 24 | 1,507 | 61 | ||||||||||||||||||||||||||||
| Construction & land development |
– | – | – | – | – | – | – | ||||||||||||||||||||||||||||
|
|
|
|
|
|
|
|
|
|
|
|
|
|
|
||||||||||||||||||||||
| Total impaired loans |
$ | 7,953 | $ | 3,326 | $ | 3,847 | $ | 7,173 | $ | 729 | $ | 8,902 | $ | 312 | |||||||||||||||||||||
|
|
|
|
|
|
|
|
|
|
|
|
|
|
|
||||||||||||||||||||||
| 2015 |
|||||||||||||||||||||||||||||||||||
| Commercial |
$ | 6,541 | $ | 5,832 | $ | 301 | $ | 6,133 | $ | 299 | $ | 5,972 | $ | 230 | |||||||||||||||||||||
| Commercial real estate |
1,265 | 670 | 393 | 1,063 | 64 | 1,420 | 18 | ||||||||||||||||||||||||||||
| Residential real estate |
1,689 | 967 | 568 | 1,535 | 26 | 1,671 | 61 | ||||||||||||||||||||||||||||
| Construction & land development |
– | – | – | – | – | – | – | ||||||||||||||||||||||||||||
|
|
|
|
|
|
|
|
|
|
|
|
|
|
|
||||||||||||||||||||||
| Total impaired loans |
$ | 9,495 | $ | 7,469 | $ | 1,262 | $ | 8,731 | $ | 389 | $ | 9,063 | $ | 309 | |||||||||||||||||||||
|
|
|
|
|
|
|
|
|
|
|
|
|
|
|
||||||||||||||||||||||
1Includes principal, accrued interest, unearned fees, and origination costs.
2017 Report to Shareholders | CSB Bancorp, Inc.
41
NOTES TO CONSOLIDATED FINANCIAL STATEMENTS
NOTE 3 – LOANS (CONTINUED)
The following table presents the aging of past due and nonaccrual loans by class of loans as of December 31:
| (Dollars in thousands) | Current | 30-59 Days Past Due |
60-89 Days Past Due |
90 Days + Past Due |
Nonaccrual | Total Past Due and Nonaccrual |
Total Loans | ||||||||||||||||||||||||||||
| 2017 |
|||||||||||||||||||||||||||||||||||
| Commercial |
$ | 138,908 | $ | 148 | $ | 65 | $ | – | $ | 1,152 | $ | 1,365 | $ | 140,273 | |||||||||||||||||||||
| Commercial real estate |
175,062 | 177 | – | 40 | 4,384 | 4,601 | 179,663 | ||||||||||||||||||||||||||||
| Residential real estate |
155,488 | 757 | 38 | 401 | 488 | 1,684 | 157,172 | ||||||||||||||||||||||||||||
| Construction & land development |
22,886 | – | – | – | – | – | 22,886 | ||||||||||||||||||||||||||||
| Consumer |
16,048 | 193 | 8 | – | 57 | 258 | 16,306 | ||||||||||||||||||||||||||||
|
|
|
|
|
|
|
|
|
|
|
|
|
|
|
||||||||||||||||||||||
| Total loans |
$ | 508,392 | $ | 1,275 | $ | 111 | $ | 441 | $ | 6,081 | $ | 7,908 | $ | 516,300 | |||||||||||||||||||||
|
|
|
|
|
|
|
|
|
|
|
|
|
|
|
||||||||||||||||||||||
| 2016 |
|||||||||||||||||||||||||||||||||||
| Commercial |
$ | 133,630 | $ | 151 | $ | 62 | $ | – | $ | 425 | $ | 638 | $ | 134,268 | |||||||||||||||||||||
| Commercial real estate |
158,504 | 435 | – | 39 | 497 | 971 | 159,475 | ||||||||||||||||||||||||||||
| Residential real estate |
142,926 | 816 | 61 | 196 | 490 | 1,563 | 144,489 | ||||||||||||||||||||||||||||
| Construction & land development |
23,428 | – | – | – | – | – | 23,428 | ||||||||||||||||||||||||||||
| Consumer |
13,234 | 21 | 16 | – | 37 | 74 | 13,308 | ||||||||||||||||||||||||||||
|
|
|
|
|
|
|
|
|
|
|
|
|
|
|
||||||||||||||||||||||
| Total loans |
$ | 471,722 | $ | 1,423 | $ | 139 | $ | 235 | $ | 1,449 | $ | 3,246 | $ | 474,968 | |||||||||||||||||||||
|
|
|
|
|
|
|
|
|
|
|
|
|
|
|
||||||||||||||||||||||
Troubled Debt Restructurings
The Company had troubled debt restructurings (“TDRs”) of $2.9 million as of December 31, 2017, with $38 thousand of specific reserves allocated to customers whose loan terms have been modified in TDRs. As of December 31, 2016, the Company had TDRs of $6.4 million, with $711 thousand of specific reserves allocated. At December 31, 2017, $2 million of the loans classified as TDRs were performing in accordance with their modified terms. The remaining $900 thousand were classified as nonaccrual.
Loan modifications that are considered TDRs completed during the year ended December 31 were as follows:
| (Dollars in thousands) | Number Of Loans Restructured |
Pre-Modification Recorded Investment |
Post-Modification Recorded Investment | ||||||||||||
| 2017 |
|||||||||||||||
| Commercial |
2 | $ | 150 | $ | 150 | ||||||||||
| Commercial real estate |
4 | 288 | 288 | ||||||||||||
| Residential real estate |
2 | 52 | 52 | ||||||||||||
|
|
|
|
|
|
|
||||||||||
| Total restructured loans |
8 | $ | 490 | $ | 490 | ||||||||||
|
|
|
|
|
|
|
||||||||||
| 2016 |
|||||||||||||||
| Commercial |
4 | $ | 3,607 | $ | 3,607 | ||||||||||
| Residential real estate |
1 | 101 | 101 | ||||||||||||
|
|
|
|
|
|
|
||||||||||
| Total restructured loans |
5 | $ | 3,708 | $ | 3,708 | ||||||||||
|
|
|
|
|
|
|
||||||||||
The loans restructured were modified by changing the monthly payment to interest only and extending the maturity dates. No principal reductions were made. There was one commercial loan in the amount of $3.3 million that was restructured in the fourth quarter of 2016 that has defaulted in 2017. None of the loans restructured in 2015 subsequently defaulted in 2016.
42
2017 Report to Shareholders | CSB Bancorp, Inc.
NOTES TO CONSOLIDATED FINANCIAL STATEMENTS
NOTE 3 – LOANS (CONTINUED)
Real Estate Loans in Foreclosure
The Company held no foreclosed real estate as of December 31, 2017, or December 31, 2016. Mortgage loans in the process of foreclosure were $114 thousand at December 31, 2017, and $448 thousand at December 31, 2016.
Credit Quality Indicators
The Company categorizes loans into risk categories based on relevant information about the ability of borrowers to service their debt such as: current financial information, historical payment experience, credit documentation, public information, and current economic trends, among other factors. The Company analyzes commercial loans individually by classifying the loans as to credit risk. This analysis includes commercial loans with an outstanding balance greater than $300 thousand. This analysis is performed on an annual basis.
The Company uses the following definitions for risk ratings:
Pass. Loans classified as pass (Acceptable, Low Acceptable, or Pass Watch) may exhibit a wide array of characteristics but at a minimum represent an acceptable risk to the Bank. Borrowers in this rating may have leveraged but acceptable balance sheet positions, satisfactory asset quality, stable to favorable sales and earnings trends, acceptable liquidity, and adequate cash flow. Loans are considered fully collectible and require an average amount of administration. While generally adhering to credit policy, these loans may exhibit occasional exceptions that do not result in undue risk to the Bank. Borrowers are generally capable of absorbing setbacks, financial and otherwise, without the threat of failure.
Special Mention. Loans classified as special mention have a material weakness that deserves management’s close attention. If left uncorrected, these weaknesses may result in deterioration of the repayment prospects for the loan or of the Bank’s credit position at some future date.
Substandard. Loans classified as substandard are inadequately protected by the current net worth and paying capacity of the obligor or of the collateral pledged, if any. Loans so classified have a well-defined weakness or weaknesses that jeopardize the liquidation of the debt. They are characterized by the distinct possibility that the Bank will sustain some loss if the deficiencies are not corrected.
Doubtful. Loans classified as doubtful have all the weaknesses inherent in those classified as substandard, with the added characteristic that the weaknesses make collection or liquidation in full, on the basis of currently existing facts, conditions, values, highly questionable, and improbable.
Loans not meeting the criteria above that are analyzed individually as part of the above described process are considered to be pass rated loans. Loans listed as not rated are either less than $300 thousand or are included in groups of homogeneous loans. Based on the most recent analysis performed, the risk category of loans by class was as follows at December 31:
| (Dollars in thousands)
|
Pass
|
Special Mention
|
Substandard
|
Doubtful
|
Not Rated
|
Total
| ||||||||||||||||||||||||
| 2017 |
||||||||||||||||||||||||||||||
| Commercial |
$ | 116,833 | $ | 13,685 | $ | 8,841 | $ | – | $ | 914 | $ | 140,273 | ||||||||||||||||||
| Commercial real estate |
162,012 | 8,220 | 8,620 | – | 811 | 179,663 | ||||||||||||||||||||||||
| Residential real estate |
205 | – | 470 | – | 156,497 | 157,172 | ||||||||||||||||||||||||
| Construction & land development |
18,493 | 880 | – | – | 3,513 | 22,886 | ||||||||||||||||||||||||
| Consumer |
– | – | 57 | – | 16,249 | 16,306 | ||||||||||||||||||||||||
|
|
|
|
|
|
|
|
|
|
|
|
|
|||||||||||||||||||
| Total |
$ | 297,543 | $ | 22,785 | $ | 17,988 | $ | – | $ | 177,984 | $ | 516,300 | ||||||||||||||||||
|
|
|
|
|
|
|
|
|
|
|
|
|
|||||||||||||||||||
| 2016 |
||||||||||||||||||||||||||||||
| Commercial |
$ | 116,739 | $ | 6,874 | $ | 9,704 | $ | – | $ | 951 | $ | 134,268 | ||||||||||||||||||
| Commercial real estate |
149,630 | 4,168 | 4,766 | – | 911 | 159,475 | ||||||||||||||||||||||||
| Residential real estate |
216 | – | 175 | – | 144,098 | 144,489 | ||||||||||||||||||||||||
| Construction & land development |
17,183 | 981 | 504 | – | 4,760 | 23,428 | ||||||||||||||||||||||||
| Consumer |
– | – | – | – | 13,308 | 13,308 | ||||||||||||||||||||||||
|
|
|
|
|
|
|
|
|
|
|
|
|
|||||||||||||||||||
| Total |
$ | 283,768 | $ | 12,023 | $ | 15,149 | $ | – | $ | 164,028 | $ | 474,968 | ||||||||||||||||||
|
|
|
|
|
|
|
|
|
|
|
|
|
|||||||||||||||||||
2017 Report to Shareholders | CSB Bancorp, Inc.
43
NOTES TO CONSOLIDATED FINANCIAL STATEMENTS
NOTE 3 – LOANS (CONTINUED)
Nonperforming loans include loans past due 90 days and greater and loans on nonaccrual of interest status. The following table presents loans that are not rated, by class of loans as of December 31:
| (Dollars in thousands) | Performing | Nonperforming | Total | ||||||||||||
| 2017 |
|||||||||||||||
| Commercial |
$ | 914 | $ | – | $ | 914 | |||||||||
| Commercial real estate |
811 | – | 811 | ||||||||||||
| Residential real estate |
155,608 | 889 | 156,497 | ||||||||||||
| Construction & land development |
3,513 | – | 3,513 | ||||||||||||
| Consumer |
16,249 | 57 | 16,306 | ||||||||||||
|
|
|
|
|
|
|
||||||||||
| Total |
$ | 177,095 | $ | 946 | $ | 178,041 | |||||||||
|
|
|
|
|
|
|
||||||||||
| 2016 |
|||||||||||||||
| Commercial |
$ | 951 | $ | – | $ | 951 | |||||||||
| Commercial real estate |
911 | – | 911 | ||||||||||||
| Residential real estate |
143,440 | 658 | 144,098 | ||||||||||||
| Construction & land development |
4,760 | – | 4,760 | ||||||||||||
| Consumer |
13,271 | 37 | 13,308 | ||||||||||||
|
|
|
|
|
|
|
||||||||||
| Total |
$ | 163,333 | $ | 695 | $ | 164,028 | |||||||||
|
|
|
|
|
|
|
||||||||||
Mortgage Servicing Rights
For the years ended December 31, 2017 and 2016, the Company had outstanding MSRs of $270 thousand and $261 thousand, respectively. No valuation allowance was recorded at December 31, 2017 or 2016, as the fair value of the MSRs exceeded their carrying value. On December 31, 2017, the Company had $64.7 million residential mortgage loans with servicing retained as compared to $61.8 million with servicing retained at December 31, 2016.
Total loans serviced for others approximated $82.7 million and $85.9 million at December 31, 2017 and 2016, respectively.
44
2017 Report to Shareholders | CSB Bancorp, Inc.
NOTES TO CONSOLIDATED FINANCIAL STATEMENTS
NOTE 4 – PREMISES AND EQUIPMENT
Premises and equipment consisted of the following at December 31:
| (Dollars in thousands) | 2017
|
2016
|
||||||||||
| Land and improvements |
$ | 1,925 | $ | 1,607 | ||||||||
| Buildings and improvements |
11,206 | 10,365 | ||||||||||
| Furniture and equipment |
6,121 | 6,346 | ||||||||||
| Leasehold improvements |
99 | 191 | ||||||||||
|
|
|
|
|
|||||||||
| 19,351 | 18,509 | |||||||||||
| Accumulated depreciation |
10,107 | 9,760 | ||||||||||
|
|
|
|
|
|||||||||
| Premises and equipment, net |
$ | 9,244 | $ | 8,749 | ||||||||
|
|
|
|
|
|||||||||
Depreciation expense amounted to $652 thousand, $690 thousand, and $660 thousand for the years ended December 31, 2017, 2016, and 2015, respectively.
The Bank leases certain office locations. Total rental expense under these leases approximated $158 thousand, $191 thousand, and $301 thousand in 2017, 2016, and 2015, respectively.
Future minimum lease payments at December 31, 2017 were as follows:
| (Dollars in thousands) | ||||||||||||
| 2018 |
$ | 108 | ||||||||||
| 2019 |
71 | |||||||||||
| 2020 |
71 | |||||||||||
|
|
|
|||||||||||
| Total |
$ | 250 | ||||||||||
|
|
|
|||||||||||
NOTE 5 – CORE DEPOSIT INTANGIBLE ASSETS
Core Deposit Intangible
No additional core deposit intangible was recorded in 2017, 2016, or 2015. The core deposit intangible asset will be amortized over an estimated life of ten years. Amortization expense related to the core deposit intangible asset totaled $116 thousand, $121 thousand, and $125 thousand in 2017, 2016, and 2015, respectively. The following table shows the core deposit intangible and the related accumulated amortization as of December 31:
| (Dollars in thousands)
|
2017
|
2016
|
2015
|
|||||||||||||
| Gross carrying amount |
$ | 1,251 | $ | 1,251 | $ | 1,251 | ||||||||||
| Accumulated amortization |
(984 | ) | (868 | ) | (747 | ) | ||||||||||
|
|
|
|
|
|
|
|||||||||||
| Net carrying amount |
$ | 267 | $ | 383 | $ | 504 | ||||||||||
|
|
|
|
|
|
|
|||||||||||
2017 Report to Shareholders | CSB Bancorp, Inc.
45
NOTES TO CONSOLIDATED FINANCIAL STATEMENTS
NOTE 5 – CORE DEPOSIT INTANGIBLE ASSETS (CONTINUED)
The estimated aggregate future amortization expense for the core deposit assets remaining as of December 31, 2017 was as follows:
| (Dollars in thousands)
|
Core Deposit Amortization
|
|||||||||
| 2018 |
$ | 101 | ||||||||
| 2019 |
63 | |||||||||
| 2020 |
59 | |||||||||
| 2021 |
44 | |||||||||
|
|
|
|||||||||
| $ | 267 | |||||||||
|
|
|
|||||||||
NOTE 6 – INTEREST-BEARING DEPOSITS
Interest-bearing deposits at December 31 were as follows:
| (Dollars in thousands)
|
2017
|
2016
| |||||||||||||
| Demand |
$ | 119,579 | $ | 97,683 | |||||||||||
| Savings |
180,217 | 163,169 | |||||||||||||
| Time deposits: |
|||||||||||||||
| In excess of $250,000 |
12,026 | 13,102 | |||||||||||||
| Other |
97,766 | 99,007 | |||||||||||||
|
|
|
|
|
||||||||||||
| Total interest-bearing deposits |
$ | 409,588 | $ | 372,961 | |||||||||||
|
|
|
|
|
||||||||||||
At December 31, 2017, stated maturities of time deposits were as follows:
| (Dollars in thousands)
|
|||||||
| 2018 |
$ | 61,124 | |||||
| 2019 |
21,409 | ||||||
| 2020 |
10,830 | ||||||
| 2021 |
11,148 | ||||||
| 2022 |
5,281 | ||||||
|
|
|
||||||
| Total |
$ | 109,792 | |||||
|
|
|
||||||
46
2017 Report to Shareholders | CSB Bancorp, Inc.
NOTES TO CONSOLIDATED FINANCIAL STATEMENTS
NOTE 7 – BORROWINGS
Short-term borrowings
Short-term borrowings include overnight repurchase agreements, federal funds purchased, and short-term advances through the FHLB. The outstanding balances and related information for short-term borrowings are summarized as follows:
| (Dollars in thousands) | 2017 | 2016 | ||||||||||
| Balance at year-end |
$ | 39,480 | $ | 48,742 | ||||||||
| Average balance outstanding |
50,445 | 51,801 | ||||||||||
| Maximum month-end balance |
56,932 | 55,642 | ||||||||||
| Weighted-average rate at year-end |
0.39 | % | 0.16 | % | ||||||||
| Weighted-average rate during the year |
0.29 | 0.14 | ||||||||||
Average balances outstanding during the year represent daily average balances; average interest rates represent interest expenses divided by the related average balances.
The following table provides additional detail regarding repurchase agreements accounted for as secured borrowings:
| Remaining Contractual Maturity Overnight and Continuous |
||||||||||
|
|
||||||||||
| (Dollars in thousands) | December 31,
|
December 31,
|
||||||||
| Securities of U.S. Government agencies and mortgage-backed securities of government agencies pledged, fair value |
$ 39,637 | $ 48,866 | ||||||||
| Repurchase agreements |
39,480 | 48,742 | ||||||||
Other borrowings
The following table sets forth information concerning other borrowings:
| Maturity Range | Weighted Average Interest |
Stated Interest Rate Range |
At December 31, | |||||||||||||||||||||||||
| (Dollars in thousands)
|
From
|
To
|
Rate
|
From
|
To
|
2017
|
2016
|
|||||||||||||||||||||
|
|
||||||||||||||||||||||||||||
| Fixed-rate |
12/20/17 | 12/21/17 | 3.61% | 3.48% | 3.73% | $ | – | $ | 10,000 | |||||||||||||||||||
| Fixed-rate amortizing |
4/1/24 | 6/1/37 | 1.86 | 1.16 | 2.01 | 11,409 | 2,385 | |||||||||||||||||||||
|
|
|
|
|
|||||||||||||||||||||||||
| $ | 11,409 | $ | 12,385 | |||||||||||||||||||||||||
|
|
|
|
|
|||||||||||||||||||||||||
Maturities of other borrowings at December 31, 2017, are summarized as follows for the years ended December 31:
| (Dollars in thousands) | Amount
|
Weighted
| ||||||||
| 2018 |
$ | 2,884 | 1.83% | |||||||
| 2019 |
2,195 | 1.83 | ||||||||
| 2020 |
1,665 | 1.84 | ||||||||
| 2021 |
1,258 | 1.85 | ||||||||
| 2022 and beyond |
3,407 | 1.92 | ||||||||
|
|
|
|||||||||
| $ | 11,409 | 1.86% | ||||||||
|
|
|
|||||||||
Monthly principal and interest payments, as well as 10% – 20% principal curtailments on the borrowings’ anniversary dates are due on the fixed-rate amortizing borrowings. FHLB borrowings are secured by a blanket collateral agreement. At December 31, 2017 the Company had the capacity to borrow an additional $81.8 million from the FHLB.
2017 Report to Shareholders | CSB Bancorp, Inc.
47
NOTES TO CONSOLIDATED FINANCIAL STATEMENTS
NOTE 8 – INCOME TAXES
The provision for income taxes consisted of the following for the years ended December 31:
| (Dollars in thousands)
|
2017
|
2016
|
2015
|
|||||||||||||||||
| Current |
$ | 3,296 | $ | 2,973 | $ | 2,564 | ||||||||||||||
| Deferred |
(167 | ) | (4 | ) | 83 | |||||||||||||||
| Change in corporate tax rate |
101 | – | – | |||||||||||||||||
|
|
|
|
|
|
|
|||||||||||||||
| Total income tax provision |
$ | 3,230 | $ | 2,969 | $ | 2,647 | ||||||||||||||
|
|
|
|
|
|
|
|||||||||||||||
The Tax Cuts and Jobs Act, enacted on December 22, 2017, lowered the federal income tax rate from 35% to 21% effective January 1, 2018. As a result, the carrying value of net deferred tax assets was reduced, which increased income tax expense by $101 thousand.
The income tax provision attributable to income from operations differed from the amounts computed by applying the statutory federal income tax rate of 34% to income before income taxes as follows:
| (Dollars in thousands)
|
2017
|
2016
|
2015
|
|||||||||||||||||
| Expected provision using statutory federal income tax rate |
$ | 3,513 | $ | 3,300 | $ | 2,947 | ||||||||||||||
| Effect of bond and loan tax-exempt income |
(251 | ) | (241 | ) | (216 | ) | ||||||||||||||
| Interest expense associated with carrying certain tax exempt bonds and loans |
6 | 5 | 4 | |||||||||||||||||
| Bank owned life insurance income |
(121 | ) | (94 | ) | (92 | ) | ||||||||||||||
| Other |
83 | (1 | ) | 4 | ||||||||||||||||
|
|
|
|
|
|
|
|||||||||||||||
| Total income tax provision |
$ | 3,230 | $ | 2,969 | $ | 2,647 | ||||||||||||||
|
|
|
|
|
|
|
|||||||||||||||
The tax effects of temporary differences that give rise to deferred tax assets and deferred tax liabilities at December 31 were as follows:
| (Dollars in thousands)
|
2017
|
2016
|
||||||||||||||||
| Allowance for loan losses |
$ | 1,275 | $ | 1,957 | ||||||||||||||
| Net operating loss carryforward |
– | 84 | ||||||||||||||||
| Unrealized loss on securities available-for-sale |
176 | 450 | ||||||||||||||||
| Other |
50 | 29 | ||||||||||||||||
|
|
|
|
|
|||||||||||||||
| Deferred tax assets |
1,501 | 2,520 | ||||||||||||||||
|
|
|
|
|
|||||||||||||||
| Premises and equipment |
(363 | ) | (384 | ) | ||||||||||||||
| Federal Home Loan Bank stock dividends |
(376 | ) | (609 | ) | ||||||||||||||
| Deferred loan fees |
(232 | ) | (362 | ) | ||||||||||||||
| Prepaid expenses |
(89 | ) | (182 | ) | ||||||||||||||
| Other |
(279 | ) | (380 | ) | ||||||||||||||
|
|
|
|
|
|||||||||||||||
| Deferred tax liabilities |
(1,339 | ) | (1,917 | ) | ||||||||||||||
|
|
|
|
|
|||||||||||||||
| Net deferred tax asset |
$ | 162 | $ | 603 | ||||||||||||||
|
|
|
|
|
|||||||||||||||
48
2017 Report to Shareholders | CSB Bancorp, Inc.
NOTES TO CONSOLIDATED FINANCIAL STATEMENTS
NOTE 8 – INCOME TAXES (CONTINUED)
There is currently no liability for uncertain tax positions and no known unrecognized tax benefits. The Company recognizes, when applicable, interest and penalties related to unrecognized tax benefits in the provision for income taxes in the Consolidated Statements of Income. With few exceptions, the Company is no longer subject to U.S. federal, state, or local income tax examinations by tax authorities for years prior to 2014.
NOTE 9 – EMPLOYEE BENEFITS
The Company sponsors a contributory 401(k) profit-sharing plan (the “Plan”) covering substantially all employees who meet certain age and service requirements. The Plan permits investment in the Company’s common stock subject to various limitations and provides for discretionary profit sharing and matching contributions. The discretionary profit sharing contribution is determined annually by the Board of Directors and amounted to 3.00% in 2017, 3.00% in 2016 and 2.75% in 2015 of each eligible participant’s compensation. The Plan also provided for a 50% Company match of participant contributions up to a maximum of 2% of each participant’s annual compensation in years 2017, 2016 and 2015. Beginning in 2018, the Plan provides for a 100% Company match up to a maximum of 4% of each participant’s annual compensation. Expense under the Plan amounted to approximately $363 thousand, $338 thousand, and $304 thousand for 2017, 2016, and 2015, respectively.
The following table summarizes stock options activity for the years ended December 31:
| 2016 | 2015 | |||||||||||||||||||||||||||||||
| Shares
|
Weighted
|
Shares
|
Weighted
|
|||||||||||||||||||||||||||||
| Outstanding at beginning of year |
5,952 | $ | 18.00 | 11,904 | $ | 18.00 | ||||||||||||||||||||||||||
| Granted |
– | – | – | – | ||||||||||||||||||||||||||||
| Exercised |
(5,952 | ) | (18.00 | ) | (5,952 | ) | (18.00 | ) | ||||||||||||||||||||||||
| Forfeited |
– | – | ||||||||||||||||||||||||||||||
|
|
|
|
|
|||||||||||||||||||||||||||||
| Outstanding at end of year |
– | – | 5,952 | 18.00 | ||||||||||||||||||||||||||||
|
|
|
|
|
|||||||||||||||||||||||||||||
| Options exercisable at year-end |
– | $ | – | 5,952 | $ | 18.00 | ||||||||||||||||||||||||||
| Weighted-average fair value of options granted during year |
N/A | N/A | N/A | N/A | ||||||||||||||||||||||||||||
There were no options outstanding at December 31, 2017 and 2016. The total intrinsic value of outstanding in-the-money stock options and outstanding in-the-money exercisable stock options was $39 thousand at December 31, 2015.
2017 Report to Shareholders | CSB Bancorp, Inc.
49
NOTES TO CONSOLIDATED FINANCIAL STATEMENTS
NOTE 10 – FINANCIAL INSTRUMENTS WITH OFF-BALANCE SHEET RISK
The Bank is party to financial instruments with off-balance sheet risk in the normal course of business to meet the financing needs of its customers. These financial instruments are primarily loan commitments to extend credit and letters of credit. These instruments involve, to varying degrees, elements of credit risk in excess of the amounts recognized in the Consolidated Balance Sheets. The contract amount of these instruments reflects the extent of involvement the Bank has in these financial instruments. The Bank’s exposure to credit loss in the event of the nonperformance by the other party to the financial instruments for loan commitments to extend credit and letters of credit is represented by the contractual amounts of these instruments. The Bank uses the same credit policies in making loan commitments as it does for on-balance sheet loans.
The following financial instruments whose contract amount represents credit risk were outstanding at December 31:
| (Dollars in thousands) | 2017 | 2016 | ||||||||
| Commitments to extend credit |
$ | 177,354 | $ | 162,763 | ||||||
| Letters of credit |
849 | 972 | ||||||||
Commitments to extend credit are agreements to lend to a customer as long as there is no violation of any condition established in the contract. Consumer commitments generally have fixed expiration dates and commercial commitments are generally due on demand and may require payment of a fee. Since many of the commitments are expected to expire without being drawn upon, the total commitment amount does not necessarily represent future cash requirements. The Company evaluates each customer’s credit worthiness on a case-by-case basis. The amount of collateral, obtained if deemed necessary by the Company upon extension of credit, is based on management’s credit evaluation of the customer. Collateral held varies but may include residential real estate, accounts receivable, recognized inventory, property, plant and equipment, and income-producing commercial properties.
Letters of credit are written conditional commitments issued by the Company to guarantee the performance of a customer to a third party and are reviewed for renewal at expiration. The credit risk involved in issuing letters of credit is essentially the same as that involved in extending loans to customers. The Company requires collateral supporting these commitments when deemed appropriate.
NOTE 11 – RELATED-PARTY TRANSACTIONS
In the ordinary course of business, loans are made by the Bank to executive officers, directors, and their related business interests consistent with Federal Reserve Regulation O.
The following is an analysis of activity of related-party loans for the years ended December 31:
| (Dollars in thousands) | 2017 | 2016 | ||||||||
| Balance at beginning of year |
$ | 321 | $ | 495 | ||||||
| New loans and advances |
478 | 84 | ||||||||
| Repayments, including loans sold |
294 | 117 | ||||||||
| Changes in related parties1 |
– | (141 | ) | |||||||
|
|
|
|
|
|||||||
| Balance at end of year |
$ | 505 | $ | 321 | ||||||
|
|
|
|
|
|||||||
1The adjustment made in 2016 relates to the retirement of a senior management member.
Deposits from executive officers, directors, and their related business interests at December 31, 2017 and 2016 were approximately $2.1 million and $3.0 million.
50
2017 Report to Shareholders | CSB Bancorp, Inc.
NOTES TO CONSOLIDATED FINANCIAL STATEMENTS
NOTE 12 – REGULATORY MATTERS
The Company (on a consolidated basis) and Bank are subject to various regulatory capital requirements administered by the federal and state banking agencies. Failure to meet minimum capital requirements can initiate certain mandatory and possibly additional discretionary actions by regulators that, if undertaken, could have a direct material effect on the Company’s and Bank’s financial performance. Under capital adequacy guidelines and the regulatory framework for prompt corrective action, the Company and Bank must meet specific capital guidelines that involve quantitative measures of the assets, liabilities, and certain off-balance-sheet items as calculated under regulatory accounting practices. The capital amounts and classification are also subject to qualitative judgments by the regulators about components, risk weightings, and other factors.
Quantitative measures established by regulation to ensure capital adequacy require the Company and Bank to maintain minimum amounts and ratios (set forth in the following table) of total capital, tier 1 capital and common equity tier 1 capital (as defined in the regulations) to risk-weighted assets (as defined), and of tier 1 capital to average assets (as defined). Management believes as of December 31, 2017 and 2016, the Company and Bank met or exceeded all capital adequacy requirements to which they are subject.
As of December 31, 2017, the most recent notification from federal and state banking agencies categorized the Bank as “well capitalized” under the regulatory framework for prompt corrective action. To be categorized as “well capitalized” an institution must maintain minimum total risk-based, tier 1 risk-based, common equity tier 1, and tier 1 leverage ratios as set forth in the following tables. There are no known conditions or events since that notification that Management believes have changed the Bank’s category.
The actual capital amounts and ratios of the Company and Bank as of December 31 are presented in the following tables:
| Actual | Minimum Required For Capital Adequacy Purposes |
Minimum Required To Be Well Capitalized Under Prompt Corrective Action |
||||||||||||||||||||||
| (Dollars in thousands) | Amount | Ratio | Amount | Ratio | Amount | Ratio | ||||||||||||||||||
| 2017 |
||||||||||||||||||||||||
| Total capital to risk-weighted assets |
||||||||||||||||||||||||
| Consolidated |
$ | 71,815 | 13.8 | % | $ | 41,693 | 8.0 | % | $ | 52,116 | 10.0 | % | ||||||||||||
| Bank |
70,672 | 13.6 | 41,684 | 8.0 | 52,105 | 10.0 | ||||||||||||||||||
| Tier 1 capital to risk-weighted assets |
||||||||||||||||||||||||
| Consolidated |
66,203 | 12.7 | 31,270 | 6.0 | 41,693 | 8.0 | ||||||||||||||||||
| Bank |
65,060 | 12.5 | 31,263 | 6.0 | 41,684 | 8.0 | ||||||||||||||||||
| Common equity tier 1 capital to risk-weighted assets |
||||||||||||||||||||||||
| Consolidated |
66,203 | 12.7 | 23,452 | 4.5 | 33,876 | 6.5 | ||||||||||||||||||
| Bank |
65,060 | 12.5 | 23,447 | 4.5 | 33,868 | 6.5 | ||||||||||||||||||
| Tier 1 capital to average assets |
||||||||||||||||||||||||
| Consolidated |
66,203 | 9.3 | 28,437 | 4.0 | 35,546 | 5.0 | ||||||||||||||||||
| Bank |
65,060 | 9.2 | 28,432 | 4.0 | 35,541 | 5.0 | ||||||||||||||||||
| 2016 |
||||||||||||||||||||||||
| Total capital to risk-weighted assets |
||||||||||||||||||||||||
| Consolidated |
$ | 66,545 | 13.7 | % | $ | 38,936 | 8.0 | % | $ | 48,670 | 10.0 | % | ||||||||||||
| Bank |
65,420 | 13.5 | 38,925 | 8.0 | 48,656 | 10.0 | ||||||||||||||||||
| Tier 1 capital to risk-weighted assets |
||||||||||||||||||||||||
| Consolidated |
61,246 | 12.6 | 29,202 | 6.0 | 38,936 | 8.0 | ||||||||||||||||||
| Bank |
60,121 | 12.4 | 29,194 | 6.0 | 38,925 | 8.0 | ||||||||||||||||||
| Common equity tier 1 capital to risk-weighted assets |
||||||||||||||||||||||||
| Consolidated |
61,246 | 12.6 | 21,901 | 4.5 | 31,635 | 6.5 | ||||||||||||||||||
| Bank |
60,121 | 12.4 | 21,895 | 4.5 | 31,626 | 6.5 | ||||||||||||||||||
| Tier 1 capital to average assets |
||||||||||||||||||||||||
| Consolidated |
61,246 | 9.3 | 26,330 | 4.0 | 32,913 | 5.0 | ||||||||||||||||||
| Bank |
60,121 | 9.1 | 26,325 | 4.0 | 32,906 | 5.0 | ||||||||||||||||||
2017 Report to Shareholders | CSB Bancorp, Inc.
51
NOTES TO CONSOLIDATED FINANCIAL STATEMENTS
NOTE 12 – REGULATORY MATTERS (CONTINUED)
The Company’s primary source of funds with which to pay dividends are dividends received from the Bank. The payment of dividends by the Bank to the Company is subject to restrictions by its regulatory agencies. These restrictions generally limit dividends to current year net income and prior two-years’ net retained earnings. Also, dividends may not reduce capital levels below the minimum regulatory requirements disclosed in the prior table. Under these provisions, at January 1, 2018, the Bank could dividend $9.3 million to the Company. The Company does not anticipate the financial need to obtain regulatory approval to pay dividends. Federal law prevents the Company from borrowing from the Bank unless loans are secured by specific obligations. Further, such secured loans are limited to an amount not exceeding ten percent of the Bank’s common stock and capital surplus.
NOTE 13 – CONDENSED PARENT COMPANY FINANCIAL INFORMATION
A summary of condensed financial information of the parent company as of December 31, 2017 and 2016, and for each of the three years in the period ended December 31, 2017 follows:
| (Dollars in thousands) | 2017 | 2016 | ||||||||||||||||||||||||||
|
|
||||||||||||||||||||||||||||
| CONDENSED BALANCE SHEETS |
||||||||||||||||||||||||||||
| ASSETS |
||||||||||||||||||||||||||||
| Cash deposited with subsidiary bank |
$ | 1,007 | $ | 921 | ||||||||||||||||||||||||
| Investment in subsidiary bank |
69,309 | 64,272 | ||||||||||||||||||||||||||
| Securities available-for-sale |
90 | 80 | ||||||||||||||||||||||||||
| Other assets |
177 | 195 | ||||||||||||||||||||||||||
|
|
|
|
|
|||||||||||||||||||||||||
| TOTAL ASSETS |
$ | 70,583 | $ | 65,468 | ||||||||||||||||||||||||
|
|
|
|
|
|||||||||||||||||||||||||
| LIABILITIES AND SHAREHOLDERS’ EQUITY |
||||||||||||||||||||||||||||
| Total liabilities |
$ | 51 | $ | 53 | ||||||||||||||||||||||||
| Total shareholders’ equity |
70,532 | 65,415 | ||||||||||||||||||||||||||
|
|
|
|
|
|||||||||||||||||||||||||
| TOTAL LIABILITIES AND SHAREHOLDERS’ EQUITY |
$ | 70,583 | $ | 65,468 | ||||||||||||||||||||||||
|
|
|
|
|
|||||||||||||||||||||||||
| (Dollars in thousands) | 2017 | 2016 | 2015 | |||||||||||||||||||||||||
|
|
||||||||||||||||||||||||||||
| CONDENSED STATEMENTS OF COMPREHENSIVE INCOME |
||||||||||||||||||||||||||||
| Interest on securities |
$ | 2 | $ | 2 | $ | 2 | ||||||||||||||||||||||
| Dividends from subsidiary |
2,600 | 2,450 | 2,400 | |||||||||||||||||||||||||
| Securities gains |
– | – | 35 | |||||||||||||||||||||||||
|
|
|
|
|
|
|
|||||||||||||||||||||||
| Total income |
2,602 | 2,452 | 2,437 | |||||||||||||||||||||||||
| Operating expenses |
348 | 384 | 465 | |||||||||||||||||||||||||
| Income before taxes and undistributed equity income of subsidiary |
2,254 | 2,068 | 1,972 | |||||||||||||||||||||||||
| Income tax benefit |
(123 | ) | (131 | ) | (146 | ) | ||||||||||||||||||||||
| Equity earnings in subsidiary, net of dividends |
4,724 | 4,539 | 3,904 | |||||||||||||||||||||||||
|
|
|
|
|
|
|
|||||||||||||||||||||||
| NET INCOME |
$ | 7,101 | $ | 6,738 | $ | 6,022 | ||||||||||||||||||||||
|
|
|
|
|
|
|
|||||||||||||||||||||||
| COMPREHENSIVE INCOME |
$ | 7,421 | $ | 6,281 | $ | 5,887 | ||||||||||||||||||||||
|
|
|
|
|
|
|
|||||||||||||||||||||||
52
2017 Report to Shareholders | CSB Bancorp, Inc.
NOTES TO CONSOLIDATED FINANCIAL STATEMENTS
NOTE 13 – CONDENSED PARENT COMPANY FINANCIAL INFORMATION (CONTINUED)
| (Dollars in thousands) | 2017 | 2016 | 2015 | |||||||||||||
|
|
||||||||||||||||
|
CONDENSED STATEMENTS OF CASH FLOWS |
||||||||||||||||
| Cash flows from operating activities: |
||||||||||||||||
| Net income |
$ | 7,101 | $ | 6,738 | $ | 6,022 | ||||||||||
| Adjustments to reconcile net income to cash provided by operations: |
||||||||||||||||
| Equity earnings in subsidiary, net of dividends |
(4,724 | ) | (4,539 | ) | (3,904 | ) | ||||||||||
| Securities gain |
– | – | (35 | ) | ||||||||||||
| Change in other assets, liabilities |
13 | 71 | 2 | |||||||||||||
|
|
|
|
|
|
|
|||||||||||
| Net cash provided by operating activities |
2,390 | 2,270 | 2,085 | |||||||||||||
|
|
|
|
|
|
|
|||||||||||
| Cash flows from investing activities: |
||||||||||||||||
| Proceeds from sale of securities |
– | – | 88 | |||||||||||||
|
|
|
|
|
|
|
|||||||||||
| Net cash provided by investing activities |
– | – | 88 | |||||||||||||
|
|
|
|
|
|
|
|||||||||||
| Cash flows from financing activities: |
||||||||||||||||
| Cash dividends paid |
(2,304 | ) | (2,139 | ) | (2,082 | ) | ||||||||||
|
|
|
|
|
|
|
|||||||||||
| Net cash used in financing activities |
(2,304 | ) | (2,139 | ) | (2,082 | ) | ||||||||||
|
|
|
|
|
|
|
|||||||||||
| Increase in cash |
86 | 131 | 91 | |||||||||||||
| Cash at beginning of year |
921 | 790 | 699 | |||||||||||||
|
|
|
|
|
|
|
|||||||||||
| Cash at end of year |
$ | 1,007 | $ | 921 | $ | 790 | ||||||||||
|
|
|
|
|
|
|
|||||||||||
NOTE 14 – FAIR VALUE MEASUREMENTS
The Company provides disclosures about assets and liabilities carried at fair value. The framework provides a fair value hierarchy that prioritizes the inputs to valuation techniques used to measure fair value. The hierarchy gives the highest priority to unadjusted quoted prices in active markets for identical assets or liabilities and lowest priority to unobservable inputs. The three broad levels of the fair value hierarchy are described below:
| Level I: |
Inputs to the valuation methodology are unadjusted quoted prices for identical assets or liabilities in active markets that the Company has the ability to access. | |
| Level II: |
Inputs to the valuation methodology include quoted prices for similar assets or liabilities in active markets; quoted prices for identical or similar assets or liabilities in inactive markets; inputs other than quoted prices that are observable for the asset or liability; inputs that are derived principally from or corroborated by observable market data by or other means including certified appraisals. If the asset or liability has a specified (contractual) term, the Level II input must be observable for substantially the full term of the asset or liability. | |
| Level III: |
Inputs to the valuation methodology are unobservable and significant to the fair value measurement. |
2017 Report to Shareholders | CSB Bancorp, Inc.
53
NOTES TO CONSOLIDATED FINANCIAL STATEMENTS
NOTE 14 – FAIR VALUE MEASUREMENTS (CONTINUED)
The following table presents the assets reported on the consolidated statements of financial condition at their fair value on a recurring basis as of December 31, 2017 and December 31, 2016, by level within the fair value hierarchy. No liabilities were carried at fair value. As required by the accounting standards, financial assets and liabilities are classified in their entirety based on the lowest level of input that is significant to the fair value measurement. Equity securities and U.S. Treasury Notes are valued at the closing price reported on the active market on which the individual securities are traded. Obligations of U.S. government corporations and agencies, mortgage-backed securities, asset-backed securities, obligations of states, and political subdivisions are valued at observable market data for similar assets.
| (Dollars in thousands) | Level I | Level II | Level III | Total | ||||||||||||||||
|
|
||||||||||||||||||||
| Assets: | December 31, 2017 |
|||||||||||||||||||
| Securities available-for-sale |
||||||||||||||||||||
| U.S. Treasury security |
$ | 998 | $ | – | $ | – | $ | 998 | ||||||||||||
| U.S. Government agencies |
– | 8,229 | – | 8,229 | ||||||||||||||||
| Mortgage-backed securities of government agencies |
– | 49,701 | – | 49,701 | ||||||||||||||||
| Asset-backed securities of government agencies |
– | 1,169 | – | 1,169 | ||||||||||||||||
| State and political subdivisions |
– | 27,141 | – | 27,141 | ||||||||||||||||
| Corporate bonds |
– | 10,425 | – | 10,425 | ||||||||||||||||
|
|
|
|
|
|
|
|
|
|||||||||||||
| Total debt securities |
998 | 96,665 | – | 97,663 | ||||||||||||||||
| Equity securities |
89 | – | – | 89 | ||||||||||||||||
|
|
|
|
|
|
|
|
|
|||||||||||||
| Total available-for-sale securities |
$ | 1,087 | $ | 96,665 | $ | – | $ | 97,752 | ||||||||||||
|
|
|
|
|
|
|
|
|
|||||||||||||
| Assets: | December 31, 2016 |
|||||||||||||||||||
| Securities available-for-sale |
||||||||||||||||||||
| U.S. Treasury security |
$ | 1,001 | $ | – | $ | – | $ | 1,001 | ||||||||||||
| U.S. Government agencies |
– | 6,402 | – | 6,402 | ||||||||||||||||
| Mortgage-backed securities of government agencies |
– | 55,837 | – | 55,837 | ||||||||||||||||
| Other mortgage-backed securities |
– | 65 | – | 65 | ||||||||||||||||
| Asset-backed securities of government agencies |
– | 1,266 | – | 1,266 | ||||||||||||||||
| State and political subdivisions |
– | 29,708 | – | 29,708 | ||||||||||||||||
| Corporate bonds |
– | 9,516 | – | 9,516 | ||||||||||||||||
|
|
|
|
|
|
|
|
|
|||||||||||||
| Total debt securities |
1,001 | 102,794 | – | 103,795 | ||||||||||||||||
| Equity securities |
80 | – | – | 80 | ||||||||||||||||
|
|
|
|
|
|
|
|
|
|||||||||||||
| Total available-for-sale securities |
$ | 1,081 | $ | 102,794 | $ | – | $ | 103,875 | ||||||||||||
|
|
|
|
|
|
|
|
|
|||||||||||||
54
2017 Report to Shareholders | CSB Bancorp, Inc.
NOTES TO CONSOLIDATED FINANCIAL STATEMENTS
NOTE 14 – FAIR VALUE MEASUREMENTS (CONTINUED)
The following table presents the assets measured on a nonrecurring basis on the consolidated balance sheets at their fair value as of December 31, 2017 and December 31, 2016, by level within the fair value hierarchy. Impaired loans that are collateral dependent are written down to fair value through the establishment of specific reserves. Techniques used to value the collateral securing the impaired loans include: quoted market prices for identical assets classified as Level I inputs; observable inputs, employed by certified appraisers, for similar assets classified as Level II inputs. In cases where valuation techniques included inputs that are unobservable and are based on estimates and assumptions developed by management based on the best information available under each circumstance, the asset valuation is classified as Level III inputs.
| (Dollars in thousands) | Level I | Level II | Level III | Total | ||||||||||||
| Assets measured on a nonrecurring basis | December 31, 2017 |
|||||||||||||||
| Impaired loans |
$ | – | $ | – | $ | 2,073 | $ | 2,073 | ||||||||
| Assets measured on a nonrecurring basis | December 31, 2016 |
|||||||||||||||
| Impaired loans |
$ | – | $ | – | $ | 3,118 | $ | 3,118 | ||||||||
The following table presents additional quantitative information about assets measured at fair value on a nonrecurring basis and for which the Company has utilized Level III inputs to determine fair value:
Quantitative Information about Level III Fair Value Measurements
| (Dollars in thousands) | Fair Value Estimate |
Valuation Techniques |
Unobservable Input |
Range (Weighted Average) |
||||||||||
|
|
||||||||||||||
| December 31, 2017 |
||||||||||||||
| Impaired loans |
$ | 551 | |
Discounted cash flow |
|
Remaining term Discount rate | |
4 mos to 24.5 yrs / (20.3 mos 4.4% to 7.5% / (5.3 |
) %) | |||||
| 1,522 | |
Appraisal of collateral1 |
|
Appraisal adjustments2 Liquidation expense2 |
|
0% to –25% (–6.8 –10 |
%) % | |||||||
| December 31, 2016 |
||||||||||||||
| Impaired loans |
$ | 3,033 | |
Discounted cash flow |
|
Remaining term Discount rate | |
6 mos to 25.5 yrs / (16.7 mos 3.6% to 7.5% / (5.2 |
) %) | |||||
| 85 | |
Appraisal of collateral1 |
|
Appraisal adjustments2 Liquidation expense2 |
|
0% to –0% (–36 –10 |
%) % | |||||||
| 1 Fair value is generally determined through independent appraisals of the underlying collateral, which generally include various inputs which are not identifiable. | ||
| 2 Appraisals may be adjusted by management for qualitative factors such as estimated liquidation expenses. The range of liquidation expenses and other appraisal adjustments are presented as a percent of the appraisal. | ||
2017 Report to Shareholders | CSB Bancorp, Inc.
55
NOTES TO CONSOLIDATED FINANCIAL STATEMENTS
NOTE 15 – FAIR VALUES OF FINANCIAL INSTRUMENTS
The estimated fair values of recognized financial instruments as of December 31 were as follows:
| 2017 | ||||||||||||||||||||
| (Dollars in thousands) | Carrying Value |
Level I | Level II | Level III | Total Fair Value |
|||||||||||||||
| Financial assets |
||||||||||||||||||||
| Cash and cash equivalents |
$ | 36,420 | $ | 36,420 | $ | – | $ | – | $ | 36,420 | ||||||||||
| Securities available-for-sale |
97,752 | 1,087 | 96,665 | – | 97,752 | |||||||||||||||
| Securities held-to-maturity |
25,758 | – | 25,491 | – | 25,491 | |||||||||||||||
| Restricted stock |
4,614 | N/A | N/A | N/A | N/A | |||||||||||||||
| Loans held for sale |
246 | 246 | – | – | 246 | |||||||||||||||
| Net loans |
511,226 | – | – | 513,106 | 513,106 | |||||||||||||||
| Bank-owned life insurance |
13,218 | 13,218 | – | – | 13,218 | |||||||||||||||
| Accrued interest receivable |
1,545 | 1,545 | – | – | 1,545 | |||||||||||||||
| Mortgage servicing rights |
270 | – | – | 270 | 270 | |||||||||||||||
| Financial liabilities |
||||||||||||||||||||
| Deposits |
$ | 583,259 | $ | 473,467 | $ | – | $ | 110,224 | $ | 583,691 | ||||||||||
| Short-term borrowings |
39,480 | 39,480 | – | – | 39,480 | |||||||||||||||
| Other borrowings |
11,409 | – | – | 10,365 | 10,365 | |||||||||||||||
| Accrued interest payable |
90 | 90 | – | – | 90 | |||||||||||||||
| 2016 | ||||||||||||||||||||
| (Dollars in thousands) | Carrying Value |
Level I | Level II | Level III | Total Fair Value |
|||||||||||||||
| Financial assets |
||||||||||||||||||||
| Cash and cash equivalents |
$ | 36,838 | $ | 36,838 | $ | – | $ | – | $ | 36,838 | ||||||||||
| Securities available-for-sale |
103,875 | 1,081 | 102,794 | – | 103,875 | |||||||||||||||
| Securities held-to-maturity |
23,883 | – | 23,444 | – | 23,444 | |||||||||||||||
| Restricted stock |
4,614 | N/A | N/A | N/A | N/A | |||||||||||||||
| Net loans |
470,158 | – | – | 471,815 | 471,815 | |||||||||||||||
| Bank-owned life insurance |
10,361 | 10,361 | – | – | 10,361 | |||||||||||||||
| Accrued interest receivable |
1,409 | 1,409 | – | – | 1,409 | |||||||||||||||
| Mortgage servicing rights |
261 | – | – | 261 | 261 | |||||||||||||||
| Financial liabilities |
||||||||||||||||||||
| Deposits |
$ | 540,785 | $ | 428,676 | $ | – | $ | 112,642 | $ | 541,318 | ||||||||||
| Short-term borrowings |
48,742 | 48,742 | – | – | 48,742 | |||||||||||||||
| Other borrowings |
12,385 | – | – | 12,511 | 12,511 | |||||||||||||||
| Accrued interest payable |
76 | 76 | – | – | 76 | |||||||||||||||
56
2017 Report to Shareholders | CSB Bancorp, Inc.
NOTES TO CONSOLIDATED FINANCIAL STATEMENTS
NOTE 15 – FAIR VALUES OF FINANCIAL INSTRUMENTS (CONTINUED)
For purposes of the above disclosures of estimated fair value, the following assumptions are used:
Cash and cash equivalents; Loans held for sale; Accrued interest receivable; Mortgage servicing rights; Short-term borrowings, and Accrued interest payable
The fair value of the above instruments is considered to be carrying value.
Securities
The fair value of securities available-for-sale and securities held-to-maturity, which are measured on a recurring basis, are determined primarily by obtaining quoted prices on nationally recognized securities exchanges or matrix pricing, which is a mathematical technique used widely in the industry to value debt securities without relying exclusively on quoted prices for the specific securities but rather by relying on securities’ relationship to other similar securities. Classified as Level I or Level II in the fair value hierarchy.
Net loans
The fair value for loans is estimated by discounting future cash flows using current market inputs at which loans with similar terms and qualities would be made to borrowers of similar credit quality. Where quoted market prices were available, primarily for certain residential mortgage loans, such market rates were utilized as estimates for fair value. Fair value of non-accrual loans is based on carrying value, classified as Level III.
Bank-owned life insurance
The carrying amount of bank-owned life insurance is based on the cash surrender value of the policies and is a reasonable estimate of fair value, classified as Level I.
Restricted stock
Restricted stock includes FHLB Stock and Federal Reserve Bank Stock. It is not practicable to determine the fair value of regulatory equity securities due to restrictions placed on their transferability.
Deposits
The fair value of certificates of deposit is based on the discounted value of contractual cash flows. The discount rates are estimated using market rates currently offered for similar instruments with similar remaining maturities, resulting in a Level III classification. Demand, savings, and money market deposit accounts are valued at the amount payable on demand as of quarter end, resulting in a Level I classification.
Other borrowings
The fair value of FHLB advances are estimated using a discounted cash flow analysis based on the current borrowing rates for similar types of borrowings, resulting in a Level III classification.
The Company also had unrecognized financial instruments at December 31, 2017 and 2016. These financial instruments relate to commitments to extend credit and letters of credit. The aggregate contract amount of such financial instruments was approximately $178.2 million at December 31, 2017, and $163.7 million at December 31, 2016. Such amounts are also considered to be the estimated fair values.
The fair value estimates of financial instruments are made at a specific point in time based on relevant market information. These estimates do not reflect any premium or discount that could result from offering for sale at one time the entire holdings of a particular financial instrument over the value of anticipated future business and the value of assets and liabilities that are not considered financial instruments. Since no ready market exists for a significant portion of the financial instruments, fair value estimates are largely based on judgments after considering such factors as future expected credit losses, current economic conditions, risk characteristics of various financial instruments, and other factors. These estimates are subjective in nature, involve uncertainties and matters of significant judgment and therefore, cannot be determined with precision. Changes in assumptions could significantly affect these estimates.
2017 Report to Shareholders | CSB Bancorp, Inc.
57
NOTES TO CONSOLIDATED FINANCIAL STATEMENTS
NOTE 16 – ACCUMULATED OTHER COMPREHENSIVE INCOME
The following table presents the changes in accumulated other comprehensive (loss) income by component net of tax for the years ended December 31, 2017 and 2016.
| (Dollars in thousands)
|
Pretax
|
Tax Effect
|
After-Tax
|
Affected Line
| |||||||||||||||||||||||||||||||
| Balance as of December 31, 2016 |
$ | (1,323 | ) | $ | 449 | $ | (874 | ) | |||||||||||||||||||||||||||
|
Unrealized holding gain on available-for-sale securities arising during the period |
376 | (128 | ) | 248 | |||||||||||||||||||||||||||||||
|
Amortization of held-to-maturity discount resulting from transfer |
108 | (36 | ) | 72 | |||||||||||||||||||||||||||||||
|
Total other comprehensive income |
484 | (164 | ) | 320 | |||||||||||||||||||||||||||||||
|
|
|
|
|
|
|
||||||||||||||||||||||||||||||
|
Deferred tax reclassification from retained earnings |
– | (109 | ) | (109 | ) | (b) | |||||||||||||||||||||||||||||
|
|
|
|
|
|
|
||||||||||||||||||||||||||||||
|
Total other comprehensive income (loss) after reclassification |
484 | (273 | ) | 211 | |||||||||||||||||||||||||||||||
|
|
|
|
|
|
|
||||||||||||||||||||||||||||||
| BALANCE AS OF DECEMBER 31, 2017 |
$ | (839 | ) | $ | 176 | $ | (663 | ) | |||||||||||||||||||||||||||
|
|
|
|
|
|
|
||||||||||||||||||||||||||||||
| Balance as of December 31, 2015 |
$ | (631 | ) | $ | 214 | $ | (417 | ) | |||||||||||||||||||||||||||
|
Unrealized holding gain on available-for-sale securities arising during the period |
(1,221 | ) | 415 | (806 | ) | ||||||||||||||||||||||||||||||
|
Amount reclassified for net gains included in net income |
(1 | ) | – | (1 | ) | (a) | |||||||||||||||||||||||||||||
|
|
|
|
|
|
|
||||||||||||||||||||||||||||||
|
Amortization of held-to-maturity discount resulting from transfer |
530 | (180 | ) | 350 | |||||||||||||||||||||||||||||||
|
|
|
|
|
|
|
||||||||||||||||||||||||||||||
|
Total other comprehensive income (loss) |
(692 | ) | 235 | (457 | ) | ||||||||||||||||||||||||||||||
|
|
|
|
|
|
|
||||||||||||||||||||||||||||||
| BALANCE AS OF DECEMBER 31, 2016 |
$ | (1,323 | ) | $ | 449 | $ | (874 | ) | |||||||||||||||||||||||||||
|
|
|
|
|
|
|
||||||||||||||||||||||||||||||
| Balance as of December 31, 2014 |
$ | (427 | ) | $ | 145 | $ | (282 | ) | |||||||||||||||||||||||||||
|
Unrealized holding gain on available-for-sale securities arising during the period |
(551 | ) | 187 | (364 | ) | ||||||||||||||||||||||||||||||
|
Amount reclassified for net gains included in net income |
(56 | ) | 19 | (37 | ) | (a) (b) | |||||||||||||||||||||||||||||
|
|
|
|
|
|
|
||||||||||||||||||||||||||||||
|
Amortization of held-to-maturity discount resulting from transfer |
403 | (137 | ) | 266 | |||||||||||||||||||||||||||||||
|
|
|
|
|
|
|
||||||||||||||||||||||||||||||
|
Total other comprehensive income (loss) |
(204 | ) | 69 | (135 | ) | ||||||||||||||||||||||||||||||
|
|
|
|
|
|
|
||||||||||||||||||||||||||||||
| BALANCE AS OF DECEMBER 31, 2015 |
$ | (631 | ) | $ | 214 | $ | (417 | ) | |||||||||||||||||||||||||||
|
|
|
|
|
|
|
||||||||||||||||||||||||||||||
(a) Securities gain.
(b) Federal income tax provision.
58
2017 Report to Shareholders | CSB Bancorp, Inc.
NOTES TO CONSOLIDATED FINANCIAL STATEMENTS
NOTE 17 – CONTINGENT LIABILITIES
In the normal course of business, the Company is subject to pending and threatened legal actions. Although, the Company is not able to predict the outcome of such actions, after reviewing pending and threatened actions, management believes that the outcome of any or all such actions will not have a material adverse effect on the results of operations or shareholders’ equity of the Company.
The Company has an employment agreement with an officer. Upon the occurrence of certain types of termination of employment, the Company may be required to make specified severance payments if termination occurs within a specified period of time, generally two years from the date of the agreement, or pursuant to certain change in control transactions.
NOTE 18 – QUARTERLY FINANCIAL DATA (UNAUDITED)
The following is a summary of selected quarterly financial data (unaudited) for the years ended December 31:
| (Dollars in thousands, except per share data)
|
Interest Income
|
Net Interest Income
|
Net Income
|
Basic Earnings Per Share
|
Diluted Earnings Per Share
|
|||||||||||||||
| 2017 |
||||||||||||||||||||
|
First quarter |
$ 6,247 | $ 5,862 | $ 1,730 | $ 0.63 | $ 0.63 | |||||||||||||||
|
Second quarter |
6,413 | 5,950 | 1,726 | 0.63 | 0.63 | |||||||||||||||
|
Third quarter |
6,766 | 6,204 | 1,866 | 0.68 | 0.68 | |||||||||||||||
|
Fourth quarter |
7,014 | 6,436 | 1,779 | 0.65 | 0.65 | |||||||||||||||
| 2016 |
||||||||||||||||||||
|
First quarter |
$ 5,661 | $ 5,285 | $ 1,480 | $ 0.54 | $ 0.54 | |||||||||||||||
|
Second quarter |
5,813 | 5,446 | 1,611 | 0.59 | 0.59 | |||||||||||||||
|
Third quarter |
5,863 | 5,497 | 1,694 | 0.61 | 0.61 | |||||||||||||||
|
Fourth quarter |
6,295 | 5,931 | 1,953 | 0.72 | 0.72 | |||||||||||||||
| 2015 |
||||||||||||||||||||
|
First quarter |
$ 5,407 | $ 5,014 | $ 1,342 | $ 0.49 | $ 0.49 | |||||||||||||||
|
Second quarter |
5,568 | 5,175 | 1,517 | 0.55 | 0.55 | |||||||||||||||
|
Third quarter |
5,463 | 5,068 | 1,556 | 0.57 | 0.57 | |||||||||||||||
|
Fourth quarter |
5,559 | 5,173 | 1,607 | 0.59 | 0.59 | |||||||||||||||
2017 Report to Shareholders | CSB Bancorp, Inc.
59
| OFFICERS OF THE COMMERCIAL & SAVINGS BANK
| ||||||
| JEFF M. AGNES Officer, Systems Administrator
PAMELA S. BASINGER Vice President, Financial Officer
DEBORAH S. BERNER Vice President, Retail Services Manager
LES A. BERTSCHY Officer, Banking Center Manager
PAMELA L. BROMUND Assistant Vice President, Loan Operations Supervisor
WENDY D. BROWN Assistant Vice President, Project Manager
C. DAWN BUTLER Vice President, Regional Bank Manager
BEVERLY A. CARR Officer, Bank Operations Manager
COLBY CHAMBERLIN Vice President, Commercial Banker
PEGGY L. CONN Corporate Secretary
JENNIFER L. DEAM Officer, Electronic Services Manager
CHRISTOPHER J. DELATORE Vice President, Commercial Banker
DAVID J. DOLAN Vice President, Retail Lending Manager
|
JASON A. GASKELL Assistant Vice President, Commercial Banker
CARRIE A. GERBER Credit Officer
ERIC S. GERBER Vice President, Commercial Banker
AMI K. HAMMOND Assistant Vice President, Banking Center Manager
MARC R. HARVEY Vice President, Organizational Development
JACKIE S. HAZEL Vice President, Trust Operations
BENJAMIN J. HERSHBERGER Assistant Vice President, Banking Center Manager
MARIE HULL-GREEN Vice President, Trust Officer
RANDALL S. JANSON Assistant Vice President, Banking Center Manager
JULIE A. JONES Vice President, Director Of Human Resources
STEPHEN G. KARAPASHA Compliance Officer
STEPHEN K. KILPATRICK First Vice President, Senior Credit Officer
GINA K. MARSHALL Officer, Customer Service Center Manager
|
ANDREA R. MILEY Senior Vice President, Senior Risk Officer
A. LEE MILLER Vice President, Cash Management & Special Projects, CRA Officer
EDWARD J. MILLER Vice President, Operation Services Manager, Security
MOLLY M. MOHR Assistant Vice President, Banking Center Manager
DANIEL L. MUSE Operations Officer
JASON O. MYERS Vice President, Trust Officer
TODD R. NICOLAS Vice President, Commercial Banker
SHAWN E. OSWALD Vice President, Information Technology Director, OFAC Officer
AMY R. PATTERSON Assistant Vice President, Mortgage & Consumer Loan Services Manager
MELANIE S. RABER Officer, Commercial Loan Documentation Supervisor
KATHY M. RINGWALT Officer, Mortgage Underwriter
LISA M. SCHONAUER Assistant Vice President, Banking Center Manager |
CHERYL J. STEINER Assistant Vice President, Investment Representative
EDDIE L. STEINER Chairman, President,
STEVEN J. STIFFLER Vice President, Commercial Banker
ERIC D. STROUSE Vice President, Commercial Banker
ELAINE A. TEDROW Assistant Vice President, Banking Center Manager
WILLIAM R. TINLIN Vice President, Recovery, Right To Financial Privacy Officer
JEANETTE TROYER Assistant Vice President, Banking Center Manager
ASHLEY E. VAUGHN Assistant Vice President, Banking Center Manager
ALICIA R. WALLACE Vice President, Commercial Banker
ALYSSA A. WALLER Assistant Vice President, Marketing Manager
MICHAEL D. WORKMAN Vice President, Mortgage Loan Officer, Small Business Lender
CRYSTAL R. YODER Operations Officer | |||
| CYNTHIA A. FERRY Assistant Vice President, Banking Center Manager
LORI S. FRANTZ Assistant Vice President, Banking Center Manager
BRETT A. GALLION Senior Vice President, Senior Operations Officer, Senior Information Officer |
BROC A. MARTIN Officer, BSA & AML, Compliance Officer
KEVIN J. MCALLISTER Vice President, Lead Trust Officer
ROBYN E. MCCLINTOCK Vice President, Regional Bank Manager
PAULA J. MEILER Senior Vice President, Chief Financial Officer |
REBECCA J. SHULTZ Assistant Vice President, Loan Officer
A. CLAY SINNETT Assistant Vice President, Commercial Banker
BUD STEBBINS Senior Vice President, Senior Loan Officer |
60
2017 Report to Shareholders | CSB Bancorp, Inc.
SHAREHOLDERS AND GENERAL INQUIRIES
| CORPORATE OFFICE |
||
| 91 North Clay Street, Millersburg, Ohio |
330.674.9015 or 800.654.9015 |
If you have questions regarding your CSB Bancorp, Inc. stock, please contact:
COMPUTERSHARE
Shareholder Services
462 South Fourth Street, Suite 1600
Louisville, Kentucky 40202
800.368.5948
www.computershare.com/investor
PEGGY L. CONN
Corporate Secretary
CSB Bancorp, Inc.
91 North Clay Street
Millersburg, Ohio 44654
330.674.9015
800.654.9015
LEGAL COUNSEL
Vorys, Sater, Seymour and Pease LLP
52 East Gay Street
P.O. Box 1008
Columbus, Ohio 43216
If you are interested in purchasing shares of CSB Bancorp, Inc., you may contact your local broker or one of the following:
CHERYL J. STEINER
Assistant Vice President,
Investment Adviser Representative
330.674.2397
Direct 330.763.2853
cheryl.steiner@ceterais.com
SWENEY CARTWRIGHT & CO.
17 South High Street, Suite 300
Columbus, Ohio 43215
800.334.7481
CSB Bancorp, Inc. is required to file an annual report on Form 10-K annually with the Securities and Exchange Commission. A copy of our Annual Report on Form 10-K is available on our website after it is filed with the SEC. Copies of the Form 10-K Annual Report and the Company’s quarterly reports will be furnished, free of charge, to shareholders by written request to:
PAULA J. MEILER
Chief Financial Officer
CSB Bancorp, Inc.
91 North Clay Street
Millersburg, Ohio 44654
330.674.9015
800.654.9015

2017 Report to Shareholders | CSB Bancorp, Inc.
61

UPCOMING RETIREMENT
|
|
HONORING RONALD HOLTMAN 17 YEARS OF DEDICATED SERVICE Ronald E. Holtman will retire from the Board of Directors of CSB Bancorp, Inc., effective at our April 25, 2018 shareholders’ meeting. Ron joined the Board in 2001 and has been instrumental in the continued growth and success of our Company. His leadership within the Board has included capably chairing Audit Committee, Trust Committee, ALCO (asset/liability management), and Nominating Committee, all for multiple years. We thank and honor Ron for his dedication and years of capable service to CSB Bancorp, Inc., and wish him the very best as he and his wife Prue continue on their journey. |

BOARD OF DIRECTORS


|
|
On Monday, December 11, we opened our doors to a brand new, full-service banking center at 119 West High Street in Orrville. This center offers all the services customers expect including day-to-day banking center transactions, home lending, personal loans, business loans, and additionally trust and brokerage services by appointment. Conveniently located in the heart of downtown Orrville, this new location offers a new banking experience with a modern layout that is optimized for smooth and efficient interactions. |


2017 MILESTONES ORRVILLE BRANCH OPENING BEST WORKPLACE FOR TOP TALENT IN NORTHEAST OHIO The Commercial & Savings Bank is proud to be recognized by ERC as one of Northeast Ohio’s 99 best places for top talent to work! This is the first year CSB has won this award. NorthCoast 99 recognizes great places to work for top performing people that drive results, provide competitive advantages, and allow businesses to innovate and grow. Applicants are evaluated based on policies and practices related to the attraction and retention of top performers, as well as data collected from employee surveys. North Coast 99 winner
BANKING CENTER INFORMATION
CSB CORPORATE HEADQUARTERS
91 North Clay Street, P.O. Box 232, Millersburg, OH 44654
| BANKING CENTERS: |

| |||
| 1.800.654.9015 |
HOLMES COUNTY
MILLERSBURG SOUTH CLAY
91 South Clay Street, P.O. Box 232, Millersburg, OH 44654
MILLERSBURG CLINTON COMMONS 2102 Glen Drive, Millersburg, OH 44654
BERLIN 4587 State Route 39, P.O. Box 420, Berlin, OH 44610
CHARM 4440 County Road 70, P.O. Box 136, Charm, OH 44617
WALNUT CREEK 4980 Olde Pump Street, P.O. Box 146, Walnut Creek, OH 44687
WINESBURG 225 U.S. Route 62, P.O. Box 51, Winesburg, OH 44690
TUSCARAWAS COUNTY
SUGARCREEK 127 South Broadway, P.O. Box 369, Sugarcreek, OH 44681
NEW PHILADELPHIA 635 West High Avenue, New Philadelphia, OH 44663
GNADENHUTTEN 100 South Walnut Street, P.O. Box 830, Gnadenhutten, OH 44629
WAYNE COUNTY
ORRVILLE 119 West High Street, P.O. Box 635, Orrville, OH 44667
SHREVE 333 West South Street, P.O. Box 551, Shreve, OH 44676
WOOSTER DOWNTOWN 405 East Liberty Street, Wooster, OH 44691
WOOSTER MILLTOWN 3562 Commerce Parkway, Wooster, OH 44691
STARK COUNTY
NORTH CANTON 1210 North Main Street, North Canton, OH 44720
CASH MANAGEMENT, CSB BANCORP, INC.
& ADMINISTRATION LOCATION
91 North Clay Street, P.O. Box 232, Millersburg, OH 44654

TRUST & WEALTH MANAGEMENT LOCATIONS
91 North Clay Street, P.O. Box 232, Millersburg, OH 44654
3562 Commerce Parkway, Wooster, OH 44691
1210 North Main Street, North Canton, OH 44720
CSB INVESTMENT SERVICES
91 South Clay Street, Millersburg, OH 44654
Not FDIC Insured No Bank Guarantee May Lose Value

CSB BANCORP INC /OH Reports
- 03/26/2010 - 10-K
- 03/23/2015 - 10-K
- 03/24/2016 - 10-K
- 03/23/2017 - 10-K
- 03/16/2018 - 10-K
- 11/13/2009 - 10-Q
- 05/14/2010 - 10-Q
- 08/13/2010 - 10-Q
- 11/12/2010 - 10-Q
- 05/13/2011 - 10-Q
- 08/12/2011 - 10-Q
- 05/14/2012 - 10-Q
- 08/13/2014 - 10-Q
- 11/13/2014 - 10-Q
- 05/14/2015 - 10-Q
- 08/13/2015 - 10-Q
- 11/13/2015 - 10-Q
- 05/13/2016 - 10-Q
- 08/11/2016 - 10-Q
- 11/10/2016 - 10-Q
- 05/12/2017 - 10-Q
- 08/11/2017 - 10-Q
- 11/09/2017 - 10-Q
- 05/10/2018 - 10-Q
- 08/09/2018 - 10-Q
- 11/09/2018 - 10-Q
- 05/08/2020 - 10-Q
- 08/10/2020 - 10-Q
- 11/09/2020 - 10-Q