Attached files
| file | filename |
|---|---|
| EX-32.2 - BALLANTYNE STRONG, INC. | ex32-2.htm |
| EX-32.1 - BALLANTYNE STRONG, INC. | ex32-1.htm |
| EX-31.2 - BALLANTYNE STRONG, INC. | ex31-2.htm |
| EX-31.1 - BALLANTYNE STRONG, INC. | ex31-1.htm |
| EX-24 - BALLANTYNE STRONG, INC. | ex24.htm |
| EX-23.2 - BALLANTYNE STRONG, INC. | ex23-2.htm |
| EX-23.1 - BALLANTYNE STRONG, INC. | ex23-1.htm |
| EX-10.22 - BALLANTYNE STRONG, INC. | ex10-22.htm |
UNITED STATES
SECURITIES AND EXCHANGE COMMISSION
Washington, D.C. 20549
FORM 10-K
(Mark One)
| [X] | ANNUAL REPORT PURSUANT TO SECTION 13 OR 15(d) OF THE SECURITIES EXCHANGE ACT OF 1934 |
| For the fiscal year ended December 31, 2017 |
| OR |
| [ ] | TRANSITION REPORT PURSUANT TO SECTION 13 OR 15(d) OF THE SECURITIES EXCHANGE ACT OF 1934 |
| For the transition period from to |
| Commission File No. 1-13906 |
Ballantyne Strong, Inc.
(Exact Name of Registrant as Specified in Its Charter)
| Delaware | 47-0587703 | |
(State or other jurisdiction of incorporation or organization) |
(I.R.S. Employer Identification No.) | |
11422 Miracle Hills Drive, Suite 300 Omaha, Nebraska |
68154 | |
| (Address of principal executive offices) | (Zip Code) |
Registrant’s telephone number, including area code: (402) 453-4444
Securities registered pursuant to Section 12(b) of the Act:
| Title of each class | Name of exchange on which registered | |
| Common Stock, $0.01 par value | NYSE American |
Securities registered pursuant to Section 12(g) of the Act: None
Indicate by check mark if the registrant is a well-known seasoned issuer, as defined in Rule 405 of the Securities Act. Yes [ ] No [X]
Indicate by check mark if the registrant is not required to file reports filed pursuant to Section 13 or Section 15(d) of the Act. Yes [ ] No [X]
Indicate by check mark whether registrant: (1) has filed all reports required to be filed by Section 13 or 15(d) of the Securities Exchange Act of 1934 during the preceding 12 months (or for such shorter period that the registrant was required to file such reports), and (2) has been subject to such filing requirements for the past 90 days. Yes [X] No [ ]
Indicate by checkmark whether the registrant has submitted electronically and posted on its corporate Web site, if any, every Interactive Data File required to be submitted and posted pursuant to Rule 405 of Regulation S-T (§232.405 of this chapter) during the preceding 12 months (or for such shorter period that the registrant was required to submit and post such files). Yes [X] No [ ]
Indicate by check mark if disclosure of delinquent filers pursuant to Item 405 of Regulation S-K (§229.405 of this chapter) is not contained herein, and will not be contained, to the best of registrant’s knowledge, in definitive proxy or information statements incorporated by reference in Part III of this Form 10-K or any amendment to this Form 10-K. [X]
Indicate by check mark whether the registrant is a large accelerated filer, an accelerated filer, a non-accelerated filer, a smaller reporting company, or an emerging growth company. See the definitions of “large accelerated filer,” “accelerated filer,” “smaller reporting company,” and “emerging growth company” in Rule 12b-2 of the Exchange Act.
| Large accelerated filer [ ] | Accelerated filer [X] | Non-accelerated filer [ ] (Do not check if a smaller reporting company) |
Smaller reporting company [ ]
Emerging growth company [ ] |
If an emerging growth company, indicate by check mark if the registrant has elected not to use the extended transition period for complying with any new or revised financial accounting standards provided pursuant to Section 13(a) of the Exchange Act [ ]
Indicate by check mark whether the registrant is a shell company (as defined in Rule 12b-2 of the Exchange Act) Yes [ ] No [X]
The aggregate market value of the Company’s voting common stock held by non-affiliates, based upon the closing price of the stock on the NYSE American on June 30, 2017 was $63,729,857. The Company does not have any non-voting common equity. As of March 2, 2018, 14,422,090 shares of common stock of Ballantyne Strong, Inc., were outstanding.
DOCUMENTS INCORPORATED BY REFERENCE
Portions of the Company’s Proxy Statement for its 2018 Annual Meeting of Stockholders are incorporated by reference in Part III, Items 10, 11, 12, 13 and 14.
TABLE OF CONTENTS
| 2 |
FORWARD-LOOKING STATEMENTS
This Annual Report on Form 10-K contains not only historical information, but also forward-looking statements within the meaning of Section 27A of the Securities Act of 1933, as amended, and Section 21E of the Securities Exchange Act of 1934, as amended. In addition, forward-looking statements may be made in press releases, orally, at conferences, on the Company’s web site, or otherwise, by or on behalf of the Company. Statements that are not historical are forward-looking and reflect expectations for future Company performance. These statements often use words such as “anticipates,” “targets,” “expects,” “hopes,” “estimates,” “intends,” “plans,” “goal,” “believes,” “continue” and other similar expressions or future or conditional verbs such as “will,” “may,” “might,” “should,” “would” and “could.” These statements involve certain known and unknown risks, uncertainties and assumptions that are difficult to predict and are often beyond the Company’s control. For these statements, the Company claims the protection of the safe harbor for forward-looking statements contained in the Private Securities Litigation Reform Act of 1995.
You should not place undue reliance on any forward-looking statement and should consider the following uncertainties and risks, as well as the risks and uncertainties more fully discussed elsewhere in this report, including under Item 1A. Risk Factors of this Annual Report on Form 10-K and in any of the Company’s subsequent Securities and Exchange Commission filings for further information about factors that could affect such forward-looking statements: the Company’s ability to expand its revenue streams, potential interruptions of supplier relationships or higher prices charged by suppliers, the Company’s ability to successfully compete and introduce enhancements and new features that achieve market acceptance and that keep pace with technological developments, the Company’s ability to successfully execute its capital allocation strategy, the Company’s ability to retain or replace its significant customers, the impact of a challenging global economic environment or a downturn in the markets, economic and political risks of selling products in foreign countries, risks of non-compliance with U.S. and foreign laws and regulations, cybersecurity risks and risks of damage and interruptions of information technology systems, the Company’s ability to retain key members of management and successfully integrate new executives, the Company’s ability to complete acquisitions, strategic investments, entry into new lines of business, divestitures, mergers or other transactions on acceptable terms or at all, the Company’s ability to assert its intellectual property rights, the impact of natural disasters and other catastrophic events, the adequacy of insurance and the impact of having a controlling stockholder.
Given the risks and uncertainties, readers should not place undue reliance on any forward-looking statements and should recognize that the statements are predictions of future results which may not occur as anticipated. Actual results could differ materially from those anticipated in the forward-looking statements and from historical results, due to the risks and uncertainties described herein, as well as others not now anticipated. New risk factors emerge from time to time and it is not possible for management to predict all such risk factors, nor can it assess the impact of all such factors on our business or the extent to which any factor, or combination of factors, may cause actual results to differ materially from those contained in the forward-looking statements. Except as required by law, the Company assumes no obligation to update forward-looking statements to reflect actual results or changes in factors or assumptions affecting such forward-looking statements.
General Description of Business
Ballantyne Strong, Inc. (“Ballantyne” or the “Company”), a Delaware corporation, is a holding company with diverse business activities focused on serving the cinema, retail, financial, advertising and government markets. The Company and its wholly owned subsidiaries Strong Technical Services, Inc., Strong/MDI Screen Systems, Inc., Convergent Media Systems Corporation (“Convergent”) and Strong Digital Media, LLC design, integrate, and install technology solutions for a broad range of applications; develop and deliver out-of-home messaging, advertising and communications; manufacture projection screens; and provide managed services including monitoring of networked equipment to our customers. The Company’s wholly-owned subsidiary, StrongVest Global Advisors LLC, serves as advisor to an exchange-traded fund (“ETF”) issued by the StrongVest ETF Trust.
| 3 |
Ballantyne is a Delaware corporation which was founded in 1932 and became a designer and manufacturer of film projectors. For more than 85 years, we have expanded our product lines and services to meet the needs of the ever-changing and technologically-advancing theater exhibition industry. Most recently, we entered the digital media sector through an acquisition which enables us to serve the advertising, education and communication needs of retail, corporate, and government markets. Ballantyne went public in 1995; our shares are traded on the NYSE American market under the symbol “BTN.”
We conduct our operations through two primary business segments: Cinema and Digital Media. During the fourth quarter of 2017, we decided to reorganize our segments to move the operations of Strong Technical Services, Inc. from the Digital Media segment to the Cinema segment. All prior periods have been recast in our segment reporting to reflect the current segment organization.
Strategy
Our Board of Directors has implemented a strategy focused on making optimal capital allocation decisions across all of the Company’s businesses and investments. The Board intends to consider and make investments in the Company’s existing Cinema and Digital Media businesses when attractive opportunities arise. The Board also intends to consider and make investments in other industries that are expected to produce higher returns on invested capital. This may involve investments in public companies or the complete acquisitions of other businesses, which may be within or outside of the Company’s existing markets. We intend our investments in public companies to be made in circumstances where we believe that we will be able to exercise some degree of influence or control.
The Company now holds investments in several public companies. These investments include RELM Wireless Corporation (NYSE American: RWC), a manufacturer of two-way wireless radio communications equipment, 1347 Property Insurance Holdings, Inc. (Nasdaq: PIH), a provider of property and casualty insurance in the States of Louisiana, Texas and Florida, and Itasca Capital Ltd. (TSX Venture: ICL), a holding company that holds a significant position in Limbach Holdings, Inc. (Nasdaq: LMB), a leading commercial provider of HVAC construction and related services. As of December 31, 2017, the Company holds approximately 8.3% of the outstanding stock of RELM Wireless Corporation, approximately 17.4% of the outstanding stock of 1347 Property Insurance Holdings, Inc., and approximately 32.3% of the outstanding stock of Itasca Capital Ltd.
Fundamental Global Investors, LLC, the funds that it manages, its other affiliates, and the directors, officers and employees of the Company and their affiliates together currently hold approximately 41.2% of the Company’s outstanding stock. In some cases, funds managed by Fundamental Global Investors, LLC may acquire positions in the same public companies as the Company. Fundamental Global Investors’ funds currently hold positions in both RELM Wireless Corporation and 1347 Property Insurance Holdings, Inc.
In addition to the Company’s operating businesses and investments in public companies, the Board expects to consider investments and transactions in other areas that it believes are likely to increase returns to shareholders, such as continued stock buybacks and monetizing physical or other assets held by the company.
The Board expects that over time the Company will be further transformed into a holding company with ownership of and investments in diverse businesses.
Operating Segments
Cinema
Overview
We provide a full range of products and services to the theater exhibition industry from the design and installation of new theater exhibition systems and related equipment to maintenance and monitoring of existing systems. The systems include a wide spectrum of premier audio-visual products and accessories such as: digital projectors, state of the art projection screens, servers and library management systems, menu boards, flat panel displays, and sound systems.
| 4 |
We market and sell directly to theater exhibitors, as well as through certain domestic and international Value Added Resellers (“VAR”). Over the course of our 85-year history, we have developed ongoing customer relationships with a large portion of the theater owners in the United States and a number of the major theater owners internationally. Our sales and marketing staff principally develop business by maintaining regular personal contact with our established customer relationships, including conducting site visits. In our sales and marketing efforts, we emphasize our value proposition of providing the broadest range of products and services delivered by one of the industry’s largest technical service teams, which provides a significant resource to our clients in managing the complexities of digital technology in the cinema exhibition industry. Our sales and marketing professionals have extensive experience with the Company’s product lines and have long-term relationships throughout the industry.
Products
Screens — We manufacture multiple standard and large format 2D and 3D screens for cinema and special venue applications through our ISO-certified manufacturing facility in Canada. There are certain digital 3D applications, such as the technology by RealD, that require unique “silver” screens that we manufacture. In addition, we purchased Peintures Elite, Inc. in 2013, the manufacturer of coatings that have been exclusive to our Company in the manufacture of our screens. This relatively small acquisition positioned us to retain the exclusive rights to this coating and to continue producing our unique screens. We are constantly innovating to set new standards within the screen industry, and in 2013 we developed the new Premium HGA screen that diffuses light more evenly over the entire screen surface, thereby reducing the formation of so-called “hot spots.”
Screen Support Systems — Our custom screen support structures are designed and built with quality and safety as a priority. They are easy to assemble, require no scaffolding and each one includes detailed and easy to understand installation instructions. Our mechanical design and engineering team supervises every step of the process, from design to manufacturing, at one location.
Projectors — Through distribution agreements with NEC and Barco, we distribute DLP Cinema projectors in the Americas. Both manufacturers of the projectors use the DLP cinema technology from Texas Instruments. NEC offers DLP Cinema projectors ranging from their NC900 projector for screens up to 31 feet wide to the NC3240S, which is a 4K projector designed for screens up to 105 feet wide. Barco offers DLP Cinema projectors ranging from their DP2K-10SX projector for screens up to 33 wide feet to the DP4K-32B cinema projector, which is an ultra-bright enhanced 4K cinema projector for screens up to 105 feet wide.
Servers — Through a formal distribution agreement with GDC Technology (USA), LLC, we distribute GDC’s line of digital cinema servers in North and South America. We also distribute their servers in certain other areas of the world under less formal arrangements. In addition, we distribute servers for other server manufacturers, including those manufactured by Dolby. Digital servers and the related integrated media block are used by our customers for the storage and delivery of digital movie content.
Audio Systems — We distribute a range of state of the art digital audio systems, including surround and 3D sound technologies from the following manufacturers: Dolby, Barco, USL, JBL and QSC. Our technicians are certified by each manufacturer to install, service and maintain these and other audio systems.
Additional Projection Products — We also distribute certain third-party accessories, which when coupled with the cinema projector, server and integrated media block, can fully outfit and automate a projection booth. The significant accessories include, but are not limited to, library management systems, automation products, pedestals, 3D accessories, lenses and lamps.
Technical Services
Network Operations Center — Our Network Operations Centers (“NOC”), staffed by software engineers and systems techs, operate 24/7/365 and provide technical support to our customers to meet Service Level Agreements (“SLA”). From each location in Alpharetta, GA and Omaha, NE, we are able to monitor our customers’ networked equipment remotely, often providing proactive solutions to systems issues before they cause system failures. Our remote services include systems monitoring and maintenance, software upgrades and system repairs. By utilizing NOC personnel to solve customer issues whenever possible, we eliminate travel time and expenses normally incurred by sending a technician onsite for repairs. Many issues that do not involve parts replacement or physical contact with the hardware can be handled remotely using our remote assistance technologies.
| 5 |
Onsite Service and Maintenance — We provide digital cinema equipment installations and after-sale maintenance services. Our onsite technicians work closely with our NOC staff to resolve systems issues that cannot be fixed remotely; they are certified to install and service a wide array of digital and audio equipment from a number of manufacturers. We offer cabling, wiring, installation and maintenance services for digital equipment on ad hoc, as-needed basis. We also offer long-term contractual service packages for maintenance and repairs to a wide range of installed digital equipment for customers. These long-term contractual service packages provide our Company with recurring revenue.
Markets
We sell our screen systems worldwide, with our primary markets being North America and Asia.
Our non-exclusive distribution agreements with NEC and Barco allow us to market digital projectors in North and South America, including the Caribbean. In China we have distribution rights to sell Barco. We do not have any territorial restrictions for any of our other products and services.
We provide Cinema technical services in the United States. We market and sell our services directly to theater owners and through dealers or VAR networks.
Competition
Screens and Screen Support Systems –While there are numerous screen manufacturing companies, the primary competitor in the worldwide cinema screen market is Harkness Screens. Competitive factors include product performance characteristics, quality, availability and price.
Digital Projection Equipment — The markets for our products in the Cinema segment have been highly competitive. The primary competitive factors are price, product quality, features and customer support. Competition in the digital cinema equipment market includes one other licensed original equipment manufacturer (OEM) of the Texas Instruments’ DLP cinema technology besides our partners NEC and Barco: Christie Digital Systems. We also compete with Sony, which uses its own 4K digital cinema technology.
Technical Services – The competition in the cinema service industry for installation, after-sale maintenance, and NOC services is primarily driven by the two largest cinema service companies: the Company and Christie Digital, although there are other smaller scale providers.
Revenues
The following table summarizes net revenues for the Cinema segment by similar classes of products and services for each of the last three fiscal years (in thousands):
| Years ended December 31, | ||||||||||||
| 2017 | 2016 | 2015 | ||||||||||
| Screen systems sales | $ | 18,915 | $ | 20,207 | $ | 18,833 | ||||||
| Digital equipment sales | 12,996 | 17,734 | 25,119 | |||||||||
| Field maintenance and monitoring services | 12,834 | 12,579 | 11,780 | |||||||||
| Installation services | 1,155 | 460 | 1,550 | |||||||||
| Other | 3,037 | 3,795 | 3,557 | |||||||||
| Total segment revenue | $ | 48,937 | $ | 54,775 | $ | 60,839 | ||||||
| 6 |
Digital Media
Overview
The Company delivers digital signage solutions and services across two primary markets: digital out-of-home and enterprise video. In 2018, we will also begin providing advertising services as described below. These markets are served through the capabilities that we developed from the acquisition of Convergent in 2013. While there is digital signage equipment sold within this segment, the primary focus of this segment is providing solutions and services to our customers.
Solutions
Digital Signage – Our industry-first Digital Signage as a Service gives customers an end-to-end solution that includes hardware, software, content distribution, management, network monitoring and field services, all for a single monthly fee. Our “as-a-service” model lowers up-front customer capital costs, allows customers to scale more easily and allows them to ‘turn on’ or ‘turn-off’ features as needed. It also eliminates the risk of investing in quickly changing technologies, removes complexity and lessens resource burdens typically associated with traditional digital signage systems. We primarily market our solutions to large businesses in North America that do not have the resources, expertise or desire to create, manage and maintain their digital signage system internally. Customers typically require deployment across many locations and utilize digital signage to increase product sales, improve the consumer experience, enhance their brand or engage their audience.
Enterprise Video – We provide video communication services and solutions, including design, integration, monitoring, maintenance and installation for the government and corporate markets. These solutions provide enterprises with the infrastructure necessary to communicate, collaborate, train and educate employees.
Advertising – During the first quarter of 2018, we signed an agreement to provide advertising services on over 3,500 New York City taxicabs. The advertising will be on a combination of vinyl printed signs and digital signs. We have leased 300 digital signs, which we expect to install during the first half of 2018. The remainder of the taxicabs will initially feature print advertising. We expect to convert more taxicabs to digital signs over time.
Products and Services
Digital Signage as a Service (DSaaS) Platform – Our platform leverages internally developed and third-party software to automate the customer’s digital signage workflow, including from content creation, approval, storage and management, network deployment, monitoring, case management and incident resolution. Since it is cloud-based, it provides inherent scalability to enable customers to expand or contract their network. The DSaaS platform supports a wide range of applications – all of which are managed through a single user interface. New features and functionality are frequently added, both through the efforts of our in-house software development team and integration with an ever-growing ecosystem of third-party applications.
Content Creation – We provide creative services to digital signage clients that include media strategy, content design and production. Our creative services team develops custom content to support the branding and marketing initiatives of each client.
Content Management and Distribution – Content management is provided to ensure accurate playback at the right place and at the right time based on a number of factors such as geography, site characteristics, location within a site or consumer demographics. We utilize our DSaaS platform for the management and distribution of content. Content is prepared, scheduled and centrally distributed from our cloud infrastructure.
Network Operations Center – Our NOC in Alpharetta, GA provides similar services to our Digital Media customers as described under Cinema above.
Service and Maintenance — We provide digital signage installations and after-sale maintenance services. Our onsite technicians work closely with our NOC staff to resolve systems issues that cannot be fixed remotely; they are certified to install and service a wide array of digital and audio equipment from a number of manufacturers. We offer cabling, wiring, installation and maintenance services for digital menu boards and other digital equipment on ad hoc, as-needed basis. We also offer long-term contractual service packages for maintenance and repairs to digital signage equipment. These long-term contractual service packages provide our Company with recurring revenue.
| 7 |
Network Connectivity – We offer nationwide internet connectivity to fulfill content distribution and network management functions. We utilize third party providers for traditional terrestrial connectivity, as well as wireless service across North America.
Measurement and Analytics – We offer the tools and resources to measure the impact of digital signage solutions. We develop measurement criteria, establish benchmarks and identify control mechanisms to test the effectiveness of such solutions during proof of concept and full rollout scenarios.
Markets
Digital Out-of-Home – The Digital Out-of-Home (“DOOH”) advertising market is a subset of the overall OOH advertising market that includes in-store digital displays and interactive promotion kiosks. DOOH marketing campaigns consist of a network of digital displays that are centrally managed and target both mobile and captive customers outside the home. We are primarily focused on pursuing DOOH communication opportunities within the retail, banking, entertainment and corporate markets.
Enterprise Video Solutions – The Enterprise Video Solutions (“EVS”) market consists of customers seeking corporate video communications, employee training and system monitoring solutions. We are primarily focused on pursuing EVS opportunities within the government, banking, retail and corporate markets.
Competition
There are many players in the DOOH and EVS markets who have expertise in integration. Some of the key players include Diversified Media Group, Stratacache and Christie Digital.
Revenues
The following table summarizes net revenues for the Digital Media segment by similar classes of products and services for each of the last three fiscal years (in thousands):
| Years ended December 31, | ||||||||||||
| 2017 | 2016 | 2015 | ||||||||||
| Field maintenance and monitoring services | $ | 9,796 | $ | 9,023 | $ | 8,727 | ||||||
| Installation services | 8,598 | 7,275 | 5,876 | |||||||||
| Digital equipment sales | 4,932 | 5,613 | 2,512 | |||||||||
| Other | 1,158 | 85 | 318 | |||||||||
| Total segment revenue | $ | 24,484 | $ | 21,996 | $ | 17,433 | ||||||
Subsidiaries
As of December 31, 2017, we have the following wholly-owned operational subsidiaries:
| ● | Strong Technical Services, Inc. performs service work for all of our products. | |
| ● | Strong/MDI Screen Systems, Inc. manufactures cinema screens and related accessories. |
| ● | Convergent Media Systems Corporation performs all digital signage solutions and services. |
| ● | StrongVest Global Advisors, LLC serves as advisor to an exchange-traded fund (ETF). |
| 8 |
During the first quarter of 2018, we established a new subsidiary, Strong Digital Media, LLC, to provide advertising services within the Digital Media segment as described above.
Sale of Business
On May 17, 2017, the Company sold the operational assets of Strong Westrex, Inc. (“SWI”), a wholly-owned subsidiary of the Company, for total proceeds of $60 thousand. The Company recorded an insignificant gain on the sale of SWI.
Financial Instruments and Credit Risk Concentrations
The Company’s top ten customers accounted for approximately 53% of 2017 consolidated net revenues. Trade accounts receivable from these customers represented approximately 39% of net consolidated receivables at December 31, 2017. Sales to the following customers in fiscal 2017 exceeded 10% of our net revenues from continuing operations (dollars in thousands):
| Revenue | % | |||||||
| Regal Cinemas | $ | 7,978 | 10.9 | % | ||||
| Wells Fargo & Company | 7,797 | 10.7 | % | |||||
| American Multi-Cinema (AMC) | 7,593 | 10.4 | % | |||||
Manufacturing
We manufacture cinema screens through Strong/MDI, our screen subsidiary in Joliette, Quebec, Canada. These manufacturing operations consist of an 83,000 square-foot facility for the manufacture of cinema screen systems. These facilities include expanded PVC welding operations with programmable automations, as well as two 90-foot high screen coating towers with state of the art precision coating application software and painting systems. This world class ISO certified operation has the capability of manufacturing multiple standard screens simultaneously to large format 2D and 3D screens for cinema and special venue applications.
Quality Control
We believe that our quality control procedures and the quality standards for the products that we manufacture, distribute or service have contributed significantly to our reputation for high performance and reliability. The inspection of incoming materials and components as well as the testing of all of our products during various stages of the sales and service cycle are key elements of this program.
Trademarks
We own or otherwise have rights to various trademarks and trade names used in conjunction with the sale of our products. We believe our success will not be dependent upon trademark protection, but rather upon our scientific and engineering capabilities and research and production techniques. We consider the following trademarks to be of value to our business: Strong® and Convergent™.
Employees
We employed 335 persons at December 31, 2017. Of these employees, 162 positions were considered manufacturing or operational, 90 were service related and 83 were considered sales and administrative. We are not a party to any collective bargaining agreement.
| 9 |
Seasonality
Generally, our business exhibits a minimal level of seasonality.
Regulation
We are subject to complex laws, rules and regulations affecting our domestic and international operations relating to, for example, environmental, safety and health requirements; exports and imports; bribery and corruption; tax; data privacy; labor and employment; competition; and intellectual property ownership and infringement. Compliance with these laws, rules and regulations may be onerous and expensive, and if we fail to comply or if we become subject to enforcement activity, our ability to manufacture our products and operate our business could be restricted and we could be subject to fines, penalties or other legal liability. Furthermore, should these laws, rules and regulations be amended or expanded, or new ones enacted, we could incur materially greater compliance costs or restrictions on our ability to manufacture our products and operate our business.
Some of these complex laws, rules and regulations – for example, those related to environmental, safety and health requirements – may particularly affect us in the jurisdictions in which we manufacture products, especially if such laws and regulations: require the use of abatement equipment beyond what we currently employ; require the addition or elimination of a raw material or process to or from our current manufacturing processes; or impose costs, fees or reporting requirements on the direct or indirect use of energy, or of materials or gases used or emitted into the environment, in connection with the manufacture of our products. There can be no assurance that in all instances a substitute for a prohibited raw material or process would be available, or be available at reasonable cost.
Executive Officers of the Company
D. Kyle Cerminara, age 40, has been Executive Chairman since September of 2015 and Chief Executive Officer since November of 2015. Mr. Cerminara has served on the Board of Directors since February of 2015.
Ray F. Boegner, age 68, has been President of the Cinema business since November of 2015. Mr. Boegner joined us in 1985 and has acted in various sales roles for our Company, including as Senior Vice President from 1997 to 2015.
Stephen L. Schilling, age 53, has been President of the Digital Media business since November of 2015.
Lance V. Schulz, age 50, has been Senior Vice President, Chief Financial Officer and Treasurer since March of 2017.
Information Available on Ballantyne Website
We make available free of charge on our website (www.ballantynestrong.com), through a link to the Securities and Exchange Commission (“SEC”) website, our annual reports on Form 10-K, quarterly reports on Form 10-Q, current reports on Form 8-K, and amendments to those reports filed or furnished pursuant to Section 13(a) or 15(d) of the Securities and Exchange Act of 1934, as amended, as soon as reasonably practicable after we electronically file such material with, or furnish it to, the SEC. However, information posted on our website is not part of the Form 10-K. The Board of Directors has adopted the following governance documents, which are also posted on our website:
| ● | Code of Ethics | |
| ● | Audit Committee Charter | |
| ● | Nominating and Corporate Governance Committee Charter | |
| ● | Compensation Committee Charter |
| 10 |
These corporate governance documents are also available in print to any stockholder upon request by writing to:
| Corporate
Secretary Ballantyne Strong, Inc. 11422 Miracle Hills Drive, Suite 300 Omaha, NE 68154 |
Financial Information About Segments and Geographic Areas
The financial information about segments and geographic areas is included in Note 17 of our consolidated financial statements in this report.
Our business and financial performance are subject to various risks and uncertainties, some of which are beyond our control. We discuss in this section some of the risk factors that, if they actually occurred, could materially and adversely affect our business, financial condition and results of operations. In that event, the trading price of our common stock could decline and you may lose part or all of your investment. You should consider these risk factors in connection with evaluating the forward-looking statements contained in this Annual Report on Form 10-K because these factors could cause our actual results and financial condition to differ materially from those projected in forward-looking statements. We undertake no obligation to revise or update any forward-looking statements contained herein to reflect subsequent events or circumstances or the occurrence of unanticipated events.
If we are unable to expand our revenue streams to compensate for the lower demand for our digital cinema products and installation services, our business, financial condition and results of operations could be materially adversely affected.
A significant portion of our revenue in recent years has been generated from the theater exhibition industry’s need for digital cinema equipment and services to support the industry’s transformation from film to digital equipment. This transition required us to commit substantial resources to the process of retrofitting existing theater complexes by removing the film equipment and replacing it with digital equipment, and we experienced significant financial gains from this work. With the completion of this digital conversion by North America theater exhibitors, we are no longer able to rely on that income as a major source of our earnings. If we are unable to expand our revenue streams with other products and services, our future growth would be significantly curtailed.
Interruptions of, or higher prices of, components from our suppliers may affect our results of operations and financial performance.
A portion of our revenues are dependent on the distribution of products supplied by various key suppliers. If we fail to maintain satisfactory relationships with our suppliers, or if our suppliers experience significant financial difficulties, we could experience difficulty in obtaining needed goods and services. Some suppliers could also decide to reduce inventories or raise prices to increase cash flow. The loss of any one or more of our suppliers could have an adverse effect on our business, and we may be unable to secure alternative manufacturing arrangements. Even if we are able to obtain alternative manufacturing arrangements, such arrangements may not be on terms similar to our current arrangements or we may be forced to accept less favorable terms in order to secure a supplier as quickly as possible so as to minimize the impact on our business operations. In addition, any required changes in our suppliers could cause delays in our operations and increase our production costs and new suppliers may not be able to meet our production demands as to volume, quality or timeliness.
| 11 |
The markets for our products and services are highly competitive and if market share is lost, we may be unable to lower our cost structure quickly enough to offset the loss of revenue.
Within the cinema market, the domestic and international markets for our product lines are highly competitive, evolving and subject to rapid technological and other changes. Our Digital Media business, in particular, is highly dependent on technology. We expect the intensity of competition in each of these areas to continue in the future for a number of reasons including:
| ● | Certain of the competitors for our digital equipment have longer operating histories and greater financial, technical, marketing and other resources than we do, which, among other things, may permit them to adopt aggressive pricing policies. As a result, we may suffer from pricing pressures that could adversely affect our ability to generate revenues and our results of operations. Some of our competitors also have greater name and brand recognition and a larger customer base than us. | |
| ● | Some of our competitors are manufacturing their own digital equipment while we employ a distribution business model through our distribution agreements with NEC, BARCO and certain other suppliers. As a result, we may suffer from pricing pressures that could adversely affect our ability to generate revenues. | |
| ● | Suppliers could decide to utilize their current sales force to supply their products directly to customers rather than utilizing channels. |
In addition, we face competition for consumer attention from other forms of entertainment. The other forms of entertainment may be more attractive to consumers than those utilizing our technologies, which could harm our business, prospects and operating results.
For these and other reasons, we must continue to enhance our technologies and our existing products and services and introduce new high quality technologies, products and services to meet the wide variety of competitive pressures that we face. If we are unable to compete successfully, our business, prospects and results of operations will be materially adversely impacted.
Our capital allocation strategy may not be successful, which could adversely impact our financial condition.
We intend to continue investing part of our cash balances in public companies. We intend our investments in public companies to be made in circumstances where we believe that we will be able to exercise some degree of influence or control. To date, our investments are highly concentrated in three public companies – 1347 Property Insurance Holdings, Inc. (Nasdaq: PIH), RELM Wireless Corporation (NYSE American: RWC) and Itasca Capital Ltd. (TSX Venture: ICL). In some cases, funds controlled by the Company’s affiliate Fundamental Global Investors, LLC have, and may in the future, acquire positions in the same public companies as the Company. These types of investments are riskier than holding our cash balances as bank deposits or, for example, such conservative investments as treasury bonds or money market funds. There can be no assurance that we will be able to maintain or enhance the value or the performance of the companies in which we have invested or may invest in the future, or that we will achieve returns or benefits from these investments. Under certain circumstances, significant declines in the fair values of these investments may require the recognition of other-than-temporary impairment losses. We may lose all or part of our investment relating to such companies if their value decreases as a result of their financial performance or for any other reason. If our interests differ from those of other investors in companies over which we do not have control, we may be unable to effect any change at those companies. We are not required to meet any diversification standards, and our investments may continue to remain concentrated. If our capital allocation strategy is not successful or we achieve less than expected returns from these investments, it could have a material adverse effect on us. The Board of Directors may also change our capital allocation strategy at any time, and such changes could further increase our exposure, which could adversely impact us.
If we are not able to develop and introduce enhancements and new features that achieve market acceptance or that keep pace with technological developments, our business could be harmed.
We operate in a dynamic environment characterized by rapidly changing technologies and industry and legal standards. Innovation is critical to our success. The introduction of new software solutions by our competitors, the market acceptance of solutions based on new or alternative technologies or the emergence of new industry standards could render our platform obsolete. Our ability to compete successfully, attract new customers and increase revenues from existing customers depends in part on our ability to enhance and improve our existing software platform and to identify new software partners, which would allow us to continually introduce or acquire new features that are in demand by the market that we serve. The success of any enhancement or new solution depends on several factors, including timely completion and integration, adequate quality testing, introduction and market acceptance. Any new platform or feature that we develop or acquire may not be introduced in a timely or cost-effective manner, may contain defects or may not achieve the broad market acceptance necessary to generate significant revenues. If we are unable to anticipate, or timely and successfully develop or acquire, new offerings or features, or enhance our existing platform to meet customer requirements, our business and operating results will be adversely affected. Additionally, for technologies that are acquired, we may not be able to successfully integrate or monetize the acquired technology at a rate that is consistent with the market’s expectations, which could have a material adverse impact on us.
| 12 |
If we are unable to maintain our brand and reputation, our business, results of operations and prospects could be materially harmed.
Our business, results of operations and prospects depend, in part, on maintaining and strengthening our brand and reputation for providing high quality products and services. Reputational value is based in large part on perceptions. Although reputations may take decades to build, any negative incidents can quickly erode trust and confidence, particularly if they result in adverse publicity, governmental investigations or litigation. If problems with our products cause operational disruption or other difficulties, or there are delays or other issues with the delivery of our products or services, our brand and reputation could be diminished. Damage to our reputation could also arise from actual or perceived legal violations, product safety issues, data security breaches, actual or perceived poor employee relations, actual or perceived poor service, actual or perceived poor privacy practices, operational or sustainability issues, actual or perceived ethical issues or other events within or outside of our control that generate negative publicity with respect to us. Any event that has the potential to negatively impact our reputation could lead to lost sales, loss of new opportunities and retention and recruiting difficulties. If we fail to promote and maintain our brand and reputation successfully, our business, results of operations and prospects could be materially harmed.
Our sales cycle can be long and unpredictable, particularly with respect to large enterprises, which could harm our business and operating results.
The timing of our sales is difficult to predict. Our sales efforts involve educating our customers, frequently at an executive level, about the use, potential return on investment, technical capabilities, security and other benefits of our solution. Customers often undertake a prolonged product-evaluation process, which frequently involves not only our solutions but also those of our competitors. As we continue to target our sales efforts at large enterprise customers, we will face greater costs, long sales cycles and less predictability in completing some of our sales. In this market segment, the customer’s decision to subscribe to our solution is often an enterprise-wide decision and may require us to provide even greater levels of education regarding the use and benefits of our solution and obtain support from multiple departments. In addition, prospective enterprise customers may require customized features and functions unique to their business process that may need acceptance testing related to those unique features. As a result of these factors, these sales opportunities may require us to devote greater sales support, operational support and professional services resources to individual customers, increasing costs and time required to complete sales and diverting our own sales and professional services resources to a smaller number of larger transactions. The long and unpredictable nature of our sales cycle could materially adversely impact our business and results of operations.
We are substantially dependent upon significant customers who could cease purchasing our products at any time.
The Company’s top ten customers accounted for approximately 53% of 2017 consolidated net revenues. Trade accounts receivable from these customers represented approximately 39% of net consolidated receivables at December 31, 2017. We had three customers that each individually accounted for over 10% of our consolidated net revenues in 2017. Most arrangements with these customers are made by purchase order and are terminable at will by either party. A significant decrease or interruption in business from the Company’s significant customers could have a material adverse effect on the Company’s business, financial condition and results of operations.
The Company has deferred tax assets that are subject to annual valuation testing, which assets may not be realized, thus negatively impacting us.
The ultimate realization of deferred tax assets is dependent upon the generation of future taxable income. We consider the scheduled reversal of taxable temporary differences, projected future taxable income and tax planning strategies in making this assessment. A cumulative loss in a particular tax jurisdiction in recent years is a significant piece of evidence with respect to the realizability that is difficult to overcome. Based on the available objective evidence, including recent updates to the taxing jurisdictions generating income, we concluded that we should maintain our valuation allowance against our U.S. deferred tax assets as of December 31, 2017. We face risks that our recorded deferred tax assets may not be realized, thus negatively impacting us.
| 13 |
Our business is subject to the economic and political risks of selling products in foreign countries.
Sales outside the United States (mainly cinema) continue to be significant, accounting for approximately 21% of consolidated sales in fiscal 2017. We expect that international sales will continue to be important to our business for the foreseeable future. Foreign sales are subject to general political and economic risks, including the recent presidential and congressional elections in the United States, which have created uncertainty regarding international trade, unanticipated or unfavorable circumstances arising from host country laws or regulations, unfavorable changes in U.S. policies on international trade and investment, the imposition of governmental economic sanctions on countries in which we do business, quotas, capital controls or other trade barriers, whether adopted by individual governments or addressed by regional trade blocks, threats of war, terrorism or governmental instability, currency controls, fluctuating exchange rates with respect to sales not denominated in U.S. dollars, changes in import/export regulations, tariffs and freight rates, potential negative consequences from changes to taxation policies, restrictions on the transfer of funds into or out of a country and the disruption of operations from labor and political disturbances. Government policies on international trade and investment can affect the demand for our products, impact the competitive position of our products or prevent us from being able to sell or manufacture products in certain countries. The implementation of more restrictive trade policies, such as higher tariffs or new barriers to entry, in countries in which we sell large quantities of products and services could negatively impact our business, results of operations and financial condition. For example, a government’s adoption of “buy national” policies or retaliation by another government against such policies could have a negative impact on our results of operations. If we were unable to navigate the foreign regulatory environment, or if we were unable to enforce our contract rights in foreign countries, our business could be adversely impacted. Any of these events could reduce our sales, limit the prices at which we can sell our products, interrupt our supply chain or otherwise have an adverse effect on our operating performance.
In addition, a portion of our foreign sales are denominated in foreign currencies and amounted to $4.7 million in 2017. To the extent that orders are denominated in foreign currencies, our reported sales and earnings are subject to foreign exchange fluctuations. In addition, there can be no assurance that our remaining international customers will continue to accept orders denominated in U.S. dollars. For those sales which are denominated in U.S. dollars, a weakening in the value of foreign currencies relative to the U.S. dollar could have a material adverse impact on us by increasing the effective price of our products in international markets. Certain areas of the world are also more cost conscious than the U.S. market and there are instances where our products are priced higher than local manufacturers. We are also exposed to foreign currency fluctuations between the Canadian and U.S. dollar due to our screen manufacturing facility in Canada where a majority of its sales are denominated in the U.S. dollar while its expenses are denominated in Canadian currency. We cannot predict the effects of exchange rate fluctuations upon our future operating results because of the number of currencies involved, the variability of currency exposures and the potential volatility of currency exchange rates.
Any of these factors could adversely affect our foreign activities and our business, financial condition and results of operations.
The risk of non-compliance with U.S. and foreign laws and regulations applicable to our international operations could have a significant impact on our results of operations, financial condition and strategic objectives.
Our global operations subject us to regulation by U.S. federal and state laws and multiple foreign laws, regulations and policies, which could result in conflicting legal requirements. These laws and regulations are complex, change frequently, have tended to become more stringent over time and increase our cost of doing business. These laws and regulations include import and export control, environmental, health and safety regulations, data privacy requirements, international labor laws and work councils and anti-corruption and bribery laws such as the U.S. Foreign Corrupt Practices Act, the U.N. Convention Against Bribery and local laws prohibiting corrupt payments to government officials. We are subject to the risk that we, our employees, our affiliated entities, contractors, agents or their respective officers, directors, employees and agents may take action determined to be in violation of any of these laws. An actual or alleged violation could result in substantial fines, sanctions, civil or criminal penalties, and debarment from government contracts, curtailment of operations in certain jurisdictions, competitive or reputational harm, litigation or regulatory action and other consequences that might adversely affect our results of operations, financial condition and strategic objectives.
| 14 |
A reversal of the U.S. economic recovery and a return to volatile or recessionary conditions in the United States or abroad could adversely affect our business or our access to capital markets in a material manner.
Worsening economic and market conditions, downside shocks, or a return to recessionary economic conditions could serve to reduce demand for our products and adversely affect our operating results. These economic conditions may also impact the financial condition of one or more of our key suppliers, which could affect our ability to secure product to meet our customers’ demand. In addition, a downturn in the cinema market could impact the valuation and collectability of certain long-term receivables held by us. We could also be adversely affected by such factors as changes in foreign currency rates and weak economic and political conditions in each of the countries in which we sell our products.
We rely extensively on our information technology systems and are vulnerable to damage and interruption.
We rely on our information technology systems and infrastructure to process transactions, summarize results and manage our business, including maintaining client and supplier information. Additionally, we utilize third parties, including cloud providers, to store, transfer and process data. Our information technology systems, as well as the systems of our customers, suppliers and other partners, are vulnerable to outages and an increasing risk of continually evolving deliberate intrusions to gain access to company sensitive information. Likewise, data security incidents and breaches by employees and others with or without permitted access to our systems pose a risk that sensitive data may be exposed to unauthorized persons or to the public. We may be unable to prevent outages or security breaches in our systems that could adversely affect our results of operations and cash flows, as well as our business reputation.
Any failure to maintain the security of information relating to our customers, employees and suppliers, whether as a result of cybersecurity attacks or otherwise, could expose us to litigation, government enforcement actions and costly response measures, and could disrupt our operations and harm our reputation.
In connection with the sales and marketing of our products and services, we may from time to time transmit confidential information. We also have access to, collect or maintain private or confidential information regarding our customers, employees, and suppliers, as well as our business. Cyberattacks are rapidly evolving and becoming increasingly sophisticated. It is possible that computer hackers and others might compromise our security measures, or security measures of those parties that we do business with now or in the future, and obtain the personal information of our customers, employees and suppliers or our business information. A security breach of any kind, including physical or electronic break-ins, computer viruses and attacks by hackers, employees or others, could expose us to risks of data loss, litigation, government enforcement actions and costly response measures, and could seriously disrupt our operations. Any resulting negative publicity could significantly harm our reputation, which could cause us to lose market share and have an adverse effect on our results of operations.
If we fail to retain key members of management, or successfully integrate new executives, our business may be materially harmed.
Our future success depends, in substantial part, on the efforts and abilities of our current management team. If certain of these individuals were to leave unexpectedly, we could experience substantial loss of institutional knowledge, face difficulty in hiring qualified successors and could experience a loss in productivity while any successor obtains the necessary training and experience. Our loss of services of any of our senior executives, or any failure to effectively integrate new management into our business processes, controls, systems and culture, could have a material adverse effect on us.
We have made changes to our management team in recent years. On November 24, 2015, the Board of Directors appointed D. Kyle Cerminara as our Chairman and Chief Executive Officer, effective immediately. Mr. Cerminara has been a member of the Board since February 2015 and has served as its Chairman since May 2015, assuming the role of Executive Chairman in September 2015. On November 2, 2015, Stephen L. Schilling joined us as President of the Digital Media business, and Ray F. Boegner was promoted to the newly created position of President of the Cinema business. On March 29, 2017, Lance V. Schulz was appointed as our Senior Vice President, Chief Financial Officer and Treasurer. These or other changes in key management could create uncertainty among our employees, suppliers and other business partners and are resulting in changes to the strategic direction of our business, any of which could have a material adverse effect on us.
| 15 |
Our previous and any potential future acquisitions, strategic investments, entry into new lines of business, divestitures, mergers or joint ventures may subject us to significant risks, any of which could harm our business.
Our long-term strategy may include identifying and acquiring, investing in or merging with suitable candidates on acceptable terms, entry into new lines of business and markets or divesting of certain business lines or activities. In particular, over time, we may acquire, make investments in or merge with providers of product offerings that complement our business or may terminate such activities. Mergers, acquisitions, divestitures and entries into new lines of business include a number of risks and present financial, managerial and operational challenges, including but not limited to:
| ● | diversion of management attention from running our existing business; | |
| ● | possible material weaknesses in internal control over financial reporting; | |
| ● | increased expenses including legal, administrative and compensation expenses related to newly hired or terminated employees; | |
| ● | increased costs to integrate, develop or, in the case of a divestiture, separate the technology, personnel, customer base and business practices of the acquired, new or divested business or assets; | |
| ● | potential exposure to material liabilities not discovered in the due diligence process; | |
| ● | potential adverse effects on reported operating results due to possible write-down of goodwill and other intangible assets associated with acquisitions; | |
| ● | potential damage to customer relationships or loss of synergies in the case of divestitures; and | |
| ● | unavailability of acquisition financing or inability to obtain such financing on reasonable terms. |
Any acquired business, technology, service or product or entry into a new line of business could significantly under-perform relative to our expectations, and may not achieve the benefits we expect. For example, our entry into the taxicab advertising line of business in 2018 poses many of the risks discussed above. For all these reasons, our pursuit of an acquisition, investment, new line of business, divestiture, merger or joint venture could cause our actual results to differ materially from those anticipated.
Failure to effectively utilize or successfully assert intellectual property rights could negatively impact us.
We own or otherwise have rights to various trademarks and trade names used in conjunction with the sale of our products, the most significant of which are Strong® and Convergent™. We rely on trademark laws to protect these intellectual property rights. We cannot assure that these intellectual property rights will be effectively utilized or, if necessary, successfully asserted. There is a risk that we will not be able to obtain and perfect our own intellectual property rights, or, where appropriate, license from others, intellectual property rights necessary to support new product introductions. Our intellectual property rights, and any additional rights we may obtain in the future, may be invalidated, circumvented or challenged in the future. Our failure to perfect or successfully assert intellectual property rights could harm our competitive position and could negatively impact us.
| 16 |
Natural disasters and other catastrophic events beyond our control could adversely affect our business operations and financial performance.
The occurrence of one or more natural disasters, such as fires, hurricanes, tornados, tsunamis, floods and earthquakes; geo-political events, such as civil unrest in a country in which our suppliers are located or terrorist or military activities disrupting transportation, communication or utility systems; or other highly disruptive events, such as nuclear accidents, pandemics, unusual weather conditions or cyberattacks, could adversely affect our operations and financial performance. Such events could result, among other things, in operational disruptions, physical damage to or destruction or disruption of one or more of our properties or properties used by third parties in connection with the supply of products or services to us, the lack of an adequate workforce in parts or all of our operations and communications and transportation disruptions. These factors could also cause consumer confidence and spending to decrease or result in increased volatility in the United States and global financial markets and economy. Such occurrences could have a material adverse effect on us and could also have indirect consequences such as increases in the costs of insurance if they result in significant loss of property or other insurable damage.
The insurance that we maintain may not fully cover all potential exposures.
We maintain property, business interruption and casualty insurance but such insurance may not cover all risks associated with the hazards of our business and is subject to limitations, including deductibles and maximum liabilities covered. We are potentially at risk if one or more of our insurance carriers fail. Additionally, severe disruptions in the domestic and global financial markets could adversely impact the ratings and survival of some insurers. In the future, we may not be able to obtain coverage at current levels, and our premiums may increase significantly on coverage that we maintain.
Entities affiliated with Fundamental Global Investors, LLC, whose interests may differ from the interests of our other stockholders, have significant influence over the Company.
The interests of Fundamental Global Investors, LLC and its affiliates may differ from the interests of our other stockholders. Fundamental Global Investors, LLC and its affiliates hold approximately 28.7% of the Company’s outstanding shares of common stock as of December 31, 2017. Mr. Cerminara, the Chief Executive Officer, Co-Founder and Partner of Fundamental Global Investors, LLC, serves as our Chairman and Chief Executive Officer. In addition, Lewis M. Johnson, the President, Co-Founder and Partner of Fundamental Global Investors, LLC, serves as a member of our board of directors. As a result of its ownership position and Mr. Cerminara’s and Mr. Johnson’s positions with the Company, Fundamental Global Investors, LLC has the ability to exert significant influence over our policies and affairs, including the power to impact the election of our directors, appointment of our management and approval of any action requiring a shareholder vote, such as amendments to our certificate of incorporation, bylaws, significant stock issuances, mergers and asset sales. Fundamental Global Investors, LLC may have interests that differ from those of our other stockholders and may vote in a way with which our other stockholders disagree and which may be adverse to their interests. Fundamental Global Investors, LLC’s significant ownership may also have the effect of delaying, preventing or deterring a change of control of the Company, could deprive our stockholders of an opportunity to receive a premium for their common stock as part of a sale of the Company and might ultimately affect the market price of our common stock.
Our stock price is vulnerable to significant fluctuations.
The trading price of our common stock has been highly volatile in the past and could be subject to significant fluctuations in response to variations in quarterly operating results, general conditions in the industries in which we operate and other factors. In addition, the stock market is subject to price and volume fluctuations affecting the market price for the stock of many companies generally, which fluctuations often are unrelated to operating performance.
Item 1B. Unresolved Staff Comments
The Company has no unresolved staff comments to report pursuant to this item.
| 17 |
Our headquarters are located at 11422 Miracle Hills Drive, Omaha, Nebraska, where we lease office space. The premises are used for offices supporting both of our operating segments and operating the Omaha NOC. The lease expires in November 2021. In addition, our subsidiaries owned or leased the following facilities as of December 31, 2017:
| ● | Our Strong/MDI Screen Systems, Inc. subsidiary owns an 83,000 square-foot manufacturing plant in Joliette, Quebec, Canada. The facilities are used for offices, manufacturing, assembly and distribution of the cinema and other screens. We believe this facility is well maintained and adequate for future needs, and is used by our Cinema segment. | |
| ● | In addition, the Company leases office space in Mooresville, North Carolina, which is used by both of our operating segments. The lease expires in November of 2020. | |
| ● | Our Convergent Media Systems Corporation subsidiary owns a 43,000 square-foot office facility in Alpharetta, Georgia, which is subject to first and second lien deeds of trust as described in Item 7 – Management’s Discussion and Analysis of Financial Condition and Results of Operations, Liquidity and Capital Resources. The facility is used for offices and operating the Alpharetta NOC. Convergent also leases our distribution facility, which is in Lawrenceville, Georgia, where we lease approximately 40,000 square feet. The lease expires in April 2020. The premises are used for distribution of certain products. In addition, Convergent leases two office facilities in Toronto, Ontario, Canada. These leases expire in March 2018 and October 2019. The office lease expiring March 2018 is not being renewed, as we intend to consolidate our Toronto operations into the remaining location. We believe these facilities are adequate for future needs and are used by both of our operating segments. |
We do not anticipate any difficulty in retaining occupancy of any leased facilities, either by renewing leases prior to expiration or replacing them with equivalent leased facilities.
In the ordinary course of our business operations, we are involved, from time to time, in certain legal disputes. No such disputes, individually or in the aggregate, are expected to have a material effect on our business or financial condition.
Item 4. Mine Safety Disclosures
Not applicable.
| 18 |
Item 5. Market for Registrant’s Common Equity, Related Stockholder Matters and Issuer Purchases of Equity Securities
Our common stock is listed and traded on the NYSE American under the symbol “BTN.” The following table sets forth the high and low per share sale price for the common stock as reported by the NYSE American.
| High | Low | |||||||||
| 2017 | First Quarter | $ | 8.10 | $ | 5.70 | |||||
| Second Quarter | 7.35 | 5.60 | ||||||||
| Third Quarter | 7.00 | 5.50 | ||||||||
| Fourth Quarter | 6.55 | 4.05 | ||||||||
| 2016 | First Quarter | $ | 4.77 | $ | 4.00 | |||||
| Second Quarter | 5.99 | 4.21 | ||||||||
| Third Quarter | 7.01 | 5.09 | ||||||||
| Fourth Quarter | 8.00 | 6.10 | ||||||||
According to the records of our transfer agent, we had 113 stockholders of record of our common stock on March 2, 2018. Because brokers and other institutions hold many of our shares on behalf of stockholders, we are unable to estimate the total number of stockholders represented by these record holders. The last reported per share sale price for the common stock on March 2, 2018 was $5.25. We had 14,422,090 shares of common stock outstanding on March 2, 2018.
Stock Repurchases
On August 20, 2015, we announced that our Board of Directors adopted a stock repurchase program authorizing the repurchase of up to 700,000 shares of our outstanding common stock pursuant to a plan adopted under Rule 10b5-1 of the Securities Exchange Act of 1934 (as amended). The program has no expiration date. There were no repurchases during the fourth quarter of 2017. As of December 31, 2017, there were 636,931 shares that may yet be purchased under the stock repurchase program.
Dividend Policy
We intend to retain our earnings to assist in financing our business and making investments and do not anticipate paying cash dividends on our common stock in the foreseeable future. The declaration and payment of dividends by the Company are also subject to the discretion of the Board. Any determination by the Board as to the payment of dividends in the future will depend upon, among other things, business conditions, our financial condition and capital requirements, as well as any other factors deemed relevant by the Board. We have not paid cash dividends since we went public in 1995.
PERFORMANCE GRAPH
The following graph compares Ballantyne’s cumulative total stockholder return over the last five fiscal years with the cumulative total returns of the New York Stock Exchange Composite Index (“NYSE”), the Russell 2000 Index and the Research Data Group, Inc. (“RDG”) SmallCap Technology Index. The graph assumes $100 was invested on December 31, 2012, and assumes reinvestment of all dividends.
| 19 |
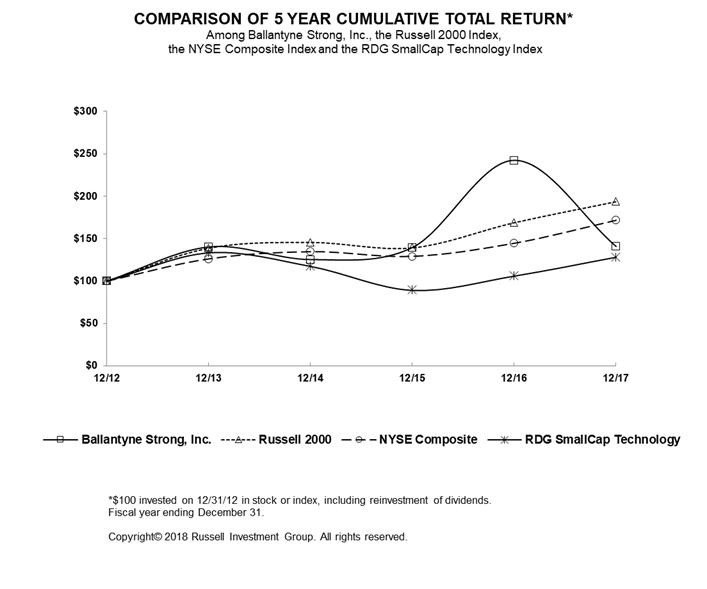
| 12/12 | 12/13 | 12/14 | 12/15 | 12/16 | 12/17 | |||||||||||||||||||
| Ballantyne Strong, Inc. | 100.00 | 140.30 | 125.45 | 139.70 | 242.42 | 140.91 | ||||||||||||||||||
| Russell 2000 | 100.00 | 138.82 | 145.62 | 139.19 | 168.85 | 193.58 | ||||||||||||||||||
| NYSE Composite | 100.00 | 126.28 | 134.81 | 129.29 | 144.73 | 171.83 | ||||||||||||||||||
| RDG SmallCap Technology | 100.00 | 133.48 | 117.53 | 89.29 | 106.10 | 128.29 |
Item 6. Selected Financial Data
The selected statement of operations data for the years ended December 31, 2017, 2016 and 2015, and the selected balance sheet data at December 31, 2017 and 2016, are derived from, and are qualified by reference to, the audited consolidated financial statements of the Company included elsewhere in this Annual Report on Form 10-K. The selected statement of operations data for the years ended December 31, 2014 and 2013, and the balance sheet data at December 31, 2015, 2014, and 2013, are derived from audited consolidated financial statements not included herein. The Company acquired Peintures Elite, Inc. on September 13, 2013 and Convergent Media Systems on October 1, 2013. In addition, the Company reclassified a portion of selected operations to discontinued operations in 2016. All prior periods have been restated to reflect the reclassification. See Note 2 to the Company’s consolidated financial statements.
| 20 |
| Year Ended December 31, | ||||||||||||||||||||
| 2017 | 2016 | 2015 | 2014 | 2013 | ||||||||||||||||
| (in thousands, except per share data) | ||||||||||||||||||||
| Statement of operations data | ||||||||||||||||||||
| Net revenue | $ | 72,646 | $ | 76,254 | $ | 78,059 | $ | 83,165 | $ | 88,891 | ||||||||||
| Gross profit | $ | 18,934 | $ | 21,156 | $ | 16,712 | $ | 17,089 | $ | 15,434 | ||||||||||
| Net (loss) earnings from continuing operations | $ | (3,592 | ) | $ | 869 | $ | (16,724 | ) | $ | 142 | $ | 252 | ||||||||
| Net (loss) earnings per share from continuing operations | ||||||||||||||||||||
| Basic | $ | (0.25 | ) | $ | 0.06 | $ | (1.19 | ) | $ | 0.01 | $ | 0.02 | ||||||||
| Diluted | $ | (0.25 | ) | $ | 0.06 | $ | (1.19 | ) | $ | 0.01 | $ | 0.02 | ||||||||
| Balance sheet data | ||||||||||||||||||||
| Working capital | $ | 13,562 | $ | 19,433 | $ | 28,179 | $ | 40,228 | $ | 44,042 | ||||||||||
| Total assets | $ | 59,014 | $ | 62,439 | $ | 66,864 | $ | 82,060 | $ | 83,630 | ||||||||||
| Long-term debt, net of current portion | $ | 1,870 | $ | — | $ | — | $ | — | $ | — | ||||||||||
| Stockholders' equity | $ | 44,122 | $ | 45,154 | $ | 44,512 | $ | 60,847 | $ | 61,499 | ||||||||||
Item 7. Management’s Discussion and Analysis of Financial Condition and Results of Operations
The following discussion and analysis should be read in conjunction with the consolidated financial statements and notes thereto appearing elsewhere in this report. Management’s discussion and analysis contains not only historical information, but also forward-looking statements within the meaning of Section 27A of the Securities Act of 1933 and Section 21E of the Securities Exchange Act of 1934. Statements that are not historical are forward-looking and reflect expectations for future Company performance. For these statements, the Company claims the protection of the safe harbor for forward-looking statements contained in the Private Securities Litigation Reform Act of 1995.
Forward-looking statements involve a number of risks and uncertainties, including but not limited to those discussed in the “Risk Factors” section contained in Item 1A. Given the risks and uncertainties, readers should not place undue reliance on any forward-looking statement and should recognize that the statements are predictions of future results which may not occur as anticipated. Actual results could differ materially from those anticipated in the forward-looking statements and from historical results, due to the risks and uncertainties described herein, as well as others not now anticipated. New risk factors emerge from time to time and it is not possible for management to predict all such risk factors, nor can it assess the impact of all such factors on our business or the extent to which any factor, or combination of factors, may cause actual results to differ materially from those contained in any forward-looking statements. Except as required by law, the Company assumes no obligation to update forward-looking statements to reflect actual results or changes in factors or assumptions affecting such forward-looking statements.
Overview
The Company is a holding company with diverse business activities focused on serving the cinema, retail, financial, advertising and government markets. It designs, integrates, and installs technology solutions for a broad range of applications; develops and delivers out-of-home messaging, advertising and communications; manufactures projection screens; and provides managed services, including monitoring of networked equipment, to our customers. We add value through our design, engineering, manufacturing excellence and customer service. We have two primary operating segments: Cinema and Digital Media. Our Cinema segment provides a full range of products and services to the theater exhibition industry, including digital projectors, state of the art projection screens, servers, library management systems, menu boards, flat panel displays, sound systems, maintenance services and network monitoring services. Our Digital Media segment delivers digital signage solutions and services across two primary markets: digital out-of-home and enterprise video.
| 21 |
Our segments were determined based on the manner in which management organizes segments for making operating decisions and assessing performance. Approximately 67% of fiscal year 2017 revenues were from Cinema and 33% from Digital Media. During the fourth quarter of 2017, we reorganized our corporate reporting structure and moved the operations of Strong Technical Services, Inc. from the Digital Media segment to the Cinema segment. All prior periods have been recast in our segment reporting to reflect the current segment organization. Additional information related to our reporting segments can be found in the notes to the consolidated financial statements.
Results of Operations:
The following table sets forth, for the periods indicated, the percentage of net revenues represented by certain items reflected in our consolidated statements of operations.
Years ended December 31, | ||||||||||||
| 2017 | 2016 | 2015 | ||||||||||
| Net revenues | 100.0 | % | 100.0 | % | 100.0 | % | ||||||
| Cost of revenues | 73.9 | 72.3 | 78.6 | |||||||||
| Gross profit | 26.1 | 27.7 | 21.4 | |||||||||
| Selling and administrative expenses | 29.6 | 22.1 | 26.3 | |||||||||
| (Loss) income from operations | (3.9 | ) | 5.5 | (5.4 | ) | |||||||
| Net (loss) earnings from continuing operations | (4.9 | ) | 1.1 | (21.4 | ) | |||||||
2017 Compared to 2016
Revenues
Net revenues during 2017 decreased 4.7% to $72.6 million from $76.3 million in 2016.
| 2017 | 2016 | $ Change | % Change | |||||||||||||
| (dollars in thousands) | ||||||||||||||||
| Cinema | $ | 48,937 | $ | 54,775 | $ | (5,838 | ) | (10.7 | )% | |||||||
| Digital Media | 24,484 | 21,996 | 2,488 | 11.3 | % | |||||||||||
| Other | 39 | — | 39 | N/A | ||||||||||||
| Total segment revenues | 73,460 | 76,771 | (3,311 | ) | (4.3 | )% | ||||||||||
| Eliminations | (814 | ) | (517 | ) | (297 | ) | 57.4 | % | ||||||||
| Total net revenues | $ | 72,646 | $ | 76,254 | $ | (3,608 | ) | (4.7 | )% | |||||||
Cinema
Sales of Cinema products and services decreased 10.1% to $49.3 million in 2017 from $54.8 million in 2016. This decrease was driven by an $8.5 million decrease in sales of digital projectors and lamps, partially offset by increases totaling $2.9 million in non-recurring maintenance services, including installations, and sales of digital displays. We expect revenue from lamp sales to remain low in future years, as we terminated our distributorship for certain lamp products in July 2017 due to the very low margins earned on these products.
| 22 |
Digital Media
Sales of Digital Media products and services increased 11.3% to $24.5 million in 2017 from $22.0 million in 2016. Recurring revenue from digital signage as a service increased $1.1 million and non-recurring installation and demand revenue increased by $1.6 million in 2017. These increases were offset by a decrease in non-recurring equipment sales of $0.7 million. The increase in non-recurring installation revenue was primarily related to a one-time project with a specific customer that was substantially completed in 2017 and is not expected to continue in the future.
Foreign Revenues
Sales outside the United States (primarily from the Cinema segment) decreased 7.2% to $15.2 million in 2017 from $16.3 million in 2016. Decreased sales in China, Mexico, Europe and other parts of Asia were partially offset by increased sales in Canada. Export sales are sensitive to the rate of cinema growth in developing countries, as well as normal replacement cycles in developed countries. Export sales are also sensitive to worldwide economic and political conditions that lead to volatility. Certain areas of the world are more cost conscious than the U.S. market and there are instances where our products are priced higher than products of local manufacturers, making it more difficult to generate sufficient profit to justify selling into these regions. Additionally, foreign exchange rates and excise taxes sometimes make it difficult to market our products overseas at reasonable selling prices.
Gross Profit
Consolidated gross profit decreased 10.5% to $18.9 million in 2017 from $21.2 million in 2016 and, as a percentage of total revenues, decreased to 26.1% in 2017 from 27.7% in 2016.
| 2017 | 2016 | $ Change | % Change | |||||||||||||
|
(dollars in thousands) |
||||||||||||||||
| Cinema | $ | 14,919 | $ | 17,160 | $ | (2,241 | ) | (13.1 | )% | |||||||
| Digital Media | 3,976 | 3,996 | (20 | ) | (0.5 | )% | ||||||||||
| Other | 39 | — | 39 | N/A | ||||||||||||
| Total gross profit | $ | 18,934 | $ | 21,156 | $ | (2,222 | ) | (10.5 | )% | |||||||
Gross profit in the Cinema segment amounted to $14.9 million or 30.5% of revenues in 2017 compared to $17.2 million or 31.3% of revenues in 2016. The decrease in gross margin dollars and as a percentage of revenues was driven by lower revenue coverage of fixed operating costs and an increase in inventory reserves.
Gross profit in the Digital Media segment amounted to $4.0 million or 16.2% of revenues in 2017 compared to $4.0 million or 18.2% of revenues in 2016. The decrease in gross margin as a percentage of revenues was driven by product mix, as lower margin equipment and installation revenues made up a larger percentage of total revenues.
| 23 |
Operating (Loss) Income
We generated an operating loss of $2.8 million in 2017 compared to operating income of $4.2 million in 2016.
| 2017 | 2016 | $ Change | % Change | |||||||||||||
|
(dollars in thousands) |
||||||||||||||||
| Cinema | $ | 10,678 | $ | 13,398 | $ | (2,720 | ) | (20.3 | )% | |||||||
| Digital Media | (3,902 | ) | (1,596 | ) | (2,306 | ) | 144.5 | % | ||||||||
| Other | (382 | ) | (88 | ) | (294 | ) | 334.1 | % | ||||||||
| Total segment operating income | 6,394 | 11,714 | (5,320 | ) | (45.4 | )% | ||||||||||
| Unallocated general and administrative expenses | (9,208 | ) | (7,550 | ) | (1,658 | ) | 22.0 | % | ||||||||
| Total operating (loss) income | $ | (2,814 | ) | $ | 4,164 | $ | (6,978 | ) | N/A | |||||||
We generated operating income in the Cinema segment of $10.7 million in 2017 compared to $13.4 million in 2016. This decrease was driven primarily by lower gross profit as described above.
The Digital Media segment generated an operating loss of $3.9 million in 2017 compared to $1.6 million in 2016. This increase in operating loss was driven primarily by higher selling, general and administrative expenses, including bad debt expense of $0.8 million and contract termination expense of $0.4 million.
Unallocated general and administrative expenses amounted to $9.2 million in 2017 compared to $7.6 million in 2016. The increase was driven primarily by increased costs related to consulting, audit and tax, information technology, employee compensation and benefits and stock-based compensation, partially offset by lower bonus expense.
Other Financial Items
In 2017, total other income of $0.7 million primarily consisted of a $1.1 million fair value adjustment to our notes receivable, partially offset by $0.3 million of foreign currency transaction losses and $0.1 million of net interest expense. In 2016, total other expense of $0.4 million primarily consisted of foreign currency transaction losses of $1.0 million, partially offset by $0.5 million of excess joint venture distributions recognized as income.
In assessing the realizability of deferred tax assets, we consider whether it is more likely than not that some portion or all of the deferred tax assets will not be realized. The ultimate realization of deferred tax assets is dependent upon the generation of future taxable income. We consider the scheduled reversal of taxable temporary differences, projected future taxable income and tax planning strategies in making this assessment. A cumulative loss in a particular tax jurisdiction in recent years is a significant piece of evidence with respect to the realizability that is difficult to overcome. Based on the available objective evidence, including recent updates to the taxing jurisdictions generating income, we concluded that a valuation allowance of $12.3 million should be recorded against our U.S. tax jurisdiction deferred tax assets as of December 31, 2017.
In December 2017, the Tax Cuts and Jobs Act of 2017 (the “2017 Tax Act”), was signed into law in the United States. The law includes significant changes to the United States corporate income tax system, including a federal corporate rate reduction and the transition of the United States from a worldwide tax system to a territorial tax system. As part of the transition to a territorial tax system, the 2017 Tax Act requires taxpayers to calculate a one-time transition tax based on the deemed repatriation of undistributed earnings of foreign subsidiaries. We currently are analyzing the 2017 Tax Act, and in certain areas, have made provisional estimates of the effects on our consolidated financial statements and tax disclosures, including the amount of the repatriation tax and changes to our existing deferred tax balances.
| 24 |
Overall, we recorded income tax expense of approximately $3.4 million in 2017 compared to income tax expense of $3.0 million in 2016. Our income tax expense consists primarily of income tax on foreign earnings. Due to the full valuation allowance recorded against our U.S. tax jurisdiction deferred tax assets as of December 31, 2017, we estimated the impact of the 2017 Tax Act on our 2017 net income tax expense to be zero.
We recorded equity method investment income of $2.0 million in 2017, consisting primarily of $2.1 million from our investment in Itasca Capital, Ltd. Equity method investment income in 2016 was not significant.
We recorded a net loss of $25 thousand in 2017 related to our discontinued China operations compared to a net loss of $1.3 million in 2016, as we completed the sale of the remaining assets in the second quarter of 2017.
As a result of the items outlined above, we recorded a net loss of $3.6 million and $0.25 basic and diluted losses per share in 2017, compared to a net loss of $0.4 million and $0.03 basic and diluted losses per share in 2016.
2016 Compared to 2015
Revenues
Net revenues for 2016 decreased 2.3% to $76.3 million from $78.1 million for 2015.
| 2016 | 2015 | $ Change | % Change | |||||||||||||
|
(dollars in thousands) |
||||||||||||||||
| Cinema | $ | 54,775 | $ | 60,839 | $ | (6,064 | ) | (10.0 | )% | |||||||
| Digital Media | 21,996 | 17,433 | 4,563 | 26.2 | % | |||||||||||
| Total segment revenues | 76,771 | 78,272 | (1,501 | ) | (1.9 | )% | ||||||||||
| Eliminations | (517 | ) | (213 | ) | (304 | ) | 142.7 | % | ||||||||
| Total net revenues | $ | 76,254 | $ | 78,059 | $ | (1,805 | ) | (2.3 | )% | |||||||
Cinema
Sales of Cinema products and services decreased 10.0% to $54.8 million in 2016 from $60.8 million in 2015. This decrease was driven primarily by a $6.5 million decrease in sales of digital projectors and lamps, partially offset by increased screen sales.
Digital Media
Sales of Digital Media products and services increased 26.2% to $22.0 million in 2016 from $17.4 million in 2015. The increase of $4.6 million was driven by increased sales of displays and media players, non-recurring installation services and non-recurring maintenance revenue, partially offset by decreased sales of recurring maintenance services.
Foreign Revenues
Sales outside the United States (primarily from the Cinema segment) decreased 5.6% to $16.3 million in 2016 from $17.3 million in 2015. Decreased sales in Mexico, Europe, Canada and Latin America were partially offset by increased sales in China and other areas of Asia.
| 25 |
Gross Profit
Consolidated gross profit increased 26.6% to $21.2 million in 2016 from $16.7 million in 2015 and, as a percentage of total revenues, increased to 27.7% in 2016 from 21.4% in 2015.
| 2016 | 2015 | $ Change | % Change | |||||||||||||
|
(dollars in thousands) |
||||||||||||||||
| Cinema | $ | 17,160 | $ | 15,163 | $ | 1,997 | 13.2 | % | ||||||||
| Digital Media | 3,996 | 1,549 | 2,447 | 158.0 | % | |||||||||||
| Total gross profit | $ | 21,156 | $ | 16,712 | $ | 4,444 | 26.6 | % | ||||||||
Gross profit in the Cinema segment amounted to $17.2 million, or 31.3% of revenues, in 2016 compared to $15.2 million, or 24.9% of revenues in 2015. The increase in gross margin dollars and gross margin as a percentage of revenues was driven by a favorable sales mix, as the mix shifted to more profitable businesses, as well as lower inventory reserve adjustments. These items were partially offset by the effect of a volume rebate related to customer contract negotiation and an increase in warranty expense in 2016.
Gross profit in the Digital Media segment amounted to $4.0 million or 18.2% of revenues in 2016 compared to $1.5 million or 8.9% of revenues in 2015. The increase in gross margin dollars and gross margin as a percentage of revenues was driven by increased revenue from non-recurring projects and equipment sales and lower inventory reserve adjustments.
Operating Income (Loss)
We generated operating income of $4.2 million in 2016 compared to an operating loss of $4.2 million in 2015.
| 2016 | 2015 | $ Change | % Change | |||||||||||||
| (dollars in thousands) | |||||||||||||||
| Cinema | $ | 13,398 | $ | 9,964 | $ | 3,434 | 34.5 | % | ||||||||
| Digital Media | (1,596 | ) | (3,764 | ) | 2,168 | 57.6 | % | |||||||||
| Other | (88 | ) | — | (88 | ) | N/A | ||||||||||
| Total segment operating income | 11,714 | 6,200 | 5,514 | 88.9 | % | |||||||||||
| Unallocated general and administrative expenses | (7,550 | ) | (10,407 | ) | 2,857 | (27.5 | )% | |||||||||
| Total operating income (loss) | $ | 4,164 | $ | (4,207 | ) | $ | 8,371 | N/A | ||||||||
We generated operating income in the Cinema segment of $13.4 million in 2016 compared to $10.0 million in 2015. This increase in operating income was driven by primarily by an increase in gross profit dollars as described above, as well as lower selling, general and administrative expenses.
The Digital Media segment generated an operating loss of $1.6 million in 2016 compared to $3.8 million in 2015. This decrease in operating loss was driven primarily by an increase in gross profit dollars as described above.
Unallocated general and administrative expenses decreased to $7.6 million in 2016 compared to $10.4 million in 2015. The decrease was driven primarily by restructuring costs incurred in 2015 plus lower compensation costs in 2016 primarily resulting from our 2015 strategic restructuring. Included in 2015 administrative expenses are $1.5 million of severance, facility consolidation and proxy contest expenses.
| 26 |
Other Financial Items
In 2016, total other expense of $0.4 million primarily consisted of foreign currency transaction losses of $1.0 million, partially offset by $0.5 million of excess joint venture distributions recognized as income. In 2015, other income of $0.4 million consisted of foreign currency transaction gains of $1.6 million and interest income of $0.4 million, partially offset by a $1.6 million unfavorable fair value adjustment to notes receivable.
In assessing the realizability of deferred tax assets, the Company considers whether it is more likely than not that some portion or all of the deferred tax assets will not be realized. The ultimate realization of deferred tax assets is dependent upon the generation of future taxable income. The Company considers the scheduled reversal of taxable temporary differences, projected future taxable income and tax planning strategies in making this assessment. A cumulative loss in a particular tax jurisdiction in recent years is a significant piece of evidence with respect to the realizability that is difficult to overcome. Based on the available objective evidence, including recent updates to the taxing jurisdictions generating income, the Company concluded that a valuation allowance of $8.6 million should be recorded against the Company’s U.S. tax jurisdiction deferred tax assets as of December 31, 2016.
We recorded income tax expense of approximately $3.0 million in 2016 compared to $13.0 million in 2015. During 2015, the Company changed its foreign reinvestment strategy and had accumulated earnings of $20.2 million in excess of what was determined to be permanently reinvested in Canada, resulting in income taxes of $7.7 million. The effective tax rate differs from the statutory rates primarily as a result of the valuation allowance recorded against the Company’s U.S. and China tax jurisdiction deferred tax assets and differing foreign and U.S. tax rates applied to respective pre-tax earnings by tax jurisdiction.
We recorded a net loss of $1.3 million related to our discontinued operations in 2016 compared to $0.7 million in 2015.
As a result of the items outlined above, we recorded a net loss of $0.4 million and $0.03 basic and diluted losses per share in 2016, compared to a net loss of $17.5 million and $1.24 basic and diluted losses per share in 2015.
Liquidity and Capital Resources
During the past several years, we have primarily met our working capital and capital resource needs from our operating cash flows and credit facilities. During the first quarter of 2018, we signed an agreement to provide advertising services on over 3,500 New York City taxicabs. The advertising will be on a combination of vinyl printed signs and digital signs. We have leased 300 digital signs, which we expect to install during the first half of 2018. The remainder of the taxicabs will initially feature print advertising. We expect to convert more taxicabs to digital signs over time. We expect that the new advertising business will negatively impact our cash flow for the first half of 2018 as we incur costs without collecting revenues during the start-up phase. However, we believe that our existing sources of liquidity, including cash and cash equivalents, credit facilities and operating cash flow, will be sufficient to meet our projected capital needs for the foreseeable future. We ended fiscal year 2017 with total cash and cash equivalents of $4.9 million compared to $7.6 million at December 31, 2016.
As of December 31, 2017, $3.6 million of the $4.9 million in cash and cash equivalents was held by our Canadian subsidiary, Strong/MDI. If these funds are repatriated to our operations in the U.S., we would be required to pay Canadian withholding taxes, which have been fully accrued as of December 31, 2017. Strong/MDI also may make intercompany loans to the U.S. parent company, which do not trigger Canadian withholding taxes if they meet certain requirements. As of December 31, 2017, the parent company had outstanding intercompany loans from Strong/MDI of approximately $19.4 million.
On April 27, 2017, we entered into a debt agreement with a bank consisting of 1) a $2.0 million five-year term loan secured by a first lien deed of trust on our Alpharetta, GA facility, bearing interest at a fixed rate of 4.5% and payable in equal monthly installments of principal and interest calculated based on a 20-year amortization schedule with a final balloon payment of approximately $1.7 million due on May 10, 2022 and 2) a line of credit of up to $1.0 million secured by a second lien deed of trust on our Alpharetta, GA facility, bearing interest at the Prime Rate published in the Wall Street Journal plus 0.25% (4.75% at December 31, 2017) and with a term ending May 10, 2018. Under the debt agreement, we must maintain a ratio of total liabilities to tangible net worth not in excess of 3 to 1 and maintain minimum liquidity of $2.0 million. At December 31, 2017, the balance of the term loan including current maturities was $2.0 million. We also had outstanding borrowings on our line of credit of $0.5 million and had the ability to borrow up to an additional $0.5 million. As of December 31, 2017, we were in compliance with our debt covenants.
| 27 |
On September 5, 2017, Strong/MDI entered into a demand credit agreement with a bank consisting of a revolving line of credit for up to CDN$3.5 million subject to a borrowing base requirement, a 20-year installment loan for up to CDN$6.0 million and a 5-year installment loan for up to CDN$500,000. Amounts outstanding under the line of credit are payable on demand and will bear interest at the prime rate established by the lender. Amounts outstanding under the installment loans will bear interest at the prime rate plus 0.5% and are payable in monthly installments, including interest, over their respective borrowing periods. The lender may also demand repayment of the installment loans at any time. The Strong/MDI credit facilities are secured by a lien on Strong/MDI’s Quebec, Canada facility and substantially all of Strong/MDI’s assets. The credit agreement requires Strong/MDI to maintain a ratio of liabilities to “effective equity” (tangible stockholders’ equity, less amounts receivable from affiliates and equity method investments) not exceeding 2 to 1, a current ratio (excluding amounts due from related parties) of at least 1.5 to 1 and minimum “effective equity” of CDN$8.0 million. There were no borrowings outstanding at December 31, 2017 on any of the Strong/MDI credit facilities, as Strong/MDI had not yet drawn on the facilities. Strong/MDI was in compliance with its debt covenants as of December 31, 2017.
Cash Flows from Operating Activities
The following table provides information that we use in analyzing our cash flows from operating activities of continuing operations (in thousands):
| 2017 | 2016 | 2015 | ||||||||||
| Net cash provided by (used in) operating activities - continuing operations | $ | 10 | $ | (92 | ) | $ | 6,427 | |||||
| Less: | ||||||||||||
| Changes in working capital | 1,053 | (4,065 | ) | 5,746 | ||||||||
| Foreign currency transaction (loss) gain | (304 | ) | (1,002 | ) | 1,612 | |||||||
| Dividends received | — | 207 | — | |||||||||
| Current income tax expense | (2,356 | ) | (2,976 | ) | (3,871 | ) | ||||||
| Net interest (expense) income | (144 | ) | 23 | 312 | ||||||||
| Other | (16 | ) | 99 | (371 | ) | |||||||
| Subtotal - reconciling items | (1,767 | ) | (7,714 | ) | 3,428 | |||||||
Operating income, excluding noncash operating expenses (non-GAAP) | $ | 1,777 | $ | 7,622 | $ | 2,999 | ||||||
Operating income, excluding noncash operating expenses, is a non-GAAP financial measure that we use only for the purpose of analyzing net cash provided by (used in) operating activities. It is defined as operating income (loss), adjusted to remove noncash operating expenses consisting of provisions for doubtful accounts, obsolete inventory and warranty, depreciation and amortization, impairment of intangible assets, loss on disposal or transfer of assets and stock-based compensation.
Net cash provided by operating activities from continuing operations was close to breakeven in 2017, as operating income, excluding noncash operating expenses of $1.8 million and favorable net changes in working capital items of $1.1 million were offset by current income tax expense (primarily Canadian) of $2.4 million, foreign currency transaction losses of $0.3 million and net interest expense of $0.1 million. The favorable net change in working capital was primarily due to a $4.9 million reduction in accounts receivable and $1.5 million reduction in inventory, partially offset by a $3.1 million reduction in accounts payable and accrued expenses and a $2.6 million reduction in deferred revenue and customer deposits.
| 28 |
Net cash used in operating activities of continuing operations was $0.1 million in 2016, as operating income, excluding noncash operating expenses of $7.6 million was offset by unfavorable changes in working capital items of $4.1 million, current income tax expense (mostly Canadian) of $3.0 million and foreign currency transaction losses of $1.0 million. The unfavorable net change in working capital was primarily due to a $3.8 million increase in accounts receivable and a $1.8 million decrease in current income taxes payable, partially offset by a $0.9 million increase in accounts payable and a $0.6 million increase in deferred revenue and customer deposits.
Net cash provided by operating activities of continuing operations was $6.4 million in 2015, due to operating income, excluding noncash operating expenses of $3.0 million, favorable net changes in working capital items of $5.7 million and foreign currency transaction gains of $1.6 million, partially offset by $3.9 million of current income tax expense (mostly Canadian). The favorable net change in working capital was primarily due to a $7.9 million reduction in accounts receivable, a $1.7 million reduction in inventory and a $1.6 million increase in current income taxes payable, partially offset by a $3.1 million reduction in accounts payable and a $1.7 million reduction in deferred revenue and customer deposits.
Cash Flows from Investing Activities
Net cash used in investing activities from continuing operations was $5.5 million in 2017. This included $3.3 million of capital expenditures and $2.5 million of investments in equity securities.
Net cash used in investing activities from continuing operations was $10.8 million in 2016. This included $7.0 million of investments in equity securities and $3.8 million of capital expenditures.
Net cash used in investing activities from continuing operations was $6.2 million in 2015. This included $6.0 million of investments in equity securities and $0.5 million of capital expenditures, offset by $0.2 million from proceeds from the sale of assets.
Cash Flows from Financing Activities
Net cash provided by financing activities was $2.1 million in 2017 due to $2.5 million of proceeds from issuance of debt, offset slightly by $0.1 million of treasury stock purchases and $0.2 million of capital lease payments.
Net cash used in financing activities of $0.3 million in 2016 included $0.2 million from purchase of treasury stock and $0.3 million from capital lease payments, partially offset by $0.1 million of proceeds from exercise of stock options. Net cash used in financing activities of $0.2 million in 2015 was primarily related to capital lease payments.
The effect of changes in foreign exchange rates increased (decreased) cash and cash equivalents from continuing operations by $0.5 million, $0.6 million, and $(1.9) million in the years ended December 31, 2017, 2016 and 2015, respectively.
Transactions with Related and Certain Other Parties
Pursuant to the proxy contest settlement agreement entered into with Fundamental Global Investors, LLC and certain of its affiliates on April 21, 2015, the Company expanded its Board of Directors to nine directors and nominated five director candidates from Fundamental Global’s slate of directors, who were elected at the 2015 Annual Meeting. Fundamental Global Investors, LLC and its affiliates hold approximately 28.7% of the Company’s outstanding shares of common stock as of December 31, 2017. Mr. D. Kyle Cerminara, the Chief Executive Officer, Co-Founder and Partner of Fundamental Global Investors, LLC, serves as our Chairman and Chief Executive Officer. We reimbursed Fundamental Global for its expenses incurred in connection with the proxy contest and settlement agreement in the amount of $178,415 in 2015. The independent members of the Board of Directors approved the reimbursement.
Our purchase of the equity securities that comprise our equity method investments were made in companies in which Fundamental Global has an ownership interest. The independent members of the Board of Directors approved these purchases and we made no payments to Fundamental Global related to these purchases. See Note 6 to the consolidated financial statements for further information on the Company’s equity method investments.
| 29 |
On April 27, 2017, we entered into a debt agreement with blueharbor bank. Our Chief Executive Officer serves on the Board of Directors of blueharbor bank. See “Liquidity and Capital Resources” above for more information about the blueharbor debt agreement. The independent members of our Board of Directors approved this agreement.
Financial Instruments and Credit Risk Concentrations
Our top ten customers accounted for approximately 53% of 2017 consolidated net revenues, including three that each individually accounted for greater than 10% of 2017 consolidated net revenues. Trade accounts receivable from our top ten customers represented approximately 39% of net consolidated receivables at December 31, 2017. While we believe our relationships with such customers are stable, most arrangements are made by purchase order and are terminable at will by either party. A significant decrease or interruption in business from our significant customers could have a material adverse effect on our business, financial condition and results of operations. We could also be adversely affected by such factors as changes in foreign currency rates and weak economic and political conditions in each of the countries in which we sell our products.
Financial instruments that potentially expose us to a concentration of credit risk principally consist of accounts receivable and notes receivable. We sell products to a large number of customers in many different geographic regions. To minimize credit concentration risk, we perform ongoing credit evaluations of our customers’ financial condition or use letters of credit.
Hedging and Trading Activities
Our primary exposure to foreign currency fluctuations pertains to our operations in Canada. In certain instances, we may enter into foreign exchange contracts to manage a portion of this risk. We do not have any trading activities that include non-exchange traded contracts at fair value.
Off Balance Sheet Arrangements and Contractual Obligations
Our off balance sheet arrangements consist principally of leasing equipment and facilities under operating leases. The future estimated payments under these arrangements are summarized below along with our other contractual obligations:
| Contractual Obligations | Total Payments | | 2018 | 2019-2020 | 2021-2022 | 2023 + | ||||||||||||||
| (in thousands) | ||||||||||||||||||||
| Long-term debt, including current maturities | $ | 2,334 | $ | 153 | $ | 306 | $ | 1,875 | $ | — | ||||||||||
| Short-term debt | 509 | 509 | — | — | — | |||||||||||||||
| Postretirement benefits | 115 | 15 | 30 | 30 | 40 | |||||||||||||||
| Capital leases | 367 | 251 | 116 | — | — | |||||||||||||||
| Operating leases | 7,444 | 1,758 | 3,242 | 2,444 | — | |||||||||||||||
| Contractual cash obligations | $ | 10,769 | $ | 2,686 | $ | 3,694 | $ | 4,349 | $ | 40 | ||||||||||
There were no other material contractual obligations other than inventory and property, plant and equipment purchases in the ordinary course of business.
Inflation
We believe that the relatively moderate rates of inflation in recent years have not had a significant impact on our net revenues or profitability. Historically, we have been able to offset any inflationary effects by either increasing prices or improving cost efficiencies.
| 30 |
Recently Issued Accounting Pronouncements
See Note 3, Summary of Significant Accounting Policies, to the consolidated financial statements for a description of recently issued accounting pronouncements.
Critical Accounting Policies and Estimates General
The following accounting policies involve judgments and estimates used in preparation of the consolidated financial statements. An accounting policy is deemed to be critical if it requires an accounting estimate to be made based on assumptions about matters that are uncertain at the time the estimate is made, and if different estimates that reasonably could have been used, or changes in the accounting estimates that are reasonably likely to occur periodically, could materially impact the consolidated financial statements.
Our accounting policies are discussed in Note 3 to the consolidated financial statements in this report. Management believes the following critical accounting policies reflect its more significant estimates and assumptions used in the preparation of the consolidated financial statements.
Revenue Recognition
We recognize revenue when all of the following circumstances are satisfied:
| ● | Persuasive evidence of an arrangement exists; | |
| ● | Delivery has occurred or services have been rendered; | |
| ● | The seller’s price to the buyer is fixed or determinable; and | |
| ● | Collectability is reasonably assured. |
If an arrangement involves multiple deliverables, the items are analyzed to determine the separate units of accounting, whether the items have value on a stand-alone basis and whether there is objective and reliable evidence of their fair values. The deliverables and timing depend upon the customer’s needs. Because the sales are so highly customized, separate sales are too infrequent to establish vendor specific objective evidence (VSOE). As a result, we use third party evidence for products and the best estimate of selling prices for other contract features. For services performed, revenue is recognized when the products have been installed and services have been rendered. Revenues from maintenance support or managed services contracts are deferred and recognized as earned ratably over the service coverage periods.
For equipment sales, revenue is generally recognized upon shipment of the product; however, there are certain instances where revenue is deferred and recognized upon delivery or customer acceptance of the product as we legally retain the risk of loss on these transactions until such time.
Costs related to revenues are recognized in the same period in which the specific revenues are recorded. Shipping and handling fees billed to customers are reported in revenue. Shipping and handling costs incurred by the Company are included in cost of sales. Estimates used in the recognition of revenues and cost of revenues include, but are not limited to, estimates for product warranties, price allowances and product returns.
Inventory Valuation
Inventories are stated at the lower of cost (first-in, first-out) or net realizable value. Our policy is to evaluate all inventory quantities for amounts on-hand that are potentially in excess of estimated usage requirements, and to write down any excess quantities to estimated net realizable value. Inherent in the estimates of net realizable values are management’s estimates related to customer demand and the development of new technology, which could make our theater and digital media products obsolete, among other items.
| 31 |
Income Taxes
Income taxes are accounted for under the asset and liability method. We use an estimate of our annual effective rate at each interim period based on the facts and circumstances at the time while the actual effective rate is calculated at year-end. Deferred tax assets and liabilities are recognized for the future tax consequences attributable to differences between the financial statement carrying amounts of existing assets and liabilities and their respective tax bases and operating loss and tax credit carryforwards. Deferred tax assets and liabilities are measured using enacted tax rates expected to apply to taxable income in the years in which those temporary differences are expected to be recovered or settled. The effect on deferred tax assets and liabilities of a change in tax rates is recognized in income in the period that includes the enactment date.
In assessing the realizability of deferred tax assets, the Company considers whether it is more likely than not that some portion or all of the deferred tax assets will not be realized. The ultimate realization of deferred tax assets is dependent upon the generation of future taxable income. The Company considers the scheduled reversal of taxable temporary differences, projected future taxable income and tax planning strategies in making this assessment. A cumulative loss in a particular tax jurisdiction in recent years is a significant piece of evidence with respect to the realizability that is difficult to overcome. Based on the available objective evidence, including recent updates to the taxing jurisdictions generating income, the Company concluded that the valuation allowance recorded against the Company’s U.S. tax jurisdiction deferred tax assets is appropriate as of December 31, 2017.
Business Combinations
The Company uses the acquisition method in accounting for acquired businesses. Under the acquisition method, the financial statements reflect the operations of an acquired business starting from the completion of the acquisition. The assets acquired and liabilities assumed are recorded at their respective estimated fair values at the date of the acquisition. Any excess of the purchase price over the estimated fair values of the identifiable net assets acquired is recorded as goodwill. Significant judgment is often required in estimating the fair value of assets acquired, particularly intangible assets. As a result, in the case of significant acquisitions we normally obtain the assistance of third-party valuation specialists in estimating fair values of tangible and intangible assets. The fair value estimates are based on available historical information and on expectations and assumptions about the future, considering the perspective of marketplace participants. While management believes those expectations and assumptions are reasonable, they are inherently uncertain. Unanticipated market or macroeconomic events and circumstances may occur, which could affect the accuracy or validity of the estimates and assumptions.
Item 7A. Quantitative and Qualitative Disclosures About Market Risk
The principal market risks affecting us are exposure to interest rates and foreign currency exchange rates. We market our products throughout the United States and the world. As a result, we could be adversely affected by such factors as changes in foreign currency rates and weak economic conditions. As a majority of our sales are currently denominated in U.S. dollars, a strengthening of the dollar can and sometimes has made our products less competitive in foreign markets.
Interest Rates—Interest rate risks from our interest related accounts such as our postretirement obligations are not deemed significant. We currently have long-term notes receivable, recorded at fair value, bearing fixed interest rates of 15% and long-term debt with a fixed interest rate of 4.5%. A change in long-term interest rates for comparable types of instruments would have the effect of us recording changes in fair value of the notes receivable through our statement of operations. We also have $500,000 borrowed on a revolving line of credit that bears variable interest at the Prime Rate published by the Wall Street Journal plus 0.25%, or 4.75% as of December 31, 2017. Changes in the Prime Rate would increase or decrease our interest expense on outstanding line of credit borrowings.
Foreign Exchange—Exposures to transactions denominated in currencies other than the entity’s functional currency are primarily related to our Canadian subsidiaries. Fluctuations in the value of foreign currencies create exposures, which can adversely affect our results of operations. From time to time, as market conditions indicate, we will enter into foreign currency contracts to manage the risks associated with forecasted transactions. A portion of our cash our Canadian subsidiary is denominated in foreign currencies, where fluctuations in exchange rates will impact our cash balances in U.S. dollar terms. A hypothetical 10% change in the value of the U.S. dollar would impact our reported cash balance by approximately $0.1 million.
Equity Price Risk—We are exposed to equity price risk related to certain of our investments in equity securities. At December 31, 2017, our carrying value of investments in equity securities aggregated $18.1 million, all of which were accounted for using the equity method. A change in the equity price of the equity method investments would result in a change in the fair value or economic value of such securities.
| 32 |
Item 8. Financial Statements and Supplementary Data
INDEX TO CONSOLIDATED FINANCIAL STATEMENTS
Individual audited financial statements of entities accounted for by the equity method qualifying as significant subsidiaries (1347 Property Insurance Holdings, Inc. and Itasca Capital Ltd.) will be filed as exhibits to a Form 10-K amendment within 90 days of the December 31, 2017 year end.
| 33 |
Report of Independent Registered Public Accounting Firm
Shareholders and Board of Directors
Ballantyne Strong, Inc.
Omaha, Nebraska
Opinion on the Consolidated Financial Statements
We have audited the accompanying consolidated balance sheets of Ballantyne Strong, Inc. (the “Company”) and subsidiaries as of December 31, 2017 and 2016, the related consolidated statements of operations and comprehensive (loss) income, stockholders’ equity, and cash flows for each of the two years in the period ended December 31, 2017, and the related notes and schedule (collectively referred to as the “consolidated financial statements”). In our opinion, the consolidated financial statements present fairly, in all material respects, the financial position of the Company and subsidiaries at December 31, 2017 and 2016, and the results of their operations and their cash flows for each of the two years in the period ended December 31, 2017, in conformity with accounting principles generally accepted in the United States of America.
We also have audited, in accordance with the standards of the Public Company Accounting Oversight Board (United States) (“PCAOB”), the Company’s internal control over financial reporting as of December 31, 2017, based on criteria established in Internal Control – Integrated Framework (2013) issued by the Committee of Sponsoring Organizations of the Treadway Commission (“COSO”) and our report dated March 15, 2018 expressed an unqualified opinion thereon.
Basis for Opinion
These consolidated financial statements are the responsibility of the Company’s management. Our responsibility is to express an opinion on the Company’s consolidated financial statements based on our audits. We are a public accounting firm registered with the PCAOB and are required to be independent with respect to the Company in accordance with the U.S. federal securities laws and the applicable rules and regulations of the Securities and Exchange Commission and the PCAOB.
We conducted our audits in accordance with the standards of the PCAOB. Those standards require that we plan and perform the audit to obtain reasonable assurance about whether the consolidated financial statements are free of material misstatement, whether due to error or fraud.
Our audits included performing procedures to assess the risks of material misstatement of the consolidated financial statements, whether due to error or fraud, and performing procedures that respond to those risks. Such procedures included examining, on a test basis, evidence regarding the amounts and disclosures in the consolidated financial statements. Our audits also included evaluating the accounting principles used and significant estimates made by management, as well as evaluating the overall presentation of the consolidated financial statements. We believe that our audits provide a reasonable basis for our opinion.
/s/ BDO USA, LLP
We have served as the Company’s auditor since 2016.
Raleigh, North Carolina
March 15, 2018
| 34 |
Report of Independent Registered Public Accounting Firm
The
Board of Directors and Stockholders
Ballantyne Strong, Inc.:
We have audited, before the effects of the adjustments applied relating to the operations that have been reclassified as discontinued operations described in Note 2, and before the effects of the adjustments applied relating to the reclassification of results between segments described in Note 17, the accompanying consolidated statements of operations, comprehensive (loss) income, stockholders’ equity, and cash flows of Ballantyne Strong, Inc. and subsidiaries (the Company) for the year ended December 31, 2015. In connection with our audit of the consolidated financial statements, we also have audited financial statement Schedule II for the related period, before the effects of the adjustments applied relating to the operations that have been reclassified as discontinued operations described in Note 2. The 2015 financial statements before the effects of the adjustments applied relating to the operations that have been reclassified as discontinued operations discussed in Note 2, and before the effects of the adjustments applied relating to the reclassification of results between segments described in Note 17 are not presented herein. These consolidated financial statements and financial statement schedule for the relating period are the responsibility of the Company’s management. Our responsibility is to express an opinion on these consolidated financial statements and financial statement schedule based on our audit.
We conducted our audit in accordance with the standards of the Public Company Accounting Oversight Board (United States). Those standards require that we plan and perform the audit to obtain reasonable assurance about whether the financial statements are free of material misstatement. An audit includes examining, on a test basis, evidence supporting the amounts and disclosures in the financial statements. An audit also includes assessing the accounting principles used and significant estimates made by management, as well as evaluating the overall financial statement presentation. We believe that our audit provide a reasonable basis for our opinion.
In our opinion, the consolidated financial statements, before the effects of the adjustments applied relating to the operations that have been reclassified as discontinued operations described in Note 2, and before the effects of the adjustments applied relating to the reclassification of results between segments described in Note 17, present fairly, in all material respects, the results of operations and cash flows of Ballantyne Strong, Inc. and subsidiaries for the year ended December 31, 2015, in conformity with U.S. generally accepted accounting principles. Also in our opinion, the related financial statement schedule for the related periods, before the effects of the adjustments applied relating to the operations that have been reclassified as discontinued operations described in Note 2 when considered in relation to the basic consolidated financial statements taken as a whole, presents fairly, in all material respects, the information set forth therein.
We were not engaged to audit, review, or apply any procedures to the adjustments to retrospectively apply the effects of the adjustments applied relating to the operations that have been reclassified as discontinued operations described in Note 2 or to retrospectively apply the effects of the adjustments applied relating to the reclassification of results between segments described in Note 17 and, accordingly, we do not express an opinion or any other form of assurance about whether such adjustments are appropriate and have been properly applied. Those adjustments were audited by a successor auditor.
/s/ KPMG LLP
Omaha, Nebraska
March 7, 2016
| 35 |
Ballantyne
Strong, Inc. and Subsidiaries
Consolidated Balance Sheets
(In thousands, except par values)
| December 31, 2017 | December 31, 2016 | |||||||
| Assets | ||||||||
| Current assets: | ||||||||
| Cash and cash equivalents | $ | 4,870 | $ | 7,596 | ||||
| Accounts receivable (net of allowance for doubtful accounts of $1,877 and $1,097, respectively) | 10,766 | 16,316 | ||||||
| Inventories, net | 4,821 | 6,563 | ||||||
| Recoverable income taxes | 495 | 672 | ||||||
| Other current assets | 1,290 | 1,746 | ||||||
| Current assets held for sale | — | 188 | ||||||
| Total current assets | 22,242 | 33,081 | ||||||
| Property, plant and equipment (net of accumulated depreciation of $8,780 and $7,066 respectively) | 10,826 | 11,187 | ||||||
| Equity method investments | 18,053 | 13,098 | ||||||
| Intangible assets, net | 3,972 | 2,357 | ||||||
| Goodwill | 952 | 889 | ||||||
| Notes receivable | 2,815 | 1,669 | ||||||
| Deferred income taxes | — | 84 | ||||||
| Other assets | 154 | 74 | ||||||
| Total assets | $ | 59,014 | $ | 62,439 | ||||
| Liabilities and Stockholders’ Equity | ||||||||
| Current liabilities: | ||||||||
| Accounts payable | $ | 3,425 | $ | 5,175 | ||||
| Accrued expenses | 3,071 | 4,097 | ||||||
| Short-term debt | 500 | — | ||||||
| Current portion of long-term debt | 65 | — | ||||||
| Deferred revenue and customer deposits | 1,619 | 4,211 | ||||||
| Income tax payable | — | 108 | ||||||
| Current liabilities held for sale | — | 57 | ||||||
| Total current liabilities | 8,680 | 13,648 | ||||||
| Long-term debt, net of current portion and debt issuance costs | 1,870 | — | ||||||
| Deferred revenue and customer deposits, net of current portion | 1,207 | 1,226 | ||||||
| Deferred income taxes | 2,816 | 1,841 | ||||||
| Other accrued expenses, net of current portion | 319 | 570 | ||||||
| Total liabilities | 14,892 | 17,285 | ||||||
| Stockholders’ equity: | ||||||||
| Preferred stock, par value $.01 per share; authorized 1,000 shares, none outstanding | — | — | ||||||
| Common stock, par value $.01 per share; authorized 25,000 shares; issued 17,216 and 17,047 shares at December 31, 2017 and 2016, respectively; 14,422 and 14,268 shares outstanding at December 31, 2017 and 2016, respectively | 169 | 169 | ||||||
| Additional paid-in capital | 40,565 | 39,758 | ||||||
| Accumulated other comprehensive income (loss): | ||||||||
| Foreign currency translation | (4,048 | ) | (5,709 | ) | ||||
| Postretirement benefit obligations | 99 | 97 | ||||||
| Unrealized gain on available-for-sale securities of equity method investment | 353 | 136 | ||||||
| Retained earnings | 25,570 | 29,187 | ||||||
| 62,708 | 63,638 | |||||||
| Less
2,794 and 2,779 of common shares in treasury, at cost at December 31, 2017 and 2016, respectively | (18,586 | ) | (18,484 | ) | ||||
| Total stockholders’ equity | 44,122 | 45,154 | ||||||
| Total liabilities and stockholders’ equity | $ | 59,014 | $ | 62,439 | ||||
See accompanying notes to consolidated financial statements.
| 36 |
Ballantyne Strong, Inc. and Subsidiaries
Consolidated Statements of Operations
(In thousands, except per share amounts)
| Years Ended December 31, | ||||||||||||
| 2017 | 2016 | 2015 | ||||||||||
| Net product sales | $ | 47,544 | $ | 54,391 | $ | 55,166 | ||||||
| Net service revenues | 25,102 | 21,863 | 22,893 | |||||||||
| Total net revenues | 72,646 | 76,254 | 78,059 | |||||||||
| Cost of products sold | 35,446 | 42,338 | 46,517 | |||||||||
| Cost of services | 18,266 | 12,760 | 14,830 | |||||||||
| Total cost of revenues | 53,712 | 55,098 | 61,347 | |||||||||
| Gross profit | 18,934 | 21,156 | 16,712 | |||||||||
| Selling and administrative expenses: | ||||||||||||
| Selling | 5,417 | 4,612 | 4,913 | |||||||||
| Administrative | 16,121 | 12,262 | 15,582 | |||||||||
| Total selling and administrative expenses | 21,538 | 16,874 | 20,495 | |||||||||
| Loss on sale or disposal of assets | (210 | ) | (118 | ) | (424 | ) | ||||||
| (Loss) income from operations | (2,814 | ) | 4,164 | (4,207 | ) | |||||||
| Other income (expense): | ||||||||||||
| Interest income | 9 | 70 | 368 | |||||||||
| Interest expense | (153 | ) | (47 | ) | (56 | ) | ||||||
| Fair value adjustment to notes receivable | 1,146 | — | (1,595 | ) | ||||||||
| Foreign currency transaction (loss) gain | (304 | ) | (1,002 | ) | 1,612 | |||||||
| Change in value of marketable securities | — | (34 | ) | 117 | ||||||||
| Excess distribution from joint venture | — | 502 | — | |||||||||
| Other (expense) income, net | (16 | ) | 118 | (21 | ) | |||||||
| Total other income (expense) | 682 | (393 | ) | 425 | ||||||||
| (Loss)
earnings before income taxes and equity method investment income | (2,132 | ) | 3,771 | (3,782 | ) | |||||||
| Income tax expense | 3,418 | 3,019 | 13,038 | |||||||||
| Equity method investment income | 1,958 | 117 | 96 | |||||||||
| Net (loss) earnings from continuing operations | (3,592 | ) | 869 | (16,724 | ) | |||||||
| Net loss from discontinued operations, net of tax | (25 | ) | (1,277 | ) | (743 | ) | ||||||
| Net loss | $ | (3,617 | ) | $ | (408 | ) | $ | (17,467 | ) | |||
| Net (loss) earnings per share - basic | ||||||||||||
| Net (loss) earnings from continuing operations | $ | (0.25 | ) | $ | 0.06 | $ | (1.19 | ) | ||||
| Net loss from discontinued operations | (0.00 | ) | (0.09 | ) | (0.05 | ) | ||||||
| Net loss | (0.25 | ) | (0.03 | ) | (1.24 | ) | ||||||
| Net (loss) earnings per share - diluted | ||||||||||||
| Net (loss) earnings from continuing operations | $ | (0.25 | ) | $ | 0.06 | $ | (1.19 | |||||
| Net loss from discontinued operations | (0.00 | ) | (0.09 | ) | (0.05 | ) | ||||||
| Net loss | (0.25 | ) | (0.03 | ) | (1.24 | ) | ||||||
See accompanying notes to consolidated financial statements.
| 37 |
Ballantyne Strong, Inc. and Subsidiaries
Consolidated Statements of Comprehensive (Loss) Income
(In thousands)
| Years Ended December 31, | ||||||||||||
| 2017 | 2016 | 2015 | ||||||||||
| Net loss | $ | (3,617 | ) | $ | (408 | ) | $ | (17,467 | ) | |||
| Adjustment to postretirement benefit obligation | ||||||||||||
| Prior service credit | (24 | ) | (24 | ) | (24 | ) | ||||||
| Net actuarial gain (loss) | 26 | 47 | (41 | ) | ||||||||
| Total adjustment to postretirement benefit obligation | 2 | 23 | (65 | ) | ||||||||
| Unrealized
gain on available-for-sale securities of equity method investments, net of tax | 217 | 136 | — | |||||||||
| Currency translation adjustment: | ||||||||||||
| Unrealized net change arising during period | 1,661 | 849 | (3,904 | ) | ||||||||
| Reclassification adjustment for sale of foreign subsidiary | — | (329 | ) | — | ||||||||
| Total other comprehensive income (loss) | 1,880 | 679 | (3,969 | ) | ||||||||
| Comprehensive (loss) income | $ | (1,737 | ) | $ | 271 | $ | (21,436 | ) | ||||
See accompanying notes to consolidated financial statements.
| 38 |
Ballantyne Strong, Inc. and Subsidiaries
Consolidated Statements of Stockholders’ Equity
Years Ended December 31, 2017, 2016 and 2015
(In thousands)
| Common
Stock | Additional Paid-In Capital | Retained Earnings | Treasury Stock | Accumulated Other Comprehensive Income (Loss) | | Total
Stockholders’ Equity | ||||||||||||||||||
| Balance at December 31, 2014 | $ | 168 | $ | 38,657 | $ | 47,062 | $ | (18,239 | ) | $ | (2,186 | ) | $ | 65,462 | ||||||||||
| Net loss | — | — | (17,467 | ) | — | — | (17,467 | ) | ||||||||||||||||
| Net other comprehensive loss | — | — | — | — | (3,969 | ) | (3,969 | ) | ||||||||||||||||
| Treasury share purchase of 3 shares | — | — | — | (15 | ) | — | (15 | ) | ||||||||||||||||
| Issuance
of 116 shares of common stock under the restricted stock plans | 1 | (1 | ) | — | — | — | — | |||||||||||||||||
| Stock-based compensation expense | — | 501 | — | — | — | 501 | ||||||||||||||||||
| Balance at December 31, 2015 | 169 | 39,157 | 29,595 | (18,254 | ) | (6,155 | ) | 44,512 | ||||||||||||||||
| Net loss | — | — | (408 | ) | — | — | (408 | ) | ||||||||||||||||
| Net other comprehensive income | — | — | — | — | 679 | 679 | ||||||||||||||||||
| Treasury purchase of 45 shares | — | — | — | (230 | ) | — | (230 | ) | ||||||||||||||||
| Issuance of 43 shares of common stock under the restricted stock plans | — | — | — | — | — | — | ||||||||||||||||||
| Stock-based compensation expense | — | 466 | — | — | — | 466 | ||||||||||||||||||
| Proceeds from exercise of stock options | — | 135 | — | — | — | 135 | ||||||||||||||||||
| Balance at December 31, 2016 | 169 | 39,758 | 29,187 | (18,484 | ) | (5,476 | ) | 45,154 | ||||||||||||||||
| Net loss | — | — | (3,617 | ) | — | — | (3,617 | ) | ||||||||||||||||
| Net other comprehensive income | — | — | — | — | 1,880 | 1,880 | ||||||||||||||||||
| Treasury share purchase of 15 shares | — | — | — | (102 | ) | — | (102 | ) | ||||||||||||||||
| Issuance
of 85 shares of common stock under the restricted stock plans | — | — | — | — | — | — | ||||||||||||||||||
| Stock-based compensation expense | — | 736 | — | — | — | 736 | ||||||||||||||||||
| Proceeds from exercise of stock options | — | 71 | — | — | — | 71 | ||||||||||||||||||
| Balance at December 31, 2017 | $ | 169 | $ | 40,565 | $ | 25,570 | $ | (18,586 | ) | $ | (3,596 | ) | $ | 44,122 | ||||||||||
See accompanying notes to consolidated financial statements.
| 39 |
Ballantyne Strong, Inc. and Subsidiaries
Consolidated Statements of Cash Flows
(In thousands)
| Years Ended December 31, | ||||||||||||
| 2017 | 2016 | 2015 | ||||||||||
| Cash flows from operating activities: | ||||||||||||
| Net loss | $ | (3,617 | ) | $ | (408 | ) | $ | (17,467 | ) | |||
| Net loss from discontinued operations, net of tax | (25 | ) | (1,277 | ) | (743 | ) | ||||||
| Net (loss) earnings from continuing operations | (3,592 | ) | 869 | (16,724 | ) | |||||||
| Adjustments to reconcile net (loss) earnings from continuing operations to net cash used in operating activities: | ||||||||||||
| Provision for doubtful accounts | 822 | 21 | 1,065 | |||||||||
| Provision for obsolete inventory | 347 | 341 | 1,713 | |||||||||
| Provision for warranty | 295 | 325 | 562 | |||||||||
| Depreciation and amortization | 2,140 | 2,187 | 2,303 | |||||||||
| Impairment of intangible assets | 41 | — | 638 | |||||||||
| Fair value adjustment to notes receivable | (1,146 | ) | — | 1,595 | ||||||||
| Excess distribution from joint venture | — | (502 | ) | — | ||||||||
| Equity method investment income | (1,958 | ) | (117 | ) | (96 | ) | ||||||
| Unrealized loss (gain) on marketable securities | — | 34 | (117 | ) | ||||||||
| Loss on disposal or transfer of assets | 210 | 118 | 424 | |||||||||
| Deferred income taxes | 1,062 | 24 | 8,817 | |||||||||
| Stock-based compensation expense | 736 | 466 | 501 | |||||||||
| Dividends received | — | 207 | — | |||||||||
| Changes in operating assets and liabilities: | ||||||||||||
| Accounts receivable | 4,887 | (3,758 | ) | 7,876 | ||||||||
| Inventories | 1,508 | 329 | 1,687 | |||||||||
| Other current assets | 300 | (378 | ) | (325 | ) | |||||||
| Accounts payable | (1,687 | ) | 931 | (3,085 | ) | |||||||
| Accrued expenses | (1,371 | ) | (79 | ) | (221 | ) | ||||||
| Deferred revenue and customer deposits | (2,630 | ) | 599 | (1,670 | ) | |||||||
| Current income taxes | 96 | (1,826 | ) | 1,620 | ||||||||
| Other assets | (50 | ) | 117 | (136 | ) | |||||||
| Net cash flows provided by (used in) operating activities - continuing operations | 10 | (92 | ) | 6,427 | ||||||||
| Net cash flows (used in) provided by operating activities - discontinued operations | (123 | ) | (3,370 | ) | 1,554 | |||||||
| Net cash (used in) provided by operating activities | (113 | ) | (3,462 | ) | 7,981 | |||||||
| Cash flows from investing activities: | ||||||||||||
| Purchase of equity securities | (2,525 | ) | (7,048 | ) | (5,983 | ) | ||||||
| Dividends received from investee in excess of cumulative earnings | 253 | — | — | |||||||||
| Capital expenditures | (3,275 | ) | (3,762 | ) | (458 | ) | ||||||
| Proceeds from sale of assets | — | — | 220 | |||||||||
| Net cash flows used in investing activities - continuing operations | (5,547 | ) | (10,810 | ) | (6,221 | ) | ||||||
| Net cash flows provided by investing activities - discontinued operations | 134 | 297 | 16 | |||||||||
| Net cash used in investing activities | (5,413 | ) | (10,513 | ) | (6,205 | ) | ||||||
(Continued on following page)
See accompanying notes to consolidated financial statements.
| 40 |
Ballantyne Strong, Inc. and Subsidiaries
Consolidated Statements of Cash Flows – (Continued)
(In thousands)
| Cash flows from financing activities: | ||||||||||||
| Proceeds from issuance of long-term debt | $ | 2,000 | $ | — | $ | — | ||||||
| Proceeds from issuance of short-term debt | 500 | — | — | |||||||||
| Payment of debt issuance costs | (49 | ) | — | — | ||||||||
| Principal payments on long-term debt | (33 | ) | — | — | ||||||||
| Purchase of treasury stock | (102 | ) | (230 | ) | (15 | ) | ||||||
| Proceeds from exercise of stock options | 71 | 135 | — | |||||||||
| Payments on capital lease obligations | (240 | ) | (268 | ) | (200 | ) | ||||||
| Excess tax benefits from stock-based compensation | — | 45 | 12 | |||||||||
| Net cash provided by (used in) financing activities | 2,147 | (318 | ) | (203 | ) | |||||||
| Effect
of exchange rate changes on cash and cash equivalents - continuing operations | 478 | 583 | (1,867 | ) | ||||||||
| Effect
of exchange rate changes on cash and cash equivalents - discontinued operations | — | (589 | ) | (127 | ) | |||||||
| Net decrease in cash and cash equivalents | (2,901 | ) | (14,299 | ) | (421 | ) | ||||||
| Discontinued operations activity included above: | ||||||||||||
| Add: Cash balance included in assets held for sale at beginning of period | 175 | 4,208 | 3,190 | |||||||||
| Less: Cash balance included in assets held for sale at end of period | — | (175 | ) | (4,208 | ) | |||||||
| Cash and cash equivalents at beginning of period | 7,596 | 17,862 | 19,301 | |||||||||
| Cash and cash equivalents at end of period | $ | 4,870 | $ | 7,596 | $ | 17,862 | ||||||
| Supplemental disclosure of cash paid for: | ||||||||||||
| Interest | $ | 152 | $ | 46 | $ | 45 | ||||||
| Income taxes | $ | 2,830 | $ | 3,378 | $ | 2,272 | ||||||
| Supplemental disclosure of non-cash investing and financing activities: | ||||||||||||
| Capital
lease obligations for property and equipment | $ | — | $ | — | $ | 752 |
See accompanying notes to consolidated financial statements.
| 41 |
Ballantyne Strong, Inc. and Subsidiaries
Notes to the Consolidated Financial Statements
(In thousands, except share and per share amounts)
1. Basis of Presentation
Business Description
Ballantyne Strong, Inc. (“Ballantyne” or the “Company”), a Delaware corporation, is a holding company with diverse business activities focused on serving the cinema, retail, financial, advertising and government markets. The Company, and its wholly owned subsidiaries Strong Technical Services, Inc., Strong/MDI Screen Systems, Inc. (“Strong/MDI”) and Convergent Media Systems Corporation design, integrate and install technology solutions for a broad range of applications; develop and deliver out-of-home messaging, advertising and communications; manufacture projection screens; and provide managed services including monitoring of networked equipment to our customers.
Principles of Consolidation
The consolidated financial statements include the accounts of the Company and all majority owned and controlled domestic and foreign subsidiaries. All significant intercompany balances and transactions have been eliminated in consolidation.
Reclassification
During 2017, the Company began classifying software in development as an intangible asset rather than property, plant and equipment, to be consistent with its classification of software assets in service. Accordingly, approximately $0.5 million of software in development at December 31, 2016 was reclassified to intangible assets from property, plant and equipment on the consolidated balance sheet to conform to the current period presentation. This reclassification had no effect on the Company’s reported results of operations, comprehensive loss or cash flows.
Use of Management Estimates
The preparation of consolidated financial statements in conformity with U.S. generally accepted accounting principles requires management to make estimates and assumptions that affect the reported amounts of assets and liabilities and disclosure of contingent assets and liabilities at the date of the consolidated financial statements and the reported amounts of revenues and expenses during the reporting period. Actual results and changes in facts and circumstances may alter such estimates and affect results of operations and financial position in future periods.
2. Discontinued Operations
In 2016, the Company’s Board of Directors approved a plan to pursue a sale of the operations conducted by its subsidiaries Strong Westrex (Beijing) Technology Inc. (“SWBTI”) and Strong Westrex, Inc. (“SWI”) (collectively, the “China Operations”), which were historically included in the Cinema segment. The purpose of the plan was to focus the efforts of the Company on the business units that have opportunities for higher return on invested capital. The results of the China Operations are reported as discontinued operations for all periods presented. The assets and liabilities of the China Operations have been reclassified as assets and liabilities held for sale in the consolidated balance sheets for all periods presented.
SWBTI was sold in November 2016 for total proceeds of $0.4 million. The Company recorded a loss on disposal of SWBTI of approximately $0.6 million, which is included in net loss from discontinued operations.
In May 2017, the Company sold the operational assets of SWI for total proceeds of $60 thousand. As a result of this sale, the Company recorded a gain on disposal of discontinued operations of approximately $50 thousand, which is included in net loss from discontinued operations.
| 42 |
The summary comparative financial results of discontinued operations were as follows (in thousands):
| Years ended December 31, | ||||||||||||
| 2017 | 2016 | 2015 | ||||||||||
| Total net revenues | $ | 24 | $ | 6,864 | $ | 14,769 | ||||||
| Total cost of revenues | 48 | 6,351 | 13,896 | |||||||||
| Total selling and administrative expenses | 53 | 1,131 | 1,622 | |||||||||
| Loss from operations of discontinued operations | (77 | ) | (618 | ) | (749 | ) | ||||||
| Loss before income taxes | (25 | ) | (1,163 | ) | (780 | ) | ||||||
| Income tax expense (benefit) | — | 114 | (37 | ) | ||||||||
| Net loss from discontinued operations, net of tax | $ | (25 | ) | $ | (1,277 | ) | $ | (743 | ) | |||
Depreciation and amortization related to discontinued operations was immaterial in 2017, 2016 and 2015. Capital expenditures related to discontinued operations were immaterial in 2017, 2016 and 2015.
3. Summary of Significant Accounting Policies
Revenue Recognition
The Company recognizes revenue when all of the following circumstances are satisfied:
| ● | Persuasive evidence of an arrangement exists; | |
| ● | Delivery has occurred or services have been rendered; | |
| ● | The seller’s price to the buyer is fixed or determinable; and | |
| ● | Collectability is reasonably assured. |
If an arrangement involves multiple deliverables, the items are analyzed to determine the separate units of accounting, whether the items have value on a stand-alone basis and whether there is objective and reliable evidence of their fair values. The deliverables and timing depend upon the customer’s needs. Because the sales are so highly customized, separate sales are too infrequent in most cases to establish vendor specific objective evidence (VSOE). As a result, the Company uses third party evidence for products and the best estimate of selling prices for other contract features. For services performed, revenue is recognized when the products have been installed and services have been rendered. Revenues from maintenance support or managed services contracts are deferred and recognized as earned over the service coverage periods.
For equipment sales, revenue is generally recognized upon shipment of the product; however, there are certain instances where revenue is deferred and recognized upon delivery or customer acceptance of the product as the Company legally retains the risk of loss on these transactions until such time.
Costs related to revenues are recognized in the same period in which the specific revenues are recorded. Shipping and handling fees billed to customers are reported in revenue. Shipping and handling costs incurred by the Company are included in cost of sales. Estimates used in the recognition of revenues and cost of revenues include, but are not limited to, estimates for product warranties, price allowances and product returns.
Cash and Cash Equivalents
All short-term, highly liquid financial instruments are classified as cash equivalents in the consolidated balance sheets and statements of cash flows. Generally, these instruments have maturities of three months or less from date of purchase. As of December 31, 2017, $3.6 million of the $4.9 million in cash and cash equivalents was held by our foreign subsidiaries.
| 43 |
Equity Method Investments
We apply the equity method of accounting to investments when we have significant influence, but not controlling interest in the investee. Judgment regarding the level of influence over each equity method investment includes considering key factors such as ownership interest, representation on the board of directors, participation in policy-making decisions and material intercompany transactions. The Company’s proportionate share of the net income (loss) resulting from these investments is reported under the line item captioned “equity method investment income” in our Consolidated Statements of Operations. The carrying value of our equity method investments is reported in equity method investments in the Consolidated Balance Sheets. The Company’s equity method investments are reported at cost and adjusted each period for the Company’s share of the investee’s income or loss and dividend paid, if any. The Company’s share of the investee’s income or loss is recorded on a one quarter lag for all equity method investments. Beginning in 2017, the Company classifies distributions received from equity method investments using the cumulative earnings approach on the Consolidated Statements of Cash Flows. Prior to 2017, dividends received from equity method investees were classified as operating cash flows. The Company assesses investments for impairment whenever events or changes in circumstances indicate that the carrying value of an investment may not be recoverable. The Company did not record any impairments related to its investments in 2017, 2016 or 2015. Note 6 contains additional information on our equity method investments, which are held by our Cinema segment.
Accounts and Notes Receivable
Trade accounts receivable are recorded at the invoiced amount and do not bear interest. The Company determines the allowance for doubtful accounts based on several factors, including overall customer credit quality, historical write-off experience and a specific analysis that projects the ultimate collectability of the account. As such, these factors may change over time causing the allowance level and bad debt expense to be adjusted accordingly.
The Company elected the fair value option on its notes receivable. Notes receivable are recorded at estimated fair value and accrue interest at 15%.
Past due accounts are written off for accounts and notes receivable when our efforts have been unsuccessful in collecting amounts due.
Inventories
Inventories are stated at the lower of cost (first-in, first-out) or net realizable value in 2017 and at lower of cost (first-in, first-out) or market for periods prior to 2017. Inventories include appropriate elements of material, labor and manufacturing overhead. Inventory balances are net of reserves on slow moving or obsolete inventory based on management’s review of inventories on hand compared to estimated future usage and sales, technological changes and product pricing.
Business Combinations
The Company uses the acquisition method of accounting for acquired businesses. Under the acquisition method, the financial statements reflect the operations of an acquired business starting from the completion of the acquisition. The assets acquired and liabilities assumed are recorded at their respective estimated fair values at the date of the acquisition. Any excess of the purchase price over the estimated fair values of the identifiable net assets acquired is recorded as goodwill. Significant judgment is often required in estimating the fair value of assets acquired, particularly intangible assets. As a result, in the case of significant acquisitions the Company normally obtains the assistance of third-party valuation specialists in estimating fair values of tangible and intangible assets. The fair value estimates are based on available historical information and on expectations and assumptions about the future, considering the perspective of marketplace participants. While management believes those expectations and assumptions are reasonable, they are inherently uncertain. Unanticipated market or macroeconomic events and circumstances may occur, which could affect the accuracy or validity of the estimates and assumptions.
| 44 |
Intangible Assets
The Company evaluates its intangible assets for impairment when there is evidence that events or circumstances indicate that the carrying amount of these assets may not be recoverable. Intangible assets with definite lives are amortized over their respective estimated useful lives to their estimated residual values. Significant judgments and assumptions are required in the impairment evaluations.
Goodwill
Goodwill is not amortized and is tested for impairment at least annually, or whenever events or changes in circumstances indicate the carrying amount of the asset may be impaired. Significant judgment is involved in determining if an indicator of impairment has occurred. The Company may consider indicators such as deterioration in general economic conditions, adverse changes in the markets in which the reporting unit operates, increases in input costs that have negative effects on earnings and cash flows, or a trend of negative or declining cash flows over multiple periods, among others. The fair value that could be realized in an actual transaction may differ from that used to evaluate the impairment of goodwill.
The Company may first review for goodwill impairment by assessing qualitative factors to determine whether any impairment may exist. If the Company believes, as a result of the qualitative assessment, that it is more likely than not that the fair value of a reporting unit is less than its carrying amount, a quantitative two-step test is required; otherwise, no further testing is required. However, the Company also may elect not to perform the qualitative assessment and, instead, proceed directly to the quantitative impairment test. Under the first step of the quantitative test, the fair value of each reporting unit is compared with its carrying value (including goodwill). If the fair value of the reporting unit exceeds its carrying value, step two is not performed. If the fair value of the reporting unit is less than its carrying value, an indication of goodwill impairment exists for the reporting unit and step two of the quantitative impairment test (measurement) is performed. Under step two, an impairment loss is recognized for any excess of the carrying amount of the reporting unit’s goodwill over the fair value of that goodwill. The fair value of goodwill is determined by allocating the fair value of the reporting unit in a manner similar to a purchase price allocation and the residual fair value after this allocation is the fair value of the reporting unit goodwill.
Goodwill was recorded in connection with the acquisition of Peintures Elite, Inc. in 2013. A qualitative assessment was performed for the year ended December 31, 2017 and it was determined that no events had occurred since the acquisition that would indicate an impairment was more likely than not.
Property, Plant and Equipment
Significant expenditures for the replacement or expansion of property, plant and equipment are capitalized. Depreciation of property, plant and equipment is provided over the estimated useful lives of the respective assets using the straight-line method. For financial reporting purposes, assets are depreciated over the estimated useful lives of 20 years for buildings and improvements, the lesser of the lease term or the estimated useful life for leasehold improvements, 3 to 10 years for machinery and equipment, 7 years for furniture and fixtures and 3 years for computers and accessories. The Company generally uses accelerated methods of depreciation for income tax purposes. The Company reviews long-lived assets for impairment whenever events or changes in circumstances indicate that the carrying amount of an asset may not be recoverable. The recoverability of property, plant and equipment is based on management’s estimates of future undiscounted cash flows and these estimates may vary due to a number of factors, some of which may be outside of management’s control. To the extent that the Company is unable to achieve management’s forecasts of future income, it may become necessary to record impairment losses for any excess of the net book value of property, plant and equipment over their fair value. During 2017, the Company recorded an impairment charge of $0.2 million in loss on disposal of assets related to a group of assets used exclusively for one customer in the Digital Media segment after the Company determined the carrying amount of the assets was not recoverable.
The Company incurs maintenance costs on all of its major equipment. Repair and maintenance costs are expensed as incurred.
| 45 |
Income Taxes
Income taxes are accounted for under the asset and liability method. The Company uses an estimate of its annual effective rate at each interim period based on the facts and circumstances at the time while the actual effective rate is calculated at year-end. Deferred tax assets and liabilities are recognized for the future tax consequences attributable to differences between the financial statement carrying amounts of existing assets and liabilities and their respective tax bases and operating loss and tax credit carryforwards. Deferred tax assets and liabilities are measured using enacted tax rates expected to apply to taxable income in the years in which those temporary differences are expected to be recovered or settled. The effect on deferred tax assets and liabilities of a change in tax rates is recognized in income in the period that includes the enactment date. In assessing whether the deferred tax assets are realizable, management considers whether it is more likely than not that some portion or all of the deferred tax assets will not be realized.
The Company’s uncertain tax positions are evaluated in a two-step process, whereby 1) the Company determines whether it is more likely than not that the tax positions will be sustained based on the technical merits of the position and 2) for those tax positions that meet the more likely than not recognition threshold, the Company would recognize the largest amount of tax benefit that is greater than fifty percent likely to be realized upon ultimate settlement with the related tax authority. The Company accrues interest and penalties related to uncertain tax positions in the Consolidated Statements of Operations as income tax expense.
Other Taxes
Sales taxes assessed by governmental authorities, including sales, use and excise taxes, are recorded on a net basis. Such taxes are excluded from revenues and are shown as a liability on the balance sheet until remitted to the appropriate taxing authorities.
Research and Development
Research and development related costs are charged to operations in the period incurred. Such costs were immaterial for the years ended December 31, 2017 and 2016 and amounted to approximately $0.1 million for the year ended December 31, 2015.
Advertising Costs
Advertising and promotional costs are expensed as incurred and amounted to approximately $0.6 million for each of the years ended December 31, 2017, 2016 and 2015.
Fair Value of Financial and Derivative Instruments
Assets and liabilities measured at fair value are categorized into a fair value hierarchy based upon the observability of inputs to the valuation of an asset or liability as of the measurement date. Inputs refer broadly to the assumptions that market participants would use in pricing the asset or liability, including assumptions about risk. The categorization within the valuation hierarchy is based upon the lowest level of input that is significant to the fair value measurement. Financial assets and liabilities carried at fair value are classified and disclosed in one of the following three categories:
| ● | Level 1 — | inputs to the valuation techniques are quoted prices in active markets for identical assets or liabilities |
| ● | Level 2 — | inputs to the valuation techniques are other than quoted prices but are observable for the assets or liabilities, either directly or indirectly |
| ● | Level 3 — | inputs to the valuation techniques are unobservable for the assets or liabilities |
The following tables present the Company’s financial assets and liabilities measured at fair value based upon the level within the fair value hierarchy in which the fair value measurements fall, as of December 31, 2017 and 2016.
| 46 |
Fair values measured on a recurring basis at December 31, 2017 (in thousands):
| Level 1 | Level 2 | Level 3 | Total | |||||||||||||
| Cash and cash equivalents | $ | 4,870 | $ | — | $ | — | $ | 4,870 | ||||||||
| Notes receivable | — | — | 2,815 | 2,815 | ||||||||||||
| Total | $ | 4,870 | $ | — | $ | 2,815 | $ | 7,685 | ||||||||
Fair values measured on a recurring basis at December 31, 2016 (in thousands):
| Level 1 | Level 2 | Level 3 | Total | |||||||||||||
| Cash and cash equivalents | $ | 7,596 | $ | — | $ | — | $ | 7,596 | ||||||||
| Notes receivable | — | — | 1,669 | 1,669 | ||||||||||||
| Total | $ | 7,596 | $ | — | $ | 1,669 | $ | 9,265 | ||||||||
Quantitative information about the Company’s level 3 fair value measurements at December 31, 2017 is set forth below (dollars in thousands):
| Fair value at 12/31/17 | Valuation technique | Unobservable input | Value | ||||||||
| Notes receivable | $ | 2,815 | Discounted cash flow | Default percentage | 46% | ||||||
| Discount rate | 18% | ||||||||||
During 2011, the Company entered into certain unsecured notes receivable arrangements with CDF2 Holdings, LLC pertaining to the sale and installation of digital projection equipment. The notes receivable accrue interest at a rate of 15% per annum. Interest not paid in any particular year is added to the principal and also accrues interest at 15%. The notes receivable are recorded at estimated fair value. In order to estimate the fair value, the Company reviews the financial position and estimated cash flows of the debtor of the notes receivable. During 2017, the Company obtained new information regarding the ability of the debtor to repay its obligation and updated its estimated future cash flow assumptions. This resulted in an increase to the fair value of the notes receivable of $1.1 million recorded in earnings during the year ended December 31, 2017. There was no adjustment to the estimated fair value of the notes receivable during the year ended December 31, 2016.
The significant unobservable inputs used in the fair value measurement of the Company’s note receivable are discount rate and percentage of default. Significant increases (decreases) in any of these inputs in isolation would result in a significantly lower (higher) fair value measurement.
The following table reconciles the beginning and ending balance of the Company’s notes receivable at fair value (in thousands):
| 2017 | 2016 | 2015 | ||||||||||
| Notes receivable balance, beginning of period | $ | 1,669 | $ | 1,669 | $ | 2,985 | ||||||
| Interest income accrued | — | — | 279 | |||||||||
| Fair value adjustment | 1,146 | — | (1,595 | ) | ||||||||
| Notes receivable balance, end of period | $ | 2,815 | $ | 1,669 | $ | 1,669 | ||||||
The Company’s short-term and long-term debt is recorded at historical cost. As of December 31, 2017, the Company’s long-term debt, including current maturities, had a carrying value of $1.97 million. Based on discounted cash flows using current quoted interest rates (Level 2 of the fair value hierarchy), the estimated fair value at December 31, 2017 was $1.93 million.
| 47 |
The carrying values of all other financial assets and liabilities, including accounts receivable, accounts payable, accrued expenses and short-term debt reported in the consolidated balance sheets equal or approximate their fair values due to the short-term nature of these instruments. Based on quoted market prices, the market value of the Company’s equity method investments was $15.3 million at December 31, 2017 (see Note 6).
All non-financial assets that are not recognized or disclosed at fair value in the financial statements on a recurring basis, which include non-financial long-lived assets, are measured at fair value in certain circumstances (for example, when there is evidence of impairment). During 2017, the Company recorded an impairment charge of $0.2 million related to a group of assets used exclusively for one customer in the Digital Media segment after the Company determined the carrying amount of the assets was not recoverable, and adjusted the carrying amount of the assets at December 31, 2017 to $0. The Company did not have any other significant non-recurring measurements of non-financial assets or liabilities during 2017. During 2015, the Company recorded an impairment charge of $0.6 million to adjust the fair value of certain software intangible assets to $0.
(Loss) Earnings Per Common Share
Basic (loss) earnings per share have been computed on the basis of the weighted average number of shares of common stock outstanding. Diluted earnings per share have been computed on the basis of the weighted average number of shares of common stock outstanding after giving effect to potential common shares from dilutive stock options and certain non-vested shares of restricted stock. The following table provides the reconciliation between average shares used to compute basic and diluted (loss) earnings per share for the three years ended December 31 (in thousands):
| 2017 | 2016 | 2015 | ||||||||||
| Weighted average shares outstanding: | ||||||||||||
| Basic weighted average shares outstanding | 14,251 | 14,233 | 14,135 | |||||||||
| Dilutive effect of stock options and certain non-vested shares of restricted stock | — | 95 | — | |||||||||
| Diluted weighted average shares outstanding | 14,251 | 14,328 | 14,135 | |||||||||
Options to purchase 510,000, 407,000 and 419,025 shares of common stock were outstanding as of December 31, 2017, 2016 and 2015, respectively, but were not included in the computation of diluted earnings per share as the option’s exercise price was greater than the average market price of the common shares for the respective periods. An additional 141,166, 95,244 and 126,148 common stock equivalents related to options and restricted stock units were excluded for the years ended December 31, 2017, 2016 and 2015, respectively, as their inclusion would be anti-dilutive, thereby decreasing the net losses per share.
Stock Compensation Plans
The Company recognizes compensation expense for all stock-based payment awards made to employees and directors based on estimated fair values on the date of grant. The Company uses the straight-line amortization method over the vesting period of the awards. The Company has historically issued shares upon exercise of stock options or vesting of restricted stock from new stock issuances. The Company estimates the fair value of restricted stock awards based upon the market price of the underlying common stock on the date of grant. The fair value of stock options granted is calculated using the Black-Scholes option pricing model. No stock-based compensation cost was capitalized as a part of inventory in 2017 and 2016.
Post-Retirement Benefits
The Company recognizes the overfunded or underfunded position of a defined benefit postretirement plan as an asset or liability in the balance sheet, measures the plan’s assets and its obligations that determine its funded status as of each balance sheet date and recognizes the changes in the funded status through comprehensive income (loss) in the year in which the changes occur.
| 48 |
Foreign Currency Translation
For the Company’s foreign subsidiary, the environment in which the business conducts operations is considered the functional currency, generally the local currency. The assets and liabilities of the foreign subsidiary are translated into the United States dollar at the foreign exchange rates in effect at the end of the period. Revenue and expenses of the Company’s foreign subsidiary are translated using an average of the foreign exchange rates in effect during the period. Translation adjustments are not included in determining net earnings but are presented in comprehensive (loss) income within the consolidated statements of comprehensive (loss) income. Transaction gains and losses that arise from foreign exchange rate fluctuations on transactions denominated in a currency other than the functional currency are included in the consolidated statement of operations as incurred. If the Company disposes of its investment in a foreign entity, any gain or loss on currency translation balance recorded in accumulated other comprehensive income is recognized as part of the gain or loss on disposition.
Warranty Reserves
In most instances, digital products are covered by the manufacturing firm’s warranty; however, for certain customers the Company may grant warranties in excess of the manufacturer’s warranty. In addition, the Company provides warranty coverage on screens it manufactures. The Company accrues for these costs at the time of sale. The following table summarizes warranty activity for the three years ended December 31 (in thousands):
| 2017 | 2016 | 2015 | ||||||||||
| Warranty accrual at beginning of period | $ | 645 | $ | 310 | $ | 355 | ||||||
| Charged to expense | 309 | 933 | 583 | |||||||||
| Claims paid, net of recoveries | (462 | ) | (600 | ) | (592 | ) | ||||||
| Foreign currency adjustment | 29 | 2 | (36 | ) | ||||||||
| Warranty accrual at end of period | $ | 521 | $ | 645 | $ | 310 | ||||||
Contingencies
The Company accrues for contingencies when its assessments indicate that it is probable that a liability has been incurred and an amount can be reasonably estimated. The Company’s estimates are based on currently available facts and its estimates of the ultimate outcome or resolution. Actual results may differ from the Company’s estimates resulting in an impact, positive or negative, on earnings.
Recently Issued Accounting Pronouncements
In May 2014, the Financial Accounting Standards Board (“FASB”) issued Accounting Standards Update (“ASU”) No. 2014-09, “Revenue from Contracts with Customers (Topic 606).” ASU 2014-09 requires an entity to recognize the amount of revenue to which it expects to be entitled for the transfer of promised goods or services to customers. The ASU will replace most existing revenue recognition guidance in U.S. GAAP when it becomes effective. The Company will adopt the new revenue guidance effective January 1, 2018 by recognizing the cumulative effect of initially applying the new standard as an adjustment to the opening balance of retained earnings. The Company has obtained an understanding of ASU 2014-09 and performed a detailed assessment of the attributes within its contracts for its major products and services. For the Cinema segment, the Company does not expect the adoption of ASC 606 to result in a material cumulative effect adjustment or material changes to revenue recognition. For the Digital Media segment, the Company is completing a final review of its assessment before concluding as to whether adoption of ASC 606 will result in a material cumulative effect adjustment or any material changes to revenue recognition. The Company expects to conclude its assessment and implement ASC 606 during the quarter ending March 31, 2018, and will include new disclosures required by ASC 606, including final effects of adoption, in its Form 10-Q for the quarter ending March 31, 2018.
| 49 |
In July 2015, the FASB issued ASU 2015-11, “Simplifying the Measurement of Inventory.” ASU 2015-11 requires an entity utilizing the first in-first out inventory method to change its measurement principle for inventory changes from the lower of cost or market to lower of cost and net realizable value. The guidance was effective for the Company beginning January 1, 2017. An entity must adopt this ASU prospectively. The adoption of ASU 2015-11 did not have a material effect on the Company’s consolidated financial statements.
In January 2016, the FASB issued ASU 2016-01, “Financial Instruments - Overall: Recognition and Measurement of Financial Assets and Financial Liabilities.” ASU 2016-01 requires equity investments that do not result in consolidation and are not accounted under the equity method to be measured at fair value with changes in fair value recognized in net income; simplifies the impairment assessment of equity investments without readily determinable fair values by requiring a qualitative assessment to identify impairment; requires an entity to present separately in other comprehensive income the portion of the total change in the fair value of a liability resulting from a change in the instrument-specific credit risk when the entity has elected to measure the liability at fair value in accordance with the fair value option for financial instruments; requires separate presentation of financial assets and financial liabilities by measurement category and form of financial assets on the balance sheet or the accompanying notes to the financial statements; clarifies that an entity should evaluate the need for a valuation allowance on a deferred tax asset related to available-for-sale securities in combination with the entity’s other deferred tax assets; and modifies certain fair value disclosure requirements. ASU 2016-01 is effective for financial statements issued for fiscal years beginning after December 15, 2017, and interim periods within those fiscal years. The adoption of ASU 2016-01 is not expected to have a material effect on the Company’s consolidated financial statements.
In February 2016, the FASB issued ASU 2016-02, “Leases (Topic 842).” ASU 2016-02 requires lessees to recognize a lease liability and a right-to-use asset for all leases, including operating leases, with a term greater than twelve months, on its balance sheet. This ASU is effective in fiscal years beginning after December 15, 2018, with early adoption permitted, and requires a modified retrospective transition method. The Company is evaluating the requirements of ASU 2016-02 and its potential impact on the Company’s financial statements. The Company has leases primarily for property and equipment and is in the process of identifying and evaluating these leases for purposes of ASU 2016-02. For each of these leases, the term will be evaluated, including extension and renewal options as well as the lease payments. While the Company has not yet quantified the impact that the adoption of ASU 2016-02 will have on its consolidated financial statements, the Company expects to record assets and liabilities on its balance sheet upon adoption of this standard, which may be material. The Company will continue to provide enhanced disclosures as it continues its assessment.
In March 2016, the FASB issued ASU 2016-09, “Compensation – Stock Compensation (Topic 718): Improvements to Employee Share-Based Payment Accounting.” ASU 2016-09 simplifies accounting for share-based payment transactions, including the income tax consequences, classification of awards as either equity or liabilities, an option to recognize gross stock compensation expense with actual forfeitures recognized as they occur and certain classifications on the statement of cash flows. The Company adopted the guidance effective January 1, 2017 on a prospective basis. Additionally, as required by ASU 2016-09, when calculating diluted earnings per share, excess tax benefits were excluded from the calculation of assumed proceeds since such amounts are recognized in the income statement. The Company applied the cash flow presentation requirements prospectively, and the 2016 and 2015 statements of cash flows were not adjusted. ASU 2016-09 allows an entity to elect as an accounting policy either to estimate the total number of awards for which the requisite service period will not be rendered or to account for forfeitures for service-based awards as they occur. The Company has elected to account for forfeitures as they occur.
In June 2016, the FASB issued ASU 2016-13, “Financial Instruments – Credit Losses (Topic 326): Measurement of Credit Losses on Financial Instruments.” This ASU will require the measurement of all expected credit losses for financial assets, including trade receivables, held at the reporting date based on historical experience, current conditions, and reasonable and supportable forecasts. The guidance is effective for annual reporting periods beginning after December 15, 2019 and interim periods within those fiscal years. The Company believes its adoption will not significantly impact the Company’s results of operations and financial position.
In August 2016, the FASB issued ASU 2016-15, “Statement of Cash Flows (Topic 230): Classification of Certain Cash Receipts and Cash Payments,” which eliminates the diversity in practice related to eight cash flow classification issues. The Company adopted this ASU in the first quarter of 2017 on a prospective basis. Adoption affected the classification of dividends received from equity method investees on the statement of cash flow but did not have any other impact.
| 50 |
In January 2017, the FASB issued ASU 2017-04, “Intangibles—Goodwill and Other (Topic 350): Simplifying the Test for Goodwill Impairment.” The new guidance eliminates Step 2 of the goodwill impairment testing which requires the fair value of individual assets and liabilities of a reporting unit to be determined when measuring goodwill impairment. The new guidance may result in different amounts of impairment that could be recognized compared to existing guidance. In addition, failing step 1 of the impairment test may not result in impairment under existing guidance. However, under the revised guidance, failing step 1 will always result in a goodwill impairment. ASU 2017-04 is to be applied prospectively for goodwill impairment testing performed in years beginning after December 15, 2019. The Company does not believe the adoption will significantly impact the Company’s results of operations or financial position.
In May 2017, the FASB issued ASU 2017-09, “Compensation – Stock Compensation (Topic 718): Scope of Modification Accounting.” The new guidance describes the types of changes to the terms or conditions of share-based payment awards to which an entity would be required to apply modification accounting. The guidance is effective for annual reporting periods beginning after December 15, 2017, including interim periods within those fiscal years. The Company believes its adoption of this ASU effective January 1, 2018 will not significantly impact the Company’s results of operations and financial position.
4. Inventories
Inventories consist of the following (in thousands):
| December 31, 2017 | December 31, 2016 | |||||||
| Raw materials and components | $ | 1,376 | $ | 1,341 | ||||
| Work in process | 362 | 247 | ||||||
| Finished goods | 3,083 | 4,975 | ||||||
| $ | 4,821 | $ | 6,563 | |||||
The inventory balances are net of reserves of approximately $1.8 million and $1.6 million as of December 31, 2017 and 2016, respectively.
5. Property, Plant and Equipment
Property, plant and equipment include the following (in thousands):
| December 31, 2017 | December 31, 2016 | |||||||
| Land | $ | 1,601 | $ | 1,596 | ||||
| Buildings and improvements | 9,277 | 8,728 | ||||||
| Machinery and equipment | 4,709 | 3,884 | ||||||
| Office furnitures and fixtures | 4,019 | 4,045 | ||||||
| Total properties cost | 19,606 | 18,253 | ||||||
| Less accumulated depreciation | (8,780 | ) | (7,066 | ) | ||||
| Net property, plant and equipment | $ | 10,826 | $ | 11,187 | ||||
Depreciation expense approximated $1.6 million, $2.0 million and $2.1 million for the years ended December 31, 2017, 2016 and 2015, respectively.
| 51 |
6. Equity Method Investments
The following summarizes our equity method investments (dollars in thousands):
| December 31, 2017 | December 31, 2016 | |||||||||||||||
| Entity | Carrying Amount | Economic Interest | Carrying Amount | Economic Interest | ||||||||||||
| RELM Wireless Corporation | $ | 4,473 | 8.3 | % | $ | 4,382 | 8.3 | % | ||||||||
| Itasca Capital, Ltd. | 5,870 | 32.3 | % | 3,368 | 32.3 | % | ||||||||||
| 1347 Property Insurance Holdings, Inc. | 7,710 | 17.4 | % | 5,348 | 12.1 | % | ||||||||||
| Total | $ | 18,053 | $ | 13,098 | ||||||||||||
The following summarizes the income (loss) of equity method investees reflected in the Consolidated Statement of Operations (in thousands):
| Year Ended December 31, | ||||||||||||
| 2017 | 2016 | 2015 | ||||||||||
| Entity | ||||||||||||
| RELM Wireless Corporation | $ | 62 | $ | 216 | $ | 1 | ||||||
| Itasca Capital, Ltd. | 2,073 | (99 | ) | — | ||||||||
| 1347 Property Insurance Holdings, Inc. | (177 | ) | — | — | ||||||||
| Digital Link II, LLC | — | — | 95 | |||||||||
| Total | $ | 1,958 | $ | 117 | $ | 96 | ||||||
RELM Wireless Corporation (“RELM”) is a publicly traded company that designs, manufactures and markets two-way land mobile radios, repeaters, base stations and related components and subsystems. The Company’s Chief Executive Officer is chairman of the board of directors of RELM, and controls entities that, when combined with the Company’s ownership in RELM, own greater than 20% of RELM, providing the Company with significant influence over RELM, but not controlling interest. The Company received dividends of $0.3 million, $0.2 million, and $0 from RELM in 2017, 2016, and 2015, respectively. Based on quoted market prices, the market value of the Company’s ownership in RELM was $4.0 million at December 31, 2017.
Itasca Capital, Ltd. (“Itasca”) is a publicly traded Canadian company that is an investment vehicle seeking transformative strategic investments. The Company’s Chief Executive Officer is a member of the board of directors of Itasca. This board seat, combined with the Company’s 32.3% ownership of Itasca, provide the Company with significant influence over Itasca, but not controlling interest. The Company did not receive dividends from Itasca in 2017, 2016, or 2015. Based on quoted market prices, the market value of the Company’s ownership in Itasca was $3.8 million at December 31, 2017.
As of December 31, 2016, the Company owned 12.1% of 1347 Property Insurance Holdings, Inc. (“PIH”) and purchased shares increasing its ownership to 17.4% during 2017 for an additional $2.5 million. PIH is a publicly traded company that provides property and casualty insurance in the States of Louisiana, Texas and Florida. The Company’s Chief Executive Officer is a member of the board of directors of PIH. This board seat and the Chief Executive Officer’s control of other entities that own shares of PIH, combined with the Company’s 17.4% ownership of PIH, provide the Company with significant influence over PIH, but not controlling interest. The Company did not receive dividends from PIH in 2017, 2016 or 2015. Based on quoted market prices, the market value of the Company’s ownership in PIH was $7.5 million at December 31, 2017.
As of December 31, 2017, the Company’s retained earnings included undistributed earnings from equity method investees of $1.6 million.
| 52 |
The summarized financial information presented below reflects the aggregated financial information of all significant equity method investees as of and for the twelve months ended September 30 of each year or portion of those twelve months the Company owned its investment, consistent with the Company’s recognition of the results of its equity method investments on a one quarter lag. The summarized financial information is presented only for the periods when the Company owned its investment. Because PIH does not present a classified balance sheet, major components of its assets and liabilities are presented instead of current and noncurrent assets and liabilities.
| For the twelve months ended September 30, | 2017 | 2016 | ||||||
| (in thousands) | ||||||||
| Revenue | $ | 72,325 | $ | 44,621 | ||||
| Operating income | 1,021 | 3,204 | ||||||
| Net income | 7,953 | 235 | ||||||
| As of September 30, | 2017 | 2016 | ||||||
| (in thousands) | ||||||||
| Cash and cash equivalents - PIH | $ | 25,679 | $ | 38,926 | ||||
| Investments - PIH | 49,702 | 31,451 | ||||||
| Reinsurance recoverables - PIH | 25,327 | 7,986 | ||||||
| Other assets - PIH | 14,815 | 14,092 | ||||||
| Current assets - RELM and Itasca | 33,359 | 30,216 | ||||||
| Noncurrent assets - RELM and Itasca | 30,005 | 23,479 | ||||||
| Total assets - PIH, RELM and Itasca | $ | 178,887 | $ | 146,150 | ||||
| Loss and loss adjustment expense reserves - PIH | $ | 22,091 | $ | 8,627 | ||||
| Unearned premium reserves - PIH | 32,170 | 26,344 | ||||||
| Redeemable preferred shares - PIH | 2,744 | 2,616 | ||||||
| Other liabilities - PIH | 12,920 | 9,625 | ||||||
| Current liabilities - RELM and Itasca | 8,857 | 5,709 | ||||||
| Noncurrent liabilities - RELM and Itasca | 452 | 394 | ||||||
| Total liabilities - PIH, RELM and Itasca | $ | 79,234 | $ | 53,315 | ||||
The carrying value of the Company’s equity method investments at December 31, 2017 exceeds its share of equity in the net assets of the equity method investees by $1.3 million, which is accounted for as equity method goodwill.
7. Intangible Assets
Intangible assets consisted of the following at December 31, 2017 (dollars in thousands):
| Useful life | Gross | Accumulated Amortization | Net | |||||||||||||
| (Years) | ||||||||||||||||
| Intangible assets not yet subject to amortization: | ||||||||||||||||
| Software in development | $ | 1,243 | $ | — | $ | 1,243 | ||||||||||
| Intangible assets subject to amortization: | ||||||||||||||||
| Software in service | 5 | 3,191 | (597 | ) | 2,594 | |||||||||||
| Product formulation | 10 | 486 | (351 | ) | 135 | |||||||||||
| Total | $ | 4,920 | $ | (948 | ) | $ | 3,972 | |||||||||
| 53 |
Intangible assets consisted of the following at December 31, 2016 (dollars in thousands):
| Useful life | Gross | Accumulated Amortization | Net | |||||||||||||
| (Years) | ||||||||||||||||
| Intangible assets not yet subject to amortization: | ||||||||||||||||
| Software in development | $ | 508 | $ | — | $ | 508 | ||||||||||
| Intangible assets subject to amortization: | ||||||||||||||||
| Software in service | 5 | 1,764 | (93 | ) | 1,671 | |||||||||||
| Product formulation | 10 | 454 | (276 | ) | 178 | |||||||||||
| Total | $ | 2,726 | $ | (369 | ) | $ | 2,357 | |||||||||
Intangible assets, other than goodwill, with definite lives are amortized over their useful lives. The Company recorded amortization expense relating to other identifiable intangible assets of $0.6 million, $0.2 million and $0.3 million during the years ended December 31, 2017, 2016 and 2015, respectively. During 2015, we recorded an impairment charge of $0.6 million for software intangible assets to measure them at their fair value.
The following table shows the Company’s estimated future amortization expense related to intangible assets currently subject to amortization for the next five years (in thousands).
| 2018 | $ | 710 | ||
| 2019 | 698 | |||
| 2020 | 689 | |||
| 2021 | 548 | |||
| 2022 | 78 | |||
| Thereafter | 6 | |||
| Total | $ | 2,729 |
8. Goodwill
All of the Company’s goodwill is related to the Cinema segment. The following represents a summary of changes in the Company’s carrying amount of goodwill (in thousands):
| Balance as of December 31, 2015 | $ | 863 | ||
| Foreign currency translation | 26 | |||
| Balance as of December 31, 2016 | 889 | |||
| Foreign currency translation | 63 | |||
| Balance as of December 31, 2017 | $ | 952 |
| 54 |
9. Accrued Expenses
The major components of current accrued expenses are as follows (in thousands):
| December 31, 2017 | December 31, 2016 | |||||||
| Employee related | $ | 1,388 | $ | 1,785 | ||||
| Legal and professional fees | 222 | 295 | ||||||
| Lease expenses | 268 | 267 | ||||||
| Warranty obligation | 521 | 645 | ||||||
| Interest and taxes | 567 | 967 | ||||||
| Post-retirement benefit obligation | 18 | 13 | ||||||
| Other | 87 | 125 | ||||||
| Total | $ | 3,071 | $ | 4,097 | ||||
The major components of long-term accrued expenses are as follows (in thousands):
| December 31, 2017 | December 31, 2016 | |||||||
| Rent and leasehold improvements | $ | 222 | $ | 439 | ||||
| Post-retirement benefit obligation | 97 | 131 | ||||||
| Total | $ | 319 | $ | 570 | ||||
10. Income Taxes
(Loss) income from continuing operations before income taxes consists of (in thousands):
| 2017 | 2016 | 2015 | ||||||||||
| United States | $ | (11,588 | ) | $ | (5,828 | ) | $ | (16,630 | ) | |||
| Foreign | 11,414 | 9,716 | 12,944 | |||||||||
| $ | (174 | ) | $ | 3,888 | $ | (3,686 | ) | |||||
| 55 |
Income tax expense (benefit) attributable to (loss) income from continuing operations consists of (in thousands):
| 2017 | 2016 | 2015 | ||||||||||
| Federal: | ||||||||||||
| Current | $ | — | $ | 10 | $ | 1,575 | ||||||
| Deferred | — | (34 | ) | 7,348 | ||||||||
| Total | — | (24 | ) | 8,923 | ||||||||
| State: | ||||||||||||
| Current | 8 | 156 | (1,301 | ) | ||||||||
| Deferred | — | 29 | 635 | |||||||||
| Total | 8 | 185 | (666 | ) | ||||||||
| Foreign: | ||||||||||||
| Current | 2,348 | 2,810 | 3,597 | |||||||||
| Deferred | 1,062 | 48 | 1,184 | |||||||||
| Total | 3,410 | 2,858 | 4,781 | |||||||||
| $ | 3,418 | $ | 3,019 | $ | 13,038 | |||||||
Income tax expense attributable to (loss) income from continuing operations differed from the amounts computed by applying the U.S. Federal income tax rate to pretax (loss) income from continuing operations as follows (in thousands):
| 2017 | 2016 | 2015 | ||||||||||
| Expected federal income tax (benefit) expense | $ | (59 | ) | $ | 1,322 | $ | (1,253 | ) | ||||
| Effect of federal rate change | 5,341 | — | — | |||||||||
| Effect of change to territorial system | (4,071 | ) | — | — | ||||||||
| State income taxes, net of federal benefit | (260 | ) | 189 | (324 | ) | |||||||
| Foreign tax rates varying from 34% | (743 | ) | (638 | ) | (871 | ) | ||||||
| Change in foreign reinvestment strategy | — | 546 | 6,650 | |||||||||
| Change in valuation allowance | 3,321 | 105 | 8,856 | |||||||||
| Section 956 inclusion | — | 1,615 | — | |||||||||
| Return to provision | (49 | ) | (193 | ) | (8 | ) | ||||||
| Other | (62 | ) | 73 | (12 | ) | |||||||
| Total | $ | 3,418 | $ | 3,019 | $ | 13,038 | ||||||
| 56 |
Deferred tax assets and liabilities were comprised of the following (in thousands):
| December 31, 2017 | December 31, 2016 | |||||||
| Deferred tax assets: | ||||||||
| Deferred revenue | $ | 230 | $ | 1,672 | ||||
| Non-deductible accruals | 206 | 187 | ||||||
| Inventory reserves | 451 | 567 | ||||||
| Stock compensation expense | 199 | 281 | ||||||
| Warranty reserves | 138 | 204 | ||||||
| Uncollectible receivable reserves | 458 | 409 | ||||||
| Net operating losses | 9,204 | 6,397 | ||||||
| Fair value adjustment to notes receivable | 147 | 633 | ||||||
| Foreign tax credits | 1,642 | 2,960 | ||||||
| Depreciation and amortization | 79 | 671 | ||||||
| Equity in loss of equity method investments | — | 163 | ||||||
| Accumulated other comprehensive income | — | 1,685 | ||||||
| Other | 170 | — | ||||||
| Total deferred tax assets | 12,924 | 15,829 | ||||||
| Valuation allowance | (12,317 | ) | (8,550 | ) | ||||
| Net deferred tax assets after valuation allowance | 607 | 7,279 | ||||||
| Deferred tax liabilities: | ||||||||
| Depreciation and amortization | 923 | 6 | ||||||
| Cash repatriation | 1,884 | 8,958 | ||||||
| Equity in income of equity method investments | 610 | — | ||||||
| Accrued group health insurance claims | — | 66 | ||||||
| Other | 6 | 6 | ||||||
| Total deferred tax liabilities | 3,423 | 9,036 | ||||||
| Net deferred tax liability | $ | (2,816 | ) | $ | (1,757 | ) | ||
In assessing the realizability of deferred tax assets, the Company considers whether it is more likely than not that some portion or all of the deferred tax assets will not be realized. The ultimate realization of deferred tax assets is dependent upon the generation of future taxable income. The Company considers the scheduled reversal of taxable temporary differences, projected future taxable income and tax planning strategies in making this assessment. A cumulative loss in a particular tax jurisdiction in recent years is a significant piece of evidence with respect to the realizability that is difficult to overcome. Based on the available objective evidence including recent updates to the taxing jurisdictions generating income, the Company concluded that a valuation allowance of $12.3 million and $8.6 million should be recorded against the Company’s U.S. tax jurisdiction deferred tax assets as of December 31, 2017 and 2016, respectively.
In December 2017, the Tax Cuts and Jobs Act of 2017 (the “2017 Tax Act”) was signed into law in the United States. The law includes significant changes to the United States corporate income tax system, including a federal corporate rate reduction and the transition of the United States from a worldwide tax system to a territorial tax system. As part of the transition to a territorial tax system, the 2017 Tax Act requires taxpayers to calculate a one-time transition tax based on the deemed repatriation of undistributed earnings of foreign subsidiaries. The Company is currently analyzing the 2017 Tax Act, and in certain areas, has made provisional estimates of the effects on our consolidated financial statements and tax disclosures, including the amount of the repatriation tax and changes to existing deferred tax balances.
| 57 |
The one-time transition tax is based primarily on the Company’s accumulated foreign earnings and profits that were previously deferred from U.S. income taxes. No additional U.S. federal income taxes have been provided as all accumulated earnings of foreign subsidiaries are deemed to have been remitted as part of the one-time transition tax. After applying foreign tax credits, the Company estimates its tax liability related to the one-time transition tax to be zero. The Company has recorded a deferred tax liability of $1.9 million at December 31, 2017 related to withholding tax on earnings from its Canadian subsidiary. Due to the full valuation allowance recorded against the U.S. tax jurisdiction deferred tax assets as of December 31, 2017, the net income tax expense related to the one-time transition tax is zero.
The decrease in the U.S. Federal corporate income tax rate resulted in a decrease in the future expected benefit of the Company’s U.S. deferred tax assets. However, due to the full valuation allowance recorded against the U.S. tax jurisdiction deferred tax assets as of December 31, 2017, the net income tax expense recorded related to the change in the corporate tax rate was zero.
The tax effect of the Company’s net operating loss carryforwards for Federal and state tax purposes total approximately $9.2 million at December 31, 2017, expiring at various times in 2033 through 2037. The Company has foreign tax credit carryforwards of approximately $1.6 million at December 31, 2017 that expire at various times in 2024 through 2025.
The Company is subject to possible examinations not yet initiated for Federal purposes for fiscal years 2014, 2015 and 2016. In most cases, the Company has examinations open for state or local jurisdictions based on the particular jurisdiction’s statute of limitations.
Estimated amounts related to underpayment of income taxes, including interest and penalties, are classified as a component of income tax expense in the consolidated statements of operations and were not material for the years ended December 31, 2017, 2016 and 2015. Amounts accrued for estimated underpayment of income taxes were zero as of December 31, 2017 and 2016.
| 11. | Debt |
The Company’s long-term debt consists of the following (in thousands):
| December 31, 2017 | December 31, 2016 | |||||||
| Term loan principal balance | $ | 1,968 | $ | — | ||||
| Less: current portion | (65 | ) | — | |||||
| Less: unamortized debt issuance costs | (33 | ) | — | |||||
| Long-term debt | $ | 1,870 | $ | — | ||||
On April 27, 2017, the Company entered into a debt agreement with a bank consisting of 1) a $2.0 million five-year term loan secured by a first lien deed of trust on the Company’s Alpharetta, GA facility, bearing interest at a fixed rate of 4.5% and payable in equal monthly installments of principal and interest calculated based on a 20-year amortization schedule with a final balloon payment of approximately $1.7 million due on May 10, 2022 and 2) a line of credit of up to $1.0 million secured by a second lien deed of trust on the Company’s Alpharetta, GA facility, bearing interest at the Prime Rate published in the Wall Street Journal plus 0.25% (4.75% at December 31, 2017) and with a term ending May 10, 2018. The debt agreement requires the Company to maintain a ratio of total liabilities to tangible net worth not in excess of 3:1 and maintain minimum liquidity of $2.0 million. The Company was in compliance with its debt covenants as of December 31, 2017. The Company had outstanding borrowings on the line of credit as of December 31, 2017 of $0.5 million, which is classified as short-term debt on the Consolidated Balance Sheet. The Company’s Chairman and Chief Executive Officer is also a member of the bank’s board of directors.
On September 5, 2017, the Company’s Canadian subsidiary, Strong/MDI, entered into a demand credit agreement with a bank consisting of a revolving line of credit for up to CDN$3.5 million subject to a borrowing base requirement, a 20-year installment loan for up to CDN$6.0 million and a 5-year installment loan for up to CDN$500,000. Amounts outstanding under the line of credit are payable on demand and will bear interest at the prime rate established by the lender. Amounts outstanding under the installment loans will bear interest at the prime rate plus 0.5% and are payable in monthly installments, including interest, over their respective borrowing periods. The lender may also demand repayment of the installment loans at any time. The Strong/MDI credit facilities are secured by a lien on Strong/MDI’s Quebec, Canada facility and substantially all of Strong/MDI’s assets. The credit agreement requires Strong/MDI to maintain a ratio of liabilities to “effective equity” (tangible stockholders’ equity, less amounts receivable from affiliates and equity method investments) not exceeding 2 to 1, a current ratio (excluding amounts due from related parties) of at least 1.5 to 1 and minimum “effective equity” of CDN$8.0 million. There were no borrowings outstanding at December 31, 2017 on any of the Strong/MDI credit facilities, as Strong/MDI had not yet drawn on the facilities. Strong/MDI was in compliance with its debt covenants as of December 31, 2017.
| 58 |
Scheduled repayments are as follows for the Company’s long-term debt outstanding as of December 31, 2017 (in thousands):
| 2018 | $ | 65 | ||
| 2019 | 68 | |||
| 2020 | 70 | |||
| 2021 | 74 | |||
| 2022 | 1,691 | |||
| Total | $ | 1,968 |
| 12. | Restructuring Activities |
2015 Corporate-wide Strategic Initiative
In connection with its strategic planning process, as well as the Company’s ongoing plans to improve efficiency and effectiveness of its operations, the Company initiated plans in the second quarter of 2015 to reduce headcount and more efficiently utilize real estate assets. Included in administrative expenses for year ended December 31, 2015, are $0.6 million and $0.2 million of severance and lease termination costs, respectively, that the Company incurred as part of this restructuring plan. The corporate-wide strategic initiative was completed in the third quarter of 2016.
The following reconciles the activity in the restructuring related severance accruals for the years ended December 31, 2016 and 2015, which are included in accrued expenses (in thousands):
| Balance, restructuring liability at December 31, 2014 | $ | — | ||
| Lease termination expense | 219 | |||
| Lease termination paid | (219 | ) | ||
| Severance expense | 559 | |||
| Severance paid | (486 | ) | ||
| Balance, restructuring liability at December 31, 2015 | 73 | |||
| Severance paid | (73 | ) | ||
| Balance, restructuring liability at December 31, 2016 | $ | — |
| 59 |
| 13. | Stock Compensation |
The Company recognizes compensation expense for all stock-based payment awards made to employees and directors based on estimated grant date fair values. Stock-based compensation expense included in selling and administrative expenses was as follows (in thousands):
| 2017 | 2016 | 2015 | ||||||||||
| Stock-based compensation expense | $ | 736 | $ | 466 | $ | 501 | ||||||
The Company’s 2010 Long-Term Incentive Plan (“2010 Plan”) provided the Compensation Committee of the Board of Directors with the discretion to grant stock options, stock appreciation rights, restricted shares, restricted stock units, performance shares and performance units. Vesting terms varied with each grant and could be subject to vesting upon a “change in control” of the Company.
The Ballantyne Strong, Inc. 2014 Non-Employee Directors’ Restricted Stock Plan (the “2014 Non-Employee Plan”) provided for the award of restricted shares to outside directors. Restricted shares issued under the 2014 Non- Employee Plan vested the day preceding the Company’s Annual Meeting of Stockholders in the year following issuance. The 2010 Plan and the 2014 Non-Employee Plan were replaced during the second quarter of 2017 by the 2017 Omnibus Equity Compensation Plan (“2017 Plan”), and therefore, no additional awards will be granted under the 2010 Plan or the 2014 Non-Employee Plan.
The 2017 Plan was approved by the Company’s stockholders at the annual meeting on June 15, 2017, and provides the Compensation Committee of the Board of Directors with the discretion to grant stock options, stock appreciation rights, restricted shares, restricted stock units, performance shares, performance units and other stock- based awards and cash-based awards. Vesting terms vary with each grant and may be subject to vesting upon a “change in control” of the Company. The total number of shares authorized for issuance under the 2017 Plan is 1,371,189 shares, with 1,253,354 shares remaining available for grant at December 31, 2017.
Options
The Company granted a total of 435,000, 200,000, and 383,300 options during the years ended December 31, 2017, 2016 and 2015, respectively. Options to purchase shares of common stock were granted with exercise prices equal to the fair value of the common stock on the date of the grant.
The weighted average grant date fair value of stock options granted during the years ended December 31, 2017, 2016 and 2015 was $2.42, $1.81 and $1.44, respectively. The fair value of each stock option granted is estimated on the date of grant using a Black-Scholes valuation model with the following weighted average assumptions:
| 2017 | 2016 | 2015 | ||||||||||
| Expected dividend yield at date of grant | 0.00 | % | 0.00 | % | 0.00 | % | ||||||
| Risk-free interest rate | 1.99 | % | 1.42 | % | 1.87 | % | ||||||
| Expected stock price volatility | 34.85 | % | 31.36 | % | 32.06 | % | ||||||
| Expected life of options (in years) | 6.0 | 6.0 | 6.0 | |||||||||
The risk-free interest rate assumptions were based on the U.S. Treasury yield curve in effect at the time of the grant. During 2017, the expected volatility was based on historical daily price changes of the Company’s stock for six years prior to the date of grant. During 2016, the Company used a one year period to calculate volatility, but updated this assumption in the current year to align the expected volatility with the expected life of the options. The expected life of options is the average number of years the Company estimates that options will be outstanding.
| 60 |
The following table summarizes the Company’s activities with respect to its stock options:
| Number of Options | Weighted Average Exercise Price Per Share | Weighted Average Remaining Contractual Term (Years) | Aggregate Intrinsic Value (in thousands) | |||||||||||||
| Outstanding at December 31, 2016 | 545,300 | $ | 4.78 | 9.7 | $ | 1,757 | ||||||||||
| Granted | 435,000 | 6.53 | ||||||||||||||
| Exercised | (15,000 | ) | 4.70 | |||||||||||||
| Forfeited | (33,000 | ) | 6.09 | |||||||||||||
| Expired | (2,000 | ) | 4.33 | |||||||||||||
| Outstanding at December 31, 2017 | 930,300 | $ | 5.63 | 8.7 | $ | 150 | ||||||||||
| Exercisable at December 31, 2017 | 200,300 | $ | 4.54 | 7.9 | $ | 62 | ||||||||||
The aggregate intrinsic value in the table above represents the total that would have been received by the option holders if all in-the-money options had been exercised and sold on the date indicated. The intrinsic value of options exercised during the years ended December 31, 2017 and 2016 amounted to $45 thousand and $43 thousand, respectively. No options were exercised in 2015.
As of December 31, 2017, 730,000 stock option awards were non-vested. Unrecognized compensation costs related to all stock options outstanding amounted to $1.4 million at December 31, 2017, which is expected to be recognized over a weighted-average period of 3.9 years.
Restricted Stock
The Company awarded a total of 115,835, 45,555, and 140,708 restricted stock units and restricted shares during the years ended December 31, 2017, 2016 and 2015, respectively. The Company estimates the fair value of restricted stock awards based upon the market price of the underlying common stock on the date of grant. The weighted average grant date fair value of restricted shares and restricted stock units granted during the twelve month periods ended December 31, 2017, 2016 and 2015 was $6.58, $4.89 and $4.38, respectively. The fair value of restricted stock awards that vested during the years ended December 31, 2017, 2016 and 2015 was $0.4 million, $0.5 million and $0.5 million, respectively.
As of December 31, 2017, the total unrecognized compensation cost related to non-vested restricted stock awards was approximately $0.5 million, which is expected to be recognized over a weighted average period of 1.8 years.
The following table summarizes restricted share activity for 2017:
Number of Restricted Stock Shares | Weighted Average Grant Date Fair Value | |||||||
| Non-vested at December 31, 2016 | 58,295 | $ | 4.77 | |||||
| Granted | 85,000 | 6.50 | ||||||
| Shares vested | (58,295 | ) | 4.77 | |||||
| Shares forfeited | — | |||||||
| Non-vested at December 31, 2017 | 85,000 | $ | 6.50 | |||||
| 61 |
The following table summarizes restricted stock unit activity for 2017:
Number of Restricted Stock Units | Weighted Average Grant Date Fair Value | |||||||
| Non-vested at December 31, 2016 | 13,750 | $ | 4.24 | |||||
| Granted | 30,835 | 6.81 | ||||||
| Shares vested | (6,875 | ) | 4.24 | |||||
| Shares forfeited | (1,875 | ) | 4.21 | |||||
| Non-vested at December 31, 2017 | 35,835 | $ | 6.45 | |||||
14. Compensation and Benefit Plans
Retirement Plan
The Company sponsors a defined contribution 401(k) plan (the “Plan”) for all eligible employees. Pursuant to the provisions of the Plan, employees may defer up to 100% of their compensation. The Company will match 50% of the amount deferred up to 6% of their compensation. The contributions made to the Plan by the Company were approximately $0.4 million for each of the years ended December 31, 2017, 2016 and 2015.
| 15. | Leases |
The Company and its subsidiaries lease plant and office facilities, autos and equipment under operating leases expiring through 2022. These leases generally contain renewal options and the Company expects to renew or replace certain of these leases in the ordinary course of business. Rent expense under operating lease agreements amounted to approximately $0.5 million, $0.4 million and $0.6 million for the years ended December 31, 2017, 2016 and 2015, respectively. The Company also has capital leases for computer equipment. The capital lease obligations are included in accrued expenses on the balance sheet.
The Company’s future minimum lease payments are as follows:
| Capital Leases | Operating Leases | |||||||
| (in thousands) | ||||||||
| 2018 | $ | 251 | $ | 1,758 | ||||
| 2019 | 116 | 1,735 | ||||||
| 2020 | — | 1,507 | ||||||
| 2021 | — | 1,378 | ||||||
| 2022 | — | 1,066 | ||||||
| Thereafter | — | - | ||||||
| Total minimum lease payments | 367 | $ | 7,444 | |||||
| Less: Amount representing interest | (14 | ) | ||||||
| Present value of minimum lease payments | 353 | |||||||
| Less: Current maturities | (239 | ) | ||||||
| Capital lease obligations, net of current portion | $ | 114 | ||||||
| 62 |
| 16. | Contingencies and Concentrations |
Concentrations
The Company’s top ten customers accounted for approximately 53% of 2017 consolidated net revenues. Trade accounts receivable from these customers represented approximately 39% of net consolidated receivables at December 31, 2017.
Litigation
The Company is involved, from time to time, in certain legal disputes in the ordinary course of business. No such disputes, individually or in the aggregate, are expected to have a material effect on the Company’s business or financial condition.
17. Business Segment Information
The Company has two primary operating segments: Cinema and Digital Media. During the fourth quarter of 2017, the Company decided to reorganize its segments to move the operations of Strong Technical Services, Inc. from the Digital Media segment to the Cinema segment. All prior periods have been recast in our segment reporting to reflect the current segment organization. The Cinema segment provides a full range of product and service solutions primarily for the theater exhibition industry, including a wide spectrum of premier audio-visual products and accessories such as digital projectors, state of the art projection screens, servers, library management systems, menu boards, flat panel displays, and sound systems, as well as network monitoring and on-site service for cinema equipment. The Digital Media segment delivers solutions and services across two primary markets: digital out-of- home and cinema. While there is digital signage equipment sold within this segment, the primary focus of this segment is providing solutions and services to our customers.
| 63 |
Summary by Business Segments
| Year ended December 31, | ||||||||||||
| 2017 | 2016 | 2015 | ||||||||||
| (in thousands) | ||||||||||||
| Net revenues | ||||||||||||
| Cinema | $ | 48,937 | $ | 54,775 | $ | 60,839 | ||||||
| Digital Media | 24,484 | 21,996 | 17,433 | |||||||||
| Other | 39 | — | — | |||||||||
| Total segment net revenues | 73,460 | 76,771 | 78,272 | |||||||||
| Eliminations | (814 | ) | (517 | ) | (213 | ) | ||||||
| Total net revenues | 72,646 | 76,254 | 78,059 | |||||||||
| Gross profit | ||||||||||||
| Cinema | 14,919 | 17,160 | 15,163 | |||||||||
| Digital Media | 3,976 | 3,996 | 1,549 | |||||||||
| Other | 39 | — | — | |||||||||
| Total gross profit | 18,934 | 21,156 | 16,712 | |||||||||
| Operating income (loss) | ||||||||||||
| Cinema | 10,678 | 13,398 | 9,964 | |||||||||
| Digital Media | (3,902 | ) | (1,596 | ) | (3,764 | ) | ||||||
| Other | (382 | ) | (88 | ) | — | |||||||
| Total segment operating income | 6,394 | 11,714 | 6,200 | |||||||||
| Unallocated general and administrative expenses | (9,208 | ) | (7,550 | ) | (10,407 | ) | ||||||
| (Loss) income from operations | (2,814 | ) | 4,164 | (4,207 | ) | |||||||
| Other income (expense), net | 682 | (393 | ) | 425 | ||||||||
| (Loss)
earnings before income taxes and equity method investment income | $ | (2,132 | ) | $ | 3,771 | $ | (3,782 | ) | ||||
| Year ended December 31, | ||||||||||||
| 2017 | 2016 | 2015 | ||||||||||
| (in thousands) | ||||||||||||
| Capital expenditures: | ||||||||||||
| Cinema | $ | 810 | $ | 1,068 | $ | 278 | ||||||
| Digital Media | 1,909 | 1,673 | 180 | |||||||||
| Other | 556 | 1,021 | — | |||||||||
| Total capital expenditures | $ | 3,275 | $ | 3,762 | $ | 458 | ||||||
| Depreciation, amortization and impairment: | ||||||||||||
| Cinema | $ | 912 | $ | 771 | $ | 993 | ||||||
| Digital Media | 1,000 | 716 | 1,262 | |||||||||
| Other | 269 | 700 | 686 | |||||||||
| Total depreciation, amortization and impairment | $ | 2,181 | $ | 2,187 | $ | 2,941 | ||||||
| 64 |
| December 31, | ||||||||
| (In thousands) | 2017 | 2016 | ||||||
| Identifiable assets, excluding assets held for sale | ||||||||
| Cinema | $ | 27,358 | $ | 32,855 | ||||
| Digital Media | 13,603 | 16,298 | ||||||
| Corporate assets | 18,053 | 13,098 | ||||||
| Total | $ | 59,014 | $ | 62,251 | ||||
Summary by Geographical Area
| Year ended December 31, | ||||||||||||
| (In thousands) | 2017 | 2016 | 2015 | |||||||||
| Net revenue | ||||||||||||
| United States | $ | 57,479 | $ | 59,917 | $ | 60,754 | ||||||
| Canada | 5,535 | 4,616 | 5,074 | |||||||||
| China | 5,031 | 5,885 | 3,654 | |||||||||
| Mexico | 1,736 | 2,125 | 2,870 | |||||||||
| Latin America | 1,557 | 1,681 | 3,540 | |||||||||
| Europe | 681 | 1,148 | 1,569 | |||||||||
| Other | 353 | 185 | 507 | |||||||||
| Asia (excluding China) | 274 | 697 | 91 | |||||||||
| Total | $ | 72,646 | $ | 76,254 | $ | 78,059 | ||||||
| December 31, | ||||||||
| (In thousands) | 2017 | 2016 | ||||||
| Identifiable assets, excluding assets held for sale | ||||||||
| United States | $ | 37,230 | $ | 40,255 | ||||
| Canada | 21,784 | 21,996 | ||||||
| Total | $ | 59,014 | $ | 62,251 | ||||
Net revenues by business segment are to unaffiliated customers, except to the extent of certain revenues from intersegment services provided by the Cinema segment to the Digital Media segment, which are represented by the eliminations in the segment operating results table above. Identifiable assets by geographical area are based on location of facilities. Net sales by geographical area are based on destination of sales.
| 65 |
18. Quarterly Financial Data (Unaudited)
The following is a summary of the unaudited quarterly results of operations for 2017 and 2016.
| 2017 | 2016 | |||||||||||||||||||||||||||||||
First Quarter | Second Quarter | Third Quarter | Fourth Quarter | First Quarter | Second Quarter | Third Quarter | Fourth
Quarter | |||||||||||||||||||||||||
| (in thousands, except per share data) | ||||||||||||||||||||||||||||||||
| Net revenue | $ | 17,926 | $ | 19,400 | $ | 19,559 | $ | 15,761 | $ | 17,114 | $ | 20,558 | $ | 18,668 | $ | 19,914 | ||||||||||||||||
| Gross profit | 4,439 | 5,274 | 5,319 | 3,902 | 5,236 | 6,149 | 4,377 | 5,394 | ||||||||||||||||||||||||
| Net earnings (loss) | 387 | (1,975 | ) | (1,037 | ) | (992 | ) | (613 | ) | 833 | (470 | ) | (158 | ) | ||||||||||||||||||
| Basic and diluted earnings (loss) per share: | ||||||||||||||||||||||||||||||||
| Basic (1) | 0.03 | (0.14 | ) | (0.07 | ) | (0.07 | ) | (0.04 | ) | 0.06 | (0.03 | ) | (0.01 | ) | ||||||||||||||||||
| Diluted (1) | 0.03 | (0.14 | ) | (0.07 | ) | (0.07 | ) | (0.04 | ) | 0.06 | (0.03 | ) | (0.01 | ) | ||||||||||||||||||
(1) Earnings per share is computed independently for each of the quarters. Therefore, the sum of the quarterly earnings per share may not equal the total for the year.
| 19. | Related Party Transactions |
Pursuant to the proxy contest settlement agreement entered into with Fundamental Global Investors, LLC and certain of its affiliates on April 21, 2015, the Company expanded its Board of Directors to nine directors and nominated five director candidates from Fundamental Global’s slate of directors, who were elected at the 2015 Annual Meeting. Fundamental Global Investors, LLC and its affiliates hold approximately 28.7% of the Company’s outstanding shares of common stock as of December 31, 2017. Mr. D. Kyle Cerminara, the Chief Executive Officer, Co-Founder and Partner of Fundamental Global Investors, LLC, serves as the Company’s Chairman and Chief Executive Officer. The Company reimbursed Fundamental Global for its expenses incurred in connection with the proxy contest and settlement agreement in the amount of $178,415 in 2015. The independent members of the Board of Directors approved the reimbursement.
The Company’s purchase of the equity securities that comprise its equity method investments were made in companies in which Fundamental Global has an ownership interest. The independent members of the Board of Directors approved these purchases and the Company made no payments to Fundamental Global related to these purchases. See Note 6 for further information on the Company’s equity method investments.
On April 27, 2017, the Company entered into a debt agreement with blueharbor bank. The Company’s Chief Executive Officer serves on the Board of Directors of blueharbor bank. The independent members of the Company’s Board of Directors approved this agreement. See Note 11 for further information on the Company’s debt agreements.
| 66 |
Ballantyne Strong, Inc. and Subsidiaries
Valuation and Qualifying Accounts
(in thousands)
| Balance at beginning of year | Charged to costs and expenses | Amounts written off, net of recoveries | Foreign exchange translation | Balance at end of year | ||||||||||
Allowance for doubtful accounts (continuing operations) | ||||||||||||||
| Year ended December 31, 2017 | $ | 1,097 | 822 | (42 | ) | — | $ | 1,877 | ||||||
| Year ended December 31, 2016 | $ | 1,207 | 21 | (131 | ) | — | $ | 1,097 | ||||||
| Year ended December 31, 2015 | $ | 252 | 1,065 | (110 | ) | — | $ | 1,207 | ||||||
| Inventory reserves (continuing operations) | ||||||||||||||
| Year ended December 31, 2017 | $ | 1,558 | 347 | (64 | ) | — | $ | 1,841 | ||||||
| Year ended December 31, 2016 | $ | 1,233 | 341 | (16 | ) | — | $ | 1,558 | ||||||
| Year ended December 31, 2015 | $ | 1,674 | 1,743 | (2,181 | ) | (3 | ) | $ | 1,233 | |||||
Item 9. Changes in and Disagreements with Accountants on Accounting and Financial Disclosure
None.
Item 9A. Controls and Procedures
Evaluation of Disclosure Controls and Procedures
As of the end of the period covered by this report, the Company carried out an evaluation, under the supervision and with the participation of the Company’s management, including the Company’s Chief Executive Officer and Chief Financial Officer, of the effectiveness of the design and operation of the Company’s disclosure controls and procedures, as defined in Exchange Act Rules 13a-15(e) and 15d-15(e) and internal control over financial reporting, as defined in Exchange Act Rules 13a-15(f) and 15d-15(f). Based upon that evaluation, the Company’s Chief Executive Officer and Chief Financial Officer concluded that the Company’s disclosure controls and procedures were effective.
Internal Control over Financial Reporting
Management’s Report on Internal Control over Financial Reporting
The Company’s management is responsible for establishing and maintaining adequate internal control over financial reporting, as such term is defined in Securities Exchange Act Rule 13a-15(f). The Company carried out an evaluation under the supervision and with the participation of the Company’s management, including the Company’s Chief Executive Officer and Chief Financial Officer, of the effectiveness of the Company’s internal control over financial reporting. The Company’s management used the framework in Internal Control-Integrated Framework (2013) issued by the Committee of Sponsoring Organizations (COSO) to perform this evaluation. Based on that evaluation, the Company’s management concluded that the Company’s internal control over financial reporting was effective as of December 31, 2017. The Company’s management determined that previously identified material weaknesses (as described below) had been remediated as of December 31, 2017.
| 67 |
A material weakness is a deficiency, or combination of deficiencies, in internal control over financial reporting, such that there is a reasonable possibility that a material misstatement of the Company’s annual or interim financial statements will not be prevented or detected on a timely basis.
During the fourth quarter of fiscal 2016, we implemented a new integrated Customer Relationship Management (CRM) and a new enterprise resource planning (ERP) system including inventory management and financial reporting modules to upgrade and standardize our information systems. We have completed the implementation with respect to some of our subsidiaries and plan to continue to roll out the CRM and ERP system modules over time for certain other subsidiaries. The CRM and ERP resulted in changes that materially affected our system of internal control over financial reporting during the three months ended December 31, 2016. As a result, our controls over system access were not fully aligned with our functional segregation of duties. During the year ended December 31, 2017, we implemented controls and procedures to align our system access with our functional segregation of duties.
In the course of our preparations for making management’s report on internal control over financial reporting in our Form 10-K for the year ended December 31, 2016 as required by Section 404 of the Sarbanes-Oxley Act of 2002, we identified areas in need of improvement and have taken remedial actions to strengthen the affected controls as appropriate. One such area was our documentation of business processes, procedures and internal controls for one of our subsidiaries that enters into arrangements with its customers involving multiple deliverables which affects revenue recognition. As of December 31, 2016, we were still in the process of updating our documentation as resource constraints stemming from the aforementioned CRM and ERP implementation delayed our efforts in making these updates. We evaluated our documentation over revenue recognition for arrangements with multiple deliverables and concluded it was not sufficient to ensure internal controls over this accounting were effective. We believe this deficiency in aggregate with the aforementioned deficiency stemming from our CRM and ERP system segregation of duties resulted in a material weakness which may have a material effect on our internal control over financial reporting impacting controls over revenue recognition.
We plan to continue to implement the CRM and other significant modules of the ERP in these and other subsidiaries in the coming years, as we believe these changes will simplify our business processes and system of internal control over financial reporting. In connection with these and future enhancements, the Company will update its internal controls over financial reporting, as necessary, to accommodate any modification to its business processes and procedures.
In addition, during the preparation of its Form 10-Q for the quarter ended March 31, 2017, management of the Company identified two misstatements in the Company’s previously issued consolidated financial statements for the year ended December 31, 2016. The first misstatement related to approximately $477,000 of maintenance service revenue that was pre-billed at a customer’s request, but related to services not completed by December 31, 2016. This revenue was improperly recognized during the year ended December 31, 2016. The second misstatement related to earnings at one of the Company’s Canadian subsidiaries that would be subject to a withholding tax if repatriated to the U.S. The Company improperly excluded earnings to the extent of certain intercompany loans between its Canada and U.S. entities from its provision for deferred income taxes, resulting in an understatement of deferred income tax expense of approximately $238,000.
The Company restated its Consolidated Balance Sheet as of December 31, 2016, and the related Consolidated Statement of Operations, Consolidated Statement of Comprehensive Income (Loss), Consolidated Statement of Stockholders’ Equity and Consolidated Statement of Cash Flows for the year then ended to correct the misstatements described above. We determined our controls over cutoff for maintenance service revenues were insufficient, resulting in a material weakness that had a material effect on our internal control over financial reporting impacting revenue recognition.
During 2017, we engaged a consulting firm to assist us in evaluating our internal controls, including controls over cutoff for maintenance service revenues, and updating our documentation, including documentation related to arrangements with customers involving multiple deliverables. During the year ended December 31, 2017, we implemented additional controls to address deficiencies regarding revenue recognition, and believe we have fully remediated the above-mentioned material weaknesses as of December 31, 2017.
BDO USA, LLP, the independent registered public accounting firm that audited our financial statements included in the Annual Report on Form 10-K, has issued an attestation report on the effectiveness of our internal control over financial reporting as of December 31, 2017. This attestation report is included below in this Item 9A.
Changes in Internal Control over Financial Reporting
Except for controls implemented to address the deficiencies described above, there have been no changes in our internal controls over financial reporting for the three months ended December 31, 2017 that have materially affected, or are reasonably likely to materially affect, our internal control over financial reporting.
| 68 |
Report of Independent Registered Public Accounting Firm
Shareholders and Board of Directors
Ballantyne Strong, Inc.
Omaha, Nebraska
Opinion on Internal Control over Financial Reporting
We have audited Ballantyne Strong, Inc.’s (the “Company’s”) internal control over financial reporting as of December 31, 2017, based on criteria established in Internal Control – Integrated Framework (2013) issued by the Committee of Sponsoring Organizations of the Treadway Commission (the “COSO criteria”). In our opinion, the Company maintained, in all material respects, effective internal control over financial reporting as of December 31, 2017, based on the COSO criteria.
We also have audited, in accordance with the standards of the Public Company Accounting Oversight Board (United States) (“PCAOB”), the consolidated balance sheets of the Company and subsidiaries as of December 31, 2017 and 2016, the related consolidated statements of operations and comprehensive (loss) income, stockholders’ equity, and cash flows for each of the two years in the period ended December 31, 2017, and the related notes and schedule and our report dated March 15, 2018 expressed an unqualified opinion thereon.
Basis for Opinion
The Company’s management is responsible for maintaining effective internal control over financial reporting and for its assessment of the effectiveness of internal control over financial reporting, included in the accompanying Item 9A, “Management’s Report on Internal Control over Financial Reporting”. Our responsibility is to express an opinion on the Company’s internal control over financial reporting based on our audit. We are a public accounting firm registered with the PCAOB and are required to be independent with respect to the Company in accordance with U.S. federal securities laws and the applicable rules and regulations of the Securities and Exchange Commission and the PCAOB.
We conducted our audit of internal control over financial reporting in accordance with the standards of the PCAOB. Those standards require that we plan and perform the audit to obtain reasonable assurance about whether effective internal control over financial reporting was maintained in all material respects. Our audit included obtaining an understanding of internal control over financial reporting, assessing the risk that a material weakness exists, and testing and evaluating the design and operating effectiveness of internal control based on the assessed risk. Our audit also included performing such other procedures as we considered necessary in the circumstances. We believe that our audit provides a reasonable basis for our opinion.
Definition and Limitations of Internal Control over Financial Reporting
A company’s internal control over financial reporting is a process designed to provide reasonable assurance regarding the reliability of financial reporting and the preparation of financial statements for external purposes in accordance with generally accepted accounting principles. A company’s internal control over financial reporting includes those policies and procedures that (1) pertain to the maintenance of records that, in reasonable detail, accurately and fairly reflect the transactions and dispositions of the assets of the company; (2) provide reasonable assurance that transactions are recorded as necessary to permit preparation of financial statements in accordance with generally accepted accounting principles, and that receipts and expenditures of the company are being made only in accordance with authorizations of management and directors of the company; and (3) provide reasonable assurance regarding prevention or timely detection of unauthorized acquisition, use, or disposition of the company’s assets that could have a material effect on the financial statements.
Because of its inherent limitations, internal control over financial reporting may not prevent or detect misstatements. Also, projections of any evaluation of effectiveness to future periods are subject to the risk that controls may become inadequate because of changes in conditions, or that the degree of compliance with the policies or procedures may deteriorate.
/s/ BDO USA, LLP
Raleigh, North Carolina
March 15, 2018
| 69 |
None.
Item 10. Directors, Executive Officers and Corporate Governance
The information required by this item will be contained in the “Board of Directors,” “Executive Officers,” “Compliance with Section 16(a) of the Exchange Act,” and “Board Committees–Audit Committee” sections of the definitive proxy statement, to be filed in connection with the 2018 Annual Meeting of Stockholders, and is incorporated herein by reference.
Our board of directors has adopted the Code of Ethics that applies to all of our directors, officers and employees, including our principal executive officer, principal financial officer and principal accounting officer. The Code of Ethics is posted on our Internet website, www.ballantynestrong.com/investors, under the “Corporate Governance” tab, and is available free of charge, upon request to Corporate Secretary, 11422 Miracle Hills Drive, Suite 300, Omaha, NE 68154; telephone number: (402) 453-4444.
Any amendment to, or waiver from, the Code of Ethics applicable to our directors and executive officers will be disclosed in a current report on Form 8-K within four business days following the date of the amendment or waiver unless the rules of the NYSE American then permit website posting of such amendments and waivers, in which case we would post such disclosures on our Internet website.
Item 11. Executive Compensation
The information required by this item will be contained in the “Executive Compensation” and “Director Compensation” sections of the definitive proxy statement, to be filed in connection with the 2018 Annual Meeting of Stockholders, and is incorporated herein by reference.
Item 12. Security Ownership of Certain Beneficial Owners and Management and Related Stockholder Matters
The following table sets forth information regarding our equity compensation plans as of December 31, 2017.
| Plan Category | Number of securities to be issued upon exercise of outstanding options, warrants and rights | Weighted average exercise price of outstanding options, warrants and rights | Number of securities remaining available for future issuance under equity compensation plans excluding securities reflected in column (a) | |||||||||
| (a) | (b) | (c) | ||||||||||
| Equity compensation plans approved by security holders | 966,135 | (1) | $ | 5.63 | 1,253,354 | (2) | ||||||
| Equity compensation plans not approved by security holders | — | — | — | |||||||||
| Total | 966,135 | $ | 5.63 | 1,253,354 | ||||||||
| (1) | Includes 820,300 securities to be issued upon exercise of outstanding options and 5,000 securities to be issued upon vesting of restricted stock units under our 2010 Long-Term Incentive Plan; and 110,000 securities to be issued upon exercise of outstanding options and 30,835 securities to be issued upon vesting of restricted stock units under our 2017 Omnibus Equity Compensation Plan. | |
| (2) | All shares available for future issuance are under the 2017 Omnibus Equity Compensation Plan. |
| 70 |
The information regarding our largest holders and ownership of our securities by our management and directors will be contained in the “Security Ownership of Certain Beneficial Owners and Management” section of the definitive proxy statement, to be filed in connection with the 2018 annual meeting of stockholders, and is incorporated herein by reference.
Item 13. Certain Relationships and Related Transactions, and Director Independence
The information required by this item will be contained in the “Related Person Transaction Procedures” and “Corporate Governance – Board Independence” sections of the definitive proxy statement, to be filed in connection with the 2018 Annual Meeting of Stockholders, and is incorporated herein by reference.
Item 14. Principal Accounting Fees and Services
The information required by this item will be contained in the “Proposal Three – Ratification of Appointment of the Company’s Independent Auditors” and “Board Committees – Audit Committee” sections of the definitive proxy statement, to be filed in connection with the 2018 Annual Meeting of Stockholders, and is incorporated herein by reference.
Item 15. Exhibits, Financial Statement Schedules
| a. | The following documents are filed as part of this report on Form 10-K: |
| 1. | Consolidated Financial Statements: | |
| An Index to the Consolidated Financial Statements is filed as a part of Item 8. | ||
| 2. | Financial Statement Schedules: | |
| Schedule II—Valuation and Qualifying Accounts for each of the three years ended December 31, 2017, 2016 and 2015. | ||
| Financial Statements of the Registrant’s subsidiaries are omitted because the Registrant is primarily an operating company and the subsidiaries are wholly owned. | ||
|
3. |
Exhibit list. |
| 71 |
EXHIBIT INDEX
| 72 |
| 73 |
| Name | Jurisdiction of Incorporation | ||||
| a. | Strong Westrex, Inc. | Nebraska | |||
| b. | Strong Technical Services, Inc. | Nebraska | |||
| c. | Strong/MDI Screen Systems, Inc. | Canada | |||
| d. | Convergent Corporation | Georgia | |||
| e. | Convergent Media Systems Corporation | Georgia | |||
| f. | Strong Digital Media, LLC | Delaware |
| 74 |
| Incorporated by Reference | ||||||||||
| Exhibit Number | Document Description | Form | Exhibit | Filing Date | Filed Herewith | |||||
| 32.1** | Certification of Chief Executive Officer pursuant to 18 U.S.C. Section 1350, as adopted pursuant to Section 906 of the Sarbanes-Oxley Act of 2002 | X | ||||||||
| 32.2** | Certification of Chief Financial Officer pursuant to 18 U.S.C. Section 1350, as adopted pursuant to Section 906 of the Sarbanes-Oxley Act of 2002 | X | ||||||||
| 101 | The following materials from Ballantyne Strong, Inc.’s Annual Report on Form 10-K for the year ended December 31, 2017, formatted in XBRL (Extensible Business Reporting Language): (i) the Consolidated Balance Sheets, (ii) the Consolidated Statements of Operations; (iii) the Consolidated Statements of Comprehensive Income (Loss); (iv) the Consolidated Statements of Stockholders’ Equity; (v) the Consolidated Statements of Cash Flows;and (vi) the Notes to Consolidated Financial Statements. | X | ||||||||
| * | Management contract or compensatory plan. |
| ** | Furnished herewith. |
| + | The exhibits and schedules to this agreement have been omitted pursuant to Item 601(b)(2) of Regulation S-K. The Company will furnish copies of such exhibits and schedules to the Securities and Exchange Commission upon request. |
None.
| 75 |
Pursuant to the requirements of Section 13 or 15(d) of the Securities Exchange Act of 1934, the registrant has duly caused this report to be signed on its behalf by the undersigned, thereunto duly authorized.
| BALLANTYNE STRONG, INC. | ||||
| By: | /s/ D. KYLE CERMINARA | By: | /s/ LANCE V. SCHULZ | |
| D. Kyle Cerminara, Chairman of the Board of Directors and Chief Executive Officer (Principal Executive Officer) | Lance V. Schulz, Senior Vice President and Chief Financial Officer (Principal Financial Officer and Principal Accounting Officer) | |||
| Date: | March 15, 2018 | Date: | March 15, 2018 | |
Pursuant to the requirements of the Securities Exchange Act of 1934, this report has been signed below by the following persons on behalf of the Registrant and in the capacities and on the dates indicated.
| By: | /s/ D. KYLE CERMINARA | |
| D. Kyle Cerminara, Chairman of the Board of Directors and Chief Executive Officer (Principal Executive Officer) | ||
| Date: | March 15, 2018 | |
| By: | /s/ SAMUEL C. FREITAG (1) | |
| Samuel C. Freitag, Director | ||
| Date: | March 15, 2018 | |
| By: | /s/ WILLIAM J. GERBER (1) | |
| William J. Gerber, Director | ||
| Date: | March 15, 2018 | |
| By: | /s/ LEWIS M. JOHNSON (1) | |
| Lewis M. Johnson, Director | ||
| Date: | March 15, 2018 | |
| By: | /s/ CHARLES T. LANKTREE (1) | |
| Charles T. Lanktree, Director | ||
| Date: | March 15, 2018 | |
| By: | /s/ ROBERT J. ROSCHMAN (1) | |
| Robert J. Roschman, Director | ||
| Date: | March 15, 2018 | |
| By: | /s/ JAMES C. SHAY (1) | |
| James C. Shay, Director | ||
| Date: | March 15, 2018 | |
| By: | /s/ NDAMUKONG SUH (1) | |
| Ndamukong Suh, Director | ||
| Date: | March 15, 2018 |
| (1) | Signed by the undersigned as attorney-in-fact and agent for the Directors indicated |
| By: | /s/ LANCE V. SCHULZ | |
| Lance V. Schulz, Attorney-In-Fact | ||
| Date: | March 15, 2018 |
| 76 |