Attached files
| file | filename |
|---|---|
| 8-K - 8-K - Agiliti Health, Inc. | a18-8077_18k.htm |
| EX-99.1 - EX-99.1 - Agiliti Health, Inc. | a18-8077_1ex99d1.htm |
Presented by Tom Leonard, CEO March 13, 2018 Universal Hospital Services Q4 Earnings Teleconference

Forward Looking Statements Safe Harbor Statement under the Private Securities Litigation Reform Act of 1995: Universal Hospital Services, Inc. believes statements in this presentation looking forward in time involve risks and uncertainties based on management’s current views and assumptions. Actual events may differ materially. Please refer to the cautionary statement regarding forward-looking statements and risk factors that appear in the Company’s Annual Report on Form 10-K for the year ended December 31, 2017, and other filings with the SEC, which can be accessed at www.UHS.com under “Investors.” This presentation contains non-GAAP measures as defined by SEC rules. Reconciliations of these measures to the most directly comparable GAAP measures are contained in the appendix.
CEO remarks

Financial Review

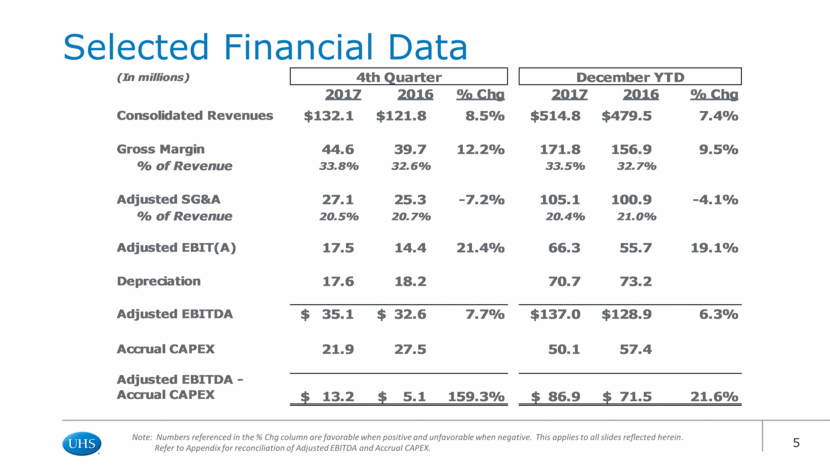
Selected Financial Data Note: Numbers referenced in the % Chg column are favorable when positive and unfavorable when negative. This applies to all slides reflected herein. Refer to Appendix for reconciliation of Adjusted EBITDA and Accrual CAPEX. (In millions) 2017 2016 % Chg 2017 2016 % Chg Consolidated Revenues 132.1 $ 121.8 $ 8.5% 514.8 $ 479.5 $ 7.4% Gross Margin 44.6 39.7 12.2% 171.8 156.9 9.5% % of Revenue 33.8% 32.6% 33.5% 32.7% Adjusted SG&A 27.1 25.3 -7.2% 105.1 100.9 -4.1% % of Revenue 20.5% 20.7% 20.4% 21.0% Adjusted EBIT(A) 17.5 14.4 21.4% 66.3 55.7 19.1% Depreciation 17.6 18.2 70.7 73.2 Adjusted EBITDA 35.1 $ 32.6 $ 7.7% 137.0 $ 128.9 $ 6.3% % of Revenue 26.6% 26.8% 26.6% 26.9% Accrual CAPEX 21.9 27.5 50.1 57.4 Adjusted EBITDA - Accrual CAPEX 13.2 $ 5.1 $ 159.3% 86.9 $ 71.5 $ 21.6% 4th Quarter December YTD
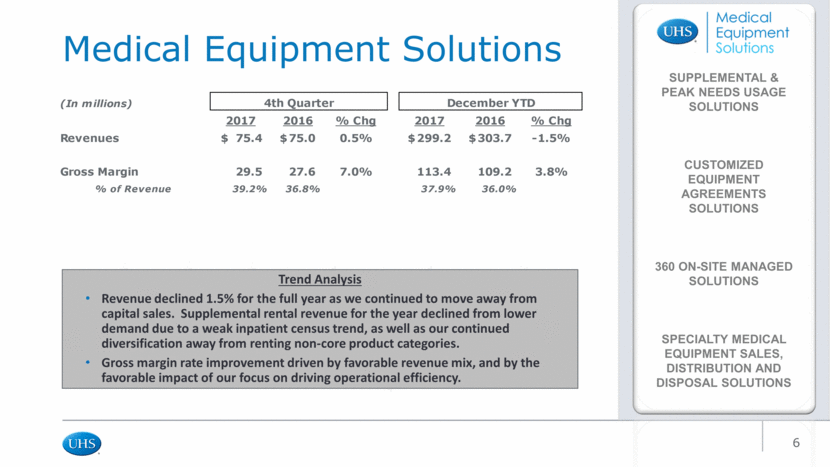
Trend Analysis Revenue declined 1.5% for the full year as we continued to move away from capital sales. Supplemental rental revenue for the year declined from lower demand due to a weak inpatient census trend, as well as our continued diversification away from renting non-core product categories. Gross margin rate improvement driven by favorable revenue mix, and by the favorable impact of our focus on driving operational efficiency. Medical Equipment Solutions SUPPLEMENTAL & PEAK NEEDS USAGE SOLUTIONS CUSTOMIZED EQUIPMENT AGREEMENTS SOLUTIONS 360 ON-SITE MANAGED SOLUTIONS SPECIALTY MEDICAL EQUIPMENT SALES, DISTRIBUTION AND DISPOSAL SOLUTIONS (In millions) 2017 2016 % Chg 2017 2016 % Chg Revenues 75.4 $ 75.0 $ 0.5% 299.2 $ 303.7 $ -1.5% Gross Margin 29.5 27.6 7.0% 113.4 109.2 3.8% % of Revenue 39.2% 36.8% 37.9% 36.0% . December YTD 4th Quarter
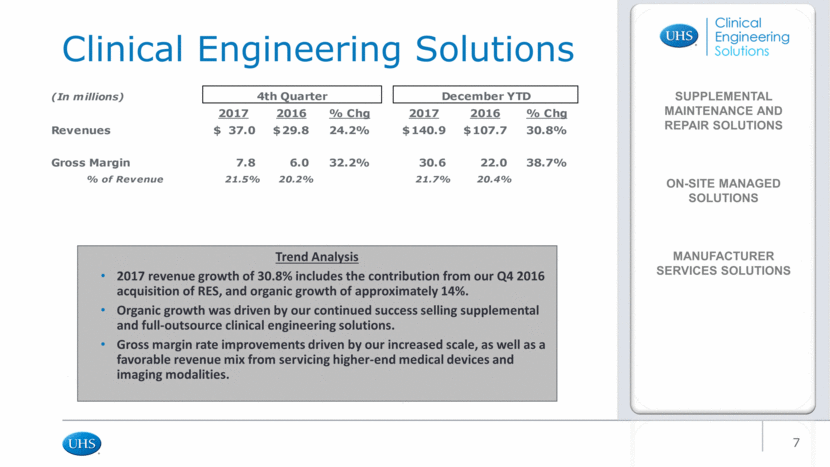
Trend Analysis 2017 revenue growth of 30.8% includes the contribution from our Q4 2016 acquisition of RES, and organic growth of approximately 14%. Organic growth was driven by our continued success selling supplemental and full-outsource clinical engineering solutions. Gross margin rate improvements driven by our increased scale, as well as a favorable revenue mix from servicing higher-end medical devices and imaging modalities. Clinical Engineering Solutions SUPPLEMENTAL MAINTENANCE AND REPAIR SOLUTIONS ON-SITE MANAGED SOLUTIONS MANUFACTURER SERVICES SOLUTIONS (In millions) 2017 2016 % Chg 2017 2016 % Chg Revenues 37.0 $ 29.8 $ 24.2% 140.9 $ 107.7 $ 30.8% Gross Margin 7.8 6.0 32.2% 30.6 22.0 38.7% % of Revenue 21.5% 20.2% 21.7% 20.4% 4th Quarter December YTD
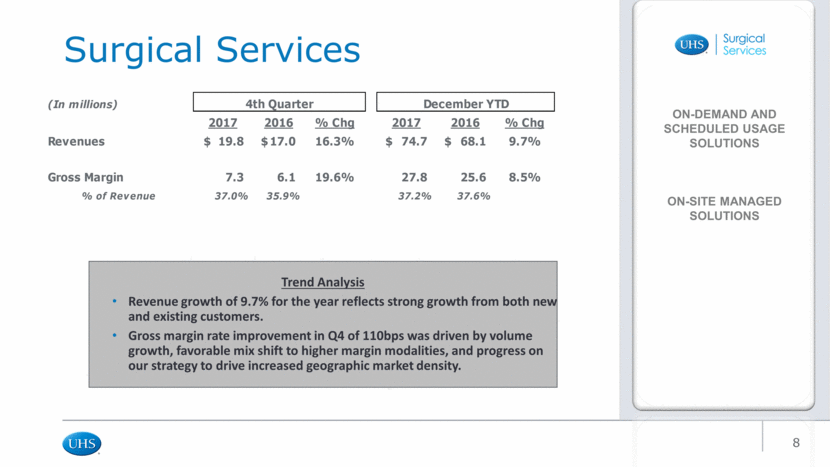
Trend Analysis Revenue growth of 9.7% for the year reflects strong growth from both new and existing customers. Gross margin rate improvement in Q4 of 110bps was driven by volume growth, favorable mix shift to higher margin modalities, and progress on our strategy to drive increased geographic market density. Surgical Services ON-DEMAND AND SCHEDULED USAGE SOLUTIONS ON-SITE MANAGED SOLUTIONS (In millions) 2017 2016 % Chg 2017 2016 % Chg Revenues 19.8 $ 17.0 $ 16.3% 74.7 $ 68.1 $ 9.7% Gross Margin 7.3 6.1 19.6% 27.8 25.6 8.5% % of Revenue 37.0% 35.9% 37.2% 37.6% 4th Quarter December YTD
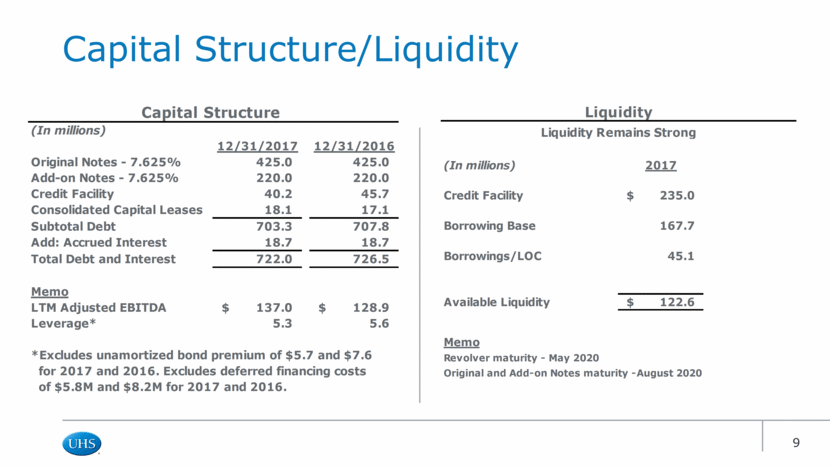
Capital Structure/Liquidity (In millions) 12/31/2017 12/31/2016 Original Notes - 7.625% 425.0 425.0 Add-on Notes - 7.625% 220.0 220.0 Credit Facility 40.2 45.7 Consolidated Capital Leases 18.1 17.1 Subtotal Debt 703.3 707.8 Add: Accrued Interest 18.7 18.7 Total Debt and Interest 722.0 726.5 Memo LTM Adjusted EBITDA 137.0 $ 128.9 $ Leverage* 5.3 5.6 *Excludes unamortized bond premium of $5.7 and $7.6 for 2017 and 2016. Excludes deferred financing costs of $5.8M and $8.2M for 2017 and 2016. Capital Structure (In millions) 2017 Credit Facility 235.0 $ Borrowing Base 167.7 Borrowings/LOC 45.1 Available Liquidity 122.6 $ Memo Revolver maturity - May 2020 Original and Add-on Notes maturity -August 2020 Liquidity Remains Strong Liquidity
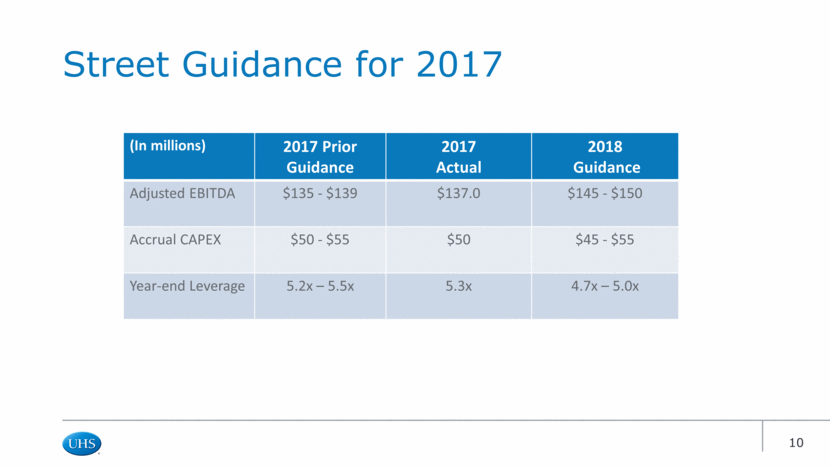
Street Guidance for 2017 (In millions) 2017 Prior Guidance 2017 Actual 2018 Guidance Adjusted EBITDA $135 - $139 $137.0 $145 - $150 Accrual CAPEX $50 - $55 $50 $45 - $55 Year-end Leverage 5.2x – 5.5x 5.3x 4.7x – 5.0x
Appendix EBITDA Reconciliation 2017 & 2016 SG&A Reconciliation Depreciation and Amortization Reconciliation Accrual CAPEX Reconciliation
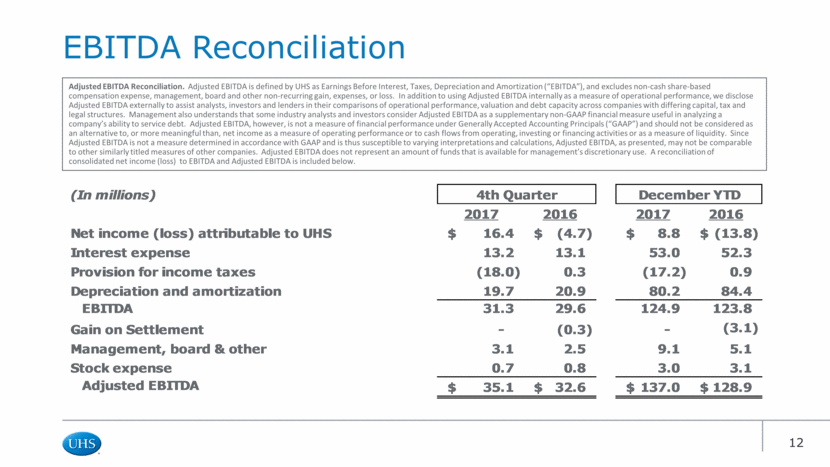
EBITDA Reconciliation Adjusted EBITDA Reconciliation. Adjusted EBITDA is defined by UHS as Earnings Before Interest, Taxes, Depreciation and Amortization (“EBITDA”), and excludes non-cash share-based compensation expense, management, board and other non-recurring gain, expenses, or loss. In addition to using Adjusted EBITDA internally as a measure of operational performance, we disclose Adjusted EBITDA externally to assist analysts, investors and lenders in their comparisons of operational performance, valuation and debt capacity across companies with differing capital, tax and legal structures. Management also understands that some industry analysts and investors consider Adjusted EBITDA as a supplementary non-GAAP financial measure useful in analyzing a company’s ability to service debt. Adjusted EBITDA, however, is not a measure of financial performance under Generally Accepted Accounting Principals (“GAAP”) and should not be considered as an alternative to, or more meaningful than, net income as a measure of operating performance or to cash flows from operating, investing or financing activities or as a measure of liquidity. Since Adjusted EBITDA is not a measure determined in accordance with GAAP and is thus susceptible to varying interpretations and calculations, Adjusted EBITDA, as presented, may not be comparable to other similarly titled measures of other companies. Adjusted EBITDA does not represent an amount of funds that is available for management’s discretionary use. A reconciliation of consolidated net income (loss) to EBITDA and Adjusted EBITDA is included below. (In millions) 2017 2016 2017 2016 Net income (loss) attributable to UHS 16.4 $ (4.7) $ 8.8 $ (13.8) $ Interest expense 13.2 13.1 53.0 52.3 Provision for income taxes (18.0) 0.3 (17.2) 0.9 Depreciation and amortization 19.7 20.9 80.2 84.4 EBITDA 31.3 29.6 124.9 123.8 Gain on Settlement - (0.3) - (3.1) Management, board & other 3.1 2.5 9.1 5.1 Stock expense 0.7 0.8 3.0 3.1 Adjusted EBITDA 35.1 $ 32.6 $ 137.0 $ 128.9 $ December YTD 4th Quarter
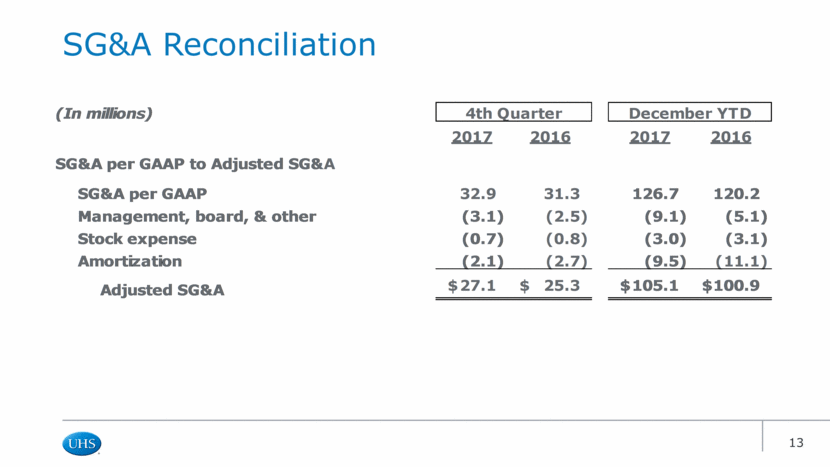
SG&A Reconciliation (In millions) 2017 2016 2017 2016 SG&A per GAAP to Adjusted SG&A SG&A per GAAP 32.9 31.3 126.7 120.2 Management, board, & other (3.1) (2.5) (9.1) (5.1) Stock expense (0.7) (0.8) (3.0) (3.1) Amortization (2.1) (2.7) (9.5) (11.1) Adjusted SG&A 27.1 $ 25.3 $ 105.1 $ 100.9 $ 4th Quarter December YTD
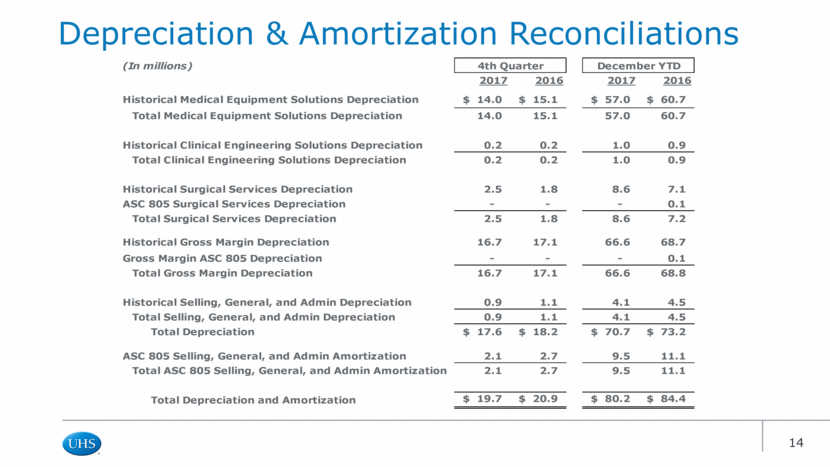
Depreciation & Amortization Reconciliations (In millions) 2017 2016 2017 2016 Historical Medical Equipment Solutions Depreciation 14.0 $ 15.1 $ 57.0 $ 60.7 $ Asset Impairment Charge - - - - Total Medical Equipment Solutions Depreciation 14.0 15.1 57.0 60.7 Historical Clinical Engineering Solutions Depreciation 0.2 0.2 1.0 0.9 Total Clinical Engineering Solutions Depreciation 0.2 0.2 1.0 0.9 Historical Surgical Services Depreciation 2.5 1.8 8.6 7.1 ASC 805 Surgical Services Depreciation - - - 0.1 Total Surgical Services Depreciation 2.5 1.8 8.6 7.2 Historical Gross Margin Depreciation 16.7 17.1 66.6 68.7 Gross Margin ASC 805 Depreciation - - - 0.1 Total Gross Margin Depreciation 16.7 17.1 66.6 68.8 Historical Selling, General, and Admin Depreciation 0.9 1.1 4.1 4.5 Total Selling, General, and Admin Depreciation 0.9 1.1 4.1 4.5 Total Depreciation 17.6 $ 18.2 $ 70.7 $ 73.2 $ ASC 805 Selling, General, and Admin Amortization 2.1 2.7 9.5 11.1 Total ASC 805 Selling, General, and Admin Amortization 2.1 2.7 9.5 11.1 Total Depreciation and Amortization 19.7 $ 20.9 $ 80.2 $ 84.4 $ December YTD 4th Quarter
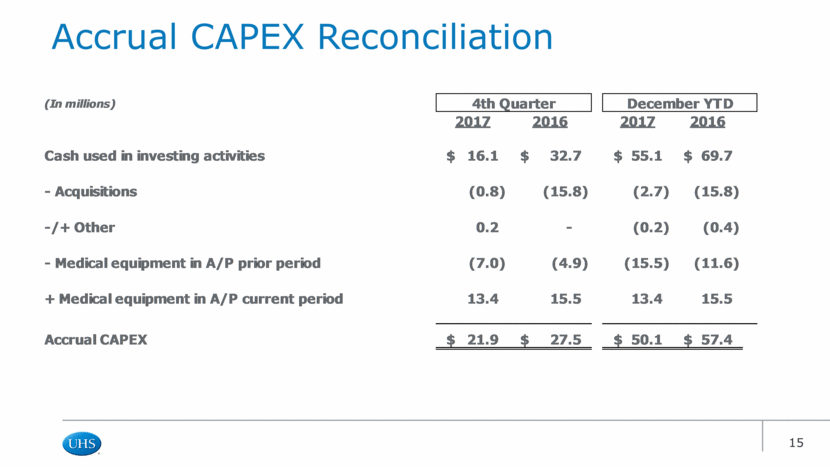
Accrual CAPEX Reconciliation
Thank you.

