Attached files
| file | filename |
|---|---|
| EX-10.1 - EX-10.1 - Agiliti Health, Inc. | a10-6057_1ex10d1.htm |
| EX-31.2 - EX-31.2 - Agiliti Health, Inc. | a10-6057_1ex31d2.htm |
| EX-32.1 - EX-32.1 - Agiliti Health, Inc. | a10-6057_1ex32d1.htm |
| EX-32.2 - EX-32.2 - Agiliti Health, Inc. | a10-6057_1ex32d2.htm |
| EX-10.2 - EX-10.2 - Agiliti Health, Inc. | a10-6057_1ex10d2.htm |
| EX-10.3 - EX-10.3 - Agiliti Health, Inc. | a10-6057_1ex10d3.htm |
| EX-31.1 - EX-31.1 - Agiliti Health, Inc. | a10-6057_1ex31d1.htm |
UNITED STATES
SECURITIES AND EXCHANGE COMMISSION
Washington, D.C. 20549
FORM 10-Q
(Mark One)
|
x |
Quarterly Report pursuant to Section 13 or 15(d) of the Securities Exchange Act of 1934 |
|
|
|
|
for the quarterly period ended March 31, 2010 |
|
|
|
|
|
or |
|
|
|
|
|
o |
Transition Report pursuant to Section 13 or 15(d) of the Securities Exchange Act of 1934 |
for the transition period from to
Commission File Number: 000-20086
UNIVERSAL HOSPITAL SERVICES, INC.
(Exact name of registrant as specified in its charter)
|
Delaware |
|
41-0760940 |
|
(State or other jurisdiction of |
|
(I.R.S. Employer |
|
incorporation or organization) |
|
Identification No.) |
7700 France Avenue South, Suite 275
Edina, Minnesota 55435-5228
(Address of principal executive offices, including zip code)
(952) 893-3200
(Registrant’s telephone number, including area code)
Not Applicable
(Former name, former address, and former fiscal year, if changed since last report)
Indicate by check mark whether the registrant: (1) has filed all reports required to be filed by Section 13 or 15(d) of the Securities Exchange Act of 1934 during the preceding 12 months (or for such shorter period that the registrant was required to file such reports), and (2) has been subject to such filing requirements for the past 90 days. Yes o No x
Indicate by check mark whether the registrant has submitted electronically and posted on its corporate Web site, if any, every Interactive Data File required to be submitted and posted pursuant to Rule 405 of Regulation S-T (§ 232.405 of this chapter) during the preceding 12 months (or for such shorter period that the registrant was required to submit and post such files). Yes o No o
Indicate by check mark whether the registrant is a large accelerated filer, an accelerated filer, a non-accelerated filer or a smaller reporting company. See definitions of “large accelerated filer,” “accelerated filer” and “smaller reporting company” in Rule 12b-2 of the Exchange Act (Check one):
|
Large accelerated filer o |
|
Accelerated filer o |
|
|
|
|
|
Non-accelerated filer x |
|
Smaller reporting company o |
|
(Do not check if a smaller reporting company) |
|
|
Indicate by check mark whether the registrant is a shell company (as defined in Rule 12b-2 of the Exchange Act). Yes o No x
Number of shares of common stock outstanding as of May 1, 2010: 1,000
Universal Hospital Services, Inc.
|
|
|
Page |
|
|
|
|||
|
|
|
|
|
|
|
|||
|
|
3 |
||
|
|
|
|
|
|
|
Statements of Operations – Three Months Ended March 31, 2010 and 2009 |
4 |
|
|
|
|
|
|
|
|
Statements of Cash Flows – Three Months Ended March 31, 2010 and 2009 |
5 |
|
|
|
|
|
|
|
Management’s Discussion and Analysis of Financial Condition and Results of Operations |
15 |
||
|
|
|
|
|
|
27 |
|||
|
|
|
|
|
|
27 |
|||
|
|
|
|
|
|
|
|||
|
|
|
|
|
|
28 |
|||
|
|
|
|
|
|
28 |
|||
|
|
|
|
|
|
28 |
|||
|
|
|
|
|
|
28 |
|||
|
|
|
|
|
|
ITEM 4. |
Removed and Reserved |
|
|
|
|
|
|
|
|
28 |
|||
|
|
|
|
|
|
30 |
|||
|
|
|
|
|
|
31 |
|||
PART I - FINANCIAL INFORMATION
Item 1. Financial Statements – Unaudited
Universal Hospital Services, Inc.
(in thousands, except share and per share information)
(unaudited)
|
|
|
March 31, |
|
December 31, |
|
||
|
|
|
2010 |
|
2009 |
|
||
|
Assets |
|
|
|
|
|
||
|
Current assets: |
|
|
|
|
|
||
|
Cash and cash equivalents |
|
$ |
122 |
|
$ |
— |
|
|
Accounts receivable, less allowance for doubtful accounts of $2,450 at March 31, 2010 and December 31, 2009 |
|
58,528 |
|
60,079 |
|
||
|
Inventories |
|
5,195 |
|
5,236 |
|
||
|
Deferred income taxes |
|
8,040 |
|
8,733 |
|
||
|
Other current assets |
|
3,285 |
|
2,983 |
|
||
|
Total current assets |
|
75,170 |
|
77,031 |
|
||
|
|
|
|
|
|
|
||
|
Property and equipment, net: |
|
|
|
|
|
||
|
Medical equipment, net |
|
210,833 |
|
197,859 |
|
||
|
Property and office equipment, net |
|
19,939 |
|
19,406 |
|
||
|
Total property and equipment, net |
|
230,772 |
|
217,265 |
|
||
|
|
|
|
|
|
|
||
|
Other long-term assets: |
|
|
|
|
|
||
|
Goodwill |
|
280,211 |
|
280,211 |
|
||
|
Other intangibles, net |
|
245,263 |
|
248,653 |
|
||
|
Other, primarily deferred financing costs, net |
|
11,749 |
|
12,243 |
|
||
|
Total assets |
|
$ |
843,165 |
|
$ |
835,403 |
|
|
|
|
|
|
|
|
||
|
Liabilities and Shareholders’ Equity |
|
|
|
|
|
||
|
Current liabilities: |
|
|
|
|
|
||
|
Current portion of long-term debt |
|
$ |
3,931 |
|
$ |
4,062 |
|
|
Book overdrafts |
|
3,414 |
|
3,302 |
|
||
|
Accounts payable |
|
14,752 |
|
18,075 |
|
||
|
Accrued compensation |
|
9,370 |
|
10,432 |
|
||
|
Accrued interest |
|
14,043 |
|
3,696 |
|
||
|
Other accrued expenses |
|
9,804 |
|
9,174 |
|
||
|
Total current liabilities |
|
55,314 |
|
48,741 |
|
||
|
|
|
|
|
|
|
||
|
Long-term debt, less current portion |
|
519,666 |
|
514,557 |
|
||
|
Pension and other long-term liabilities |
|
6,487 |
|
6,465 |
|
||
|
Interest rate swap |
|
21,133 |
|
21,286 |
|
||
|
Payable to Parent |
|
6,680 |
|
6,342 |
|
||
|
Deferred income taxes |
|
62,082 |
|
64,021 |
|
||
|
|
|
|
|
|
|
||
|
Commitments and contingencies (Note 7) |
|
|
|
|
|
||
|
|
|
|
|
|
|
||
|
Shareholders’ equity |
|
|
|
|
|
||
|
Common stock, $0.01 par value; 1,000 shares authorized, issued and outstanding at March 31, 2010 and December 31, 2009 |
|
— |
|
— |
|
||
|
Additional paid-in capital |
|
248,794 |
|
248,794 |
|
||
|
Accumulated deficit |
|
(60,445 |
) |
(58,165 |
) |
||
|
Accumulated other comprehensive loss |
|
(16,546 |
) |
(16,638 |
) |
||
|
Total shareholders’ equity |
|
171,803 |
|
173,991 |
|
||
|
Total liabilities and shareholders’ equity |
|
$ |
843,165 |
|
$ |
835,403 |
|
The accompanying notes are an integral part of the unaudited financial statements.
Universal Hospital Services, Inc.
(in thousands)
(unaudited)
|
|
|
Three Months Ended |
|
||||
|
|
|
March 31, |
|
||||
|
|
|
2010 |
|
2009 |
|
||
|
Revenue |
|
|
|
|
|
||
|
Medical equipment outsourcing |
|
$ |
65,174 |
|
$ |
58,282 |
|
|
Technical and professional services |
|
10,813 |
|
10,412 |
|
||
|
Medical equipment sales and remarketing |
|
4,187 |
|
5,236 |
|
||
|
Total revenues |
|
80,174 |
|
73,930 |
|
||
|
|
|
|
|
|
|
||
|
Cost of Sales |
|
|
|
|
|
||
|
Cost of medical equipment outsourcing |
|
22,617 |
|
20,469 |
|
||
|
Cost of technical and professional services |
|
7,784 |
|
7,370 |
|
||
|
Cost of medical equipment sales and remarketing |
|
3,347 |
|
4,386 |
|
||
|
Medical equipment depreciation |
|
17,457 |
|
15,862 |
|
||
|
Total costs of medical equipment outsourcing, technical and professional services and medical equipment sales and remarketing |
|
51,205 |
|
48,087 |
|
||
|
|
|
|
|
|
|
||
|
Gross margin |
|
28,969 |
|
25,843 |
|
||
|
|
|
|
|
|
|
||
|
Selling, general and administrative |
|
21,070 |
|
22,015 |
|
||
|
Operating income |
|
7,899 |
|
3,828 |
|
||
|
|
|
|
|
|
|
||
|
Interest expense |
|
11,507 |
|
11,717 |
|
||
|
Loss before income taxes |
|
(3,608 |
) |
(7,889 |
) |
||
|
|
|
|
|
|
|
||
|
Benefit for income taxes |
|
(1,328 |
) |
(3,099 |
) |
||
|
Net loss |
|
$ |
(2,280 |
) |
$ |
(4,790 |
) |
The accompanying notes are an integral part of the unaudited financial statements.
Universal Hospital Services, Inc.
(in thousands)
(unaudited)
|
|
|
Three Months Ended |
|
||||
|
|
|
March 31, |
|
||||
|
|
|
2010 |
|
2009 |
|
||
|
Cash flows from operating activities: |
|
|
|
|
|
||
|
Net loss |
|
$ |
(2,280 |
) |
$ |
(4,790 |
) |
|
Adjustments to reconcile net loss to net cash provided by operating activities: |
|
|
|
|
|
||
|
Depreciation |
|
19,570 |
|
17,995 |
|
||
|
Amortization of intangibles and deferred financing costs |
|
3,992 |
|
4,428 |
|
||
|
Provision for doubtful accounts |
|
(28 |
) |
587 |
|
||
|
Provision for inventory obsolescence |
|
86 |
|
(22 |
) |
||
|
Non-cash stock-based compensation expense |
|
338 |
|
623 |
|
||
|
Loss on sales and disposals of equipment |
|
98 |
|
137 |
|
||
|
Deferred income taxes |
|
(1,308 |
) |
(2,705 |
) |
||
|
Changes in operating assets and liabilities: |
|
|
|
|
|
||
|
Accounts receivable |
|
1,578 |
|
(781 |
) |
||
|
Inventories |
|
(45 |
) |
222 |
|
||
|
Other operating assets |
|
(410 |
) |
(725 |
) |
||
|
Accounts payable |
|
(1,116 |
) |
(2,795 |
) |
||
|
Other operating liabilities |
|
9,937 |
|
6,377 |
|
||
|
Net cash provided by operating activities |
|
30,412 |
|
18,551 |
|
||
|
Cash flows from investing activities: |
|
|
|
|
|
||
|
Medical equipment purchases |
|
(33,328 |
) |
(10,164 |
) |
||
|
Property and office equipment purchases |
|
(1,167 |
) |
(674 |
) |
||
|
Proceeds from disposition of property and equipment |
|
602 |
|
951 |
|
||
|
Net cash used in investing activities |
|
(33,893 |
) |
(9,887 |
) |
||
|
Cash flows from financing activities: |
|
|
|
|
|
||
|
Proceeds under senior secured credit facility |
|
42,150 |
|
42,000 |
|
||
|
Payments under senior secured credit facility |
|
(37,450 |
) |
(21,000 |
) |
||
|
Payments of principal under capital lease obligations |
|
(1,209 |
) |
(1,171 |
) |
||
|
Change in book overdrafts |
|
112 |
|
(7,099 |
) |
||
|
Net cash provided by financing activities |
|
3,603 |
|
12,730 |
|
||
|
Net change in cash and cash equivalents |
|
122 |
|
21,394 |
|
||
|
|
|
|
|
|
|
||
|
Cash and cash equivalents at the beginning of period |
|
— |
|
12,006 |
|
||
|
Cash and cash equivalents at the end of period |
|
$ |
122 |
|
$ |
33,400 |
|
|
|
|
|
|
|
|
||
|
Supplemental cash flow information: |
|
|
|
|
|
||
|
Interest paid |
|
$ |
559 |
|
$ |
774 |
|
|
Income taxes paid |
|
$ |
107 |
|
$ |
30 |
|
|
Non-cash activities: |
|
|
|
|
|
||
|
Medical equipment purchases included in accounts payable (at end of period) |
|
$ |
2,489 |
|
$ |
2,256 |
|
|
Capital lease additions |
|
$ |
1,487 |
|
$ |
985 |
|
The accompanying notes are an integral part of the unaudited financial statements.
Universal Hospital Services, Inc.
NOTES TO UNAUDITED QUARTERLY FINANCIAL STATEMENTS
1. Basis of Presentation
The interim financial statements included in this Quarterly Report on Form 10-Q have been prepared by Universal Hospital Services, Inc. (“we,” “our”, “us”, the “Company”, or “UHS”) without audit, pursuant to the rules and regulations of the Securities and Exchange Commission (the “SEC”). Certain information and footnote disclosures normally included in financial statements prepared in accordance with accounting principles generally accepted in the United States of America (“GAAP”) have been condensed or omitted, pursuant to such rules and regulations. These condensed financial statements should be read in conjunction with the financial statements and related notes included in the Company’s 2009 Annual Report on Form 10-K (“2009 Form 10-K”), filed with the SEC.
The interim financial statements presented herein as of March 31, 2010, reflect, in the opinion of management, all adjustments necessary for a fair presentation of the financial position and the results of operations and cash flows for the periods presented. These adjustments are all of a normal, recurring nature. The results of operations for any interim period are not necessarily indicative of results for the full year.
The December 31, 2009 balance sheet amounts were derived from audited financial statements, but do not include all disclosures required by GAAP.
We are required to make estimates and assumptions about future events in preparing financial statements in conformity with GAAP. These estimates and assumptions affect the amounts of assets, liabilities, revenues and expenses at the date of the unaudited condensed financial statements. While we believe that our past estimates and assumptions have been materially accurate, our current estimates are subject to change if different assumptions as to the outcome of future events are made. We evaluate our estimates and judgments on an ongoing basis and predicate those estimates and judgments on historical experience and on various other factors that we believe to be reasonable under the circumstances. We make adjustments to our assumptions and judgments when facts and circumstances dictate. Since future events and their effects cannot be determined with absolute certainty, actual results may differ from the estimates used in preparing the accompanying unaudited condensed financial statements.
A description of our critical accounting policies is included in our 2009 Form 10-K. There have been no material changes to these policies for the quarter ended March 31, 2010.
2. Comprehensive Loss
Comprehensive loss is comprised of net loss and other comprehensive income (loss). Other comprehensive income (loss) includes unrealized gains from derivatives designated as cash flow hedges and minimum pension liability adjustments. Accumulated other comprehensive loss is displayed separately on the balance sheets. A reconciliation of net loss to comprehensive loss is provided below:
|
|
|
Three Months Ended |
|
||||
|
|
|
March 31, |
|
||||
|
(in thousands) |
|
2010 |
|
2009 |
|
||
|
Net loss |
|
$ |
(2,280 |
) |
$ |
(4,790 |
) |
|
Unrealized gain on cash flow hedge, net of tax |
|
92 |
|
622 |
|
||
|
Comprehensive loss |
|
$ |
(2,188 |
) |
$ |
(4,168 |
) |
3. Recent Accounting Pronouncement
Standard Issued Not Yet Adopted
In October 2009, the Financial Accounting Standards Board (“FASB”) issued Accounting Standards Update (“ASU”), 2009-13, Revenue Recognition (Topic 605): Multiple Deliverable Revenue Arrangements — A Consensus of the FASB Emerging Issues Task Force.” This update provides application guidance on whether multiple deliverables exist, how the deliverables should be separated and how the consideration should be allocated to one or more units of accounting. This update establishes a selling price hierarchy for determining the selling price of a deliverable. The selling price used for each deliverable will be based on vendor-specific objective evidence, if available, third-party evidence if vendor-specific objective evidence is not available, or estimated selling price if neither vendor-specific or third-party evidence is available. The Company will be required to apply this guidance prospectively for revenue arrangements entered into or materially modified after January 1, 2011. The Company is currently evaluating the impact of the provisions of ASU 2009-13 on the Company’s Financial Statements.
4. Fair Value Measurements
Financial assets and liabilities measured at fair value on a recurring basis as of March 31, 2010 and December 31, 2009, in accordance with Accounting Standards Codification (“ASC”) Topic 820, are summarized in the following table by type of inputs applicable to the fair value measurements:
|
|
|
Fair Value at March 31, 2010 |
|
Fair Value at December 31, 2009 |
|
||||||||||||||||||||
|
(in thousands) |
|
Level 1 |
|
Level 2 |
|
Level 3 |
|
Total |
|
Level 1 |
|
Level 2 |
|
Level 3 |
|
Total |
|
||||||||
|
Interest Rate Swap |
|
$ |
— |
|
$ |
21,133 |
|
$ |
— |
|
$ |
21,133 |
|
$ |
— |
|
$ |
21,286 |
|
$ |
— |
|
$ |
21,286 |
|
A description of the inputs used in the valuation of assets and liabilities is summarized as follows:
Level 1 – Inputs represent unadjusted quoted prices for identical assets or liabilities exchanged in active markets.
Level 2 – Inputs include directly or indirectly observable inputs other than Level 1 inputs such as quoted prices for similar assets or liabilities exchanged in active or inactive markets; quoted prices for identical assets or liabilities exchanged in inactive markets; other inputs that are considered in fair value determinations of the assets or liabilities, such as interest rates and yield curves that are observable at commonly quoted intervals, volatilities, prepayment speeds, loss severities, credit risks and default rates;
and inputs that are derived principally from or corroborated by observable market data by correlation or other means.
Level 3 – Inputs include unobservable inputs used in the measurement of assets and liabilities. Management is required to use its own assumptions regarding unobservable inputs because there is little, if any, market activity in the assets or liabilities or related observable inputs that can be corroborated at the measurement date. Measurements of nonexchange traded derivative contract assets and liabilities are primarily based on valuation models, discounted cash flow models or other valuation techniques that are believed to be used by market participants. Unobservable inputs require management to make certain projections and assumptions about the information that would be used by market participants in pricing assets or liabilities.
Fair Value of Other Financial Instruments
The Company considers the carrying amount of financial instruments, including accounts receivable, accounts payable and accrued liabilities, as the approximate fair value due to their short maturities. The fair value of our outstanding PIK Toggle Notes, Floating Rate Notes and 10.125% Senior Notes, based on the quoted market price for the same or similar issues of debt, is approximately:
|
|
|
March 31, |
|
December 31, |
|
||
|
(in millions) |
|
2010 |
|
2009 |
|
||
|
PIK Toggle Notes |
|
$ |
229.4 |
|
$ |
227.1 |
|
|
Floating Rate Notes |
|
195.5 |
|
193.8 |
|
||
|
10.125% Senior Notes |
|
9.8 |
|
9.8 |
|
||
5. Stock-Based Compensation
During the quarter ended March 31, 2010, activity under the 2007 Stock Option Plan of UHS Holdco, Inc., our parent company (“Parent”) was as follows:
|
(in thousands except exercise price) |
|
Number of |
|
Weighted |
|
Aggregate |
|
Weighted |
|
||
|
Outstanding at December 31, 2009 |
|
37,527 |
|
$ |
1.00 |
|
$ |
35,651 |
|
7.5 |
|
|
Forfeited or expired |
|
(117 |
) |
$ |
1.00 |
|
|
|
|
|
|
|
|
|
|
|
|
|
|
|
|
|
||
|
Outstanding at March 31, 2010 |
|
37,410 |
|
$ |
1.00 |
|
$ |
31,050 |
|
7.3 |
|
|
|
|
|
|
|
|
|
|
|
|
||
|
Exercisable at March 31, 2010 |
|
15,003 |
|
$ |
1.00 |
|
$ |
12,452 |
|
7.2 |
|
|
|
|
|
|
|
|
|
|
|
|
||
|
Remaining authorized options available for issue |
|
6,495 |
|
|
|
|
|
|
|
||
The intrinsic value of a stock award is the amount by which the market value of the underlying stock exceeds the exercise price of the award.
Although Parent grants stock options, the Company recognizes compensation expense related to these options since the services are performed for its benefit. For the quarters ended March 31, 2010 and
2009, we recognized non-cash stock compensation expense of $0.3 and $0.6 million, respectively, which is primarily included in selling, general and administrative expenses. At March 31, 2010, unearned non-cash stock-based compensation related to our fixed vesting options, that we expect to recognize as expense over the next 3.0 years, totals approximately $3.7 million, net of our estimated forfeiture rate of 2.0%. Unearned non-cash stock-based compensation related to the performance vesting options totaling approximately $4.8 million, net of our estimated forfeiture rate of 2.0%, would be recognized over the next 5.8 years only if the performance targets are met. The expense could be accelerated upon the sale of Parent or the Company.
Compensation expense related to service provided by the Company’s employees is recognized in the accompanying Statements of Operations with an offsetting Payable to Parent liability, which is not expected to be settled within the next twelve months.
6. Long-Term Debt
Long-term debt consists of the following:
|
|
|
March 31, |
|
December 31, |
|
||
|
(in thousands) |
|
2010 |
|
2009 |
|
||
|
PIK Toggle Notes |
|
$ |
230,000 |
|
$ |
230,000 |
|
|
Floating Rate Notes |
|
230,000 |
|
230,000 |
|
||
|
Senior secured credit facility |
|
43,100 |
|
38,400 |
|
||
|
10.125% Senior Notes |
|
9,945 |
|
9,945 |
|
||
|
Capital lease obligations |
|
10,552 |
|
10,274 |
|
||
|
|
|
523,597 |
|
518,619 |
|
||
|
Less: Current portion of long-term debt |
|
(3,931 |
) |
(4,062 |
) |
||
|
Total long-term debt |
|
$ |
519,666 |
|
$ |
514,557 |
|
PIK Toggle Notes. Our 8.50% / 9.25% PIK Toggle Notes (the “PIK Toggle Notes”) were issued on May 31, 2007 in the aggregate principal amount of $230.0 million under a Second Lien Senior Indenture dated as of May 31, 2007, between the Company and Wells Fargo Bank, National Association, as trustee (the “Second Lien Senior Indenture”). The PIK Toggle Notes mature on June 1, 2015. Interest on the PIK Toggle Notes is payable semiannually in arrears on each June 1 and December 1. For any interest payment period through June 1, 2011, the Company may, at its option, elect to pay interest on the PIK Toggle Notes entirely in cash (“Cash Interest”), entirely by increasing the principal amount of the outstanding PIK Toggle Notes, by issuing additional PIK Toggle Notes (“PIK Interest”) or 50% Cash Interest and 50% PIK Interest. Cash Interest on the PIK Toggle Notes accrues at the rate of 8.50% per annum. PIK Interest on the PIK Toggle Notes accrues at the rate of 9.25% per annum. After June 1, 2011, the Company is required to make all interest payments on the PIK Toggle Notes entirely as Cash Interest. The PIK Toggle Notes are redeemable, at the Company’s option, in whole or in part, at specified redemption prices (as defined in the Second Lien Senior Indenture) plus accrued interest to the date of redemption. In addition, the PIK Toggle Notes have a change of control provision, which gives each holder the right to require the Company to purchase all or a portion of such holders’ PIK Toggle Notes upon a change in control, as defined in the Second Lien Senior Indenture, at a purchase price equal to 101% of the principal amount plus accrued interest to the date of purchase. The PIK Toggle Notes, subject to certain definitions and exceptions, have covenants that restrict, among other things, the
incurrence of additional debt, the payment of dividends and the issuance of preferred stock. The PIK Toggle Notes are uncollateralized.
Floating Rate Notes. Our-Floating Rate Notes (the “Floating Rate Notes”) were issued on May 31, 2007 in the aggregate principal amount of $230.0 million under the Second Lien Senior Indenture. The Floating Rate Notes mature on June 1, 2015. Interest on the Floating Rate Notes is payable semiannually in arrears on each June 1 and December 1. Interest on the Floating Rate Notes is reset for each semi-annual interest period and is calculated at the current LIBOR rate plus 3.375%. At March 31, 2010, our LIBOR-based rate was 3.859%, which includes the credit spread. The Floating Rate Notes are redeemable, at the Company’s option, in whole or in part, at specified redemption prices (as defined in the Second Lien Senior Indenture) plus accrued interest to the date of redemption. In addition, the Floating Rate Notes have a change of control provision, which gives each holder the right to require the Company to purchase all or a portion of such holders’ Floating Rate Notes upon a change in control, as defined in the Second Lien Senior Indenture, at a purchase price equal to 101% of the principal amount plus accrued interest to the date of purchase. The Floating Rate Notes, subject to certain definitions and exceptions, have covenants that restrict, among other things, the incurrence of additional debt, the payment of dividends and the issuance of preferred stock. The Floating Rate Notes are uncollateralized.
Interest Rate Swap. In June 2007, we entered into an interest rate swap agreement for $230.0 million, which has the effect of converting the interest rate applicable to our $230.0 million of Floating Rate Notes to a fixed interest rate. The effective date for the interest rate swap agreement was December 2007 and the expiration date is May 2012.
The interest rate swap agreement qualifies for cash flow hedge accounting under ASC Topic 815, “Derivatives and Hedging.” Both at inception and on an on-going basis, we must perform an effectiveness test. In accordance with ASC Topic 815, the fair value of the interest rate swap agreement at March 31, 2010 is included as a cash flow hedge on our balance sheet. The change in fair value was recorded as a component of accumulated other comprehensive loss on our balance sheet, net of tax, since the instrument was determined to be an effective hedge at March 31, 2010. We expect to reclassify approximately $6.2 million into earnings, currently recorded in accumulated other comprehensive loss, in the next 12 months.
As a result of our interest rate swap agreement, we expect the effective interest rate on our $230.0 million Floating Rate Notes to be 9.065% through May 2012.
Senior Secured Credit Facility. Our senior secured credit facility is a first lien senior secured asset-based revolving credit facility that allows for borrowings up to $135.0 million, as defined in the credit agreement dated May 31, 2007 between the Company and a group of financial institutions. The senior secured credit facility terminates on May 31, 2013. As of March 31, 2010, we had $88.3 million of availability under the senior secured credit facility based on a borrowing base of $135.0 million, less borrowings of $43.1 million, and after giving effect to $3.6 million used for letters of credit. Our obligations under the senior secured credit facility are secured by a first priority security interest in substantially all of our assets, excluding a pledge of our and Parent’s capital stock, any joint ventures and certain other exceptions. Our obligations under the senior secured credit facility are unconditionally guaranteed by Parent.
Borrowings under the senior secured credit facility accrue interest (including a credit spread varying with facility usage):
· at a per annum rate equal to 0.50% above the rate announced from time to time by the agent as the “prime rate” payable quarterly in arrears; and
· at a per annum rate equal to 1.50% above the adjusted LIBOR rate used by the agent, for the respective interest rate period determined at our option, payable in arrears upon cessation of the interest rate period elected.
At March 31, 2010, we had an outstanding balance under our prime rate which was accruing interest at 3.750%, which includes the credit spread noted above. At March 31, 2010, we had outstanding balances under LIBOR-based rates which were accruing interest at rates ranging from 1.730% to 1.748%, each of which include the credit spread noted above.
On May 6, 2010 we extended, amended and restated our senior secured credit facility. For additional information, see Note 11, Subsequent Events.
10.125% Senior Notes. Our 10.125% Senior Notes (the “Senior Notes”) mature on November 1, 2011. Interest on the Senior Notes is payable semiannually, in arrears, on May 1 and November 1. Interest accrues at the rate of 10.125% per annum. The Senior Notes are redeemable, at the Company’s option, in whole or in part of, at specified redemption prices (as defined) plus accrued interest to the date of redemption. The Senior Notes are uncollateralized.
7. Commitments and Contingencies
The Company, from time to time, may become involved in litigation arising out of operations in the normal course of business. Asserted claims are subject to many uncertainties and the outcome of individual matters is not predictable with assurance.
On October 19, 2009, Freedom Medical, Inc. filed a lawsuit against the Company and others in U.S. District Court for the Eastern District of Texas. The federal complaint alleges violation of state and federal antitrust laws, tortuous interference with business relationships, business disparagement and common law conspiracy. Freedom Medical, Inc. is seeking unspecified damages and injunctive relief. Although it is not possible to reliably predict the outcome of the lawsuit, we believe that we have meritorious defenses against the claims and will vigorously defend against them.
As of March 31, 2010, we were not a party to any other pending legal proceedings the adverse outcome of which could reasonably be expected to have a material adverse effect on our operating results, financial position or cash flows.
8. Related Party Transactions
Management Agreement
On May 31, 2007, we and Irving Place Capital entered into a professional services agreement pursuant to which Irving Place Capital provides general advisory and management services to us with respect to financial and operating matters. Irving Place Capital is a principal owner of Parent, and the following members of our board of directors are associated with Irving Place Capital: John Howard, Robert Juneja, Bret Bowerman and David Crane. We paid Irving Place Capital professional services fees of $0.2 million and $0.2 million for the quarters ended March 31, 2010 and 2009, respectively.
Business Relationship
In the ordinary course of business, we entered into an operating lease for our Minneapolis, Minnesota district office with Ryan Companies US, Inc. (“Ryan”), which began on May 1, 2007. One of our board of directors is also a director of Ryan. We made payments to Ryan totaling $84,000 and $78,000 during the quarters ended March 31, 2010 and 2009, respectively.
One of our directors, who joined the Board of Directors on April 1, 2008, is also a director of Broadlane, Inc. (“Broadlane”), a health care group purchasing organization that serves many of our customers. During the quarters ended March 31, 2010 and 2009, we paid administrative fees to Broadlane of approximately $155,000 and $130,000, respectively. On March 31, 2010, accounts payable includes approximately $53,000 in amounts due to Broadlane.
The Company believes that the aforementioned arrangements and relationships were provided in the ordinary course of business at prices and on terms similar to those that would result from arm’s length negotiation between unrelated parties.
9. Segment Information
Our reporting segments consist of Medical Equipment Outsourcing, Technical and Professional Services, and Medical Equipment Sales and Remarketing. Certain operating information for our segments as well as a reconciliation of total Company gross margin to loss before income tax was as follows:
|
Medical Equipment Outsourcing (in thousands) |
|
||||||
|
|
|
|
|
|
|
||
|
|
|
Three Months Ended |
|
||||
|
|
|
2010 |
|
2009 |
|
||
|
Revenues |
|
$ |
65,174 |
|
$ |
58,282 |
|
|
Cost of revenue |
|
22,617 |
|
20,469 |
|
||
|
Medical equipment depreciation |
|
17,457 |
|
15,862 |
|
||
|
Gross margin |
|
$ |
25,100 |
|
$ |
21,951 |
|
|
Technical and Professional Services (in thousands) |
|||||||
|
|
|
|
|
|
|
||
|
|
|
Three Months Ended |
|
||||
|
|
|
2010 |
|
2009 |
|
||
|
Revenues |
|
$ |
10,813 |
|
$ |
10,412 |
|
|
Cost of revenue |
|
7,784 |
|
7,370 |
|
||
|
Gross margin |
|
$ |
3,029 |
|
$ |
3,042 |
|
|
Medical Equipment Sales and Remarketing (in thousands) |
|||||||
|
|
|
|
|
|
|
||
|
|
|
Three Months Ended |
|
||||
|
|
|
2010 |
|
2009 |
|
||
|
Revenues |
|
$ |
4,187 |
|
$ |
5,236 |
|
|
Cost of revenue |
|
3,347 |
|
4,386 |
|
||
|
Gross margin |
|
$ |
840 |
|
$ |
850 |
|
|
Total Gross Margin and Reconciliation to Loss Before Income Tax (in thousands) |
|||||||
|
|
|
|
|
|
|
||
|
|
|
Three Months Ended |
|
||||
|
|
|
2010 |
|
2009 |
|
||
|
Total gross margin |
|
$ |
28,969 |
|
$ |
25,843 |
|
|
Selling, general and administrative |
|
21,070 |
|
22,015 |
|
||
|
Interest expense |
|
11,507 |
|
11,717 |
|
||
|
Loss before income tax |
|
$ |
(3,608 |
) |
$ |
(7,889 |
) |
10. Pension Plan
The components of net periodic pension costs are as follows:
|
|
|
Three Months Ended |
|
||||
|
(in thousands) |
|
2010 |
|
2009 |
|
||
|
Interest cost |
|
$ |
270 |
|
$ |
266 |
|
|
Expected return on plan assets |
|
(301 |
) |
(303 |
) |
||
|
Recognized net actuarial loss |
|
37 |
|
2 |
|
||
|
Net periodic cost (benefit) |
|
$ |
6 |
|
$ |
(35 |
) |
Future benefit accruals for all participants were frozen as of December 31, 2002.
11. Subsequent Events
Amended and Restated Credit Agreement
On May 6, 2010 we entered into an Amended and Restated Credit Agreement with GE Business Financial Services, Inc., as agent for the lenders, and the lenders party thereto (the “Amended Credit Agreement”), which amended the senior secured credit facility dated as of May 31, 2007. The amendment increased the aggregate amount the Company may obtain under revolving loans from $135.0 million to $195.0 million and extended the maturity date to November 30, 2014. The Company’s obligations under the Amended Credit Agreement are secured by a first priority security interest in substantially all of the Company’s assets, excluding a pledge of its and Parent’s stock, any joint ventures and certain other exceptions. The Company’s obligations under the Amended Credit Agreement are unconditionally guaranteed by Parent.
Under the Amended Credit Agreement, up to $195.0 million is available for working capital and general corporate purposes, including permitted investments, capital expenditures and debt repayments, on a fully revolving basis, subject to the terms and conditions set forth in the credit documents in the form of revolving loans, swing line loans and letters of credit. The availability under the Amended Credit Agreement is subject to a borrowing base calculated on the basis of certain of the Company’s eligible accounts receivable, inventory and equipment.
Borrowings under the Amended Credit Agreement bear interest at a floating per annum rate, at our election, equal to LIBOR plus 2.75% or prime rate plus 1.75%, each of which are subject to credit facility usage.
The Amended Credit Agreement requires our compliance with various affirmative and negative covenants. Pursuant to the affirmative covenants, we and Parent will, among other things, deliver financial and other information to the agent, provide notice of certain events (including events of default), pay our obligations, maintain our properties, maintain the security interest in the collateral for the benefit of the agent and the lenders and maintain insurance.
Among other restrictions, and subject to certain definitions and exceptions, the Amended Credit Agreement restricts our ability to:
· incur indebtedness;
· create or permit liens;
· declare or pay dividends and certain other restricted payments;
· consolidate, merge or recapitalize;
· acquire or sell assets;
· make certain investments, loans or other advances;
· enter into transactions with affiliates;
· change our line of business; and
· enter into hedging transactions.
The Amended Credit Agreement also contains a financial covenant that is triggered if our available borrowing capacity is less than $15.0 million for a certain period, which consists of a minimum ratio of trailing four-quarter EBITDA to cash interest expense, as such terms are defined in the Amended Credit Agreement.
The Amended Credit Agreement specifies certain events of default, including, among others, failure to pay principal, interest or fees, violation of covenants, inaccuracy of representations or warranties, bankruptcy events, certain ERISA-related events, cross-defaults to other material agreements, change of control events and invalidity of guarantees or security documents. Some events of default will be triggered only after certain cure periods have expired, or will provide for materiality thresholds. If such a default occurs, the lenders under the Amended Credit Agreement would be entitled to take various actions, including all actions permitted to be taken by a secured creditor and the acceleration of amounts due under the Amended Credit Agreement.
The foregoing description of the Amended Credit Agreement is not complete and is qualified in its entirety by reference to the Amended Credit Agreement, which is filed as Exhibit 10.1 hereto and is incorporated herein by reference.
Equipment Recall
On May 3, 2010, Baxter Healthcare Corporation (“Baxter”) announced a Food and Drug Administration (“FDA”) recall of certain Baxter infusion pumps. The recall notice provides for monetary or replacement consideration to be provided to us and states that devices may continue to be used until an orderly recall plan is finalized between Baxter and the FDA. While we do not believe the recall will have a material adverse effect on our financial statements, we will continue to evaluate this potential impact as more information becomes available.
Item 2. Management’s Discussion and Analysis of Financial Condition and Results of Operations
The following should be read in conjunction with the accompanying financial statements and notes.
BUSINESS OVERVIEW
Our Company
Universal Hospital Services, Inc. (“we”, “our”, “us”, the “Company”, or “UHS”) is a leading nationwide provider of medical equipment management and service solutions to the United States health care industry. Our customers include national, regional and local acute and long-term acute care hospitals, alternate site providers (such as long-term acute care hospitals, skilled nursing facilities, specialty hospitals, nursing homes, and home care providers) and medical equipment manufacturers. We provide our customers equipment management and service solutions across the spectrum of the equipment life cycle as a result of our position as one of the industry’s largest purchasers and outsourcers of medical equipment. During the twelve months ended March 31, 2010, we owned or managed over 550,000 pieces of medical equipment consisting of 360,000 owned or managed pieces in our Medical Equipment Outsourcing segment and 190,000 pieces of customer owned equipment we manage in our Technical and Professional Services segment. Our diverse medical equipment outsourcing customer base includes more than 4,225 acute care hospitals and approximately 4,275 alternate site providers. We also have relationships with more than 200 medical equipment manufacturers and many of the nation’s largest group purchasing organizations (“GPOs”) and many of the integrated delivery networks (“IDNs”). All of our solutions leverage our nationwide network of 84 offices and our 70 years of experience managing and servicing all aspects of medical equipment. Our fees are paid directly by our customers rather than from direct reimbursement from third-party payors, such as private insurers, Medicare, or Medicaid. We commenced operations in 1939, originally incorporated in Minnesota in 1954 and reincorporated in Delaware in 2001.
As one of the nation’s leading medical equipment management and service solutions companies, we design and offer comprehensive solutions for our customers that help reduce capital and operating expenses, increase equipment and staff productivity and support improved patient safety and outcomes.
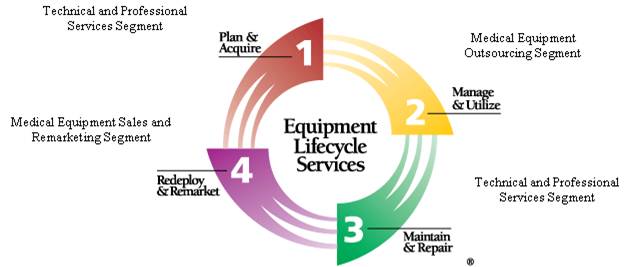
Our reporting segments consist of Medical Equipment Outsourcing, Technical and Professional Services and Medical Equipment Sales and Remarketing. We evaluate the performance of our reporting segments based on gross margin and gross margin before purchase accounting adjustments. The accounting policies of the individual reporting segments are the same as those of the entire Company.
We present the non-generally accepted accounting principles (“GAAP”) financial measure gross margin, before purchase accounting adjustments, because we use this measure to monitor and evaluate the operational performance of our business and to assist analysts, investors and lenders in their comparisons of operational performance across companies, many of whose results will not include similar adjustments. A reconciliation of the non-GAAP financial measure to its equivalent GAAP measure is included in the respective tables.
Medical Equipment Outsourcing Segment - Manage & Utilize
Our flagship business is our Medical Equipment Outsourcing segment, which accounted for $65.2 million, or approximately 81.3% of our revenues, for the quarter ended March 31, 2010. As of March 31, 2010, we owned or managed over 360,000 pieces of medical equipment in our Medical Equipment Outsourcing segment, primarily in the categories of respiratory therapy, newborn care, critical care, patient monitors, patient handling (such as beds, stretchers and wheelchairs), pressure area management (such as therapy surfaces) and wound therapy. Historically, we have purchased and directly owned the equipment used in our medical equipment outsourcing programs. During 2007, we entered into “revenue sharing” agreements with a select few manufacturers of equipment where the manufacturers retain ownership of the equipment, but UHS takes possession and manages the rental of the equipment to customers. We may enter into more of such arrangements in the future. Such arrangements are less capital-intensive for us. In January 2010, one of these agreements was modified such that we purchased $16.6 million of the manufacturer’s equipment that we previously managed, but did not own. With this January 2010 purchase, the revenue share portion of the agreement was terminated and we began to recognize 100% of the revenue associated with this equipment.
We perform regular and preventative maintenance on the equipment and retain detailed records for documentation. We repair, test and clean the equipment. Our service includes prompt replacement of
non-working equipment and the flexibility to upgrade technology as a customer’s product of choice changes. We have three primary outsourcing programs:
· Supplemental and Peak Needs Usage;
· Customized Outsourcing Agreements; and
· Asset360TM Program (formerly Asset Management Partnership Program, “AMPP”).
We have contracts in place with many of the leading national GPOs for both the acute care and alternate site markets. We also have agreements directly with national acute care and alternate site providers. We expect much of our future growth in this segment to be driven by our customers outsourcing more of their medical equipment needs and taking full advantage of our diversified product offering, customized outsourcing agreements and Asset360 Programs.
Technical and Professional Services Segment - Plan & Acquire; Maintain & Repair
Our Technical and Professional Services segment accounted for $10.8 million, or approximately 13.5% of our revenues for the quarter ended March 31, 2010. We leverage our 70 years of experience and our extensive equipment database in repairing and maintaining medical equipment. We offer a broad range of inspection, preventative maintenance, repair, logistic and consulting services through our team of approximately 325 technicians and professionals located throughout the United States in our nationwide network of offices. During the twelve months ended March 31, 2010, we managed over 190,000 units of customer owned equipment. In addition, during the twelve months ended March 31, 2010, we serviced over 360,000 units that we own or directly manage. Our technical and professional service offerings are less capital-intensive than our Medical Equipment Outsourcing segment, and provide a complementary alternative for customers that wish to own their medical equipment, but lack the infrastructure, expertise or scale to perform routine maintenance, repair, record-keeping and lifecycle analysis and planning functions.
Medical Equipment Sales and Remarketing Segment - Redeploy & Remarket
Our Medical Equipment Sales and Remarketing segment accounted for $4.2 million, or approximately 5.2%, of our revenues for the quarter ended March 31, 2010. This segment includes three distinct business activities:
Medical Equipment Remarketing and Disposal. We are one of the nation’s largest buyers and sellers of pre-owned medical equipment. We buy, source, remarket and dispose of pre-owned medical equipment for our customers and on our own behalf. We provide our customers with the ability to sell their unneeded medical equipment for immediate cash or credit. Customers can also take advantage of our disposal services, where we dispose of equipment that has no remaining economic value in a safe and environmentally appropriate manner.
Specialty Medical Equipment Sales and Distribution. We use our national infrastructure to provide sales and distribution services to manufacturers of specialty medical equipment on a limited basis. Our distribution services include providing demonstrations services and product maintenance services. We act as a distributor for only a limited number of products that are particularly suited to our national distribution network or that fit with our ability to provide technical support. We currently sell equipment in selected product lines including, but not limited to, respiratory percussion vests,
continuous passive motion machines, patient monitors, patient handling equipment and infant security systems.
Sales of Disposables. We offer our customers single use disposable items. Most of these items are used in connection with our outsourced equipment. We offer these products as a convenience to customers and to complement our full medical equipment lifecycle solutions.
RESULTS OF OPERATIONS
The following discussion addresses:
· our financial condition as of March 31, 2010 and
· the results of operations for the three month periods ended March 31, 2010 and 2009.
This discussion should be read in conjunction with the financial statements included elsewhere in this Quarterly Report on Form 10-Q and the Management’s Discussion and Analysis of Financial Condition and Results of Operations section included in our 2009 Annual Report on Form 10-K, filed with the Securities and Exchange Commission.
The following table provides information on the percentages of certain items of selected financial data compared to total revenues for the three month periods ended March 31, 2010 and 2009. The table below also indicates the percentage increase or decrease over the prior comparable period.
|
|
|
Three Months Ended March 31, |
|
||||
|
|
|
|
|
|
|
Percent |
|
|
|
|
Percent of Total Revenues |
|
Increase |
|
||
|
|
|
2010 |
|
2009 |
|
(Decrease) |
|
|
|
|
|
|
|
|
|
|
|
Revenue |
|
|
|
|
|
|
|
|
Medical equipment outsourcing |
|
81.3 |
% |
78.8 |
% |
11.8 |
% |
|
Technical and professional services |
|
13.5 |
|
14.1 |
|
3.9 |
|
|
Medical equipment sales and remarketing |
|
5.2 |
|
7.1 |
|
(20.0 |
) |
|
Total revenues |
|
100.0 |
% |
100.0 |
% |
8.4 |
|
|
|
|
|
|
|
|
|
|
|
Cost of Sales |
|
|
|
|
|
|
|
|
Cost of medical equipment outsourcing |
|
28.2 |
|
27.7 |
|
10.5 |
|
|
Cost of technical and professional services |
|
9.7 |
|
10.0 |
|
5.6 |
|
|
Cost of medical equipment sales and remarketing |
|
4.2 |
|
5.9 |
|
(23.7 |
) |
|
Medical equipment depreciation |
|
21.8 |
|
21.5 |
|
10.1 |
|
|
Total costs of medical equipment outsourcing, technical and professional services and medical equipment sales and remarketing |
|
63.9 |
|
65.1 |
|
6.5 |
|
|
Gross margin |
|
36.1 |
|
34.9 |
|
12.1 |
|
|
|
|
|
|
|
|
|
|
|
Selling, general and administrative |
|
26.2 |
|
29.8 |
|
(4.3 |
) |
|
Operating income |
|
9.9 |
|
5.1 |
|
106.3 |
|
|
|
|
|
|
|
|
|
|
|
Interest expense |
|
14.4 |
|
15.8 |
|
(1.8 |
) |
|
Loss before income taxes |
|
(4.5 |
) |
(10.7 |
) |
(54.3 |
) |
|
|
|
|
|
|
|
|
|
|
Benefit for income taxes |
|
(1.7 |
) |
(4.2 |
) |
(57.1 |
) |
|
Net loss |
|
(2.8 |
)% |
(6.5 |
)% |
(52.4 |
) |
Results of Operations for the three month period ended March 31, 2010 compared to the three month period ended March 31, 2009
Medical Equipment Outsourcing Segment — Manage & Utilize
(in thousands)
|
|
|
Three Months Ended |
|
|
|
|
|
|||||
|
|
|
March 31, |
|
|
|
|
|
|||||
|
|
|
2010 |
|
2009 |
|
Change |
|
% Change |
|
|||
|
Total revenue |
|
$ |
65,174 |
|
$ |
58,282 |
|
$ |
6,892 |
|
11.8 |
% |
|
Cost of revenue |
|
22,617 |
|
20,469 |
|
2,148 |
|
10.5 |
|
|||
|
Medical equipment depreciation |
|
17,457 |
|
15,862 |
|
1,595 |
|
10.1 |
|
|||
|
Gross margin |
|
$ |
25,100 |
|
$ |
21,951 |
|
$ |
3,149 |
|
14.3 |
|
|
|
|
|
|
|
|
|
|
|
|
|||
|
Gross margin % |
|
38.5 |
% |
37.7 |
% |
|
|
|
|
|||
|
|
|
|
|
|
|
|
|
|
|
|||
|
Gross margin |
|
$ |
25,100 |
|
$ |
21,951 |
|
$ |
3,149 |
|
14.3 |
|
|
Purchase accounting adjustments, primarily non-cash charges related to step-up in carrying value of medical equipment |
|
3,457 |
|
3,581 |
|
(124 |
) |
(3.5 |
) |
|||
|
Gross margin, before purchase accounting adjustments |
|
$ |
28,557 |
|
$ |
25,532 |
|
$ |
3,025 |
|
11.8 |
% |
|
|
|
|
|
|
|
|
|
|
|
|||
|
Gross margin %, before purchase accounting adjustments |
|
43.8 |
% |
43.8 |
% |
|
|
|
|
|||
Total revenue in the Medical Equipment Outsourcing segment increased $6.9 million, or 11.8%, to $65.2 million in the first quarter of 2010 as compared to the same period of 2009. This increase was primarily driven by increased activity in our Asset360TM Programs (formerly Asset Management Partnership Program, “AMPP”), patient handling and wound therapy, partially offset by sluggish customer census. Beginning January 2010, our patient handling revenues reflect the benefit of recognizing 100% of the revenue previously covered under a revenue share agreement. Our Asset360 Programs increased from 51 programs at March 31, 2009 to 64 programs at March 31, 2010.
Total cost of revenue in the segment increased $2.1 million, or 10.5%, to $22.6 million in the first quarter of 2010 as compared to the same period of 2009. This increase is primarily attributable to higher employee-related, auto-related, and other expenses of $1.6, $0.4, and $0.5 million, respectively, partially offset by a decrease in fleet equipment repair expense of $0.4 million.
Medical equipment depreciation increased $1.6 million, or 10.1%, to $17.5 million in the first quarter of 2010 as compared to the same period of 2009. The increase in medical equipment depreciation primarily relates to the increase in medical equipment purchases related to our patient handling medical equipment, which we previously only managed under the revenue share agreement noted above. Depreciation for the quarters ended March 31, 2010 and 2009 include $3.1 and $3.4 million, respectively, of purchase accounting adjustments related to the step-up in carrying value of our medical equipment.
Gross margin percentage for the Medical Equipment Outsourcing segment increased from 37.7% in the first quarter of 2009 to 38.5% in the first quarter of 2010. This increase resulted primarily from increased operating efficiencies associated with higher levels of medical equipment utilization. Gross margin percentage, before purchase accounting adjustments, remained consistent at 43.8% in the first quarter of 2009 and the first quarter of 2010.
Technical and Professional Services Segment — Plan & Acquire; Maintain & Repair
(in thousands)
|
|
|
Three Months Ended |
|
|
|
|
|
|||||
|
|
|
March 31, |
|
|
|
|
|
|||||
|
|
|
2010 |
|
2009 |
|
Change |
|
% Change |
|
|||
|
Total revenue |
|
$ |
10,813 |
|
$ |
10,412 |
|
$ |
401 |
|
3.9 |
% |
|
Cost of revenue |
|
7,784 |
|
7,370 |
|
414 |
|
5.6 |
|
|||
|
Gross margin |
|
$ |
3,029 |
|
$ |
3,042 |
|
$ |
(13 |
) |
(0.4 |
) |
|
|
|
|
|
|
|
|
|
|
|
|||
|
Gross margin % |
|
28.0 |
% |
29.2 |
% |
|
|
|
|
|||
|
|
|
|
|
|
|
|
|
|
|
|||
|
Gross margin |
|
$ |
3,029 |
|
$ |
3,042 |
|
$ |
(13 |
) |
(0.4 |
) |
|
Purchase accounting adjustments, primarily non-cash charges related to favorable lease commitments |
|
3 |
|
5 |
|
(2 |
) |
(32.6 |
) |
|||
|
Gross margin, before purchase accounting adjustments |
|
$ |
3,032 |
|
$ |
3,047 |
|
$ |
(15 |
) |
(0.5 |
)% |
|
|
|
|
|
|
|
|
|
|
|
|||
|
Gross margin %, before purchase accounting adjustments |
|
28.0 |
% |
29.3 |
% |
|
|
|
|
|||
Total revenue in the Technical and Professional Services segment increased $0.4 million, or 3.9%, to $10.8 million in the first quarter of 2010 as compared to the same period of 2009. This increase resulted from increases in our manufacturer services unit and BioMed360TM Programs (formerly Customized Healthcare Asset Management Programs, “CHAMP”) of $0.3 and $0.6 million, respectively offset by decreases in our supplemental service programs of $0.5 million.
Total cost of revenue in the segment increased $0.4 million, or 5.6%, to $7.8 million in the first quarter of 2010 as compared to the same period of 2009. The increase is primarily attributable to increases in our 3rd party vendor costs.
Gross margin percentage for the Technical and Professional Services segment decreased from 29.2% for the first quarter of 2009 to 28.0% for the same period of 2010. We expect gross margin percentage to fluctuate based on the variability of third party vendor expenses in our BioMed360 Programs and supplemental service programs.
Medical Equipment Sales and Remarketing Segment — Redeploy & Remarket
(in thousands)
|
|
|
Three Months Ended |
|
|
|
|
|
|||||
|
|
|
March 31, |
|
|
|
|
|
|||||
|
|
|
2010 |
|
2009 |
|
Change |
|
% Change |
|
|||
|
Total revenue |
|
$ |
4,187 |
|
$ |
5,236 |
|
$ |
(1,049 |
) |
(20.0 |
)% |
|
Cost of revenue |
|
3,347 |
|
4,386 |
|
(1,039 |
) |
(23.7 |
) |
|||
|
Gross margin |
|
$ |
840 |
|
$ |
850 |
|
$ |
(10 |
) |
(1.2 |
) |
|
|
|
|
|
|
|
|
|
|
|
|||
|
Gross margin % |
|
20.1 |
% |
16.2 |
% |
|
|
|
|
|||
|
|
|
|
|
|
|
|
|
|
|
|||
|
Gross margin |
|
$ |
840 |
|
$ |
850 |
|
$ |
(10 |
) |
(1.2 |
) |
|
Purchase accounting adjustments, primarily non-cash charges related to the step-up in carrying value of our medical equipment |
|
77 |
|
324 |
|
(247 |
) |
(76.2 |
) |
|||
|
Gross margin, before purchase accounting adjustments |
|
$ |
917 |
|
$ |
1,174 |
|
$ |
(257 |
) |
(21.9 |
)% |
|
|
|
|
|
|
|
|
|
|
|
|||
|
Gross margin %, before purchase accounting adjustments |
|
21.9 |
% |
22.4 |
% |
|
|
|
|
|||
Total revenue in the Medical Equipment Sales and Remarketing segment decreased $1.0 million, or 20.0%, to $4.2 million in the first quarter of 2010 as compared to the same period of 2009. The decrease was primarily driven by decreases in new, pre-owned, and other equipment sales of $1.0, $0.5, and $0.1 million, respectively, partially offset by an increase in disposable sales and other equipment sales of $0.4 and $0.2 million, respectively.
Total cost of revenue in the segment decreased $1.0 million, or 23.7%, to $3.3 million in the first quarter of 2010 as compared to the same period of 2009. The decrease was primarily due to decreases in the costs of new, pre-owned, and other equipment of $0.7, $0.5, and $0.2 million, respectively, partially offset by an increase in the cost of disposables and other expenses of $0.3 and $0.1 million, respectively. During the quarters ended March 31, 2010 and 2009, purchase accounting adjustments related to medical equipment sold increased cost of revenue by $0.1 and $0.3 million, respectively.
Gross margin percentage for the Medical Equipment Sales and Remarketing segment increased from 16.2% in the first quarter of 2009 to 20.1% for the same period of 2010. Gross margin percentage, before purchase accounting adjustments, decreased from 22.4% in the first quarter of 2009 to 21.9% for the same period of 2010. We expect margins and activity in this segment to fluctuate based on the transactional nature of the business.
Selling, General and Administrative
Selling, General and Administrative and Interest Expense
(in thousands)
|
|
|
Three Months Ended |
|
|
|
|
|
|||||
|
|
|
March 31, |
|
|
|
|
|
|||||
|
|
|
2010 |
|
2009 |
|
Change |
|
% Change |
|
|||
|
Selling, general and administrative |
|
$ |
21,070 |
|
$ |
22,015 |
|
$ |
(945 |
) |
(4.3 |
)% |
|
Interest expense |
|
11,507 |
|
11,717 |
|
(210 |
) |
(1.8 |
) |
|||
Selling, general and administrative expense decreased $0.9 million, or 4.3%, to $21.1 million for the first quarter of 2010 as compared to the same period of 2009. Selling, general and administrative expense consists primarily of employee-related expenses, professional fees, occupancy charges, bad debt expense and depreciation and amortization. Selling, general and administrative expense during the quarter ended March 31, 2010 benefited from lower bad debt expense, amortization, and stock-based compensation of $0.6, $0.4, and $0.3 million, respectively, offset by other expense increases of $0.4 million. Selling, general and administrative expense as a percentage of total revenue was 26.2% and 29.8% for each of the quarters ended March 31, 2010 and 2009, respectively.
Interest Expense
Interest expense decreased $0.2 million, or 1.8%, to $11.5 million during the first quarter of 2010 as compared to the same period of 2009. The decrease was primarily driven by lower levels of outstanding debt on our senior secured credit facility and lower average interest rate on our revolving credit agreement.
Income Taxes
Benefit for income taxes decreased $1.8 million to $1.3 million during the first quarter of 2010 as compared to the same period of 2009. The decrease is attributable to the change in loss before income taxes.
Net Loss
Net loss decreased $2.5 million to $2.3 million in the first quarter of 2010 as compared to the same period of 2009. This decrease was primarily driven by increased activity in our Asset360 Program, patient handling and wound therapy solutions coupled with increased operating efficiencies associated with higher levels of medical equipment utilization.
EBITDA
Earnings Before Interest, Taxes, Depreciation and Amortization (“EBITDA”) was $30.9 and $25.7 million for the quarters ended March 31, 2010 and 2009, respectively. EBITDA for the quarter ended March 31, 2010, was primarily driven by increased activity in our Asset360 Programs, patient handling and wound therapy solutions.
EBITDA is defined as earnings before interest expense, income taxes, depreciation and amortization. In addition to using EBITDA internally as measure of operational performance, we disclose it externally to assist analysts, investors and lenders in their comparisons of operational performance, valuation and debt capacity across companies with differing capital, tax and legal structures. Management also understands that some industry analysts and investors consider EBITDA as a supplementary non-GAAP financial measure useful in analyzing a company’s ability to service debt. EBITDA, however, is not a measure of financial performance under GAAP and should not be considered as an alternative to, or more meaningful than, net income as a measure of operating performance or to cash flows from operating, investing or financing activities or as a measure of liquidity. Since EBITDA is not a measure determined in accordance with GAAP and is thus susceptible to varying interpretations and calculations, EBITDA, as presented, may not be comparable to other similarly titled measures of other companies. EBITDA does not represent an amount of funds that is available for management’s discretionary use. A reconciliation of EBITDA to net cash provided by operating activities is included below:
|
|
|
Three Months Ended |
|
||||
|
|
|
March 31, |
|
||||
|
(in thousands) |
|
2010 |
|
2009 |
|
||
|
Net cash provided by operating activities |
|
$ |
30,412 |
|
$ |
18,551 |
|
|
Changes in operating assets and liabilities |
|
(9,944 |
) |
(2,298 |
) |
||
|
Other non-cash expenses |
|
212 |
|
778 |
|
||
|
Benefit for income taxes |
|
(1,328 |
) |
(3,099 |
) |
||
|
Interest expense |
|
11,507 |
|
11,717 |
|
||
|
EBITDA |
|
$ |
30,859 |
|
$ |
25,649 |
|
|
|
|
Three Months Ended |
|
||||
|
|
|
March 31, |
|
||||
|
(in thousands) |
|
2010 |
|
2009 |
|
||
|
EBITDA |
|
$ |
30,859 |
|
$ |
25,649 |
|
|
|
|
|
|
|
|
||
|
Other Financial Data: |
|
|
|
|
|
||
|
Net cash provided by operating activities |
|
$ |
30,412 |
|
$ |
18,551 |
|
|
Net cash used in investing activities |
|
(33,893 |
) |
(9,887 |
) |
||
|
Net cash provided by (used in) financing activities |
|
3,603 |
|
12,730 |
|
||
|
|
|
|
|
|
|
||
|
Other Operating Data (as of end of period): |
|
|
|
|
|
||
|
Medical equipment (approximate number of owned outsourcing units) |
|
227,000 |
|
217,000 |
|
||
|
District offices |
|
84 |
|
84 |
|
||
|
Number of outsourcing hospital customers |
|
4,225 |
|
4,150 |
|
||
|
Number of total outsourcing customers |
|
8,500 |
|
8,250 |
|
||
SEASONALITY
Quarterly operating results are typically affected by seasonal factors. Historically, our first and fourth quarters are the strongest, reflecting increased customer utilization during the fall and winter months.
LIQUIDITY AND CAPITAL RESOURCES
Our principal sources of liquidity are expected to be cash and cash equivalents, cash flows from operating activities, and borrowings under our first lien senior secured asset-based revolving credit facility providing for loans in an amount of up to $135.0 million, pursuant to a credit agreement dated as of May 31, 2007 with a group of financial institutions (the “senior secured credit facility”). Our senior secured credit facility matures in May 2013. It is anticipated that our principal uses of liquidity will be to fund capital expenditures related to purchases of medical equipment, provide working capital, meet debt service requirements and finance our strategic plans.
On May 6, 2010 we extended, amended and restated our senior secured credit facility. For additional information, see Note 11, Subsequent Events. During the second quarter, Management intends to use the amended and restated senior secured facility to redeem, at par, the remaining $9.9 million amount outstanding of our 10.125% Senior Notes.
We require substantial cash to operate our Medical Equipment Outsourcing programs and service our debt. Our outsourcing programs require us to invest a significant amount of cash in medical equipment purchases. To the extent that such expenditures cannot be funded from cash and cash equivalents, our operating cash flow, borrowing under our senior secured credit facility or other financing sources, we may not be able to conduct our business or grow as currently planned. We anticipate an additional capital investment of approximately $55.0 million during the remaining nine months of 2010.
If we are unable to service our debt obligations through our cash and cash equivalents, generating sufficient cash flow from operations, and additional borrowings under our first lien senior secured asset-based revolving credit facility, we will be forced to take actions such as reducing or delaying capital expenditures, selling assets, restructuring or refinancing our debt, electing to pay PIK interest on our PIK Toggle Notes, or seeking additional equity capital. This, to a certain extent, is subject to general
economic, financial, competitive, legislative, regulatory and other factors that are beyond our control. If we are unable to repay our debt at maturity, we may have to obtain alternative financing, which may not be available to us.
Net cash provided by operating activities was $30.4 and $18.6 million for the quarters ended March 31, 2010 and 2009, respectively. Net cash provided by operating activities during the quarter ended March 31, 2010 primarily benefited from favorable changes in operating assets and liabilities and a decrease in net loss as compared to the same period of 2009.
Net cash used in investing activities was $33.9 and $9.9 million for the quarters ended March 31, 2010 and 2009, respectively. Net cash used in investing activities increased during the 2010 period when compared to the same period in the prior year primarily as a result of an increase in capital expenditures for medical equipment.
Net cash provided by financing activities was $3.6 and $12.7 million for the quarters ended March 31, 2010 and 2009, respectively. During the quarter ended March 31, 2010, net cash used in financing activities was impacted by a decrease in net draws under our senior secured credit facility of $16.3 million partially offset by an increase of the change in book overdrafts of $7.2 million. The change in book overdrafts of $7.2 million during the three months ended March 31, 2009 resulted from our net operating account cash position at March 31, 2009 as compared to our net book overdraft position at other period ends.
Cash on-hand was $0.1 million as of March 31, 2010 compared to $33.4 million as of March 31, 2009. The decrease primarily resulted from a draw of $31.0 million from our senior secured credit facility during the quarter ended March 31, 2009 to, among other things, pre-borrow for our then upcoming interest payments due June 1, 2009 on our Floating Rate Notes and PIK Toggle Notes.
Based on the level of operating performance expected in 2010, we believe our cash and cash equivalents, cash from operations, and additional borrowings under our senior secured credit facility, will meet our liquidity needs for the foreseeable future, exclusive of any borrowings that we may make to finance potential acquisitions. However, if during that period or thereafter we are not successful in generating sufficient cash flows from operations or in raising additional capital when required in sufficient amounts and on terms acceptable to us, our business could be adversely affected. As of March 31, 2010, we had $88.3 million of availability under our senior secured credit facility, based on a borrowing base of $135.0 million, less borrowings of $43.1 million and after giving effect to $3.6 million used for letters of credit.
Our levels of borrowing are further restricted by the financial covenants set forth in our senior secured credit facility agreement and the second lien senior indenture governing our PIK Toggle Notes and Floating Rate Notes. As of March 31, 2010, the Company was in compliance with all covenants under the senior secured credit facility.
RECENT ACCOUNTING PRONOUNCEMENT
Standard Issued Not Yet Adopted
In October 2009, the FASB issued Accounting Standards Update (“ASU”), 2009-13, Revenue Recognition (Topic 605): Multiple Deliverable Revenue Arrangements — A Consensus of the FASB Emerging Issues Task Force.” This update provides application guidance on whether multiple deliverables exist, how the deliverables should be separated and how the consideration should be allocated to one or more units of accounting. This update establishes a selling price hierarchy for determining the selling price of a deliverable. The selling price used for each deliverable will be based on vendor-specific objective evidence, if available, third-party evidence if vendor-specific objective evidence is not available, or estimated selling price if neither vendor-specific or third-party evidence is available. The Company will be required to apply this guidance prospectively for revenue arrangements entered into or materially modified after January 1, 2011. We are currently evaluating the impact of the provisions of ASU 2009-13.
SAFE HARBOR STATEMENT
Safe Harbor Statement under the Private Securities Litigation Reform Act of 1995: We believe statements in this Quarterly Report on Form 10-Q looking forward in time involve risks and uncertainties. The following factors, among others, could adversely affect our business, operations and financial condition, causing our actual results to differ materially from those expressed in any forward-looking statements:
· our history of net losses and substantial interest expense;
· our substantial outstanding debt and debt service obligations;
· our need for substantial cash to operate and expand our business as planned;
· restrictions imposed by the terms of our debt;
· a decrease in the number of patients our customers are serving;
· the effect of prolonged negative changes in domestic and global economic conditions;
· our ability to effect change in the manner in which health care providers traditionally procure medical equipment;
· the absence of long-term commitments with customers;
· difficulties or delays in our continued expansion into certain of our businesses/geographic markets and developments of new businesses/geographic markets;
· the impact of health care reform initiatives;
· changes in third-party payor reimbursement rates for health care items and services;
· our ability to maintain existing contracts with GPOs and IDNs and enter into new contracts with additional GPOs and IDNs;
· additional credit risks in increasing business with home care providers and nursing homes;
· the impact of significant regulation of the health care industry and the need to comply with those regulations;
· impacts of equipment product recalls or obsolescence;
· increases in vendor costs that cannot be passed through to our customers; and
· the risk factors as set forth in Item 1A of Part II of this Quarterly Report on Form 10-Q
Item 3. Quantitative and Qualitative Disclosures about Market Risk
We are exposed to market risk arising from adverse changes in interest rates, fuel costs, and pension valuation. We do not enter into derivatives or other financial instruments for speculative purposes.
Interest Rates
We use both fixed and variable rate debt as sources of financing. At March 31, 2010, we had approximately $523.6 million of total debt outstanding. After taking into account the effect of our interest rate swap agreement, we had $43.1 million of debt bearing interest at variable rates averaging 1.86%. Based on variable debt levels at March 31, 2010, a 1.0 percentage point change in interest rates on variable rate debt would result in annual interest expense fluctuating by approximately $0.4 million.
In June 2007, we entered into an interest rate swap agreement for $230.0 million, which has the effect of converting the interest rate applicable to our $230.0 million of Floating Rate Notes to a fixed interest rate. The effective date for the interest rate swap agreement was December 2007; the expiration date is May 2012.
The interest rate swap agreement qualifies for cash flow hedge accounting under ASC Topic 815, “Derivatives and Hedging.” Both at inception and on an on-going basis, we must perform an effectiveness test. In accordance with ASC Topic 815, the fair value of the interest rate swap agreement at March 31, 2010 is included as a cash flow hedge on our balance sheet. The change in fair value was recorded as a component of accumulated other comprehensive loss, net of tax, on our balance sheet since the instrument was determined to be an effective hedge at March 31, 2010. We have not recorded any amounts due to ineffectiveness for any periods presented. We expect to reclassify approximately $6.2 million into earnings, currently recorded in accumulated other comprehensive loss, in the next 12 months. As a result of our interest rate swap agreement, we expect the effective interest rate on our $230.0 million Floating Rate Notes to be 9.065% through May 2012.
Fuel Costs
We are also exposed to market risks related to changes in the price of gasoline used to fuel our fleet of delivery and sales vehicles. A hypothetical 10% increase in the first quarter of 2010 average price of unleaded gasoline, assuming gasoline usage levels for the quarter ended March 31, 2010, would lead to an annual increase in fuel costs of approximately $0.3 million.
Other Market Risk
Our pension obligations are also affected by market risk as discussed in Item 7A of Part II of our 2009 Form 10-K. Continued distress in the financial markets may impact the fair value of debt and equity securities in our pension trust.
As of March 31, 2010, we have no other material exposure to market risk.
Item 4(T). Controls and Procedures
(a) Evaluation of disclosure controls and procedures
Under the supervision and with the participation of our management, including our Chief Executive Officer and Chief Financial Officer, we evaluated the effectiveness of the design and operation of our disclosure controls and procedures (as defined in Rule 13a-15(e) and Rule 15d-15(e) promulgated under the Securities Exchange Act of 1934 as amended (the “Exchange Act”)). Based upon that evaluation, our Chief Executive Officer and Chief Financial Officer concluded that, as of the end of the period covered by this report, our disclosure controls and procedures were effective.
(b) Changes in internal control over financial reporting
There were no changes in our internal control over financial reporting during the quarter ended March 31, 2010, that have materially affected, or are reasonably likely to materially affect, our internal control over financial reporting.
The Company, from time to time, may become involved in litigation arising out of operations in the normal course of business, including the matters discussed in Item 3 of Part I of the 2009 Form 10-K.
Asserted claims are subject to many uncertainties and the outcome of individual matters is not predictable with assurance.
As of March 31, 2010, we were not a party to any other pending legal proceedings the adverse outcome of which could reasonably be expected to have a material adverse effect on our operating results, financial position or cash flows.
Our business is subject to various risks and uncertainties. Any of the risks discussed elsewhere in this Quarterly Report on Form 10-Q or our other filings with the Securities and Exchange Commission, including the risk factors set forth in our 2009 Form 10-K, could materially adversely affect our business, financial condition or results of operations.
Item 2. Unregistered Sales of Equity Securities and Use of Proceeds
None.
Item 3. Defaults upon Senior Securities
Not applicable.
On May 6, 2010 we entered into an Amended and Restated Credit Agreement with GE Business Financial Services, Inc., as agent for the lenders, and the lenders party thereto (the “Amended Credit Agreement”), which amended the senior secured credit facility dated as of May 31, 2007. The amendment increased the aggregate amount the Company may obtain under revolving loans from
$135.0 million to $195.0 million and extended the maturity date to November 30, 2014. The Company’s obligations under the Amended Credit Agreement are secured by a first priority security interest in substantially all of the Company’s assets, excluding a pledge of its and Parent’s stock, any joint ventures and certain other exceptions. The Company’s obligations under the Amended Credit Agreement are unconditionally guaranteed by Parent.
Under the Amended Credit Agreement, up to $195.0 million is available for working capital and general corporate purposes, including permitted investments, capital expenditures and debt repayments, on a fully revolving basis, subject to the terms and conditions set forth in the credit documents in the form of revolving loans, swing line loans and letters of credit. The availability under the Amended Credit Agreement is subject to a borrowing base calculated on the basis of certain of the Company’s eligible accounts receivable, inventory and equipment.
Borrowings under the Amended Credit Agreement bear interest at a floating per annum rate, at our election, equal to LIBOR plus 2.75% or prime rate plus 1.75%, each of which are subject to credit facility usage.
The Amended Credit Agreement requires our compliance with various affirmative and negative covenants. Pursuant to the affirmative covenants, we and Parent will, among other things, deliver financial and other information to the agent, provide notice of certain events (including events of default), pay our obligations, maintain our properties, maintain the security interest in the collateral for the benefit of the agent and the lenders and maintain insurance.
Among other restrictions, and subject to certain definitions and exceptions, the Amended Credit Agreement restricts our ability to:
· incur indebtedness;
· create or permit liens;
· declare or pay dividends and certain other restricted payments;
· consolidate, merge or recapitalize;
· acquire or sell assets;
· make certain investments, loans or other advances;
· enter into transactions with affiliates;
· change our line of business; and
· enter into hedging transactions.
The Amended Credit Agreement also contains a financial covenant that is triggered if our available borrowing capacity is less than $15.0 million for a certain period, which consists of a minimum ratio of trailing four-quarter EBITDA to cash interest expense, as such terms are defined in the Amended Credit Agreement.
The Amended Credit Agreement specifies certain events of default, including, among others, failure to pay principal, interest or fees, violation of covenants, inaccuracy of representations or warranties, bankruptcy events, certain ERISA-related events, cross-defaults to other material agreements, change of control events and invalidity of guarantees or security documents. Some events of default will be triggered only after certain cure periods have expired, or will provide for materiality thresholds. If such a default occurs, the lenders under the Amended Credit Agreement would be entitled to take various
actions, including all actions permitted to be taken by a secured creditor and the acceleration of amounts due under the Amended Credit Agreement.
The foregoing description of the Amended Credit Agreement is not complete and is qualified in its entirety by reference to the Amended Credit Agreement, which is filed as Exhibit 10.1 hereto and is incorporated herein by reference.
|
Number |
|
Description |
|
10.1 |
|
Amended and Restated Credit Agreement, dated as of May 6, 2010, among Universal Hospital Services, Inc., UHS Holdco, Inc., the lenders party thereto, GE Business Financial Services, Inc., as administrative agent, Bank of America, N.A., as documentation agent, and GE Capital Markets, Inc., and Bank of America Securities, LLC, as co-lead arrangers and co-bookrunners. |
|
|
|
|
|
10.2 |
|
Amended and Restated Guaranty, dated as of May 6, 2010, among UHS Holdco, Inc. and the secured parties named therein |
|
10.3 |
|
First Lien Security Agreement, dated May 6, 2010, among UHS Holdco, Inc., Universal Hospital Services, Inc. and GE Business Financial Services, Inc., as collateral agent |
|
31.1 |
|
Certification of Principal Executive Officer Pursuant to Section 302 of the Sarbanes-Oxley Act of 2002. |
|
31.2 |
|
Certification of Principal Financial Officer Pursuant to Section 302 of the Sarbanes-Oxley Act of 2002. |
|
32.1 |
|
Certification Pursuant to Section 906 of the Sarbanes-Oxley Act of 2002. |
|
|
|
|
|
32.2 |
|
Certification Pursuant to Section 906 of the Sarbanes-Oxley Act of 2002. |
Pursuant to the requirements of the Securities Exchange Act of 1934, the registrant has duly caused this report to be signed on its behalf by the undersigned thereunto duly authorized.
Date: May 10, 2010
|
|
Universal Hospital Services, Inc. |
|
|
|
|
|
|
|
By |
/s/ Gary D. Blackford |
|
|
Gary D. Blackford, |
|
|
|
Chairman of the Board and Chief Executive Officer |
|
|
|
(Principal Executive Officer and Duly Authorized Officer) |
|
|
|
|
|
|
|
By |
/s/ Rex T. Clevenger |
|
|
Rex T. Clevenger, |
|
|
|
Executive Vice President and Chief Financial Officer |
|
|
|
(Principal Financial Officer) |
|