Attached files
| file | filename |
|---|---|
| EX-32.2 - EXHIBIT 32.2 - R1 RCM INC. | exhibit322-2017.htm |
| EX-32.1 - EXHIBIT 32.1 - R1 RCM INC. | exhibit321-2017.htm |
| EX-31.2 - EXHIBIT 31.2 - R1 RCM INC. | exhibit312-2017.htm |
| EX-31.1 - EXHIBIT 31.1 - R1 RCM INC. | exhibit311-2017.htm |
| EX-23.1 - EXHIBIT 23.1 - R1 RCM INC. | ex231-consent.htm |
| EX-10.55 - EXHIBIT 10.55 - R1 RCM INC. | ex1055-longxr1offerletter0.htm |
UNITED STATES
SECURITIES AND EXCHANGE COMMISSION
Washington, D.C. 20549
Form 10-K
ý | ANNUAL REPORT PURSUANT TO SECTION 13 OR 15(d) OF THE SECURITIES EXCHANGE ACT OF 1934 |
For the fiscal year ended December 31, 2017
OR
¨ | TRANSITION REPORT PURSUANT TO SECTION 13 OR 15(d) OF THE SECURITIES EXCHANGE ACT OF 1934 |
For the transition period from to
Commission file number 001-34746
R1 RCM Inc.
(Exact name of registrant as specified in its charter)
Delaware | 02-0698101 | |
(State or other jurisdiction of incorporation or organization) | (I.R.S. Employer Identification No.) | |
401 North Michigan Avenue, Suite 2700 Chicago, Illinois | 60611 | |
(Address of principal executive offices) | (Zip Code) | |
(312) 324-7820
Registrant’s telephone number, including area code
Securities registered pursuant to Section 12(b) of the Act:
Title of each class: | Name of each exchange on which registered: | |
Common Stock, $0.01 par Value | The NASDAQ Capital Market | |
Securities registered pursuant to Section 12(g) of the Act:
Indicate by check mark if the registrant is a well-known seasoned issuer, as defined in Rule 405 of the Securities Act. Yes ¨ No ý
Indicate by check mark if the registrant is not required to file reports pursuant to Section 13 or Section 15(d) of the Act. Yes ¨ No ý
Indicate by check mark whether the registrant (1) has filed all reports required to be filed by Section 13 or 15(d) of the Securities Exchange Act of 1934 during the preceding 12 months (or for such shorter period that the registrant was required to file such reports), and (2) has been subject to such filing requirements for the past 90 days. Yes ý No ¨
Indicate by check mark whether the registrant has submitted electronically and posted on its corporate website, if any, every Interactive Data File required to be submitted and posted pursuant to Rule 405 of Regulation S-T (§ 232.405 of this chapter) during the preceding 12 months (or for such shorter period that the registrant was required to submit and post such files). Yes ý No ¨
Indicate by check mark if disclosure of delinquent filers pursuant to Item 405 of Regulation S-K is not contained herein, and will not be contained, to the best of registrant’s knowledge, in definitive proxy or information statements incorporated by reference in Part III of this Form 10-K or any amendment to this Form 10-K. ¨
Indicate by check mark whether the registrant is a large accelerated filer, an accelerated filer, a non-accelerated filer, or a smaller reporting company. See the definitions of "large accelerated filer," "accelerated filer," "smaller reporting company," and "emerging growth company" in Rule 12b-2 of the Exchange Act. (Check one):
Large accelerated filer | o | Accelerated filer | ý | Non-accelerated filer | o | Smaller reporting company | o | Emerging growth company | o |
(Do not check if a smaller reporting company) | |||||||||
If an emerging growth company, indicate by check mark if the registrant has elected not to use the extended transition period for complying with any new or revised financial accounting standards provided pursuant to Section 13(a) of the Exchange Act. ¨
Indicate by check mark whether the registrant is a shell company (as defined in Rule 12b-2 of the Exchange Act). Yes ¨ No ý
Aggregate market value of the voting and non-voting common equity held by non-affiliates of the registrant, based on the last sale price for such stock on June 30, 2017: $379,043,483
As of March 5, 2018, the registrant had 104,066,522 shares of common stock, par value $0.01 per share, outstanding.
Portions of the registrant’s definitive proxy statement for its 2018 Annual Meeting of Stockholders are incorporated by reference into Part III of this Annual Report on Form 10-K.
R1 RCM INC.
TABLE OF CONTENTS
Page | ||
PART I | ||
PART II | ||
PART III | ||
PART IV | ||
FORWARD-LOOKING STATEMENTS
This Annual Report on Form 10-K contains forward-looking statements, within the meaning of the federal securities laws, that involve substantial risks and uncertainties. You should not place undue reliance on these statements. All statements, other than statements of historical facts, included in this Annual Report on Form 10-K are forward-looking statements. The words "anticipate", "believe", "designed", "estimate", "expect", "forecast", "intend", "may", "plan", "predict", "project", "target", "will" or "would" and similar expressions are intended to identify forward-looking statements, although not all forward-looking statements contain these identifying words. These forward-looking statements include, among other things, statements about our strategy, our future operations, our future financial position, our projected costs, our prospects, our plans, objectives of management, the anticipated benefits of the services agreement with Intermountain Healthcare, the expected timing and completion of a definitive agreement with Presence Health, the timing of the closing and anticipated benefits of the pending Intermedix acquisition, the onboarding of Ascension hospitals and the expected expansion of our relationship with Ascension, the expected timing of our transition to new data centers, the expected outcome or impact of pending or threatened litigation and expected market growth. All forward-looking statements are subject to risks and uncertainties that may cause actual results to differ materially from those that we expected, including:
• | our ability to achieve or maintain profitability; |
• | our ability to retain existing customers or acquire new customers; |
• | our ability to manage our operations effectively; |
• | disruptions in or damages to our shared services centers or third-party operated data centers; |
• | our exposure to risks related to our growing operations in India; |
• | delayed or unsuccessful implementation of our technologies or services, or unexpected implementation costs; |
• | the development of markets for our RCM service offering; |
• | breaches or failures of our information technologies security measures or unauthorized access to a customer’s data; |
• | fluctuations in our results of operations or cash flows; |
• | the loss of key personnel; |
• | our ability to integrate our customers’ revenue cycle management employees; |
• | negative perceptions of the collection of medical co-pays and other payments from patients; |
• | negative perceptions of offshore outsourcing and proposed legislations related thereto; |
• | our legal responsibility for obligations related to our employees or our customers’ employees; |
• | the impact of litigation; |
• | our ability to use our net operating loss carryforwards; |
• | changes in tax laws and unanticipated tax liabilities; |
• | our ability to realize the anticipated benefits of our acquisitions and long-term strategic partnerships; |
• | our dependence on the A&R MPSA with Ascension; |
• | our ability to negotiate and complete a definitive agreement with Presence Health; |
• | our and Intermedix’s ability to satisfy the conditions to closing the Intermedix acquisition in the anticipated timeframe or at all and the risk that the expected benefits from the pending Intermountain acquisition will not be realized or will not be realized within the expected time period; |
• | risks related to the indebtedness we intend to incur to finance the Intermedix acquisition; |
• | our ability to comply with healthcare laws and regulations; |
• | developments in the healthcare industry, including national healthcare reform; |
• | our ability to comply with information privacy laws; |
• | our ability to comply with debt collection and other consumer protection laws and regulations; |
• | our ability to protect our intellectual property; and |
• | other factors set forth in Part I, Item 1A “Risk Factors” and elsewhere in this Annual Report on Form 10-K. |
We may not actually achieve the plans, intentions or expectations disclosed in our forward-looking statements, and you should not place undue reliance on our forward-looking statements. Actual results or events could differ materially from the plans, intentions and expectations disclosed in the forward-looking statements we make. We have included important information in the cautionary statements included in this Annual Report on Form 10-K, particularly in Part I, Item 1A “Risk Factors,” that could cause actual results or events to differ materially from the forward-looking statements that we make. Our forward-looking statements do not reflect the potential impact of any future acquisitions, mergers, dispositions, joint ventures or investments we may make.
You should read this Annual Report on Form 10-K and the documents that we have filed as exhibits to the Annual Report on Form 10-K completely and with the understanding that our actual future results may be materially different from what we expect. We do not assume any obligation to update any forward-looking statements, whether as a result of new information, future events or otherwise, except as required by law.
PART I
Unless the context indicates otherwise, references in this Annual Report to "R1 RCM," "R1," the "Company" or "company," "we," "our" and "us" mean R1 RCM Inc. and its subsidiaries.
Item 1. | Business |
Overview
R1 is a leading provider of revenue cycle management ("RCM") services to healthcare providers. Our technology-enabled services help healthcare providers generate sustainable improvements in their operating margins and cash flows while also enhancing patient, physician and staff satisfaction for our customers.
We achieve these results for our customers by managing healthcare providers’ revenue cycle operations, which encompass processes including patient registration, insurance and benefit verification, medical treatment documentation and coding, bill preparation and collections from patients and payers. We do so by deploying a unique operating model that leverages our extensive healthcare site experience, innovative technology and process excellence. We assist our RCM customers in managing their revenue cycle operating costs while simultaneously increasing the portion of the maximum potential services revenue they receive. Together, these benefits can generate significant and sustainable improvements in operating margins and cash flows for our customers.
Our primary service offering consists of end-to-end RCM, which we deploy through an operating partner relationship or a co-managed relationship. Under an operating partner relationship, we provide comprehensive revenue cycle infrastructure to providers, including all revenue cycle personnel, technology solutions and process workflow. Under a co-managed relationship, we leverage our customers’ existing RCM staff and processes, and supplement them with our infused management, subject matter specialists, proprietary technology solutions and other resources.
We also offer modular services, allowing customers to engage us for only specific components of our end-to-end RCM service offering, such as physician advisory services ("PAS") and revenue capture. Our PAS offering assists hospitals in complying with payer requirements regarding whether to classify a hospital visit as an in-patient or an out-patient observation case for billing purposes. Our revenue capture offering includes charge capture, charge description master ("CDM") maintenance and pricing services that help providers ensure they are capturing the maximum net compliant revenue for services delivered.
Once implemented, our technology solutions, processes and services are deeply embedded in our customers’ day-to-day operations. We believe our service offerings are adaptable to meet an evolving healthcare regulatory environment, technology standards and market trends.
Revenue Cycle Software and Services Market
Revenue cycle is an important function for hospital and health systems as they seek to collect payment due to them from health insurance companies and patients. Healthcare providers operate their revenue cycle with a combination of labor, software and services vendors. Third-party vendors offer various solutions including consulting services, software and services point solutions that cover one or multiple components of the revenue cycle and full outsourcing services, among others. The Centers for Medicare and Medicaid Services (CMS) projects hospital care expenditures in the U.S. to amount to $1.2 trillion in 2018. We estimate the cost of hospital revenue cycle operations to be approximately 5% of revenue, resulting in a market size of $60 billion. Additionally, CMS projects physician care expenditures to amount to $730 million in 2018. We estimate cost of physician revenue cycle operations to be approximately 5.5% of revenue, resulting in a market size of $40 billion. According to Research and Markets, revenue cycle spend is projected to grow at a compounded annual growth rate of 12% through 2022.
5
Health systems are currently facing challenges in their revenue cycle operations based on several factors including: (1) more complex and clinical-outcomes based reimbursement, (2) industry consolidation amongst hospitals and across the continuum of care, (3) increasing patient responsibility of their medical bills and (4) capital constraints to invest in the revenue cycle given financial difficulties and requirements to invest in improving clinical care. We believe these are positive trends for external vendors in the revenue cycle industry which we expect will drive further growth for the industry and our company.
Segment
All of our significant operations are organized around the single business of providing revenue cycle operations for U.S.-based health systems, inclusive of acute and ambulatory settings.
We view our operations and manage our business as one operating and reporting segment. All of our net services revenue and trade accounts receivable are derived from healthcare providers domiciled in the United States. The information about our business should be read together with our consolidated financial statements and related notes included elsewhere in this Annual Report on Form 10-K. See Note 18, Segments and Customer Concentrations, to our consolidated financial statements for information regarding our segment and customer concentrations.
Our Services
Drawing on our combination of our extensive healthcare-site expertise, innovative technology and process excellence, we seek to deliver measurable economic value to our customers across our RCM solutions.
Revenue Cycle Management Offering
Our primary RCM service offering consists of comprehensive end-to-end RCM services, which address the full spectrum of revenue cycle challenges faced by healthcare providers. Our approach to deliver value for our customers is built on the R1 Performance StackSM, a holistic operating model designed to fit into a healthcare provider’s revenue cycle operations.
The R1 Performance StackSM consists of four components:
Workflow - End to end work flow differentiated on outcomes - We deploy a fully cataloged,
standardized methodology for revenue cycle execution from order intake and scheduling to claim
reimbursement. The approach is based on standard structures and rigorous methods, tested and proven in multiple organizations and environments.
Analytics - Performance monitoring & management system - We use hundreds of measurement methods
to drive comprehensive daily accountability and to enable front-line operators to deliver on
differentiated business outcomes every single day.
Operations - Scaled global delivery model & leading human capital - We bring experienced talent across global shared services, centralized analytics and deployment teams who all deliver one operating platform. Our teams understand the missions and unique needs of non-profit organizations and are trained, certified and
continuously developed to deliver on customer revenue cycle needs.
Technology - Comprehensive revenue cycle work flow & analytics solutions - Our R1 Hub Technologies
integrate across multiple host and payer systems and hard-wire our standard methods, operating metrics, and
daily routines into an end-to-end technology platform.
Our RCM service offering is designed to adapt to a provider's organizational structure. We seek to integrate our technology, personnel, our accumulated body of knowledge and our culture within each customer’s revenue
6
cycle activities, with the expectation that we will enjoy a long-term collaborative relationship with each customer. We deliver technology and operational support in the form of both on-site management and centralized staffing to deliver improved efficiency and quality across all RCM functions.
Our end-to-end RCM agreements generally provide us with the opportunity to earn net operating fees and incentive fees. Net operating fees represent the gross base fees we charge our customers for operating the revenue cycle processes included in our agreements less corresponding costs of customers’ revenue cycle operations which we undertake to pay pursuant to our RCM agreements. Certain RCM agreements are on a fixed fee, per-use and/or volumetric basis. We help our customers reduce their revenue cycle costs by implementing new operational practices, optimizing their technology suite and deploying more efficient processes. In certain cases, we work with our customers to transfer aspects of their revenue cycle operations to our shared services centers, which typically results in lower operating costs than operating those aspects of the revenue cycle at the customers’ site.
Incentive fees are performance-based fees related to agreed-upon improvements in financial or operating metrics at our customers. When using these metrics to calculate this improvement, we typically utilize metrics that are already being tracked by, or easily calculated from, our customers’ respective accounting systems and compare the results of those metrics against the results for the same metrics for a defined prior period.
We seek to improve our customers’ processes using a variety of techniques including:
• | Gathering Complete Patient and Payer Information. We focus on gathering complete patient information and validating insurance eligibility and benefits so patient care services can be recorded and billed to the appropriate parties. For scheduled healthcare services, we educate patients as to their potential financial responsibilities before receiving care. Through our systems, we maintain an automated electronic scorecard which measures the efficiency of up-front data capture, authorization, billing and collections throughout the life cycle of any given patient account. These scorecards are analyzed in the aggregate, and the results are used to help improve work flow processes and operational decisions for our customers. |
• | Improving Claims Filing and Payer Collections. Through our proprietary technology and process expertise, we identify, for each patient encounter, the amount our customer should receive from a payer if terms of the applicable contract with the payer and patient policies are followed. Over time, we compare these amounts with the actual payments collected to help identify which payers, types of medical treatments and patients represent various levels of payment risk for a customer. Using proprietary algorithms and analytics, we consider actual reimbursement patterns to predict the payment risk associated with a customer’s claims to its payers, and we then direct increased attention and time to the riskiest accounts. |
• | Identifying Alternative Payment Sources. We use various methods to find payment sources for uninsured patients and reimbursement for services not covered by payers. Our patient financial screening technology and methodologies often identify federal, state or private grant sources to help pay for healthcare services. These techniques are designed to ease the financial burden on uninsured or underinsured patients, increase the percentage of patient bills that are actually paid and improve the total amount of reimbursement received by our customers. |
• | Employing Proprietary Technology and Algorithms. We employ a variety of proprietary data analytics and algorithms. For example, we identify patient accounts with financial risk by applying proprietary analysis techniques to the data we have collected. Our systems are designed to streamline work processes through the use of proprietary algorithms that focus revenue cycle staff effort on those accounts deemed to have the greatest potential for improving net revenue yield or charge capture. We adjust our proprietary predictive algorithms to reflect changes in payer and patient behavior based upon the knowledge we obtain from our entire customer base. As new customers are added and payer and patient behavior changes, the information we use to create our algorithms expands, increasing the accuracy, reliability and value of such algorithms. |
• | Using Analytical Capabilities and Operational Excellence. We draw on the experience that we have gained from working with some of the best healthcare provider systems in the United States to train our |
7
customers’ staff about new and innovative RCM practices. We use sophisticated analytical procedures to identify specific opportunities to improve business processes.
• | Increasing Charge Capture. We are able to help our customers increase their charge capture by implementing optimization techniques and related processes. We use sophisticated analytics software to help improve the accuracy of claims filings and the resolution of disputed claims from payers. We also overlay a range of capabilities designed to reduce missed charges, improve the clinical/reimbursement interface and produce bills that comply with payer requirements and applicable healthcare regulations. |
• | Leveraging our Shared Services Centers. We help our customers increase their revenue cycle efficiency by implementing improved practices, streamlining work flow processes and outsourcing aspects of their revenue cycle operations to our shared services centers. Examples of services that can be completed at our shared services centers in the United States and India include pre-registration, medical transcription, cash posting, reconciliation of payments to billing records and patient and payer follow-up. By leveraging the economies of scale and experience of our shared services centers, we believe that we offer our customers better quality services at a lower cost. |
We believe that these techniques are enhanced by our proprietary and integrated technology, management experience and well-developed processes. Our proprietary technology solutions include workflow automation and direct payer connection capabilities that enable revenue cycle staff to focus on problem accounts rather than on manual tasks, such as searching payer websites for insurance and benefits verification for all patients. We employ technology that identifies and isolates specific cases requiring review or action, using the same interface for all users, to automate a host of tasks that otherwise can consume a significant amount of staff time. Our proprietary technology enhances the ability of our customers' revenue cycle staff to improve their interaction with patients. We use real-time feedback from our customers to improve the functionality and performance of our technology and processes and incorporate these improvements into our service offerings on a regular basis. We strive to apply operational excellence throughout our customers' entire revenue cycle.
Modular Solutions
In 2017, in addition to our existing PAS offering, we expanded our portfolio of modular solutions to include five modules focused around key RCM performance outcomes:
• | Revenue Capture: Charge capture, CDM maintenance and pricing services that help providers ensure they are capturing the maximum net compliant revenue for services delivered. |
• | High Accuracy: Full-service coding, revenue integrity services and advanced analytics that help enable revenue growth and improve operational efficiency through compliant processes and services. |
• | High Yield: Appeals and underpayment services designed to improve payer yield through better recovery rates for denials and provide actionable analytics. |
• | High Efficiency: Claim validation, insurance billing and claim reconciliation designed to improve collection yield while reducing costs. |
• | Patient Experience: Pre-registration and financial clearance services designed to ensure adequate coverage and authorization of care. These services support patients’ financial needs and improve their experience accessing care. |
Physician Advisory Services Offering
PAS consists of both concurrent review and retrospective chart audits to help our customers achieve compliant and accurate billing. We also provide customers with retrospective appeal management service support for both governmental and commercial payers. Our physicians conduct detailed retrospective reviews of medical
8
records to identify medical necessity for hospital services and the required documentation to appropriately support an appeal. We employ trained physicians to deliver these services.
Business Update
Intermountain Services Agreement
On January 23, 2018, we entered into an Amended and Restated Services Agreement with Intermountain Healthcare (“Intermountain Healthcare” or “Intermountain”) for a ten-year term. The expanded relationship centers on providing end-to-end RCM under an operating partner relationship for fully managed revenue cycle operations across inpatient and preventative care settings. Intermountain will rely on R1 to provide and manage the full spectrum of RCM needs. Additionally, Intermountain has entered into a securities purchase agreement to acquire equity in R1, pursuant to which the Company sold to Intermountain, in private placements under the Securities Act, (i) 4,665,594 shares of common stock, at a purchase price of $4.2867 per share (representing the per share average closing price of the Company’s Common Stock for the period from January 1, 2018 to January 12, 2018), and (ii) a warrant to acquire up to 1,500,000 shares of Common Stock at an exercise price of $4.2867 per share, on the terms and subject to the conditions set forth in the Warrant Agreement, for an aggregate purchase price of $20,000,000.
Presence Health
On February 18, 2018, we announced that Presence Health has selected the Company to provide its end-to-end RCM services across the Presence Health system’s acute care hospitals and physician care settings.We signed a non-binding term sheet with Presence Health, with the expectation of completing negotiations on a definitive agreement and going live with service in the second quarter of 2018.
Intermedix Acquisition
On February 23, 2018, we entered into an Agreement and Plan of Merger (the “Intermedix Agreement”), with Intermedix Holdings, Inc. (“Intermedix”) and solely in its capacity as Securityholder Representative, Thomas H. Lee Equity Fund VI, L.P. Pursuant to the terms of the Intermedix Agreement, the Company will acquire Intermedix, including its healthcare division comprised of its physician and EMS RCM, practice management and analytics businesses, for $460 million in cash, subject to customary adjustments for cash, debt, transaction expenses and normalized working capital. We intend to fund the Intermedix acquisition and the related fees and expenses with a combination of cash on hand and new financing. Concurrently with the execution of the Intermedix Agreement, the Company entered into debt financing commitment letters. The Intermedix acquisition is expected to close in the second quarter of 2018.
Relationship with Ascension
On February 16, 2016, we entered into a long-term strategic partnership with Ascension Health Alliance, the parent of our largest customer and the nation’s largest Catholic and non-profit health system, and TowerBrook Capital Partners ("TowerBrook"), an investment management firm. As part of the transaction, we amended and restated our Master Professional Services Agreement ("A&R MPSA") with Ascension Health ("Ascension") effective February 16, 2016 with a term of ten years. Pursuant to the A&R MPSA and with certain limited exceptions, we are the exclusive provider of RCM services and PAS with respect to acute care services provided by the hospitals affiliated with Ascension that execute supplement agreements with us. In addition, at the close of the transaction, we issued to TCP-ASC ACHI Series LLLP, a limited liability limited partnership jointly owned by Ascension Health Alliance and investment funds affiliated with TowerBrook ("Investor"): (i) 200,000 shares of our 8.00% Series A Convertible Preferred Stock, par value $0.01 per share (the "Series A Preferred Stock") for an aggregate price of $200 million and (ii) a warrant with a term of ten years to acquire up to 60 million shares of our common stock, par value $0.01 per share, at an exercise price of $3.50 per share, on the terms and subject to the conditions set forth in the Warrant Agreement ("the Warrant"). The Series A Preferred Stock is immediately convertible into shares of common stock. We refer herein to the foregoing transactions consummated on February 16, 2016 with the Investor and Ascension as the "Transaction".
9
This long-term strategic partnership has expanded our relationship with Ascension, and we expect that it will continue to expand that relationship, help us to grow our overall business and improve our ability to win customers outside of the Ascension hospital base. We believe the ten year term of the A&R MPSA, together with the significant investment in R1 by Ascension, our largest customer, provides our business with stability and growth. In addition, our management team continues to benefit from the oversight provided by having TowerBrook involved as a strategic investor.
We started onboarding the first phase of new hospitals in mid-2016, which was followed by the second phase of new hospitals in mid-2017. We have onboarded or started the onboarding process for more than 85% of the new Ascension hospitals under the A&R MPSA.We expect the final phase of hospitals to be onboarded in mid-2018. The A&R MPSA is structured as an operating partner model, whereby a significant number of Ascension’s revenue cycle employees become our employees. The operating partner model also requires the transition of the non-payroll expenses supporting a hospital’s revenue cycle operations to become direct expenses of the Company.
In May 2017, we announced the expansion of our relationship with Ascension. The expanded relationship adds a health system which was acquired by Ascension after the signing of the A&R MPSA and increases the scope of our contract by adding physician RCM services for all Ascension ministries in Wisconsin.
In February 2018, in conjunction with entering into the Intermedix Agreement, we entered into a non-binding term sheet with Ascension to provide certain revenue cycle management services for physician groups that receive services from Ascension’s National Revenue Service Center and other groups associated with Ascension hospital systems (the “Medical Group RCM Services”). The Company expects to enter into the definitive Supplement for Medical Group RCM Services at the time of the closing of the Intermedix acquisition. The execution of the supplement for Medical Group RCM Serivces on terms set forth in the term sheet is a condition to our obligation to consummate the Intermedix acquisition.
Customers
Our customers typically are single or multi-hospital healthcare systems and their respective affiliated ambulatory clinics and physician practice groups. We seek to develop strategic, long-term relationships with our customers and focus on providers that we believe understand the value of our operating model and have demonstrated success in both the provision of healthcare services and the ability to achieve financial and operational results.
Hospital systems affiliated with Ascension have accounted for a significant portion of our net services revenue each year since our formation. For the years ended December 31, 2017, 2016 and 2015, net services revenue from hospitals affiliated with Ascension accounted for 90%, 78% and 45% of our total net services revenue, respectively.
Customer Agreements
We generally provide our RCM offering pursuant to managed services agreements with our customers. In rendering our services, we must comply with customer policies and procedures regarding charity care, personnel, data security, compliance and risk management, as well as applicable federal, state and local laws and regulations. Our end-to-end RCM agreements typically span three to ten years (subject to the parties' respective termination rights). In general, our RCM agreements provide that:
• | we are required to staff a sufficient number of our own employees commensurate with the service offering and provide the technology necessary to implement and manage our services; |
• | in our co-managed relationship model, our management and staff work cooperatively with our customers’ management and staff to achieve mutually specified objectives, and in our operating partner relationship model, we are responsible for providing all revenue cycle personnel, technology and process workflow; |
10
• | a portion of our fees are tied to the achievement of certain financial or operating metrics; and |
• | the parties provide representations and indemnities to each other. |
Our agreements for modular solutions generally vary in length between one and three years. Customers pay a contractually negotiated fee for these services on a fixed fee, per-use or volumetric basis and, in certain cases, a portion of our fees are tied to the achievement of certain metrics.
Sales and Marketing
Our new business opportunities are generated by our sales and marketing team and other members of our senior management team. Our customer acquisition process utilizes traditional and non-traditional techniques to inform the marketplace of R1’s solutions. Broad outreach and interest are turned into 1-1 selling opportunities through demand generation programs and a marketing-sales pipeline management process. Initial interaction with a prospective healthcare system begins with a key decision maker reporting to executive management. The initial interaction begins by comparing the potential customer’s historical and projected results versus a standardized improvement model. The next step is a more detailed assessment of the prospect’s existing operations versus our RCM model and a review of the potential opportunities. We begin negotiations with a standardized contract that is customized, as necessary, after collaborative discussions of operational and management issues and our proposed working relationship. Our sales process for RCM managed services agreements typically lasts 6 to 18 months from the introductory meeting to the agreement’s execution, while our sales process for our modular solutions typically lasts 3 to 6 months.
Technology and Products
Technology and Product Development
Our technology and product development process begins with interaction with the marketplace and understanding of healthcare providers’ needs and challenges. Our product management team in our Chicago headquarters, working closely with our operations team, leads these efforts with product development operations facilities in the United States and India. We continue to invest in the improvement of our technology and products in order to enhance the services that we provide our customers. We devote substantial resources to our development efforts and plan at an annual, bi-annual and quarterly release level. We employ a structured system to assess the impact that potential new technologies, products or enhancements will have on net services revenue, costs, efficiency and customer satisfaction. The results of this analysis are evaluated in conjunction with our overall corporate goals when making development decisions. In addition to our technology and products development team, our operations personnel play an integral role in setting technology and product priorities in support of their objective of keeping our software operating 24 hours a day, seven days a week.
Proprietary Software Suite
Our integrated suite of RCM technology provides a layer of analytics, rules processing and workflow capabilities that interface with provider systems to optimize process efficiency and effectiveness. These technologies power the detection of defects on patient accounts and enable staff workflow at point of service areas, customer sites and our shared service centers.
• | "R1 Access" powers workflow in customer central business offices and at our scaled shared service centers for pre-registration, financial clearance and financial counseling. The platform processes patient accounts through proprietary rules engines tuned to identify defects in demographic data, authorization processes, insurance benefits and eligibility and medical necessity. Our rules engines in R1 Access are also used to calculate patient cost estimates and prior balance accounts receivables. For the uninsured, the platform helps staff triage patients to find coverage for their visit. Our technology enables staff to work on an exception basis eliminating the need for manual intervention on accounts with no exceptions identified. |
11
• | "R1 Link" delivers all of the insight and defect detection capabilities of our proprietary rules engines in real-time to point of service emergency department and registration areas within the hospitals and clinics. When defects or inconsistent data are detected in the data entry or registration process, users receive targeted messages alerting them to resolve the issue while the patient is still in front of them. |
• | "R1 Contact," our patient contact application, provides the workflow and data for patient contact center representatives. It enables effective financial discussions with patients on outstanding balances. The platform is integrated into our call center, call-routing and auto-dialer capabilities and facilitates improved outcomes through propriety process and technology approaches. |
• | "R1 Insight," our proprietary contract modeling platform, is used to accurately calculate the maximum allowed reimbursement for each claim based upon models of our customer's contract with each payer. This platform is used to provide insight into the health of payer contracts and to power portions of the workflow tools described above. |
• | "R1 Analytics," our web-based reporting and analytics platform, produces over 300 proprietary reports derived from the financial, process and productivity data that we accumulate as a result of our services, which enable us to monitor and identify areas for improvement in the efficacy of our RCM services. |
• | "R1 Decision," classifies defects in a proprietary nomenclature and distributes data to back end teams for follow up and resolution according to standard operating processes. Defects are identified and noted on accounts as they occur. The platform, along with our "Yield-Based Follow Up" application, is designed to power customer patient financial services departments and our shared services. |
• | "R1 Physician Advisor," assists our customers in the initiation of a service request by our PAS team. Our platform allows for the electronic submission, tracking, reviewing and auditing of patient cases referred to us. The PAS portal environment is established as a secure site that enables us to receive patient records from customer case managers and route them to our physicians for review. This workflow is supported by an analytics engine within the web portal that provides our customers the ability to improve their compliance and workflow with our real time reporting, dashboards and worklists. |
• | "R1 Patient Experience," streamlines the interface for patients and physicians with the revenue cycle across all settings of care. It includes self-service appointment management, patient out-of-pocket estimation, online pre-registration and financial clearance. The technology includes web-based, mobile, tablet, kiosk and other access points, which are all connected to R1’s proprietary rules engines to reduce revenue cycle defects. |
• | "R1 Automate," provides robotic process automation, data aggregation from disparate sources, desktop automation and other technologies to automate work. With this technology, repetitive transactional processes are automated, delivering operating efficiency and freeing up staff members to focus no higher-order problem solving and higher value-added work. The solutions target a wide range of functions including prior authorization, coding, accounts receivable follow-up, payment posting and credit balances, among others. |
• | “R1 Chart Manager,” supports patient medical record deficiency management, by evaluating record completeness and optimizing the chart completion work flow. The application creates an intuitive user experience, queuing work by defect and providing visibility to work in process. It allows hand-offs across departments, and tracking of accountability for chart completion, in order to drive velocity and accuracy of the medical record management and coding processes. Customers generally experience improved unbilled AR days and faster cash collection by utilizing the technology. |
These propriety technology applications run on an integrated platform built on a modern event driven architecture and rules engines that enhances integration of systems and operational workflows. Our applications are deployed on a highly-scalable architecture based upon Microsoft and other industry leading platforms. We offer a common experience for end-users and believe the consistent look and feel of our applications allows our customers and staff to use our software suite quickly and easily. All customer sites run the same base set of code.
12
Technology Operations
Our software interacts with our customers’ software through a series of real-time and batch interfaces. We do not require changes to the customer’s core patient care delivery or financial systems. Instead of installing hardware or software in customer locations or data centers, we specify the information that a customer needs to extract from its existing systems in order to interface with our systems. This methodology enables our systems to operate with many combinations of customer systems, including custom and industry-standard implementations.
When these interfaces are in place, we provide a holistic application suite across the hospital revenue cycle. For our purposes, the revenue cycle starts when a patient registers for future service or arrives at a hospital or clinic for unscheduled service, and ends when the hospital has collected all the appropriate revenue from all possible sources. Thus, we provide eligibility, address validation, skip tracing, charge capture, patient and payer follow-up, analytics and tracking, charge master management, contract modeling, contract "what if" analysis, collections and other functions throughout the customer’s revenue cycle.
Our applications, including relevant development, testing and quality assurance environments, are hosted and operated from within industry standard, third-party enterprise-class data centers located in Alpharetta, Georgia and Philadelphia, Pennsylvania. Our internal financial application suite is hosted in various locations in a U.S.-based cloud model. The third-party partners we use for hosting are compliant with the Statement on Standards for Attestation Engagements, or SSAE, No. 16, Reporting on Controls at a Service Organization (Service Organization Controls 1). We have agreements with our hardware and system software suppliers for support 24 hours a day, seven days a week. Our operations personnel also use our resources located in our other U.S. facilities, as well as our India facilities.
Data and information regarding our customers’ patients is encrypted both when transmitted over the internet and at-rest. We have data backups that occur at appropriate intervals. In addition to serving as a back-up, these data files update the data in our online analytical processing engine, enabling the data to be more current than if only refreshed overnight.
If a combination of events were to cause a system failure, we would follow our IT incident management processes to isolate the failure and restore services. We believe that no combination of failures by our systems can impact a customer’s ability to deliver patient care because our systems run parallel to the client’s host system, which is the system of record for all patient related information.
Our third-party data centers are designed to withstand many catastrophic events such as blizzards, hurricanes and power grid anomalies. To protect against a catastrophic event in which our primary data center is destroyed and service cannot be fully restored within a few days, we store backups of our systems, applications and databases off-site, which would be utilized to make our systems and IT infrastructure operational in our secondary data center. We would re-establish operations by provisioning new servers, restoring data from the off-site backups and re-establishing connectivity with our customers’ host systems. There would be minimal changes needed on the customer host systems and no changes would need to be made on customer workstations for customers to reconnect to our systems.
As part of our 2018 IT plan, we are transitioning to new data-center hosting providers and are in the process of migrating to next-generation data-centers located in Dallas, TX, and Ashburn, VA. This transition is expected to lay the foundation to support R1’s growth and improve our scaling capabilities and is expected to be completed during 2018.
Information Security
We dedicate significant resources to protecting our customers’ confidential and protected health information ("PHI"). Our security strategy employs various practices and technologies designed to control, audit, monitor and protect access to sensitive information. With our comprehensive, cross-functional approach, we have received and maintained certification from the Health Information Trust ("HITRUST") Alliance since January 2013. The
13
HITRUST Common Security Framework ("CSF"), the most widely adopted framework in the healthcare industry, provides a comprehensive set of baseline security controls that leverage nationally and internationally accepted standards, including ISO, NIST, PCI, HIPAA and COBIT. Our HITRUST certification validates our continued commitment to compliance with the Health Insurance Portability and Accountability Act of 1996, as amended, and the regulations that have been issued under it, such as the Health Information Technology for Economic and Clinical Health Act, or HITECH Act ("HITECH")( and OMNIBUS regulations, which we collectively refer to as "HIPAA", and to state-specific security and privacy laws regarding the creation, access, storage or exchange of PHI and financial information. With continual receipt of HITRUST CSF Certified Status, we believe we are recognized as meeting key healthcare regulations and requirements for protecting and securing sensitive private healthcare information and appropriately managing risk.
Competition
The market for our solutions is highly competitive and we expect competition to intensify in the future. We believe that competition for the services we provide is based primarily on the following factors:
• | knowledge and understanding of the complex healthcare payment and reimbursement system in the United States; |
• | a track record of delivering revenue improvements and efficiency gains for hospitals and healthcare systems; |
• | predictable and measurable results; |
• | the ability to deliver a solution that is fully-integrated along each step of a hospital’s revenue cycle operations; |
• | cost-effectiveness, including the breakdown between up-front costs and pay-for-performance incentive compensation; |
• | reliability, simplicity and flexibility of technology platforms; |
• | understanding of the healthcare industry’s regulatory environment; and |
• | sufficient and scalable infrastructure and financial stability. |
We face competition from various sources, including other end-to-end RCM providers and the internal RCM departments of healthcare organizations. Hospitals that previously have made internal investments in their RCM departments sometimes choose to continue to rely on their own internal RCM staff.
We also compete with several categories of external market participants, most of which focus on specific components of hospital revenue cycle. External market participants include:
• | software vendors and other technology-supported RCM business process outsourcing companies; |
• | traditional consultants; and |
• | information technology outsourcers. |
These types of external participants also compete with us in the field of modular solutions.
Although we believe that there are barriers to replicating our end-to-end RCM solution, competition may intensify in the future. Other companies may develop superior or more economical service offerings that healthcare
14
providers could find more attractive than our offerings. Moreover, the regulatory landscape may shift in a direction that is more strategically advantageous to existing and future competitors.
Government Regulation
The customers we serve are subject to a complex array of federal and state laws and regulations. These laws and regulations may change rapidly and unpredictably, and it is frequently unclear how they apply to our business. We devote significant efforts, through training of personnel and monitoring, to establish and maintain compliance with all regulatory requirements that we believe are applicable to our business and the services we offer.
Government Regulation of Health Information
Privacy and Security Regulations. HIPAA contains substantial restrictions and requirements with respect to the use and disclosure of an individual's PHI. HIPAA prohibits a covered entity from using or disclosing an individual’s PHI unless the use or disclosure is authorized by the individual or is specifically required or permitted under HIPAA. Under HIPAA, covered entities must establish administrative, physical and technical safeguards to protect the confidentiality, integrity and availability of electronic PHI maintained or transmitted by them or by others on their behalf.
HIPAA applies to covered entities such as healthcare providers that engage in HIPAA-defined standard electronic transactions, health plans and healthcare clearinghouses. In February 2009, HIPAA was amended by the HITECH Act to impose certain of the HIPAA privacy and security requirements directly upon "business associates" that perform functions on behalf of, or provide services to, certain covered entities. Most of our customers are covered entities and we are a business associate to many such customers under HIPAA as a result of our contractual obligations to perform certain functions on behalf of, and provide certain services to, those customers. As a business associate, we sometimes also act as a clearinghouse in performing certain functions for our customers. In order to provide customers with services that involve the use or disclosure of PHI, HIPAA requires our customers to enter into business associate agreements with us.
Such agreements must, among other things, provide adequate written assurances:
• | as to how we will use and disclose the PHI; |
• | that we will implement reasonable administrative, physical and technical safeguards to protect such information from misuse; |
• | that we will enter into similar agreements with our agents and subcontractors that have access to the information; |
• | that we will report security incidents and other inappropriate uses or disclosures of the information; and |
• | that we will assist the customer with certain of its duties under HIPAA. |
Transaction Requirements. In addition to privacy and security requirements, HIPAA also requires that certain electronic transactions related to healthcare billing be conducted using prescribed electronic formats. For example, claims for reimbursement that are transmitted electronically to payers must comply with specific formatting standards, and these standards apply whether the payer is a government or a private entity. We are contractually required to structure and provide our services in a way that supports our customers’ HIPAA compliance obligations.
Data Security and Breaches. In recent years, there have been well-publicized data breach incidents involving the improper dissemination of personal health and other information of individuals, both within and outside of the healthcare industry. Many states have responded to these incidents by enacting laws requiring holders of personal information to maintain safeguards and to take certain actions in response to data breach incidents, such as providing prompt notification of the breach to affected individuals and government authorities. In many cases, these laws are
15
limited to electronic data, but states are increasingly enacting or considering stricter and broader requirements. Under the HITECH Act and its implementing regulations, business associates are also required to notify covered entities, which in turn are required to notify affected individuals and government authorities of data security breaches involving unsecured PHI. In addition, the U.S. Federal Trade Commission ("FTC") has prosecuted some data breach cases as unfair and deceptive acts or practices under the Federal Trade Commission Act ("FTC Act"). We have implemented and maintain physical, technical and administrative safeguards intended to protect all personal data, and have processes in place to assist us in complying with applicable laws and regulations regarding the protection of this data and properly responding to any security incidents.
State Laws. In addition to HIPAA, most states have enacted patient confidentiality laws that protect against the unauthorized disclosure of confidential medical information, and many states have adopted or are considering further legislation in this area, including privacy safeguards, security standards and data security breach notification requirements. Such state laws, if more stringent than HIPAA requirements, are not preempted by the federal requirements, and we must comply with them even though they may be subject to different interpretations by various courts and other governmental authorities.
Other Requirements. In addition to HIPAA, numerous other state and federal laws govern the collection, dissemination, use, access to and confidentiality of individually identifiable health and other information and healthcare provider information. The FTC has issued guidance for, and several states have issued or are considering new regulations to require, holders of certain types of personally identifiable information to implement formal policies and programs to prevent, detect and mitigate the risk of identity theft and other unauthorized access to or use of such information. Further, federal and state legislation has been proposed, and through rule making or executive action, several states have taken action, to restrict or discourage the disclosure of medical or other personally identifiable information to individuals or entities located outside of the United States.
Government Regulation of Reimbursement
Our customers are subject to regulation by a number of governmental agencies, including those that administer the Medicare and Medicaid programs. Accordingly, our customers are sensitive to legislative and regulatory changes in, and limitations on, the government healthcare programs and changes in reimbursement policies, processes and payment rates. During recent years, there have been numerous federal legislative and administrative actions that have affected government programs, including adjustments that have reduced or increased payments to physicians and other healthcare providers and adjustments that have affected the complexity of our work. For example, the Medicare Access and CHIP Reauthorization Act of 2015 (MACRA) established a Quality Payment Program (QPP) that requires physician groups to track and report a multitude of data relating to quality, clinical practice improvement activities, use of an electronic health record and cost. Success or failure with respect to these measures may impact reimbursement in future years. Similarly for hospitals, participation in the Medicare Value-Based Purchasing Program, which requires the reporting of quality and cost measures, can have up to a 3% impact on inpatient reimbursement from Medicare in 2018. It is possible that the federal or state governments will implement additional reductions, increases or changes in reimbursement in the future under government programs that adversely affect our customer base or increase the cost of providing our services. Any such changes could adversely affect our own financial condition by reducing the reimbursement rates of our customers.
Shortly after taking office, President Trump began a series of initiatives to reduce government regulation. Executive Order 13771 requires federal agencies to identify two existing regulations to be repealed whenever a new regulation is proposed (referred to as the “2-for-1” Executive Order). Executive Order 13777 requires each federal agency to appoint a Regulatory Reform Officer and Regulatory Reform Task Forces to ensure that agencies effectively carry out these regulatory reform initiatives. For the most part, the 2-for-1 Executive Order has not impacted government regulation of reimbursement because transfer rules, or rules that deal with the transfer of money or goods from one group to another, such as Medicare providers, are exempt from the Executive Order. However, CMS has formed a regulatory reform task force, and in the Fall of 2017 solicited public comments on regulations that could be revised or repealed to reduce the burden on health care providers. It is possible that deregulation efforts could have a positive impact on our customers in the future if administrative burdens are reduced, but at this point the impact is unclear.
16
Fraud and Abuse Laws
A number of federal and state laws, generally referred to as fraud and abuse laws, apply to healthcare providers, physicians and others that make, offer, seek or receive referrals or payments for products or services that may be paid for through any federal or state healthcare program and in some instances any private program. Given the breadth of these laws and regulations, they may affect our business, either directly or because they apply to our customers. These laws and regulations include:
Anti-Kickback Laws. There are numerous federal and state laws that govern patient referrals, physician financial relationships and inducements to healthcare providers and patients. The federal healthcare anti-kickback law prohibits any person or entity from offering, paying, soliciting or receiving anything of value, directly or indirectly, for the referral of patients covered by Medicare, Medicaid and certain other federal healthcare programs or the leasing, purchasing, ordering or arranging for or recommending the lease, purchase or order of any item, good, facility or service covered by these programs. Courts have construed this anti-kickback law to mean that a financial arrangement may violate this law if any one of the purposes of an arrangement is to induce referrals of federal healthcare programs, patients or business, regardless of whether there are other legitimate purposes for the arrangement. There are several limited exclusions known as safe harbors that may protect certain arrangements from enforcement penalties although these safe harbors tend to be quite narrow. Penalties for federal anti-kickback violations can be severe, and include imprisonment, criminal fines, civil money penalties with triple damages and exclusion from participation in federal healthcare programs. Anti-kickback law violations also may give rise to a civil False Claims Act ("FCA") action, as described below. Many states have adopted similar prohibitions against kickbacks and other practices that are intended to induce referrals, and some of these state laws are applicable to all patients regardless of whether the patient is covered under a governmental health program or private health plan.
False or Fraudulent Claim Laws. There are numerous federal and state laws that forbid submission of false information or the failure to disclose information in connection with the submission and payment of provider claims for reimbursement. In some cases, these laws also forbid abuse of existing systems for such submission and payment, for example, by systematic over treatment or duplicate billing of the same services to collect increased or duplicate payments.
In particular, the federal FCA prohibits a person from knowingly presenting or causing to be presented a civil false or fraudulent claim for payment or approval by an officer, employee or agent of the United States. The FCA also prohibits a person from knowingly making, using or causing to be made or used a false record or statement material to such a claim. The FCA was amended on May 20, 2009 by the Fraud Enforcement and Recovery Act of 2009 ("FERA"). Following the FERA amendments, the FCA’s "reverse false claim" provision also creates liability for persons who knowingly conceal an overpayment of government money or knowingly and improperly retain an overpayment of government funds. In addition, the Patient Protection and Affordable Care Act of 2010 ("ACA") requires providers to report and return overpayments and to explain the reason for the overpayment in writing within 60 days of the date on which the overpayment is identified, and the failure to do so is punishable under the FCA. Violations of the FCA may result in treble damages, significant monetary penalties and other collateral consequences including, potentially, exclusion from participation in federally funded healthcare programs. In 2016, penalties for FCA violations doubled and can now range from $10,781 to $21,563 per claim (up from $5,000 to $11,000). The scope and implications of the FCA amendments have yet to be fully determined or adjudicated and as a result it is difficult to predict how future enforcement initiatives may impact our business.
In addition, under the Civil Monetary Penalty Act of 1981, the Department of Health and Human Services Office of Inspector General has the authority to impose administrative penalties and assessments against any person, including an organization or other entity, who knowingly presents, or causes to be presented, to a state or federal government employee or agent certain false or otherwise improper claims.
Stark Law and Similar State Laws. The Ethics in Patient Referrals Act, known as the "Stark Law", prohibits certain types of referral arrangements between physicians and healthcare entities and thus potentially applies to our customers. Specifically, under the Stark Law, absent an applicable exception, a physician may not make a referral to an entity for the furnishing of designated health service ("DHS") for which payment may be made by the Medicare
17
program if the physician or any immediate family member has a financial relationship with that entity. Further, an entity that furnishes DHS pursuant to a prohibited referral may not present or cause to be presented a claim or bill for such services to the Medicare program or to any other individual or entity. Violations of the statute can result in civil monetary penalties and/or exclusion from federal healthcare programs. Stark Law violations also may give rise to a civil FCA action. Any such violations by, and penalties and exclusions imposed upon, our customers could adversely affect their financial condition and, in turn, could adversely affect our own financial condition.
Laws in many states similarly forbid billing based on referrals between individuals and/or entities that have various financial, ownership or other business relationships. These laws vary widely from state to state.
Laws Limiting Assignment of Reimbursement Claims
Various federal and state laws, including Medicare and Medicaid, forbid or limit assignments of claims for reimbursement from government funded programs. Some of these laws limit the manner in which business service companies may handle payments for such claims and prevent such companies from charging their provider customers on the basis of a percentage of collections or charges. We do not believe that the services we provide our customers result in an assignment of claims for the Medicare or Medicaid reimbursements for purposes of federal healthcare programs. Any determination to the contrary, however, could adversely affect our ability to be paid for the services we provide to our customers, require us to restructure the manner in which we are paid, or have further regulatory consequences.
Emergency Medical Treatment and Active Labor Act
The federal Emergency Medical Treatment and Active Labor Act ("EMTALA") was adopted by the U.S. Congress in response to reports of a widespread hospital emergency room practice of "patient dumping." At the time of EMTALA’s enactment, patient dumping was considered to have occurred when a hospital capable of providing the needed care sent a patient to another facility or simply turned the patient away based on such patient’s inability to pay for his or her care. EMTALA imposes requirements as to the care that must be provided to anyone who seeks care at facilities providing emergency medical services. In addition, CMS of the U.S. Department of Health and Human Services has issued final regulations clarifying those areas within a hospital system that must provide emergency treatment, procedures to meet on-call requirements, as well as other requirements under EMTALA. Sanctions for failing to fulfill these requirements include exclusion from participation in the Medicare and Medicaid programs and civil monetary penalties. In addition, the law creates private civil remedies that enable an individual who suffers personal harm as a direct result of a violation of the law to sue the offending hospital for damages and equitable relief. A hospital that suffers a financial loss as a direct result of another participating hospital’s violation of the law also has a similar right.
EMTALA generally applies to our customers, and we assist our customers with the intake of their patients. Although we believe that our customers’ medical screening, stabilization and transfer practices are generally in compliance with the law and applicable regulations, we cannot be certain that governmental officials responsible for enforcing the law or others will not assert that we or our customers are in violation of these laws nor what obligations may be imposed by regulations to be issued in the future.
Regulation of Debt Collection Activities
The federal Fair Debt Collection Practices Act ("FDCPA") regulates persons who regularly collect or attempt to collect, directly or indirectly, consumer debts owed or asserted to be owed to another person. Certain of our accounts receivable activities may be deemed to be subject to the FDCPA. The FDCPA establishes specific guidelines and procedures that debt collectors must follow in communicating with consumer debtors, including the time, place and manner of such communications. Further, it prohibits harassment or abuse by debt collectors, including the threat of violence or criminal prosecution, obscene language or repeated telephone calls made with the intent to abuse or harass. The FDCPA also places restrictions on communications with individuals other than consumer debtors in connection with the collection of any consumer debt and sets forth specific procedures to be followed when communicating with such third parties for purposes of obtaining location information about the
18
consumer. In addition, the FDCPA contains various notice and disclosure requirements and prohibits unfair or misleading representations by debt collectors. Finally, the FDCPA imposes certain limitations on lawsuits to collect debts against consumers.
Debt collection activities are also regulated at the state level. Most states have laws regulating debt collection activities in ways that are similar to, and in some cases more stringent than, the FDCPA. In addition, some states require companies engaged in the collection of consumer debt to be licensed. In all states where we operate, we believe that we (a) currently hold all required licenses, (2) are in the process of requesting and retaining all applicable licenses; or, (3) are exempt from licensing.
We are also subject to the Telephone Consumer Protection Act ("TCPA"). In the process of communicating with our customers’ patients, we use a variety of communications methods. The TCPA places certain restrictions on companies that place telephone calls to consumers.
The FTC has the authority to investigate consumer complaints relating to the FDCPA and the TCPA, and to initiate or recommend enforcement actions, including actions to seek monetary penalties. State officials typically have authority to enforce corresponding state laws. In addition, affected consumers may bring suits, including class action suits, to seek monetary remedies (including statutory damages) for violations of the federal and state provisions discussed above.
Regulation of Credit Card Activities
We process, on behalf of our customers, credit card payments from their patients. Various federal and state laws impose privacy and information security laws and regulations with respect to the use of credit cards. If we fail to comply with these laws and regulations or experience a credit card security breach, our reputation could be damaged, possibly resulting in lost future business, and we could be subjected to additional legal or financial risk as a result of non-compliance.
ICD-10
On October 1, 2015, the International Classification of Diseases 9 ("ICD-9"), which was used to report medical diagnoses and in-patient procedures was replaced by International Classification of Diseases 10 ("ICD-10"). ICD-10 affects coding for all covered entities, is significantly more complex than ICD-9 and has required system and business changes throughout the healthcare industry.
Foreign Regulations
Our operations in India are subject to additional regulations that govern the creation, continuation and winding up of companies, as well as the relationships between the shareholders, the company, the public and the government.
Intellectual Property
We rely upon a combination of patent, trademark, copyright and trade secret laws and contractual terms and conditions to protect our intellectual property rights, and have sought patent protection for aspects of our key innovations.
We have been issued three U.S. patents, which expire in 2028, 2030 and 2031, and have filed three additional U.S. patent applications that relate to key domains of our R1 Access software suite: improving efficiency of client claims' reimbursement, follow-up and measurement. Legal standards relating to the validity, enforceability and scope of protection of patents can be uncertain. We do not know whether any of our pending patent applications will result in the issuance of patents or whether the examination process will require us to narrow our claims. Our patent applications may not result in the grant of patents with the scope of the claims that we seek, if at all, or the scope of the granted claims may not be sufficiently broad to protect our products and technology. Our three granted patents or any patents that may be granted in the future from pending or future applications may be opposed, contested,
19
circumvented, designed around by a third party or found to be invalid or unenforceable. Third parties may develop technologies that are similar or superior to our proprietary technologies, duplicate or otherwise obtain and use our proprietary technologies or design around patents owned or licensed by us. If our technology is found to infringe any patent or other intellectual property right held by a third party, we could be prevented from providing our service offerings and/or subjected to significant damage awards.
We also rely, in some circumstances, on trade secrets to protect our technology. We control access to and the use of our application capabilities through a combination of internal and external controls, including contractual protections with employees, customers, contractors and business partners. We license some of our software through agreements that impose specific restrictions on our customers’ ability to use the software, such as prohibiting reverse engineering and limiting the use of copies. We also require employees and contractors to sign non-disclosure agreements and invention assignment agreements to give us ownership of intellectual property developed in the course of working for us.
Consistent with common industry practices, we occasionally utilize open source software or third party software products to meet our clients' needs.
Financial Information About Geographic Areas
All of our customers are entities organized and located within the United States. We do not derive any customer revenue from countries outside the United States. See Note 6, Property, Equipment and Software, to our consolidated financial statements for information regarding the location of our long-lived assets.
Employees
As of March 5, 2018, we had approximately 9,065 full-time employees, as well as approximately 900 part-time employees. Of these employees, approximately 6,851 full-time and all part-time employees were located in the U.S., and approximately 3,100 full-time employees were located in India. Our employees are not represented by a labor union, and we consider our current employee relations to be good.
Corporate Information
We were incorporated in Delaware in 2003 as Healthcare Services, Inc. and were named Healthcare Services, Inc. from July 2003 until August 2009 when we changed our name to Accretive Health, Inc. We operated under the name Accretive Health until January 5, 2017, when we changed our name to R1 RCM Inc. Our principal executive offices are located at 401 North Michigan Avenue, Suite 2700, Chicago, Illinois 60611, and our telephone number is (312) 324-7820.
Information Availability
Our Annual Reports on Form 10-K, Quarterly Reports on Form 10-Q, Current Reports on Form 8-K, proxy statements and all amendments and exhibits to those reports are available free of charge on our website at www.r1rcm.com under the "Investor Relations" page as soon as reasonably practicable after such material is electronically filed with, or furnished to, the Securities and Exchange Commission (the "SEC"). The content on any website referred to in this Annual Report on Form 10-K is not incorporated by reference into this report, unless expressly noted otherwise. Our reports filed with the SEC are also made available to read and copy at the SEC’s Public Reference Room at 100 F Street, N.E., Washington, D.C. 20549. Information about the Public Reference Room may be obtained by contacting the SEC at 1-800-SEC-0330. Reports filed with the SEC are also made available on its website at www.sec.gov.
20
Item 1A. | Risk Factors |
Risks Relating to our Business and Industry
We may not be able to achieve or maintain profitability.
While we generated net income in 2016, we have incurred net losses in most of our recent fiscal years in accordance with United States generally accepted accounting principles ("GAAP"). We also incurred significant costs in most of our recent fiscal years including, among other things, acquisition related diligence and costs and costs related to exploration of strategic alternatives, legal defense, restructuring and/or previously settled lawsuits filed against us and we may continue to incur additional costs in connection with certain of these matters in 2018. Further, we have incurred and expect to incur additional costs for investments in technology, facilities and talent to support the anticipated growth of our business, including growth related to the expected implementation of our services under our operating partner relationships. We intend to continue to increase our operating expenses associated with sales and marketing in future years in an effort to expand our business. If our revenue does not increase to offset these increases in costs, our operating results would be adversely affected. You should not consider our historical operating results as indicative of future operating results, and we cannot assure you that we will be able to achieve or maintain profitability in the future. Each of the risks described in this "Risk Factors" section, as well as other factors, may adversely affect our future operating results.
If we are unable to retain our existing customers or acquire new customers, our financial condition will suffer.
Our success depends in part upon the retention of our customers and our ability to acquire new customers. We derive our net services revenue primarily from managed services agreements pursuant to which we receive performance-based fees. Customers can elect not to renew their managed services agreements with us upon expiration. In addition, our agreements with certain customers permit such customers to terminate for convenience, subject to a notice period. If a managed services agreement is not renewed or is terminated early for any reason, we would not derive the financial benefits that we would expect to derive by serving that customer.
Some of our managed services agreements require us to adhere to extensive, complex data security, network access and other institutional procedures and requirements of our customers, and we cannot guaranty that some of our customers will not allege that we have not complied with all such procedures and requirements. If we breach a managed services agreement or, for certain of our managed services agreements, fail to perform in accordance with contractual service levels, we may be liable to the customer for damages, and either we or the customer may generally terminate an agreement for a material uncured breach by the other. Any of these events could adversely affect our business, financial condition, operating results and cash flows. In addition, financial issues or other changes in customer circumstances, such as a customer change in control (including as a result of increasing consolidation within the healthcare provider industry), may cause us or the customer to seek to modify or terminate a managed services agreement. Increasing consolidation within the healthcare provider industry may also make it more difficult for us to acquire new customers, as consolidated healthcare systems may be more likely to have incumbent revenue cycle management providers or significant internal revenue cycle capabilities. For example, certain of our smaller customers have been acquired by larger healthcare systems and ceased to be customers.
Additionally, from time to time we have reached settlement agreements with customers which provided for the early terminations of those customers' agreements. The loss of customer agreements has adversely affected our operating results historically.
If we fail to manage our operations effectively, our business would be harmed.
We have not always been fully successful in managing the expansion of our operations which has led, at times to some customer dissatisfaction and weaknesses in our operating, internal and financial controls. To manage potential future growth, we will need to hire, integrate and retain highly skilled and motivated employees, and will
21
need to work effectively with a growing number of customer employees engaged in revenue cycle operations. We will also need to continue to maintain or improve our financial, internal and management controls, reporting systems and procedures. If we do not effectively manage our operations, we may not be able to execute on our business plan, respond to competitive pressures, take advantage of market opportunities, satisfy customer requirements or maintain high-quality service offerings.
Disruptions in service or damage to our shared services centers and third-party operated data centers could adversely affect our business.
Our shared services centers and third-party operated data centers are essential to our business. Our operations depend on our ability to operate our shared services centers, and to maintain and protect our applications, which are located in data centers that are operated for us by third parties. We cannot control or assure the continued or uninterrupted availability of these third-party data centers. In addition, our information technologies and systems, as well as our data centers and shared services centers, are vulnerable to damage or interruption from various causes, including (1) acts of God and other natural disasters, war and acts of terrorism and (2) power losses, computer systems failures, internet and telecommunications or data network failures, operator error, losses of and corruption of data and similar events. We have a business continuity plan and maintain insurance against fires, floods, other natural disasters and general business interruptions to mitigate the adverse effects of a disruption, relocation or change in operating environment at one of our data centers or shared services centers, but the situations we plan for and the amount of insurance coverage we maintain may not be adequate in every particular case. In addition, the occurrence of any of these events could result in interruptions, delays or cessations in service to our customers, or in interruptions, delays or cessations in the direct connections we establish between our customers and payers. Any of these events could impair or inhibit our ability to provide our services, reduce the attractiveness of our services to current or potential customers and adversely affect our financial condition and results of operations.
In addition, despite the implementation of security measures, our infrastructure, data centers, shared services centers or systems that we interface with, including the internet and related systems, may be vulnerable to physical break-ins, improper employee or contractor access, programming errors, cyber attacks, computer viruses, malicious code, phishing attacks, denial-of-service attacks or other information security threats by third parties seeking to disrupt operations or misappropriate information or similar physical or electronic breaches of security. Any of these can cause system failure, including network, software or hardware failure, which can result in service disruptions. As a result, we may be required to expend significant capital and other resources to protect against security breaches and hackers or to alleviate problems caused by such breaches.
Our growing operations in India expose us to risks that could have a material adverse effect on our costs of operations.
We employ a significant number of persons in India and expect to continue to add personnel in India. While there are cost and service advantages to operating in India, significant growth in the technology sector in India has increased competition to attract and retain skilled employees and has led to a commensurate increase in compensation expense. In the future, we may not be able to hire and retain such personnel at compensation levels consistent with our existing compensation and salary structure in India. In addition, our reliance on a workforce in India exposes us to disruptions in the business, political and economic environment in that region. Maintenance of a stable political environment is important to our operations, and terrorist attacks and acts of violence or war may directly affect our physical facilities and workforce or contribute to general instability. Our operations in India require us to comply with local laws and regulatory requirements, which are complex and of which we may not always be aware, and expose us to foreign currency exchange rate risk. Our Indian operations may also subject us to trade restrictions, reduced or inadequate protection for intellectual property rights, security breaches and other factors that may adversely affect our business. Negative developments in any of these areas could increase our costs of operations or otherwise harm our business.
Delayed or unsuccessful implementation of our technologies or services with our customers or implementation costs that exceed our expectations may harm our financial results.
22
To implement our solutions, we work with our customer’s existing vendors, management and staff and layer our proprietary technology applications on top of the customer’s existing patient accounting and clinical systems. Each customer’s situation is different, and unanticipated difficulties and delays may arise such as delays in, or the inability to, obtain approvals or access rights from our customers’ vendors. If the implementation process is not executed successfully or is delayed, our relationship with the customer may be adversely affected and our results of operations could suffer. Implementation of our solutions also requires us to integrate our own employees into the customer’s operations. The customer’s circumstances may require us to devote a larger number of our employees than anticipated, which could increase our costs and harm our financial results.
The markets for our RCM service offering may develop more slowly than we expect, including because some potential customers for our services previously have made or in the future will make investments in internally developed solutions and choose to continue to rely on their own internal resources, which could adversely affect our revenue growth.
Our success depends, in part, on the willingness of hospitals, physicians and other healthcare providers to implement integrated solutions for the areas in which we provide services. Some hospitals may be reluctant or unwilling to implement our solutions for a number of reasons, including failure to perceive the need for improved revenue cycle operations or lack of knowledge about the potential benefits our solutions provide.
Even if potential customers recognize the need to improve revenue cycle operations, they may not select solutions such as ours because they previously have made or in the future will make investments in internally developed solutions and choose to continue to rely on their own internal resources. As a result, the markets for integrated, end-to-end revenue cycle management services may develop more slowly than we expect, which could adversely affect our revenue and operating results.
We operate in a highly competitive industry, and our current or future competitors may be able to compete more effectively than we do, which could have a material adverse effect on our business, revenue, growth rates and market share.
The market for our solutions is highly competitive and we expect competition to intensify in the future. The rapid changes in the U.S. healthcare market due to financial pressures to reduce the growth in healthcare costs and from regulatory and legislative initiatives are increasing the level of competition. We face competition from new entrants as well as the internal RCM departments of hospitals, as described above, and external participants. External participants that are our competitors in the revenue cycle market include end-to-end RCM providers, software vendors and other technology-supported RCM business process outsourcing companies, traditional consultants and information technology outsourcers. These types of external participants also compete with us in the field of physician advisory services (which services and capabilities have been or are being integrated into our RCM service offering). Our competitors may be able to respond more quickly and effectively than we can to new or changing opportunities, technologies, standards, regulations or customer requirements. We may not be able to compete successfully with these companies, and these or other competitors may introduce technologies or services that render our technologies or services obsolete or less marketable. Even if our technologies and services are more effective than the offerings of our competitors, current or potential customers might prefer competitive technologies or services to our technologies and services. Increased competition is likely to result in pricing pressures, which could adversely affect our margins, growth rate or market share.
We face a selling cycle of variable length to secure new RCM agreements, making it difficult to predict the timing of specific new customer relationships.
We face a selling cycle of variable length, typically spanning six to 18 months or longer, to secure a new managed services agreement. Even if we succeed in developing a relationship with a potential new customer, we may not be successful in entering into a managed services agreement with that customer. In addition, we cannot accurately predict the timing of entering into managed services agreements with new customers due to the complex procurement decision processes of most healthcare providers, which often involves high-level management or board
23
committee approvals. Consequently, we have only a limited ability to predict the timing of specific new customer relationships.
If our information technology security measures are breached or fail and unauthorized access is obtained to a customer’s data, our service may be perceived as not being secure, the attractiveness of our services to current or potential customers may be reduced and we may incur significant liabilities.
Our services involve the storage and transmission of customers’ proprietary information and protected health, financial, payment and other personal information of patients. We rely on proprietary and commercially available systems, software, tools and monitoring, as well as other processes, to provide security for processing, transmission and storage of such information, and because of the sensitivity of this information, the effectiveness of such security efforts is very important. If our security measures are breached or fail as a result of third-party action, employee error, malfeasance or otherwise, someone may be able to obtain unauthorized access to customer or patient data. Improper activities by third parties, advances in computer and software capabilities and encryption technology, new tools and discoveries and other events or developments may facilitate or result in a compromise or breach of our computer systems. Techniques used to obtain unauthorized access or to sabotage systems change frequently and generally are not recognized until launched against a target, and we may be unable to anticipate these techniques or to implement adequate preventive measures. Our security measures may not be effective in preventing these types of activities, and the information technology security measures of our third-party data centers and service providers may not be adequate.
To date, cyber attacks have not had a material impact on our business, results of operations or financial condition; however, we could suffer material losses in the future as a result of cyber attacks, and we are not able to predict the severity of these attacks. Our risk and exposure to these matters remains heightened because of, among other things, the evolving nature of these threats, the ongoing shortage of qualified cyber security professionals and the interconnectivity and interdependence of third parties to our systems. The occurrence of a cyber attack, breach, unauthorized access, misuse, computer virus or other malicious code or other cyber security event could jeopardize or result in the unauthorized disclosure, gathering, monitoring, misuse, corruption, loss or destruction of confidential information that belongs to us or our customers or PHI that is processed and stored in, and transmitted through, our computer systems and networks. The occurrence of such an event could also result in damage to our software, computers or systems, or otherwise cause interruptions or malfunctions in our, our customers’ or third parties’ operations. If a breach of our information technology security occurs, we could face damages for contract breach, penalties for violation of applicable laws or regulations, possible lawsuits by individuals affected by the breach and significant remediation costs and efforts to prevent future occurrences. Although we currently carry insurance coverage to protect ourselves against some of these risks, our inability to continue to obtain such insurance coverage at reasonable costs could also have a material adverse effect on us. In addition, whether there is an actual or a perceived breach of our information technology security, the market perception of the effectiveness of our security measures could be harmed and we could lose current or potential customers.
Our results of operations and cash flows fluctuate as a result of certain factors, some of which may be outside of our control.
The timing of any new customer additions is not likely to be uniform period to period, which can cause fluctuations in our results. Operating costs are typically higher in periods in which we add new customers because we incur expenses to implement our operating model at those customers. Further, fees billable to customers under many of our managed services agreements experience fluctuations as they are tied contractually to the level of our customers’ cash receipts. Fees have a significant effect on our cash flows, and changes in the amount of fees can cause significant fluctuations in our quarter-to-quarter operating cash flows. Our cash flows can also be impacted by the timing of operating costs.
If we lose key personnel or if we are unable to attract, hire, integrate and retain our key personnel and other necessary employees, our business could be harmed.
24
Our future success depends in part on our ability to attract, hire, integrate and retain key personnel. Our future success also depends in part on the continued contributions of our executive officers and other key personnel, each of whom may be difficult to replace. The loss of services of any of our executive officers or key personnel, or the inability to continue to attract qualified personnel could have a material adverse effect on our business. Competition for the caliber and number of employees we require is intense. We may face difficulty identifying and hiring qualified personnel at compensation levels consistent with our existing compensation and salary structure. In addition, we invest significant time and expense in training each of our employees, which increases their value to competitors who may seek to recruit them. If we fail to retain our employees, we could incur significant expenses in hiring, integrating and training their replacements, and the quality of our services and our ability to serve our customers could diminish, resulting in a material adverse effect on our business.
We may be unsuccessful in integrating our customers’ revenue cycle management employees who become our employees under our operating partner service offering model.
Under the terms of the our agreements with certain of our customers, we expect to continue to transition a significant number of our customers’ revenue cycle management employees to our employment from time to time. For example, we began transitioning Ascension’s revenue cycle management employees in 2016, and we expect to begin transitioning Intermountain’s revenue cycle employees in 2018. We may experience difficulties in integrating these employees. Such difficulties may include the diversion of management’s attention from other business concerns. If we experience difficulties in integrating these employees, our business, results of operations and financial condition could be adversely affected.
We may be liable to our customers or third parties if we make errors in providing our services, and our anticipated net services revenue may be lower if we provide poor service.
The services we offer are complex, and we make errors from time to time. Errors can result from the interface of our proprietary technology applications and a customer’s existing technologies or we may make human errors in any aspect of our service offerings. The costs incurred in correcting any material errors may be substantial and could adversely affect our operating results. Our customers, or third parties such as our customers’ patients, may assert claims against us alleging that they suffered damages due to our errors, and such claims could subject us to significant legal defense costs in excess of our existing insurance coverage and adverse publicity regardless of the merits or eventual outcome of such claims. In addition, if we provide poor service to a customer and the customer therefore fails to achieve agreed upon improvement in financial or operating metrics, the incentive fee payments to us from that customer will be lower than anticipated.
Our business operations currently include the collection, on behalf of our customers, of medical co-pays and other payments that are due to our customers from their patients. This business practice has been perceived negatively by the public and this negative perception has adversely affected (and may continue to adversely affect) our business, results of operations and financial condition.
We currently collect, on behalf of our customers, medical co-pays and other non-defaulted payments that are due to our customers from their patients, pursuant to managed services agreements with our customers. Collection of these payments from patients may become a more significant part of our RCM services as industry trends continue to increase patient responsibility as a percentage of total compensation to healthcare providers. This business practice, which has received widespread, unfavorable publicity as a result of lawsuits previously initiated against us, has been negatively perceived by the public and has led us to change aspects of our business practices, made it more difficult to retain existing customers and attract new customers, extended the time it takes to enter into service agreements with new customers, and resulted in a material adverse effect on our business, results of operations and financial condition, and it may continue to do so.
Negative public perception in the United States regarding offshore outsourcing and proposed legislation may increase the cost of delivering our services.
25
Offshore outsourcing is a politically sensitive topic in the United States. For example, various organizations and public figures in the United States have expressed concern about a perceived association between offshore outsourcing providers and the loss of jobs in the United States. The Tax Jobs and Cuts Act of 2017 significantly reduced corporate taxes in part to encourage companies to keep work in the United States. Current or prospective customers may elect to perform such services themselves or may be discouraged from transferring these services from onshore to offshore providers to avoid negative perceptions that may be associated with using an offshore provider. Any slowdown or reversal of existing industry trends towards offshore outsourcing would increase the cost of delivering our services if we had to relocate aspects of our services from India to the United States where operating costs are higher.
Legislation in the United States may be enacted that is intended to discourage or restrict offshore outsourcing. In the United States, federal and state legislation has been proposed, and in several states enacted, to restrict or discourage U.S. companies from outsourcing their services to companies outside the United States. Further, through rule making or executive action, some states have imposed limitations on offshore outsourcing of administrative services for the Medicaid program. It is possible that additional legislation could be adopted or regulatory guidance issued that would restrict U.S. private sector companies that have federal or state government contracts, or that receive government funding or reimbursement, such as Medicare or Medicaid payments, from outsourcing their services to offshore service providers. Any changes to existing laws or the enactment of new legislation restricting offshore outsourcing in the United States may adversely affect our ability to do business, particularly if these changes are widespread, and could have a material adverse effect on our business, results of operations, financial condition and cash flows.
Litigation has materially adversely affected our business, financial condition, operating results and cash flows and caused unfavorable publicity and may continue to do so.
We are currently and have in the past been involved in lawsuits, claims, audits and investigations related to our business. These lawsuits, claims, audits and investigations, which are described in "Part I – Item 3 – Legal Proceedings", have resulted in, and may lead to additional, unfavorable publicity for us and may continue to materially adversely affect, our business, financial condition, operating results and cash flows in various ways, including having a disruptive effect upon the operation of our business and consuming the time and attention of our senior management.
In addition, we have incurred substantial expenses in connection with these litigation matters, including substantial fees for attorneys. Although we maintain insurance that may provide coverage for some or all of these expenses, and we have given notice to our insurers of the claims, our insurers have responded, in many instances, by reserving their rights under the policies, including the rights to deny coverage under various policy exclusions. There is risk that the insurers will rescind the policies, that some or all of the claims will not be covered by such policies, or that, even if covered, our ultimate liability will exceed the available insurance.
We are unable to predict the outcome of pending legal actions. The ultimate resolutions of our pending litigation could have a material adverse effect on our financial results, financial condition or liquidity, and on the trading price of our common stock.
In addition, we may become subject to future lawsuits, claims, audits and investigations that could result in the incurrence of substantial additional expense, subject us to significant liability, result in significant settlement payments or further divert management’s attention from our business, and thereby materially adversely affect our business, financial condition, operating results and cash flows.
The imposition of legal responsibility for obligations related to our employees or our customers’ employees could adversely affect our business and subject us to liability.
Under certain of our agreements with customers, we work with those customers’ employees engaged in the activities included in the scope of our services. Our co-management model RCM services agreements establish the division of responsibilities between us and our customers for various personnel management matters, including
26
compliance with and liability under various employment laws and regulations. We could, nevertheless, be found to have liability with our customers for actions against or by employees of our customers, including under various employment laws and regulations, such as those relating to discrimination, retaliation, wage and hour matters, occupational safety and health, family and medical leave, notice of facility closings and layoffs and labor relations, as well as similar liability with respect to our own employees, and any such liability could result in a material adverse effect on our business.
Our ability to use our net operating loss carryforwards may be limited.
As of December 31, 2017, we had approximately $182.5 million of federal net operating loss carryforwards for U.S. income tax purposes that begin to expire in 2033 and cumulative state net operating loss carryforwards of approximately $190.8 million. Section 382 of the Internal Revenue Code imposes limitations on a corporation’s ability to use its net operating loss carryforwards if it experiences an "ownership change." Similar rules and limitations may apply for state income tax purposes. In the event an "ownership change" were to occur in the future, our ability to utilize our net operating losses could be limited. If our net operating loss carryforwards are limited, and we have taxable income which exceeds the available net operating loss carryforwards for that period, we would incur an income tax liability even though net operating loss carryforwards may be available in future years prior to their expiration.
We offer our services in many jurisdictions and, therefore, may be subject to federal, state and local taxes that could harm our business or that we may have inadvertently failed to pay.
We may lose sales or incur significant costs should various tax jurisdictions be successful in imposing taxes on a broader range of services. Imposition of such taxes on our services could result in substantial unplanned costs, which would effectively increase the cost of such services to our customers and may adversely affect our ability to retain existing customers or to gain new customers in the areas in which such taxes are imposed.
Changes in tax laws and unanticipated tax liabilities could adversely affect the taxes we pay and our profitability.
We are subject to income and other taxes in the U.S. and foreign jurisdictions, and our operations, plans and results are affected by tax and other initiatives around the world. In particular, we are affected by the impact of changes to tax laws or policy or related authoritative interpretations. On December 22, 2017, the Tax Cuts and Jobs Act (the “Tax Act”) was signed into law. While we have estimated the effects of the Tax Act, we continue to refine those estimates with the possibility they could change, and those changes could be material. We are also impacted by settlements of pending or any future adjustments proposed by taxing authorities inside and outside of the U.S. in connection with our tax audits, all of which will depend on their timing, nature and scope. Any increases in income tax rates, changes in income tax laws or unfavorable resolution of tax matters could have a material adverse impact on our financial results.
Risks Related to Ascension and the Transaction
Hospital systems affiliated with Ascension currently account for a significant portion of our net services revenue as well as our gross cash generated from contracting activities. The early termination of our A&R MPSA with Ascension, or any significant loss of business from our large customers, would have a material adverse effect on our business, results of operations and financial condition.
Hospital systems affiliated with Ascension have accounted for a significant portion of our net services revenue each year since our formation. In 2017, 2016 and 2015, net services revenue from hospitals affiliated with Ascension represented 90%, 78%, and 45% of our total net services revenue, respectively, in such periods. The early termination of the A&R MPSA, the loss of any of our other large customers or their failure to renew their managed services agreements with us upon expiration, or a reduction in the fees for our services for these customers, could have a material adverse effect on our business, results of operations and financial condition.
27
Our agreement with Ascension requires us to offer to Ascension service fees that are at least as low as the fees we charge any other customer receiving comparable services at comparable or lower volumes.
Our A&R MPSA with Ascension requires us to offer to Ascension's affiliated hospital systems fees for our services that are at least as low as the fees we charge any other customer receiving comparable services at lower volumes. If we were to charge lower service fees to any other customer receiving comparable services at lower volumes, we would be obligated to charge such lower fees to the hospital systems affiliated with Ascension effective as of the date such lower charges were first implemented for such other customer. If we offer customers lower rates than as discussed above, it could have a material adverse effect on our results of operations and financial condition.
The shares of Series A Preferred Stock are senior obligations, rank prior to our common stock with respect to dividends, distributions and payments upon liquidation and have other terms, such as a put right and a mandatory conversion date, that could negatively impact the value of shares of our common stock.
We have issued 227,483 shares of Series A Preferred Stock to the Investor. The rights of the holders of our Series A Preferred Stock with respect to dividends, distributions and payments upon liquidation rank senior to similar obligations to our common stock holders. Upon our liquidation or upon certain changes of control, the holders of our Series A Preferred Stock are entitled to receive, prior and in preference to any distribution to the holders of any other class of our equity securities, an amount equal to the greater of the outstanding principal plus all accrued and unpaid dividends on such Series A Preferred Stock (which cumulative dividends accrue at the rate of 8.0% per annum and compound quarterly) and the amount such holders would have received if such Series A Preferred Stock had been converted into common stock. Until February 16, 2023, the dividends on the Series A Preferred Stock will be paid-in-kind and thereafter such dividends may be paid in cash or paid-in-kind at the election of the Company.
The terms of the Series A Preferred Stock provide rights to their holders that could negatively impact our Company. Shares of our Series A Preferred Stock may be converted at any time at the option of the holder at an effective initial conversion price of $2.50 per share (which conversion price is subject to adjustment upon the occurrence of certain events).
Further, so long as Investor owns at least 25% of our common stock on an as-converted basis, no dividends on our common stock (or any other equity securities junior in right to the Series A Preferred Stock) may be paid without the consent of the Investor. To the extent any dividend, distributions or other payments are made on our common stock, the holders of the Series A Preferred Stock shall have the right to participate on an as converted basis in any such dividends, distributions or other payments. The existence of such a senior security could have an adverse effect on the value of our common stock.
The Investor, an affiliate of TowerBrook and Ascension, is a significant shareholder in us and may have conflicts of interest with us or you in the future.
In connection with the Transactions, we entered into a purchase agreement with the Investor and Ascension, pursuant to which we issued (i) 200,000 shares of our Series A Preferred Stock for an aggregate price of $200 million and (ii) a warrant to acquire up to 60 million shares of our common stock. As a result of this ownership, so long as certain ownership thresholds are met, the Investor, among other things, has the right to nominate a majority of the members of our board of directors ("Board") and has a consent right over certain corporate actions, including the declaration of any dividend, any amendment of the A&R MPSA, the incurrence of indebtedness in excess of $25.0 million, the acquisition of any assets or properties or the making of any capital expenditures in excess of $10.0 million, the approval of our annual budget and the hiring or termination of our chief executive officer. In addition, as of December 31, 2017, the issued and outstanding Series A Preferred Stock would represent approximately 47% of the current voting power at a meeting of our stockholders.
The interests of the Investor and its affiliates may differ from our other stockholders in material respects. For example, the Investor may have an interest in pursuing acquisitions, divestitures, financings (including financings that are secured and senior to the Series A Preferred Stock) or other transactions that, in their judgment, could
28
enhance their equity investments, even though such transactions might involve risks to you. Additionally, Ascension is an affiliate of Investor and as our largest customer their interests may differ from yours. The Investor or its affiliates or advisors are also in the business of making or advising on investments in companies, and may from time to time in the future, acquire interests in, or provide advice to, businesses that directly or indirectly compete with certain portions of our business or are suppliers or customers of ours. They may pursue acquisition opportunities that may be complementary to our business and, as a result, those acquisition opportunities may not be available to us. You should consider that the interests of these holders may differ from yours in material respects.
Risks Related to the Pending Acquisition of Intermedix
There is no assurance that our pending acquisition of Intermedix will be completed in a timely manner or at all. If the acquisition of Intermedix is not consummated, our business could suffer materially and our stock price could decline.
The consummation of our acquisition of Intermedix is subject to customary closing conditions, including the expiration or early termination of the waiting period under the Hart-Scott-Rodino Act of 1976, as amended. There can be no assurance that the acquisition will be consummated on the desired timeframe, or at all.
If our acquisition of Intermedix is not consummated, we may be subject to a number of material risks, and our business and stock price could be adversely affected, as follows:
• | we have incurred and expect to continue to incur significant expenses related to the acquisition of Intermedix even if the transaction is not consummated; |
• | we could be obligated to pay Intermedix a $23.0 million termination fee or a $32.2 million termination fee, as applicable, depending on the circumstances, in connection with the termination of the Intermedix Agreement; and |
• | the market price of our common stock may decline to the extent that the current market price reflects a market assumption that the acquisition will be completed. |
We may fail to realize the anticipated benefits of the Intermedix acquisition.
The success of the acquisition of Intermedix will depend on, among other things, our ability to realize anticipated synergies and cost savings from the combination of the businesses of R1 and Intermedix. In particular, the anticipated benefits are subject to the following risks:
• | we may fail to realize the anticipated synergies and cost savings we expect from the acquisition; |
• | the use of a significant portion of our cash and the incurrence of substantial indebtedness in connection with the financing of the acquisition may have an adverse effect on our liquidity; |
• | we may fail to retain key employees of Intermedix; |
• | we may be unable to successfully integrate personnel from the two companies, while at the same time attempting to provide consistent, high quality services; |
• | future developments may impair the value of our purchased goodwill or intangible assets; |
• | we may face difficulties establishing, integrating or combining operations and systems; |
• | we may face challenges retaining the customers of the acquired businesses; |
29
• | we may become responsible for unexpected liabilities, which could negatively impact our financial position and results of operations following the acquisition; |
• | we may be unable to successfully integrate the additional Ascension employees contemplated by the supplement to the A&R MPSA; |
• | we may encounter unforeseen internal control, regulatory or compliance issues; and |
• | we may face other additional risks relating to regulatory matters, legal proceedings, tax laws or positions. |
If any of these risks occur, we may not be able to realize the anticipated benefits of the acquisition, or they may take longer to realize than expected. The integration process could result in the distraction of our management, the disruption of our ongoing business or inconsistencies in our services, standards, controls, procedures and policies, any of which could adversely affect our ability to maintain relationships with customers, vendors and employees or to achieve the anticipated benefits of the acquisition, or could otherwise adversely affect our business and operating results.
In connection with the Intermedix acquisition, we will incur a substantial amount of indebtedness. The agreements that will govern the indebtedness to be incurred by us are expected to contain covenants that impose restrictions on our ability to operate.
We intend to fund a portion of the purchase price for the Intermedix acquisition with a new $295 million senior secured credit facility and $110 million principal amount of unsecured, subordinated notes provided by Ascension Health Alliance and investment funds affiliated with TowerBrook Capital Partners. The definitive loan documentation for this indebtedness is expected to contain certain customary representations and warranties, affirmative and negative financial covenants, indemnity obligations and events of default. This new indebtedness could have important consequences to us, including:
• | our ability to obtain additional financing, if necessary, for working capital, capital expenditures, acquisitions or other purposes may be impaired or such financing may not be available on favorable terms, or at all; |
• | any negative financial covenants contained in the debt agreements will require us to meet financial tests that may affect our flexibility in planning for, and reacting to, changes in our business, including possible acquisition opportunities; |
• | we will need a substantial portion of our cash flow to make principal and interest payments on our indebtedness, reducing the funds that would otherwise be available for operations and future business opportunities; and |
• | our debt level will make us more vulnerable than our less leveraged competitors to competitive pressures or a downturn in our business or the economy generally. |
Our ability to comply with the provisions of the debt agreements may be affected by events beyond our control. Failure to comply with these covenants could result in an event of default, which, if not cured or waived, could accelerate our debt repayment obligations.
Regulatory Risks
The healthcare industry is heavily regulated. Our failure to comply with regulatory requirements could create liability for us, result in adverse publicity and adversely affect our business.
30
The healthcare industry is heavily regulated and is subject to changing political, legislative, regulatory and other influences. Many healthcare laws are complex, and their application to specific services and relationships may not be clear. In particular, many existing healthcare laws and regulations, when enacted, did not anticipate the services that we provide. There can be no assurance that our operations will not be challenged or adversely affected by enforcement initiatives. Enforcement activity is growing and is an identified priority of federal and state governments. Our failure to accurately anticipate the application of these laws and regulations to our business, or any other failure to comply with regulatory requirements, could create liability for us, result in adverse publicity and adversely affect our business. Federal and state legislatures and agencies frequently consider proposals to revise laws that impact the healthcare industry or to revise or create additional statutory and regulatory requirements. Such proposals, if implemented, could adversely affect our operations, the attractiveness of our services to existing customers and our ability to market new services, or could create unexpected liabilities for us. We are unable to predict what changes to laws or regulations might be made in the future or how those changes could affect our business or our operating costs.
Developments in the healthcare industry, including national healthcare reform, could adversely affect our business.
The healthcare industry has changed significantly in recent years and we expect that significant changes will continue to occur. The timing and impact of developments in the healthcare industry are difficult to predict. We cannot be sure that the markets for our services will continue to exist at current levels or that we will have adequate technical, financial and marketing resources to react to changes in those markets. It is uncertain whether the Republican-controlled Congress will be able to repeal the Affordable Care Act in 2018. The repeal of the individual mandate in 2017 could lead to an increase in the uninsured population and an increase in bad debt, which could reduce revenue to hospitals and in turn impact our revenue. The adoption of other measures to reform the Medicaid program through block grants and other methods could similarly reduce hospital revenue and have an adverse effect on our business. We are unable to predict what additional healthcare initiatives, if any, will be implemented at the federal or state level, or what the ultimate effect of federal health care reform or any future legislation or regulation will have on us. Other material changes, such as the required transition to ICD-10 in October 2015, have required and will continue to require significant system and business changes throughout the healthcare industry, and may be disruptive to our customers and our business. Such disruption could result in, among other things, the imposition of significant new challenges to our ability to achieve performance targets specified under our customer contracts, as well as a need for us to redeploy resources or to obtain new resources in an effort to meet such challenges, all of which could adversely affect our business or our results of operations. Additionally, several reductions or changes to Medicare reimbursement have been enacted recently or will be implemented, which reductions and changes could reduce the amounts received by our customers and may have an adverse indirect effect on our business.
Healthcare reform also is causing the transition of some payment methods and provider reimbursement from volume-based reimbursement to value-based reimbursement models, which can include risk-sharing, accountable care organizations, capitation, bundled payment and other innovative approaches. While such new reimbursement models may provide us with opportunities to provide new or additional services to our customers (e.g., our value based reimbursement capabilities within our RCM service offering) and to participate in incentive based payment arrangements for our services, there can be no assurance that such new models and approaches will prove to be profitable to our customers or to us. Further, such new models and approaches may require investment by us to develop technology or expertise to offer necessary and appropriate services or support to our customers, and the amount of such investment and the timing for return of such investment are not fully known at this time due to the uncertainties of healthcare reform and payment and reimbursement model transitions that are occurring. Certain new care delivery and reimbursement models are being offered as pilot programs or as limited or transitional programs, and there is no assurance that such programs will continue or be renewed. Any of these models and approaches, and changes generally in the healthcare industry, can impact the relationships between our customers and payers, from which our customers derive revenue and with which revenue our customers pay for our services. Adoption of such new models and approaches may require compliance with a range of federal and state laws relating to fraud and abuse, insurance, reinsurance and managed care regulation, billing and collection, corporate practice of medicine restrictions and licensing, among others. Many states in which these new value-based structures are being developed lack regulatory guidance or a well-developed body of law for these new models and approaches, or may not have
31
updated their laws or enacted legislation yet to reflect the new healthcare reform models. As a result, although we have structured, and will attempt to structure and conduct, our operations in accordance with our interpretation of current laws and regulations, new laws, regulations or guidance could have a material adverse effect on our current and future operations and could subject us to the risk of restructuring or terminating our customer agreements and arrangements, as well as the risk of regulatory enforcement, penalties and sanctions, if state enforcement agencies disagree with our interpretation of state laws.
If we violate HIPAA, the HITECH Act or state or foreign health information privacy laws, we may incur significant liabilities, and any such violations could make it more difficult to retain existing customers or attract new customers, extend the time it takes to enter into service agreements with new customers, and result in a material adverse effect on our business, results of operations and financial condition.
HIPAA contains substantial restrictions and requirements with respect to the use and disclosure of individuals’ PHI. Under HIPAA, covered entities, including health plans, healthcare providers, and healthcare clearinghouses that conduct HIPAA-defined standard electronic transactions, are restricted in how they use and disclose PHI and must establish administrative, physical and technical safeguards to protect the confidentiality, integrity and availability of electronic PHI maintained or transmitted by them or by others on their behalf. Most of our customers are covered entities and we are a business associate to many of those customers under HIPAA as a result of our contractual obligations to perform certain functions on behalf of, and to provide certain services to, those customers. As a business associate, we sometimes also act as a clearinghouse in performing certain functions for our customers. In addition, although we believe that we are not a healthcare provider, if we were found to be a healthcare provider, we could have liability under the provisions of HIPAA that apply to providers as well as under state health information privacy and licensing laws. Our use and disclosure of PHI is restricted by HIPAA and the business associate agreements we are required to enter into with our covered entity customers. In 2009, HIPAA was amended by the HITECH Act to impose certain of the HIPAA privacy and security requirements directly upon business associates of covered entities and increase significantly the monetary penalties for violations of HIPAA. The HITECH Act also requires business associates to notify covered entities, who in turn must notify affected individuals and government authorities, of data security breaches involving unsecured PHI. Since the passage of the HITECH Act, enforcement of HIPAA violations has increased, as indicated by the announcement of a number of significant settlement agreements and/or sanctions by federal authorities, the pursuit of HIPAA violations by state attorneys general, and the roll-out of a new federal audit program for covered entities and business associates.
In addition to HIPAA, most states have enacted patient confidentiality laws that protect against the unauthorized disclosure of confidential medical information, and many states have adopted or are considering further legislation in this area, including privacy safeguards, security standards and data security breach notification requirements. Such state laws, if more stringent than HIPAA, are not preempted by the federal requirements, and we must comply with them even though such state laws may be subject to different interpretations by various courts and other governmental authorities. We will also become subject to the European General Data Protection Regulation, which becomes effective in May 2018, upon consummation of the Intermedix acquisition.
We have implemented and maintain physical, technical and administrative safeguards intended to protect all personal data and have processes in place to assist us in complying with applicable laws and regulations regarding the protection of this data and properly responding to any security incidents or breaches. We have received and maintained certification from the Health Information Trust (HITRUST) Alliance since January 2013. The HITRUST Common Security Framework (CSF), the most widely adopted framework in the healthcare industry,
provides a comprehensive set of baseline security controls that leverage nationally and internationally accepted
standards, including ISO, NIST, PCI, HIPAA and COBIT. Our HITRUST certification validates our continued
commitment to compliance with the Security and Privacy Rules under HIPAA and to state-specific security and
privacy laws regarding the creation, access, storage or exchange of PHI and financial information. Nonetheless, a knowing breach of HIPAA’s requirements could expose us to criminal liability. A breach of our safeguards and processes that is not due to reasonable cause or involves willful neglect could expose us to significant civil penalties and the possibility of civil litigation under HIPAA and applicable state law.
32
We have been the victim of theft of company property containing patient data in the past, and we may face similar incidents in the future, which could result in a material adverse effect on our business, results of operations and financial condition.
If we fail to comply with federal and state laws governing submission of false or fraudulent claims to government healthcare programs and financial relationships among healthcare providers, we may be subject to civil and criminal penalties or loss of eligibility to participate in government healthcare programs.
A number of federal and state laws, including anti-kickback restrictions and laws prohibiting the submission of false or fraudulent claims, apply to healthcare providers, physicians and others that make, offer, seek or receive payments or split fees for referrals of products or services that may be paid for through any federal or state healthcare program and, in some instances, any private program. These laws are complex and their application to our specific services and relationships may not be clear and may be applied to our business in ways that we do not anticipate. Healthcare, as one of the largest industries in the country and one of the costliest lines in the federal budget, continues to attract attention from legislators and regulators. Federal and state regulatory and law enforcement authorities continue to focus on enforcement activities with respect to Medicare and Medicaid fraud and abuse regulations and other healthcare reimbursement laws and rules in an effort to reduce overall healthcare spending. From time to time, participants in the healthcare industry receive inquiries or subpoenas to produce documents in connection with government investigations. We could be required to expend significant time and resources to comply with these requests, and the attention of our management team could be diverted by these efforts. Furthermore, if we are found to be in violation of any federal or state fraud and abuse laws, we could be subject to civil and criminal penalties, forced to restructure our business and excluded from participating in federal and state healthcare programs such as Medicare and Medicaid which would result in significant harm to our business and financial condition.
The federal healthcare anti-kickback law prohibits any person or entity from offering, paying, soliciting or receiving anything of value, directly or indirectly, for the referral of patients covered by Medicare, Medicaid and other federal healthcare programs or the leasing, purchasing, ordering or arranging for or recommending the lease, purchase or order of any item, good, facility or service covered by these programs. Many states have adopted similar prohibitions against kickbacks and other practices that are intended to induce referrals, and some of these state laws are applicable to all patients regardless of whether the patient is covered under a governmental health program or private health plan. New payment structures, such as accountable care organizations and other arrangements involving combinations of hospitals, physicians and other providers who share payment savings, potentially implicate anti-kickback and other fraud and abuse laws. We seek to structure our business relationships and activities to avoid any activity that could be construed to implicate the federal healthcare anti-kickback law and similar laws. We cannot assure you, however, that our arrangements and activities will be deemed outside the scope of these laws or that increased enforcement activities will not directly or indirectly have a material adverse effect on our business, financial condition or results of operations. Any determination by a federal or state agency or court that we have violated any of these laws could subject us to civil or criminal penalties, could require us to change or terminate some portions of our operations or business, could disqualify us from providing services to healthcare providers doing business with government programs, could give our customers the right to terminate our managed services agreements with them and, thus, could have a material adverse effect on our business and results of operations. Moreover, any violations by, and resulting penalties or exclusions imposed upon, our customers could adversely affect their financial condition and, in turn, have a material adverse effect on our business and results of operations.
There are also numerous federal and state laws that forbid submission of false information or the failure to disclose information in connection with the submission and payment of healthcare provider claims for reimbursement. In particular, the federal FCA prohibits a person from knowingly presenting or causing to be presented a false or fraudulent claim for payment or approval by an officer, employee or agent of the United States. In addition, the FCA prohibits a person from knowingly making, using, or causing to be made or used a false record or statement material to such a claim. The FCA may be enforced by the government or by private whistleblowers under the "qui tam" provisions of the statute. Whistleblowers are entitled to a share of any recovery in a FCA case. Changes to the FCA enacted as part of the ACA make it easier for whistleblowers to bring FCA claims. Although
33
changes may be made to the ACA, the changes to the FCA contained in the ACA will likely remain in place. Violations of the FCA may result in treble damages, significant monetary penalties, and other collateral consequences including, potentially, exclusion from participation in federally funded healthcare programs.
These laws and regulations may change rapidly, and it is frequently unclear how they apply to our business. Errors created by our proprietary applications or services that relate to entry, formatting, preparation or transmission of claim, reporting of quality or other data pursuant to value-based purchasing initiatives, or cost report information may be determined or alleged to cause the submission of false claims or otherwise be in violation of these laws and regulations. Further, our continued growth of coding and billing services provided from an offshore shared services environment necessitates comprehensive monitoring and oversight of these services to ensure a constant vigilance to quality control and regulatory compliance. Any failure of our proprietary applications or services to comply with these laws and regulations could result in substantial civil or criminal liability and could, among other things, adversely affect demand for our services, invalidate all or portions of some of our managed services agreements with our customers, require us to change or terminate some portions of our business, require us to refund portions of our base fee revenues and incentive payment revenues, cause us to be disqualified from serving customers doing business with government payers, and give our customers the right to terminate our managed services agreements with them.
We cannot be certain that governmental officials responsible for enforcing EMTALA, or other parties, will not assert that our customers are in violation of EMTALA, and defending and settling allegations of EMTALA violations could have a material adverse effect on our business even if we are ultimately not found to have contributed to such violations.
EMTALA requires Medicare-participating hospitals that have emergency departments to provide a medical screening examination and stabilizing treatment to all individuals who come to the hospital seeking treatment of an emergency medical condition, regardless of the patient’s ability to pay for the care. Sanctions for failing to fulfill these requirements include exclusion from participation in the Medicare and Medicaid programs and civil monetary penalties. In addition, the law creates private civil remedies that enable an individual who suffers personal harm as a direct result of a violation of the law to sue the offending hospital for damages and equitable relief.
Since we are not a healthcare provider, EMTALA is not applicable to us, but we cannot be certain that governmental officials responsible for enforcing EMTALA, or other parties, will not assert that our customers are in violation of EMTALA. If our customers are found to have violated EMTALA, they may assert claims that our management practices contributed to the violation. Defending and settling allegations of EMTALA violations could have a material adverse effect on our business even if we are ultimately not found guilty of a violation.
Our failure to comply with debt collection and other consumer protection laws and regulations could subject us to fines and other liabilities, which could harm our reputation and business, and could make it more difficult to retain existing customers or attract new customers, extend the time it takes to enter into service agreements with new customers, and result in a material adverse effect on our business, results of operations and financial condition.
The FDCPA regulates persons who regularly collect or attempt to collect, directly or indirectly, consumer debts in default that are owed or asserted to be owed to another person. However, our business practices that involve collecting, or assisting our customers in collecting, non-defaulted amounts owed by patients for current and prior services activities may be determined to be subject to the FDCPA. Many states impose additional requirements on debt collection communications, and some of those requirements may be more stringent than the federal requirements. Moreover, regulations governing debt collection are subject to changing interpretations that may be inconsistent among different jurisdictions. Further, we are subject to the TCPA, which imposes certain restrictions on companies that place telephone calls to consumers.
We could incur costs or could be subject to fines or other penalties under the TCPA, the FDCPA and the FTC Act if we are determined to have violated the provisions of those regulations during the course of conducting our operations. We, or our customers, could be required to report such breaches to affected consumers or regulatory
34
authorities, leading to disclosures that could damage our reputation or harm our business, financial position and operating results. As a result of the theft of a laptop in 2011 giving rise to a lawsuit against us by the Minnesota Attorney General and a related FTC inquiry of our data security practices, in December 2013, we entered into a consent order with the FTC pursuant to which no fine or penalty was paid but in which we agreed, among other things, to maintain a comprehensive information security program reasonably designed to protect the security, confidentiality, and integrity of personal information collected from or about consumers. Future allegations of this type could require us to change aspects of our business practices, make it more difficult to retain existing customers or attract new customers, extend the time it takes to enter into service agreements with new customers, and result in a material adverse effect on our business, results of operations and financial condition.
Potential additional regulation of the disclosure of health information outside the United States may increase our costs.
Federal or state governmental authorities may impose additional data security standards or additional privacy or other restrictions on the collection, use, transmission and other disclosures of health information. Legislation has been proposed at various times at both the federal and the state levels that would limit, forbid or regulate the use or transmission of medical information pertaining to U.S. patients outside of the United States. Some states have also imposed limitations through rule making or executive action. If additional states or the federal government were to adopt additional limitations, that may render our operations in India impracticable or substantially more expensive. Moving such operations to the United States may involve substantial delay in implementation and increased costs.
We may not realize all of the anticipated benefits of our acquisitions and long-term strategic partnerships, or these benefits may take longer to realize than expected.
From time to time, we make strategic acquisitions or enter into long-term strategic partnerships. Transactions such as the A&R MPSA with Ascension, the amended and restated services agreement with Intermountain and the acquisition of Intermedix, and transactions that we may enter into in the future, may involve significant challenges and risks, including that the transactions do not advance our business strategy, or fail to produce satisfactory returns on our investment. Our due diligence reviews may not identify all of the issues necessary to accurately estimate the cost and potential risks of a particular transaction, including potential exposure to regulatory sanctions as a result of a target company or partner’s previous activities, unexpected costs. As a result of these risks, any future acquisition or long-term strategic partnership may not be successful, and we may not realize any benefits from any such transaction.
Risks Related to Intellectual Property
We may be unable to adequately protect our intellectual property.
Our success depends, in part, upon our ability to establish, protect and enforce our intellectual property and other proprietary rights. If we fail to establish or protect our intellectual property rights, we may lose an important advantage in the market in which we compete. We rely upon a combination of patent, trademark, copyright and trade secret law and contractual terms and conditions to protect our intellectual property rights, all of which provide only limited protection. We cannot assure you that our intellectual property rights are sufficient to protect our competitive advantages. Although we have filed three U.S. patent applications, we cannot assure you that any patents that will be issued from these applications will provide us with the protection that we seek or that any future patents issued to us will not be challenged, invalidated or circumvented. We have also been issued three U.S. patents, but we cannot assure you that they will provide us with the protection that we seek or that they will not be challenged, invalidated or circumvented. Legal standards relating to the validity, enforceability and scope of protection of patents are uncertain. Any patents that may be issued in the future from pending or future patent applications or our three issued patents may not provide sufficiently broad protection or they may not prove to be enforceable in actions against alleged infringers. Also, we cannot assure you that any trademark registrations will be issued for pending or future applications or that any of our trademarks will be enforceable or provide adequate protection of our proprietary rights.
35
We also rely in some circumstances on trade secrets to protect our technology. Trade secrets may lose their value if not properly protected. We endeavor to enter into non-disclosure agreements with our employees, customers, contractors and business partners to limit access to and disclosure of our proprietary information. The steps we have taken, however, may not prevent unauthorized use of our technology, and adequate remedies may not be available in the event of unauthorized use or disclosure of our trade secrets and proprietary technology. Moreover, others may reverse engineer or independently develop technologies that are competitive to ours or infringe our intellectual property.
Accordingly, despite our efforts, we may be unable to prevent third parties from infringing or misappropriating our intellectual property and using our technology for their competitive advantage. Any such infringement or misappropriation could have a material adverse effect on our business, results of operations and financial condition. Monitoring infringement of our intellectual property rights can be difficult and costly, and enforcement of our intellectual property rights may require us to bring legal actions against infringers. Infringement actions are inherently uncertain and therefore may not be successful, even when our rights have been infringed, and even if successful may require a substantial amount of resources and divert our management’s attention.
Claims by others that we infringe their intellectual property could force us to incur significant costs or revise the way we conduct our business.
Our competitors protect their intellectual property rights by means such as patents, trade secrets, copyrights and trademarks. We have not conducted an independent review of patents issued to third parties. Additionally, because patent applications in the United States and many other jurisdictions are kept confidential for 18 months before they are published, we may be unaware of pending patent applications that relate to our proprietary technology. Any party asserting that we infringe its proprietary rights would force us to defend ourselves, and possibly our customers, against the alleged infringement. These claims and any resulting lawsuit, if successful, could subject us to significant liability for damages and invalidation of our proprietary rights or interruption or cessation of our operations. The software and technology industries are characterized by the existence of a large number of patents, copyrights, trademarks and trade secrets and by frequent litigation based on allegations of infringement or other violations of intellectual property rights. Moreover, the risk of such a lawsuit will likely increase as our size and scope of our services and technology platforms increase, as our geographic presence and market share expand and as the number of competitors in our market increases.
Any such claims or litigation could:
• | be time-consuming and expensive to defend, whether meritorious or not; |
• | require us to stop providing the services that use the technology that infringes the other party’s intellectual property; |
• | divert the attention of our technical and managerial resources; |
• | require us to enter into royalty or licensing agreements with third parties, which may not be available on terms that we deem acceptable, if at all; |
• | prevent us from operating all or a portion of our business or force us to redesign our services and technology platforms, which could be difficult and expensive and may make the performance or value of our service offerings less attractive; |
• | subject us to significant liability for damages or result in significant settlement payments; or |
• | require us to indemnify our customers, as we are required by contract to indemnify some of our customers for certain claims based upon the infringement or alleged infringement of any third party’s intellectual property rights resulting from our customers’ use of our intellectual property. |
36
Intellectual property litigation can be costly. Even if we prevail, the cost of such litigation could deplete our financial resources. Litigation is also time-consuming and could divert management’s attention and resources away from our business. Furthermore, during the course of litigation, confidential information may be disclosed in the form of documents or testimony in connection with discovery requests, depositions or trial testimony. Disclosure of our confidential information and our involvement in intellectual property litigation could materially adversely affect our business. Some of our competitors may be able to sustain the costs of complex intellectual property litigation more effectively than we can because they have substantially greater resources. In addition, any uncertainties resulting from the initiation and continuation of any litigation could significantly limit our ability to continue our operations and could harm our relationships with current and prospective customers. Any of the foregoing could disrupt our business and have a material adverse effect on our operating results and financial condition.
Risks Related to the Ownership of Shares of Our Common Stock
The trading price of our common stock has been volatile and may continue to be volatile.
Since December 31, 2010, our common stock has traded at a price per share as high as $32.82 and as low as $1.47. The trading price of our common stock is likely to continue to be highly volatile and could be subject to wide fluctuations in response to various factors. In addition to the risks described in this section, factors that may cause the market price of our common stock to fluctuate include:
• | fluctuations in our quarterly financial results or the quarterly financial results of companies perceived to be similar to us; |
• | changes in estimates of our financial results; |
• | failure to meet expectations of securities analysts; |
• | the loss of service agreements with customers; |
• | lawsuits filed against us by governmental authorities or stockholders; |
• | unfavorable publicity concerning our operations or business practices; |
• | investors’ general perception of us; and |
• | changes in general economic, industry, regulatory and market conditions. |
In addition, if the stock market in general experiences a loss of investor confidence, the trading price of our common stock could decline for reasons unrelated to our business, financial condition or results of operations.
Anti-takeover provisions in our charter documents and Delaware law could discourage, delay or prevent a change in control of our company and may affect the trading price of our common stock.
We are a Delaware corporation and the anti-takeover provisions of the Delaware General Corporation Law may discourage, delay or prevent a change in control by prohibiting us from engaging in a business combination with an interested stockholder for a period of three years after the person becomes an interested stockholder, even if a change in control would be beneficial to our existing stockholders. In addition, our restated certificate of incorporation and amended and restated bylaws may discourage, delay or prevent a change in our management or control over us that stockholders may consider favorable. Our restated certificate of incorporation and amended and restated bylaws:
• | authorize the issuance of "blank check" preferred stock that could be issued by our Board to thwart a takeover attempt; |
37
• | until the annual meeting of stockholders to be held in 2018, provide for a classified board of directors; |
• | require that directors only be removed from office upon a supermajority stockholder vote; |
• | provide that vacancies on our Board, including newly created directorships, may be filled only by a majority vote of directors then in office; |
• | limit who may call special meetings of stockholders; prohibit stockholder action by written consent, requiring all actions to be taken at a meeting of the stockholders; and |
• | require supermajority stockholder voting to effect certain amendments to our restated certificate of incorporation and amended and restated bylaws. |
At our 2015 Annual Meeting of Stockholders held on August 14, 2015, our stockholders voted to approve an amendment to our current restated certificate of incorporation that provides for the phased-in declassification of our Board and the annual election of all directors. Our Board has made conforming changes to our amended and restated bylaws. Our restated certificate of incorporation provides that directors may be removed with or without cause, with the same supermajority vote that currently applies (the affirmative vote of the holders of at least two-thirds of the shares entitled to vote at an election of directors).
We may not pay any cash dividends on our capital stock in the foreseeable future.
Although we paid cash dividends on our capital stock prior to our May 2010 initial public offering ("IPO") there is no assurance that we will pay cash dividends on our common stock in the foreseeable future. Any future dividend payments will be within the discretion of our Board and will depend on, among other things, our financial condition, results of operations, capital requirements, capital expenditure requirements, contractual restrictions, provisions of applicable law and other factors that our Board may deem relevant. Additionally, pursuant to the Investor Rights Agreement between the Company and the Investor ("Investor Rights Agreement") and subject to certain ownership thresholds contained in the Investor Rights Agreement, any dividends on our common stock would require the approval of the holders of our Series A Preferred Stock that are held by the Investor or any Investor Affiliate (as defined in the Investor Rights Agreement). We may not generate sufficient cash from operations in the future to pay dividends on our common stock.
38
Item 1B. | Unresolved Staff Comments |
None.
Item 2. | Properties |
We lease our existing facilities and do not own any real estate property.
Our corporate headquarters occupy approximately 43,000 square feet in Chicago, Illinois under a lease expiring on August 31, 2030. In addition, we have a right of first offer to lease all or a portion of 21,500 sqare feet of space on another floor in the same building. We also lease office space and other facilities in Kalamazoo, Michigan; Southfield, Michigan; Birmingham, Alabama; Cape Girardeau, Missouri; Hyderabad, India; and three facilities near New Delhi, India. Pursuant to our managed services agreements with customers, we occupy space on-site at all hospitals where we provide our RCM services. We generally do not pay customers for our use of space provided by them for our use in the provision of RCM services to that customer.
We believe that our facilities are sufficient for our current needs. We intend to add new facilities or expand existing facilities as we add employees or expand or change our geographic markets and office locations, and we believe that suitable additional or substitute space will be available as needed to accommodate any such expansion of our operations.
Item 3. | Legal Proceedings |
Other than as described below, we are presently not a party to any material litigation or regulatory proceeding and are not aware of any pending or threatened litigation or regulatory proceeding against us which, individually or in the aggregate, could have a material adverse effect on our business, operating results, financial condition or cash flows.
On July 22, 2014, we were named as a defendant in a putative class action lawsuit filed in the U.S. District Court for the Eastern District of Michigan (Anger v. Accretive Health, Inc.), seeking statutory damages, injunctive relief and attorneys’ fees. The primary allegations are that we attempted to collect debts without providing the notice required by the FDCPA and Michigan Fair Debt Collection Practices Act and failed to abide by the terms of an agreed payment plan in violation of those same statutes. On February 23, 2017, the parties reached a settlement in principle and filed the proposed class action settlement with the Court, which conducted a Class Action Fairness Act ("CAFA") hearing on whether to approve of the settlement. Members of the putative class were notified of the settlement and were given an opportunity to object or opt-out of the settlement before the CAFA hearing on October 4, 2017. No objections to the class settlement were filed, and the Court approved the settlement by Order dated October 11, 2017. Accordingly, the Company paid a total $1.3 million settlement, some of which was paid to a settlement fund to assist members of the class Ascension Michigan ministry patients pay off healthcare debt to Ascension ministries.
In April 2015, we were named among other defendants in an employment action brought by a former employee of Mercy Maine Hospital before the Maine Human Rights Commission ("MHRC"), alleging improper termination in retaliation for uncovering alleged Medicare fraud. The plaintiff filed a parallel qui tam action in the District of Maine (Worthy v. Eastern Maine Healthcare Systems) making the same allegations, and seeking money damages, FCA penalties and plaintiff’s attorneys’ fees. The U.S. Department of Justice declined to intervene in the federal court action, and the case was unsealed in April 2015. The parties mediated the case before the Magistrate Judge on July 24, 2017 and reached an agreement in principle, and subsequently resolved an additional contingency in order to settle the case. The settlement, which is now finalized, did not have a material impact to our consolidated financial statements.
39
In May 2016, we were served with a FCA case brought by a former emergency department service associate who worked at a hospital of one of our customers, Washington Hospital Center ("WHC"), along with WHC and three other hospitals that were PAS clients and a place holder, John Doe hospital, representing all PAS clients (USA ex rel. Graziosi vs. Accretive Health, Inc. et. al.). The Second Amended Complaint, which seeks monetary damages, alleges that our PAS business violates the federal FCA. The case was originally filed under seal in 2013 in the federal district court in Chicago, was presented to the U.S. Attorney in Chicago twice, and the U.S. Attorneys declined to intervene. We filed a motion to dismiss the Second Amended Complaint on July 29, 2016. On March 22, 2017, the district court dismissed all claims against all hospital defendants other than Medstar Inc.’s WHC, and dismissed all claims related to TriCare-related episodes of care. Plaintiff filed a Third Amended Complaint, seeking to add back claims related to other PAS clients in January 2018 and we have moved to dismiss all such claims related to any hospital other than WHC. That motion has been fully briefed. We believe that we have meritorious defenses to all claims in the case and intend to vigorously defend ourselves against these claims. The outcome is not presently determinable.
Item 4. | Mine Safety Disclosure |
Not applicable.
40
PART II
Item 5. | Market for Registrant’s Common Equity, Related Stockholder Matters and Issuer Purchases of Equity Securities |
On March 16, 2017, our common stock began trading on the NASDAQ Capital Market under the symbol "RCM." Prior to March 16, 2017, our common stock traded on the facilities of the OTC Markets Group, Inc. under the symbol "ACHI." From May 20, 2010 through March 14, 2014, our common stock was traded on the NYSE under the symbol "AH." Our common stock was suspended from trading on the NYSE prior to the opening of the market on March 17, 2014 (and subsequently delisted) and began trading under the symbol "ACHI" through the facilities of the OTC Markets Group, Inc. on that date.
The following table sets forth the high and low closing sales prices per share of our common stock, as reported by the OTC Markets Group, Inc. and NASDAQ, as applicable, for the periods indicated:
Price Range | ||||||||
High | Low | |||||||
2016 | ||||||||
Quarter ended March 31, 2016 | $ | 3.20 | $ | 2.40 | ||||
Quarter ended June 30, 2016 | $ | 2.53 | $ | 1.74 | ||||
Quarter ended September 30, 2016 | $ | 2.52 | $ | 1.50 | ||||
Quarter ended December 31, 2016 | $ | 2.42 | $ | 2.15 | ||||
2017 | ||||||||
Quarter ended March 31, 2017 | $ | 2.14 | $ | 3.09 | ||||
Quarter ended June 30, 2017 | $ | 4.24 | $ | 3.08 | ||||
Quarter ended September 30, 2017 | $ | 3.85 | $ | 3.08 | ||||
Quarter ended December 31, 2017 | $ | 4.51 | $ | 3.49 | ||||
The closing sale price per share of our common stock, as reported by the NASDAQ, on March 5, 2018 was $6.25. As of March 5, 2018, there were approximately 37 stockholders of record of our common stock and approximately 4,000 beneficial holders.
Dividends
We did not pay any dividends on our common stock during the years ended December 31, 2017 and 2016. We currently intend to retain earnings, if any, to finance the growth and development of our business, and we do not expect to pay any cash dividends on our common stock in the foreseeable future. Payment of future dividends, if any, will be at the discretion of our Board and will depend on, among other things, our financial condition, results of operations, capital expenditure requirements, contractual restrictions, provisions of applicable law and other factors that the Board deems relevant. Additionally, pursuant to the Investor Rights Agreement between the Company and the Investor, subject to certain ownership thresholds contained in the Investor Rights Agreement, any dividends on our common stock would require the approval of the holders of our Series A Preferred Stock that are held by the Investor or any Investor Affiliate (as defined in the Investor Rights Agreement).
41
Issuer Purchases of Equity Securities
The following table provides information about our repurchases of common stock during the periods indicated (in thousands, except share and per share data):
Period | Number of Shares Purchased (1) | Average Price Paid per Share (3) | Total Number of Shares Purchased as Part of Publicly Announced Plans or Programs (2) | Maximum Dollar Value of Shares that May Yet be Purchased Under Publicly Announced Plans or Programs (in millions) (2) | |||||||||||
October 1, 2017 through October 31, 2017 | — | $ | — | — | $ | 49.0 | |||||||||
November 1, 2017 through November 30, 2017 | — | $ | — | — | $ | 49.0 | |||||||||
December 1, 2017 through December 31, 2017 | — | $ | — | — | $ | 49.0 | |||||||||
(1) | Include strategic repurchases and repurchases of our stock related to employees’ tax withholding upon vesting of restricted stock. See Note 10, Share-Based Compensation, to our consolidated financial statements included in this Annual Report on Form 10-K. |
(2) | On November 13, 2013, the Board authorized, subject to the completion of the restatement of our financial statements, the repurchase of up to $50.0 million of our common stock from time to time in the open market or in privately negotiated transactions (the "2013 Repurchase Program"). The timing and amount of any shares repurchased under the 2013 Repurchase Program will be determined by our management based on its evaluation of market conditions and other factors. The 2013 Repurchase Program may be suspended or discontinued at any time. See Note 9, Stockholders' Equity (Deficit), to our consolidated financial statements included in this Annual Report on Form 10-K. |
(3) | Average price paid per share of common stock repurchased under the 2013 Repurchase Program is the execution price, including commissions paid to brokers. |
42
Stock Price Performance Graph
The following graph compares the change in the cumulative total return (including the reinvestment of dividends) on our common stock to the change in the cumulative total return on the stocks included in the NYSE Composite Index and NASDAQ Health Care Index over the period from December 31, 2012 through December 31, 2017. The graph assumes an investment of $100 made in our common stock on December 31, 2012. We did not pay any dividends during the period reflected in the graph.
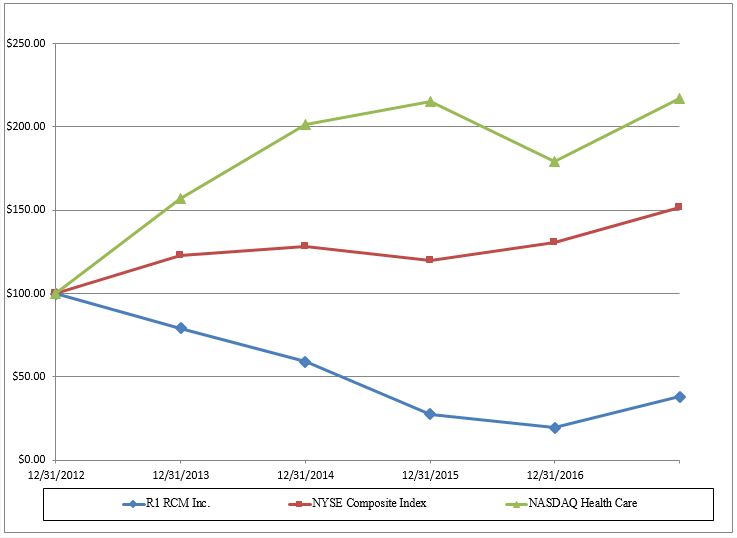
COMPARISON OF CUMULATIVE TOTAL RETURN
12/31/2012 | 12/31/2013 | 12/31/2014 | 12/31/2015 | 12/31/2016 | 12/31/2017 | |
R1 RCM Inc. | $100 | 79.1 | 59.24 | 27.63 | 19.43 | 38.08 |
NYSE Composite Index | $100 | 123.18 | 128.37 | 120.13 | 130.95 | 151.7 |
NASDAQ Health Care Index | $100 | 157.04 | 201.75 | 215.58 | 179.12 | 217.28 |
The comparisons shown in the graph above are based on historical data and we caution that the stock price performance shown in the graph above is not indicative of, and is not intended to forecast, the potential future performance of our common stock. The information in this "Stock Price Performance Graph" section shall not be deemed to be "soliciting material" or to be "filed" with the SEC, nor shall such information be incorporated by reference into any future filing under the Securities Act of 1933, or the Securities Act, or the Securities Exchange Act of 1934, or the Exchange Act, except to the extent that we specifically incorporate it by reference into such filing.
43
Item 6. | Selected Consolidated Financial Data |
The selected consolidated financial data presented below should be read in conjunction with "Management’s Discussion and Analysis of Financial Condition and Results of Operations," and "Consolidated Financial Statements and Supplementary Data," included elsewhere in this Form 10-K.
We derived the consolidated statements of operations and comprehensive income (loss) data for the years ended December 31, 2017, 2016, and 2015, and the consolidated balance sheet data as of December 31, 2017 and 2016 from our audited consolidated financial statements, which are included in this Annual Report on Form 10-K. We derived the consolidated statement of operations and comprehensive income (loss) data for the years ended December 31, 2014 and 2013 and the consolidated balance sheet data as of December 31, 2015, 2014 and 2013 from our audited consolidated financial statements and audited restated consolidated financial statements, which are not included in this Annual Report on Form 10-K.
Beginning with the quarter ended March 31, 2017, the Company changed the presentation in its financial statements to be stated in millions instead of thousands. Therefore, previously reported amounts may differ due to rounding.
Selected Financial Data
Year Ended December 31, | ||||||||||||||||||||
2017 | 2016 | 2015 | 2014 | 2013 | ||||||||||||||||
(In millions, except per share data) | ||||||||||||||||||||
Consolidated Statement of Operations Data: | ||||||||||||||||||||
Net services revenue | $ | 449.8 | $ | 592.6 | $ | 117.2 | $ | 210.1 | $ | 504.8 | ||||||||||
Operating expenses: | ||||||||||||||||||||
Cost of services | 416.3 | 199.7 | 169.0 | 182.1 | 186.8 | |||||||||||||||
Selling, general and administrative | 56.3 | 74.1 | 75.0 | 69.9 | 79.9 | |||||||||||||||
Restatement and other | 4.7 | 20.8 | 9.3 | 86.7 | 34.0 | |||||||||||||||
Total operating expenses | 477.3 | 294.7 | 253.3 | 338.8 | 300.7 | |||||||||||||||
Income (loss) from operations | (27.5 | ) | 297.9 | (136.0 | ) | (128.7 | ) | 204.1 | ||||||||||||
Net interest income (expense) | 0.2 | 0.3 | 0.2 | 0.3 | 0.3 | |||||||||||||||
Net income (loss) before income tax provision | (27.3 | ) | 298.2 | (135.8 | ) | (128.4 | ) | 204.4 | ||||||||||||
Income tax provision (benefit) | 31.5 | 121.1 | (51.6 | ) | (48.7 | ) | 74.3 | |||||||||||||
Net income (loss) | $ | (58.8 | ) | $ | 177.1 | $ | (84.3 | ) | $ | (79.7 | ) | $ | 130.1 | |||||||
Net income (loss) per common share | ||||||||||||||||||||
Basic | $ | (0.75 | ) | $ | 0.65 | $ | (0.87 | ) | $ | (0.83 | ) | $ | 1.36 | |||||||
Diluted | $ | (0.75 | ) | $ | 0.65 | $ | (0.87 | ) | $ | (0.83 | ) | $ | 1.34 | |||||||
As of December 31, | ||||||||||||||||||||
2017 | 2016 | 2015 | 2014 | 2013 | ||||||||||||||||
(In millions, except per share data) | ||||||||||||||||||||
Consolidated Balance Sheet Data: | ||||||||||||||||||||
Cash and cash equivalents | $ | 164.9 | $ | 181.2 | $ | 103.5 | $ | 145.2 | $ | 228.9 | ||||||||||
Working capital (1) | $ | 112.4 | $ | 137.7 | $ | 24.2 | $ | 41.6 | $ | 124.0 | ||||||||||
Total assets | $ | 336.0 | $ | 415.1 | $ | 460.3 | $ | 446.4 | $ | 510.0 | ||||||||||
Non-current liabilities | $ | 23.4 | $ | 120.7 | $ | 441.0 | $ | 325.5 | $ | 202.8 | ||||||||||
Total stockholders’ equity (deficit) | $ | 33.4 | $ | (12.3 | ) | $ | (213.3 | ) | $ | (142.2 | ) | $ | (85.6 | ) | ||||||
(1) | We define working capital as total current assets excluding the current portion of deferred tax assets pertaining to the current portion of deferred customer billings, less total current liabilities excluding the current portion of deferred customer billings. We exclude the current portion of deferred customer billings and related deferred tax assets from the definition of working capital due to the nature of these balances. We adopted the provisions of Accounting Standards Update 2015-17, Income Taxes: Balance Sheet Classification of Deferred Taxes (Topic 740), or ASU 2015-17, on a prospective basis for the reporting period ended December 31, 2015. Consequently, under the guidance of ASU 2015-17, |
44
deferred tax assets were classified as non-current in the consolidated balance sheet for the reporting period ended December 31, 2015, 2016 and 2017. As permitted by ASU 2015-17, the current and non-current deferred tax assets were not retroactively adjusted for the prior reporting periods ended December 31, 2014 and 2013.
Non-GAAP Measures
As of January 1, 2017, the Company adopted Topic 606, Revenue from Contracts with Customers (“Topic 606”) and thus for the year ended December 31, 2017, the Company followed the guidance under Topic 606. Under the newly adopted guidance, revenue is measured based on consideration specified in a contract with a customer, and excludes any sales incentives and amounts collected on behalf of third parties. The Company recognizes revenue when it satisfies a performance obligation by transferring control over a service to a customer, which is typically over the contract term. Estimates of variable consideration are included in revenue to the extent that it is probable that a significant reversal of cumulative revenue will not occur once the uncertainty is resolved. See Note 2, Summary of Significant Accounting Policies, to the consolidated financial statements for additional information.
For the years ended December 31, 2016, 2015, 2014 and 2013, we typically invoiced customers for base fees and incentive fees on a quarterly or monthly basis, and typically received cash from customers on a similar basis. For GAAP reporting purposes, we only recognized those net operating fees and incentive fees as net services revenue to the extent that all the criteria for revenue recognition were met, which was generally upon contract renewal, termination or other contractual agreement event. As such, net operating and incentive fees were typically recognized for GAAP purposes in periods subsequent to the periods in which the services are provided. Therefore, our net services revenue and other items in our GAAP consolidated financial statements typically included the effects of billings and collections from periods prior to the period in which revenue was recognized.
Prior to the adoption of Topic 606, management utilized certain non-GAAP financial measures in financial and operational decision-making due to net services revenue and other items in our GAAP consolidated financial statements typically including the effects of billings and collections from periods prior to the period in which revenue was recognized. For periods prior to 2017, we supplement our consolidated financial statements that have been prepared in accordance with GAAP with the following non-GAAP financial measures: gross and net cash generated from customer contracting activities. The non-GAAP measures of gross and net cash generated from customer contracting activities, that were utilized by the Company prior to 2017, are the metrics most comparable to net services revenue and net income, respectively. The Company will provide these metrics for comparability in light of the differences in our revenue recognition year over year.
In order to provide a more comprehensive understanding of the information used by our management team in financial and operational decision-making, we supplement our consolidated financial statements that have been prepared in accordance with GAAP with the non-GAAP financial measure of adjusted EBITDA. Adjusted EBITDA is utilized by our Board and management team as (i) one of the primary methods for planning and forecasting overall expectations and for evaluating actual results against such expectations; and (ii) as a performance evaluation metric in determining achievement of certain executive incentive compensation programs, as well as for incentive compensation plans for employees.
These non-GAAP measures are used throughout this Form 10-K including "Management’s Discussion and Analysis of Financial Condition and Results of Operations."
Use of Non-GAAP Financial Information
We understand that, although non-GAAP measures are frequently used by investors, securities analysts, and others in their evaluation of companies, these measures have limitations as analytical tools, and you should not consider them in isolation or as a substitute for analysis of our results of operations as reported under GAAP. Some of these limitations are:
45
• | Gross and net cash generated from customer contracting activities include invoiced or accrued net operating fees, and collected incentive fees which may be subject to adjustment or concession prior to the end of a contract or "other contractual agreement event"; |
• | Gross and net cash generated from customer contracting activities include progress billings on incentive fees that have been collected for a number of our RCM contracts. These progress billings have, from time-to-time been subject to adjustments, and the fees included in these non-GAAP measures may be subject to adjustments in the future; |
• | Adjusted EBITDA and net cash generated from customer contracting activities do not reflect changes in, or cash requirements for, our working capital needs; |
• | Adjusted EBITDA and net cash generated from customer contracting activities do not reflect share-based compensation expense; |
• | Adjusted EBITDA and net cash generated from customer contracting activities do not reflect income tax expenses or cash requirements to pay taxes; |
• | Adjusted EBITDA and net cash generated from customer contracting activities do not reflect certain Other expenses which may require cash payments; |
• | Although depreciation and amortization charges are non-cash charges, the assets being depreciated and amortized will often have to be replaced in the future, and neither adjusted EBITDA nor net cash generated from customer contracting activities reflect cash requirements for such replacements or other purchase commitments, including lease commitments; and |
• | Other companies in our industry may calculate adjusted EBITDA differently than we do, limiting its usefulness as a comparative measure. |
Selected Non-GAAP Measures
For each of the periods indicated, the following table presents selected non-GAAP measures and the most comparable GAAP measures. See below for an explanation of how we calculate and use these non-GAAP measures, and for a reconciliation of these non-GAAP measures to the most comparable GAAP measures. See "Selected Financial Data" above for a presentation of net income (loss), the most comparable GAAP measure to adjusted EBITDA and net cash generated for customer contracting activities, and net services revenue, the most comparable GAAP measure to gross cash generated from customer contracting activities.
Year End December 31, | ||||||||||||||||||||
2017 | 2016 | 2015 | 2014 | 2013 | ||||||||||||||||
(in millions) | ||||||||||||||||||||
Non-GAAP Measures: | ||||||||||||||||||||
Adjusted EBITDA | $ | 4.1 | $ | 357.0 | $ | (86.6 | ) | $ | (15.7 | ) | $ | 268.7 | ||||||||
Net cash generated from customer contracting activities | n.a. | $ | (26.8 | ) | $ | 26.4 | $ | 7.8 | $ | 15.6 | ||||||||||
Gross cash generated from customer contracting activities | n.a. | $ | 208.7 | $ | 230.2 | $ | 233.6 | $ | 251.6 | |||||||||||
n.a. - Due to the adoption of Topic 606 as of January 1, 2017, the non-GAAP measure of gross cash generated from customer contracting activities, that was utilized by the Company in 2016, is not applicable for 2017. Gross cash generated from customer contracting activities has been provided for the year ended December 31, 2016 as it is the most comparable metric to net services revenue for the year ended December 31, 2017.
Gross and Net Cash Generated from Customer Contracting Activities
46
Gross and net cash generated from customer contracting activities reflects the change in the deferred customer billings, relative to GAAP net services revenue. Deferred customer billings include the portion of both (i) invoiced or accrued net operating fees and (ii) cash collections of incentive fees, in each case, that have not met our revenue recognition criteria. Deferred customer billings are included in the detail of our customer liabilities balance in the consolidated balance sheet. Deferred customer billings are reduced by the amounts of revenue recognized when a revenue recognition event occurs. Gross cash generated from customer contracting activities is defined as GAAP net services revenue, plus the change in deferred customer billings. Accordingly, gross cash generated from customer contracting activities is the sum of (i) invoiced or accrued net operating fees, (ii) cash collections on incentive fees and (iii) other services fees. Net cash generated from customer contracting activities is defined as adjusted EBITDA, plus the change in deferred customer billings.We anticipate the use of these non-GAAP measures to be limited to the year and quarters ended in 2017. Beginning in 2018, there will be two comparable periods of GAAP metrics under Topic 606 and we expect disclosure of these metrics to not be necessary on a go forward basis.
Gross and net cash generated from customer contracting activities include invoices issued to customers that may remain uncollected or may be subject to credits, and cash collected may be returned to our customers in the form of concessions or other adjustments. Customer concessions and other adjustments have occurred in the past and we cannot determine the likelihood that they will again occur in the future.
These non-GAAP measures are used throughout this Annual Report on Form 10-K including in this Management’s Discussion and Analysis of Financial Condition and Results of Operations.
Adjusted EBITDA
We define adjusted EBITDA as net income before net interest income, income tax provision, depreciation and amortization expense, share-based compensation expense, reorganization-related expense and certain other items. Prior to 2017, the use of adjusted EBITDA to measure operating and financial performance was limited by our revenue recognition criteria, pursuant to which GAAP net services revenue was recognized at the end of a contract or "other contractual agreement event". As such, adjusted EBITDA did not adequately match corresponding cash flows resulting from customer contracting activities.
Reconciliation of GAAP and Non-GAAP Measures: The following table presents a reconciliation of adjusted EBITDA and net cash generated from customer contracting activities to net income (loss), and gross cash generated from customer contracting activities to net services revenue the most comparable GAAP measures, for each of the periods indicated.
Year End December 31, | |||||||||||||||||||||
2017 | 2016 | 2015 | 2014 | 2013 | |||||||||||||||||
( in thousands) | |||||||||||||||||||||
Net income (loss) (GAAP) | $ | (58.8 | ) | $ | 177.1 | $ | (84.3 | ) | $ | (79.6 | ) | $ | 130.1 | ||||||||
Net interest (income) expense | (0.2 | ) | — | (0.3 | ) | (0.2 | ) | (0.3 | ) | (0.3 | ) | ||||||||||
Income tax provision (benefit) | 31.5 | 121.1 | (51.6 | ) | (48.7 | ) | 74.3 | ||||||||||||||
Depreciation and amortization expense | 16.3 | 10.2 | 8.5 | 6.0 | 6.8 | ||||||||||||||||
Share-based compensation expense (1) | 10.7 | 28.1 | 31.7 | 20.2 | 23.8 | ||||||||||||||||
Other (2) | 4.7 | 20.8 | 9.3 | 86.8 | 34.0 | ||||||||||||||||
Adjusted EBITDA (Non-GAAP) | 4.1 | 357.0 | (86.6 | ) | (15.7 | ) | 268.7 | ||||||||||||||
Change in deferred customer billings (3) | n.a. | (383.9 | ) | 112.9 | 23.4 | (253.1 | ) | ||||||||||||||
Net cash generated from customer contracting activities (Non-GAAP) | n.a. | (26.8 | ) | 26.4 | 7.8 | 15.6 | |||||||||||||||
Net services revenue (GAAP) | $ | 449.8 | $ | 592.6 | $ | 117.2 | $ | 210.1 | $ | 504.8 | |||||||||||
Change in deferred customer billings (3) | n.a. | (383.9 | ) | 112.9 | 23.4 | (253.1 | ) | ||||||||||||||
Gross cash generated from customer contracting activities (Non-GAAP) | n.a. | $ | 208.7 | $ | 230.2 | $ | 233.6 | $ | 251.6 | ||||||||||||
n.a. - Due to the adoption of Topic 606 as of January 1, 2017, the non-GAAP measure of gross cash generated from customer contracting activities, that was utilized by the Company in 2016, is not applicable for 2017. Gross cash generated from customer contracting activities has been provided for the year ended December 31, 2016 as it is the most comparable metric to net services revenue for the year ended December 31, 2017.
47
(1) | Share-based compensation expense represents the expense associated with stock options, RSAs and RSUs granted, as reflected in our Consolidated Statements of Operations. See Note 10, Share-Based Compensation, to the consolidated financial statements included in this Annual Report on Form 10-K for the detail of the amounts of share-based compensation expense. |
(2) | Other costs consist of the following (in millions): |
Year Ended December 31, | |||||||||||||||||||
2017 | 2016 | 2015 | 2014 | 2013 | |||||||||||||||
Severance and employee benefits | $ | 0.3 | $ | 3.5 | $ | 0.6 | $ | 9.2 | $ | 4.0 | |||||||||
Facility charges | — | 1.1 | 2.6 | 5.0 | — | ||||||||||||||
Non-cash share based compensation | 0.1 | 1.8 | — | 7.9 | 1.2 | ||||||||||||||
Reorganization-related | 0.4 | 6.4 | 3.2 | 22.1 | 5.2 | ||||||||||||||
Transaction fees | — | 12.7 | — | 57.3 | — | ||||||||||||||
Defined contribution plan contributions | — | 0.5 | — | — | — | ||||||||||||||
Restatement costs | — | 1.2 | 2.5 | — | 23.1 | ||||||||||||||
Acquisition related diligence and costs | 3.1 | — | — | — | — | ||||||||||||||
Transitioned employees restructuring expense | 1.2 | — | — | — | — | ||||||||||||||
Strategic Alternative Exploration | — | — | 3.8 | — | — | ||||||||||||||
Prior year employment tax expense | — | — | (0.2 | ) | 0.9 | — | |||||||||||||
Office Transformation | — | — | — | 6.5 | — | ||||||||||||||
Litigation | — | — | — | — | 5.7 | ||||||||||||||
Other | 4.3 | 14.4 | 6.1 | 64.7 | 28.8 | ||||||||||||||
Total other | $ | 4.7 | $ | 20.8 | $ | 9.3 | $ | 86.8 | $ | 34.0 | |||||||||
(3) | Deferred customer billings include the portion of both (i) invoiced or accrued net operating fees and (ii) cash collections on incentive fees, in each case, that have not met our revenue recognition criteria. Deferred customer billings are included in the detail of our customer liabilities balance in the consolidated balance sheets. Deferred customer billings are reduced by revenue recognized when revenue recognition occurs. Change in deferred customer billings represents the net change in the cumulative net operating fees and incentive fees that have not met revenue recognition criteria. |
48
Item 7. | Management’s Discussion and Analysis of Financial Condition and Results of Operations |
Management’s Discussion and Analysis of Financial Condition and Results of Operations ("MD&A") should be read in conjunction with our consolidated financial statements and the related notes and other financial information included elsewhere in this Annual Report on Form 10-K. Some of the information contained in this discussion and analysis or set forth elsewhere in this Annual Report on Form 10-K, including information with respect to our plans and strategy for our business and related financing, includes forward-looking statements that involve risks and uncertainties. Please review "Risk Factors" of this Annual Report on Form 10-K for a discussion of important factors that could cause actual results to differ materially from the results described in or implied by the forward-looking statements contained in the following discussion and analysis.
Overview
We are a leading provider of RCM services to healthcare providers. We help healthcare providers generate sustainable improvements in their operating margins and cash flows while also enhancing patient, physician and staff satisfaction for our customers.
While we cannot control the changes in the regulatory environment imposed on our customers, we believe that our role becomes increasingly more important to our customers as macroeconomic, regulatory and healthcare industry conditions continue to impose financial pressure on healthcare providers to manage their operations effectively and efficiently.
Our primary service offering consists of end-to-end RCM, which we deploy through an operating partner relationship and a co-managed relationship. Under an operating partner relationship, we provide comprehensive revenue cycle infrastructure to providers, including all revenue cycle personnel, technology and process workflow. Under a co-managed relationship, we leverage our customers’ existing RCM staff and processes, and supplement them with our infused management, subject matter specialists, proprietary technology and other resources.
We also offer modular services, allowing customers to engage us for only specific components of our end-to-end RCM service offering, such as PAS and revenue capture. Our PAS offering assists hospitals in complying with payer requirements regarding whether to classify a hospital visit as an in-patient or an out-patient observation case for billing purposes. Our revenue capture offering includes charge capture, CDM maintenance and pricing services that help providers ensure they are capturing the maximum net compliant revenue for services delivered.
We operate our business as a single segment configured with our significant operations and offerings organized around the business of providing end-to-end RCM services to U.S.-based hospitals and other healthcare providers.
Summary of Operations
In 2017, we completed several initiatives which we expect to position us to better serve our customers and grow our business:
• | In January, we renamed the company and launched the R1 brand, designed to establish our brand identity and improve our marketing efforts with prospective customers. Our new brand reflects our vision to be the one revenue cycle partner for healthcare providers across care settings and payment models. |
• | In March, we listed the company on the Nasdaq Capital Market under the ticker symbol “RCM”. |
• | In May, we announced the expansion of our relationship with Ascension in the Wisconsin market. The expanded relationship increased both the size and scope of our contract. Specifically, we added a health system which was acquired by Ascension subsequent to the signing of the MPSA in 2016, and we increased the scope of our contract by adding physician RCM services for all Ascension ministries in Wisconsin. |
49
• | In June, we announced the expansion of our portfolio of modular solutions. Our modular solutions are designed to allow an easier entry point for potential customers vis-à-vis our end-to-end offering, while leveraging our extensive operating experience, proven methods, performance analytics, broad infrastructure and proprietary technology - all delivered as-a-service to healthcare providers. |
• | In August, we appointed a new chief commercial officer to drive our customer growth initiatives, including sales, marketing, product management and solution development. |
• | In the third quarter, we announced a strategic partnership with a third-party vendor to improve the patient experience across both ambulatory and inpatient settings. We launched this effort at three pilot sites in the third quarter and plan to broadly roll it out to our customer base in 2018. |
• | In the second half 2017, we generated positive cash flows from operations and reduced our loss from operations by over $4 million compared to the first half of 2017. In addition, we returned to generating positive adjusted EBITDA and free cash flow (defined as cash flow from operations, less capital expenditures) following an approximately 18-month period of negative adjusted EBITDA and free cash flow due to investments and upfront costs associated with onboarding new business under the A&R MPSA. |
Net Services Revenue
Revenues from our RCM agreements consist primarily of net operating fees and incentive fees that are primarily performance-based and/or contingent fees. The following table summarizes the composition of our net services revenue for the years ended December 31, 2017, 2016 and 2015:
Year ended December 31, | |||||||||||||||||||||
2017 | 2016 | 2015 | |||||||||||||||||||
(in millions) | |||||||||||||||||||||
RCM services: net operating fees | $ | 374.8 | 83.3 | % | $ | 368.8 | 62.2 | % | $ | 66.2 | 56.5 | % | |||||||||
RCM services: incentive fees | 29.0 | 6.4 | % | 191.3 | 32.3 | % | 20.3 | 17.3 | % | ||||||||||||
RCM services: other | 13.6 | 3.0 | % | 16.3 | 2.8 | % | 16.4 | 14.0 | % | ||||||||||||
Other services fees | 32.4 | 7.2 | % | 16.1 | 2.7 | % | 14.3 | 12.2 | % | ||||||||||||
Total net services revenue | $ | 449.8 | 100.0 | % | $ | 592.6 | 100.0 | % | $ | 117.2 | 100.0 | % | |||||||||
Cost of Services
Our cost of services includes:
• | Infused management and technology expenses. We incur costs related to our management and staff employees who are devoted to customer operations. These expenses consist primarily of the wages, bonuses, benefits, share-based compensation, travel and other costs associated with deploying our employees to customer sites to guide and manage our customers’ revenue cycle operations. The employees we deploy to customer sites typically have significant experience in revenue cycle operations, care coordination, technology, quality control or other management disciplines. Included in these expenses is an allocation of the costs associated with maintaining, improving and deploying our integrated proprietary technology suite. |
• | Shared services center costs. We incur expenses related to salaries and benefits of employees in our shared services centers, as well as non-payroll costs associated with operating our shared services centers. |
• | Other expenses. We incur expenses related to our employees who manage PAS and other services. These expenses consist primarily of wages, bonuses, benefits, share-based compensation and other costs. |
50
Estimates of Cost of Customers’ Revenue Cycle Operations
Cost of customers’ revenue cycle operations consist of invoiced costs from customers and estimated costs not yet invoiced. These costs consist of payroll and third-party non-payroll costs. Customers’ payroll costs are reasonably estimable; however, we are dependent upon information generated from our customers’ records to determine the amount of third-party non-payroll costs. We estimate the amount of non-payroll costs incurred but not invoiced in order to properly calculate Net Operating Fees at the end of each reporting period. Such estimated costs are based on contractually allowable expenses, historical reimbursed costs and estimated lag in the timing of receipt of information for third-party non-payroll costs. The timing difference includes the lag between the services rendered by third-party vendors and their billings to our customers. The liabilities for such costs are included in accrued service costs and are part of the customer liabilities balance in the consolidated balance sheet. These estimates are based on the best available information and are subject to future adjustments based on additional information received from our customers.
Selling, General and Administrative Expenses
Selling, general and administrative expenses consist primarily of expenses for executives, sales, corporate IT, legal, regulatory compliance, finance and human resources personnel, professional service fees related to external legal, tax, audit and advisory services, insurance premiums, facility charges and other corporate expenses.
Other Costs
Other costs include reorganization-related expenses and certain other costs. We have initiated restructuring plans consisting of reductions in our workforce in certain corporate, administrative, operations and management functions. Reorganization costs consist primarily of severance payments, employee benefits and share-based compensation expense for accelerated awards. In 2017, we incurred costs relating to evaluating and pursuing acquisition opportunities as part of the Company’s inorganic growth strategy. Additionally, as part of the transition of Ascension personnel to the Company in conjunction with the A&R MPSA, the Company has agreed to reimburse Ascension for certain severance and retention costs related to certain Ascension employees who will not be transitioned to the Company.
Interest Income
Interest income is derived from the return achieved from our cash and cash equivalents.
Income Taxes
Income tax provision (benefit) consists of federal and state income taxes in the United States and other local taxes in India.
Application of Critical Accounting Policies and Use of Estimates
Our consolidated financial statements reflect the assets, liabilities and results of operations of R1 RCM Inc. and our wholly-owned subsidiaries. All material intercompany transactions and balances have been eliminated in consolidation. Our consolidated financial statements have been prepared in accordance with GAAP.
The preparation of financial statements in conformity with GAAP requires us to make estimates and judgments that affect the amounts reported in our consolidated financial statements and the accompanying notes. We regularly evaluate the accounting policies and estimates we use. In general, we base estimates on historical experience and on assumptions that we believe to be reasonable given our operating environment. Estimates are based on our best knowledge of current events and the actions we may undertake in the future. Although we believe all adjustments considered necessary for fair presentation have been included, our actual results may differ materially from our estimates.
51
We believe that the accounting policies described below involve our more significant judgments, assumptions and estimates, and therefore, could have the greatest potential impact on our consolidated financial statements. In addition, we believe that a discussion of these policies is necessary to understand and evaluate the consolidated financial statements contained in this Annual Report on Form 10-K. For further information on our critical and other significant accounting policies, see Note 2, Summary of Significant Accounting Policies, to the consolidated financial statements included in this Annual Report on Form 10-K.
Revenue Recognition
Periods prior to January 1, 2017
Revenue is generally recognized when all of the following criteria are met: (i) persuasive evidence of an arrangement exists, (ii) services have been rendered, (iii) the fee is fixed or determinable and (iv) collectability is reasonably assured.
Net service fees, as reported in the consolidated statement of operations and comprehensive income (loss), consist of: (a) RCM services fees and (b) professional service fees earned on a fixed fee, transactional fee or time and materials basis. The Company’s primary source of revenue is RCM services fees. RCM services fees are primarily contingent, but along with fixed fees are generally viewed as one deliverable. To the extent that certain RCM services fees are fixed and not subject to refund, adjustment or concession, such fees are generally recognized as revenue on a straight-line basis over the term of the contract.
On a limited basis, the Company enters into contracts with multiple accounting elements which may include a combination of fixed fee or transactional fee elements. The selling price of each element is determined by using management's best estimate of selling price. Revenues are recognized in accordance with the accounting policies for the separate elements.
RCM services fees that are contingent in nature are recognized as revenue once all the criteria for revenue recognition are met, which is generally at the end of a contract or other contractual agreement event. Revenue is recognized for RCM services fees upon the contract reaching the end of its stated term (such that the contractual relationship will not continue in its current form) to the extent that: (i) cash has been received for invoiced fees and (ii) there are no disputes at the conclusion of the term of the contract.
If fees or services are disputed by a customer at the end of a contract, a settlement agreement entered into with the customer triggers revenue recognition. An other "contractual agreement event" occurs when a renewal, amendment to an existing contract, or other settlement agreement is executed in which the parties reach agreement on prior fees. Revenue is recognized up to the amount covered by such agreements.
RCM services fees consist of the following contingent fees: (i) Net Operating Fees and (ii) Incentive Fees.
Net Operating Fees
The Company generates net operating fees to the extent the Company is able to assist customers in reducing the cost of revenue cycle operations. In limited cases, the Company earns a fixed fee instead of a fee based on the mechanics described below. The Company’s net operating fees consist of:
i) gross base fees invoiced to customers; less
ii) corresponding costs of customers’ revenue cycle operations which the Company pays pursuant to its RCM agreements, including salaries and benefits for the customers' RCM personnel, and related third-party vendor costs; less
iii) any cost savings the Company shares with customers.
52
Net operating fees are recorded as deferred customer billings until the Company recognizes revenue for a customer contract at the end of a contract or reaches an "other contractual agreement event". The amount of unpaid costs of customers’ revenue cycle operations and shared cost savings are reported as accrued service costs within customer liabilities in the consolidated balance sheets.
Incentive Fees
The Company generates revenue in the form of performance-based fees when the Company improves the customers’ financial or operational metrics. These performance metrics vary by customer contract. However, certain contracts contain a contract-to-date performance metric that is not resolved until the end of the term of the contract.
Periods commencing January 1, 2017
Nature of Goods and Services
The Company's primary source of revenue is its end-to-end RCM services fees. The Company also generates revenue through its modular RCM services, where customers will engage the Company for only specific components of its end-to-end RCM service offering on a fixed-fee or transactional basis, as well as its PAS offering.
Revenue Cycle Management
RCM services fees are primarily variable and performance related, and are generally viewed as the consideration earned in satisfaction of a single performance obligation. RCM services fees consist of net operating fees, incentive fees and other fees.
Net Operating Fees
The Company’s net operating fees consist of:
i) gross base fees invoiced to customers; less
ii) corresponding costs of customers’ revenue cycle operations which the Company pays pursuant to its RCM agreements, including salaries and benefits for the customers' RCM personnel, and related third-party vendor costs.
The Company recognizes revenue related to net operating fees ratably as the performance obligation for the RCM services is satisfied. Base fees are typically billed in advance of the quarter and paid in three monthly payments as the Company performs and the customer simultaneously receives and consumes the benefits provided by the services provided. The costs of customers’ revenue cycle operations which the company pays pursuant to its RCM agreements are accrued based on the service period.
Incentive Fees
The Company recognizes revenue related to incentive fees ratably as the performance obligation for RCM services is satisfied, to the extent that it is probable that a significant reversal of cumulative revenue will not occur once the uncertainty is resolved. Incentive fees are structured to reflect quarterly or annual, performance and are evaluated on a contract-by-contract basis. Incentive fees are typically billed and paid on a quarterly basis.
RCM Other
The Company recognizes revenue related to other RCM Other fees as RCM services are provided. These services typically consist of the Company's modular RCM services offering, which consists of an
53
obligation to provide services for a specific component of its end-to-end RCM service offering. Fees are typically variable in nature with the entire amount being included in revenue in the month of service. The customer simultaneously receives and consumes the benefits provided by the services and the fees are typically billed on a monthly basis with payment terms of up to 30 days. To the extent that certain service fees are fixed and not subject to refund, adjustment or concession, these fees are generally recognized into revenue ratably as the performance obligation is satisfied.
Other Services
The Company recognizes revenue from PAS in the period in which the service is performed. The Company’s PAS arrangements typically consist of an obligation to provide specific services to customers on a when and if needed basis. These services are provided under a fixed price per unit arrangement. These contracts are evaluated on a contract-by-contract basis. Fees for the Company's PAS arrangements are typically billed on a monthly basis with 30 to 60 day payment terms.
Bundled Services
Modular RCM services may be sold separately or bundled in a contract and end-to-end RCM services are typically sold separately but may be bundled with PAS services. PAS services are commonly sold separately. The typical length of an end-to-end RCM contract is three to ten years (subject to the parties' respective termination rights) but varies from customer to customer. PAS and modular RCM agreements generally vary in length between one and three years.
For bundled arrangements, the Company accounts for individual services as a separate performance obligation if a service is separately identifiable from other items in the bundled arrangement and if a customer can benefit from it on its own or with other resources that are readily available to the customer. The transaction price is allocated between separate services in a bundle based on their relative standalone selling prices. The standalone selling prices are determined based on the prices at which the Company separately sells its RCM, PAS, or modular services. PAS services are provided at a customer’s election but do not represent material rights as the services are priced at standalone selling price throughout the life of the agreement. In certain situations, the Company allocates variable consideration to a distinct service, or services, within a contract. The Company allocates variable payments to one or more, but not all, of the distinct services in a contract when (i) the variable payment relates specifically to the Company’s efforts to transfer the distinct service and (ii) the variable payment is for an amount that depicts the amount of consideration to which the Company expects to be entitled in exchange for transferring the promised services to its customer.
Cost of Services
Costs associated with generating the Company’s net services revenue, including the cost of operating its shared services centers, are expensed as incurred. Cost of services consist of (i) infused management, on site revenue cycle employees and technology costs, (ii) shared services costs and (iii) other costs to perform physician advisory services. Infused management and technology costs consist primarily of wages, bonuses, benefits, share-based compensation, travel and other costs associated with deploying the Company’s employees at customer sites to help manage the Company’s customers’ revenue cycle operations. The other significant portion of such expenses is an allocation of the costs associated with maintaining, improving and deploying our integrated proprietary technology suite. Shared services costs relate to the Company’s shared services centers in the U.S. and India that perform patient scheduling and pre-registration, medical transcription, cash posting, reconciliation of payments to billing records, patient follow-up and Medicaid eligibility determination for our customers. The Company incurs expenses related to salaries and benefits for employees in its shared services centers and non-payroll costs associated with operating its shared services centers. Other expenses consist of costs related to managing PAS and other services. These expenses consist primarily of wages, bonuses, benefits, share-based compensation and facilities costs.
Income Taxes
54
We account for income taxes under the asset and liability method. We record deferred tax assets and liabilities for future income tax consequences that are attributable to differences between the carrying amount of assets and liabilities for financial statement purposes and the income tax bases of such assets and liabilities. We base the measurement of deferred tax assets and liabilities on enacted tax rates that we expect will apply to taxable income in the year we expect to settle or recover those temporary differences. We recognize the effect on deferred income tax assets and liabilities of any change in income tax rates in the period that includes the enactment date.
The carrying values of deferred income tax assets and liabilities reflect the application of our income tax accounting policies, and are based on management’s assumptions and estimates about future operating results and levels of taxable income, and judgments regarding the interpretation of the provisions of current accounting principles. We provide a valuation allowance for deferred tax assets if, based upon the weight of all available evidence, both positive and negative, it is more likely than not that some or all of the deferred tax assets will not be realized. We have established a valuation allowance with respect to certain separate state income net operating loss carryforward deferred tax assets.
The estimated effective tax rate for the year is applied to our quarterly operating results. In the event that there is a significant unusual or discrete item recognized, or expected to be recognized, in our quarterly operating results, the tax attributable to that item is calculated separately and recorded at the same time as the unusual or discrete item, such as the resolution of prior-year tax matters.
We recognize the tax benefit from an uncertain tax position only if it is more likely than not that the position will be sustained on examination by taxing authorities, based on the technical merits of the position. The tax benefits recognized in the consolidated financial statements from such a position are measured based on the largest benefit that has a greater than 50% likelihood of being realized upon ultimate settlement.
Interest and penalties related to income taxes are recognized in our tax provision in the consolidated statement of operations and comprehensive income (loss).
The Tax Act was enacted on December 22, 2017. The Tax Act reduces the U.S. federal corporate tax rate from 35% to 21%, requires companies to pay a one-time transition tax on earnings of certain foreign subsidiaries that were previously tax deferred and creates new taxes on certain foreign sourced earnings. At December 31, 2017, the Company has not completed the accounting for the tax effects of enactment of the Tax Act. However, the Company has made a reasonable estimate of the effects on the existing deferred tax balances and the one-time transition tax. For these items, a provisional net tax cost of approximately $38.2 million has been recognized and is included as a component of provision for income taxes from continuing operations for the year ended December 31, 2017.
Provisional amounts: Deferred tax assets and liabilities: The Company remeasured certain U.S. deferred tax assets and liabilities based on the rates at which they are expected to reverse in the future, which is generally 21%. However, the Company is still analyzing certain aspects of the Tax Act and refining the calculations, which could potentially affect the measurement of these balances or potentially give rise to new deferred tax amounts. For the year ended December 31, 2017, a provisional amount was recorded related to the remeasurement of the deferred tax balance, resulting in a provision for income taxes benefit of approximately $35.2 million.
Foreign tax effects: The one-time transition tax is based on the total post-1986 foreign earnings and profits ("E&P") that the Company had previously deferred from U.S. income taxes. A provisional amount was recorded for the one-time transition tax liability, resulting in a provision for income taxes cost of approximately $3.0 million. The Company has not yet completed the calculation of the total post-1986 foreign E&P. Further, the transition tax is based in part on the amount of those earnings held in cash and other specified assets. This amount may change when the calculation of post-1986 foreign E&P and the amounts held in cash or other specified assets are finalized.
See Note 12, Income Taxes, to our consolidated financial statements included in this Annual Report on Form 10-K for additional information on income taxes.
Share-Based Compensation Expense
55
We determine the expense for all employee share-based compensation awards by estimating their fair value and recognizing that value as an expense, on a ratable basis, in our consolidated financial statements over the requisite service period in which our employees earn the awards. The fair value of performance and service condition stock options is calculated using the Black-Scholes option pricing model and, for market condition stock awards, the fair value is estimated using Monte Carlo simulations.
To determine the fair value of a share-based award using the Black-Scholes option pricing model, we make assumptions regarding the risk-free interest rate, expected future volatility and expected life of the award. These inputs are subjective and generally require significant analysis and judgment to develop. We aggregate all employees into one pool for valuation purposes. The risk-free rate is based on the U.S. treasury yield curve in effect at the time of grant. We estimate the expected volatility of our share price by reviewing the historical volatility levels of our common stock in conjunction with that of public companies that operate in similar industries or are similar in terms of stage of development or size and then projecting this information toward its future expected volatility. We exercise judgment in selecting these companies, as well as in evaluating the available historical and implied volatility for these companies. We calculate the expected term in years for each stock option using a simplified method based on the average of each option’s vesting term and original contractual term. We apply an estimated forfeiture rate derived from our historical data and our estimates of the likely future actions of option holders when recognizing the share-based compensation expense of the options.
To determine the fair value of a share-based award using Monte Carlo simulations, we make assumptions regarding the risk-free interest rate, expected future volatility, expected dividend yield and performance period. The risk-free rate is based on the U.S. treasury yield curve in effect at the time of grant. We estimate the expected volatility of the share price by reviewing the historical volatility levels of our common stock in conjunction with that of public companies that operate in similar industries or are similar in terms of stage of development or size and then projecting this information toward our future expected volatility. Dividend yield is determined based on our future plans to pay dividends. We calculate the performance period based on the specific market condition to be achieved and derived from historical data and estimates of future performance.
We recognize compensation expense, net of forfeitures, using a straight-line method over the applicable vesting period. Each appropriate quarter, the share-based compensation expense is adjusted to reflect all options that vested or were forfeited during the period.
The fair value of modifications to share-based awards is generally estimated using the Black-Scholes option pricing model. If a share-based compensation award is modified after the grant date, incremental compensation expense, if any, is recognized in an amount equal to the excess of the fair value of the modified award over the fair value of the original award immediately before the modification. Incremental compensation expense for vested awards is recognized immediately. For unvested awards, the sum of the incremental compensation expense and the remaining unrecognized compensation expense for the original award on the modification date is recognized over the modified service period.
New Accounting Standards
For additional information regarding new accounting guidance, see Note 3, Recent Accounting Pronouncements, to our consolidated financial statements included in this Annual Report on Form 10-K, which provides a summary of recently adopted accounting standards and disclosures.
Results of Operations
Year Ended December 31, 2017 Compared to Year Ended December 31, 2016
The following table provides consolidated operating results and other operating data for the periods indicated:
56
Year Ended December 31, | 2017 vs. 2016 Change | ||||||||||||||
2017 | 2016 | Amount | % | ||||||||||||
(In millions) | |||||||||||||||
Consolidated statement of operations Data: | |||||||||||||||
RCM services: net operating fees | $ | 374.8 | $ | 368.8 | $ | 6.0 | 1.6 | % | |||||||
RCM services: incentive fees | 29.0 | 191.3 | (162.3 | ) | (84.8 | )% | |||||||||
RCM services: other | 13.6 | 16.3 | (2.7 | ) | (16.6 | )% | |||||||||
Other services fees | 32.4 | 16.1 | 16.3 | 101.2 | % | ||||||||||
Total net services revenue | 449.8 | 592.6 | (142.8 | ) | (24.1 | )% | |||||||||
Operating expenses: | |||||||||||||||
Cost of services | 416.3 | 199.7 | 216.6 | 108.5 | % | ||||||||||
Selling, general and administrative | 56.3 | 74.1 | (17.8 | ) | (24.0 | )% | |||||||||
Other | 4.7 | 20.8 | (16.1 | ) | (77.4 | )% | |||||||||
Total operating expenses | 477.3 | 294.7 | 182.6 | 62.0 | % | ||||||||||
Income (loss) from operations | (27.5 | ) | 297.9 | (325.4 | ) | (109.2 | )% | ||||||||
Net interest income | 0.2 | 0.3 | (0.1 | ) | (33.3 | )% | |||||||||
Net income (loss) before income tax provision | (27.3 | ) | 298.2 | (325.5 | ) | (109.2 | )% | ||||||||
Income tax provision (benefit) | 31.5 | 121.1 | (89.6 | ) | (74.0 | )% | |||||||||
Net income (loss) | (58.8 | ) | 177.1 | (235.9 | ) | (133.2 | )% | ||||||||
The following table represents a reconciliation of gross cash generated from customer contracting activities to net services revenue, the most comparable GAAP measure, for each of the periods indicated:
Year Ended December 31, | 2017 vs. 2016 Change | ||||||||||||
2017 | 2016 | Amount | % | ||||||||||
(In millions) | |||||||||||||
RCM services: net operating fees | 374.8 | 368.8 | 6.0 | 1.6 | % | ||||||||
RCM services: incentive fees | 29.0 | 191.3 | (162.3 | ) | (84.8 | )% | |||||||
RCM services: other | 13.6 | 16.3 | (2.7 | ) | (16.6 | )% | |||||||
Other services fees | 32.4 | 16.1 | 16.3 | 101.2 | % | ||||||||
Net Services Revenue | 449.8 | 592.6 | $ | (142.8 | ) | (24.1 | )% | ||||||
Change in deferred customer billings (non-GAAP) (1) | n.a. | (383.9 | ) | n.m. | n.m. | ||||||||
Gross cash generated from customer contracting activities (non-GAAP) | n.a. | 208.7 | n.m. | n.m. | |||||||||
n.m. - not meaningful
n.a. - Due to the adoption of Topic 606 as of January 1, 2017, the non-GAAP measure of gross cash generated from customer contracting activities, that was utilized by the Company in 2016, is not applicable for 2017. Gross cash generated from customer contracting activities has been provided for the year ended December 31, 2016 as it is the most comparable metric to net services revenue for the year ended December 31, 2017.
(1) | Deferred customer billings include the portion of both (i) invoiced or accrued net operating fees and (ii) cash collections on incentive fees, in each case, that have not met our revenue recognition criteria. Deferred customer billings are included in the detail of our customer liabilities account in the consolidated balance sheet. Deferred customer billings are reduced by revenue recognized when revenue recognition occurs. Change in deferred customer billings represents the net change in the cumulative net operating fees and incentive fees that have not met revenue recognition criteria under Topic 605. |
The following table represents a reconciliation of adjusted EBITDA and net cash generated from customer contracting activities to net income (loss), the most comparable GAAP measure, for each of the periods indicated:
57
Year Ended December 31, | 2017 vs. 2016 Change | ||||||||||||
2017 | 2016 | Amount | % | ||||||||||
(In millions) | |||||||||||||
Net income (loss) | (58.8 | ) | 177.1 | (235.9 | ) | (133.2 | )% | ||||||
Net interest income | (0.2 | ) | — | (0.3 | ) | 0.1 | (33.3 | )% | |||||
Income tax provision (benefit) | 31.5 | 121.1 | (89.6 | ) | (74.0 | )% | |||||||
Depreciation and amortization expense (GAAP) | 16.3 | 10.2 | 6.1 | 59.8 | % | ||||||||
Share-based compensation expense (GAAP)(1) | 10.7 | 28.1 | (17.4 | ) | (61.9 | )% | |||||||
Other (GAAP)(2) | 4.7 | 20.8 | (16.1 | ) | (77.4 | )% | |||||||
Adjusted EBITDA (non-GAAP) | 4.1 | 357.0 | (352.9 | ) | (98.9 | )% | |||||||
Change in deferred customer billings (non-GAAP) (3) | n.a. | (383.9 | ) | n.m. | n.m. | ||||||||
Net cash generated from customer contracting activities (non-GAAP) | n.a. | (26.8 | ) | n.m. | n.m. | ||||||||
n.m. - not meaningful
n.a. - Due to the adoption of Topic 606 as of January 1, 2017, the non-GAAP measure of gross cash generated from customer contracting activities, that was utilized by the Company in 2016, is not applicable for 2017. Net cash generated from customer contracting activities has been provided for theyear ended December 31, 2016 as it is the most comparable metric to adjusted EBITDA for the year ended December 31, 2017.
Due to rounding, numbers presented in this table may not add up precisely to the totals provided.
(1) | Share-based compensation expense represents the expense associated with stock options, restricted stock units and restricted stock awards granted, as reflected in our Consolidated Statements of Operations and Comprehensive Income (Loss). See Note 10, Share-Based Compensation, to the Consolidated Financial Statements included in this Annual Report on Form 10-K for the detail of the amounts of share-based compensation expense. |
(2) | Other costs consist of the following (in millions): |
Year Ended December 31, | |||||||
2017 | 2016 | ||||||
Severance and employee benefits | $ | 0.3 | $ | 3.5 | |||
Facility charges | — | 1.1 | |||||
Non-cash share based compensation | 0.1 | 1.8 | |||||
Reorganization-related | 0.4 | 6.4 | |||||
Transaction fees | — | 12.7 | |||||
Defined contribution plan contributions | — | 0.5 | |||||
Restatement costs | — | 1.2 | |||||
Acquisition related diligence and costs | 3.1 | — | |||||
Transitioned employees restructuring expense | 1.2 | — | |||||
Other | 4.3 | 14.4 | |||||
Total other | $ | 4.7 | $ | 20.8 | |||
(3) | Deferred customer billings include the portion of both (i) invoiced or accrued net operating fees and (ii) cash collections on incentive fees, in each case, that have not met our revenue recognition criteria. Deferred customer billings are included in the detail of our customer liabilities account in the consolidated balance sheet. Deferred customer billings are reduced by revenue recognized when revenue recognition occurs. Change in deferred customer billings represents the net change in the cumulative net operating fees and incentive fees that have not met revenue recognition criteria. |
Revenue
Revenue decreased by $142.8 million, or 24.1%, from $592.6 million for the year ended December 31, 2016 to $449.8 million for the year ended December 31, 2017. As noted above, the Company adopted new guidance on revenue recognition as of January 1, 2017. Under the new revenue recognition standard, we recognize revenue when a performance obligation is satisfied by transferring control over a service to a customer, which is typically over the contract term. For the year ended December 31, 2017, we recognized $449.8 million in revenue. Prior to the adoption of the new standard, revenue was recognized when all the criteria for revenue recognition was met, which was generally upon contract renewal, termination or other contractual agreement event. For the year ended December 31, 2016, we recognized $557.8 million in revenue due to contractual agreement events. See Note 7,
58
Revenue Recognition, for further explanation of the Company’s revenue recognition policy related to periods starting on or after January 1, 2017.
Net Services Revenue (2017) (GAAP) compared to Gross Cash Generated from Customer Contracting Activities (2016) (non-GAAP)
Due to the adoption of Topic 606 as of January 1, 2017, the non-GAAP measure of gross cash generated from customer contracting activities, that was utilized by the Company in 2016, is not applicable for 2017. However, we have provided a year-over-year comparison of net services revenue to gross cash generated from customer contracting activities as gross cash generated from customer contracting activities for the year ended December 31, 2016 is the most comparable metric to net services revenue for the year ended December 31, 2017.
Net services revenue as compared to gross cash generated from customer contracting activities increased by $241.1 million, or 115.5%, from $208.7 million for the year ended December 31, 2016, to $449.8 million for the year ended December 31, 2017. The increase was primarily driven by the onboarding of new Ascension hospitals under the A&R MPSA.The transition to the A&R MPSA for Ascension hospitals served prior to 2016 also contributed to the increase, due to a change in classification of costs from an offset to net operating fees to cost of services due to on-boarding of employees. These two factors resulted in an increase in revenue of $247.9 million. In addition, other services fees increased by $16.5 million, driven by our PAS service offering. These increases were partially offset by customer terminations of approximately $21.9 million.
Gross cash generated from customer contracting activities is a non-GAAP measure. Please see "Selected Consolidated Financial Data - Selected Non-GAAP Measures" for an explanation of how we calculate and use gross cash generated from customer contracting activities and for its reconciliation to revenue, the most comparable GAAP measure.
Cost of Services
Cost of services increased by $216.6 million, or 108.5%, from $199.7 million for the year ended December 31, 2016, to $416.3 million for the year ended December 31, 2017. The increase was primarily driven by costs associated with providing services to new Ascension hospitals. In addition, costs also increased due to the transition to the A&R MPSA, which led to change in classification of costs from an offset to net operating fees to cost of services due to on-boarding of employees (discussed above) and an increase in shared services costs driven by increased volume. In addition, the increase in PAS volume resulted in a $8.5 million increase in cost of services.
Selling, General and Administrative Expenses
Selling, general and administrative expenses decreased by $17.8 million, or 24.0%, from $74.1 million for the year ended December 31, 2016 to $56.3 million for the year ended December 31, 2017. The decrease was primarily due to a decrease in stock compensation expense.
Other Costs
Other costs decreased by $16.1 million, from $20.8 million for the year ended December 31, 2016, to $4.7 million for the year ended December 31, 2017. The decrease was primarily attributable to $13.1 million in costs related to retention payments paid in connection with the closing of the Transaction with Ascension Health Alliance and TowerBrook on February 16, 2016 and $5.5 million in reorganization related costs during the year ended December 31, 2016 offset by $3.1 million in acquisition-related diligence expenditures in 2017.
Income Taxes
Income tax provision decreased by $89.6 million to $31.5 million for the year ended December 31, 2017 from $121.1 million for the year ended December 31, 2016. This was primarily due to a decrease of $325.5 in pretax income as well as a $5.8 decrease in discrete items. This decrease was partially offset by an increase in tax expense
59
for 2017 from provisional amounts related to the deemed repatriation charge of approximately $3.0 million and $35.2 million resulting from the revaluation of deferred tax assets and liabilities to the lower enacted U.S corporate tax rate of 21% under the Tax Act.
Our effective tax rate excluding the impact of the Tax Act was approximately 24% and 41% for the years ended December 31, 2017 and 2016. Our tax rate is affected by discrete items that may occur in any given year, but not consistent from year to year. Our rate was impacted by the write-down of deferred tax assets, state taxes and the geographical mix of business.
60
Results of Operations
Year Ended December 31, 2016 Compared to Year Ended December 31, 2015
The following table provides consolidated operating results and other operating data for the periods indicated:
Year Ended December 31, | 2016 vs. 2015 Change | ||||||||||||||
2016 | 2015 | Amount | % | ||||||||||||
(In millions) | |||||||||||||||
Consolidated statement of operations Data: | |||||||||||||||
RCM services: net operating fees | $ | 368.8 | $ | 66.2 | $ | 302.6 | 457.1 | % | |||||||
RCM services: incentive fees | 191.3 | 20.3 | 171.0 | 842.4 | % | ||||||||||
RCM services: other | 16.3 | 16.4 | (0.1 | ) | (0.6 | )% | |||||||||
Other services fees | 16.1 | 14.3 | 1.8 | 12.6 | % | ||||||||||
Total net services revenue | 592.6 | 117.2 | 475.4 | 405.6 | % | ||||||||||
Operating expenses: | |||||||||||||||
Cost of services | 199.7 | 169.0 | 30.7 | 18.2 | % | ||||||||||
Selling, general and administrative | 74.1 | 75.0 | (0.9 | ) | (1.2 | )% | |||||||||
Other | 20.8 | 9.3 | 11.5 | 123.7 | % | ||||||||||
Total operating expenses | 294.7 | 253.3 | 41.4 | 16.3 | % | ||||||||||
Income (loss) from operations | 297.9 | (136.0 | ) | 433.9 | (319.0 | )% | |||||||||
Net interest income | 0.3 | 0.2 | 0.1 | 50.0 | % | ||||||||||
Net income (loss) before income tax provision | 298.2 | (135.8 | ) | 434.0 | (319.6 | )% | |||||||||
Income tax provision (benefit) | 121.1 | (51.6 | ) | 172.7 | (334.7 | )% | |||||||||
Net income (loss) | 177.1 | (84.3 | ) | 261.4 | (310.1 | )% | |||||||||
Net interest income | (0.3 | ) | (0.3 | ) | — | — | % | ||||||||
Income tax provision (benefit) | 121.1 | (51.6 | ) | 172.7 | (334.7 | )% | |||||||||
Depreciation and amortization expense | 10.2 | 8.5 | 1.7 | 20.0 | % | ||||||||||
Share-based compensation expense | 28.1 | 31.7 | (3.6 | ) | (11.4 | )% | |||||||||
Other | 20.8 | 9.3 | 11.5 | 123.7 | % | ||||||||||
Adjusted EBITDA | 357.0 | (86.6 | ) | 443.6 | (512.2 | )% | |||||||||
Change in deferred customer billings | (383.9 | ) | 112.9 | (496.8 | ) | (440.0 | )% | ||||||||
Net cash generated from customer contracting activities | $ | (26.8 | ) | $ | 26.4 | $ | (53.2 | ) | (201.5 | )% | |||||
Net services revenue | $ | 592.6 | $ | 117.2 | $ | 475.4 | 405.6 | % | |||||||
Change in deferred customer billings | (383.9 | ) | 112.9 | (496.8 | ) | (440.0 | )% | ||||||||
Gross cash generated from customer contracting activities | $ | 208.7 | $ | 230.2 | $ | (21.5 | ) | (9.3 | )% | ||||||
Components of gross cash generated from customer contracting activities: | |||||||||||||||
RCM services: net operating fee | $ | 150.5 | $ | 123.2 | $ | 27.3 | 22.2 | % | |||||||
RCM services: incentive fee | 29.1 | 67.7 | (38.6 | ) | (57.0 | )% | |||||||||
RCM services: other | 13.0 | 25.0 | (12.0 | ) | (48.0 | )% | |||||||||
Total RCM services fees | 192.6 | 215.9 | (23.3 | ) | (10.8 | )% | |||||||||
Other services fees | 16.1 | 14.3 | 1.8 | 12.6 | % | ||||||||||
Gross cash generated from customer contracting activities | $ | 208.7 | $ | 230.2 | $ | (21.5 | ) | (9.3 | )% | ||||||
Net Services Revenue
Net services revenue increased by $475.4 million, or 405.6%, from $117.2 million for the year ended December 31, 2015 to $592.6 million for the year ended December 31, 2016. The increase was primarily due to contractual agreement events related to Ascension and other RCM clients in the year ended December 31, 2016, resulting in revenue recognition of $557.8 million in net services revenue, partially offset by the recognition of revenue from contractual agreement events during 2015.
61
In addition, other service fees increased by $1.8 million in 2016 as compared to 2015, primarily driven by an increase in PAS revenue.
Gross Cash Generated from Customer Contracting Activities (Non-GAAP)
Gross cash generated from customer contracting activities decreased by $21.5 million, or 9.3%, from $230.2 million for the year ended December 31, 2015, to $208.7 million for the year ended December 31, 2016. The decrease in gross cash generated was primarily driven by reduction in the scope of services for certain customers and customer attrition.
Gross cash generated from customer contracting activities is a non-GAAP measure. Please see "Selected Consolidated Financial Data - Selected Non-GAAP Measures" for an explanation of how we calculate and use gross cash generated from customer contracting activities and for its reconciliation to net services revenue, the most comparable GAAP measure.
Cost of Services
Cost of services increased by $30.7 million, or 18.2%, from $169.0 million for the year ended December 31, 2015, to $199.7 million for the year ended December 31, 2016. The increase in costs was primarily due to the transition to the A&R MPSA, which has resulted in a change in classification of costs from an offset to net operating fees to cost of services due to on-boarding of employees. The Company expects cost of services to increase as our headcount increases as a result of the on-boarding of former Ascension employees. Previously, these costs were netted against billings as a component of net operating fees. Additionally, the implementation of ICD-10, a clinical cataloging system that went into effect for the U.S. healthcare industry on October 1, 2015, increased costs.
Selling, General and Administrative Expenses
Selling, general and administrative expenses decreased by $0.9 million, or 1.2%, from $75.0 million for the year ended December 31, 2015 to $74.1 million for the year ended December 31, 2016. The decrease was primarily due to a decrease in stock compensation expense.
Net Cash Generated from Customer Contracting Activities (Non-GAAP)
Net cash generated from customer contracting activities decreased by $53.2 million from $26.4 million for the year ended December 31, 2015 to $(26.8) million for the year ended December 31, 2016. This decrease was primarily due to a decrease in gross cash generated from customer contracting activities and an increase in cost of services as explained above.
Please see "Selected Consolidated Financial Data - Selected Non-GAAP Measures" for an explanation of how we calculate and use net cash generated from customer contracting activities and for its reconciliation to net income (loss), the most comparable GAAP measure.
Other Costs
Other costs increased by $11.5 million, from $9.3 million for the year ended December 31, 2015, to $20.8 million for the year ended December 31, 2016. The increase was primarily attributable to $12.7 million in costs related to retention payments paid in connection with the closing of the Transaction with Ascension Health Alliance and TowerBrook on February 16, 2016.
Income Taxes
Income tax provision increased by $172.7 million to $121.1 million for the year ended December 31, 2016 from a benefit of $51.6 million for the year ended December 31, 2015, primarily due to an increase in pretax income. Our effective tax rate was approximately 41% and 38% for the years ended December 31, 2016 and 2015.
62
Our tax rate is affected by discrete items that may occur in any given year, but not consistent from year to year. Our rate was negatively impacted by the write-down of state deferred tax assets from the geographical mix of business.
63
Liquidity and Capital Resources
Cash flows from operating, investing and financing activities, as reflected in our Consolidated Statements of Cash Flows, are summarized in the following table:
Year Ended December 31, | ||||||||||||
2017 | 2016 | 2015 | ||||||||||
(In millions) | ||||||||||||
Net cash provided by (used in) operating activities | $ | 20.9 | $ | (86.9 | ) | $ | (23.8 | ) | ||||
Net cash used in investing activities | (33.6 | ) | (11.6 | ) | (22.3 | ) | ||||||
Net cash (used in) provided by financing activities | (4.2 | ) | 176.5 | 4.9 | ||||||||
Effect of exchange rate changes in cash | 0.6 | (0.3 | ) | (0.5 | ) | |||||||
Net increase (decrease) in cash and cash equivalents | (16.3 | ) | 77.7 | (41.7 | ) | |||||||
As of December 31, 2017 and 2016, we had cash and cash equivalents of $164.9 million and $181.2 million, respectively. These balances consist primarily of highly liquid money market funds. Our cash and cash equivalents, at any time, include amounts paid to us in advance by customers for the purpose of reimbursing their revenue cycle operations costs. See Note 2, Summary of Significant Accounting Policies, to our consolidated financial statements included in this Annual Report on Form 10-K for additional information. We expect that the combination of our current liquidity, expected additional cash generated from operations and to the extent necessary, new borrowing facilities will be sufficient to satisfy our anticipated cash requirement through at least the next twelve months.
Year Ended December 31, 2017 Compared to Year Ended December 31, 2016
Operating Activities
Cash used in operating activities improved by $107.8 million, from cash used of $86.9 million for the year ended December 31, 2016, to cash provided by $20.9 million for the year ended December 31, 2017. The increase resulted from stronger operating performance as evidenced by the improvement in adjusted EBITDA for the year ended December 31, 2017 as compared to net cash generated for the year ended December 31, 2016 and year-over-year favorable changes in working capital.
Investing Activities
Cash used in investing activities increased by $22.0 million from $11.6 million for the year ended December 31, 2016, to $33.6 million for the year ended December 31, 2017. Cash used in investing activities increased primarily due to an increase in purchases of computer hardware and software and spending on expanding our India operations.
Financing Activities
Cash provided by financing activities decreased by $180.7 million from cash provided by financing activities of $176.5 million for the year ended December 31, 2016 to cash used in financing activities of $4.2 million for the year ended December 31, 2017. This change is primarily due to the investment of $200 million by the Investor in connection with the Transaction offset by transaction costs of $21.3 million during the year ended December 31, 2016.
Year Ended December 31, 2016 Compared to Year Ended December 31, 2015
Operating Activities
64
Cash used in operating activities increased by $63.1 million, from cash used of $23.8 million for the year ended December 31, 2015, to cash used of $86.9 million for the year ended December 31, 2016. The increase resulted from the decrease in net cash generated from customer contracting activities and unfavorable changes in working capital primarily related to the change to an operating partner model with Ascension as employee costs are paid as incurred as opposed to the longer payment cycle associated with reimbursements under the co-managed model.
Investing Activities
Cash used in investing activities decreased by $10.7 million from $22.3 million for the year ended December 31, 2015, to $11.6 million for the year ended December 31, 2016. Cash used in investing activities decreased primarily due to a year-over-year decline in purchases of computer software and lower spending on leasehold improvements related the on-going build out of a new shared service center. Cash used was offset by cash provided of $1.0 million from proceeds received from the maturation of short-term investments.
Financing Activities
Cash provided by financing activities increased by $171.6 million for the year ended December 31, 2016, primarily due to the investment of $200 million by the Investor in connection with the Transaction offset by transaction costs of $21.3 million.
Future Capital Needs
The Company continues to invest capital in the achievement of our strategic initiatives. In conjunction with our announced acquisition of Intermedix, we entered into debt commitment letters for a $295 million first lien senior secured credit facility, of which $270 million is a term loan facility and $25 million is a revolving credit facility, and $110 million of unsecured, subordinated notes. In addition, we plan to continue to enhance customer service by continuing our investment in technology to enable our systems to more effectively integrate with our customers’ existing technologies in connection with our strategic initiatives. We plan to continue to deploy resources to strengthen our information technology infrastructure in order to drive additional value for our customers. We also expect to continue to invest in our shared services infrastructure and capabilities, and selectively pursue acquisitions and/or strategic relationships that will enable us to broaden or further enhance our offerings.
New business development remains a priority as we plan to continue to boost our sales and marketing efforts. We plan to continue to add experienced personnel to our sales organization, develop more disciplined sales processes and create an integrated marketing capability. Additionally, we expect to incur costs associated with implementation and transition costs to onboard new customers.
We believe that our available cash balances and the cash flows expected to be generated from operations and to the extent necessary, new borrowing facilities will be sufficient to satisfy our current and planned working capital and investment needs for the next twelve months.
65
Contractual Obligations
The following table presents a summary of our contractual obligations as of December 31, 2017 (in millions):
2018 | 2019 | 2020 | 2021 | 2022 | Thereafter | Total | ||||||||||||||||||||||
Operating Leases (1) | $ | 8.1 | $ | 7.4 | $ | 7.6 | $ | 7.3 | $ | 4.0 | $ | 19.0 | $ | 53.4 | ||||||||||||||
Purchase Obligations (2) | $ | 1.1 | $ | 1.1 | $ | 1.1 | $ | 1.1 | $ | — | $ | — | $ | 4.4 | ||||||||||||||
Total | $ | 9.2 | $ | 8.5 | $ | 8.7 | $ | 8.4 | $ | 4.0 | $ | 19.0 | $ | 57.8 | ||||||||||||||
(1) Obligations and commitments to make future minimum rental payments under non-cancelable operating leases having remaining terms in excess of one year.
(2) Includes obligations associated with IT software and service costs.
Uncertain Tax Positions
We have a $0.3 million liability for uncertain tax positions as of December 31, 2017. These have been excluded from the "Contractual Obligations" table as we cannot reasonably estimate the period of cash settlement for the tax positions presented in our financial statements as a reduction of our deferred tax asset.
Off-Balance Sheet Arrangements
Other than the contractual obligations noted above, there were no off-balance sheet transactions, arrangements or other relationships with other persons in 2017, 2016 or 2015 that would have affected or are likely to affect our liquidity or the availability of, or requirements for, capital resources.
Item 7a. | Qualitative and Quantitative Disclosures about Market Risk |
Interest Rate Sensitivity. Our interest income is primarily generated from interest earned on operating cash accounts. We do not enter into interest rate swaps, caps or collars or other hedging instruments. As a result, we believe that the risk of a significant impact on our operating income from interest rate fluctuations is not material.
Foreign Currency Exchange Risk. Our results of operations and cash flows are subject to fluctuations due to changes in the Indian rupee because a portion of our operating expenses are incurred by our subsidiary in India and are denominated in Indian rupees. However, we do not generate any revenues outside of the United States. For years ended December 31, 2017, 2016 and 2015, 8%, 8% and 7%, respectively, of our expenses were denominated in Indian rupees. As of December 31, 2017 and 2016, we had net assets of $23.8 million and $15.8 million in India, respectively. The reduction in earnings from a 10% adverse change in U.S. dollar/Indian Rupee foreign currency spot rates would be $4.1 million and $2.7 million at December 31, 2017 and 2016, respectively.
Beginning in 2018, the Company entered into derivative financial instruments to reduce its exposure to changes in foreign currency exchange rates. These instruments will be recorded at fair value. To determine the fair value of these instruments, the Company will use quoted market prices and standard pricing models with inputs derived from or corroborated by observable market data. As of January 31, 2018, the notional amount of our open foreign currency forward contracts was approximately 1.1 billion Indian rupees and the fair value was a net unrealized loss of $0.1 million.
Item 8. | Consolidated Financial Statements and Supplementary Data |
The financial statements required by this Item are located beginning on page F-1 of this report.
66
Item 9. | Changes in and Disagreements with Accountants on Accounting and Financial Disclosure |
None
Item 9A. | Controls and Procedures |
This Item 9A includes information concerning the controls and controls evaluation referred to in the certifications of our Chief Executive Officer and Chief Financial Officer required by Rule 13a-14 of the Exchange Act included in this Annual Report as Exhibits 31.1 and 31.2.
Management’s Report on Internal Control Over Financial Reporting
Management has responsibility for establishing and maintaining adequate internal control over financial reporting. Internal control over financial reporting is a process designed to provide reasonable assurance regarding the reliability of financial reporting and the preparation of financial statements for external reporting purposes in accordance with accounting principles generally accepted in the United States. Because of its inherent limitations, internal control over financial reporting may not prevent or detect misstatements. Management has assessed the effectiveness of the Company’s internal control over financial reporting as of December 31, 2017. In making its assessment, management has utilized the criteria set forth by the COSO of the Treadway Commission in Internal Control-Integrated Framework (2013). Management concluded that based on its assessment, our internal control over financial reporting was effective as of December 31, 2017. The Company’s internal control over financial reporting as of December 31, 2017 has been audited by Ernst & Young LLP as stated in their report which appears on page 68.
Evaluation of Disclosure Controls and Procedures
Disclosure controls and procedures (as defined in Rules 13a-15(e) and 15d-15(e) of the Exchange Act) are designed to ensure that information required to be disclosed by us in reports filed or submitted under the Exchange Act is recorded, processed, summarized and reported within the time periods specified in SEC rules and forms and that such information is accumulated and communicated to management including its principal executive officer and principal financial officer to allow timely decisions regarding required disclosures.
In connection with the preparation of this report, our management, under the supervision and with the participation of the Chief Executive Officer and Chief Financial Officer, evaluated the effectiveness of our disclosure controls and procedures as of December 31, 2017. Our Chief Executive Officer and Chief Financial Officer concluded that, as of December 31, 2017, our disclosure controls and procedures were effective.
Changes in Internal Control Over Financial Reporting
There have been no changes in our internal control over financial reporting during the quarter ended December 31, 2017 that have materially affected, or are reasonably likely to materially affect, our internal control over financial reporting.
67
Report of Independent Registered Public Accounting Firm
The Stockholders and Board of Directors of R1 RCM Inc.
Opinion on Internal Control over Financial Reporting
We have audited R1 RCM Inc.’s internal control over financial reporting as of December 31, 2017, based on criteria established in Internal Control - Integrated Framework issued by the Committee of Sponsoring Organizations of the Treadway Commission (2013 framework) (the COSO criteria). In our opinion, R1 RCM Inc. (the Company) maintained, in all material respects, effective internal control over financial reporting as of December 31, 2017, based on COSO criteria.
We also have audited, in accordance with the standards of the Public Company Accounting Oversight Board (United States) (PCAOB), the consolidated balance sheets of the Company as of December 31, 2017 and 2016, the related consolidated statements of operations and comprehensive income (loss), stockholders’ equity (deficit), and cash flows for each of the three years in the period ended December 31, 2017, and the related notes and our report dated March 9, 2018 expressed an unqualified opinion thereon.
Basis for Opinion
The Company’s management is responsible for maintaining effective internal control over financial reporting and for its assessment of the effectiveness of internal control over financial reporting included in the accompanying Management’s Report on Internal Control Over Financial Reporting. Our responsibility is to express an opinion on the Company’s internal control over financial reporting based on our audit. We are a public accounting firm registered with the PCAOB and are required to be independent with respect to the Company in accordance with the U.S. federal securities laws and the applicable rules and regulations of the Securities and Exchange Commission and the PCAOB.
We conducted our audit in accordance with the standards of the PCAOB. Those standards require that we plan and perform the audit to obtain reasonable assurance about whether effective internal control over financial reporting was maintained in all material respects.
Our audit included obtaining an understanding of internal control over financial reporting, assessing the risk that a material weakness exists, testing and evaluating the design and operating effectiveness of internal control based on the assessed risk, and performing such other procedures as we considered necessary in the circumstances. We believe that our audit provides a reasonable basis for our opinion.
Definition and Limitations of Internal Control Over Financial Reporting
A company’s internal control over financial reporting is a process designed to provide reasonable assurance regarding the reliability of financial reporting and the preparation of financial statements for external purposes in accordance with generally accepted accounting principles. A company’s internal control over financial reporting includes those policies and procedures that (1) pertain to the maintenance of records that, in reasonable detail, accurately and fairly reflect the transactions and dispositions of the assets of the company; (2) provide reasonable assurance that transactions are recorded as necessary to permit preparation of financial statements in accordance with generally accepted accounting principles, and that receipts and expenditures of the company are being made only in accordance with authorizations of management and directors of the company; and (3) provide reasonable assurance regarding prevention or timely detection of unauthorized acquisition, use, or disposition of the company’s assets that could have a material effect on the financial statements.
Because of its inherent limitations, internal control over financial reporting may not prevent or detect misstatements. Also, projections of any evaluation of effectiveness to future periods are subject to the risk that controls may become inadequate because of changes in conditions, or that the degree of compliance with the policies or procedures may deteriorate.
68
/s/ Ernst & Young LLP
Chicago, Illinois
March 9, 2018
69
Item 9B. | Other Information |
None
70
PART III
Item 10. | Directors, Executive Officers and Corporate Governance |
The information required by this item with respect to our directors and executive officers will be contained in our 2018 Proxy Statement under the caption "Information About Our Directors, Officers and 5% Stockholders" and is incorporated in this report by reference.
The information required by this item with respect to Section 16(a) beneficial ownership reporting compliance will be contained in our 2018 Proxy Statement under the caption "Section 16(a) Beneficial Ownership Reporting Compliance" and is incorporated in this report by reference.
The information required by this item with respect to corporate governance matters will be contained in our 2018 Proxy Statement under the caption "Corporate Governance" and is incorporated in this report by reference.
Code of Ethics
We have adopted a code of business conduct and ethics that applies to our directors and officers (including our principal executive officer, principal financial officer, principal accounting officer or controller, or persons performing similar functions) as well as our employees. Copies of our code of business conduct and ethics are available without charge upon written request directed to Corporate Secretary, R1 RCM Inc., 401 N. Michigan Avenue, Suite 2700, Chicago, Illinois, 60611. Additionally, copies are available without charge online at http://ir.r1rcm.com/phoenix.zhtml?c=234481&p=irol-govhighlights.
Item 11. | Executive Compensation |
Information required to be furnished by Item 402 of Regulation S-K and paragraphs (e)(4) and (e)(5) of Item 407 of Regulation S-K regarding executive compensation will be included in our 2018 Proxy Statement, and is herein incorporated by reference.
Item 12. | Security Ownership of Certain Beneficial Owners and Management and Related Stockholder Matters |
We maintain an Amended and Restated Stock Option Plan ("2006 Plan"), and a Second Amended and Restated 2010 Stock Incentive Plan (the "2010 Amended Plan"), and together with the 2006 Plan (the "Plans"). Under the 2010 Amended Plan we may issue up to a maximum of 46,374,756 shares, including any shares that remained available for issuance under the 2006 Plan as of the date of the IPO and any shares subject to awards that were outstanding under the 2006 Plan as of the date of the IPO that expire, terminate or are otherwise surrendered, canceled, forfeited or repurchased by us without the issuance of shares thereunder. We will not make any further grants under the 2006 Plan. The 2010 Amended Plan provides for the grant of incentive stock options, non-statutory stock options, stock appreciation rights, restricted stock, restricted stock units and and other share-based awards. As of December 31, 2017, 8,664,763 shares were available for future grants of awards under the 2010 Amended Plan. However, to the extent that previously granted awards under the 2006 Plan or 2010 Amended Plan expire, terminate or are otherwise surrendered, canceled or forfeited, the number of shares available for future awards under the 2010 Amended Plan will increase.
The following table summarizes information about the securities authorized for issuance under our equity compensation plans as of December 31, 2017:
71
(a) | (b) | (c) | ||||||||
Plan Category | Number of Securities to be Issued Upon Exercise of Outstanding Options and Restricted Stock Units | Weighted- Average Exercise Price of Outstanding Options | Number of Securities Remaining Available for Future Issuance Under Equity Compensation Plans (Excluding Securities reflected in Column (a)) | |||||||
Equity compensation plans approved by stockholders (1)(2) | 28,966,716 | $ | 4.70 | 8,664,763 | ||||||
Equity compensation plans not approved by stockholders (3) | 2,903,801 | — | ||||||||
Total | 31,870,517 | 8,664,763 | ||||||||
(1)Includes 17,742,966 outstanding stock options, 1,183,500 restricted stock units and 10,040,250 performance-based restricted stock units ("PBRSUs") awarded under the Plans. The number of shares included for PBRSUs represents the maximum shares that could vest based on applicable price targets and includes shares issued pursuant to the PBRSU award agreements intended to be settled in cash until such time as the share reserve available under the 2010 Amended Plan has been deemed sufficient by the Compensation Committee of our Board of Directors to allow for settlement of the PBRSUs in shares. See Note 10, Share-Based Compensation, to our consolidated financial statements included in this Annual Report on Form 10-K for additional information. Since the restricted stock units and performance-based restricted stock units have no exercise price, they are not included in the weighted-average exercise price calculation in column b.
(2)Excludes 2,352,490 shares of RSAs that were unvested and not forfeited as of December 31, 2017.
(3)Represents stock option inducement grants made pursuant to the NYSE inducement grant rules. Since the performance-based restricted stock units have no exercise price, a weighted-average exercise price has not been included in column b.
The information required by this item with regard to security ownership of certain beneficial owners and management will be contained in our 2018 Proxy Statement under the caption "Information About Our Directors, Officers and 5% Stockholders - Security Ownership of Certain Beneficial Owners and Management" and is incorporated in this report by reference.
Item 13. | Certain Relationships and Related Transactions, and Director Independence |
The information required by this item will be contained in our 2018 Proxy Statement under the captions "Related-Party Transactions" and "Corporate Governance" and is incorporated in this report by reference.
Item 14. | Principal Accountant Fees and Services |
The information required by this item will be contained in our 2018 Proxy Statement under the caption "Ratification of the Selection of Independent Registered Public Accounting Firm" and is incorporated in this report by reference.
72
PART IV
Item 15. | Exhibits and Financial Statement Schedules |
a) The following documents are filed as a part of this report:
(1) Financial Statements: The financial statements and notes thereto annexed to this report beginning on page F-1.
(2) Financial Statement Schedules: Schedule II- Valuation and Qualifying Accounts Disclosure schedules have been omitted because they are not required or because the required information is in the Consolidated Financial Statements and notes thereto.
(3) Exhibits: The list of Exhibits filed as part of this Annual Report on Form 10-K is set forth on the Exhibit Index immediately preceding such Exhibits and is incorporated herein by this reference.
Item 16. | Form 10-K Summary |
None.
73
SIGNATURES
Pursuant to the requirements of Section 13 or 15(d) of the Securities Exchange Act of 1934, the registrant has duly caused this report to be signed on its behalf by the undersigned, thereunto duly authorized.
Date: March 9, 2018
R1 RCM INC. | |
By: | /s/ Joseph Flanagan |
Joseph Flanagan | |
President and Chief Executive Officer | |
By: | /s/ Christopher Ricaurte |
Christopher Ricaurte | |
Chief Financial Officer and Treasurer | |
Pursuant to the requirements of the Securities Exchange Act of 1934, this report has been signed by the following persons on behalf of the registrant in the capacities and on the dates indicated.
Signature | Title | Date | ||
/s/ Joseph Flanagan Joseph Flanagan | President and Chief Executive Officer (Principal Executive Officer) | March 9, 2018 | ||
/s/ Christopher Ricaurte Christopher Ricaurte | Chief Financial Officer and Treasurer (Principal Financial Officer) | March 9, 2018 | ||
/s/ Richard Evans Richard Evans | Principal Accounting Officer | March 9, 2018 | ||
/s/ Steven J. Shulman Steven J. Shulman | Chairman of the Board | March 9, 2018 | ||
/s/ Charles J. Ditkoff Charles J. Ditkoff | Director | March 9, 2018 | ||
/s/ Michael C. Feiner Michael C. Feiner | Director | March 9, 2018 | ||
/s/ John B. Henneman III John B. Henneman III | Director | March 9, 2018 | ||
/s/ Joseph R. Impicciche Joseph R. Impicciche | Director | March 9, 2018 | ||
/s/ Alex J. Mandl Alex J. Mandl | Director | March 9, 2018 | ||
/s/ Neal Moszkowski Neal Moszkowski | Director | March 9, 2018 | ||
/s/ Ian Sacks Ian Sacks | Director | March 9, 2018 | ||
/s/ Anthony J. Speranzo Anthony J. Speranzo | Director | March 9, 2018 | ||
74
R1 RCM Inc.
Index to Consolidated Financial Statements
Page | |||
Audited Consolidated Financial Statements | |||
Report of Independent Registered Public Accounting Firm | |||
Consolidated Balance Sheets | |||
Consolidated Statements of Operations and Comprehensive Income (Loss) | |||
Consolidated Statements of Stockholders’ Equity (Deficit) | |||
Consolidated Statements of Cash Flows | |||
Notes to Consolidated Financial Statements | |||
F-1
Report of Independent Registered Public Accounting Firm
The Stockholders and Board of Directors of R1 RCM Inc.
Opinion on the Financial Statements
We have audited the accompanying consolidated balance sheets of R1 RCM Inc. (the Company) as of December 31, 2017 and 2016, the related consolidated statements of operations and comprehensive income (loss), stockholders’ equity (deficit), and cash flows for each of the three years in the period ended December 31, 2017, and the related notes (collectively referred to as the “financial statements”). In our opinion, the financial statements present fairly, in all material respects, the financial position of the Company at December 31, 2017 and 2016, and the results of its operations and its cash flows for each of the three years in the period ended December 31, 2017, in conformity with U.S. generally accepted accounting principles.
We also have audited, in accordance with the standards of the Public Company Accounting Oversight Board (United States) (PCAOB), the Company's internal control over financial reporting as of December 31, 2017, based on criteria established in Internal Control-Integrated Framework issued by the Committee of Sponsoring Organizations of the Treadway Commission (2013 framework) and our report dated
March 9, 2018 expressed an unqualified opinion thereon.
Adoption of ASU No. 2014-09
As discussed in Note 2 to the financial statements, the Company changed its method for accounting for revenue in 2017 due to the adoption of Accounting Standards Update (ASU) No. 2014-09, Revenue from Contracts with Customers (Topic 606), and the amendments in ASU No.’s 2015-14, 2016-08, 2016-10 and 2016-12.
Basis for Opinion
These financial statements are the responsibility of the Company‘s management. Our responsibility is to express an opinion on the Company‘s financial statements based on our audits. We are a public accounting firm registered with the PCAOB and are required to be independent with respect to the Company in accordance with the U.S. federal securities laws and the applicable rules and regulations of the Securities and Exchange Commission and the PCAOB.
We conducted our audits in accordance with the standards of the PCAOB. Those standards require that we plan and perform the audit to obtain reasonable assurance about whether the financial statements are free of material misstatement, whether due to error or fraud. Our audits included performing procedures to assess the risks of material misstatement of the financial statements, whether due to error or fraud, and performing procedures that respond to those risks. Such procedures include examining, on a test basis, evidence regarding the amounts and disclosures in the financial statements. Our audits also included evaluating the accounting principles used and significant estimates made by management, as well as evaluating the overall presentation of the financial statements. We believe that our audits provide a reasonable basis for our opinion.
/s/ Ernst & Young LLP
We have served as the Company‘s auditor since 2004.
Chicago, Illinois
March 9, 2018
F-2
R1 RCM Inc.
Consolidated Balance Sheets
(In millions, except per share data)
December 31, | ||||||||
2017 | 2016 | |||||||
Assets | ||||||||
Current assets: | ||||||||
Cash and cash equivalents | $ | 164.9 | $ | 181.2 | ||||
Accounts receivable, net | 8.2 | 4.0 | ||||||
Accounts receivable, net - related party | 15.4 | 1.8 | ||||||
Prepaid income taxes | 0.6 | 3.8 | ||||||
Prepaid expenses and other current assets | 13.2 | 13.8 | ||||||
Total current assets | 202.3 | 204.6 | ||||||
Property, equipment and software, net | 48.3 | 32.8 | ||||||
Non-current deferred tax assets | 70.5 | 169.9 | ||||||
Restricted cash equivalents | 1.5 | 1.5 | ||||||
Other assets | 13.4 | 6.3 | ||||||
Total assets | $ | 336.0 | $ | 415.1 | ||||
Liabilities | ||||||||
Current liabilities: | ||||||||
Accounts payable | 7.2 | 7.9 | ||||||
Current portion of customer liabilities | 1.1 | 69.7 | ||||||
Current portion of customer liabilities - related party | 27.1 | 14.2 | ||||||
Accrued compensation and benefits | 37.8 | 24.8 | ||||||
Other accrued expenses | 16.7 | 18.5 | ||||||
Total current liabilities | 89.9 | 135.1 | ||||||
Non-current portion of customer liabilities | — | 1.0 | ||||||
Non-current portion of customer liabilities - related party | 11.5 | 110.0 | ||||||
Other non-current liabilities | 11.9 | 9.7 | ||||||
Total liabilities | $ | 113.3 | $ | 255.8 | ||||
8.00% Series A convertible preferred stock: par value $0.01 per share, 370,000 authorized, 227,483 shares issued and outstanding as of December 31, 2017 (aggregate liquidation value of $232.0); 370,000 authorized, 210,160 shares issued and outstanding as of December 31, 2016 (aggregate liquidation value of $214.4) | 189.3 | 171.6 | ||||||
Stockholders’ equity (deficit) | ||||||||
Common stock, $0.01 par value, 500,000,000 shares authorized, 116,650,388 shares issued and 104,409,961 shares outstanding at December 31, 2017; 116,425,524 shares issued and 106,659,542 shares outstanding at December 31, 2016 | 1.2 | 1.2 | ||||||
Additional paid-in capital | 337.9 | 349.2 | ||||||
Accumulated deficit | (244.5 | ) | (304.7 | ) | ||||
Accumulated other comprehensive loss | (1.6 | ) | (2.8 | ) | ||||
Treasury stock, at cost, 12,240,427 shares as of December 31, 2017; 9,765,982 shares as of December 31, 2016 | (59.6 | ) | (55.2 | ) | ||||
Total stockholders’ equity (deficit) | 33.4 | (12.3 | ) | |||||
Total liabilities and stockholders’ equity (deficit) | $ | 336.0 | $ | 415.1 | ||||
See accompanying notes to consolidated financial statements.
F-3
R1 RCM Inc.
Consolidated Statements of Operations and Comprehensive Income (Loss)
(In millions, except per share data)
Year Ended December 31, | ||||||||||||
2017 | 2016 | 2015 | ||||||||||
Net services revenue ($404.4 million, $461.4 million and $53.2 million from related party for the year ended December 31, 2017, 2016 and 2015, respectively) | $ | 449.8 | $ | 592.6 | $ | 117.2 | ||||||
Operating expenses: | ||||||||||||
Cost of services | 416.3 | 199.7 | 169.0 | |||||||||
Selling, general and administrative | 56.3 | 74.1 | 75.0 | |||||||||
Other | 4.7 | 20.8 | 9.3 | |||||||||
Total operating expenses | 477.3 | 294.7 | 253.3 | |||||||||
Income (loss) from operations | (27.5 | ) | 297.9 | (136.0 | ) | |||||||
Net interest income | 0.2 | 0.3 | 0.2 | |||||||||
Income (loss) before income tax provision | (27.3 | ) | 298.2 | (135.8 | ) | |||||||
Income tax provision (benefit) | 31.5 | 121.1 | (51.6 | ) | ||||||||
Net income (loss) | $ | (58.8 | ) | $ | 177.1 | $ | (84.3 | ) | ||||
Net income (loss) per common share: | ||||||||||||
Basic | $ | (0.75 | ) | $ | 0.65 | $ | (0.87 | ) | ||||
Diluted | $ | (0.75 | ) | $ | 0.65 | $ | (0.87 | ) | ||||
Weighted average shares used in calculating net income (loss) per common share: | ||||||||||||
Basic | 102,062,051 | 100,160,206 | 96,806,885 | |||||||||
Diluted | 102,062,051 | 100,160,206 | 96,806,885 | |||||||||
Consolidated statements of comprehensive income (loss) | ||||||||||||
Net income (loss) | (58.8 | ) | 177.1 | (84.3 | ) | |||||||
Other comprehensive loss: | ||||||||||||
Foreign currency translation adjustments | 1.2 | (0.4 | ) | (0.7 | ) | |||||||
Comprehensive income (loss) | $ | (57.6 | ) | $ | 176.7 | $ | (85.0 | ) | ||||
Basic: | ||||||||||||
Net income (loss) | $ | (58.8 | ) | $ | 177.1 | $ | (84.3 | ) | ||||
Less dividends on preferred shares | (17.7 | ) | (62.7 | ) | — | |||||||
Less income allocated to preferred shareholders | — | (49.0 | ) | — | ||||||||
Net income (loss) available/allocated to common shareholders - basic | $ | (76.5 | ) | $ | 65.4 | $ | (84.3 | ) | ||||
Diluted: | ||||||||||||
Net income (loss) | $ | (58.8 | ) | $ | 177.1 | $ | (84.3 | ) | ||||
Less dividends on preferred shares | (17.7 | ) | (62.7 | ) | — | |||||||
Less income allocated to preferred shareholders | — | (49.0 | ) | — | ||||||||
Net income (loss) available/allocated to common shareholders - diluted | $ | (76.5 | ) | $ | 65.4 | $ | (84.3 | ) | ||||
See accompanying notes to consolidated financial statements.
F-4
R1 RCM Inc.
Consolidated Statements of Stockholders’ Equity (Deficit)
(In millions, except per share data)
Common Stock | Treasury Stock | Additional Paid-In Capital | Accumulated Deficit | Accumulated other comprehensive (loss) | Total | |||||||||||||||||||||||||
Shares | Amount | Shares | Amount | |||||||||||||||||||||||||||
Balance at January 1, 2015 | 102,890,241 | $ | 1.0 | (4,778,222 | ) | $ | (51.1 | ) | $ | 307.1 | $ | (397.5 | ) | $ | (1.8 | ) | $ | (142.2 | ) | |||||||||||
Share-based compensation expense | — | — | — | — | 29.2 | — | — | 29.2 | ||||||||||||||||||||||
Deferred tax asset write off including windfall of $0 million | — | — | — | — | (15.3 | ) | — | — | (15.3 | ) | ||||||||||||||||||||
Issuance of common stock related to share-based compensation plans | 8,994,729 | 0.1 | — | — | (0.1 | ) | — | — | — | |||||||||||||||||||||
Exercise of vested stock options | 1,374,438 | — | — | — | 1.5 | — | — | 1.5 | ||||||||||||||||||||||
Treasury stock purchases | — | — | (765,750 | ) | (1.6 | ) | — | — | — | (1.6 | ) | |||||||||||||||||||
Foreign currency translation adjustments | — | — | — | — | — | — | (0.7 | ) | (0.7 | ) | ||||||||||||||||||||
Net income (loss) | — | — | — | — | — | (84.3 | ) | — | (84.3 | ) | ||||||||||||||||||||
Balance at December 31, 2015 | 113,259,408 | 1.1 | (5,543,972 | ) | (52.7 | ) | 322.5 | (481.8 | ) | (2.5 | ) | (213.3 | ) | |||||||||||||||||
Share-based compensation expense | — | — | — | — | 30.2 | — | — | 30.2 | ||||||||||||||||||||||
Deferred tax asset write off including shortfall of $3.5 million | — | — | — | — | (10.6 | ) | — | — | (10.6 | ) | ||||||||||||||||||||
Issuance of common stock related to share-based compensation plans | 3,071,876 | 0.1 | — | — | (0.1 | ) | — | — | — | |||||||||||||||||||||
Exercise of vested stock options | 94,240 | — | — | — | 0.2 | — | — | 0.2 | ||||||||||||||||||||||
Beneficial conversion feature | — | — | — | — | 48.3 | — | — | 48.3 | ||||||||||||||||||||||
Issuance of stock warrants | — | — | — | — | 21.4 | — | — | 21.4 | ||||||||||||||||||||||
Dividends paid/accrued on preferred stock | — | — | — | — | (14.4 | ) | — | — | (14.4 | ) | ||||||||||||||||||||
Deemed preferred stock dividend | — | — | — | — | (48.3 | ) | — | — | (48.3 | ) | ||||||||||||||||||||
Treasury stock purchases | — | — | (4,222,010 | ) | (2.5 | ) | — | — | — | (2.5 | ) | |||||||||||||||||||
Foreign currency translation adjustments | — | — | — | — | — | — | (0.4 | ) | (0.4 | ) | ||||||||||||||||||||
Net income (loss) | — | — | — | — | — | 177.1 | — | 177.1 | ||||||||||||||||||||||
Balance at December 31, 2016 | 116,425,524 | 1.2 | (9,765,982 | ) | (55.2 | ) | 349.2 | (304.7 | ) | (2.8 | ) | (12.3 | ) | |||||||||||||||||
Impact of adoption of Topic 606 | — | — | — | — | — | 113.4 | — | 113.4 | ||||||||||||||||||||||
Impact of adoption of ASU 2016-09 | — | — | — | — | 1.5 | (0.9 | ) | — | 0.6 | |||||||||||||||||||||
Adjusted Balance at January 1, 2017 | 116,425,524 | 1.2 | (9,765,982 | ) | (55.2 | ) | 350.7 | (192.2 | ) | (2.8 | ) | 101.7 | ||||||||||||||||||
Share-based compensation expense | — | — | — | — | 11.2 | — | — | 11.2 | ||||||||||||||||||||||
Issuance of common stock related to share-based compensation plans | 155,535 | — | — | — | — | — | — | — | ||||||||||||||||||||||
Exercise of vested stock options | 69,329 | — | — | — | 0.2 | — | — | 0.2 | ||||||||||||||||||||||
Dividends paid/accrued on preferred stock | — | — | — | — | (17.7 | ) | — | — | (17.7 | ) | ||||||||||||||||||||
Acquisition of treasury stock related to equity award plans | — | — | (1,640,005 | ) | (4.4 | ) | — | — | — | (4.4 | ) | |||||||||||||||||||
Treasury stock purchases and forfeitures | — | — | (834,440 | ) | — | — | — | — | — | |||||||||||||||||||||
Reclassification of excess share-based compensation | — | — | — | — | (6.5 | ) | 6.5 | — | — | |||||||||||||||||||||
Foreign currency translation adjustments | — | — | — | — | — | — | 1.2 | 1.2 | ||||||||||||||||||||||
Net (loss) income | — | — | — | — | — | (58.8 | ) | — | (58.8 | ) | ||||||||||||||||||||
Balance at December 31, 2017 | 116,650,388 | $ | 1.2 | (12,240,427 | ) | $ | (59.6 | ) | $ | 337.9 | $ | (244.5 | ) | $ | (1.6 | ) | $ | 33.4 | ||||||||||||
See accompanying notes to consolidated financial statements.
F-5
R1 RCM Inc.
Consolidated Statements of Cash Flows
(In millions)
Year Ended December 31, | ||||||||||||
2017 | 2016 | 2015 | ||||||||||
Operating activities | ||||||||||||
Net income (loss) | $ | (58.8 | ) | $ | 177.1 | $ | (84.3 | ) | ||||
Adjustments to reconcile net income (loss) to net cash used in operations: | ||||||||||||
Depreciation and amortization | 16.3 | 10.2 | 8.5 | |||||||||
Share-based compensation | 10.7 | 29.8 | 29.2 | |||||||||
Loss on disposal | 0.2 | 0.2 | — | |||||||||
Allowance for doubtful accounts | 0.3 | — | — | |||||||||
Deferred income taxes | 29.7 | 121.8 | (52.7 | ) | ||||||||
Reimbursed tenant improvements | — | 1.4 | — | |||||||||
Changes in operating assets and liabilities: | ||||||||||||
Accounts receivable and related party accounts receivable | (13.0 | ) | 4.4 | (5.7 | ) | |||||||
Restricted cash equivalents | — | — | (1.5 | ) | ||||||||
Prepaid income taxes | 3.2 | (2.8 | ) | 5.1 | ||||||||
Prepaid expenses and other assets | (5.8 | ) | (6.9 | ) | (7.5 | ) | ||||||
Accounts payable | (0.3 | ) | 1.2 | (7.2 | ) | |||||||
Accrued compensation and benefits | 12.9 | 15.7 | (5.9 | ) | ||||||||
Other liabilities | 1.5 | 1.1 | 0.3 | |||||||||
Customer liabilities and customer liabilities - related party | 24.0 | (440.1 | ) | 97.9 | ||||||||
Net cash provided by (used in) operating activities | 20.9 | (86.9 | ) | (23.8 | ) | |||||||
Investing activities | ||||||||||||
Purchases of property, equipment, and software | (33.6 | ) | (12.6 | ) | (21.3 | ) | ||||||
Proceeds from maturation of short-term investments | — | 1.0 | — | |||||||||
Purchase of short-term investments | — | — | (1.0 | ) | ||||||||
Net cash used in investing activities | (33.6 | ) | (11.6 | ) | (22.3 | ) | ||||||
Financing activities | ||||||||||||
Series A convertible preferred stock and warrant issuance, net of issuance costs | — | 178.7 | — | |||||||||
Exercise of vested stock options | 0.2 | 0.2 | 1.5 | |||||||||
Purchase of treasury stock | (2.5 | ) | (0.4 | ) | — | |||||||
Shares withheld for taxes | (1.9 | ) | (2.0 | ) | (1.6 | ) | ||||||
Restricted cash release from letter of credit | — | — | 5.0 | |||||||||
Net cash (used in) provided by financing activities | (4.2 | ) | 176.5 | 4.9 | ||||||||
Effect of exchange rate changes in cash | 0.6 | (0.3 | ) | (0.5 | ) | |||||||
Net increase (decrease) in cash and cash equivalents | (16.3 | ) | 77.7 | (41.7 | ) | |||||||
Cash and cash equivalents, at beginning of period | 181.2 | 103.5 | 145.2 | |||||||||
Cash and cash equivalents, at end of period | $ | 164.9 | $ | 181.2 | $ | 103.5 | ||||||
Supplemental disclosures of cash flow information | ||||||||||||
Accrued dividends payable to Preferred Stockholders | $ | 4.5 | $ | 4.2 | $ | — | ||||||
Accrued liabilities related to purchases of property, equipment and software | $ | 1.1 | $ | 2.5 | $ | 0.4 | ||||||
Accounts payable related to purchases of property, equipment and software | $ | 1.4 | $ | 2.0 | $ | 0.6 | ||||||
Income taxes paid | $ | (1.6 | ) | $ | (1.2 | ) | $ | (1.1 | ) | |||
Income taxes refunded | $ | 3.5 | $ | 0.7 | $ | 1.4 | ||||||
See accompanying notes to consolidated financial statements.
F-6
R1 RCM Inc.
Notes to Consolidated Financial Statements
1. Description of Business
R1 RCM Inc. (the "Company") is a leading provider of revenue cycle management ("RCM") services to healthcare providers. Our technology-enabled services help healthcare providers generate sustainable improvements in their operating margins and cash flows while also enhancing patient, physician and staff satisfaction for our customers. The Company achieves these results for its customers by managing healthcare providers’ revenue cycle operations, which encompass processes including patient registration, insurance and benefit verification, medical treatment documentation and coding, bill preparation and collections from patients and payers. The Company does so by deploying a unique operating model that leverages its extensive healthcare site experience, innovative technology and process excellence.
The Company's primary service offering consists of end-to-end RCM, which encompasses patient registration, insurance and benefit verification, medical treatment documentation and coding, bill preparation and collections. The Company deploys its RCM services through an operating partner relationship or a co-managed relationship. Under an operating partner relationship, the Company provides comprehensive revenue cycle infrastructure to providers, including all revenue cycle personnel, technology and process workflow. Under a co-managed relationship, the Company leverages its customers’ existing RCM staff and processes, and supplements them with the Company's infused management, subject matter specialists, proprietary technology and other resources.
The Company also offers modular services, allowing customers to engage the Company for only specific components of its end-to-end RCM service offering, such as PAS and revenue capture. The Company's PAS offering assists hospitals in complying with payer requirements regarding whether to classify a hospital visit as an in-patient or an out-patient observation case for billing purposes. The Company's revenue capture offering includes charge capture, charge description master ("CDM") maintenance and pricing services that help providers ensure they are capturing the maximum net compliant revenue for services delivered.
Ascension
On February 16, 2016, the Company entered into a long-term strategic partnership with Ascension Health Alliance, the parent of the Company's largest customer and the nation’s largest Catholic and non-profit health system, and TowerBrook Capital Partners ("TowerBrook"), an investment management firm (the "Transaction"). As part of the Transaction, the Company amended and restated its Master Professional Services Agreement ("A&R MPSA") with Ascension Health ("Ascension") effective February 16, 2016 with a term of ten years. Pursuant to the A&R MPSA and with certain limited exceptions, the Company is the exclusive provider of RCM services and PAS with respect to acute care services provided by the hospitals affiliated with Ascension that execute supplement agreements with the Company.
In May 2017, we announced the expansion of our relationship with Ascension. The expanded relationship adds a health system which was acquired by Ascension after the signing of the A&R MPSA and increases the scope of our contract by adding physician RCM services for all Ascension ministries in Wisconsin.
2. Summary of Significant Accounting Policies
Basis of Presentation
The consolidated financial statements include the assets, liabilities and results of operations of the Company and its wholly owned subsidiaries. All material intercompany transactions and balances have been eliminated in consolidation. The preparation of financial statements in conformity with the United States generally accepted accounting principles ("GAAP") requires management to make estimates and assumptions that affect the amounts reported in these consolidated financial statements and accompanying notes. Actual results can differ from those estimates.
F-7
R1 RCM Inc.
Notes to Consolidated Financial Statements
Beginning with the quarter ended March 31, 2017, the Company changed the presentation in its financial statements to be stated in millions instead of thousands. Therefore, previously reported amounts may differ due to rounding.
Segments
Reporting segments are identified as components of an enterprise about which separate discrete financial information is available for evaluation by the chief operating decision maker, or decision-making group, relating to resource allocation and performance assessments. All of the Company’s operations are organized around the single business of providing revenue cycle operations for U.S-based hospitals and other medical providers. The Company views its operations and manages its business as one operating and reporting segment.
Revenue Recognition
Periods prior to January 1, 2017
Revenue is generally recognized when all of the following criteria are met: (i) persuasive evidence of an arrangement exists, (ii) services have been rendered, (iii) the fee is fixed or determinable and (iv) collectability is reasonably assured.
Net service fees, as reported in the consolidated statement of operations and comprehensive income (loss), consist of: (a) RCM services fees and (b) professional service fees earned on a fixed fee, transactional fee or time and materials basis. The Company’s primary source of revenue is RCM services fees. RCM services fees are primarily contingent, but along with fixed fees are generally viewed as one deliverable. To the extent that certain RCM services fees are fixed and not subject to refund, adjustment or concession, such fees are generally recognized as revenue on a straight-line basis over the term of the contract.
On a limited basis, the Company enters into contracts with multiple accounting elements which may include a combination of fixed fee or transactional fee elements. The selling price of each element is determined by using management's best estimate of selling price. Revenues are recognized in accordance with the accounting policies for the separate elements.
RCM services fees that are contingent in nature are recognized as revenue once all the criteria for revenue recognition are met, which is generally at the end of a contract or other contractual agreement event. Revenue is recognized for RCM services fees upon the contract reaching the end of its stated term (such that the contractual relationship will not continue in its current form) to the extent that: (i) cash has been received for invoiced fees and (ii) there are no disputes at the conclusion of the term of the contract.
If fees or services are disputed by a customer at the end of a contract, a settlement agreement entered into with the customer triggers revenue recognition. An other "contractual agreement event" occurs when a renewal, amendment to an existing contract, or other settlement agreement is executed in which the parties reach agreement on prior fees. Revenue is recognized up to the amount covered by such agreements.
RCM services fees consist of the following contingent fees: (i) Net Operating Fees and (ii) Incentive Fees.
Net Operating Fees
The Company generates net operating fees to the extent the Company is able to assist customers in reducing the cost of revenue cycle operations. In limited cases, the Company earns a fixed fee instead of a fee based on the mechanics described below. The Company’s net operating fees consist of:
i) gross base fees invoiced to customers; less
F-8
R1 RCM Inc.
Notes to Consolidated Financial Statements
ii) corresponding costs of customers’ revenue cycle operations which the Company pays pursuant to its RCM agreements, including salaries and benefits for the customers' RCM personnel, and related third-party vendor costs; less
iii) any cost savings the Company shares with customers.
Net operating fees are recorded as deferred customer billings until the Company recognizes revenue for a customer contract at the end of a contract or reaches an "other contractual agreement event". The amount of unpaid costs of customers’ revenue cycle operations and shared cost savings are reported as accrued service costs within customer liabilities in the consolidated balance sheets.
Incentive Fees
The Company generates revenue in the form of performance-based fees when the Company improves the customers’ financial or operational metrics. These performance metrics vary by customer contract. However, certain contracts contain a contract-to-date performance metric that is not resolved until the end of the term of the contract.
Periods commencing January 1, 2017
Nature of Goods and Services
The Company's primary source of revenue is its end-to-end RCM services fees. The Company also generates revenue through its modular RCM services, where customers will engage the Company for only specific components of its end-to-end RCM service offering on a fixed-fee or transactional basis, as well as its PAS offering.
Revenue Cycle Management
RCM services fees are primarily variable and performance related, and are generally viewed as the consideration earned in satisfaction of a single performance obligation. RCM services fees consist of net operating fees, incentive fees, and other fees.
Net Operating Fees
The Company’s net operating fees consist of:
i) gross base fees invoiced to customers; less
ii) corresponding costs of customers’ revenue cycle operations which the Company pays pursuant to its RCM agreements, including salaries and benefits for the customers' RCM personnel, and related third-party vendor costs.
The Company recognizes revenue related to net operating fees ratably as the performance obligation for the RCM services is satisfied. Base fees are typically billed in advance of the quarter and paid in three monthly payments as the Company performs and the customer simultaneously receives and consumes the benefits provided by the services provided. The costs of customers’ revenue cycle operations which the company pays pursuant to its RCM agreements are accrued based on the service period.
Incentive Fees
The Company recognizes revenue related to incentive fees ratably as the performance obligation for RCM services is satisfied, to the extent that it is probable that a significant reversal of cumulative revenue will not occur once the uncertainty is resolved. Incentive fees are structured to reflect quarterly or annual,
F-9
R1 RCM Inc.
Notes to Consolidated Financial Statements
performance and are evaluated on a contract-by-contract basis. Incentive fees are typically billed and paid on a quarterly basis.
RCM Other
The Company recognizes revenue related to other RCM Other fees as RCM services are provided. These services typically consist of the Company's modular RCM services offering, which consists of an obligation to provide services for a specific component of its end-to-end RCM service offering. Fees are typically variable in nature with the entire amount being included in revenue in the month of service. The customer simultaneously receives and consumes the benefits provided by the services and the fees are typically billed on a monthly basis with payment terms of up to 30 days. To the extent that certain service fees are fixed and not subject to refund, adjustment or concession, these fees are generally recognized into revenue ratably as the performance obligation is satisfied.
Other Services
The Company recognizes revenue from PAS in the period in which the service is performed. The Company’s PAS arrangements typically consist of an obligation to provide specific services to customers on a when and if needed basis. These services are provided under a fixed price per unit arrangement. These contracts are evaluated on a contract-by-contract basis. Fees for the Company's PAS arrangements are typically billed on a monthly basis with 30 to 60 day payment terms.
Bundled Services
Modular RCM services may be sold separately or bundled in a contract and end-to-end RCM services are typically sold separately but may be bundled with PAS services. PAS services are commonly sold separately. The typical length of an end-to-end RCM contract is three to ten years (subject to the parties' respective termination rights) but varies from customer to customer. PAS and modular RCM agreements generally vary in length between one and three years.
For bundled arrangements, the Company accounts for individual services as a separate performance obligation if a service is separately identifiable from other items in the bundled arrangement and if a customer can benefit from it on its own or with other resources that are readily available to the customer. The transaction price is allocated between separate services in a bundle based on their relative standalone selling prices. The standalone selling prices are determined based on the prices at which the Company separately sells its RCM, PAS, or modular services. PAS services are provided at a customer’s election but do not represent material rights as the services are priced at standalone selling price throughout the life of the agreement. In certain situations, the Company allocates variable consideration to a distinct service, or services, within a contract. The Company allocates variable payments to one or more, but not all, of the distinct services in a contract when (i) the variable payment relates specifically to the Company’s efforts to transfer the distinct service and (ii) the variable payment is for an amount that depicts the amount of consideration to which the Company expects to be entitled in exchange for transferring the promised services to its customer.
Cost of Services
Costs associated with generating the Company’s net services revenue, including the cost of operating its shared services centers, are expensed as incurred. Cost of services consist of (i) infused management, on site revenue cycle employees and technology costs, (ii) shared services costs and (iii) other costs to perform PAS. Infused management and technology costs consist primarily of wages, bonuses, benefits, share-based compensation, travel and other costs associated with deploying the Company’s employees at customer sites to help manage the Company’s customers’ revenue cycle operations. The other significant portion of such expenses is an allocation of the costs associated with maintaining, improving and deploying our integrated proprietary technology suite. Shared services costs relate to the Company’s shared services centers in the U.S. and India that perform patient scheduling and pre-registration, medical transcription, cash posting, reconciliation of payments to billing records, patient follow-up and Medicaid eligibility determination for our customers. The Company incurs expenses related to
F-10
R1 RCM Inc.
Notes to Consolidated Financial Statements
salaries and benefits for employees in its shared services centers and non-payroll costs associated with operating its shared services centers. Other expenses consist of costs related to managing PAS and other services. These expenses consist primarily of wages, bonuses, benefits, share-based compensation and facilities costs.
Comprehensive Income (Loss)
Comprehensive income (loss) is the net income (loss) of the Company combined with other changes in stockholders’ equity (deficit) not involving ownership interest changes. For the Company, such changes are foreign currency translation adjustments.
Cash and Cash Equivalents
The Company considers all highly liquid investments with a maturity of three months or less when purchased to be cash equivalents.
Restricted Cash Equivalents
In 2016 and 2017, restricted cash equivalents represent the amount of certificate of deposits ("CDs"), with a maturity of three months or less, that the Company is unable to access for operational purposes as the CDs collateralize the Company's corporate travel program. At December 31, 2016 and December 31, 2017, the Company had $1.5 million in restricted cash equivalents.
Accounts Receivable and Allowance for Doubtful Accounts
Accounts receivable is comprised of unpaid balances pertaining to modular services and end-to-end RCM customers and for periods prior to January 1, 2017, net receivable balances for end-to-end RCM customers after considering cost reimbursements owed to such customers, including related accrued balances.
The Company maintains an estimated allowance for doubtful accounts to reduce its accounts receivable to the amount that it believes will be collected. This allowance is based on the Company’s historical experience, its assessment of each customer’s ability to pay, the length of time a balance has been outstanding, input from key customer resources assigned to each customer and the status of any ongoing operations with each applicable customer.
Property, Equipment and Software
Property, equipment and software are stated at cost, and related depreciation and amortization are calculated on the straight-line method over the estimated useful lives of the assets.
The Company capitalizes qualifying internal and third-party costs and hardware and software costs related to the Company’s software development activities in accordance with ASC 350-40. The Company amortizes the capitalized software development costs over their estimated life on a straight-line basis.
The major classifications of property, equipment and software and their expected useful lives are as follows:
Computers and other equipment | 3 years | |
Leasehold improvements | Shorter of 10 years or lease term | |
Office furniture | 5 years | |
Software | 3 to 5 years | |
Impairment of Long-Lived Assets
F-11
R1 RCM Inc.
Notes to Consolidated Financial Statements
Property, equipment, software and other acquired intangible assets are reviewed for impairment whenever events or changes in circumstances indicate that the carrying amount of the asset may not be recoverable. If circumstances require a long-lived asset or asset group be reviewed for possible impairment, the Company first compares undiscounted cash flows expected to be generated by each asset or asset group to its carrying value. If the carrying value of the long-lived asset or asset group is not recoverable on an undiscounted cash flow basis, an impairment charge is recognized to the extent that the carrying value exceeds the fair value. There was no impairment of property, equipment, software or other acquired intangible assets for the years ended December 31, 2017, 2016 and 2015.
Income Taxes
Income taxes are accounted for under the asset and liability method. Deferred tax assets and liabilities are recognized for the future tax consequences attributable to differences between the financial statement carrying amounts of existing assets and liabilities and their respective tax basis and operating loss and tax credit carry forwards. Deferred tax assets and liabilities are measured using current tax laws and enacted tax rates in effect for the years in which those temporary differences are expected to be recovered or settled. The effect on deferred tax assets and liabilities of a change in tax rates is recognized in income in the period that includes the enactment date. The Company records a valuation allowance for deferred tax assets if, based upon the weight of all available evidence, both positive and negative, it is more likely than not that some or all of the deferred tax assets will not be realized.
The Company recognizes the tax benefit from an uncertain tax position only if it is more likely than not that the tax position will be sustained upon examination by the tax authorities, based on the technical merits of the position. The tax benefits recognized in the consolidated financial statements from such a position are measured based on the largest amount of benefit that has a greater than 50% percent likelihood of being realized upon ultimate settlement. Interest and penalties relating to income taxes are recognized in our income tax provision in the consolidated statements of operations and comprehensive income (loss).
The Tax Cut and Jobs Act (the "Tax Act") was enacted on December 22, 2017 and requires a U.S. shareholder of a foreign corporation to include Global Intangible Low-Taxed Income ("GILTI") in taxable income. The accounting policy of the Company is to record any tax on GILTI in the provision for income taxes in the year it is incurred.
Legal and Other Contingencies
In the normal course of business, the Company is subject to regulatory investigations or legal proceedings, as well as demands, claims and threatened litigation. The Company records an estimated loss for any claim, lawsuit, investigation or proceeding when it is probable that a liability has been incurred and the amount of the loss can be reasonably estimated. Significant judgment is required in both the determination of the probability and whether the loss can be reasonably estimated. Actual expenses could differ from such estimates.
Foreign Currency Translation and Transaction Gains (Losses)
Assets and liabilities of non-U.S. subsidiaries that operate in a local currency environment, where such local currency is the functional currency, are translated to U.S. dollars at exchange rates in effect at the balance sheet date. Income and expense accounts are translated at average exchange rates during the year which approximates the rates in effect at the transaction dates. The resulting translation adjustments are recorded as a separate component of accumulated other comprehensive income (loss).
The Company’s foreign currency transaction gains and losses are included in selling, general and administrative in the accompanying consolidated statements of operations and comprehensive income (loss).
Share-Based Compensation Expense
F-12
R1 RCM Inc.
Notes to Consolidated Financial Statements
The Company determines the expense for all employee share-based compensation awards by estimating their fair value and recognizing such value as an expense, on a ratable basis, in the consolidated financial statements over the requisite service period in which the employees earn the awards. The fair value of performance and service condition stock options is calculated using the Black-Scholes option pricing model and, for market condition stock awards, the fair value is estimated using Monte Carlo simulations.
As of January 1, 2017, the Company adopted ASU No. 2016-09, Compensation-Stock Compensation (Topic 718): Improvements to Employee Share-Based Payment Accounting ("ASU 2016-09"). The Company elected to change its accounting policy to account for forfeitures as they occur under the new standard. The change was applied on a modified retrospective basis with a cumulative effect adjustment recorded. Prior to January 1, 2017, the Company applied an estimated forfeiture rate derived from its historical data and estimates of the likely future actions of option holders when recognizing the share-based compensation expense of the options. Excess tax benefits and shortfalls for share-based payments are now included in operating activities rather than in financing activities. The changes have been applied prospectively in accordance with ASU 2016-09 and prior periods have not been adjusted.
To determine the fair value of a share-based award using the Black-Scholes option pricing model, the Company makes assumptions regarding the risk-free interest rate, expected future volatility and expected life of the award. These inputs are subjective and generally require significant analysis and judgment to develop. The Company aggregates all employees into one pool based on the grant date for valuation purposes. The risk-free rate is based on the U.S. treasury yield curve in effect at the time of grant. The Company estimates the expected volatility of the share price by reviewing the historical volatility levels of its common stock in conjunction with that of public companies that operate in similar industries or are similar in terms of stage of development or size and then projecting this information toward its future expected volatility. The Company exercises judgment in selecting these companies, as well as in evaluating the available historical and implied volatility for these companies. The Company calculates the expected term in years for each stock option using a simplified method based on the average of each option’s vesting term and original contractual term. The simplified method was used due to the lack of sufficient historical data available to provide a reasonable basis upon which to estimate the expected term of each stock option.
To determine the fair value of a share-based award using Monte Carlo simulations, the Company makes assumptions regarding the risk-free interest rate, expected future volatility, expected dividend yield and performance period. The risk-free rate is based on the U.S. treasury yield curve in effect at the time of grant. The Company estimates the expected volatility of the share price by reviewing the historical volatility levels of its common stock in conjunction with that of public companies that operate in similar industries or are similar in terms of stage of development or size and then projecting this information toward its future expected volatility. Dividend yield is determined based on the Company’s future plans to pay dividends. The Company had no plans to do so at December 31, 2017. The Company calculates the performance period based on the specific market condition to be achieved and derived from historical data and estimates of future performance.
The Company recognizes compensation expense, net of forfeitures, using a straight-line method over the applicable service or performance period. During each quarter, the share-based compensation expense is adjusted to reflect all expense for options that vested during the period; however, compensation expense already recognized is not adjusted if market conditions are not met.
The Company accounts for stock options issued to non-employees based on their estimated fair value determined using the Black-Scholes option pricing model. The stock options issued to non-employees vest over the arrangement period. The fair value of the equity awards granted to non-employees is remeasured on each balance sheet date until the awards vest, and the related expense is adjusted based on the resulting changes in fair value, if any. The non-employee share-based compensation expense is recognized over the performance period, which is the vesting period. Upon vesting, the performance of the non-employee is deemed complete and the vested awards are not subsequently remeasured.
The fair value of modifications to share-based awards is generally estimated using the Black-Scholes option pricing model. If a share-based compensation award is modified after the grant date, incremental
F-13
R1 RCM Inc.
Notes to Consolidated Financial Statements
compensation expense, if any, is recognized in an amount equal to the excess of the fair value of the modified award over the fair value of the original award immediately before the modification. Incremental compensation expense for vested awards is recognized immediately. For unvested awards, the sum of the incremental compensation expense and the remaining unrecognized compensation expense for the original award on the modification date is recognized over the modified service period.
Treasury Stock
The Company records treasury stock at the cost to acquire such shares, including commissions paid to brokers. Treasury stock is included as a component of stockholders’ equity (deficit).
Earnings (Loss) Per Share
Basic net income per share is computed by dividing net income, less any dividends, accretion or decretion, redemption or induced conversion on the Preferred Stock, by the weighted average number of common shares outstanding during the period. As the Preferred Stock (as defined in Note 9) participates in dividends alongside the Company’s common stock (per their participating dividends), the Preferred Stock would constitute participating securities under ASC 260-10 and are applied to earnings per share using the two-class method. Under this method, all earnings (distributed and undistributed) are allocated to common shares and participating securities based on their respective rights to receive dividends.
3. Recent Accounting Pronouncements
Recently Issued Accounting Standards and Disclosures
In February 2016, the FASB issued ASU No. 2016-02, Leases (Topic 842) ("ASU 2016-02"), which supersedes existing guidance on accounting for leases in Topic 840, Leases. ASU 2016-02 generally requires all leases to be recognized in the consolidated balance sheet. The provisions of ASU 2016-02 are effective for reporting periods beginning after December 15, 2018; early adoption is permitted. The provisions of ASU 2016-02
are to be applied using a modified retrospective approach. The Company is currently evaluating the impact of the adoption of this prospective guidance on its consolidated financial statements.
In November 2016, the FASB issued ASU 2016-18, Statement of Cash Flows (Topic 230): Restricted Cash ("ASU 2016-18"). ASU 2016-18 is intended to reduce diversity in practice in the classification and presentation of changes in restricted cash on the Consolidated Statement of Cash Flows. ASU 2016-18 requires that the Consolidated Statement of Cash Flows explain the change in total cash and cash equivalents and amounts generally described as restricted cash or restricted cash equivalents when reconciling the beginning-of-period and end-of-period total amounts. ASU 2016-18 also requires a reconciliation between the total of cash and cash equivalents and restricted cash presented in the Consolidated Statement of Cash Flows and the cash and cash equivalents balance presented in the Consolidated Balance Sheet. The guidance is effective for interim and annual periods beginning after December 15, 2017, and early adoption is permitted. The guidance requires application using a retrospective transition method. The Company is currently evaluating the impact of the adoption of this prospective guidance on its consolidated financial statements.
In August 2017, the FASB issued ASU No. 2017-12, Derivatives and Hedging (Topic 815): Targeted Improvements to Accounting for Hedging Activities ("ASU 2017-12"). ASU 2017-12 is intended to improve the financial reporting of hedging relationships in order to better portray the economic results of an entity's risk management activities in its financial statements. The guidance is effective for interim and annual periods beginning after December 15, 2018. On January 1, 2018, we adopted ASU 2017-12. The adoption of ASU 2017-12 did not have a material effect on our consolidated financial statements.
On December 22, 2017, the Securities and Exchange Commission's Office of the Chief Accountant published Staff Accounting Bulletin No. 118 (SAB 118), which provides guidance on reporting for accounting impacts of the recently enacted tax reform legislation. SAB 118 permits the Company to provide reasonable
F-14
R1 RCM Inc.
Notes to Consolidated Financial Statements
estimates for the income tax effects of the Tax Act and to report the effects as provisional amounts in its financial statements during a limited measurement period. Under SAB 118, the measurement period may not extend beyond one year from the enactment of the Tax Act.
4. Fair Value of Financial Instruments
The Company records its financial assets and liabilities at fair value. The accounting standard for fair value (i) defines fair value as the price that would be received to sell an asset or paid to transfer a liability (an exit price) in an orderly transaction between market participants at the measurement date, (ii) establishes a framework for measuring fair value, (iii) establishes a hierarchy of fair value measurements based upon the ability to observe inputs used to value assets and liabilities, (iv) requires consideration of nonperformance risk and (v) expands disclosures about the methods used to measure fair value. The accounting standard establishes a three-level hierarchy of measurements based upon the reliability of observable and unobservable inputs used to arrive at fair value. Observable inputs are independent market data, while unobservable inputs reflect the Company’s assumptions about valuation. The three levels of the hierarchy are defined as follows:
• | Level 1: Observable inputs such as quoted prices in active markets for identical assets and liabilities; |
• | Level 2: Inputs other than quoted prices that are observable for the asset or liability, either directly or indirectly. These include quoted prices for similar assets or liabilities in active markets and quoted prices for identical or similar assets or liabilities in markets that are not active, and model-derived valuations in which all significant inputs and significant value drivers are observable in active markets; and |
• | Level 3: Valuations derived from valuation techniques in which one or more significant inputs or significant value drivers are unobservable. |
The carrying amounts of the Company’s financial instruments, which include financial assets such as cash and cash equivalents, restricted cash equivalents, accounts receivable, net, and certain other current assets, as well as financial liabilities such as accounts payable, accrued service costs, accrued compensation and benefits and certain other accrued expenses, approximate their fair values, due to the short-term nature of these instruments. The Company does not have any financial assets or liabilities that are required to be measured at fair value on a recurring basis.
Beginning in 2018, the Company entered into derivative financial instruments to reduce its exposure to changes in foreign currency exchange rates. These instruments will be recorded at fair value. To determine the fair value of these instruments, the Company will use quoted market prices and standard pricing models with inputs derived from or corroborated by observable market data. As of January 31, 2018, the notional amount of our open foreign currency forward contracts was approximately 1.1 billion Indian rupees and the fair value was a net unrealized loss of $0.1 million.
5. Accounts Receivable and Allowance for Doubtful Accounts
Accounts receivable is comprised of unpaid balances pertaining to modular services and end-to-end RCM customers and for periods prior to January 1, 2017, net receivable balances for end-to-end RCM customers after considering cost reimbursements owed to such customers, including related accrued balances.
The Company maintains an estimated allowance for doubtful accounts to reduce its accounts receivable to the amount that it believes will be collected. This allowance is based on the Company’s historical experience, its assessment of each customer’s ability to pay, the length of time a balance has been outstanding, input from key customer resources assigned to each customer, and the status of any ongoing operations with each applicable customer.
Movements in the allowance for doubtful accounts are as follows (in thousands):
F-15
R1 RCM Inc.
Notes to Consolidated Financial Statements
Year Ended December 31, | |||||||
2017 | 2016 | ||||||
Beginning balance | $ | 66 | $ | 99 | |||
Provision (recoveries) | 304 | 5 | |||||
Write-offs | (7 | ) | (38 | ) | |||
Ending balance | $ | 363 | $ | 66 | |||
6. Property, Equipment and Software
Property, equipment and software consist of the following (in millions):
December 31, 2017 | December 31, 2016 | |||||||
Computer and other equipment | $ | 28.7 | $ | 23.3 | ||||
Leasehold improvements | 22.3 | 16.0 | ||||||
Software | 44.5 | 28.1 | ||||||
Office furniture | 7.4 | 4.9 | ||||||
Property, equipment and software, gross | 102.9 | 72.3 | ||||||
Less accumulated depreciation and amortization | (54.6 | ) | (39.5 | ) | ||||
Property, equipment and software, net | $ | 48.3 | $ | 32.8 | ||||
Property, equipment and software, net, located in India was $10.1 million and $2.3 million as of December 31, 2017 and 2016, respectively. The remaining property, equipment and software was located in the U.S. as of December 31, 2017 and 2016.
During the year ended December 31, 2017 and 2016, the Company wrote-off approximately $1.2 million and $9.1 million in fully depreciated assets that were no longer in service, respectively.
The following table summarizes the allocation of depreciation and amortization expense between cost of services and selling, general and administrative expenses (in millions):
Year Ended December 31, | ||||||||||||
2017 | 2016 | 2015 | ||||||||||
Cost of services | $ | 14.5 | $ | 9.5 | $ | 7.6 | ||||||
Selling, general and administrative | 1.8 | 0.7 | 0.9 | |||||||||
Total depreciation and amortization | $ | 16.3 | $ | 10.2 | $ | 8.5 | ||||||
7. Revenue Recognition
The Company follows the guidance under Topic 606, Revenue from Contracts with Customers, (“Topic 606”). Revenue is measured based on consideration specified in a contract with a customer, and excludes any sales incentives and amounts collected on behalf of third parties. The Company recognizes revenue when it satisfies a performance obligation by transferring control over a service to a customer, which is typically over the contract term. Estimates of variable consideration are included in revenue to the extent that it is probable that a significant reversal of cumulative revenue will not occur once the uncertainty is resolved. See Note 2, Summary of Significant Accounting Polices, for further discussion.
F-16
R1 RCM Inc.
Notes to Consolidated Financial Statements
Disaggregation of Revenue
In the following table, revenue is disaggregated by source of revenue (in millions):
Year Ended December 31, | ||||||||
2017 | 2016 | |||||||
RCM services: net operating fees | $ | 374.8 | $ | 368.8 | ||||
RCM services: incentive fees | 29.0 | 191.3 | ||||||
RCM services: other | 13.6 | 16.3 | ||||||
Other services fees | 32.4 | 16.1 | ||||||
Total net service revenue | $ | 449.8 | $ | 592.6 | ||||
Contract Balances
The following table provides information about receivables, contracts assets, and contract liabilities from contracts with customers (in millions):
December 31, 2017 | At adoption | |||
Receivables (1) | 23.6 | 30.5 | ||
Contract assets | — | — | ||
Contract liabilities | 15.5 | 20.9 | ||
(1) Receivables are included in accounts receivable, net. The balance includes
accounts receivable, net - related party.
The Company recognized revenue of $19.7 million for the year ended December 31, 2017, which amount was included in contract liabilities at the beginning of the period.
The Company recognized revenue of $1.9 million during the year ended December 31, 2017 related to services performed in periods prior to the parties reaching an agreement that creates enforceable rights and obligations.
The Company recognized revenue of $1.3 million for the year ended December 31, 2017 related to changes in transaction price estimates during the year for certain revenue cycle management contracts.
A receivable is recognized in the period the Company provides services when the Company’s right to consideration is unconditional. Payment terms on invoiced amounts are typically 30-60 days.
Significant changes in the contract assets and the contract liabilities balances during the year ended December 31, 2017 are as follows (in millions):
December 31, 2017 | ||||
Contract assets | Contract liabilities | |||
Revenue recognized that was included in the contract liability balance at the beginning of the period | — | 19.7 | ||
Increases due to cash received, excluding amounts recognized as revenue during the period | — | 14.3 | ||
Transferred to receivables from contract assets recognized at the beginning of the period | — | — | ||
Increases as a result of cumulative catch-up adjustment arising from changes in the estimate of the stage of completion, excluding amounts transferred to receivables during the period | — | — | ||
F-17
R1 RCM Inc.
Notes to Consolidated Financial Statements
Transaction Price Allocated to the Remaining Performance Obligation
The following table includes estimated revenue expected to be recognized in the future related to performance obligations that are unsatisfied (or partially unsatisfied) at the end of the reporting period (in millions). The estimated revenue does not include amounts of variable consideration that are constrained.
RCM | Other | ||||||||||||
Net operating fees | Incentive fees | Other | Other Services fees | ||||||||||
2018 | $ | 13.5 | $ | 10.0 | $ | 5.1 | $ | — | |||||
2019 | — | — | 3.3 | — | |||||||||
2020 | — | — | 2.8 | — | |||||||||
2021 | — | — | 2.8 | — | |||||||||
Thereafter | — | — | 11.6 | — | |||||||||
Total | $ | 13.5 | $ | 10.0 | $ | 25.6 | $ | — | |||||
The amounts presented in the table above primarily consist of fixed fees which are typically recognized ratably
as the performance obligation is satisfied or incentive fees which are measured cumulatively over the contractually defined performance period.
Estimates of revenue expected to be recognized in future periods also exclude unexercised customer options to purchase services within the Company's PAS contracts that do not represent material rights to the customer. Customer options that do not represent a material right are only accounted for in accordance with Topic 606 when the customer exercises its option to purchase additional goods or services.
The Company elected certain of the optional exemptions from the disclosure requirement for remaining performance obligations for specific situations in which an entity need not estimate variable consideration to recognize revenue. Accordingly, the Company applies the practical expedient in paragraph 606-10-55-18 to its stand-alone PAS contracts and modular RCM services and does not disclose information about variable consideration from remaining performance obligations for which the Company recognizes revenue. PAS performance obligations are typically short in duration (often less than 1 day) with any uncertainty related to the associated variable consideration resolved as each increment of service (completion of a level of care review or an appeal) is completed which reflects the value the Customer receives from the Company’s fulfillment of the performance obligation. Modular RCM services performance obligations for variable consideration are of short duration with fees corresponding to the value the customer has realized, for example, patient accounts collected on behalf of the Customer or medical record lines transcribed.
The Company also applies the guidance in paragraph 606-10-50-14A(b) to variable consideration within its end-to-end RCM contracts and does not disclose information about remaining, wholly unsatisfied performance obligations for variable consideration that the Company is able to allocate to one or more, but not-all, of the performance obligations in its contracts in accordance with paragraph 606-10-32-40. The Company’s end-to-end RCM services performance obligations are satisfied over time and are substantially the same from period to period under either a co-managed or operating partner model. Fees are variable and consist of net operating fees and incentive fees with the uncertainty related to net operating fees and certain incentive fees being resolved quarterly with the uncertainty of other incentive fees being resolved annually. The information presented in the table above includes estimates for incentive fees where the uncertainty related to the final fee is resolved on longer than a quarterly basis and to the extent the Company does not believe the associated consideration is constrained.
Changes in Accounting Policies
Except for the changes below, the Company has consistently applied the accounting policies to all periods presented in these consolidated financial statements.
F-18
R1 RCM Inc.
Notes to Consolidated Financial Statements
The Company adopted Topic 606 with a date of the initial application of January 1, 2017. As a result, the Company has changed its accounting policy for revenue recognition as detailed below.
The Company adopted Topic 606, effective January 1, 2017, using the modified retrospective method, applying Topic 606 to contracts that were not complete as of the date of initial application. Therefore, the comparative information has not been adjusted and continues to be reported under Topic 605. For contracts that were modified before the beginning of the earliest reporting period presented the Company has not retrospectively restated the contract for those modifications in accordance with the contract modification guidance in 606-10-25-12 and 25-13. The Company instead reflected the aggregate effect of those modifications when identifying the satisfied and unsatisfied performance obligations, determining the transaction price and allocating the transaction price to the satisfied and unsatisfied performance obligation. The details of the significant changes and quantitative impact of the changes are set out below.
RCM services fees
RCM services fees that are variable in nature were recognized under Topic 605 as revenue once all the criteria for revenue recognition are met, which is generally at the end of a contract or other contractual agreement event. Revenue previously has been recognized for RCM service fees upon the contract reaching the end of its stated term (such that the contract relationship will not continue in its current form) to the extent that cash has been received for invoiced fees and there are no disputes at the conclusion of the term of the contract.
Under Topic 606, the Company recognizes service fees that are variable in nature over time as the service is provided to the customer to the extent that it is probable that a significant reversal of cumulative revenue will not occur once the uncertainty related to the estimated revenue is subsequently resolved. Net operating fees are typically recognized on a quarterly basis as the RCM services are rendered and measurement of the net operating fees earned during the distinct performance period is objectively determinable. Incentive fees are calculated quarterly based upon contractually defined agreed-upon performance metrics and are recognized as revenue to the extent that it is probable that a significant reversal of cumulative revenue will not occur once any uncertainty related to the estimated revenue is subsequently resolved.
Fixed fees are generally recognized over the term of the contract on a ratable basis as the performance obligation is satisfied.
Other services fees
The PAS contract between the Company and customer typically stipulates the price per unit the Company is entitled to for each unit of service performed. Certain contracts include minimum fees and volume discounts but the Company does not know the quantity or mix of service types the customer will request until the request is made. The length of time it takes the Company to perform each service can vary depending on the nature of the service or complexity of the specific situation or case. Revenue previously had been recognized for PAS service fees when the service was completed.
Under Topic 606, the Company recognizes revenue on a monthly basis when services are completed during the month consistent with recognition under Topic 605.
Deferred contract costs
Eligible, one-time, nonrecurring fulfillment costs associated with the initial phases of the Ascension A&R MPSA and with the transition of additional Ascension hospitals under separate contracts are deferred and subsequently amortized. These costs are amortized on a straight-line basis over the expected period of benefit. Under Topic 606, the Company will continue to amortize associated assets over the remaining life of the contract as services are provided.
F-19
R1 RCM Inc.
Notes to Consolidated Financial Statements
Impacts on Financial Statements
The significant affects of adopting Topic 606 are changes to net services revenue, cost of services, accounts receivable, customer liabilities, and income taxes for the period beginning January 1, 2017 for the Company’s net operating fees and incentive fees as the Company started recognizing revenue when it satisfies a performance obligation by transferring control over a service to a customer as opposed to when a contract renewal, termination or other contractual agreement event occurs.
The following tables summarize the impacts of adopting Topic 606 on the Company’s consolidated financial statements as of and for the year ended months ended December 31, 2017 (in millions):
F-20
R1 RCM Inc.
Notes to Consolidated Financial Statements
i. | Consolidated balance sheets |
Impact of changes in accounting policies | ||||||||||||
As reported December 31, 2017 | Adjustments | Balances without adoption of Topic 606 | ||||||||||
Assets | ||||||||||||
Current assets: | ||||||||||||
Cash and cash equivalents | $ | 164.9 | $ | — | $ | 164.9 | ||||||
Accounts receivable, net | 8.2 | (0.7 | ) | 7.5 | ||||||||
Accounts receivable, net - related party | 15.4 | (10.7 | ) | 4.7 | ||||||||
Prepaid income taxes | 0.6 | — | 0.6 | |||||||||
Prepaid expenses and other current assets | 13.2 | (0.2 | ) | 13.0 | ||||||||
Total current assets | 202.3 | (11.6 | ) | 190.7 | ||||||||
Property, equipment and software, net | 48.3 | — | 48.3 | |||||||||
Non-current deferred tax assets | 70.5 | 132.6 | 203.1 | |||||||||
Restricted cash equivalents | 1.5 | — | 1.5 | |||||||||
Other assets | 13.4 | 0.2 | 13.6 | |||||||||
Total assets | $ | 336.0 | $ | 121.2 | $ | 457.2 | ||||||
Liabilities | ||||||||||||
Current liabilities: | ||||||||||||
Accounts payable | 7.2 | (0.9 | ) | 6.3 | ||||||||
Current portion of customer liabilities | 1.1 | 41.9 | 43.0 | |||||||||
Current portion of customer liabilities - related party | 27.1 | 0.2 | 27.3 | |||||||||
Accrued compensation and benefits | 37.8 | — | 37.8 | |||||||||
Other accrued expenses | 16.7 | (1.7 | ) | 15.0 | ||||||||
Total current liabilities | 89.9 | 39.5 | 129.4 | |||||||||
Non-current portion of customer liabilities | — | 0.1 | 0.1 | |||||||||
Non-current portion of customer liabilities - related party | 11.5 | 478.8 | 490.3 | |||||||||
Other non-current liabilities | 11.9 | — | 11.9 | |||||||||
Total liabilities | $ | 113.3 | $ | 518.4 | $ | 631.7 | ||||||
8.00% Series A convertible preferred stock | 189.3 | — | 189.3 | |||||||||
Stockholders’ equity (deficit) | ||||||||||||
Common stock | 1.2 | — | 1.2 | |||||||||
Additional paid-in capital | 337.9 | — | 337.9 | |||||||||
Accumulated deficit | (244.5 | ) | (397.2 | ) | (641.7 | ) | ||||||
Accumulated other comprehensive loss | (1.6 | ) | — | (1.6 | ) | |||||||
Treasury stock | (59.6 | ) | — | (59.6 | ) | |||||||
Total stockholders’ equity (deficit) | 33.4 | (397.2 | ) | (363.8 | ) | |||||||
Total liabilities and stockholders’ equity (deficit) | $ | 336.0 | $ | 121.2 | $ | 457.2 | ||||||
F-21
R1 RCM Inc.
Notes to Consolidated Financial Statements
ii. | Consolidated statements of operations and comprehensive income (loss) |
Impact of changes in accounting policies | ||||||||||||
As reported year ended December 31, 2017 | Adjustments | Balances without adoption of Topic 606 | ||||||||||
Net services revenue | $ | 449.8 | $ | (361.1 | ) | $ | 88.7 | |||||
Operating expenses: | ||||||||||||
Cost of services | 416.3 | (15.2 | ) | 401.1 | ||||||||
Selling, general and administrative | 56.3 | — | 56.3 | |||||||||
Other | 4.7 | — | 4.7 | |||||||||
Total operating expenses | 477.3 | (15.2 | ) | 462.1 | ||||||||
Income (loss) from operations | (27.5 | ) | (345.9 | ) | (373.4 | ) | ||||||
Net interest income | 0.2 | — | 0.2 | |||||||||
Income (loss) before income tax provision | (27.3 | ) | (345.9 | ) | (373.2 | ) | ||||||
Income tax provision (benefit) | 31.5 | (62.1 | ) | (30.6 | ) | |||||||
Net income (loss) | $ | (58.8 | ) | $ | (283.8 | ) | $ | (342.6 | ) | |||
Consolidated statements of comprehensive income (loss) | ||||||||||||
Net income (loss) | $ | (58.8 | ) | $ | (283.8 | ) | $ | (342.6 | ) | |||
Other comprehensive loss: | ||||||||||||
Foreign currency translation adjustments | 1.2 | — | 1.2 | |||||||||
Comprehensive income (loss) | $ | (57.6 | ) | $ | (283.8 | ) | $ | (341.4 | ) | |||
F-22
R1 RCM Inc.
Notes to Consolidated Financial Statements
iii. | Consolidated statements of cash flows |
Impact of changes in accounting policies | ||||||||||||
As reported December 31, 2017 | Adjustments | Balances without adoption of Topic 606 | ||||||||||
Operating activities | ||||||||||||
Net income (loss) | $ | (58.8 | ) | $ | (283.8 | ) | $ | (342.6 | ) | |||
Adjustments to reconcile net income (loss) to net cash used in operations: | ||||||||||||
Depreciation and amortization | 16.3 | — | 16.3 | |||||||||
Share-based compensation | 10.7 | — | 10.7 | |||||||||
Loss on disposal | 0.2 | — | 0.2 | |||||||||
Allowance for doubtful receivables | 0.3 | — | 0.3 | |||||||||
Deferred income taxes | 29.7 | (62.1 | ) | (32.4 | ) | |||||||
Reimbursed tenant improvements | — | — | — | |||||||||
Changes in operating assets and liabilities: | — | |||||||||||
Accounts receivable and related party accounts receivable | (13.0 | ) | 5.9 | (7.1 | ) | |||||||
Restricted cash equivalents | — | — | — | |||||||||
Prepaid income taxes | 3.2 | — | 3.2 | |||||||||
Prepaid expenses and other assets | (5.8 | ) | — | (5.8 | ) | |||||||
Accounts payable | (0.3 | ) | (0.9 | ) | (1.2 | ) | ||||||
Accrued compensation and benefits | 12.9 | — | 12.9 | |||||||||
Other liabilities | 1.5 | (1.7 | ) | (0.2 | ) | |||||||
Customer liabilities and customer liabilities - related party | 24.0 | 342.6 | 366.6 | |||||||||
Net cash provided by (used in) operating activities | 20.9 | — | 20.9 | |||||||||
Investing activities | ||||||||||||
Purchases of property, equipment, and software | (33.6 | ) | — | (33.6 | ) | |||||||
Proceeds from maturation of short-term investments | — | — | — | |||||||||
Purchase of short-term investments | — | — | — | |||||||||
Net cash used in investing activities | (33.6 | ) | — | (33.6 | ) | |||||||
Financing activities | ||||||||||||
Series A convertible preferred stock and warrant issuance, net of issuance costs | — | — | — | |||||||||
Exercise of vested stock options | 0.2 | — | 0.2 | |||||||||
Purchase of treasury stock | (2.5 | ) | — | (2.5 | ) | |||||||
Shares withheld for taxes | (1.9 | ) | — | (1.9 | ) | |||||||
Restricted cash release from letter of credit | — | — | — | |||||||||
Net cash (used in) provided by financing activities | (4.2 | ) | — | (4.2 | ) | |||||||
Effect of exchange rate changes in cash | 0.6 | — | 0.6 | |||||||||
Net increase (decrease) in cash and cash equivalents | (16.3 | ) | — | (16.3 | ) | |||||||
Cash and cash equivalents, at beginning of period | 181.2 | — | 181.2 | |||||||||
Cash and cash equivalents, at end of period | $ | 164.9 | $ | — | $ | 164.9 | ||||||
F-23
R1 RCM Inc.
Notes to Consolidated Financial Statements
8. Customer Liabilities
Customer liabilities include (i) accrued service costs (amounts due and accrued for cost reimbursements),
(ii) deferred customer billings (net operating fees invoiced or accrued and incentive fees collected that have not met all revenue recognition criteria), (iii) refund liabilities (amounts potentially due as a refund to the Company's customers on incentive fees), (iv) customer deposits (consisting primarily of net operating fees under the Company’s RCM contracts that are paid prior to the service period and amounts due as a refund to the Company's customers on incentive fees) and (v) Deferred Revenue (contract liabilities) (fixed or variable fees amortized to revenue over the service period). Deferred customer billings are classified as current based on the customer contract end dates or other termination events that fall within twelve months of the balance sheet dates. Accrued service cost, refund liabilities and contract liabilities are classified as current or non-current based on the anticipated period in which the liabilities are expected to be settled or the revenue is expected to be recognized.
Customer liabilities consist of the following (in millions):
December 31, | December 31, | ||||||
2017 | 2016 | ||||||
Deferred customer billings, current | $ | — | $ | 68.2 | |||
Accrued service costs, current (1) | 23.7 | 14.8 | |||||
Customer deposits, current (1) | — | 0.9 | |||||
Refund liabilities, current (1) | 0.5 | — | |||||
Deferred revenue (contract liabilities), current (1) | 4.0 | — | |||||
Current portion of customer liabilities | $ | 28.2 | $ | 83.9 | |||
Deferred customer billings, non-current (2) | $ | — | $ | 110.0 | |||
Refund liabilities, non-current | — | — | |||||
Customer deposits, non-current | — | — | |||||
Deferred revenue (contract liabilities), non-current (2) | 11.5 | 1.0 | |||||
Non current portion of customer liabilities | $ | 11.5 | $ | 111.0 | |||
Total customer liabilities | $ | 39.7 | $ | 194.9 | |||
(1) Includes $23.7 million, $0.5 million and $2.9 million in current accrued service costs, refund liabilities and deferred revenue, respectively, for a related party that are included in the current portion of customer liabilities - related party in the accompanying consolidated balance sheets at December 31, 2017. Includes $13.2 million and $1.0 million in current accrued service costs and customer deposits, respectively, for a related party that are included in the current portion of customer liabilities - related party in the accompanying consolidated balance sheet at December 31, 2016.
(2) Includes $11.5 million in deferred revenue for a related party that are included in the non-current portion of customer liabilities - related party in the accompanying consolidated balance sheet at December 31, 2017. Includes $110.0 million in deferred customer billings for a related party that are included in the non-current portion of customer liabilities - related party in the accompanying consolidated balance sheet at December 31, 2016.
9. Stockholders’ Equity (Deficit)
Preferred Stock and Warrant
The Company has 5,000,000 shares of authorized preferred stock, each with a par value of $0.01. The preferred stock may be issued from time to time in one or more series. The board of directors of the Company ("Board") is authorized to determine the rights, preferences, privileges and restrictions of the Company’s authorized but unissued shares of preferred stock. On February 16, 2016, at the close of the Transaction, the Company issued to TCP-ASC ACHI Series LLLP, a limited liability limited partnership jointly owned by Ascension Health Alliance and investment funds affiliated with TowerBrook (the "Investor"): (i) 200,000 shares of its 8.00% Series A Convertible Preferred Stock, par value $0.01 per share (the "Series A Preferred Stock" or "Preferred Stock"), for an aggregate
F-24
R1 RCM Inc.
Notes to Consolidated Financial Statements
price of $200 million and (ii) an exercisable warrant to acquire up to 60 million shares of its common stock with an exercise price of $3.50 per common share and a term of ten years. The Series A Preferred Stock is immediately convertible into shares of common stock. As of December 31, 2017 and December 31, 2016, the Company had 227,483 and 210,160 shares of Preferred Stock outstanding, respectively. See Note 13, 8.00% Series A Convertible Preferred Stock, for additional information.
Common Stock
Each outstanding share of the Company's common stock, par value $0.01 per share ("common stock"), is entitled to one vote per share on all matters submitted to a vote by shareholders. Subject to the rights of any preferred stock which may from time to time be outstanding, the holders of outstanding shares of common stock are entitled to receive dividends and, upon liquidation or dissolution, are entitled to receive pro rata all assets legally available for distribution to stockholders. No dividends were declared or paid on the common stock during 2017 or 2016.
Treasury Stock
On November 13, 2013, the Board authorized a repurchase of up to $50.0 million of the Company’s common stock in the open market or in privately negotiated transactions. The timing and amount of any shares repurchased will be determined by the Company based on its evaluation of market conditions and other factors. The repurchase program may be suspended or discontinued at any time at the sole discretion of the Board. Any repurchased shares will be available for use in connection with the Company’s stock plans and for other corporate purposes. The Company funds the repurchases from cash on hand. During the year ended December 31, 2016, the Company repurchased 158,557 shares of the Company stock for $0.4 million. During the year ended December 31, 2017, 855,474 shares were repurchased for $2.5 million. No shares have been retired. As of December 31, 2017 and December 31, 2016, the Company held in treasury 5,321,393 and 4,465,919 shares of repurchased stock, respectively.
Treasury stock also includes repurchases of Company stock related to employees’ tax withholding upon vesting of restricted shares. For the year ended December 31, 2017, the Company repurchased 784,531 shares related to employees’ tax withholding upon vesting of restricted shares. Additionally, treasury stock includes restricted stock awards that have been canceled or forfeited. See Note 10, Share-Based Compensation.
10. Share-Based Compensation
The Company maintains two stock incentive plans: the Amended and Restated Stock Option Plan (the "2006 Plan") and the Second Amended and Restated Stock 2010 Incentive Plan (the "2010 Amended Plan", together with the 2006 Plan, the "Plans"). In December 2016, the Company's stockholders approved the Second Amended and Restated 2010 Stock Incentive Plan, which authorized the issuance of an additional seventeen million shares of the Company's common stock pursuant to awards.
Under the Plans, the Company is authorized to issue up to a maximum of 46,374,756 shares of common stock. This number includes any shares that remained available for issuance under the 2006 Plan as of the date of the IPO and any shares subject to awards that were outstanding under the 2006 Plan as of the date of the IPO that expire, terminate or are otherwise surrendered, canceled, forfeited or repurchased by the Company without the issuance of shares thereunder. The Company will not make any further grants under the 2006 Plan. The 2010 Amended Plan provides for the grant of incentive stock options, non-statutory stock options, stock appreciation rights, restricted stock awards ("RSAs"), restricted stock units ("RSUs") and other share-based awards. As of December 31, 2017, 8,664,763 shares were available for future grants of awards under the 2010 Amended Plan. To the extent that previously granted awards under the 2006 Plan or 2010 Amended Plan expire, terminate or are otherwise surrendered, canceled or forfeited, the number of shares available for future awards under the 2010 Amended Plan will increase.
F-25
R1 RCM Inc.
Notes to Consolidated Financial Statements
Under the terms of the Plans, all stock options will expire if they are not exercised within ten years of their grant date. Generally all employee options, RSAs and RSUs vest ratably between one and four years.
As of January 1, 2017, the Company adopted ASU 2016-09. The Company elected to change its accounting policy to account for forfeitures as they occur under the new standard. The change was applied on a modified retrospective basis with a cumulative effect adjustment recorded to increase accumulated deficit by $0.9 million, increase additional paid-in capital by $1.5 million and increase non-current deferred tax assets by $0.6 million as of January 1, 2017. Excess tax benefits for share-based payments are now included in net cash used in operating activities rather than net cash used in financing activities. The changes have been applied prospectively in accordance with ASU 2016-09 and prior periods have not been adjusted.
Amendments related to accounting for excess tax benefits and shortfalls have been adopted prospectively, resulting in recognition of excess tax benefits and shortfalls in income tax expenses (benefit) rather than additional paid-in capital. For the year ended December 31, 2017, the Company recognized $0.9 million of income tax expense from shortfalls associated with vesting and exercises of equity awards.
In 2014 and 2013, the Company granted service-based, non-qualified options to purchase 3,400,000 and 4,703,801 shares of common stock and awarded 1,000,000 and 400,000 shares of restricted stock, respectively, to key employees pursuant to inducement grant rules of the New York Stock Exchange ("NYSE"), of which 2,903,801, 3,703,801 and 7,103,801 of the stock options were outstanding as of December 31, 2017, 2016 and 2015, respectively, and 0, 41,630 and 1,399,980 of the shares of restricted stock were outstanding as of December 31, 2017, 2016 and 2015, respectively.
The Company uses the Black-Scholes option pricing model to estimate the fair value of its service-based options as of its grant date. The Company uses the Monte Carlo simulations to estimate the fair value of its RSAs with vesting based on market-based performance conditions as of their respective grant dates. Expected life is based on the market condition to which the vesting is tied. Monte Carlo simulations are also used to estimate the fair value of its PBRSUs. The PBRSUs vest upon satisfaction of both time-based requirements and performance targets based on share price. Expected life is based on the market condition to which the vesting is tied.
The following table sets forth the significant assumptions used in the Black-Scholes option pricing model and the Monte Carlo simulations and the calculation of share-based compensation expense during 2017, 2016 and 2015:
Year Ended December 31, | ||||||
2017 | 2016 | 2015 | ||||
Expected dividend yield | — | — | — | |||
Risk-free interest rate | 1.8% to 2.38% | 1.2% to 2.06% | 1.5% to 2.0% | |||
Expected volatility | 40% - 45% | 45% - 50% | 50% | |||
Expected term (in years) | 2.34 to 6.29 | 5.96 to 6.30 | 6.25 | |||
Forfeitures | —% | 5.68% annually | 5.68% annually | |||
Total share-based compensation costs that have been included in the Company’s consolidated statements of operations were as follows (in millions):
F-26
R1 RCM Inc.
Notes to Consolidated Financial Statements
Year Ended December 31, | ||||||||||||
2017 | 2016 | 2015 | ||||||||||
Share-Based Compensation Expense Allocation Details: | ||||||||||||
Cost of services | $ | 4.5 | $ | 6.1 | $ | 7.2 | ||||||
Selling, general and administrative | 6.1 | 22.0 | 24.5 | |||||||||
Other | 0.1 | 1.8 | — | |||||||||
Total share-based compensation expense (1) | $ | 10.7 | $ | 29.9 | $ | 31.7 | ||||||
(1) Includes $0.1 million, $0.1 million and $2.4 million in share-based compensation expense paid in cash during the year ended December 31, 2017, 2016 and 2015, respectively. In addition to the share-based compensation expense recorded above, $0.5 million, $0.4 million and $0 of share-based compensation expense was capitalized to deferred contract costs for the year ended December 31, 2017, 2016 and 2015, respectively. See Note 17, Deferred Contract Costs, for further discussion.
Stock options
The following table sets forth a summary of all employee and non-employee option activity under all plans for the years ended December 31, 2017, 2016 and 2015:
Shares | Weighted- Average Exercise Price | Weighted- Average Remaining Contractual Term (in years) | Aggregate Intrinsic Value (in millions) | ||||||||||
Outstanding at January 1, 2015 | 19,924,405 | $ | 10.91 | 6.9 | $ | 9.4 | |||||||
Granted | 2,231,504 | 5.60 | |||||||||||
Exercised | (1,374,438 | ) | 1.13 | ||||||||||
Canceled/forfeited | (5,521,205 | ) | 13.17 | ||||||||||
Outstanding at December 31, 2015 | 15,260,266 | 10.23 | 7.0 | $ | 0.3 | ||||||||
Granted | 11,186,107 | 2.39 | |||||||||||
Exercised | (94,240 | ) | 1.93 | ||||||||||
Canceled/forfeited | (5,933,526 | ) | 9.22 | ||||||||||
Outstanding at December 31, 2016 | 20,418,607 | 6.26 | 7.9 | $ | 0.3 | ||||||||
Granted | 3,683,406 | 3.34 | |||||||||||
Exercised | (69,329 | ) | 2.38 | ||||||||||
Canceled/forfeited | (6,289,718 | ) | 9.01 | ||||||||||
Outstanding at December 31, 2017 | 17,742,966 | 4.70 | 7.9 | $ | 23.7 | ||||||||
Outstanding, vested and exercisable at December 31, 2015 | 11,879,209 | $ | 11.73 | 5.6 | $ | 9.4 | |||||||
Outstanding, vested and exercisable at December 31, 2016 | 7,993,168 | $ | 11.34 | 5.3 | $ | — | |||||||
Outstanding, vested and exercisable at December 31, 2017 | 5,778,376 | $ | 8.87 | 5.5 | $ | 17.7 | |||||||
The weighted-average grant date fair value of options granted during the years ended December 31, 2017, 2016 and 2015 was $1.34, $1.07 and $2.78 per share, respectively. The weighted-average grant date fair value excludes the options granted under the option exchange discussed further below. The total intrinsic value of the options exercised in the years ended December 31, 2017, 2016 and 2015 was $0.1 million, $0.1 million and $4.9 million, respectively. The total fair value of options vested during the years ended December 31, 2017, 2016 and 2015 was $4.9 millions, $15.0 million and $14.9 million, respectively.
On May 12, 2017, the Company offered certain employees and directors an opportunity to elect to exchange certain stock options for new options covering a fewer number of shares of common stock. Under this
F-27
R1 RCM Inc.
Notes to Consolidated Financial Statements
offer, the Company accepted for exchange 4,279,463 options. All surrendered options were canceled and the Company issued 1,728,795 new stock options in exchange for such tendered options. The exchange ratios were established with the intent not to generate incremental share-based compensation expense and were established just prior to commencement of the offer. The incremental compensation associated with the fluctuations in the Company’s common stock price between the date the exchange ratios were established and the commencement of the offer was insignificant.
Restricted stock awards
The following table sets forth a summary of the activity during the years ended December 31, 2017, 2016 and 2015:
Shares | Weighted- Average Grant Date Fair Value | ||||||
Outstanding and unvested at January 1, 2015 | 2,477,465 | $ | 8.71 | ||||
Granted | 8,994,729 | 3.34 | |||||
Vested | (1,892,049 | ) | 5.24 | ||||
Forfeited | (324,213 | ) | 7.61 | ||||
Outstanding and unvested at December 31, 2015 | 9,255,932 | $ | 4.24 | ||||
Granted | 3,071,876 | 2.58 | |||||
Vested | (3,361,336 | ) | 4.37 | ||||
Forfeited | (3,103,760 | ) | 4.69 | ||||
Outstanding and unvested at December 31, 2016 | 5,862,712 | $ | 3.01 | ||||
Granted | — | — | |||||
Vested | (2,675,782 | ) | 3.50 | ||||
Forfeited | (834,440 | ) | 1.52 | ||||
Outstanding and unvested at December 31, 2017 | 2,352,490 | $ | 3.03 | ||||
The total fair value of RSAs vested during the years ended December 31, 2017, 2016 and 2015 was $9.3 million, $14.7 million, and $9.9 million, respectively. The Company’s RSA agreements allow employees to deliver to the Company shares of stock upon vesting of their RSAs in lieu of their payment of the required personal employment-related taxes. The Company does not withhold taxes in excess of maximum required statutory requirements. During the years ended December 31, 2017, 2016 and 2015, employees delivered to the Company 733,769, 996,510 and 441,537 shares of stock, respectively, which the Company recorded at a cost of approximately $1.8 million, $2.2 million and$1.6 million, respectively. As of December 31, 2017, the Company held 2,263,706 shares of surrendered common stock in treasury related to the vesting of RSAs.
Forfeited and canceled RSAs are added to treasury stock. For the years ended December 31, 2017, 2016 and 2015, 834,440, 3,103,760 and 324,213 shares were added to treasury stock due to canceled RSAs, respectively.
Restricted stock units
In the fourth quarter of 2016, the Company began to grant RSUs to its employees. A summary of the activity during the years ended December 31, 2017 and 2016 is shown below:
F-28
R1 RCM Inc.
Notes to Consolidated Financial Statements
Shares | Weighted- Average Grant Date Fair Value | ||||||
Outstanding and unvested at January 1, 2016 | — | $ | — | ||||
Granted | 1,361,794 | 2.35 | |||||
Vested | — | — | |||||
Forfeited | (15,020 | ) | 2.35 | ||||
Outstanding and unvested at December 31, 2016 | 1,346,774 | $ | 2.35 | ||||
Granted | 285,527 | 2.96 | |||||
Vested | (155,535 | ) | 2.35 | ||||
Forfeited | (293,266 | ) | 2.35 | ||||
Outstanding and unvested at December 31, 2017 | 1,183,500 | $ | 2.50 | ||||
The Company's RSU agreements allow employees to surrender to the Company shares of common stock upon vesting of their RSUs in lieu of their payment of the required personal employment-related taxes. During the year ended December 31, 2017 and 2016, employees delivered to the Company 50,762 and no shares of stock, respectively, which the Company recorded at a cost of approximately $0.2 million and $0.0 million, respectively. Shares surrendered for payment of personal employment-related taxes are held in treasury.
Performance-based restricted stock units
In the third quarter of 2017, the Company began to grant performance-based RSUs ("PBRSUs" to its employees. The PBRSUs vest upon satisfaction of both time-based requirements and performance targets based on share price with certain awards vesting on December 31, 2019 and certain awards vesting on December 31, 2020. Depending on the average price of the stock for the 60 days prior to the end of the vesting period, the number of shares vesting could be between 0% and 350% of the number of PBRSUs originally granted. Based on the established price targets, 10,040,250 is the maximum number of shares that could vest.
A summary of the PBRSU activity during the year ended December 31, 2017 is shown below:
Shares | Weighted- Average Grant Date Fair Value | ||||||
Outstanding and unvested at January 1, 2017 | — | $ | — | ||||
Granted | 4,894,817 | 3.35 | |||||
Vested | — | — | |||||
Forfeited | (108,917 | ) | 2.38 | ||||
Outstanding and unvested at December 31, 2017 | 4,785,900 | $ | 3.37 | ||||
Of the 4,785,900 outstanding PBRSUs at December 31, 2017, 1,475,208 shares are issued pursuant to the PBRSU award agreements intended to be settled in cash until such time as the share reserve available under the 2010 Amended Plan has been deemed sufficient by the Compensation Committee of our Board of Directors to allow for settlement of the PBRSUs in shares.
Modifications of share-based awards
During the second quarter of 2015, in connection with the resignation of a member of the Board who was also the former Chief Executive Officer of the Company, the Company modified the terms of awards previously granted to such Board member. This modification allowed for the continuation of vesting of options despite his resignation from the Board. Such modification resulted in a net increase of share-based compensation expense for the year ended December 31, 2015 of $3.1 million.
F-29
R1 RCM Inc.
Notes to Consolidated Financial Statements
During the third quarter of 2015, the Compensation Committee of the Board approved the grant of cash bonuses to the participants in the Company's 2014 annual cash incentive bonus plan who received all or a portion of their 2014 annual cash incentive award in the form of restricted shares of the Company's common stock (the "2014 Bonus Plan RSA Grantees"). Such bonuses were paid to 2014 Bonus Plan RSA Grantees on the second regularly scheduled payroll date following the Company’s scheduled second quarter earnings release on August 5, 2015 and were equal to the product of (i) $2.66 (which amount represents the difference of $5.38, the trading price per share of the Company’s common stock as of the close of trading on the date that the Company determined the number of restricted shares to be granted to 2014 Bonus Plan RSA Grantees, minus $2.72, the trading price per share of the Company’s common stock as of the close of trading on the second business day following the earnings release), multiplied by (ii) the number of restricted shares granted to the applicable 2014 Bonus Plan RSA Grantee. The aggregate number of restricted shares granted to 2014 Bonus Plan RSA Grantees was 683,401. This modification resulted in a net increase of share-based compensation expense for the year ended December 31, 2015 of $1.8 million.
During the second quarter of 2016, in connection with the resignation of the Company's Chief Executive Officer and Chief Financial Officer and the Restructuring Plan as further described in Note 11, the vesting of certain options and RSAs was accelerated pursuant to the agreements previously entered into by the former employees and resulted in an increase of share-based compensation expense for the year ended December 31, 2016 of $7.0 million.
11. Other
Other costs are comprised of reorganization-related and certain other costs. For the year ended December 31, 2017, 2016 and 2015, the Company incurred $4.7 million, $20.8 million and $9.3 million in other costs, respectively.
Other costs consist of the following (in millions):
Year Ended December 31, | |||||||||||
2017 | 2016 | 2015 | |||||||||
Severance and employee benefits | $ | 0.3 | $ | 3.5 | $ | 0.6 | |||||
Facility charges | — | 1.1 | 2.6 | ||||||||
Non-cash share based compensation | 0.1 | 1.8 | — | ||||||||
Reorganization-related | 0.4 | 6.4 | 3.2 | ||||||||
Transaction fees (1) | — | 12.7 | — | ||||||||
Defined contribution plan contributions (2) | — | 0.5 | — | ||||||||
Restatement costs | — | 1.2 | 2.5 | ||||||||
Acquisition related diligence and costs (3) | 3.1 | — | — | ||||||||
Transitioned employees restructuring expense (4) | 1.2 | — | — | ||||||||
Strategic Alternative Exploration | — | — | 3.8 | ||||||||
Prior year employment tax expense | — | — | (0.2 | ) | |||||||
Other | 4.3 | 14.4 | 6.1 | ||||||||
Total other | $ | 4.7 | $ | 20.8 | $ | 9.3 | |||||
(1) Costs related to retention payments and legal fees paid in connection with the closing of the Transaction (see Note 13).
(2) Additional contributions to the Company's defined contribution plan for the year ended December 31, 2016.
(3) Costs related to evaluating and pursuing acquisition opportunities as part of the Company’s inorganic growth strategy.
F-30
R1 RCM Inc.
Notes to Consolidated Financial Statements
(4) As part of the transition of Ascension personnel to the Company in conjunction with the A&R MPSA, the Company has agreed to reimburse Ascension for certain severance and retention costs related to certain Ascension employees who will not be transitioned to the Company.
Reorganization-related
During the second and fourth quarters of 2016, the Company initiated restructuring plans consisting of reductions in its workforce in order to align the size and composition of its workforce to its current client base, better position itself for already committed future growth, and enable the Company to more efficiently serve contracted demand.
The Company's reorganization activity was as follows (in millions):
Severance and Employee Benefits | Facilities and Other Costs | Total | |||||||||
Reorganization liability at December 31, 2014 | $ | 3.3 | $ | 0.1 | $ | 3.4 | |||||
Restructuring charges | 0.6 | 2.6 | 3.2 | ||||||||
Cash payments | (3.6 | ) | (0.5 | ) | (4.1 | ) | |||||
Non-cash charges | — | — | — | ||||||||
Reorganization liability at December 31, 2015 | $ | 0.3 | $ | 2.2 | $ | 2.5 | |||||
Restructuring charges | 5.4 | 1.0 | 6.4 | ||||||||
Cash payments | (2.3 | ) | (2.7 | ) | (5.0 | ) | |||||
Non-cash charges | (1.8 | ) | — | (1.8 | ) | ||||||
Reorganization liability at December 31, 2016 | $ | 1.6 | $ | 0.5 | $ | 2.1 | |||||
Restructuring charges | 0.4 | — | 0.4 | ||||||||
Cash payments | (1.7 | ) | (0.5 | ) | (2.2 | ) | |||||
Non-cash charges | (0.1 | ) | $ | — | (0.1 | ) | |||||
Reorganization liability at December 31, 2017 | $ | 0.2 | $ | — | $ | 0.2 | |||||
12. Income Taxes
The domestic and foreign components of income (loss) before income taxes consist of the following (in millions):
Year Ended December 31, | ||||||||||||
2017 | 2016 | 2015 | ||||||||||
Domestic | $ | (33.9 | ) | $ | 292.4 | $ | (139.1 | ) | ||||
Foreign | 6.6 | 5.8 | 3.3 | |||||||||
Total income (loss) before income taxes | $ | (27.3 | ) | $ | 298.2 | $ | (135.8 | ) | ||||
For the years ended December 31, 2017, 2016 and 2015, the Company’s current and deferred income tax expense (benefit) attributable to income (loss) from operations are as follows (in millions):
F-31
R1 RCM Inc.
Notes to Consolidated Financial Statements
Current | Deferred | Total | ||||||||||
Year Ended December 31, 2015 | ||||||||||||
U.S. Federal | $ | 0.1 | $ | (43.2 | ) | $ | (43.1 | ) | ||||
State & Local | (0.2 | ) | (8.5 | ) | (8.7 | ) | ||||||
Foreign | 0.5 | (0.3 | ) | 0.2 | ||||||||
$ | 0.4 | $ | (52.0 | ) | $ | (51.6 | ) | |||||
Year Ended December 31, 2016 | ||||||||||||
U.S. Federal | $ | (0.2 | ) | $ | 95.6 | $ | 95.4 | |||||
State & Local | — | 25.0 | 25.0 | |||||||||
Foreign | 1.1 | (0.4 | ) | 0.7 | ||||||||
$ | 0.9 | $ | 120.2 | $ | 121.1 | |||||||
Year Ended December 31, 2017 | ||||||||||||
U.S. Federal | $ | 0.1 | $ | 32.4 | $ | 32.5 | ||||||
State & Local | 0.2 | (2.3 | ) | (2.1 | ) | |||||||
Foreign | 1.5 | (0.4 | ) | 1.1 | ||||||||
$ | 1.8 | $ | 29.7 | $ | 31.5 | |||||||
Reconciliation of the difference between the actual tax rate and the statutory U.S. federal income tax rate is as follows:
Year Ended December 31, | |||||||||
2017 | 2016 | 2015 | |||||||
Federal statutory tax rate | 35 | % | 35 | % | 35 | % | |||
Increase in income tax rate resulting from: | |||||||||
State and local income taxes, net of federal tax benefits | 5 | % | 5 | % | 4 | % | |||
U.S. Tax Reform | (140 | )% | — | % | — | % | |||
Stock-based Compensation | (17 | )% | — | % | — | % | |||
Other | 2 | % | 1 | % | (1 | )% | |||
Actual tax rate | (115 | )% | 41 | % | 38 | % | |||
F-32
R1 RCM Inc.
Notes to Consolidated Financial Statements
The following table sets forth the Company’s net deferred tax assets as of December 31, 2017 and 2016 (in millions):
As of December 31, | ||||||||
2017 | 2016 | |||||||
Deferred Tax assets: | ||||||||
Deferred customer billings | $ | — | 67.5 | |||||
Net operating loss carryforwards | 47.9 | 71.0 | ||||||
Share-based compensation | 13.0 | 22.9 | ||||||
Accrued bonus | 4.0 | 4.8 | ||||||
Advanced billing revenue | 4.0 | 0.4 | ||||||
Other reserves | 0.4 | 0.7 | ||||||
Alternative minimum tax | 2.4 | 1.9 | ||||||
Other | 3.3 | 2.1 | ||||||
Deferred Rent | 2.9 | 2.9 | ||||||
R&D credit | 0.3 | 0.3 | ||||||
Charitable contributions | 0.4 | 0.5 | ||||||
Stock warrants | — | 0.1 | ||||||
Total gross deferred tax assets | 78.6 | 175.1 | ||||||
Fixed assets | (1.7 | ) | (2.1 | ) | ||||
Contract implementation costs | (3.3 | ) | (1.8 | ) | ||||
Less valuation allowance | (3.1 | ) | (1.3 | ) | ||||
Net deferred tax asset | $ | 70.5 | $ | 169.9 | ||||
At December 31, 2017, the Company had cumulative U.S. federal and state net operating loss carryforwards of approximately $182.5 million and $190.8 million, respectively, which are available to offset U.S. federal and state taxable income in future periods through 2037.
Enacted on December 22, 2017, the Tax Act reduces the U.S. federal corporate tax rate from 35% to 21%, requires companies to pay a one-time transition tax on earnings of certain foreign subsidiaries that were previously tax deferred and creates new taxes on certain foreign sourced earnings. At December 31, 2017, the Company has not completed the accounting for the tax effects of enactment of the Tax Act. However, as described below, the Company has made a reasonable estimate of the effects on the existing deferred tax balances and the one-time transition tax. For these items, a net provisional tax cost of approximately $38.2 million is recognized and is included as a component of provision for income taxes from continuing operations.
The Company remeasured certain U.S. deferred tax assets and liabilities based on the rates at which they are expected to reverse in the future, which is generally 21%. However, the Company is still analyzing certain aspects of the Tax Act and refining the calculations, which could potentially affect the measurement of these balances or potentially give rise to new deferred tax amounts. A provisional amount was recorded related to the remeasurement of the deferred tax balance, resulting in a provision for income taxes benefit of approximately $35.2 million.
The one-time transition tax is based on the total post-1986 earnings and profits ("E&P") for which the Company had previously deferred from U.S. income taxes. A provisional amount was recorded for the one-time transition tax liability, resulting in a provision for income taxes cost of approximately $3.0 million. The Company has not yet completed the calculation of the total post-1986 foreign E&P. Further, the transition tax is based in part on the amount of those earnings held in cash and other specified assets. This amount may change when the calculation of post-1986 foreign E&P and the amounts held in cash or other specified assets are finalized.
F-33
R1 RCM Inc.
Notes to Consolidated Financial Statements
A valuation allowance is required to be established when, based on currently available information, it is more likely than not that all or a portion of a deferred tax asset will not be realized. The guidance on accounting for income taxes provides important factors in determining whether a deferred tax asset will be realized, including whether there has been sufficient taxable income in recent years and whether sufficient income can reasonably be expected in future years in order to utilize the deferred tax asset. Consideration is given to the weight of all available evidence, both positive and negative. The Company estimates its already contracted business growth associated with the Ascension A&R MPSA will be profitable and allow the Company to utilize its NOL carryforwards and other deferred tax assets. Accordingly, the Company believes that it is more likely than not that the remaining deferred tax assets will be realized. Should the Company not operationally execute as expected, and the growth in the Ascension business not be as profitable as expected, such realizability assessment may change.
The Company has recorded valuation allowances at December 31, 2017 and 2016 of $1.3 million and $1.3 million, respectively, based on our assessment that it is more likely than not that a portion of the Company’s separate state income tax net operating loss will not be realized because the Company no longer has business activities in that state, or where the activity level has decreased to such a level where we believe the NOL will not be realized. In addition, the Company has recorded a provisional valuation allowance of approximately $1.8 million for foreign taxes as a result of credits generated from the one-time transition that the Company believes will not be realized.
Immediately prior to enactment of the Tax Act on December 22, 2017, we had $20.5 million of undistributed foreign earnings. Upon passage of the Tax Act, all $20.5 million of undistributed foreign earnings became subject to U.S. federal tax. Under the Tax Act, future unremitted foreign earnings will no longer be subject to tax when repatriated to its U.S. parent, but may be subject to withholding taxes or distribution taxes of the payor affiliate country. The Company has the ability and intent to maintain our investments in India. The Company has not provided for any additional outside basis difference inherent in its foreign subsidiaries, as these amounts continue to be indefinitely reinvested in foreign operations.
The 2017, 2016 and 2015 current tax provision includes $1.4 million, $1.2 million and $0.5 million, respectively, for income taxes arising from the pre-tax income of the Company’s India subsidiaries. The tax provisions are net of the impact of a tax holiday in India. The Company’s benefits from this tax holiday were $1.0 million, $0.9 million and $0.7 million for the year ended for the year ended December 31, 2017, 2016 and 2015, respectively. The Company expanded its operations in India during the year and was awarded new tax holiday agreements. The tax holidays are set to expire between March 31, 2019 and March 31, 2027.
The Company recognizes the tax benefit from an uncertain tax position only if it is more likely than not that the tax position will be sustained upon examination by taxing authorities, based on the technical merits of the position. The tax benefits recognized in the financial statements are measured based on the largest benefit that has a greater than fifty percent likelihood of being realized upon ultimate settlement. The Company’s unrecognized tax benefits as of December 31, 2017, 2016 and 2015 totaled $0.3 million, $0.3 million and $1.2 million, respectively.
F-34
R1 RCM Inc.
Notes to Consolidated Financial Statements
The following table summarizes the activity related to the unrecognized tax benefits (in thousands):
Tax Benefit | |||
Unrecognized tax benefits at December 31, 2014 | $ | 1.1 | |
Increases in positions taken in a current period | 0.1 | ||
Increases in positions taken in prior period | 0.6 | ||
Decreases in positions taken in a prior period | — | ||
Decreases due to lapse of statute of limitations | (0.6 | ) | |
Decreases due to settlement | — | ||
Unrecognized tax benefits at December 31, 2015 | $ | 1.2 | |
Increases in positions taken in a current period | — | ||
Increases in positions taken in prior period | 5.0 | ||
Decreases in positions taken in a prior period | (5.0 | ) | |
Decreases due to lapse of statute of limitations | — | ||
Decreases due to settlement | (0.9 | ) | |
Unrecognized tax benefits at December 31, 2016 | $ | 0.3 | |
Increases in positions taken in prior period | 0.1 | ||
Increases in positions taken in a current period | — | ||
Decreases in position taken in prior period | (0.1 | ) | |
Decreases due to lapse of statute of limitations | — | ||
Decreases due to settlement | — | ||
Unrecognized tax benefits at December 31, 2017 | $ | 0.3 | |
As of December 31, 2017, approximately $0.3 million of the total gross unrecognized tax benefits represented the amount that, if recognized, would result in an adjustment to the effective income tax rate in future periods. The Company recognizes interest and penalties related to income tax matters as part of income tax expense. The Company recorded adjustments to interest and potential penalties related to these unrecognized tax benefits during 2017, and in total, as of December 31, 2017, the Company has recorded a liability for interest and potential penalties of $0.0 million. The Company anticipates changes to the reserves within the next 12 months to be primarily related to interest. The Company believes it has sufficient accruals for contingent tax liabilities.
In connection with tax return examinations, contingencies can arise that generally result from different interpretations of tax laws and regulations as they pertain to the amount, timing or inclusion of revenues and expenses in taxable income, or the ability to utilize tax credits to reduce income taxes payable. While it is probable, based on the potential outcome of the Company’s federal and state tax examinations or the expiration of the statute of limitations for specific jurisdictions, that the liability for unrecognized tax benefits may increase or decrease within the next 12 months, the Company does not expect any such change would have a material effect on our financial condition, results of operations or cash flow.
The Company and its subsidiaries are subject to U.S. federal income tax as well as income tax of multiple state and foreign jurisdictions. U.S. federal income tax returns since 2014 are currently open for examination. State jurisdictions vary for open tax years. The statute of limitations for most states ranges from three to six years. The Company’s subsidiaries India income tax returns since fiscal year 2009 are currently open for final determination.
13. 8.00% Series A Convertible Preferred Stock
At the close of the Transaction on February 16, 2016 (as described in Note 1), the Company issued to the Investor: (i) 200,000 shares of Preferred Stock, for an aggregate price of $200 million, and (ii) a warrant with a term of ten years to acquire up to 60 million shares of common stock at an exercise price of $3.50 per share, on the terms
F-35
R1 RCM Inc.
Notes to Consolidated Financial Statements
and subject to the conditions set forth in the Warrant Agreement (“Warrant”). The Preferred Stock is immediately convertible into shares of common stock.
During the twelve months ended December 31, 2016, the Company incurred direct and incremental expenses of $21.3 million (including $14.0 million in closing fees paid to the Investor) relating to financial advisory fees, closing costs, legal expenses and other offering-related expenses in connection with the Transaction. These direct and incremental expenses reduced the carrying amount of the Preferred Stock. In connection with the issuance of the Preferred Stock, a beneficial conversion feature of $48.3 million was recognized. Since the Preferred Stock is presently convertible into common stock, this amount was subsequently accreted to the carrying amount of the Preferred Stock, and treated as a deemed preferred stock dividend in the calculation of earnings per share.
Dividend Rights
The holders of the Preferred Stock are entitled to receive cumulative dividends January 1, April 1, July 1 and October 1 of each year (dividend payment dates), which commenced on April 1, 2016, at a rate equal to 8% per annum (preferred dividend) multiplied by the liquidation preference per share, initially $1,000 per share adjusted for any unpaid cumulative preferred dividends. For the first seven years after issuance, the dividends on the Preferred Stock will be paid-in-kind. As of December 31, 2017 and 2016, the Company had accrued dividends of $4.5 million and $4.2 million associated with the Preferred Stock, respectively, of which $4.5 million and $4.2 million was paid in additional shares and $660 and $260 was paid in cash in January of the following year, respectively. For the year ended December 31, 2017 and 2016, the dividends that were paid, or accrued, in additional shares of Preferred Stock totaled $17.7 and $14.4 million, respectively.
Conversion Features
Each share of the Preferred Stock may be converted to common stock on any date at the option of the holder into the per share amount (as defined in the Certificate of Designations of the 8.00% Series A Convertible Preferred Stock (the "Series A COD")). Fractional shares resulting from any conversion will be rounded to the nearest whole share.
Redemption Rights
Since the redemption of the Preferred Stock is contingently or optionally redeemable and therefore not certain to occur, the Preferred Stock is not required to be classified as a liability under ASC 480, Distinguishing Liabilities from Equity. As the Preferred Stock is redeemable at the option of the holders upon a fundamental change (as defined in the Series A COD) and is redeemable in certain circumstances upon the occurrence of an event that is not solely within the Company's control, the Company has classified the Preferred Stock in mezzanine equity on the Consolidated Balance Sheets. In the event the Company believes that redemption of the Preferred Stock is probable, the Company would be required to accrete changes in the carrying value to the redemption value over the period until the expected redemption date.
Voting Rights
Each holder of the Preferred Stock is entitled to vote with the common stock on an as-converted basis on all matters submitted to a vote of shareholders of the Company, and has full voting rights and powers equal to the voting rights and powers of the holders of common stock.
The following summarizes the Preferred Stock activity for the twelve months ended December 31, 2017 and 2016 (in millions, except per share data):
F-36
R1 RCM Inc.
Notes to Consolidated Financial Statements
Preferred Stock | |||||||
Shares Issued and Outstanding | Carrying Value | ||||||
Balance at December 31, 2015 | — | $ | — | ||||
Issuance of preferred stock | 200,000 | 108.9 | |||||
Beneficial conversion feature deemed dividend | — | 48.3 | |||||
Dividends paid/accrued dividends | 10,160 | 14.4 | |||||
Balance at December 31, 2016 | 210,160 | $ | 171.6 | ||||
Dividends paid/accrued dividends | 17,323 | 17.7 | |||||
Balance at December 31, 2017 | 227,483 | $ | 189.3 | ||||
14. Earnings (Loss) Per Share
Basic net income per share is computed by dividing net income, less any dividends, accretion or decretion, redemption or induced conversion on the Preferred Stock, by the weighted average number of common shares outstanding during the period. As the Preferred Stock participates in dividends alongside the Company’s common stock (per their participating dividends), the Preferred Stock would constitute participating securities under ASC 260-10 and are applied to earnings per share using the two-class method. Under this method, all earnings (distributed and undistributed) are allocated to common shares and participating securities based on their respective rights to receive dividends.
Diluted net income per share is calculated using the more dilutive of the if-converted or the two-class method. For the years ended December 31, 2017 and 2016, the two-class method was more dilutive and was computed by adjusting the denominator used in the basic net income per share computation by the weighted average number of common shares outstanding and potentially dilutive securities outstanding during the period plus, when their effect is dilutive, incremental shares consisting of shares subject to stock options, shares issuable upon vesting of RSAs, RSUs, PBRSUs and Preferred Stock.
F-37
R1 RCM Inc.
Notes to Consolidated Financial Statements
Basic and diluted net income (loss) per common share are calculated as follows (in millions, except share and per share data):
Twelve Months Ended December 31, | ||||||||||||
2017 | 2016 | 2015 | ||||||||||
Basic EPS: | ||||||||||||
Net income (loss) | $ | (58.8 | ) | $ | 177.1 | $ | (84.3 | ) | ||||
Less dividends on preferred shares | (17.7 | ) | (62.7 | ) | — | |||||||
Less income allocated to preferred shareholders | — | (49.0 | ) | — | ||||||||
Net income (loss) available/(allocated) to common shareholders - basic | $ | (76.5 | ) | $ | 65.4 | $ | (84.3 | ) | ||||
Diluted EPS: | ||||||||||||
Net income (loss) | (58.8 | ) | 177.1 | (84.3 | ) | |||||||
Less dividends on preferred shares | (17.7 | ) | (62.7 | ) | — | |||||||
Less income allocated to preferred shareholders | — | (49.0 | ) | — | ||||||||
Net income (loss) available/(allocated) to common shareholders - diluted | $ | (76.5 | ) | $ | 65.4 | $ | (84.3 | ) | ||||
Basic weighted-average common shares | 102,062,051 | 100,160,206 | 96,806,885 | |||||||||
Add: Effect of dilutive securities | — | — | — | |||||||||
Diluted weighted average common shares | 102,062,051 | 100,160,206 | 96,806,885 | |||||||||
Net income (loss) per common share (basic) | $ | (0.75 | ) | $ | 0.65 | $ | (0.87 | ) | ||||
Net income (loss) per common share (diluted) | $ | (0.75 | ) | $ | 0.65 | $ | (0.87 | ) | ||||
Because of their anti-dilutive effect, 26,064,856 and 27,628,093 common share equivalents comprised of stock options, RSAs, PBRSUs and RSUs have been excluded from the diluted earnings per share calculation for the years ended December 31, 2017 and 2016, respectively. Due to the net loss, stock options and RSAs totaling 24,516,198 were not included in the computation of diluted income (loss) per share for the year ended 2015. Additionally, the Investor's exercisable warrant to acquire up to 60 million shares of the Company's common stock has been excluded from the diluted earnings per share calculation because it is anti-dilutive for all periods presented.
15. Commitments and Contingencies
Operating Leases
The Company rents office space and equipment under operating leases, primarily for its Chicago corporate office, U.S. shared services centers and India operations. Office space lease terms range from one to 13 years, whereas equipment lease terms range from one to three years. The Company’s leases contain various rent holidays and rent escalation clauses and entitlements for tenant improvement allowances. Lease payments are amortized to expense on a straight-line basis over the lease term.
Total rent expense under all operating leases was $7.9 million, $5.6 million and $6.2 million for the years ended December 31, 2017, 2016 and 2015, respectively.
F-38
R1 RCM Inc.
Notes to Consolidated Financial Statements
The aggregate future minimum rental commitments under all noncancelable operating leases having remaining terms in excess of one year as of December 31, 2017 are as follows (in millions):
2018 | $ | 8.1 | |
2019 | 7.4 | ||
2020 | 7.6 | ||
2021 | 7.3 | ||
2022 | 4.0 | ||
Thereafter | 19.0 | ||
Total | $ | 53.4 | |
Legal Proceedings
Other than as described below, the Company is not presently a party to any material litigation or regulatory proceeding and is not aware of any pending or threatened litigation or regulatory proceeding against the Company which, individually or in the aggregate, could have a material adverse effect on its business, operating results, financial condition or cash flows.
On July 22, 2014, the Company was named as a defendant in a putative class action lawsuit filed in the U.S. District Court for the Eastern District of Michigan (Anger v. Accretive Health, Inc.), seeking statutory damages, injunctive relief and attorneys’ fees. The primary allegations are that the Company attempted to collect debts without providing the notice required by the Fair Debt Collection Practices Act ("FDCPA") and Michigan Fair Debt Collection Practices Act and failed to abide by the terms of an agreed payment plan in violation of those same statutes. On February 23, 2017, the parties reached a settlement in principle and filed the proposed class action settlement with the Court, which conducted a Class Action Fairness Act (CAFA) hearing on whether to approve of the settlement. Members of the putative class were notified of the settlement and were given an opportunity to object or opt-out of the settlement. No objections to the settlement were entered before or at the CAFA hearing on October 4, 2017, and the Court approved the settlement by Order dated October 11, 2017. Accordingly, the Company paid a total $1.3 million settlement amount, some of which was paid to a settlement fund to assist members of the class Ascension Michigan ministry patients pay off healthcare debt to Ascension ministries.
In April 2015, the Company was named among other defendants in an employment action brought by a former employee of Mercy Maine Hospital before the Maine Human Rights Commission ("MHRC"), alleging improper termination in retaliation for uncovering alleged Medicare fraud. The plaintiff filed a parallel qui tam action in the District of Maine (Worthy v. Eastern Maine Healthcare Systems) making the same allegations, and seeking money damages, False Claims Act penalties and plaintiff’s attorneys’ fees. The U.S. Department of Justice declined to intervene in the federal court action, and the case was unsealed in April 2015. The parties mediated the case before the Magistrate Judge on July 24, 2017 and reached an agreement in principle, and subsequently resolved an additional contingency in order to settle the case. The settlement, which is now finalized, did not have a material impact to the consolidated financial statements.
In May 2016, the Company was served with a False Claims Act case brought by a former emergency department service associate who worked at a hospital of one of the Company’s customers, MedStar Inc.’s Washington Hospital Center (“WHC”), along with WHC and three other hospitals that were PAS clients and a place holder, John Doe hospital, representing all PAS clients (USA ex rel. Graziosi vs. Accretive Health, Inc. et. al.), and seeking money damages, False Claims Act penalties and plaintiff’s attorneys’ fees. The Second Amended Complaint alleges that the Company’s PAS business violates the federal False Claims Act. The case was originally filed under seal in 2013 in the federal district court in Chicago, was presented to the U.S. Attorney in Chicago twice, and the U.S. Attorneys declined to intervene. The Company filed a motion to dismiss the Second Amended Complaint on July 29, 2016. On March 22, 2017, the district court dismissed all claims against all hospital defendants other than Medstar Inc.’s WHC, and dismissed all claims related to TriCare-related episodes of care. Plaintiff filed a Third Amended Complaint, seeking to add back claims related to other PAS clients in January 2018,
F-39
R1 RCM Inc.
Notes to Consolidated Financial Statements
and the Company has moved to discuss all such claims related to any hospital other than WHC. That motion has been fully briefed. The Company believes that it has meritorious defenses to all claims in the case and intends to vigorously defend itself against these claims. The outcome is not presently determinable.
16. Related Party Transactions
As a result of the closing of the Transaction on February 16, 2016 and Ascension's ownership interest in the Investor, Ascension became a related party to the Company. See Note 13, 8.00% Series A Convertible Preferred Stock, for additional information.
The Company provides RCM and PAS services to Ascension. The execution of the A&R MPSA, as discussed in Note 1, Business Description and Basis of Presentation, was a contractual settlement agreement of the prior Master Professional Services Agreement between the Company and Ascension. The Company recorded revenue of $404.4 million and $437.4 million in connection with these services for the year ended December 31, 2017 and 2016, respectively. In addition to the revenue recorded related to the execution of the A&R MPSA, the Company recorded revenue from services provided to Ascension of $24.0 million for the year ended December 31, 2016.
At December 31, 2017, the Company had $27.1 million in current portion of customer liabilities for a related party, consisting of $23.7 million, $0.5 million and $2.9 million in current accrued service costs, refund liabilities and deferred revenue. The Company had $11.5 million in non-current portion of customer liabilities for a related party related to non-current deferred revenue as of December 31, 2017. At December 31, 2016, the Company had $14.2 million in current portion of customer liabilities for a related party, consisting of $13.2 million in current accrued service costs and $1.0 million in current customer deposits. The Company had $110.0 million in non-current portion of customer liabilities for a related party related to deferred customer billings as of December 31, 2016. At December 31, 2017 and December 31, 2016, the Company had $15.4 million and $1.8 million in accounts receivable with Ascension, respectively.
As part of the transition of Ascension personnel to the Company in conjunction with the A&R MPSA, the Company has agreed to reimburse Ascension for certain severance and retention costs related to certain Ascension employees who will not be transitioned to the Company. As of December 31, 2017 and December 31, 2016, the Company had $0.5 million and $1.7 million in accrued compensation and benefits related to these costs, respectively.
As Ascension is the Company's largest customer, a significant percentage of the Company's cost of services is associated with providing services to Ascension. However, due to the nature of the Company's shared services and information technology operations, it is impractical to assign the dollar amount associated with services provided to Ascension.
17. Deferred Contract Costs
Certain costs associated with the initial phases of the Ascension A&R MPSA and with the transition of additional Ascension hospitals are deferred. These fulfillment costs relate directly to the Company’s responsibilities under the A&R MPSA, generate or enhance resources of the Company that will be used in satisfying its performance obligations under the A&R MPSA in the future, and are expected to be recovered through the margins realized under the A&R MPSA. At December 31, 2017, the Company had $13.2 million in total deferred contract costs and $4.8 million at December 31, 2016.
Of the $13.2 million in deferred eligible costs, $1.6 million is included in prepaid expenses and other current assets and $11.6 million is included in other assets in the accompanying consolidated balance sheets as of December 31, 2017. As of December 31, 2016, deferred eligible costs were included in the other non-current assets in the accompanying consolidated balance sheets.
F-40
R1 RCM Inc.
Notes to Consolidated Financial Statements
The associated assets are amortized as services are transferred to the customer over the remaining life of the contracts. For the year ended December 31, 2017 and 2016, total amortization was $1.0 million and $0 million, respectively, and there were no associated impairment losses.
18. Segments and Customer Concentrations
The Company has determined that it has a single operating segment in accordance with how its business activities are managed and evaluated. All of the Company’s significant operations are organized around the single business of providing end-to-end management services of revenue cycle operations for U.S.-based hospitals and other medical providers. Accordingly, for purposes of segment disclosures, the Company has only one reporting segment. All of the Company’s net services revenue and trade accounts receivable are derived from healthcare providers domiciled in the United States.
Hospital systems affiliated with Ascension have accounted for a significant portion of the Company’s net services revenue each year since the Company’s formation. For the twelve months ended December 31, 2017, 2016 and 2015, net services revenue from hospitals affiliated with Ascension accounted for 90%, 78% and 45% of the Company's total net services revenue, respectively. The loss of customers within the Ascension health system would have a material adverse impact on the Company’s operations. For the year ended December 31, 2016, Intermountain Healthcare accounted for 15% of the Company's total net services revenue. For the year ended December 31, 2015, one customer, unaffiliated with Ascension, accounted for 17% of the Company's total net services revenue.
As of December 31, 2017 and 2016, the Company had a concentration of credit risk with hospitals affiliated with Ascension accounting for 66% and 31% of accounts receivable, respectively.
F-41
R1 RCM Inc.
Notes to Consolidated Financial Statements
19. Retirement Plan
The Company maintains a 401(k) retirement plan (the "401(k) plan") that is intended to be a tax-qualified defined contribution plan under Section 401(k) of the Internal Revenue Code. In general, all employees are eligible to participate. The 401(k) plan includes a salary deferral arrangement pursuant to which participants may elect to reduce their current compensation by up to the statutorily prescribed limit, equal to $18,000 in 2017, 2016 and 2015, and have the amount of the reduction contributed to the 401(k) plan.
Effective July 1, 2017 the Company currently matches employee contributions up to 50% of the first 3% of base compensation that a participant contributes to the 401(k) plan, including director-level and above employees. Prior to July 1, 2017, the Company matched employee contributions up to 50% of the first 3% of base compensation that a participant contributed to the 401(k) Plan and director-level and above employees were excluded from the matching contribution feature of the plan. For the years ended December 31, 2017, 2016 and 2015, total Company contributions to the plan were $2.2 million, $0.7 million and $0.4 million, respectively.
20. Accrued Compensation and Benefits
Accrued compensation and benefits is comprised of the following (in millions):
Year Ended December 31, | |||||||
2017 | 2016 | ||||||
Accrued payroll | $ | 8.8 | $ | 3.3 | |||
Accrued bonus | 16.3 | 12.5 | |||||
Other | 12.7 | 9.0 | |||||
Ending balance | $ | 37.8 | $ | 24.8 | |||
21. Other Non-Current
Other non-current liabilities consisted of the following (in millions):
Year Ended December 31, | |||||||
2017 | 2016 | ||||||
Deferred rent | $ | 11.9 | $ | 9.0 | |||
Other | — | 0.7 | |||||
Ending balance | $ | 11.9 | $ | 9.7 | |||
Note 22. Quarterly Financial Information (Unaudited)
The following tables provide our Quarterly Condensed Consolidated Statements of Operations (in millions except per share data):
F-42
R1 RCM Inc.
Notes to Consolidated Financial Statements
1st Quarter Ended March 31, | 2nd Quarter Ended June 30, | 3rd Quarter Ended September, 30 | 4th Quarter Ended December 31, | |||||||||||||||||||||||||
2017 | 2016 | 2017 | 2016 | 2017 | 2016 | 2017 | 2016 | |||||||||||||||||||||
Net services revenue | $ | 86.9 | $ | 352.2 | $ | 99.4 | $ | 8.7 | $ | 123.2 | $ | 125.5 | $ | 140.3 | $ | 106.2 | ||||||||||||
Total operating expenses | 95.4 | 73.5 | 109.6 | 78.4 | 128.3 | 64.1 | 144.0 | 78.6 | ||||||||||||||||||||
Income (loss) from operations | (8.5 | ) | 278.7 | (10.2 | ) | (69.8 | ) | (5.1 | ) | 61.4 | (3.7 | ) | 27.5 | |||||||||||||||
Net income (loss) | $ | (8.3 | ) | $ | 167.4 | $ | (6.7 | ) | $ | (40.8 | ) | $ | (3.6 | ) | $ | 37.3 | $ | (40.2 | ) | $ | 13.1 | |||||||
Net income (loss) per common share | ||||||||||||||||||||||||||||
Basic | $ | (0.12 | ) | $ | 0.85 | $ | (0.11 | ) | $ | (0.45 | ) | $ | (0.08 | ) | $ | 0.18 | $ | (0.44 | ) | $ | 0.05 | |||||||
Diluted | $ | (0.12 | ) | $ | 0.85 | $ | (0.11 | ) | $ | (0.45 | ) | $ | (0.08 | ) | $ | 0.18 | $ | (0.44 | ) | $ | 0.05 | |||||||
Note 23. Subsequent Event
Intermountain Services Agreement
On and effective as of January 23, 2018, the Company entered into an Amended and Restated Services Agreement (the “Intermountain Services Agreement”) with Intermountain Healthcare (“Intermountain Healthcare” or “Intermountain”) having a ten-year term. Additionally, Intermountain has entered into a securities purchase agreement with R1 described in more detail below to acquire equity in R1 for an aggregate purchase price of $20 million.
The Intermountain Services Agreement continues the Company’s relationship with Intermountain Healthcare which commenced in October 2011 and was previously extended by amendment dated September 27, 2016. Pursuant to the Intermountain Services Agreement, the Company will provide revenue cycle management service offering to Intermountain hospitals and medical group providers under the operating partner model. In addition, the Company will provide revenue cycle management services to Intermountain’s homecare, hospice and palliative care, durable medical equipment and infusion therapy business. Intermountain has agreed that the Company may provide services to additional hospitals acquired by Intermountain over time. With certain limited exceptions, the Company will be the exclusive provider of revenue cycle management services for the hospitals, medical group providers, and home health business affiliated with Intermountain. The Intermountain Services Agreement is subject to certain limited termination rights, including for uncured material breaches or specific service level failures or in the event a party is excluded from certain health care programs, is unable to perform their services as a result of a change in applicable law, is subject to certain adverse judgments or is subject to certain bankruptcy or similar insolvency or event of default occurrences.
On January 23, 2018, the Company entered into a Securities Purchase Agreement (the “Intermountain Purchase Agreement”), by and between the Company and Intermountain, pursuant to which the Company sold to Intermountain, in private placements under the Securities Act, (i) 4,665,594 shares of common stock, at a purchase price of $4.2867 per share (representing the per share average closing price of the Company’s Common Stock for the period from January 1, 2018 to January 12, 2018), and (ii) a warrant to acquire up to 1,500,000 shares of Common Stock on the terms and subject to the conditions set forth in the Warrant Agreement, for an aggregate purchase price of $20,000,000.
Under the terms of the Intermountain Purchase Agreement, for so long as Intermountain’s “Ownership Threshold” (as that term is defined in the Purchase Agreement) is met, Intermountain shall be entitled to nominate one individual (the “Intermountain Designee”) to the Company’s Board. Additionally, subject to applicable law and the listing standards of the Nasdaq Capital Market (or other United States national securities exchange that the Common Stock is listed upon, if any), the Company will offer the Intermountain Designee an opportunity to, at Intermountain’s option, either sit on each regular committee of the Board or attend (but not vote) at the meetings of such committee as an observer.
F-43
R1 RCM Inc.
Notes to Consolidated Financial Statements
Intermedix Merger
On February 23, 2018, the Company entered into an Agreement and Plan of Merger (the “Intermedix Agreement”), with Intermedix Holdings, Inc. (“Intermedix”), Project Links Parent, Inc. (“Parent”), a wholly-owned subsidiary of the Company, Project Links Merger Sub, Inc. (“Merger Sub”) and solely in its capacity as Securityholder Representative, Thomas H. Lee Equity Fund VI, L.P., providing for the merger of Merger Sub with and into Intermedix (the “Merger”), with Intermedix surviving the Merger as a wholly-owned subsidiary of Parent.
Pursuant to the terms of the Intermedix Agreement, the Company will acquire Intermedix for $460 million in cash, subject to customary adjustments for cash, debt, transaction expenses and normalized working capital. The Company intends to fund the Merger and the related fees and expenses with a combination of cash on hand and new financing (such financing, the “Financing”). Concurrently with the execution of the Intermedix Agreement, the Company entered into debt financing commitment letters (as described in more detail below) that together with cash on hand, the Company believes are sufficient to cover the purchase price plus the related fees and expenses. Pursuant to the Intermedix Agreement, the Company has agreed to customary covenants to obtain the Financing, and Intermedix has agreed to provide reasonable cooperation with the Company in the Company’s efforts to obtain the Financing. There is no financing condition to the consummation of the Merger.
The Intermedix Agreement contains customary representations, warranties and closing conditions (including the expiration or early termination of the waiting period under the Hart-Scott-Rodino Act of 1976, as amended).Either Parent or Intermedix may terminate the Intermedix Agreement (i) if certain conditions to closing have not been satisfied or waived prior to the date that is four months after the signing of the Intermedix Agreement (the “Outside Date”) or (ii) if a restraint exists that permanently enjoins or prohibits the Merger. Parent may terminate the Intermedix Agreement if Intermedix is in material breach under the Intermedix Agreement and such material breach would cause certain conditions to the closing not to be met and which are not, or cannot be, cured in the time period specified in the Intermedix Agreement. Intermedix may terminate the Intermedix Agreement (i) if the Company, Parent or Merger Sub is in material breach under the Intermedix Agreement and such material breach would cause certain conditions to the closing not to be met and which are not, or cannot be, cured in the time period specified in the Intermedix Agreement, (ii) if all conditions to closing have been satisfied or waived and the Company, Parent and Merger Sub fail to consummate the Merger following confirmation by Intermedix it is prepared to close, in which case the Company will be required to pay to Intermedix a reverse termination fee of $23,000,000, or (iii) if the Company fails to execute an agreement with Ascension Health incorporating the terms of the term sheet for Medical Group RCM Services within the time period specified in the Intermedix Agreement and such condition to closing is not waived by the Company on or prior to the end of such time period, in which case the Company will be required to pay to Intermedix a termination fee of $32,200,000. The Intermedix Agreement may also be terminated by mutual written consent of Parent and Intermedix.
Immediately prior the closing of the Merger, Intermedix will spin-off certain assets related to Intermedix’s emergency preparedness and emergency response systems business to Intermedix’s existing shareholders, which assets will not be acquired by the Company. The transaction is expected to close in the second quarter of 2018.
Concurrently with the signing of the Intermedix Agreement, the Company entered into a debt commitment letter (the "Commitment Letter”), dated February 23, 2018 with Bank of America, N.A., Merrill Lynch, Pierce, Fenner & Smith Incorporated and Ares Capital Management LLC, on behalf of one or more funds and accounts managed directly or indirectly by Ares Capital Management LLC for a $295 million first lien senior secured credit facility, of which $270 million is a term loan facility and $25 million is a revolving credit facility (the “First Lien Facility”), which Commitment Letter and the commitments contemplated thereby will terminate 4 months following the date of the Intermedix Agreement (coinciding with the termination date with respect to the Intermedix Agreement).
The Commitment Letter contains certain conditions to funding which are similar to the closing conditions included in the Intermedix Agreement. Borrowings under the First Lien Facility will bear interest at a fluctuating rate equal to, at the Company’s option, LIBOR or the applicable base rate plus a margin calculated as described in
F-44
R1 RCM Inc.
Notes to Consolidated Financial Statements
the Commitment Letter. Revolving loans under the First Lien Facility, if funded, will mature in five years and term loans under the First Lien Facility will mature in seven years.
In addition, concurrently with the signing of the Intermedix Agreement and the Commitment Letter, the Company entered into a commitment letter (the “Subordinated Commitment Letter”), dated February 23, 2018 with TowerBrook Investors IV (Onshore), L.P., TowerBrook Investors IV (892), L.P., TowerBrook Investors IV (OS), L.P., TowerBrook Investors IV Executive Fund, L.P., TowerBrook Investors IV Team Daybreak, L.P. and Ascension Health Alliance D/B/A Ascension (collectively, the “Purchasers”), pursuant to which the Purchasers have agreed to purchase $110 million of unsecured, subordinated notes (the ”Subordinated Notes”; together with the First Lien Facility, the “Facilities”), which commitments contemplated thereby will terminate four months following the date of the Intermedix Agreement (coinciding with the termination date with respect to the Intermedix Agreement).
The Subordinated Commitment Letter contemplates that interest on the Subordinated Notes will accrue at 14.0% per annum, increasing by 1.0% per annum on the third anniversary of the closing date of the Merger and by an additional 1.0% per annum on each subsequent anniversary of the closing date of the Merger until the Subordinated Notes are repaid in full. Interest will be payable quarterly in cash; provided, however, that the Company may, at its option, (i) on or prior to the first anniversary of the closing date of the Merger, elect to pay up to 75% of each quarterly interest payment in kind (with such payment being capitalized to principal on the last day of each applicable fiscal quarter) and pay the remaining balance of such quarterly interest payment in cash; (ii) following the first anniversary and prior to the second anniversary of the closing date of the Merger, elect to pay up to 50% of each quarterly interest payment in kind and pay the remaining balance in cash; and (iii) thereafter, elect to pay up to 25% of each quarterly interest payment in kind and pay the remaining balance in cash. The Subordinated Notes will mature on the one year anniversary of the stated maturity date of the First Lien Facility.
Additionally, the Subordinated Commitment Letter contemplates that the Company may voluntarily prepay the Subordinated Notes subject to the applicable prepayment premium (other than in connection with a change of control) as follows: (i) if such prepayment is made before the first anniversary of the closing date of the Merger, an amount equal to 3.0% of the principal amount of the Subordinated Notes so prepaid; (ii) if such prepayment is made on or after the first anniversary but prior to the second anniversary of the closing date of the Merger, an amount equal to 2.0% of the principal amount of the Subordinated Notes so prepaid; (iii) if such prepayment is made on or after the second anniversary but prior to the third anniversary of the closing date of the Merger, an amount equal to 1.0% of the principal amount of the Subordinated Notes so prepaid; and (iv) if such prepayment is made on or after the third anniversary of the closing date of the Merger, there is no prepayment premium. In the event a prepayment of the Subordinated Notes is made in connection with a change of control (either through the exercise of the repurchase right of the holders of the Subordinated Notes or through a voluntary prepayment), the prepayment premium shall be an amount equal to 1.0% of the principal amount of the Subordinated Notes so prepaid.
Ascension Health Term Sheet
On February 23, 2018, the Company and Ascension Health entered into a non-binding term sheet setting forth certain material terms of a supplement (the “Supplement”) to the A&R MPSA, which terms provide that the Company will provide certain revenue cycle management services for physician groups that receive services from Ascension Health’s National Revenue Service Center and other groups associated with Ascension Health hospital systems (the “Medical Group RCM Services”). The Company expects to enter into the definitive Supplement for Medical Group RCM Services at the time of the closing of the Merger. The term sheet also contemplates that the Supplement will provide for: (i) the re-badging of certain centrally-based revenue cycle operations employees who support Ascension Health’s physician groups; (ii) compensation for the Medical Group RCM Services through payment of a base fee and incentive fee, each calculated in accordance with the A&R MPSA, with revisions to the performance metrics and an increase in the available percentage of cash collections for the incentive payment; and (iii) the transition of the Medical Group RCM Services to physician groups associated with Ascension Wisconsin (as set forth in the Amendment) to the new terms set forth in the Supplement.
Presence Health
F-45
R1 RCM Inc.
Notes to Consolidated Financial Statements
On February 18, 2018, the Company announced that Presence Health based in Chicago, Illinois has selected the Company to provide its end-to-end RCM services across the Presence Health system’s acute care hospitals and physician care settings. R1 and Presence Health signed a non-binding term sheet, with the expectation of completing negotiations on a definitive agreement and going live with service in the second quarter of 2018.
F-46
EXHIBIT INDEX
Exhibit Number | Description |
101 | The following materials from the R1 RCM Inc.’s Annual Report on Form 10-K for the year ended December 31, 2017, formatted in eXtensible Business Reporting Language (XBRL): (i) the Consolidated Balance Sheets, (ii) the Consolidated Statements of Operations and Comprehensive Income (Loss), (iii) the Consolidated Statements of Stockholders’ Equity, (iv) the Consolidated Statements of Cash Flows, and (v) related notes. |
* | Management contract or compensatory plan or arrangement required to be filed pursuant to Item 15(b) of Form 10-K. |
+ | Confidential treatment requested as to certain portions, which portions have been omitted and filed separately with the Securities and Exchange Commission. |