Attached files
| file | filename |
|---|---|
| EX-32.2 - EX-32.2 - Fogo de Chao, Inc. | fogo-ex322_6.htm |
| EX-32.1 - EX-32.1 - Fogo de Chao, Inc. | fogo-ex321_9.htm |
| EX-31.2 - EX-31.2 - Fogo de Chao, Inc. | fogo-ex312_7.htm |
| EX-31.1 - EX-31.1 - Fogo de Chao, Inc. | fogo-ex311_8.htm |
| EX-23.1 - EX-23.1 - Fogo de Chao, Inc. | fogo-ex231_10.htm |
| EX-21.1 - EX-21.1 - Fogo de Chao, Inc. | fogo-ex211_11.htm |
UNITED STATES
SECURITIES AND EXCHANGE COMMISSION
WASHINGTON, DC 20549
FORM 10-K
(Mark One)
|
☒ |
ANNUAL REPORT PURSUANT TO SECTION 13 OR 15(d) OF THE SECURITIES EXCHANGE ACT OF 1934 |
For the fiscal year ended December 31, 2017
OR
|
☐ |
TRANSITION REPORT PURSUANT TO SECTION 13 OR 15(d) OF THE SECURITIES EXCHANGE ACT OF 1934 |
For the transition period from ________to ________
Commission File Number: 001-37450
FOGO DE CHAO, INC.
(Exact Name of Registrant as Specified in its Charter)
|
Delaware |
|
45-5353489 |
|
( State or other jurisdiction of incorporation or organization) |
|
(I.R.S. Employer |
|
|
|
|
|
5908 Headquarters Drive Suite K200 Plano, TX |
|
75024 |
|
(Address of principal executive offices) |
|
(Zip Code) |
Registrant’s telephone number, including area code: (972) 960-9533
Securities registered pursuant to Section 12(b) of the Act: Common Stock, par value $0.01 per share; Common stock traded on NASDAQ stock market.
Securities registered pursuant to Section 12(g) of the Act: None
Indicate by check mark if the registrant is a well-known seasoned issuer, as defined in Rule 405 of the Securities Act. YES ☐ NO ☑
Indicate by check mark if the registrant is not required to file reports pursuant to Section 13 or 15(d) of the Act. YES ☐ NO ☑
Indicate by check mark whether the registrant: (1) has filed all reports required to be filed by Section 13 or 15(d) of the Securities Exchange Act of 1934 during the preceding 12 months (or for such shorter period that the registrant was required to file such reports), and (2) has been subject to such filing requirements for the past 90 days. YES ☑ NO ☐
Indicate by check mark whether the registrant has submitted electronically and posted on its corporate Web site, if any, every Interactive Data File required to be submitted and posted pursuant to Rule 405 of Regulation S-T (§232.405 of this chapter) during the preceding 12 months (or for such shorter period that the registrant was required to submit and post such files). YES ☑ NO ☐
Indicate by check mark if disclosure of delinquent filers pursuant to Item 405 of Regulation S-K (§229.405) is not contained herein, and will not be contained, to the best of registrant’s knowledge, in definitive proxy or information statements incorporated by reference in Part III of this Form 10-K or any amendment to this Form 10-K. ☐
Indicate by check mark whether the registrant is a large accelerated filer, an accelerated filer, a non-accelerated filer, smaller reporting company, or an emerging growth company. See the definitions of “large accelerated filer,” “accelerated filer,” “smaller reporting company” and “emerging growth company” in Rule 12b-2 of the Exchange Act. (Check one):
|
Large accelerated filer |
|
☐ |
|
Accelerated filer |
|
☑ |
|
|
|
|
|
|
|
|
|
Non-accelerated filer |
|
☐ (Do not check if a small reporting company) |
|
Small reporting company |
|
☐ |
|
|
|
|
|
|
|
|
|
Emerging growth company |
|
☑ |
|
|
|
|
If an emerging growth company, indicate by check mark if the registrant has elected not to use the extended transition period for complying with any new or revised financial accounting standards provided pursuant to Section 13(a) of the Exchange Act. ☑
Indicate by check mark whether the registrant is a shell company (as defined in Rule 12b-2 of the Exchange Act). YES ☐ NO ☑
As of July 2, 2017, the last day of the registrant’s most recently completed second fiscal quarter, the aggregate market value of the registrant's outstanding common stock held by non-affiliates was approximately $150,142,000, based upon the last reported sales price on June 30, 2017. The registrant’s common stock was not traded on July 2, 2017, the last day of the registrant’s second fiscal quarter. For purposes of this calculation, shares of common stock held by each executive officer and director and by holders of more than 5% of the outstanding common stock have been excluded since those persons may under certain circumstances be deemed to be affiliates. This determination of affiliate status is not necessarily a conclusive determination for other purposes.
The number of shares of registrant’s Common Stock outstanding as of March 2, 2018 was 28,254,732.
Pursuant to general instruction G to Form 10-K, portions of information to be disclosed in registrant’s definitive proxy statement for its 2018 Annual Meeting of Stockholders are incorporated by reference into Part III of this Report.
|
|
|
Page |
|
PART I |
|
|
|
Item 1. |
1 |
|
|
Item 1A. |
13 |
|
|
Item 1B. |
37 |
|
|
Item 2. |
37 |
|
|
Item 3. |
38 |
|
|
Item 4. |
39 |
|
|
|
|
|
|
PART II |
|
|
|
Item 5. |
40 |
|
|
Item 6. |
41 |
|
|
Item 7. |
Management’s Discussion and Analysis of Financial Condition and Results of Operations |
44 |
|
Item 7A. |
68 |
|
|
Item 8. |
69 |
|
|
Item 9. |
Changes in and Disagreements With Accountants on Accounting and Financial Disclosure |
69 |
|
Item 9A. |
69 |
|
|
Item 9B. |
69 |
|
|
|
|
|
|
PART III |
|
|
|
Item 10. |
70 |
|
|
Item 11. |
70 |
|
|
Item 12. |
Security Ownership of Certain Beneficial Owners and Management and Related Stockholder Matters |
70 |
|
Item 13. |
Certain Relationships and Related Transactions, and Director Independence |
70 |
|
Item 14. |
70 |
|
|
|
|
|
|
PART IV |
|
|
|
Item 15. |
71 |
|
|
Item 16. |
74 |
i
Cautionary Note Regarding Forward-Looking Statements
This Annual Report on Form 10-K contains forward-looking statements, within the meaning of the Private Securities Litigation Reform Act of 1995, which are subject to risks and uncertainties. Forward-looking statements relate to expectations, beliefs, projections, guidance, future plans, objectives and strategies, anticipated events or trends and similar expressions concerning matters that are not historical facts, such as statements regarding our future financial condition or results of operations, our prospects and strategies for future growth, the development and introduction of new products, and the implementation of our marketing and branding strategies. Forward-looking statements can also be identified by words such as “may,” “will,” “should,” “expects,” “plans,” “anticipates,” “believes,” “estimates,” “predicts,” “potential,” “seeks,” “intends,” “targets” or the negative of these terms or other comparable terminology.
Forward-looking statements are not guarantees of future performance and actual results may differ significantly from the results discussed in the forward-looking statements. Factors that might cause such differences include, but are not limited to, those discussed in the section entitled "Risk Factors" in Item 1A of this Form 10-K and other factors noted in “Management’s Discussion and Analysis of Financial Condition and Results of Operations” in Item 7 of this Form 10-K. The risk factors and other factors discussed in this Form 10-K are in addition to those contained in any other cautionary statements, written or oral, which may be made or otherwise addressed in connection with a forward-looking statement or contained in any of our subsequent filings with the SEC. Because of these factors, we caution against placing undue reliance on forward-looking statements. Forward-looking statements speak only as of the date on which they are made. Except as required by applicable securities law, we undertake no obligation to update any forward-looking statement to reflect events or circumstances after the date on which the statement is made or to reflect the occurrence of unanticipated events.
In this section and other parts of this Form 10-K, we refer to certain measures used for financial and operational decision making and as a means to evaluate period-to-period comparisons. We also may refer to a number of financial measures that are not defined under GAAP, but have corresponding GAAP-based measures. Where non-GAAP measures appear, we provide tables reconciling these non-GAAP measures to their corresponding GAAP-based measures and make reference to a discussion of their use. We believe these measures provide useful information about operating results, enhance the overall understanding of past financial performance and future prospects, and allow for greater transparency with respect to key metrics used by management in its financial and operational decision making.
The following discussion should be read in conjunction with the accompanying Consolidated Financial Statements and related notes thereto included elsewhere in this annual report. All information presented herein is based on our fiscal calendar. Unless otherwise stated, references to particular years, quarters, months or periods refer to our fiscal years and the associated quarters, months and periods of those fiscal years.
PART I
Merger Agreement with Rhône
On February 20, 2018, we entered into an Agreement and Plan of Merger among Prime Cut Intermediate Holdings Inc., a Delaware corporation (“Parent”) and an investment entity affiliated with Rhône Capital V L.P. (“Rhône”) and Prime Cut Merger Sub Inc., a Delaware corporation and a wholly owned subsidiary of Parent (“Merger Subsidiary”), pursuant to which, among other things and subject to the satisfaction or waiver of specified conditions, Merger Subsidiary will merge with and into Fogo de Chão, which will survive as a wholly owned subsidiary of Parent. Parent will finance the Merger with a combination of debt and equity financing. See “Management’s Discussion and Analysis of Financial Condition and Results of Operations – Key Events – Merger Agreement with Rhône” for information about the transaction.
Overview
Fogo de Chão, Inc. and its subsidiaries began operations in 1979 in Brazil and in 1997 in the United States (“US”). We are principally engaged in the operation of Brazilian steakhouses, or churrascarias, in the US, Brazil, Puerto Rico and through joint ventures in Mexico and the Middle East. References to “Fogo,” the “Company,” “we,” “us,” and “our” in this Form 10-K are references to Fogo de Chão, Inc. and its subsidiaries.
1
We operate on a 52- or 53-week fiscal year that ends on the Sunday that is closest to December 31 of that year. Our fiscal quarters consist of 13 weeks, although in the years with 53 weeks, the fourth quarter represents a 14-week period. All fiscal years presented in this Form 10-K consist of 52 weeks, with the exception of Fiscal 2015 which consisted of 53 weeks ended January 3, 2016. References to Fiscal 2016 relate to our 52-week fiscal year ended January 1, 2017. References to Fiscal 2017 relate to our 52-week fiscal year ended December 31, 2017.
Our Company
Fogo de Chão (fogo-dee-shoun) is a leading Brazilian steakhouse, or churrascaria, which has specialized for nearly 40 years in fire-roasting high-quality meats utilizing the centuries-old Southern Brazilian cooking technique of churrasco. We deliver a distinctive and authentic Brazilian dining experience through the combination of our high-quality Brazilian cuisine and our differentiated service model known as espeto corrido (Portuguese for “continuous service”) delivered by our churrasqueiros, which we refer to as our gaucho chefs. We offer our guests a variety of menu choices at varying price points including our most popular offering, the Full Churrasco Experience, as well as Gaucho Lunch, Weekend Brazilian Brunch and Bar Fogo menu items. The Full Churrasco Experience, our prix fixe menu, provides the opportunity to experience a variety of meats including beef, lamb, pork and chicken, simply seasoned and carefully fire-roasted to expose their natural flavors, as well as a selection of fresh seasonal salads and specialty items at the Market Table.
Throughout our history, we have been recognized for our leading consumer appeal by both national and local media in the markets where we operate, including winning multiple “best of” restaurant awards from one of Brazil’s most prominent lifestyle publications, Veja Magazine, and numerous accolades in the US, including awards from Nation’s Restaurant News, Zagat and Wine Spectator Magazine.
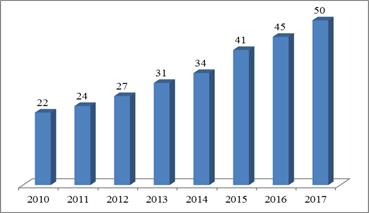
We opened our first restaurant in 1979 in Porto Alegre, Brazil. In 1986, we expanded to São Paulo, Brazil, a city in which we now operate five restaurants. Encouraged by our growth in Brazil, we opened our first restaurant in the US in 1997 in Addison, Texas, a suburb of Dallas, and have since expanded our footprint nationwide. We currently operate 38 restaurants in the US, nine restaurants in Brazil, two joint venture restaurants in Mexico and two joint venture restaurants in the Middle East, one which opened in August 2017 in Jeddah, Saudi Arabia and the other in Dubai, UAE, which opened in February 2018. From our 2010 to 2017 fiscal years, we grew our restaurant count by a compound annual growth rate (“CAGR”) of 12.4%.
|
Restaurant Count |
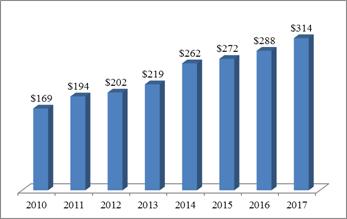
Revenue |
|
|
|
|
|
|
We believe our dedication to serving high-quality Brazilian cuisine and our differentiated service model, combined with our disciplined focus on restaurant operations, have resulted in strong financial results in Fiscal 2017 illustrated by the following:
|
|
• |
We generated average unit volumes (“AUVs”) of approximately $7.7 million in the US and approximately R$14.6 million (Brazilian Real) in Brazil, |
|
|
• |
Increased our restaurant base 11.1% from 45 restaurants at the end of Fiscal 2016 to 50 at the end of Fiscal 2017. Openings included Tysons (Virginia), Dallas (Texas), Bellevue (Washington), Troy (Michigan), Jacksonville (Florida), and our first joint venture restaurant in the Middle East in Jeddah (Saudi Arabia); and |
|
|
• |
From Fiscal 2016 to Fiscal 2017, revenue grew 9.0% to $314.4 million. |
2
AUVs are a key metric we use in evaluating the performance of our restaurants. See “Management’s Discussion and Analysis of Financial Condition and Results of Operations” for an explanation of how this metric is calculated and how we use this metric in evaluating the performance of our restaurants.
Our Competitive Strengths
We believe the following strengths differentiate us from our competitors and serve as the foundation for our continued growth:
Authentic Cuisine – A Culinary Journey to Brazil
We provide our guests with an experience that is distinctly Brazilian, and our food is at the heart of that experience. Our traditional Brazilian cuisine has been passed down from generation to generation in Brazil and lives on in the way our gaucho chefs prepare, season and continuously fire-roast our meats utilizing the traditional cooking method of churrasco – fire-roasted on skewers over an open flame to expose the natural flavors. Our entrée selection features a variety of carefully cooked and seasoned meats including Brazilian style cuts of beef such as the fraldinha and the picanha, our signature cut of steak, as well as other premium beef cuts such as filet mignon and rib eye, lamb, chicken, pork and seafood items. Each cut is carved table-side by our gaucho chefs in a manner designed to both enhance the tenderness of each slice and meet our guests’ desired portion size and temperature. At Fogo de Chão, every table is a chef’s table. To complement our meat selection, a variety of sharable side dishes, including warm cheese bread, fried bananas and crispy polenta, are brought to each table and replenished throughout the meal. For guests preferring lighter fare, we also offer Brazilian-inspired à la carte seafood options, a Market Table only option and a selection of small plates. Our Market Table, which features a variety of gourmet side dishes, seasonal salads, Brazilian hearts of palm, fresh-cut vegetables, aged cheeses and cured meats is immediately available once our guests are seated. We believe it pays homage to the kitchen tables of Southern Brazil where families share fresh produce and seasonal salads grown locally. Our menu is enhanced by an award-winning wine list and a full bar complete with a selection of signature Brazilian drinks such as the caipirinha.
Interactive, Approachable Fine-Dining Experience Delivered By Our Gaucho Chefs
We believe that we offer our guests an upscale, approachable and friendly atmosphere in elegant dining rooms that is complemented by the personalized, interactive experience with our gaucho chefs and team members. Skilled artisans trained in the centuries-old Southern Brazilian cooking tradition of churrasco and the culture and heritage of Southern Brazil, the home of churrasco, our gaucho chefs are central to our ability to maintain consistency and authenticity throughout our restaurants in Brazil and the US. Due to our significant operations in Brazil, we are able to place many of our native Brazilian gaucho chefs in restaurants in the US, which we believe preserves the distinctly Brazilian attributes of our brand. Our team members focus on anticipating guests’ needs and helping guests navigate our unique dining experience for a memorable visit.
Our gaucho chefs butcher, prepare, cook and serve our premium meats to each guest, as well as engage and interact with them. We utilize a continuous style of service, where each of our gaucho chefs approaches guests at their table with various selections of meat, providing our guests with the cut, temperature and quantity they desire. During these interactions, our gaucho chefs learn each guest’s specific preferences and are able to tailor their dining experience accordingly. In addition to providing an entertaining and engaging experience, our continuous service allows our guests to control the entrée variety, portions and pace of their meal, which we believe maximizes the customization of their experience and the satisfaction they receive from dining at our restaurants.
Award-Winning Concept with a Compelling Value Proposition and Broad Appeal
We believe that the combination of our high-quality Brazilian cuisine, differentiated dining experience and value proposition with menu price options like our Full Churrasco Experience prix fixe menu, Gaucho Lunch, Weekend Brazilian Brunch and Happy Hour leads our restaurants to appeal to a wide range of demographics, including both men and women, and socioeconomic groups. We believe our restaurants provide a preferred venue for various dining occasions, including intimate gatherings, family get-togethers, business functions, convention banquets and other celebrations. Many of our guests dine at our restaurants multiple times per year.
Our restaurants have received numerous awards and accolades from critics and reviewers in the US and Brazil. For example, we have been nationally recognized by Nation’s Restaurant News, Zagat and Wine Spectator Magazine, and we have received awards from local media in the markets we operate, including Atlanta Magazine, Chicago Tribune, Dallas Observer and Houston Business Journal. Additionally, our restaurants are consistently included among the top upscale dining options by reputable online reviewers such as Yelp and Urban Spoon. We believe that the authenticity of our brand is demonstrated by the fact that we have received multiple “best of” restaurant awards from Veja Magazine.
3
Unique Operating Model Drives Attractive Restaurant-Level Profitability
Through the consistent execution of our unique business model, we are able to produce what we believe is attractive restaurant-level profitability by optimizing labor and food costs. For Fiscal 2017, the sum of our food and beverage costs and compensation and benefits costs (or “prime costs”) as a percentage of revenue was 52.5%. Our favorable performance on the largest components of a restaurant’s cost structure, which drives our restaurant contribution margins, is due to the following unique structural characteristics of our operational model:
|
|
• |
The dual role our gaucho chefs play as both chef and server significantly reduces back-of-the-house labor costs; |
|
|
• |
Simple cooking technique and streamlined food offering, combined with table-side service and plating, allow for efficient kitchen and server operations, reducing labor costs; |
|
|
• |
Our gaucho chefs work as a team with cross-functional roles and responsibilities, increasing productivity, speed of service and guest satisfaction, while reducing labor costs; |
|
|
• |
Simple, space-efficient cooking technique and streamlined menu reduces our kitchen’s footprint and maximizes space devoted to front-of-the-house tables, which allows our restaurants to achieve higher sales per square foot and enables us to leverage our fixed costs such as occupancy; |
|
|
• |
Our self-service Market Table requires minimal staffing and kitchen preparation, thereby reducing labor costs, and provides us flexibility in the range of items we offer, which helps us manage food costs through seasons and market cycles; |
|
|
• |
In-house butchering by our highly skilled gaucho chefs maximizes the yield on our meat cuts, thereby reducing food costs; and |
|
|
• |
Our wide variety of proteins offered provides us flexibility in sourcing our meat selection, which help us optimize food costs. |
Attractive Cash-on-Cash Returns Create New Restaurant Growth Opportunity
Our business model produces attractive unit volumes and restaurant contribution margins that drive attractive cash-on-cash returns in excess of 40%. For Fiscal 2017, we generated AUVs of approximately $7.7 million in the US and approximately R$14.6 million (Brazilian Real) in Brazil. We target cash-on-cash returns in excess of 40% for new restaurant development by the end of the third full year of operation. We calculate cash-on-cash return by dividing our restaurant contribution in the third year of operation by our initial investment costs (net of pre-opening costs and tenant allowances). Our restaurants perform well across a diverse range of geographic regions, population densities and real estate settings, which we believe demonstrates the portability of our concept to new markets. We believe the combination of our attractive cash-on-cash returns, proven concept portability, and current footprint, supports further use of cash flow to grow our restaurant base and creates an attractive new restaurant growth opportunity.
Highly Attractive Concept for Domestic and International Real Estate Developers Supports Growth
Due to the broad appeal of our brand, the diversity of our guest base and the relatively high number of weekly visits to our restaurants, our concept is a preferred tenant for real estate developers. Landlords and developers, both in the US and internationally, seek out our restaurants to be anchors for their developments as they are highly complementary to national retailers. Our ability to achieve AUVs that are comparable to those of other high-end steakhouses despite our lower average check demonstrates our capacity to attract more guests than many of our competitors. Our AUVs, brand recognition and relatively high guest traffic position us well to negotiate prime locations within a development and favorable lease terms, which enhance our return on invested capital.
We believe our concept has international appeal and makes us an attractive tenant for international real estate developers. We also believe we will be able to leverage our brand strength to negotiate attractive terms in desirable locations as we grow outside the US and Brazil. We have entered into joint ventures to expand our operations in Mexico and in certain locations in the United Arab Emirates, Qatar, Kuwait, Oman, Bahrain, the Kingdom of Saudi Arabia and Lebanon. We currently have two joint venture restaurants located in Mexico City, one in Jeddah, Saudi Araba, and one in Dubai, United Arab Emirates.
Our Growth Strategies
We plan to continue to expand our restaurant footprint and drive revenue growth, improve margins and enhance our competitive positioning by executing on the following strategies:
4
We believe we are in the early stages of our growth with 51 current restaurants, 38 in the US, nine in Brazil, two in Mexico, one in Jeddah, Saudi Arabia and one in Dubai, United Arab Emirates. Based on internal analysis and a study prepared by an independent third party, we believe there is long-term potential for more than 100 domestic restaurant sites, with additional new restaurants internationally, due to the broad appeal of our differentiated concept, attractive cash-on-cash returns, flexible real estate strategy and successful history of opening new restaurants. We have a long track record of successful new restaurant development, evidenced by having grown our restaurant count by a multiple of 10 since 2000 and at a 12.4% CAGR since 2010. We target cash-on-cash return returns in excess of 40% for new restaurant development by the end of the third full year of operation. We calculate our cash-on-cash return by dividing our restaurant contribution in the third year of operation by our initial investment costs (net of pre-opening costs and tenant allowances). We believe our concept has proven portability, with attractive AUVs and cash-on-cash returns across a diverse range of geographic regions, population densities and real estate settings.
We will continue to pursue a disciplined new restaurant growth strategy primarily in the US in both new and existing markets where we believe we are capable of achieving sales volumes and restaurant contribution margins that generate attractive cash-on-cash returns. We opened six restaurants during Fiscal 2017, including our first joint venture restaurant in Jeddah, Saudi Arabia, which opened in August 2017. Over the next five years, we plan to increase our company-owned restaurant count by at least 10% annually, with North America being our primary market for new restaurant development. In addition, we plan to grow in other international markets.
|
|
• |
Open New Restaurants in the United States. We believe the US can support a considerable number of additional Fogo de Chão restaurants and will continue to be our primary market for new restaurant development. Based on internal analysis and a study prepared by an independent third party, we believe there is long-term potential for more than 100 domestic sites across large- and mid-sized markets as well as urban and suburban locations that can support Fogo de Chão restaurants. |
|
|
• |
Open New Restaurants in Brazil. Based on analysis performed by our development team, we believe there is an opportunity to open additional restaurants in Brazil, the birthplace of Fogo de Chão. Over the next five years, we plan to opportunistically open new restaurants throughout the country as attractive real estate locations become available. In addition to providing attractive returns on invested capital, our operations in Brazil allow us to maintain our authentic and distinctive churrasco heritage and support the global growth of our brand. |
|
|
• |
Open New Restaurants in Other International Markets. We will selectively consider other international markets, as we believe attractive opportunities for opening new restaurants exist in large cities and business centers in certain international markets including Asia, Australia, Canada, Europe, the Middle East and South America. We will pursue growth in these markets through a combination of company-owned restaurant development and joint ventures, which we believe allows us to expand our brand with limited capital investment by us. In August 2017 and February 2018, we opened joint venture restaurant in Jeddah, Saudi Arabia and in Dubai, UAE. |
Our current restaurant investment model targets an average cash investment of $4.5 million per restaurant, net of tenant allowances and pre-opening costs, assuming an average restaurant size of approximately 8,500-10,000 square feet, an AUV of $7.0 million and a cash-on-cash return in excess of 40% by the end of the third full year of operation.
The investment targets for our new restaurants do not consider any allocations of corporate support expense, non-cash items such as depreciation, amortization and equity-related compensation expense, or income taxes, and do not represent a targeted return on an investment in our common stock. Additionally, the actual performance of any new restaurant may differ from the originally targeted performance due to a variety of factors, many of which are outside of our control, and such differences may be material. There can be no assurance that any new restaurant opened will have similar operating results to those of established restaurants. See “Risk Factors—Risks Related to Our Business and Industry—Our historical revenue and AUVs may not be indicative of our future financial performance.”
Grow Our Comparable Restaurant Sales
We believe the following strategies will allow us to grow our comparable restaurant sales:
|
|
• |
Food and Beverage Innovation. We seek to introduce innovative items that we believe align with evolving consumer preferences and broaden our appeal, and we will continue to explore ways to increase the number of occasions for guests to visit our restaurants. In order to drive guest frequency and broaden the appeal of our menu, we have added our new Gaucho Lunch menu, Weekend Brazilian Brunch, seafood items and on-trend seasonal food and beverage offerings. Additionally, we believe there are significant day-part opportunities with our Bar Fogo concept, a “small plates” menu served at the bar, Happy Hour and special occasion menus. |
5
|
|
• |
Further Grow Our Large Group Dining Sales. We believe our differentiated dining experience, open restaurant layout, speed of service and compelling value proposition make us a preferred destination for group dining occasions of all types. We currently have group sales manager positions at all of our US restaurants who introduce large group reception and meeting packages, which have generated significant momentum in group sales growth. We believe the investments we have made in our group sales business will continue to yield positive results. |
|
|
• |
Continue to Invest in Our Marketing to Drive Traffic. We will continue to invest in marketing and advertising to drive guest trial and frequency. We continue to introduce new marketing initiatives through various channels, including social, online, print, digital advertising, TV and radio media, with the intent to promote brand awareness. We will continue to harness word of mouth and grow our social media and e-mail marketing fan base through thoughtful planning, unique promotions and rich content that reward loyalty and increase guest engagement with our brand. We believe we drive repeat traffic by becoming our guests’ preferred upscale restaurant destination and believe targeted marketing investments that heighten awareness and increase trial and frequency reinforce the premium image of our brand and highlight the authenticity of our dining experience will continue to generate guest loyalty and promote brand advocacy. |
|
|
• |
Remodel Select Restaurants. We will continue to remodel select restaurants to enhance the guest experience, highlight our brand attributes and encourage guest trial and frequency. We also believe there are opportunities to optimize restaurant capacity and enhance merchandising to maximize sales per square foot. |
Improve Margins by Leveraging Our Infrastructure and Investments in Human Capital
To support our future growth and improve our operations and management team, we continue to incrementally add positions to our corporate team in executive positions and key functional areas and have added local sales manager positions and assistant manager positions at the restaurant level. These hires have bolstered key functional areas and supported future growth initiatives including senior leadership, new restaurant site selection and analysis, new restaurant design, group dining, product innovation and in-restaurant employee training. In addition, we have implemented initiatives in our restaurants to improve labor productivity, which we believe will further enhance restaurant profitability and the guest experience. These investments and initiatives have yielded positive results and we believe we will continue to benefit from these investments as we grow our business in the long-term. Furthermore, we expect our general and administrative expenses to decrease as a percentage of total revenue over time as we are able to leverage these investments by growing revenue faster than our fixed cost base. In addition, we have made substantial investments in our IT systems, and we expect to utilize our IT infrastructure for continued improvements in operational efficiency and margins through the use of labor productivity and training tools.
Our Dining Experience
Our restaurants offer price optionality with several ways guests may choose to experience the restaurant. The most well-known is the Full Churrasco Experience; this is our prix fixe menu that includes two courses. Guests begin at the Market Table, which features a variety of gourmet side dishes, seasonal salads, Brazilian hearts of palm, fresh-cut vegetables, aged cheeses, smoked salmon and cured meats, and is available immediately after the guests are seated. The second course of the menu is the rodizio (meat) service. We offer a variety of cuts of beef, lamb, pork and chicken fire-roasted over open flames in the traditional Brazilian style. Gaucho chefs rotate through the dining room, with each server responsible for a single cut of meat that is carved table-side to guests’ specifications. Some of our most popular Brazilian style cuts include the picanha, our signature cut (a part of the sirloin), alcatra (cut from the top sirloin), new beef ancho (the prime part of the rib eye), fraldinha (bottom sirloin), linguica (robust pork sausages) and costela (beef ribs). Each guest has beside them a two-sided medallion with one side red and one side green. When a guest is ready to begin enjoying the various selections of meat they simply turn the medallion to green. This signals our gaucho chefs to visit that table and offer whatever cut of meat they are serving. Guests can pause the service at any time by turning the medallion to red and then back to green when they are ready to try additional selections, and can communicate to our gauchos any specific cut of meat they prefer. The medallion allows customization so the guest can control the pace and choice of meats. Each cut is carved by our gaucho chefs in a manner designed to both enhance the tenderness of each slice as well as meet our guests’ desired portion size and temperature. Finally, to complement the meats during the Full Churrasco Experience, a variety of sharable side dishes, including warm cheese bread, fried bananas and crispy polenta, are brought to each table and replenished throughout the meal. Our restaurants also offer a selection of traditional desserts, including papaya cream and tres leches.
6
In addition to our Full Churrasco Experience and à la carte seafood items, we have launched new menu options such as Gaucho Lunch and Weekend Brazilian Brunch. Our Gaucho Lunch, available Monday through Friday at all US locations, allows our guests to start with the Market Table and then have the choice to add a single selection of meat at a lower price than the full lunch experience. We have expanded hours at our US locations and have rolled out our Weekend Brazilian Brunch on Saturdays and Sundays. Our Weekend Brazilian Brunch menu, which is priced less than the full dinner menu, includes the Full Churrasco Experience as well as some new signature brunch items.
Our menu options are enhanced by an award-winning wine list and a full bar complete with a selection of signature Brazilian drinks such as the caipirinha. We also offer Bar Fogo, a primarily “small-plates” menu offered at the bar designed to enhance our bar experience, increase alcohol sales and drive higher spend per guest. We believe there is substantial opportunity to increase guest frequency and spend per guest through continued menu innovation and further day-part expansion.
Site Selection and Development
New Restaurant Development
We will continue to pursue a disciplined restaurant growth strategy in markets where we believe we are capable of achieving sales volumes and restaurant contribution margins that achieve attractive cash-on-cash returns. Over the next five years, we plan to increase our company-owned restaurant count by at least 10% annually.
We view the US as our primary market for new restaurant development. Our restaurants perform well across a diverse range of geographic regions, population densities and real estate settings. Based on internal analysis and studies by an independent third party, we believe there is long-term potential for more than 100 sites in the US to support Fogo de Chão restaurants. In Brazil, we plan to opportunistically open new restaurants throughout the country over the next five years as attractive real estate locations become available. We will continue to selectively consider other international markets, as we believe attractive opportunities for opening new restaurants exist in Asia, Australia, Canada, Europe, Mexico, the Middle East and South America.
We will pursue international expansion beyond Brazil in large cities through a combination of company-owned restaurant development and joint ventures. We have developed a joint venture strategy to grow our restaurant base in new international jurisdictions by leveraging the capital and local market expertise of restaurant operating partners to enable us to enter these new markets efficiently. We opened our third joint venture restaurant in Jeddah, Saudi Arabia in August 2017. We will pursue growth in Mexico and the Middle East through our joint venture relationships, which we believe allows us to expand our brand with limited capital investment by us.
There is no guarantee that we will be able to increase the number of our restaurants. We may be unsuccessful in expanding within our existing or into new markets for a variety of reasons described herein under “Risk Factors,” including competition for guests, sites, employees, licenses and financing.
Market and Site Selection Process
We consider market and site selection to be critical to our long-term success because the location of a restaurant is a critical variable in its long-term success, and we accordingly devote considerable resources to market analysis, real estate planning and site selection.
We use a combination of our internal development committee as well as a national real estate broker interfacing with local networks in our target markets to identify and assess potential sites for new restaurant development. Our in-house real estate team has experience with a wide range of national restaurant brands. We utilize sophisticated analytical tools designed to uncover characteristics that we believe drive successful restaurant openings. In the US, we utilize two complementary site selection tools for market planning: (i) an independent third party that utilizes transaction data based on actual guest zip codes to identify the most valuable psychographic guest segments and maps those segments to uncover trade areas that contain the highest concentration of our core guests in Designated Market Areas (“DMAs”) to help us prioritize market and site selection and (ii) a second independent third party, which also uses psychographic criteria as well as site-specific features, location of competitors and customer surveys to further refine the search within potential DMAs.
Criteria for evaluating market expansion opportunities include total population and population density, guest demographics, total DMA restaurant sales, gross domestic product per capita, labor force and unemployment rates, availability of premier site locations, competition penetration and projected unit economics, among other things. We seek out locations with high average household income and commercial density as well as traffic drivers such as high daytime population and proximity to luxury hotels, meeting spaces and airports and sites with a strong mix of retail co-tenancy.
7
Our real estate process is led by our internal development committee, which is comprised of senior management and members of our real estate team. The development committee meets periodically to review new site opportunities and recommends new locations to our board of directors for approval. Once a location has been approved by the board of directors, we begin a design process to align the characteristics of the site to our brand attributes.
Restaurant Design
We place significant emphasis on the unique design and atmosphere of our restaurants. Each of our restaurants has a unique layout to optimize available space, and we have a flexible restaurant design. This flexibility enhances our growth opportunity, since our concept performs well in a diverse range of property types, building sizes and locations from high-density urban to less dense suburban markets with either in-line or free-standing building types.
Restaurant design is handled by our in-house architectural team utilizing in-house resources as well as local third-party architects in the markets where we develop restaurants. In designing our restaurants, our goal is to provide guests with an open, interactive layout that complements the continuous style of service provided by our gaucho chefs. We believe our restaurant design highlights our Southern Brazilian roots in a modern, contemporary way. This is accomplished through our choice of color palette, imagery and décor, which we believe creates an atmosphere that enhances our guests’ dining experience. Depending on the location and size of the restaurant, guests will find unique elements incorporated in the restaurant design. For example, many restaurants include a glass-enclosed pit roaster prominently displayed with large cuts of meat cooking over an open flame. While all of our restaurants share similar design elements, each restaurant is customized to accommodate the specifics of the location and the available floor space. Our restaurant floor plans have ample space, allowing for a fluid and dynamic setup and provide flexibility to accommodate large groups. Because of the simplicity of our back-of-house operations, we are able to dedicate more floor space for the seating area than some of our competitors, thereby optimizing our restaurant locations and increasing revenue per square foot.
Restaurant Management and Operations
Restaurant Organizational Structure
Each restaurant typically employs approximately 60 to 85 people. There are approximately 10 to 12 gaucho chefs per restaurant. Supporting the gaucho chefs are approximately 10 to 30 servers and approximately 10 to 30 bussers and kitchen staff as well as other operating personnel. Our gaucho chefs butcher, prepare, fire-roast and serve all our meats. Each restaurant has a general manager and two assistant managers, and some of our restaurants in the US employ a third assistant general manager to support growth. To promote authenticity, continuity of the churrasco culture and improved operations, most of our employees holding management-level positions and our general managers are former gaucho chefs.
We emphasize a culture of collaboration within the management of our restaurants to facilitate the continuous development of “best practices” regarding guest service, cost control and growth opportunities. In both our US and Brazilian operations, our general managers meet each week to discuss performance and opportunities for improvement.
Our Gaucho Chefs
Our highly-trained and skilled gaucho chefs perform a combination of “back-of-the-house” and “front-of-the-house” duties. The skill set required to perform as one of our gaucho chefs illustrates the importance of the position in the organization. The responsibilities and skills fall into three general categories – culinary, service, and authenticity:
Culinary
|
|
• |
Assess meat quality; |
|
|
• |
Butcher, season and marinate meats; |
|
|
• |
Forecast nightly business flow and adjust the types and quantities of meats to be cooked to ensure quality and utilize procedures to minimize meat waste; and |
|
|
• |
Cooking temperature management (each meat requires different temperature management techniques). |
8
|
|
• |
Ability to serve in high energy “espeto corrido” style in a safe manner; |
|
|
• |
Delivery and presentation of skewered meats to each table; |
|
|
• |
Customized carving of meats to satisfy the preferences of the guest; |
|
|
• |
Monitor the tables and coordinate with each other, ensuring that each guest is presented with all available cuts of meat; and |
|
|
• |
Ensure that the pace and style of the presentation of each meal is consistent with authentic gaucho traditions. |
Authenticity
|
|
• |
Knowledgeable regarding culture, history, and lifestyle of Southern Brazil and its gauchos; |
|
|
• |
Knowledgeable regarding traditional gaucho cuisine, including the different cuts of meat and the style of cooking; |
|
|
• |
Ability to answer guests’ questions regarding gaucho tradition, culture and cuisine; and |
|
|
• |
Train employees in the US in authentic service, monitor service delivery at each meal and make any corrections needed to preserve the authentic nature of presentation. |
We maintain very high standards for the gaucho chef position. Once selected, the employee must successfully complete an apprenticeship program of 18 to 24 months, which primarily consists of on-the-job training before being certified for the position. The training is not completed after this initial program, as we have implemented a program of continuous training and mentoring. We credit our stringent hiring and intense training practices for our ability to deliver a consistent and authentic product to our guests, which we believe differentiates us from our competition. These practices have also resulted in strong retention rates in our restaurants, with our gaucho chefs and our restaurant general managers who are some of our more tenured team members.
Talent Acquisition, Training and Leadership Development
Our talent management begins with attracting, selecting and training talent that aligns with our values. We believe this approach has been a cornerstone of our success and we continue to focus on our training efforts to ensure our brand standards are maintained globally. Our talent strategy is focused on three core tenets, underpinned by a technology-based platform and web-based tools, including:
|
|
• |
Selection, On-Boarding and Cultural Immersion. We take a balanced approach on selection by attracting and developing like-minded, guest- and hospitality-focused leaders for future management needs. All leaders at all levels of our organization are immersed in the culture and heritage of Fogo de Chão. |
|
|
• |
Competency-Based Learning. After passing an interview and selection process, managers must be certified through an eight- to 12-week in-restaurant management development program. During the onboarding process, newly promoted or hired leaders learn all of the functional positions in the restaurant and develop strong guest-oriented management routines. Training takes place in one of our six training restaurants. All Fogo employees, irrespective of level in the organization, are coached and developed in the competency their role requires and are certified through a validation process. |
|
|
• |
Next Level Leadership. We continue to identify future leaders through our rigorous succession-management process and develop tailored, competency-based development action plans in partnership with direct supervisors at every level of our organization. Our learning and development platforms continue to track development action plans to ensure our Fogo employees are prepared to meet current and future needs. |
Our learning and development platforms are web-based and are delivered with interactive content that engage users and test for retained knowledge. This video-based approach allows us to deliver our learning and development platforms in multiple languages and maintain version control, keeping learning consistent internationally as we continue to develop new content.
Brazilian Gaucho Chef Development and Mentor Process
To help to create an exceptional dining experience and authenticity, we utilize our Brazilian operations as a training ground and recruitment base for our restaurants in the US, selecting talented gaucho chefs to transfer to the US. We pay for English lessons, travel expenses, and immigration expenses for our gaucho chefs.
9
Since opening our first location in the US in 1997, we have brought gaucho chefs to the US from Brazil utilizing various means, including utilization of the L-1B “specialized knowledge” visa which generally permits an employee to remain in the US for up to five years. We also utilize the L-1A “intracompany manager” visa for our employees who qualify. The L-1A visa generally permits an employee to remain in the US for up to seven years. We have applied for and received permanent resident alien (“green card”) immigration status for a number of these transferees.
Since 2013, we have also brought Brazilian gaucho chefs to the US on one-year corporate training programs through use of the J-1 “cultural exchange” visa. The primary focus of this program is training and cultural exchange, including classroom instruction.
Marketing and Advertising
Our marketing goals are to:
|
|
• |
Increase comparable restaurant sales by attracting new guests; |
|
|
• |
Increase frequency (return visits) of existing guests; |
|
|
• |
Support new restaurant openings to achieve sales and profit goals; and |
|
|
• |
Communicate and promote brand positioning as a leading Brazilian Steakhouse through our focus on high-quality ingredients, a high level of service and commitment to the traditional gaucho method of cooking. |
All advertising is coordinated by our corporate office. We utilize various advertising channels to create awareness and drive trial of the brand. These channels may include digital, social media, print, out-of-home, radio and television advertising as well as local restaurant marketing. Other areas of marketing include travel publications and advertising to support the growing social media platforms.
Social Media
Social media is an increasingly important and growing marketing channel. We maintain a strong presence on several social platforms including Facebook, Twitter, YouTube and Instagram, allowing us to maintain a high level of guest engagement and brand awareness. We periodically conduct promotions and provide content on various social platforms to further drive a unique level of guest engagement. We believe our social presence allows us to meaningfully connect with our guests and harness positive word of mouth.
Local Restaurant Marketing
A key strategy utilized by our management teams at the local level is to maintain strong relationships with concierge desks at key area hotels. At various restaurants, managers will also host networking events with chambers and associations to create awareness and goodwill among community organizations.
New Restaurant Openings
New restaurants are supported first by bringing on a local public relations firm to assist in introducing the brand to the market and promoting the brand through media relations. Advertising spend is optimized depending on the market and includes a combination of digital and social advertising, print, out-of-home, radio and television.
Group Sales
We believe our restaurants are preferred group dining venues because of the quality and variety of our menu offering, the efficiency of our service model in handling large groups and our attractive private dining areas. Group sales managers prospect for new business with local businesses and organizations and work with existing guests on larger event planning. We define large groups as reservations with more than 15 guests. We have invested in hiring group sales managers to support all of our US locations as well as select Brazil locations. We believe continued increases in our group sales business represents a growth opportunity.
10
Purchasing, Innovation and Quality Control
Our purchasing strategy is to offer our guests high-quality ingredients while leveraging the flexibility of our operating model to optimize costs. Since our menu does not require exact menu specifications, we innovate utilizing high-quality seasonal items to continually introduce new products while achieving the best available price for a range of proteins, including beef, chicken, lamb and pork, as well as Market Table ingredients. This advantage allows us to shift the mix of our ingredients to offset inflationary pressure and optimize the cost of the basket of products we deliver without compromising the guest experience. Our belief is that all innovation begins with focused, seasonal procurement that keeps our menu on-trend and maintains our affordable price positioning.
In addition, we have flexibility in the type and weights of proteins we purchase and serve, which helps us to manage our food costs. We have national supplier arrangements in the US ranging from three months to one year depending on the product and season. We monitor contracts monthly, and shift the mix of our products served to respond to changes in pricing, thus optimizing the cost of the ingredients we offer in our restaurants. Finally, management of food waste through proper training and procedures at the restaurant level represents another lever through which we control our food costs given our prix fixe menu.
We maintain strict quality standards at our restaurants. Each employee is expected to adhere to these standards, and it is the responsibility of the general managers and the gaucho chefs to ensure that these standards are upheld. We are committed to providing guests with high quality, fresh products and superior service. Through the use of our training programs, extensive experience requirements for our gaucho chefs and our commitment to hiring and developing staff, we are able to maintain high standards and guidelines for all menu items across our restaurants. Similarly, we rely on a quality assurance team to conduct regular, comprehensive audits of our suppliers to ensure we are offering our guests high-quality products.
Management Information Systems
All of our restaurants use computerized point-of-sale and back-office systems that we believe are scalable to support our continued growth. The systems provide a touch screen interface and integrated, high-speed credit card and gift card processing. The point-of-sale computers are designed specifically for the restaurant industry and the system is used to collect daily transaction data which generates information about daily sales, product mix and average check totals that we actively analyze. Applications inside the restaurant capture guest and reservation information, aiding in the management of the restaurant’s tables during service and optimizing our guests’ experience.
Our corporate systems provide our management with operating reports that show restaurant performance comparisons with budget and prior year results. These systems allow us to monitor restaurant sales, food and beverage costs, operating expenses and other restaurant trends on a regular basis and enable regular communication and collaboration between restaurants and the corporate office.
Our ongoing information technology strategy and goals are centered around further transforming information technology into a growth-enabling function by upgrading our telecommunications infrastructure, increasing technical staff knowledge, creating a technology platform to support group sales growth and enabling productivity improvements for our restaurant locations.
Competition
The restaurant industry is highly competitive. The number, size and strength of our competitors vary widely by region. There are many different segments within the restaurant industry, which are distinguished based on the type of food, food quality, service, location, associated price-to-value relationship and overall dining experience. Our restaurants compete with a number of restaurants within their markets, both locally owned restaurants and other restaurants that are members of regional or national chains based on the quality and variety of our menu offering, our service model and our authentic Brazilian cuisine. Our competition continues to intensify as competitors increase the breadth and depth of their product offerings and open new restaurants. We compete in the full-service dining category with other Brazilian-style steakhouses and local and national upscale steakhouses such as Ruth’s Chris Steakhouse, Del Frisco’s, The Capital Grille, Smith & Wollensky and Morton’s The Steakhouse.
Our Employees
As of December 31, 2017, we had 3,491 employees, of which 3,380 were employed in our restaurants, including the group sales teams for each restaurant, and 111 were corporate personnel. None of our employees in the US are currently covered by a collective bargaining agreement though many of our employees in Brazil participate in industry-wide trade union programs. We have had no labor-related work stoppages, and we believe our relations with our employees are generally good.
11
Our restaurants are subject to licensing and regulation by state and local health, safety, fire and other authorities, including licensing and regulation requirements for the sale of food and alcoholic beverages. Failure to obtain or retain food, liquor or other licenses would adversely affect the operations of restaurants. We believe we maintain the necessary restaurant, alcoholic beverage and retail licenses, permits and approvals. Our restaurants are subject in each state in which we operate to “dram shop” laws, which allow, in general, a person to sue us if that person was injured by an intoxicated person who was wrongfully served alcoholic beverages at one of our restaurants.
The development and construction of additional restaurants are also subject to compliance with applicable zoning, land use and environmental regulations. We are subject to federal, state and local laws and regulations concerning waste disposal, pollution, protection of the environment, and the presence, discharge, storage, handling, release and disposal of, and exposure to, hazardous or toxic substances. Our restaurants must comply with the applicable requirements of the Americans with Disabilities Act of 1990 (“ADA”) and related federal and state statutes which prohibit discrimination on the basis of disability with respect to public accommodations and employment.
Federal and state labor laws govern our relationship with our employees and affect our operating costs. These laws include minimum wage requirements, overtime, unemployment tax rates, workers’ compensation rates, citizenship requirements and sales taxes. We are subject to the Fair Labor Standards Act, the Occupational Safety and Health Act, the Immigration Reform and Control Act of 1986, the Patient Protection and Affordable Care Act (“PPACA”), and various federal and state laws governing such matters as minimum wages, overtime, tips, tip credits, employee breaks and other working conditions.
We are subject to federal and state laws and regulations relating to information security, privacy, cashless payments and consumer credit protection and fraud.
In addition to domestic government regulation, our international business is subject to the US Foreign Corrupt Practices Act of 1997 and the laws and regulations of other countries, including tax requirements, labor laws, union rules, immigration restrictions and procedures and anti-corruptions laws.
For a discussion of the potential impact on our business of a failure by us to comply with applicable domestic and international laws and regulations, see “Risk Factors — Risks Related to Our Business and Industry — Our business is subject to extensive regulation and we may incur additional costs or liabilities as a result of government regulation of our restaurants.” Changes in, or any failure to comply with, applicable laws or regulations could materially adversely affect our ability to operate our restaurants and/or increase our cost to do so, which could materially adversely affect our financial performance.
Environmental Matters
Our operations are also subject to national, provincial, state and local laws and regulations in the US, Brazil and Mexico relating to environmental protection, including regulation of discharges into the air and water, storage and disposal of waste and clean-up of contaminated soil and groundwater. Under various national, provincial, state and local laws, an owner or operator of real estate may be liable for the costs of removal or remediation of hazardous or toxic substances on, in or emanating from such property. Such liability may be imposed without regard to whether the owner or operator knew of, or was responsible for, the presence of such hazardous or toxic substances.
Intellectual Property
Our principal trademarks include FOGO, FOGO DE CHÃO, BAR FOGO, and our campfire design, which we have registered with the United States Patent and Trademark Office. We have also registered or applied for registration of the FOGO EXPRESS, FOGO GRILL, BAR FOGO, FOGO TO GO, THE GAUCHO WAY OF PREPARING MEAT, and various designs as trademarks in the US. In addition, we have registered or applied for FOGO DE CHÃO, FOGO’S, various FOGO and FOGO DE CHÃO-formative terms, our campfire design, and other terms as trademarks in Brazil. Several of our principal marks are also registered or applied-for in many foreign countries.
We believe that our trademarks, service marks and other intellectual property rights have significant value and are important to the marketing and reputation of our brand. An important part of our intellectual property strategy is the monitoring and enforcement of our rights in markets in which our restaurants currently exist or markets which we intend to enter in the future. We monitor international trademark registers to discover and oppose third-party trademark applications for confusingly similar trademarks to preserve and enhance the scope of protection for our brands.
12
We enforce our rights through a number of methods, including sending cease-and-desist letters or making infringement claims in federal court. We are aware of third-party restaurants with names similar to our trademarks in certain limited geographical areas in the US, Brazil and elsewhere and are pursuing enforcement of our rights. However, we cannot predict whether steps taken to protect such rights will be adequate. See “Risk Factors—Risks Related to Our Business and Industry—Any failure to protect and maintain our intellectual property rights could adversely affect the value of our brand.”
The Company
Fogo de Chão, Inc. was incorporated under the name Brasa (Parent) Inc. on May 24, 2012 in connection with the acquisition (the “Acquisition”) on July 21, 2012 of Fogo de Chão Churrascaria (Holdings) LLC, a Delaware limited liability company, and its parent company, FC Holdings Inc., a Cayman Islands exempt company, by a collaborative group consisting of funds affiliated with Thomas H. Lee Partners, L.P. (“THL” and along with such funds and their affiliates, the “THL Funds”) and other minority investors. The Acquisition was financed by loans to Brasa Holdings and equity contributions by the THL Funds and certain members of management. On December 17, 2014, we changed our corporate name from Brasa (Parent) Inc. to Fogo de Chão, Inc.
Fogo de Chão, Inc. is a holding company with no assets or operations of its own. The Company owns 100% of Brasa (Purchaser) Inc., which owns Brasa (Holdings) Inc. (“Brasa Holdings”). Brasa Holdings owns Fogo de Chão (Holdings) Inc., which owns the Company’s domestic and foreign operating subsidiaries.
Available Information
We are subject to the information and periodic and current reporting requirements of the United States Securities Exchange Act of 1934 (“Exchange Act”), and, in accordance therewith, we file periodic and current reports, proxy statements and other information with the United States Securities and Exchange Commission (“SEC”). Such periodic and current reports, proxy statements and other information are available to the public on the SEC's website at www.sec.gov and free of charge through our website at www.fogodechao.com. To receive copies of public records not posted to the SEC's website at prescribed rates, you may complete an online form at www.sec.gov, send a fax to (202) 772-9337 or submit a written request to the SEC, Office of FOIA/PA Operations, 100 F Street, N.E., Washington, D.C. 20549-2736. You may call the SEC at 1-800-SEC-0330 for further information. Our website address is provided as an inactive textual reference only. The information contained on, or accessible through, our website is not part of this Annual Report on Form 10-K and is not incorporated by reference herein.
RISK FACTORS
This section and other parts of this Annual Report on Form 10-K contain forward-looking statements, within the meaning of the Private Securities Litigation Reform Act of 1995, which are subject to risks and uncertainties. Forward-looking statements relate to expectations, beliefs, projections, guidance, future plans, objectives and strategies, anticipated events or trends and similar expressions concerning matters that are not historical facts, such as statements regarding our future financial condition or results of operations, our prospects and strategies for future growth, the development and introduction of new products, and the implementation of our marketing and branding strategies. Forward-looking statements can also be identified by words such as “may,” “will,” “should,” “expects,” “plans,” “anticipates,” “believes,” “estimates,” “predicts,” “potential,” “seeks,” “intends,” “targets” or the negative of these terms or other comparable terminology. Forward-looking statements are not guarantees of future performance and actual results may differ significantly from the results discussed in the forward-looking statements. Factors that might cause such differences include, but are not limited to, the risk factors discussed below. The risk factors and other factors discussed in this Form 10-K are in addition to those contained in any other cautionary statements, written or oral, which may be made or otherwise addressed in connection with a forward-looking statement or contained in any of our subsequent filings with the SEC. Because of these factors, we caution against placing undue reliance on forward-looking statements. Forward-looking statements speak only as of the date on which they are made. Except as required by applicable securities law, we undertake no obligation to update any forward-looking statement to reflect events or circumstances after the date on which the statement is made or to reflect the occurrence of unanticipated events.
13
Risks Related to Our Agreement to be Acquired by Rhône
The pendency of our agreement to be acquired by Rhône could have an adverse effect on our business.
On February 20, 2018, we announced an agreement to be acquired by investment entities affiliated with Rhône Capital (together with its affiliates, “Rhône”) pursuant to an Agreement and Plan of Merger among Prime Cut Intermediate Holdings Inc., a Delaware corporation (“Parent”) and an investment entity affiliated with Rhône Capital V L.P. and Prime Cut Merger Sub Inc., a Delaware corporation and a wholly owned subsidiary of Parent (“Merger Subsidiary”), pursuant to which, among other things and subject to the satisfaction or waiver of specified conditions, Merger Subsidiary will merge with and into Fogo. As a result of the merger, the Company will survive as a wholly owned subsidiary of Parent. Upon the consummation of the merger, subject to certain exceptions, each share of our common stock issued and outstanding immediately prior to the merger will be converted into the right to receive $15.75 in cash, without interest.
The announcement and pendency of the acquisition by Rhône could cause disruption in the business, including experiencing (i) the potential loss or disruption of commercial relationships prior to the completion of the merger, or (ii) a potential negative effect on our ability to retain management, sales and other key personnel as a result of the announcement of the merger. Such disruptions may continue to occur through the closing of the merger.
The merger agreement generally requires us to operate our business in the ordinary course of business pending consummation of the merger, but includes certain contractual restrictions on the conduct of our business. In addition, the pendency of the acquisition by Rhône and the completion of the conditions to closing could divert the time and attention of our management.
All of the matters described above, alone or in combination, could materially and adversely affect our business, financial condition, results of operations and stock price.
The failure to complete the merger with Rhône could adversely affect our business.
We cannot provide assurance that our pending acquisition by Rhône will be completed. If the pending merger is not completed, the share price of our common stock may drop to the extent that the current market price of our common stock reflects an assumption that a transaction will be completed. On February 16, 2018, the day before the announcement of the pending merger, our stock’s closing price was $12.55. On February 20, 2018, following the announcement of the pending merger, our stock’s closing price was $15.55.
Our ability to consummate the merger may be affected by any of the following:
|
|
• |
failure of Rhône to obtain the financing required to consummate the proposed transaction by the end date specified in the merger agreement; |
|
|
• |
the risk that the regulatory approval required for the proposed transaction is delayed, is not obtained, or is obtained subject to conditions that are not anticipated; |
|
|
• |
the occurrence of events or circumstances constituting a “material adverse effect” on the Company; and |
|
|
• |
the failure to satisfy any of the other closing conditions by the end date specified in the merger agreement. |
There can be no assurance that our business or our financial condition will not be adversely affected, as compared to the condition prior to the announcement of the merger, if the merger is not consummated.
Risks Related to Our Business and Industry
The restaurant industry in general, and the specialty and fine-dining segment in particular, are affected by changes in economic conditions, which could negatively affect our guest traffic, business, financial condition and results of operations.
Dining at restaurants is a discretionary activity for consumers, and, therefore, we are subject to the effects of any economic conditions. Our restaurants cater to both business and social guests. Accordingly, our business is susceptible to economic factors that may result in reduced discretionary spending by our clientele. We also believe that consumers generally tend to make fewer discretionary expenditures, including for high-end restaurant meals, during periods of actual or perceived negative economic conditions. Changes in spending habits as a result of an economic slowdown, inflation, increases in food and other commodity costs or lower consumer confidence are likely to decrease the number of restaurant guests and average revenue per guest and put pressure on pricing, which would adversely affect our business and financial performance.
14
The US, Brazil or the specific markets in which we operate may suffer from depressed economic activity, recessionary economic cycles, higher fuel or energy costs, low consumer confidence, high levels of unemployment, reduced home values, increases in home foreclosures, investment losses, personal bankruptcies, reduced access to credit or other economic factors that may affect consumer discretionary spending. During the economic crisis and recession from late 2007 to mid-2009, our business was materially adversely affected by a significant decrease in revenues from our restaurants in the US and Brazil due to adverse economic conditions in those areas. Additionally, the Brazilian economy was negatively impacted by an economic recession that began in 2014 and is viewed to have technically ended mid-2017. The Brazilian economy may be negatively affected in 2018 by public finances and the elections scheduled in October 2018. If negative economic conditions persist for a long period of time or become more pervasive, consumers might make long-lasting changes to their discretionary spending behavior, including dining out less frequently on a permanent basis and generating lower average check sizes at our restaurants. If restaurant revenue decreases, our profitability could decline as we spread fixed costs across a lower level of revenue. Reductions in staff levels, asset impairment charges and potential restaurant closures could result from prolonged negative restaurant sales. There can be no assurance that the macroeconomic environment or the regional economics in which we operate will improve significantly or that government stimulus efforts will improve consumer confidence, liquidity, credit markets, home values or unemployment, among other things.
The future performance of the economies in the US, Brazil and other specific markets in which we operate is uncertain and may be affected by economic, political and other factors that are beyond our control. These factors, which also affect consumer spending on restaurant meals, include, among others, national, regional and local economic conditions, levels of disposable consumer income, consumer confidence and the effects of geopolitical incidents. We believe that any negative developments relating to these factors, whether actual or perceived, could adversely impact our business and financial performance.
We face significant competition from other restaurant companies, which could adversely affect our business and financial performance and make it difficult to expand in new and existing markets.
We must compete successfully with other restaurant companies in existing or new markets in order to maintain and enhance our overall financial performance. The restaurant industry in the US, Brazil and other specific markets in which we operate is highly competitive in terms of price, quality of service, restaurant location, atmosphere, and type and quality of food. We compete with restaurant chains and independently owned restaurants (including, among others, churrascaria operators) for guests, restaurant locations and experienced management and staff. Some of our competitors have greater financial and other resources, have been in business for a longer period of time, have greater name recognition and are more established in the markets where we currently operate and where we plan to open new restaurants. Any inability to compete successfully with other restaurant companies may harm our ability to maintain or increase our revenue, force us to close one or more of our restaurants or limit our ability to expand our restaurant base. Restaurant closings would reduce our revenue and could subject us to significant costs, including severance payments to employees, write-downs of leasehold improvements, equipment, furniture and fixtures, and legal expenses. In addition, we could remain liable for remaining future lease obligations for any terminated restaurant locations.
Churrascaria operators and other competitors in the steakhouse sector of our industry have continued to open restaurants in recent years. If we overestimate demand for our restaurants or underestimate the popularity of competing restaurants, we may be unable to realize anticipated revenue from existing or new restaurants. Similarly, if any of our competitors opens additional restaurants in existing or targeted markets, we may realize lower than expected revenue from our restaurants. Any decrease in the number of restaurant guests for any of our existing or new restaurants due to competition could reduce our revenue and adversely affect our business and financial performance, which could cause the market price of our common stock to decline.
Our Brazilian operations, our international joint ventures and any other future international operations, expose us to economic, regulatory and other risks associated with such countries.
We have long-standing operations in Brazil, where we have nine restaurants. Our Brazilian restaurants accounted for 13.4% of our revenues in Fiscal 2017, 14.8% in Fiscal 2016 and 16.4% in Fiscal 2015. We currently operate through joint ventures in Mexico and the Middle East and intend to expand into other international markets in the future. Our lack of experience in operating restaurants outside of the US and Brazil increases the risk that any international expansion efforts that we may undertake may not be successful. In addition, international operations, including our operations in Brazil, Mexico and the Middle East, subject us to a number of risks, including:
|
|
• |
inflation and currency devaluations; |
|
|
• |
fluctuations in currency exchange rates; |
|
|
• |
foreign and legal regulatory requirements; |
|
|
• |
difficulties in managing and staffing international operations; |
15
|
|
• |
potentially adverse tax consequences, including complexities of international tax systems and restrictions on the repatriation of earnings; |
|
|
• |
expropriation or governmental regulation restricting foreign ownership or requiring divestiture; |
|
|
• |
increases in the cost of labor (as a result of unionization or otherwise); |
|
|
• |
the burdens of complying with different legal standards; and |
|
|
• |
political, social and economic conditions. |
We are subject to the US Foreign Corrupt Practices Act of 1977 (“FCPA”), the US Treasury Department’s Office of Foreign Assets Control (“OFAC”) regulations, other US laws and regulations governing our international operations and similar laws in other countries. Any violation of the FCPA, OFAC regulations or other applicable anti-corruption laws, by us, our affiliated entities or their respective officers, directors, employees and agents could result in substantial fines, sanctions, civil and/or criminal penalties and curtailment of operations in certain jurisdictions and could adversely affect our financial condition, results of operations, cash flows or our availability of funds under our revolving line of credit. Further, detecting, investigating, and resolving actual or alleged violations is expensive and can consume significant time and attention of our management.
We depend on our joint venture partners to perform their obligations in Mexico and the Middle East. We also license certain of our trademarks to our Mexico and Middle East joint ventures for use in connection with operating the Fogo brand. If our partner fails to perform its obligations, or the licensee fails to maintain the quality of the goods and services used in connection with our trademarks, the value of our brand and our trademarks could potentially be harmed and negative publicity could also be associated with us.
If we are unable to account for these risks while operating abroad, our reputation and brand value could be harmed. The occurrence of any of these risks could negatively affect our current international operations and any future expansion into new geographic markets, which would have a material adverse effect on our business and results of operations.
We are a multinational organization faced with increasingly complex tax issues in the jurisdictions in which we operate, including in Brazil, Mexico and the Middle East, and we could be obligated to pay additional taxes in those jurisdictions.
As a multinational organization that operates in several jurisdictions, including the US, Brazil, Mexico, Saudi Arabia and the United Arab Emirates, we may be subject to taxation in jurisdictions with increasingly complex tax laws, the application of which can be uncertain. The tax positions that we have taken or may take in the future may be subject to challenge on audit, and the authorities in these jurisdictions, including Brazil, Mexico, Saudi Arabia and the United Arab Emirates could successfully assert that we are obligated to pay additional taxes, interest and penalties. In addition, the amount of taxes we pay could increase substantially as a result of changes in the applicable tax principles, including increased tax rates, new tax laws or revised interpretations of existing tax laws and precedents, which could have a material adverse effect on our liquidity and operating results. The authorities could also claim that various withholding requirements apply to us or our subsidiaries or assert that benefits of tax treaties are not available to us or our subsidiaries, any of which could have a material impact on us and the results of our operations.
Brazilian economic, political and other conditions, and Brazilian government policies or actions in response to these conditions, may negatively affect our business, results of operations and financial performance, as well as the market price of our common stock.
The Brazilian economy has been characterized by frequent and occasionally extensive intervention by the Brazilian government and unstable economic cycles. The Brazilian government has often changed monetary, taxation, credit, tariff and other policies to influence the course of the country’s economy. For example, the government’s actions to control inflation have at times involved setting wage and price controls, imposing exchange controls and limiting imports into Brazil. Uncertainty over whether the Brazilian federal government may implement changes in policy or regulation may affect economic performance and contribute to economic uncertainty in Brazil.
In 2015, a series of protests began in Brazil against the then current government and President, which resulted in a slight reduction in guest traffic. In 2016, the former President of Brazil was impeached and protests occurred in a number of cities in December 2016 in response to government austerity plans. The term of the current President, who is the subject of investigations by the Brazilian Federal Police and the Office of the Brazilian Federal Prosecutor is due to end in October 2018.
16
Laws regulating the collection of tips in commercial establishments and significantly modifying the existing labor laws were approved in 2017. We anticipate that the new laws will be tested in Brazilian courts. We are attempting to implement the changes required under the new laws, but cannot predict the potential impact of the new laws, or judicial interpretation of such laws, on our business or prospective results of operations.
There are various ongoing investigations into allegations of money laundering and corruption being conducted by the Office of the Brazilian Federal Prosecutor that have negatively impacted the Brazilian economy and political environment. Members of the Brazilian government as well as senior officers of large state-owned companies have faced or are currently facing allegations of corruption and money laundering as a result of these investigations. These individuals are alleged to have accepted bribes by means of kickbacks on contracts granted by the government to several infrastructure, oil and gas and construction companies. A number of senior politicians, including members of Congress, and high-ranking executives officers of major corporations and state-owned companies in Brazil have been arrested, convicted of various charges relating to corruption, entered into plea agreements with federal prosecutors and/or have resigned or been removed from their positions. The potential outcome of ongoing corruption-related investigations is uncertain, but they have already hurt the image and reputation of those companies that have been implicated as well as the general market perception of the Brazilian economy, political environment and the Brazilian capital markets.
We have no control over, and cannot predict, what policies or actions the Brazilian government may take in the future, including in response to protesting activities. These factors, as well as uncertainty over whether the Brazilian government may implement changes in policy or regulations relating to these factors, could adversely affect us and our business, results of operations, financial performance and the market price of our common stock. We cannot predict what policies may be implemented by the Brazilian federal or state governments and whether these policies will negatively affect our business, financial condition, results of operations and prospects.
Our business, results of operations, financial condition and prospects may be adversely affected by exchange control policies, interest rates, liquidity of domestic capital and lending markets, social and political instability, and other economic, political, diplomatic and social developments affecting Brazil.
The Brazilian government regularly implements changes to tax regimes that may increase our tax burden. These changes include modifications in the rate of assessments, non-renewal of existing tax relief and, on occasion, enactment of temporary taxes the proceeds of which are earmarked for designated governmental purposes. Increases in our overall tax burden could negatively affect our overall financial performance and profitability.
Our reporting currency is the US dollar but a significant portion of our revenue and costs and expenses are in the Brazilian Real, so that exchange rate movements may affect our financial performance.
We generate revenue, and incur costs and expenses, in our Brazilian operations denominated in Brazilian reais. The results of our Brazilian operations are translated from reais into US dollars upon consolidation when we prepare our consolidated financial statements. When the US dollar weakens relative to the Brazilian Real, the contribution of our Brazilian operations to our overall results of operations increases. By contrast, when the US dollar strengthens against the Real, the contribution of our Brazilian operations tends to decrease.
The Brazilian currency has historically been subject to significant exchange rate fluctuations in relation to the US dollar and other currencies and has been devalued frequently over the past four decades. These exchange rate movements have been attributable to economic conditions in Brazil, Brazilian governmental policies and actions, developments in global foreign exchange markets and other factors. The Brazilian government has in the past implemented various economic plans and used various exchange rate policies to address exchange rate fluctuation and there can be no assurances the government will not take action in the future.
The Real depreciated 14.3% against the US dollar during Fiscal 2014 and depreciated further by 48.5% during Fiscal 2015. The Real strengthened in relation to the US dollar 17.3% during Fiscal 2016 but then experienced a slight depreciation of 1.2% during Fiscal 2017. Our reported consolidated results of operations have periodically been affected by the strength of the US dollar relative to the Brazilian Real and further appreciation of the US dollar in the future periods could affect adversely our consolidated results of operations in those periods. Disruptions in financial markets may also result in significant changes in foreign exchange rates in relatively short periods of time which further increases the risk of an adverse currency effect. We do not currently use financial derivatives or hedging agreements to manage our currency exposure. In the future, we may choose to use a combination of natural hedging techniques and financial derivatives to protect against foreign currency exchange rate risks. However, such activities may be ineffective or may not offset more than a portion of the adverse financial effect resulting from foreign currency variations.
17
Our company’s principal asset is its ownership interest in Fogo de Chão (Holdings) Inc. and if that subsidiary or our other subsidiaries are restricted from distributing or repatriating funds to us, pursuant to law, regulation or otherwise, our liquidity, financial condition or results of operations could be materially and adversely affected.
We have no material assets other than our ownership of the equity interests in our subsidiaries and no independent means of generating revenue. To the extent that we need funds, and our subsidiaries are restricted from making such distributions under applicable law or regulation, or is otherwise unable to provide such funds, such restrictions or inability could materially adversely affect our liquidity, financial condition and results of operations.
Brazilian law permits the Brazilian government to impose temporary restrictions on conversions of Brazilian currency into foreign currencies and on remittances to foreign investors of proceeds from their investments in Brazil, whenever there is a serious imbalance in Brazil’s balance of payments or there are reasons to expect a pending serious imbalance. Brazilian banks may also impose restrictions. Any imposition of restrictions on conversions and remittances could hinder or prevent our Brazilian subsidiaries from converting Brazilian currency into US dollars or other foreign currencies and remitting abroad dividends or distributions. As a result, any imposition of exchange controls restrictions could reduce the market prices of the shares of our common stock.
Additionally, the terms of our Credit Agreement, dated as of June 18, 2015, among Brasa (Holdings) Inc., as Borrower, Brasa (Purchaser) Inc., Wells Fargo Bank, National Association, as Administrative Agent and Swing Line Lender, Wells Fargo Bank, National Association and JPMorgan Chase Bank, N.A. as L/C Issuers and the other lenders party thereto (“2015 Credit Facility”) include a number of restrictive covenants that impose restrictions on our subsidiaries’ ability to, among other things, make certain restricted payments, including dividends to us.
Cash repatriation restrictions and exchange controls may also limit our ability to convert foreign currencies such as the Real into US dollars or to remit payments by our Brazilian subsidiaries or businesses located in or conducted within a country imposing restrictions or controls. We may face similar risks in other international jurisdictions in which we operate. While we have repatriated cash historically, should we need to do so in the future to fund our operations, we may be unable to repatriate or convert such cash, or unable to do so without incurring substantial costs which may have a material adverse effect on our operating results and financial condition.
Our future success depends upon the continued appeal of our restaurant concept and we are vulnerable to changes to consumer preferences.
Our success depends, in considerable part, on the popularity of our menu offerings and the overall dining experience provided to guests by our restaurants. Any shift in consumer preferences away from our restaurant concept could negatively affect our financial performance. The restaurant industry is characterized by the continual introduction of new concepts and is subject to rapidly changing consumer preferences, tastes and dining habits. Our sales could be impacted by shifts in consumer preferences arising from dietary concerns relating to calories, sodium or carbohydrates. There can be no assurance that consumers will continue to regard churrascaria-inspired or steakhouse-based food favorably or that we will be able to develop new products that appeal to consumer preferences. Guest preferences may also be affected by a decline in the price of groceries which may increase the attractiveness of dining at home versus dining out. Our business, financial condition and results of operations depend in part on our ability to anticipate, identify and respond to changing consumer preferences. Any failure by us to anticipate and respond to changing guest preferences could make our restaurants less appealing and adversely affect our business.
Our historical revenue and AUVs may not be indicative of our future financial performance.
Our revenue and AUVs have historically been, and will continue to be, affected by, among others, the following factors:
|
|
• |
our ability to execute effectively our business strategy; |
|
|
• |
the square footage and number of seats in new restaurants, which may vary from existing restaurants; |
|
|
• |
initial sales performance by new restaurants; |
|
|
• |
competition; |
|
|
• |
consumer and demographic trends, in particular for ethnic foods, and levels of beef consumption; and |
|
|
• |
general economic conditions and conditions specific to the restaurant industry. |
18
Existing restaurants may fail to maintain revenue and AUV levels consistent with our historical experience. New restaurants may not reach the historical revenue and AUV levels of our existing restaurants or according to our plans, if at all. Any decrease in our revenue or AUVs would negatively affect our financial performance, which could cause the price of our common stock to fluctuate substantially.
Our future growth depends on our ability to open new restaurants in existing and new markets and to operate these restaurants profitably.
Our future financial performance will depend on our ability to execute our business strategy—in particular, to open new restaurants on a profitable basis. We currently operate 38 restaurants in the US, nine restaurants in Brazil, two joint venture restaurants in Mexico and two joint venture restaurant in the Middle East. We opened six restaurants during Fiscal 2017, including our first joint venture restaurant in the Middle East, which opened in August 2017. Over the next five years, we plan to increase our company-owned restaurant count by at least 10% annually, with North America being our primary market for new restaurant development. In addition, we plan to grow in Brazil as well as other international markets, however there is no guarantee that we will be able to increase the number of our restaurants in North America or in international markets. Our ability to successfully open new restaurants is, in turn, dependent upon a number of factors, many of which are beyond our control, including:
|
|
• |
finding and securing quality locations on acceptable financial terms; |
|
|
• |
complying with applicable zoning, land use, environmental and other governmental rules and regulations (including interpretations of such rules and regulations); |
|
|
• |
obtaining, for an acceptable cost, required permits and approvals; |
|
|
• |
having adequate financing for construction, opening and operating costs; |
|
|
• |
controlling construction and equipment costs for new restaurants; |
|
|
• |
weather, natural disasters and disasters beyond our control resulting in delays; |
|
|
• |
hiring, training and retaining management and other employees necessary to meet staffing needs; and |
|
|
• |
successfully promoting new restaurants and competing in the markets in which these are located. |
We continuously review potential sites for future restaurants. Typically, we experience a “start-up” period before a new restaurant achieves our targeted level of operating and financial performance which may include an initial start-up period of sales volatility. The start-up period varies for each new restaurant and may last as long as three years to achieve targeted results. In addition, we face higher operating costs caused by start-up costs including higher food, labor and other direct operating expenses and other temporary inefficiencies associated with opening new restaurants. We may also face challenges such as lack of brand recognition, market familiarity and acceptance when we enter new markets.
Our long-term success is highly dependent on our ability to successfully identify appropriate sites and develop and expand our operations in existing and new markets.
We intend to develop new restaurants in our existing markets, and selectively enter into new markets. There can be no assurance that any new restaurant that we open will have similar operating results to those of existing restaurants. There is no guarantee that a sufficient number of suitable restaurant sites will be available in desirable areas or on terms that are acceptable to us, and we may not be able to open our planned new restaurants on a timely basis, if at all. Further, if opened, these restaurants may not be operated profitably. As part of our growth strategy, we may enter into geographic markets in which we have little or no prior operating experience. Consumer recognition of our brand has been important in the success of restaurants in our existing markets and recognition may be lacking in new geographic markets. In addition, restaurants we open in new markets may take longer to reach expected sales and profit levels on a consistent basis and may have higher construction, occupancy or operating expenses than restaurants we open in existing markets, thereby affecting our overall profitability. Any failure on our part to recognize or respond to these challenges may adversely affect the success of any new restaurants.
The number and timing of new restaurants opened during any given period, and their associated contribution to operating growth, may be negatively impacted by a number of factors including, without limitation:
|
|
• |
identification and availability of appropriate locations that will increase the number of restaurant guests and sales per unit; |
|
|
• |
inability to generate sufficient funds from operations or to obtain acceptable financing to support our development; |
|
|
• |
recruitment and training of qualified operating personnel in the local market; |
|
|
• |
availability of acceptable lease arrangements; |
19
|
|
• |
timely delivery of the leased premises to us from our landlords and punctual commencement and completion of our buildout construction activities; |
|
|
• |
delays due to the customized nature of our restaurant concepts and decor, construction and pre-opening processes for each new location; |
|
|
• |
obtaining all necessary governmental licenses and permits, including our liquor licenses, on a timely basis to construct or remodel and operate our restaurants; |
|
|
• |
inability to comply with certain covenants under our 2015 Credit Facility that could limit our ability to open new restaurants; |
|
|
• |
consumer tastes in new geographic regions and acceptance of our restaurant concept; |
|
|
• |
competition in new markets, including competition for restaurant sites; unforeseen engineering or environmental problems with the leased premises; |
|
|
• |
adverse weather during the construction period; anticipated commercial, residential and infrastructure development near our new restaurants; and |
|
|
• |
other unanticipated increases in costs, any of which could give rise to delays or cost overruns. |
If we are unable to successfully open new restaurants, our financial results or revenue growth could be adversely affected and our business negatively affected as we expect a portion of our growth to come from new restaurants.
Our failure to manage our growth effectively could harm our business and operating results.
Our growth plan includes opening a number of new restaurants. Our existing restaurant management systems, administrative staff, financial and management controls and information systems may be inadequate to support our planned expansion. Those demands on our infrastructure and resources may also adversely affect our ability to manage our existing restaurants. Managing our growth effectively will require us to continue to enhance these systems, procedures and controls and to hire, train and retain managers, gaucho chefs and other team members. We may not respond quickly enough to the changing demands that our expansion will impose on our management, restaurant teams and existing infrastructure which could harm our business, financial condition and results of operations.
We believe our gaucho culture is an important contributor to our success. As we grow, however, we may have difficulty maintaining our culture or adapting it sufficiently to meet the needs of our operations. Our business, financial condition and results of operations could be materially adversely affected if we do not maintain our infrastructure and culture as we grow.
Increases in the prices of, or reductions in the availability of, top-quality beef could reduce our operating margins and revenue.
We purchase substantial quantities of beef, including Angus Beef® (and its equivalent in Brazil), which is subject to significant price fluctuations due to conditions affecting livestock markets, weather, feed prices, industry demand and other factors. Our meat costs in the United States and Brazil accounted for approximately 53.0%, 52.2% and 54.4% of our total food and beverage costs during Fiscal 2017, Fiscal 2016 and Fiscal 2015, respectively. If the price for beef increases in the future and we choose not to pass, or cannot pass, these increases on to our guests, our operating margins could decrease significantly. In addition, if key beef items become unavailable for us to purchase, our revenue could decrease.
20
We may experience higher operating costs, including increases in supplier prices and employee salaries and benefits, which could adversely affect our financial performance.
Our ability to maintain consistent quality throughout our restaurants depends, in part, upon our ability to acquire fresh food products, including substantial quantities of beef, and related items from reliable sources in accordance with our specifications and in sufficient quantities. We have pricing agreements in place with a few suppliers for our beef purchases and for the purchase of certain other commodities in the US and short term contracts with a limited number of suppliers for the distribution of our other food purchases and other supplies for our restaurants. We do not have any supply agreements or pricing agreements in place in Brazil, and therefore we are subject to risks of shortages and price fluctuations with respect to our food purchases for our restaurants in Brazil. Our largest suppliers of beef in the US and Brazil accounted for 97%, 95%, and 94% of our beef purchases in Fiscal 2017, Fiscal 2016, and Fiscal 2015, respectively. Our dependence on a limited number of suppliers subjects us to risks of shortages, delivery interruptions and price fluctuations. If our suppliers do not perform adequately or otherwise fail to distribute supplies to our restaurants, we may be unable to replace them in a short period of time on acceptable terms. Any inability to so replace suppliers could increase our costs or cause shortages at our restaurants of food and other items that may cause us to remove popular items from a restaurant’s menu or temporarily close a restaurant, which could result in a loss of guests and, consequently, revenue during the time of the shortage and thereafter, if our guests change their dining habits as a result.
If we pay higher prices for food items or other supplies or increase compensation or benefits to our employees, we will sustain an increase in our operating costs. Many factors affect the prices paid for food and other items, including conditions affecting livestock markets, weather, changes in demand and inflation. Factors that may affect compensation and benefits paid to our employees include changes in minimum wage and employee benefits laws (as discussed below). Other factors that could cause our operating costs to increase include fuel prices, occupancy and related costs, maintenance expenditures and increases in other day-to-day expenses. If we are unable or unwilling to increase our menu prices or take other actions to offset increased operating costs, we could experience a decline in our financial performance.
We rely heavily on certain vendors, suppliers and distributors, which could adversely affect our business.
Our ability to maintain consistent price and quality throughout our restaurants depends in part upon our ability to acquire specified food products and supplies in sufficient quantities from third-party vendors, suppliers and distributors at a reasonable cost. We rely on US Foods, Inc. (“US Foods”) as one of our primary distributors in the United States. In Fiscal 2017, Fiscal 2016 and Fiscal 2015, we spent approximately 76%, 75%, and 74%, respectively, of our food and beverage costs in the US on products and supplies procured from or through US Foods. Our agreement with US Foods may be terminated by either us or US Foods upon 60 days’ written notice. We do not control the businesses of our vendors, suppliers and distributors, and our efforts to specify and monitor the standards under which they perform may not be successful. Furthermore, certain food items are perishable, and we have limited control over whether these items will be delivered to us in appropriate condition for use in our restaurants. If any of our vendors, suppliers or distributors are unable to fulfill their obligations to our standards, or if we are unable to find replacement providers in the event of a supply or service disruption, we could encounter supply shortages and incur higher costs to secure adequate supplies, which could materially adversely affect our business, financial condition and results of operations. We do not have any supply agreements or distribution agreements in Brazil that have concentration on one vendor.
Our marketing programs may not be successful.
We believe our brand is critical to our business. We incur costs and expend other resources in our marketing efforts to raise brand awareness and attract and retain guests. These initiatives may not be successful, resulting in expenses incurred without the benefit of higher revenue. Additionally, some of our competitors have greater financial resources, which enable them to spend significantly more than we are able to on marketing and advertising. Should our competitors increase spending on marketing and advertising or our marketing funds decrease for any reason, or should our advertising and promotions be less effective than our competitors, there could be a material adverse effect on our results of operations and financial condition.
21
Any negative publicity surrounding our restaurants or our sector of the restaurant industry could adversely affect the number of restaurant guests, which could reduce revenue in our restaurants.
We believe that any adverse publicity concerning the quality of our food and our restaurants generally could damage our brand and adversely affect the future success of our business. Company-specific adverse publicity, including inaccurate publicity, could take different forms, such as negative reviews by restaurant or word-of-mouth criticisms emanating from our guest base. The experience of other restaurants and restaurant chains with incidents relating to food-borne illnesses or product recalls that affect their business could adversely affect our sector of the restaurant industry. Also, there has been a recent increase in the use of social media platforms and similar devices, including weblogs (blogs), social media websites, and other forms of Internet-based communications which allow individuals access to a broad audience of consumers and other interested persons. Many social media platforms immediately publish the content their subscribers and participants can post, often without filters or checks on accuracy of the content posted. There is significant opportunity for dissemination of information, including inaccurate information. Information concerning our company or our sector of the restaurant industry may be posted on such platforms at any time. Information posted may be adverse to our interests or may be inaccurate, either of which may harm our business and financial performance. The harm may be immediate without affording us an opportunity for redress or correction.
Negative publicity relating to the consumption of food products, including in connection with food-borne illness, could result in reduced consumer demand for our menu offerings, which could reduce sales.
Instances of food-borne illness, including Bovine Spongiform Encephalopathy, which is also known as BSE, and aphthous fever, as well as hepatitis A, lysteria, salmonella, norovirus and e-coli, whether or not found in the US or Brazil or traced directly to one of our suppliers or our restaurants, could reduce demand for our menu offerings. We cannot guarantee that our internal controls and training will be fully effective in preventing all food safety issues at our restaurants, including instances of food-borne illnesses. Any negative publicity relating to these and other health-related matters may affect consumers’ perceptions of our restaurants and the food that we offer, reduce guest visits to our restaurants and negatively impact demand for our menu offerings. Adverse publicity relating to any of these matters, beef in general or other similar concerns could adversely affect our business and results of operations. Further, food-borne illnesses and injuries caused by food tampering have had in the past, and could have in the future, an adverse effect on the price and availability of certain of our produce and meat offerings.
Our company could face lawsuits relating to workplace and employment laws and fair credit reporting requirements, which, if determined adversely, could result in negative publicity or in payment of substantial damages by us.
Various federal and state labor laws govern our relationships with our employees and affect operating costs. These laws include employee classifications as exempt or non-exempt, minimum wage requirements, unemployment tax rates, workers’ compensation rates, tip reporting and classification, citizenship requirements and other wage and benefit requirements for employees classified as non-exempt. Our business may be adversely affected by legal or governmental proceedings brought by or on behalf of our employees or guests. Although we require all workers to provide us with government-specified documentation evidencing their employment eligibility, some of our employees may, without our knowledge, be unauthorized workers. We currently participate in the “E-Verify” program, an Internet-based, free program run by the United States government to verify employment eligibility, in states in which participation is required. However, use of the “E-Verify” program does not guarantee that we will properly identify all applicants who are ineligible for employment. Unauthorized workers are subject to deportation and may subject us to fines or penalties, and if any of our workers are found to be unauthorized we could experience adverse publicity that negatively impacts our brand and may make it more difficult to hire and keep qualified employees. Termination of a significant number of employees who were unauthorized employees may disrupt our operations, cause temporary increases in our labor costs as we train new employees and result in additional adverse publicity. We could also become subject to fines, penalties and other costs related to claims that we did not fully comply with all record-keeping obligations of federal and state immigration compliance laws. These factors could have a material adverse effect on our business, financial condition and results of operations.
In recent years, a number of restaurant companies, including our company, have been subject to lawsuits and other claims, including class action lawsuits, alleging violations of federal and state law governing workplace and employment matters such as various forms of discrimination, tip pooling, wrongful termination, harassment and similar matters and violations of fair credit reporting requirements. A number of these lawsuits and claims against other companies have resulted in various penalties, including the payment of substantial damages by the defendants. In addition, lawsuits by employees or on behalf of our employees are common in Brazil after termination of employment and we have been subject to a number of such lawsuits. Insurance may not be available at all or in sufficient amounts to cover all liabilities with respect to these matters. Accordingly, we may incur substantial damages and expenses resulting from claims and lawsuits, which would increase our operating costs, decrease funds available for the development of our business and result in charges to our income statements resulting in decreased profitability or net losses. Employee claims against us also create not only legal and financial liability but negative publicity that could adversely affect us and divert our financial and management resources that would otherwise be used to benefit the future performance of our operations.
22
Litigation concerning food quality, health, employee conduct and other issues could require us to incur additional liabilities or cause guests to avoid our restaurants.
Restaurant companies have from time to time faced lawsuits alleging that a guest suffered illness or injury during or after a visit to a restaurant, including actions seeking damages resulting from food-borne illness and relating to notices with respect to chemicals contained in food products required under state law. Similarly, food tampering, employee hygiene and cleanliness failures or improper employee conduct at our restaurants could lead to product liability or other claims. To date, we have not been a defendant in any lawsuit asserting such a claim. However, we cannot assure you that such a lawsuit will not be filed against us and we cannot guarantee to consumers that our internal controls and training will be fully effective in preventing claims. We are also subject to various claims arising in the ordinary course of our business, including personal injury claims, contract claims and other matters. In addition, we could become subject to class action lawsuits related to these and other matters in the future. Regardless of whether any claims against us are valid or whether we are ultimately held liable, claims may be expensive to defend and may divert management attention and other resources from our operations and hurt our financial performance. A judgment significantly in excess of our insurance coverage for any claims would materially adversely affect our results of operations and financial condition. In addition, adverse publicity resulting from any such claims may negatively impact revenue at one or more of our restaurants.
Our business is subject to extensive regulation and we may incur additional costs or liabilities as a result of government regulation of our restaurants.
Our business is subject to extensive federal, state, local and foreign government regulation, including, among others, regulations related to the preparation and sale of food, the sale of alcoholic beverages, zoning and building codes, land use and employee, health, sanitation and safety matters.
Typically, our licenses to sell alcoholic beverages must be renewed annually and may be suspended or revoked at any time for cause. Alcoholic beverage control regulations govern various aspects of daily operations of our restaurants, including the minimum age of guests and employees, hours of operation, advertising, wholesale purchasing and inventory control, handling and storage. Any failure by any of our restaurants to obtain and maintain, on a timely basis, liquor or other licenses, permits or approvals required to serve alcoholic beverages or food, as well as any associated negative publicity, could delay or prevent the opening of, or adversely impact the viability of, and could have an adverse effect on, that restaurant and its operating and financial performance. We apply for our liquor licenses with the advice of outside legal counsel and licensing consultants. Because of the many and various state and federal licensing and permitting requirements, there is a significant risk that one or more regulatory agencies could determine that we have not complied with applicable licensing or permitting regulations or have not maintained the approvals necessary for us to conduct business within its jurisdiction. Any changes in the application or interpretation of existing laws may adversely impact our restaurants in that state, and could also cause us to lose, either temporarily or permanently, the licenses, permits and regulations necessary to conduct our restaurant operations, and subject us to fines and penalties.
There is also a potential for increased regulation of certain food establishments in the US, where compliance with a Hazard Analysis and Critical Control Points (“HACCP”) approach would be required. HACCP refers to a management system in which food safety is addressed through the analysis and control of potential hazards from production, procurement and handling, to manufacturing, distribution and consumption of the finished product. Many states have required restaurants to develop and implement HACCP Systems, and the United States government continues to expand the sectors of the food industry that must adopt and implement HACCP programs. For example, the Food Safety Modernization Act (the “FSMA”), signed into law in January 2011, granted the FDA new authority regarding the safety of the entire food system, including through increased inspections and mandatory food recalls. Although restaurants are specifically exempted from or not directly implicated by some of these new requirements, we anticipate that the new requirements may impact our industry. Additionally, our suppliers may initiate or otherwise be subject to food recalls that may impact the availability of certain products, result in adverse publicity or require us to take actions that could be costly for us or otherwise impact our business.
Our restaurants in the US are subject to state “dram shop” laws, which generally allow a person to sue us if that person was injured by an intoxicated person who was wrongfully served alcoholic beverages at one of our restaurants. Recent litigation against restaurant chains has resulted in significant judgments, including punitive damages, under dram shop laws. A judgment against us under a dram shop law could exceed our liability insurance coverage policy limits and could result in substantial liability for us and have a material adverse effect on our results of operations. Our inability to continue to obtain such insurance coverage at reasonable cost also could have a material adverse effect on us. Regardless of whether any claims against us are valid or whether we are liable, we may be adversely affected by publicity resulting from such laws.
23
We are also required to comply with the standards mandated by the ADA, which generally prohibits discrimination in accommodation or employment based on disability. We may in the future have to modify restaurants or our operations to make reasonable accommodations for disabled persons. While these expenses could be material, our current expectation is that any such actions will not require us to expend substantial funds.
The costs of operating our restaurants may increase in the event of changes in laws governing minimum hourly wages, working conditions, predictive scheduling, overtime and tip credits, health care, workers’ compensation insurance rates, unemployment tax rates, sales taxes or other laws and regulations, such as those governing access for the disabled (including the ADA). If any of these costs were to increase and we were unable or unwilling to pass on such costs to our guests by increasing menu prices or by other means, our business and results of operations could be negatively affected.
Failure to comply with federal, state or local regulations could cause our licenses to be revoked and force us to cease the sale of alcoholic beverages at certain restaurants. Any difficulties, delays or failures in obtaining such licenses, permits or approvals could delay or prevent the opening of a restaurant in a particular area or increase the costs associated therewith. In addition, in certain states, including states where we have existing restaurants or where we plan to open a restaurant, the number of liquor licenses available is limited, and licenses are traded on the open market. Liquor, beer and wine sales comprise a significant portion of our revenue. If we are unable to maintain our existing licenses, our guest patronage, revenue and results of operations would be adversely affected. Or, if we choose to open a restaurant in those states where the number of licenses available is limited, the cost of a new license could be significant.
Any failure to protect and maintain our intellectual property rights could adversely affect the value of our brand.
We have registered our principal trademarks including the FOGO, FOGO DE CHÃO and BAR FOGO marks, the campfire design and other marks used by our restaurants as trade names, trademarks or service marks with the United States Patent and Trademark Office, in Brazil and in numerous foreign countries. The trademarks we currently use have not been registered in all of the countries outside of the US in which we do business or may do business in the future. We may never register such trademarks in all of these countries and, even if we do, the laws of some foreign countries do not protect intellectual property rights to the same extent as the laws of the US. We believe that our intellectual property are valuable assets that are critical to our success. The success of our business depends on our continued ability to use our intellectual property in order to increase our brand awareness, and the unauthorized use or other misappropriation of our intellectual property in the US or any foreign countries could diminish the value of our brands and restaurant concept and may cause a decline in our revenue. We are aware of names similar to those of our restaurants used by third parties in certain limited geographical areas in the US, Brazil and elsewhere. Protective actions taken by us with respect to these rights may fail to prevent unauthorized usage or imitation by others, which could harm our reputation, brands or competitive position and, if we commence litigation to enforce our rights, cause us to incur significant legal expenses.
The impact of negative economic factors, including the availability of credit, on our landlords and other retail center tenants could negatively affect our financial results.
Negative effects on our existing and potential landlords due to any inaccessibility of credit and other unfavorable economic factors may, in turn, adversely affect our business and results of operations. If our landlords are unable to obtain financing or remain in good standing under their existing financing arrangements, they may be unable to provide construction contributions or satisfy other lease covenants to us. If any landlord files for bankruptcy protection, the landlord may be able to reject our lease in the bankruptcy proceedings. While we would have the option to retain our rights under the lease, we could not compel the landlord to perform any of its obligations and would be left with damages as our sole recourse. In addition, if our landlords are unable to obtain sufficient credit to continue to properly manage their retail sites, we may experience a drop in the level of quality of such retail centers. Our development of new restaurants may also be adversely affected by the negative financial situations of developers and potential landlords.
24
We occupy most of our restaurants under long-term non-cancelable leases, which we may be unable to renew at the end of the lease terms or which may limit our flexibility to move to new locations.
All but two of our restaurants in the US are located in leased premises and all of our restaurants in Brazil are located in leased premises. Many of our current leases in the US are non-cancelable and usually have terms ranging from 10 to 20 years, with renewal options for terms ranging from five to 10 years. We anticipate that leases that we enter into in the future in the US will also be long-term and non-cancelable and have similar renewal options. If we were to close or fail to open a restaurant at a leased location, we would generally remain committed to perform our obligations under the applicable lease, which could include, among other things, payment of the base rent and a percentage of common area operating expenses for the balance of the lease term. Our obligation to continue making rental payments and fulfilling other lease obligations under leases for closed or unopened restaurants could have a material adverse effect on our business and results of operations. Lease rates in Brazil are periodically readjusted and the rent amounts are not predetermined as they generally are in the US. If the landlord and we cannot agree on an adjusted rate, the dispute is submitted to a judicial resolution process. As a result, our lease rates in Brazil are subject to more volatility than those in the US and we may not always be able to predict these rates due to the unpredictable nature of the judicial resolution process, which could be unfavorable to us.
At the end of the lease term and any renewal period for a restaurant, we may be unable to renew the lease without substantial additional cost, if at all. If we are unable to renew our restaurant leases, we may be forced to close or relocate a restaurant, which could subject us to significant construction and other costs. For example, closing a restaurant, even for a brief period to permit relocation, would reduce the revenue contribution of that restaurant to our total revenue. Additionally, the revenue and profit, if any, generated at a relocated restaurant may not equal the revenue and profit generated at the previous restaurant location.
Long-term leases can, however, limit our flexibility to move a restaurant to a new location. For example, current locations may no longer be attractive in the event that demographic patterns shift or neighborhood conditions decline. In addition, long-term leases may affect our ability to take advantage of more favorable rent levels due to changes in local real estate market conditions. These and other location-related issues may affect the financial performance of individual restaurants.
Our rent expense could increase our vulnerability to adverse economic and industry conditions and could limit our operating and financial flexibility.
Our rent expense accounted for approximately 7.7%, 7.3% and 6.8% of our revenue in Fiscal 2017, Fiscal 2016 and Fiscal 2015, respectively. We expect that new restaurants will typically be leased by us under operating leases, although for fiscal years beginning after December 15, 2018, Accounting Standards Update 2016-02, Leases (Topic 842) will require the recognition of most leases on the balance sheet. Substantial operating lease obligations could have significant negative consequences, including:
|
|
• |
increasing our vulnerability to adverse economic and industry conditions; |
|
|
• |
requiring a substantial portion of our available cash to be applied to pay our rental obligations, thus reducing cash available for other purposes; |
|
|
• |
limiting our ability to obtain any necessary financing; and |
|
|
• |
limiting our flexibility in planning for, or reacting to, changes in our business or our industry. |
We depend on cash flow from operations to pay our lease obligations and to fulfill our other cash requirements. If our restaurants do not generate sufficient cash flow and sufficient funds are not otherwise available to us from borrowings under bank loans or from other sources, we may not be able to meet our lease obligations, grow our business, respond to competitive challenges or fund our other liquidity and capital needs, which would have a material adverse effect on us.
Opening new restaurants in existing markets may negatively affect sales at our existing restaurants.
The consumer target area of our restaurants varies by location, depending on a number of factors, including population density, other local retail and business attractions, area demographics and geography. As a result, the opening of a new restaurant in or near markets in which we already have restaurants could adversely affect sales at these existing restaurants. Existing restaurants could also make it more difficult to build our consumer base for a new restaurant in the same market. Our core business strategy does not entail opening new restaurants that we believe will materially affect sales at our existing restaurants, but we may selectively open new restaurants in and around areas of existing restaurants that are operating at or near capacity to effectively serve our guests. Sales cannibalization among our restaurants may become significant in the future as we continue to expand our operations and could affect our sales growth, which could, in turn, materially adversely affect our business, financial condition and results of operations.
25
Our success depends on securing desirable restaurant locations.
The success of any restaurant depends in substantial part on its location. There can be no assurance that the current locations of our restaurant will continue to be attractive as demographic patterns change. Neighborhood or economic conditions where stores are located could decline in the future, thus resulting in potentially reduced sales in those locations. Competition for restaurant locations can also be intense and there may be delay or cancellation of new store developments by our franchise partners, which may be exacerbated by factors related to the commercial real estate or credit markets. If we cannot obtain desirable locations for our restaurant at reasonable prices due to, among other things, higher than anticipated acquisition, construction and/or development costs of new locations, difficulty negotiating leases with acceptable terms, onerous land use or zoning restrictions, or challenges in securing required governmental permits, then our ability to open new restaurants and our ability to meet our growth expectations may be adversely affected.
Labor shortages or increases in labor costs could slow our growth and adversely affect our ability to operate our restaurants.
Our success depends, in part, upon our ability to attract, motivate and retain qualified employees, including restaurant managers and gaucho chefs necessary to meet the needs of our existing restaurants and to support our expansion program. Qualified personnel to fill these positions may be in short supply in some areas. If we are unable to continue to recruit and retain sufficiently qualified personnel, our business and our growth could be adversely affected. Any future inability to recruit and retain qualified personnel may delay openings of new restaurants and could adversely impact existing restaurants. Any such delays, any material increases in employee turnover rates in existing restaurants or any employee dissatisfaction could have a material adverse effect on our business and results of operations. In addition, competition for qualified employees could require us to pay higher wages, which could result in higher labor costs, which could, in turn, have a material adverse effect on our financial performance.
Increases in minimum wages or unionization activities could substantially increase our labor costs.
Under the minimum wage laws in most jurisdictions in the US, we are permitted to pay certain hourly employees a wage that is less than the base minimum wage for general employees because these employees receive tips as a substantial part of their income. As of December 31, 2017, approximately 34.9% of our employees in the US earn this lower minimum wage in their respective locations as tips constitute a substantial part of their income. If federal, state or local governments change their laws to require that all employees be paid the general employee minimum base wage regardless of supplemental tip income, our labor costs would increase substantially. Our labor costs would also increase if the minimum base wage increases. In addition, several states and localities in which we operate and the federal government have from time to time enacted minimum wage increases, changes to eligibility for overtime pay, paid sick leave and mandatory vacation accruals, and similar requirements and these changes could increase our labor costs. We may be unable or unwilling to increase our prices in order to pass increased labor costs on to our guests, in which case our operating margins would be adversely affected. Also, although none of our employees in the US are currently covered under collective bargaining agreements, many of our employees in Brazil participate in industry-wide trade union programs. Additionally, our employees in the US may elect or attempt to be represented by labor unions in the future. If a significant number of our employees were to become unionized and collective bargaining agreement terms were significantly different from our current compensation arrangements, it could adversely affect our business, financial condition and results of operations.
Our growth may be hindered by immigration restrictions, our inability to obtain necessary visas and work permits for foreign workers and changes in United States immigration laws and regulations, particularly with respect to L-1B visa eligibility.
Our future success could depend on our ability to attract and retain employees with specialized culinary skills. Many of our gaucho chefs in the US are Brazilian nationals whose ability to work in the US depends on obtaining and maintaining necessary visas and work permits (which may or may not be tied to their employment with us).
Immigration and work permit laws and regulations in the US are subject to changes, both in substance as well as in the application of standards and enforcement. Immigration and work permit laws and regulations can be significantly affected by political considerations and economic conditions in the US. Immigration reform continues to attract significant attention in the public arena, the US Congress and the White House Administration. If new immigration or work permit legislation is enacted or executive orders are issued, such laws and orders may contain provisions that could increase our costs in recruiting, training and retaining employees and increase our costs of complying with federal law in reviewing employees’ immigration status. Furthermore, increased enforcement efforts with respect to existing immigration laws and orders by governmental authorities may disrupt a portion of our workforce or our operations. We have been, and may in the future be, unable to obtain visas or work permits to bring necessary employees to the US for any number of reasons including, among others, limits set by the US Department of Homeland Security or the US Department of State.
26
The Department of Homeland Security’s Bureau of Citizenship & Immigration Services (USCIS, formerly INS) began to narrow its interpretation of L-1B visa eligibility as to all corporate petitioners in 2007 and 2008. Beginning in 2009, the USCIS ceased approving our L-1B visas and recommended that the petitions of 10 then current L-1B visa holders be revoked. We contested the adverse actions before USCIS, and then sued USCIS in US District Court. The US District Court affirmed the USCIS denials in 2013, but we appealed that determination, and on October 21, 2014, the US Court of Appeals for the D.C. Circuit granted our appeal, reversed the USCIS denial, and remanded the representative L-1B petition in question to the district court, with instructions to vacate the denial and to remand to USCIS for further consideration in light of the Court’s correction of USCIS’s factual and legal adjudication errors. USCIS reopened the matter pursuant to the D.C. Circuit’s remand order. On June 12, 2015, USCIS again denied the L-1B petition. On August 7, 2015, we filed a complaint for declaratory and mandamus relief in the US District Court for the District of Columbia seeking to overturn the latest USCIS denial and effectuate the prior holding of the D.C. Circuit. On September 26, 2016, the District Court ruled that the USCIS improperly disregarded substantial evidence as our evidence was adequate to conclude that the gaucho churrasqueiro position involves specialized knowledge but that we did not provide enough evidence that a particular individual completed our training program. Neither we nor the government appealed this determination.
Due to the current climate and uncertainty relative to the process of requesting and obtaining L-1B visas, as well as recent denials of certain requests, we will continue to explore all available legal means to bring employees from Brazil to work in our restaurants in the US. Recent executive orders by the new US administration have created additional uncertainty regarding our ability to bring employees from Brazil to work in our restaurants. Continued compliance with existing US or foreign immigration laws or changes in such laws, making it more difficult to hire foreign nationals or limiting our ability to retain visas or work permits for current employees in the US, could materially adversely affect our expansion strategy and, more generally, our business and financial performance.
The effect of changes to healthcare laws in the United States may increase the number of employees who choose to participate in our healthcare plans, which may significantly increase our healthcare costs and negatively impact our financial results.
In 2010, the PPACA was signed into law in the US to require health care coverage for many uninsured individuals and expand coverage to those already insured. We currently offer and subsidize a portion of comprehensive healthcare coverage, primarily for our salaried employees. The healthcare reform law currently requires us to offer healthcare benefits to all full-time employees (including full-time hourly employees) who meet certain minimum requirements of coverage and affordability, or face penalties. If we elect to offer such benefits we may incur substantial expense. If we fail to offer such benefits, or the benefits we elect to offer do not meet the applicable requirements, we may incur penalties. The healthcare reform law also requires individuals to obtain coverage or face individual penalties, so employees who are currently eligible but elect not to participate in our healthcare plans may find it more advantageous to do so when such individual mandates take effect. It is also possible that by making changes or failing to make changes in the healthcare plans offered by us we will become less competitive in the market for our labor. Finally, implementing the requirements of healthcare reform is likely to impose additional administrative costs. The costs and other effects of these new healthcare requirements cannot be determined with certainty, but they may significantly increase our healthcare coverage costs and could materially adversely affect our business, financial condition and results of operations.
Legislation and regulations requiring the display and provision of nutritional information for our menu offerings, and new information or attitudes regarding diet and health or adverse opinions about the health effects of consuming our menu offerings, could affect consumer preferences and negatively impact our results of operations.
Government regulation and consumer eating habits may impact our business as a result of changes in attitudes regarding diet and health or new information regarding the health effects of consuming our menu offerings. These changes have resulted in, and may continue to result in, the enactment of laws and regulations that impact the ingredients and nutritional content of our menu offerings, or laws and regulations requiring us to disclose the nutritional content of our food offerings.
The PPACA establishes a uniform, federal requirement for certain restaurants to post certain nutritional information on their menus. Specifically, the PPACA amended the Federal Food, Drug and Cosmetic Act to require chain restaurants with 20 or more locations operating under the same name and offering substantially the same menus to publish the total number of calories of standard menu items on menus and menu boards, along with a statement that puts this calorie information in the context of a total daily calorie intake. The compliance date for menu labeling requirements was extended from May 5, 2017 to May 7, 2018. The PPACA also requires covered restaurants to provide to consumers, upon request, a written summary of detailed nutritional information for each standard menu item, and to provide a statement on menus and menu boards about the availability of this information. The PPACA further permits the United States Food and Drug Administration to require covered restaurants to make additional nutrient disclosures, such as disclosure of trans-fat content. An unfavorable report on, or reaction to, our menu ingredients, the size of our portions or the nutritional content of our menu items could negatively influence the demand for our offerings.
27
Furthermore, a number of states, counties and cities have enacted menu labeling laws requiring multi-unit restaurant operators to disclose certain nutritional information to guests, or have enacted legislation restricting the use of certain types of ingredients in restaurants. Among those are California and New York City, although we believe the PPACA is intended to pre-empt conflicting state or local laws on nutritional labeling.
Compliance with current and future laws and regulations regarding the ingredients and nutritional content of our menu items may be costly and time-consuming. Additionally, some government authorities are increasing regulations regarding trans-fats and sodium, which may require us to limit or eliminate trans-fats and sodium in our offerings, switch to higher cost ingredients or may hinder our ability to operate in certain markets. Some jurisdictions have banned certain cooking ingredients, such as trans-fats, or have discussed banning certain products, such as large sodas.
Removal of these products and ingredients from our menus could affect product tastes, guest satisfaction levels, and sales volumes, whereas if we fail to comply with these laws or regulations, our business could experience a material adverse effect.
We cannot make any assurances regarding our ability to effectively respond to changes in consumer health perceptions or our ability to successfully implement the nutrient content disclosure requirements and to adapt our menu offerings to trends in eating habits. The imposition of additional menu-labeling laws could have an adverse effect on our results of operations and financial position, as well as on the restaurant industry in general.
Health concerns arising from outbreaks of viruses may have an adverse effect on our business.
The United States, Brazil, Mexico and other countries have experienced, or may experience in the future, outbreaks of neurological diseases or other diseases or viruses, such as norovirus, influenza, Zika and H1N1. If a virus is transmitted by human contact, our employees or customers could become infected, or could choose, or be advised, to avoid gathering in public places, any one of which could materially adversely affect our business, financial condition and results of operations.
A breach of security of confidential consumer information related to our electronic processing of credit and debit card transactions could substantially affect our reputation and financial results.
A significant majority of our sales are by credit or debit cards. Restaurants and retailers have experienced security breaches in which credit and debit card information has been stolen. We use third-party providers to track, process and authorize our sales by credit or gift card. Improper access to our or these third party provider’s systems or databases could result in the theft, publication, deletion or modification of confidential customer information and/or card data, including theft of funds on the card or counterfeit reproduction of the cards. If the security of such providers is compromised, then we may be subject to unplanned losses, expenses, fines or penalties. We may in the future become subject to claims for purportedly fraudulent transactions arising out of the actual or alleged theft of credit or debit card information, and we may also be subject to lawsuits or other proceedings relating to these types of incidents. In addition, most states have enacted legislation requiring notification of security breaches involving personal information, including credit and debit card information. Claims or proceedings related to theft of credit or debit card information may be brought by payment card providers, banks and credit unions that issues cards, cardholders (either individually or as part of a class action lawsuit) and federal and state regulators. Any such claim or proceeding could cause us to incur significant unplanned expenses, which could have an adverse impact on our financial condition and results of operations. Further, adverse publicity resulting from these allegations may have a material adverse effect on us and our restaurants.
28
We rely heavily on information technology, and any material failure, weakness, interruption or breach of security could prevent us from effectively operating our business.
We rely heavily on information systems, including point-of-sale processing in our restaurants, management of our supply chain, payment of obligations, collection of cash, credit and debit card transactions, payment of payroll and other obligations and other processes and procedures. Our ability to efficiently and effectively manage our business depends significantly on the reliability and capacity of these systems. Our operations depend upon our ability to protect our computer equipment and systems against damage from physical theft, power loss, cyber-attacks, telecommunications failure or other catastrophic events, such as fires, earthquakes, tornadoes and hurricanes, and/or errors by our employees, as well as from internal and external security breaches, viruses and other disruptive problems. Some of our essential business processes that are dependent on technology are outsourced to third parties. Such processes include, but are not limited to, gift card tracking and authorization, web site hosting and maintenance, data warehousing and business intelligence services, point-of-sale system maintenance, certain tax filings, telecommunications services, web-based labor scheduling and other key processes. We make a diligent effort to ensure that all providers of outsourced services are observing proper internal control practices, such as redundant processing facilities; however, there are no guarantees that failures will not occur. The failure of our systems or those of third party service providers to operate effectively, maintenance problems, upgrading or transitioning to new platforms, expanding systems as we grow or a breach in security of these systems could result in delays in guest service and reduce efficiency in our operations. Remediation of such problems could result in significant, unplanned capital investments. Our reputation as a brand may also be adversely affected from breaches or regulatory violations, which may have a material adverse effect on us and our restaurants.
Changes to estimates related to our property, fixtures and equipment, goodwill or operating results that are lower than our current estimates at certain restaurant locations may cause us to incur impairment charges, which may adversely affect our results of operations.
In accordance with accounting guidance as it relates to the impairment of long-lived assets, we make certain estimates and projections with regard to individual restaurant operations, as well as our overall performance, in connection with our impairment analyses for long-lived assets. When impairment triggers are deemed to exist for any location, the estimated undiscounted future cash flows are compared to its carrying value. If the carrying value exceeds the undiscounted cash flows, an impairment charge equal to the difference between the carrying value and the fair value is recorded. In the absence of extraordinary events, individual restaurants are excluded in our impairment analysis until they have been open for 36 months. An initial three-year operating plan is developed for each new restaurant and we remain committed to that plan barring unforeseen circumstances.
During Fiscal 2017, we recognized a $4.2 million non-cash impairment charge related to the reduction in the carrying value of an underperforming restaurant in the United States. The Company continues to evaluate the restaurant’s operating performance and its options. A closure of this restaurant could result in a material charge in the period in which the Company ceases operations.
Additionally, we test our reporting units for impairment of goodwill annually. We compare the fair value of the reporting unit, estimated using a combination of methodologies, to its carrying amount and, if the carrying amount of a reporting unit's goodwill exceeds its fair value, we would measure the impairment loss. The projections of future cash flows, and application of other methodologies, used in these analyses require the use of judgment and a number of estimates and projections of future operating results. If actual results differ from our estimates, additional charges for asset impairments may be required in the future. If future impairment charges are significant, our reported operating results would be adversely affected.
Changes to accounting rules or regulations may adversely affect our results of operations.
Changes to existing accounting rules or regulations may impact our future results of operations or cause the perception that we are more highly leveraged. Other new accounting rules or regulations and varying interpretations of existing accounting rules or regulations have occurred and may occur in the future. Future changes to accounting rules or regulations could materially adversely affect our business, financial condition and results of operations.
In February 2016, the Financial Accounting Standards Board issued Accounting Standards Update 2016-02, “Leases (Topic 842).” The new standard establishes a right-of-use (“ROU”) model that requires a lessee to record a ROU asset and a lease liability on the balance sheet for all leases with terms longer than 12 months. Leases will be classified as either finance or operating, with classification affecting the pattern of expense recognition in the income statement. The new standard is effective for fiscal years beginning after December 15, 2018, including interim periods within those fiscal years. The new standard could have a significant impact on our consolidated balance sheet as we will likely record material assets and obligations for current operating leases. We are currently evaluating the impact that adoption could have on our consolidated statement of income but the recognition of liabilities for our lease obligations could negatively impact our financial results.
29
Loss of key management personnel could hurt our business and inhibit our ability to operate and grow successfully.
Our success will continue to depend, to a significant extent, on our leadership team and other key management personnel. If we are unable to attract and retain sufficiently experienced and capable management personnel, our business and financial results may suffer. If members of our leadership team or other key management personnel leave, we may have difficulty replacing them, and our business may suffer. There can be no assurance that we will be able to successfully attract and retain our leadership team and other key management personnel that we need. We also do not maintain any key man life insurance policies for any of our employees.
Our current insurance policies may not provide adequate levels of coverage against all claims, and we may incur losses that are not covered by our insurance.
We maintain insurance coverage for a significant portion of our risks and associated liabilities with respect to general liability, property and casualty liability, liquor liability, employer’s liability and other insurable risks. However, there are types of losses we may incur that cannot be insured against or that we believe are not commercially reasonable to insure. For example, insurance covering liability for violations of wage and hour laws has not generally been available. We also self-insure for workers’ compensation and health benefits under plans with high deductibles. Losses for such uninsured claims, if they occur, could have a material adverse effect on our business and results of operations.
Compliance with environmental laws may negatively affect our business.
We are subject to national, provincial, state and local laws and regulations in the US, Brazil and Mexico concerning waste disposal, pollution, protection of the environment, and the presence, discharge, storage, handling, release and disposal of, and exposure to, hazardous or toxic substances. These environmental laws provide for significant fines and penalties for noncompliance and liabilities for remediation, sometimes without regard to whether the owner or operator of the property knew of, or was responsible for, the release or presence of hazardous toxic substances. Third parties may also make claims against owners or operators of properties for personal injuries and property damage associated with releases of, or actual or alleged exposure to, such hazardous or toxic substances at, on or from our restaurants. Environmental conditions relating to releases of hazardous substances at prior, existing or future restaurant sites could materially adversely affect our business, financial condition and results of operations. Further, environmental laws, and the administration, interpretation and enforcement thereof, are subject to change and may become more stringent in the future, each of which could materially adversely affect our business, financial condition and results of operations.
New or revised tax regulations could have an adverse effect in our financial results.
We are subject to income tax requirements in various jurisdictions in the US and internationally. Many of these jurisdictions have made changes to their tax policies, including tax reform in the US that was enacted in December 2017. Overall, the impact of US tax reform should reduce our effective tax rate; however, additional guidance or interpretations of the Tax Cuts and Jobs Act (the “Tax Act” or “TCJA”) could negatively impact our financial results. Other jurisdictions are contemplating changes or have unpredictable enforcement activity. Increases in applicable tax rates, implementation of new taxes, changes in applicable tax laws and interpretations of these tax laws and actions by tax authorities in jurisdictions in which we operate could reduce our after tax income and have an adverse effect on our results of operations.
The Tax Act significantly revised the US tax code by, in part but not limited to, reducing the US corporate tax rate from 35% to 21% and imposing a mandatory one-time transition tax on certain un-repatriated earnings of foreign subsidiaries. The SEC staff acknowledged the challenges companies face incorporating the effects of tax reform by their financial reporting deadlines. In response, on December 22, 2017, the SEC staff issued Staff Accounting Bulletin No. 118, or SAB 118, to address the application of US GAAP in situations when a registrant does not have the necessary information available, prepared, or analyzed in reasonable detail to complete accounting for certain income tax effects of the Tax Act. As of December 31, 2017, we recorded a provisional income tax benefit of $15.0 million for the re-measurement of our US deferred tax assets and liabilities because of the federal corporate tax rate reduction. We also recorded a provisional income tax charge of $6.5 million for the transition tax on deemed repatriation of deferred foreign income. The provisional amounts recorded are based on our current interpretation and understanding of the Tax Act, are judgmental and may change as we receive additional clarification and implementation guidance. We will continue to gather and evaluate the income tax impact of the Tax Act. Changes to these provisional amounts or any of our other estimates regarding taxes could result in material charges or credits in future reporting periods.
30
Our ability to use our net operating loss carryforwards and certain other tax attributes may be limited.
As of December 31, 2017, we had state net operating loss carryforwards of approximately $4.8 million, including federal general business credits of approximately $13.0 million. Under Sections 382 and 383 of the Internal Revenue Code of 1986, as amended, or the Code, if a corporation undergoes an “ownership change,” its ability to use its pre-change net operating loss carryforwards and other pre-change tax attributes to offset its post-change income may be limited. In general, an “ownership change” generally occurs if there is a cumulative change in our ownership by “5-percent shareholders” that exceeds 50 percentage points over a rolling three-year period. Similar rules may apply under state tax laws. We experienced an ownership change in the past and may experience ownership changes in the future as a result of future transactions in our stock, some of which may be outside our control. As a result, if we earn net taxable income, our ability to use our pre-change net operating loss carryforwards, or other pre-change tax attributes, to offset US federal and state taxable income may be subject to significant limitations. As of December 31, 2017, none of the operating loss or general business credit carryforwards are subject to limitation. Our current state net operating loss and general business credit carryforwards will begin to expire in 2033 - 2037.
The amount of money that we have borrowed and may, in the future borrow, may adversely affect our financial condition and operating activities.
Our 2015 Credit Facility provides for a $250.0 million revolving credit facility (the “Revolving Credit Facility”). The loans under the Revolving Credit Facility mature on June 24, 2020.
As of December 31, 2017, we had total aggregate principal amount of outstanding debt of $138.0 million, $5.7 million in outstanding letters of credit and $106.3 million of available borrowing capacity remaining under our 2015 Credit Facility. Our 2015 Credit Facility and any other debt incurred in the future, may have important consequences to holders of our common stock, including the following:
|
|
• |
our ability to obtain additional financing for working capital, capital expenditures, acquisitions or other purposes may be impaired; |
|
|
• |
we may use a substantial portion of our cash flow from operations to service our indebtedness, rather than for operations or other purposes; |
|
|
• |
our level of indebtedness could place us at a competitive disadvantage compared to our competitors with proportionately less debt; and |
|
|
• |
our flexibility in planning for, or reacting to, changes in our business and the industry in which we operate may be limited. |
We expect that we will depend primarily upon cash flow from operations to pay interest and other amounts due under our 2015 Credit Facility and any other indebtedness we may incur in the future. Our ability to make these payments depends on our future performance, which will be affected by business, financial, economic and other factors, many of which we cannot control. If we do not have sufficient funds, we may be required to refinance all or part of our then existing debt, sell assets or borrow more money. We may not be able to accomplish any of these alternatives on terms acceptable to us, if at all. In addition, the terms of existing or future debt agreements, including our 2015 Credit Facility, may restrict us from adopting any of these alternatives.
Our 2015 Credit Facility imposes operating and financial restrictions that may impair our ability to respond to changing business and industry conditions.
Our 2015 Credit Facility contains restrictions and covenants that generally limit our ability to, among other things:
|
|
• |
incur additional indebtedness; |
|
|
• |
make investments; |
|
|
• |
use assets as collateral in other transactions; |
|
|
• |
sell assets or merge with or into other companies; |
|
|
• |
pay dividends to, or purchase stock from, our stockholders; |
|
|
• |
enter into transactions with affiliates; |
|
|
• |
sell stock or other ownership interests in our subsidiaries; and |
|
|
• |
create or permit restrictions on our subsidiaries’ ability to make payments to us. |
31
Our 2015 Credit Facility limits our ability to engage in these types of transactions even if we believed that a specific transaction would contribute to our future growth or improve our results of operations. Our 2015 Credit Facility requires us to meet specified financial and operating results and maintain compliance with specified financial ratios. We are required to maintain a maximum Total Rent Adjusted Leverage Ratio (as defined under our 2015 Credit Facility), at levels that vary until maturity, and a minimum Consolidated Interest Coverage Ratio (as defined under our 2015 Credit Facility. Starting in Fiscal 2017 and through Fiscal 2018, the Total Rent Adjusted Leverage Ratio may not be greater than 5.25 to 1 and the ratio will further reduce to 5.00 to 1 in Fiscal 2019 through maturity. Starting in Fiscal 2017, the Consolidated Interest Coverage Ratio may not be less than 2.00 to 1 through maturity. As of the date hereof, we were in compliance with our 2015 Credit Facility’s financial covenants. However, breach of these provisions or failure to comply with these financial ratios could result in a default under the 2015 Credit Facility, in which case our lenders would have the right to declare borrowings to be immediately due and payable. Our lenders may also accelerate payment of borrowings upon the occurrence of certain change of control events relating to us. If we are unable to repay borrowings when due, whether at maturity or following a default or change of control event, our lenders would have the right to take or sell assets pledged as collateral to secure the indebtedness. Any such actions taken by our lenders or other creditors would have a material adverse effect on our business and financial condition.
Risks Related to Ownership of Our Common Stock
The THL Funds have a substantial ownership interest in our common stock. Conflicts of interest may arise because some of our directors are principals of the THL Funds.
The THL Funds collectively beneficially own approximately 60.7% of our outstanding common stock. As a consequence, the THL Funds are able to control matters requiring stockholder approval, including the election of directors, a merger, consolidation or sale of all or substantially all of our assets, and any other significant transaction. The interests of the THL Funds may not always coincide with our interests or the interests of our other stockholders.
The THL Funds could invest in entities that directly or indirectly compete with us. As a result of these relationships, when conflicts arise between the interests of the THL Funds and the interests of our stockholders, these directors may not be disinterested. The representatives of the THL Funds on our Board of Directors, by the terms of our amended and restated certificate of incorporation and the amended and restated registration rights agreement among the Company, the THL Funds, management stockholders and other investors named in the agreement, are not required to offer us any transaction opportunity of which they become aware and could take any such opportunity for themselves or offer it to other companies in which they have an investment, unless such opportunity is expressly offered to them solely in their capacity as our directors.
The THL Funds may have conflicts of interest with other stockholders in the future.
The THL Funds may exert significant influence over, and could control, matters requiring stockholder approval, including the election of directors and approval of major corporate transactions. In addition, this concentration of ownership may delay or prevent a change of control of our company and make some transactions more difficult or impossible without the support of the THL Funds.
The interests of the THL Funds may not always be consistent with the interests of our company or of other stockholders. Accordingly, the THL Funds could cause us to enter into transactions or agreements of which holders of our common stock would not approve or make decisions with which such holders would disagree.
The THL Funds are in the business of making investments in companies and could from time to time acquire and hold interests in businesses that compete with us. The THL Funds may also pursue acquisition opportunities that may be complementary to our business, and as a result, desirable acquisitions may not be available to us.
We are a “controlled company” within the meaning of NASDAQ rules and, as a result, are exempt from certain corporate governance requirements.
So long as the THL Funds maintain holdings of more than 50% of the voting power of our capital stock, we will be a “controlled company” within the meaning of NASDAQ corporate governance standards. Under these standards, a company need not comply with certain corporate governance requirements, including:
|
|
• |
the requirement that a majority of our board of directors consist of “independent directors” as defined under NASDAQ rules; |
|
|
• |
the requirement that we have a compensation committee that is composed entirely of independent directors with a written charter addressing the committee’s purpose and responsibilities; |
32
|
|
• |
the requirement for an annual performance evaluation of the nominating and corporate governance and compensation committees. |
We are not required to have a majority of independent directors on our board of directors and our compensation committee and nominating and corporate governance committee do not consist entirely of independent directors and are not subject to annual performance evaluations. If we are no longer eligible to rely on the controlled company exception, we will seek to comply with all applicable NASDAQ corporate governance requirements, but we will be able to rely on phase-in periods for certain of these requirements in accordance with NASDAQ rules. Accordingly, our stockholders may not have the same protections afforded to stockholders of companies that are subject to all NASDAQ corporate governance requirements.
The market price of our common stock may decline, and you could lose all or a significant part of your investment.
The market price of, and trading volume for, our common stock may be influenced by many factors, some of which are beyond our control, including, among others, the following:
|
|
• |
variations in our quarterly or annual operating results; |
|
|
• |
changes in our earnings estimates (if provided) or differences between our actual financial and operating results and those expected by investors and analysts; |
|
|
• |
initiatives undertaken by our competitors, including, for example, the opening of restaurants in our existing markets; |
|
|
• |
actual or anticipated fluctuations in our or our competitors’ results of operations, and our and our competitors’ growth rates; |
|
|
• |
the failure of securities analysts to cover our common stock, or changes in estimates by analysts who cover us and competitors in our industry; |
|
|
• |
recruitment or departure of key personnel; |
|
|
• |
adoption or modification of laws, regulations, policies, procedures or programs applicable to our business or announcements relating to these matters; |
|
|
• |
any increased indebtedness we may incur in the future; |
|
|
• |
actions by stockholders; |
|
|
• |
announcements by us or our competitors of significant contracts, acquisitions, dispositions, strategic relationships, joint ventures or capital commitments; |
|
|
• |
the expiration of lock-up agreements entered into by our existing stockholders in connection with our initial public offering; |
|
|
• |
economic conditions; |
|
|
• |
geopolitical incidents; and |
|
|
• |
investor perceptions of us, our competitors and our industry. |
As a result of these and other factors, our stockholders may experience a decrease, which could be substantial, in the value of their shares of our common stock, including decreases unrelated to our financial performance or prospects.
The market price and trading volume of our common stock may be volatile, which could result in rapid and substantial losses for our stockholders.
The market price of our common stock may be highly volatile and could be subject to wide fluctuations. In addition, the trading volume in our common stock may fluctuate and cause significant price variations to occur. If the market price of our common stock declines significantly, stockholders may be unable to resell shares of our common stock at or above their purchase price, if at all. The market price of our common stock may fluctuate or decline significantly in the future.
33
Certain broad market and industry factors may materially decrease the market price of our common stock, regardless of our actual operating performance. The stock market in general has from time to time experienced extreme price and volume fluctuations, including recently. In addition, in the past, following periods of volatility in the overall market and decreases in the market price of a company’s securities, securities class action litigation has often been instituted against these companies. This litigation, if instituted against us, could result in substantial costs and a diversion of our management’s attention and resources.
Future sales of our common stock could cause the market price of such shares to fall.
If our existing stockholders sell substantial amounts of our common stock, the market price of our common stock could decrease significantly. The perception in the public market that major stockholders might sell substantial amounts of our common stock could also depress the market price of our common stock. A decline in the market price of our common stock might impede our ability to raise capital through the issuance of additional shares of our common stock or other equity securities.
Future offerings of equity by us may adversely affect the market price of our common stock.
In the future, we may attempt to obtain financing or to further increase our capital resources by issuing additional shares of our common stock or by offering debt or other equity securities, including senior or subordinated notes, debt securities convertible into equity or shares of preferred stock. Opening new restaurants in existing and new markets could require substantial additional capital in excess of cash from operations. We would expect to finance the capital required for new restaurants through a combination of additional issuances of equity, corporate indebtedness and cash from operations.
Issuing additional shares of our common stock or other equity securities or securities convertible into equity may dilute the economic and voting rights of our existing stockholders or reduce the market price of our common stock or both. Upon liquidation, holders of such debt securities and preferred shares, if issued, and lenders with respect to other borrowings would receive a distribution of our available assets prior to the holders of our common stock. Debt securities convertible into equity could be subject to adjustments in the conversion ratio pursuant to which certain events may increase the number of equity securities issuable upon conversion. Preferred shares, if issued, could have a preference with respect to liquidating distributions or a preference with respect to dividend payments that could limit our ability to pay dividends to the holders of our common stock. Our decision to issue securities in any future offering will depend on market conditions and other factors beyond our control, which may adversely affect the amount, timing or nature of our future offerings. Thus, holders of our common stock bear the risk that our future offerings may reduce the market price of our common stock and dilute their stockholdings in us.
Our amended and restated bylaws designate a state or federal court located within the state of Delaware as the sole and exclusive forum for certain types of actions and proceedings that may be initiated by our stockholders, which could limit our stockholders’ ability to obtain a favorable judicial forum for disputes with us or our directors, officers or other employees.
Our amended and restated bylaws provide that, with certain limited exceptions, unless we consent in writing to the selection of an alternative forum, a state or federal court located within the state of Delaware will be the sole and exclusive forum for any stockholder (including any beneficial owner) to bring (i) any derivative action or proceeding brought on our behalf, (ii) any action asserting a claim of breach of a fiduciary duty owed by any of our directors, officers or other employees to us or our stockholders, (iii) any action asserting a claim arising pursuant to any provision of the Delaware General Corporation Law (“DGCL”), or (iv) any action asserting a claim governed by the internal affairs doctrine, in each case subject to said Delaware court having personal jurisdiction over the indispensable parties named as defendants therein. Any person or entity purchasing or otherwise acquiring or holding any interest in shares of our capital stock is deemed to have notice of and consented to the foregoing provisions. This choice of forum provision may limit a stockholder’s ability to bring a claim in a judicial forum that it finds favorable for disputes with us or our directors, officers or other employees, which may discourage such lawsuits against us and our directors, officers and employees. Alternatively, if a court were to find this choice of forum provision inapplicable to, or unenforceable in respect of, one or more of the specified types of actions or proceedings, we may incur additional costs associated with resolving such matters in other jurisdictions, which could adversely affect our business, financial condition or results of operations.
We do not intend to pay cash dividends for the foreseeable future.
We intend to retain all of our earnings for the foreseeable future to fund the operation and growth of our business and to repay indebtedness, and therefore, we do not anticipate paying any cash dividends to holders of our capital stock for the foreseeable future. Any future determination regarding the payment of any dividends will be made at the discretion of our board of directors and will depend on our financial condition, results of operations, capital requirements, liquidity, contractual restrictions, general business conditions and other factors that our board of directors may deem relevant. Consequently, investors must rely on sales of their common stock after price appreciation, which may never occur, as the only way to realize any future gains on their investment. Investors seeking cash dividends should not invest in our common stock.
34
Our future capital requirements are uncertain, and we may have difficulty raising money in the future on acceptable terms, if at all.
Our capital requirements depend on many factors, including the amounts required to open new restaurants and to service our indebtedness. To the extent that our capital resources are insufficient to meet these requirements, we may need to raise additional funds through financings or curtail our growth, reduce our costs and expenses, or sell certain of our assets. Any additional equity offerings or debt financings may be on terms that are not favorable to us. Equity offerings could result in dilution to our stockholders, and equity or debt securities issued in the future may have rights, preferences and privileges that are senior to those of our common stock. If our need for capital arises because of significant losses, the occurrence of these losses may make it more difficult for us to raise the necessary capital.
Provisions of our charter documents, Delaware law and other documents could discourage, delay or prevent a merger or acquisition at a premium price.
Our amended and restated certificate of incorporation and bylaws include provisions that:
|
|
• |
permit us to issue preferred stock in one or more series and, with respect to each series, fix the number of shares constituting the series and the designation of the series, the voting powers, if any, of the shares of the series and the preferences and other special rights, if any, and any qualifications, limitations or restrictions, of the shares of the series; |
|
|
• |
restrict the ability of stockholders to act by written consent or to call special meetings; |
|
|
• |
require the affirmative vote of 662/3% of the outstanding shares entitled to vote to approve certain transactions or to amend certain provisions of our certificate of incorporation or bylaws; |
|
|
• |
limit the ability of stockholders to amend our certificate of incorporation and bylaws; |
|
|
• |
require advance notice for nominations for election to the board of directors and for stockholder proposals; and |
|
|
• |
establish a classified board of directors with staggered three-year terms. |
These provisions may discourage, delay or prevent a merger or acquisition of our company, including a transaction in which the acquiror may offer a premium price for our common stock.
Our equity incentive plans also permit vesting of stock options and restricted stock, and payments to be made to the employees thereunder, in connection with a change of control of our company, which could discourage, delay or prevent a merger or acquisition at a premium price. In addition, our 2015 Credit Facility includes and other debt incurred by us in the future may include, provisions entitling the lenders to demand immediate repayment of borrowings upon the occurrence of certain change of control events relating to our company, which also could discourage, delay or prevent a business combination transaction.
The market price of our common stock could decline if securities or industry analysts do not publish research or reports about our company or if they downgrade us or other restaurant companies in our industry.
The market price of our common stock depends, in part, on the research and reports that securities or industry analysts publish about us or our business. We do not influence or control the reporting of these analysts. In addition, if no analysts provide coverage of our company or if one or more of the analysts who do cover us downgrade shares of our company or other companies in our industry, the market price of our common stock could be negatively impacted. If one or more of these analysts cease coverage of our company, we could lose visibility in the market, which could, in turn, cause the market price of our common stock to decline.
The future issuance of additional common stock in connection with our incentive plans, acquisitions or otherwise will dilute all other stockholdings.
We have an aggregate of 1.3 million shares of common stock authorized but unissued and not reserved for issuance under our equity incentive plans. We may issue all of these shares of common stock without any action or approval by our stockholders, subject to certain exceptions. Any common stock issued in connection with our equity incentive plans, the exercise of outstanding stock options or otherwise would dilute the percentage ownership held by our stockholders.
35
Our costs have increased as a result of operating as a public company, and our management is required to devote substantial time to complying with public company regulations.
As a public company and particularly after we cease to be an “emerging growth company” (to the extent that we take advantage of certain exceptions from reporting requirements that are available under the JOBS Act as an “emerging growth company”), we incur significant legal, accounting and other expenses not incurred prior to our IPO. In addition, Sarbanes-Oxley, as well as rules promulgated by the SEC and the NASDAQ, require us to adopt corporate governance practices applicable to US public companies. These rules and regulations have increased and may in the future increase our legal and financial compliance costs.
Sarbanes-Oxley, as well as rules and regulations subsequently implemented by the SEC and the NASDAQ, have imposed increased disclosure and enhanced corporate governance practices for public companies. We are committed to maintaining high standards of corporate governance and public disclosure, and our efforts to comply with evolving laws, regulations and standards are likely to result in increased expenses and a diversion of management’s time and attention from revenue-generating activities to compliance activities. We may not be successful in implementing and maintaining these requirements and implementing or maintaining them could adversely affect our business, results of operations and financial condition. In addition, if we fail to implement and maintain the requirements with respect to our internal accounting and audit functions, our ability to report our financial results on a timely and accurate basis could be impaired.
We are an “emerging growth company” and comply with reduced reporting requirements applicable to emerging growth companies.
We are an “emerging growth company,” as defined in the JOBS Act, and we take advantage of certain exemptions from various reporting requirements that are applicable to other public companies that are not emerging growth companies, including, but not limited to, not being required to comply with the auditor attestation requirements of Section 404 of Sarbanes-Oxley, reduced disclosure obligations regarding executive compensation in our periodic reports and proxy statements, and exemptions from the requirements of holding a nonbinding advisory vote on executive compensation and shareholder approval of any golden parachute payments not previously approved. In addition, even if we begin to comply with the greater obligations of public companies that are not emerging growth companies, we may avail ourselves of the reduced requirements applicable to emerging growth companies from time to time in the future. We cannot predict whether our common stock is less attractive if we choose to rely on these exemptions. If our common stock is less attractive as a result of our reliance on the available exemptions, there may be a less active trading market for our common stock and our stock price may be more volatile.
Section 107 of the JOBS Act also provides that an “emerging growth company” can take advantage of the extended transition period provided in Section 7(a)(2)(B) of the Securities Act for complying with new or revised accounting standards. However, we are choosing to opt out of any extended transition period, and as a result we will comply with new or revised accounting standards on the relevant dates on which adoption of such standards is required for non-emerging growth companies. Section 107 of the JOBS Act provides that our decision to opt out of the extended transition period for complying with new or revised accounting standards is irrevocable.
We will remain an “emerging growth company” for up to five years, or until the earliest of (i) the last day of the first fiscal year in which our annual gross revenues exceed $1 billion, (ii) the date that we become a “large accelerated filer” as defined in Rule 12b-2 under the Securities Exchange Act of 1934, as amended (the “Exchange Act”), which would occur if the market value of our common stock that is held by non-affiliates exceeds $700 million as of the last business day of our most recently completed second fiscal quarter, or (iii) the date on which we have issued more than $1 billion in non-convertible debt during the preceding three year period.
36
As a public company, we are obligated to develop and maintain proper and effective internal control over financial reporting, and any failure to maintain the adequacy of internal control may adversely affect investor confidence in our company and, as a result, the value of our common shares.
The Sarbanes-Oxley Act of 2002, or Sarbanes-Oxley, requires, among other things, that we assess the effectiveness of our internal control over financial reporting annually and disclosure controls and procedures quarterly. In particular, beginning with our fiscal year ended on January 1, 2017, we are required to perform system and process evaluation and testing of our internal control over financial reporting to allow management to report on the effectiveness of our internal control over financial reporting, as required by Section 404 of Sarbanes-Oxley. Section 404 of Sarbanes-Oxley also generally requires an attestation from our independent registered public accounting firm on the effectiveness of our internal control over financial reporting. However, for as long as we remain an "emerging growth company" as defined in the JOBS Act, we intend to utilize the provision exempting us from the requirement that our independent registered public accounting firm provide an attestation on the effectiveness of our internal control over financial reporting.
During the evaluation and testing process, if we identify one or more material weaknesses in our internal control over financial reporting, we will be unable to assert that our internal control over financial reporting is effective. We cannot assure you that there will not be material weaknesses or other deficiencies in our internal control over financial reporting in the future. Any failure to maintain internal control over financial reporting could severely inhibit our ability to accurately report our financial condition or results of operations. If we are unable to conclude that our internal control over financial reporting is effective, or if our independent registered public accounting firm determines we have a material weakness or other deficiency in our internal control over financial reporting once that firm begins its Section 404 audits of internal control over financial reporting, we could lose investor confidence in the accuracy and completeness of our financial reports, the market price of our common shares could decline, and we could be subject to sanctions or investigations by the SEC, the NASDAQ or other regulatory authorities. Failure to remedy any material weakness in our internal control over financial reporting, or to implement or maintain other effective control systems required of public companies, could also restrict our future access to the capital markets.
Item 1B. Unresolved Staff Comments.
None.
We operate 38 restaurants in the US, nine restaurants in Brazil, two joint venture restaurants in Mexico and two joint venture restaurants in the Middle East. We operate a variety of restaurant formats, including in-line and free-standing locations. Our restaurants range in size from approximately 7,000 to 16,000 square feet, with seating from 200 to 500 guests. We plan to open restaurants that will range from approximately 8,500 to 10,000 square feet per restaurant and may vary depending on site specific opportunities.
We currently lease all of our restaurants except for two locations. Our US leases generally have initial terms of between 10 and 20 years and can be extended generally in five-year increments. All of our leases in the US require a fixed annual rent, and many require the payment of additional rent if restaurant sales exceed a negotiated amount. Our leases in Brazil typically have terms shorter than our US leases and our rental payments may be subject to review by Brazilian courts. Generally, our leases are “net” leases, which require us to pay all of the cost of insurance, taxes, maintenance and utilities. We generally cannot cancel these leases at our option.
In addition, we lease approximately 24,700 square feet of office space in Plano, Texas which we use as our corporate headquarters. We utilize approximately 4,600 square feet of office space above our Santo Amaro restaurant in São Paulo for our corporate office in Brazil.
37
The general location and opening year for each of our restaurants are set forth below:
|
United States |
|
International |
|||||
|
Location |
Date Opened |
|
Location |
Date Opened |
|
Location |
Date Opened |
|
Addison, TX* |
Aug 1997 |
|
San Diego, CA |
Aug 2013 |
|
São Paulo, Moema |
Mar 1986 |
|
Houston, TX* |
Feb 2000 |
|
Rosemont, IL |
Sep 2013 |
|
São Paulo, Santo Amaro |
Jun 1987 |
|
Atlanta, GA |
Feb 2001 |
|
New York, NY |
Dec 2013 |
|
São Paulo, Vila Olimpia |
Oct 2003 |
|
Chicago, IL |
Aug 2002 |
|
San Jose, CA |
Feb 2014 |
|
Belo Horizonte, Sevassi |
Sep 2006 |
|
Beverly Hills, CA |
Mar 2005 |
|
Portland, OR |
May 2014 |
|
Brasilia |
May 2007 |
|
Washington, D.C. |
Dec 2005 |
|
Los Angeles, CA |
Dec 2014 |
|
Rio de Janeiro, Botafogo |
Jun 2011 |
|
Philadelphia, PA |
Dec 2006 |
|
San Juan, Puerto Rico |
Feb 2015 |
|
São Paulo, Center Norte |
Oct 2012 |
|
Minneapolis, MN |
Apr 2007 |
|
Summerlin, NV |
Nov 2015 |
|
São Paulo, Jardins |
Nov 2013 |
|
Baltimore, MD |
Aug 2007 |
|
The Woodlands, TX |
Nov 2015 |
|
Rio de Janeiro, Barra |
Apr 2015 |
|
Austin, TX |
Nov 2007 |
|
San Francisco, CA |
Dec 2015 |
|
|
|
|
Indianapolis, IN |
May 2008 |
|
New Orleans, LA |
Dec 2015 |
|
Mexico City (Polanco)** |
May 2015 |
|
Miami Beach, FL |
Oct 2008 |
|
Naperville, IL |
Jan 2016 |
|
Mexico City (Santa Fe)** |
Oct 2016 |
|
Scottsdale, AZ |
Dec 2008 |
|
King of Prussia, PA |
Jul 2016 |
|
|
|
|
Kansas City, MO |
Jan 2009 |
|
Dunwoody, GA |
Nov 2016 |
|
Jeddah (Saudi Arabia)** |
Aug 2017 |
|
Denver, CO |
Jul 2009 |
|
Tysons, VA |
Jan 30, 2017 |
|
Dubai (United Arab Emirates)** |
Feb 2018 |
|
San Antonio, TX |
Aug 2009 |
|
Dallas, TX |
Feb 13, 2017 |
|
|
|
|
Las Vegas, NV |
Nov 2011 |
|
Bellevue, WA |
May 14, 2017 |
|
|
|
|
Orlando, FL |
Mar 2012 |
|
Troy, MI |
Nov 6, 2017 |
|
|
|
|
Boston, MA |
Nov 2012 |
|
Jacksonville, FL |
Nov 13, 2017 |
|
|
|
|
* |
Indicates restaurant on property owned by the Company. |
|
** |
Indicates joint venture restaurant. |
Since opening our first location in the US in 1997, we have brought churrasqueiros, or gaucho chefs, to the US from Brazil utilizing the L-1B “specialized knowledge” visa which generally permits an employee to remain in the US for up to five years. We also utilize the L-1A “intracompany manager” visa for our employees who qualify. The L-1A visa generally permits an employee to remain in the US for up to seven years. The Department of Homeland Security’s Bureau of Citizenship & Immigration Services (“USCIS,” formerly INS) began to narrow its interpretation of L-1B visa eligibility as to all corporate petitioners in 2007. Beginning in 2009, the USCIS ceased approving our L-1B visas and recommended that the petitions of 10 then current L-1B visa holders be revoked. We contested the adverse actions before USCIS, and then sued USCIS in US District Court. The US District Court affirmed the USCIS denials in 2013, but we appealed that determination, and on October 21, 2014, the US Court of Appeals for the D.C. Circuit granted our appeal, reversed the USCIS denial, and remanded the representative L-1B petition in question to the district court, with instructions to vacate the denial and to remand to USCIS for further consideration in light of the Court’s correction of USCIS’s factual and legal adjudication errors. USCIS reopened the matter pursuant to the D.C. Circuit’s remand order. On June 12, 2015, USCIS again denied the L-1B petition. On August 7, 2015, we filed a complaint for declaratory and mandamus relief in the US District Court for the District of Columbia seeking to overturn the latest USCIS denial and effectuate the prior holding of the D.C. Circuit. The government answered our complaint on October 13, 2015, and the parties then filed cross-motions for summary judgment. On September 26, 2016, the District Court ruled that the USCIS improperly disregarded substantial evidence as our evidence was adequate to conclude that the gaucho churrasqueiro position involves specialized knowledge but that we did not provide enough evidence that a particular individual completed our training program. Neither we nor the government appealed this determination. We intend to file new L-1B visa petitions in the near future.
38
The Union of Workers in Hotels, Apart-Hotels, Motels, Flats, Restaurants, Bars, Snack Bars and Similar in Săo Paulo and the Region (the “Union of Workers”) brought claims in 2011 on behalf of certain employees of one of our Săo Paulo restaurants asserting that the restaurant charged mandatory tips and did not properly calculate compensation payable to or for the benefit of those employees. The claims were initially dismissed in 2011 but the union pursued various appeals of its claims. A regional labor court rendered a decision in 2014 that partially granted one of the union appeals and ordered the restaurant to make unquantified payments based on its determination that the restaurant charged mandatory tips. At that time, the restaurant recorded a reserve of R$100,000 (Brazilian Real), the amount established by the judge for the calculation of court fees. The restaurant appealed to the superior labor court, which did not grant the appeal. The decision of the regional labor court became final in November 2015 and the claims were remitted to the first labor court to proceed with the next phase of the matter. The Company is currently engaged in the delivery of documents and information to, and negotiations with, the union. At this time, the Company does not know how many employees could be affected or the relevant time period for, or the appropriate method of, calculating any amounts that may be payable. In light of the foregoing and the inherent uncertainties involved in Brazilian labor matters, we are currently unable to reasonably estimate the possible loss or a range of possible losses that may result from the union’s claims; however, an adverse outcome could materially and adversely affect the Company’s financial condition, results of operations or cash flows in any particular reporting period. The Union of Workers also represents certain employees of our other four locations in Săo Paulo. The Union of Workers negotiated a new collective agreement applicable for the period 2015 through 2017. Based on the terms of the new agreement, the Company believes that the Union of Workers should not now be able to assert the same claims on behalf of employees of the four Săo Paulo restaurants that were not covered by the prior decision. Nonetheless, in light of the inherent uncertainties involved in Brazilian labor matters, there can be no assurance that the Union of Workers will not pursue such claims and, if so, that such claims would be rejected; an adverse outcome could materially and adversely affect the Company’s financial condition, results of operations or cash flows in any particular reporting period.
We are currently involved in other claims, investigations and legal actions that arise in the ordinary course of our business, including claims and investigations resulting from employment-related matters. None of these matters, many of which are covered by insurance, has had a material effect on us. We are not party to any material pending legal proceedings and are not aware of any claims that could have a material adverse effect on our business, financial condition, results of operations or cash flows. However, a significant increase in the number of these claims or an increase in amounts owing under successful claims could materially and adversely affect our business, financial condition, results of operations or cash flows.
Item 4. Mine Safety Disclosures.
None.
39
Item 5. Market for Registrant’s Common Equity, Related Stockholder Matters and Issuer Purchases of Equity Securities.
Market Information
Our common stock has traded on the NASDAQ Global Select Market under the symbol “FOGO” since it began trading on June 19, 2015. Our initial public offering was priced at $20.00 per share on June 18, 2015. The following table sets forth, for the periods indicated, the high and low sales prices per share for our common stock as quoted by the Nasdaq Global Select Market:
|
Fiscal Year Ended December 31, 2017 |
|
High |
|
|
Low |
|
||
|
First Quarter (January 2, 2017 - April 2, 2017) |
|
$ |
16.35 |
|
|
$ |
13.10 |
|
|
Second Quarter (April 3, 2017 - July 2, 2017 ) |
|
$ |
17.05 |
|
|
$ |
13.25 |
|
|
Third Quarter (July 3, 2017 - October 1, 2017) |
|
$ |
13.95 |
|
|
$ |
12.10 |
|
|
Fourth Quarter (October 2, 2017 - December 31, 2017) |
|
$ |
12.70 |
|
|
$ |
10.30 |
|
|
Fiscal Year Ended January 1, 2017 |
|
High |
|
|
Low |
|
||
|
First Quarter (January 4, 2016 - April 3, 2016) |
|
$ |
16.95 |
|
|
$ |
13.40 |
|
|
Second Quarter (April 4, 2016 - July 3, 2016 ) |
|
$ |
17.89 |
|
|
$ |
12.00 |
|
|
Third Quarter (July 4, 2016 - October 2, 2016) |
|
$ |
14.18 |
|
|
$ |
10.51 |
|
|
Fourth Quarter (October 3, 2016 - January 1, 2017) |
|
$ |
14.95 |
|
|
$ |
10.50 |
|
The closing sale price of a share of our common stock, as reported by the Nasdaq Global Select Market, on March 2, 2018, was $15.625. As of March 2, 2018, there were 32 holders of record of our common stock, not including beneficial owners of shares registered in nominee or street name.
Performance Graph
The following performance graph compares the dollar change in the cumulative shareholder return on our common stock with the cumulative total returns of the S&P Smallcap 600 Index, the Nasdaq Composite Index and the NRN Restaurant Index. This graph assumes a $100 investment in our common stock on June 19, 2015 (the date when our common stock first started trading) and in each of the forgoing indices on each of the dates indicated, and assumes the reinvestment of dividends, if any. The indices are included for comparative purposes only. They do not necessarily reflect management's opinion that such indices are an appropriate measure of the relative performance of our common stock. This graph is furnished and not "filed" with the Securities and Exchange Commission and it is not "soliciting material", and should not be incorporated by reference in any of our filings under the Securities Act of 1933, as amended, or the Securities Exchange Act of 1934, as amended, whether made before or after the date hereof and irrespective of any general incorporation language in such filing.
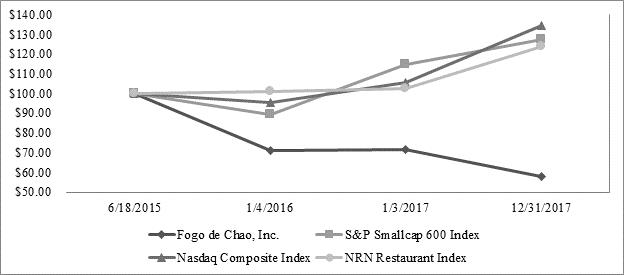
40
|
|
|
Jun 18, 2015 |
|
|
Jan 4, 2016 |
|
|
Jan 3, 2017 |
|
|
Dec 31, 2017 |
|
||||
|
Fogo de Chão, Inc. |
|
$ |
100.00 |
|
|
$ |
71.15 |
|
|
$ |
71.75 |
|
|
$ |
58.00 |
|
|
S&P Smallcap 600 Index |
|
$ |
100.00 |
|
|
$ |
89.15 |
|
|
$ |
114.66 |
|
|
$ |
127.29 |
|
|
Nasdaq Composite Index |
|
$ |
100.00 |
|
|
$ |
95.52 |
|
|
$ |
105.77 |
|
|
$ |
134.49 |
|
|
NRN Restaurant Index |
|
$ |
100.00 |
|
|
$ |
101.09 |
|
|
$ |
102.74 |
|
|
$ |
123.85 |
|
Dividend Policy
We intend to retain all of our earnings for the foreseeable future to fund the operation and growth of our business and to repay indebtedness, and therefore, we do not anticipate paying any cash dividends to holders of our capital stock for the foreseeable future. Any future determination regarding the payment of any dividends will be made at the discretion of our board of directors and will depend on our financial condition, results of operations, capital requirements, liquidity, contractual restrictions, general business conditions and other factors that our board of directors may deem relevant. Our credit facility restricts, and debt instruments that we may enter into in the future may contain, restrictions on our ability to pay dividends on our common stock.
In prior years, we considered the undistributed net earnings of our Brazilian subsidiaries to be indefinitely reinvested. Although there were no known restrictions that would prohibit the repatriation of cash and cash equivalents from our Brazilian subsidiaries to the US, such repatriation may have constituted a change in our assertion regarding indefinite reinvestment. As a result, we would have been required to record a tax liability attributable to those undistributed earnings. Recent US tax reform legislation has changed the way the Company would account for the impact of a distribution. The Company is in the process of determining whether a distribution would require a change to the indefinite reinvestment assertion and estimating the deferred tax liability, if any, that would be recorded were the company to change its assertion. Additionally, cash and cash equivalents of our joint venture in Mexico can only be used to settle the obligations of the joint venture. See “Liquidity and Capital Resources.”
Unregistered Recent Sales of Securities
None.
Securities Authorized for Issuance Under Equity Compensation Plans
See Item 12, “Security Ownership of Certain Beneficial Owners and Management and Related Stockholder Matters,” of this Annual Report on Form 10-K for information regarding securities authorized for issuance under the Company’s equity compensation plans.
Item 6. Selected Financial Data.
The following tables set forth the Company’s selected financial data for the periods indicated. The statement of operations data for the fiscal years ended December 31, 2017, January 1, 2017 and January 3, 2016 and the balance sheet data as of December 31, 2017 and January 1, 2017 have been derived from our audited consolidated financial statements appearing elsewhere in this Annual Report on Form 10-K. The statement of operations data for the fiscal years ended December 28, 2014 and December 29, 2013 and the balance sheet data as of January 3, 2016, December 28, 2014 and December 29, 2013 have been derived from our historical audited consolidated financial statements, which are not included in this report.
41
The historical results presented below are not necessarily indicative of the results to be expected for any future period. This information should be read in conjunction with “Business,” "Risk Factors," Management’s Discussion and Analysis of Financial Condition and Results of Operations” and our audited consolidated financial statements and the related notes thereto included elsewhere in this annual report.
|
|
|
Fiscal Year Ended |
|
|||||||||||||||||
|
|
|
December 31, |
|
|
January 1, |
|
|
January 3, |
|
|
December 28, |
|
|
December 29, |
|
|||||
|
|
|
2017 |
|
|
2017 |
|
|
2016 |
|
|
2014 |
|
|
2013 |
|
|||||
|
|
|
(52 weeks) |
|
|
(52 weeks) |
|
|
(53 weeks) |
|
|
(52 weeks) |
|
|
(52 weeks) |
|
|||||
|
Statement of Operations Data |
|
|
|
|
|
|
|
|
|
|
|
|
|
|
|
|
|
|
|
|
|
(in thousands, except share and per share amounts) |
|
|
|
|
|
|
|
|
|
|
|
|
|
|
|
|
|
|
|
|
|
Revenues: |
|
|
|
|
|
|
|
|
|
|
|
|
|
|
|
|
|
|
|
|
|
Revenue restaurant sales |
|
$ |
313,967 |
|
|
$ |
288,134 |
|
|
$ |
271,498 |
|
|
$ |
261,401 |
|
|
$ |
219,239 |
|
|
Other revenue |
|
|
392 |
|
|
|
162 |
|
|
|
136 |
|
|
|
879 |
|
|
|
— |
|
|
Total revenues |
|
|
314,359 |
|
|
|
288,296 |
|
|
|
271,634 |
|
|
|
262,280 |
|
|
|
219,239 |
|
|
Restaurant operating costs: |
|
|
|
|
|
|
|
|
|
|
|
|
|
|
|
|
|
|
|
|
|
Food and beverage costs |
|
|
89,664 |
|
|
|
82,145 |
|
|
|
80,062 |
|
|
|
78,330 |
|
|
|
67,002 |
|
|
Compensation and benefit costs(a) |
|
|
75,173 |
|
|
|
66,376 |
|
|
|
60,224 |
|
|
|
54,673 |
|
|
|
46,860 |
|
|
Occupancy and other operating expenses (excluding depreciation and amortization) |
|
|
61,320 |
|
|
|
54,001 |
|
|
|
46,153 |
|
|
|
44,156 |
|
|
|
36,703 |
|
|
Total restaurant operating costs |
|
|
226,157 |
|
|
|
202,522 |
|
|
|
186,439 |
|
|
|
177,159 |
|
|
|
150,565 |
|
|
Marketing and advertising costs |
|
|
8,069 |
|
|
|
7,132 |
|
|
|
6,618 |
|
|
|
5,585 |
|
|
|
6,188 |
|
|
General and administrative costs(b) |
|
|
23,321 |
|
|
|
20,576 |
|
|
|
32,566 |
|
|
|
21,419 |
|
|
|
18,239 |
|
|
Pre-opening costs |
|
|
3,773 |
|
|
|
3,580 |
|
|
|
4,858 |
|
|
|
1,951 |
|
|
|
4,764 |
|
|
Loss on extinguishment of debt |
|
|
— |
|
|
|
— |
|
|
|
5,991 |
|
|
|
3,090 |
|
|
|
6,875 |
|
|
Non-cash impairment charges |
|
|
4,188 |
|
|
|
320 |
|
|
|
— |
|
|
|
— |
|
|
|
— |
|
|
Depreciation/amortization and other |
|
|
19,367 |
|
|
|
15,750 |
|
|
|
12,180 |
|
|
|
11,684 |
|
|
|
8,618 |
|
|
Total costs and expenses |
|
|
284,875 |
|
|
|
249,880 |
|
|
|
248,652 |
|
|
|
220,888 |
|
|
|
195,249 |
|
|
Income from operations |
|
|
29,484 |
|
|
|
38,416 |
|
|
|
22,982 |
|
|
|
41,392 |
|
|
|
23,990 |
|
|
Other income (expense): |
|
|
|
|
|
|
|
|
|
|
|
|
|
|
|
|
|
|
|
|
|
Interest expense, net(c) |
|
|
(2,598 |
) |
|
|
(2,179 |
) |
|
|
(9,119 |
) |
|
|
(17,121 |
) |
|
|
(22,354 |
) |
|
Other income (expense), net |
|
|
49 |
|
|
|
(18 |
) |
|
|
(34 |
) |
|
|
(7 |
) |
|
|
(101 |
) |
|
Total other income (expense), net |
|
|
(2,549 |
) |
|
|
(2,197 |
) |
|
|
(9,153 |
) |
|
|
(17,128 |
) |
|
|
(22,455 |
) |
|
Income before income taxes |
|
|
26,935 |
|
|
|
36,219 |
|
|
|
13,829 |
|
|
|
24,264 |
|
|
|
1,535 |
|
|
Income tax expense (benefit)(d) |
|
|
(1,470 |
) |
|
|
11,957 |
|
|
|
(14,168 |
) |
|
|
6,991 |
|
|
|
2,472 |
|
|
Net income (loss) |
|
|
28,405 |
|
|
|
24,262 |
|
|
|
27,997 |
|
|
|
17,273 |
|
|
|
(937 |
) |
|
Less: Net income (loss) attributable to noncontrolling interest |
|
|
(384 |
) |
|
|
(175 |
) |
|
|
132 |
|
|
|
(282 |
) |
|
|
— |
|
|
Net income (loss) attributable to Fogo de Chão, Inc. |
|
$ |
28,789 |
|
|
$ |
24,437 |
|
|
$ |
27,865 |
|
|
$ |
17,555 |
|
|
$ |
(937 |
) |
|
Earnings (loss) per common share attributable to Fogo de Chão, Inc.(e): |
|
|
|
|
|
|
|
|
|
|
|
|
|
|
|
|
|
|
|
|
|
Basic |
|
$ |
1.02 |
|
|
$ |
0.87 |
|
|
$ |
1.09 |
|
|
$ |
0.77 |
|
|
$ |
(0.04 |
) |
|
Diluted |
|
$ |
1.00 |
|
|
$ |
0.85 |
|
|
$ |
1.06 |
|
|
$ |
0.76 |
|
|
$ |
(0.04 |
) |
|
Weighted average common shares outstanding(e): |
|
|
|
|
|
|
|
|
|
|
|
|
|
|
|
|
|
|
|
|
|
Basic |
|
|
28,227,747 |
|
|
|
28,119,196 |
|
|
|
25,519,312 |
|
|
|
22,697,106 |
|
|
|
22,554,969 |
|
|
Diluted |
|
|
28,802,819 |
|
|
|
28,822,616 |
|
|
|
26,324,115 |
|
|
|
23,016,461 |
|
|
|
22,554,969 |
|
42
|
|
|
As of |
|
|
As of |
|
|
As of |
|
|
As of |
|
|
As of |
|
|||||
|
|
|
December 31, |
|
|
January 1, |
|
|
January 3, |
|
|
December 28, |
|
|
December 29, |
|
|||||
|
|
|
2017 |
|
|
2017 |
|
|
2016 |
|
|
2014 |
|
|
2013 |
|
|||||
|
Consolidated Balance Sheet Data |
|
|
|
|
|
|
|
|
|
|
|
|
|
|
|
|
|
|
|
|
|
(in thousands) |
|
|
|
|
|
|
|
|
|
|
|
|
|
|
|
|
|
|
|
|
|
Cash and cash equivalents |
|
$ |
38,342 |
|
|
$ |
31,275 |
|
|
$ |
24,919 |
|
|
$ |
19,387 |
|
|
$ |
16,010 |
|
|
Total assets |
|
|
542,613 |
|
|
|
522,395 |
|
|
|
484,577 |
|
|
|
476,183 |
|
|
|
480,841 |
|
|
Total long-term debt, including current portion |
|
|
138,000 |
|
|
|
150,000 |
|
|
|
165,000 |
|
|
|
243,045 |
|
|
|
252,283 |
|
|
Total equity |
|
|
320,774 |
|
|
|
292,859 |
|
|
|
252,554 |
|
|
|
155,459 |
|
|
|
150,322 |
|
|
(a) |
For the fiscal year ended January 3, 2016, includes $1.4 million of compensation expense recognized upon the closing of the IPO attributable to the vesting of stock options. See Note 11 to the Consolidated Financial Statements. |
|
(b) |
For the fiscal year ended January 3, 2016, includes the $7.5 million fee paid to an affiliate of THL as a result of the termination of advisory services agreement. See Note 19 to the Consolidated Financial Statements. For the fiscal year ended January 3, 2016, includes $4.3 million of compensation expense recognized upon the closing of the IPO attributable to the vesting of stock options. See Note 11 to the Consolidated Financial Statements. |
|
(c) |
In connection with the IPO we refinanced our existing credit facility (the “2012 Credit Facility”) and entered into a new credit facility (the “2015 Credit Facility”). Upon the closing of the IPO, we drew down on the 2015 Credit Facility and used that borrowing along with the proceeds from the IPO and repaid the outstanding debt on the 2012 Credit Facility. See Note 10 to the Consolidated Financial Statements. |
|
(d) |
For the fiscal year ended December 31, 2017, includes net tax benefit of $8.5 due to the enactment of the Tax Act during December 2017, consisting of a $15.0 million provisional tax benefit recorded related to the re-measurement of certain deferred tax assets and liabilities; offset by a $6.5 provisional tax expense related to the one-time transition tax on the mandatory deemed repatriation of foreign earnings, and includes a $2.1 million net benefit related to the election to utilize foreign tax credits instead of deduction of foreign taxes paid. See Note 14 to the Consolidated Financial Statements. |
|
(e) |
In connection with the closing of the IPO, the Company effected a stock split pursuant to which each share held by the holder of common stock was reclassified into 25.4588 shares. All share and per share data have been retroactively restated to give effect to the stock split. |
43
Item 7. Management’s Discussion and Analysis of Financial Condition and Results of Operations.
You should read the following discussion and analysis of our financial condition and results of operations in conjunction with the “Selected Financial Data” section of this annual report and our consolidated financial statements and related notes appearing elsewhere in this annual report on Form 10-K. In addition to historical information, this discussion and analysis contains forward-looking statements based on current expectations that involve risks, uncertainties and assumptions, such as our plans, objectives, expectations and intentions described in “Cautionary Note Regarding Forward-Looking Statements” at the beginning of this annual report and included elsewhere in this annual report. Our actual results and the timing of events may differ materially from those anticipated in these forward-looking statements as a result of various factors, including those set forth in the “Risk Factors” section and included elsewhere in this annual report.
In this section and other parts of this Form 10-K, we refer to certain measures used for financial and operational decision making and as a means to evaluate period-to-period comparisons. We also may refer to a number of financial measures that are not defined under generally accepted accounting principles in the United States of America (“GAAP”), but have corresponding GAAP-based measures. Where non-GAAP measures appear, we provide tables reconciling these non-GAAP measures to their corresponding GAAP-based measures and make reference to a discussion of their use. We believe these measures provide useful information about operating results, enhance the overall understanding of past financial performance and future prospects, and allow for greater transparency with respect to key metrics used by management in its financial and operational decision making.
We operate on a 52- or 53-week fiscal year that ends on the Sunday that is closest to December 31 of that year. Each fiscal year generally comprises four 13-week fiscal quarters, although in the years with 53 weeks the fourth quarter represents a 14-week period. References to Fiscal 2017 relate to our 52-week fiscal year ended December 31, 2017. References to Fiscal 2016 relate to our 52-week fiscal year ended January 1, 2017. References to Fiscal 2015 relate to our 53-week fiscal year ended January 3, 2016.
Overview
Fogo de Chão (fogo-dee-shoun) is a leading Brazilian steakhouse, or churrascaria, which has specialized for nearly 40 years in fire-roasting high-quality meats utilizing the centuries-old Southern Brazilian cooking technique of churrasco. We deliver a distinctive and authentic Brazilian dining experience through the combination of our high-quality Brazilian cuisine and our differentiated service model known as espeto corrido (Portuguese for “continuous service”) delivered by our churrasqueiros, which we refer to as our gaucho chefs. We offer our guests a variety of menu choices including our most popular offering the Full Churrasco Experience as well Gaucho Lunch, Weekend Brazilian Brunch and Bar Fogo menu items. The Full Churrasco Experience, our prix fixe menu, provides the opportunity to experience a variety of meats including beef, lamb, pork and chicken, simply seasoned and carefully fire-roasted to expose their natural flavors as well as a selection of fresh seasonal salads and specialty items at the Market Table.
Growth Strategies and Outlook
Our growth is based on the following strategies:
|
|
• |
Grow our restaurant base; |
|
|
• |
Grow our comparable restaurant sales; and |
|
|
• |
Improve margins by leveraging our infrastructure and investments in human capital. |
We believe we are in the early stages of our growth with 50 current restaurants, 38 in the US, nine in Brazil and three international joint venture restaurants. Based on internal analysis and a study prepared by an independent third party, we believe there is a long-term growth potential for more than 100 domestic sites, with additional new restaurants internationally. We have a long track record of successful new restaurant development, having grown our restaurant count by a multiple of 10 since 2000, and at a 12.4% CAGR since 2010. While new restaurants are expected to be a key driver of our growth, we believe positive comparable restaurant sales growth and margin expansion through leveraging our infrastructure will also contribute to future growth.
44
Restaurant Development
Restaurant openings reflect the number of new restaurants opened during a particular reporting period. During Fiscal 2017 we opened our third international joint venture restaurant in Jeddah, Saudi Arabia. Over the next five years, we plan to increase our company-owned restaurant count by at least 10% annually, with North America being our primary market for new restaurant development. In addition, over the next five years, we plan to opportunistically open new restaurants in Brazil as attractive real estate locations become available. We will pursue growth in international markets through a combination of company-owned restaurants and joint ventures, which we believe allows us to expand our brand with limited capital investment by us. The actual number and timing of new restaurant openings is subject to a number of factors outside of the Company's control including, but not limited to, weather conditions and factors under the control of landlords, contractors and regulatory/licensing authorities.
|
|
|
Fiscal Year |
|
|||||||||
|
|
|
2017 |
|
|
2016 |
|
|
2015 |
|
|||
|
Restaurant Activity |
|
|
|
|
|
|
|
|
|
|
|
|
|
Beginning of Period |
|
45 |
|
|
41 |
|
|
34 |
|
|||
|
Openings(a) |
|
|
6 |
|
|
|
4 |
|
|
|
7 |
|
|
Closings(b) |
|
|
(1 |
) |
|
|
— |
|
|
|
— |
|
|
Restaurants at end of period |
|
50 |
|
|
45 |
|
|
41 |
|
|||
|
(a) |
We opened our first Middle East JV restaurant in August 2017. We do not consolidate the results of our Middle East JV operations. |
|
(b) |
The lease for an underperforming restaurant in Brazil expired in September 2017 and not renewed. The restaurant was fully impaired as of January 1, 2017. |
Key Events
Merger Agreement with Rhône
On February 20, 2018, the Company entered into an Agreement and Plan of Merger (the “Merger Agreement”) among Prime Cut Intermediate Holdings Inc., a Delaware corporation (“Parent”) and an investment entity affiliated with Rhône Capital V L.P. (“Rhône”) and Prime Cut Merger Sub Inc., a Delaware corporation and a wholly owned subsidiary of Parent (“Merger Subsidiary”), pursuant to which, among other things and subject to the satisfaction or waiver of specified conditions, Merger Subsidiary will merge with and into the Company, which will survive as a wholly owned subsidiary of Parent. Parent will finance the Merger with a combination of debt and equity financing.
At the effective time of the Merger,
|
|
• |
each share of the Company’s common stock issued and outstanding immediately prior to the Effective Time (other than dissenting shares) will be converted into the right to receive $15.75 in cash, without interest; |
|
|
• |
each Company outstanding stock option will be cancelled, with the holder of such stock option becoming entitled to receive an amount in cash equal to (i) the excess, if any, of (a) $15.75 minus (b) the exercise price per share of common stock subject to such stock option, multiplied by (ii) the number of shares of common stock subject to such stock option; and |
|
|
• |
the restrictions on each Company outstanding restricted stock will lapse, with the holder of such performance-based restricted stock becoming entitled to receive an amount in cash equal to (i) $15.75 multiplied by (ii) the number of shares of common stock subject to such restricted stock. |
Following execution of the Merger Agreement, certain affiliates and co-investors of Thomas H. Lee Partners, L.P. and certain directors and executive officers of the Company, who collectively hold approximately 61.56% of the voting power of the outstanding common stock of the Company, executed and delivered to the Company a written consent adopting the Merger Agreement. The Merger cannot be consummated until the passing of 20 calendar days from the date on which the Company mails to the Company’s stockholders an information statement describing the Merger Agreement, the Merger and the other transactions contemplated by the Merger Agreement on Schedule 14C under the Securities Exchange Act of 1934, as amended. Following delivery of the written consent, pursuant to the terms of the Merger Agreement, the Company may not engage in any further discussions or solicitations regarding the potential acquisition of the Company by any third party, and the Company has no ability to terminate the Merger Agreement in order to enter into an alternative transaction.
45
The completion of the Merger is subject to customary conditions, including, without limitation, (1) the absence of any restraining order, preliminary or permanent injunction or other court order or other legal restraint or prohibition preventing the consummation of the Merger, (2) the expiration or termination of the applicable waiting period under the Hart-Scott-Rodino Antitrust Improvements Act of 1976, as amended, (3) subject to certain qualifications, the accuracy of representations and warranties of the Company, Parent and Merger Subsidiary, and (4) the performance in all material respects of the obligations of the Company, Parent and Merger Subsidiary, respectively. The Merger is not subject to a financing condition. Completion of the Merger is expected early in the second fiscal quarter of 2018.
Natural Disasters
During the third quarter of Fiscal 2017, our operations were impacted by Hurricanes Harvey, Irma and Maria which struck the US mainland and Puerto Rico adversely affecting 10 of our US restaurants. Most of the affected restaurants were minimally impacted, however four restaurants were significantly impacted requiring them to close for multiple days. These closures extended prior to landfall through the post-hurricane clean up periods. The US mainland restaurants returned to operations within a week of the hurricanes, with sales exceeding expectations for the remainder of Fiscal 2017. Our restaurant in San Juan, Puerto Rico re-opened mid-November 2017 with sales also exceeding our expectations for the remainder of Fiscal 2017. We maintain comprehensive insurance coverage on our restaurants including property, flood and business interruption. Initial assessments have found minimal structural and cosmetic damage to the restaurants; however we are working with our insurance providers to assess the overall impact from the hurricanes and expect that process to take some time. As a result of the hurricane activity, we estimate total revenue was negatively impacted by $1.6 million for Fiscal 2017. We expect to recover a portion of the lost income through insurance recoveries in Fiscal 2018. The Company has not recorded any gains related to insurance recoveries during Fiscal 2017.
In addition, operations of our Mexican JV were impacted by multiple major earthquakes that affected the greater Mexico City metropolitan area. Our two restaurants in Mexico City sustained minimal cosmetic damage and we believe no structural damage. To date, we have not experienced a loss of operating days as a result of the earthquakes.
Secondary Offering
On May 17, 2017, we completed a secondary offering of 5,175,000 shares of common stock at a public offering price of $14.00 per share, which included 675,000 shares sold to the underwriters pursuant to their over-allotment option. As all of these shares were offered by certain selling stockholders we did not receive any proceeds from the offering.
2016 Summer Olympics
Rio de Janeiro hosted the 2016 Summer Olympics which were held during the third quarter of Fiscal 2016. As a result, we estimate our two Rio de Janeiro restaurants contributed approximately $1.4 million of incremental revenue in the third quarter of Fiscal 2016.
Recent Events in Brazil
Brazil’s political environment has historically influenced, and continues to influence, the performance of the country’s economy. Starting in 2015 a series of protests began in Brazil against the Brazilian government and its President. The initial protests occurred in cities throughout Brazil, including Rio de Janeiro and São Paolo, and continued throughout the remainder of 2015, culminating in the impeachment of the President of Brazil in 2016. After a somewhat successful start to the new President’s administration, their proposed pension overhaul faced significant opposition with protests occurring in a number of cities in response to the government’s austerity plans. The new administration also endured a number of scandals emerging from ongoing anti-corruption campaign which ultimately led to the current President’s indictment on corruption charges in June 2017. In August 2017, Brazil’s Lower House of government voted against sending the trial to Brazil’s Supreme Court; however, a second round of corruption charges were leveled against the current President, whose term is due to end in October 2018, in September 2017. The protests and political unrest contributed to lower guest traffic in our restaurants in Brazil, in Fiscal 2016 and Fiscal 2017. Additionally, growing security concerns are affecting guest traffic in our two Rio de Janeiro restaurants. While we believe these issues are temporary, should indicators suggest a permanent reduction in guest traffic and cash flows due to the prolonged unrest, the recovery of carrying value of certain Brazilian assets could be challenged.
In addition to the uncertain political environment, Brazil continues to suffer from a protracted economic recession that is negatively impacting our guests. Although we believe Fiscal 2017 represents an inflection point for the Brazilian economy, as supported by improving economic forecasts, political turbulence continues to cast a long shadow on the strength of the recovery. Nevertheless, we believe Brazil’s economy will likely continue recovering as we lap the economic recession. With our focus on US development, Brazil will continue becoming a smaller portion of the overall business, representing less than 15% of our consolidated revenue base for the second half of Fiscal 2017.
46
Brazilian legislation regulating the collection of tips in commercial establishments was approved by the President of Brazil and became effective on May 13, 2017. We have implemented new procedures intended to facilitate our compliance with the new tip legislation, however, we cannot predict whether our procedures will fully comply with any regulations that may be adopted in furtherance of the legislation or judicial determinations as to the requirements of the legislation. Additionally, comprehensive labor reform legislation became effective in November 2017. We anticipate that the new laws will be tested in Brazilian courts. We are attempting to implement the changes required under the new laws, but cannot predict the potential impact of the new laws, or judicial interpretation of such laws, on our business or prospective results of operations.
Tax Law Changes
On December 22, 2017, the Tax Act was signed into law by President Trump. The Tax Act significantly revised the US corporate income tax regime by, among other things, lowering the US corporate tax rate from 35% to 21% effective January 1, 2018, while also repealing the deduction for domestic production activities, implementing a territorial tax system and imposing a repatriation tax on deemed repatriated earnings of foreign subsidiaries. US GAAP requires that the impact of tax legislation be recognized in the period in which the law was enacted. As a result of the Tax Act, the Company recorded a tax benefit of $15.0 million due to a remeasurement of deferred tax assets and liabilities and a tax charge of $6.5 million due to the transition tax on deemed repatriation of deferred foreign income, in the three months ended December 31, 2017. Both of the tax benefit and the tax charge represent provisional amounts and the Company’s current best estimates. Any adjustments recorded to the provisional amounts through the fourth quarter of fiscal 2018 will be included in income from operations as an adjustment to tax expense. The provisional amounts incorporate assumptions made based upon the Company’s current interpretation of the Tax Act and may change as the Company receives additional clarification and implementation guidance.
Commodity Pricing
We experienced lower and stable beef prices in Fiscal 2017, which allowed us to offset inflation on food costs and other meats as compared to Fiscal 2016. Prices at food-at-home outlets have posted lower year-over-year price increases, and supermarket prices decreased for the second year in a row, falling approximately 0.2 percent. Inflation has been lower than average due, in part, to a stronger US dollar.
Exchange Rate Impact
We experienced significant foreign currency improvement from Fiscal 2016 to Fiscal 2017 due to fluctuations of the Brazilian Real relative to the US dollar. When the Brazilian Real strengthens compared to the US dollar, it has a positive impact on our Brazilian operating results upon translation of those results into US dollars for the purposes of consolidation. We anticipate foreign currency to stabilize throughout Fiscal 2018 with respect to the Brazilian Real. See “Supplemental Selected Constant Currency Information” on page 60 for the exchange rate impact on current financial periods.
Performance Indicators
In assessing the performance of our business, we consider a variety of performance and financial measures. The key measures we use for determining how our business is performing are the number of new restaurant openings, comparable restaurant sales, restaurant contribution and restaurant contribution margin and Adjusted EBITDA and Adjusted EBITDA margin. Restaurant contribution and restaurant contribution margin and Adjusted EBITDA and Adjusted EBITDA margin are non-GAAP measures. See page 56 for discussion of non-GAAP financial measures.
New Restaurant Openings
Our ability to successfully open new restaurants and expand our restaurant base is critical to adding revenue capacity to meet our goals for growth. New restaurant openings contribute additional operating weeks and revenue to our business. Before a new restaurant opens, we incur pre-opening costs, as described below. New restaurants often open with an initial start-up period of sales volatility. Operating margins tend to stabilize within twelve months of opening. New restaurants typically experience normal inefficiencies in the form of higher food, labor and other direct operating expenses and, as a result, restaurant contribution margins are generally lower during the start-up period of operation. To achieve our goal to successfully open new restaurants, we consider a number of factors including macro and micro economic conditions, availability of appropriate locations, competition in local markets, and the availability of teams to manage new locations. The actual number and timing of new restaurant openings is subject to a number of factors outside of our control including, but not limited to, weather conditions and factors under the control of landlords, contractors and regulatory/licensing authorities.
47
We consider a restaurant to be comparable during the first full fiscal quarter following the eighteenth full month of operations. We adjust the sales included in the comparable restaurant calculation for restaurant closures, primarily as a result of remodels, so that the periods will be comparable. Changes in comparable restaurant sales reflect changes in sales for the comparable group of restaurants over a specified period of time. Changes in comparable sales reflect changes in guest count trends as well as changes in average check per person, as described below. This measure highlights performance of existing restaurants, as the impact of new restaurant openings is excluded. The Company uses a 52/53 week fiscal year convention. For fiscal years following a 53 week year the Company calculates comparable restaurant sales using the most comparable calendar week to the current reporting period.
Average Check Per Person
Average check per person is calculated by dividing total comparable restaurant sales by comparable restaurant guest counts for a given time period. Average check per person is influenced by menu prices and menu mix. Management uses this indicator to analyze trends in guests’ preferences, the effectiveness of menu offerings and per guest expenditures.
Average Unit Volumes
We measure average unit volumes (“AUVs”) on an annual (52-week) basis. In fiscal years with 53 weeks, we exclude the 53rd week from the AUV calculation for consistency purposes. AUVs consist of the average sales of all restaurants that have been open for a trailing 52-week period or longer. We adjust the sales included in AUV calculations for restaurant closures. This measurement allows us to assess changes in consumer spending patterns at our restaurants and the overall performance of our restaurant base.
Guest Counts
Guest counts are measured by the number of entrées ordered at our restaurants over a given time period. Examples of our entrées include our Full Churrasco Experience, à la carte seafood items, and Gaucho Lunch.
Factors Affecting the Comparability of our Operating Results
Income Taxes
On December 22, 2017, the Tax Act was signed into law effective January 1, 2018. The Tax Act significantly revised the US tax code by, in part but not limited to: a corporate tax rate decrease from 35% to 21% effective for tax years beginning after December 31, 2017, the transition of US international taxation from a worldwide tax system to a territorial system, and a one-time transition tax on the mandatory deemed repatriation of cumulative foreign earnings as of December 31, 2017. Under Accounting Standards Codification 740, Income Taxes, the Company must recognize the effects of tax law changes in the period in which the new legislation is enacted.
52 vs. 53 Week Fiscal Year
Fiscal 2017 and Fiscal 2016 contained 52 weeks whereas Fiscal 2015 contained 53 weeks. We estimate the 53rd week in Fiscal 2015 contributed approximately $6.8 million of incremental revenue, as compared to Fiscal 2016. While certain expenses that were directly related to the incremental revenue increased, other expenses, such as fixed costs, were incurred on a calendar basis.
Initial Public Offering
On June 24, 2015, we completed our initial public offering ("IPO") of 5,073,528 shares of common stock at a price to the public of $20.00 per share, which included 661,764 shares of common stock sold to the underwriters pursuant to their option to purchase additional shares. After underwriters’ discounts and commissions and offering costs, we received net proceeds from the IPO of $91.3 million. Proceeds from the IPO, together with borrowings under our 2015 Credit Facility, were used to repay outstanding indebtedness under our 2012 Credit Facility.
Certain share-based awards granted from 2012 through 2015 include vesting conditions that require both (i) completion of a four or five-year vesting period and (ii) satisfaction of a Liquidity Event, as defined in the applicable award agreement. Under the terms of those agreements, a Liquidity Event is defined as the earlier to occur of (i) a change in control transaction or (ii) an initial public offering. Upon the closing of the IPO, options for the purchase of 783,606 shares of common stock vested as a result of the satisfaction of the Liquidity Event vesting condition. The Company recognized $5.7 million of compensation expense associated with these options during the second quarter of Fiscal 2015.
48
Termination of the Advisory Services Agreement
As a result of the IPO, we terminated our Advisory Services Agreement with an affiliate of Thomas H. Lee Partners, L.P. and paid a one-time non-recurring payment of $7.5 million in connection with the termination during the second quarter of Fiscal 2015. While we have benefitted from savings on management fees that we incurred as a private company, these benefits have been offset by the incremental costs we incurred as a public company such as legal, accounting, insurance and other compliance costs.
2015 Credit Facility
Concurrently with the consummation of our IPO, we refinanced our 2012 Credit Facility and entered into a new $250.0 million revolving credit facility (the “2015 Credit Facility”). Loans under the 2015 Credit Facility bear interest at a base rate plus a margin ranging from 0.50% to 1.50% or at LIBOR plus a margin ranging from 1.50% to 2.50% and will mature in 2020. The 2015 Credit Facility contains customary affirmative, negative and financial covenants applicable to us and certain of our subsidiaries, including financial maintenance covenants requiring us to maintain a maximum Total Rent Adjusted Leverage Ratio and a minimum Consolidated Interest Coverage Ratio (each as defined in the underlying credit facility agreement). Starting in Fiscal 2017 and through Fiscal 2018, the Total Rent Adjusted Leverage Ratio may not be greater than 5.25 to 1 and the ratio will further reduce to 5.0 to 1 in Fiscal 2019, through maturity. The Consolidated Interest Coverage Ratio may not be less than 2.00 to 1. Borrowings under the 2015 Credit Facility may vary significantly from time to time depending on our cash needs at any given time. Upon the consummation of our IPO we drew $165.0 million under the 2015 Credit Facility and used those borrowings, along with the net proceeds from our IPO, to repay the outstanding indebtedness under the 2012 Credit Facility. We recorded a loss of $6.0 million on the extinguishment of the 2012 Credit Facility during the second quarter of Fiscal 2015.
Stock Split
In connection with the closing of the IPO, we effected a stock split pursuant to which each share held by the holder of common stock was reclassified into 25.4588 shares. All share and per share data have been retroactively restated to give effect to the stock split.
Significant Components of Our Results of Operations
Revenue
Revenue primarily consists of food and beverage sales, net of any employee meals and complimentary meals. Revenue is recognized when food and beverage products are sold at our restaurants net of any discounts. Revenue in a given period is directly influenced by the number of operating weeks in such period, the number of restaurants we operate and comparable restaurant sales growth. Proceeds from the sale of gift cards that do not have expiration dates are recorded as deferred revenue at the time of the sale and recognized as revenue when the gift card is redeemed by the holder. The portion of gift cards sold which are never redeemed is commonly referred to as gift card breakage. We recognize gift card breakage revenue for gift cards when the likelihood of redemption becomes remote and we determine there is no legal obligation to remit the value of the unredeemed gift cards to governmental agencies.
Food and Beverage Costs
Food and beverage costs include the direct costs associated with food, beverage and distribution of our menu items. We measure food and beverage costs by tracking the cost as a percentage of revenue. Food and beverage costs as a percentage of revenue are generally influenced by the cost of food and beverage items, distribution costs and sales mix. These components are variable in nature, increase with revenue, are subject to increases or decreases based on fluctuations in commodity costs, including beef, lamb, pork, chicken and seafood prices, and depend in part on the controls we have in place to manage costs at our restaurants.
Compensation and Benefit Costs
Compensation and benefits costs comprise restaurant and regional management salaries and bonuses, hourly staff payroll and other payroll-related expenses, including bonus expenses, share-based compensation, vacation pay, payroll taxes, fringe benefits and health insurance expenses and are measured by tracking hourly and total labor as a percentage of revenue.
Occupancy and Other Operating Expenses
Occupancy and other operating expenses comprise all occupancy costs, consisting of both fixed and variable portions of rent, common area maintenance charges, utility costs, credit card fees, real estate property and other related taxes and other related restaurant supply and occupancy costs, but exclude depreciation and amortization expense, and are measured by tracking occupancy and other operating expenses as a percentage of revenue.
49
Marketing and Advertising Costs
Marketing and advertising costs include all media, production and related costs for both local restaurant advertising and national marketing. We measure the efficiency of our marketing and advertising expenditures by tracking these costs as a percentage of total revenue.
General and Administrative Costs
General and administrative costs are comprised of costs related to certain corporate and administrative functions that support development and restaurant operations. These expenses are generally fixed and reflect management, supervisory and staff salaries, employee benefits and bonuses, share-based compensation, travel expense, information systems, training, corporate rent, technology, market research, and professional and consulting fees, including fees related to the implementation of, and compliance with, Section 404 of the Sarbanes-Oxley Act. We measure general and administrative costs by tracking general and administrative costs as a percentage of revenue.
Pre-opening Costs
Pre-opening costs are costs incurred prior to, and directly associated with, opening a restaurant, and primarily consist of manager salaries, relocation costs, recruiting expenses, employee payroll and related training costs for new employees, including rehearsal of service activities, as well as straight-line lease costs incurred prior to opening. In addition, pre-opening costs include public relations costs incurred prior to opening. We typically start incurring pre-opening costs four to six months prior to opening and these costs tend to increase four weeks prior to opening as we begin training activities.
Depreciation and Amortization Expense
Depreciation and amortization expense includes depreciation of fixed assets and certain definite life intangible assets. We depreciate capitalized leasehold improvements over the shorter of the total expected lease term or their estimated useful life.
Income Tax Expense
Income tax expense depends on the statutory tax rates in the countries where we operate. Historically we have generated taxable income in the US and Brazil. Our provision includes federal, state and local, and foreign current and deferred income tax expense.
Segment Reporting
We operate our restaurants using a single restaurant concept and brand. Each restaurant under our single global brand operates with similar types of products and menu, providing a continuous service style, similar contracts, customers and employees, irrespective of location. We have identified two operating segments: US and Brazil, which is how we organize our restaurants for making operating decisions and assessing performance. Our joint venture in Mexico is included in the US for segment reporting purposes as the operations of the joint venture are monitored by the US segment management. License fee revenue, store opening fee and country development fee revenue attributable to our joint venture in the Middle East JV is included in other revenue in the consolidated statements of operations and comprehensive income.
Results of Operations
The following tables summarize key components of our consolidated results of operations for the periods indicated, both in dollars and as a percentage of revenue:
50
Fiscal 2017 (52 Weeks) Compared to Fiscal 2016 (52 Weeks)
(dollars in thousands)
|
|
|
Fiscal 2017 |
|
|
Fiscal 2016 |
|
|
Increase / (Decrease) |
|
|||||||||||||||||||
|
|
|
Dollars |
|
|
%(a) |
|
|
Dollars |
|
|
%(a) |
|
|
Dollars |
|
|
%(b) |
|
|
%(c) |
|
|||||||
|
Revenue |
|
|
|
|
|
|
|
|
|
|
|
|
|
|
|
|
|
|
|
|
|
|
|
|
|
|
|
|
|
US Restaurant |
|
$ |
271,712 |
|
|
|
86.4 |
% |
|
$ |
245,381 |
|
|
|
85.1 |
% |
|
$ |
26,331 |
|
|
|
10.7 |
% |
|
|
1.3 |
% |
|
Brazil Restaurant |
|
|
42,255 |
|
|
|
13.5 |
% |
|
|
42,753 |
|
|
|
14.8 |
% |
|
|
(498 |
) |
|
|
(1.2 |
%) |
|
|
(1.3 |
%) |
|
Other revenue |
|
|
392 |
|
|
|
0.1 |
% |
|
|
162 |
|
|
|
0.1 |
% |
|
|
230 |
|
|
* |
|
|
* |
|
||
|
Total revenue |
|
|
314,359 |
|
|
|
100.0 |
% |
|
|
288,296 |
|
|
|
100.0 |
% |
|
|
26,063 |
|
|
|
9.0 |
% |
|
* |
|
|
|
Restaurant operating costs |
|
|
|
|
|
|
|
|
|
|
|
|
|
|
|
|
|
|
|
|
|
|
|
|
|
|
|
|
|
Food and beverage costs |
|
|
89,664 |
|
|
|
28.5 |
% |
|
|
82,145 |
|
|
|
28.5 |
% |
|
|
7,519 |
|
|
|
9.2 |
% |
|
|
0.0 |
% |
|
Compensation and benefit costs |
|
|
75,173 |
|
|
|
23.9 |
% |
|
|
66,376 |
|
|
|
23.0 |
% |
|
|
8,797 |
|
|
|
13.3 |
% |
|
|
0.9 |
% |
|
Occupancy and other operating expenses (excluding depreciation and amortization) |
|
|
61,320 |
|
|
|
19.5 |
% |
|
|
54,001 |
|
|
|
18.7 |
% |
|
|
7,319 |
|
|
|
13.6 |
% |
|
|
0.8 |
% |
|
Total restaurant operating costs |
|
|
226,157 |
|
|
|
71.9 |
% |
|
|
202,522 |
|
|
|
70.2 |
% |
|
|
23,635 |
|
|
|
11.7 |
% |
|
|
1.7 |
% |
|
Marketing and advertising costs |
|
|
8,069 |
|
|
|
2.6 |
% |
|
|
7,132 |
|
|
|
2.5 |
% |
|
|
937 |
|
|
|
13.1 |
% |
|
|
0.1 |
% |
|
General and administrative costs |
|
|
23,321 |
|
|
|
7.4 |
% |
|
|
20,576 |
|
|
|
7.1 |
% |
|
|
2,745 |
|
|
|
13.3 |
% |
|
|
0.3 |
% |
|
Pre-opening costs |
|
|
3,773 |
|
|
|
1.2 |
% |
|
|
3,580 |
|
|
|
1.2 |
% |
|
|
193 |
|
|
|
5.4 |
% |
|
|
0.0 |
% |
|
Non-cash impairment charges |
|
|
4,188 |
|
|
|
1.3 |
% |
|
|
320 |
|
|
|
0.1 |
% |
|
|
3,868 |
|
|
* |
|
|
* |
|
||
|
Depreciation and amortization |
|
|
19,037 |
|
|
|
6.1 |
% |
|
|
15,729 |
|
|
|
5.5 |
% |
|
|
3,308 |
|
|
|
21.0 |
% |
|
|
0.6 |
% |
|
Other operating (income) expense, net |
|
|
330 |
|
|
|
0.1 |
% |
|
|
21 |
|
|
|
0.0 |
% |
|
|
(309 |
) |
|
* |
|
|
|
(0.1 |
%) |
|
|
Total costs and expenses |
|
|
284,875 |
|
|
|
90.6 |
% |
|
|
249,880 |
|
|
|
86.7 |
% |
|
|
34,995 |
|
|
|
14.0 |
% |
|
|
3.9 |
% |
|
Income from operations |
|
|
29,484 |
|
|
|
9.4 |
% |
|
|
38,416 |
|
|
|
13.3 |
% |
|
|
(8,932 |
) |
|
|
(23.3 |
%) |
|
|
(3.9 |
%) |
|
Other income (expense): |
|
|
|
|
|
|
|
|
|
|
|
|
|
|
|
|
|
|
|
|
|
|
|
|
|
|
|
|
|
Interest expense, net |
|
|
(4,984 |
) |
|
|
(1.6 |
%) |
|
|
(4,387 |
) |
|
|
(1.5 |
%) |
|
|
597 |
|
|
|
13.6 |
% |
|
|
0.1 |
% |
|
Interest income |
|
|
2,386 |
|
|
|
0.8 |
% |
|
|
2,208 |
|
|
|
0.8 |
% |
|
|
178 |
|
|
|
8.1 |
% |
|
|
0.0 |
% |
|
Other income (expense), net |
|
|
49 |
|
|
|
0.0 |
% |
|
|
(18 |
) |
|
|
0.0 |
% |
|
|
(67 |
) |
|
* |
|
|
|
0.0 |
% |
|
|
Total other income (expense), net |
|
|
(2,549 |
) |
|
|
(0.8 |
%) |
|
|
(2,197 |
) |
|
|
(0.8 |
%) |
|
|
352 |
|
|
|
16.0 |
% |
|
|
0.0 |
% |
|
Income before income taxes |
|
|
26,935 |
|
|
|
8.6 |
% |
|
|
36,219 |
|
|
|
12.6 |
% |
|
|
(9,284 |
) |
|
* |
|
|
|
(4.0 |
%) |
|
|
Income tax expense (benefit) |
|
|
(1,470 |
) |
|
|
(0.5 |
%) |
|
|
11,957 |
|
|
|
4.1 |
% |
|
|
(13,427 |
) |
|
|
(112.3 |
%) |
|
|
(4.6 |
%) |
|
Net income |
|
|
28,405 |
|
|
|
9.0 |
% |
|
|
24,262 |
|
|
|
8.4 |
% |
|
|
4,143 |
|
|
|
17.1 |
% |
|
|
0.6 |
% |
|
Less: Loss attributable to noncontrolling interest |
|
|
(384 |
) |
|
|
(0.1 |
%) |
|
|
(175 |
) |
|
|
(0.1 |
%) |
|
* |
|
|
* |
|
|
* |
|
|||
|
Net income attributable to Fogo de Chão, Inc. |
|
$ |
28,789 |
|
|
|
9.2 |
% |
|
$ |
24,437 |
|
|
|
8.5 |
% |
|
$ |
4,352 |
|
|
|
17.8 |
% |
|
|
0.7 |
% |
|
(a) |
Calculated as a percentage of total revenue. |
|
(b) |
Calculated percentage increase / (decrease) in dollars. |
|
(c) |
Calculated increase / (decrease) in percentage of total revenue. |
|
* |
Not meaningful. |
Revenue
Total revenue increased due to a $25.3 million increase in non-comparable restaurant sales, a favorable foreign exchange impact of $3.3 million, and a $0.2 million increase in joint venture revenue, offset by a $2.8 million decrease in comparable restaurant sales. Total comparable restaurant sales decreased 0.3%.
US restaurant revenue increased due to a $25.3 million increase in non-comparable restaurant sales and a $1.0 million increase in comparable restaurant sales. US comparable restaurant sales increased 0.5%.
51
Brazil restaurant revenue decreased due to a $3.8 million decrease in comparable restaurant sales offset by a favorable foreign exchange impact of $3.3 million. Brazil comparable restaurant sales decreased 7.2%. The Rio de Janeiro locations’ results included lapping the 2016 Summer Olympics during the third quarter of Fiscal 2017. Excluding the impact of the 2016 Summer Olympics, Brazil comparable restaurant sales decreased 4.3%
Other revenue increased as our first Middle East JV restaurant opened in Jeddah, Saudi Arabia. In connection with the Jeddah opening we recognized a country development fee and a store opening fee in addition to a recurring license fee.
Food and Beverage Costs
Food and beverage costs increased due to a $7.7 million increase in food and beverage costs of non-comparable restaurants and an unfavorable foreign exchange impact of $1.1 million, offset by a $1.3 million decrease in food and beverage costs of comparable restaurants. As a percentage of total revenue, total food and beverage costs remained flat in spite of new restaurant openings and the impact of the hurricanes, somewhat offset by reduced liquor and desserts costs in Brazil.
Compensation and Benefit Costs
Compensation and benefit costs increased due to a $7.7 million increase in non-comparable restaurant labor expense, a $0.7 million increase in comparable restaurant labor expense and an unfavorable foreign exchange impact of $0.5 million. As a percentage of total revenue, total compensation and benefits costs increased as a result of wage rate inflation in the US and Brazil in addition to inefficiencies associated with new restaurant openings, marginally offset by lower insurance costs.
Occupancy and Other Operating Expenses
Occupancy and other operating expenses increased due to a $5.7 million increase in non-comparable restaurant operating expenses, a $0.9 million increase in comparable restaurant operating expenses, and an unfavorable foreign exchange rate impact of $0.7 million. As a percentage of total revenue, total occupancy and other operating costs increased due to higher costs of rent as a percentage of sales in our new restaurants as these stores are in the early stages of their revenue growth curve, the timing of restaurant repairs, and local commercial rent taxes.
Marketing and Advertising Costs
Marketing and advertising costs increased due to a refreshed advertising campaign during Fiscal 2017 as well as an increase in brand awareness advertising. As a percentage of total revenue, marketing and advertising costs increased marginally.
General and Administrative Costs
General and administrative costs increased due to a $1.6 million increase in corporate compensation as a result of additional headcount in the US, $0.7 million in expenses related to our secondary offering in the second quarter of Fiscal 2017, $0.4 million in concurrent corporate office rents as we transition to our new corporate office space, an unfavorable foreign exchange impact of $0.2 million and a $0.1 million donation to the Houston Food Bank in relation to Hurricane Harvey relief efforts. These increases were offset by a decrease of $0.3 million in stock compensation expense. As a percentage of total revenue, general and administrative costs increased 0.3%.
Pre-opening Costs
Pre-opening costs increased due to the timing of new restaurant development. During Fiscal 2017 we opened five US restaurants and had an additional three restaurants under construction at year-end that are due to open in Fiscal 2018. During Fiscal 2016 we opened three US restaurants and had an additional three restaurants under construction at year-end that opened during the first half of Fiscal 2017.
Non-cash Impairment Charges
During Fiscal 2017, we recognized $4.2 million in non-cash impairment charges related to the reduction in the carrying value of an underperforming restaurant in the US. The Company continues to evaluate the restaurant’s operating performance and its options. A closure of this restaurant could result in a material charge in the period in which the Company ceases operations. During Fiscal 2016, we recognized $0.3 million in non-cash impairment charges related to the reduction in the carrying value of an underperforming restaurant in Brazil. The lease for this underperforming restaurant in Brazil expired in September 2017 and was not renewed.
52
Interest expense, net of capitalized interest, increased slightly due to a 0.6% increase in the interest rate on our 2015 Credit Facility, which was alleviated marginally by a decrease in the average outstanding balance.
Interest Income
Interest income increased due to increased cash and cash equivalents in Brazil and favorable interest rates earned on those balances.
Income Tax Expense (Benefit)
On December 22, 2017, the Tax Act was signed into law effective January 1, 2018. The Tax Act significantly revised the US tax code by, in part but not limited to: a corporate tax rate decrease from 35% to 21% effective for tax years beginning after December 31, 2017, the transition of US international taxation from a worldwide tax system to a territorial system, and a one-time transition tax on the mandatory deemed repatriation of cumulative foreign earnings as of December 31, 2017. Under Accounting Standards Codification 740, Income Taxes, the Company must recognize the effects of tax law changes in the period in which the new legislation is enacted.
The Fiscal 2017 income tax benefit was primarily comprised of $9.4 million of income tax expense at the federal statutory rate, $6.5 million expense related to its one-time repatriation inclusion, $1.4 million of state income taxes, net of the federal benefit, and $0.8 million of subpart F income. These expenses were more than offset by $15.0 million of deferred tax liability revaluation, $2.1 million of foreign tax credits, $2.1 million of employment credits, and $0.3 million of other credits.
The Fiscal 2016 tax expense was comprised of $12.7 million of income tax expense at the federal statutory rate, $1.3 million of state income taxes, net of the federal benefit, $0.6 million of subpart F income, and $0.4 million of other non-deductible expenses. These expenses were offset by $1.2 million of foreign tax rate differential and $1.8 million of employment credits.
53
Fiscal 2016 (52 Weeks) Compared to Fiscal 2015 (53 Weeks)
(dollars in thousands)
|
|
|
Fiscal 2016 |
|
|
Fiscal 2015 |
|
|
Increase / (Decrease) |
|
|||||||||||||||||||
|
|
|
Dollars |
|
|
%(a) |
|
|
Dollars |
|
|
%(a) |
|
|
Dollars |
|
|
%(b) |
|
|
%(c) |
|
|||||||
|
Revenue |
|
|
|
|
|
|
|
|
|
|
|
|
|
|
|
|
|
|
|
|
|
|
|
|
|
|
|
|
|
US Restaurant |
|
$ |
245,381 |
|
|
|
85.1 |
% |
|
$ |
227,073 |
|
|
|
83.5 |
% |
|
$ |
18,308 |
|
|
|
8.1 |
% |
|
|
1.6 |
% |
|
Brazil Restaurant |
|
|
42,753 |
|
|
|
14.8 |
% |
|
|
44,425 |
|
|
|
16.4 |
% |
|
|
(1,672 |
) |
|
|
(3.8 |
%) |
|
|
(1.6 |
%) |
|
Other |
|
|
162 |
|
|
|
0.1 |
% |
|
|
136 |
|
|
|
0.1 |
% |
|
|
26 |
|
|
* |
|
|
* |
|
||
|
Total revenue |
|
|
288,296 |
|
|
|
100.0 |
% |
|
|
271,634 |
|
|
|
100.0 |
% |
|
|
16,662 |
|
|
|
6.1 |
% |
|
* |
|
|
|
Restaurant operating costs |
|
|
|
|
|
|
|
|
|
|
|
|
|
|
|
|
|
|
|
|
|
|
|
|
|
|
|
|
|
Food and beverage costs |
|
|
82,145 |
|
|
|
28.5 |
% |
|
|
80,062 |
|
|
|
29.5 |
% |
|
|
2,083 |
|
|
|
2.6 |
% |
|
|
(1.0 |
%) |
|
Compensation and benefit costs |
|
|
66,376 |
|
|
|
23.0 |
% |
|
|
60,224 |
|
|
|
22.2 |
% |
|
|
6,152 |
|
|
|
10.2 |
% |
|
|
0.8 |
% |
|
Occupancy and other operating expenses (excluding depreciation and amortization) |
|
|
54,001 |
|
|
|
18.7 |
% |
|
|
46,153 |
|
|
|
17.0 |
% |
|
|
7,848 |
|
|
|
17.0 |
% |
|
|
1.7 |
% |
|
Total restaurant operating costs |
|
|
202,522 |
|
|
|
70.2 |
% |
|
|
186,439 |
|
|
|
68.6 |
% |
|
|
16,083 |
|
|
|
8.6 |
% |
|
|
1.6 |
% |
|
Marketing and advertising costs |
|
|
7,132 |
|
|
|
2.5 |
% |
|
|
6,618 |
|
|
|
2.4 |
% |
|
|
514 |
|
|
|
7.8 |
% |
|
|
0.1 |
% |
|
General and administrative costs |
|
|
20,576 |
|
|
|
7.1 |
% |
|
|
32,566 |
|
|
|
12.0 |
% |
|
|
(11,990 |
) |
|
|
(36.8 |
%) |
|
|
(4.9 |
%) |
|
Pre-opening costs |
|
|
3,580 |
|
|
|
1.2 |
% |
|
|
4,858 |
|
|
|
1.8 |
% |
|
|
(1,278 |
) |
|
|
(26.3 |
%) |
|
|
(0.6 |
%) |
|
Loss on extinguishment of debt |
|
|
— |
|
|
|
0.0 |
% |
|
|
5,991 |
|
|
|
2.2 |
% |
|
|
(5,991 |
) |
|
|
* |
|
|
|
* |
|
|
Non-cash impairment charges |
|
|
320 |
|
|
|
0.1 |
% |
|
|
— |
|
|
|
0.0 |
% |
|
|
320 |
|
|
* |
|
|
* |
|
||
|
Depreciation and amortization |
|
|
15,729 |
|
|
|
5.5 |
% |
|
|
12,471 |
|
|
|
4.6 |
% |
|
|
3,258 |
|
|
|
26.1 |
% |
|
|
0.9 |
% |
|
Other operating (income) expense, net |
|
|
21 |
|
|
|
0.0 |
% |
|
|
(291 |
) |
|
|
(0.1 |
%) |
|
|
(312 |
) |
|
* |
|
|
|
(0.1 |
%) |
|
|
Total costs and expenses |
|
|
249,880 |
|
|
|
86.7 |
% |
|
|
248,652 |
|
|
|
91.5 |
% |
|
|
1,228 |
|
|
|
0.5 |
% |
|
|
(4.8 |
%) |
|
Income from operations |
|
|
38,416 |
|
|
|
13.3 |
% |
|
|
22,982 |
|
|
|
8.5 |
% |
|
|
15,434 |
|
|
|
67.2 |
% |
|
|
4.8 |
% |
|
Other income (expense): |
|
|
|
|
|
|
|
|
|
|
|
|
|
|
|
|
|
|
|
|
|
|
|
|
|
|
|
|
|
Interest expense, net |
|
|
(4,387 |
) |
|
|
(1.5 |
%) |
|
|
(9,975 |
) |
|
|
(3.7 |
%) |
|
|
(5,588 |
) |
|
|
(56.0 |
%) |
|
|
(2.2 |
%) |
|
Interest income |
|
|
2,208 |
|
|
|
0.8 |
% |
|
|
856 |
|
|
|
0.3 |
% |
|
|
1,352 |
|
|
|
157.9 |
% |
|
|
(0.5 |
%) |
|
Other income (expense), net |
|
|
(18 |
) |
|
|
0.0 |
% |
|
|
(34 |
) |
|
|
0.0 |
% |
|
|
(16 |
) |
|
* |
|
|
|
0.0 |
% |
|
|
Total other income (expense), net |
|
|
(2,197 |
) |
|
|
(0.8 |
%) |
|
|
(9,153 |
) |
|
|
(3.4 |
%) |
|
|
(6,956 |
) |
|
|
(76.0 |
%) |
|
|
(2.6 |
%) |
|
Income before income taxes |
|
|
36,219 |
|
|
|
12.6 |
% |
|
|
13,829 |
|
|
|
5.1 |
% |
|
|
22,390 |
|
|
* |
|
|
|
7.5 |
% |
|
|
Income tax expense (benefit) |
|
|
11,957 |
|
|
|
4.1 |
% |
|
|
(14,168 |
) |
|
|
(5.2 |
%) |
|
|
26,125 |
|
|
|
(184.4 |
%) |
|
|
9.3 |
% |
|
Net income |
|
|
24,262 |
|
|
|
8.4 |
% |
|
|
27,997 |
|
|
|
10.3 |
% |
|
|
(3,735 |
) |
|
|
(13.3 |
%) |
|
|
(1.9 |
%) |
|
Less: Income (loss) attributable to noncontrolling interest |
|
|
(175 |
) |
|
|
(0.1 |
%) |
|
|
132 |
|
|
|
0.0 |
% |
|
* |
|
|
* |
|
|
* |
|
|||
|
Net income attributable to Fogo de Chão, Inc. |
|
$ |
24,437 |
|
|
|
8.5 |
% |
|
$ |
27,865 |
|
|
|
10.3 |
% |
|
$ |
(3,428 |
) |
|
|
(12.3 |
%) |
|
|
(1.8 |
%) |
|
(a) |
Calculated as a percentage of total revenue. |
|
(b) |
Calculated percentage increase / (decrease) in dollars. |
|
(c) |
Calculated increase / (decrease) in percentage of total revenue. |
|
* |
Not meaningful. |
Revenue
Total revenue increased due to a $27.6 million increase in revenue from new restaurants opened in Fiscal 2016 and Fiscal 2015 and a $1.4 million increase in revenue attributable to the 2016 Summer Olympics, offset by the 53rd week impact of $6.8 million, a $4.2 million decrease in comparable restaurant revenue and an unfavorable foreign exchange impact of $1.4 million. Total comparable restaurant sales decreased 0.6%.
US restaurant revenue increased due to a $26.5 million increase in revenue from new restaurants opened in Fiscal 2016 and Fiscal 2015, offset by the 53rd week impact of $6.0 million and a $2.3 million decrease in comparable restaurant revenue. US comparable restaurant sales decreased 0.6%.
54
Brazil restaurant revenue decreased due to a $1.9 million decrease in comparable restaurant revenue, an unfavorable foreign exchange impact of $1.4 million and the 53rd week impact of $0.8 million, offset by a $1.4 million increase in revenue attributable to the 2016 Summer Olympics and a $1.1 million increase in revenue from new restaurants opened in Fiscal 2016 and Fiscal 2015. Brazil comparable restaurant sales decreased 0.5%.
Other revenue includes gift card breakage revenue recognized by our US operating segment during Fiscal 2016 and Fiscal 2015 related to gift cards whose likelihood of redemption was determined to be remote.
Food and Beverage Costs
Food and beverage costs increased due to a $7.5 million increase in food and beverage costs from non-comparable restaurants. However, the increase was offset by a $3.1 million decrease in comparable restaurant food and beverage costs, a $1.8 million reduction due to the impact of the 53rd week in Fiscal 2015 and a favorable foreign exchange impact of $0.5 million. As a percentage of total revenue, total food and beverage costs decreased primarily due to reductions in protein commodity pricing, improvements in mix shift with the introduction of seasonal menu offerings and waste reduction efforts.
Compensation and Benefit Costs
Compensation and benefit costs increased due to a $9.3 million increase in non-comparable restaurant labor expenses and a $0.2 million increase in comparable restaurant labor expenses, offset by a $1.7 million decrease in cumulative share-based compensation expense primarily recognized in conjunction with the IPO in Fiscal 2015, a $1.4 million reduction due to the impact of the 53rd week in Fiscal 2015 and a favorable foreign exchange impact of $0.2 million. As a percentage of total revenue, total compensation and benefits costs increased due to inefficiencies associated with new restaurant openings as our management teams become more accustomed to predicting, managing and servicing the sales volumes of their new restaurants. The increase is also being driven by investments in third managers as well as increases in minimum wages and group health insurance claims.
Occupancy and Other Operating Expenses
Occupancy and other operating expenses increased primarily due to a $6.7 million increase in non-comparable restaurant expenses and a $2.0 million increase in comparable restaurant expenses, offset by a $0.6 million reduction due to the impact of the 53rd week in Fiscal 2015 and a favorable foreign exchange impact of $0.3 million. As a percentage of total revenue, total occupancy and other operating costs increased as a result of increased fixed occupancy costs on lower revenue.
Marketing and Advertising Costs
Marketing and advertising costs increased due to a larger revenue base and additional advertising expenses. As a percentage of total revenue, total marketing and advertising expenses were essentially flat.
General and Administrative Costs
General and administrative costs decreased due to the 2015 recognition of cumulative share-based compensation during the second quarter triggered by the IPO in the amount of $4.3 million, as well as a one-time charge of $7.5 million for the disposition of the Advisory Services Agreement with an affiliate of THL in connection with the IPO and a $1.2 million decrease in corporate compensation expense. These decreases were offset by a $0.3 million increase in insurance, a $0.3 million increase in corporate travel and a $0.2 million increase in tax consulting expenses. As a percentage of total revenue, total general and administrative costs decreased as a result of lapping IPO related expenses from Fiscal 2015.
Pre-opening Costs
Pre-opening costs decreased due to the timing of new restaurant development. During Fiscal 2016 we opened four restaurants and had an additional three restaurants under construction at year-end that opened in Fiscal 2017. During Fiscal 2015 we opened seven restaurants and had an additional restaurant under construction at year-end that opened during the first quarter of Fiscal 2016.
Loss on Extinguishment of Debt
During the second quarter of Fiscal 2015 we paid-off our 2012 Credit Facility with the proceeds from the IPO plus proceeds from the 2015 Credit Facility. As a result, we wrote off unamortized loan costs and unamortized original issue discounts, and paid a pre-payment penalty of $0.3 million for a total loss on the extinguishment of $6.0 million.
55
During Fiscal 2016, we recognized a $0.3 million non-cash impairment charge related to the reduction in the carrying value of an underperforming restaurant in Brazil.
Interest Expense
Interest expense, net of capitalized interest, decreased due to a reduction in the average outstanding principal balance owed and a reduction in interest rates following the extinguishment of the 2012 Credit Facility that occurred during the second quarter of Fiscal 2015.
Interest Income
Interest income increased due to increased cash and cash equivalents in Brazil and favorable interest rates earned on those balances.
Income Tax Expense (Benefit)
We recognized income tax expense in Fiscal 2016 as compared to an income tax benefit in Fiscal 2015. The increase in income tax expense from Fiscal 2015 is primarily attributable to the change in assertion with respect to undistributed foreign earnings and the release of a valuation allowance during the second quarter of Fiscal 2015. We had historically provided deferred taxes under ASC 740-30-25, formerly APB 23, for the presumed repatriation to the US earnings from our Brazilian subsidiaries. In June 2015, we asserted that undistributed net earnings of our Brazilian subsidiaries would be indefinitely reinvested in operations outside the US. This was primarily driven by a reduction in debt service costs on a forward basis as a result of the IPO. Additionally, future US cash projections and our intent to continue investing in restaurants in foreign jurisdictions with cash generated in those jurisdictions, drove our decision to make the assertion. We also made the decision to release our valuation allowance against our net deferred tax asset. The decision to release the valuation allowance was triggered in conjunction with the IPO. Reduced debt service costs and historic cumulative earnings (US pretax income plus permanent tax differences) were all sources of positive evidence that led us to believe that it was more likely than not that we would be able to realize our net deferred tax assets.
Our consolidated effective tax rate varies from the federal statutory rate of 35% primarily due to foreign earnings being subjected to taxation at lower tax rates, FICA tax credits, state income taxes, and nondeductible equity-based compensation.
Non-GAAP Financial Measures
To supplement its unaudited condensed consolidated financial statements, which are prepared and presented in accordance with GAAP, the Company uses the following non-GAAP financial measures: restaurant contribution and restaurant contribution margin and Adjusted EBITDA and Adjusted EBITDA margin (collectively, the "non-GAAP financial measures"). The presentation of this financial information is not intended to be considered in isolation or as a substitute for, or superior to, the financial information prepared and presented in accordance with GAAP. The Company uses these non-GAAP financial measures for financial and operational decision making and as a means to evaluate period-to-period comparisons. The Company believes that they provide useful information about operating results, enhance the overall understanding of past financial performance and future prospects, and allow for greater transparency with respect to key metrics used by management in its financial and operational decision making. The non-GAAP measures used by the Company may be different from the methods used by other companies.
Restaurant Contribution and Restaurant Contribution Margin
Restaurant contribution, a non-GAAP financial measure, is equal to revenue generated by our restaurants sales less direct restaurant operating costs (which include food and beverage costs, compensation and benefits costs, and occupancy and certain other operating costs but exclude depreciation and amortization expense). This performance measure includes only the costs that restaurant level managers can directly control and excludes other operating costs that are essential to conduct the Company’s business. Depreciation and amortization expense is excluded because it is not an operating cost that can be directly controlled by restaurant level managers. Restaurant contribution margin is equal to restaurant contribution as a percentage of revenue from restaurant sales. Restaurant contribution and restaurant contribution margin are supplemental measures of operating performance of our restaurants and our calculations thereof may not be comparable to those reported by other companies.
We use restaurant contribution and restaurant contribution margin as key metrics to evaluate the profitability of incremental sales at our restaurants, to evaluate our restaurant performance across periods and to evaluate our restaurant financial performance compared with our competitors. We believe restaurant level operating margin is useful to investors in that it highlights trends in our core business that may not otherwise be apparent to investors when relying solely on GAAP financial measures. Because other
56
companies may calculate restaurant level margin differently than we do, restaurant level margin as presented herein may not be comparable to similarly titled measures reported by other companies.
Restaurant contribution and restaurant contribution margin are neither required by, nor presented in accordance with GAAP. Restaurant contribution and restaurant contribution margin have limitations as analytical tools, and you should not consider them in isolation or as substitutes for analysis of our results as reported under GAAP.
The following table sets forth a reconciliation of income from operations, which is a GAAP financial measure, to total segment restaurant contribution (dollars in thousands).
|
|
|
Fiscal 2017 |
|
|
Fiscal 2016 |
|
|
Fiscal 2015 |
|
|||
|
Income from operations |
|
$ |
29,484 |
|
|
$ |
38,416 |
|
|
$ |
22,982 |
|
|
Less: |
|
|
|
|
|
|
|
|
|
|
|
|
|
Other revenue |
|
|
392 |
|
|
|
162 |
|
|
|
136 |
|
|
Add: |
|
|
|
|
|
|
|
|
|
|
|
|
|
Marketing and advertising costs |
|
|
8,069 |
|
|
|
7,132 |
|
|
|
6,618 |
|
|
General and administrative costs |
|
|
23,321 |
|
|
|
20,576 |
|
|
|
32,566 |
|
|
Pre-opening costs |
|
|
3,773 |
|
|
|
3,580 |
|
|
|
4,858 |
|
|
Loss on extinguishment of debt |
|
|
— |
|
|
|
— |
|
|
|
5,991 |
|
|
Non-cash impairment charges |
|
|
4,188 |
|
|
|
320 |
|
|
|
— |
|
|
Depreciation and amortization |
|
|
19,037 |
|
|
|
15,729 |
|
|
|
12,471 |
|
|
Other operating (income) expense, net |
|
|
330 |
|
|
|
21 |
|
|
|
(291 |
) |
|
Total segment restaurant contribution |
|
$ |
87,810 |
|
|
$ |
85,612 |
|
|
$ |
85,059 |
|
|
|
|
|
|
|
|
|
|
|
|
|
|
|
|
Total revenues |
|
$ |
314,359 |
|
|
$ |
288,296 |
|
|
$ |
271,634 |
|
|
Less: Other revenue |
|
|
392 |
|
|
|
162 |
|
|
|
136 |
|
|
Total segment revenue from restaurant sales |
|
$ |
313,967 |
|
|
$ |
288,134 |
|
|
$ |
271,498 |
|
The following table summarizes restaurant contribution by segment and restaurant contribution margin by segment for Fiscal 2017 compared to Fiscal 2016 (dollars in thousands).
|
|
|
Fiscal 2017 |
|
|
Fiscal 2016 |
|
|
Increase / (Decrease) |
|
|||||||||||||||||||
|
|
|
Dollars |
|
|
%(a) |
|
|
Dollars |
|
|
%(a) |
|
|
Dollars |
|
|
%(b) |
|
|
%(c) |
|
|||||||
|
Revenue restaurant sales |
|
|
|
|
|
|
|
|
|
|
|
|
|
|
|
|
|
|
|
|
|
|
|
|
|
|
|
|
|
US Restaurant |
|
$ |
271,712 |
|
|
|
86.5 |
% |
|
$ |
245,381 |
|
|
|
85.2 |
% |
|
$ |
26,331 |
|
|
|
10.7 |
% |
|
|
1.3 |
% |
|
Brazil Restaurant |
|
|
42,255 |
|
|
|
13.5 |
% |
|
|
42,753 |
|
|
|
14.8 |
% |
|
|
(498 |
) |
|
|
(1.2 |
%) |
|
|
(1.3 |
%) |
|
Total revenue restaurant sales |
|
$ |
313,967 |
|
|
|
100.0 |
% |
|
$ |
288,134 |
|
|
|
100.0 |
% |
|
$ |
25,833 |
|
|
|
9.0 |
% |
|
* |
|
|
|
Restaurant operating costs |
|
|
|
|
|
|
|
|
|
|
|
|
|
|
|
|
|
|
|
|
|
|
|
|
|
|
|
|
|
US |
|
$ |
196,272 |
|
|
|
72.2 |
% |
|
$ |
173,264 |
|
|
|
70.6 |
% |
|
$ |
23,008 |
|
|
|
13.3 |
% |
|
|
1.6 |
% |
|
Brazil |
|
|
29,885 |
|
|
|
70.7 |
% |
|
|
29,258 |
|
|
|
68.4 |
% |
|
|
627 |
|
|
|
2.1 |
% |
|
|
2.3 |
% |
|
Total restaurant operating costs |
|
$ |
226,157 |
|
|
|
72.0 |
% |
|
$ |
202,522 |
|
|
|
70.3 |
% |
|
$ |
23,635 |
|
|
|
11.7 |
% |
|
|
1.7 |
% |
|
Restaurant contribution |
|
|
|
|
|
|
|
|
|
|
|
|
|
|
|
|
|
|
|
|
|
|
|
|
|
|
|
|
|
US |
|
$ |
75,440 |
|
|
|
27.8 |
% |
|
$ |
72,117 |
|
|
|
29.4 |
% |
|
$ |
3,323 |
|
|
|
4.6 |
% |
|
|
(1.6 |
%) |
|
Brazil |
|
|
12,370 |
|
|
|
29.3 |
% |
|
|
13,495 |
|
|
|
31.6 |
% |
|
|
(1,125 |
) |
|
|
(8.3 |
%) |
|
|
(2.3 |
%) |
|
Total segment restaurant contribution |
|
$ |
87,810 |
|
|
|
28.0 |
% |
|
$ |
85,612 |
|
|
|
29.7 |
% |
|
$ |
2,198 |
|
|
|
2.6 |
% |
|
|
(1.7 |
%) |
|
(a) |
Calculated as a percentage of total revenue or segment revenue where applicable. |
|
(b) |
Calculated percentage increase / (decrease) in dollars. |
|
(c) |
Calculated increase / (decrease) in percentage of total revenue or segment revenue where applicable. |
|
* |
Not meaningful. |
57
The following tables summarize restaurant contribution by segment and restaurant contribution margin by segment for Fiscal 2016 compared to Fiscal 2015 (dollars in thousands).
|
|
|
Fiscal 2016 |
|
|
Fiscal 2015 |
|
|
Increase / (Decrease) |
|
|||||||||||||||||||
|
|
|
Dollars |
|
|
%(a) |
|
|
Dollars |
|
|
%(a) |
|
|
Dollars |
|
|
%(b) |
|
|
%(c) |
|
|||||||
|
Revenue restaurant sales |
|
|
|
|
|
|
|
|
|
|
|
|
|
|
|
|
|
|
|
|
|
|
|
|
|
|
|
|
|
US Restaurant |
|
$ |
245,381 |
|
|
|
85.2 |
% |
|
$ |
227,073 |
|
|
|
83.6 |
% |
|
$ |
18,308 |
|
|
|
8.1 |
% |
|
|
1.6 |
% |
|
Brazil Restaurant |
|
|
42,753 |
|
|
|
14.8 |
% |
|
|
44,425 |
|
|
|
16.4 |
% |
|
|
(1,672 |
) |
|
|
(3.8 |
%) |
|
|
(1.6 |
%) |
|
Total revenue restaurant sales |
|
$ |
288,134 |
|
|
|
100.0 |
% |
|
$ |
271,498 |
|
|
|
100.0 |
% |
|
$ |
16,636 |
|
|
|
6.1 |
% |
|
* |
|
|
|
Restaurant operating costs |
|
|
|
|
|
|
|
|
|
|
|
|
|
|
|
|
|
|
|
|
|
|
|
|
|
|
|
|
|
US |
|
$ |
173,264 |
|
|
|
70.6 |
% |
|
$ |
156,558 |
|
|
|
68.9 |
% |
|
$ |
16,706 |
|
|
|
10.7 |
% |
|
|
1.7 |
% |
|
Brazil |
|
|
29,258 |
|
|
|
68.4 |
% |
|
|
29,881 |
|
|
|
67.3 |
% |
|
|
(623 |
) |
|
|
(2.1 |
%) |
|
|
1.1 |
% |
|
Total restaurant operating costs |
|
$ |
202,522 |
|
|
|
70.3 |
% |
|
$ |
186,439 |
|
|
|
68.7 |
% |
|
$ |
16,083 |
|
|
|
8.6 |
% |
|
|
1.6 |
% |
|
Restaurant contribution |
|
|
|
|
|
|
|
|
|
|
|
|
|
|
|
|
|
|
|
|
|
|
|
|
|
|
|
|
|
US |
|
$ |
72,117 |
|
|
|
29.4 |
% |
|
$ |
70,515 |
|
|
|
31.1 |
% |
|
$ |
1,602 |
|
|
|
2.3 |
% |
|
|
(1.7 |
%) |
|
Brazil |
|
|
13,495 |
|
|
|
31.6 |
% |
|
|
14,544 |
|
|
|
32.7 |
% |
|
|
(1,049 |
) |
|
|
(7.2 |
%) |
|
|
(1.1 |
%) |
|
Total segment restaurant contribution |
|
$ |
85,612 |
|
|
|
29.7 |
% |
|
$ |
85,059 |
|
|
|
31.3 |
% |
|
$ |
553 |
|
|
|
0.7 |
% |
|
|
(1.6 |
%) |
|
(a) |
Calculated as a percentage of total revenue or segment revenue where applicable. |
|
(b) |
Calculated percentage increase / (decrease) in dollars. |
|
(c) |
Calculated increase / (decrease) in percentage of total revenue or segment revenue where applicable. |
|
* |
Not meaningful. |
Adjusted EBITDA and Adjusted EBITDA Margin
Adjusted EBITDA is defined as net income before interest, taxes and depreciation and amortization plus the sum of certain operating and non-operating expenses, including pre-opening costs, losses on modifications and extinguishment of debt, share-based compensation costs, management and consulting fees, non-cash impairment charges, one-time costs associated with the 2015 IPO, retention agreement costs, and other non-cash or similar adjustments. Adjusted EBITDA margin represents Adjusted EBITDA as a percentage of revenue. By monitoring and controlling our Adjusted EBITDA and Adjusted EBITDA margin, we can gauge the overall profitability of our company. Adjusted EBITDA and Adjusted EBITDA margin are supplemental measures of our performance that are neither required by, nor presented in accordance with, GAAP. Adjusted EBITDA and Adjusted EBITDA margin are not measurements of our financial performance under GAAP and should not be considered as an alternative to net income (loss), operating income or any other performance measures derived in accordance with GAAP or as an alternative to cash flows from operating activities as a measure of our liquidity. In addition, in evaluating Adjusted EBITDA and Adjusted EBITDA margin, you should be aware that in the future we will incur expenses or charges such as those added back to calculate Adjusted EBITDA. Our presentation of Adjusted EBITDA and Adjusted EBITDA margin should not be construed as an inference that our future results will be unaffected by unusual or non-recurring items.
We believe Adjusted EBITDA and Adjusted EBITDA margin facilitate operating performance comparisons from period to period by isolating the effects of some items that vary from period to period without any correlation to core operating performance or that vary widely among similar companies. These potential differences may be caused by variations in capital structures (affecting interest expense), tax positions (such as the impact on periods or companies of changes in effective tax rates or net operating losses) and the age and book depreciation of facilities and equipment (affecting relative depreciation expense). We also present Adjusted EBITDA and Adjusted EBITDA margin because (i) we believe this measure is frequently used by securities analysts, investors and other interested parties to evaluate companies in our industry, (ii) we believe investors will find this measure useful in assessing our ability to service or incur indebtedness, and (iii) we use Adjusted EBITDA and Adjusted EBITDA margin internally as a benchmark to compare our performance to that of our competitors.
58
Adjusted EBITDA and Adjusted EBITDA margin have limitations as an analytical tool, and you should not consider it in isolation, or as a substitute for analysis of our results as reported under GAAP. Some of these limitations are (i) it does not reflect our cash expenditures, future requirements for capital expenditures or contractual commitments, (ii) it does not reflect changes in, or cash requirements for, our working capital needs, (iii) it does not reflect the significant interest expense, or the cash requirements necessary to service interest or principal payments, on our debt, (iv) although depreciation and amortization are non-cash charges, the assets being depreciated and amortized will often have to be replaced in the future, and Adjusted EBITDA and Adjusted EBITDA margin do not reflect any cash requirements for such replacements, (v) it does not adjust for all non-cash income or expense items that are reflected in our statements of cash flows, (vi) it does not reflect the impact of earnings or charges resulting from matters we consider not to be indicative of our ongoing operations, and (vii) other companies in our industry may calculate this measure differently than we do, limiting its usefulness as a comparative measure.
Adjusted EBITDA
The following table sets forth the reconciliation of Adjusted EBITDA to net income attributable to Fogo de Chão, Inc. (dollars in thousands).
|
|
|
Fiscal 2017 |
|
|
Fiscal 2016 |
|
|
Fiscal 2015 |
|
|
|||
|
Net income attributable to Fogo de Chão, Inc. |
|
$ |
28,789 |
|
|
$ |
24,437 |
|
|
$ |
27,865 |
|
|
|
Depreciation and amortization expense(a) |
|
|
18,630 |
|
|
|
15,437 |
|
|
|
12,302 |
|
|
|
Interest expense, net |
|
|
4,984 |
|
|
|
4,387 |
|
|
|
9,975 |
|
|
|
Interest income |
|
|
(2,386 |
) |
|
|
(2,208 |
) |
|
|
(856 |
) |
|
|
Income tax expense (benefit)(b) |
|
|
(1,510 |
) |
|
|
11,923 |
|
|
|
(14,229 |
) |
|
|
EBITDA |
|
|
48,507 |
|
|
|
53,976 |
|
|
|
35,057 |
|
|
|
Pre-opening costs(c) |
|
|
3,770 |
|
|
|
3,389 |
|
|
|
4,560 |
|
|
|
Share-based compensation(d) |
|
|
565 |
|
|
|
792 |
|
|
|
6,792 |
|
|
|
Non-cash adjustments(e) |
|
|
923 |
|
|
|
959 |
|
|
|
820 |
|
|
|
Secondary offering costs |
|
|
715 |
|
|
|
— |
|
|
|
— |
|
|
|
Corporate office relocation |
|
|
525 |
|
|
|
— |
|
|
|
— |
|
|
|
Non-cash impairment charge(f) |
|
|
4,188 |
|
|
|
320 |
|
|
|
— |
|
|
|
Non-recurring expenses(g) |
|
|
502 |
|
|
|
456 |
|
|
|
— |
|
|
|
Management and consulting fees(h) |
|
|
— |
|
|
|
— |
|
|
|
8,137 |
|
|
|
Loss on extinguishment of debt(i) |
|
|
— |
|
|
|
— |
|
|
|
5,991 |
|
|
|
Retention agreement payments(j) |
|
|
— |
|
|
|
— |
|
|
|
1,042 |
|
|
|
IPO related expenses(k) |
|
|
— |
|
|
|
— |
|
|
|
782 |
|
|
|
Adjusted EBITDA |
|
$ |
59,695 |
|
|
$ |
59,892 |
|
|
$ |
63,181 |
|
|
|
(a) |
For Fiscal 2017, Fiscal 2016 and Fiscal 2015, excludes $0.4 million, $0.3 million and $0.2 million, respectively, of depreciation expense attributable to our joint venture in Mexico. |
|
(b) |
For Fiscal 2017, Fiscal 2016 and Fiscal 2015, excludes $0.04 million, $0.03 million and $0.1 million, respectively, of income tax expense attributable to our joint venture in Mexico. |
|
(c) |
For Fiscal 2017, Fiscal 2016 and Fiscal 2015, excludes $0.0 million, $0.2 million and $0.3 million, respectively, of pre-opening costs incurred by our joint venture in Mexico. |
|
(d) |
For Fiscal 2015, includes $5.7 million of compensation expense recognized upon the closing of the IPO attributable to the vesting of stock options. See Note 11 to the Consolidated Financial Statements. |
|
(e) |
Consists of non-cash portion of straight-line rent expense. |
|
(f) |
For Fiscal 2017, consists of non-cash impairment charge related to the reduction in carrying value of an underperforming restaurant in the United States. For Fiscal 2016, consists of non-cash impairment charge related to the reduction in the carrying value of an underperforming restaurant in Brazil. |
|
(g) |
For Fiscal 2017, amount includes $0.2 million of one time accrual for the Brazil Union matter, $0.1 million of costs incurred in the closing of the Salvador restaurant, $0.1 million of one time labor claims and $0.1 million of costs incurred in the Brazil Restructure. For Fiscal 2016, amount includes $0.1 million of one-time legal and accounting fees and $0.3 million of one-time expenses related to the realignment of management of the Brazilian subsidiaries and the legal transfer of the Brazilian subsidiaries to the Company’s Dutch holding company to support the Company’s expansion into international markets. |
|
(h) |
Consists primarily of payments to an affiliate of THL and advisors engaged by an affiliate of THL for advisory and consulting services. For Fiscal 2015, includes the $7.5 million fee paid to an affiliate of THL as a result of the termination of the advisory services agreement with that affiliate. See Note 19 to the Consolidated Financial Statements. |
59
|
(j) |
Consists of cash payments to our regional managers pursuant to retention and non-compete agreements executed in 2012. The final payments under these agreements were paid in October 2015. |
|
(k) |
Represents external professional service costs incurred as we assessed and initiated the process of becoming a public company. These costs include accounting and legal fees for public readiness services, documentation of internal controls to comply with Section 404 of the Sarbanes-Oxley Act and external auditor fees incurred for review of all fiscal quarters included in the registration statement. |
Supplemental Selected Constant Currency Information
As exchange rates are an important factor in understanding period-to-period comparisons, we believe the presentation of certain results on a constant currency basis in addition to reported results helps improve investors’ ability to understand our operating results and evaluate our performance in comparison to prior periods. Constant currency information compares results between periods as if exchange rates had remained constant period-over-period. We use results on a constant currency basis as one measure to evaluate our performance. We calculate constant currency by retranslating results across all prior periods presented using a derived exchange rate for the most current year periods presented based on actual results. The tables set forth below calculate constant currency at a foreign currency exchange rate of 3.1936 Brazilian reals to 1 US dollar, which represents the derived exchange rates for Fiscal 2017, calculated as explained above. These results should be considered in addition to, not as a substitute for, results reported in accordance with GAAP. Results on a constant currency basis, as we present them, may not be comparable to similarly titled measures used by other companies and are not measures of performance presented in accordance with GAAP.
|
|
|
Fiscal 2017 |
|
|
Fiscal 2016 |
|
|
Fiscal 2015 |
|
|
|||
|
Total revenue as reported |
|
$ |
314,359 |
|
|
$ |
288,296 |
|
|
$ |
271,634 |
|
|
|
Effect of foreign currency |
|
|
— |
|
|
|
3,314 |
|
|
|
1,889 |
|
|
|
Total revenue at constant currency |
|
$ |
314,359 |
|
|
$ |
291,610 |
|
|
$ |
273,523 |
|
|
|
|
|
|
|
|
|
|
|
|
|
|
|
|
|
|
Adjusted EBITDA |
|
$ |
59,695 |
|
|
$ |
59,892 |
|
|
$ |
63,181 |
|
|
|
Effect of foreign currency |
|
|
— |
|
|
|
669 |
|
|
|
892 |
|
|
|
Adjusted EBITDA at constant currency |
|
$ |
59,695 |
|
|
$ |
60,561 |
|
|
$ |
64,073 |
|
|
|
Adjusted EBITDA margin at constant currency |
|
|
19.0 |
% |
|
|
20.8 |
% |
|
|
23.4 |
% |
|
|
|
|
|
|
|
|
|
|
|
|
|
|
|
|
|
Segment restaurant contribution |
|
$ |
87,810 |
|
|
$ |
85,612 |
|
|
$ |
85,059 |
|
|
|
Effect of foreign currency |
|
|
— |
|
|
|
922 |
|
|
|
1,060 |
|
|
|
Segment restaurant contribution at constant currency |
|
$ |
87,810 |
|
|
$ |
86,534 |
|
|
$ |
86,119 |
|
|
|
Segment restaurant contribution margin at constant currency |
|
|
27.9 |
% |
|
|
29.7 |
% |
|
|
31.5 |
% |
|
Liquidity and Capital Resources
Our liquidity and capital requirements are principally the build-out cost of new restaurants, renovations of existing restaurants and corporate infrastructure, as well payments of principal and interest on our outstanding indebtedness and lease obligations. We also require capital resources to further expand and strengthen the capabilities of our corporate support and information technology infrastructures. Our main sources of liquidity have been cash flow from operating activities, construction cost contributions from landlords when available to us (also known as tenant improvement allowances) and borrowings under our existing and previous credit facilities.
60
The Company had historically provided deferred taxes under ASC 740-30-25, formerly APB 23, for the presumed repatriation to the US earnings from the Company’s Brazilian subsidiaries. In June 2015, the Company asserted that the outside basis difference, including undistributed earnings, of its Brazilian subsidiaries would be indefinitely reinvested in operations outside the US. This was primarily driven by a reduction in debt service costs on a go-forward basis as a result of the IPO. The assertion was supported by future US cash projections and the Company’s intent to continue using foreign-generated cash to invest in foreign restaurants. As a result of the change in assertion, the Company reduced its deferred tax liabilities related to undistributed foreign earnings by $13.9 million. In 2016, the Company effectuated an internal restructuring whereby it created a new Dutch holding company, FDC Netherlands Coöperatief U.A. (“Fogo Co-op”) and contributed all of its Brazilian subsidiaries to Fogo Co-op. For US federal income tax purposes, this transaction was structured as a tax-free reorganization. Since the restructuring, Fogo Co-op is treated as the regarded or separate legal entity for US federal income tax purposes and the Brazilian entities are branches or divisions of Fogo Co-op. Consequently, income or losses earned by the Brazilian entities are deemed to be earned by Fogo Co-op for US federal income tax purposes.
The Company is not able to determine a reasonable estimate of the deferred tax liability, if any, that would be recorded if the Company were to change its indefinite reinvestment assertion. Missing or incomplete information relevant to this analysis includes tax basis and book basis in the shares of Fogo Co-op. In addition, the undistributed earnings of approximately $51.5 million related to Fogo Co-Op could be subject to state income tax or withholding tax. Pursuant to SAB 118, the Company will continue to apply ASC 740 based on the provisions of the tax law in effect immediately prior to the enactment of the Tax Act, including the historical indefinite reinvestment assertion with respect to the outside basis differences.
During 2018, the Company will analyze the impact of the Tax Act on its indefinite reinvestment assertion. This analysis will consider the impact of previously taxed earnings created under section 965, the application of the new section 245A dividends received deduction, the impact of the new section 951A GILTI tax rules, state law changes, the existence of an outside basis difference in excess of earnings, currency translation adjustment impacts, and shifts in the global business environment resulting from the Tax Act.
We intend to spend approximately $27.0 million to $31.0 million in Fiscal 2018 on capital expenditures, net of tenant allowances, including approximately $23.0 million to $25.0 million for new restaurant development and approximately $4.0 million to $6.0 million on opportunistic restaurant remodeling.
We believe that our cash from operations and borrowings under our 2015 Credit Facility will be adequate to meet our liquidity needs and capital expenditure requirements for the next 12 months from the date of issuance of these financial statements. In addition, we may make discretionary capital improvements with respect to our restaurants or systems such as our planned opportunistic restaurant remodel program, which we could fund through the issuance of debt or equity securities or other external financing sources to the extent we were unable to fund such capital expenditures out of our cash from operations.
The following table presents the primary components of net cash flows provided by and used in operating, investing and financing activities for the periods indicated.
|
|
|
Fiscal 2017 |
|
|
Fiscal 2016 |
|
|
Fiscal 2015 |
|
|||
|
Net cash provided by (used in) |
|
|
|
|
|
|
|
|
|
|
|
|
|
Operating activities |
|
$ |
55,441 |
|
|
$ |
56,093 |
|
|
$ |
37,361 |
|
|
Investing activities |
|
|
(35,869 |
) |
|
|
(38,353 |
) |
|
|
(35,423 |
) |
|
Financing activities |
|
|
(11,990 |
) |
|
|
(14,011 |
) |
|
|
5,834 |
|
|
Effect of foreign exchange |
|
|
(515 |
) |
|
|
2,627 |
|
|
|
(2,240 |
) |
|
Net increase in cash and cash equivalents |
|
$ |
7,067 |
|
|
$ |
6,356 |
|
|
$ |
5,532 |
|
Operating Activities
Net cash provided by operating activities in Fiscal 2017 decreased $0.7 million from Fiscal 2016. The decrease is primarily attributable to a $3.5 million decrease in cash received related to the timing of accounts and other receivables, a $0.7 million increase in cash paid for secondary offering costs, a $0.6 million increase in cash paid interest, a $0.6 million increase in cash paid for inventory, $0.5 million related to duplicate rent costs for the corporate office, and a $0.4 million increase in pre-opening expenses. These decreases to cash were offset by $2.5 million increase in cash related to the timing of payments of liabilities, and a $2.7 million net increase in deferred rent and tenant allowance.
61
Net cash provided by operating activities in Fiscal 2016 increased $18.7 million from Fiscal 2015. The increase is primarily attributable to an $8.6 million decrease in cash paid interest, an $8.2 million increase in cash related to the timing of collections of receivables and payments of liabilities, a $1.3 million decrease in pre-opening expenses, and a $0.7 million net increase in deferred revenue
Investing Activities
For Fiscal 2017, compared to Fiscal 2016, net cash flows used in investing activities decreased by $2.5 million primarily due to timing of capital expenditures related to new restaurant construction.
For Fiscal 2016, compared to Fiscal 2015, net cash flows used in investing activities increased by $2.9 million primarily due to timing of capital expenditures related to new restaurant construction.
Financing Activities
Net cash flows used by financing activities decreased $2.0 million from Fiscal 2016. In Fiscal 2017, the Company made $12.0 million repayments as compared to in Fiscal 2016 the Company made $15.0 million repayments under the 2015 Credit Facility.
Net cash flows used by financing activities in Fiscal 2016 increased $19.8 million from Fiscal 2015. In Fiscal 2015, the Company generated $259.4 million from the IPO and borrowings under the 2015 Credit Facility, offset by the payoff of the 2012 Credit Facility, pre-payment penalty, debt issuance costs and payment of IPO costs. In Fiscal 2016, the Company made $15.0 million repayments under the 2015 Credit Facility.
2015 Credit Facility
On June 24, 2015, in connection with the closing of the IPO, we refinanced our 2012 Credit Facility and entered into the 2015 Credit Facility. Upon the closing of the IPO, we drew $165.0 million on the 2015 Credit Facility and used those borrowings, along with the net proceeds from the IPO, to repay the outstanding debt under the 2012 Credit Facility.
The 2015 Credit Facility provides for a $250.0 million revolving credit facility (the “Revolving Credit Facility”). The loans under the Revolving Credit Facility mature on June 24, 2020.
At our option, loans under the Revolving Credit Facility may be Base Rate Loans or Eurodollar Rate Loans and bear interest at a Base Rate or Eurodollar Rate, respectively, plus the Applicable Rate. The “Applicable Rate” for any Base Rate Loans or Eurodollar Rate Loan shall be between 50 and 150 basis points with respect to Base Rate Loans and between 150 and 250 basis points with respect to Eurodollar Rate Loans, depending on the Total Rent Adjusted Leverage Ratio. The current Applicable Rate will be (i) in the case of any Base Rate Loan 1.0% and in the case of any Eurodollar Rate Loan, 2.0%.
The 2015 Credit Facility contains a number of affirmative, negative and financial covenants, and events of default customary for facilities of this type. The covenants, among other things, restrict our ability to incur additional indebtedness, make certain acquisitions, engage in certain transactions with affiliates, and authorize or pay dividends. In addition, we will be required to maintain two financial covenants, which include a maximum Total Rent Adjusted Leverage Ratio (at levels that vary until maturity) and a minimum Consolidated Interest Coverage Ratio. At December 31, 2017, these required ratios were 5.25 to 1 and 2.00 to 1, respectively and the Company was in compliance with those covenants.
As of December 31, 2017, we had seven letters of credit outstanding for a total of $5.7 million and $106.3 million of available borrowing capacity under the 2015 Credit Facility.
Contractual Obligations
Leases
We lease certain restaurant locations, storage spaces, buildings and equipment under non-cancelable operating leases. Our restaurant leases generally have initial terms of between 10 and 20 years, and generally can be extended only in five-year increments. Our leases expire at various dates between 2018 and 2033, excluding extensions at our option. Some of our restaurant leases include renewal options, rent abatements and leasehold rental incentives, none of which are reflected in the following table. Some of our leases also include contingent rental payments based on sales volume, the impact of which also are not reflected in the following table.
62
During Fiscal 2017, we entered into additional leases and exercised an extension on an existing lease, adding estimated minimum future rental payments of approximately $6.7 million attributable to these non-cancelable operating leases.
The following table summarizes our contractual arrangements at December 31, 2017 on actual basis and the timing and effect that such commitments are expected to have on our liquidity and cash flows in future periods:
|
|
|
Payments due by Fiscal Year |
|
|||||||||||||||||
|
|
|
Total |
|
|
Less than 1 Year |
|
|
More than 1 - 3 Years |
|
|
More than 3 - 5 Years |
|
|
More than 5 Years |
|
|||||
|
Contractual Obligations |
|
|
|
|
|
|
|
|
|
|
|
|
|
|
|
|
|
|
|
|
|
Workers compensation reserve(a) |
|
$ |
1,923 |
|
|
$ |
738 |
|
|
$ |
709 |
|
|
$ |
258 |
|
|
$ |
218 |
|
|
Long-term debt obligations(b) |
|
|
138,000 |
|
|
|
— |
|
|
|
138,000 |
|
|
|
— |
|
|
|
— |
|
|
Scheduled interest payments(c) |
|
|
14,638 |
|
|
|
5,571 |
|
|
|
9,067 |
|
|
|
— |
|
|
|
— |
|
|
Operating lease (minimum rent)(d) |
|
|
192,983 |
|
|
|
21,874 |
|
|
|
63,558 |
|
|
|
36,629 |
|
|
|
70,922 |
|
|
Total payments |
|
$ |
347,544 |
|
|
$ |
28,183 |
|
|
$ |
211,334 |
|
|
$ |
36,887 |
|
|
$ |
71,140 |
|
|
(a) |
Estimated future payments attributable to our workers compensation reserve. Actual timing of payments may differ from the estimates above. |
|
(b) |
Our Revolving Credit Facility does not require principal payments on any outstanding balance until June 24, 2020. |
|
(c) |
The table above assumes an interest rate of 3-month LIBOR plus a spread of 1.75% on our Revolving Credit Facility plus annual administrative agent fees and fees incurred on the unused portion of the Revolving Credit Facility. |
|
(d) |
Future minimum lease payments attributable to all locations in Brazil contain annual escalations that are tied to the IGPM inflation index. These payments, which will be made in the functional currency of the country, have been estimated using the period-end currency exchange rate and exclude subsequent changes in the prevailing IGPM index rate. Future minimum lease payments attributable to one location in Mexico contain annual escalations that are tied to the US CPI-U index. These payments, which will be made in the functional currency of the country, have been estimated using the period-end currency exchange rate and the US CPI-U index rate existing at the time of the lease was executed. |
Off-Balance Sheet Arrangements
We enter into standby letters of credit to secure certain of our obligations, including insurance programs and lease obligations. As of December 31, 2017, letters of credit and letters of guaranty totaling $5.7 million have been issued. Other than these standby letters of credit, we do not have any off-balance sheet arrangements, investments in special purpose entities or undisclosed borrowings or debt. In addition, we have not entered into any derivative contracts or synthetic leases.
Critical Accounting Policies and Estimates
Our discussion and analysis of our financial condition and consolidated results of operations are based upon our consolidated financial statements, which have been prepared in accordance with generally accepted accounting principles in the United States (“GAAP”). The preparation of financial statements in conformity with GAAP requires management to make estimates and assumptions, such as the valuation of long-lived, definite and indefinite-lived assets, estimated useful lives of assets, the reasonably assured lease terms of operating leases, valuation of the workers’ compensation and Company-sponsored employee health insurance program liabilities, and deferred tax valuation allowances, that affect the reported amounts of assets and liabilities and disclosure of contingent assets and liabilities at the date of the financial statements and the reported amounts of revenue and expenses during the reporting period. Actual results could differ from those estimates.
We believe that the following critical accounting policies affect our more significant estimates and judgments used in the preparation of our consolidated financial statements and that the judgments and estimates are reasonable:
Insurance Reserves
Beginning in Fiscal 2013, the Company self-insured for certain losses related to workers’ compensation claims and Company-sponsored employee health insurance programs. We estimate the accrued liabilities for all self-insurance programs at the end of each reporting period. Our estimate is based on a number of assumptions and factors, including historical trends and actuarial assumptions.
63
Beginning in the fourth quarter of Fiscal 2015, we engaged a third party actuary to assist us in estimating our liability for our workers’ compensation claims. We elected to accrue the estimated liability for workers’ compensation claims discounted based on the cash flow estimates provided by the actuary. Prior to the fourth quarter of Fiscal 2015 we did not discount the estimated liability for workers’ compensation claims. The discount on the estimated liability for workers’ compensation claims as of December 31, 2017 is approximately $0.2 million. We believe that applying a discount to the estimated future cash flows provided by the actuarial analysis results in a more accurate estimate of the liability. The estimated liability for all other self-insurance programs is not discounted. The estimated liability for workers’ compensation claims was $1.9 million as of December 31, 2017. The estimated liability for all other self-insurance programs was $0.4 million as of December 31, 2017.
Impairment of Long-Lived Assets
On a quarterly basis, or as circumstances warrant, we review long-lived assets to determine if triggering events have occurred which would require a test to determine if the carrying amount of the assets may not be recoverable based on estimated future cash flows. Assets are reviewed at the lowest level for which cash flows can be separately identified, which is at the individual restaurant level. In the absence of extraordinary events, restaurants are included in our impairment analysis after they have been opened for 36 months. An initial three-year operating plan is developed for each new location and we remain committed to that plan barring unforeseen circumstances.
During December 2017, the Company recognized a $4.2 million non-cash impairment charge related to the reduction in the carrying value of an underperforming restaurant in the US. The Company continues to evaluate the restaurant’s operating performance and its options. A closure of this restaurant could result in a material charge in the period in which the Company ceases operations.
Our restaurant in San Juan, Puerto Rico re-opened to the public in November 2017. Due to the extended closure, the San Juan location experienced operating losses during the third quarter and into the fourth quarter of Fiscal 2017. While we believe these losses are temporary, should indicators suggest a prolonged period of closure and continued losses, this reduction in cash flows could challenge the recovery of carrying value of the restaurants’ assets.
Goodwill
Goodwill represents the excess of the purchase price of an acquired business over the fair value of the assets acquired and liabilities assumed resulting from the acquisition. Goodwill is not amortized. We test our goodwill annually for impairment during the fourth quarter, or more frequently should an event occur or circumstances indicate that the carrying amount may be impaired. Such events or circumstances may be a significant change in business climate, economic and industry trends, legal factors, negative operating performance indicators, significant competition, changes in strategy or disposition of a reporting unit or a portion thereof. We have identified two reporting units, the US and Brazil, based on the geography of the Company’s operations to which goodwill is attributable. The impairment evaluation is conducted annually using a two-step process. In the first step, the fair value of each reporting unit is compared with the carrying amount of the reporting unit, including goodwill. The estimated fair value of the reporting unit is determined on the basis of discounted future cash flows. If the estimated fair value of the reporting unit is less than the carrying amount of the reporting unit, then a second step must be completed in order to determine the amount of the goodwill impairment that should be recorded. In the second step, the implied fair value of the reporting unit’s goodwill is determined by allocating the reporting unit’s fair value to all of its assets and liabilities other than goodwill in a manner similar to a purchase price allocation. The resulting implied fair value of the goodwill that results from the application of this second step is then compared to the carrying amount of the goodwill and an impairment charge is recorded for any excess or carrying value over fair value. No impairment to goodwill was recorded during any of the periods presented.
Intangible Assets
Indefinite-lived intangible assets are not amortized. We test our indefinite-lived intangibles for impairment annually during the fourth quarter, or more frequently if circumstances indicate potential impairment, through a comparison of fair value to its carrying amount. The estimated fair value is determined on the basis of discounted future cash flows. If the estimated fair value is less than the carrying amount of the indefinite-lived intangible asset, then an impairment charge is recorded to reduce the asset to its estimated fair value. Our indefinite-lived intangible assets relate to the assigned value of the Fogo de Chão trade name. Definite-lived intangible assets consist of non-compete agreements. The non-compete agreements are amortized over five years, which is the term of the agreements, and are measured for impairment when events or circumstances indicate the carrying value may be impaired in the same manner as long-lived assets. No impairments related to these intangible assets were recorded in any of the periods presented. The term of the non-compete agreements were completed during 2017.
64
Operating Leases and Deferred Rent
We operate the majority of our restaurants in leased premises. We record the minimum base rents including option periods which in the judgement of management are reasonably assured of renewal. In determining whether an option period is reasonably assured for renewal we consider the capital outlay required for a location and our target return on that investment. For purposes of calculating straight-line rents, the lease term commences on the date we obtain control of the property, which is normally when the property is ready for normal tenant improvements (build-out period). The difference between rent expense and rent paid is recorded as a deferred rent liability. Allowances for tenant improvements are included in the deferred rent liability and recognized over the life of the lease by reducing rent expense.
Income Taxes
On December 22, 2017, the Tax Act was signed into law effective January 1, 2018. The Tax Act significantly revised the US tax code by, in part but not limited to: a corporate tax rate decrease from 35% to 21% effective for tax years beginning after December 31, 2017, the transition of US international taxation from a worldwide tax system to a territorial system, and a one-time transition tax on the mandatory deemed repatriation of cumulative foreign earnings as of December 31, 2017. Under Accounting Standards Codification 740, Income Taxes, the Company must recognize the effects of tax law changes in the period in which the new legislation is enacted.
We calculated an estimate of the impact of the Tax Act in its year-end income tax provision in accordance with our understanding of the Tax Act and guidance available as of the date of this filing. The provisional tax benefit recorded related to the re-measurement of certain deferred tax assets and liabilities, based on the rates at which they are expected to reverse in the future, was $15.0 million. The provisional tax expense related to the one-time transition tax on the mandatory deemed repatriation of foreign earnings was $6.5 million.
The Tax Act provides for a one-time transition tax under section 965 on previously untaxed post-1986 foreign income of specified foreign corporations owned by US shareholders by deeming those earnings to be repatriated. Foreign earnings considered held in the form of cash and cash equivalents are taxed at an effective rate of 15.5%, and the remaining earnings are taxed at an effective rate of 8%, which includes a partial participation exemption. We recorded $6.5 million expense related to its one-time repatriation inclusion. As addressed below, this amount is presented as provisional while we continue to review the balance of foreign earnings required to be included under section 965(a).
We have historically not utilized a foreign tax credit, instead opting to deduct all foreign taxes paid. In Fiscal 2017, we elected to calculate and utilize a foreign tax credit. We recorded a $2.1 million benefit related to foreign tax credits which includes a credit benefit of $3.3 million net of the $1.1 million Section 78 gross up expense. As addressed below, this amount is presented as provisional while we continue to review its foreign tax pool balance and attributes relevant to the section 904 foreign tax credit limitation.
The Tax Act provides for 100% bonus depreciation for eligible property placed in service after September 27, 2017, and before 2023. The Tax Act allows a Company to make an election for the 2017 tax year to apply 50% bonus depreciation rather than 100% bonus depreciation on eligible property. At this time, we plan to elect the 50% bonus depreciation. As addressed below, this amount is presented as provisional while we continue to review the impact of 100% bonus depreciation on its foreign tax credit utilization.
On December 22, 2017, Staff Accounting Bulletin No. 118 ("SAB 118") was issued to address the application of US GAAP in situations when a registrant does not have the necessary information available, prepared, or analyzed (including computations) in reasonable detail to complete the accounting for certain income tax effects of the Tax Act. Pursuant to SAB 118, we are presenting the adjustments to deferred tax assets and liabilities, the liability related to the transition tax, and foreign tax credits as provisional amounts based on information available as of December 31, 2017. As further regulatory guidance is issued by the applicable taxing authorities and as accounting treatment is clarified, additional work may be necessary to ensure earnings as required by the calculations are properly determined. As we perform additional analysis on the application of the law, and as we refine our estimates in calculating the effect, our final analysis may be different from current provisional amounts. Any changes to the provisional amounts will be recognized in the period completed which could materially affect our tax obligations and effective tax rate. Additionally, as a result of the Tax Act, we have not completed our evaluation of its indefinite reinvestment assertion with regard to foreign earnings under ASC 740-30. As a result, deferred tax liabilities may be increased or decreased during the period allowed under SAB 118.
65
The effects of other provisions of the Tax Act are not expected to have a material impact on our Fiscal 2017 consolidated financial statements. Other provisions of the Tax Act may impact us in Fiscal 2018. These include the new section 951A Global Intangible Low-Taxed Income (“GILTI”) anti-deferral rules and the section 245A deduction for certain dividends received from foreign corporations. We have not completed its analysis of the effect of these provisions, hence no estimate can currently be made and no provisional amounts were recorded in the financial statements for the impact of these provisions of the Tax Act. Based on the current interpretation, we may choose a method as an accounting policy to record deferred taxes in relation to the GILTI provisions or to record the tax in the period in which it occurs. Pursuant to SAB 118, we have not elected an accounting policy for the effect of the GILTI tax law provisions.
Recently Issued Accounting Standards
Recently issued accounting standards not included below are not expected to have a material impact on the Company’s consolidated financial position or results of operations.
In April 2016, the FASB issued ASU 2016-10, an amendment to ASU 2014-09, Revenue from Contracts with Customers (Topic 606). ASU 2014-09 provides a comprehensive new revenue recognition model that requires a company to recognize revenue to depict the transfer of goods or services to a customer at an amount that reflects the consideration it expects to receive in exchange for those goods or services and expands related disclosure requirements. ASU 2016-10 clarifies ASU 2014-09 to address the potential for diversity in practice at the adoption. ASUs 2016-10 and 2014-09 are effective for annual and interim reporting periods beginning after December 15, 2017, and early application is permitted.
The majority of our revenues are from food and beverage sales at our restaurants. ASU 2014-09 will not have an impact on revenue recognition related to food and beverage sales. ASU 2014-09 requires gift card breakage to be recognized as revenue in proportion to the pattern of gift card redemptions exercised by our customers. Currently, the Company records breakage income within other revenue.
The new guidance may be applied retrospectively to each prior period presented or retrospectively with the cumulative effect adjustment to opening retained earnings as of the date of adoption (modified retrospective approach). We have elected the modified retrospective adoption method and plan to adopt this guidance in the first quarter of fiscal 2018. We do not expect the adoption of this guidance to have a material impact on our consolidated financial statements. The Company has evaluated the impact of adoption on the recognition of license fee and other income related to the Company’s joint ventures and does not believe the adoption will have a material impact on our consolidated financial statements.
In February 2016, the FASB issued Accounting Standards Update (“ASU”) 2016-02, Leases (Topic 842). This guidance requires the recognition of most leases on the balance sheet to give investors, lenders, and other financial statement users a more comprehensive view of a company’s long-term financial obligations as well as the assets it owns versus leases. ASU 2016-02 will be effective for fiscal years beginning after December 15, 2018, and interim periods within those fiscal years. Currently, all of our restaurant and our restaurant support center leases are accounted for as operating leases, and therefore are not recorded within our balance sheet. We expect this adoption will result in a material increase in the assets and liabilities on our consolidated balance sheets, but will likely have an insignificant impact on our consolidated statements of earnings. In preparation for the adoption of the guidance, we are implementing controls and key system changes to enable the preparation of financial information.
In June 2016, the FASB issued ASU 2016-13, “Financial Instruments-Credit Losses (Topic 326): Measurement of Credit Losses on Financial Instruments,” which provides financial statement users with more decision-useful information about the expected credit losses on financial instruments and other commitments to extend credit held by a reporting entity at each reporting date. To achieve this, the amendments in this ASU replace the incurred loss impairment methodology in current GAAP with a methodology that reflects expected credit losses and requires consideration of a broader range of reasonable and supportable information to inform credit loss estimates. The measurement of expected credit losses will be based on relevant information about past events, including historical experience, current conditions, and reasonable and supportable forecasts that affect the collectability of the reported amount. The amendments in this ASU will be applied using a modified-retrospective approach and, for public entities, are effective for fiscal years beginning after December 15, 2019 and interim periods within those annual periods. Early adoption is permitted for fiscal years beginning after December 15, 2018 and interim periods within those annual periods. The Company has not yet evaluated the impact the adoption of this standard will have on its consolidated financial statements.
In August 2016, the FASB issued ASU 2016-15, “Statement of Cash Flows (Topic 230): Classification of Certain Cash Receipts and Cash Payments,” which clarifies and provides specific guidance on eight cash flow classification issues that are not currently addressed by current GAAP. ASU 2016-15 is effective for annual periods and interim periods within those annual periods beginning after December 15, 2017, and early adoption is permitted. The Company will adopt ASU 2016-15 effective Fiscal 2018. Upon adoption there will be no impact on the Company’s consolidated statement of cash flows.
66
In January 2017, the FASB issued ASU 2017-04, “Intangibles - Goodwill and Other (Topic 350).” ASU 2017-04 simplifies the subsequent measurement of goodwill by removing the second step of the two-step impairment test. The amendment requires an entity to perform its annual, or interim goodwill impairment test by comparing the fair value of a reporting unit with its carrying amount. A goodwill impairment will be the amount by which a reporting unit’s carrying value exceeds its fair value, not to exceed the carrying amount of goodwill. The amendment should be applied on a prospective basis. ASU 2017-04 is effective for fiscal years beginning after December 15, 2019, and interim periods within those fiscal years. Early adoption is permitted for interim or annual goodwill impairment tests performed on testing dates after January 1, 2017. The adoption of this guidance will have no impact on the Company’s consolidated financial statements.
JOBS Act
We are an “emerging growth company,” as defined in the Jumpstart our Business Startups Act of 2012, or the JOBS Act, and we take advantage of certain exemptions from various reporting requirements that are applicable to other public companies that are not emerging growth companies, including, but not limited to, not being required to comply with the auditor attestation requirements of Section 404 of the Sarbanes-Oxley Act, reduced disclosure obligations regarding executive compensation in our periodic reports and proxy statements, and exemptions from the requirements of holding a nonbinding advisory vote on executive compensation and shareholder approval of any golden parachute payments not previously approved. In addition, even if we comply with the greater obligations of public companies that are not emerging growth from time to time, we may avail ourselves of the reduced requirements applicable to emerging growth companies from time to time in the future.
Section 107 of the JOBS Act also provides that an “emerging growth company” can take advantage of the extended transition period provided in Section 7(a)(2)(B) of the Securities Act of 1933, as amended, for complying with new or revised accounting standards. However, we are choosing to opt out of any extended transition period, and as a result we will seek to comply with new or revised accounting standards on the relevant dates on which adoption of such standards is required for non-emerging growth companies. Section 107 of the JOBS Act provides that our decision to opt out of the extended transition period for complying with new or revised accounting standards is irrevocable.
We will remain an “emerging growth company” for up to five years following the completion of our initial public offering which will be June 2020, or until the earliest of (i) the last day of the first fiscal year in which our annual gross revenues exceed $1 billion, (ii) the date that we become a “large accelerated filer” as defined in Rule 12b-2 under the Securities Exchange Act of 1934, as amended (the “Exchange Act”), which would occur if the market value of our common stock that is held by non-affiliates exceeds $700 million as of the last business day of our most recently completed second fiscal quarter, or (iii) the date on which we have issued more than $1 billion in non-convertible debt during the preceding three-year period.
67
Item 7A. Quantitative and Qualitative Disclosures About Market Risk.
Market risk represents the risk of loss that may impact our financial position due to adverse changes in financial market prices and rates. Our market risk exposure is primarily a result of fluctuations in interest rates and foreign currency exchange rates. We do not hold or issue financial instruments for trading purposes.
Foreign Currency Exchange Risk
The reporting currency for our consolidated financial statements is the US dollar. However, during Fiscal 2017, Fiscal 2016 and Fiscal 2015, we generated 13.4%, 14.8% and 16.4%, respectively, of our revenue in Brazil. The revenue and expenses of our Brazilian subsidiaries is translated at the then average exchange rates and as a result our consolidated financial statements are impacted by fluctuations in the foreign currency exchange rates. The Real depreciated 14.3% against the US dollar during Fiscal 2014 and depreciated further by 48.5% during Fiscal 2015. The Real strengthened in relation to the US dollar 17.3% during Fiscal 2016 and then slightly depreciated again by 1.2% against the US dollar during Fiscal 2017. As a result, we have experienced significant foreign currency impact due to fluctuations of the Brazilian Real relative to the US dollar and may be impacted materially for the foreseeable future. We anticipate foreign currency to stabilize throughout Fiscal 2018 with respect to the Brazilian reais. Any hypothetical loss in revenue could be partially or completely offset by lower food and beverage costs and lower selling, general and administrative costs that are generated in Brazilian reais. A 10% appreciation in the relative value of the US dollar compared to the Brazilian Real would have resulted in lost income from operations of approximately $0.6 million and $0.7 million for Fiscal 2017 and for Fiscal 2016, respectively. To the extent the ratio between our revenue generated in Brazilian reais increases as compared to our expenses generated in Brazilian reais, we expect that our results of operations will be further impacted by changes in exchange rates. We do not currently hedge foreign currency fluctuations. However, in the future, in an effort to mitigate losses associated with these risks, we may at times enter into derivative financial instruments, although we have not historically done so. These may take the form of forward sales contracts and option contracts. We do not, and do not intend to, engage in the practice of trading derivative securities for profit.
Interest Rate Risk
We are exposed to market risk from changes in interest rates on our debt, which bears interest at variable rates and is a function of our Total Rent Adjusted Leverage Ratio as defined in the 2015 Credit Facility agreement. As of December 31, 2017, we had total aggregate principal amount of outstanding borrowings of $138.0 million. A 1.00% increase in the effective interest rate applied to these borrowings would result in an interest expense increase of $1.4 million on an annualized basis. We manage our interest rate risk through normal operating and financing activities and, when determined appropriate, through the use of derivative financial instruments.
Inflation
Inflationary factors such as increases in food, beverage and overhead costs may adversely affect our operating results. Although we do not believe that inflation has had a material impact on our financial position or results of operations to date, a high rate of inflation in the future may have an adverse effect on our ability to maintain current levels of gross margin and selling, general and administrative costs as a percentage of revenue if our menu prices do not increase with these increases.
68
Item 8. Financial Statements and Supplementary Data.
Information with respect to this Item is set forth beginning on page F-1. See "Item 15. Exhibits, Financial Statement Schedules."
Item 9. Changes in and Disagreements with Accountants on Accounting and Financial Disclosure.
None.
Item 9A. Controls and Procedures.
Disclosure Controls and Procedures
Our management establishes and maintains disclosure controls and procedures (as defined in Rules 13a-15(e) and 15d-15(e) under the Exchange Act) that are designed to ensure that information required to be disclosed by us in the reports that we file or submit under the Exchange Act is recorded, processed, summarized and reported within the time periods specified in the Securities and Exchange Commission’s rules and forms. Such information is accumulated and communicated to our management, including our Chief Executive Officer (“CEO”) and Chief Financial Officer (“CFO”), as appropriate, to allow timely decisions regarding required disclosure. We evaluated the effectiveness of our disclosure controls and procedures as of December 31, 2017, with the participation of our CEO and CFO, as well as other key members of our management. Based on this evaluation, our CEO and CFO concluded that our disclosure controls and procedures were effective as of December 31, 2017.
Management’s Report on Internal Control Over Financial Reporting
Our management is responsible for establishing and maintaining adequate internal control over financial reporting as defined in Rules 13a-15(f) and 15d-15(f) under the Exchange Act designed to provide reasonable assurance regarding the reliability of financial reporting and the preparation of the Company’s financial statements for external reporting purposes in accordance with US generally accepted accounting principles.
Our management assessed the effectiveness of the Company’s internal control over financial reporting as of December 31, 2017, using the criteria set forth by the Committee of Sponsoring Organizations of the Treadway Commission in Internal Control - Integrated Framework (2013). This evaluation was carried out under the supervision, and with the participation, of our management, including our CEO and CFO. Based on this assessment, management concluded that, as of December 31, 2017, the Company’s internal control over financial reporting was effective.
This Annual Report on Form 10-K for the fiscal year ended December 31, 2017 does not include an attestation report of our independent registered public accounting firm regarding internal control over financial reporting due to an exemption established by the JOBS Act for “emerging growth companies.”
Changes in Internal Control over Financial Reporting
There have been no changes in our internal control over financial reporting that occurred during our most recent fiscal quarter ended December 31, 2017 that have materially affected, or are reasonably likely to materially affect, our internal control over financial reporting.
None.
69
Item 10. Directors, Executive Officers and Corporate Governance.
Pursuant to general instruction G to Form 10-K, we incorporate by reference into this item the information to be disclosed in our definitive proxy statement for our 2018 Annual Meeting of Stockholders.
Item 11. Executive Compensation.
Pursuant to general instruction G to Form 10-K, we incorporate by reference into this item the information to be disclosed in our definitive proxy statement for our 2018 Annual Meeting of Stockholders.
Item 12. Security Ownership of Certain Beneficial Owners and Management and Related Stockholder Matters.
|
|
|
Equity Compensation Plan Information |
|
|||||||||
|
Plan category |
|
Number of securities to be issued upon exercise of outstanding options, warrants, and rights (a) |
|
|
Weighted-average exercise price of outstanding options, warrants and rights (b) |
|
|
Number of securities remaining available for future issuance under equity compensation plans (excluding securities reflect in column (a)) (c) |
|
|||
|
Equity compensation plans approved by security holders |
|
|
2,182,230 |
|
|
$ |
9.95 |
|
|
|
1,260,585 |
|
|
Equity compensation plans not approved by security holders |
|
|
— |
|
|
|
— |
|
|
|
— |
|
Pursuant to general instruction G to Form 10-K, we incorporate by reference into this item the information to be disclosed in our definitive proxy statement for our 2018 Annual Meeting of Stockholders.
Item 13. Certain Relationships and Related Transactions, and Director Independence.
Pursuant to general instruction G to Form 10-K, we incorporate by reference into this item the information to be disclosed in our definitive proxy statement for our 2018 Annual Meeting of Stockholders.
Item 14. Principal Accounting Fees and Services.
Pursuant to general instruction G to Form 10-K, we incorporate by reference into this item the information to be disclosed in our definitive proxy statement for our 2018 Annual Meeting of Stockholders.
70
Item 15. Exhibits, Financial Statement Schedules.
Refer to Index to Financial Statements appearing on page F-1.
|
(b) |
Financial Statement Schedules |
No financial statement schedules are provided because the information called for is not required or is shown in the financial statements or the notes thereto.
|
(c) |
Exhibits |
The exhibits listed on the accompanying Exhibit Index are filed or incorporated by reference as part of this report.
71
|
Exhibit Number |
|
Description |
|
Filings Referenced for Incorporation by Reference |
|
1.1 |
|
|
Exhibit 1.1 of the Company’s Current Report on Form 8-K filed February 20, 2018 |
|
|
3.1 |
|
Amended and Restated Certificate of Incorporation of Fogo de Chão, Inc. |
|
Exhibit 3.1 of the Company’s Current Report on Form 8-K filed June 30, 2015 |
|
3.2 |
|
|
Exhibit 3.2 of the Company’s Current Report on Form 8-K filed June 30, 2015 |
|
|
3.3 |
|
|
Exhibit 2.1 of the Company’s Current Report on Form 8-K filed February 20, 2018 |
|
|
4.1 |
|
|
Exhibit 4.1 of the Company’s Amendment No. 2 to Form S-1 filed June 8, 2015 |
|
|
10.1# |
|
|
Exhibit 10.1 of the Company’s Registration Statement on Form S-1 filed April 20, 2015 |
|
|
10.2# |
|
|
Exhibit 10.2 of the Company’s Amendment No. 3 to Form S-1 filed June 15, 2015 |
|
|
10.3# |
|
|
Exhibit 10.3 of the Company’s Registration Statement on Form S-1 filed April 20, 2015 |
|
|
10.4# |
|
|
Exhibit 10.4 of the Company’s Registration Statement on Form S-1 filed April 20, 2015 |
|
|
10.5# |
|
Form of Restricted Stock Agreement under the Brasa (Parent) Inc. 2012 Omnibus Equity Incentive Plan |
|
Exhibit 10.5 of the Company’s Registration Statement on Form S-1 filed April 20, 2015 |
|
10.6# |
|
|
Exhibit 10.14 of the Company’s Amendment No. 2 to Form S-1 filed June 8, 2015 |
|
|
10.7# |
|
Form of Fogo 2015 Plan Restricted Stock Award Notice and Agreement |
|
Exhibit 10.1 of the Company’s Quarterly Report on Form 10-Q filed August 9, 2017 |
|
10.8# |
|
Form of Fogo 2015 Plan Restricted Stock Award Notice and Agreement (2017 Grant -Time Vesting) |
|
Exhibit 10.1 of the Company’s Quarterly Report on Form 10-Q filed November 8, 2017 |
|
10.9# |
|
Form of Performance-Based Restricted Stock Award Agreement under the 2015 Omnibus Incentive Plan |
|
Exhibit 10.1 of the Company’s Current Report on Form 8-K filed December 7, 2017 |
|
10.10# |
|
|
Exhibit 10.15 of the Company’s Amendment No. 3 to Form S-1 filed June 15, 2015 |
|
|
10.11# |
|
|
Exhibit 10.1 of the Company’s Current Report on Form 8-K filed July 7, 2016. |
|
|
10.12# |
|
Form of Indemnification Agreement between Fogo de Chão, Inc. and its directors and certain officers |
|
Exhibit 10.12 of the Company’s Amendment No. 2 to Form S-1 filed June 8, 2015 |
|
10.13# |
|
|
Exhibit 10.2 of the Company’s Current Report on Form 8-K filed December 7, 2017 |
|
|
10.14# |
|
Amended and Restated Employment Agreement with Lawrence J. Johnson dated as of July 20, 2012 |
|
Exhibit 10.6 of the Company’s Amendment No. 1 to Form S-1 filed May 27, 2015 |
|
10.15# |
|
Employment Agreement with George Barry McGowan dated as of July 15, 2013 |
|
Exhibit 10.14 of the Company's Annual Report on Form 10-K filed March 30, 2016 |
|
10.16# |
|
Employment Agreement with Selma Oliveira dated as of July 11, 2014 |
|
Exhibit 10.14 of the Company’s Registration Statement on Form S-1 filed April 20, 2015 |
|
10.17 |
|
|
Exhibit 10.16 of the Company’s Amendment No. 2 to Form S-1 filed June 8, 2015 |
|
|
10.18 |
|
|
Exhibit 10.17 of the Company’s Amendment No. 2 to Form S-1 filed June 8, 2015 |
72
|
|
|
Exhibit 10.18 of the Company’s Amendment No. 2 to Form S-1 filed June 8, 2015 |
||
|
10.20 |
|
|
Exhibit 10.1 of the Company’s Current Report on Form 8-K filed June 30, 2015 |
|
|
21.1 |
|
|
Filed herewith. |
|
|
23.1 |
|
Consent of PricewaterhouseCoopers LLP, Independent Registered Public Accounting Firm |
|
Filed herewith. |
|
31.1 |
|
|
Filed herewith. |
|
|
31.2 |
|
|
Filed herewith. |
|
|
32.1* |
|
|
Furnished herewith. |
|
|
32.2* |
|
|
Furnished herewith. |
|
|
101.INS |
|
XBRL Instance Document |
|
Filed herewith. |
|
101.SCH |
|
XBRL Taxonomy Extension Schema Document |
|
Filed herewith. |
|
101.CAL |
|
XBRL Taxonomy Extension Calculation Linkbase Document |
|
Filed herewith. |
|
101.DEF |
|
XBRL Taxonomy Extension Definition Linkbase Document |
|
Filed herewith. |
|
101.LAB |
|
XBRL Taxonomy Extension Label Linkbase Document |
|
Filed herewith. |
|
101.PRE |
|
XBRL Taxonomy Extension Presentation Linkbase Document |
|
Filed herewith. |
|
|
|
|
|
|
|
# |
|
Management contract or compensatory plan or arrangement. |
||
|
* |
|
Not deemed to be "filed" for purposes of section 18 of the Securities Exchange Act of 1934. |
||
73
None.
74
Pursuant to the requirements of Section 13 or 15(d) of the Securities Exchange Act of 1934, the Registrant has duly caused this report to be signed on its behalf by the undersigned thereunto duly authorized, on March 8, 2018.
|
|
|
FOGO DE CHAO, INC. |
|
|
|
|
|
|
|
|
|
By: |
/s/ Lawrence J. Johnson |
|
|
|
|
Lawrence J. Johnson |
|
|
|
|
Chief Executive Officer |
Pursuant to the requirements of the Securities Exchange Act of 1934, as amended, this annual report has been signed below by the following persons on behalf of the Registrant in the capacities and on the dates indicated.
|
Name |
|
Title |
|
Date |
|
|
|
|
|
|
|
/s/ Lawrence J. Johnson |
|
Director and Chief Executive Officer |
|
March 8, 2018 |
|
Lawrence J. Johnson |
|
(Principal Executive Officer) |
|
|
|
|
|
|
|
|
|
/s/ Anthony D. Laday |
|
Chief Financial Officer |
|
March 8, 2018 |
|
Anthony D. Laday |
|
(Principal Financial Officer) |
|
|
|
|
|
|
|
|
|
/s/ Stacy A. Murray |
|
Vice President Accounting and Controller |
|
March 8, 2018 |
|
Stacy A. Murray |
|
(Principal Accounting Officer) |
|
|
|
|
|
|
|
|
|
/s/ George Barry McGowan |
|
President |
|
March 8, 2018 |
|
George Barry McGowan |
|
|
|
|
|
|
|
|
|
|
|
/s/ Todd M. Abbrecht |
|
Director |
|
March 8, 2018 |
|
Todd M. Abbrecht |
|
|
|
|
|
|
|
|
|
|
|
/s/ Gerald W. Deitchle |
|
Director |
|
March 8, 2018 |
|
Gerald W. Deitchle |
|
|
|
|
|
|
|
|
|
|
|
/s/ Douglas A. Haber |
|
Director |
|
March 8, 2018 |
|
Douglas A. Haber |
|
|
|
|
|
|
|
|
|
|
|
/s/ Neil Moses |
|
Director |
|
March 8, 2018 |
|
Neil Moses |
|
|
|
|
|
|
|
|
|
|
|
/s/ Douglas R. Pendergast |
|
Director |
|
March 8, 2018 |
|
Douglas R. Pendergast |
|
|
|
|
|
|
|
|
|
|
|
/s/ Jeff T. Swenson |
|
Director |
|
March 8, 2018 |
|
Jeff T. Swenson |
|
|
|
|
75
INDEX TO CONSOLIDATED FINANCIAL STATEMENTS
|
F-2 |
|
|
|
|
|
F-3 |
|
|
|
|
|
Consolidated Statements of Operations and Comprehensive Income (Loss) |
F-4 |
|
|
|
|
F-5 |
|
|
|
|
|
F-6 |
|
|
|
|
|
F-8 |
F-1
Report of Independent Registered Public Accounting Firm
To the Board of Directors and Shareholders of Fogo de Chão, Inc. and Subsidiaries:
Opinion on the Financial Statements
We have audited the accompanying consolidated balance sheets of Fogo de Chão, Inc. and Subsidiaries as of December 31, 2017 and January 1, 2017, and the related consolidated statements of operations and comprehensive income (loss), of stockholders’ equity and of cash flows for each of the three years in the period ended December 31, 2017, including the related notes (collectively referred to as the “consolidated financial statements”). In our opinion, the consolidated financial statements present fairly, in all material respects, the financial position of the Company as of December 31, 2017 and January 1, 2017, and the results of their operations and their cash flows for each of the three years in the period ended December 31, 2017 in conformity with accounting principles generally accepted in the United States of America.
Basis for Opinion
These consolidated financial statements are the responsibility of the Company’s management. Our responsibility is to express an opinion on the Company’s consolidated financial statements based on our audits. We are a public accounting firm registered with the Public Company Accounting Oversight Board (United States) (“PCAOB”) and are required to be independent with respect to the Company in accordance with the U.S. federal securities laws and the applicable rules and regulations of the Securities and Exchange Commission and the PCAOB.
We conducted our audits of these consolidated financial statements in accordance with the standards of the PCAOB. Those standards require that we plan and perform the audit to obtain reasonable assurance about whether the consolidated financial statements are free of material misstatement, whether due to error or fraud. The Company is not required to have, nor were we engaged to perform, an audit of its internal control over financial reporting. As part of our audits we are required to obtain an understanding of internal control over financial reporting but not for the purpose of expressing an opinion on the effectiveness of the Company's internal control over financial reporting. Accordingly, we express no such opinion.
Our audits included performing procedures to assess the risks of material misstatement of the consolidated financial statements, whether due to error or fraud, and performing procedures that respond to those risks. Such procedures included examining, on a test basis, evidence regarding the amounts and disclosures in the consolidated financial statements. Our audits also included evaluating the accounting principles used and significant estimates made by management, as well as evaluating the overall presentation of the consolidated financial statements. We believe that our audits provide a reasonable basis for our opinion.
/s/ PricewaterhouseCoopers LLP
Dallas, Texas
March 8, 2018
We have served as the Company's auditor since 2006.
F-2
(in thousands, except share and par value amounts)
|
|
|
December 31, |
|
|
January 1, |
|
||
|
|
|
2017 |
|
|
2017 |
|
||
|
Assets |
|
|
|
|
|
|
|
|
|
Current assets: |
|
|
|
|
|
|
|
|
|
Cash and cash equivalents |
|
$ |
38,342 |
|
|
$ |
31,275 |
|
|
Accounts receivable |
|
|
10,646 |
|
|
|
10,082 |
|
|
Other receivables |
|
|
1,829 |
|
|
|
1,460 |
|
|
Inventories |
|
|
5,017 |
|
|
|
4,647 |
|
|
Prepaid expenses and other current assets |
|
|
4,331 |
|
|
|
3,763 |
|
|
Total current assets |
|
|
60,165 |
|
|
|
51,227 |
|
|
Property and equipment, net |
|
|
173,545 |
|
|
|
158,850 |
|
|
Prepaid rent |
|
|
637 |
|
|
|
772 |
|
|
Goodwill |
|
|
208,291 |
|
|
|
211,150 |
|
|
Intangible assets, net |
|
|
95,581 |
|
|
|
95,951 |
|
|
Liquor licenses |
|
|
1,267 |
|
|
|
1,184 |
|
|
Other assets |
|
|
3,035 |
|
|
|
2,917 |
|
|
Deferred tax assets |
|
|
92 |
|
|
|
344 |
|
|
Total assets(a) |
|
$ |
542,613 |
|
|
$ |
522,395 |
|
|
Liabilities and Equity |
|
|
|
|
|
|
|
|
|
Current liabilities: |
|
|
|
|
|
|
|
|
|
Accounts payable and accrued expenses |
|
$ |
35,628 |
|
|
$ |
29,457 |
|
|
Deferred revenue |
|
|
7,387 |
|
|
|
6,344 |
|
|
Total current liabilities |
|
|
43,015 |
|
|
|
35,801 |
|
|
Deferred rent |
|
|
24,292 |
|
|
|
19,781 |
|
|
Long-term debt, less current portion |
|
|
138,000 |
|
|
|
150,000 |
|
|
Other noncurrent liabilities |
|
|
2,288 |
|
|
|
2,116 |
|
|
Deferred taxes |
|
|
14,244 |
|
|
|
21,838 |
|
|
Total liabilities(a) |
|
|
221,839 |
|
|
|
229,536 |
|
|
Commitments and contingencies (Note 15) |
|
|
|
|
|
|
|
|
|
Equity: |
|
|
|
|
|
|
|
|
|
Fogo de Chão, Inc. shareholders' equity: |
|
|
|
|
|
|
|
|
|
Preferred stock, $0.01 par value, 15,000,000 shares authorized, no shares issued and outstanding as of December 31, 2017 and January 1, 2017, respectively |
|
|
— |
|
|
|
— |
|
|
Common stock, $0.01 par value, 200,000,000 shares authorized, 28,254,732 and 28,211,586 shares issued and outstanding as of December 31, 2017 and January 1, 2017, respectively |
|
|
282 |
|
|
|
282 |
|
|
Additional paid-in capital |
|
|
276,021 |
|
|
|
275,237 |
|
|
Accumulated earnings |
|
|
88,677 |
|
|
|
59,888 |
|
|
Accumulated other comprehensive loss |
|
|
(45,971 |
) |
|
|
(44,763 |
) |
|
Total Fogo de Chão, Inc. shareholders' equity |
|
|
319,009 |
|
|
|
290,644 |
|
|
Noncontrolling interests |
|
|
1,765 |
|
|
|
2,215 |
|
|
Total equity |
|
|
320,774 |
|
|
|
292,859 |
|
|
Total liabilities and equity |
|
$ |
542,613 |
|
|
$ |
522,395 |
|
|
(a) |
Consolidated assets as of December 31, 2017 and January 1, 2017 include total assets of $2,652 and $2,991, respectively, attributable to joint venture that can only be used to settle the obligations of the joint venture. Consolidated liabilities as of December 31, 2017 and January 1, 2017 include total liabilities of $465 and $403 attributable to the consolidated joint venture. See Note 5. |
The accompanying notes are an integral part of these consolidated financial statements.
F-3
Consolidated Statements of Operations and Comprehensive Income (Loss)
(in thousands, except share and per share amounts)
|
|
|
Fiscal Year Ended |
|
|||||||||
|
|
|
December 31, |
|
|
January 1, |
|
|
January 3, |
|
|||
|
|
|
2017 |
|
|
2017 |
|
|
2016 |
|
|||
|
Revenues: |
|
|
|
|
|
|
|
|
|
|
|
|
|
Revenue restaurant sales |
|
$ |
313,967 |
|
|
$ |
288,134 |
|
|
$ |
271,498 |
|
|
Other revenue |
|
|
392 |
|
|
|
162 |
|
|
|
136 |
|
|
Total revenues |
|
|
314,359 |
|
|
|
288,296 |
|
|
|
271,634 |
|
|
Restaurant operating costs: |
|
|
|
|
|
|
|
|
|
|
|
|
|
Food and beverage costs |
|
|
89,664 |
|
|
|
82,145 |
|
|
|
80,062 |
|
|
Compensation and benefit costs |
|
|
75,173 |
|
|
|
66,376 |
|
|
|
60,224 |
|
|
Occupancy and other operating expenses (excluding depreciation and amortization) |
|
|
61,320 |
|
|
|
54,001 |
|
|
|
46,153 |
|
|
Total restaurant operating costs |
|
|
226,157 |
|
|
|
202,522 |
|
|
|
186,439 |
|
|
Marketing and advertising costs |
|
|
8,069 |
|
|
|
7,132 |
|
|
|
6,618 |
|
|
General and administrative costs |
|
|
23,321 |
|
|
|
20,576 |
|
|
|
32,566 |
|
|
Pre-opening costs |
|
|
3,773 |
|
|
|
3,580 |
|
|
|
4,858 |
|
|
Loss on extinguishment of debt |
|
|
— |
|
|
|
— |
|
|
|
5,991 |
|
|
Non-cash impairment charges |
|
|
4,188 |
|
|
|
320 |
|
|
|
— |
|
|
Depreciation and amortization |
|
|
19,037 |
|
|
|
15,729 |
|
|
|
12,471 |
|
|
Other operating (income) expense, net |
|
|
330 |
|
|
|
21 |
|
|
|
(291 |
) |
|
Total costs and expenses |
|
|
284,875 |
|
|
|
249,880 |
|
|
|
248,652 |
|
|
Income from operations |
|
|
29,484 |
|
|
|
38,416 |
|
|
|
22,982 |
|
|
Other income (expense): |
|
|
|
|
|
|
|
|
|
|
|
|
|
Interest expense, net of capitalized interest |
|
|
(4,984 |
) |
|
|
(4,387 |
) |
|
|
(9,975 |
) |
|
Interest income |
|
|
2,386 |
|
|
|
2,208 |
|
|
|
856 |
|
|
Other income (expense), net |
|
|
49 |
|
|
|
(18 |
) |
|
|
(34 |
) |
|
Total other income (expense), net |
|
|
(2,549 |
) |
|
|
(2,197 |
) |
|
|
(9,153 |
) |
|
Income before income taxes |
|
|
26,935 |
|
|
|
36,219 |
|
|
|
13,829 |
|
|
Income tax expense (benefit) |
|
|
(1,470 |
) |
|
|
11,957 |
|
|
|
(14,168 |
) |
|
Net income |
|
|
28,405 |
|
|
|
24,262 |
|
|
|
27,997 |
|
|
Less: Net income (loss) attributable to noncontrolling interest |
|
|
(384 |
) |
|
|
(175 |
) |
|
|
132 |
|
|
Net income attributable to Fogo de Chão, Inc. |
|
$ |
28,789 |
|
|
$ |
24,437 |
|
|
$ |
27,865 |
|
|
Net income |
|
$ |
28,405 |
|
|
$ |
24,262 |
|
|
$ |
27,997 |
|
|
Other comprehensive income (loss): |
|
|
|
|
|
|
|
|
|
|
|
|
|
Currency translation adjustment |
|
|
(1,065 |
) |
|
|
14,261 |
|
|
|
(29,888 |
) |
|
Total other comprehensive income (loss) |
|
$ |
(1,065 |
) |
|
$ |
14,261 |
|
|
$ |
(29,888 |
) |
|
Comprehensive income |
|
|
27,340 |
|
|
|
38,523 |
|
|
|
(1,891 |
) |
|
Less: Comprehensive loss attributable to noncontrolling interest |
|
|
(241 |
) |
|
|
(616 |
) |
|
|
(11 |
) |
|
Comprehensive income (loss) attributable to Fogo de Chão, Inc. |
|
$ |
27,581 |
|
|
$ |
39,139 |
|
|
$ |
(1,880 |
) |
|
Earnings per common share attributable to Fogo de Chão, Inc.: |
|
|
|
|
|
|
|
|
|
|
|
|
|
Basic |
|
$ |
1.02 |
|
|
$ |
0.87 |
|
|
$ |
1.09 |
|
|
Diluted |
|
$ |
1.00 |
|
|
$ |
0.85 |
|
|
$ |
1.06 |
|
|
Weighted average common shares outstanding: |
|
|
|
|
|
|
|
|
|
|
|
|
|
Basic |
|
|
28,227,747 |
|
|
|
28,119,196 |
|
|
|
25,519,312 |
|
|
Diluted |
|
|
28,802,819 |
|
|
|
28,822,616 |
|
|
|
26,324,115 |
|
The accompanying notes are an integral part of these consolidated financial statements.
F-4
Consolidated Statement of Shareholders’ Equity
(in thousands, except share amounts)
|
|
|
|
|
|
|
|
|
|
|
Additional |
|
|
|
|
|
|
Accumulated Other |
|
|
Fogo de Chão, Inc. |
|
|
|
|
|
|
|
|
|
|||
|
|
|
Common Stock |
|
|
Paid-In |
|
|
Accumulated |
|
|
Comprehensive |
|
|
Shareholders' |
|
|
Noncontrolling |
|
|
Total |
|
|||||||||||
|
|
|
Shares |
|
|
Amount |
|
|
Capital |
|
|
Earnings |
|
|
Loss |
|
|
Equity |
|
|
Interests |
|
|
Equity |
|
||||||||
|
December 28, 2014 |
|
|
22,813,378 |
|
|
$ |
228 |
|
|
$ |
175,987 |
|
|
$ |
7,586 |
|
|
$ |
(29,720 |
) |
|
$ |
154,081 |
|
|
$ |
1,378 |
|
|
$ |
155,459 |
|
|
Net income |
|
|
— |
|
|
|
— |
|
|
|
— |
|
|
|
27,865 |
|
|
|
— |
|
|
|
27,865 |
|
|
|
132 |
|
|
|
27,997 |
|
|
Restricted shares vested |
|
|
154,684 |
|
|
|
2 |
|
|
|
(2 |
) |
|
|
— |
|
|
|
— |
|
|
|
— |
|
|
|
— |
|
|
|
— |
|
|
Issuance of common stock |
|
|
27,876 |
|
|
|
— |
|
|
|
301 |
|
|
|
— |
|
|
|
— |
|
|
|
301 |
|
|
|
— |
|
|
|
301 |
|
|
Issuance of common stock in connection with IPO, net of transaction costs |
|
|
5,073,528 |
|
|
|
51 |
|
|
|
91,266 |
|
|
|
— |
|
|
|
— |
|
|
|
91,317 |
|
|
|
— |
|
|
|
91,317 |
|
|
Share-based compensation |
|
|
— |
|
|
|
— |
|
|
|
6,792 |
|
|
|
— |
|
|
|
— |
|
|
|
6,792 |
|
|
|
— |
|
|
|
6,792 |
|
|
Currency translation adjustment |
|
|
— |
|
|
|
— |
|
|
|
— |
|
|
|
— |
|
|
|
(29,745 |
) |
|
|
(29,745 |
) |
|
|
(143 |
) |
|
|
(29,888 |
) |
|
Contributions from noncontrolling interests |
|
|
— |
|
|
|
— |
|
|
|
— |
|
|
|
— |
|
|
|
— |
|
|
|
— |
|
|
|
1,270 |
|
|
|
1,270 |
|
|
Distributions to noncontrolling interests |
|
|
— |
|
|
|
— |
|
|
|
— |
|
|
|
— |
|
|
|
— |
|
|
|
— |
|
|
|
(694 |
) |
|
|
(694 |
) |
|
January 3, 2016 |
|
|
28,069,466 |
|
|
$ |
281 |
|
|
$ |
274,344 |
|
|
$ |
35,451 |
|
|
$ |
(59,465 |
) |
|
$ |
250,611 |
|
|
$ |
1,943 |
|
|
$ |
252,554 |
|
|
Net income (loss) |
|
|
— |
|
|
|
— |
|
|
|
— |
|
|
|
24,437 |
|
|
|
— |
|
|
|
24,437 |
|
|
|
(175 |
) |
|
|
24,262 |
|
|
Restricted shares vested |
|
|
129,697 |
|
|
|
1 |
|
|
|
— |
|
|
|
— |
|
|
|
— |
|
|
|
1 |
|
|
|
— |
|
|
|
1 |
|
|
Stock option exercise |
|
|
12,423 |
|
|
|
— |
|
|
|
101 |
|
|
|
— |
|
|
|
— |
|
|
|
101 |
|
|
|
— |
|
|
|
101 |
|
|
Share-based compensation |
|
|
— |
|
|
|
— |
|
|
|
792 |
|
|
|
— |
|
|
|
— |
|
|
|
792 |
|
|
|
— |
|
|
|
792 |
|
|
Currency translation adjustment |
|
|
— |
|
|
|
— |
|
|
|
— |
|
|
|
— |
|
|
|
14,702 |
|
|
|
14,702 |
|
|
|
(441 |
) |
|
|
14,261 |
|
|
Contributions from noncontrolling interests |
|
|
— |
|
|
|
— |
|
|
|
— |
|
|
|
— |
|
|
|
— |
|
|
|
— |
|
|
|
1,825 |
|
|
|
1,825 |
|
|
Distributions to noncontrolling interests |
|
|
— |
|
|
|
— |
|
|
|
— |
|
|
|
— |
|
|
|
— |
|
|
|
— |
|
|
|
(937 |
) |
|
|
(937 |
) |
|
January 1, 2017 |
|
|
28,211,586 |
|
|
$ |
282 |
|
|
$ |
275,237 |
|
|
$ |
59,888 |
|
|
$ |
(44,763 |
) |
|
$ |
290,644 |
|
|
$ |
2,215 |
|
|
$ |
292,859 |
|
|
Net income |
|
|
— |
|
|
|
— |
|
|
|
— |
|
|
|
28,789 |
|
|
|
— |
|
|
|
28,789 |
|
|
|
(384 |
) |
|
|
28,405 |
|
|
Restricted shares vested |
|
|
22,779 |
|
|
|
— |
|
|
|
— |
|
|
|
— |
|
|
|
— |
|
|
|
— |
|
|
|
— |
|
|
|
— |
|
|
Stock option exercise |
|
|
20,367 |
|
|
|
— |
|
|
|
219 |
|
|
|
— |
|
|
|
— |
|
|
|
219 |
|
|
|
— |
|
|
|
219 |
|
|
Share-based compensation |
|
|
— |
|
|
|
— |
|
|
|
565 |
|
|
|
— |
|
|
|
— |
|
|
|
565 |
|
|
|
— |
|
|
|
565 |
|
|
Currency translation adjustment |
|
|
— |
|
|
|
— |
|
|
|
— |
|
|
|
— |
|
|
|
(1,208 |
) |
|
|
(1,208 |
) |
|
|
143 |
|
|
|
(1,065 |
) |
|
Contributions from noncontrolling interests |
|
|
— |
|
|
|
— |
|
|
|
— |
|
|
|
— |
|
|
|
— |
|
|
|
— |
|
|
|
14 |
|
|
|
14 |
|
|
Distributions to noncontrolling interests |
|
|
— |
|
|
|
— |
|
|
|
— |
|
|
|
— |
|
|
|
— |
|
|
|
— |
|
|
|
(223 |
) |
|
|
(223 |
) |
|
December 31, 2017 |
|
|
28,254,732 |
|
|
$ |
282 |
|
|
$ |
276,021 |
|
|
$ |
88,677 |
|
|
$ |
(45,971 |
) |
|
$ |
319,009 |
|
|
$ |
1,765 |
|
|
$ |
320,774 |
|
The accompanying notes are an integral part of these consolidated financial statements.
F-5
Consolidated Statements of Cash Flows
(in thousands)
|
|
|
Fiscal Year Ended |
|
|||||||||
|
|
|
December 31, |
|
|
January 1, |
|
|
January 3, |
|
|||
|
|
|
2017 |
|
|
2017 |
|
|
2016 |
|
|||
|
Cash flows from operating activities: |
|
|
|
|
|
|
|
|
|
|
|
|
|
Net income |
|
$ |
28,405 |
|
|
$ |
24,262 |
|
|
$ |
27,997 |
|
|
Adjustments to reconcile net income to net cash flows provided by operating activities: |
|
|
|
|
|
|
|
|
|
|
|
|
|
Depreciation of property and equipment |
|
|
18,879 |
|
|
|
15,463 |
|
|
|
12,201 |
|
|
Amortization of definite-lived intangibles |
|
|
158 |
|
|
|
266 |
|
|
|
270 |
|
|
Amortization of favorable/unfavorable leases |
|
|
(165 |
) |
|
|
(188 |
) |
|
|
(185 |
) |
|
Amortization of debt issuance costs |
|
|
577 |
|
|
|
577 |
|
|
|
452 |
|
|
Amortization of original issue discount |
|
|
— |
|
|
|
— |
|
|
|
549 |
|
|
Loss on extinguishment of debt |
|
|
— |
|
|
|
— |
|
|
|
5,991 |
|
|
Deferred income taxes |
|
|
(4,939 |
) |
|
|
8,801 |
|
|
|
(16,305 |
) |
|
Share-based compensation expense |
|
|
565 |
|
|
|
792 |
|
|
|
6,792 |
|
|
Net (gain) loss on disposal of property and equipment |
|
|
366 |
|
|
|
205 |
|
|
|
55 |
|
|
Non-cash impairment charges |
|
|
4,188 |
|
|
|
320 |
|
|
|
— |
|
|
Changes in operating assets and liabilities: |
|
|
|
|
|
|
|
|
|
|
|
|
|
Accounts and other receivables |
|
|
(976 |
) |
|
|
2,492 |
|
|
|
(4,007 |
) |
|
Prepaid expenses and other assets |
|
|
(715 |
) |
|
|
(1,449 |
) |
|
|
124 |
|
|
Inventories |
|
|
(379 |
) |
|
|
201 |
|
|
|
123 |
|
|
Accounts payable and accrued expenses |
|
|
3,441 |
|
|
|
916 |
|
|
|
(803 |
) |
|
Income taxes payable, net of receivables/prepayments |
|
|
191 |
|
|
|
267 |
|
|
|
22 |
|
|
Accrued interest |
|
|
7 |
|
|
|
(28 |
) |
|
|
(3,525 |
) |
|
Deferred revenue |
|
|
1,044 |
|
|
|
1,120 |
|
|
|
406 |
|
|
Deferred rent and tenant allowance |
|
|
4,794 |
|
|
|
2,076 |
|
|
|
7,204 |
|
|
Net cash flows provided by operating activities |
|
|
55,441 |
|
|
|
56,093 |
|
|
|
37,361 |
|
|
Cash flows from investing activities: |
|
|
|
|
|
|
|
|
|
|
|
|
|
Purchase liquor licenses |
|
|
(83 |
) |
|
|
(442 |
) |
|
|
(251 |
) |
|
Capital expenditures |
|
|
(35,866 |
) |
|
|
(37,911 |
) |
|
|
(35,172 |
) |
|
Proceeds from sale of assets |
|
|
80 |
|
|
|
— |
|
|
|
— |
|
|
Net cash flows used in investing activities |
|
|
(35,869 |
) |
|
|
(38,353 |
) |
|
|
(35,423 |
) |
|
Cash flows from financing activities: |
|
|
|
|
|
|
|
|
|
|
|
|
|
Borrowings, 2015 Credit Facility |
|
|
— |
|
|
|
— |
|
|
|
165,000 |
|
|
Repayments, 2015 Credit Facility |
|
|
(12,000 |
) |
|
|
(15,000 |
) |
|
|
— |
|
|
Repayments on term loans, 2012 Credit Facility |
|
|
— |
|
|
|
— |
|
|
|
(3,349 |
) |
|
Payoff on term loans, 2012 Credit Facility |
|
|
— |
|
|
|
— |
|
|
|
(245,085 |
) |
|
Pre-payment premium and fees, payoff 2012 Credit Facility |
|
|
— |
|
|
|
— |
|
|
|
(326 |
) |
|
Debt issuance costs |
|
|
— |
|
|
|
— |
|
|
|
(2,884 |
) |
|
Proceeds from issuance of common stock |
|
|
— |
|
|
|
— |
|
|
|
301 |
|
|
Proceeds from issuance of common stock in initial public offering, net of underwriter fees |
|
|
— |
|
|
|
— |
|
|
|
94,368 |
|
|
Payment of initial public offering costs |
|
|
— |
|
|
|
— |
|
|
|
(2,767 |
) |
|
Proceeds from stock option exercises |
|
|
219 |
|
|
|
101 |
|
|
|
— |
|
|
Contributions from noncontrolling interest |
|
|
14 |
|
|
|
1,825 |
|
|
|
1,270 |
|
|
Distributions to noncontrolling interest |
|
|
(223 |
) |
|
|
(937 |
) |
|
|
(694 |
) |
|
Net cash flows (used in) provided by financing activities |
|
|
(11,990 |
) |
|
|
(14,011 |
) |
|
|
5,834 |
|
|
Effect of foreign exchange rates on cash and cash equivalents |
|
|
(515 |
) |
|
|
2,627 |
|
|
|
(2,240 |
) |
|
Net increase in cash and cash equivalents |
|
|
7,067 |
|
|
|
6,356 |
|
|
|
5,532 |
|
|
Cash and cash equivalents at beginning of period |
|
|
31,275 |
|
|
|
24,919 |
|
|
|
19,387 |
|
F-6
|
|
$ |
38,342 |
|
|
$ |
31,275 |
|
|
$ |
24,919 |
|
|
|
Supplemental disclosure of cash flow information: |
|
|
|
|
|
|
|
|
|
|
|
|
|
Cash paid during the period: |
|
|
|
|
|
|
|
|
|
|
|
|
|
Interest paid, net of amounts capitalized |
|
$ |
4,403 |
|
|
$ |
3,785 |
|
|
$ |
12,393 |
|
|
Income taxes, net of refunds |
|
$ |
2,939 |
|
|
$ |
2,895 |
|
|
$ |
1,833 |
|
|
Non-cash activities: |
|
|
|
|
|
|
|
|
|
|
|
|
|
Capital expenditures included in accounts payable and accrued expenses |
|
$ |
7,103 |
|
|
$ |
4,807 |
|
|
$ |
5,989 |
|
The accompanying notes are an integral part of these consolidated financial statements.
F-7
Notes to Consolidated Financial Statements
(in thousands, except share and per share amounts)
1. Description of Business
Fogo de Chão, Inc. and subsidiaries (the “Company”) operates upscale Brazilian churrascaria steakhouses under the brand of Fogo de Chão. As of December 31, 2017, the Company operated, through its subsidiaries, 38 restaurants in the United States (including one restaurant in the US Territory of Puerto Rico), nine restaurants in Brazil, two joint venture restaurants in Mexico and one joint venture restaurant in the Middle East.
Fogo de Chão, Inc. is a holding company with no assets or operations of its own. The Company owns 100% of Brasa (Purchaser) Inc. (“Brasa Purchaser”), which owns Brasa (Holdings) Inc. (“Brasa Holdings”). Brasa Holdings owns Fogo de Chão (Holdings) Inc. (“Fogo Holdings”), which owns the Company’s domestic and foreign operating subsidiaries.
On June 24, 2015, the Company completed an initial public offering (the "IPO") of 5,073,528 shares of common stock at a price to the public of $20.00 per share, which included 661,764 shares sold to the underwriters pursuant to their option to purchase additional shares. After underwriters’ discounts and commissions and offering costs, the Company received net proceeds from the offering of approximately $91,317. Proceeds from the offering were used to repay borrowings under the Company’s credit facility (see Note 10).
2. Basis of Presentation
Merger Agreement with Rhône
On February 20, 2018, the Company entered into an Agreement and Plan of Merger (the “Merger Agreement”) among Prime Cut Intermediate Holdings Inc., a Delaware corporation (“Parent”) and an investment entity affiliated with Rhône Capital V L.P. (“Rhône”) and Prime Cut Merger Sub Inc., a Delaware corporation and a wholly owned subsidiary of Parent (“Merger Subsidiary”), pursuant to which, among other things and subject to the satisfaction or waiver of specified conditions, Merger Subsidiary will merge with and into the Company, which will survive as a wholly owned subsidiary of Parent. Parent will finance the Merger with a combination of debt and equity financing.
At the effective time of the Merger,
|
|
• |
each share of the Company’s common stock issued and outstanding immediately prior to the Effective Time (other than dissenting shares) will be converted into the right to receive $15.75 in cash, without interest; |
|
|
• |
each Company outstanding stock option will be cancelled, with the holder of such stock option becoming entitled to receive an amount in cash equal to (i) the excess, if any, of (a) $15.75 minus (b) the exercise price per share of common stock subject to such stock option, multiplied by (ii) the number of shares of common stock subject to such stock option; and |
|
|
• |
the restrictions on each Company outstanding restricted stock will lapse, with the holder of such performance-based restricted stock becoming entitled to receive an amount in cash equal to (i) $15.75 multiplied by (ii) the number of shares of common stock subject to such restricted stock. |
Following execution of the Merger Agreement, certain affiliates and co-investors of Thomas H. Lee Partners, L.P. and certain directors and executive officers of the Company, who collectively hold approximately 61.56% of the voting power of the outstanding common stock of the Company, executed and delivered to the Company a written consent adopting the Merger Agreement. The Merger cannot be consummated until the passing of 20 calendar days from the date on which the Company mails to the Company’s stockholders an information statement describing the Merger Agreement, the Merger and the other transactions contemplated by the Merger Agreement on Schedule 14C under the Securities Exchange Act of 1934, as amended. Following delivery of the written consent, pursuant to the terms of the Merger Agreement, the Company may not engage in any further discussions or solicitations regarding the potential acquisition of the Company by any third party, and the Company has no ability to terminate the Merger Agreement in order to enter into an alternative transaction.
The completion of the Merger is subject to customary conditions, including, without limitation, (1) the absence of any restraining order, preliminary or permanent injunction or other court order or other legal restraint or prohibition preventing the consummation of the Merger, (2) the expiration or termination of the applicable waiting period under the Hart-Scott-Rodino Antitrust Improvements Act of 1976, as amended, (3) subject to certain qualifications, the accuracy of representations and warranties of the
F-8
Company, Parent and Merger Subsidiary, and (4) the performance in all material respects of the obligations of the Company, Parent and Merger Subsidiary, respectively. The Merger is not subject to a financing condition. Completion of the Merger is expected early in the second fiscal quarter of 2018.
Basis of Presentation
The consolidated financial statements represent the financial information of Fogo de Chão, Inc. and its subsidiaries, as well as consolidated joint ventures for which the Company has determined that it is the primary beneficiary. The financial statements have been prepared in conformity with generally accepted accounting principles in the United States of America (“GAAP”). In connection with the closing of the IPO, the Company effected a stock split pursuant to which each share held by the holder of common stock was reclassified into 25.4588 shares. All share and per share data have been retroactively restated in the accompanying financial statements, and in the accompanying notes which are an integral part of the financial statements, to give effect to the stock split.
Out of Period Adjustment
During the third quarter of Fiscal 2017, the Company identified and corrected an immaterial error related to the omission of two restaurants’ tax basis from the 2012 opening balance sheet deferred tax liability and goodwill balances. This adjustment resulted in a decrease to the Company’s goodwill balance and a decrease to the deferred tax liability in the amount of $2,415. The cumulative effect of the remaining tax basis differences as of October 1, 2017, totaling $197 and arising in Fiscal years 2013 and 2014, was recorded as a reduction to the deferred tax liability, and a reduction to income tax expense, during the third quarter of Fiscal 2017 as a discrete item.
Based on an analysis of Accounting Standards Codification (“ASC”) 250 - “Accounting Changes and Error Corrections” (“ASC 250”), Staff Accounting Bulletin 99 - “Materiality” (“SAB 99”) and Staff Accounting Bulletin 108 - Considering the Effects of Prior Year Misstatements when Quantifying Misstatements in Current Year Financial Statements (“SAB 108”), the Company determined that this error was not material to any of the Company’s prior annual and quarterly consolidated financial statements based upon quantitative and qualitative factors, and therefore, amendments of previously filed reports were not required.
Principles of Consolidation
The accompanying consolidated financial statements include the assets, liabilities and results of operations of the Company, as well as consolidated joint ventures for which the Company has determined that it is the primary beneficiary. All intercompany balances and transactions have been eliminated in the consolidated financial statements.
Accounting Year
The Company uses a 52/53 week fiscal year convention whereby its fiscal year ends each year on the Sunday that is closest to December 31 of that year. Each fiscal year generally is comprised of four 13-week fiscal quarters, although in the years with 53 weeks the fourth quarter represents a 14-week period. References to Fiscal 2017 relate to the Company’s 52-week fiscal year ended December 31, 2017. References to Fiscal 2016 relate to the Company’s 52-week fiscal year ended January 1, 2017. References to Fiscal 2015 relate to the Company’s 53-week fiscal year ended January 3, 2016.
3. Summary of Significant Accounting Policies
Use of Estimates
The preparation of financial statements in conformity with GAAP requires management to make estimates and assumptions, such as the valuation of long-lived, definite and indefinite-lived assets, estimated useful lives of assets, the reasonably assured lease terms of operating leases, valuation of the workers’ compensation and Company-sponsored employee health insurance program liabilities, the fair value of share-based compensation, and deferred tax valuation allowances, that affect the reported amounts of assets and liabilities and disclosure of contingent assets and liabilities at the date of the financial statements and the reported amounts of revenue and expenses during the reporting period. Actual results could differ from those estimates.
Variable Interest Entities (“VIEs”)
The Company consolidates VIEs in which the Company is deemed to have a controlling interest as a result of the Company having both the power to direct the activities that significantly impact the entity’s economic performance and the right to receive the benefits that could potentially be significant to the VIE. If the Company has a controlling interest in a VIE, the assets, liabilities, and results of the operations of the variable interest entity are included in the consolidated financial statements.
F-9
The Company considers all highly liquid investment instruments purchased with an original maturity of three months or less to be cash equivalents. Cash consists of deposits held at major banks that at times exceed federally insured limits or in international jurisdictions where either insurance is not provided or in amounts that exceed amounts guaranteed by the local government or other governmental agencies, and cash on hand in restaurant locations. The Company also maintains certificates of deposit denominated in Brazilian reais, which throughout their terms can be put to the issuer within three months or less from the date of issuance, and with no early withdrawal penalty charges, are considered cash equivalents. The Company has not incurred losses related to any deposits in excess of the FDIC insurance amount and believes no significant concentration of credit risk exists with respect to cash investments. Financial instruments, which potentially subject the Company to concentrations of credit risk, consist of cash and cash equivalents. Management periodically evaluates the credit worthiness of financial institutions, and maintains cash and cash equivalent accounts only with major financial institutions thereby minimizing exposure for deposits in excess of federally insured amounts. Management believes that credit risk associated with cash and cash equivalents is remote.
Accounts Receivable
Accounts receivable consist of balances receivable from credit card companies in the normal course of business and generally are liquidated within 30 days or less. As such, no allowance for doubtful accounts is considered to be necessary.
Inventories
Inventories consists of food and beverages and are recorded at the lower of cost or net realizable value. Cost is determined by the first-in first-out method. Any unusable or spoiled inventory is written off when identified.
Prepaid Rent
Non-current prepaid rent consists of amounts paid in advance relating to restaurant leases executed in Brazil during 2010 and 2012 that expire in 2026 and 2022, respectively, and amounts attributable to restaurant leases in Mexico, which were entered into in 2014 and 2016 that expire in 2024 and 2026, respectively. The current portion of prepaid rent is included in prepaid expenses and other current assets in the consolidated balance sheets.
Property and Equipment, Net
Property and equipment is stated at cost to acquire less accumulated depreciation. Depreciation is calculated using the straight-line method over the estimated useful lives of the related assets. Leasehold improvements are amortized using the straight-line method over the shorter of the lease term or the estimated useful life of the asset.
Estimated useful lives are generally as follows:
|
|
Estimated Useful Live |
|
Buildings |
40 years |
|
Leasehold improvements |
5 - 20 years |
|
Furniture, fixtures and equipment |
3 - 15 years |
|
Automobiles |
5 years |
Expenditures for maintenance, repairs and betterments that do not enhance the value or increase the estimated useful life of the assets are expensed as incurred and included in restaurant operating costs. Expenditures for betterments and major renewals that significantly enhance the value and increase the estimated useful life of the assets are capitalized. The cost of assets sold or retired and the related amounts of accumulated depreciation are eliminated from the accounts in the year of disposal and the resulting gains or losses are included in operations.
Capitalized Interest
Direct and certain related indirect costs of construction, including interest, are capitalized in conjunction with construction and development projects. These costs are included in property and equipment and are amortized over the life of the related building and leasehold interest. The Company capitalized $143, $107 and $123 of interest during Fiscal 2017, Fiscal 2016 and Fiscal 2015, respectively.
F-10
Debt issuance costs are amortized to interest expense over the term of the debt using the effective interest method for term debt and the straight-line method for revolving debt over the terms of the related instruments. In April 2015, the FASB issued ASU 2015-03, “Simplifying the Presentation of Debt Issuance Costs,” which changes the presentation of debt issuance costs in financial statements, requiring an entity to present such costs in the balance sheet as a direct deduction from the carrying amount of long-term debt, consistent with debt discounts or premiums. In August 2015, the FASB issued ASU 2015-15, which clarifies the treatment of debt issuance costs attributable to line-of-credit arrangements after the adoption of ASU 2015-03. In particular, ASU 2015-15 clarifies that the SEC staff would not object to an entity deferring and presenting debt issuance costs related to a line-of-credit arrangement as an asset and subsequently amortizing the deferred debt issuance costs ratably over the term of such arrangement, regardless of whether there are any outstanding borrowings on the line-of-credit arrangement. ASU 2015-03 and ASU 2015-15 are effective for financial statements issued for fiscal years beginning after December 15, 2015, and interim periods within those fiscal years. The Company adopted ASU 2015-03 and ASU 2015-15 as of April 3, 2016. The Company’s financial statement presentation was consistent with the guidance in ASU 2015-15. As a result, there was no impact to the Company’s consolidated balance sheet upon adoption. Unamortized debt issuance costs as of December 31, 2017 and January 1, 2017, which are attributable to the Company’s 2015 Credit Facility (revolving line-of-credit), are included in other assets (noncurrent) in the consolidated balance sheet.
Impairment of Long-Lived Assets
The Company reviews property and equipment and definite-lived intangible assets for impairment when events or circumstances indicate these assets may not be recoverable. Factors considered include, significant underperformance relative to expected historical or projected future operating results, significant changes in the manner of use of the acquired assets or the strategy for the overall business and significant negative industry or economic trends. The recoverability is assessed by comparing the carrying value of the asset to the undiscounted cash flows expected to be generated by the asset. If impairment exists, the amount of impairment is measured as the excess of the carrying amount over the estimated fair value, as determined by each location’s projected future discounted cash flows. This assessment process requires the use of estimates and assumptions regarding future cash flows and estimated useful lives, which are subject to a significant degree of judgment. If these assumptions change in the future, the Company may be required to record impairment charges for these assets. During Fiscal 2017, the Company recognized a $4,188 non-cash impairment charge related to the reduction in the carrying value of an underperforming restaurant in the United States. The Company continues to evaluate the restaurant’s operating performance and its options. A closure of this restaurant could result in a material charge in the period in which the Company ceases operations. During Fiscal 2016, the Company recognized a $320 non-cash impairment charge related to the reduction in the carrying value of an underperforming restaurant in Brazil. The lease for this underperforming restaurant in Brazil expired in September 2017 and was not renewed. The Company did not record any impairment related to long-lived assets in any of the other periods presented.
Goodwill
Goodwill represents the excess of the purchase price of the acquired business over the fair value of the assets acquired and liabilities assumed resulting from the acquisition. Goodwill is not amortized. Goodwill is tested annually for impairment during the fourth quarter, or more frequently should an event occur or circumstances indicate that the carrying amount may be impaired. Such events or circumstances may be a significant change in business climate, economic and industry trends, legal factors, negative operating performance indicators, significant competition, changes in strategy or disposition of a reporting unit or a portion thereof. The Company has identified two reporting units, United States and Brazil, based on the geography of the Company’s operations to which goodwill is attributable.
The impairment evaluation for goodwill is conducted annually using a two-step process. In the first step, the fair value of each reporting unit is compared with the carrying amount of the reporting unit, including goodwill. The estimated fair value of the reporting unit is determined on the basis of discounted future cash flows. If the estimated fair value of the reporting unit is less than the carrying amount of the reporting unit, then a second step must be completed in order to determine the amount of the goodwill impairment that should be recorded. In the second step, the implied fair value of the reporting unit’s goodwill is determined by allocating the reporting unit’s fair value to all of its assets and liabilities other than goodwill in a manner similar to a purchase price allocation. The resulting implied fair value of the goodwill that results from the application of this second step is then compared to the carrying amount of the goodwill and an impairment charge is recorded for any excess or carrying value over fair value. No impairment to goodwill was recorded during any of the periods presented.
F-11
Indefinite-lived intangible assets are not amortized, but are tested for impairment annually during the fourth quarter, or more frequently if circumstances indicate potential impairment, through a comparison of fair value to its carrying amount. The estimated fair value is determined on the basis of discounted future cash flows using the relief from royalty method. If the estimated fair value is less than the carrying amount of the indefinite-lived intangible asset, then an impairment charge is recorded to reduce the asset to its estimated fair value. The indefinite-lived intangible assets relate to the assigned value of the Fogo de Chão trade name.
Definite-lived intangible assets consist of non-compete agreements. The non-compete agreements are amortized over 5 years, which is the term of the agreements, and are measured for impairment when events or circumstances indicate the carrying value may be impaired in the same manner as long-lived assets.
The Company did not record any impairment related to intangible assets in any of the periods presented.
Liquor Licenses
The costs of obtaining non-transferable liquor licenses directly issued by local government agencies for nominal fees are expensed as incurred. The costs of purchasing transferable liquor licenses through open markets in jurisdictions with a limited number of authorized liquor licenses are capitalized as indefinite-lived intangible assets and are reviewed for impairment annually or whenever events or changes in circumstances indicate that the carrying amount may not be recoverable. If the carrying amount is not recoverable, an impairment charge is recorded for the excess of the carrying amount over the fair value. Fair value is determined based on prices in the open market for licenses in same or similar jurisdictions. No impairments were recorded during any of the periods presented. Annual liquor license renewal fees are expensed as incurred.
Fair Value
Fair value is defined as the price that would be received to sell an asset or price paid to transfer a liability in an orderly transaction between market participants at the measurement date. Authoritative guidance for fair value measurements establishes a hierarchy that prioritizes the inputs to valuation models based upon the degree to which they are observable. The three levels of the fair value measurement hierarchy are as follows:
Level 1: Inputs represent quoted prices in active markets for identical assets or liabilities at the measurement date.
Level 2: Inputs (other than quoted prices included in Level 1) that are either directly or indirectly observable or the asset or liability through correlation with market data at the measurement date for the duration of the instrument’s anticipated life.
Level 3: Inputs are unobservable and therefore reflect management’s best estimate of the assumptions that market participants would use in pricing the asset or liability.
As of December 31, 2017 and January 1, 2017, the fair value of cash and cash equivalents, accounts receivable, accounts payable, accrued expenses, and other current liabilities approximated their carrying value due to their short-term nature. The carrying amounts of the long-term debt approximate fair value as interest rates vary with the market interest rates and negotiated terms and conditions are consistent with current market terms (Level 2).
Revenue
Revenue from restaurant sales is recognized when food and beverage products are sold and is presented net of employee meals and complimentary meals. Proceeds from the sale of gift cards that do not have expiration dates are recorded as deferred revenue at the time of the sale and recognized as revenue when the gift card is redeemed by the holder. The portion of gift cards sold which are never redeemed is commonly referred to as gift card breakage. The Company recognizes gift card breakage revenue for gift cards when the likelihood of redemption becomes remote and the Company determines there is no legal obligation to remit the value of the unredeemed gift cards to governmental agencies. The Company estimates the gift card breakage rate based upon the pattern of historical redemptions. The Company recognized $164, $162 and $136 in gift card breakage revenue during Fiscal 2017, Fiscal 2016 and Fiscal 2015, respectively.
F-12
During the fourth quarter of Fiscal 2015, the Company began selling gift cards through a non-related third party. Proceeds from the sale of gift cards that do not have expiration dates are recorded as deferred revenue at the time of the sale and recognized as revenue when the gift card is redeemed by the holder. Commissions related to gift cards sold by third parties are initially deferred and subsequently recognized in earnings as a component of other restaurant operating expense, in the same pattern as the revenue related to the gift card is recognized. Deferred costs are included in prepaid expenses and other current assets in the consolidated balance sheet. The amount of deferred costs at December 31, 2017 and at January 1, 2017, attributable to gift cards sold by third parties, was immaterial.
Sales Taxes
Revenue is presented net of sales taxes. The sales tax payable obligation is included in accrued expenses until the taxes are remitted to the appropriate taxing authorities.
Operating Leases and Deferred Rent
The Company operates the majority of its restaurants in leased premises. The Company records the minimum base rents including option periods which in the judgement of management are reasonably assured of renewal. For purposes of calculating straight-line rents, the lease term commences on the date the Company obtains control of the property, which is normally when the property is ready for normal tenant improvements (build-out period). The difference between rent expense and rent paid is recorded as a deferred rent liability. Allowances for tenant improvements are included in the deferred rent liability and recognized over the life of the lease by reducing rent expense. Favorable lease assets and unfavorable lease liabilities, representing the difference between the market rates in effect for acquired leases compared to the various lease payments on individual operating leases, are amortized on a straight-line basis to rent expense over the lease term remaining at the time of the acquisition. Favorable leases are included in other assets (noncurrent) in the consolidated balance sheets. Unfavorable lease liabilities are included in other noncurrent liabilities in the consolidated balance sheets.
Contingent rent expense is recognized, and subsequently accrued, when it becomes probable that the Company will achieve restaurant sales above a specified target amount, evaluated on a per lease basis.
Advertising Costs
Advertising costs are expensed as incurred. Advertising costs were approximately $8,013, $7,084 and $6,685 for Fiscal 2017, Fiscal 2016 and Fiscal 2015, respectively.
Pre-Opening Costs
Pre-opening costs incurred with the opening of new restaurants are expensed as incurred. These costs include wages, benefits, travel and lodging for the training and opening management teams, and food, beverage and other restaurant operating expenses incurred prior to a restaurant opening for business including lease costs. In addition, preopening costs include marketing costs incurred prior to opening as well as meal expenses for entertaining guests as part of the restaurant opening.
Insurance Reserves
The Company is self-insured for certain losses related to workers’ compensation claims and Company-sponsored employee health insurance programs. The Company estimates the accrued liabilities for all self-insurance programs at the end of each reporting period. The Company engages a third party actuary to assist management with estimating its liability for its workers’ compensation claims based on discounted cash flows. The liability calculated based on discounted cash flow estimates was $1,923 and $1,747 as of December 31, 2017 and January 1, 2017, respectively, compared to an undiscounted liability of approximately $2,100 and $1,900, respectively. The estimated current portion of the accrued liability attributable to workers’ compensation is $707 and $649 as of December 31, 2017 and January 1, 2017, respectively, and is included in accounts payable and accrued expenses in the consolidated balance sheet. The estimated non-current portion is included in other non-current liabilities. The estimated liability for all other self-insurance programs is not discounted and is based on a number of assumptions and factors, including historical trends and actuarial assumptions. The accrued liability attributable to these other self-insurance programs is $383 and $347 as of December 31, 2017 and January 1, 2017, respectively, and is included in accounts payable and accrued expenses in the consolidated balance sheets.
To limit exposure to losses, the Company maintains stop-loss coverage through third-party insurers with a deductible of $250 per claim.
F-13
The Company accounts for income taxes in accordance with ASC Topic 740, “Accounting for Income Taxes,” which requires an asset and liability approach for financial accounting and reporting of income taxes. Under ASC Topic 740, income taxes are accounted for based upon the future tax consequences attributable to differences between the financial statement carrying amounts of existing assets and liabilities and their respective tax basis and operating loss and tax credit carry-forwards. The Company estimates its annual effective tax rate at each interim period based on the facts and circumstances available at that time while the actual effective tax rate is calculated at year-end. The Company is subject to income taxes in the US, Puerto Rico, Brazil, Netherlands and Mexico. In evaluating its ability to recover its deferred tax assets, the Company considers all available positive and negative evidence, including scheduled reversals of deferred tax liabilities, projected future taxable income, tax planning strategies and recent financial operations. In projecting future taxable income, the Company begins with historical results adjusted for the results of discontinued operations and changes in accounting policies and incorporates assumptions including the amount of future state, federal and foreign pretax operating income, the reversal of temporary differences, and the implementation of feasible and prudent tax planning strategies. These assumptions require significant judgment about the forecasts of future taxable income and are consistent with the plans and estimates the Company uses to manage its underlying businesses. In evaluating the objective evidence that historical results provide, the Company considers three years of cumulative operating income (loss).
The Company recognizes tax liabilities in accordance with ASC 740, and adjusts those liabilities when judgments change as a result of evaluation of new information not previously available. Significant judgment is required in assessing, among other things, the timing and amounts of deductible and taxable items. Due to the complexity of some of these uncertainties, the ultimate resolution may result in payment that is materially different from the Company’s current estimate of its tax liabilities. These differences are reflected as increases or decreases to income tax expense in the period in which they are determined.
Income taxes relate to the Company’s domestic federal income tax, Puerto Rico income tax, tax in the Company’s foreign subsidiary in Brazil, tax in the Company’s consolidated joint venture in Mexico, tax in the Company’s foreign subsidiary in the Netherlands, margin tax and state tax in certain US jurisdictions. The provision for income taxes for the foreign subsidiary in Brazil is calculated under the presumed profits method. Under the presumed profits method, the tax authority applies a percentage of the foreign subsidiary’s revenue as the profit margin, and taxes the presumed profits at the current federal rate in Brazil.
The Company applies the authoritative guidance related to uncertainty in income taxes. The Company has concluded that there were no uncertain tax positions identified during its analysis. The Company recognizes interest and penalties, if any, related to uncertain tax positions in income tax expense.
F-14
On December 22, 2017, new tax reform legislation, commonly referred to as the Tax Cuts and Jobs Act (“Tax Act” or “TCJA”) was signed into law effective January 1, 2018. In the fourth quarter of Fiscal 2017, the Company recorded a provision to income taxes for its preliminary assessment of the impact of the Tax Act. Pursuant to Staff Accounting Bulletin No. 118 (“SAB 118”), the Company recorded provisional amounts related to estimated calculations based on information available as of December 31, 2017. As further regulatory guidance is issued by the applicable taxing authorities, as accounting treatment is clarified, as the Company performs additional analysis on the application of the law, and as the Company refines its estimates in calculating the effect, the Company’s final analysis may be different from current provisional amounts. Any changes to the provisional amounts will be recognized in the period completed which could materially affect the Company’s tax obligations and effective tax rate. Furthermore, there may be certain aspects of the Tax Act that will require the Company to adopt a new accounting policy, such as the section 951A GILTI tax provisions. The Company has not completed an analysis of the effect of these provisions and, therefore, has not elected an accounting policy for the effect of these provisions.
The Company had historically provided deferred taxes under ASC 740-30-25, formerly APB 23, for the presumed repatriation to the United States of earnings from the Company’s Brazilian subsidiaries. In June 2015, the Company asserted that the outside basis difference, including undistributed earnings of its Brazilian subsidiaries would be indefinitely reinvested in operations outside the United States. This was primarily driven by a reduction in debt service costs on a go-forward basis as a result of the IPO. The assertion was supported by future US cash projections and the Company’s intent to continue using foreign-generated cash to invest in foreign restaurants. As a result of the Tax Act, the Company’s outside basis difference in the foreign subsidiaries has changed. The Company is in the process of measuring the deferred tax liability that would be recorded were the Company to change its indefinite reinvestment assertion. As this analysis is incomplete, the Company is not currently able to provide a reasonable estimate for a deferred tax liability. Pursuant to SAB 118, the Company will continue to apply ASC 740 based on the provisions of the tax law in effect immediately prior to the enactment of the Tax Act, including the historical indefinite reinvestment assertion with respect to the outside basis differences.
Share-Based Compensation
The Company measures share-based awards granted to employees and directors based on the fair value of the award on the date of grant. The fair value of stock option awards is determined using the Black-Scholes option-pricing model. The fair value of restricted stock awards is the fair value of the Company’s common stock on the date the restricted stock is awarded.
The fair value of the share-based awards is recognized as an expense, net of forfeitures, over the requisite service period, which is generally the vesting period of the respective award. For awards with both service and performance conditions, the expense is recognized using the graded vesting method. For awards with only service conditions, the expense is recognized using the straight-line method.
In December 2017, the Company issued restricted stock designated as performance awards to the Company’s executive officers and certain senior management. These performance-based restricted shares were granted pursuant to the Company’s 2015 Omnibus Incentive Plan. The determination of the number of performance-based restricted shares that each individual may receive is subject to, and calculated by reference to, the achievement by the Company of goals measured by a range of targeted financial performance, as defined, and the individual’s continued employment through the end of the measurement period. The fair value of these performance awards is based on the fair value of the award on the date of grant. Compensation expense attributable to performance awards is recognized using the straight-line method. The amount of compensation expense recognized is based upon the estimated number of performance awards expected to be earned. This estimate is reassessed at each reporting period with an adjustment to the total amount of compensation expense to be recognized accordingly.
For liability-classified awards, compensation expense is recognized over the period during which services are rendered by the employee until completed. At the end of each financial reporting period prior to completion of the service, the fair value of these awards is re-measured using the then-current fair value of the Company’s common stock and updated assumption inputs in the Black-Scholes option-pricing model. The Company did not have any liability-classified awards outstanding as of December 31, 2017 or January 1, 2017.
The Company classifies share-based compensation expense in its consolidated statement of operations and comprehensive income (loss) in the same manner in which the award recipient’s payroll costs are classified or in which the award recipient’s service payments are classified.
F-15
In March 2016, the FASB issued ASU 2016-09, “Compensation-Stock Compensation (Topic 718): Improvements to Employee Share-Based Payment Accounting.” ASU 2016-09 requires among other things that all excess tax benefits and tax deficiencies (including tax benefits of dividends on share-based payment awards) to be recognized as income tax expense or benefit in the income statement. The tax effects of exercised or vested awards should be treated as discrete items in the reporting period in which they occur. An entity also should recognize excess tax benefits, and assess the need for a valuation allowance, regardless of whether the benefit reduces taxes payable in the current period. The ASU also requires excess tax benefits to be classified along with other income tax cash flows as an operating activity in the statement of cash flows. Additionally, the new guidance provides an accounting policy election to account for forfeitures as they occur. The Company adopted ASU 2016-09 during the first quarter of Fiscal 2016 and elected to change its accounting policy to account for forfeitures as they occur as provided under ASU 2016-09. The adoption of this guidance did not a have material impact on the Company’s consolidated financial statements.
Earnings (Loss) Per Share
Basic earnings (loss) per share is calculated by dividing net income (loss) attributable to Fogo de Chão, Inc. by the weighted-average number of shares of common stock outstanding during each period. Diluted earnings (loss) per share is calculated using net income (loss) attributable to Fogo de Chão, Inc. divided by diluted weighted-average shares of common stock outstanding during each period. Potentially dilutive securities include shares of common stock underlying stock options and restricted stock. Diluted earnings (loss) per share considers the impact of potentially dilutive securities, except in periods in which there is a loss, because the inclusion of the potential common shares would have an anti-dilutive effect.
In December 2017, the Company issued restricted stock designated as performance awards to the Company’s executive officers and certain senior management. The determination of the number of performance-based restricted shares that each individual may receive is subject to, and calculated by reference to, the achievement by the Company of goals measured by a range of targeted financial performance, as defined, and the individual’s continued employment through the end of the measurement period. Shares whose issuance is contingent upon the satisfaction of certain conditions are considered outstanding and included in the computation of diluted earnings (loss) per share if all necessary conditions have been satisfied by the end of the period assuming the end of the reporting period was also the end of the contingency period (the events have occurred).
Foreign Currency Translation
The Company considers the Brazilian Real the functional currency of its Brazilian subsidiary because it conducts substantially all of its business in that currency. The Mexican Peso is the functional currency of the Company’s joint venture in Mexico because substantially all of the business of the joint venture is conducted in that currency. The assets and liabilities of the Brazilian subsidiary and of the joint venture in Mexico are translated into US dollars, which is the Company’s reporting currency, at exchange rates existing at the balance sheet dates. Revenue and expenses are translated at average exchange rates and shareholders’ equity balances are translated at historical exchange rates. Adjustments resulting from translating foreign functional currency financial statements into US dollars are included in the foreign currency translation adjustment, a component of accumulated other comprehensive income (loss). The functional currency of the Company’s other subsidiaries is the US dollar.
Comprehensive Income (Loss)
Comprehensive income (loss) includes all changes in equity during a period except those resulting from investments by and distributions to shareholders. Accumulated comprehensive income (loss) consists of the Company’s net income (loss) and foreign currency translation adjustments from operations in Brazil, net of related income tax effects. Accumulated comprehensive loss attributable to the Company’s joint venture in Mexico consists of the net loss of the joint venture and adjustments resulting from translating the foreign functional currency financial statements of the joint venture into US dollars.
Segment Reporting
Fogo de Chão, Inc. owns and operates full-service, Brazilian steakhouses in the US (including the US Territory of Puerto Rico) and Brazil using a single restaurant concept and brand. Each restaurant under the Company’s single global brand operates with similar types of products and menu, providing a continuous service style, similar contracts, customers and employees, irrespective of location. ASC 280, “Segment Reporting” requires use of the “management approach” model for segment reporting. The management approach model is based on the way a company’s management organizes segments within the company for making operating decisions and assessing performance. The Company’s segments consist of two operating segments: United States and Brazil. The Company’s joint venture in Mexico is included in the United States for segment reporting purposes as the operations of the joint venture are monitored by the United States segment management. License fee revenue, store opening fee and country development fee revenue attributable to the Middle East JV is included in other revenue in the consolidated statements of operations and comprehensive income.
F-16
4. Recently Issued Accounting Standards
Recently issued accounting standards not included below are not expected to have a material impact on the Company’s consolidated financial position or results of operations.
In May 2014, the FASB issued ASU 2014-09, “Revenue from Contracts with Customers.” The core principle of the standard is that an entity recognizes revenue to depict the transfer of promised goods or services to customers in an amount that reflects the consideration to which the entity expects to be entitled in exchange for those goods or services. This ASU will replace most existing revenue recognition guidance in GAAP. New qualitative and quantitative disclosure requirements aim to enable financial statement users to understand the nature, amount, timing, and uncertainty of revenue and cash flows arising from contracts with customers. This ASU permits the use of either the retrospective or cumulative effect transition method. In August 2015, the FASB issued ASU 2015-14, "Revenue from Contracts with Customers (Topic 606): Deferral of the Effective Date," which defers the effective date of ASU 2014-09 by one-year for all entities. The FASB also agreed to allow entities to choose to adopt the standard as of the original effective date. Additionally, in March 2016, the FASB issued ASU 2016-08, "Revenue from Contracts with Customers (Topic 606): Principal versus Agent Considerations (Reporting Revenue Gross versus Net)," in April 2016, the FASB issued ASU 2016-10, "Revenue from Contracts with Customers (Topic 606): Identifying Performance Obligations and Licensing," and in May 2016, the FASB issued ASU 2016-12, "Revenue from Contracts with Customers (Topic 606): Narrow-Scope Improvements and Practical Expedients," all of which provide additional clarification on certain topics addressed in ASU 2014-09. This guidance will be effective for annual reporting periods beginning after December 15, 2017, including interim periods therein. Early adoption is permitted for annual reporting periods beginning after December 15, 2016, including interim periods therein. The majority of the Company’s revenues are from food and beverage sales at its restaurants. ASU 2014-09 will not have an impact on revenue recognition related to food and beverage sales. ASU 2014-09 requires gift card breakage to be recognized as revenue in proportion to the pattern of gift card redemptions exercised by customers. The new guidance may be applied retrospectively to each prior period presented or retrospectively with the cumulative effect adjustment to opening retained earnings as of the date of adoption (modified retrospective approach). The Company has elected the modified retrospective adoption method and plans to adopt this guidance in the first quarter of Fiscal 2018. The Company does not expect the adoption of this guidance to have a material impact on its consolidated financial statements. The Company has evaluated the impact of adoption on the recognition of license fee and other income related to the Company’s joint ventures and does not believe the adoption will have a material impact on its consolidated financial statements.
In February 2016, the FASB issued Accounting Standards Update (“ASU”) 2016-02, Leases (Topic 842). This guidance requires the recognition of most leases on the balance sheet to give investors, lenders, and other financial statement users a more comprehensive view of a company’s long-term financial obligations as well as the assets it owns versus leases. ASU 2016-02 will be effective for fiscal years beginning after December 15, 2018, and interim periods within those fiscal years. Currently, all of the Company’s restaurant and our restaurant support center leases are accounted for as operating leases, and therefore are not recorded within the balance sheet. The Company expects this adoption will result in a material increase in the assets and liabilities on its consolidated balance sheets, but will likely have an insignificant impact on its consolidated statements of earnings. In preparation for the adoption of the guidance, the Company is implementing controls and key system changes to enable the preparation of financial information.
In June 2016, the FASB issued ASU 2016-13, “Financial Instruments-Credit Losses (Topic 326): Measurement of Credit Losses on Financial Instruments,” which provides financial statement users with more decision-useful information about the expected credit losses on financial instruments and other commitments to extend credit held by a reporting entity at each reporting date. To achieve this, the amendments in this ASU replace the incurred loss impairment methodology in current GAAP with a methodology that reflects expected credit losses and requires consideration of a broader range of reasonable and supportable information to inform credit loss estimates. The measurement of expected credit losses will be based on relevant information about past events, including historical experience, current conditions, and reasonable and supportable forecasts that affect the collectability of the reported amount. The amendments in this ASU will be applied using a modified-retrospective approach and, for public entities, are effective for fiscal years beginning after December 15, 2019 and interim periods within those annual periods. Early adoption is permitted for fiscal years beginning after December 15, 2018 and interim periods within those annual periods. The Company has not yet evaluated the impact the adoption of this standard will have on its consolidated financial statements.
In August 2016, the FASB issued ASU 2016-15, “Statement of Cash Flows (Topic 230): Classification of Certain Cash Receipts and Cash Payments,” which clarifies and provides specific guidance on eight cash flow classification issues that are not currently addressed by current GAAP. ASU 2016-15 is effective for annual periods and interim periods within those annual periods beginning after December 15, 2017, and early adoption is permitted. The Company will adopt ASU 2016-15 effective Fiscal 2018. Upon adoption there will be no impact on the Company’s consolidated statement of cash flows.
F-17
In January 2017, the FASB issued ASU 2017-04, “Intangibles - Goodwill and Other (Topic 350).” ASU 2017-04 simplifies the subsequent measurement of goodwill by removing the second step of the two-step impairment test. The amendment requires an entity to perform its annual, or interim goodwill impairment test by comparing the fair value of a reporting unit with its carrying amount. A goodwill impairment will be the amount by which a reporting unit’s carrying value exceeds its fair value, not to exceed the carrying amount of goodwill. The amendment should be applied on a prospective basis. ASU 2017-04 is effective for fiscal years beginning after December 15, 2019, and interim periods within those fiscal years. Early adoption is permitted for interim or annual goodwill impairment tests performed on testing dates after January 1, 2017. The Company has not yet evaluated the impact the adoption of this standard will have on its consolidated financial statements.
5. Joint Ventures
Mexico
On July 1, 2014, the Company entered into a joint venture agreement with a non-related party (“Mexican JV Partner,” and together with the Company, the “Parties”) to form JV Churrascaria Mexico, S. de R.L. de C.V. (the “Mexican JV”), for the purposes of jointly developing, constructing and operating Brazilian style steakhouses under the “Fogo de Chão” name in certain locations in Mexico. Pursuant to the joint venture agreement, the Company owns 51% of the ownership interests in the joint venture and is entitled to receive 50% of the profits of the joint venture after the Parties recoup their initial contributions. The Company is also entitled to a license fee equal to a percentage of the annual gross revenue of each restaurant developed, constructed or operated by the Mexican JV.
The Company determined that it is the primary beneficiary of the joint venture since the Company will have the power to direct activities that significantly impact the entity on a day-to-day basis. These activities include, but are not limited to having an affirmative vote over key operating decisions of the joint venture.
Fogo Holdings recognized $138, $127 and $120 in license fee income during Fiscal 2017, Fiscal 2016 and Fiscal 2015, respectively. This income, and the related expense recognized by the Mexican JV, are eliminated in consolidated net income. The license fee expense, recognized by the Mexican JV, is included in net income (loss) attributable to the noncontrolling interest. The license fee income, recognized by Fogo Holdings, is included in net income attributable to Fogo de Chão, Inc.
Net income (loss) from the Mexican JV for Fiscal 2017, Fiscal 2016 and Fiscal 2015, have been allocated to the Company’s joint venture partner in accordance with the terms of the joint venture agreement. The assets of the consolidated joint venture are restricted for use only by the joint venture and are not available for the Company’s general operations.
The following table presents the consolidated assets and liabilities of the Mexican JV included within the Company’s consolidated balance sheets as of December 31, 2017 and January 1, 2017, respectively.
|
|
|
December 31, 2017 |
|
|
January 1, 2017 |
|
||
|
Cash and cash equivalents |
|
$ |
114 |
|
|
$ |
43 |
|
|
Accounts receivable |
|
|
59 |
|
|
|
43 |
|
|
Inventories |
|
|
122 |
|
|
|
117 |
|
|
Prepaid expenses and other assets |
|
|
657 |
|
|
|
835 |
|
|
Property and equipment, net |
|
|
1,665 |
|
|
|
1,912 |
|
|
Deferred tax assets, noncurrent |
|
|
35 |
|
|
|
41 |
|
|
Total assets |
|
$ |
2,652 |
|
|
$ |
2,991 |
|
|
Accounts payable and accrued expenses |
|
$ |
514 |
|
|
$ |
540 |
|
|
Total liabilities |
|
|
514 |
|
|
|
540 |
|
|
Fogo de Chão, Inc. investment in joint venture |
|
|
373 |
|
|
|
236 |
|
|
Noncontrolling interest |
|
|
1,765 |
|
|
|
2,215 |
|
|
Total owners' equity |
|
|
2,138 |
|
|
|
2,451 |
|
|
Total liabilities and owners' equity |
|
$ |
2,652 |
|
|
$ |
2,991 |
|
Accounts payable include $49 and $137 due to the Company as of December 31, 2017 and January 1, 2017, respectively, and are eliminated in consolidation.
F-18
During the first quarter of Fiscal 2015, a wholly-owned subsidiary of the Company entered into a shareholders agreement with a non-related party to form FD Restaurants Ltd., a Cayman Islands exempted company (the “Middle East JV”), for the purposes of jointly developing, constructing and operating Brazilian style steakhouses under the “Fogo de Chão” name in certain locations in the United Arab Emirates, Qatar, Kuwait, Oman, Bahrain, the Kingdom of Saudi Arabia and Lebanon. Pursuant to the agreement, the Company will own 51% of the ownership interests in the Middle East JV and will be entitled to receive 50% of the profits of the Middle East JV after the parties recoup their initial contributions. The Company will be entitled to a license fee equal to a percentage of the annual gross revenue of each restaurant developed, constructed or operated by the Middle East JV. The Company will also be entitled to a store opening fee upon each restaurant opening to the public, as well as a country development fee for the first restaurant opened in each designated country. Payment of the store opening fee and master country development fee are paid for out of the profits of the Middle East JV through distributions. Distributions are to be made proportionately, based upon each shareholder’s contribution in the Middle East JV, until each shareholder’s contribution is equal. Thereafter, distributions will be shared equally. The Company accounts for its investment in the Middle East JV under the equity method as it has determined that it does not have a controlling interest in the Middle East JV since the Company will not have the power to direct activities that significantly impact the Middle East JV on a day-to-day basis, but does have the ability to exercise significant influence.
In August 2017, the Middle East JV opened its first restaurant in Jeddah in the Kingdom of Saudi Arabia. The Company recognized $78 in license fee revenue, a $75 store opening fee and $75 related to the country development fee related to the opening of the restaurant in Saudi Arabia, during Fiscal 2017. The receivable for the store opening fee and country development fee is included in other assets (noncurrent) in the consolidated balance sheet as collection could be recognized over a period longer than twelve months. License fee revenue, store opening fee and country development fee revenue attributable to the Middle East JV is included in other revenue in the consolidated statements of operations and comprehensive income.
6. Property and Equipment, Net
Property and equipment, net consists of the following:
|
|
|
December 31, |
|
|
January 1, |
|
||
|
|
|
2017 |
|
|
2017 |
|
||
|
Land |
|
$ |
5,340 |
|
|
$ |
5,340 |
|
|
Buildings |
|
|
4,810 |
|
|
|
4,810 |
|
|
Leasehold improvements |
|
|
186,551 |
|
|
|
157,669 |
|
|
Furniture, fixtures and equipment |
|
|
33,307 |
|
|
|
24,973 |
|
|
Automobiles |
|
|
98 |
|
|
|
120 |
|
|
Construction in progress |
|
|
8,191 |
|
|
|
13,812 |
|
|
|
|
|
238,297 |
|
|
|
206,724 |
|
|
Less: Accumulated depreciation |
|
|
(64,752 |
) |
|
|
(47,874 |
) |
|
Property and equipment, net |
|
$ |
173,545 |
|
|
$ |
158,850 |
|
Depreciation expense was $18,879, $15,463 and $12,201 for Fiscal 2017, Fiscal 2016 and Fiscal 2015, respectively.
Property and equipment attributable to the Company’s operations in the US (including the US Territory of Puerto Rico), accounted for 94% and 93% of total property and equipment, net (excluding land) at December 31, 2017 and January 1, 2017, respectively. Property and equipment attributable to the Company’s operations in Brazil accounted for 5% and 6% of total property and equipment, net (excluding land) at December 31, 2017 and January 1, 2017, respectively. Land is solely attributable to the Company’s operations in the US.
F-19
7. Goodwill and Intangible Assets
The following is a reconciliation of the beginning and ending balances of goodwill:
|
|
December 31, 2017 |
|
|
January 1, 2017 |
|
||
|
Goodwill |
|
|
|
|
|
|
|
|
United States(a) |
$ |
170,026 |
|
|
$ |
172,441 |
|
|
Brazil |
|
62,663 |
|
|
|
62,663 |
|
|
Foreign exchange impact(b) |
|
(23,954 |
) |
|
|
(30,672 |
) |
|
Balance, beginning of year |
|
208,735 |
|
|
|
204,432 |
|
|
Foreign exchange impact |
|
(444 |
) |
|
|
6,718 |
|
|
Balance, end of year |
$ |
208,291 |
|
|
$ |
211,150 |
|
|
(a) |
Goodwill attributed to the United States was corrected for an error in the accounting for a prior period business acquisition. See Note 2. |
|
(b) |
Cumulative foreign exchange impact. |
The Company regularly evaluates whether events and circumstances have occurred that may indicate a potential change in recoverability of goodwill. The Company performs its annual goodwill impairment review during its fiscal fourth quarter. The Company’s last annual review indicated that there was no impairment of goodwill, and that the reporting units had estimated fair values that were in excess of their carrying values, including goodwill. There have been no impairments to goodwill recognized.
Intangible assets include the following:
|
|
|
December 31, 2017 |
|
|
January 1, 2017 |
|
||||||||||
|
|
|
Gross Amount |
|
|
Accumulated Amortization |
|
|
Gross Amount |
|
|
Accumulated Amortization |
|
||||
|
Non-compete agreements (definite-lived): |
|
|
|
|
|
|
|
|
|
|
|
|
|
|
|
|
|
United States |
|
$ |
— |
|
|
$ |
— |
|
|
$ |
1,100 |
|
|
$ |
(972 |
) |
|
Brazil |
|
|
— |
|
|
|
— |
|
|
|
400 |
|
|
|
(353 |
) |
|
Foreign exchange impact(a) |
|
|
— |
|
|
|
— |
|
|
|
(152 |
) |
|
|
134 |
|
|
Non-compete agreements, net |
|
$ |
— |
|
|
$ |
— |
|
|
$ |
1,348 |
|
|
$ |
(1,191 |
) |
|
Trade name (indefinite-lived): |
|
|
|
|
|
|
|
|
|
|
|
|
|
|
|
|
|
United States |
|
|
77,200 |
|
|
|
|
|
|
|
77,200 |
|
|
|
|
|
|
Brazil |
|
|
30,100 |
|
|
|
|
|
|
|
30,100 |
|
|
|
|
|
|
Foreign exchange impact(a) |
|
|
(11,719 |
) |
|
|
|
|
|
|
(11,506 |
) |
|
|
|
|
|
Trade name |
|
|
95,581 |
|
|
|
— |
|
|
|
95,794 |
|
|
|
— |
|
|
Total |
|
$ |
95,581 |
|
|
$ |
— |
|
|
$ |
97,142 |
|
|
$ |
(1,191 |
) |
|
(a) |
Cumulative foreign exchange impact. |
Amortization expense for definite-lived intangibles was $158, $266 and $270 for Fiscal 2017, Fiscal 2016 and Fiscal 2015, respectively. The term of the non-compete agreements were completed during 2017.
Goodwill and intangible assets of the Company’s Brazilian reporting unit are denominated in the Brazilian Real. These assets are translated into US dollars at the rate of exchange as of the applicable balance sheet date. As a result, the US dollar value of goodwill and intangibles is impacted by the fluctuation in the exchange rate.
F-20
Deferred rent consists of the following:
|
|
December 31, |
|
|
January 1, |
|
||
|
|
2017 |
|
|
2017 |
|
||
|
Deferred rent |
$ |
9,638 |
|
|
$ |
7,610 |
|
|
Tenant allowance |
|
15,385 |
|
|
|
12,667 |
|
|
|
|
25,023 |
|
|
|
20,277 |
|
|
Less: Current portion |
|
(731 |
) |
|
|
(496 |
) |
|
Total, less current portion |
$ |
24,292 |
|
|
$ |
19,781 |
|
Many of the Company’s operating leases contain rent escalations at various periods during the applicable lease term. The Company recognizes rental expense for minimum lease payments for these leases on a straight-line basis over the life of the lease. Any allowances from the landlord used for tenant improvements are reflected as property and equipment with a corresponding credit to a liability account. Amounts recorded to normal tenant improvements are depreciated over the lesser of the asset’s useful life or the lease term. The corresponding liability is amortized over the life of the lease.
Favorable lease assets and unfavorable lease liabilities:
|
|
|
December 31, |
|
|
January 1, |
|
||
|
|
|
2017 |
|
|
2017 |
|
||
|
Favorable lease assets |
|
$ |
— |
|
|
$ |
738 |
|
|
Less: Accumulated amortization |
|
|
— |
|
|
|
(517 |
) |
|
Foreign exchange impact |
|
|
— |
|
|
|
(130 |
) |
|
Favorable lease assets, net |
|
$ |
— |
|
|
$ |
91 |
|
|
Unfavorable lease liabilities |
|
$ |
1,574 |
|
|
$ |
2,128 |
|
|
Less: Accumulated amortization |
|
|
(1,040 |
) |
|
|
(1,337 |
) |
|
Unfavorable lease liabilities, net |
|
$ |
534 |
|
|
$ |
791 |
|
Favorable lease assets and unfavorable lease liabilities represent the difference between the market rates in effect for acquired leases compared to the various lease payments on individual operating leases. Favorable lease assets and unfavorable lease liabilities are amortized to rent expense on a straight-line basis over the lease term remaining at the time of the acquisition. The amortization of favorable lease assets increases rent expense, while the amortization of unfavorable lease liabilities decreases rent expense. The net decrease in rent expense, resulting from the amortization of favorable lease assets and unfavorable lease liabilities, was $165, $188 and $185 for Fiscal 2017, Fiscal 2016 and Fiscal 2015, respectively. Amortization of unfavorable lease liabilities is expected to result in a net decrease in rent expense of approximately $140 for Fiscal 2018; $97 for Fiscal 2019; $97 for Fiscal 2020; $97 for Fiscal 2021 and $84 for Fiscal 2022. Favorable lease assets are included in other assets (noncurrent) in the consolidated balance sheets. Unfavorable lease liabilities are included in other noncurrent liabilities in the consolidated balance sheets.
9. Accounts Payable and Accrued Expenses
Accounts payable and accrued expenses consist of the following:
|
|
|
December 31, |
|
|
January 1, |
|
||
|
|
|
2017 |
|
|
2017 |
|
||
|
Accounts payable |
|
$ |
11,440 |
|
|
$ |
10,080 |
|
|
Accrued capital expenditures |
|
|
7,103 |
|
|
|
4,807 |
|
|
Deferred rent (current) |
|
|
731 |
|
|
|
496 |
|
|
Payroll and payroll related |
|
|
6,845 |
|
|
|
6,488 |
|
|
Interest payable |
|
|
41 |
|
|
|
34 |
|
|
Sales and beverage taxes payable |
|
|
2,836 |
|
|
|
2,634 |
|
|
Self-insurance reserves (current) |
|
|
1,090 |
|
|
|
996 |
|
|
Income and other taxes payable |
|
|
2,329 |
|
|
|
1,614 |
|
|
Other accrued expenses |
|
|
3,213 |
|
|
|
2,308 |
|
|
Total |
|
$ |
35,628 |
|
|
$ |
29,457 |
|
F-21
10. Long-Term Debt
Long-term debt consists of the following:
|
|
|
December 31, |
|
|
January 1, |
|
||
|
|
|
2017 |
|
|
2017 |
|
||
|
2015 Credit Facility: |
|
|
|
|
|
|
|
|
|
Revolving Credit Facility |
|
$ |
138,000 |
|
|
$ |
150,000 |
|
|
|
|
|
138,000 |
|
|
|
150,000 |
|
|
Less: Current portion of long-term debt |
|
|
— |
|
|
|
— |
|
|
Long-term debt, less current portion |
|
$ |
138,000 |
|
|
$ |
150,000 |
|
On June 24, 2015, in connection with the closing of the IPO, the Company refinanced its existing credit facility (the “2012 Credit Facility”) and Brasa (Holdings) Inc., an indirect subsidiary of the Company, as the borrower (the “Borrower”) and Brasa (Purchaser) Inc., a direct subsidiary of the Company, entered into a new credit facility (the “2015 Credit Facility”).
Upon the closing of the IPO, the Company drew down $165,000 under the 2015 Credit Facility and used those borrowings, along with the net proceeds from the IPO, to repay the outstanding existing debt under the 2012 Credit Facility. The Company recorded a loss on the extinguishment of $5,991, which included the write-off of unamortized debt issuance costs of $825 and original issue discount of $4,840. In addition, the Company was required to pay a $250 pre-payment premium on Term Loan B and $76 in legal and other expenses directly attributable to the extinguishment.
2015 Credit Facility
The 2015 Credit Facility provides for (i) a $250,000 revolving credit facility (the “Revolving Credit Facility”) and (ii) incremental facilities that may include (A) one or more increases to the amount available under the Revolving Credit Facility, (B) the establishment of one or more new revolving credit commitments and/or (C) the establishment of one or more term loan commitments. The loans under the Revolving Credit Facility mature on June 24, 2020.
At the Company’s option, loans under the Revolving Credit Facility may be Base Rate Loans or Eurodollar Rate Loans (each as defined in the credit agreement) and bear interest at a Base Rate or Eurodollar Rate (each as defined in the credit agreement), respectively, plus the Applicable Rate (as defined in the credit agreement). The Base Rate is a fluctuating rate per annum equal to the highest of (i) the Federal Funds Rate in effect on such day plus 0.5%, (ii) the Prime Rate and (iii) the Eurodollar Rate applicable for an Interest Period of one (1) month plus 1.00%. The Eurodollar Rate is a rate per annum determined for the applicable interest period by reference to the London interbank offered rate administered by ICE Benchmark Administration and displayed by Reuters (or, if not available for any interest period, an interpolated rate determined by the Administrative Agent).
The Applicable Rate will be (i) in the case of any Base Rate Loan (including Swingline Loans), 1.00% and (ii) in the case of any Eurodollar Rate Loan, 2.00%; provided that, following delivery of financial statements pursuant to the credit agreement for the first full fiscal quarter ending after the closing date, the “Applicable Rate” for any Base Rate Loans (including Swingline Loans) or Eurodollar Rate Loan shall be between 50 and 150 basis points with respect to Base Rate Loans and between 150 and 250 basis points with respect to Eurodollar Rate Loans, depending on the Total Rent Adjusted Leverage Ratio (as defined in the credit agreement).
The Borrower and its restricted subsidiaries are subject to affirmative, negative and financial covenants, and events of default customary for facilities of this type (with customary grace periods, as applicable, and lender remedies). The covenants, among other things, restrict, subject to certain exceptions, the Borrower’s and each of its restricted subsidiary’s ability to (i) incur additional indebtedness, (ii) issue stock, (iii) create liens on assets, (iv) engage in mergers or consolidations, (v) sell assets, (vi) make investments, loans or advances, (vii) make certain acquisitions, (viii) engage in certain transactions with affiliates, (ix) authorize or pay dividends, (x) enter into certain restrictive agreements and (xi) change lines of business or fiscal year. In addition, the Borrower will be required to maintain two financial covenants, which include a maximum Total Rent Adjusted Leverage Ratio (at levels that vary until maturity) and a minimum Consolidated Interest Coverage Ratio. Beginning with the third quarter ending September 27, 2015 and through Fiscal 2016, these required ratios were 5.50 to 1 and 2.00 to 1, respectively. Starting in Fiscal 2017 and through Fiscal 2018, the Total Rent Adjusted Leverage Ratio may not be greater than 5.25 to 1 and the ratio will further reduce to 5.00 to 1 in Fiscal 2019 through maturity. The Consolidated Interest Coverage Ratio may not be less than 2.00 to 1 through maturity. The Company was in compliance with these covenants at December 31, 2017 and January 1, 2017.
F-22
Because the Company is not required to make principal payments on any outstanding balance under the Revolving Credit Facility until June 24, 2020, any outstanding balance is reported as non-current in the Company’s consolidated balance sheet as a component of long-term debt.
As of December 31, 2017, the Company had seven letters of credit outstanding for a total of $5,664; and $106,336 of available borrowing capacity under the 2015 Credit Facility.
Debt Issuance Costs
Debt issuance costs are amortized to interest expense over the term of the debt using the straight-line method for revolving debt over the terms of the related instruments. For the period leading to the IPO, the debt issuance costs associated with the previous term debt were amortized to interest expense using the effective interest method. Remaining unamortized debt issuance costs were $1,442 and $2,019 as of December 31, 2017 and January 1, 2017, respectively, and are included in other assets (noncurrent) in the consolidated balance sheets.
In April 2015, the FASB issued ASU 2015-03, “Simplifying the Presentation of Debt Issuance Costs,” which changes the presentation of debt issuance costs in financial statements, requiring an entity to present such costs in the balance sheet as a direct deduction from the carrying amount of long-term debt, consistent with debt discounts or premiums. In August 2015, the FASB issued ASU 2015-15, which clarifies the treatment of debt issuance costs attributable to line-of-credit arrangements after the adoption of ASU 2015-03. In particular, ASU 2015-15 clarifies that the SEC staff would not object to an entity deferring and presenting debt issuance costs related to a line-of-credit arrangement as an asset and subsequently amortizing the deferred debt issuance costs ratably over the term of such arrangement, regardless of whether there are any outstanding borrowings on the line-of-credit arrangement. ASU 2015-03 and ASU 2015-15 are effective for financial statements issued for fiscal years beginning after December 15, 2015, and interim periods within those fiscal years. The Company adopted ASU 2015-03 and ASU 2015-15 as of April 3, 2016. The Company’s financial statement presentation was consistent with the guidance in ASU 2015-15. As a result, there was no impact to the Company’s consolidated balance sheet upon adoption.
11. Share-Based Compensation
In 2012, the Company established its 2012 Omnibus Equity Incentive Plan (the “2012 Plan”). Prior to the IPO, the Company granted share-based awards pursuant to the 2012 Plan. In connection with the IPO, the Company adopted its 2015 Omnibus Incentive Plan (the “2015 Plan”). All outstanding equity awards under the 2012 Plan will remain outstanding under the 2012 Plan and will be governed by the 2012 Plan and their respective award agreements.
The 2012 Plan provides for the Company to sell or issue restricted common stock or to grant stock options, stock appreciation rights or other share-based awards to employees, members of the board of directors and consultants of the Company. Each award will be subject to the terms and conditions set forth in the 2012 Plan and to those other terms and conditions specified in the underlying award agreement. Under the 2012 Plan, a maximum of 2,291,296 shares of common stock are reserved for issuance of stock-based awards.
Awards granted under the 2015 Plan may consist of incentive stock options, nonqualified stock options, stock appreciation rights, restricted stock, restricted stock units, and other share-based awards and cash awards. Each award will be subject to the terms and conditions set forth in the 2015 Plan and to those other terms and conditions specified in the underlying award agreement. The 2015 Plan authorizes up to 1,200,000 shares of common stock for issuance pursuant to the terms of the 2015 Plan.
Both the 2012 Plan and the 2015 Plan are administered by the board of directors of Fogo de Chão, Inc., or at the discretion of the board of directors, by a committee of the board. The exercise prices, vesting and other restrictions are determined at the discretion of the board of directors, or a committee of the board, as applicable, except that the exercise price per share of stock options may not be less than the fair market value of the share of common stock on the date of grant and the term of the stock option may not be greater than ten years (the maximum allowed contractual life).
F-23
As discussed in Note 2, on February 20, 2018, the Company entered into a Merger Agreement, pursuant to which, among other things and subject to the satisfaction or waiver of specified conditions, Merger Subsidiary will merge with and into the Company (the “Merger”), with the Company surviving as a wholly owned subsidiary of Parent. Pursuant to the Merger Agreement, at the Effective Time each outstanding stock option will be cancelled, with the holder of such stock option becoming entitled to receive an amount in cash equal to (i) the excess, if any, of (a) $15.75 minus (b) the exercise price per share of common stock subject to such stock option, multiplied by (ii) the number of shares of common stock subject to such stock option; and the restrictions on each outstanding restricted stock will lapse, with the holder of such restricted stock becoming entitled to receive an amount in cash equal to (i) $15.75 multiplied by (ii) the number of shares of common stock subject to such restricted stock.
Stock Options
Prior to the IPO, stock options granted under the 2012 Plan were typically granted to employees in two tranches, each with separate exercise prices. The exercise price for the first tranche was based on the fair value of common stock on the date of grant, and the exercise price of the second tranche was typically 200% of the fair value of common stock on the date of grant. These options typically vest upon both (i) the completion of a four or five year vesting period and (ii) the satisfaction of a Liquidity Event, as that term is defined in the stock option award agreement. Under the terms of the option award agreement, a Liquidity Event is defined as the earlier to occur of (i) a change in control transaction or (ii) an initial public offering. As the completion of a Liquidity Event cannot be considered probable until it occurs, no expense associated with these awards was recorded until the Liquidity Event occurred. Upon the closing of the IPO, options for the purchase of 783,606 shares of common stock vested as a result of the satisfaction of the Liquidity Event vesting condition. The Company recognized $5,658 of compensation expense associated with these options upon the closing of the IPO.
During the second quarter of Fiscal 2015, the Company granted stock options for the purchase of 138,200 shares of common stock with an exercise price of $20.00. Each stock option grant was immediately vested 20% on the grant date and continues to vest 20% on each of the first four anniversaries of the grant date, subject to the participant’s continued service with the Company through each such anniversary date. These stock options were granted under the 2015 Plan.
During the fourth quarter of Fiscal 2016, the Company granted stock options for the purchase 28,000 shares of common stock with a weighted average exercise price of $11.20. These stock options vest 25% on each of the first four anniversaries of the grant date, subject to the participant’s continued service with the Company through each such anniversary date. These stock options were granted under the 2015 Plan.
The weighted average grant-date fair value of stock options granted during Fiscal 2016 and Fiscal 2015 was $4.25 and $6.50, respectively.
The fair values of the stock options granted were estimated on the date of grant using the Black-Scholes option-pricing model. The following table sets forth the assumptions that the Company used to determine the fair value of the stock options granted, presented on a weighted-average basis:
|
Assumptions: |
|
Fiscal 2016 |
|
|
Fiscal 2015 |
|
||
|
Expected life (in years) |
|
|
6.3 |
|
|
|
6.0 |
|
|
Risk-free interest rate |
|
|
1.59 |
% |
|
|
1.86 |
% |
|
Volatility |
|
|
36 |
% |
|
|
30 |
% |
|
Dividend yield |
|
|
0 |
% |
|
|
0 |
% |
Prior to the IPO, the Company was a privately held company and accordingly lacks sufficient company-specific historical and implied volatility information. Therefore, it estimates its expected stock volatility based on the historical volatility of a publicly-traded group of peer companies and expects to continue to do so until such time as it has adequate historical data regarding the volatility of its own traded stock price. The expected life of the options represents the estimated period of time until exercise and is based on historical experience of similar options, giving consideration to the contractual terms, vesting schedules and expectations of future employee behavior. The expected life of the stock options granted during the second quarter of Fiscal 2015 and during the fourth quarter of Fiscal 2016 were calculated using the simplified method, which is an average of the contractual term of the option and its ordinary vesting period, as the Company does not have sufficient relevant historical data for determining the expected life of these stock option awards. The risk-free interest rate is determined by reference to the US Treasury yield curve in effect at the time of grant of the award for time periods approximately equal to the expected term of the award. Expected dividend yield is based on the fact that the Company has never paid cash dividends and does not expect to pay any cash dividends in the foreseeable future.
F-24
The following table summarizes the Company’s stock option activity for Fiscal 2017:
|
|
|
Number of Options |
|
|
Weighted Average Exercise Price |
|
|
Weighted Average Remaining Contractual Life (Years) |
|
|
Aggregate Intrinsic Value |
|
||||
|
Outstanding at January 1, 2017 |
|
|
2,102,031 |
|
|
$ |
10.68 |
|
|
|
|
|
|
|
|
|
|
Granted |
|
|
— |
|
|
|
— |
|
|
|
|
|
|
|
|
|
|
Exercised |
|
|
(20,367 |
) |
|
$ |
10.78 |
|
|
|
|
|
|
|
|
|
|
Forfeited |
|
|
(29,370 |
) |
|
$ |
17.82 |
|
|
|
|
|
|
|
|
|
|
Outstanding at December 31, 2017 |
|
|
2,052,294 |
|
|
$ |
10.58 |
|
|
|
5.1 |
|
|
$ |
5,174 |
|
|
Vested (and exercisable) at December 31, 2017 |
|
|
1,856,594 |
|
|
$ |
10.31 |
|
|
|
4.9 |
|
|
$ |
4,893 |
|
|
Unvested at December 31, 2017 |
|
|
195,700 |
|
|
$ |
13.13 |
|
|
|
|
|
|
|
|
|
The intrinsic value of stock options exercised during Fiscal 2017 and Fiscal 2016 totaled $64 and $109, respectively. The tax benefit realized on stock options exercised during Fiscal 2017 and Fiscal 2016 was immaterial. No stock options were exercised during Fiscal 2015.
The aggregate intrinsic value represents the amount by which fair value of the Company’s stock exceeds the exercise price of the stock option.
As of December 31, 2017, the Company had an aggregate of $316 of unrecognized share-based compensation cost related to outstanding stock options, which is expected to be recognized over a weighted average period of 1.6 years.
Restricted Stock
The Company has granted restricted common stock with time-based vesting conditions. Unvested shares of restricted common stock may not be sold or transferred by the holder. These restrictions lapse according to the time-based vesting conditions of each award which is typically between two and four years. The fair value of restricted stock awards is the fair value of the Company’s common stock on the date the restricted stock is awarded.
In September 2017, the Company granted restricted common stock with time-based vesting conditions to the Company’s executive officers and certain senior management. Unvested shares of restricted common stock may not be sold or transferred by the holder. These restrictions lapse on each of the first three anniversaries of the grant date, subject to the participant’s continued service with the Company through each such anniversary date.
In December 2017, the Company granted restricted stock designated as performance awards to the Company’s executive officers and certain senior management. These performance-based restricted shares were granted pursuant to the Company’s 2015 Omnibus Incentive Plan. The number of performance-based restricted shares granted represents the number of on-target shares for the three fiscal year performance period ending at the end of the Company's 2020 fiscal year. The vesting percentage may be less than 100% of the on-target shares based on the Company's 2020 total revenue and earnings per share performance, each metric applicable to 50% of the shares granted. These performance-based restricted shares will vest, if at all, subject to: (i) the Company achieving certain 2020 total revenue and earnings per share performance objectives and (ii) generally, the participant's continued service with the Company through the three-year measurement period.
The weighted average grant-date fair value of restricted stock granted during Fiscal 2017, Fiscal 2016 and Fiscal 2015 was $11.93, $16.84 and $13.14, respectively.
F-25
The following table summarizes the Company’s restricted stock activity for Fiscal 2017:
|
|
|
Number of Shares |
|
|
Weighted Average Grant-Date Fair Value |
|
||
|
Unvested at January 1, 2017 |
|
|
25,008 |
|
|
$ |
9.90 |
|
|
Issued |
|
|
127,707 |
|
|
$ |
11.93 |
|
|
Vested |
|
|
(22,779 |
) |
|
$ |
9.23 |
|
|
Forfeited |
|
|
— |
|
|
|
— |
|
|
Unvested at December 31, 2017 |
|
|
129,936 |
|
|
$ |
12.02 |
|
The grant-date fair value of restricted stock that vested during Fiscal 2017, Fiscal 2016 and Fiscal 2015 totaled $210, $1,014 and $1,189, respectively.
As of December 31, 2017, the Company had an aggregate of $1,445 of unrecognized share-based compensation cost related to outstanding unvested restricted common stock, which is expected to be recognized over a weighted average period of 2.8 years.
Share-Based Compensation Expense
The Company recorded share-based compensation expense related to stock options and restricted stock in the following expense categories in its statements of operations and comprehensive income (loss):
|
|
|
Fiscal 2017 |
|
|
Fiscal 2016 |
|
|
Fiscal 2015 |
|
|||
|
Restaurant operating costs |
|
$ |
116 |
|
|
$ |
82 |
|
|
$ |
1,795 |
|
|
General and administrative costs |
|
|
449 |
|
|
|
710 |
|
|
|
4,997 |
|
|
Total share-based compensation |
|
|
565 |
|
|
|
792 |
|
|
|
6,792 |
|
|
Income tax benefit(a) |
|
|
(137 |
) |
|
|
(275 |
) |
|
|
(2,396 |
) |
|
Total share-based compensation, net of taxes |
|
$ |
428 |
|
|
$ |
517 |
|
|
$ |
4,396 |
|
|
(a) |
Deferred income tax benefit attributable to share based compensation awards. For Fiscal 2017, deferred tax benefit was calculated based upon reduced tax rates as a result of the impact of the Tax Act, see Note 14. |
Shares Available
As of December 31, 2017, 302,572 and 958,013 shares remained available for future issuance under the 2012 Plan and 2015 Plan, respectively.
12. Employee Benefit Plan
401(k) Plan – Effective July 1, 2016, the Company implemented a 401(k) plan to provide retirement benefits for certain employees.
Deferred Compensation Plan – Effective July 1, 2016, the Company implemented a non-qualified deferred compensation plan. The deferred compensation plan is intended to provide current tax planning opportunities and supplemental funds upon retirement or death for certain key employees designated and approved by the Company to be eligible to participate in the deferred compensation plan. The deferred compensation plan enables its participants with the opportunity to voluntarily elect to defer the timing of payment of base salary and/or bonuses. Deferred compensation liability is $538 and $227 as of December 31, 2017 and January 1, 2017, respectively, and is included in other noncurrent liabilities in the consolidated balance sheets.
F-26
The following table sets forth the computations of basic and diluted earnings per share:
|
|
|
Fiscal 2017 |
|
|
Fiscal 2016 |
|
|
Fiscal 2015 |
|
|||
|
Net income attributable to Fogo de Chão, Inc. |
|
$ |
28,789 |
|
|
$ |
24,437 |
|
|
$ |
27,865 |
|
|
Basic weighted average shares outstanding |
|
|
28,227,747 |
|
|
|
28,119,196 |
|
|
|
25,519,312 |
|
|
Effect of dilutive securities: |
|
|
|
|
|
|
|
|
|
|
|
|
|
Unvested restricted stock |
|
|
15,859 |
|
|
|
103,277 |
|
|
|
255,857 |
|
|
Stock options |
|
|
559,213 |
|
|
|
600,143 |
|
|
|
548,946 |
|
|
Diluted weighted average number of shares outstanding |
|
|
28,802,819 |
|
|
|
28,822,616 |
|
|
|
26,324,115 |
|
|
Basic earnings per share |
|
$ |
1.02 |
|
|
$ |
0.87 |
|
|
$ |
1.09 |
|
|
Diluted earnings per share |
|
$ |
1.00 |
|
|
$ |
0.85 |
|
|
$ |
1.06 |
|
The following table sets forth the potentially dilutive securities outstanding during Fiscal 2017, Fiscal 2016 and Fiscal 2015 that were not included in the computation of diluted earnings per share because their effect was antidilutive:
|
|
|
Fiscal 2017 |
|
|
Fiscal 2016 |
|
|
Fiscal 2015 |
|
|||
|
Stock options |
|
|
666,935 |
|
|
|
705,106 |
|
|
|
295,028 |
|
|
Nonvested restricted stock |
|
|
15,779 |
|
|
|
1,671 |
|
|
|
112 |
|
In December 2017, the Company issued 63,820 shares of restricted stock designated as performance awards to the Company’s executive officers and certain senior management. These performance-based restricted shares were granted pursuant to the Company’s 2015 Omnibus Incentive Plan. The number of performance-based restricted shares granted represents the number of on-target shares for the three fiscal year performance period ending at the end of the Company's 2020 fiscal year. The vesting percentage may be less than 100% of the on-target shares based on the Company's 2020 total revenue and earnings per share performance, each metric applicable to 50% of the shares granted. These performance-based restricted shares will vest, if at all, subject to: (i) the Company achieving certain 2020 total revenue and earnings per share performance objectives and (ii) generally, the participant's continued service with the Company through the three-year measurement period. Because the performance-based vesting conditions had not been satisfied and would not have been satisfied as of December 31, 2017 they have been excluded from the calculation of diluted earnings per share for Fiscal 2017.
14. Income Taxes
Federal Tax Reform
On December 22, 2017, the Tax Act was signed into law effective January 1, 2018. The Tax Act significantly revised the US tax code by, in part but not limited to: a corporate tax rate decrease from 35% to 21% effective for tax years beginning after December 31, 2017, the transition of US international taxation from a worldwide tax system to a territorial system, and a one-time transition tax on the mandatory deemed repatriation of cumulative foreign earnings as of December 31, 2017. Under Accounting Standards Codification 740, Income Taxes, the Company must recognize the effects of tax law changes in the period in which the new legislation is enacted.
The Company has calculated a reasonable estimate of the impact of the Tax Act in its year-end income tax provision in accordance with its understanding of the Tax Act and guidance available as of the date of this filing. The provisional tax benefit recorded related to the re-measurement of certain deferred tax assets and liabilities, based on the rates at which they are expected to reverse in the future, was $14,978. The provisional tax expense related to the one-time transition tax on the mandatory deemed repatriation of foreign earnings was $6,457.
The Tax Act provides for a one-time transition tax under section 965 on previously untaxed post-1986 foreign income of specified foreign corporations owned by US shareholders by deeming those earnings to be repatriated. Foreign earnings considered held in the form of cash and cash equivalents are taxed at an effective rate of 15.5%, and the remaining earnings are taxed at an effective rate of 8%, which includes a partial participation exemption. The Company recorded $6,457 expense related to its one-time repatriation inclusion. As addressed below, this amount is presented as provisional while the Company continues to review the balance of foreign earnings required to be included under section 965(a).
F-27
The Company has historically not utilized a foreign tax credit, instead opting to deduct all foreign taxes paid. In Fiscal 2017, the Company elected to calculate and utilize a foreign tax credit. The Company recorded a $2,134 benefit related to foreign tax credits which includes a credit benefit of $3,283 net of the $1,149 Section 78 gross up expense. As addressed below, this amount is presented as provisional while the Company continues to review its foreign tax pool balance and attributes relevant to the section 904 foreign tax credit limitation.
The Tax Act provides for 100% bonus depreciation for eligible property placed in service after September 27, 2017, and before 2023. The Tax Act allows a Company to make an election for the 2017 tax year to apply 50% bonus depreciation rather than 100% bonus depreciation on eligible property. At this time, the Company plans to elect the 50% bonus depreciation. As addressed below, this amount is presented as provisional while the Company continues to review the impact of 100% bonus depreciation on its foreign tax credit utilization.
On December 22, 2017, Staff Accounting Bulletin No. 118 ("SAB 118") was issued to address the application of US GAAP in situations when a registrant does not have the necessary information available, prepared, or analyzed (including computations) in reasonable detail to complete the accounting for certain income tax effects of the Tax Act. Pursuant to SAB 118, the Company is presenting the adjustments to deferred tax assets and liabilities, the liability related to the transition tax, and foreign tax credits as provisional amounts because it has the necessary information to develop a reasonable estimate. As further regulatory guidance is issued by the applicable taxing authorities and as accounting treatment is clarified, additional work may be necessary to ensure earnings as required by the calculations are properly determined. As the Company performs additional analysis on the application of the law, and as the Company refines its estimates in calculating the effect, the Company’s final analysis may be different from current provisional amounts. Any changes to the provisional amounts will be recognized in the period completed which could materially affect the Company’s tax obligations and effective tax rate. Additionally, as a result of the Tax Act, the Company has not completed its evaluation of its indefinite reinvestment assertion with regard to foreign earnings under ASC 740-30. As a result, deferred tax liabilities may be increased or decreased during the period allowed under SAB 118.
The effects of other provisions of the Tax Act are not expected to have a material impact on the Company’s Fiscal 2017 consolidated financial statements. Other provisions of the Tax Act may impact the Company in Fiscal 2018. These include the new section 951A Global Intangible Low-Taxed Income (“GILTI”) anti-deferral rules and the section 245A deduction for certain dividends received from foreign corporations. The Company has not completed its analysis of the effect of these provisions, hence no estimate can currently be made and no provisional amounts were recorded in the financial statements for the impact of these provisions of the Tax Act. Based on the current interpretation, the Company may choose a method as an accounting policy to record deferred taxes in relation to the GILTI provisions or to record the tax in the period in which it occurs. Pursuant to SAB 118, the Company has not elected an accounting policy for the effect of the GILTI tax law provisions.
Income from Continuing Operations Before Income Taxes
The following table summarizes the income from continuing operations before income taxes in the following jurisdictions for Fiscal 2017, Fiscal 2016 and Fiscal 2015:
|
|
|
Fiscal 2017 |
|
|
Fiscal 2016 |
|
|
Fiscal 2015 |
|
|||
|
United States |
|
$ |
18,828 |
|
|
$ |
27,033 |
|
|
$ |
4,284 |
|
|
Foreign |
|
|
8,107 |
|
|
|
9,186 |
|
|
|
9,545 |
|
|
|
|
$ |
26,935 |
|
|
$ |
36,219 |
|
|
$ |
13,829 |
|
F-28
The income tax expense (benefit) from continuing operations for Fiscal 2017, Fiscal 2016 and Fiscal 2015 consists of the following:
|
|
|
Fiscal 2017 |
|
|
Fiscal 2016 |
|
|
Fiscal 2015 |
|
|||
|
Current tax expense |
|
|
|
|
|
|
|
|
|
|
|
|
|
US Federal |
|
$ |
304 |
|
|
$ |
— |
|
|
$ |
— |
|
|
State and local |
|
|
782 |
|
|
|
869 |
|
|
|
248 |
|
|
Foreign |
|
|
2,383 |
|
|
|
2,287 |
|
|
|
1,889 |
|
|
Total current tax expense |
|
|
3,469 |
|
|
|
3,156 |
|
|
|
2,137 |
|
|
Deferred tax expense (benefit) |
|
|
|
|
|
|
|
|
|
|
|
|
|
US Federal |
|
|
(6,880 |
) |
|
|
8,024 |
|
|
|
(15,541 |
) |
|
State and local |
|
|
1,690 |
|
|
|
780 |
|
|
|
(422 |
) |
|
Foreign |
|
|
251 |
|
|
|
(3 |
) |
|
|
(342 |
) |
|
Total deferred tax expense (benefit) |
|
|
(4,939 |
) |
|
|
8,801 |
|
|
|
(16,305 |
) |
|
Income tax expense (benefit) |
|
$ |
(1,470 |
) |
|
$ |
11,957 |
|
|
$ |
(14,168 |
) |
Effective and Statutory Rate Reconciliation
The following table summarizes a reconciliation of income tax expense (benefit) for continuing operations, calculated at the US statutory federal income tax rate of 35%, to total income tax expense (benefit) for Fiscal 2017, Fiscal 2016 and Fiscal 2015:
|
|
|
Fiscal 2017 |
|
|
Fiscal 2016 |
|
|
Fiscal 2015 |
|
|||
|
Income tax expense at federal statutory rate |
|
$ |
9,427 |
|
|
$ |
12,677 |
|
|
$ |
4,840 |
|
|
Increases/(Decreases) due to: |
|
|
|
|
|
|
|
|
|
|
|
|
|
State income taxes, net of federal benefit |
|
|
1,364 |
|
|
|
1,344 |
|
|
|
(261 |
) |
|
Employment credits |
|
|
(2,112 |
) |
|
|
(1,842 |
) |
|
|
(1,785 |
) |
|
Differences due to other non-deductible expenses |
|
|
402 |
|
|
|
239 |
|
|
|
216 |
|
|
Change in valuation allowance |
|
|
363 |
|
|
|
— |
|
|
|
(2,677 |
) |
|
Change in estimate |
|
|
— |
|
|
|
(86 |
) |
|
|
527 |
|
|
Foreign tax rate differential |
|
|
(994 |
) |
|
|
(1,150 |
) |
|
|
(1,750 |
) |
|
Unremitted earnings |
|
|
— |
|
|
|
— |
|
|
|
(13,198 |
) |
|
Subpart F income |
|
|
786 |
|
|
|
639 |
|
|
|
— |
|
|
The Tax Act - transition tax |
|
|
6,457 |
|
|
|
— |
|
|
|
— |
|
|
Foreign tax credits |
|
|
(2,134 |
) |
|
|
— |
|
|
|
— |
|
|
The Tax Act - tax rate change impact on deferred taxes |
|
|
(14,978 |
) |
|
|
— |
|
|
|
— |
|
|
Out-of-period adjustment |
|
|
(160 |
) |
|
|
— |
|
|
|
(308 |
) |
|
Other |
|
|
109 |
|
|
|
136 |
|
|
|
228 |
|
|
Total income tax expense (benefit), net |
|
$ |
(1,470 |
) |
|
$ |
11,957 |
|
|
$ |
(14,168 |
) |
The significant components of the difference between Fiscal 2017 statutory rate and the annual effective tax rate are attributable to accounting for the estimated tax impact of the Tax Act, employment tax credits, statutory rate differential between foreign jurisdictions and the US, state taxes, and foreign tax credits. The significant components of the difference between the Fiscal 2016 statutory tax rate and the annual effective tax rate are attributable to employment tax credits, statutory tax rate differential between foreign jurisdictions and the US, subpart F income, nondeductible expenses, and state taxes.
During the first and second quarters of Fiscal 2017, the Company recognized discrete tax benefits of $153 and $62, respectively, resulting from refunds received related to prior year state and local income tax returns. During the third quarter of Fiscal 2017, the Company identified an error in the accounting for a prior period business acquisition resulting from the omission of tax basis related to two of its restaurants that were under construction at the time of the acquisition. The Company corrected this error in the third quarter of Fiscal 2017, which resulted in a $2,415 adjustment decreasing net deferred tax liabilities and goodwill and the recognition of a discrete tax benefit of $197.
During the first quarter of Fiscal 2015, the Company recognized a $308 discrete tax benefit related to a true-up of the deferred tax asset on Fiscal 2014 alternative minimum tax credits.
F-29
Deferred income taxes reflect the net tax effects of (a) temporary differences between the carrying amounts of assets and liabilities for financial reporting purposes and the amounts used for income tax purposes and (b) operating loss and tax credit carryforwards. These items are stated at the enacted tax rates that are expected to be in effect when taxes are actually paid or recovered.
Significant components of deferred tax assets and liabilities as of December 31, 2017 and January 1, 2017 are as follows:
|
|
|
December 31, 2017 |
|
|
January 1, 2017 |
|
||
|
Deferred tax assets |
|
|
|
|
|
|
|
|
|
Deferred revenue |
|
$ |
941 |
|
|
$ |
1,205 |
|
|
Tenant allowances |
|
|
3,915 |
|
|
|
4,840 |
|
|
Capitalized transaction costs |
|
|
1,352 |
|
|
|
2,276 |
|
|
Deferred rent liability |
|
|
2,765 |
|
|
|
3,206 |
|
|
Net operating loss carryforwards |
|
|
561 |
|
|
|
4,992 |
|
|
Wage credit carryforward |
|
|
12,967 |
|
|
|
10,782 |
|
|
Favorable/Unfavorable leases |
|
|
141 |
|
|
|
290 |
|
|
Accrued expenses |
|
|
629 |
|
|
|
808 |
|
|
Share-based compensation |
|
|
1,775 |
|
|
|
2,517 |
|
|
Foreign tax credit carryforward |
|
|
589 |
|
|
|
— |
|
|
AMT credit carryforward |
|
|
677 |
|
|
|
771 |
|
|
Other |
|
|
451 |
|
|
|
141 |
|
|
Total deferred tax assets |
|
|
26,763 |
|
|
|
31,828 |
|
|
Deferred tax liabilities |
|
|
|
|
|
|
|
|
|
Tax depreciation in excess of book depreciation |
|
|
(11,683 |
) |
|
|
(14,798 |
) |
|
Goodwill and intangible assets |
|
|
(28,773 |
) |
|
|
(38,428 |
) |
|
Valuation allowance |
|
|
(458 |
) |
|
|
— |
|
|
Other |
|
|
(1 |
) |
|
|
(96 |
) |
|
Total deferred tax liabilities |
|
|
(40,915 |
) |
|
|
(53,322 |
) |
|
Net deferred tax liabilities |
|
$ |
(14,152 |
) |
|
$ |
(21,494 |
) |
The Company has net deductible goodwill for income tax purposes of $62,583 at December 31, 2017.
The Company has gross US federal net operating loss carryforwards in the amount of $12,701 at January 1, 2017, which are expected to be fully utilized at December 31, 2017. The Company has foreign net operating losses of $926 at December 31, 2017 and $405 at January 1, 2017 which will begin to expire in 2023. The Company has state net operating loss carryforwards in various states in the amount of $4,767 that expire over the next 17 years. The Company has AMT credit carryforwards of $677. As a result of TCJA, the Company can claim up to 50% of the total credit to offset regular tax starting in tax year 2018 with the remaining credit amount refundable by 2021. The international AMT credit carryforward can be carried forward indefinitely. The Company has general business tax credit carryforwards of approximately $12,967 which begin to expire in 2033 - 2037 and foreign tax credit carryforwards of $589 which begin to expire in 2027. Immediately before expiration, unused general business credits may be claimed as a deduction in the following year.
The Company had historically provided deferred taxes under ASC 740-30-25, formerly APB 23, for the presumed repatriation to the US of earnings from the Company’s Brazilian subsidiaries. In June 2015, the Company asserted that the outside basis difference, including undistributed earnings, of its Brazilian subsidiaries would be indefinitely reinvested in operations outside the US. This was primarily driven by a reduction in debt service costs on a go-forward basis as a result of the IPO. The assertion was supported by future US cash projections and the Company’s intent to continue using foreign-generated cash to invest in foreign restaurants. As a result of the change in assertion, the Company reduced its deferred tax liabilities related to undistributed foreign earnings by $13,877. In 2016, the Company effectuated an internal restructuring whereby it created a new Dutch holding company, FDC Netherlands Coöperatief U.A. (“Fogo Co-op”) and contributed all of its Brazilian subsidiaries to Fogo Co-op. For US federal income tax purposes, this transaction was structured as a tax-free reorganization. Since the restructuring, Fogo Co-op is treated as the regarded or separate legal entity for US federal income tax purposes and the Brazilian entities are branches or divisions of Fogo Co-op. Consequently, income or losses earned by the Brazilian entities are deemed to be earned by Fogo Co-op for US federal income tax purposes.
F-30
The Company is not able to determine a reasonable estimate of the deferred tax liability, if any, that would be recorded if the Company were to change its indefinite reinvestment assertion. Missing or incomplete information relevant to this analysis includes tax basis and book basis in the shares of Fogo Co-op. In addition, the undistributed earnings of approximately $51,468 related to Fogo Co-Op could be subject to state income tax or withholding tax. Pursuant to SAB 118, the Company will continue to apply ASC 740 based on the provisions of the tax law in effect immediately prior to the enactment of the Tax Act, including the historical indefinite reinvestment assertion with respect to the outside basis differences.
During 2018, the Company will analyze the impact of the Tax Act on its indefinite reinvestment assertion. This analysis will consider the impact of previously taxed earnings created under section 965, the application of the new section 245A dividends received deduction, the impact of the new section 951A GILTI tax rules, state law changes, the existence of an outside basis difference in excess of earnings, currency translation adjustment impacts, and shifts in the global business environment resulting from the Tax Act.
ASC 740 requires that the Company reduce its deferred income tax assets by a valuation allowance if, based on the weight of the available evidence, it is more likely than not that all or a portion of a deferred tax asset will not be realized. The ultimate realization of deferred tax assets is dependent upon the generation of future taxable income during the periods in which those temporary differences are deductible. In 2015, the Company made the decision to release its valuation allowance against its net deferred tax asset. The decision to release the valuation allowance was triggered in conjunction with the IPO. Reduced debt service costs and historic cumulative earnings (US pretax income plus permanent tax differences) were all sources of positive evidence that led the Company to believe that it was more likely than not that it would be able to realize its net deferred tax assets. In 2017, the Company made the decision to record a valuation allowance against its deferred tax assets in Puerto Rico. The Company is in an overall cumulative three year loss position driven primarily by losses generated in 2017 due to the negative impact of hurricane Maria.
Changes in the valuation allowance for deferred tax assets were as follows:
|
|
|
Fiscal 2017 |
|
|
Fiscal 2016 |
|
|
Fiscal 2015 |
|
|||
|
Valuation allowance as of the beginning of the year |
|
$ |
— |
|
|
$ |
— |
|
|
$ |
2,837 |
|
|
Charge as (benefit) expense to income tax provision |
|
|
458 |
|
|
|
— |
|
|
|
(2,837 |
) |
|
Changes to other comprehensive income |
|
|
— |
|
|
|
— |
|
|
|
— |
|
|
Valuation allowance as of end of year |
|
$ |
458 |
|
|
$ |
— |
|
|
$ |
— |
|
The Company had no unrecognized tax benefits as of December 31, 2017, January 1, 2017 and January 3, 2016. The Company is subject to income taxes in the US federal jurisdiction and various states and foreign jurisdictions. Tax regulations within each jurisdiction are subject to the interpretation of the related tax laws and regulations and require significant judgment to apply. The Company has considered whether there are any uncertain tax positions, and has determined that there are no such uncertain tax positions.
The Company is potentially subject to income tax audits in numerous jurisdictions in the US and internationally until the applicable statute of limitations expires. The following is a summary of tax years potentially subject to examination and/or adjustment in the significant tax and business jurisdictions in which the company operates:
|
Jurisdiction |
|
Tax Years Subject to Examination |
|
United States (Federal, state, local) |
|
2013 - 2016 |
|
Brazil |
|
2011 - 2016 |
|
Puerto Rico |
|
2014 - 2016 |
|
Mexico |
|
2015 - 2016 |
|
Netherlands |
|
2015 - 2016 |
15. Commitments and Contingencies
Lease Commitments
The Company leases its corporate office and various of its restaurant locations under non-cancelable operating leases. These leases have initial lease terms of between ten and twenty years and can be extended in five-year increments. These leases generally provide for minimum annual rental payments that are subject to periodic escalations that are fixed or in some cases, based upon increases in specific inflation indexes as stipulated in the non-cancelable operating lease.
F-31
Certain lease arrangements have contingent rental payments based on net sales thresholds per the lease agreement. Accrued liability for contingent rent was $235 and $197 as of December 31, 2017 and January 1, 2017, respectively. These balances are included in accounts payable and accrued expenses in the consolidated balance sheets.
Future minimum lease payments for non-cancelable leases (excluding contingent rental payments) are as follows:
|
2018 |
|
$ |
21,874 |
|
|
2019 |
|
|
21,374 |
|
|
2020 |
|
|
21,299 |
|
|
2021 |
|
|
20,884 |
|
|
2022 |
|
|
19,485 |
|
|
Thereafter |
|
|
88,067 |
|
|
Total |
|
$ |
192,983 |
|
The following table presents the components of rent expense, attributable to non-cancelable operating leases for the Company’s corporate office and restaurant locations, for Fiscal 2017, 2016 and 2015. Favorable lease assets and liabilities are amortized to rent expense on a straight-line basis over each respective operating lease term. The amortization of favorable lease assets increases rent expense, while the amortization of unfavorable lease liabilities decreases rent expense.
|
|
|
Fiscal 2017 |
|
|
Fiscal 2016 |
|
|
Fiscal 2015 |
|
|||
|
Rent expense |
|
$ |
24,043 |
|
|
$ |
21,033 |
|
|
$ |
18,352 |
|
|
Contingent rent expense |
|
|
356 |
|
|
|
180 |
|
|
|
217 |
|
|
Amortization lease assets |
|
|
(165 |
) |
|
|
(188 |
) |
|
|
(185 |
) |
|
Total rent expense |
|
$ |
24,234 |
|
|
$ |
21,025 |
|
|
$ |
18,384 |
|
Litigation
The Union of Workers in Hotels, Apart-Hotels, Motels, Flats, Restaurants, Bars, Snack Bars and Similar in São Paulo and the Region (the “Union of Workers”) brought claims in 2011 on behalf of certain employees of one of the Company’s São Paulo restaurants asserting that the restaurant charged mandatory tips and did not properly calculate compensation payable to or for the benefit of those employees. The claims were initially dismissed in 2011 but the Union of Workers pursued various appeals of its claims. A regional labor court rendered a decision in 2014 that partially granted one of the Union of Workers appeals and ordered the restaurant to make unquantified payments based on its determination that the restaurant charged mandatory tips. At that time, the restaurant recorded a reserve of R$100 (Brazilian Real), the amount established by the judge for the calculation of court fees. The restaurant appealed to the superior labor court, which did not grant the appeal. The decision of the regional labor court became final in November 2015 and the claims were remitted to the first labor court. The Company entered into an agreement with the Union of Workers to resolve the claims; the labor court judge signed on May 23, 2017 an order approving the agreement. The Union of Workers also represents certain employees of our other four locations in São Paulo. The Union of Workers negotiated a new collective agreement applicable for the period 2015 through 2017. Based on the terms of the new agreement, the Company believes that the Union of Workers should not now be able to assert the same claims on behalf of employees of the four São Paulo restaurants that were not covered by the prior decision. Nonetheless, in light of the inherent uncertainties involved in Brazilian labor matters, there can be no assurance that the Union of Workers will not pursue such claims and, if so, that such claims would be rejected; an adverse outcome could materially and adversely affect the Company’s financial condition, results of operations or cash flows in any particular reporting period.
The Company is currently involved in various other claims, investigations and legal actions that arise in the ordinary course of its business, including claims and investigations resulting from employment-related matters. None of these matters, many of which are covered by insurance, has had a material effect on the Company. The Company is not party to any material pending legal proceedings and is not aware of any claims that could have a material adverse effect on its business, financial condition, results of operations or cash flows. However, a significant increase in the number of these claims or an increase in amounts owing under successful claims could materially and adversely affect the Company’s business, financial condition, results of operations or cash flows.
F-32
The Company relies on one supplier for substantially all of its beef purchases for its operations in the US. However, the Company believes the products purchased through this supplier are widely available at similar prices from multiple suppliers. The Company does not anticipate any significant risk to its business in the event that this supplier is no longer available to provide goods or services. However, a change in suppliers could potentially result in different costs. We do not have any supply agreements or distribution agreements in Brazil that have concentration on one vendor.
17. Segment Reporting
The Company owns and operates full-service Brazilian steakhouses in the United States and Brazil under the brand name Fogo de Chão. Each restaurant operates with similar types of products and menus, providing a continuous service style, irrespective of location. Sales from external customers are derived principally from food and beverage sales, and the Company does not rely on any major customers as a source of sales. The Company’s joint venture in Mexico is included in the United States for segment reporting purposes as the operations of the joint venture are monitored by the United States segment management.
The Company’s chief operating decision maker evaluates segment performance using restaurant contribution, which is not a measure defined by GAAP. Restaurant contribution is a key metric used by the Company to evaluate the profitability of incremental sales at its restaurants, to evaluate restaurant performance across periods and to evaluate restaurant financial performance compared with competitors. Restaurant contribution is calculated as revenue from restaurant sales less restaurant operating costs (which includes food and beverage costs, compensation and benefits costs and occupancy and other operating costs but excludes depreciation and amortization expense).
The following table presents the financial information of the Company’s operating segments for Fiscal 2017, Fiscal 2016 and Fiscal 2015.
|
|
|
Fiscal 2017 |
|
|
Fiscal 2016 |
|
|
Fiscal 2015 |
|
|||
|
Revenue restaurant sales |
|
|
|
|
|
|
|
|
|
|
|
|
|
United States(a) |
|
$ |
271,712 |
|
|
$ |
245,381 |
|
|
$ |
227,073 |
|
|
Brazil |
|
|
42,255 |
|
|
|
42,753 |
|
|
|
44,425 |
|
|
Total segment revenue from restaurant sales |
|
$ |
313,967 |
|
|
$ |
288,134 |
|
|
$ |
271,498 |
|
|
Restaurant contribution |
|
|
|
|
|
|
|
|
|
|
|
|
|
United States |
|
$ |
75,440 |
|
|
$ |
72,117 |
|
|
$ |
70,515 |
|
|
Brazil |
|
|
12,370 |
|
|
|
13,495 |
|
|
|
14,544 |
|
|
Total segment restaurant contribution |
|
$ |
87,810 |
|
|
$ |
85,612 |
|
|
$ |
85,059 |
|
|
(a) |
Includes $3,449, $4,239 and $4,450 for Fiscal 2017, Fiscal 2016 and Fiscal 2015, respectively, attributable to the Company’s restaurant in Puerto Rico. Includes $4,140, $3,826 and $3,659 for Fiscal 2017, Fiscal 2016 and Fiscal 2015, respectively, attributable to the joint venture in Mexico. |
F-33
The following table sets forth the reconciliation of total segment contribution to consolidated income before income taxes for Fiscal 2017, Fiscal 2016 and Fiscal 2015.
|
|
|
Fiscal 2017 |
|
|
Fiscal 2016 |
|
|
Fiscal 2015 |
|
|||
|
Total segment restaurant contribution |
|
$ |
87,810 |
|
|
$ |
85,612 |
|
|
$ |
85,059 |
|
|
Add: |
|
|
|
|
|
|
|
|
|
|
|
|
|
Other revenue |
|
|
392 |
|
|
|
162 |
|
|
|
136 |
|
|
Less: |
|
|
|
|
|
|
|
|
|
|
|
|
|
Marketing and advertising costs |
|
|
8,069 |
|
|
|
7,132 |
|
|
|
6,618 |
|
|
General and administrative costs |
|
|
23,321 |
|
|
|
20,576 |
|
|
|
32,566 |
|
|
Pre-opening costs |
|
|
3,773 |
|
|
|
3,580 |
|
|
|
4,858 |
|
|
Loss on extinguishment/modification debt |
|
|
— |
|
|
|
— |
|
|
|
5,991 |
|
|
Non-cash impairment charges |
|
|
4,188 |
|
|
|
320 |
|
|
|
— |
|
|
Depreciation and amortization |
|
|
19,037 |
|
|
|
15,729 |
|
|
|
12,471 |
|
|
Other operating (income) expense, net |
|
|
330 |
|
|
|
21 |
|
|
|
(291 |
) |
|
Income from operations |
|
|
29,484 |
|
|
|
38,416 |
|
|
|
22,982 |
|
|
Other income (expense), net |
|
|
(2,549 |
) |
|
|
(2,197 |
) |
|
|
(9,153 |
) |
|
Income before income taxes |
|
$ |
26,935 |
|
|
$ |
36,219 |
|
|
$ |
13,829 |
|
The following table sets forth the reconciliation total segment revenue from restaurant sales to total consolidated revenues for Fiscal 2017, Fiscal 2016 and Fiscal 2015.
|
|
|
Fiscal 2017 |
|
|
Fiscal 2016 |
|
|
Fiscal 2015 |
|
|||
|
Total segment revenue from restaurant sales |
|
$ |
313,967 |
|
|
$ |
288,134 |
|
|
$ |
271,498 |
|
|
Add: |
|
|
|
|
|
|
|
|
|
|
|
|
|
Other revenue |
|
|
392 |
|
|
|
162 |
|
|
|
136 |
|
|
Total revenues |
|
$ |
314,359 |
|
|
$ |
288,296 |
|
|
$ |
271,634 |
|
The table below sets forth the property and equipment attributable to each segment as of December 31, 2017 and January 1, 2017.
|
|
|
December 31, |
|
|
January 1, |
|
||
|
|
|
2017 |
|
|
2017 |
|
||
|
Property and equipment, net |
|
|
|
|
|
|
|
|
|
United States(a) |
|
$ |
159,514 |
|
|
$ |
148,161 |
|
|
Brazil |
|
|
8,649 |
|
|
|
9,668 |
|
|
Total segment property and equipment, net |
|
|
168,163 |
|
|
|
157,829 |
|
|
Corporate office(b) |
|
|
5,382 |
|
|
|
1,021 |
|
|
Total property and equipment, net |
|
$ |
173,545 |
|
|
$ |
158,850 |
|
|
(a) |
Property and equipment, net as of December 31, 2017 and January 1, 2017, includes $3,100 and $3,370, respectively, attributable to the Company’s restaurant in Puerto Rico and includes $1,665 and $1,912, respectively, attributable to the joint venture in Mexico. |
|
(b) |
Property and equipment, net attributable to the Company’s corporate office in the US. |
The table below sets forth the capital expenditures attributable to each segment during Fiscal 2017, Fiscal 2016 and Fiscal 2015.
|
|
|
Fiscal 2017 |
|
|
Fiscal 2016 |
|
|
Fiscal 2015 |
|
|||
|
Capital expenditures |
|
|
|
|
|
|
|
|
|
|
|
|
|
United States(a) |
|
$ |
32,498 |
|
|
$ |
34,519 |
|
|
$ |
36,165 |
|
|
Brazil |
|
|
744 |
|
|
|
1,659 |
|
|
|
3,595 |
|
|
Total capital expenditures(b) |
|
$ |
33,242 |
|
|
$ |
36,178 |
|
|
$ |
39,760 |
|
|
(a) |
Amount for Fiscal 2017, Fiscal 2016 and Fiscal 2015 includes $28, $845 and $1,106, respectively, attributable to the joint venture in Mexico. Amount for Fiscal 2017, Fiscal 2016 and Fiscal 2015 excludes $4,922, $539 and $445, respectively, attributable to the Company's corporate office in the US. |
F-34
|
(b) |
Total capital expenditures include non-cash capital expenditures included within accounts payable and accrued expenses as of the end of the each respective period. |
The table below sets forth total assets as of December 31, 2017 and January 1, 2017.
|
|
|
December 31, |
|
|
January 1, |
|
||
|
|
|
2017 |
|
|
2017 |
|
||
|
Total assets |
|
|
|
|
|
|
|
|
|
United States(a) |
|
$ |
442,484 |
|
|
$ |
425,961 |
|
|
Brazil |
|
|
100,052 |
|
|
|
95,346 |
|
|
Netherlands(b) |
|
|
77 |
|
|
|
1,088 |
|
|
Total assets |
|
$ |
542,613 |
|
|
$ |
522,395 |
|
|
(a) |
Total assets as of December 31, 2017 and January 1, 2017 include total assets of $2,652 and $2,991, respectively, attributable to the joint venture in Mexico that may only be used to settle the obligations of the joint venture. For both periods presented, total assets include assets attributable to the Company’s corporate office in the United States and assets that are not directly attributable to restaurant operations. For both periods presented, total assets include assets attributable to the Company’s restaurant in Puerto Rico which is primarily property and equipment. |
|
(b) |
Includes $20 and $1,059 in cash and cash equivalents as of December 31, 2017 and January 1, 2017, respectively. Cash and cash equivalents are primarily due to distributions from the Company’s Brazilian entity. |
18. Condensed Financial Information for Parent Company
Fogo de Chão, Inc. has no material assets or standalone operations other than its ownership in Brasa Holdings and its subsidiaries.
The 2015 Credit Facility agreement includes restrictions on Fogo de Chão, Inc.’s ability to obtain funds from any of its subsidiaries through dividends, loans or advances. Accordingly, this condensed financial information has been presented on a “Parent-only” basis. Under a Parent-only presentation, Fogo de Chão, Inc.’s investments in its consolidated subsidiaries are presented under the equity method of accounting.
This parent company financial information should be read in conjunction with the Company’s consolidated financial statements and the accompanying notes thereto. For purposes of this condensed financial information, the Company’s wholly owned and majority owned subsidiaries are recorded based upon its proportionate share of the subsidiaries’ net assets (similar to presenting them on the equity method).
The following tables present the financial position of Fogo de Chão, Inc. as of December 31, 2017 and January 1, 2017, and the results of its operations for Fiscal 2017, Fiscal 2016 and Fiscal 2015.
|
|
|
December 31, |
|
|
January 1, |
|
||
|
|
|
2017 |
|
|
2017 |
|
||
|
Assets: |
|
|
|
|
|
|
|
|
|
Investments in Brasa (Holdings) Inc. and its subsidiaries |
|
$ |
319,009 |
|
|
$ |
290,644 |
|
|
Total assets |
|
$ |
319,009 |
|
|
$ |
290,644 |
|
|
Shareholders' Equity: |
|
|
|
|
|
|
|
|
|
Preferred stock, $0.01 par value, 15,000,000 shares authorized, no shares issued and outstanding as of December 31, 2017 and January 1, 2017 |
|
$ |
— |
|
|
$ |
— |
|
|
Common stock, $0.01 par value, 200,000,000 shares authorized, 28,254,732 and 28,211,586 shares issued and outstanding as of December 31, 2017 and January 1, 2017, respectively |
|
|
282 |
|
|
|
282 |
|
|
Additional paid-in capital |
|
|
276,021 |
|
|
|
275,237 |
|
|
Accumulated earnings |
|
|
88,677 |
|
|
|
59,888 |
|
|
Accumulated other comprehensive loss |
|
|
(45,971 |
) |
|
|
(44,763 |
) |
|
Total shareholders' equity |
|
$ |
319,009 |
|
|
$ |
290,644 |
|
F-35
|
|
|
Fiscal 2017 |
|
|
Fiscal 2016 |
|
|
Fiscal 2015 |
|
|||
|
Equity in net income of Brasa (Holdings) Inc. and its subsidiaries |
|
$ |
28,789 |
|
|
$ |
24,437 |
|
|
$ |
27,865 |
|
|
Net income attributable to Fogo de Chão, Inc. |
|
|
28,789 |
|
|
|
24,437 |
|
|
|
27,865 |
|
|
Other comprehensive income (loss) |
|
|
(1,208 |
) |
|
|
14,702 |
|
|
|
(29,745 |
) |
|
Comprehensive income (loss) |
|
$ |
27,581 |
|
|
$ |
39,139 |
|
|
$ |
(1,880 |
) |
|
Basic earnings per share |
|
$ |
1.02 |
|
|
$ |
0.87 |
|
|
$ |
1.09 |
|
|
Diluted earnings per share |
|
$ |
1.00 |
|
|
$ |
0.85 |
|
|
$ |
1.06 |
|
|
Basic weighted average shares outstanding |
|
|
28,227,747 |
|
|
|
28,119,196 |
|
|
|
25,519,312 |
|
|
Diluted weighted average shares outstanding |
|
|
28,802,819 |
|
|
|
28,822,616 |
|
|
|
26,324,115 |
|
There were no cash flows at the parent company during Fiscal 2017, Fiscal 2016 or Fiscal 2015.
19. Related-Party Transactions
The Company and its wholly-owned subsidiaries entered into an agreement with an affiliated entity of its private equity fund owners (“Sponsor”) to provide management, consulting and financial and other advisory services to the Company (the “Advisory Services Agreement”). The Advisory Services Agreement required the Company to pay Sponsor a non-refundable periodic retainer fee in an amount per year of the greater of $750 or 1.50% of Consolidated EBITDA, as defined in the Advisory Services Agreement, for the immediately preceding fiscal year. The Advisory Services Agreement was terminated upon the consummation of the IPO and the Company paid a one-time fee of $7,544 to terminate the Advisory Services Agreement. Prior to the termination of the Advisory Services Agreement, the Company recorded $593 of expense during Fiscal 2015, attributable to periodic retainer fees. These amounts, including the one-time termination fee, are included in general and administrative costs in the consolidated statement of operations and comprehensive income (loss) for the fiscal year ended January 3, 2016. The Company had no outstanding payable due Sponsor at January 3, 2016 related to the Advisory Services Agreement.
In February 2015, the Company entered into three Director Securities Purchase Agreements pursuant to which the Company issued and sold to three independent directors 9,292 shares of common stock each, at a purchase price of $10.78 per share.
20. Quarterly Financial Data (unaudited)
The following tables set forth certain unaudited consolidated financial information for each of the four quarters in Fiscal 2017 and Fiscal 2016 (in thousands, except share per share data):
|
|
|
Fiscal 2017 |
|
|||||||||||||
|
|
|
Q4 |
|
|
Q3 |
|
|
Q2 |
|
|
Q1 |
|
||||
|
|
|
(13 weeks) |
|
|
(13 weeks) |
|
|
(13 weeks) |
|
|
(13 weeks) |
|
||||
|
Revenue |
|
$ |
88,842 |
|
|
$ |
71,404 |
|
|
$ |
77,758 |
|
|
$ |
76,355 |
|
|
Income from operations |
|
$ |
8,749 |
|
|
$ |
4,536 |
|
|
$ |
8,291 |
|
|
$ |
7,908 |
|
|
Net income |
|
$ |
15,653 |
|
|
$ |
2,519 |
|
|
$ |
5,274 |
|
|
$ |
4,959 |
|
|
Net income attributable to Fogo de Chão, Inc. |
|
$ |
15,627 |
|
|
$ |
2,709 |
|
|
$ |
5,414 |
|
|
$ |
5,039 |
|
|
Earnings per common share attributable to Fogo de Chão, Inc.: |
|
|
|
|
|
|
|
|
|
|
|
|
|
|
|
|
|
Basic |
|
$ |
0.55 |
|
|
$ |
0.10 |
|
|
$ |
0.19 |
|
|
$ |
0.18 |
|
|
Diluted |
|
$ |
0.54 |
|
|
$ |
0.09 |
|
|
$ |
0.19 |
|
|
$ |
0.17 |
|
|
Weighted average common shares outstanding: |
|
|
|
|
|
|
|
|
|
|
|
|
|
|
|
|
|
Basic |
|
|
28,249,723 |
|
|
|
28,234,889 |
|
|
|
28,214,065 |
|
|
|
28,212,489 |
|
|
Diluted |
|
|
28,690,654 |
|
|
|
28,793,488 |
|
|
|
28,880,315 |
|
|
|
28,846,996 |
|
F-36
|
|
|
Fiscal 2016 |
|
|||||||||||||
|
|
|
Q4 |
|
|
Q3 |
|
|
Q2 |
|
|
Q1 |
|
||||
|
|
|
(13 weeks) |
|
|
(13 weeks) |
|
|
(13 weeks) |
|
|
(13 weeks) |
|
||||
|
Revenue |
|
$ |
80,877 |
|
|
$ |
69,012 |
|
|
$ |
69,550 |
|
|
$ |
68,857 |
|
|
Income from operations |
|
$ |
12,102 |
|
|
$ |
7,237 |
|
|
$ |
9,728 |
|
|
$ |
9,349 |
|
|
Net income |
|
$ |
7,712 |
|
|
$ |
4,492 |
|
|
$ |
6,066 |
|
|
$ |
5,992 |
|
|
Net income attributable to Fogo de Chão, Inc. |
|
$ |
7,698 |
|
|
$ |
4,579 |
|
|
$ |
6,190 |
|
|
$ |
5,970 |
|
|
Earnings per common share attributable to Fogo de Chão, Inc.: |
|
|
|
|
|
|
|
|
|
|
|
|
|
|
|
|
|
Basic |
|
$ |
0.27 |
|
|
$ |
0.16 |
|
|
$ |
0.22 |
|
|
$ |
0.21 |
|
|
Diluted |
|
$ |
0.27 |
|
|
$ |
0.16 |
|
|
$ |
0.21 |
|
|
$ |
0.21 |
|
|
Weighted average common shares outstanding: |
|
|
|
|
|
|
|
|
|
|
|
|
|
|
|
|
|
Basic |
|
|
28,193,400 |
|
|
|
28,119,343 |
|
|
|
28,086,942 |
|
|
|
28,077,537 |
|
|
Diluted |
|
|
28,751,247 |
|
|
|
28,743,358 |
|
|
|
28,880,226 |
|
|
|
28,916,072 |
|
Q4 Fiscal 2017
During the fourth quarter of Fiscal 2017, the Company recognized a $4,188 non-cash impairment charge related to the reduction in the carrying value of an underperforming restaurant in the US. See Note 3.
During the fourth quarter of Fiscal 2017, the Company recorded a $14,978 tax benefit, related to the re-measurement of deferred tax assets and liabilities, and a $6,457 tax expense, related to one-time repatriation inclusion of foreign earnings, as a result of tax reform legislation enacted during the period. See Note 14.
During the fourth quarter of Fiscal 2017, the Company recorded a $2,134 benefit related to foreign tax credits. See Note 14.
Q4 Fiscal 2016
During the fourth quarter of Fiscal 2016, the Company recognized a $320 non-cash impairment charge related to the reduction in the carrying value of an underperforming restaurant in Brazil. See Note 3.
F-37