Attached files
| file | filename |
|---|---|
| 8-K - 8-K - CVB FINANCIAL CORP | d496059d8k.htm |
| Exhibit 99.1
|
Exhibit 99.1
CVB Financial Corp. March 2018 cbbank.com
|
Forward Looking Statements Certain matters set forth herein (including the exhibits hereto) constitute forward-looking statements within the meaning of the Private Securities Litigation Reform Act of 1995, including forward-looking statements relating to our current business plans and expectations and our future financial position and operating results. Words such as “will likely result”, “aims”, “anticipates”, “believes”, “could”, “estimates”, “expects”, “hopes”, “intends”, “may”, “plans”, “projects”, “seeks”, “should”, “will,” “strategy”, “possibility”, and variations of these words and similar expressions help to identify these forward looking statements, which involve risks and uncertainties. These forward-looking statements are subject to risks and uncertainties that could cause actual results, performance and/or achievements to differ materially from those projected. These risks and uncertainties include, but are not limited to, local, regional, national and international economic and market conditions and political events and the impact they may have on us, our customers and our assets and liabilities; our ability to attract deposits and other sources of funding or liquidity; supply and demand for real estate and periodic deterioration in real estate prices and/or values in California or other states where we lend, including both residential and commercial real estate; a sharp or prolonged slowdown or decline in real estate construction, sales or leasing activities; changes in the financial performance and/or condition of our borrowers, depositors, key vendors or counterparties; changes in our levels of delinquent loans, nonperforming assets, allowance for loan losses and charge-offs; the costs or effects of our pending merger with Community Bank or other mergers, acquisitions or dispositions we may make, whether we are able to obtain any required governmental approvals in connection with any such acquisitions or dispositions, and/or our ability to realize the contemplated financial or business benefits associated with any such acquisitions or dispositions; our ability to realize cost savings and business synergies in connection with our agreement to merge with Community Bank within expected time frames or at all; the effect of changes in laws, regulations and applicable judicial decisions (including laws, regulations and judicial decisions concerning financial reforms, taxes, banking capital levels, allowance for loan losses, consumer, commercial or secured lending, securities and securities trading and hedging, bank operations, compliance, fair lending, employment, executive compensation, insurance, cybersecurity, vendor management and information technology) with which we and our subsidiaries must comply or believe we should comply or which may otherwise impact us; the effects of additional legal and regulatory requirements to which we may become subject in the event our total assets exceed $10 billion; changes in estimates of future reserve requirements and minimum capital requirements based upon the periodic review thereof under relevant regulatory and accounting requirements, including changes in the Basel Committee framework establishing capital standards for credit, operations and market risk; the accuracy of the assumptions and estimates and the absence of technical error in implementation or calibration of models used to estimate the fair value of financial instruments or expected credit losses or delinquencies; inflation, changes in market interest rates, securities market and monetary fluctuations; changes in government-established interest rates or monetary policies; changes in the amount and availability of deposit insurance; disruptions in the infrastructure that supports our business and the communities where we are located, which are concentrated in California, involving or related to physical site access and/or communication facilities; cyber incidents; or theft or loss of Company or customer data or money; political uncertainty or instability; acts of war or terrorism, or natural disasters, such as earthquakes, drought, or the effects of pandemic diseases; the timely development and acceptance of new banking products and services and the perceived overall value of these products and services by our customers and potential customers; the Company’s relationships with and reliance upon vendors with respect to the operation of certain of the Company’s key internal and external systems and applications; changes in commercial or consumer spending, borrowing and savings preferences or behaviors; technological changes and the expanding use of technology in banking and financial services (including the adoption of mobile banking and funds transfer applications); our ability to retain and increase market share, retain and grow customers and control expenses; changes in the competitive environment among financial and bank holding companies, banks and other financial service and technology providers; competition and innovation with respect to financial products and services by banks, financial institutions and non-traditional providers including retail businesses and technology companies, volatility in the credit and equity markets and its effect on the general economy or local or regional business conditions or on the Company’s customers; fluctuations in the price of the Company’s common stock or other securities; and the resulting impact on the Company’s ability to raise capital or make acquisitions, the effect of changes in accounting policies and practices, as may be adopted from time-to-time by our regulatory agencies, as well as by the Public Company Accounting Oversight Board, the Financial Accounting Standards Board and other accounting standard-setters; changes in our organization, management, compensation and benefit plans, and our ability to retain or expand our workforce, management team and/or our board of directors; the costs and effects of legal, compliance and regulatory actions, changes and developments, including the initiation and resolution of legal proceedings (including securities, bank operations, consumer or employee class action litigation), the possibility that any settlement of any putative class action lawsuits may not be approved by the relevant court or that significant numbers of putative class members may opt out of any settlement; regulatory or other governmental inquiries or investigations, and/or the results of regulatory examinations or reviews; our ongoing relations with our various federal and state regulators, including the SEC, Federal Reserve Board, FDIC and California DBO; our success at managing the risks involved in the foregoing items and all other factors set forth in the Company’s public reports, including its Annual Report on Form 10-K for the year ended December 31, 2017, and particularly the discussion of risk factors within that document. The Company does not undertake, and specifically disclaims any obligation, to update any forward-looking statements to reflect occurrences or unanticipated events or circumstances after the date of such statements except as required by law. Any statements about future operating results, such as those concerning accretion and dilution to our earnings or shareholders, are for illustrative purposes only, are not forecasts, and actual results may differ. The terms the “Company,” “we,” “us,” or “our” refer to CVB Financial Corp. on a consolidated basis. cbbank.com 2
|
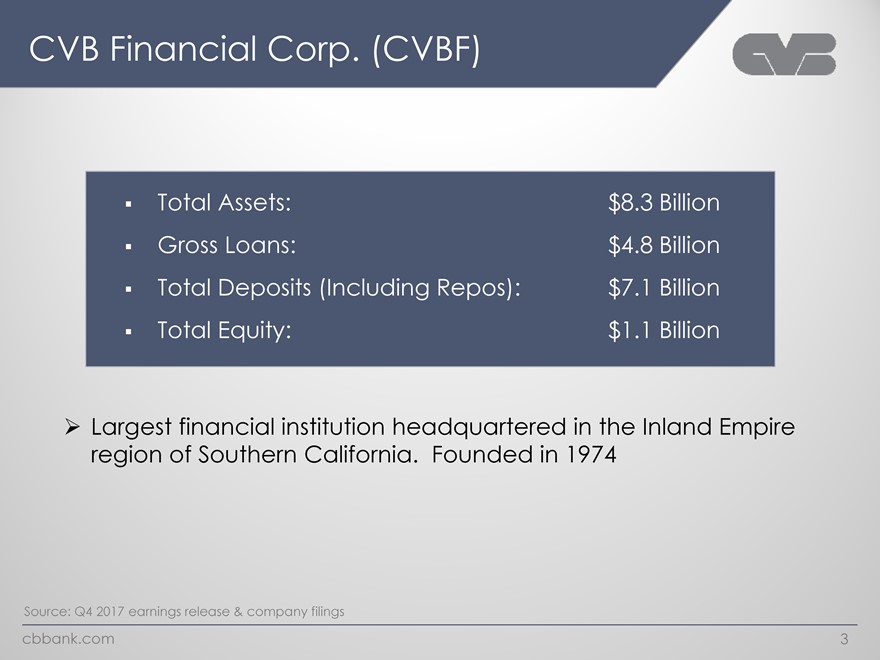
CVB Financial Corp. (CVBF) ï,§ Total Assets: $8.3 Billionï,§ Gross Loans: $4.8 Billionï,§ Total Deposits (Including Repos): $7.1 Billionï,§ Total Equity: $1.1 Billion ïƒ~ Largest financial institution headquartered in the Inland Empire region of Southern California. Founded in 1974 Source: Q4 2017 earnings release & company filings cbbank.com 3
|
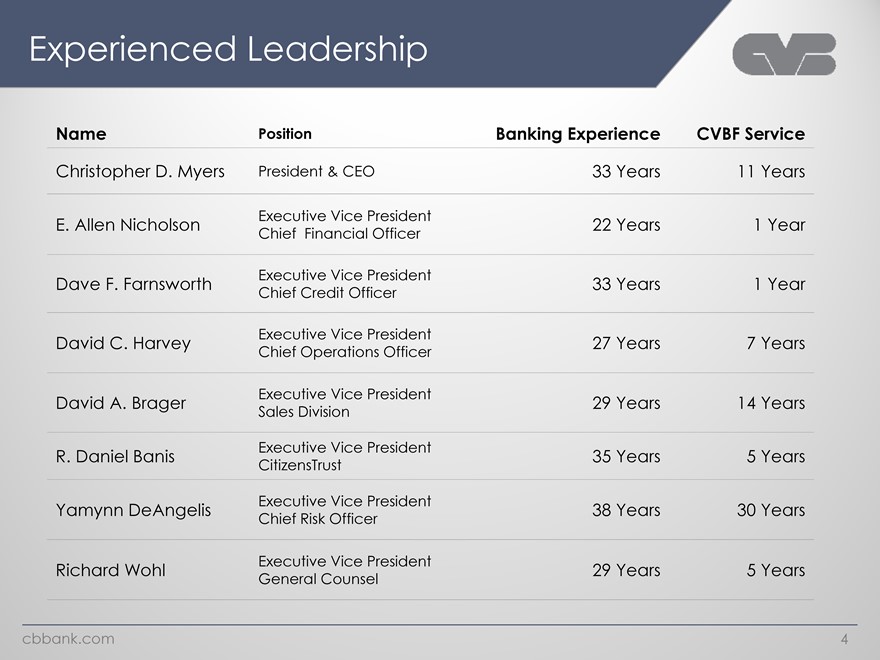
Experienced Leadership Name Position Banking Experience CVBF Service Christopher D. Myers President & CEO 33 Years 11 Years E. Allen Nicholson Executive Vice President 22 Years 1 Year Chief Financial Officer Dave F. Farnsworth Executive Vice President 33 Years 1 Year Chief Credit Officer David C. Harvey Executive Vice President 27 Years 7 Years Chief Operations Officer David A. Brager Executive Vice President 29 Years 14 Years Sales Division R. Daniel Banis Executive Vice President 35 Years 5 Years CitizensTrust Yamynn DeAngelis Executive Vice President 38 Years 30 Years Chief Risk Officer Richard Wohl Executive Vice President 29 Years 5 Years General Counsel cbbank.com 4
|
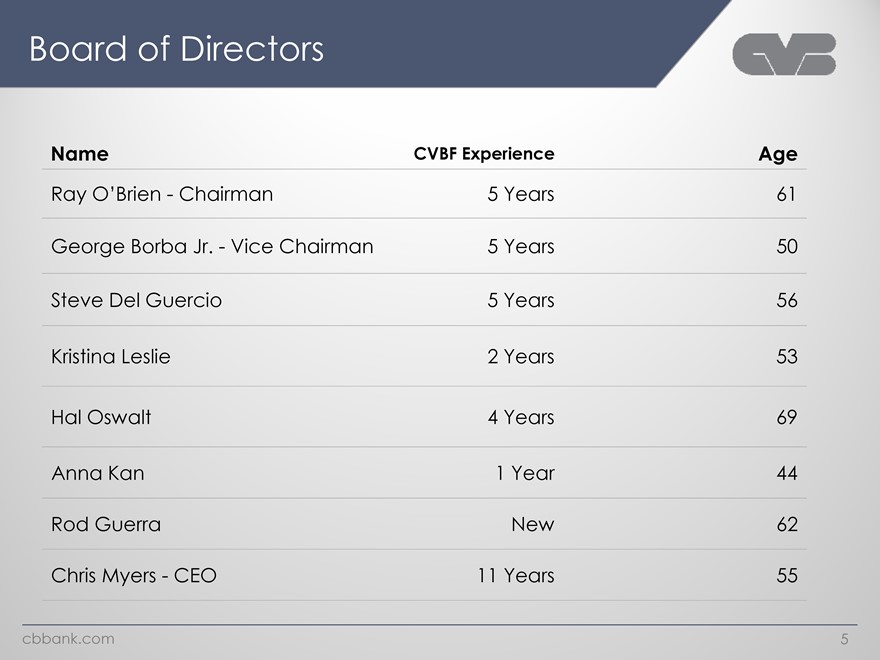
Board of Directors Name CVBF Experience Age Ray O’Brien—Chairman 5 Years 61 George Borba Jr.—Vice Chairman 5 Years 50 Steve Del Guercio 5 Years 56 Kristina Leslie 2 Years 53 Hal Oswalt 4 Years 69 Anna Kan 1 Year 44 Rod Guerra New 62 Chris Myers—CEO 11 Years 55 cbbank.com 5
|
Who is CVB Financial Corp.? cbbank.com
|
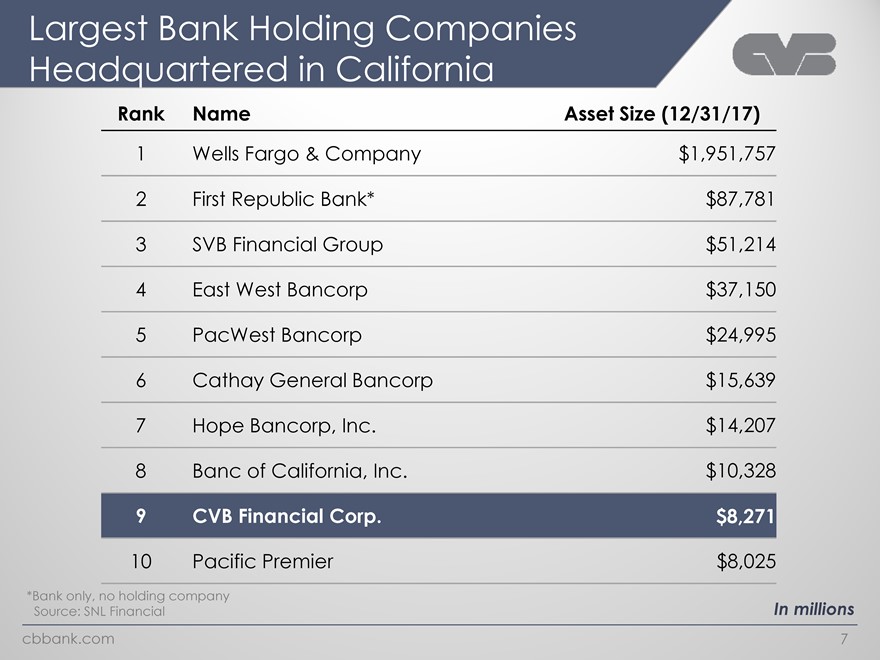
Largest Bank Holding Companies Headquartered in California Rank Name Asset Size (12/31/17) 1 Wells Fargo & Company $1,951,757 2 First Republic Bank* $87,781 3 SVB Financial Group $51,214 4 East West Bancorp $37,150 5 PacWest Bancorp $24,995 6 Cathay General Bancorp $15,639 7 Hope Bancorp, Inc. $14,207 8 Banc of California, Inc. $10,328 9 CVB Financial Corp. $8,271 10 Pacific Premier $8,025 *Bank only, no holding company Source: SNL Financial In millions cbbank.com 7
|
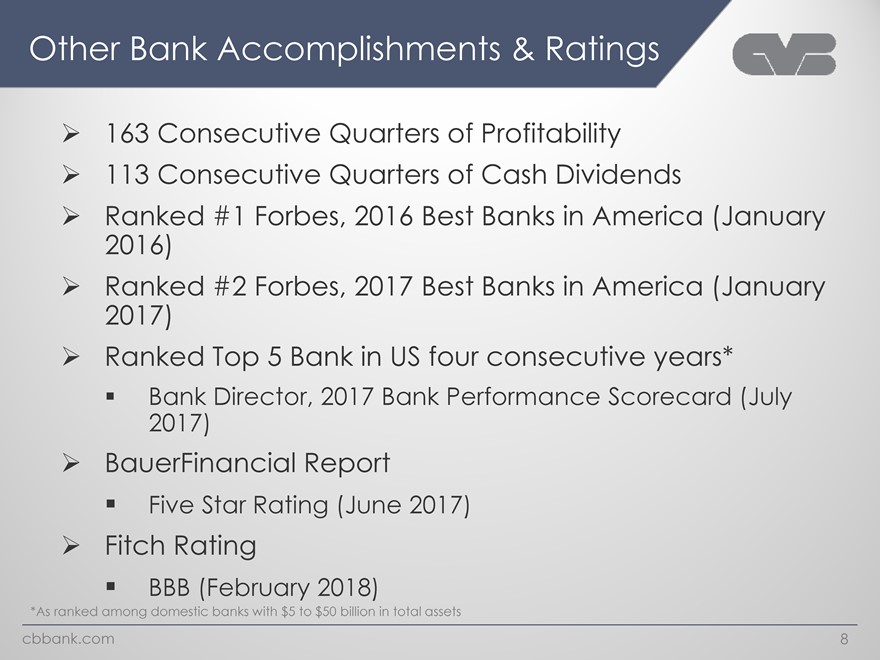
Other Bank Accomplishments & Ratings 163 Consecutive Quarters of Profitability 113 Consecutive Quarters of Cash Dividends Ranked #1 Forbes, 2016 Best Banks in America (January 2016) Ranked #2 Forbes, 2017 Best Banks in America (January 2017) Ranked Top 5 Bank in US four consecutive years* Bank Director, 2017 Bank Performance Scorecard (July 2017) BauerFinancial Report ï,§ Five Star Rating (June 2017) Fitch Rating BBB (February 2018) *As ranked among domestic banks with $5 to $50 billion in total assets cbbank.com 8
|
Our Markets cbbank.com
|
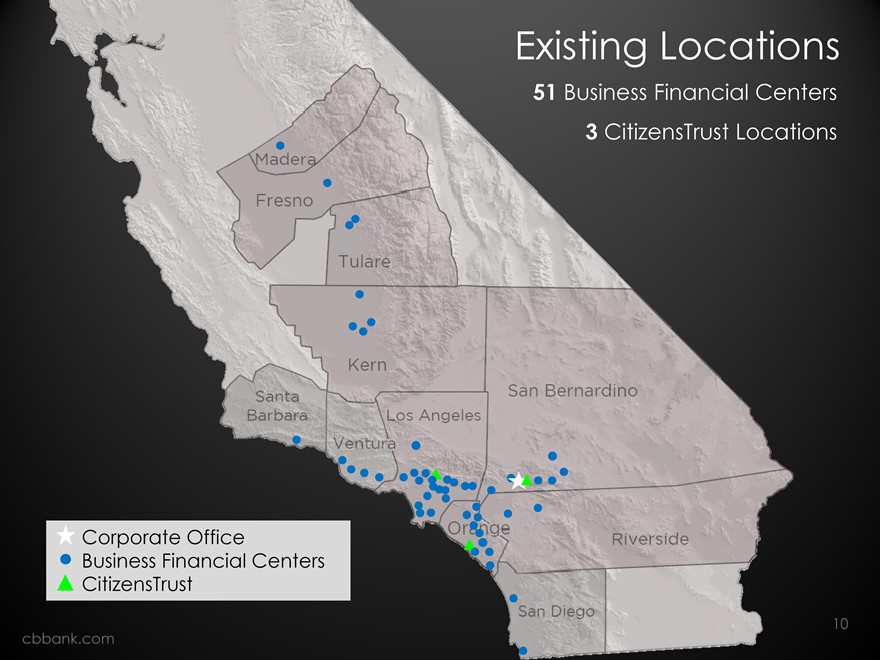
Existing Locations 51 Business Financial Centers 3 CitizensTrust Locations Corporate Office Business Financial Centers CitizensTrust cbbank.com 10
|
Financial Performance cbbank.com
|
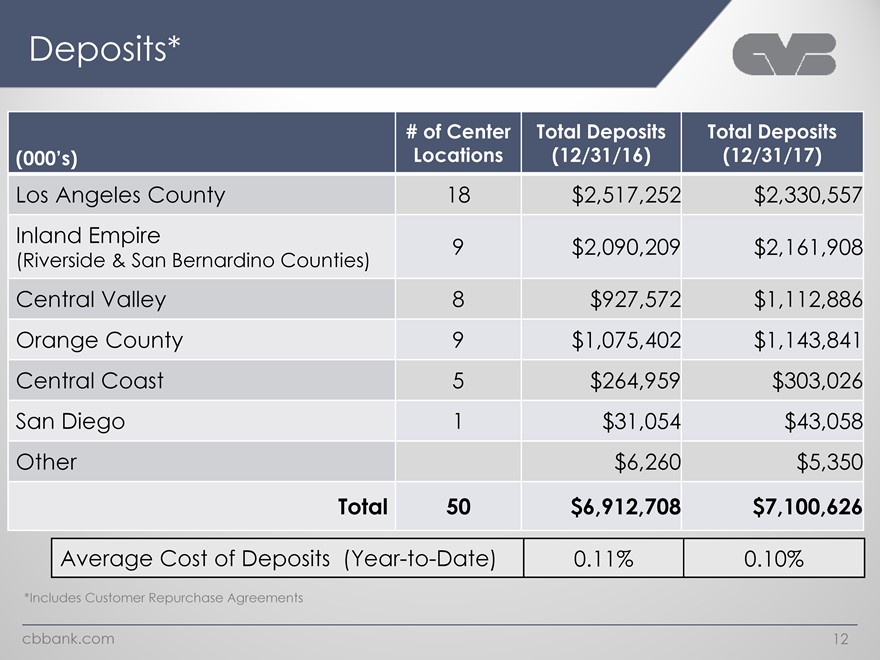
Deposits* # of Center Total Deposits Total Deposits (000’s) Locations (12/31/16) (12/31/17) Los Angeles County 18 $2,517,252 $2,330,557 Inland Empire 9 $2,090,209 $2,161,908 (Riverside & San Bernardino Counties) Central Valley 8 $927,572 $1,112,886 Orange County 9 $1,075,402 $1,143,841 Central Coast 5 $264,959 $303,026 San Diego 1 $31,054 $43,058 Other $6,260 $5,350 Total 50 $6,912,708 $7,100,626 Average Cost of Deposits (Year-to-Date) 0.11% 0.10% *Includes Customer Repurchase Agreements cbbank.com 12
|
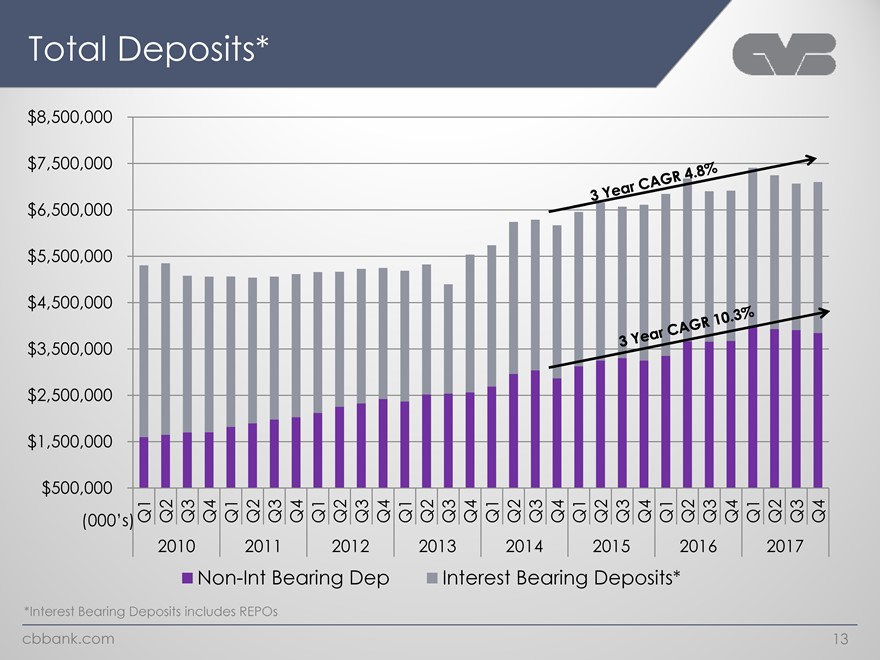
Total Deposits* $8,500,000 $7,500,000 $6,500,000 $5,500,000 $4,500,000 $3,500,000 $2,500,000 $1,500,000 $500,000 (000’s)Q1 Q2 Q3 Q4 Q1 Q2 Q3 Q4 Q1 Q2 Q3 Q4 Q1 Q2 Q3 Q4 Q1 Q2 Q3 Q4 Q1 Q2 Q3 Q4 Q1 Q2 Q3 Q4 Q1 Q2 Q3 Q4 2010 2011 2012 2013 2014 2015 2016 2017 Non-Int Bearing Dep Interest Bearing Deposits* *Interest Bearing Deposits includes REPOs cbbank.com 13
|
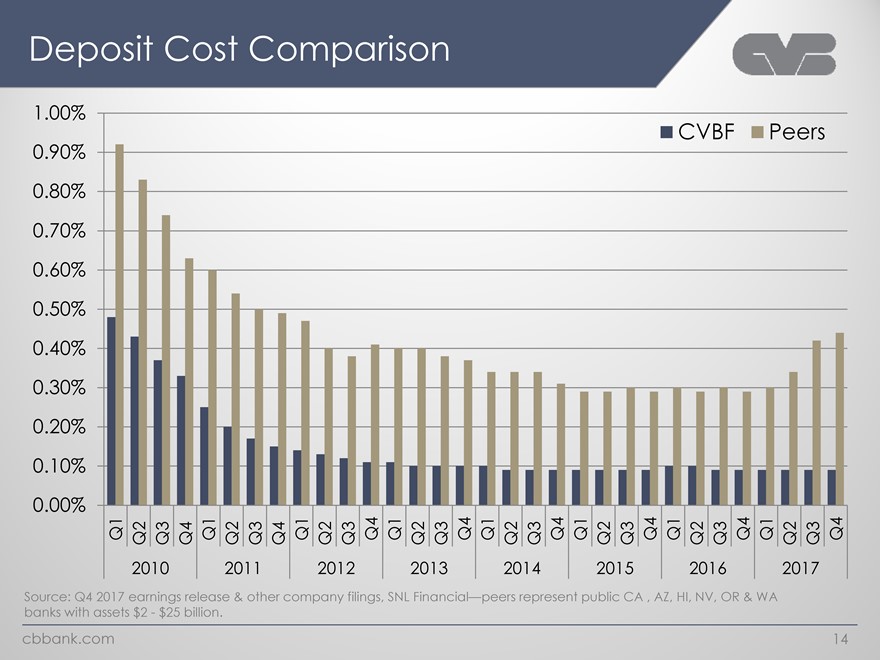
Deposit Cost Comparison 1.00% 0.90% CVBF Peers 0.80% 0.70% 0.60% 0.50% 0.40% 0.30% 0.20% 0.10% 0.00% Q1 Q2 Q3 Q4 Q1 Q2 Q3 Q4 Q1 Q2 Q3 Q4 Q1 Q2 Q3 Q4 Q1 Q2 Q3 Q4 Q1 Q2 Q3 Q4 Q1 Q2 Q3 Q4 Q1 Q2 Q3 Q4 2010 2011 2012 2013 2014 2015 2016 2017 Source: Q4 2017 earnings release & other company filings, SNL Financial—peers represent public CA , AZ, HI, NV, OR & WA banks with assets $2—$25 billion. cbbank.com 14
|
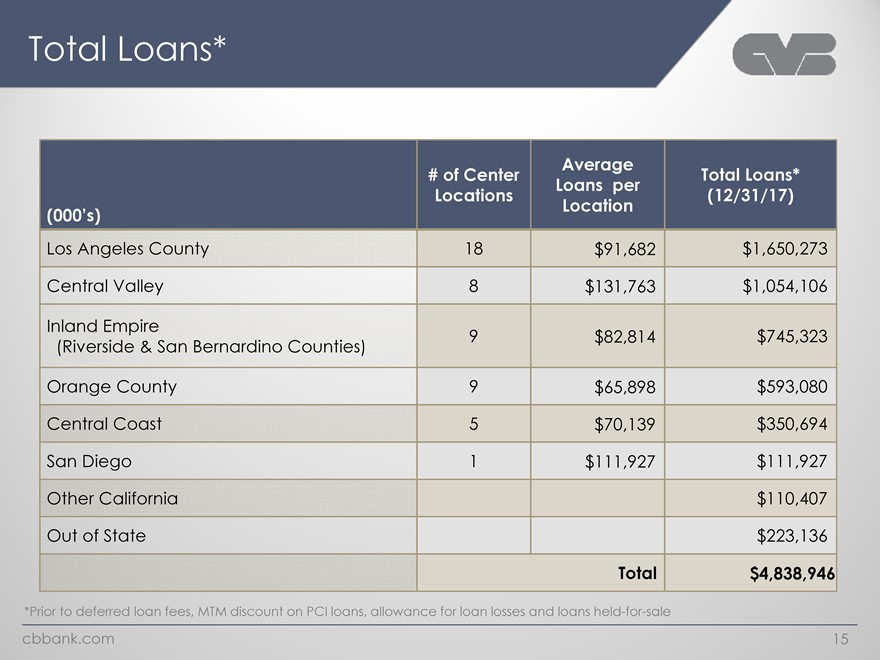
Total Loans* Average # of Center Total Loans* Loans per Locations (12/31/17) Location (000’s) Los Angeles County 18 $91,682 $1,650,273 Central Valley 8 $131,763 $1,054,106 Inland Empire 9 $82,814 $745,323 (Riverside & San Bernardino Counties) Orange County 9 $65,898 $593,080 Central Coast 5 $70,139 $350,694 San Diego 1 $111,927 $111,927 Other California $110,407 Out of State $223,136 Total $4,838,946 *Prior to deferred loan fees, MTM discount on PCI loans, allowance for loan losses and loans held-for-sale cbbank.com 15
|
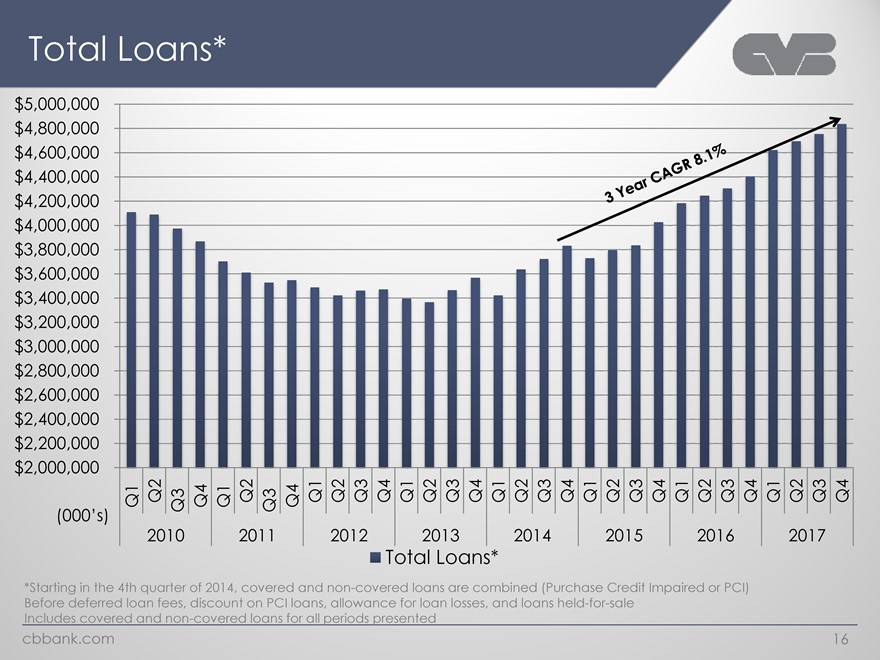
Total Loans* $5,000,000 $4,800,000 $4,600,000 $4,400,000 $4,200,000 $4,000,000 $3,800,000 $3,600,000 $3,400,000 $3,200,000 $3,000,000 $2,800,000 $2,600,000 $2,400,000 $2,200,000 $2,000,000 Q1 Q2 Q3 Q4 Q1 Q2 Q3 Q4 Q1 Q2 Q3 Q4 Q1 Q2 Q3 Q4 Q1 Q2 Q3 Q4 Q1 Q2 Q3 Q4 Q1 Q2 Q3 Q4 Q1 Q2 Q3 Q4 (000’s) 2010 2011 2012 2013 2014 2015 2016 2017 Total Loans* *Starting in the 4th quarter of 2014, covered and non-covered loans are combined (Purchase Credit Impaired or PCI) Before deferred loan fees, discount on PCI loans, allowance for loan losses, and loans held-for-sale Includes covered and non-covered loans for all periods presented cbbank.com 16
|
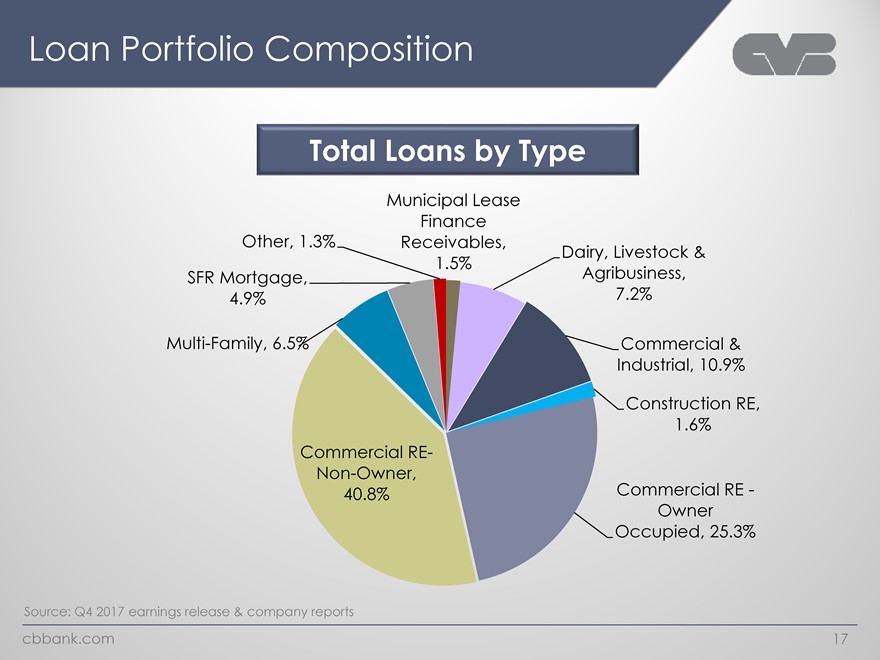
Loan Portfolio Composition Total Loans by Type Municipal Lease Finance Other, 1.3% Receivables, Dairy, Livestock & 1.5% SFR Mortgage, Agribusiness, 4.9% 7.2% Multi-Family, 6.5% Commercial & Industrial, 10.9% Construction RE, 1.6% Commercial RE-Non-Owner, 40.8% Commercial RE -Owner Occupied, 25.3% Source: Q4 2017 earnings release & company reports cbbank.com 17
|
Credit Quality cbbank.com
|
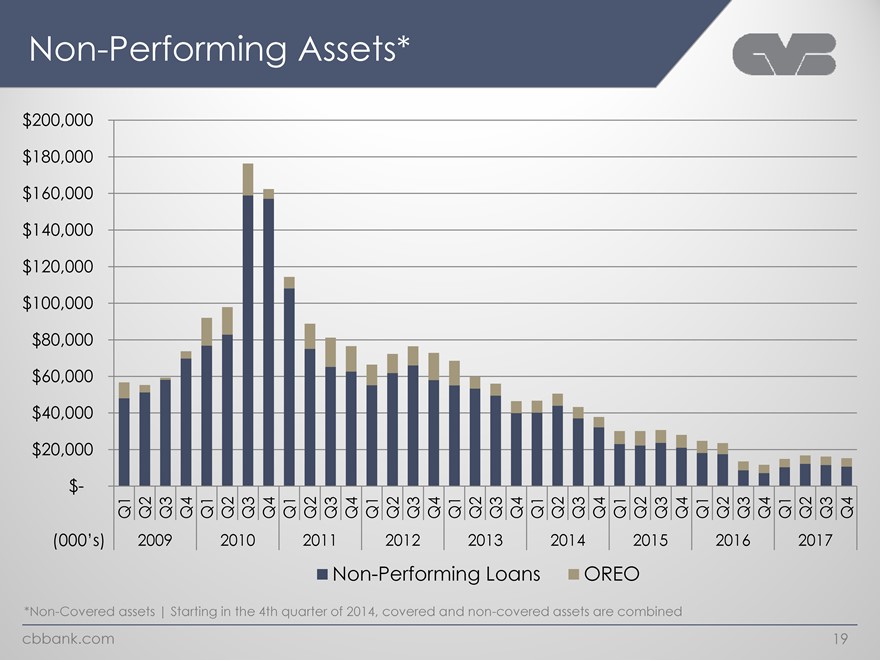
Non-Performing Assets* $200,000 $180,000 $160,000 $140,000 $120,000 $100,000 $80,000 $60,000 $40,000 $20,000 $- Q1 Q2 Q3 Q4 Q1 Q2 Q3 Q4 Q1 Q2 Q3 Q4 Q1 Q2 Q3 Q4 Q1 Q2 Q3 Q4 Q1 Q2 Q3 Q4 Q1 Q2 Q3 Q4 Q1 Q2 Q3 Q4 Q1 Q2 Q3 Q4 (000’s) 2009 2010 2011 2012 2013 2014 2015 2016 2017 Non-Performing Loans OREO *Non-Covered assets | Starting in the 4th quarter of 2014, covered and non-covered assets are combined cbbank.com 19
|
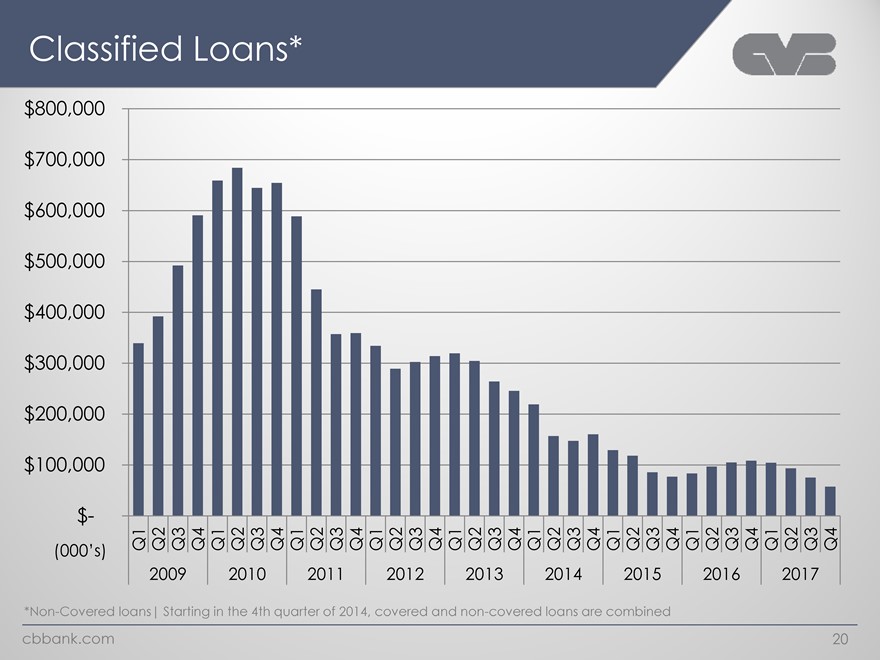
Classified Loans* $800,000 $700,000 $600,000 $500,000 $400,000 $300,000 $200,000 $100,000 $- (000’s) Q1 Q2 Q3 Q4 Q1 Q2 Q3 Q4 Q1 Q2 Q3 Q4 Q1 Q2 Q3 Q4 Q1 Q2 Q3 Q4 Q1 Q2 Q3 Q4 Q1 Q2 Q3 Q4 Q1 Q2 Q3 Q4 Q1 Q2 Q3 Q4 2009 2010 2011 2012 2013 2014 2015 2016 2017 *Non-Covered loans| Starting in the 4th quarter of 2014, covered and non-covered loans are combined cbbank.com 20
|
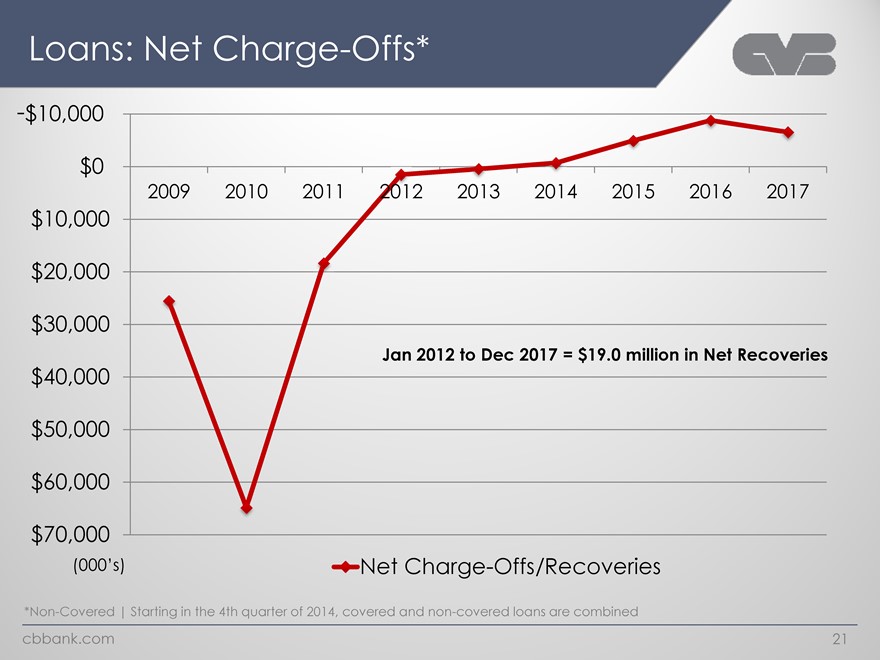
Loans: Net Charge-Offs* -$10,000 $0 2009 2010 2011 2012 2013 2014 2015 2016 2017 $10,000 $20,000 $30,000 Jan 2012 to Dec 2017 = $19.0 million in Net Recoveries $40,000 $50,000 $60,000 $70,000 (000’s) Net Charge-Offs/Recoveries *Non-Covered | Starting in the 4th quarter of 2014, covered and non-covered loans are combined cbbank.com 21
|
Profits cbbank.com
|
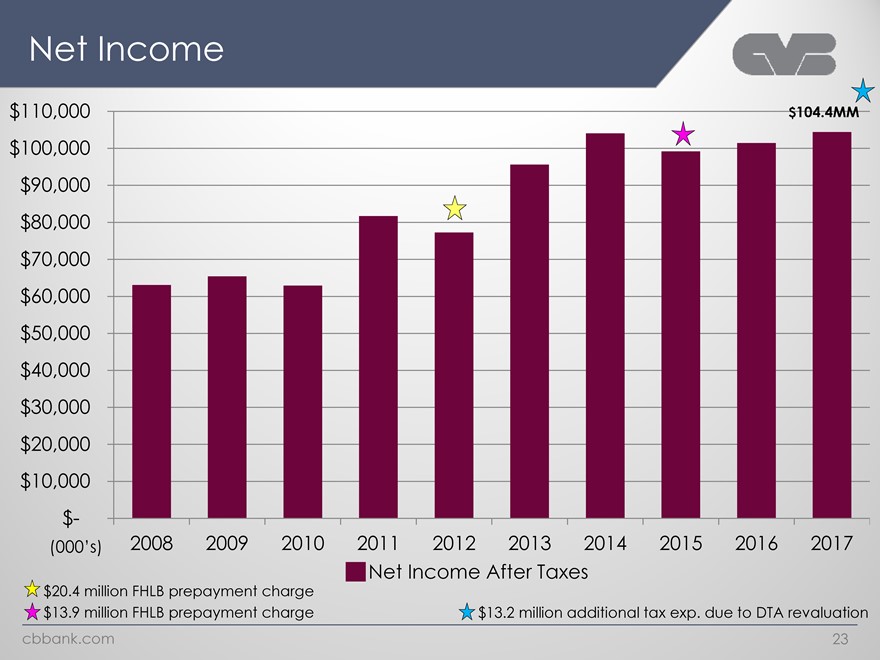
Net Income $110,000 $104.4MM $100,000 $90,000 $80,000 $70,000 $60,000 $50,000 $40,000 $30,000 $20,000 $10,000 $-(000’s) 2008 2009 2010 2011 2012 2013 2014 2015 2016 2017 Net Income After Taxes $20.4 million FHLB prepayment charge $13.9 million FHLB prepayment charge $13.2 million additional tax exp. due to DTA revaluation cbbank.com 23
|
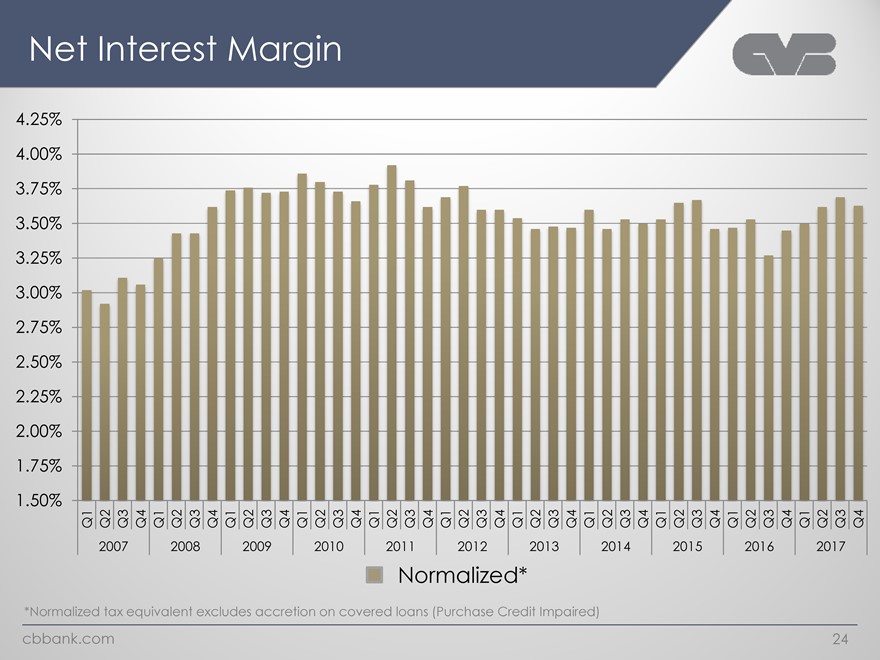
Net Interest Margin 4.25% 4.00% 3.75% 3.50% 3.25% 3.00% 2.75% 2.50% 2.25% 2.00% 1.75% 1.50% Q1 Q2 Q3 Q4 Q1 Q2 Q3 Q4 Q1 Q2 Q3 Q4 Q1 Q2 Q3 Q4 Q1 Q2 Q3 Q4 Q1 Q2 Q3 Q4 Q1 Q2 Q3 Q4 Q1 Q2 Q3 Q4 Q1 Q2 Q3 Q4 Q1 Q2 Q3 Q4 Q1 Q2 Q3 Q4 2007 2008 2009 2010 2011 2012 2013 2014 2015 2016 2017 Normalized* *Normalized tax equivalent excludes accretion on covered loans (Purchase Credit Impaired) cbbank.com 24
|
Efficiency & Expenses cbbank.com
|
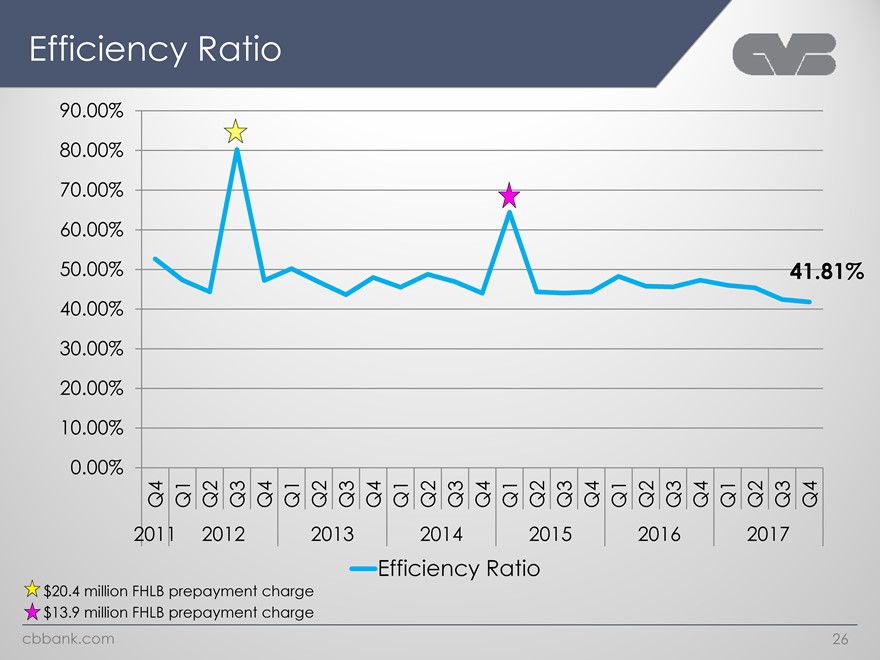
Efficiency Ratio 90.00% 80.00% 70.00% 60.00% 50.00% 41.81% 40.00% 30.00% 20.00% 10.00% 0.00% Q4 Q1 Q2 Q3 Q4 Q1 Q2 Q3 Q4 Q1 Q2 Q3 Q4 Q1 Q2 Q3 Q4 Q1 Q2 Q3 Q4 Q1 Q2 Q3 Q4 2011 2012 2013 2014 2015 2016 2017 Efficiency Ratio $20.4 million FHLB prepayment charge $13.9 million FHLB prepayment charge cbbank.com 26
|
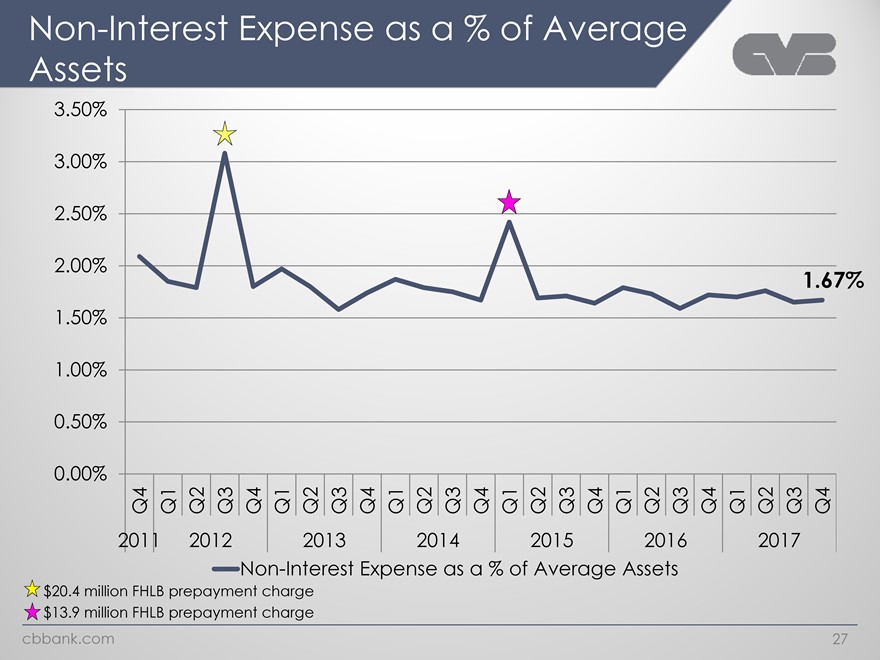
Non-Interest Expense as a % of Average Assets 3.50% 3.00% 2.50% 2.00% 1.67% 1.50% 1.00% 0.50% 0.00% Q4 Q1 Q2 Q3 Q4 Q1 Q2 Q3 Q4 Q1 Q2 Q3 Q4 Q1 Q2 Q3 Q4 Q1 Q2 Q3 Q4 Q1 Q2 Q3 Q4 2011 2012 2013 2014 2015 2016 2017 Non-Interest Expense as a % of Average Assets $20.4 million FHLB prepayment charge $13.9 million FHLB prepayment charge cbbank.com 27
|
Capital cbbank.com
|
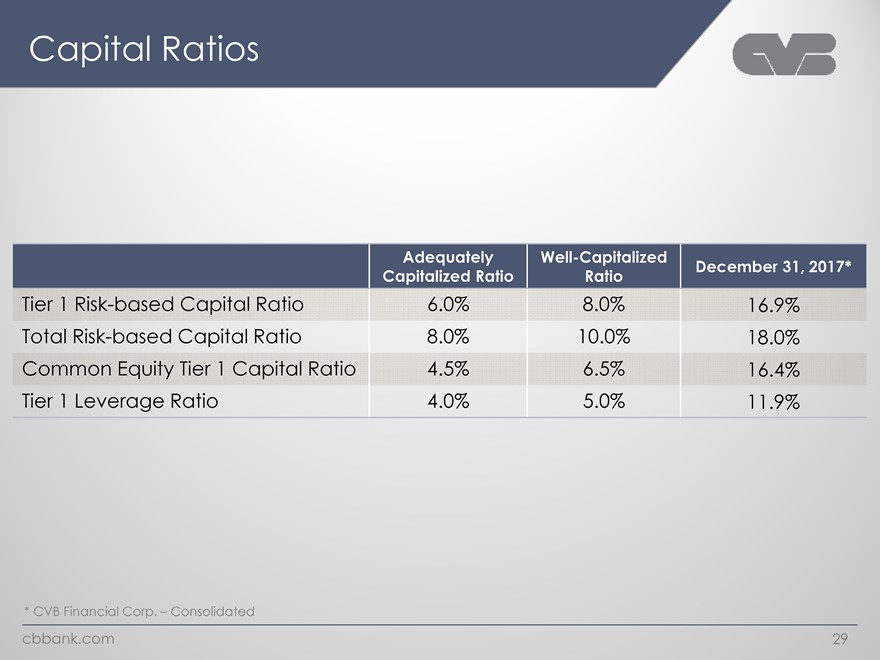
Capital Ratios Adequately Well-Capitalized December 31, 2017* Capitalized Ratio Ratio Tier 1 Risk-based Capital Ratio 6.0% 8.0% 16.9% Total Risk-based Capital Ratio 8.0% 10.0% 18.0% Common Equity Tier 1 Capital Ratio 4.5% 6.5% 16.4% Tier 1 Leverage Ratio 4.0% 5.0% 11.9% * CVB Financial Corp. – Consolidated cbbank.com 29

|
Securities & Investments cbbank.com
|
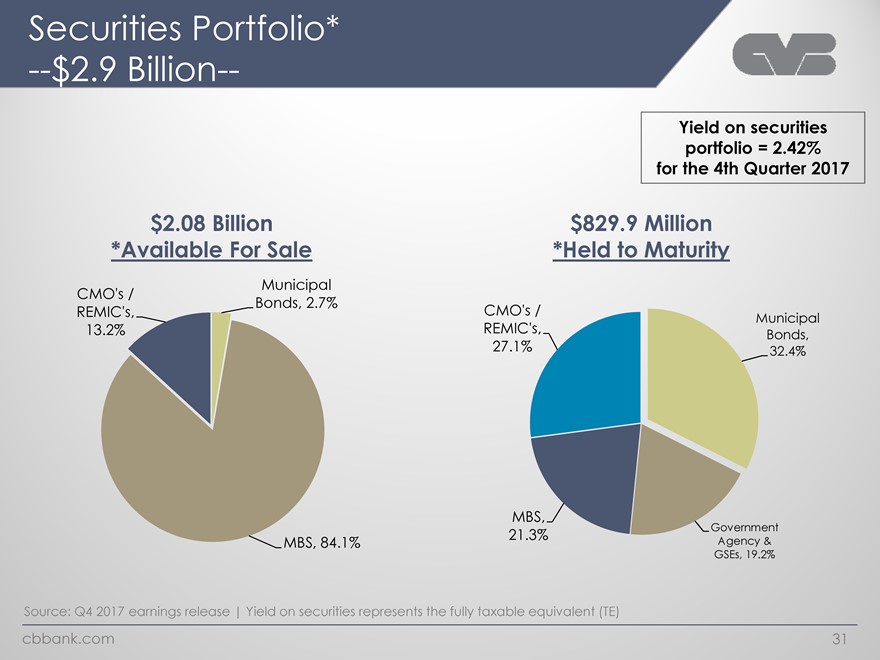
Securities & Investments cbbank.com Securities Portfolio* —$2.9 Billion— Yield on securities portfolio = 2.42% for the 4th Quarter 2017 $2.08 Billion $829.9 Million *Available For Sale *Held to Maturity Municipal CMO’s / Bonds, 2.7% REMIC’s, CMO’s / Municipal 13.2% REMIC’s, Bonds, 27.1% 32.4% MBS, 21.3% Government MBS, 84.1% Agency & GSEs, 19.2% Source: Q4 2017 earnings release | Yield on securities represents the fully taxable equivalent (TE) cbbank.com 31 ecurities Portfolio* $2.08
|
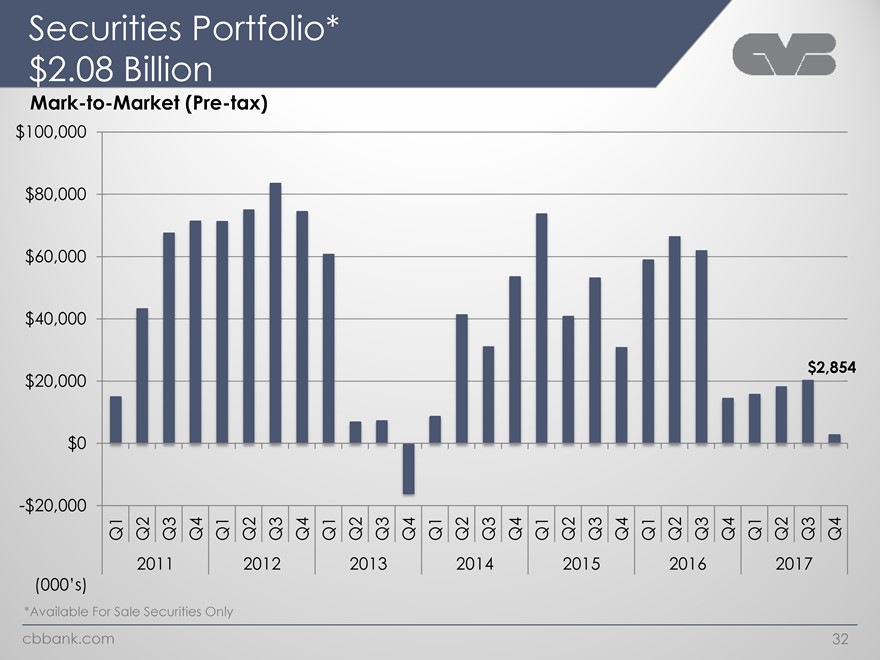
Billion Mark-to-Market (Pre-tax) $100,000 $80,000 $60,000 $40,000 $2,854 $20,000 $0 -$20,000 Q1 Q2 Q3 Q4 Q1 Q2 Q3 Q4 Q1 Q2 Q3 Q4 Q1 Q2 Q3 Q4 Q1 Q2 Q3 Q4 Q1 Q2 Q3 Q4 Q1 Q2 Q3 Q4 2011 2012 2013 2014 2015 2016 2017 (000’s) *Available For Sale Securities Only cbbank.com 32
|
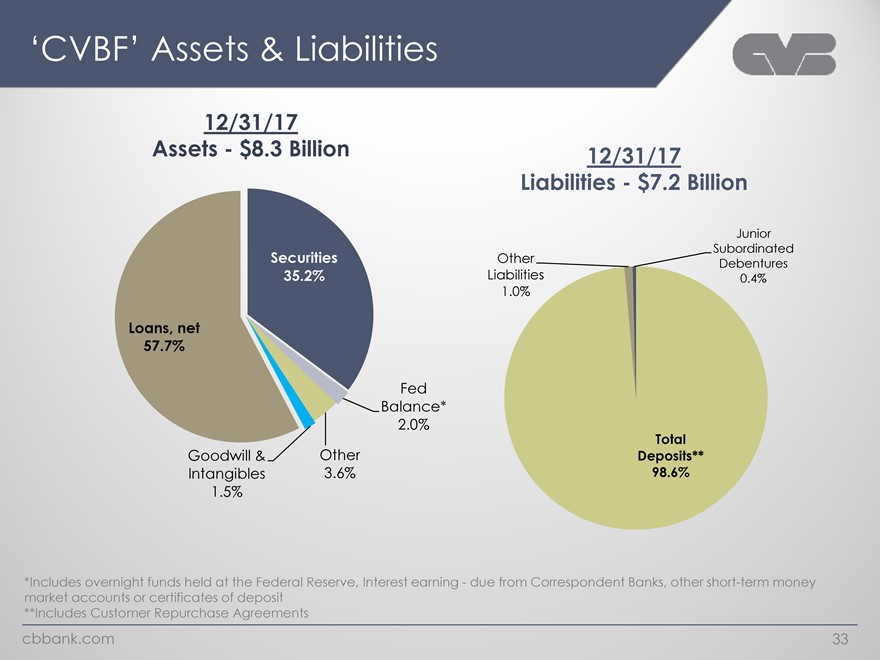
‘CVBF’ Assets & Liabilities 12/31/17 Assets—$8.3 Billion 12/31/17 Liabilities—$7.2 Billion Junior Subordinated Securities Other Debentures 35.2% Liabilities 0.4% 1.0% Loans, net 57.7% Fed Balance* 2.0% Total Goodwill & Other Deposits** Intangibles 3.6% 98.6% 1.5% *Includes overnight funds held at the Federal Reserve, Interest earning—due from Correspondent Banks, other short-term money market accounts or certificates of deposit **Includes Customer Repurchase Agreements cbbank.com 33
|
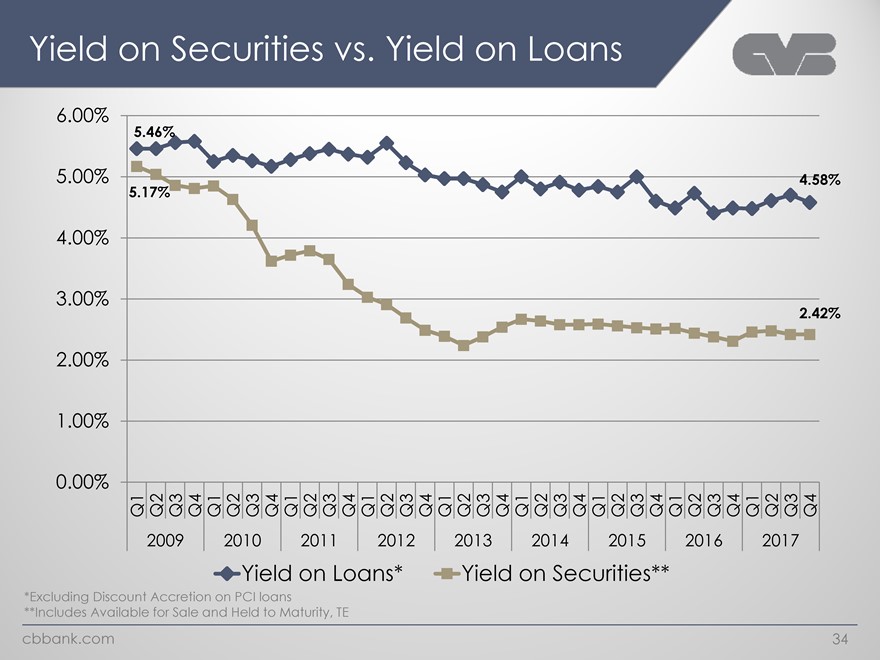
Yield on Securities vs. Yield on Loans 6.00% 5.46% 5.00% 4.58% 5.17% 4.00% 3.00% 2.42% 2.00% 1.00% 0.00% Q1Q2Q3Q4Q1Q2Q3Q4Q1Q2Q3Q4Q1Q2Q3Q4Q1Q2Q3Q4Q1Q2Q3Q4Q1Q2Q3Q4Q1Q2Q3Q4Q1Q2Q3Q4 2009 2010 2011 2012 2013 2014 2015 2016 2017 Yield on Loans* Yield on Securities** *Excluding Discount Accretion on PCI loans **Includes Available for Sale and Held to Maturity, TE cbbank.com 34
|
Our Growth Strategy cbbank.com
|
Our Vision Citizens Business Bank will strive to become the premier financial services company operating throughout the state of California, servicing the comprehensive financial needs of successful small to medium sized businesses and their owners. cbbank.com 36
|
Customer The best privately-held and/or family-owned businesses throughout California ï,§ Annual revenues of $1-200 million Top 25% in their respective industry ï,§ Full relationship banking ï,§ Build 20-year relationships cbbank.com 37
|
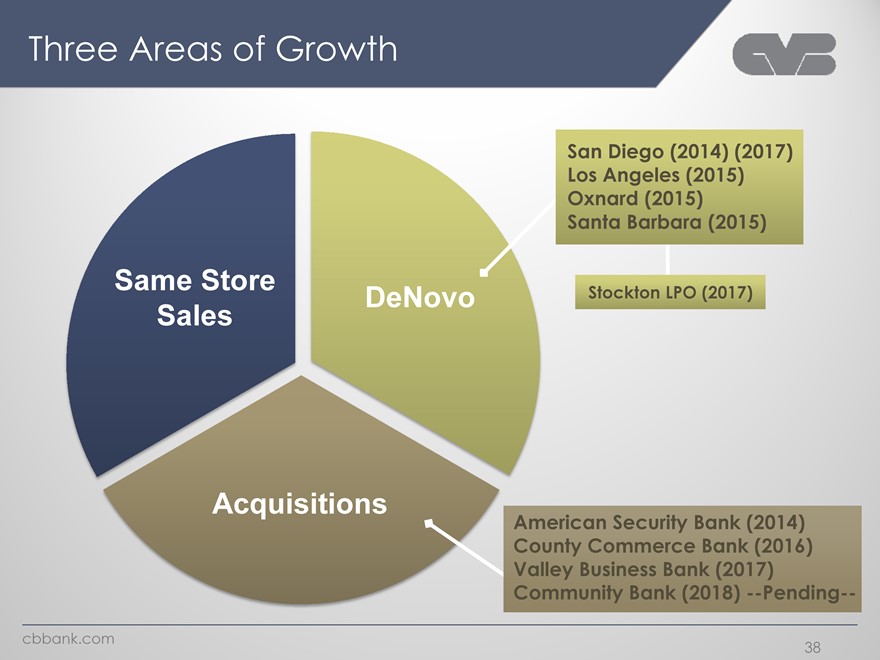
Three Areas of Growth San Diego (2014) (2017) Los Angeles (2015) Oxnard (2015) Santa Barbara (2015) Same Store Stockton LPO (2017) DeNovo Sales Acquisitions American Security Bank (2014) County Commerce Bank (2016) Valley Business Bank (2017) Community Bank (2018) —Pending— cbbank.com 38
|
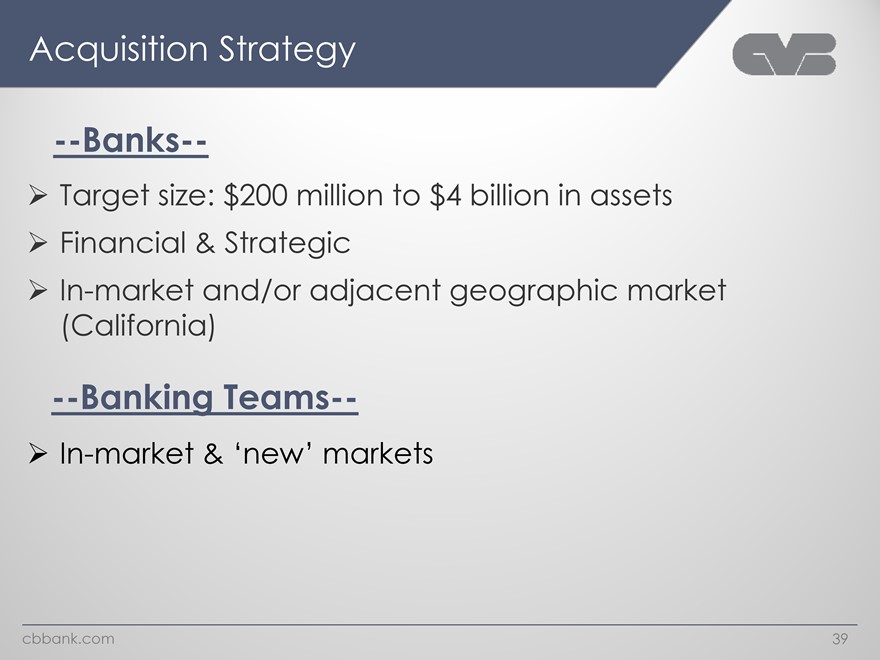
cbbank.com Acquisition Strategy Target size: $200 million to $4 billion in assets Financial & Strategic In-market and/or adjacent geographic market (California) --Banks-- --Banking Teams-- In-market & ‘new’ markets 39
|
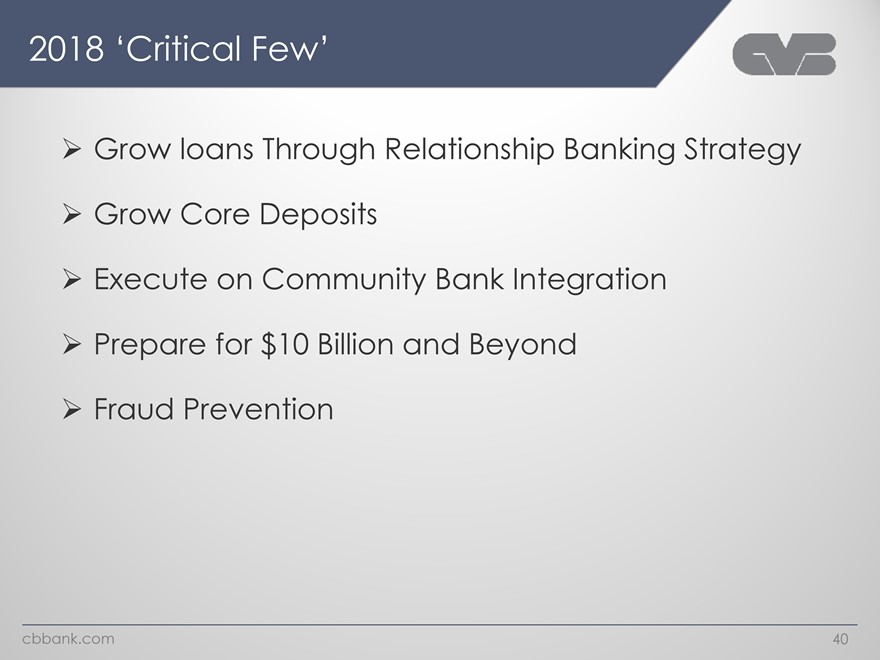
cbbank.com 2018 ‘Critical Few’ Grow loans
Through Relationship Banking Strategy Grow Core Deposits Execute on Community Bank Integration
Prepare for $10 Billion and Beyond Fraud Prevention 40
|
Copy of presentation at www.cbbank.com cbbank.com