Attached files
| file | filename |
|---|---|
| EX-32.2 - EX-32.2 - CVB FINANCIAL CORP | d294388dex322.htm |
| EX-32.1 - EX-32.1 - CVB FINANCIAL CORP | d294388dex321.htm |
| EX-31.2 - EX-31.2 - CVB FINANCIAL CORP | d294388dex312.htm |
| EX-31.1 - EX-31.1 - CVB FINANCIAL CORP | d294388dex311.htm |
| EX-23 - EX-23 - CVB FINANCIAL CORP | d294388dex23.htm |
| EX-21 - EX-21 - CVB FINANCIAL CORP | d294388dex21.htm |
| EX-12 - EX-12 - CVB FINANCIAL CORP | d294388dex12.htm |
| EX-10.5E - EX-10.5E - CVB FINANCIAL CORP | d294388dex105e.htm |
Table of Contents
UNITED STATES
SECURITIES AND EXCHANGE COMMISSION
Washington, D.C. 20549
Form 10-K
☒ ANNUAL REPORT PURSUANT TO SECTION 13 OR 15(d) OF THE SECURITIES EXCHANGE ACT OF 1934.
For the fiscal year ended December 31, 2016
or
☐ TRANSITION REPORT PURSUANT TO SECTION 13 OR 15(d) OF THE SECURITIES EXCHANGE ACT OF 1934.
For the transition period from to
Commission file number: 1-10140
CVB FINANCIAL CORP.
(Exact name of registrant as specified in its charter)
| California | 95-3629339 | |
| (State or other jurisdiction of incorporation or organization) |
(I.R.S. Employer Identification No.) | |
| 701 N. Haven Avenue, Suite 350 Ontario, California |
91764 | |
| (Address of Principal Executive Offices) | (Zip Code) | |
Registrant’s telephone number, including area code: (909) 980-4030
Securities registered pursuant to Section 12(b) of the Act:
| Title of Class |
Name of Each Exchange on Which Registered | |
| Common Stock, no par value | NASDAQ Stock Market, LLC |
Securities registered pursuant to Section 12(g) of the Act:
None
Indicate by check mark if the registrant is a well-known seasoned issuer, as defined in Rule 405 of the Securities Act. Yes ☒ No ☐
Indicate by check mark if the registrant is not required to file reports pursuant to Section 13 or Section 15(d) of the Act. Yes ☐ No ☒
Indicate by check mark whether the registrant (1) has filed all reports required to be filed by Section 13 or 15(d) of the Securities Exchange Act of 1934 during the preceding 12 months (or for such shorter period that the Registrant was required to file such reports), and (2) has been subject to such filing requirements for the past 90 days. Yes ☒ No ☐
Indicate by check mark whether the registrant has submitted electronically and posted on its corporate Web site, if any, every Interactive Data File required to be submitted and posted pursuant to Rule 405 of Regulation S-T during the preceding 12 months (or for such shorter period that the registrant was required to submit and post such files). Yes ☒ No ☐
Indicate by check mark if disclosure of delinquent filers pursuant to Item 405 of Regulation S-K is not contained herein, and will not be contained, to the best of registrant’s knowledge, in definitive proxy or information statements incorporated by reference in Part III of this Form 10-K or any amendment to this Form 10-K. ☒
Indicate by check mark whether the registrant is a large accelerated filer, an accelerated filer, a non-accelerated filer, or a smaller reporting company. See the definitions of “large accelerated filer,” “accelerated filer” and “smaller reporting company” in Rule 12b-2 of the Exchange Act. (Check one):
| Large accelerated filer | ☒ | Accelerated filer | ☐ | |||
| Non-accelerated filer | ☐ (Do not check if a smaller reporting company) |
Smaller reporting company | ☐ | |||
Indicate by check mark whether the registrant is a shell company (as defined in Rule 12b-2 of the Act). Yes ☐ No ☒
As of June 30, 2016, the aggregate market value of the common stock held by non-affiliates of the registrant was approximately $1,645,948,475.
Number of shares of common stock of the registrant outstanding as of February 16, 2017: 108,415,281.
| DOCUMENTS INCORPORATED BY REFERENCE |
PART OF | |||
| Definitive Proxy Statement for the Annual Meeting of Stockholders which will be filed within 120 days of the fiscal year ended December 31, 2016 |
Part III of Form 10-K |
Table of Contents
CVB FINANCIAL CORP.
2016 ANNUAL REPORT ON FORM 10-K
1
Table of Contents
INTRODUCTION
Cautionary Note Regarding Forward-Looking Statements
Certain statements in this report constitute “forward-looking statements” within the meaning of Section 27A of the Securities Act of 1933, as amended, Rule 175 promulgated thereunder, Section 21E of the Securities and Exchange Act of 1934, as amended, Rule 3b-6 promulgated thereunder, or Exchange Act, and as such involve risk and uncertainties. All statements in this Form 10-K other than statements of historical fact are “forward-looking statements” for purposes of federal and state securities laws. Words such as “will likely result, “aims”, “anticipates”, “believes”, “could”, “estimates”, “expects”, “hopes”, “intends”, “may”, “plans”, “projects”, “seeks”, “should”, “will” and variations of these words and similar expressions help to identify these forward looking statements, which involve risks and uncertainties.
These forward-looking statements relate to, among other things, anticipated future operating and financial performance, the allowance for loan losses, our financial position and liquidity, business strategies, regulatory and competitive outlook, investment and expenditure plans, capital and financing needs and availability, plans and objectives of management for future operations, expectations of the environment in which we operate, projections of future performance, perceived opportunities in the market and strategies regarding our mission and vision and statements relating to any of the foregoing. Factors that could cause actual results to differ from those discussed in the forward-looking statements include but are not limited to:
| • | local, regional, national and international economic and market conditions and events and the impact they may have on us, our customers and our assets and liabilities; |
| • | our ability to attract deposits and other sources of funding or liquidity; |
| • | supply and demand for real estate and periodic deterioration in real estate prices and/or values in California or other states where we lend, including both residential and commercial real estate; |
| • | a prolonged slowdown or decline in real estate construction, sales or leasing activities; |
| • | changes in the financial performance and/or condition of our borrowers or key vendors or counterparties; |
| • | changes in our levels of delinquent loans, nonperforming assets, allowance for loan losses and charge-offs; |
| • | the costs or effects of acquisitions or dispositions we may make, whether we are able to obtain any required governmental approvals in connection with any such acquisitions or dispositions, and/or our ability to realize the contemplated financial or business benefits associated with any such acquisitions or dispositions; |
| • | our ability to realize cost savings or synergies in connection with our acquisition of Valley Commerce Bancorp within expected time frames or at all; |
| • | the effect of changes in laws, regulations and applicable judicial decisions (including laws, regulations and judicial decisions concerning financial reforms, taxes, banking capital levels, consumer, commercial or secured lending, securities and securities trading and hedging, compliance, fair lending, employment, executive compensation, insurance, vendor management and information security) with which we and our subsidiaries must comply or believe we should comply, including additional legal and regulatory requirements to which we may become subject in the event our total assets exceed $10 billion; |
| • | changes in estimates of future reserve requirements and minimum capital requirements based upon the periodic review thereof under relevant regulatory and accounting requirements, including changes in the Basel Committee framework establishing capital standards for credit, operations and market risk; |
| • | the accuracy of the assumptions and estimates and the absence of technical error in implementation or calibration of models used to estimate the fair value of financial instruments; |
| • | inflation, interest rate, securities market and monetary fluctuations; |
| • | changes in government interest rates or monetary policies; |
2
Table of Contents
| • | changes in the amount and availability of deposit insurance; |
| • | political developments, uncertainties or instability; |
| • | disruptions in the infrastructure that supports our business and the communities where we are located, which are concentrated in California, involving or related to physical site access, cyber incidents, terrorist and political activities, disease pandemics, catastrophic events, natural disasters such as earthquakes, extreme weather events, electrical, environmental, computer servers, and communications or other services we use, or that affect our employees or third parties with whom we conduct business; |
| • | the timely development and acceptance of new banking products and services and the perceived overall value of these products and services by customers and potential customers; |
| • | the Company’s relationships with and reliance upon vendors with respect to the operation of certain of the Company’s key internal and external systems and applications; |
| • | changes in commercial or consumer spending, borrowing and savings preferences or behaviors; |
| • | technological changes and the expanding use of technology in banking (including the adoption of mobile banking and funds transfer applications); |
| • | our ability to retain and increase market share, retain and grow customers and control expenses; |
| • | changes in the competitive environment among financial and bank holding companies, banks and other financial service providers; |
| • | competition and innovation with respect to financial products and services by banks, financial institutions and non-traditional providers including retail businesses and technology companies; |
| • | volatility in the credit and equity markets and its effect on the general economy or local or regional business conditions; |
| • | fluctuations in the price of the Company’s common stock or other securities and the resulting impact on the Company’s ability to raise capital or make acquisitions; |
| • | the effect of changes in accounting policies and practices, as may be adopted from time-to-time by the regulatory agencies, as well as by the Public Company Accounting Oversight Board, the Financial Accounting Standards Board and other accounting standard-setters; |
| • | changes in our organization, management, compensation and benefit plans, and our ability to retain or expand our workforce, management team and/or board of directors; |
| • | the costs and effects of legal, compliance and regulatory actions, changes and developments, including the initiation and resolution of legal proceedings (such as securities, bank operations, consumer or employee class action litigation), |
| • | the possibility that any settlement of any of the putative class action lawsuits may not be approved by the relevant court or that significant numbers of putative class members may opt out of any settlement; |
| • | regulatory or other governmental inquiries or investigations, and/or the results of regulatory examinations or reviews; |
| • | our ongoing relations with our various federal and state regulators, including the SEC, Federal Reserve Board, FDIC and California DBO; and |
| • | our success at managing the risks involved in the foregoing items. |
For additional information concerning risks we face, see “Item 1A. Risk Factors” and any additional information we set forth in our periodic reports filed pursuant to the Exchange Act, including this Annual Report on Form 10-K. We do not undertake any obligation to update our forward-looking statements to reflect occurrences or unanticipated events or circumstances arising after the date of such statements, except as required by law.
3
Table of Contents
PART I
| ITEM 1. | BUSINESS |
CVB Financial Corp.
CVB Financial Corp. (referred to herein on an unconsolidated basis as “CVB” and on a consolidated basis as “we”, “our” or the “Company”) is a bank holding company incorporated in California on April 27, 1981 and registered with the Board of Governors of the Federal Reserve System (“Federal Reserve”) under the Bank Holding Company Act of 1956, as amended (the “Bank Holding Company Act”). The Company commenced business on December 30, 1981 when, pursuant to a reorganization, it acquired all of the voting stock of Chino Valley Bank. On March 29, 1996, Chino Valley Bank changed its name to Citizens Business Bank (“CBB” or the “Bank”). The Bank is our principal asset. The Company also has one inactive subsidiary, Chino Valley Bancorp. The Company is also the common stockholder of CVB Statutory Trust III. CVB Statutory Trust III was created in January 2006 to issue trust preferred securities in order to raise capital for the Company.
CVB’s principal business is to serve as a holding company for the Bank and for other banking or banking related subsidiaries, which the Company may establish or acquire. CVB has not engaged in any other material activities to date. As a legal entity separate and distinct from its subsidiaries, CVB’s principal source of funds is, and will continue to be, dividends paid by and other funds advanced from the Bank and capital raised directly by CVB. Legal limitations are imposed on the amount of dividends that may be paid and loans that may be made by the Bank to CVB. See “Item 1. Business — Regulation and Supervision — Dividends.” As of December 31, 2016, the Company had $8.07 billion in total consolidated assets, $4.33 billion in net loans, $6.31 billion in deposits, and $603.0 million in customer repurchase agreements.
On February 29, 2016 the Bank acquired all of the assets and assumed all of the liabilities of County Commerce Bank (“CCB”) for $20.6 million in cash and $21.6 million in stock. As a result, CCB was merged with the Bank, the principal subsidiary of CVB. CCB was headquartered in Oxnard, CA, with four branch locations in Ventura County. This acquisition extended the Bank’s our geographic footprint northward into the central coast of California. The total fair value of assets acquired approximated $252.4 million, which included $54.8 million in cash and balances due from depository institutions, $1.5 million in FHLB stock, $168.0 million in loans and lease finance receivables, $8.6 million in fixed assets, $3.9 million in core deposit intangible assets acquired and $289,000 in other assets. The total fair value of liabilities assumed was $230.8 million, which included $224.2 million in deposits, $5.0 million in FHLB advances and $1.6 million in other liabilities. Goodwill of $15.3 million from the acquisition represents the excess of the purchase price over the fair value of the net tangible and intangible assets acquired.
On September 22, 2016, we announced that we entered into a merger agreement with Valley Commerce Bancorp (“VCBP”), pursuant to which its subsidiary, Valley Business Bank, will merge into Citizens Business Bank. Valley Business Bank has four branch locations and total assets of approximately $416 million. VCBP is a well-regarded 20 year institution that further strengthens our presence in the Central Valley area of California. The FDIC and Valley Commerce Bancorp’s shareholders have approved the transaction and we expect to close the transaction as soon as all remaining conditions have been fulfilled.
The principal executive offices of CVB and the Bank are located at 701 North Haven Avenue, Suite 350, Ontario, California. Our phone number is (909) 980-4030.
Citizens Business Bank
The Bank commenced operations as a California state-chartered bank on August 9, 1974. The Bank’s deposit accounts are insured under the Federal Deposit Insurance Act up to applicable limits. The Bank is not a member of the Federal Reserve System. At December 31, 2016, the Bank had $8.07 billion in assets, $4.33 billion in net loans, $6.33 billion in deposits, and $603.0 million in customer repurchase agreements.
4
Table of Contents
As of December 31, 2016, there were 42 Business Financial Centers and eight Commercial Banking Centers (collectively “Centers”) located in the Inland Empire, Los Angeles County, Orange County, San Diego County, Ventura County, Santa Barbara County, and the Central Valley area of California.
We also have three trust offices located in Ontario, Newport Beach and Pasadena. These offices serve as sales offices for the Bank’s wealth management, trust and investment products.
Through our network of Centers, we emphasize personalized service combined with a wide range of banking and trust services for businesses, professionals and individuals located in the service areas of our Centers. Although we focus the marketing of our services to small-and medium-sized businesses, a wide range of banking, investment and trust services are made available to the local consumer market.
We offer a standard range of bank deposit instruments. These include checking, savings, money market and time certificates of deposit for both business and personal accounts. We also serve as a federal tax depository for our business customers.
We also provide a full complement of lending products, including commercial, agribusiness, consumer, real estate loans and equipment and vehicle leasing. Commercial products include lines of credit and other working capital financing, accounts receivable lending and letters of credit. Agribusiness products are loans to finance the operating needs of wholesale dairy farm operations, cattle feeders, livestock raisers, and farmers. We provide bank qualified lease financing for municipal governments. Commercial real estate and construction loans are secured by a range of property types and include both owner-occupied and investor owned properties. Financing products for consumers include automobile leasing and financing, lines of credit, credit cards, home mortgages, and home equity loans and lines of credit.
We also offer a wide range of specialized services designed for the needs of our commercial customers. These services include cash management systems for monitoring cash flow, a credit card program for merchants, courier pick-up and delivery, payroll services, remote deposit capture, electronic funds transfers by way of domestic and international wires and automated clearinghouse, and on-line account access. We make available investment products offered by other providers to our customers, including mutual funds, a full array of fixed income vehicles and a program to diversify our customers’ funds in federally insured time certificates of deposit of other institutions.
In addition, we offer a wide range of financial services and trust services through our CitizensTrust division. These services include fiduciary services, mutual funds, annuities, 401(k) plans and individual investment accounts.
Business Segments
We are a community bank with two reportable operating segments: (i) Business Financial and Commercial Banking Centers (“Centers”) and (ii) Other Operations (“Other”). Our Centers are the focal points for customer sales and services and the primary focus of management of the Company. In 2016 all other operating departments have been combined into the “Other” category for reporting purposes. See the sections captioned “Results by Segment Operations” in Item 7. Management’s Discussion and Analysis of Financial Condition and Results of Operations and Note 21 — Business Segments of the notes to consolidated financial statements.
Competition
The banking and financial services business is highly competitive. The competitive environment faced by banks is a result primarily of changes in laws and regulations, changes in technology and product delivery systems, and the ongoing consolidation among insured financial institutions. We compete for loans, deposits, and customers with other commercial banks, savings and loan associations, savings banks, securities and brokerage
5
Table of Contents
companies, mortgage companies, insurance companies, finance companies, money market funds, credit unions, and other nonbank financial service providers, including online banks and “peer-to-peer” or “marketplace” lenders and other small business and consumer lenders. Many competitors are much larger in total assets and capitalization, have greater access to capital markets and/or offer a broader range of financial products and services, including technology-based services.
Economic Conditions/Government Policies
Our profitability, like most financial institutions, is primarily dependent on interest rate spreads and noninterest income. In general, the difference between the interest rates paid by the Bank on interest-bearing liabilities, such as deposits and other borrowings, and the interest rates received by the Bank on interest-earning assets, such as loans extended to customers and securities held in the investment portfolio, will comprise the major portion of our earnings. These rates are highly sensitive to many factors that are beyond our control, such as inflation, recession and unemployment, government monetary and other policies, and the impact which future changes in domestic and foreign economic conditions might have on us cannot be predicted.
Opportunity for banks to earn fees and other noninterest income have also been limited by restrictions imposed by the Dodd-Frank Wall Street Reform and Consumer Protection Act (“Dodd-Frank”) and other government regulations. As the following sections indicate, the impact of current and future changes in government laws and regulations on our ability to maintain current levels of fees and other noninterest income could be material and cannot be predicted.
Our business is also influenced by the monetary and fiscal policies of the federal government and the policies of regulatory agencies, particularly the Federal Reserve. The Federal Reserve implements national monetary policies (with objectives such as curbing inflation, increasing employment and combating recession) through its open-market operations in U.S. Government securities by buying and selling treasury and mortgage-backed securities, by adjusting the required level of reserves for depository institutions subject to its reserve requirements, and by varying the target federal funds and discount rates applicable to borrowings by depository institutions. The actions of the Federal Reserve in these areas influence the growth and performance of bank loans, investments, and deposits and also affect interest earned on interest-earning assets and paid on interest-bearing liabilities. Government fiscal and budgetary policies, including deficit spending, can also have a significant impact on the capital markets and interest rates. The nature and impact of any future changes in monetary and fiscal policies on us cannot be predicted.
Regulation and Supervision
General
The Company and the Bank are subject to significant regulation and restrictions by federal and state laws and regulatory agencies. These regulations and restrictions are intended primarily for the protection of depositors and the Federal Deposit Insurance Corporation (“FDIC”) Deposit Insurance Fund (“DIF”) and for the protection of borrowers, and secondarily for the stability of the U.S. banking system. The following discussion of statutes and regulations is a summary and does not purport to be complete nor does it address all applicable statutes and regulations. This discussion is qualified in its entirety by reference to the statutes and regulations referred to in this discussion. From time to time, federal and state legislation is enacted and implemented by regulations which may have the effect of materially increasing the cost of doing business, limiting or expanding permissible activities, or affecting the competitive balance between banks and other financial services providers.
We cannot predict whether or when other legislation or new regulations may be enacted, and if enacted, the effect that new legislation or any implemented regulations and supervisory policies would have on our financial condition and results of operations. Such developments may further alter the structure, regulation, and
6
Table of Contents
competitive relationship among financial institutions, may limit the types or pricing of the products and services we offer, and may subject us to increased regulation, disclosure, and reporting requirements.
Legislation and Regulatory Developments
The federal banking agencies continue to implement the remaining requirements in the Dodd-Frank Act as well as promulgating other regulations and guidelines intended to assure the financial strength and safety and soundness of banks and the stability of the U.S. banking system. Following on the implementation and effectiveness of new capital rules (“the New Capital Rules”) and the so called Volcker Rule restrictions on certain proprietary trading and investment activities, recent developments have included:
(i) the extension of the Volcker Rule conformance period until July 21, 2017 for banking institutions to conform existing investments, including certain collateralized loan obligations, and relationships, with certain exceptions, with “covered funds”, including hedge funds, private equity funds and certain other private funds. The Company and the Bank held no investment positions at December 31, 2016 which were subject to the final rule. — See “Volcker Rule” and has controls in place to ensure compliance with the Volcker Rule going forward.
(ii) the shift in the stress testing cycle and reporting dates required by the banking agencies for institutions with total consolidated assets of $10 billion to $50 billion to assess the potential impact of different scenarios on earnings, losses, liquidity and capital. The Bank conducts a modified form of stress testing but is not currently subject to these requirements.
(iii) the continued implementation of an additional “capital conservation buffer” increasing to 1.25% in 2017 for minimum risk-weighted asset ratios under the New Capital Rules. — See “Capital Adequacy” and “Management’s Discussion and Analysis of Financial Condition and Results of Operations — Capital Resources.
(iv) the effectiveness of the final TILA-RESPA Integrated Disclosure (”TRID”) rules promulgated by the Bureau of Consumer Finance Protection (as described below), as required by the Dodd-Frank Act, which require new mortgage disclosures and training of staff for most mortgage loan applications. CBB is employing its best efforts to comply with the new TRID requirements.—
(v) the release by the Interagency Federal Financial Institutions Examinations Council (FFIEC) of a cybersecurity assessment tool for voluntary use by banks which provides guidelines to measure a bank’s individual risk profile” and “Cybersecurity maturity”. The Bank is considering whether and in what form we would implement this tool.
(vi) the adoption of the Fixing America’s Surface Transportation Act (the “FAST Act”), highway legislation which contains financial services provisions, including (a) expanding the extended 18 months examination cycle for banks with up to $1 billion in assets; (b) deleting the annual privacy notice for banks which have not changed their policy or practices of sharing of information with third parties and (c) limiting the percentage payment of dividends on reserve bank stock held by banks with more than $10 billion in assets. The bank as a nonmember state bank holds no reserve bank stock.
(vii) the pronouncement by the Office of the Comptroller of the Currency of a limited-purpose “fintech” national bank charter which would enable a fintech company to originate loans and access the payment system directly, without relying on third-party banks. Such a development could further increase competition in the financial services sector, including with the Company and the Bank.
7
Table of Contents
In the exercise of their supervisory and examination authority, the regulatory agencies have emphasized corporate governance, capital planning and stress testing, enterprise risk management and other board responsibilities; anti-money laundering compliance; information technology adequacy; cyber security preparedness; vendor management and fair lending and other consumer compliance obligations.
Capital Adequacy Requirements
Bank holding companies and banks are subject to similar regulatory capital requirements administered by state and federal banking agencies. The basic capital rule changes in the New Capital Rules adopted by the federal bank regulatory agencies were fully effective on January 1, 2015, but many elements are being phased in over multiple future years. The risk-based capital guidelines for bank holding companies, and additionally for banks, require capital ratios that vary based on the perceived degree of risk associated with a banking organization’s operations, both for transactions reported on the balance sheet as assets, such as loans, and for those recorded as off-balance sheet items, such as commitments, letters of credit and recourse arrangements. The risk-based capital ratio is determined by classifying assets and certain off-balance sheet financial instruments into weighted categories, with higher levels of capital being required for those categories perceived as representing greater risks, and with the applicable ratios calculated by dividing qualifying capital by total risk-adjusted assets and off-balance sheet items. Capital amounts and classifications are also subject to qualitative judgments by regulators about components, risk weighting and other factors. Bank holding companies and banks engaged in significant trading activity may also be subject to the market risk capital guidelines and be required to incorporate additional market and interest rate risk components into their risk-based capital standards. To the extent that the new rules are not fully phased in, the prior capital rules will continue to apply.
The New Capital Rules revised the previous risk-based and leverage capital requirements for banking organizations to meet the requirements of the Dodd-Frank Act and to implement the international Basel Committee on Banking Supervision Basel III agreements. Many of the requirements in the New Capital Rules and other regulations and rules are applicable only to larger or internationally active institutions and not to all banking organizations, including institutions currently with less than $10 billion of assets, which includes CVB and the Bank. These include required annual stress tests for institutions with $10 billion or more assets and Enhanced Prudential Standards, Comprehensive Capital Analysis and Review requirements, Capital Plan and Resolution Plan or living will submissions. These also include an additional countercyclical capital buffer, a supplementary leverage ratio and the Liquidity Coverage Ratio rule requiring sufficient high-quality liquid assets, which may in turn apply to institutions with $50 billion or more in assets, $250 billion or more in assets, or institutions which may be identified as Global Systematically Important Banking Institutions (G-SIBs). If CVB were to cross the $10 billion or more asset threshold, its compliance costs and regulatory requirements, including the requirement to conduct an annual company-run stress test, would increase. Under the risk-based capital guidelines in place prior to the effectiveness of the New Capital Rules, which trace back to the 1988 Basel I accord, there were three fundamental capital ratios: a total risk-based capital ratio, a Tier 1 risk-based capital ratio and a Tier 1 leverage ratio. To be deemed “well capitalized,” a bank must have a total risk-based capital ratio, a Tier 1 risk-based capital ratio and a Tier 1 leverage ratio of at least ten percent, six percent and five percent, respectively. Under the capital rules that applied in 2014, there was no Tier 1 leverage requirement for a holding company to be deemed well-capitalized.
The following are the New Capital Rules applicable to the Company and the Bank which began January 1, 2015:
| • | an increase in the minimum Tier 1 capital ratio from 4.00% to 6.00% of risk-weighted assets; |
| • | a new category and a required 4.50% of risk-weighted assets ratio is established for “common equity Tier 1” as a subset of Tier 1 capital limited to common equity; |
| • | a minimum non-risk-based leverage ratio is set at 4.00%; |
| • | changes in the permitted composition of Tier 1 capital to exclude trust preferred securities subject to certain grandfathering exceptions for organizations like CVB which were under $15 billion in |
8
Table of Contents
| assets as of December 31, 2009, mortgage servicing rights and certain deferred tax assets and include unrealized gains and losses on available for sale debt and equity securities unless the organization opts out of including such unrealized gains and losses, which election the Company made in 2015; |
| • | the risk-weights of certain assets for purposes of calculating the risk-based capital ratios are changed for high volatility commercial real estate acquisition, development and construction loans, certain past due non-residential mortgage loans and certain mortgage-backed and other securities exposures; and |
| • | an additional capital conservation buffer of 2.5% of risk weighted assets above the regulatory minimum capital ratios, which will be phased in over four years beginning at the rate of 0.625% of risk-weighted assets per year beginning 2016 and which must be met to avoid limitations on the ability of the Bank to pay dividends, repurchase shares or pay discretionary bonuses. |
Management believes that, as of December 31, 2016, the Company and the Bank would meet all requirements under the New Capital Rules applicable to them on a fully phased-in basis if such requirements were currently in effect.
Including the capital conservation buffer of 2.5%, the New Capital Rules would result in the following minimum ratios to be considered well capitalized: (i) a Tier 1 capital ratio of 8.5%, (ii) a common equity Tier 1 capital ratio of 7.0%, and (iii) a total capital ratio of 10.5%. At December 31, 2016, the respective capital ratios of the Company and the Bank exceeded the minimum percentage requirements to be deemed “well-capitalized” for regulatory purposes. See “Management’s Discussion and Analysis of Financial Condition and Results of Operations — Capital Resources.”
While the New Capital Rules set higher regulatory capital standards for the Company and the Bank, bank regulators may also continue their past policies of expecting banks to maintain additional capital beyond the new minimum requirements. The implementation of the New Capital Rules or more stringent requirements to maintain higher levels of capital or to maintain higher levels of liquid assets could adversely impact the Company’s net income and return on equity, restrict the ability to pay dividends or executive bonuses and require the raising of additional capital. See “Management’s Discussion and Analysis of Financial Condition and Results of Operations—Capital Resources.
Prompt Corrective Action Provisions
The Federal Deposit Insurance Act requires the federal bank regulatory agencies to take “prompt corrective action” with respect to a depository institution if that institution does not meet certain capital adequacy standards, including requiring the prompt submission of an acceptable capital restoration plan. Depending on the bank’s capital ratios, the agencies’ regulations define five categories in which an insured depository institution will be placed: well-capitalized, adequately capitalized, undercapitalized, significantly undercapitalized, and critically undercapitalized. At each successive lower capital category, an insured bank is subject to more restrictions, including restrictions on the bank’s activities, operational practices or the ability to pay dividends or executive bonuses. Based upon its capital levels, a bank that is classified as well-capitalized, adequately capitalized, or undercapitalized may be treated as though it were in the next lower capital category if the appropriate federal banking agency, after notice and opportunity for hearing, determines that an unsafe or unsound condition, or an unsafe or unsound practice, warrants such treatment.
The prompt corrective action standards were changed to conform with the New Capital Rules. Under the new standards, in order to be considered well-capitalized, the bank will be required to meet the new common equity Tier 1 ratio of 6.5%, an increased Tier 1 ratio of 8% (increased from 6%), a total capital ratio of 10% (unchanged) and a leverage ratio of 5% (unchanged).
The federal banking agencies also may require banks and bank holding companies subject to enforcement actions to maintain capital ratios in excess of the minimum ratios otherwise required to be deemed well capitalized, in which case institutions may no longer be deemed to be well capitalized and may therefore be subject to certain restrictions such as taking brokered deposits.
9
Table of Contents
Volcker Rule
In December 2013, the federal bank regulatory agencies adopted final rules that implement a part of the Dodd-Frank Act commonly referred to as the “Volcker Rule.” Under these rules and subject to certain exceptions, banking entities are restricted from engaging in activities that are considered proprietary trading and from sponsoring or investing in certain entities, including hedge or private equity funds that are considered “covered funds.” These rules became effective on April 1, 2014, although certain provisions are subject to delayed effectiveness under rules promulgated by the FRB. The Company and the Bank held no investment positions at December 31, 2016 which were subject to the final rule. Therefore, while these new rules may require us to conduct certain internal analysis and reporting to ensure continued compliance, they did not require any material changes in our operations or business.
Bank Holding Company Regulation
Bank holding companies and their subsidiaries are subject to significant regulation and restrictions by Federal and State laws and regulatory agencies, which may affect the cost of doing business, and may limit permissible activities and expansion or impact the competitive balance between banks and other financial services providers.
A wide range of requirements and restrictions are contained in both federal and state banking laws, which together with implementing regulatory authority:
| • | Require periodic reports and such additional reports of information as the Federal Reserve may require; |
| • | Require bank holding companies to meet or exceed increased levels of capital (See “Capital Adequacy Requirements”); |
| • | Require that bank holding companies serve as a source of financial and managerial strength to subsidiary banks and commit resources as necessary to support each subsidiary bank; |
| • | Limit of dividends payable to shareholders and restrict the ability of bank holding companies to obtain dividends or other distributions from their subsidiary banks. The Company’s ability to pay dividends on both its common and preferred stock is subject to legal and regulatory restrictions. Substantially all of the Company’s funds to pay dividends or to pay principal and interest on our debt obligations are derived from dividends paid by the Bank; |
| • | Require a bank holding company to terminate an activity or terminate control of or liquidate or divest certain subsidiaries, affiliates or investments if the Federal Reserve believes the activity or the control of the subsidiary or affiliate constitutes a significant risk to the financial safety, soundness or stability of any bank subsidiary; |
| • | Require the prior approval of senior executive officer or director changes and prohibit golden parachute payments, including change in control agreements, or new employment agreements with such payment terms, which are contingent upon termination if an institution is in “troubled condition”; |
| • | Regulate provisions of certain bank holding company debt, including the authority to impose interest ceilings and reserve requirements on such debt and require prior approval to purchase or redeem securities in certain situations; |
| • | Require prior approval for the acquisition of 5% or more of the voting stock of a bank or bank holding company by bank holding companies or other acquisitions and mergers with banks and consider certain competitive, management, financial, anti-money-laundering compliance, potential impact on U.S. financial stability or other factors in granting these approvals, in addition to similar California or other state banking agency approvals which may also be required; and |
| • | Require prior notice and/or prior approval of the acquisition of control of a bank or a bank holding company by a shareholder or individuals acting in concert with ownership or control of 10% of the voting stock being a presumption of control. |
10
Table of Contents
Other Restrictions on the Company’s Activities
Subject to prior notice or Federal Reserve approval, bank holding companies may generally engage in, or acquire shares of companies engaged in, activities determined by the Federal Reserve to be so closely related to banking or managing or controlling banks as to be a proper incident thereto. Bank holding companies which elect and retain “financial holding company” status pursuant to the Gramm-Leach-Bliley Act of 1999 (“GLBA”) may engage in these nonbanking activities and broader securities, insurance, merchant banking and other activities that are determined to be “financial in nature” or are incidental or complementary to activities that are financial in nature without prior Federal Reserve approval. Pursuant to GLBA and Dodd-Frank, in order to elect and retain financial holding company status, a bank holding company and all depository institution subsidiaries of a bank holding company must be considered well capitalized and well managed, and, except in limited circumstances, depository subsidiaries must be in satisfactory compliance with the Community Reinvestment Act (“CRA”), which requires banks to help meet the credit needs of the communities in which they operate. Failure to sustain compliance with these requirements or correct any non-compliance within a fixed time period could lead to divestiture of subsidiary banks or require all activities to conform to those permissible for a bank holding company. CVB has not elected financial holding company status and neither CVB nor the Bank has engaged in any activities determined by the Federal Reserve to be financial in nature or incidental or complementary to activities that are financial in nature.
CVB is also a bank holding company within the meaning of Section 3700 of the California Financial Code. Therefore, CVB and any of its subsidiaries are subject to examination by, and may be required to file reports with, the California Department of Business Oversight (“DBO”). DBO approvals may also be required for certain mergers and acquisitions.
Securities Exchange Act of 1934
CVB’s common stock is publicly held and listed on the NASDAQ Stock Market (“NASDAQ”), and CVB is subject to the periodic reporting, information, proxy solicitation, insider trading, corporate governance and other requirements and restrictions of the Securities Exchange Act of 1934 and the regulations of the Securities and Exchange Commission (“SEC”) promulgated thereunder as well as listing requirements of NASDAQ.
Sarbanes-Oxley Act
The Company is subject to the accounting oversight and corporate governance requirements of the Sarbanes-Oxley Act of 2002, including, among other things, required executive certification of financial presentations, requirements for board audit committees and their members, and disclosure of controls and procedures and internal control over financial reporting.
Bank Regulation
As a California commercial bank whose deposits are insured by the FDIC, the Bank is subject to regulation, supervision, and regular examination by the DBO and by the FDIC, as the Bank’s primary Federal regulator, and must additionally comply with certain applicable regulations of the Federal Reserve. Specific federal and state laws and regulations which are applicable to banks regulate, among other things, the scope of their business, their investments, their reserves against deposits, the timing of the availability of deposited funds, their activities relating to dividends, investments, loans, the nature and amount of and collateral for certain loans, servicing and foreclosing on loans, borrowings, capital requirements, certain check-clearing activities, branching, and mergers and acquisitions. California banks are also subject to statutes and regulations including Federal Reserve Regulation O and Federal Reserve Act Sections 23A and 23B and Regulation W, which restrict or limit loans or extensions of credit to “insiders”, including officers, directors, and principal shareholders, and loans or extension of credit by banks to affiliates or purchases of assets from affiliates, including parent bank holding companies, except pursuant to certain exceptions and only on terms and conditions at least as favorable to those prevailing
11
Table of Contents
for comparable transactions with unaffiliated parties. Failure to comply with applicable bank regulation or adverse results from any examinations of the Bank could affect the cost of doing business, and may limit or impede otherwise permissible activities and expansion activities by the Bank.
Pursuant to the Federal Deposit Insurance Act (“FDI Act”) and the California Financial Code, California state chartered commercial banks may generally engage in any activity permissible for national banks. Therefore, the Bank may form subsidiaries to engage in the many so-called “closely related to banking” or “nonbanking” activities commonly conducted by national banks in operating subsidiaries or in subsidiaries of bank holding companies. Further, California banks may conduct certain “financial” activities permitted under GLBA in a “financial subsidiary” to the same extent as may a national bank, provided the bank is and remains “well-capitalized,” “well-managed” and in satisfactory compliance with the CRA. The Bank currently has no financial subsidiaries.
FDIC and DBO Enforcement Authority
The federal and California regulatory structure gives the bank regulatory agencies extensive discretion in connection with their supervisory and enforcement activities and examination policies, including policies with respect to the classification of assets and the establishment of appropriate loan loss reserves for regulatory purposes. The regulatory agencies have adopted guidelines to assist in identifying and addressing potential safety and soundness concerns before an institution’s capital becomes impaired. The guidelines establish operational and managerial standards generally relating to: (1) internal controls, information systems, and internal audit systems; (2) loan documentation; (3) credit underwriting; (4) interest-rate exposure; (5) asset growth and asset quality; and (6) compensation, fees, and benefits. Further, the regulatory agencies have adopted safety and soundness guidelines for asset quality and for evaluating and monitoring earnings to ensure that earnings are sufficient for the maintenance of adequate capital and reserves. If, as a result of an examination, the DBO or the FDIC should determine that the financial condition, capital resources, asset quality, earnings prospects, management, liquidity, or other aspects of the Bank’s operations are unsatisfactory or that the Bank or its management is violating or has violated any law or regulation, the DBO and the FDIC, and separately the FDIC as insurer of the Bank’s deposits, have residual authority to:
| • | Require affirmative action to correct any conditions resulting from any violation or practice; |
| • | Direct an increase in capital and the maintenance of higher specific minimum capital ratios, which could preclude the Bank from being deemed well capitalized and restrict its ability to accept certain brokered deposits; |
| • | Restrict the Bank’s growth geographically, by products and services, or by mergers and acquisitions, including bidding in FDIC receiverships for failed banks; |
| • | Enter into or issue informal or formal enforcement actions, including required Board resolutions, Matters Requiring Board Attention (MRBA), written agreements and consent or cease and desist orders or prompt corrective action orders to take corrective action and cease unsafe and unsound practices; |
| • | Require prior approval of senior executive officer or director changes; remove officers and directors and assess civil monetary penalties; and |
| • | Terminate FDIC insurance, revoke the charter and/or take possession of and close and liquidate the Bank or appoint the FDIC as receiver. |
Deposit Insurance
The FDIC is an independent federal agency that insures deposits, up to prescribed statutory limits, of federally insured banks and savings institutions and safeguards the safety and soundness of the banking and savings industries. The FDIC insures our customer deposits through the DIF up to prescribed limits for each depositor. The Dodd-Frank Act revised the FDIC’s DIF management authority by setting requirements for the Designated Reserve Ratio (the DIF balance divided by estimated insured deposits) and redefining the assessment base, which is used to calculate banks’ quarterly assessments. The amount of FDIC assessments paid by each DIF member institution is based on its asset size and relative risk of default as measured by regulatory capital
12
Table of Contents
ratios and other supervisory factors. The FDIC may terminate a depository institution’s deposit insurance upon a finding that the institution’s financial condition is unsafe or unsound or that the institution has engaged in unsafe or unsound practices that pose a risk to the DIF or that may prejudice the interest of the bank’s depositors. The termination of deposit insurance for a bank would also result in the revocation of the bank’s charter by the DBO.
We are generally unable to control the amount of premiums that we are required to pay for FDIC insurance, which can be affected by the cost of bank failures to the FDIC among other factors.
In October 2010, the FDIC adopted a restoration plan to ensure that the fund reserve ratio reaches 1.35%. In March 2016, the FDIC approved a final rule requiring banks with more than $10 billion in total assets to pay “surcharge assessments” at an annual rate of 0.045% to bring the fund’s reserve ratio to 1.35% by the end of 2018. If the fund’s reserve ratio does not reach 1.35% by the end of 2018, the FDIC will impose a one-time special assessment in the first quarter of 2019. For banks with less than $10 billion in total assets, such as the Bank, in April 2016, the board of directors of the FDIC approved a final rule to amend the risk-based assessment methodology for banks with less than $10.0 billion in assets that have been FDIC-insured for at least five years, such as the Bank. The final rule replaces the four risk categories for determining such a bank’s assessment rate with a financial ratios method based on a statistical model estimating the bank’s probability of failure over three years. The final rule also eliminates the then existing brokered deposit downward adjustment factor for such banks’ assessment rates; lowers the range of assessment rates authorized to 0.015% per annum for an institution posing the least risk, to 0.40% per annum for an institution posing the most risk; and will further lower the range of assessment rates if the reserve ratio of the Deposit Insurance Fund increases to 2% or more.
The FDIC will, at least semi-annually, update its income and loss projections for the Deposit Insurance Fund and, if necessary, propose rules to further increase assessment rates. Any future increases in FDIC insurance premiums may have a material and adverse effect on our earnings and could have a material adverse effect on the value of, or market for, our common stock.
Dividends
It is the Federal Reserve’s policy that bank holding companies should generally pay dividends on common stock only out of income available over the past year, and only if prospective earnings retention is consistent with the organization’s expected future needs and financial condition. It is also the Federal Reserve’s policy that bank holding companies should not maintain dividend levels that undermine their ability to be a source of strength to its banking subsidiaries. The Federal Reserve also discourages dividend payment ratios that are at maximum allowable levels unless both asset quality and capital are very strong. In addition, a bank holding company may be unable to pay dividends on its common stock if it fails to maintain an adequate capital conservation buffer under the New Capital Rules.
The Bank is a legal entity that is separate and distinct from its holding company. The Company relies on dividends received from the Bank for use in the operation of the Company and the ability of the Company to pay dividends to shareholders. Future cash dividends by the Bank will also depend upon management’s assessment of future capital requirements, contractual restrictions, and other factors. The new Capital Rules may restrict dividends by the Bank if the additional capital conservation buffer is not achieved. See “Capital Adequacy Requirements”.
The ability of the Bank to declare a cash dividend to CVB is subject to California law, which restricts the amount available for cash dividends to the lesser of a bank’s retained earnings or net income for its last three fiscal years (less any distributions to shareholders made during such period). Where the above test is not met, cash dividends may still be paid, with the prior approval of the DBO, in an amount not exceeding the greatest of (1) retained earnings of the bank; (2) the net income of the bank for its last fiscal year; or (3) the net income of the bank for its current fiscal year.
13
Table of Contents
Compensation
The Dodd-Frank Act requires the federal bank regulators and the SEC to establish joint regulations or guidelines prohibiting incentive-based payment arrangements at specified regulated entities, including the Company and the Bank, having at least $1 billion in total assets that encourage inappropriate risks by providing an executive officer, employee, director or principal stockholder with excessive compensation, fees or benefits or that could lead to material financial loss to the entity. In addition, these regulators must establish regulations or guidelines requiring enhanced disclosure to regulators of incentive-based compensation arrangements. The agencies proposed such regulations initially in April 2011 and in April 2016, the Federal Reserve and other federal financial agencies re-proposed restrictions on incentive-based compensation. For institutions with at least $1 billion but less than $50 billion in total consolidated assets, such as the Company and the Bank, the proposal would impose principles-based restrictions that are broadly consistent with existing interagency guidance on incentive-based compensation. Such institutions would be prohibited from entering into incentive compensation arrangements that encourage inappropriate risks by the institution (1) by providing an executive officer, employee, director, or principal shareholder with excessive compensation, fees, or benefits, or (2) that could lead to material financial loss to the institution. The proposal would also impose certain governance and recordkeeping requirements on institutions of the Company’s and the Bank’s size. The regulatory organizations would reserve the authority to impose more stringent requirements on institutions of the Company’s and the Bank’s size. We are evaluating the expected impact of the proposal on our business.
Operations and Consumer Compliance Laws
The Bank must comply with numerous federal and state anti-money laundering and consumer protection statutes and implementing regulations, including the USA PATRIOT Act of 2001, the Bank Secrecy Act, the Foreign Account Tax Compliance Act, the CRA, the Fair Debt Collection Practices Act, the Fair Credit Reporting Act, the Equal Credit Opportunity Act, the Truth in Lending Act, the Fair Housing Act, the Home Mortgage Disclosure Act, the Real Estate Settlement Procedures Act, the National Flood Insurance Act, the California Homeowner Bill of Rights and various federal and state privacy protection laws, including the Telephone Consumer Protection Act , CAN-SPAM Act. Noncompliance with any of these laws could subject the Bank to compliance enforcement actions as well as lawsuits and could also result in administrative penalties, including, fines and reimbursements. The Bank and the Company are also subject to federal and state laws prohibiting unfair or fraudulent business practices, untrue or misleading advertising and unfair competition.
These laws and regulations mandate certain disclosure and reporting requirements and regulate the manner in which financial institutions must deal with customers when taking deposits, making loans, servicing, collecting and foreclosure of loans, and providing other services. Failure to comply with these laws and regulations can subject the Bank and the Company to various penalties, including but not limited to enforcement actions, injunctions, fines or criminal penalties, punitive damages to consumers, and the loss of certain contractual rights.
The Bank received a “Satisfactory” rating in its most recent FDIC CRA performance evaluation, which measures how financial institutions support their communities in the areas of lending, investment and service.
The Dodd-Frank Act provided for the creation of the Bureau of Consumer Finance Protection (“CFPB”) as an independent entity within the Federal Reserve with broad rulemaking, supervisory and enforcement authority over consumer financial products and services, including deposit products, residential mortgages, home-equity loans and credit cards. The CFPB’s functions include investigating consumer complaints, conducting market research, rulemaking, and enforcing rules related to consumer financial products and services. CFPB regulations and guidance apply to all covered persons and banks with $10 billion or more in assets are subject to supervision including examination by the CFPB. Banks with less than $10 billion in assets, including the Bank, will continue to be examined for compliance by their primary federal banking agency.
14
Table of Contents
The CFPB has finalized a number of significant rules which impact nearly every aspect of the lifecycle of a residential mortgage loan. These rules implement the Dodd-Frank Act amendments to the Equal Credit Opportunity Act, the Truth in Lending Act and the Real Estate Settlement Procedures Act. Among other things, the rules adopted by the CFPB require covered persons including banks making residential mortgage loans to: (i) develop and implement procedures to ensure compliance with an “ability-to-repay” test and identify whether a loan meets a new definition for a “qualified mortgage”, in which case a rebuttable presumption exists that the creditor extending the loan has satisfied the ability-to-repay test; (ii) implement new or revised disclosures, policies and procedures for originating and servicing mortgages including, but not limited to, pre-loan counseling, early intervention with delinquent borrowers and specific loss mitigation procedures for loans secured by a borrower’s principal residence; (iii) comply with additional restrictions on mortgage loan originator hiring and compensation; (iv) comply with new disclosure requirements and standards for appraisals and certain financial products; and (v) maintain escrow accounts for higher-priced mortgage loans for a longer period of time.
The review of products and practices to prevent unfair, deceptive or abusive acts or practices (“UDAAP”) is a continuing focus of the CFPB, and of banking regulators more broadly. The ultimate impact of this heightened scrutiny is uncertain but could result in changes to pricing, practices, products and procedures. It could also result in increased costs related to regulatory oversight, supervision and examination, additional remediation efforts and possible penalties. In addition, the Dodd-Frank Act provides the CFPB with broad supervisory, examination and enforcement authority over various consumer financial products and services, including the ability to require reimbursements and other payments to customers for alleged violations of UDAAP and other legal requirements and to impose significant penalties, as well as injunctive relief that prohibits lenders from engaging in allegedly unlawful practices. The CFPB also has the authority to obtain cease and desist orders providing for affirmative relief or monetary penalties. The Dodd-Frank Act does not prevent states from adopting stricter consumer protection standards. State regulation of financial products and potential enforcement actions could also adversely affect the Bank’s business, financial condition or results of operations.
The federal bank regulators have adopted rules limiting the ability of banks and other financial institutions to disclose non-public information about consumers to unaffiliated third parties. These limitations require disclosure of privacy policies to consumers and, in some circumstances, allow consumers to prevent disclosure of certain personal information to a nonaffiliated third party. These regulations affect how consumer information is transmitted through diversified financial companies and conveyed to outside vendors. In addition, consumers may also prevent disclosure of certain information among affiliated companies that is assembled or used to determine eligibility for a product or service, such as that shown on consumer credit reports and asset and income information from applications. Consumers also have the option to direct banks and other financial institutions not to share information about transactions and experiences with affiliated companies for the purpose of marketing products or services.
Under the Durbin Amendment to the Dodd-Frank Act, the Federal Reserve adopted rules establishing standards for assessing whether the interchange fees that may be charged with respect to certain electronic debit transactions are “reasonable and proportional” to the costs incurred by issuers for processing such transactions.
Interchange fees, or “swipe” fees, are charges that merchants pay to us and other card-issuing banks for processing electronic payment transactions. Under the final rules, the maximum permissible interchange fee is equal to no more than 21 cents plus 5 basis points of the transaction value for many types of debit interchange transactions. The Federal Reserve also adopted a rule to allow a debit card issuer to recover one cent per transaction for fraud prevention purposes if the issuer complies with certain fraud-related requirements required by the Federal Reserve. The Federal Reserve also has rules governing routing and exclusivity that require issuers to offer two unaffiliated networks for routing transactions on each debit or prepaid product.
Currently, we qualify for the small issuer exemption from the interchange fee cap, which applies to any debit card issuer that, together with its affiliates, has total assets of less than $10 billion as of the end of the
15
Table of Contents
previous calendar year. We will become subject to the interchange fee cap beginning July 1 of the year following the time when our total assets reaches or exceeds $10 billion. Reliance on the small issuer exemption does not exempt us from federal regulations prohibiting network exclusivity arrangements or from routing restrictions, however.
Commercial Real Estate Concentration Limits
In December 2006, the federal banking regulators issued guidance entitled “Concentrations in Commercial Real Estate Lending, Sound Risk Management Practices” to address increased concentrations in commercial real estate, or CRE, loans. In addition, in December 2015, the federal bank agencies issued additional guidance entitled “Statement on Prudent Risk Management for Commercial Real Estate Lending.” Together, these guidelines describe the criteria the agencies will use as indicators to identify institutions potentially exposed to CRE concentration risk. An institution that has (i) experienced rapid growth in CRE lending, (ii) notable exposure to a specific type of CRE, (iii) total reported loans for construction, land development, and other land representing 100% or more of the institution’s capital, or (iv) total CRE loans representing 300% or more of the institution’s capital, and the outstanding balance of the institutions CRE portfolio has increased by 50% or more in the prior 36 months, may be identified for further supervisory analysis of the level and nature of its CRE concentration risk. As of December 31, 2016, the Bank’s total CRE loans represented 236% of its capital.
Future Legislation and Regulation
Congress may enact, modify or repeal legislation from time to time that affects the regulation of the financial services industry, and state legislatures may enact, modify or repeal legislation from time to time affecting the regulation of financial institutions chartered by or operating in those states. Federal and state regulatory agencies also periodically propose and adopt changes to their regulations or change the manner in which existing regulations are applied. The substance or impact of pending or future legislation or regulation, or the application thereof, cannot be predicted, although enactment of proposed legislation (or modification or repeal of existing legislation) could impact the regulatory structure under which the Company and Bank operate and may significantly increase its costs, impede the efficiency of its internal business processes, require the Bank to increase its regulatory capital and modify its business strategy, and limit its ability to pursue business opportunities in an efficient manner. The Company’s business, financial condition, results of operations or prospects may be adversely affected, perhaps materially.
Available Information
Reports filed with the SEC include our proxy statements, annual reports on Form 10-K, quarterly reports on Form 10-Q and current reports on Form 8-K. These reports and other information on file can be inspected and copied on official business days between 10:00 a.m. and 3:00 p.m. at the public reference facilities of the SEC on file at 100 F Street, N.E., Washington D.C., 20549. The public may obtain information on the operation of the public reference rooms by calling the SEC at 1-800-SEC-0330. The SEC maintains a website that contains the reports, proxy and information statements and other information we file with them. The address of the site is http://www.sec.gov. The Company also maintains an Internet website at http://www.cbbank.com. We make available, free of charge through our website, our Proxy Statement, Annual Report on Form 10-K, Quarterly Reports on Form 10-Q, and Current Reports on Form 8-K, and any amendments thereto, as soon as reasonably practicable after we file such reports with the SEC. None of the information contained in or hyperlinked from our website is incorporated into this Form 10-K.
16
Table of Contents
Executive Officers of the Company
The following sets forth certain information regarding our five named executive officers, their positions and their ages.
| Executive Officers: | ||||
| Name |
Position |
Age | ||
| Christopher D. Myers |
President and Chief Executive Officer of the Company and the Bank | 54 | ||
| E. Allen Nicholson |
Chief Financial Officer of the Company and Executive Vice President and Chief Financial Officer of the Bank | 49 | ||
| David F. Farnsworth |
Executive Vice President and Chief Credit Officer of the Bank | 60 | ||
| David A. Brager |
Executive Vice President and Sales Division Manager of the Bank | 49 | ||
| David C. Harvey |
Executive Vice President and Chief Operations Officer of the Bank | 49 | ||
Mr. Myers assumed the position of President and Chief Executive Officer of the Company and the Bank on August 1, 2006. Prior to that, Mr. Myers served as Chairman of the Board and Chief Executive Officer of Mellon First Business Bank from 2004 to 2006. From 1996 to 2003, Mr. Myers held several management positions with Mellon First Business Bank, including Executive Vice President, Regional Vice President, and Vice President/Group Manager.
Mr. Nicholson was appointed Chief Financial Officer of the Company and Executive Vice President and Chief Financial Officer of the Bank on May 4, 2016. Previously, Mr. Nicholson served as Executive Vice President and Chief Financial Officer of Pacific Premier Bank and its holding company, Pacific Premier Bancorp Inc. from June of 2015 to May of 2016, and from 2008 to 2014, Mr. Nicholson was Chief Financial Officer of 1st Enterprise Bank. From 2005 to 2008, he was the Chief Financial Officer of Mellon First Business Bank.
Mr. Farnsworth was appointed Executive Vice President and Chief Credit Officer of the Bank on July 18, 2016. Prior to his appointment, Mr. Farnsworth was Executive Vice President, Global Risk Management, and National CRE Risk Executive at BBVA Compass. Previously, Mr. Farnsworth held senior credit management positions with US Bank and AmSouth.
Mr. Brager assumed the position of Executive Vice President and Sales Division Manager of the Bank on November 22, 2010. From 2007 to 2010, he served as Senior Vice President and Regional Manager of the Central Valley Region for the Bank. From 2003 to 2007, he served as Senior Vice President and Manager of the Fresno Business Financial Center for the Bank. From 1997 to 2003, Mr. Brager held management positions with Westamerica Bank.
Mr. Harvey assumed the position of Executive Vice President and Chief Operations Officer of the Bank on December 31, 2009. From 2000 to 2008, he served as Senior Vice President and Operations Manager at Bank of the West. From 2008 to 2009 he served as Executive Vice President and Commercial and Treasury Services Manager at Bank of the West.
| ITEM 1A. | RISK FACTORS |
Risk Factors That May Affect Future Results — Together with the other information on the risks we face and our management of risk contained in this Annual Report or in our other SEC filings, the following presents significant risks which may affect us. Events or circumstances arising from one or more of these risks could
17
Table of Contents
adversely affect our business, financial condition, operating results and prospects and the value and price of our common stock could decline. The risks identified below are not intended to be a comprehensive list of all risks we face, and additional risks that we may currently view as not material may also impair our business operations and results.
Strategic and External Risks
Changes in economic, market and political conditions continue to be challenging for our industry.
Our success depends, to a certain extent, upon local, national and global economic and political conditions, as well as governmental monetary policies. Conditions such as an economic recession, rising unemployment, changes in interest rates, money supply and other factors beyond our control may adversely affect our asset quality, deposit levels and loan demand and, therefore, our earnings. Because we have a significant amount of real estate loans, decreases in real estate values could adversely affect the value of property used as collateral. Adverse changes in the economy may also have a negative effect on the ability of our borrowers to make timely repayments of their loans, which could have an adverse impact on our earnings. Consequently, declines in the economy could have a material adverse effect on our financial condition and results of operations.
Our earnings are significantly affected by the fiscal and monetary policies of the federal government and its agencies.
The policies of the Federal Reserve impact us significantly. Its policies directly and indirectly influence the rate of interest earned on loans and paid on borrowings and interest-bearing deposits and can also affect the value of financial instruments we hold. Changes in those policies are beyond our control and are difficult to predict. Federal Reserve policies can also affect our borrowers, potentially increasing the risk that they may fail to repay their loans. As an example, monetary tightening by the Federal Reserve could adversely affect our borrowers’ earnings and ability to repay their loans, which could have a material adverse effect on our financial condition and results of operations.
U.S. and international financial markets and economic conditions could adversely affect our liquidity, results of operations and financial condition
As described in “Business — Economic Conditions, Government Policies, Regulation and Supervision”, turmoil and downward economic trends have been particularly acute in the financial sector. After suffering sharp declines in values during the 2008-2009 Recession, commercial and residential real estate prices have improved in most areas served by CBB.
While general economic conditions in the United States, including employment markets, appear to have improved, the overall rate of economic growth, compared to prior periods of economic growth, for most of the markets and industries served by CBB, continues to be modest, and this in turn has generally resulted in more limited business expansion, revenue expansion and employment growth for CBB’s customers and geographic markets. In addition, the banking industry has been impacted by increased regulatory oversight, a continuing low interest rate environment, declines in selected overseas markets and various geopolitical issues and conflicts.
There can be no assurance that we will not experience an adverse effect, which may be material, on our business, financial condition and results of operations due to changes in economic conditions, changes in fiscal and monetary policies, and changes in government regulations.
The resulting economic pressure on consumers and businesses, the absence of sustained historical rates of economic growth, and the periodic lack of confidence in financial markets, may adversely affect our business, financial condition, results of operations and stock price. A worsening of any of these conditions would likely
exacerbate the adverse effects of these market conditions on us and others in the financial institutions industry. In particular, we may face the following risks in connection with these events, or any downward turn in the economy:
| • | The process we use to estimate losses inherent in our credit exposure requires difficult, subjective and complex judgments, including forecasts of economic conditions and how these economic |
18
Table of Contents
| conditions might impair the ability of our borrowers to repay their loans. The level of uncertainty concerning economic conditions may adversely affect the accuracy of our estimates which may, in turn, impact the reliability of the process. |
| • | The Company’s commercial, residential and consumer borrowers may be unable to make timely repayments of their loans, or the decrease in value of real estate collateral securing the payment of such loans could result in significant credit losses, increasing delinquencies, foreclosures and customer bankruptcies, any of which could have a material adverse effect on the Company’s operating results. |
| • | A sustained environment of low interest rates would continue to cause lending margins to stay compressed, which in turn may limit our revenues and profitability. |
| • | The value of the portfolio of investment securities that we hold may be adversely affected by increasing interest rates and defaults by debtors. |
| • | Further disruptions in the capital markets or other events, including actions by rating agencies and deteriorating investor expectations, may result in changes in applicable rates of interest, difficulty in accessing capital or an inability to borrow on favorable terms or at all from other financial institutions. |
| • | Increased competition among financial services companies due to expected further consolidation in the industry may adversely affect the Company’s ability to market its products and services. |
Although the Company and the Bank exceed the minimum capital ratio requirements to be deemed well capitalized and have not suffered any significant liquidity issues as a result of these events, the cost and availability of funds may be adversely affected by illiquid credit markets and the demand for our products and services may decline as our borrowers and customers continue to realize the impact of slower than customary economic growth, after-effects of the previous recession and ongoing underemployment of the workforce. In view of the concentration of our operations and the collateral securing our loan portfolio in Central and Southern California, we may be particularly susceptible to adverse economic conditions in the state of California, where our business is concentrated. In addition, adverse economic conditions may exacerbate our exposure to credit risk and adversely affect the ability of borrowers to perform, and thereby, adversely affect our liquidity, financial condition, results or operations and profitability.
Future legislation, regulatory reform or policy changes under the current U.S. administration could have a material effect on our business and results of operations.
The results of the November 2016 elections have generated uncertainty with respect to, and could result in, significant changes in legislation, regulation and government policy that could significantly impact our business. While it is not possible to predict whether and when any such changes will occur or what form any such changes may take (including through the use of Executive Orders), specific proposals discussed during and after the election that could have a material adverse effect on our business, liquidity and results of operations include, but are not limited to, the repeal of all or part of the Dodd-Frank Act, and other significant changes to consumer protection legislation.
Other legislation, regulatory reform or policy changes under the current U.S. administration, such as financial services regulatory reform, U.S. oil deregulation, government-sponsored enterprise (GSE) reform and increased infrastructure spending, could impact our business. At this time, we cannot predict the scope or nature of these changes or assess what the overall effect of such potential changes could be on our results of operations or cash flows.
There exists the potential for comprehensive tax reform in the United States that may significantly change the tax rules applicable to U.S. domiciled corporations. Changes such as lower corporate tax rates, removal of the interest expense deduction, removal of the municipal bond tax exemption or the introduction of a border adjustment tax could impact the Company as a U.S. taxpayer, as well as the demand for our products and services. Current proposals aim to lower the U.S. corporate tax rate from 35% to as low as 15% or 20%, but
19
Table of Contents
generally broaden the base to which the lower tax rate would apply. Many aspects of tax reform plans remain unknown though, and no proposed legislation has been filed. We cannot say with certainty if tax reform will be enacted, or how it would impact the Company at this time.
We face strong competition from financial services companies and other companies that offer banking services
We conduct most of our operations in the state of California. The banking and financial services businesses in the state of California are highly competitive and increased competition in our primary market area may adversely impact the level of our loans and deposits. Ultimately, we may not be able to compete successfully against current and future competitors. These competitors include national banks, regional banks and other community banks. We also face competition from many other types of financial institutions, including savings and loan associations, finance companies, brokerage firms, insurance companies, credit unions, mortgage companies and other financial intermediaries. In particular, our competitors include major financial companies whose greater resources may afford them a marketplace advantage by enabling them to offer products at lower costs, maintain numerous locations, and mount extensive promotional and advertising campaigns. Areas of competition include interest rates for loans and deposits, efforts to obtain loan and deposit customers and a range in quality of products and services provided, including new technology driven products and services. If we are unable to attract and retain banking customers, we may be unable to continue our loan growth and level of deposits.
Potential acquisitions may disrupt our business and dilute shareholder value
We generally seek merger or acquisition partners that are culturally similar and have experienced management and possess either significant market presence or have potential for improved profitability through financial management, economies of scale or expanded services. Acquiring other banks, businesses, or branches involves various risks commonly associated with acquisitions, including, among other things:
| • | Potential exposure to unknown or contingent liabilities of the target company. |
| • | Exposure to potential asset quality issues of the target company. |
| • | Potential disruption to our business. |
| • | Potential diversion of our management’s time and attention. |
| • | The possible loss of key employees and customers of the target company. |
| • | Difficulty in estimating the value of the target company. |
| • | Potential changes in banking or tax laws or regulations that may affect the target company. |
Acquisitions typically involve the payment of a premium over book and market values, and, therefore, some dilution of our tangible book value and net income per common share may occur in connection with any future transaction. Furthermore, failure to realize the expected revenue increases, cost savings, increases in geographic or product presence, and/or other projected benefits from an acquisition could have a material adverse effect on our business, financial condition and results of operations.
Consumers may decide not to use banks to complete their financial transactions.
Technology and other changes are allowing parties to complete financial transactions through alternative methods that historically have involved banks. For example, consumers can now maintain funds that would have historically been held as bank deposits in brokerage accounts, mutual funds or general-purpose reloadable prepaid cards. Consumers can also complete transactions, such as paying bills and / or transferring funds directly without the assistance of banks. In December 2016, the OCC announced that it would begin considering applications from financial technology companies to become special purpose national banks, and requested comments about how it can foster responsible innovation in the chartering process while continuing to provide robust oversight. The process of eliminating banks as intermediaries, known as “disintermediation,” could result
20
Table of Contents
in the loss of fee income, as well as the loss of customer deposits and the related income generated from those deposits. The loss of these revenue streams and the lower cost of deposits as a source of funds could have a material adverse effect on our financial condition and results of operations.
Credit Risks
Our allowance for loan losses may not be sufficient to cover actual losses
A significant source of risk arises from the possibility that we could sustain losses because borrowers, guarantors, and related parties may fail to perform in accordance with the terms of their loans and leases. The underwriting and credit monitoring policies and procedures that we have adopted to address this risk may not prevent unexpected losses that could have a material adverse effect on our business, financial condition, results of operations and cash flows. We maintain an allowance for loan losses to provide for loan and lease defaults and non-performance, which also includes increases for new loan growth. While we believe that our allowance for loan losses is appropriate to cover inherent losses, we cannot assure you that we will not increase the allowance for loan losses further or that regulators will not require us to increase this allowance.
We may be required to make additional provisions for credit losses and charge-off additional loans in the future, which could adversely affect our results of operations
For the year ended December 31, 2016, we recorded a $6.4 million loan loss provision recapture. During 2016 we experienced charge-offs of $238,000, and recoveries of $9.0 million. Because we have a significant amount of real estate loans, decreases in real estate values could adversely affect the value of property used as collateral. As of December 31, 2016, we had $3.0 billion in commercial real estate loans, $85.9 million in construction loans, $339.8 million in dairy & livestock and agribusiness loans, and $250.8 million in single-family residential mortgages. Although the U.S. economy appears to have emerged from a period of severe recession followed by slower than normal growth, business activity and real estate values continue to grow more slowly than in past economic recoveries, and may not recover fully or could again decline from current levels, and this in turn could affect the ability of our loan customers to service their debts, including those customers whose loans are secured by commercial or residential real estate. This, in turn, could result in loan charge-offs and provisions for credit losses in the future, which could have a material adverse effect on our financial condition, net income and capital. In addition, the Federal Reserve Board and other government officials have expressed concerns about banks’ concentration in commercial real estate lending and the ability of commercial real estate borrowers to perform pursuant to the terms of their loans.
Dairy & livestock and agribusiness lending presents unique credit risks.
As of December 31, 2016, approximately 7.7% of our total gross loan portfolio was comprised of dairy & livestock and agribusiness loans. As of December 31, 2016, we had $339.8 million in dairy & livestock and agribusiness loans, including $317.9 in dairy & livestock loans, $21.9 million in agribusiness loans. Approximately 40% of our borrowers are located in the Central Valley of California. Repayment of dairy & livestock and agribusiness loans depends primarily on the successful raising and feeding of livestock or planting and harvest of crops and marketing the harvested commodity (including milk production). Collateral securing these loans may be illiquid. In addition, the limited purpose of some agricultural -related collateral affects credit risk because such collateral may have limited or no other uses to support values when loan repayment problems emerge. Our dairy & livestock and agribusiness lending staff have specific technical expertise that we depend on to mitigate our lending risks for these loans and we may have difficulty retaining or replacing such individuals. Many external factors can impact our agricultural borrowers’ ability to repay their loans, including adverse weather conditions, water issues, commodity price volatility (i.e. milk prices), diseases, land values, production costs, changing government regulations and subsidy programs, changing tax treatment, technological changes, labor market shortages/increased wages, and changes in consumers’ preferences, over which our borrowers may have no control. These factors, as well as recent volatility in certain commodity prices, including milk prices, could adversely impact the ability of those to whom we have made dairy & livestock and agribusiness loans to perform under the terms of their borrowing arrangements with us, which in turn could result in credit losses and adversely affect our business, financial condition and results of operations.
21
Table of Contents
The FASB has recently issued an accounting standard update that will result in a significant change in how we recognize credit losses and may have a material impact on our financial condition or results of operations.
In June 2016, the Financial Accounting Standards Board (“FASB”) issued an accounting standard update, “Financial Instruments-Credit Losses (Topic 326), Measurement of Credit Losses on Financial Instruments,” which replaces the current “incurred loss” model for recognizing credit losses with an “expected loss” model referred to as the Current Expected Credit Loss (“CECL”) model. Under the CECL model, we will be required to present certain financial assets carried at amortized cost, such as loans held for investment and held-to-maturity debt securities, at the net amount expected to be collected. The measurement of expected credit losses is to be based on information about past events, including historical experience, current conditions, and reasonable and supportable forecasts that affect the collectability of the reported amount. This measurement will take place at the time the financial asset is first added to the balance sheet and periodically thereafter. This differs significantly from the “incurred loss” model required under current generally accepted accounting principles (“GAAP”), which delays recognition until it is probable a loss has been incurred. Accordingly, we expect that the adoption of the CECL model will materially affect how we determine our allowance for loan losses and could require us to significantly increase our allowance. Moreover, the CECL model may create more volatility in the level of our allowance for loan losses. If we are required to materially increase our level of allowance for loan losses for any reason, such increase could adversely affect our business, financial condition and results of operations.
The new CECL standard will become effective for us for fiscal years beginning after December 15, 2019 and for interim periods within those fiscal years. We are currently evaluating the impact the CECL model will have on our accounting, but we expect to recognize a one-time cumulative-effect adjustment to our allowance for loan losses as of the beginning of the first reporting period in which the new standard is effective, consistent with regulatory expectations set forth in interagency guidance issued at the end of 2016. We cannot yet determine the magnitude of any such one-time cumulative adjustment or of the overall impact of the new standard on our financial condition or results of operations.
Our loan portfolio is predominantly secured by real estate and thus we have a higher degree of risk from a downturn in our real estate markets
A renewed downturn in our real estate markets could hurt our business because many of our loans are secured by real estate. Real estate values and real estate markets are generally affected by changes in national, regional or local economic conditions, fluctuations in interest rates and the availability of loans to potential purchasers, changes in tax laws and other governmental statutes, regulations and policies, and acts of nature, such as earthquakes, prolonged drought and disasters particular to California. Substantially all of our real estate collateral is located in the state of California. If real estate values, including values of land held for development, should again start to decline, the value of real estate collateral securing our loans could be significantly reduced. Our ability to recover on defaulted loans by foreclosing and selling the real estate collateral would then be diminished and we would be more likely to suffer losses on defaulted loans. Commercial real estate loans typically involve large balances to single borrowers or a group of related borrowers. Since payments on these loans are often dependent on the successful operation or management of the properties, as well as the business and financial condition of the borrower(s), repayment of such loans may be subject to adverse conditions in the real estate market, adverse economic conditions or changes in applicable government regulations.
Additional risks associated with our real estate construction loan portfolio include failure of developers and/or contractors to complete construction on a timely basis or at all, market deterioration during construction, cost overruns and failure to sell or lease the security underlying the construction loans so as to generate the cash flow anticipated by our borrower.
A decline in the economy may cause renewed declines in real estate values and increases in unemployment, which may result in higher than expected loan delinquencies or problem assets, a decline in demand for our products and services, or a lack of growth or decrease in deposits, which may cause us to incur losses, adversely affect our capital or hurt our business.
22
Table of Contents
Our commercial real estate loan portfolio exposes us to risks that may be greater than the risks related to our other loans
Federal and state banking regulators are examining commercial real estate lending activity with heightened scrutiny and may require banks with higher levels of commercial real estate loans to implement more stringent underwriting, internal controls, risk management policies and portfolio stress testing, as well as possibly higher levels of allowances for losses and capital levels as a result of commercial real estate lending growth and exposures. Because a significant portion of our loan portfolio is comprised of commercial real estate loans, the banking regulators may require us to maintain higher levels of capital than we would otherwise be expected to maintain, which could limit our ability to leverage our capital and have a material adverse effect on our business, financial condition, results of operations and prospects.
We are exposed to risk of environmental liabilities with respect to properties to which we take title
In the course of our business, we may foreclose and take title to real estate, and could be subject to environmental liabilities with respect to these properties. While we will take steps to mitigate this risk, we may be held liable to a governmental entity or to third parties for property damage, personal injury, investigation and clean-up costs incurred by these parties in connection with environmental contamination, or we may be required to investigate or clean-up hazardous or toxic substances, or chemical releases at one or more properties. The costs associated with investigation or remediation activities could be substantial. In addition, while there are certain statutory protections afforded lenders who take title to property through foreclosure on a loan, if we are the owner or former owner of a contaminated site, we may be subject to common law claims by third parties based on damages and costs resulting from environmental contamination emanating from the property. If we become subject to significant environmental liabilities, our business, financial condition, results of operations and prospects could be adversely affected.
Liquidity risk could impair our ability to fund operations and jeopardize our financial condition
Liquidity is essential to our business. An inability to raise funds through deposits, borrowings, the sale of loans and other sources could have a material adverse effect on our liquidity. Our access to funding sources in amounts adequate to finance our activities could be impaired by factors that affect us specifically or the financial services industry in general. Factors that could detrimentally impact our access to liquidity sources include a decrease in the level of our business activity due to a market downturn or adverse regulatory action against us. Our ability to acquire deposits or borrow could also be impaired by factors that are not specific to us, such as a severe disruption of the financial markets or negative views and expectations about the prospects for the financial services industry as a whole. Many if not all of these same factors could also significantly raise the cost of deposits to our Company and/or to the banking industry in general. This in turn could negatively affect the amount of interest we pay on our interest-bearing liabilities, which could have an adverse impact on our interest rate spread and profitability.
The actions and commercial soundness of other financial institutions could affect our ability to engage in routine funding transactions
Financial service institutions are interrelated as a result of trading, clearing, counterparty or other relationships. We have exposure to different industries and counterparties, and execute transactions with various counterparties in the financial industry, including brokers and dealers, commercial banks, investment banks, mutual funds, and other institutional clients. Defaults by financial services institutions, even rumors or questions about one or more financial institutions or the financial services industry in general, could lead to market wide liquidity problems and further, could lead to losses or defaults by the Company or other institutions. Many of these transactions expose us to credit risk in the event of default of the applicable counterparty or client. In addition, our credit risk may increase when the collateral held by us cannot be realized upon or is liquidated at prices not sufficient to recover the full amount of the loan or derivative exposure due to us. Any such losses could materially and adversely affect our consolidated financial statements.
23
Table of Contents
Changes in interest rates could reduce the value of our investment securities holdings. The Corporation maintains an investment portfolio consisting of various high quality liquid fixed-income securities. The total book value of the securities portfolio as of December 31, 2016 was $3.2 billion, of which $2.3 billion is available for sale. The nature of fixed-income securities is such that changes in market interest rates impact the value of these assets.
Our business is subject to interest rate risk and variations in interest rates may negatively affect our financial performance
A substantial portion of our income is derived from the differential or “spread” between the interest earned on loans, securities and other interest-earning assets, and the interest paid on deposits, borrowings and other interest-bearing liabilities. Because of the differences in the maturities and repricing characteristics of our interest-earning assets and interest-bearing liabilities, changes in interest rates do not produce equivalent changes in interest income earned on interest-earning assets and interest paid on interest-bearing liabilities. At December 31, 2016 our balance sheet was positioned with a modestly asset sensitive bias over a two-year horizon assuming no balance sheet growth, and as a result, our net interest margin tends to expand in a rising interest rate environment and decrease in a declining interest rate environment. Accordingly, fluctuations in interest rates could adversely affect our interest rate spread and, in turn, our profitability. In addition, loan origination volumes are affected by market interest rates. Rising interest rates, generally, are associated with a lower volume of loan originations while lower interest rates are usually associated with higher loan originations. Conversely, in rising interest rate environments, loan repayment rates may decline and in falling interest rate environments, loan repayment rates may increase. In addition, in a rising interest rate environment, we may need to accelerate the pace of rate increases on our deposit accounts as compared to the pace of future increases in short-term market rates. Accordingly, changes in levels of market interest rates could materially and adversely affect our net interest spread, asset quality, as well as loan origination and prepayment volume.
We may experience goodwill impairment
If our estimates of segment fair value change due to changes in our businesses or other factors, we may determine that impairment charges on goodwill recorded as a result of acquisitions are necessary. Estimates of fair value are determined based on a complex model using cash flows, the fair value of our Company as determined by our stock price, and company comparisons. If management’s estimates of future cash flows are inaccurate, fair value determined could be inaccurate and impairment may not be recognized in a timely manner. If the fair value of the Company declines, we may need to recognize goodwill impairment in the future which would have a material adverse effect on our results of operations and capital levels.
Our Accounting Estimates and Risk Management Processes Rely On Analytical and Forecasting Models
The processes we use to estimate our inherent loan losses and to measure the fair value of financial instruments, as well as the processes used to estimate the effects of changing interest rates and other market measures on our financial condition and results of operations, depends upon the use of analytical and forecasting models. These models reflect assumptions that may not be accurate, particularly in times of market stress or other unforeseen circumstances. Even if these assumptions are adequate, the models may prove to be inadequate or inaccurate because of other flaws in their design or their implementation. If the models we use for interest rate risk and asset-liability management are inadequate, we may incur increased or unexpected losses upon changes in market interest rates or other market measures. If the models we use for determining our probable loan losses are inadequate, the allowance for loan losses may not be sufficient to support future charge-offs. If the models we use to measure the fair value of financial instruments are inadequate, the fair value of such financial instruments may fluctuate unexpectedly or may not accurately reflect what we could realize upon sale or settlement of such financial instruments. Any such failure in our analytical or forecasting models could have a material adverse effect on our business, financial condition and results of operations.
Our decisions regarding the fair value of assets acquired could be different than initially estimated, which could materially and adversely affect our business, financial condition, results of operations, and future prospects
In business combinations, we acquire significant portfolios of loans that are marked to their estimated fair value, there is no assurance that the acquired loans will not suffer deterioration in value. The fluctuations in
24
Table of Contents
national, regional and local economic conditions, including those related to local residential, commercial real estate and construction markets, may increase the level of charge-offs in the loan portfolio that we acquire and correspondingly reduce our net income. These fluctuations are not predictable, cannot be controlled and may have a material adverse impact on our operations and financial condition, even if other favorable events occur.
Operational Risks
Failure to manage our growth may adversely affect our performance
Our financial performance and profitability depend on our ability to manage past and possible future growth. Future acquisitions and our continued growth may present operating, integration, regulatory, management and other issues that could have a material adverse effect on our business, financial condition, results of operations and cash flows.
The occurrence of fraudulent activity, breaches or failures of our information security controls or cybersecurity-related incidents could have a material adverse effect on our business, financial condition and results of operations
As a financial institution, we are susceptible to fraudulent activity, information security breaches and cybersecurity-related incidents that may be committed against us or our clients, which may result in financial losses or increased costs to us or our clients, disclosure or misuse of our information or our client information, misappropriation of assets, privacy breaches against our clients, litigation, or damage to our reputation. Such fraudulent activity may take many forms, including check fraud, electronic fraud, wire fraud, on-line banking, takeover, phishing, social engineering and other dishonest acts. Information security breaches and cybersecurity-related incidents may include fraudulent or unauthorized access to systems used by us or our clients, denial or degradation of service attacks, and malware or other cyber-attacks. There continues to be a rise in electronic fraudulent activity, security breaches and cyber-attacks within the financial services industry, especially in the commercial banking sector due to cyber criminals targeting commercial bank accounts. In recent periods, several large corporations, including financial institutions and retail companies, have suffered major data breaches, in some cases exposing not only confidential and proprietary corporate information, but also sensitive financial and other personal information of their customers and employees and subjecting them to potential fraudulent activity. Some of our clients may have been affected by these breaches, which increase their risks of identity theft, credit card fraud and other fraudulent activity that could involve their accounts with us.
Information pertaining to us and our clients is maintained, and transactions are executed, such as our online banking or core systems on the networks and systems of ours, our clients and certain of our third party providers. The secure maintenance and transmission of confidential information, as well as execution of transactions over these systems, are essential to protect us and our clients against fraud and security breaches and to maintain our clients’ confidence. In addition, increases in criminal activity levels and sophistication, advances in computer capabilities, new discoveries, vulnerabilities in third-party technologies (including browsers and operating systems) or other developments could result in a compromise or breach of the technology, processes and controls that we use to prevent fraudulent transactions and to protect data about us, our clients and underlying transactions, as well as the technology used by our clients to access our systems. Although we have developed, and continue to invest in, systems and processes that are designed to detect and prevent security breaches and cyber-attacks and periodically test our security, our inability to anticipate, or failure to adequately mitigate, breaches of security could result in: losses to us or our clients; our loss of business and/or clients; damage to our reputation; the incurrence of additional expenses; disruption to our business; our inability to grow our online services or other businesses; additional regulatory scrutiny or penalties; or our exposure to civil litigation and possible financial liability — any of which could have a material adverse effect on our business, financial condition and results of operations.
More generally, publicized information concerning security and cyber-related problems could inhibit the use or growth of electronic or web-based applications or solutions as a means of conducting commercial transactions for us and other financial institutions. Such publicity may also cause damage to our reputation as a financial institution. As a result, our business, financial condition and results of operations could be adversely affected.
25
Table of Contents
Our business is exposed to the risk of changes in technology
The rapid pace of technology changes and the impact of such changes on financial services generally and on our Company specifically could impact our cost structure and our competitive position with our customers. Such developments include the rapid movement by customers and some competitor financial institutions to web-based services, mobile banking and cloud computing. Our failure or inability to anticipate, plan for or implement technology change could adversely affect our competitive position, financial condition and profitability.
Our controls and procedures could fail or be circumvented
Management regularly reviews and updates our internal controls, disclosure controls and procedures and corporate governance policies and procedures. Any system of controls, however well designed and operated, is based in part on certain assumptions and on the conduct of individuals, and can provide only reasonable, but not absolute, assurances of the effectiveness of these systems and controls, and that the objectives of these controls have been met. Any failure or circumvention of our controls and procedures, and any failure to comply with regulations related to controls and procedures could adversely affect our business, results of operations and financial condition.
Failure to maintain effective internal control over financial reporting or disclosure controls and procedures could adversely affect our ability to report our financial condition and results of operations accurately and on a timely basis
A failure to maintain effective internal control over financial reporting or disclosure controls and procedures could adversely affect our ability to report our financial results accurately and on a timely basis, which could result in a loss of investor confidence in our financial reporting or adversely affect our access to sources of liquidity. Furthermore, because of the inherent limitations of any system of internal control over financial reporting, including the possibility of human error, the circumvention or overriding of controls and fraud, even effective internal controls may not prevent or detect all misstatements.
We rely on communications, information, operating and financial control systems technology from third-party service providers, and we may suffer an interruption in those systems
We rely heavily on third-party service providers for much of our communications, information, operating and financial control systems technology, including our internet banking services and data processing systems. Any failure or interruption of these services or systems or breaches in the security of these systems could result in failures or interruptions to serve our customers, including deposit, servicing and/or loan origination systems. The occurrence of any failures or interruptions may require us to identify alternative sources of such services, which may result in increased costs or other consequences that in turn could have an adverse effect on our business, including damage to the Bank’s reputation.
We are dependent on key personnel and the loss of one or more of those key personnel may materially and adversely affect our prospects
Competition for qualified employees and personnel in the banking industry is intense and there are a limited number of qualified persons with knowledge of, and experience in, the California community banking industry. The process of recruiting personnel with the combination of skills and attributes required to carry out our strategies is often lengthy. In addition, legislation and regulations which impose restrictions on executive compensation may make it more difficult for us to retain and recruit key personnel. Our success depends to a significant degree upon our ability to attract and retain qualified management, loan origination, finance, administrative, risk management, marketing and technical personnel and upon the continued contributions of our management and personnel. In particular, our success has been and continues to be highly dependent upon the abilities of key executives, including our President and Chief Executive Officer, and certain other employees.
26
Table of Contents
In addition, our success has been and continues to be highly dependent upon the services of our directors, some of whom may be considering retirement, and we may not be able to identify and attract suitable candidates to replace such directors.
Legal, Regulatory, Compliance and Reputational Risks
We are subject to extensive government regulation that could limit or restrict our activities, which, in turn, may hamper our ability to increase our assets and earnings
Our operations are subject to extensive regulation by federal, state and local governmental authorities and we are subject to various laws and judicial and administrative decisions imposing requirements and restrictions on part or all of our operations. Similarly, the lending, credit and deposit products we offer are subject to broad oversight and regulation. Because our business is highly regulated, the laws, rules, regulations and supervisory guidance and policies applicable to us are subject to regular modification and change. Perennially, various laws, rules and regulations are proposed, which, if adopted, could impact our operations by making compliance much more difficult or expensive, restricting our ability to originate or sell loans or further restricting the amount of interest or other charges or fees earned on loans or other products. Current and future legal and regulatory requirements, restrictions and regulations, including those imposed under Dodd-Frank, may adversely impact our profitability and may have a material and adverse effect on our business, financial condition, and results of operations, may require us to invest significant management attention and resources to evaluate and make any changes required by the legislation and accompanying rules, and may make it more difficult for us to attract and retain qualified executive officers and employees. The implementation of certain final Dodd-Frank rules is delayed or phased in over several years; therefore, as yet we cannot definitively assess what may be the short or longer term specific or aggregate effect of the full implementation of Dodd-Frank on us.
We face a risk of noncompliance and enforcement action with the Bank Secrecy Act and other anti-money laundering statutes and regulations
The Bank Secrecy Act, the USA PATRIOT Act of 2001, and other laws and regulations require financial institutions, among other duties, to institute and maintain an effective anti-money laundering program and file suspicious activity and currency transaction reports as appropriate. The federal Financial Crimes Enforcement Network is authorized to impose significant civil money penalties for violations of those requirements and has recently engaged in coordinated enforcement efforts with the individual federal banking regulators, as well as the U.S. Department of Justice, Drug Enforcement Administration, and Internal Revenue Service. We are also subject to scrutiny of compliance with the rules enforced by the Office of Foreign Assets Control and compliance with the Foreign Corrupt Practices Act. If our policies, procedures and systems are deemed deficient, we would be subject to liability, including fines and regulatory actions, which may include restrictions on our ability to pay dividends and the necessity to obtain regulatory approvals to proceed with certain aspects of our business plan. Failure to maintain and implement adequate programs to combat money laundering and terrorist financing could also have serious reputational consequences for us. Any of these results could materially and adversely affect our business, financial condition and results of operations.
New mortgage regulations may adversely impact our business
Revisions made pursuant to Dodd-Frank to Regulation Z, which implements the Truth in Lending Act (TILA), effective in January 2014, apply to all consumer mortgages (except home equity lines of credit, timeshare plans, reverse mortgages, or temporary loans), and mandate specific underwriting criteria and “ability to repay” requirements for home loans. This may impact our offering and underwriting of single family residential loans in our residential mortgage lending operation and could have a resulting unknown effect on potential delinquencies. In addition, the relatively uniform requirements may make it difficult for regional and community banks to compete against the larger national banks for single family residential loan originations.
27
Table of Contents
The impact of new capital rules will impose enhanced capital adequacy requirements on us and may materially affect our operations
We will be subject to more stringent capital requirements. Pursuant to Dodd-Frank and to implement for U.S. banking institutions the principles of the international “Basel III” standards, the federal banking agencies have adopted a new set of rules on minimum leverage and risk-based capital that will apply to both insured banks and their holding companies. These regulations were issued in July 2013, and will be phased in, for the Bank and the Company, over a period of five years, beginning in 2016. The new capital rules, among other things:
| • | impose more restrictive eligibility requirements for Tier 1 and Tier 2 capital; |
| • | introduce a new category of capital, called Common Equity Tier 1 capital, which must be at least 4.5% of risk-based assets, net of regulatory deductions, and a capital conservation buffer of an additional 2.5% of common equity to risk-weighted assets, raising the target minimum common equity ratio to 7%; |
| • | increase the minimum Tier 1 capital ratio to 8.5% inclusive of the capital conservation buffer; |
| • | increase the minimum total capital ratio to 10.5% inclusive of the capital conservation buffer; and |
| • | introduce a non-risk adjusted Tier 1 leverage ratio of 3%, based on a measure of total exposure rather than total assets, and new liquidity standards. |
The full implementation of the new capital rule may adversely affect our ability to pay dividends, or require us to reduce business levels or raise capital, including in ways that may adversely affect our business, liquidity, financial condition and results of operations.
The new Basel III-based capital standards could limit our ability to pay dividends or make stock repurchases and our ability to compensate our executives with discretionary bonuses. Under the new capital standards, if our Common Equity Tier 1 Capital does not include a newly required “capital conservation buffer,” we will be prohibited from making distributions to our stockholders. The capital conservation buffer requirement, which is measured in addition to the minimum Common Equity Tier 1 capital of 4.5%, will be phased in over four years, starting at 0.625% for 2016, and rising to 2.5% for 2019 and subsequent years. Additionally, under the new capital standards, if our Common Equity Tier 1 Capital does not include the newly required “capital conservation buffer,” we will also be prohibited from paying discretionary bonuses to our executive employees. This may affect our ability to attract or retain employees, or alter the nature of the compensation arrangements that we may enter into with them.
Managing reputational risk is important to attracting and maintaining customers, investors and employees
Threats to our reputation can come from many sources, including adverse sentiment about financial institutions generally, unethical practices, employee misconduct or fraud, failure to deliver minimum standards of service or quality, compliance deficiencies, government investigations, litigation, and questionable or fraudulent activities of our customers. We have policies and procedures in place to protect our reputation and promote ethical conduct, but these policies and procedures may not be fully effective. Negative publicity regarding our business, employees, or customers, with or without merit, may result in the loss of customers, investors and employees, costly litigation, a decline in revenues and increased governmental scrutiny and regulation.
We are subject to legal and litigation risk which could adversely affect us
Because our Company is extensively regulated by a variety of federal and state agencies, and because we are subject to a wide range of business, consumer and employment laws and regulations at the federal, state and local levels, we are at risk of governmental investigations and lawsuits as well as claims and litigation from private parties. We are from time to time involved in disputes with and claims from investors, customers, government agencies, vendors, employees and other business parties, and such disputes and claims may result in
28
Table of Contents
litigation or settlements, any one of which or in the aggregate could have an adverse impact on the Company’s operating flexibility, employee relations, financial condition or results of operations, as a result of the costs of any judgment, the terms of any settlement and/or the expenses incurred in defending the applicable claim.
We are unable, at this time, to estimate our potential liability in these matters, but we may be required to pay judgments, settlements or other penalties and incur other costs and expenses in connection with any one or more of these lawsuits, which in turn could have a material adverse effect on our business, results of operations and financial condition. In addition, responding to requests for information in connection with discovery demanded by the plaintiffs in any of these lawsuits may be costly and divert internal resources away from managing our business. See Item 3 - Legal Proceedings below.
We may be subject to customer claims and legal actions pertaining to the performance of our fiduciary responsibilities. Whether or not such customer claims and legal actions are founded or unfounded, if such claims and legal actions are not resolved in a manner favorable to us, they may result in significant financial liability and/or adversely affect the market perception of us and our products and services, as well as impact customer demand for those products and services. Any financial liability or reputation damage could have a material adverse effect on our business, which, in turn, could have a material adverse effect on our financial condition and results of operations.
Federal and state laws and regulations may restrict our ability to pay dividends
The ability of the Bank to pay dividends to the Company and of the Company to pay dividends to its shareholders is limited by applicable federal and California law and regulations. See “Business — Regulation and Supervision” and “Management’s Discussion and Analysis of Financial Condition and Results of Operations — Liquidity and Cash Flow.”
Risks Associated with our Common Stock
The price of our common stock may be volatile or may decline
The trading price of our common stock may fluctuate widely as a result of a number of factors, many of which are outside our control. In addition, the stock market is subject to fluctuations in its share prices and trading volumes that affect the market prices of the shares of many companies. These specific and broad market fluctuations could adversely affect the market price of our common stock. Among the factors that could affect our stock price are:
| • | actual or anticipated fluctuations in our operating results and financial condition; |
| • | changes in revenue or earnings estimates or publication of research reports and recommendations by financial analysts; |
| • | credit events or losses; |
| • | failure to meet analysts’ revenue or earnings estimates; |
| • | speculation in the press or investment community; |
| • | strategic actions by us or our competitors, such as acquisitions or restructurings; |
| • | actions or trades by institutional shareholders or other large shareholders; |
| • | our capital position; |
| • | fluctuations in the stock price and operating results of our competitors; |
| • | actions by hedge funds, short term investors, activist shareholders or shareholder representative organizations; |
| • | general market conditions and, in particular, developments related to market conditions for the financial services industry; |
| • | proposed or adopted regulatory changes or developments; |
| • | anticipated or pending investigations, proceedings or litigation that involve or affect the Company and/or the Bank; or |
| • | domestic and international economic factors, whether related or unrelated to the Company’s performance. |
29
Table of Contents
The stock market and, in particular, the market for financial institution stocks, has experienced significant volatility in recent years. The market price of our common stock and the trading volume in our common stock may fluctuate and cause significant price variations to occur. The trading price of the shares of our common stock and the value of our other securities will depend on many factors, which may change from time to time, including, without limitation, our financial condition, performance, creditworthiness and prospects, future sales of our equity or equity related securities, and other factors identified above in “Cautionary Note Regarding Forward-Looking Statement”. The capital and credit markets have been experiencing volatility and disruption for more than five years. In some cases, the markets have produced downward pressure on stock prices and credit availability for certain issuers without regard to those issuers’ underlying financial strength. A significant decline in our stock price could result in substantial losses for individual shareholders and could lead to costly and disruptive securities litigation. Extensive sales by large shareholders could also exert sustained downward pressure on our stock price.
An investment in our common stock is not an insured deposit
Our common stock is not a bank deposit and, therefore, is not insured against loss by the FDIC, any other deposit insurance fund or by any other public or private entity. Investment in our common stock is inherently risky for the reasons described in this “Risk Factors” section and elsewhere in this report and is subject to the same market forces that affect the price of common stock in any company. As a result, if you acquire our common stock, you could lose some or all of your investment.
Anti-takeover provisions and federal law may limit the ability of another party to acquire us, which could cause our stock price to decline
Various provisions of our articles of incorporation and by-laws and certain other actions we have taken could delay or prevent a third-party from acquiring us, even if doing so might be beneficial to our shareholders. The Bank Holding Company Act of 1956, as amended, and the Change in Bank Control Act of 1978, as amended, together with federal regulations, require that, depending on the particular circumstances, regulatory approval and/or appropriate regulatory filings may be required from either or all the Federal Reserve, the FDIC, the DBO prior to any person or entity acquiring “control” (as defined in the applicable regulations) of a state non-member bank, such as the Bank. These provisions may prevent a merger or acquisition that would be attractive to shareholders and could limit the price investors would be willing to pay in the future for our common stock.
Changes in stock market prices could reduce fee income from our brokerage, asset management and investment advisory businesses
We earn substantial wealth management fee income for managing assets for our clients and also providing brokerage and investment advisory services. Because investment management and advisory fees are often based on the value of assets under management, a fall in the market prices of those assets could reduce our fee income. Changes in stock market prices could affect the trading activity of investors, reducing commissions and other fees we earn from our brokerage business.
CVB is a holding company and depends on the Bank for dividends, distributions and other payments
CVB is a legal entity separate and distinct from the Bank. Our principal source of cash flow, including cash flow to pay dividends to our shareholders is dividends from the Bank. CVB’s ability to pay dividends to our stockholders is substantially dependent upon the Bank’s ability to pay dividends to CVB. Federal and state law imposes limits on the ability of the Bank to pay dividends and make other distributions and payments. If the Bank is unable to meet regulatory requirements to pay dividends or make other distributions to CVB, CVB will be unable to pay dividends to its shareholders.
We may face other risks
From time to time, we detail other risks with respect to our business and/or financial results in our filings with the SEC. For further discussion on additional areas of risk, see “Item 7. Management’s Discussion and Analysis of Financial Condition and Results of Operations.”
30
Table of Contents
| ITEM 1B. | UNRESOLVED STAFF COMMENTS |
None
| ITEM 2. | PROPERTIES |
The principal executive offices of the Company and the Bank are located in Ontario, California, and are owned by the Company.
As of December 31, 2016, the Bank occupied a total of 53 premises consisting of (i) 50 Business Financial and Commercial Banking Centers (“Centers”) of which one Center is located at our Corporate Headquarters, (ii) a Corporate Headquarters and two operations/administrative centers, and (iii) a storage facility. We own 15 of these locations and the remaining properties are leased under various agreements with expiration dates ranging from 2017 through 2026, some with lease renewal options that could extend certain leases through 2036. All properties are located in Southern and Central California.
For additional information concerning properties, see Note 10 — Premises and Equipment of the Notes to the consolidated financial statements included in this report. See “Item 8 — Financial Statements and Supplemental Data.”
| ITEM 3. | LEGAL PROCEEDINGS |
Certain lawsuits and claims arising in the ordinary course of business have been filed or are pending against us or our affiliates, including but not limited to actions involving federal and state securities law claims, employment, wage-hour and labor law claims, lender liability claims, negligence, and consumer and privacy claims, some of which may be styled as “class action” or representative cases.
The Company is involved in the following legal actions and complaints which we currently believe could be material to us.
A purported shareholder class action complaint was filed against the Company on August 23, 2010, in an action captioned Lloyd v. CVB Financial Corp., et al., Case No. CV 10-06256- MMM, in the United States District Court for the Central District of California. Along with the Company, Christopher D. Myers (our President and Chief Executive Officer) and Edward J. Biebrich, Jr. (our former Chief Financial Officer) were also named as defendants. On September 14, 2010, a second purported shareholder class action complaint was filed against the Company, in an action originally captioned Englund v. CVB Financial Corp., et al., Case No. CV 10-06815-RGK, in the United States District Court for the Central District of California. The Englund complaint named the same defendants as the Lloyd complaint and made allegations substantially similar to those included in the Lloyd complaint. On January 21, 2011, the District Court consolidated the two actions for all purposes under the Lloyd action, now captioned as Case No. CV 10-06256-MMM (PJWx). At the same time, the District Court also appointed the Jacksonville Police and Fire Pension Fund (the “Jacksonville Fund”) as lead plaintiff in the consolidated action and approved the Jacksonville Fund’s selection of lead counsel for the plaintiffs in the consolidated action. On March 7, 2011, the Jacksonville Fund filed a consolidated complaint naming the same defendants and alleging violations by all defendants of Section 10(b) of the Securities Exchange Act of 1934 and Rule 10b-5 promulgated thereunder and violations by the individual defendants of Section 20(a) of the Exchange Act. The consolidated complaint alleges that defendants, among other things, misrepresented and failed to disclose conditions adversely affecting the Company throughout the purported class period, which was originally alleged to be between October 21, 2009 and August 9, 2010 (but which has subsequently been shortened to the period between March 4, 2010 and August 9, 2010). Specifically, defendants are alleged to have violated applicable accounting rules and to have made misrepresentations in connection with the Company’s allowance for loan loss methodology, loan underwriting guidelines, methodology for grading loans, and the process for making provisions for loan losses. The consolidated complaint sought compensatory damages and other relief in favor of the purported class.
31
Table of Contents
On October 26, 2016, the Parties entered into a Stipulation and Settlement (“Securities Settlement”) to resolve the litigation for a payment of $6.2 million. The Securities Settlement is being funded solely with insurance proceeds, and involves no admission of liability whatsoever. On December 5, 2016, the Court entered an order preliminarily approving the Securities Settlement. The Securities Settlement is subject to final court approval, which is currently scheduled for hearing March 13, 2017.
A former employee and branch-based service manager filed a complaint against the Company, on December 29, 2014, in an action entitled Glenda Morgan v. Citizens Business Bank, et al., Case No. BC568004, in the Superior Court for Los Angeles County, individually and on behalf of the Company’s branch-based employees and managers who are classified as “exempt” under California and federal employment laws. The case is styled as a putative class action lawsuit and alleges, among other things, that (i) the Company misclassified certain employees and managers as “exempt” employees, (ii) the Company violated California’s wage and hour, overtime, meal break and rest break rules and regulations, (iii) certain employees did not receive proper expense reimbursements, (iv) the Company did not maintain accurate and complete payroll records, and (v) the Company engaged in unfair business practices. On February 11, 2015, the same law firm representing Morgan filed a second complaint, entitled Jessica Osuna v. Citizens Business Bank, et al., Case No. CIVDS1501781, in the Superior Court for San Bernardino County, alleging wage and hour claims on behalf of the Company’s “non-exempt” hourly employees. On April 6, 2015, these two cases were consolidated in a first amended complaint in Los Angeles County Superior Court. The first amended complaint sought class certification, the appointment of the plaintiffs as class representatives, and an unspecified amount of damages and penalties. Subsequently, related cases were filed by the same law firm in the Superior Court for San Bernardino County, alleging (1) violations of the Labor Code and seeking penalties under the California Private Attorney General Act of 2004 and (2) seeking a declaratory judgment that certain releases signed by CBB employees were invalid.
On November 28, 2016, the parties reached an agreement in principal to settle all of the related wage and hour class action lawsuits (“Wage-Hour Settlement”). Plaintiffs will dismiss all their lawsuits with prejudice in exchange for the payment of $1,500,000 to the putative class members, after attorneys’ fees and costs. The Wage-Hour Settlement is subject to court approval. The parties are preparing the Wage-Hour Settlement documents and will seek preliminary approval from the court during the first quarter of 2017. We anticipate that the Wage-Hour Settlement will be concluded sometime in the second quarter of 2017.
Where appropriate, we establish accruals in accordance with FASB guidance over loss contingencies (ASC 450). As of December 31, 2016, the Company had established a litigation accrual of $1.5 million for the Wage-Hour Settlement. Our accruals for loss contingencies are reviewed quarterly and adjusted as additional information becomes available. We disclose the amount accrued if we believe it is material or if we believe such disclosure is necessary for our financial statements to not be misleading. If a loss is not both probable and reasonably estimable, or if an exposure to loss exists in excess of the amount previously accrued, we assess whether there is at least a reasonable possibility that a loss, or additional loss, may have been incurred, and we adjust our accruals and disclosures accordingly. We do not presently believe that the ultimate resolution of the foregoing matters will have a material adverse effect on the Company’s results of operations, financial condition, or cash flows. The outcome of litigation and other legal and regulatory matters is inherently uncertain, however, and it is possible that one or more of the legal matters currently pending or threatened could have a material adverse effect on our liquidity, consolidated financial position, and/or results of operations.
| ITEM 4. | MINE SAFETY DISCLOSURES |
Not applicable.
32
Table of Contents
PART II
| ITEM 5. | MARKET FOR THE REGISTRANT’S COMMON EQUITY, RELATED STOCKHOLDER MATTERS AND ISSUER PURCHASES OF EQUITY SECURITIES |
Our common stock is traded on the NASDAQ Global Select National Market under the symbol “CVBF.” The following table presents the high and low sales prices and dividend information for our common stock during each quarter for the past two years. The Company had approximately 108,415,281 shares of common stock outstanding with 1,493 registered shareholders of record as of February 16, 2017. Refer to the section entitled “Information about the Annual Meeting and Voting” of our definitive Proxy Statement to be filed pursuant to Regulation 14A within 120 days after the end of the last fiscal year.
| Quarter Ended |
High |
Low |
Cash Dividends Declared | |||
| 12/31/2016 |
$23.23 | $16.32 | $0.12 | |||
| 9/30/2016 |
$17.88 | $15.39 | $0.12 | |||
| 6/30/2016 |
$17.92 | $15.25 | $0.12 | |||
| 3/31/2016 |
$17.70 | $14.02 | $0.12 | |||
| 12/31/2015 |
$18.77 | $15.82 | $0.12 | |||
| 9/30/2015 |
$18.37 | $15.30 | $0.12 | |||
| 6/30/2015 |
$18.11 | $15.45 | $0.12 | |||
| 3/31/2015 |
$16.21 | $14.53 | $0.12 |
For information on the statutory and regulatory limitations on the ability of the Company to pay dividends to its shareholders and on the Bank to pay dividends to the Company, see “Item 1. Business-Regulation and Supervision — Dividends” and “Item 7. Management’s Discussion and Analysis of Financial Condition and Results of Operations — Liquidity and Cash Flow.”
Issuer Purchases of Equity Securities
On July 16, 2008, our Board of Directors approved a program to repurchase up to 10,000,000 shares of our common stock (such number will not be adjusted for stock splits, stock dividends, and the like) in the open market or in privately negotiated transactions, at times and at prices considered appropriate by us, depending upon prevailing market conditions and other corporate and legal considerations. As a result of various repurchases made under the 2008 repurchase program, on August 11, 2016, our Board of Directors authorized an increase in the Company’s common stock repurchase program back to 10,000,000 shares, or approximately 9.3% of the Company’s currently outstanding shares at the time of authorization, and adopted a 10b5-1 plan. There is no expiration date for this repurchase program. During the fourth quarter of the year ended December 31, 2016, the Company repurchased 81,800 shares of our common stock outstanding. The Company terminated its 10b5-1 plan in January 2017 in order to comply with Regulation M. As of December 31, 2016, we have 9,918,200 shares of our common stock remaining that are eligible for repurchase under the common stock repurchase program.
| Period | Total Number of Shares Purchased as Part of Publicly Announced Plans or Programs |
Average Price Paid Per Share |
Maximum Number of Shares Available for Repurchase Under the Plans or Programs |
|||||||||
| October 1 - 31, 2016 |
- | $ | - | 10,000,000 | ||||||||
| November 1 - 30, 2016 |
81,800 | $ | 16.51 | 9,918,200 | ||||||||
| December 1 - 31, 2016 |
- | $ | - | 9,918,200 | ||||||||
|
|
|
|||||||||||
| Total |
81,800 | $ | 16.51 | 9,918,200 | ||||||||
|
|
|
|||||||||||
33
Table of Contents
Performance Graph
The following Performance Graph and related information shall not be deemed “soliciting material” or be “filed” with the Securities and Exchange Commission, nor shall such information be incorporated by reference into any future filing under the Securities Act of 1933 or Securities Exchange Act of 1934, each as amended, except to the extent that the Company specifically incorporates it by reference into such filing.
The following graph compares the yearly percentage change in CVB Financial Corp.’s cumulative total shareholder return (stock price appreciation plus reinvested dividends) on common stock (i) the cumulative total return of the Nasdaq Composite Index; and (ii) a published index comprised by Morningstar (formerly Hemscott, Inc.) of banks and bank holding companies in the Pacific region (the peer group line depicted below). The graph assumes an initial investment of $100 on December 31, 2011, and reinvestment of dividends through December 31, 2016. Points on the graph represent the performance as of the last business day of each of the years indicated. The graph is not necessarily indicative of future price performance.
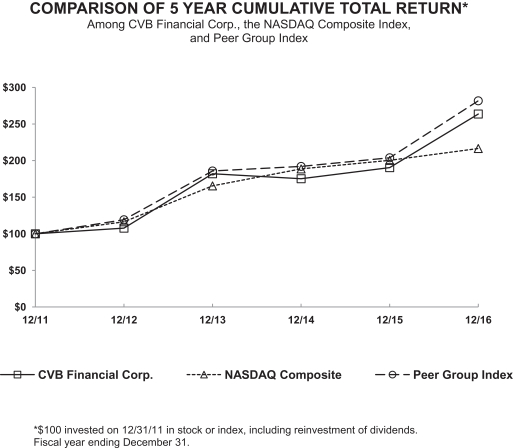
ASSUMES $100 INVESTED ON DECEMBER 31, 2011
ASSUMES DIVIDEND REINVESTED
FISCAL YEAR ENDING DECEMBER 31, 2016
| Company/Market/Peer Group |
12/31/2011 |
12/31/2012 |
12/31/2013 |
12/31/2014 |
12/31/2015 |
12/31/2016 |
||||||||||||||||||
| CVB Financial Corp. |
100.00 | 107.73 | 182.06 | 175.26 | 190.42 | 263.67 | ||||||||||||||||||
| NASDAQ Composite |
100.00 | 116.41 | 165.47 | 188.69 | 200.32 | 216.54 | ||||||||||||||||||
| Peer Group Index |
100.00 | 119.23 | 185.87 | 192.09 | 203.92 | 281.75 | ||||||||||||||||||
Source: Research Data Group, Inc., www.researchdatagroup.com
34
Table of Contents
| ITEM 6. | SELECTED FINANCIAL DATA |
The following table reflects selected financial information at and for the five years ended December 31. Throughout the past five years, the Company has acquired other banks. This may affect the comparability of the data.
| At or For the Year Ended December 31, | ||||||||||||||||||||
| 2016 | 2015 | 2014 | 2013 | 2012 | ||||||||||||||||
| (Dollars in thousands, except per share amounts) | ||||||||||||||||||||
| Interest income |
$ | 265,050 | $ | 261,513 | $ | 252,903 | $ | 232,773 | $ | 262,222 | ||||||||||
| Interest expense |
7,976 | 8,571 | 16,389 | 16,507 | 25,272 | |||||||||||||||
|
|
|
|
|
|
|
|
|
|
|
|||||||||||
| Net interest income |
257,074 | 252,942 | 236,514 | 216,266 | 236,950 | |||||||||||||||
|
|
|
|
|
|
|
|
|
|
|
|||||||||||
| Recapture of provision for loan losses |
(6,400 | ) | (5,600 | ) | (16,100 | ) | (16,750 | ) | - | |||||||||||
| Noninterest income |
35,552 | 33,483 | 36,412 | 25,287 | 15,903 | |||||||||||||||
| Noninterest expense |
136,740 | 140,659 | 126,229 | 114,028 | 138,160 | |||||||||||||||
|
|
|
|
|
|
|
|
|
|
|
|||||||||||
| Earnings before income taxes |
162,286 | 151,366 | 162,797 | 144,275 | 114,693 | |||||||||||||||
| Income taxes |
60,857 | 52,221 | 58,776 | 48,667 | 37,413 | |||||||||||||||
|
|
|
|
|
|
|
|
|
|
|
|||||||||||
| NET EARNINGS |
$ | 101,429 | $ | 99,145 | $ | 104,021 | $ | 95,608 | $ | 77,280 | ||||||||||
|
|
|
|
|
|
|
|
|
|
|
|||||||||||
| Basic earnings per common share |
$ | 0.94 | $ | 0.93 | $ | 0.98 | $ | 0.91 | $ | 0.74 | ||||||||||
|
|
|
|
|
|
|
|
|
|
|
|||||||||||
| Diluted earnings per common share |
$ | 0.94 | $ | 0.93 | $ | 0.98 | $ | 0.91 | $ | 0.74 | ||||||||||
|
|
|
|
|
|
|
|
|
|
|
|||||||||||
| Cash dividends declared per common share |
$ | 0.480 | $ | 0.480 | $ | 0.400 | $ | 0.385 | $ | 0.340 | ||||||||||
|
|
|
|
|
|
|
|
|
|
|
|||||||||||
| Cash dividends declared on common shares |
$ | 51,849 | $ | 51,040 | $ | 42,356 | $ | 40,469 | $ | 35,642 | ||||||||||
| Dividend pay-out ratio (1) |
51.12 | % | 51.48 | % | 40.72 | % | 42.33 | % | 46.12 | % | ||||||||||
| Weighted average common shares: |
||||||||||||||||||||
| Basic |
107,282,332 | 105,715,247 | 105,239,421 | 104,729,184 | 104,418,905 | |||||||||||||||
| Diluted |
107,686,955 | 106,192,472 | 105,759,523 | 105,126,303 | 104,657,610 | |||||||||||||||
| Common Stock Data: |
||||||||||||||||||||
| Common shares outstanding at year end |
108,251,981 | 106,384,982 | 105,893,216 | 105,370,170 | 104,889,586 | |||||||||||||||
| Book value per share |
$ | 9.15 | $ | 8.68 | $ | 8.29 | $ | 7.33 | $ | 7.28 | ||||||||||
| Financial Position: |
||||||||||||||||||||
| Assets |
$ | 8,073,707 | $ | 7,671,200 | $ | 7,377,920 | $ | 6,664,967 | $ | 6,363,364 | ||||||||||
| Investment securities available-for-sale |
2,270,466 | 2,368,646 | 3,137,158 | 2,663,642 | 2,449,387 | |||||||||||||||
| Investment securities held-to-maturity |
911,676 | 850,989 | 1,528 | 1,777 | 2,050 | |||||||||||||||
| Net loans, excluding PCI loans (2) |
4,263,158 | 3,867,941 | 3,630,875 | 3,310,681 | 3,159,872 | |||||||||||||||
| Net PCI loans (3) |
70,366 | 89,840 | 126,367 | 160,315 | 195,215 | |||||||||||||||
| Deposits |
6,309,680 | 5,917,260 | 5,604,658 | 4,890,631 | 4,773,987 | |||||||||||||||
| Borrowings |
656,028 | 736,704 | 809,106 | 911,457 | 698,178 | |||||||||||||||
| Junior subordinated debentures |
25,774 | 25,774 | 25,774 | 25,774 | 67,012 | |||||||||||||||
| Stockholders’ equity |
990,862 | 923,399 | 878,109 | 771,887 | 762,970 | |||||||||||||||
| Equity-to-assets ratio (4) |
12.27 | % | 12.04 | % | 11.90 | % | 11.58 | % | 11.99 | % | ||||||||||
| Financial Performance: |
||||||||||||||||||||
| Return on beginning equity |
10.98 | % | 11.29 | % | 13.48 | % | 12.53 | % | 10.81 | % | ||||||||||
| Return on average equity (ROE) |
10.26 | % | 10.87 | % | 12.50 | % | 12.34 | % | 10.31 | % | ||||||||||
| Return on average assets (ROA) |
1.26 | % | 1.31 | % | 1.45 | % | 1.48 | % | 1.19 | % | ||||||||||
| Net interest margin, tax-equivalent (TE) (5) |
3.46 | % | 3.62 | % | 3.62 | % | 3.71 | % | 4.06 | % | ||||||||||
| Efficiency ratio (6) |
46.73 | % | 49.11 | % | 46.25 | % | 47.21 | % | 54.64 | % | ||||||||||
| Noninterest expense to average assets |
1.70 | % | 1.86 | % | 1.77 | % | 1.77 | % | 2.13 | % | ||||||||||
| Credit Quality: |
||||||||||||||||||||
| Allowance for loan losses |
$ | 61,540 | $ | 59,156 | $ | 59,825 | $ | 75,235 | $ | 92,441 | ||||||||||
| Allowance/gross loans |
1.40 | % | 1.47 | % | 1.57 | % | 2.12 | % | 2.68 | % | ||||||||||
| Total nonaccrual loans |
$ | 7,152 | $ | 21,019 | $ | 32,186 | $ | 39,954 | $ | 57,997 | ||||||||||
| Nonaccrual loans/gross loans, net of deferred loan fees |
0.16 | % | 0.52 | % | 0.84 | % | 1.13 | % | 1.68 | % | ||||||||||
| Allowance/nonaccrual loans |
860.46 | % | 281.44 | % | 185.87 | % | 188.30 | % | 159.39 | % | ||||||||||
| Net (recoveries), charge offs |
$ | (8,784 | ) | $ | (4,931 | ) | $ | (690 | ) | $ | 456 | $ | 1,523 | |||||||
| Net (recoveries), charge offs/average loans |
-0.21 | % | -0.13 | % | -0.02 | % | 0.01 | % | 0.05 | % | ||||||||||
| Regulatory Capital Ratios: |
||||||||||||||||||||
| Company: |
||||||||||||||||||||
| Tier 1 leverage ratio |
11.49 | % | 11.22 | % | 10.86 | % | 11.30 | % | 11.50 | % | ||||||||||
| Common equity Tier 1 risk-based capital ratio |
16.48 | % | 16.49 | % | N/A | N/A | N/A | |||||||||||||
| Tier 1 risk-based capital ratio |
16.94 | % | 16.98 | % | 16.99 | % | 17.83 | % | 18.23 | % | ||||||||||
| Total risk-based capital ratio |
18.19 | % | 18.23 | % | 18.24 | % | 19.09 | % | 19.49 | % | ||||||||||
| Bank: |
||||||||||||||||||||
| Tier 1 leverage ratio |
11.36 | % | 11.11 | % | 10.77 | % | 11.20 | % | 11.21 | % | ||||||||||
| Common equity Tier 1 risk-based capital ratio |
16.76 | % | 16.81 | % | N/A | N/A | N/A | |||||||||||||
| Tier 1 risk-based capital ratio |
16.76 | % | 16.81 | % | 16.85 | % | 17.67 | % | 17.77 | % | ||||||||||
| Total risk-based capital ratio |
18.01 | % | 18.06 | % | 18.11 | % | 18.93 | % | 19.03 | % | ||||||||||
| (1) | Dividends declared on common stock divided by net earnings. |
| (2) | Net loans, excluding Purchase Credit Impaired (“PCI”) loans. |
| (3) | Excludes loans held-for-sale. PCI loans are those loans acquired from SJB and previously covered by a loss sharing agreement with the FDIC. |
| (4) | Stockholders’ equity divided by total assets. |
| (5) | Net interest income (TE) divided by average interest-earning assets. |
| (6) | Noninterest expense divided by net interest income before provision for loan losses plus noninterest income. Also refer to “Noninterest Expense and Efficiency Ratio Reconciliation (non-GAAP)” under Analysis of the Results of Operations of Item 7 of this Form 10-K. |
35
Table of Contents
| ITEM 7. | MANAGEMENT’S DISCUSSION AND ANALYSIS OF FINANCIAL CONDITION AND RESULTS OF OPERATIONS |
The following discussion provides information about the results of operations, financial condition, liquidity, and capital resources of CVB Financial Corp. and its wholly owned subsidiary. This information is intended to facilitate the understanding and assessment of significant changes and trends related to our financial condition and the results of our operations. This discussion and analysis should be read in conjunction with this Annual Report on Form 10-K, and the audited consolidated financial statements and accompanying notes presented elsewhere in this report.
The preparation of these consolidated financial statements requires management to make estimates and judgments that affect the reported amounts of assets and liabilities, revenues and expenses, and related disclosures of contingent assets and liabilities at the date of our financial statements. Actual results may differ from these estimates under different assumptions or conditions.
Critical accounting policies are defined as those that are reflective of significant judgments and uncertainties, and are essential to understanding Management’s Discussion and Analysis of Financial Condition and Results of Operations. The following is a summary of the more judgmental and complex accounting estimates and principles. In each area, we have identified the variables most important in the estimation process. We have used the best information available to make the necessary estimates to value the related assets and liabilities. Actual performance that differs from our estimates and future changes in the key variables could change future valuations and impact the results of operations.
Allowance for Loan Losses (“ALLL”) — Arriving at an appropriate level of allowance for loan losses involves a high degree of judgment. Our allowance for loan losses provides for probable losses based upon evaluations of known and inherent risks in the loan and lease portfolio. The determination of the balance in the allowance for loan losses is based on an analysis of the loan and lease finance receivables portfolio using a systematic methodology and reflects an amount that, in our judgment, is appropriate to provide for probable credit losses inherent in the portfolio, after giving consideration to the character of the loan portfolio, current economic conditions, past credit loss experience, and such other factors as deserve current recognition in estimating inherent credit losses. The provision for loan losses is charged to expense. For a full discussion of our methodology of assessing the adequacy of the allowance for loan losses, see “Item 7, Management’s Discussion and Analysis of Financial Condition and Results of Operation — Risk Management” and Note 3 — Summary of Significant Accounting Policies and Note 7 — Loans and Lease Finance Receivables and Allowance for Loan Losses of our consolidated financial statements presented elsewhere in this report.
Investment Securities — The Company classifies as held-to-maturity (“HTM”) those debt securities that the Company has the positive intent and ability to hold to maturity. Securities classified as trading are those securities that are bought and held principally for the purpose of selling them in the near term. All other debt and equity securities are classified as available-for-sale (“AFS”). Securities held-to-maturity are accounted for at cost and adjusted for amortization of premiums and accretion of discounts. Trading securities are accounted for at fair value with the unrealized gains and losses being included in current earnings. Available-for-sale securities are accounted for at fair value, with the net unrealized gains and losses, net of income tax effects, presented as a separate component of stockholders’ equity. Realized gains and losses on sales of securities are recognized in earnings at the time of sale and are determined on a specific-identification basis. Purchase premiums and discounts are recognized in interest income using the effective-yield method over the estimated terms of the securities. For mortgage-backed securities (“MBS”) and collateralized mortgage obligations (“CMO”), the amortization or accretion is based on estimated average lives of the securities. The lives of these securities can fluctuate based on the amount of prepayments received on the underlying collateral of the securities. The Company’s investment in the Federal Home Loan Bank of San Francisco (“FHLB”) stock is carried at cost.
36
Table of Contents
At each reporting date, securities are assessed to determine whether there is an other-than-temporary impairment (“OTTI”). Other-than-temporary impairment on investment securities is not recognized in earnings when there are credit losses on a debt security for which management does not intend to sell and for which it is more-likely-than-not that the Company will not have to sell prior to recovery of the noncredit impairment. Otherwise, the portion of the total impairment that is attributable to the credit loss would be recorded in earnings, and the remaining difference between the debt security’s amortized cost and its fair value would be included in other comprehensive income.
Goodwill and Goodwill Impairment — Goodwill resulting from business combinations prior to January 1, 2009, represents the excess of the purchase price over the fair value of the net assets of the businesses acquired. Goodwill resulting from business combinations after January 1, 2009, is generally determined as the excess of the fair value of the consideration transferred, plus the fair value of any noncontrolling interest in the acquiree, over the fair value of the net assets acquired and liabilities assumed as of the acquisition date. Goodwill and intangible assets acquired in a purchase business combination and determined to have an indefinite useful life are not amortized, but tested for impairment at least annually, or more frequently if events and circumstances exists that indicate that a goodwill impairment test should be performed.
Intangible assets with definite useful lives are amortized over their estimated useful lives to their estimated residual values. Goodwill is the only intangible asset with an indefinite life on our balance sheets. Based on the Company’s annual impairment test, there was zero recorded impairment as of December 31, 2016.
Other intangible assets consist of core deposit intangible assets arising from business combinations and are amortized using an accelerated method over their estimated useful lives.
Purchase Credit Impaired Loans — Purchase credit impaired (“PCI”) loans are those loans that we acquired in the San Joaquin Bank (“SJB”) acquisition for which we were “covered” for reimbursement for a substantial portion of any future losses under the terms of the Federal Deposit Insurance Corporation (“FDIC”) loss sharing agreement. We account for PCI loans under ASC 310-30, Loans and Debt Securities Acquired with Deteriorated Credit Quality (“acquired impaired loan accounting”) when (i) we acquire loans deemed to be impaired when there is evidence of credit deterioration since their origination and it is probable at the date of acquisition that we would be unable to collect all contractually required payments and (ii) as a general policy election for non-impaired loans that we acquire in a distressed bank acquisition. Acquired impaired loans are accounted for individually or in pools of loans based on common risk characteristics. The excess of the loan’s or pool’s scheduled contractual principal and interest payments over all cash flows expected at acquisition is the nonaccretable difference. The remaining amount, representing the excess of the loan’s cash flows expected to be collected over the fair value is the accretable yield (accreted into interest income over the remaining life of the loan or pool). Refer to Note 6 — Acquired SJB Assets and FDIC Loss Sharing Asset for PCI loans by type.
Income Taxes — Income taxes are accounted for under the asset and liability method. Deferred tax assets and liabilities are recognized for the future tax consequences attributable to differences between the financial statement carrying amounts of existing assets and liabilities and their respective tax bases and operating loss and tax credit carryforwards. Deferred tax assets and liabilities are measured using enacted tax rates expected to apply to taxable income in the years in which those temporary differences are expected to be recovered or settled. The effect on deferred tax assets and liabilities of a change in tax rates is recognized in income in the period that includes the enactment date. Future realization of deferred tax assets ultimately depends on the existence of sufficient taxable income of the appropriate character (for example, ordinary income or capital gain) within the carryback or carryforward periods available under the tax law. Based on historical and future expected taxable earnings and available strategies, the Company considers the future realization of these deferred tax assets more likely than not.
The tax effects from an uncertain tax position are recognized in the financial statements only if, based on its merits, the position is more likely than not to be sustained on audit by the taxing authorities. Interest and penalties related to uncertain tax positions are recorded as part of other operating expense.
37
Table of Contents
Use of Fair Value — We use fair value measurements to record fair value adjustments to certain financial instruments and to determine fair value disclosures. Investment securities available-for-sale and interest-rate swaps are financial instruments recorded at fair value on a recurring basis. Additionally, from time to time, we may be required to record at fair value other financial assets on a non-recurring basis, such as impaired loans and other real estate owned (“OREO”), goodwill, and other intangible assets. These non-recurring fair value adjustments typically involve application of lower-of-cost-or-market accounting or write-downs of individual assets. Further, we include in Note 20 — Fair Value Information of the consolidated financial statements information about the extent to which fair value is used to measure assets and liabilities, the valuation methodologies used and its impact to earnings. Additionally, for financial instruments not recorded at fair value we disclose the estimate of their fair value.
Stock-Based Compensation — Consistent with the provisions of ASC 718, Stock Compensation, we recognize expense for the grant date fair value of stock options and restricted shares issued to employees, officers and non-employee directors over the their requisite service periods (generally the vesting period). The service periods may be subject to performance conditions.
The fair value of each stock option grant is estimated as of the grant date using the Black-Scholes option-pricing model. Management assumptions used at the time of grant impact the fair value of the option calculated under the Black-Scholes option-pricing model, and ultimately, the expense that will be recognized over the life of the option.
The grant date fair value of restricted stock awards is measured at the fair value of the Company’s common stock as if the restricted share was vested and issued on the date of grant.
For complete discussion and disclosure of other accounting policies see Note 3 — Summary of Significant Accounting Policies of the Company’s consolidated financial statements presented elsewhere in this report.
For the year ended December 31, 2016, we reported net earnings of $101.4 million, compared with $99.1 million for 2015, an increase of $2.3 million, or 2.30%. Earnings for 2016 included $6.4 million in loan loss provision recapture and $4.1 million in nonrecurring expenses. This compares to $5.6 million in loan loss provision recapture and $13.9 million in pre-tax debt termination expense for 2015. Diluted earnings per share were $0.94 per share for the year ended December 31, 2016, compared to $0.93 per share for 2015.
At December 31, 2016, total assets of $8.07 billion increased $402.5 million, or 5.25%, from total assets of $7.67 billion at December 31, 2015. Interest-earning assets totaled $7.64 billion at December 31, 2016, an increase of $354.8 million, or 4.87%, when compared with total interest-earning assets of $7.29 billion at December 31, 2015. The increase in interest-earning assets was primarily due to a $378.1 million increase in total loans and a $15.2 million increase in interest-earning balances due from depository institutions. This was partially offset by a $37.5 million decrease in total investment securities.
Total investment securities were $3.18 billion at December 31, 2016, a decrease of $37.5 million from $3.22 billion at December 31, 2015.
At December 31, 2016, investment securities HTM totaled $911.7 million. The after-tax unrealized gain reported in AOCI on investment securities HTM was $1.7 million at December 31, 2016. During the third quarter of 2015, we transferred investment securities from our AFS security portfolio to HTM. Transfers of securities into the HTM category from the AFS category are transferred at fair value at the date of transfer. The fair value of these securities at the date of transfer was $898.6 million. The unrealized holding gain or loss at the date of transfer is retained in accumulated other comprehensive income and in the carrying value of the held-to-maturity
38
Table of Contents
securities. The net unrealized holding gain at the date of transfer was $3.9 million after-tax and will continue to be reported in accumulated other comprehensive income (“AOCI”) and amortized over the remaining life of the securities as a yield adjustment.
At December 31, 2016, investment securities AFS totaled $2.27 billion, inclusive of a pre-tax unrealized gain of $14.6 million.
Total loans and leases, net of deferred fees and discount, of $4.40 billion at December 31, 2016, increased by $378.1 million, or 9.41%, from $4.02 billion at December 31, 2015. The increase in total loans included $143.2 million of loans acquired from CCB during the first quarter of 2016. The $378.1 million increase in total loans was principally due to increases of approximately $272.8 million in commercial real estate loans, $45.8 million in commercial and industrial loans, $32.9 million in dairy & livestock and agribusiness loans, $17.3 million in construction loans, $16.8 million in SFR mortgage loans, and $8.0 million in consumer loans. SBA loans decreased by $9.7 million.
Noninterest-bearing deposits were $3.67 billion at December 31, 2016, an increase of $423.4 million, or 13.03%, compared to $3.25 billion at December 31, 2015. At December 31, 2016, noninterest-bearing deposits were 58.22% of total deposits, compared to 54.93% at December 31, 2015. Our average cost of total deposits was 9 basis points for 2016 and 2015.
At December 31, 2016 we had $603.0 million in customer repurchase agreements and $53.0 million in short-term borrowings, compared to 690.7 million and $46.0 million, respectively, at December 31, 2015.
At December 31, 2016, we had $25.8 million of junior subordinated debentures, unchanged from December 31, 2015. These debentures bear interest at three-month LIBOR plus 1.38% and mature in 2036.
The allowance for loan losses totaled $61.5 million at December 31, 2016, compared to $59.2 million at December 31, 2015. The allowance for loan losses was reduced by $6.4 million in 2016, offset by net recoveries of $8.8 million. The allowance for loan losses was 1.40% and 1.47% of total loans and leases outstanding at December 31, 2016 and December 31, 2015, respectively.
Our capital ratios under the revised capital framework referred to as Basel III remain well-above regulatory standards. As of December 31, 2016, the Company’s Tier 1 leverage capital ratio totaled 11.49%, our common equity Tier 1 ratio totaled 16.48%, our Tier 1 risk-based capital ratio totaled 16.94%, and our total risk-based capital ratio totaled 18.19%. Refer to our Analysis of Financial Condition-Capital Resources for discussion of the new capital rules which were effective beginning with the first quarter ended March 31, 2015.
Recent Acquisitions
On September 22, 2016, we announced that we entered into a merger agreement with Valley Commerce Bancorp (“VCBP”), pursuant to which its subsidiary, Valley Business Bank will merge into Citizens Business Bank. Valley Business Bank has four branch locations and total assets of approximately $416 million. VCBP is a well-regarded 20 year institution that further strengthens our presence in the Central Valley area of California. The FDIC and Valley Commerce Bancorp’s shareholders have approved the transaction and we expect to close the transaction as soon as all remaining conditions have been fulfilled.
The Company completed the acquisition and integration of CCB in the first half of 2016. This follows recent strategic moves into the Central Coast area, which included new locations in Westlake Village and Santa Barbara in 2016, and Oxnard in 2015.
39
Table of Contents
ANALYSIS OF THE RESULTS OF OPERATIONS
Financial Performance
| Variance | ||||||||||||||||||||||||||||
| For the Year Ended December 31, | 2016 | 2015 | ||||||||||||||||||||||||||
| 2016 | 2015 | 2014 | $ | % | $ | % | ||||||||||||||||||||||
| (Dollars in thousands, except per share amounts) | ||||||||||||||||||||||||||||
| Net interest income |
$ | 257,074 | $ | 252,942 | $ | 236,514 | $ | 4,132 | 1.63 | % | $ | 16,428 | 6.95 | % | ||||||||||||||
| Recapture of provision for loan losses |
6,400 | 5,600 | 16,100 | 800 | 14.29 | % | (10,500 | ) | -65.22 | % | ||||||||||||||||||
| Noninterest income |
35,552 | 33,483 | 36,412 | 2,069 | 6.18 | % | (2,929 | ) | -8.04 | % | ||||||||||||||||||
| Noninterest expense |
(136,740 | ) | (140,659 | ) (1) | (126,229 | ) | 3,919 | 2.79 | % | (14,430 | ) | -11.43 | % | |||||||||||||||
| Income taxes |
(60,857 | ) | (52,221 | ) | (58,776 | ) | (8,636 | ) | -16.54 | % | 6,555 | 11.15 | % | |||||||||||||||
|
|
|
|
|
|
|
|
|
|
|
|
|
|
|
|||||||||||||||
| Net earnings |
$ | 101,429 | $ | 99,145 | $ | 104,021 | $ | 2,284 | 2.30 | % | $ | (4,876 | ) | -4.69 | % | |||||||||||||
|
|
|
|
|
|
|
|
|
|
|
|
|
|
|
|||||||||||||||
| Earnings per common share: |
||||||||||||||||||||||||||||
| Basic |
$ | 0.94 | $ | 0.93 | $ | 0.98 | $ | 0.01 | $ | (0.05 | ) | |||||||||||||||||
| Diluted |
$ | 0.94 | $ | 0.93 | $ | 0.98 | $ | 0.01 | $ | (0.05 | ) | |||||||||||||||||
| Return on average assets |
1.26 | % | 1.31 | % (1) | 1.45 | % | -0.05 | % | -0.14 | % | ||||||||||||||||||
| Return on average shareholders’ equity |
10.26 | % | 10.87 | % (1) | 12.50 | % | -0.61 | % | -1.63 | % | ||||||||||||||||||
| Efficiency ratio |
46.73 | % | 49.11 | % (1) | 46.25 | % | -2.38 | % | 2.86 | % | ||||||||||||||||||
| Noninterest expense to average assets |
1.70 | % | 1.86 | % (1) | 1.77 | % | -0.16 | % | 0.09 | % | ||||||||||||||||||
(1) Includes $13.9 million debt termination expense.
Noninterest Expense and Efficiency Ratio Reconciliation (Non-GAAP)
We use certain non-GAAP financial measures to provide supplemental information regarding our performance. Noninterest expense for the years ended December 31, 2016 and 2015 included debt termination expense of $16,000 and $13.9 million, respectively. We believe that presenting the efficiency ratio, and the ratio of noninterest expense to average assets, excluding the impact of debt termination expense, provides additional clarity to the users of financial statements regarding core financial performance. The Company did not incur debt termination expense during the year ended December 31, 2014.
| For the Year Ended December 31, | ||||||||||||
| 2016 | 2015 | 2014 | ||||||||||
| (Dollars in thousands) | ||||||||||||
| Net interest income |
$ | 257,074 | $ | 252,942 | $ | 236,514 | ||||||
| Noninterest income |
35,552 | 33,483 | 36,412 | |||||||||
| Noninterest expense |
136,740 | 140,659 | 126,229 | |||||||||
| Less: debt termination expense |
(16 | ) | (13,870 | ) | - | |||||||
|
|
|
|
|
|
|
|||||||
| Adjusted noninterest expense |
$ | 136,724 | $ | 126,789 | $ | 126,229 | ||||||
| Efficiency ratio |
46.73 | % | 49.11 | % | 46.25 | % | ||||||
| Adjusted efficiency ratio |
46.72 | % | 44.27 | % | 46.25 | % | ||||||
| Adjusted noninterest expense |
$ | 136,724 | $ | 126,789 | $ | 126,229 | ||||||
| Average assets |
8,022,994 | 7,565,056 | 7,150,017 | |||||||||
| Adjusted noninterest expense to average assets |
1.70 | % | 1.68 | % | 1.77 | % | ||||||
40
Table of Contents
Net Interest Income
The principal component of our earnings is net interest income, which is the difference between the interest and fees earned on loans and investments (interest-earning assets) and the interest paid on deposits and borrowed funds (interest-bearing liabilities). Net interest margin is net interest income as a percentage of average interest-earning assets for the period. The level of interest rates and the volume and mix of interest-earning assets and interest-bearing liabilities impact net interest income and net interest margin. The net interest spread is the yield on average interest earning assets minus the cost of average interest-bearing liabilities. Net interest margin and net interest spread are included on a tax equivalent (TE) basis by adjusting interest income utilizing the federal statutory tax rate of 35%. Our net interest income, interest spread, and net interest margin are sensitive to general business and economic conditions. These conditions include short-term and long-term interest rates, inflation, monetary supply, and the strength of the international, national and state economies, in general, and more specifically, the local economies in which we conduct business. Our ability to manage net interest income during changing interest rate environments will have a significant impact on our overall performance. We manage net interest income through affecting changes in the mix of interest-earning assets as well as the mix of interest-bearing liabilities, changes in the level of interest-bearing liabilities in proportion to interest-earning assets, and in the growth and maturity of earning assets. See Item 7 – Management’s Discussion and Analysis of Financial Condition and Results of Operations – Asset/Liability and Market Risk Management – Interest Rate Sensitivity Management included herein.
41
Table of Contents
The table below presents the interest rate spread, net interest margin and the composition of average interest-earning assets and average interest-bearing liabilities by category for the periods indicated, including the changes in average balance, composition, and average yield/rate between these respective periods.
Interest-Earning Assets and Interest-Bearing Liabilities
| For the Year Ended December 31, | ||||||||||||||||||||||||||||||||||||
| 2016 | 2015 | 2014 | ||||||||||||||||||||||||||||||||||
| Average | Yield/ | Average | Yield/ | Average | Yield/ | |||||||||||||||||||||||||||||||
| Balance | Interest | Rate | Balance | Interest | Rate | Balance | Interest | Rate | ||||||||||||||||||||||||||||
| (Dollars in thousands) | ||||||||||||||||||||||||||||||||||||
| INTEREST-EARNING ASSETS |
||||||||||||||||||||||||||||||||||||
| Investment securities (1) |
||||||||||||||||||||||||||||||||||||
| Available-for-sale securities: |
||||||||||||||||||||||||||||||||||||
| Taxable |
$ | 2,126,733 | $ | 43,538 | 2.07 | % | $ | 2,339,849 | $ | 48,854 | 2.08 | % | $ | 2,341,487 | $ | 47,301 | 2.03 | % | ||||||||||||||||||
| Tax-advantaged |
123,844 | 4,164 | 4.90 | % | 397,440 | 14,336 | 4.95 | % | 578,594 | 20,913 | 4.95 | % | ||||||||||||||||||||||||
| Held-to-maturity securities: |
||||||||||||||||||||||||||||||||||||
| Taxable |
500,557 | 10,183 | 2.03 | % | 223,780 | 4,451 | 1.97 | % | 1,640 | 164 | 10.00 | % | ||||||||||||||||||||||||
| Tax-advantaged |
300,484 | 10,044 | 4.51 | % | 135,419 | 4,567 | 4.55 | % | - | - | - | |||||||||||||||||||||||||
| Investment in FHLB stock |
17,873 | 2,224 | 12.24 | % | 20,497 | 2,774 | (4) | 13.35 | % | 27,347 | 2,130 | 7.68 | % | |||||||||||||||||||||||
| Interest-earning deposits with other institutions |
320,289 | 1,905 | 0.59 | % | 276,459 | 868 | 0.31 | % | 222,929 | 776 | 0.35 | % | ||||||||||||||||||||||||
| Loans held-for-sale |
- | - | - | - | - | - | 90 | - | - | |||||||||||||||||||||||||||
| Loans (2) |
4,197,808 | 190,486 | 4.53 | % | 3,788,008 | 181,631 | 4.79 | % | 3,608,858 | 175,794 | 4.87 | % | ||||||||||||||||||||||||
| Yield adjustment to interest income from discount accretion on PCI loans |
(2,679 | ) | 2,506 | (5,875 | ) | 4,032 | (10,138 | ) | 5,825 | |||||||||||||||||||||||||||
|
|
|
|
|
|
|
|
|
|
|
|
|
|||||||||||||||||||||||||
| Total interest-earning assets |
7,584,909 | 265,050 | 3.57 | % | 7,175,577 | 261,513 | 3.74 | % | 6,770,807 | 252,903 | 3.86 | % | ||||||||||||||||||||||||
| Total noninterest-earning assets |
438,085 | 389,479 | 379,210 | |||||||||||||||||||||||||||||||||
|
|
|
|
|
|
|
|||||||||||||||||||||||||||||||
| Total assets |
$ | 8,022,994 | $ | 7,565,056 | $ | 7,150,017 | ||||||||||||||||||||||||||||||
|
|
|
|
|
|
|
|||||||||||||||||||||||||||||||
| INTEREST-BEARING LIABILITIES |
||||||||||||||||||||||||||||||||||||
| Savings deposits (3) |
$ | 2,185,493 | 4,354 | 0.20 | % | $ | 1,998,601 | 3,849 | 0.19 | % | $ | 1,886,743 | 3,692 | 0.20 | % | |||||||||||||||||||||
| Time deposits |
584,149 | 1,603 | 0.27 | % | 735,045 | 1,417 | 0.19 | % | 713,813 | 1,285 | 0.18 | % | ||||||||||||||||||||||||
|
|
|
|
|
|
|
|
|
|
|
|
|
|||||||||||||||||||||||||
| Total interest-bearing deposits |
2,769,642 | 5,957 | 0.21 | % | 2,733,646 | 5,266 | 0.19 | % | 2,600,556 | 4,977 | 0.19 | % | ||||||||||||||||||||||||
| FHLB advances, other borrowings, and customer repurchase agreements |
637,585 | 2,019 | 0.32 | % | 684,386 | 3,305 | 0.48 | % | 845,686 | 11,412 | 1.33 | % | ||||||||||||||||||||||||
|
|
|
|
|
|
|
|
|
|
|
|
|
|||||||||||||||||||||||||
| Interest-bearing liabilities |
3,407,227 | 7,976 | 0.23 | % | 3,418,032 | 8,571 | 0.25 | % | 3,446,242 | 16,389 | 0.47 | % | ||||||||||||||||||||||||
|
|
|
|
|
|
|
|
|
|
|
|
|
|||||||||||||||||||||||||
| Noninterest-bearing deposits |
3,539,707 | 3,159,989 | 2,802,490 | |||||||||||||||||||||||||||||||||
| Other liabilities |
87,328 | 74,997 | 69,258 | |||||||||||||||||||||||||||||||||
| Stockholders’ equity |
988,732 | 912,038 | 832,027 | |||||||||||||||||||||||||||||||||
|
|
|
|
|
|
|
|||||||||||||||||||||||||||||||
| Total liabilities and stockholders’ equity |
$ | 8,022,994 | $ | 7,565,056 | $ | 7,150,017 | ||||||||||||||||||||||||||||||
|
|
|
|
|
|
|
|||||||||||||||||||||||||||||||
| Net interest income |
$ | 257,074 | $ | 252,942 | $ | 236,514 | ||||||||||||||||||||||||||||||
|
|
|
|
|
|
|
|||||||||||||||||||||||||||||||
| Net interest income excluding discount on PCI loans |
$ | 254,568 | $ | 248,910 | $ | 230,689 | ||||||||||||||||||||||||||||||
|
|
|
|
|
|
|
|||||||||||||||||||||||||||||||
| Net interest spread - tax equivalent |
3.34 | % | 3.49 | % | 3.39 | % | ||||||||||||||||||||||||||||||
| Net interest spread - tax equivalent excluding PCI discount |
3.30 | % | 3.43 | % | 3.29 | % | ||||||||||||||||||||||||||||||
| Net interest margin |
3.39 | % | 3.52 | % | 3.50 | % | ||||||||||||||||||||||||||||||
| Net interest margin - tax equivalent |
3.46 | % | 3.62 | % | 3.62 | % | ||||||||||||||||||||||||||||||
| Net interest margin - tax equivalent excluding PCI discount |
3.43 | % | 3.56 | % | 3.52 | % | ||||||||||||||||||||||||||||||
| (1) | Includes tax equivalent (TE) adjustments utilizing a federal statutory rate of 35%. Non tax-equivalent (TE) rate was 2.24%, 2.38% and 2.35% for the years ended December 31, 2016, 2015 and 2014, respectively. |
| (2) | Includes loan fees of $3,953, $3,922 and $3,078 for the years ended December 31, 2016, 2015 and 2014, respectively. Prepayment penalty fees of $3,479, $4,920 and $2,983 are included in interest income for the years ended December 31, 2016, 2015 and 2014, respectively. |
| (3) | Includes interest-bearing demand and money market accounts. |
| (4) | Includes a special dividend from the FHLB of $923,000. |
42
Table of Contents
Net Interest Income and Net Interest Margin Reconciliations (Non-GAAP)
We use certain non-GAAP financial measures to provide supplemental information regarding our performance. The 2016, 2015 and 2014 net interest income and net interest margin include a yield adjustment of $2.5 million, $4.0 million and $5.8 million, respectively. These yield adjustments relate to discount accretion on PCI loans, and are reflected in the Company’s net interest margin. We believe that presenting net interest income and the net interest margin excluding these yield adjustments provides additional clarity to the users of financial statements regarding core net interest income and net interest margin.
| For the Year Ended December 31, | ||||||||||||||||||||||||||||||||||||
| 2016 | 2015 | 2014 | ||||||||||||||||||||||||||||||||||
| Average | Average | Average | ||||||||||||||||||||||||||||||||||
| Balance | Interest | Yield | Balance | Interest | Yield | Balance | Interest | Yield | ||||||||||||||||||||||||||||
| (Dollars in thousands) | ||||||||||||||||||||||||||||||||||||
| Total interest-earning assets (TE) |
$ | 7,584,909 | $ | 270,358 | 3.57 | % | $ | 7,175,577 | $ | 268,422 | 3.74 | % | $ | 6,770,807 | $ | 260,573 | 3.86 | % | ||||||||||||||||||
| Discount on acquired PCI loans |
2,679 | (2,506 | ) | 5,875 | (4,032 | ) | 10,138 | (5,825 | ) | |||||||||||||||||||||||||||
|
|
|
|
|
|
|
|
|
|
|
|
|
|||||||||||||||||||||||||
| Total interest-earning assets, excluding PCI loan discount and yield adjustment |
$ | 7,587,588 | $ | 267,852 | 3.53 | % | $ | 7,181,452 | $ | 264,390 | 3.68 | % | $ | 6,780,945 | $ | 254,748 | 3.77 | % | ||||||||||||||||||
|
|
|
|
|
|
|
|
|
|
|
|
|
|||||||||||||||||||||||||
| Net interest income and net interest margin (TE) |
|
$ | 262,382 | 3.46 | % | $ | 259,851 | 3.62 | % | $ | 244,184 | 3.62 | % | |||||||||||||||||||||||
| Yield adjustment to interest income from |
(2,506 | ) | (4,032 | ) | (5,825 | ) | ||||||||||||||||||||||||||||||
|
|
|
|
|
|
|
|||||||||||||||||||||||||||||||
| Net interest income and net interest margin (TE), excluding yield adjustment |
$ | 259,876 | 3.43 | % | $ | 255,819 | 3.56 | % | $ | 238,359 | 3.52 | % | ||||||||||||||||||||||||
|
|
|
|
|
|
|
|||||||||||||||||||||||||||||||
The following tables present a comparison of interest income and interest expense resulting from changes in the volumes and rates on average interest-earning assets and average interest-bearing liabilities for the periods indicated. Changes in interest income or expense attributable to volume changes are calculated by multiplying the change in volume by the initial average interest rate. The change in interest income or expense attributable to changes in interest rates is calculated by multiplying the change in interest rate by the initial volume. The changes attributable to interest rate and volume changes are calculated by multiplying the change in rate times the change in volume.
Rate and Volume Analysis for Changes in Interest Income, Interest Expense and Net Interest Income
| Comparison of Year Ended December 31, | ||||||||||||||||||||||||||||||||
| 2016 Compared to 2015 Increase (Decrease) Due to |
2015 Compared to 2014 Increase (Decrease) Due to |
|||||||||||||||||||||||||||||||
| Volume | Rate | Rate/ Volume |
Total | Volume | Rate | Rate/ Volume |
Total | |||||||||||||||||||||||||
| (Dollars in thousands) | ||||||||||||||||||||||||||||||||
| Interest income: |
||||||||||||||||||||||||||||||||
|
Available-for-sale securities: |
||||||||||||||||||||||||||||||||
| Taxable investment securities |
$ | (5,121 | ) | $ | (214 | ) | $ | 19 | $ | (5,316 | ) | $ | (52 | ) | $ | 1,607 | $ | (2 | ) | $ | 1,553 | |||||||||||
| Tax-advantaged investment securities |
(9,930 | ) | (786 | ) | 544 | (10,172 | ) | (6,584 | ) | 11 | (4 | ) | (6,577 | ) | ||||||||||||||||||
| Held-to-maturity securities: |
||||||||||||||||||||||||||||||||
| Taxable investment securities |
5,408 | 145 | 179 | 5,732 | 22,449 | (133 | ) | (18,029 | ) | 4,287 | ||||||||||||||||||||||
| Tax-advantaged investment securities |
5,564 | (39 | ) | (48 | ) | 5,477 | 4,567 | - | - | 4,567 | ||||||||||||||||||||||
| Investment in FHLB stock |
(351 | ) | (228 | ) | 29 | (550 | ) | (532 | ) | 1,569 | (393 | ) | 644 | |||||||||||||||||||
| Interest-earning deposits with other institutions |
138 | 776 | 123 | 1,037 | 196 | (84 | ) | (20 | ) | 92 | ||||||||||||||||||||||
| Loans HFS |
- | - | - | - | - | - | - | - | ||||||||||||||||||||||||
| Loans |
20,790 | (10,770 | ) | (1,165 | ) | 8,855 | 8,661 | (2,690 | ) | (134 | ) | 5,837 | ||||||||||||||||||||
| Yield adjustment from discount accretion |
(2,184 | ) | 1,442 | (784 | ) | (1,526 | ) | (2,450 | ) | 1,133 | (476 | ) | (1,793 | ) | ||||||||||||||||||
|
|
|
|
|
|
|
|
|
|
|
|
|
|
|
|
|
|||||||||||||||||
| Total interest income |
14,314 | (9,674 | ) | (1,103 | ) | 3,537 | 26,255 | 1,413 | (19,058 | ) | 8,610 | |||||||||||||||||||||
|
|
|
|
|
|
|
|
|
|
|
|
|
|
|
|
|
|||||||||||||||||
43
Table of Contents
| Comparison of Year Ended December 31, | ||||||||||||||||||||||||||||||||
| 2016 Compared to 2015 Increase (Decrease) Due to |
2015 Compared to 2014 Increase (Decrease) Due to |
|||||||||||||||||||||||||||||||
| Volume | Rate | Rate/ Volume |
Total | Volume | Rate | Rate/ Volume |
Total | |||||||||||||||||||||||||
| (Dollars in thousands) | ||||||||||||||||||||||||||||||||
| Interest expense: |
||||||||||||||||||||||||||||||||
| Savings deposits |
368 | 126 | 11 | 505 | 463 | (289 | ) | (17 | ) | 157 | ||||||||||||||||||||||
| Time deposits |
(297 | ) | 608 | (125 | ) | 186 | 38 | 91 | 3 | 132 | ||||||||||||||||||||||
| FHLB advances, other borrowings, and |
(225 | ) | (1,139 | ) | 78 | (1,286 | ) | (2,189 | ) | (7,313 | ) | 1,395 | (8,107 | ) | ||||||||||||||||||
|
|
|
|
|
|
|
|
|
|
|
|
|
|
|
|
|
|||||||||||||||||
| Total interest expense |
(154 | ) | (405 | ) | (36 | ) | (595 | ) | (1,688 | ) | (7,511 | ) | 1,381 | (7,818 | ) | |||||||||||||||||
|
|
|
|
|
|
|
|
|
|
|
|
|
|
|
|
|
|||||||||||||||||
| Net interest income |
$ | 14,468 | $ | (9,269 | ) | $ | (1,067 | ) | $ | 4,132 | $ | 27,943 | $ | 8,924 | $ | (20,439 | ) | $ | 16,428 | |||||||||||||
|
|
|
|
|
|
|
|
|
|
|
|
|
|
|
|
|
|||||||||||||||||
2016 Compared to 2015
Net interest income, before recapture of provision for loan losses, of $257.1 million for 2016 increased $4.1 million, or 1.63%, compared to $252.9 million for 2015. Average interest-earning assets of $7.58 billion grew by $409.3 million, or 5.70%, from $7.18 billion for 2015. Our net interest margin tax equivalent (TE) was 3.46% for 2016, compared to 3.62% for 2015. Total cost of funds decreased to 0.11% for 2016 from 0.13% for 2015.
Interest income for 2016 was $265.1 million, which represented a $3.5 million, or 1.35%, increase when compared to 2015. Interest income grew by $14.3 million as a result of the $409.3 million growth in earning assets, but the decline in the earning asset yield reduced interest income by $11.0 million. The tax equivalent yield on earning assets declined from 3.74% in 2015 to 3.57% in 2016, primarily due to the 0.26% decrease in loan yields.
Interest income and fees on loans for 2016 totaled $193.0 million which represented a $7.3 million, or 3.95%, increase when compared to 2015. The low interest rate environment and competitive pricing pressures continued to impact both loan retention and loan yields during 2016. Our average loan yield on loans (excluding discount on PCI loans) was 4.53% for 2016, compared to 4.79% for 2015.
For the year ended December 31, 2016, there were four nonperforming, troubled debt restructuring (“TDR”) loans that were paid in full resulting in the recognition of $3.3 million of interest income. This compares to five nonperforming loans paid in full resulting in a $4.9 million increase in interest income in 2015. When this recaptured nonaccrued interest is excluded, the net increase margin (TE) was 3.42% for 2016, compared to 3.55% for 2015. Interest income from prepayment penalties declined by $1.4 million from $4.9 million in 2015 to $3.5 million for 2016. The impact of loan repricing and lower prepayment penalties combined for an approximate 13 basis point decline in the net interest margin.
In general, we stop accruing interest on a loan after its principal or interest becomes 90 days or more past due. When a loan is placed on nonaccrual, all interest previously accrued but not collected is charged against earnings. There was no interest income that was accrued and not reversed on nonaccrual loans at December 31, 2016 and 2015. As of December 31, 2016 and 2015, we had $7.2 million and $21.0 million of nonaccrual loans (excluding PCI loans), respectively. Had these nonaccrual loans for which interest was no longer accruing complied with the original terms and conditions, interest income would have been approximately $493,000 and $1.2 million greater for 2016 and 2015, respectively.
Net loan fees and the direct costs associated with the origination or purchase of loans are deferred and deducted from total loans on our balance sheet. Net deferred loan fees are recognized in interest income over the term of the loan using the effective-yield method. We recognized loan fee income of $4.0 million for 2016, compared to $3.9 million for 2015.
Interest income from total investment securities of $67.9 million for 2016 decreased $4.3 million, or 5.93%, from $72.2 million for 2015. This decrease was the result of both a $44.9 million decline in average investment securities and a 0.14% decline in the average non-TE yield on securities for 2016. Dividend income from FHLB stock decreased by $550,000 from 2015, due to a special dividend of $923,000 from the FHLB.
44
Table of Contents
Interest expense of $8.0 million for 2016 decreased $595,000, or 6.94%, compared to $8.6 million for 2015. The average rate paid on interest-bearing liabilities decreased two basis points, to 0.23% for 2016, from 0.25% for 2015. Average interest-bearing liabilities were $10.8 million lower in 2016, compared to 2015, as repurchase agreements and other borrowings declined by $46.8 million. The combination of a lower cost of interest bearing liabilities and the $379.7 million increase in non-interest bearing deposits resulted in a reduction in cost of funds from 0.13% in 2015 to 0.11% in 2016.
2015 Compared to 2014
Net interest income, before recapture of provision for loan losses, of $252.9 million for 2015 increased $16.4 million, or 6.95%, compared to $236.5 million for 2014. Interest-earning assets grew by $404.8 million, or 5.98%, from $6.77 billion for 2014 to $7.18 billion for 2015. Our net interest margin (TE) was 3.62% for 2015 and 2014. Net interest income for 2015 was also positively impacted by a $7.8 million decrease in interest expense, primarily due to the prepayment of a $200.0 million FHLB fixed rate debt in the first quarter of 2015. Total cost of funds decreased to 0.13% for 2015 from 0.26% for 2014.
Interest income for 2015 was $261.5 million, which represented an $8.6 million, or 3.40%, increase when compared to 2014. Interest income and fees and loans for 2015 totaled $185.7 million, which represented a $4.0 million, or 2.23%, increase when compared to 2014. This increase was primarily due to a $183.4 million increase in average loans for 2015 when compared to 2014, offset by an 8 basis point decline in the average yield on loans (excluding discount on PCI loans) for 2015.
There was no interest income that was accrued and not reversed on nonaccrual loans at December 31, 2015 and 2014. As of December 31, 2015 and 2014, we had $21.0 million and $32.2 million of nonaccrual loans (excluding PCI loans), respectively. Had these nonaccrual loans for which interest was no longer accruing complied with the original terms and condition, interest income would have been approximately $1.2 million and $2.0 million greater for 2015 and 2014, respectively.
Net loan fees and the direct costs associated with the origination or purchase of loans are deferred and deducted from total loans on our balance sheet. Net deferred loan fees are recognized in interest income over the term of the loan using the effective-yield method. We recognized loan fee income of $3.9 million for 2015, compared to $3.1 million for 2014.
Interest income from investment securities was $72.2 million for 2015, a $3.8 million increase from $68.4 million for 2014. This increase was the result of both a $174.8 million increase in average investment securities and a three basis point increase in the average non-TE yield on securities for 2015, compared to 2014.
Interest expense of $8.6 million for 2015 decreased $7.8 million, or 47.70%, compared to $16.4 million for 2014. Interest expense from FHLB advances and other borrowings declined by $8.1 million as a result of the prepayment of a $200.0 million FHLB fixed rate debt in the first quarter of 2015. The average rate paid on interest-bearing liabilities decreased 22 basis points, to 0.25% for 2015, from 0.47% for 2014.
Provision for Loan Losses
The allowance for loan losses is increased by the provision for loan losses and recoveries of prior losses, and is decreased by recapture of provisions and by charge-offs taken when management believes the uncollectability of any loan is confirmed. The provision for loan losses is determined by management as the amount to be added to (subtracted from) the allowance for loan losses after net charge-offs have been deducted to bring the allowance to an appropriate level which, in management’s best estimate, is necessary to absorb probable loan losses within the existing loan portfolio.
The allowance for loan losses totaled $61.5 million at December 31, 2016, compared to $59.2 million at December 31, 2015. The allowance for loan losses was reduced by a $6.4 million loan loss provision recapture for 2016, offset by net recoveries of $8.8 million. We recorded a $5.6 million loan loss provision recapture for
45
Table of Contents
2015 and a $16.1 million loan loss provision recapture for 2014. We believe the allowance is appropriate at December 31, 2016. We periodically assess the quality of our portfolio to determine whether additional provisions for loan losses are necessary. The ratio of the allowance for loan losses to total loans and leases outstanding, net of deferred fees and discount, as of December 31, 2016, 2015 and 2014 was 1.40%, 1.47% and 1.57%, respectively. Refer to the discussion of Allowance for Loan Losses in Item 7—Management’s Discussion and Analysis of Financial Condition and Results of Operations contained herein for discussion concerning observed changes in the credit quality of various components of our loan portfolio as well as changes and refinements to our methodology.
No assurance can be given that economic conditions which adversely affect the Company’s service areas or other circumstances will not be reflected in increased provisions for loan losses in the future, as the nature of this process requires considerable judgment. Net recoveries totaled $8.8 million for 2016, compared to net recoveries of $5.0 million for 2015 and net recoveries of $690,000 for 2014. See “Allowance for Loan Losses” under Analysis of Financial Condition herein.
PCI loans acquired in the FDIC-assisted transaction were initially recorded at their fair value and were covered by a loss sharing agreement with the FDIC, which expired in October 2014 for commercial loans. Due to the timing of the acquisition and the October 16, 2009 fair value estimate, there was no provision for loan losses on the PCI loans in 2009. Refer to Note 3 — Summary of Significant Accounting Policies of the consolidated financial statements. During the year ended December 31, 2016 there were no charge-offs or recoveries, compared to $92,000 in net charge-offs for 2015 and $40,000 in net charge-offs for 2014, for loans in excess of the amount originally expected in the fair value of the loans at acquisition.
Noninterest Income
Noninterest income includes income derived from special services offered, such as CitizensTrust, BankCard services, international banking, and other business services. Also included in noninterest income are service charges and fees, primarily from deposit accounts, gains (net of losses) from the disposition of investment securities, loans, other real estate owned, and fixed assets, and other revenues not included as interest on earning assets.
The following table sets forth the various components of noninterest income for the periods presented.
| Variance | ||||||||||||||||||||||||||||
| For the Year Ended December 31, | 2016 | 2015 | ||||||||||||||||||||||||||
| 2016 | 2015 | 2014 | $ | % | $ | % | ||||||||||||||||||||||
| (Dollars in thousands) | ||||||||||||||||||||||||||||
| Noninterest income: |
||||||||||||||||||||||||||||
| Service charges on deposit accounts |
$ | 15,066 | $ | 15,567 | $ | 15,778 | $ | (501 | ) | -3.22 | % | $ | (211 | ) | -1.34 | % | ||||||||||||
| Trust and investment services |
9,595 | 8,642 | 8,118 | 953 | 11.03 | % | 524 | 6.45 | % | |||||||||||||||||||
| Bankcard services |
2,921 | 3,094 | 3,386 | (173 | ) | -5.59 | % | (292 | ) | -8.62 | % | |||||||||||||||||
| BOLI income |
2,612 | 2,561 | 2,428 | 51 | 1.99 | % | 133 | 5.48 | % | |||||||||||||||||||
| Gain (loss) on sale of investment securities, net |
548 | (22 | ) | - | 570 | 2590.91 | % | (22 | ) | - | ||||||||||||||||||
| Change in FDIC loss sharing asset, net |
(5 | ) | (902 | ) | (3,591 | ) | 897 | 99.45 | % | 2,689 | 74.88 | % | ||||||||||||||||
| Gain (loss) on OREO, net |
(20 | ) | 416 | 1,020 | (436 | ) | -104.81 | % | (604 | ) | -59.22 | % | ||||||||||||||||
| Gain on sale of loans |
1,101 | 732 | 6,001 | 369 | 50.41 | % | (5,269 | ) | -87.80 | % | ||||||||||||||||||
| Other |
3,734 | 3,395 | 3,272 | 339 | 9.99 | % | 123 | 3.76 | % | |||||||||||||||||||
|
|
|
|
|
|
|
|
|
|
|
|
|
|
|
|||||||||||||||
| Total noninterest income |
$ | 35,552 | $ | 33,483 | $ | 36,412 | $ | 2,069 | 6.18 | % | $ | (2,929 | ) | -8.04 | % | |||||||||||||
|
|
|
|
|
|
|
|
|
|
|
|
|
|
|
|||||||||||||||
2016 Compared to 2015
The $2.1 million increase in noninterest income was primarily due to a $953,000 increase in trust and investment service fees, an $897,000 positive impact from the change in the FDIC loss sharing asset, and a
46
Table of Contents
$548,000 gain on the sale of investment securities in the third quarter of 2016. Gain on sale of loans increased by $369,000 due to a $1.1 million net gain on sale of loans in the first quarter of 2016. These gains were offset by a decrease of $501,000 in service charges on deposit accounts and a decrease of $436,000 in gain on sale of OREO during 2016 compared to 2015. Other income included a $358,000 increase in swap fee income for 2016 and a $272,000 net gain on the sale of our Porterville branch during the second quarter of 2016.
CitizensTrust consists of Wealth Management and Investment Services income. The Wealth Management group provides a variety of services, which include asset management, financial planning, estate planning, retirement planning, private and corporate trustee services, and probate services. Investment Services provides self-directed brokerage, 401(k) plans, mutual funds, insurance and other non-insured investment products. At December 31, 2016, CitizensTrust had approximately $2.69 billion in assets under management and administration, including $2.08 billion in assets under management. CitizensTrust generated fees of $9.6 million for 2016, compared to $8.6 million for 2015.
The Bank invests in Bank-Owned Life Insurance (“BOLI”). BOLI involves the purchasing of life insurance by the Bank on a selected group of employees. The Bank is the owner and beneficiary of these policies. BOLI is recorded as an asset at its cash surrender value. Increases in the cash value of these policies, as well as insurance proceeds received, are recorded in noninterest income and are not subject to income tax, as long as they are held for the life of the covered parties. BOLI income was $2.6 million for both 2016 and 2015.
2015 Compared to 2014
The $2.9 million decrease in noninterest income for 2015 was primarily due to a $732,000 gain on the sale of loans in 2015, compared to a $6.0 million gain for 2014. This was partially offset by a $902,000 net decrease in the FDIC loss sharing asset, compared to a $3.6 million net decrease for 2014.
At December 31, 2015, CitizensTrust had approximately $2.42 billion in assets under management and administration, including $1.88 billion in assets under management. CitizensTrust generated fees of $8.6 million for 2015, compared to $8.1 million for 2014.
BOLI income of $2.6 million for 2015 increased $133,000, or 5.48%, from $2.4 million for 2014.
47
Table of Contents
Noninterest Expense
The following table summarizes the various components of noninterest expense for the periods presented.
| Variance | ||||||||||||||||||||||||||||
| For the Year Ended December 31, | 2016 | 2015 | ||||||||||||||||||||||||||
| 2016 | 2015 | 2014 | $ | % | $ | % | ||||||||||||||||||||||
| (Dollars in thousands) | ||||||||||||||||||||||||||||
| Noninterest expense: |
||||||||||||||||||||||||||||
| Salaries and employee benefits |
$ | 82,630 | $ | 78,618 | $ | 76,644 | $ | 4,012 | 5.10 | % | $ | 1,974 | 2.58 | % | ||||||||||||||
| Occupancy |
12,138 | 11,141 | 11,345 | 997 | 8.95 | % | (204 | ) | -1.80 | % | ||||||||||||||||||
| Equipment |
3,503 | 3,751 | 3,919 | (248 | ) | -6.61 | % | (168 | ) | -4.29 | % | |||||||||||||||||
| Professional services |
5,054 | 5,757 | 5,460 | (703 | ) | -12.21 | % | 297 | 5.44 | % | ||||||||||||||||||
| Software licenses and maintenance |
5,465 | 5,368 | 5,402 | 97 | 1.81 | % | (34 | ) | -0.63 | % | ||||||||||||||||||
| Stationery and supplies |
1,178 | 1,295 | 1,530 | (117 | ) | -9.03 | % | (235 | ) | -15.36 | % | |||||||||||||||||
| Telecommunications expense |
2,222 | 1,649 | 1,565 | 573 | 34.75 | % | 84 | 5.37 | % | |||||||||||||||||||
| Marketing and promotion |
5,027 | 5,015 | 5,195 | 12 | 0.24 | % | (180 | ) | -3.46 | % | ||||||||||||||||||
| Amortization of intangible assets |
1,106 | 949 | 1,137 | 157 | 16.54 | % | (188 | ) | -16.53 | % | ||||||||||||||||||
| Debt termination expense |
16 | 13,870 | - | (13,854 | ) | -99.88 | % | 13,870 | - | |||||||||||||||||||
| Regulatory assessments |
3,785 | 4,168 | 3,996 | (383 | ) | -9.19 | % | 172 | 4.30 | % | ||||||||||||||||||
| Insurance |
1,719 | 1,771 | 1,931 | (52 | ) | -2.94 | % | (160 | ) | -8.29 | % | |||||||||||||||||
| Loan expense |
991 | 904 | 1,260 | 87 | 9.62 | % | (356 | ) | -28.25 | % | ||||||||||||||||||
| OREO expense |
500 | 443 | 307 | 57 | 12.87 | % | 136 | 44.30 | % | |||||||||||||||||||
| Recapture of provision for unfunded loan |
(450 | ) | (500 | ) | (1,250 | ) | 50 | 10.00 | % | 750 | 60.00 | % | ||||||||||||||||
| Directors’ expenses |
797 | 691 | 1,032 | 106 | 15.34 | % | (341 | ) | -33.04 | % | ||||||||||||||||||
| Acquisition related expenses |
1,897 | 475 | 1,973 | 1,422 | 299.37 | % | (1,498 | ) | -75.92 | % | ||||||||||||||||||
| Impairment loss on asset held-for-sale |
2,558 | - | - | 2,558 | - | - | - | |||||||||||||||||||||
| Legal settlement |
1,500 | - | - | 1,500 | - | - | - | |||||||||||||||||||||
| Other |
5,104 | 5,294 | 4,783 | (190 | ) | -3.59 | % | 511 | 10.68 | % | ||||||||||||||||||
|
|
|
|
|
|
|
|
|
|
|
|
|
|
|
|||||||||||||||
| Total noninterest expense |
$ | 136,740 | $ | 140,659 | $ | 126,229 | $ | (3,919 | ) | -2.79 | % | $ | 14,430 | 11.43 | % | |||||||||||||
|
|
|
|
|
|
|
|
|
|
|
|
|
|
|
|||||||||||||||
| Noninterest expense to average assets, |
1.70 | % | 1.68 | % | 1.77 | % | ||||||||||||||||||||||
| Efficiency ratio, excluding debt termination |
46.72 | % | 44.27 | % | 46.25 | % | ||||||||||||||||||||||
| (1) | Noninterest expense divided by net interest income before provision for loan losses plus noninterest income. |
Our ability to control noninterest expenses in relation to asset growth can be measured in terms of total noninterest expenses as a percentage of average assets. Excluding the impact of the debt termination expense, noninterest expense measured as a percentage of average assets was 1.70% for 2016, compared to 1.68% and 1.77% for 2015 and 2014, respectively.
Our ability to control noninterest expenses in relation to the level of total revenue (net interest income before provision for loan losses plus noninterest income) is measured by the efficiency ratio and indicates the percentage of net revenue that is used to cover expenses. For 2016, the efficiency ratio, excluding debt termination expense, was 46.72%, compared to 44.27% for 2015 and 46.25% for 2014.
2016 Compared to 2015
Noninterest expense for 2016 was $3.9 million lower than 2015, as $13.9 million in debt termination expense was incurred in 2015. Excluding the impact of debt termination expense, noninterest expense of $136.7 million increased $9.9 million, or 7.84%. This increase was primarily due to $4.1 million in nonrecurring expenses resulting from a fair value adjustment of $2.6 million for our operations center, which was classified as an asset held-for-sale at December 31, 2016, and a $1.5 million accrual for the settlement of a wage-hour class action lawsuit. Salaries and employee benefits increased $4.0 million, principally due to additional
48
Table of Contents
compensation related costs resulting from the acquisition of CCB, the opening of our Santa Barbara commercial banking center in January 2016, and other strategic new hires. Acquisition expenses of $1.9 million in 2016 were due to the CCB acquisition and pending Valley Business Bank acquisition.
2015 Compared to 2014
Noninterest expense for 2015 increased $14.4 million, compared to 2014. The overall increase was primarily due to pre-tax debt termination expense of $13.9 million resulting from the redemption of a $200.0 million FHLB fixed rate advance in the first quarter of 2015. The $1.8 million increase in salaries and employee benefits expense was principally due to our growth and expansion efforts in Los Angeles, Ventura and Santa Barbara Counties. As part of these growth efforts, we hired new teams of bankers to lead our expansion into the southern portion of California’s Central Coast markets. We hired a six person team to form our new Commercial Banking Center location in Oxnard, California. The Oxnard Commercial Banking Center represents an important and strategic expansion for the Bank into the Ventura County and Santa Barbara County markets. We also hired a new team of bankers to continue to build out our downtown Los Angeles Commercial Banking Center with the objective of expanding our business activities. Acquisition related costs for CCB in 2015 were $475,000, compared to acquisition related costs of $2.0 million for American Security Bank (“ASB”) in 2014. Noninterest expense for 2015 also included a $500,000 recapture of provision for unfunded loan commitments, compared to $1.3 million for 2014.
Income Taxes
The Company’s effective tax rate for 2016 was 37.50%, compared to 34.50% for 2015 and 36.10% for 2014. Our estimated annual effective tax rate varies depending upon tax-advantaged income as well as available tax credits.
The effective tax rates are below the nominal combined Federal and State tax rate as a result of tax-advantaged income from certain municipal security investments and municipal loans and leases as a percentage of total income as well as available tax credits for each period.
We have two reportable business segments: (i) Business Financial and Commercial Banking Centers (“Centers”) and (ii) Dairy & Livestock and Agribusiness. All other operations have been aggregated in “Other”. Our Centers and Dairy & Livestock and Agribusiness are the focal points for customer sales and services and the primary focus of management of the Company. In 2016, Dairy & Livestock and Agribusiness was reflected as our second reportable segment. All other operating departments have been aggregated and included in the “Other” category for reporting purposes. Recapture of provision for loan losses was allocated by segment based on loan type in 2016. Prior period information has been conformed to the current presentation. In addition, the Company allocates internal funds to the segments using a methodology that charges users of funds interest expense and credits providers of funds interest income with the net effect of this allocation being recorded in the “Other” category. Taxes are not included in the segments as this is accounted for at the corporate level. The results of these two segments are included in the reconciliation between business segment totals and our consolidated total. Refer to Note 3 — Summary of Significant Accounting Policies and Note 21 — Business Segments of the consolidated financial statements.
Key measures we use to evaluate the segments’ performance are included in the following table for the years ended December 31, 2016, 2015 and 2014. These tables also provide additional significant segment measures useful to understanding the performance of these segments.
49
Table of Contents
Business Financial and Commercial Banking Centers
| For the Year Ended December 31, | ||||||||||||
| 2016 | 2015 | 2014 | ||||||||||
| Key Measures: | (Dollars in thousands) | |||||||||||
| Statement of Operations |
||||||||||||
| Net interest income |
$ | 178,183 | $ | 167,633 | $ | 159,932 | ||||||
| Recapture of provision for loan losses |
(172 | ) | (6,711 | ) | (9,204 | ) | ||||||
| Noninterest income |
20,179 | 20,677 | 20,513 | |||||||||
| Noninterest expense |
50,110 | 48,568 | 47,493 | |||||||||
|
|
|
|
|
|
|
|||||||
| Segment pre-tax profit |
$ | 148,424 | $ | 146,453 | $ | 142,156 | ||||||
|
|
|
|
|
|
|
|||||||
| Balance Sheet |
||||||||||||
| Average loans |
$ | 3,377,639 | $ | 3,001,503 | $ | 2,851,809 | ||||||
| Average interest-bearing deposits and customer repurchase agreements |
$ | 3,203,070 | $ | 3,080,142 | $ | 2,964,404 | ||||||
| Yield on loans (1) |
4.55 | % | 4.78 | % | 4.88 | % | ||||||
| Rate paid on interest-bearing deposits and customer repurchases |
0.22 | % | 0.21 | % | 0.22 | % | ||||||
| (1) | Yield on loans excludes PCI discount accretion, and is accounted for at the corporate level. |
For the year ended December 31, 2016, the Centers’ segment pre-tax profit increased by $2.0 million, or 1.35%, primarily due to an increase in interest income of $12.0 million, or 6.73%, compared to 2015. The $12.0 million increase in interest income for 2016 was principally due to a $376.1 million increase in average loans offset by a 23 basis point drop in the loan yield to 4.55% for 2016, compared to 4.78% for 2015. The market for new loans continued to remain competitive. The increase in interest income was offset by a $1.5 million increase in noninterest expense for 2016 compared to 2015, principally due to additional compensation related costs resulting from the acquisition of CCB, the opening of our Santa Barbara commercial banking center in January 2016, and other strategic new hires. In addition, 2016 included a loan loss provision recapture of $172,000 for 2016, compared to a $6.7 million loan loss provision recapture for 2015.
For the year ended December 31, 2015, the Centers’ segment pre-tax profit increased by $4.3 million, or 3.02%, primarily due to an increase in interest income of $8.2 million, or 4.82%, compared to 2014. The $8.2 million increase in interest income for 2015 was principally due to a $149.7 million increase in average loans offset by a 10 basis point drop in the loan yield to 4.78% for 2015, compared to 4.88% for 2014. The increase in interest income was offset by a $1.1 million increase in noninterest expense for 2015 compared to 2014, principally due to additional compensation related costs resulting from our growth and expansion efforts in Los Angeles, Ventura and Santa Barbara Counties. In addition, 2016 included a loan loss provision recapture of $6.7 million for 2015, compared to a $9.2 million loan loss provision recapture for 2014.
50
Table of Contents
Dairy & Livestock and Agribusiness
| For the Year Ended December 31, | ||||||||||||
| 2016 | 2015 | 2014 | ||||||||||
| Key Measures: | (Dollars in thousands) | |||||||||||
| Statement of Operations |
||||||||||||
| Net interest income |
$ | 7,973 | $ | 7,558 | $ | 6,500 | ||||||
| (Recapture of) provision for loan losses |
2,296 | 143 | (5,680 | ) | ||||||||
| Noninterest income |
223 | 261 | 281 | |||||||||
| Noninterest expense |
1,958 | 1,844 | 1,757 | |||||||||
|
|
|
|
|
|
|
|||||||
| Segment pre-tax profit |
$ | 3,942 | $ | 5,832 | $ | 10,704 | ||||||
|
|
|
|
|
|
|
|||||||
| Balance Sheet |
||||||||||||
| Average loans |
$ | 428,864 | $ | 370,582 | $ | 351,940 | ||||||
| Average interest-bearing deposits and customer |
$ | 23,606 | $ | 25,895 | $ | 10,540 | ||||||
| Yield on loans (1) |
3.46 | % | 3.53 | % | 3.63 | % | ||||||
| Rate paid on interest-bearing deposits and customer repurchases |
0.15 | % | 0.18 | % | 0.14 | % | ||||||
For the year ended December 31, 2016, the dairy & livestock and agribusiness segment pre-tax profit decreased by $1.9 million, or 32.41%, primarily due to an increase in the loan loss provision of $2.2 million for 2016, compared to 2015.
For the year ended December 31, 2015, the dairy & livestock and agribusiness segment pre-tax profit decreased by $4.9 million, or 45.52%, primarily due to a loan loss provision of $143,000 for 2015, compared to a $5.7 million loan loss provision recapture for 2014.
Other
| For the Year Ended December 31, | ||||||||||||
| 2016 | 2015 | 2014 | ||||||||||
| Key Measures: |
(Dollars in thousands) | |||||||||||
| Statement of Operations |
||||||||||||
| Net interest income (1) |
$ | 70,918 | $ | 77,751 | $ | 70,082 | ||||||
| (Recapture of) provision for loan losses |
(8,524 | ) | 968 | (1,216 | ) | |||||||
| Noninterest income |
15,150 | 12,545 | 15,618 | |||||||||
| Noninterest expense |
84,656 | 76,377 | 76,979 | |||||||||
| Debt termination expense |
16 | 13,870 | - | |||||||||
|
|
|
|
|
|
|
|||||||
| Segment pre-tax profit (loss) |
$ | 9,920 | $ | (919 | ) | $ | 9,937 | |||||
|
|
|
|
|
|
|
|||||||
| Balance Sheet |
||||||||||||
| Average investments |
$ | 3,051,618 | $ | 3,096,488 | $ | 2,921,721 | ||||||
| Average loans |
$ | 388,626 | $ | 410,048 | $ | 394,971 | ||||||
| Average interest-bearing deposits |
$ | 174,986 | $ | 279,918 | $ | 258,535 | ||||||
| Average borrowings |
$ | 28,806 | $ | 55,565 | $ | 226,539 | ||||||
| Yield on investments -TE |
2.42 | % | 2.55 | % | 2.61 | % | ||||||
| Non-tax equivalent yield |
2.24 | % | 2.38 | % | 2.35 | % | ||||||
| Yield on loans |
6.26 | % | 7.07 | % | 7.54 | % | ||||||
| Average cost of borrowings |
1.91 | % | 3.27 | % | 4.29 | % | ||||||
| (1) | Includes the elimination of certain items that are included in more than one department, most of which represents products and services for Centers’ customers. |
51
Table of Contents
For the year ended December 31, 2016, the Company’s other operating departments, including treasury and administration, reported a pre-tax profit of $9.9 million, compared to a pre-tax loss of $919,000 for 2015. This $10.8 million increase in pre-tax profit was primarily due to $13.9 million in debt termination expense as a result of the redemption of $200.0 million of fixed rate debt from the FHLB on February 23, 2015. In addition, 2016 included a loan loss provision recapture of $8.5 million for 2016, compared to a $968,000 loan loss provision for 2015. Net interest income decreased $6.8 million as a result of a $44.9 million decrease in average investments and a 14 basis point drop in non-tax equivalent yield on investments. The yield on loans also decreased 81 basis points from 2015. The overall decrease in net interest income was partially offset by a decrease of $1.4 million in interest expense due to the redemption of fixed rate debt from the FHLB in the first quarter of 2015. The $8.3 million increase in noninterest expense in 2016 included $4.1 million in nonrecurring expenses resulting from a fair value adjustment of $2.6 million for our operations center, and a $1.5 million accrual for the settlement of a wage-hour class action lawsuit. Acquisition expenses of $1.9 million in 2016 were due to the CCB acquisition and pending Valley Business Bank acquisition.
For the year ended December 31, 2015, the Company’s other operating departments, reported a pre-tax loss of $919,000, compared to a pre-tax profit of $9.9 million for 2014. This $10.9 million decrease in pre-tax profit was primarily due to $13.9 million in debt termination expense as a result of the redemption of $200.0 million of fixed rate debt from the FHLB on February 23, 2015, offset by an $8.0 million decline in interest expense due to the redemption of the FHLB fixed rate debt in the first quarter of 2015. In addition, 2015 included a loan loss provision of $968,000, compared to a $1.2 million loan loss provision recapture for 2014. Net interest income for 2015 was positively impacted as a result of one non-performing commercial real estate loan that was paid in full resulting in a $2.8 million increase to interest income. Average loans increased by $15.1 million, but the positive contributions to interest income was partially offset by a 47 basis point drop in the loan yield for 2015, compared to 2014. Noninterest income for 2015 decreased $3.1 million primarily due to a $5.3 million decrease in gain on sale of loans, offset by an increase of $2.7 million related to the FDIC loss sharing asset (a net decrease in the FDIC loss sharing asset of $902,000 for 2015, compared to $3.6 million for 2014).
ANALYSIS OF FINANCIAL CONDITION
The Company reported total assets of $8.07 billion at December 31, 2016. This represented an increase of $402.5 million, or 5.25%, from total assets of $7.67 billion at December 31, 2015. Interest-earning assets totaled $7.64 billion at December 31, 2016, an increase of $354.8 million, or 4.87%, when compared with interest-earning assets of $7.29 billion at December 31, 2015. The increase in interest-earning assets was primarily due to a $378.1 million increase in total loans and a $15.2 million increase in interest-earning balances due from depository institutions. This was partially offset by a $37.5 million decrease in total investment securities. Total liabilities were $7.08 billion at December 31, 2016, an increase of $335.0 million, or 4.97%, from total liabilities of $6.75 billion at December 31, 2015. Total equity increased $67.5 million, or 7.31%, to $990.9 million at December 31, 2016, compared to total equity of $923.4 million at December 31, 2015.
52
Table of Contents
Investment Securities
The Company maintains a portfolio of investment securities to provide interest income and to serve as a source of liquidity for its ongoing operations. At December 31, 2016, we reported total investment securities of $3.18 billion. This represented a decrease of $37.5 million, or 1.16%, from total investment securities of $3.22 billion at December 31, 2015. During the third quarter of 2015, we transferred investment securities from our AFS security portfolio to HTM. Transfers of securities into the held-to-maturity category from the available-for-sale category are transferred at fair value at the date of transfer. The fair value of these securities at the date of transfer was $898.6 million. The unrealized holding gain or loss at the date of transfer is retained in accumulated other comprehensive income and in the carrying value of the held-to-maturity securities. The net unrealized holding gain at the date of transfer was $3.9 million after-tax and will continue to be reported in AOCI and amortized over the remaining life of the securities as a yield adjustment. At December 31, 2016, investment securities HTM totaled $911.7 million. The after-tax unrealized gain reported in AOCI on investment securities HTM was $1.7 million at December 31, 2016. At December 31, 2016, our investment securities AFS totaled $2.27 billion, inclusive of a pre-tax unrealized gain of $14.6 million. The after-tax unrealized gain reported in AOCI on investment securities AFS was $8.5 million.
As of December 31, 2016, the Company had a pre-tax net unrealized holding gain on total investment securities of $16.3 million, compared to a pre-tax net unrealized holding gain of $33.9 million at December 31, 2015. The changes in the net unrealized holding gain resulted primarily from fluctuations in market interest rates. For 2016, total repayments/maturities and proceeds from sales of investment securities totaled $827.6 million. The Company purchased additional investment securities totaling $808.0 million and $694.6 million for 2016 and 2015, respectively. We sold two investment securities with a recognized gain of $548,000 in 2016. This compares to one investment security sold in 2015 with a recognized loss of approximately $22,000. No investment securities were sold in 2014.
The table below summarizes the fair value of AFS investment securities for the periods presented.
| December 31, | ||||||||||||||||||||||||
| 2016 | 2015 | 2014 | ||||||||||||||||||||||
| Fair Value | Percent | Fair Value | Percent | Fair Value | Percent | |||||||||||||||||||
| (Dollars in thousands) | ||||||||||||||||||||||||
| Investment securities available-for-sale |
||||||||||||||||||||||||
| Government agency/GSE |
$ | 2,752 | 0.12 | % | $ | 5,745 | 0.24 | % | $ | 330,843 | 10.55 | % | ||||||||||||
| Residential mortgage-backed securities |
1,834,748 | 80.81 | % | 1,813,097 | 76.55 | % | 1,917,496 | 61.12 | % | |||||||||||||||
| CMO/REMIC - residential |
347,189 | 15.29 | % | 383,781 | 16.20 | % | 304,091 | 9.69 | % | |||||||||||||||
| Municipal bonds |
80,071 | 3.53 | % | 160,973 | 6.80 | % | 579,641 | 18.48 | % | |||||||||||||||
| Other securities |
5,706 | 0.25 | % | 5,050 | 0.21 | % | 5,087 | 0.16 | % | |||||||||||||||
|
|
|
|
|
|
|
|
|
|
|
|
|
|||||||||||||
| Total available-for-sale securities |
$ | 2,270,466 | 100.00 | % | $ | 2,368,646 | 100.00 | % | $ | 3,137,158 | 100.00 | % | ||||||||||||
|
|
|
|
|
|
|
|
|
|
|
|
|
|||||||||||||
53
Table of Contents
The table below set forth the carrying value of HTM investment securities for the periods presented.
| December 31, | ||||||||||||||||||||||||
| 2016 | 2015 | 2014 | ||||||||||||||||||||||
| Amortized Cost |
Percent | Amortized Cost |
Percent | Amortized Cost |
Percent | |||||||||||||||||||
| (Dollars in thousands) | ||||||||||||||||||||||||
| Investment securities held-to-maturity |
||||||||||||||||||||||||
| Government agency/GSE |
$ | 182,648 | 20.03 | % | $ | 293,338 | 34.47 | % | $ | - | - | |||||||||||||
| Residential mortgage-backed securities |
193,699 | 21.25 | % | 232,053 | 27.27 | % | - | - | ||||||||||||||||
| CMO |
244,419 | 26.81 | % | 1,284 | 0.15 | % | 1,528 | 100.00 | % | |||||||||||||||
| Municipal bonds |
290,910 | 31.91 | % | 324,314 | 38.11 | % | - | - | ||||||||||||||||
|
|
|
|
|
|
|
|
|
|
|
|
|
|||||||||||||
| Total held-to-maturity securities |
$ | 911,676 | 100.00 | % | $ | 850,989 | 100.00 | % | $ | 1,528 | 100.00 | % | ||||||||||||
|
|
|
|
|
|
|
|
|
|
|
|
|
|||||||||||||
| Fair Value |
$ | 897,374 | $ | 853,039 | $ | 2,177 | ||||||||||||||||||
|
|
|
|
|
|
|
|||||||||||||||||||
The maturity distribution of the AFS portfolio consists of the following for the period presented.
| December 31, 2016 | ||||||||||||||||||||||||
| One Year or Less |
After One Year Through Five Years |
After Five Years Through Ten Years |
After Ten Years |
Total | Percent to Total |
|||||||||||||||||||
| (Dollars in thousands) | ||||||||||||||||||||||||
| Investment securities available-for-sale: |
||||||||||||||||||||||||
| Government agency/GSE |
$ | 2,752 | $ | - | $ | - | $ | - | $ | 2,752 | 0.12 | % | ||||||||||||
| Residential mortgage-backed securities |
2,691 | 1,773,933 | 33,147 | 24,977 | 1,834,748 | 80.81 | % | |||||||||||||||||
| CMO/REMIC - residential |
97 | 181,063 | 47,809 | 118,220 | 347,189 | 15.29 | % | |||||||||||||||||
| Municipal bonds (1) |
10,958 | 31,175 | 7,951 | 29,987 | 80,071 | 3.53 | % | |||||||||||||||||
| Other securities |
506 | - | - | 5,200 | 5,706 | 0.25 | % | |||||||||||||||||
|
|
|
|
|
|
|
|
|
|
|
|
|
|||||||||||||
| Total |
$ | 17,004 | $ | 1,986,171 | $ | 88,907 | $ | 178,384 | $ | 2,270,466 | 100.00 | % | ||||||||||||
|
|
|
|
|
|
|
|
|
|
|
|
|
|||||||||||||
| Weighted average yield: |
||||||||||||||||||||||||
| Government agency/GSE |
0.95 | % | - | - | - | 0.95 | % | |||||||||||||||||
| Residential mortgage-backed securities |
5.05 | % | 2.39 | % | 2.35 | % | 2.72 | % | 2.40 | % | ||||||||||||||
| CMO/REMIC - residential |
3.07 | % | 1.33 | % | 2.36 | % | 2.67 | % | 1.92 | % | ||||||||||||||
| Municipal bonds (1) |
2.13 | % | 3.42 | % | 3.95 | % | 2.70 | % | 3.02 | % | ||||||||||||||
| Other securities |
- | - | - | 6.19 | % | 5.62 | % | |||||||||||||||||
| Total |
2.33 | % | 2.31 | % | 2.50 | % | 2.78 | % | 2.35 | % | ||||||||||||||
| (1) | The weighted average yield for the portfolio is not tax-equivalent. The tax equivalent yield at December 31, 2016 was 4.65%. |
54
Table of Contents
The maturity distribution of the HTM portfolio consists of the following for the period presented.
| December 31, 2016 | ||||||||||||||||||||||||
| One Year or Less |
After One Year Through Five Years |
After Five Years Through Ten Years |
After Ten Years |
Total | Percent to Total |
|||||||||||||||||||
| (Dollars in thousands) | ||||||||||||||||||||||||
| Investment securities held-to-maturity: |
||||||||||||||||||||||||
| Government agency/GSE |
$ | - | $ | 424 | $ | - | $ | 182,224 | $ | 182,648 | 20.03 | % | ||||||||||||
| Residential mortgage-backed securities |
- | 188,741 | - | 4,958 | 193,699 | 21.25 | % | |||||||||||||||||
| CMO |
- | 154,961 | 89,458 | - | 244,419 | 26.81 | % | |||||||||||||||||
| Municipal bonds (1) |
- | 11,137 | 111,112 | 168,661 | 290,910 | 31.91 | % | |||||||||||||||||
| Other securities |
- | - | - | - | - | - | ||||||||||||||||||
|
|
|
|
|
|
|
|
|
|
|
|
|
|||||||||||||
| Total |
$ | - | $ | 355,263 | $ | 200,570 | $ | 355,843 | $ | 911,676 | 100.00 | % | ||||||||||||
|
|
|
|
|
|
|
|
|
|
|
|
|
|||||||||||||
| Weighted average yield: |
||||||||||||||||||||||||
| Government agency/GSE |
- | 1.36 | % | - | 1.89 | % | 1.89 | % | ||||||||||||||||
| Residential mortgage-backed securities |
- | 2.28 | % | - | 2.91 | % | 2.30 | % | ||||||||||||||||
| CMO |
- | 2.05 | % | 2.08 | % | - | 2.06 | % | ||||||||||||||||
| Municipal bonds (1) |
- | 3.40 | % | 3.40 | % | 3.09 | % | 3.22 | % | |||||||||||||||
| Other securities |
- | - | - | - | - | |||||||||||||||||||
| Total |
- | 2.21 | % | 2.81 | % | 2.47 | % | 2.45 | % | |||||||||||||||
| (1) | The weighted average yield for the portfolio is not tax-equivalent. The tax equivalent yield at December 31, 2016 was 4.96%. |
The maturity of each security category is defined as the contractual maturity except for the categories of mortgage-backed securities and CMO/REMIC whose maturities are defined as the estimated average life. The final maturity of mortgage-backed securities and CMO/REMIC will differ from their contractual maturities because the underlying mortgages have the right to repay such obligations without penalty. The speed at which the underlying mortgages repay is influenced by many factors, one of which is interest rates. Mortgages tend to repay faster as interest rates fall and slower as interest rate rise. This will either shorten or extend the estimated average life. Also, the yield on mortgage-backed securities and CMO/REMIC are affected by the speed at which the underlying mortgages repay. This is caused by the change in the amount of amortization of premiums or accretion of discounts of each security as repayments increase or decrease. The Company obtains the estimated average life of each security from independent third parties.
The weighted-average yield on the total investment portfolio at December 31, 2016 was 2.38% with a weighted-average life of 4.5 years. This compares to a weighted-average yield of 2.55% at December 31, 2015 with a weighted-average life of 4.1 years. The weighted average life is the average number of years that each dollar of unpaid principal due remains outstanding. Average life is computed as the weighted-average time to the receipt of all future cash flows, using as the weights the dollar amounts of the principal pay-downs.
Approximately 88% of the securities in the total investment portfolio, at December 31, 2016, are issued by the U.S. government or U.S. government-sponsored agencies and enterprises, which have the implied guarantee of payment of principal and interest. As of December 31, 2016, approximately $114.1 million in U.S. government agency bonds are callable.
The Agency CMO/REMIC are backed by agency-pooled collateral. All non-agency AFS CMO/REMIC issues held are rated investment grade or better by either Standard & Poor’s or Moody’s, as of December 31, 2016 and 2015. We had three nonagency AFS CMO/REMIC securities with a carrying value of $84,000 and $183,000 at December 31, 2016 and 2015, respectively.
55
Table of Contents
The Company held investment securities in excess of 10% of shareholders’ equity from the following issuers for the periods presented.
| December 31, 2016 | December 31, 2015 | |||||||||||||||
| Book Value | Market Value | Book Value | Market Value | |||||||||||||
| Major issuer: | (Dollars in thousands) | |||||||||||||||
| Federal National Mortgage Association |
$ | 1,282,274 | $ | 1,291,769 | $ | 1,541,033 | $ | 1,556,388 | ||||||||
| Federal Home Loan Mortgage Corporation |
1,036,363 | 1,039,163 | 906,942 | 916,403 | ||||||||||||
| Government National Mortgage Association |
289,054 | 282,516 | 50,910 | 52,135 | ||||||||||||
| Small Business Administration |
182,224 | 180,613 | 153,638 | 154,538 | ||||||||||||
Municipal securities held by the Company are issued by various states and their various local municipalities. The following tables present municipal securities by the top holdings by state for the periods presented.
| December 31, 2016 | ||||||||||||||||
| Amortized Cost |
Percent of Total |
Fair Value | Percent of Total |
|||||||||||||
| (Dollars in thousands) | ||||||||||||||||
| Municipal Securities available-for-sale: |
||||||||||||||||
| California |
$ | 13,449 | 16.8 | % | $ | 13,681 | 17.1 | % | ||||||||
| Minnesota |
11,100 | 13.9 | % | 10,690 | 13.4 | % | ||||||||||
| Iowa |
8,620 | 10.8 | % | 8,800 | 11.0 | % | ||||||||||
| Arizona |
7,033 | 8.8 | % | 7,132 | 8.9 | % | ||||||||||
| Connecticut |
6,979 | 8.7 | % | 6,896 | 8.6 | % | ||||||||||
| Massachusetts |
5,979 | 7.5 | % | 5,770 | 7.2 | % | ||||||||||
| All other states (10 states) |
26,977 | 33.5 | % | 27,102 | 33.8 | % | ||||||||||
|
|
|
|
|
|
|
|
|
|||||||||
| Total |
$ | 80,137 | 100.0 | % | $ | 80,071 | 100.0 | % | ||||||||
|
|
|
|
|
|
|
|
|
|||||||||
| Municipal Securities held-to-maturity: |
||||||||||||||||
| Minnesota |
$ | 68,913 | 23.7 | % | $ | 67,651 | 23.6 | % | ||||||||
| Texas |
32,607 | 11.2 | % | 32,051 | 11.2 | % | ||||||||||
| Massachusetts |
18,645 | 6.4 | % | 18,247 | 6.4 | % | ||||||||||
| Pennsylvania |
17,506 | 6.0 | % | 17,576 | 6.1 | % | ||||||||||
| New York |
16,811 | 5.8 | % | 16,738 | 5.8 | % | ||||||||||
| Ohio |
16,400 | 5.6 | % | 16,325 | 5.7 | % | ||||||||||
| All other states (21 states) |
120,028 | 41.3 | % | 118,330 | 41.2 | % | ||||||||||
|
|
|
|
|
|
|
|
|
|||||||||
| Total |
$ | 290,910 | 100.0 | % | $ | 286,918 | 100.0 | % | ||||||||
|
|
|
|
|
|
|
|
|
|||||||||
56
Table of Contents
| December 31, 2015 | ||||||||||||||||
| Amortized Cost |
Percent of Total |
Fair Value | Percent of Total |
|||||||||||||
| (Dollars in thousands) | ||||||||||||||||
| Municipal Securities available-for-sale: |
||||||||||||||||
| New Jersey |
$ | 25,458 | 16.1 | % | $ | 25,919 | 16.1 | % | ||||||||
| Washington |
18,847 | 11.9 | % | 19,219 | 12.0 | % | ||||||||||
| Michigan |
17,580 | 11.1 | % | 17,765 | 11.0 | % | ||||||||||
| Missouri |
14,937 | 9.5 | % | 15,012 | 9.3 | % | ||||||||||
| California |
13,838 | 8.8 | % | 14,059 | 8.7 | % | ||||||||||
| Illinois |
10,266 | 6.5 | % | 10,402 | 6.5 | % | ||||||||||
| All other states (11 states) |
57,014 | 36.1 | % | 58,597 | 36.4 | % | ||||||||||
|
|
|
|
|
|
|
|
|
|||||||||
| Total |
$ | 157,940 | 100.0 | % | $ | 160,973 | 100.0 | % | ||||||||
|
|
|
|
|
|
|
|
|
|||||||||
| Municipal Securities held-to-maturity: |
||||||||||||||||
| Minnesota |
$ | 60,617 | 18.7 | % | $ | 61,530 | 18.8 | % | ||||||||
| Michigan |
38,496 | 11.9 | % | 38,303 | 11.7 | % | ||||||||||
| Texas |
37,160 | 11.5 | % | 37,557 | 11.5 | % | ||||||||||
| Ohio |
23,028 | 7.1 | % | 23,016 | 7.1 | % | ||||||||||
| New Jersey |
21,202 | 6.5 | % | 21,184 | 6.5 | % | ||||||||||
| Pennsylvania |
17,500 | 5.4 | % | 17,739 | 5.4 | % | ||||||||||
| All other states (21 states) |
126,311 | 38.9 | % | 127,317 | 39.0 | % | ||||||||||
|
|
|
|
|
|
|
|
|
|||||||||
| Total |
$ | 324,314 | 100.0 | % | $ | 326,646 | 100.0 | % | ||||||||
|
|
|
|
|
|
|
|
|
|||||||||
57
Table of Contents
The tables below show the Company’s investment securities’ gross unrealized losses and fair value by investment category and length of time that individual securities have been in a continuous unrealized loss position, at December 31, 2016 and 2015. The unrealized losses on these securities were primarily attributed to changes in interest rates. The issuers of these securities have not, to our knowledge, evidenced any cause for default on these securities. These securities have fluctuated in value since their purchase dates as market rates have fluctuated. However, we have the ability and the intention to hold these securities until their fair values recover to cost or maturity. As such, management does not deem these securities to be other-than-temporarily-impaired (“OTTI”). A summary of our analysis of these securities and the unrealized losses is described more fully in Note 5 — Investment Securities of the notes to the consolidated financial statements. Economic trends may adversely affect the value of the portfolio of investment securities that we hold.
| December 31, 2016 | ||||||||||||||||||||||||
| Less Than 12 Months | 12 Months or Longer | Total | ||||||||||||||||||||||
| Fair Value | Gross Unrealized Holding Losses |
Fair Value | Gross Unrealized Holding Losses |
Fair Value | Gross Unrealized Holding Losses |
|||||||||||||||||||
| (Dollars in thousands) | ||||||||||||||||||||||||
| Investment securities available-for-sale: |
||||||||||||||||||||||||
| Government agency/GSE |
$ | - | $ | - | $ | - | $ | - | $ | - | $ | - | ||||||||||||
| Residential mortgage-backed securities |
583,143 | (6,232 | ) | - | - | 583,143 | (6,232 | ) | ||||||||||||||||
| CMO/REMIC - residential |
128,595 | (1,485 | ) | - | - | 128,595 | (1,485 | ) | ||||||||||||||||
| Municipal bonds |
23,255 | (954 | ) | 5,981 | (1 | ) | 29,236 | (955 | ) | |||||||||||||||
| Other securities |
- | - | - | - | - | - | ||||||||||||||||||
|
|
|
|
|
|
|
|
|
|
|
|
|
|||||||||||||
| Total available-for-sale securities |
$ | 734,993 | $ | (8,671 | ) | $ | 5,981 | $ | (1 | ) | $ | 740,974 | $ | (8,672 | ) | |||||||||
|
|
|
|
|
|
|
|
|
|
|
|
|
|||||||||||||
| Investment securities held-to-maturity: |
||||||||||||||||||||||||
| Government agency/GSE |
$ | 76,854 | $ | (1,972 | ) | $ | - | $ | - | $ | 76,854 | $ | (1,972 | ) | ||||||||||
| Residential mortgage-backed securities |
191,807 | (1,892 | ) | - | - | 191,807 | (1,892 | ) | ||||||||||||||||
| CMO |
237,611 | (6,808 | ) | - | - | 237,611 | (6,808 | ) | ||||||||||||||||
| Municipal bonds |
145,804 | (3,711 | ) | 36,971 | (1,057 | ) | 182,775 | (4,768 | ) | |||||||||||||||
|
|
|
|
|
|
|
|
|
|
|
|
|
|||||||||||||
| Total held-to-maturity securities |
$ | 652,076 | $ | (14,383) | $ | 36,971 | $ | (1,057) | $ | 689,047 | $ | (15,440) | ||||||||||||
|
|
|
|
|
|
|
|
|
|
|
|
|
|||||||||||||
58
Table of Contents
| December 31, 2015 | ||||||||||||||||||||||||
| Less Than 12 Months | 12 Months or Longer | Total | ||||||||||||||||||||||
| Fair Value | Gross Unrealized Holding Losses |
Fair Value | Gross Unrealized Holding Losses |
Fair Value | Gross Unrealized Holding Losses |
|||||||||||||||||||
| (Dollars in thousands) | ||||||||||||||||||||||||
| Investment securities available-for-sale: |
||||||||||||||||||||||||
| Government agency/GSE |
$ | 5,745 | $ | (7 | ) | $ | - | $ | - | $ | 5,745 | $ | (7 | ) | ||||||||||
| Residential mortgage-backed securities |
437,699 | (1,761 | ) | - | - | 437,699 | (1,761 | ) | ||||||||||||||||
| CMO/REMIC - residential |
171,923 | (1,074 | ) | - | - | 171,923 | (1,074 | ) | ||||||||||||||||
| Municipal bonds |
398 | (2 | ) | 5,961 | (1 | ) | 6,359 | (3 | ) | |||||||||||||||
| Other securities |
- | - | - | - | - | - | ||||||||||||||||||
|
|
|
|
|
|
|
|
|
|
|
|
|
|||||||||||||
| Total available-for-sale securities |
$ | 615,765 | $ | (2,844 | ) | $ | 5,961 | $ | (1 | ) | $ | 621,726 | $ | (2,845 | ) | |||||||||
|
|
|
|
|
|
|
|
|
|
|
|
|
|||||||||||||
| Investment securities held-to-maturity: |
||||||||||||||||||||||||
| Government agency/GSE |
$ | 84,495 | $ | (734 | ) | $ | - | $ | - | $ | 84,495 | $ | (734 | ) | ||||||||||
| Residential mortgage-backed securities |
230,760 | (1,293 | ) | - | - | 230,760 | (1,293 | ) | ||||||||||||||||
| CMO |
- | - | - | - | - | - | ||||||||||||||||||
| Municipal bonds |
110,119 | (719 | ) | - | - | 110,119 | (719 | ) | ||||||||||||||||
|
|
|
|
|
|
|
|
|
|
|
|
|
|||||||||||||
| Total held-to-maturity securities |
$ | 425,374 | $ | (2,746) | $ | - | $ | - | $ | 425,374 | $ | (2,746) | ||||||||||||
|
|
|
|
|
|
|
|
|
|
|
|
|
|||||||||||||
As of December 31, 2015, the Company had one OTTI HTM security with a net carrying value of $1.3 million. This security sold for a net gain of $546,000 in 2016. The Company did not record any charges for other-than-temporary impairment losses for the years ended December 31, 2016 and 2015.
Loans
Total loans and leases, net of deferred fees and discounts, of $4.40 billion at December 31, 2016, increased by $378.1 million, or 9.41%, from $4.02 billion at December 31, 2015. The increase in total loans included $143.2 million of loans acquired from CCB during the first quarter of 2016. The $378.1 million increase in total loans was principally due to increases of approximately $272.8 million in commercial real estate loans, $45.8 million in commercial and industrial loans, $32.9 million in dairy & livestock and agribusiness loans, $17.3 million in construction loans, $16.8 million in SFR mortgage loans, and $8.0 million in consumer loans. SBA loans decreased by $9.7 million.
59
Table of Contents
Total loans, net of deferred loan fees, comprise 57.49% of our total earning assets as of December 31, 2016. The following table presents our loan portfolio, excluding PCI and held-for-sale loans, by type for the periods presented.
Distribution of Loan Portfolio by Type
| December 31, | ||||||||||||||||||||
| 2016 | 2015 | 2014 | 2013 | 2012 | ||||||||||||||||
| (Dollars in thousands) | ||||||||||||||||||||
| Commercial and industrial |
$ | 485,078 | $ | 434,099 | $ | 390,011 | $ | 376,800 | $ | 391,664 | ||||||||||
| SBA |
97,184 | 106,867 | 134,265 | 135,992 | 155,758 | |||||||||||||||
| Real estate: |
||||||||||||||||||||
| Commercial real estate |
2,930,141 | 2,643,184 | 2,487,803 | 2,207,515 | 1,990,107 | |||||||||||||||
| Construction |
85,879 | 68,563 | 55,173 | 47,109 | 59,721 | |||||||||||||||
| SFR mortgage |
250,605 | 233,754 | 205,124 | 189,233 | 159,288 | |||||||||||||||
| Dairy & livestock and agribusiness |
338,631 | 305,509 | 279,173 | 294,292 | 336,660 | |||||||||||||||
| Municipal lease finance receivables |
64,639 | 74,135 | 77,834 | 89,106 | 105,767 | |||||||||||||||
| Consumer and other loans |
78,274 | 69,278 | 69,884 | 55,103 | 60,273 | |||||||||||||||
|
|
|
|
|
|
|
|
|
|
|
|||||||||||
| Gross loans, excluding PCI loans |
4,330,431 | 3,935,389 | 3,699,267 | 3,395,150 | 3,259,238 | |||||||||||||||
| Less: Deferred loan fees, net |
(6,952 | ) | (8,292 | ) | (8,567 | ) | (9,234 | ) | (6,925 | ) | ||||||||||
|
|
|
|
|
|
|
|
|
|
|
|||||||||||
| Gross loans, excluding PCI loans, net of deferred loan fees |
4,323,479 | 3,927,097 | 3,690,700 | 3,385,916 | 3,252,313 | |||||||||||||||
| Less: Allowance for loan losses |
(60,321 | ) | (59,156 | ) | (59,825 | ) | (75,235 | ) | (92,441 | ) | ||||||||||
|
|
|
|
|
|
|
|
|
|
|
|||||||||||
| Net loans, excluding PCI loans |
4,263,158 | 3,867,941 | 3,630,875 | 3,310,681 | 3,159,872 | |||||||||||||||
|
|
|
|
|
|
|
|
|
|
|
|||||||||||
| PCI Loans |
73,093 | 93,712 | 133,496 | 173,104 | 220,559 | |||||||||||||||
| Discount on PCI loans |
(1,508 | ) | (3,872 | ) | (7,129 | ) | (12,789 | ) | (25,344 | ) | ||||||||||
| Less: Allowance for loan losses |
(1,219 | ) | - | - | - | - | ||||||||||||||
|
|
|
|
|
|
|
|
|
|
|
|||||||||||
| PCI loans, net |
70,366 | 89,840 | 126,367 | 160,315 | 195,215 | |||||||||||||||
|
|
|
|
|
|
|
|
|
|
|
|||||||||||
| Total loans and lease finance receivables |
$ | 4,333,524 | $ | 3,957,781 | $ | 3,757,242 | $ | 3,470,996 | $ | 3,355,087 | ||||||||||
|
|
|
|
|
|
|
|
|
|
|
|||||||||||
As of December 31, 2016, $180.6 million, or 6.16% of the total commercial real estate loans included loans secured by farmland, compared to $173.0 million, or 6.54%, at December 31, 2015. The loans secured by farmland included $127.1 million for loans secured by dairy & livestock land and $53.6 million for loans secured by agricultural land at December 31, 2016, compared to $128.4 million for loans secured by dairy & livestock land and $44.6 million for loans secured by agricultural land at December 31, 2015. As of December 31, 2016, dairy & livestock and agribusiness loans of $338.6 million was comprised of $317.9 million for dairy & livestock loans and $20.7 million for agribusiness loans, compared to $287.0 million for dairy & livestock loans and $18.5 million for agribusiness loans at December 31, 2015.
PCI Loans from the SJB Acquisition
These PCI loans were acquired from SJB on October 16, 2009 and were subject to a loss sharing agreement with the FDIC. Under the terms of such loss sharing agreement, the FDIC absorbs 80% of losses and shares in 80% of loss recoveries up to $144.0 million in losses with respect to covered assets, after a first loss amount of $26.7 million. The loss sharing agreement covered 5 years for commercial loans and covers 10 years for single-family residential loans from the October 16, 2009 acquisition date and the loss recovery provisions are in effect for 8 and 10 years, respectively, for commercial and single-family residential loans from the acquisition date. The loss sharing agreement for commercial loans expired on October 16, 2014.
The PCI loan portfolio included unfunded commitments for commercial lines of credit, construction draws and other lending activity. The total commitment outstanding as of the acquisition date is included under the shared-loss agreement. As such, any additional advances up to the total commitment outstanding at the time of acquisition were covered under the loss share agreement.
60
Table of Contents
The following table presents PCI loans by type for the periods presented.
Distribution of Loan Portfolio by Type (PCI)
| December 31, | ||||||||||||||||||||
| 2016 | 2015 | 2014 | 2013 | 2012 | ||||||||||||||||
| (Dollars in thousands) | ||||||||||||||||||||
| Commercial and industrial |
$ | 2,309 | $ | 7,473 | $ | 14,605 | $ | 19,047 | $ | 24,680 | ||||||||||
| SBA |
327 | 393 | 1,110 | 1,414 | 1,469 | |||||||||||||||
| Real estate: |
||||||||||||||||||||
| Commercial real estate |
67,594 | 81,786 | 109,350 | 141,141 | 179,428 | |||||||||||||||
| Construction |
- | - | - | 644 | 1,579 | |||||||||||||||
| SFR mortgage |
178 | 193 | 205 | 313 | 1,415 | |||||||||||||||
| Dairy & livestock and agribusiness |
1,216 | 1,429 | 4,890 | 6,000 | 5,651 | |||||||||||||||
| Municipal lease finance receivables |
- | - | - | - | - | |||||||||||||||
| Consumer and other loans |
1,469 | 2,438 | 3,336 | 4,545 | 6,337 | |||||||||||||||
|
|
|
|
|
|
|
|
|
|
|
|||||||||||
| Gross PCI loans |
73,093 | 93,712 | 133,496 | 173,104 | 220,559 | |||||||||||||||
| Less: Purchase accounting discount |
(1,508 | ) | (3,872 | ) | (7,129 | ) | (12,789 | ) | (25,344 | ) | ||||||||||
|
|
|
|
|
|
|
|
|
|
|
|||||||||||
| Gross PCI loans, net of discount |
71,585 | 89,840 | 126,367 | 160,315 | 195,215 | |||||||||||||||
| Less: Allowance for PCI loan losses |
(1,219 | ) | - | - | - | - | ||||||||||||||
|
|
|
|
|
|
|
|
|
|
|
|||||||||||
| Net PCI loans |
$ | 70,366 | $ | 89,840 | $ | 126,367 | $ | 160,315 | $ | 195,215 | ||||||||||
|
|
|
|
|
|
|
|
|
|
|
|||||||||||
The excess of cash flows expected to be collected over the initial fair value of acquired loans is referred to as the accretable yield and is accreted into interest income over the estimated life of the acquired loans using the effective yield method. The accretable yield will change due to:
| • | estimate of the remaining life of acquired loans which may change the amount of future interest income; |
| • | estimate of the amount of contractually required principal and interest payments over the estimated life that will not be collected (the nonaccretable difference); and |
| • | indices for acquired loans with variable rates of interest. |
Commercial and industrial loans are loans to commercial entities to finance capital purchases or improvements, or to provide cash flow for operations. Small Business Administration (“SBA”) loans are loans, which are guaranteed in whole or in part by the SBA, to commercial entities and/or their principals to finance capital purchases or improvements, to provide cash flow for operations for both short and long term working capital needs to finance sales growth or expansion, and commercial real estate loans to acquire or refinance the entities commercial real estate. Real estate loans are loans secured by conforming trust deeds on real property, including property under construction, land development, commercial property and single-family and multi-family residences. Consumer loans include auto and equipment leases, installment loans to consumers as well as home equity loans and other loans secured by junior liens on real property. Municipal lease finance receivables are leases to municipalities. Dairy & livestock and agribusiness loans are loans to finance the operating needs of wholesale dairy farm operations, cattle feeders, livestock raisers, and farmers.
Our SBA loans are comprised of SBA 504 loans and SBA 7(a) loans. As of December 31, 2016, the Company had $16.7 million of total SBA 7(a) loans. The SBA 7(a) loans of include revolving lines of credit (SBA Express), term loans to finance long term working capital requirements, capital expenditures, and/or for the purchase or refinance of commercial real estate. SBA 7(a) loans are guaranteed by the SBA at various percentages typically ranging from 50% to 75% of the loan, depending on the type of loan and when it was granted. SBA 7(a) loans are typically granted with a variable interest rate adjusting quarterly along with the monthly payment. The SBA 7(a) term loans can provide financing for up to 100% of the project costs associated with the installation of equipment and/or commercial real estate which can exceed the value of the collateral related to the transaction. These loans also provide extended terms not provided by the Bank’s standard equipment and CRE loan programs.
61
Table of Contents
As of December 31, 2016, the Company had $80.8 million of total SBA 504 loans. SBA 504 loans include term loans to finance capital expenditures and for the purchase of commercial real estate. Initially the Bank provides two separate loans to the Borrower representing a first and second lien on the collateral. The loan with the first lien is typically at a 50% advance to the acquisition costs and the second lien loan provides the financing for 40% of the acquisition costs with the Borrower’s down payment of 10%. When the loans are funded the Bank retains the first lien loan for its term and sells the second lien loan to the SBA subordinated debenture program. A majority of the Bank’s 504 loans are granted for the purpose of commercial real estate acquisition.
Our real estate loans are comprised of industrial, office, retail, single-family residences, multi-family residences, and farmland.
Our loan portfolio is from a variety of areas throughout our marketplace. The following is the breakdown of our total held-for-investment commercial real estate loans, excluding PCI loans, by region as of December 31, 2016.
| December 31, 2016 | ||||||||||||||||
| Total Loans | Commercial Real Estate Loans |
|||||||||||||||
| (Dollars in thousands) | ||||||||||||||||
| Los Angeles County |
$ | 1,619,070 | 37.4 | % | $ | 1,112,560 | 38.0 | % | ||||||||
| Central Valley |
785,446 | 18.1 | % | 477,119 | 16.3 | % | ||||||||||
| Inland Empire |
703,627 | 16.3 | % | 590,678 | 20.1 | % | ||||||||||
| Orange County |
589,905 | 13.6 | % | 333,159 | 11.4 | % | ||||||||||
| Ventura/Santa Barbara County |
265,916 | 6.1 | % | 208,497 | 7.1 | % | ||||||||||
| Other areas (1) |
366,467 | 8.5 | % | 208,128 | 7.1 | % | ||||||||||
|
|
|
|
|
|
|
|
|
|||||||||
| $ | 4,330,431 | 100.0 | % | $ | 2,930,141 | 100.0 | % | |||||||||
|
|
|
|
|
|
|
|
|
|||||||||
| (1) | Other areas include loans that are out-of-state or in other areas of California. |
The following is the breakdown of total PCI held-for-investment commercial real estate loans by region as of December 31, 2016.
| December 31, 2016 | ||||||||||||||||
| Total PCI Loans |
Commercial Real Estate Loans |
|||||||||||||||
| (Dollars in thousands) | ||||||||||||||||
| Central Valley |
$ | 62,267 | 85.2 | % | $ | 59,983 | 88.7 | % | ||||||||
| Los Angeles County |
8,067 | 11.0 | % | 4,906 | 7.3 | % | ||||||||||
| Ventura/Santa Barbara County |
53 | 0.1 | % | - | - | |||||||||||
| Other areas (1) |
2,706 | 3.7 | % | 2,705 | 4.0 | % | ||||||||||
|
|
|
|
|
|
|
|
|
|||||||||
| $ | 73,093 | 100.0 | % | $ | 67,594 | 100.0 | % | |||||||||
|
|
|
|
|
|
|
|
|
|||||||||
| (1) | Other areas include loans that are out-of-state or in other areas of California. |
62
Table of Contents
The table below breaks down our real estate portfolio, excluding PCI loans, with the exception of construction loans which are addressed separately.
| December 31, 2016 | ||||||||||||||||
| Loan Balance |
Percent | Percent Owner- Occupied (1) |
Average Loan Balance |
|||||||||||||
| (Dollars in thousands) | ||||||||||||||||
| SFR mortgage: |
||||||||||||||||
| SFR mortgage - Direct |
$ | 208,366 | 6.5 | % | 100.0 | % | $ | 514 | ||||||||
| SFR mortgage - Mortgage pools |
42,239 | 1.3 | % | 100.0 | % | 179 | ||||||||||
|
|
|
|
|
|||||||||||||
| Total SFR mortgage |
250,605 | 7.8 | % | |||||||||||||
|
|
|
|
|
|||||||||||||
| Commercial real estate: |
||||||||||||||||
| Multi-family |
275,162 | 8.6 | % | - | 1,369 | |||||||||||
| Industrial |
867,454 | 27.3 | % | 40.4 | % | 1,183 | ||||||||||
| Office |
502,910 | 15.8 | % | 28.4 | % | 1,224 | ||||||||||
| Retail |
505,830 | 15.9 | % | 8.0 | % | 1,576 | ||||||||||
| Medical |
202,085 | 6.4 | % | 33.9 | % | 1,889 | ||||||||||
| Secured by farmland (2) |
180,636 | 5.7 | % | 100.0 | % | 2,053 | ||||||||||
| Other (3) |
396,064 | 12.5 | % | 42.2 | % | 1,390 | ||||||||||
|
|
|
|
|
|||||||||||||
| Total commercial real estate |
2,930,141 | 92.2 | % | |||||||||||||
|
|
|
|
|
|||||||||||||
| Total SFR mortgage and commercial real estate loans |
$ | 3,180,746 | 100.0 | % | 37.7 | % | 1,141 | |||||||||
|
|
|
|
|
|||||||||||||
| (1) | Represents percentage of reported owner-occupied at origination in each real estate loan category. |
| (2) | The loans secured by farmland included $127.1 million for loans secured by dairy & livestock land and $53.6 million for loans secured by agricultural land at December 31, 2016. |
| (3) | Other loans consist of a variety of loan types, none of which exceeds 2.0% of total commercial real estate loans. |
The SFR mortgage — Direct loans, excluding PCI loans, in the table above include SFR mortgage loans which are currently generated through an internal program in our Centers. This program is focused on owner-occupied SFR’s with defined loan-to-value, debt-to-income and other credit criteria, such as FICO credit scores, that we believe are appropriate for loans which are primarily intended for retention in our Bank’s loan portfolio. We originated loan volume in the aggregate principal amount of $53.0 million under this program during 2016.
In addition, we previously purchased pools of owner-occupied single-family loans from real estate lenders, SFR mortgage—Mortgage Pools, with a remaining balance totaling $42.2 million at December 31, 2016. These loans were purchased with average FICO scores predominantly ranging from 700 to over 800 and overall original loan-to-value ratios of 60% to 80%. These pools were purchased to diversify our loan portfolio. We have not purchased any mortgage pools since August 2007.
63
Table of Contents
The table below breaks down our PCI real estate portfolio with the exception of construction loans which are addressed separately.
| December 31, 2016 | ||||||||||||||||
| Loan Balance |
Percent | Percent Owner- Occupied (1) |
Average Loan Balance |
|||||||||||||
| (Dollars in thousands) | ||||||||||||||||
| SFR mortgage |
||||||||||||||||
| SFR mortgage - Direct |
$ | 178 | 0.3 | % | 100.0 | % | $ | 178 | ||||||||
| SFR mortgage - Mortgage pools |
- | - | - | - | ||||||||||||
|
|
|
|
|
|||||||||||||
| Total SFR mortgage |
178 | 0.3 | % | |||||||||||||
| Commercial real estate: |
||||||||||||||||
| Multi-family |
2,469 | 3.6 | % | - | 1,235 | |||||||||||
| Industrial |
16,629 | 24.5 | % | 31.2 | % | 665 | ||||||||||
| Office |
2,505 | 3.7 | % | 87.3 | % | 313 | ||||||||||
| Retail |
9,466 | 14.0 | % | 32.0 | % | 592 | ||||||||||
| Medical |
9,590 | 14.2 | % | 100.0 | % | 1,598 | ||||||||||
| Secured by farmland |
5,165 | 7.6 | % | 100.0 | % | 861 | ||||||||||
| Other (2) |
21,770 | 32.1 | % | 65.9 | % | 726 | ||||||||||
|
|
|
|
|
|||||||||||||
| Total commercial real estate |
67,594 | 99.7 | % | |||||||||||||
|
|
|
|
|
|||||||||||||
| Total SFR mortgage and commercial real estate loans |
$ | 67,772 | 100.0 | % | 58.6 | % | 721 | |||||||||
|
|
|
|
|
|||||||||||||
| (1) | Represents percentage of reported owner-occupied at origination in each real estate loan category. |
| (2) | Includes loans associated with hospitality, churches, gas stations, and hospitals, which represents approximately 84% of other loans. |
Construction Loans
As of December 31, 2016, the Company had $85.9 million in construction loans. This represents 1.95% of total gross loans held-for-investment. There were no PCI construction loans at December 31, 2016. Although our construction loans are located throughout our market footprint, the majority of construction loans consist of commercial land development and construction projects in Los Angeles, Orange County, and the Inland Empire region of Southern California. At December 31, 2016, construction loans consisted of $46.6 million in SFR and multi-family construction loans and $39.2 million in commercial construction loans. As of December 31, 2016 there were no nonperforming construction loans.
The table below provides the maturity distribution for held-for-investment total gross loans, including PCI loans, as of December 31, 2016. The loan amounts are based on contractual maturities although the borrowers have the ability to prepay the loans. Amounts are also classified according to repricing opportunities or rate sensitivity.
64
Table of Contents
Loan Maturities and Interest Rate Category at December 31, 2016
| Within One Year |
After One But Within Five Years |
After Five Years |
Total | |||||||||||||
| (Dollars in thousands) | ||||||||||||||||
| Types of Loans: |
||||||||||||||||
| Commercial and industrial |
$ | 176,611 | $ | 180,477 | $ | 130,299 | $ | 487,387 | ||||||||
| SBA |
1,530 | 12,510 | 83,471 | 97,511 | ||||||||||||
| Real estate: |
||||||||||||||||
| Commercial real estate |
162,621 | 580,721 | 2,254,393 | 2,997,735 | ||||||||||||
| Construction |
81,595 | 4,284 | - | 85,879 | ||||||||||||
| SFR mortgage |
313 | 5,366 | 245,104 | 250,783 | ||||||||||||
| Dairy & livestock and agribusiness |
336,337 | 2,512 | 998 | 339,847 | ||||||||||||
| Municipal lease finance receivables |
170 | 8,712 | 55,757 | 64,639 | ||||||||||||
| Consumer and other loans |
21,104 | 31,621 | 27,018 | 79,743 | ||||||||||||
|
|
|
|
|
|
|
|
|
|||||||||
| Total gross loans |
$ | 780,281 | $ | 826,203 | $ | 2,797,040 | $ | 4,403,524 | ||||||||
|
|
|
|
|
|
|
|
|
|||||||||
| Amount of Loans based upon: |
||||||||||||||||
| Fixed Rates |
$ | 131,205 | $ | 509,243 | $ | 1,361,156 | $ | 2,001,604 | ||||||||
| Floating or adjustable rates |
649,076 | 316,960 | 1,435,884 | 2,401,920 | ||||||||||||
|
|
|
|
|
|
|
|
|
|||||||||
| Total gross loans |
$ | 780,281 | $ | 826,203 | $ | 2,797,040 | $ | 4,403,524 | ||||||||
|
|
|
|
|
|
|
|
|
|||||||||
As a normal practice in extending credit for commercial and industrial purposes, we may accept trust deeds on real property as collateral. In some cases, when the primary source of repayment for the loan is anticipated to come from the cash flow from normal operations of the borrower, and real property has been taken as collateral, the real property is considered a secondary source of repayment for the loan. Since we lend primarily in Southern and Central California, our real estate loan collateral is concentrated in this region. At December 31, 2016, substantially all of our loans secured by real estate were collateralized by properties located in California. This concentration is considered when determining the adequacy of our allowance for loan losses.
Nonperforming Assets
The following table provides information on nonperforming assets, excluding PCI loans, as of December 31 for each of the last five years.
| December 31, | ||||||||||||||||||||
| 2016 | 2015 | 2014 | 2013 | 2012 | ||||||||||||||||
| (Dollars in thousands) | ||||||||||||||||||||
| Nonaccrual loans |
$ | 5,526 | $ | 8,397 | $ | 11,901 | $ | 14,835 | $ | 26,688 | ||||||||||
| Troubled debt restructured loans (nonperforming) |
1,626 | 12,622 | 20,285 | 25,119 | 31,309 | |||||||||||||||
| OREO, net |
4,527 | 6,993 | 5,637 | 6,475 | 14,832 | |||||||||||||||
|
|
|
|
|
|
|
|
|
|
|
|||||||||||
| Total nonperforming assets |
$ | 11,679 | $ | 28,012 | $ | 37,823 | $ | 46,429 | $ | 72,829 | ||||||||||
|
|
|
|
|
|
|
|
|
|
|
|||||||||||
| Troubled debt restructured performing loans |
$ | 19,233 | $ | 42,687 | $ | 53,589 | $ | 66,955 | $ | 50,392 | ||||||||||
|
|
|
|
|
|
|
|
|
|
|
|||||||||||
| Percentage of nonperforming assets to total loans |
0.27 | % | 0.70 | % | 0.99 | % | 1.37 | % | 2.23 | % | ||||||||||
|
|
|
|
|
|
|
|
|
|
|
|||||||||||
| Percentage of nonperforming assets to total assets |
0.14 | % | 0.37 | % | 0.51 | % | 0.70 | % | 1.14 | % | ||||||||||
|
|
|
|
|
|
|
|
|
|
|
|||||||||||
65
Table of Contents
At December 31, 2016, loans classified as impaired, excluding PCI loans, totaled $26.4 million, or 0.60% of total gross loans, compared to $63.7 million, or 1.62% of total loans at December 31, 2015. The December 31, 2016 balance included nonperforming loans of $7.2 million. At December 31, 2016, impaired loans which were restructured in a TDR represented $20.9 million, of which $1.6 million were nonperforming and $19.2 million were performing.
Of the $26.4 million total impaired loans as of December 31, 2016, $21.5 million were considered collateral dependent and measured using the fair value of the collateral based on current appraisals (obtained within 1 year). The amount of impaired loans measured using the present value of expected future cash flows discounted at the loans effective rate were $4.9 million.
Troubled Debt Restructurings
Total TDRs were $20.9 million at December 31, 2016, compared to $55.3 million at December 31, 2015. Of the $1.6 million in nonperforming TDRs at December 31, 2016, all were paying in accordance with the modified terms at December 31, 2016. At December 31, 2016, $19.2 million of performing TDRs were accruing interest as restructured loans. Performing TDRs were granted in response to borrower financial difficulty and generally provide for a modification of loan repayment terms. The performing restructured loans represent the only impaired loans accruing interest at each respective reporting date. A performing restructured loan is reasonably assured of repayment and is performing in accordance with the modified terms. We have not restructured loans into multiple loans in what is typically referred to as an “A/B” note structure, where normally the “A” note meets current underwriting standards and the “B” note is typically immediately charged off upon restructuring.
The following table provides a summary of TDRs, excluding PCI loans, for the periods presented.
| December 31, 2016 | December 31, 2015 | |||||||||||||||
| Balance | Number of Loans |
Balance | Number of Loans |
|||||||||||||
| (Dollars in thousands) | ||||||||||||||||
| Performing TDRs: |
||||||||||||||||
| Commercial and industrial |
$ | 745 | 5 | $ | 939 | 5 | ||||||||||
| SBA |
845 | 2 | 681 | 1 | ||||||||||||
| Real Estate: |
||||||||||||||||
| Commercial real estate |
13,445 | 6 | 25,752 | 13 | ||||||||||||
| Construction |
- | - | 7,651 | 1 | ||||||||||||
| SFR mortgage |
2,967 | 10 | 3,565 | 11 | ||||||||||||
| Dairy & livestock and agribusiness |
747 | 1 | 3,685 | 2 | ||||||||||||
| Consumer and other |
484 | 2 | 414 | 1 | ||||||||||||
|
|
|
|
|
|
|
|
|
|||||||||
| Total performing TDRs |
$ | 19,233 | 26 | $ | 42,687 | 34 | ||||||||||
|
|
|
|
|
|
|
|
|
|||||||||
| Nonperforming TDRs: |
||||||||||||||||
| Commercial and industrial |
$ | 156 | 3 | $ | 652 | 5 | ||||||||||
| SBA |
312 | 2 | 321 | 1 | ||||||||||||
| Real Estate: |
||||||||||||||||
| Commercial real estate |
781 | 1 | 11,323 | 4 | ||||||||||||
| Construction |
- | - | - | - | ||||||||||||
| SFR mortgage |
310 | 1 | 326 | 1 | ||||||||||||
| Dairy & livestock and agribusiness |
- | - | - | - | ||||||||||||
| Consumer and other |
67 | 2 | - | - | ||||||||||||
|
|
|
|
|
|
|
|
|
|||||||||
| Total nonperforming TDRs |
$ | 1,626 | 9 | $ | 12,622 | 11 | ||||||||||
|
|
|
|
|
|
|
|
|
|||||||||
| Total TDRs |
$ | 20,859 | 35 | $ | 55,309 | 45 | ||||||||||
|
|
|
|
|
|
|
|
|
|||||||||
At December 31, 2016 and 2015, $141,000 and $607,000 of the allowance for loan losses was specifically allocated to TDRs, respectively. Impairment amounts identified are typically charged off against the allowance at
66
Table of Contents
the time a probable loss is determined. Total charge-offs on TDRs for 2016 and 2015 were $38,000 and zero, respectively.
Nonperforming Assets and Delinquencies
The table below provides trends in our nonperforming assets and delinquencies, excluding PCI loans, for the periods presented.
| December 31, 2016 |
September 30, 2016 |
June 30, 2016 |
March 31, 2016 |
December 31, 2015 |
||||||||||||||||
| (Dollars in thousands) | ||||||||||||||||||||
| Nonperforming loans: |
||||||||||||||||||||
| Commercial and industrial |
$ | 156 | $ | 543 | $ | 568 | $ | 622 | $ | 704 | ||||||||||
| SBA |
2,737 | 3,013 | 2,637 | 2,435 | 2,567 | |||||||||||||||
| Real estate: |
||||||||||||||||||||
| Commercial real estate |
1,683 | 2,396 | 11,396 | 12,082 | 14,541 | |||||||||||||||
| Construction |
- | - | - | - | - | |||||||||||||||
| SFR mortgage |
2,207 | 2,244 | 2,443 | 2,549 | 2,688 | |||||||||||||||
| Dairy & livestock and agribusiness |
- | - | - | - | - | |||||||||||||||
| Consumer and other loans |
369 | 470 | 428 | 456 | 519 | |||||||||||||||
|
|
|
|
|
|
|
|
|
|
|
|||||||||||
| Total |
$ | 7,152 | $ | 8,666 | $ | 17,472 | $ | 18,144 | $ | 21,019 | ||||||||||
|
|
|
|
|
|
|
|
|
|
|
|||||||||||
| % of Total gross loans |
0.16 | % | 0.20 | % | 0.41 | % | 0.43 | % | 0.52 | % | ||||||||||
| Past due 30-89 days: |
||||||||||||||||||||
| Commercial and industrial |
$ | - | $ | - | $ | 61 | $ | 111 | $ | - | ||||||||||
| SBA |
352 | - | - | - | - | |||||||||||||||
| Real estate: |
||||||||||||||||||||
| Commercial real estate |
- | 228 | 320 | - | 354 | |||||||||||||||
| Construction |
- | - | - | - | - | |||||||||||||||
| SFR mortgage |
- | - | - | 625 | 1,082 | |||||||||||||||
| Dairy & livestock and agribusiness |
- | - | - | - | - | |||||||||||||||
| Consumer and other loans |
84 | 294 | 97 | 164 | - | |||||||||||||||
|
|
|
|
|
|
|
|
|
|
|
|||||||||||
| Total |
$ | 436 | $ | 522 | $ | 478 | $ | 900 | $ | 1,436 | ||||||||||
|
|
|
|
|
|
|
|
|
|
|
|||||||||||
| % of Total gross loans |
0.01 | % | 0.01 | % | 0.01 | % | 0.02 | % | 0.04 | % | ||||||||||
| OREO: |
||||||||||||||||||||
| Commercial and industrial |
$ | - | $ | - | $ | - | $ | - | $ | - | ||||||||||
| Real estate: |
||||||||||||||||||||
| Commercial real estate |
- | - | 1,209 | 1,705 | 2,125 | |||||||||||||||
| Construction |
4,527 | 4,840 | 4,840 | 4,840 | 4,868 | |||||||||||||||
|
|
|
|
|
|
|
|
|
|
|
|||||||||||
| Total |
$ | 4,527 | $ | 4,840 | $ | 6,049 | $ | 6,545 | $ | 6,993 | ||||||||||
|
|
|
|
|
|
|
|
|
|
|
|||||||||||
| Total nonperforming, past due, and OREO |
$ | 12,115 | $ | 14,028 | $ | 23,999 | $ | 25,589 | $ | 29,448 | ||||||||||
|
|
|
|
|
|
|
|
|
|
|
|||||||||||
| % of Total gross loans |
0.28 | % | 0.33 | % | 0.57 | % | 0.61 | % | 0.73 | % | ||||||||||
We had $7.2 million in nonperforming loans, excluding PCI loans, defined as nonaccrual loans and nonperforming TDRs, at December 31, 2016, or 0.16% of total gross loans. This compares to nonperforming loans of $21.0 million, or 0.52% of total loans, at December 31, 2015. The $13.9 million decrease in nonperforming loans was principally due to one nonperforming TDR commercial real estate loan that was returned to accrual status in the third quarter of 2016. This $8.8 million loan is a participation interest in the Company’s only Shared National Credit loan.
We had $4.5 million in OREO at December 31, 2016, compared to $7.0 million at December 31, 2015. As of December 31, 2016, we had one OREO property, compared with four OREO properties at December 31, 2015. During 2016, we sold three OREO properties with a carrying value of $2.1 million, realizing a net loss on sale of approximately $27,000. There were no additions to OREO for the twelve months ended December 31, 2016.
67
Table of Contents
Changes in economic and business conditions have had an impact on our market area and on our loan portfolio. We continually monitor these conditions in determining our estimates of needed reserves. However, we cannot predict the extent to which the deterioration in general economic conditions, real estate values, increases in general rates of interest and changes in the financial conditions or business of a borrower, and drought conditions in California may adversely affect a borrower’s ability to pay or the value of our collateral. See “Risk Management — Credit Risk” herein.
Acquired SJB Assets
Loans acquired through the SJB acquisition are accounted for under ASC Topic 310-30, Loans and Debt Securities Acquired with Deteriorated Credit Quality (“ASC 310-30”). PCI loans accounted for under ASC 310-30 are generally considered accruing and performing loans as the loans accrete interest income over the estimated life of the loan when cash flows are reasonably estimable. Accordingly, acquired impaired loans that are contractually past due are still considered to be accruing and performing loans. If the timing and amount of future cash flows is not reasonably estimable, the loans may be classified as nonperforming loans and interest income is not recognized until the timing and amount of future cash flows can be reasonably estimated. As of December 31, 2016, there were no PCI loans considered as nonperforming as described above.
There were no acquired SJB OREO properties remaining as of December 31, 2016 and 2015.
Allowance for Loan Losses
The allowance for loan losses is established as management’s estimate of probable losses inherent in the loan and lease receivables portfolio. The allowance is increased (decreased) by the provision for losses and decreased by charge-offs when management believes the uncollectability of a loan is confirmed which is charged against operating results. Subsequent recoveries, if any, are added to the allowance. The determination of the balance in the allowance for loan losses is based on an analysis of the loan and lease finance receivables portfolio using a systematic methodology and reflects an amount that, in management’s judgment, is appropriate to provide for probable credit losses inherent in the portfolio, after giving consideration to the character of the loan portfolio, current economic conditions, past loan loss experience, and such other factors that would deserve current recognition in estimating inherent credit losses.
The allowance for loan losses totaled $61.5 million as of December 31, 2016, compared to $59.2 million as of December 31, 2015. The allowance for loan losses was reduced by $6.4 million, offset by net recoveries of $8.8 million for the year ended December 31, 2016. This compares to a $5.6 million loan loss provision recapture, offset by net recoveries of $5.0 million for the same period of 2015.
68
Table of Contents
The table below presents a summary of net charge-offs and recoveries by type and the resulting allowance for loan losses and recapture of provision for loan losses for the periods presented.
| As of and For the Year Ended December 31, | ||||||||||||||||||||
| 2016 | 2015 | 2014 | 2013 | 2012 | ||||||||||||||||
| (Dollars in thousands) | ||||||||||||||||||||
| Allowance for loan losses at beginning of period |
$ | 59,156 | $ | 59,825 | $ | 75,235 | $ | 92,441 | $ | 93,964 | ||||||||||
| Charge-offs: |
||||||||||||||||||||
| Commercial and industrial |
120 | 411 | 888 | 2,491 | 1,158 | |||||||||||||||
| SBA |
- | 37 | 50 | - | 101 | |||||||||||||||
| Commercial real estate |
- | 117 | 353 | - | 1,873 | |||||||||||||||
| Construction |
- | - | - | - | - | |||||||||||||||
| SFR mortgage |
102 | 215 | - | 252 | 642 | |||||||||||||||
| Dairy & livestock and agribusiness |
- | - | 1,061 | - | 1,150 | |||||||||||||||
| Consumer and other loans |
16 | 229 | 17 | 108 | 283 | |||||||||||||||
|
|
|
|
|
|
|
|
|
|
|
|||||||||||
| Total charge-offs |
238 | 1,009 | 2,369 | 2,851 | 5,207 | |||||||||||||||
|
|
|
|
|
|
|
|
|
|
|
|||||||||||
| Recoveries: |
||||||||||||||||||||
| Commercial and industrial |
630 | 319 | 873 | 544 | 876 | |||||||||||||||
| SBA |
40 | 41 | 114 | 215 | 404 | |||||||||||||||
| Commercial real estate |
792 | 4,330 | 140 | 402 | 514 | |||||||||||||||
| Construction |
7,174 | 581 | 885 | 703 | 1,139 | |||||||||||||||
| SFR mortgage |
- | 186 | 401 | 367 | (108 | ) | ||||||||||||||
| Dairy & livestock and agribusiness |
216 | 407 | 492 | 109 | 166 | |||||||||||||||
| Consumer and other loans |
170 | 76 | 154 | 55 | 36 | |||||||||||||||
|
|
|
|
|
|
|
|
|
|
|
|||||||||||
| Total recoveries |
9,022 | 5,940 | 3,059 | 2,395 | 3,027 | |||||||||||||||
|
|
|
|
|
|
|
|
|
|
|
|||||||||||
| Net (recoveries) charge-offs |
(8,784 | ) | (4,931 | ) | (690 | ) | 456 | 2,180 | ||||||||||||
| Other reallocation (1) |
- | - | - | - | 657 | |||||||||||||||
| Recapture of provision for loan losses |
(6,400 | ) | (5,600 | ) | (16,100 | ) | (16,750 | ) | - | |||||||||||
|
|
|
|
|
|
|
|
|
|
|
|||||||||||
| Allowance for loan losses at end of period |
$ | 61,540 | $ | 59,156 | $ | 59,825 | $ | 75,235 | $ | 92,441 | ||||||||||
|
|
|
|
|
|
|
|
|
|
|
|||||||||||
| Summary of reserve for unfunded loan commitments: |
||||||||||||||||||||
| Reserve for unfunded loan commitments at beginning of period |
$ | 7,156 | $ | 7,656 | $ | 9,088 | $ | 8,588 | $ | 9,588 | ||||||||||
| Other |
- | - | (182 | ) | - | - | ||||||||||||||
| (Recapture of) provision for unfunded loan commitments |
(450 | ) | (500 | ) | (1,250 | ) | 500 | (1,000 | ) | |||||||||||
|
|
|
|
|
|
|
|
|
|
|
|||||||||||
| Reserve for unfunded loan commitments at end of period |
$ | 6,706 | $ | 7,156 | $ | 7,656 | $ | 9,088 | $ | 8,588 | ||||||||||
|
|
|
|
|
|
|
|
|
|
|
|||||||||||
| Reserve for unfunded loan commitments to total unfunded loan commitments |
0.76 | % | 0.92 | % | 1.05 | % | 1.45 | % | 1.55 | % | ||||||||||
| Amount of total loans at end of period (2) |
$ | 4,395,064 | $ | 4,016,937 | $ | 3,817,067 | $ | 3,546,231 | $ | 3,447,528 | ||||||||||
| Average total loans outstanding (2) |
$ | 4,195,129 | $ | 3,782,133 | $ | 3,598,720 | $ | 3,393,687 | $ | 3,427,571 | ||||||||||
| Net (recoveries) charge-offs to average total loans |
-0.21 | % | -0.13 | % | -0.02 | % | 0.01 | % | 0.05 | % | ||||||||||
| Net (recoveries) charge-offs to total loans at end of period |
-0.20 | % | -0.12 | % | -0.02 | % | 0.01 | % | 0.06 | % | ||||||||||
| Allowance for loan losses to average total loans |
1.47 | % | 1.56 | % | 1.66 | % | 2.22 | % | 2.70 | % | ||||||||||
| Allowance for loan losses to total loans at end of period |
1.40 | % | 1.47 | % | 1.57 | % | 2.12 | % | 2.68 | % | ||||||||||
| Net (recoveries) charge-offs to allowance for loan losses |
-14.27 | % | -8.34 | % | -1.15 | % | 0.61 | % | 2.36 | % | ||||||||||
| Net recoveries (charge-offs) to recapture of provision for loan losses |
137.25 | % | 88.05 | % | 4.29 | % | -2.72 | % | - | |||||||||||
| (1) | During 2012, there was $657,000 in net recoveries for PCI loans, resulting in a $657,000 recapture of provision for loan losses on PCI loans. An offsetting adjustment was recorded to the FDIC loss-sharing asset based on the appropriate asset based on the appropriate loss-sharing percentage. |
| (2) | Net of deferred loan origination fees, costs and discounts. |
69
Table of Contents
Specific allowance: For impaired loans, we incorporate specific allowances based on loans individually evaluated utilizing one of three valuation methods, as prescribed under ASC 310-10. If the measure of the impaired loan is less than the recorded investment in the loan, the deficiency will be charged off against the ALLL or, alternatively, a specific allocation will be established and included in the overall ALLL balance. The specific allocation represents $141,000 (0.23%), $669,000 (1.13%) and $1.5 million (2.59%) of the total allowance as of December 31, 2016, 2015 and 2014, respectively.
General allowance: The loan portfolio collectively evaluated for impairment under ASC 450-20 is divided into risk rating classes of loan receivables between “classified” loans (including substandard and doubtful loans) “Special Mention” loans and “Pass” loans, and are further disaggregated into loan segments by loan type with similar risk characteristics. Both the classified and non-classified loan categories are divided into eight (8) specific loan segments. The allowance is provided for each segment based upon that segment’s average historical loss experience over an established look back period, adjusted for applicable loss emergence periods (i.e., the amount of time from the point at which a loss is incurred to the point at which the loss is confirmed), and further adjusted for current conditions based on our analysis of specific environmental or qualitative loss factors, as prescribed in the 2006 Interagency Policy Statement on ALLL, affecting the collectability of our loan portfolio that may cause actual loss rates to differ from historical loss experience. The above description reflects certain changes made to the Bank’s ALLL methodology in the current period described further below. Beginning with the fourth quarter of 2015 and coinciding with the implementation of the new ALLL methodology, the Bank’s previous “unallocated reserve” was absorbed into the qualitative component of the allowance and eliminated.
During the first quarter of 2016, the Bank adjusted the Historical Loss Rate (HLR) applied to the construction portfolio segment from a segment level to a portfolio-wide HLR. Management determined that the actual losses recognized in the construction segment over the look-back period were no longer representative of the current risk in the construction loan portfolio due to substantial changes in the Bank’s lending policies and practices.
During the second quarter of 2016, the Bank made no adjustments to its existing allowance methodology.
During the third quarter of 2016, the Bank updated its existing allowance methodology as part of its scheduled annual review to evaluate all components of the model to ensure it performs consistently with meaningful results. The Company evaluated its (i) loan segmentation, (ii) look-back period, (iii) loss emergence periods, (iv) historical loss rates, and (v) qualitative factors and structure. Based on our review of the model, certain changes were made to key components, including (i) the calculation of the allocable range of our qualitative factors, (ii) certain economic and credit metrics were added to our qualitative factors, while others were deleted, to provide more relevant indicators of economic risk and credit performance, (iii) re-calculation of our portfolio and segment-level loss emergence periods was completed adding any loans in which the bank incurred a charge-off in the last year to our prior calculation, and (iv) implementing certain lags in data requirements to improve reporting timeliness. The net effect of this annual model update was not material to the overall results of the allowance.
During the fourth quarter of 2016 the Bank made no changes to its ALLL methodology; however, given the immaterial amount of unaccreted discount remaining on PCI loans under the SJB portfolio as well as the extended length of time since the 2009 acquisition of SJB during which the remaining loans in the portfolio have performed, the Bank determined that the PCI loans in this portfolio would be fully reserved under the current ALLL methodology rather than continuing to apply acquired impaired loan accounting.
The Bank determined that the ALLL balance of $61.5 million was appropriate as a result of the net effect of reduced reserve requirements for (i) continued, moderate reductions in the historical loss rates for all portfolio segments except the dairy & livestock portfolio, which remained unchanged, (ii) the effect of moderately improving economic metrics on the qualitative factors, and (iii) significant net recoveries of $8.8 million; offset by increased reserve requirements for (i) specific downgrades in the risk ratings of loans centered in the dairy & livestock portfolio, (ii) an increase of $1.2 million to the allowance for PCI loans (as described above) and (iii) requirements related to continued loan growth experienced during the quarter.
70
Table of Contents
While we believe that the allowance at December 31, 2016 was appropriate to absorb losses from any known or inherent risks in the portfolio, no assurance can be given that economic conditions, interest rate fluctuations, conditions of our borrowers, or natural disasters, which adversely affect our service areas or other circumstances or conditions, including those defined above, will not be reflected in increased provisions for loan losses in the future.
The following table provides a summary of the allocation of the allowance for loan losses for specific loan categories at the dates indicated for total loans. The allocations presented should not be interpreted as an indication that loans charged to the allowance for loan losses will occur in these amounts or proportions, or that the portion of the allowance allocated to each loan category, represents the total amount available for future losses that may occur within these categories.
Allocation of Allowance for Loan Losses
| December 31, | ||||||||||||||||||||||||||||||||||||||||
| 2016 | 2015 | 2014 | 2013 | 2012 | ||||||||||||||||||||||||||||||||||||
| Allowance for Loan Losses |
% of Loans to Total Loans in Each Category |
Allowance for Loan Losses |
% of Loans to Total Loans in Each Category |
Allowance for Loan Losses |
% of Loans to Total Loans in Each Category |
Allowance for Loan Losses |
% of Loans to Total Loans in Each Category |
Allowance for Loan Losses |
% of Loans to Total Loans in Each Category |
|||||||||||||||||||||||||||||||
| (Dollars in thousands) | ||||||||||||||||||||||||||||||||||||||||
| Commercial and industrial |
$ | 8,154 | 11.0 | % | $ | 8,588 | 10.8 | % | $ | 7,074 | 10.2 | % | $ | 8,502 | 10.6 | % | $ | 8,901 | 11.3 | % | ||||||||||||||||||||
| SBA |
871 | 2.2 | % | 993 | 2.7 | % | 2,557 | 3.5 | % | 2,332 | 3.8 | % | 2,751 | 4.5 | % | |||||||||||||||||||||||||
| Real estate: |
||||||||||||||||||||||||||||||||||||||||
| Commercial real estate |
37,443 | 66.6 | % | 36,995 | 65.7 | % | 33,373 | 65.0 | % | 39,402 | 62.1 | % | 47,457 | 57.6 | % | |||||||||||||||||||||||||
| Construction |
1,096 | 1.9 | % | 2,389 | 1.7 | % | 988 | 1.5 | % | 1,305 | 1.3 | % | 2,291 | 1.7 | % | |||||||||||||||||||||||||
| SFR mortgage |
2,287 | 5.7 | % | 2,103 | 5.8 | % | 2,344 | 5.4 | % | 2,718 | 5.3 | % | 3,448 | 4.6 | % | |||||||||||||||||||||||||
| Dairy & livestock and agribusiness |
8,541 | 7.7 | % | 6,029 | 7.6 | % | 5,479 | 7.3 | % | 11,728 | 8.3 | % | 18,696 | 9.8 | % | |||||||||||||||||||||||||
| Municipal lease finance receivables |
941 | 1.5 | % | 1,153 | 1.8 | % | 1,412 | 2.0 | % | 2,335 | 2.5 | % | 1,588 | 3.1 | % | |||||||||||||||||||||||||
| Consumer and other loans |
988 | 1.8 | % | 906 | 1.7 | % | 1,262 | 1.8 | % | 960 | 1.6 | % | 1,170 | 1.7 | % | |||||||||||||||||||||||||
| PCI loans |
1,219 | 1.6 | % | - | 2.2 | % | - | 3.3 | % | - | 4.5 | % | - | 5.7 | % | |||||||||||||||||||||||||
| Unallocated (1) |
- | - | - | - | 5,336 | - | 5,953 | - | 6,139 | - | ||||||||||||||||||||||||||||||
|
|
|
|
|
|
|
|
|
|
|
|
|
|
|
|
|
|
|
|
|
|||||||||||||||||||||
| Total |
$ | 61,540 | 100.0 | % | $ | 59,156 | 100.0 | % | $ | 59,825 | 100.0 | % | $ | 75,235 | 100.0 | % | $ | 92,441 | 100.0 | % | ||||||||||||||||||||
|
|
|
|
|
|
|
|
|
|
|
|
|
|
|
|
|
|
|
|
|
|||||||||||||||||||||
| (1) | Based upon changes to our ALLL methodology, as described earlier in this document, beginning with the fourth quarter of 2015 and coinciding with the implementation of the new ALLL methodology, the Bank’s previous “unallocated reserve” was absorbed into the qualitative component of the allowance. |
71
Table of Contents
Deposits
The primary source of funds to support earning assets (loans and investments) is the generation of deposits.
Total deposits were $6.31 billion at December 31, 2016. This represented an increase of $392.4 million, or 6.63%, over total deposits of $5.92 billion at December 31, 2015. This increase included $209.5 million of total deposits acquired from CCB during the first quarter of 2016, of which $78.7 million were noninterest-bearing deposits. The average balance of deposits by category and the average effective interest rates paid on deposits is summarized for the periods presented in the table below.
| For the Year Ended December 31, | ||||||||||||||||||||||||
| 2016 | 2015 | 2014 | ||||||||||||||||||||||
| Average | ||||||||||||||||||||||||
| Balance | Rate | Balance | Rate | Balance | Rate | |||||||||||||||||||
| (Dollars in thousands) | ||||||||||||||||||||||||
| Non interest-bearing deposits |
$ | 3,539,707 | - | $ | 3,159,989 | - | $ | 2,802,490 | - | |||||||||||||||
| Interest-bearing deposits |
||||||||||||||||||||||||
| Investment checking |
397,463 | 0.07 | % | 353,650 | 0.06 | % | 340,042 | 0.06 | % | |||||||||||||||
| Money market |
1,462,679 | 0.26 | % | 1,354,856 | 0.25 | % | 1,272,175 | 0.25 | % | |||||||||||||||
| Savings |
325,351 | 0.10 | % | 290,095 | 0.10 | % | 274,526 | 0.10 | % | |||||||||||||||
| Time deposits |
584,149 | 0.27 | % | 735,045 | 0.19 | % | 713,813 | 0.18 | % | |||||||||||||||
|
|
|
|
|
|
|
|||||||||||||||||||
| Total deposits |
$ | 6,309,349 | $ | 5,893,635 | $ | 5,403,046 | ||||||||||||||||||
|
|
|
|
|
|
|
|||||||||||||||||||
The amount of noninterest-bearing deposits in relation to total deposits is an integral element in achieving a low cost of funds. Average noninterest-bearing deposits totaled $3.54 billion for 2016, representing an increase of $379.7 million, or 12.02%, from average demand deposits of $3.16 billion for 2015. Average noninterest-bearing deposits represented 56.10% of total average deposits for 2016, compared to 53.62% of total average deposits for 2015.
Average savings deposits, which include savings, interest-bearing demand, and money market accounts, were $2.19 billion for 2016, representing an increase of $186.9 million, or 9.35%, from average savings deposits of $2.00 billion for 2015.
Average time deposits totaled $584.1 million for 2016, representing a decrease of $150.9 million, or 20.53%, from total average time deposits of $735.0 million for 2015.
The following table provides the remaining maturities of large denomination ($250,000 or more) time deposits, including public funds, at December 31, 2016.
Maturity Distribution of Large Denomination Time Deposits
| December 31, 2016 | ||||
| (Dollars in thousands) | ||||
| 3 months or less |
$ | 36,118 | ||
| Over 3 months through 6 months |
26,404 | |||
| Over 6 months through 12 months |
23,911 | |||
| Over 12 months |
18,282 | |||
|
|
|
|||
| Total |
$ | 104,715 | ||
|
|
|
|||
Time deposits totaled $382.8 million at December 31, 2016, representing a decrease of $327.7 million, or 46.12%, from total time deposits of $710.5 million for December 31, 2015. The decrease was primarily due to approximately $280.1 million of time deposits from the state of California that matured and were not renewed during the third quarter of 2016. We considered these time deposits interest rate sensitive and elected not to renew as they matured.
72
Table of Contents
Borrowings
In order to enhance the Bank’s spread between its cost of funds and interest-earning assets, we first seek noninterest-bearing deposits (the lowest cost of funds to the Bank). Next, we pursue growth in interest-bearing deposits, and finally, we supplement the growth in deposits with borrowed funds (borrowings and customer repurchase agreements). Average borrowed funds, as a percent of total funding (total deposits plus borrowed funds), was 8.84% for 2016, compared to 10.05% for 2015.
The following table summarizes information about our term FHLB advances, repurchase agreements and other borrowings outstanding as of and for the periods presented.
| Repurchase Agreements |
FHLB Advances | Other Borrowings |
Total | |||||||||||||
| (Dollars in thousands) | ||||||||||||||||
| At December 31, 2016 |
||||||||||||||||
| Amount outstanding |
$ | 603,028 | $ | - | $ | 53,000 | $ | 656,028 | ||||||||
| Weighted-average interest rate |
0.26 | % | - | 0.55 | % | 0.28 | % | |||||||||
| For the year ended December 31, 2016 |
||||||||||||||||
| Highest amount at month-end |
$ | 753,345 | $ | 5,000 | $ | 53,000 | $ | 811,345 | ||||||||
| Daily-average amount outstanding |
$ | 608,779 | $ | 710 | $ | 2,322 | $ | 611,811 | ||||||||
| Weighted-average interest rate |
0.24 | % | 1.19 | % | 0.41 | % | 0.24 | % | ||||||||
| At December 31, 2015 |
||||||||||||||||
| Amount outstanding |
$ | 690,704 | $ | - | $ | 46,000 | $ | 736,704 | ||||||||
| Weighted-average interest rate |
0.24 | % | - | 0.28 | % | 0.24 | % | |||||||||
| For the year ended December 31, 2015 |
||||||||||||||||
| Highest amount at month-end |
$ | 690,704 | $ | 199,501 | $ | 46,000 | $ | 936,205 | ||||||||
| Daily-average amount outstanding |
$ | 628,821 | $ | 29,516 | $ | 275 | $ | 658,612 | ||||||||
| Weighted-average interest rate |
0.23 | % | 4.75 | % | 0.21 | % | 0.44 | % | ||||||||
| At December 31, 2014 |
||||||||||||||||
| Amount outstanding |
$ | 563,627 | $ | 199,479 | $ | 46,000 | $ | 809,105 | ||||||||
| Weighted-average interest rate |
0.24 | % | 4.52 | % | 0.10 | % | 1.29 | % | ||||||||
| For the year ended December 31, 2014 |
||||||||||||||||
| Highest amount at month-end |
$ | 726,063 | $ | 199,479 | $ | 46,000 | $ | 971,542 | ||||||||
| Daily-average amount outstanding |
$ | 619,147 | $ | 199,351 | $ | 1,414 | $ | 819,912 | ||||||||
| Weighted-average interest rate |
0.25 | % | 4.52 | % | 0.12 | % | 1.29 | % | ||||||||
At December 31, 2016, our borrowings included $603.0 million of repurchase agreements and $53.0 million in other short-term borrowings. At December 31, 2015, our borrowings included $690.7 million in repurchase agreements and other short-term borrowings of $46.0 million.
We offer a repurchase agreement product to our customers. This product, known as Citizens Sweep Manager, sells our investment securities overnight to our customers under an agreement to repurchase them the next day at a price which reflects the market value of the use of funds by the Bank for the period concerned. These repurchase agreements are signed with customers who want to invest their excess deposits, above a pre-determined balance in a demand deposit account, in order to earn interest. As of December 31, 2016 and December 31, 2015, total customer repurchases were $603.0 million and $690.7 million, respectively, with weighted average interest rates of 0.26 % and 0.24%, respectively.
At December 31, 2016, borrowed funds (customer repurchase agreements, FHLB Advances and other borrowings) totaled $656.0 million. This represented a decrease of $80.7 million, or 10.95%, from total borrowed funds of $736.7 million at December 31, 2015. On February 23, 2015 we redeemed $200.0 million of our FHLB advances, which carried a fixed rate of 4.52% and was set to mature in November of 2016. The repayment of this advance, which resulted in a $13.9 million pre-tax debt termination expense as reflected in other operating expense, was funded from Citizens Business Bank deposits. At December 31, 2016, we had $53.0 million overnight borrowings with the FHLB at a cost of 55 basis points.
73
Table of Contents
At December 31, 2016, $3.11 billion of loans and $2.19 billion of investment securities, at carrying value, were pledged to secure public deposits, short and long-term borrowings, and for other purposes as required or permitted by law.
Aggregate Contractual Obligations
The following table summarizes the aggregate contractual obligations as of December 31, 2016.
| Maturity by Period | ||||||||||||||||||||
| Total | Less Than One Year |
One Year Through Three Years |
Four Years Through Five Years |
Over Five Years |
||||||||||||||||
| (Dollars in thousands) | ||||||||||||||||||||
| Deposits (1) |
$ | 6,309,680 | $ | 6,281,364 | $ | 14,432 | $ | 5,967 | $ | 7,917 | ||||||||||
| Customer repurchase agreements (1) |
603,028 | 603,028 | - | - | - | |||||||||||||||
| Junior subordinated debentures (1) |
25,774 | - | - | - | 25,774 | |||||||||||||||
| Deferred compensation |
12,361 | 433 | 457 | 487 | 10,984 | |||||||||||||||
| Operating leases |
13,748 | 5,060 | 6,021 | 1,990 | 677 | |||||||||||||||
| Affordable housing investment |
4,198 | 1,162 | 2,923 | 35 | 78 | |||||||||||||||
| Advertising agreements |
1,818 | 1,006 | 812 | - | - | |||||||||||||||
|
|
|
|
|
|
|
|
|
|
|
|||||||||||
| Total |
$ | 6,970,607 | $ | 6,892,053 | $ | 24,645 | $ | 8,479 | $ | 45,430 | ||||||||||
|
|
|
|
|
|
|
|
|
|
|
|||||||||||
| (1) | Amounts exclude accrued interest. |
Deposits represent noninterest-bearing, money market, savings, NOW, certificates of deposits, brokered and all other deposits held by the Bank.
Customer repurchase agreements represent excess amounts swept from customer demand deposit accounts, which mature the following business day and are collateralized by investment securities. These amounts are due to customers.
At December 31, 2016 we had $53.0 million in short-term borrowings with the FHLB at a cost of 55 basis points, compared to $46.0 million at a cost of 28 basis points at December 31, 2015.
Junior subordinated debentures represent the amounts that are due from the Company to CVB Statutory Trust III. The debentures have the same maturity as the Trust Preferred Securities. These debentures bear interest at three-month LIBOR plus 1.38% and mature in 2036.
Deferred compensation represents the amounts that are due to former employees’ based on salary continuation agreements as a result of acquisitions and amounts due to current employees under our deferred compensation plans.
Operating leases represent the total minimum lease payments due under non-cancelable operating leases.
74
Table of Contents
Off-Balance Sheet Arrangements
The following table summarizes the off-balance sheet items at December 31, 2016.
| Maturity by Period | ||||||||||||||||||||
| Total | Less Than One Year |
One Year to Three Years |
Four Years to Five Years |
After Five Years |
||||||||||||||||
| (Dollars in thousands) | ||||||||||||||||||||
| Commitment to extend credit: |
||||||||||||||||||||
| Commercial and industrial |
$ | 442,689 | $ | 321,666 | $ | 101,103 | $ | 4,162 | $ | 15,758 | ||||||||||
| SBA |
899 | 376 | 124 | 5 | 394 | |||||||||||||||
| Real estate: |
||||||||||||||||||||
| Commercial real estate |
149,270 | 12,744 | 40,569 | 72,927 | 23,030 | |||||||||||||||
| Construction |
69,637 | 50,067 | 19,570 | - | - | |||||||||||||||
| SFR Mortgage |
- | - | - | - | - | |||||||||||||||
| Dairy & livestock and agribusiness (1) |
111,948 | 108,765 | 3,183 | - | - | |||||||||||||||
| Consumer and other loans |
69,913 | 5,579 | 11,567 | 6,702 | 46,065 | |||||||||||||||
|
|
|
|
|
|
|
|
|
|
|
|||||||||||
| Total commitment to extend credit |
844,356 | 499,197 | 176,116 | 83,796 | 85,247 | |||||||||||||||
| Obligations under letters of credit |
36,460 | 33,968 | 2,492 | - | - | |||||||||||||||
|
|
|
|
|
|
|
|
|
|
|
|||||||||||
| Total |
$ | 880,816 | $ | 533,165 | $ | 178,608 | $ | 83,796 | $ | 85,247 | ||||||||||
|
|
|
|
|
|
|
|
|
|
|
|||||||||||
| (1) | Total commitments to extend credit to agribusiness were $10.1 million at December 31, 2016. |
As of December 31, 2016, we had commitments to extend credit of approximately $844.3 million, and obligations under letters of credit of $36.5 million. Commitments to extend credit are agreements to lend to customers, provided there is no violation of any condition established in the contract. Commitments generally have fixed expiration dates or other termination clauses and may require payment of a fee. Commitments are generally variable rate, and many of these commitments are expected to expire without being drawn upon. As such, the total commitment amounts do not necessarily represent future cash requirements. We use the same credit underwriting policies in granting or accepting such commitments or contingent obligations as we do for on-balance sheet instruments, which consist of evaluating customers’ creditworthiness individually. The Company recorded a recapture of provision for unfunded loan commitments of $450,000 for 2016, compared to $500,000 for 2015. The Company had a reserve for unfunded loan commitments of $6.7 million as of December 31, 2016 and $7.2 million as of December 31, 2015 included in other liabilities.
Standby letters of credit are conditional commitments issued by the Bank to guarantee the financial performance of a customer to a third party. Those guarantees are primarily issued to support private borrowing or purchase arrangements. The credit risk involved in issuing letters of credit is essentially the same as that involved in extending loan facilities to customers. When deemed necessary, we hold appropriate collateral supporting those commitments.
Capital Resources
Our primary source of capital has been the retention of operating earnings. In order to ensure adequate levels of capital, we conduct an ongoing assessment of projected sources, needs and uses of capital in conjunction with projected increases in assets and the level of risk. As part of this ongoing assessment, the Board of Directors reviews the various components of capital.
The Company’s total equity was $990.9 million at December 31, 2016. This represented an increase of $67.5 million, or 7.31%, from total equity of $923.4 million at December 31, 2015. The increase in 2016 resulted from $101.4 million in net earnings, $21.6 million for the issuance of stock for the acquisition of CCB, and $8.4 million for various stock based compensation items related to shares issued pursuant to our stock-based
75
Table of Contents
compensation plan. This was offset by $51.8 million for cash dividends declared on common stock, a $10.7 million decrease in other comprehensive income, net of tax, resulting from the net change in fair value of our investment securities portfolio, and $1.4 million in common stock repurchased from the market.
During 2016, the Board of Directors of CVB declared quarterly cash dividends totaling $0.48 per share. Dividends are payable at the discretion of the Board of Directors and there can be no assurance that the Board of Directors will continue to pay dividends at the same rate, or at all, in the future. CVB’s ability to pay cash dividends to its shareholders is subject to restrictions under federal and California law, including restrictions imposed by the Federal Reserve, and covenants set forth in various agreements we are a party to including covenants set forth in our junior subordinated debentures.
On August 11, 2016, our Board of Directors authorized an increase in the Company’s common stock repurchase program originally announced in 2008 to 10,000,000 shares, or approximately 9.3% of the Company’s outstanding shares at the time of authorization and adopted a 10b5-1 plan. During 2016, the Company repurchased 81,800 shares of our common stock outstanding. The Company terminated its 10b5-1 plan in January 2017 pursuant to Regulation M. As of December 31, 2016, we have 9,918,200 shares of our common stock remaining that are eligible for repurchase under the common stock repurchase program.
The Bank and the Company are required to meet risk-based capital standards under the revised capital framework referred to as Basel III set by their respective regulatory authorities. The risk-based capital standards require the achievement of a minimum total risk-based capital ratio of 8.0%, a Tier 1 risk-based capital ratio of 6.0% and a common equity Tier 1 capital ratio of 4.5%. In addition, the regulatory authorities require the highest rated institutions to maintain a minimum leverage ratio of 4.0%. To be considered “well-capitalized” for bank regulatory purposes, the Bank and the Company are required to have a Common Equity Tier 1 (“CET1”) capital ratio equal to or greater than 6.5%, a Tier 1 risk-based capital ratio equal to or greater than 8.0%, a total risk-based capital ratio equal to or greater than 10.0% and a Tier 1 leverage ratio equal to or greater than 5.0%. At December 31, 2016, the Bank and the Company exceeded the minimum risk-based capital ratios and leverage ratios required to be considered “well-capitalized” for regulatory purposes. For further information about capital requirements and our capital ratios, see “Item 1. Business—Regulation and Supervision—Capital Adequacy Requirements”.
At December 31, 2016, the Bank and the Company exceeded the minimum risk-based capital ratios and leverage ratios, under the revised capital framework referred to as Basel III, required to be considered “well-capitalized” for regulatory purposes.
The table below presents the Company’s and the Bank’s risk-based and leverage capital ratios for the periods presented.
| December 31, 2016 | December 31, 2015 | |||||||||||||||||||||||
| Capital Ratios |
Adequately Capitalized Ratios |
Well Capitalized Ratios |
CVB Financial Corp. Consolidated |
Citizens Business Bank |
CVB Financial Corp. Consolidated |
Citizens Business Bank |
||||||||||||||||||
| Tier 1 leverage capital ratio |
4.00 | % | 5.00 | % | 11.49 | % | 11.36 | % | 11.22 | % | 11.11 | % | ||||||||||||
| Common equity Tier I capital ratio |
4.50 | % | 6.50 | % | 16.48 | % | 16.76 | % | 16.49 | % | 16.81 | % | ||||||||||||
| Tier 1 risk-based capital ratio |
6.00 | % | 8.00 | % | 16.94 | % | 16.76 | % | 16.98 | % | 16.81 | % | ||||||||||||
| Total risk-based capital ratio |
8.00 | % | 10.00 | % | 18.19 | % | 18.01 | % | 18.23 | % | 18.06 | % | ||||||||||||
Basel III also introduces a new “capital conservation buffer,” composed entirely of CET1, on top of minimum risk-weighted asset ratios. The capital conservation buffer is designed to absorb losses during periods of economic stress. Banking institutions with a ratio of CET1 to risk-weighted assets above the minimum requirement but below the capital conservation buffer will face constraints on dividends, equity repurchases and payment of discretionary bonuses based on the amount of the shortfall. The implementation of the capital conservation buffer began on January 1, 2016 at 0.625% and will be phased in over a four-year period
76
Table of Contents
(increasing by that amount on each subsequent January 1, until it reaches 2.5% on January 1, 2019). Thus, when fully phased in on January 1, 2019, the Bank will be required to maintain this additional capital conservation buffer of 2.5% of CET1. When fully phased in on January 1, 2019, the Company and the Bank will be required to maintain minimum capital ratios as follows:
| Common Equity Tier 1 Ratio |
Tier 1 Capital Ratio |
Total Capital Ratio |
Tier 1 Leverage Ratio |
|||||||||||||
| Regulatory minimum ratio |
4.5 | % | 6.0 | % | 8.0 | % | 4.0 | % | ||||||||
| Plus: Capital conservation buffer requirement |
2.5 | % | 2.5 | % | 2.5 | % | - | |||||||||
| Regulatory minimum ratio plus capital conservation buffer |
7.0 | % | 8.5 | % | 10.5 | % | 4.0 | % | ||||||||
We anticipate that the Company and the Bank will meet these requirements well in advance of the ultimate full phase-in date. However, it is possible that further increases in regulatory capital may be required in response to the implementation of the Basel III final rule. The exact amount, however, will depend upon our prevailing risk profile under various stress scenarios.
All financial institutions must manage and control a variety of business risks that can significantly affect their financial performance. Our Board of Directors (Board) and executive management team have overall and ultimate responsibility for management of these risks, which they carry out through committees with specific and well-defined risk management functions. The Risk Management Plan that we have adopted seeks to implement the proper control and management of key risk factors inherent in the operation of the Company and the Bank. Some of the key risks that we must manage are credit risks, asset/liability, interest rate and market risks, counterparty risk, transaction risk, compliance risk, strategic risk, cybersecurity risk, price risk and foreign exchange risk. These specific risk factors are not mutually exclusive. It is recognized that any product or service offered by us may expose the Bank to one or more of these risks. Our Risk Management Committee and Risk Management Division monitor these risks to minimize exposure to the Company. The Board and its committees work closely with management in overseeing risk. Each Board committee receives reports and information regarding risk issues directly from management.
Credit Risk Management
Loans represent the largest component of assets on our balance sheet and their related credit risk is among the most significant risks we manage. We define credit risk as the risk of loss associated with a borrower or counterparty default (failure to meet obligations in accordance with agreed upon terms). Credit risk is found in all activities where success depends on a counter party, issuer, or borrower performance. Credit risk arises through the extension of loans and leases, certain securities, and letters of credit.
Severe hurricanes, storms, earthquakes, drought and other weather conditions, as well as natural disasters and problems related to possible climate changes, may from time-to-time cause or create the risk of damage to facilities, buildings, property or other assets of Bank customers, borrowers or municipal debt issuers. This could in turn affect their financial condition or results of operations and as a consequence their ability or capacity to repay debt or fulfill other obligations to the Bank. While we do not currently have reason to believe that any of the Bank’s loans or municipal securities are materially impaired as a result of such damage, there can be no assurance that this will continue to be the case, particularly where recent storms and natural disasters whose impact is still being evaluated by the concerned parties.
Credit risk in the investment portfolio and correspondent bank accounts is in part addressed through defined limits in the Company’s policy statements. In addition, certain securities carry insurance to enhance the credit quality of the bond. Limitations on industry concentration, aggregate customer borrowings, geographic boundaries and standards on loan quality also are designed to reduce loan credit risk. Senior Management, Directors’ Committees, and the Board of Directors are provided with information to appropriately identify, measure, control and monitor the credit risk of the Company.
77
Table of Contents
The general loan policy is updated annually and approved by the Board of Directors. It prescribes underwriting guidelines and procedures for all loan categories in which the Bank participates to establish risk tolerance and parameters that are communicated throughout the Bank to ensure consistent and uniform lending practices. The underwriting guidelines include, among other things, approval limitation and hierarchy, documentation standards, loan-to-value limits, debt coverage ratio, overall credit-worthiness of the borrower, guarantor support, etc. All loan requests considered by the Bank should be for a clearly defined legitimate purpose with a determinable primary source, as well as alternate sources of repayment. All loans should be supported by appropriate documentation including, current financial statements, credit reports, collateral information, guarantor asset verification, tax returns, title reports, appraisals (where appropriate), and other documents of quality that will support the credit.
The major lending categories are commercial and industrial loans, SBA loans, owner-occupied and non owner-occupied commercial real estate loans, construction loans, dairy & livestock and agribusiness loans, residential real estate loans, and various consumer loan products. Loans underwritten to borrowers within these diverse categories require underwriting and documentation suited to the unique characteristics and inherent risks involved.
Commercial and industrial loans require credit structures that are tailored to the specific purpose of the business loan, involving a thorough analysis of the borrower’s business, cash flow, collateral, industry risks, economic risks, credit, character, and guarantor support. Owner-occupied real estate loans are primarily based upon the capacity and stability of the cash flow generated by the occupying business and the market value of the collateral, among other things. Non owner-occupied real estate is typically underwritten to the income produced by the subject property and many considerations unique to the various types of property (i.e. office, retail, warehouse, shopping center, medical, etc.), as well as, the financial support provided by sponsors in recourse transactions. Construction loans will often depend on the specific characteristics of the project, the market for the specific development, real estate values, and the equity and financial strength of the sponsors. Dairy & livestock and agribusiness loans are largely predicated on the revenue cycles and demand for milk and crops, commodity prices, collateral values of herd, feed, and income-producing dairies or croplands, and the financial support of the guarantors. Underwriting of residential real estate and consumer loans are generally driven by personal income and debt service capacity, credit history and scores, and collateral values.
SBA loans require credit structures that conform to the various requirements of the SBA programs specific to the type of loan request and the Bank’s loan policy as it relates to these loans. The SBA 7(a) loans are similar to the commercial and industrial loans that are tailored to the specific purpose of the business loan, involving a thorough analysis of the borrower’s business, cash flow, collateral, industry risks, economic risks, credit, character, and guarantor support for both the Bank and the SBA. Once granted the SBA 7(a) loans require the Bank to follow SBA servicing guidelines to maintain the SBA guaranty which typically ranges from 50% to 75% depending on the type of 7(a) loan. SBA 504 loans are similar to the Bank’s Owner-occupied real estate loans. As such they are primarily based upon the capacity and stability of the cash flow generated by the occupying business and the market value of the collateral, among other things. When the Bank funds an SBA 504 transaction, which includes the 50% first trust deed loan and the 40% second trust deed loan, the initial risk is centered in completing the SBA’s requirements to provide for the payoff of the second trust deed loan from the subordinated debenture. Once the 504 second is paid off, the remaining first trust deed loan is then managed under the same requirements applied to the Bank’s owner-occupied commercial real estate loan. It should be noted that both the SBA 7(a) and 504 programs provide loans for commercial real estate acquisition. However, the terms and advances rates available under the 7(a) program are outside of the Bank’s standard loan programs and risk profile and therefore require a credit enhancement in the form of the SBA guaranty. Additionally, the interest rates for the 7(a) program are typically variable and can adjust as often as monthly with quarterly adjustment the most typical. SBA 504 loan interest rates for the first trust deed loan are at the Bank’s discretion and subject to competitive pressures from other banks.
Implicit in lending activities is the risk that losses will occur and that the amount of such losses will vary over time. Consequently, we maintain an allowance for loan losses by charging a provision for loan losses to earnings. Loans, including impaired loans, determined to be losses are charged against the allowance for loan
78
Table of Contents
losses. Our allowance for loan losses is maintained at a level considered by us to be appropriate to provide for estimated probable losses inherent in the existing portfolio. In this regard, it is important to note that the Bank’s practice with regard to impaired loans, including modified loans or troubled debt restructurings that are classified as impaired, is to generally charge off any impairment amount against the ALLL upon evaluating the loan using one of the three methods described in ASC 310-10-35 at the time a probable loss becomes recognized. As such, the Bank’s specific allowance for impaired loans, including troubled debt restructurings, is relatively low as a percentage of impaired loans outstanding since any known impairment amount will generally have been charged off.
The allowance for loan losses is based upon estimates of probable losses inherent in the loan and lease portfolio. The nature of the process by which we determine the appropriate allowance for loan losses requires the exercise of considerable judgment. The amount actually observed in respect of these losses can vary significantly from the estimated amounts. We employ a systematic methodology that is intended to reduce the differences between estimated and actual losses.
Central to our credit risk management is its loan risk rating system. The originating credit officer assigns borrowers an initial risk rating, which is reviewed and possibly changed by credit management. The risk rating is based primarily on an analysis of each borrower’s financial capacity in conjunction with industry and economic trends. Credit approvals are made based upon our evaluation of the inherent credit risk specific to the transaction and are reviewed for appropriateness by senior line and credit management personnel. Credits are monitored by line and credit management personnel for deterioration in a borrower’s financial condition, which would impact the ability of the borrower to perform under the contract. Risk ratings may be adjusted as necessary.
Loans are risk rated into the following categories: Pass, Pass Watch List, Special Mention, Substandard, Doubtful, and Loss. Each of these groups is assessed and appropriate amounts used in determining the adequacy of our allowance for losses. The Impaired and Doubtful loans are analyzed on an individual basis for allowance amounts. The other categories have formulae used to determine the needed allowance amount.
The Company obtains a quarterly independent credit review by engaging an outside party to review a sample of our loans and leases. The primary purpose of this review is to evaluate our existing loan ratings and provide an assessment as to the effectiveness of our allowance process.
Our methodology for assessing the appropriateness of the allowance is conducted on a regular basis and considers all loans. The systematic methodology consists of two major phases.
In the first phase, individual loans are reviewed to identify loans for impairment. A loan is generally considered impaired when, based on current information and events, it is probable that the Company will be unable to collect all amounts due according to the original contractual terms of the loan. A loan for which there is an insignificant delay in the amount of payments is not considered an impaired loan. Utilizing one of the three methods described in ASC 310-10-35-22, impairment is measured based on either the expected future cash flows discounted at each loan’s effective interest rate, the fair value of the loan’s collateral if the loan is collateral dependent, or an observable market price of the loan (if one exists). If the measure of the impaired loan is less than the recorded investment in the loan, the deficiency will be charged off against the ALLL or, alternatively, a specific allocation will be established and included in the overall ALLL balance.
The Bank evaluates a loan’s collectability from information developed through our loan risk rating system and process, and other sources of information that assist management in monitoring loan performance (e.g. past due loan reports). The Bank then identifies loans for evaluation of impairment and establishes specific allowances in cases where we have identified significant conditions or circumstances related to a credit that we believe indicates the probability that a loss has been incurred. We perform a detailed analysis of these loans, including, but not limited to, cash flows, appraisals of the collateral, conditions of the marketplace for liquidating the collateral and assessment of the guarantors. We then determine the impairment under ASC 310-10, which
79
Table of Contents
requires judgment and estimates, and allocate a portion of the allowance for losses as a specific allowance for each of these loans, or charge off the impairment amount as described above. The eventual outcomes may differ from the estimates used to determine the impairment amount.
The second phase is conducted by evaluating or segmenting the remainder of the loan portfolio into groups or pools of loans with similar characteristics in accordance with ASC No. 450-10, “Contingencies.” In this second phase, groups or pools of homogeneous loans are reviewed to determine a portfolio formula allowance. In the case of the portfolio formula allowance, homogeneous portfolios, such as small business loans, consumer loans, dairy & livestock and agribusiness loans, and real estate loans, are aggregated or pooled in determining the appropriate allowance. The risk assessment process in this case emphasizes trends in the different portfolios for delinquency, loss, and other behavioral characteristics of the subject portfolios.
Included in this second phase is our consideration of known relevant internal and external factors that may affect a loan’s collectability. This includes our estimates of the amounts necessary for concentrations, economic uncertainties, the volatility of the market value of collateral, and other relevant factors. We perform an evaluation of various conditions, the effects of which are not directly measured in the determination of the formula and specific allowances. The evaluation of the inherent loss with respect to these conditions is subject to a higher degree of uncertainty because they are not identified with specific problem credits or portfolio segments. The conditions evaluated include, but are not limited to the following conditions that existed as of the balance sheet date:
| • | then-existing general economic and business conditions affecting the key lending areas of the Company, |
| • | then-existing economic and business conditions of areas outside the lending areas, such as other sections of the United States, |
| • | credit quality trends (including trends in past due loans, adversely graded loans, and nonperforming loans expected to result from existing conditions), |
| • | collateral values, including changes in the value of underlying collateral for collateral-dependent loans. |
| • | the existence and effect of any concentrations of credit, and changes in the level of such concentrations, |
| • | changes in lending policies and procedures |
| • | changes in loan volumes, |
| • | specific industry conditions within portfolio segments, |
| • | recent loss experience in particular segments of the portfolio, |
| • | duration of the current business cycle, |
| • | the effect of external factors such as legal and regulatory requirements, including bank regulatory examination results and findings of the Company’s external credit examiners. |
We review these conditions in discussion with our senior credit officers. To the extent that any of these conditions is evidenced by a specifically identifiable problem credit or portfolio segment as of the evaluation date, our estimate of the effect of such condition may be reflected as a specific allowance applicable to such credit or portfolio segment. Where any of these conditions is not evidenced by a specifically identifiable problem credit or portfolio segment as of the evaluation date, our evaluation of the inherent loss related to such condition is reflected in the second phase of the allowance. Although we have allocated a portion of the allowance to specific loan categories, the appropriateness of the allowance must be considered in its entirety.
Refer to additional discussion concerning loans, nonperforming assets, allowance for loan losses and related tables under the Analysis of Financial Condition contained herein.
80
Table of Contents
ASSET/LIABILITY AND MARKET RISK MANAGEMENT
Liquidity and Cash Flow
The objective of liquidity management is to ensure that funds are available in a timely manner to meet our financial obligations when they come due without incurring unnecessary cost or risk, or causing a disruption to our normal operating activities. This includes the ability to manage unplanned decreases or changes in funding sources, accommodating loan demand and growth, funding investments, repurchasing securities, paying creditors as necessary, and other operating or capital needs.
We regularly assess the amount and likelihood of projected funding requirements through a review of factors such as historical deposit volatility and funding patterns, present and forecasted market and economic conditions, individual customer funding needs, as well as current and planned business activities. Management has a Liquidity Committee that meets quarterly. This committee analyzes the cash flows from loans, investments, deposits and borrowings. In addition, the Company has a Balance Sheet Management Committee of the Board of Directors that meets monthly to review the Company’s balance sheet and liquidity position. This committee provides oversight to the balance sheet and liquidity management process and recommends policy guidelines for the approval of our Board of Directors, and courses of action to address our actual and projected liquidity needs.
Our primary sources and uses of funds for the Company are loans and deposits. Our deposit levels and cost of deposits may fluctuate from period-to-period due to a variety of factors, including the stability of our deposit base, prevailing interest rates, and market conditions. Total deposits of $6.31 billion at December 31, 2016 increased $392.4 million, or 6.63%, over total deposits of $5.92 billion at December 31, 2015.
In general, our liquidity is managed daily by controlling the level of liquid assets as well as the use of funds provided by the cash flow from the investment portfolio, loan demand and deposit fluctuations. Our definition of liquid assets includes cash and cash equivalents in excess of minimum levels needed to fulfill normal business operations, short-term investment securities and other anticipated near term cash flows from investments. To meet unexpected demands, lines of credit are maintained with correspondent banks, the Federal Home Loan Bank and the Federal Reserve. The sale of securities can also serve as a contingent source of funds. We can obtain additional liquidity from deposit growth by offering competitive interest rates on deposits from both our local and national wholesale markets.
CVB is a company separate and apart from the Bank that must provide for its own liquidity and must service its own obligations. Substantially all of CVB’s revenues are obtained from dividends declared and paid by the Bank to CVB. There are statutory and regulatory provisions that could limit the ability of the Bank to pay dividends to CVB. In addition, our regulators could limit the ability of the Bank or CVB to pay dividends or make other distributions. For the Bank, sources of funds include principal payments on loans and investments, growth in deposits, FHLB advances, and other borrowed funds. Uses of funds include withdrawal of deposits, interest paid on deposits, increased loan balances, purchases, and noninterest expenses.
Below is a summary of our average cash position and statement of cash flows for the years ended December 31, 2016 and 2015. For further details see our “Consolidated Statements of Cash Flows” under Part IV consolidated financial statements of this report.
81
Table of Contents
Consolidated Summary of Cash Flows
| ` | For the Year Ended December 31, | |||||||
| 2016 | 2015 | |||||||
| (Dollars in thousands) | ||||||||
| Average cash and cash equivalents |
$ | 367,182 | $ | 352,764 | ||||
| Percentage of total average assets |
4.58 | % | 4.66 | % | ||||
| Net cash provided by operating activities |
$ | 123,255 | $ | 105,642 | ||||
| Net cash used in investing activities |
(152,739 | ) | (300,748 | ) | ||||
| Net cash provided by financing activities |
45,020 | 195,435 | ||||||
|
|
|
|
|
|||||
| Net increase in cash and cash equivalents |
$ | 15,536 | $ | 329 | ||||
|
|
|
|
|
|||||
Average cash and cash equivalents increased by $14.4 million, or 4.09%, to $367.2 million for the year ended December 31, 2016, compared to $352.8 million for the same period of 2015.
At December 31, 2016, cash and cash equivalents totaled $121.6 million. This represented an increase of $15.5 million, or 14.64%, from $106.1 million at December 31, 2015.
Market Risk
In the normal course of its business activities, we are exposed to market risks, including price and liquidity risk. Market risk is the potential for loss from adverse changes in market rates and prices, such as interest rates (interest rate risk). Liquidity risk arises from the possibility that we may not be able to satisfy current or future commitments or that we may be more reliant on alternative funding sources such as long-term debt. Financial products that expose us to market risk include securities, loans, deposits, debt, and derivative financial instruments.
82
Table of Contents
The table below provides the actual balances as of December 31, 2016 of interest-earning assets and interest-bearing liabilities, including the average rate earned or incurred for 2016, the projected contractual maturities over the next five years, and the estimated fair value of each category determined using available market information and appropriate valuation methodologies.
| Maturing | ||||||||||||||||||||||||||||||||
| December 31, 2016 |
Average Rate |
One Year | Two Years | Three Years | Four Years | Five Years and Beyond |
Estimated Fair Value |
|||||||||||||||||||||||||
| (Dollars in thousands) | ||||||||||||||||||||||||||||||||
| Interest-earning assets: |
||||||||||||||||||||||||||||||||
| Investment securities available-for-sale (1) |
$ | 2,270,466 | 2.22 | % | $ | 22,761 | $ | 82,155 | $ | 448,037 | $ | 964,151 | $ | 753,362 | $ | 2,270,466 | ||||||||||||||||
| Investment securities held-to-maturity (1) |
911,676 | 2.96 | % | 37,414 | 31,216 | 32,888 | 139,003 | 671,155 | 897,374 | |||||||||||||||||||||||
| Investment in FHLB stock |
17,688 | 12.24 | % | - | - | - | - | 17,688 | 17,688 | |||||||||||||||||||||||
| Interest-earning deposits due from Federal Reserve and with other institutions |
50,036 | 0.59 | % | 31,750 | 13,225 | 3,920 | 245 | 896 | 50,036 | |||||||||||||||||||||||
| Loans and lease finance receivables (2) |
4,396,572 | 4.53 | % | 780,281 | 189,520 | 200,671 | 222,320 | 3,003,780 | 4,306,225 | |||||||||||||||||||||||
|
|
|
|
|
|
|
|
|
|
|
|
|
|
|
|||||||||||||||||||
| Total interest-earning assets |
$ | 7,646,438 | $ | 872,206 | $ | 316,116 | $ | 685,516 | $ | 1,325,719 | $ | 4,446,881 | $ | 7,541,789 | ||||||||||||||||||
|
|
|
|
|
|
|
|
|
|
|
|
|
|
|
|||||||||||||||||||
| Interest-bearing liabilities: |
||||||||||||||||||||||||||||||||
| Interest-bearing deposits |
$ | 2,636,139 | 0.21 | % | $ | 2,607,824 | $ | 8,711 | $ | 5,720 | $ | 4,499 | $ | 9,385 | $ | 2,634,443 | ||||||||||||||||
| Borrowings |
656,028 | 0.24 | % | 656,028 | - | - | - | - | 655,820 | |||||||||||||||||||||||
| Junior subordinated debentures |
25,774 | 2.09 | % | - | - | - | - | 25,774 | 18,463 | |||||||||||||||||||||||
|
|
|
|
|
|
|
|
|
|
|
|
|
|
|
|||||||||||||||||||
| Total interest-bearing liabilities |
$ | 3,317,941 | $ | 3,263,852 | $ | 8,711 | $ | 5,720 | $ | 4,499 | $ | 35,159 | $ | 3,308,726 | ||||||||||||||||||
|
|
|
|
|
|
|
|
|
|
|
|
|
|
|
|||||||||||||||||||
| (1) | These include mortgage-backed securities which generally prepay before maturity. |
| (2) | Gross loans, net of deferred loan fees. Average rate does not reflect discount accretion on PCI loans. The estimated fair value is net of PCI discount and allowance for loan losses. |
Interest Rate Sensitivity Management
During periods of changing interest rates, the ability to re-price interest-earning assets and interest-bearing liabilities can influence net interest income, the net interest margin, and consequently, our earnings. Interest rate risk is managed by attempting to control the spread between rates earned on interest-earning assets and the rates paid on interest-bearing liabilities within the constraints imposed by market competition in our service area. The primary goal of interest rate risk management is to control exposure to interest rate risk, within policy limits approved by the Board of Directors. These limits and guidelines reflect our risk appetite for interest rate risk over both short-term and long-term horizons. We measure these risks and their impact by identifying and quantifying exposures through the use of sophisticated simulation and valuation models, which, as described in additional detail below, are employed by management to understand net interest income (NII) at risk and economic value of equity (EVE) at risk. Net interest income at risk sensitivity captures asset and liability re-pricing mismatches and is considered a shorter term measure, while EVE sensitivity captures mismatches within the period end balance sheets through the financial instruments’ respective maturities and is considered a longer term measure.
One of the primary methods that we use to quantify and manage interest rate risk is simulation analysis, which we use to model NII from the Company’s balance sheet under various interest rate scenarios. We use simulation analysis to project rate sensitive income under many scenarios. The analyses may include rapid and gradual ramping of interest rates, rate shocks, basis risk analysis, and yield curve twists. Specific balance sheet management strategies are also analyzed to determine their impact on NII and EVE. Key assumptions in the
83
Table of Contents
simulation analysis relate to the behavior of interest rates and pricing spreads, the changes in product balances, and the behavior of loan and deposit clients in different rate environments. This analysis incorporates several assumptions, the most material of which relate to the re-pricing characteristics and balance fluctuations of deposits with indeterminate or non-contractual maturities, and prepayment of loans and securities.
Our interest rate risk policy measures the sensitivity of our net interest income over both a one year and two year cumulative time horizon
The simulation model estimates the impact of changing interest rates on interest income from all interest-earning assets and interest expense paid on all interest-bearing liabilities reflected on our balance sheet. This sensitivity analysis is compared to policy limits, which specify a maximum tolerance level for net interest income exposure over a one-year horizon assuming no balance sheet growth, given a 200 basis point upward and a 100 basis point downward shift in interest rates. The simulation model uses a parallel yield curve shift that ramps rates up or down on a pro rata basis over the 12-month and 24-month time horizon.
The following depicts the Company’s net interest income sensitivity analysis as of December 31, 2016.
| Estimated Net Interest Income Sensitivity (1) | ||||||||
| December 31, 2016 |
December 31, 2015 | |||||||
| Interest Rate Scenario |
12-month Period |
24-month
Period |
12-month Period |
24-month Period | ||||
| + 200 basis points |
-1.18% | 1.16% | -2.32% | -0.85% | ||||
| - 100 basis points |
-2.05% | -4.19% | -1.50% | -3.81% | ||||
(1) Percentage change from base.
Based on our current models, we believe that the interest rate risk profile of the balance sheet is generally well matched with a slight asset sensitive bias over a two year horizon. The estimated sensitivity does not necessarily represent a forecast and the results may not be indicative of actual changes to our net interest income. These estimates are based upon a number of assumptions including: the nature and timing of interest rate levels including yield curve shape, prepayments on loans and securities, pricing strategies on loans and deposits, and replacement of asset and liability cash flows. While the assumptions used are based on current economic and local market conditions, there is no assurance as to the predictive nature of these conditions including how customer preferences or competitor influences might change.
We also perform valuation analysis which incorporates all cash flows over the estimated remaining life of all balance sheet and derivative positions. The valuation of the balance sheet, at a point in time, is defined as the discounted present value of all asset cash flows and derivative cash flows minus the discounted present value of all liability cash flows, the net of which is referred to as EVE. The sensitivity of EVE to changes in the level of interest rates is a measure of the longer-term re-pricing risk and options risk embedded in the balance sheet. EVE uses instantaneous changes in rates, as shown in the table below. EVE sensitivity is reported in both upward and downward rate shocks. Assumptions about the timing and variability of balance sheet cash flows are critical in the EVE analysis. Particularly important are the assumptions driving prepayments and the expected duration and pricing of the indeterminate deposit portfolios. At December 31, 2016, the EVE profile indicates a decline in net balance sheet value due to instantaneous upward changes in rates. When rates are shocked upward, the magnitude of the decline in EVE was less as of December 31, 2016 when compared to December 31, 2015. This change in sensitivity was primarily due to the increase in non-maturity deposits, in particular non-interest bearing deposits, and the increase in the estimated duration of these liabilities.
Economic Value of Equity Sensitivity
| Instantaneous Rate Change | December 31, 2016 | December 31, 2015 | ||||||
| 100 bp decrease in interest rates |
-9.1 | % | -6.6 | % | ||||
| 100 bp increase in interest rates |
0.8 | % | -2.8 | % | ||||
| 200 bp increase in interest rates |
0.2 | % | -7.4 | % | ||||
| 300 bp increase in interest rates |
-1.5 | % | -12.8 | % | ||||
| 300 bp increase in interest rates |
-3.7 | % | -18.6 | % | ||||
84
Table of Contents
As EVE measures the discounted present value of cash flows over the estimated lives of instruments, the change in EVE does not directly correlate to the degree that earnings would be impacted over a shorter time horizon (i.e., the current year). Further, EVE does not take into account factors such as future balance sheet growth, changes in asset and liability mix, changes in yield curve relationships, and changing product spreads that could mitigate the adverse impact of changes in interest rates.
Counterparty Risk
Recent developments in the financial markets have placed an increased awareness of Counterparty Risks. These risks occur when a financial institution has an indebtedness or potential for indebtedness to another financial institution. We have assessed our Counterparty Risk with the following results:
| • | We do not have any investments in the preferred stock of any other company. |
| • | We have one issuance of a trust preferred security totaling $5.0 million with a large financial institution. |
| • | Most of our investment securities are either municipal securities, callable agencies or securities backed by mortgages, Fannie Mae, Freddie Mac, SBA or FHLB. |
| • | All of our commercial line insurance policies are with companies with the highest AM Best ratings of A or above. |
| • | We have no significant exposure to our Cash Surrender Value of Life Insurance since the Cash Surrender Value balance is with insurance companies that carry an AM Best rating of A- or greater and one company is rated B. |
| • | We have no significant Counterparty exposure related to derivatives such as interest rate swaps. Our Counterparty is a major financial institution and our agreement requires the Counterparty to post cash collateral for mark-to-market balances due to us. |
| • | We believe our risk of loss associated with our counterparty borrowers related to interest rate swaps is generally mitigated as the loans with swaps are underwritten to take into account potential additional exposure. |
| • | We have $388.0 million in Fed Funds lines of credit with other banks. All of these banks are major U.S. banks, each with over $20.0 billion in assets. We rely on these funds for overnight borrowings. At December 31, 2016, we had $53.0 million in short-term borrowings. |
| • | Our secured borrowing capacity with the FHLB was $2.52 billion, of which $2.52 billion was available as of December 31, 2016. |
Transaction Risk
Transaction risk is the risk to earnings or capital arising from problems in service, activity or product delivery. This risk is significant within any bank and is interconnected with other risk categories in most activities throughout the Company. Transaction risk is a function of internal controls, information systems, associate integrity, and operating processes. It arises daily throughout the Company as transactions are processed. It pervades all divisions, departments and centers and is inherent in all products and services we offer.
In general, transaction risk is defined as high, medium or low by the Company. The audit plan ensures that high risk areas are reviewed annually. We utilize internal auditors and independent audit firms to test key controls of operational processes and to audit information systems, compliance management program, loan review and trust services.
85
Table of Contents
The key to monitoring transaction risk is in the design, documentation and implementation of well-defined procedures. Any system of controls, however well designed and operated, is based in part on certain assumptions and can provide only reasonable, but not absolute, assurances of the effectiveness of these systems and controls, and that the objectives of these controls have been met.
Compliance Risk
Compliance risk is the risk to earnings or capital arising from violations of, or non-conformance with, laws, rules, regulations, prescribed practices, or ethical standards. Compliance risk also arises in situations where the laws or rules governing certain products or activities of the Bank’s customers may be ambiguous or untested. Compliance risk exposes us to fines, civil money penalties, payment of damages, and the voiding of contracts. Compliance risk can also lead to a diminished reputation, reduced business value, limited business opportunities, lessened expansion potential, and lack of contract enforceability.
There is no single or primary source of compliance risk. It is inherent in every activity. Frequently, it blends into operational risk and transaction risk. A portion of this risk is sometimes referred to as legal risk. This is not limited solely to risk from failure to comply with consumer protection laws; it encompasses all laws, as well as prudent ethical standards and contractual obligations. It also includes the exposure to litigation from all aspects of banking, traditional and non-traditional.
Our Risk Management Policy and Program and the Code of Ethical Conduct are cornerstones for controlling compliance risk. An integral part of controlling this risk is the proper training of associates. The Chief Risk Officer is responsible for developing and executing a comprehensive compliance training program. The Chief Risk Officer seeks to provide our associates with adequate training commensurate to their job functions to ensure compliance with banking laws and regulations.
Our Risk Management Policy and Program includes a risk-based audit program aimed at identifying internal control deficiencies and weaknesses. The Compliance Management Program includes two levels of review. One is in-depth audits performed by our internal audit department under the direction of the Chief Auditor and supplemented by independent external firms, and the other is periodic monitoring performed by the Risk Management Division. Annually, an Audit Plan for the Company is developed and presented for approval to the Audit Committee of the Board.
The Company utilizes independent external firms to conduct compliance audits as a means of identifying weaknesses in the compliance program. The annual Audit also includes a review of selected centers and departments.
The Risk Management Division conducts periodic monitoring of our compliance efforts with a special focus on those areas that expose us to compliance risk. The purpose of the periodic monitoring is to verify whether our associates are adhering to established policies and procedures. Any material exceptions identified are brought forward to the appropriate department head, the Audit Committee and the Risk Management Committee.
We recognize that customer complaints can often identify weaknesses in our compliance program which could expose us to risk. Therefore, we attempt to ensure that all complaints are given prompt attention. Our Compliance Management Policy and Program include provisions on how customer complaints are to be addressed. The Chief Risk Officer reviews formal complaints to determine if a significant compliance risk exists and communicates those findings to the Compliance Management and Risk Management Committees.
Strategic Risk
Strategic risk is the risk to earnings or capital arising from adverse decisions or improper implementation of strategic decisions. This risk is a function of the compatibility between an organization’s goals, the resources deployed against those goals and the quality of implementation.
86
Table of Contents
Strategic risks are identified as part of the strategic planning process. Offsite strategic planning sessions, with members of the Board of Directors and Senior Leadership, are held annually. The strategic review consists of an economic assessment, competitive analysis, industry outlook and legislative and regulatory review.
A primary measurement of strategic risk is peer group analysis. Key performance ratios are compared to three separate peer groups to identify any sign of weakness and potential opportunities. The peer group consists of:
| 1. | Banks of comparable size |
| 2. | High performing banks |
| 3. | A list of specific banks |
Another measure is the comparison of the actual results of previous strategic initiatives against the expected results established prior to implementation of each strategy.
Cybersecurity Risk
Cybersecurity and fraud risk refers to the risk of failures, interruptions of services, or breaches of security with respect to the Company’s or the Bank’s communication, information, operations, devices, financial control, customer internet banking, customer information, email, data processing systems, or other bank or third party applications. The ability of the Company’s customers to bank remotely, including online and through mobile devices, requires secure transmission of confidential information and increases the risk of data security breaches. In addition, the Company and the Bank rely primarily on third party providers to develop, manage, maintain and protect these systems and applications. Any such failures, interruptions or fraud or security breaches, depending on the scope, duration, affected system(s) or customers(s), could expose the Company and/or the Bank to financial loss, reputation damage, litigation, or regulatory action. We continue to invest in technologies and training to protect our associates, our clients and our assets. While we have implemented various detective and preventative measures which seek to protect our Company, our customers’ information and the Bank from the risk of fraud, data security breaches or service interruptions, there can be no assurance that these measures will be effective in preventing breaches or losses for us or our customers.
Price and Foreign Exchange Risk
Price risk arises from changes in market factors that affect the value of traded instruments. Foreign exchange risk is the risk to earnings or capital arising from movements in foreign exchange rates.
Our current exposure to price risk is nominal. We do not have trading accounts. Consequently, the level of price risk within the investment portfolio is limited to the need to sell securities for reasons other than trading.
We maintain deposit accounts with various foreign banks. Our Interbank Liability Policy seeks to limit the balance in any of these accounts to an amount that does not in our judgment present a significant risk to our earnings from changes in the value of foreign currencies.
Our asset liability model seeks to calculate the market value of the Bank’s equity. In addition, management prepares, on a monthly basis, a capital volatility report that compares changes in the market value of the investment portfolio. We have as our target to always be well-capitalized by regulatory standards.
The Balance Sheet Management Policy requires the submission of a Fair Value Matrix Report to the Balance Sheet Management Committee on a quarterly basis. The report seeks to calculate the economic value of equity under different interest rate scenarios, revealing the level or price risk of the Bank’s interest sensitive asset and liability portfolios.
87
Table of Contents
| ITEM 7A. | QUANTITATIVE AND QUALITATIVE DISCLOSURES ABOUT MARKET RISK |
Market risk is the risk of loss from adverse changes in the market prices and interest rates. Our market risk arises primarily from interest rate risk inherent in our lending and deposit taking activities. We currently do not enter into futures, forwards, or option contracts. For quantitative and qualitative disclosures about market risks in our portfolio, see “Asset/Liability Management and Interest Rate Sensitivity Management” included in Item 7 — Management’s Discussion and Analysis of Financial Condition and the Results of Operations presented elsewhere in this report. Our analysis of market risk and market-sensitive financial information contain forward looking statements and is subject to the disclosure at the beginning of Part I regarding such forward-looking information.
88
Table of Contents
| ITEM 8. | FINANCIAL STATEMENTS AND SUPPLEMENTARY DATA |
CVB Financial Corp.
Index to Consolidated Financial Statements
and Financial Statement Schedules
| Page | ||||
| Consolidated Financial Statements |
||||
| 96 | ||||
| 97 | ||||
| Consolidated Statements of Stockholders’ Equity — Three Years Ended December 31, 2016, 2015 and 2014 |
98 | |||
| Consolidated Statements of Cash Flows — Years Ended December 31, 2016, 2015 and 2014 |
99 | |||
| 101 | ||||
| 156 | ||||
All schedules are omitted because they are not applicable, not material or because the information is included in the financial statements or the notes thereto.
For information about the location of management’s annual reports on internal control, our financial reporting and the audit report of KPMG LLP thereon. See “Item 9A. Controls and Procedures.”
| ITEM 9. | CHANGES IN AND DISAGREEMENTS WITH ACCOUNTANTS ON ACCOUNTING AND FINANCIAL DISCLOSURE |
None
| ITEM 9A. | CONTROLS AND PROCEDURES |
1) Management’s Report on Internal Control over Financial Reporting
Management of CVB Financial Corp., together with its consolidated subsidiaries (the “Company”), is responsible for establishing and maintaining adequate internal control over financial reporting. The Company’s internal control over financial reporting is a process designed by, or under the supervision of, the Company’s principal executive and principal financial officers to provide reasonable assurance regarding the reliability of financial reporting and the preparation of the Company’s financial statements for external reporting purposes in accordance with U.S. generally accepted accounting principles.
Our internal control over financial reporting includes policies and procedures that pertain to the maintenance of records that, in reasonable detail, accurately and fairly reflect transactions and dispositions of assets; provide reasonable assurances that transactions are recorded as necessary to permit preparation of financial statements in accordance with U.S. generally accepted accounting principles, and that receipts and expenditures are being made only in accordance with authorizations of management and the directors of the Company; and provide reasonable assurance regarding prevention or timely detection of unauthorized acquisition, use or disposition of the Company’s assets that could have a material effect on our financial statements.
As of December 31, 2016, management conducted an assessment of the effectiveness of the Company’s internal control over financial reporting based on the framework established in Internal Control — Integrated Framework (2013) issued by the Committee of Sponsoring Organizations of the Treadway Commission (COSO). Based on this assessment, management has determined that the Company’s internal control over financial reporting as of December 31, 2016 is effective. KPMG LLP, an independent registered public accounting firm, has issued their report on the effectiveness of internal control over financial reporting as of December 31, 2016.
89
Table of Contents
2) Auditor attestation
Report of Independent Registered Public Accounting Firm
The Board of Directors and Stockholders
CVB Financial Corp.:
We have audited CVB Financial Corp. and subsidiaries’ internal control over financial reporting as of December 31, 2016, based on criteria established in Internal Control — Integrated Framework (2013) issued by the Committee of Sponsoring Organizations of the Treadway Commission (COSO). CVB Financial Corp. and subsidiaries’ management is responsible for maintaining effective internal control over financial reporting and for its assessment of the effectiveness of internal control over financial reporting, included in the accompanying Management’s Report on Internal Control over Financial Reporting. Our responsibility is to express an opinion on the Company’s internal control over financial reporting based on our audit.
We conducted our audit in accordance with the standards of the Public Company Accounting Oversight Board (United States). Those standards require that we plan and perform the audit to obtain reasonable assurance about whether effective internal control over financial reporting was maintained in all material respects. Our audit included obtaining an understanding of internal control over financial reporting, assessing the risk that a material weakness exists, and testing and evaluating the design and operating effectiveness of internal control based on the assessed risk. Our audit also included performing such other procedures as we considered necessary in the circumstances. We believe that our audit provides a reasonable basis for our opinion.
A company’s internal control over financial reporting is a process designed to provide reasonable assurance regarding the reliability of financial reporting and the preparation of financial statements for external purposes in accordance with generally accepted accounting principles. A company’s internal control over financial reporting includes those policies and procedures that (1) pertain to the maintenance of records that, in reasonable detail, accurately and fairly reflect the transactions and dispositions of the assets of the company; (2) provide reasonable assurance that transactions are recorded as necessary to permit preparation of financial statements in accordance with generally accepted accounting principles, and that receipts and expenditures of the company are being made only in accordance with authorizations of management and directors of the company; and (3) provide reasonable assurance regarding prevention or timely detection of unauthorized acquisition, use, or disposition of the company’s assets that could have a material effect on the financial statements.
Because of its inherent limitations, internal control over financial reporting may not prevent or detect misstatements. Also, projections of any evaluation of effectiveness to future periods are subject to the risk that controls may become inadequate because of changes in conditions, or that the degree of compliance with the policies or procedures may deteriorate.
In our opinion, CVB Financial Corp. and subsidiaries maintained, in all material respects, effective internal control over financial reporting as of December 31, 2016, based on criteria established in Internal Control — Integrated Framework (2013) issued by the Committee of Sponsoring Organizations of the Treadway Commission.
We also have audited, in accordance with the standards of the Public Company Accounting Oversight Board (United States), the consolidated balance sheets of CVB Financial Corp. and subsidiaries as of December 31, 2016 and 2015, and the related consolidated statements of earnings and comprehensive income, stockholders’ equity, and cash flows for each of the years in the three-year period ended December 31, 2016, and our report dated March 1, 2017 expressed an unqualified opinion on those consolidated financial statements.
/s/ KPMG LLP
Los Angeles, California
March 1, 2017
90
Table of Contents
3) Changes in Internal Control over Financial Reporting
We maintain controls and procedures designed to ensure that information is recorded and reported in all filings of financial reports. Such information is reported to our management, including our Chief Executive Officer and Chief Financial Officer to allow timely and accurate disclosure based on the definition of “disclosure controls and procedures” in SEC Rule 13a-15(e) and 15d-15(e).
As of the end of the period covered by this report, we carried out an evaluation of the effectiveness of the design and operation of our disclosure controls and procedures under the supervision and with the participation of the Chief Executive Officer and the Chief Financial Officer. Based on the foregoing, our Chief Executive Officer and the Chief Financial Officer concluded that our disclosure controls and procedures are effective as of the end of the period covered by this report.
During the fiscal quarter ended December 31, 2016, there have been no changes in our internal control over financial reporting that has materially affected or is reasonably likely to materially affect our internal control over financial reporting.
| ITEM 9B. | OTHER INFORMATION |
None.
91
Table of Contents
PART III
| ITEM 10. | DIRECTORS, EXECUTIVE OFFICERS AND CORPORATE GOVERNANCE |
Except as hereinafter noted, the information concerning directors and executive officers of the Company, corporate governance and our audit committee financial experts is incorporated by reference from the section entitled “Discussion of Proposals recommended by the Board — Proposal 1: Election of Directors” and “Beneficial Ownership Reporting Compliance,” “Corporate Governance Principles and Board Matters,” and “Audit Committee” of our definitive Proxy Statement to be filed pursuant to Regulation 14A within 120 days after the end of the last fiscal year. For information concerning the executive officers of the Company, see Item I of Part I hereto.
The Company has adopted a Code of Ethics that applies to all of the Company’s employees, including the Company’s principal executive officer, the principal financial officer, accounting officers, and all employees who perform these functions. A copy of the Code of Ethics is available to any person without charge by submitting a request to the Company’s Chief Financial Officer at 701 N. Haven Avenue, Suite 350, Ontario, CA 91764. If the Company shall amend its Code of Ethics as applies to the principal executive officer, principal financial officer, principal accounting officer or controller (or persons performing similar functions) or shall grant a waiver from any provision of the code of ethics to any such person, the Company shall disclose such amendment or waiver on its website at www.cbbank.com under the tab “Investor Relations.”
| ITEM 11. | EXECUTIVE COMPENSATION |
Information concerning management remuneration and transactions is incorporated by reference from the section entitled “Election of Directors” and “Executive Compensation — Certain Relationships and Related Transactions” of our definitive Proxy Statement to be filed pursuant to Regulation 14A within 120 days after the end of the last fiscal year.
| ITEM 12. | SECURITY OWNERSHIP OF CERTAIN BENEFICIAL OWNERS AND MANAGEMENT AND RELATED STOCKHOLDER MATTERS |
The following table summarizes information as of December 31, 2016 relating to our equity compensation plans pursuant to which grants of options, restricted stock, or other rights to acquire shares may be granted from time to time.
Equity Compensation Plan Information
| Plan category | Number of Securities to be Issued upon Exercise of Outstanding Options, Warrants, and Rights (a) |
Weighted-Average Exercise Price of Options, Warrants, and Rights (b) |
Number of Securities Remaining Available for Future Issuance Under Equity Compensation Plans (Excluding Securities Reflected in Column (a) (c) |
|||||||||
| Equity compensation plans approved by security holders |
876,036 | $ | 11.88 | 647,192 | ||||||||
| Equity compensation plans not approved by security holders |
- | $ | - | - | ||||||||
|
|
|
|
|
|
|
|
||||||
| Total |
876,036 | $ | 11.88 | 647,192 | ||||||||
|
|
|
|
|
|
|
|||||||
Information concerning security ownership of certain beneficial owners and management is incorporated by reference from the sections entitled “Stock Ownership” of our definitive Proxy Statement to be filed pursuant to Regulation 14A within 120 days after the end of the last fiscal year.
92
Table of Contents
| ITEM 13. | CERTAIN RELATIONSHIPS AND RELATED TRANSACTIONS, AND DIRECTOR INDEPENDENCE |
Information concerning certain relationships and related transactions with management and others and information regarding director independence is incorporated by reference from the section entitled “Executive Compensation — Certain Relationships and Related Transactions” and “Director Independence” of our definitive Proxy Statement to be filed pursuant to Regulation 14A within 120 days after the end of the last fiscal year.
| ITEM 14. | PRINCIPAL ACCOUNTANT FEES AND SERVICES |
Information concerning principal accounting fees and services is incorporated by reference from the section entitled “Ratification of Appointment of Independent Public Accountants” of our definitive Proxy Statement to be filed pursuant to Regulation 14A within 120 days after the end of the last fiscal year.
93
Table of Contents
PART IV
| ITEM 15. | EXHIBITS AND FINANCIAL STATEMENT SCHEDULES |
Financial Statements
| (a) | (1) All Financial Statements |
Reference is made to the Index to Financial Statements on page 89 for a list of financial statements filed as part of this Annual Report on Form 10-K.
(2) Financial Statement Schedules
Reference is made to the Index to Financial Statements on page 89 for the listing of supplementary financial statement schedules required by this item.
(3) Exhibits
The listing of exhibits required by this item is set forth in the Index to Exhibits on page 157 of this Annual Report on Form 10-K.
| (b) | Exhibits |
See Index to Exhibits on Page 157 of this Form 10-K.
| (c) | Financial Statement Schedules |
There are no financial statement schedules required by Regulation S-X that have been excluded from the annual report to shareholders.
94
Table of Contents
Pursuant to the requirements of Section 13 or 15(d) of the Securities Exchange Act of 1934, the registrant has duly caused this report to be signed on its behalf by the undersigned, thereunto duly authorized, on the 1st day of March 2017.
| CVB FINANCIAL CORP. | ||
| By: | /s/ CHRISTOPHER D. MYERS | |
| Christopher D. Myers | ||
| President and Chief Executive Officer | ||
Pursuant to the requirements of the Securities Exchange Act of 1934, this report has been signed below by the following persons on behalf of the registrant in the capacities and on the dates indicated.
| Signature |
Title |
Date | ||
| /s/ RAYMOND V. O’BRIEN III Raymond V. O’Brien |
Chairman of the Board | March 1, 2017 | ||
| /s/ GEORGE. A. BORBA, JR. George A. Borba, Jr. |
Vice Chairman | March 1, 2017 | ||
| /s/ STEPHEN A. DEL GUERCIO |
Director | March 1, 2017 | ||
| Stephen A. Del Guercio | ||||
| /s/ ROBERT M. JACOBY Robert M. Jacoby |
Director | March 1, 2017 | ||
| /s/ ANNA KAN Anna Kan |
Director | March 1, 2017 | ||
| /s/ KRISTINA M. LESLIE Kristina M. Leslie |
Director | March 1, 2017 | ||
| /s/ HAL W. OSWALT Hal W. Oswalt |
Director | March 1, 2017 | ||
| /s/ CHRISTOPHER D. MYERS Christopher D. Myers |
Director, President and Chief Executive Officer (Principal Executive Officer) |
March 1, 2017 | ||
| /s/ E. ALLEN NICHOLSON E. Allen Nicholson |
Chief Financial Officer (Principal Financial and Accounting Officer) |
March 1, 2017 | ||
95
Table of Contents
CVB FINANCIAL CORP. AND SUBSIDIARIES
CONSOLIDATED BALANCE SHEETS
(Dollars in thousands, except share amounts)
| December 31, | December 31, | |||||||
| 2016 | 2015 | |||||||
| Assets |
||||||||
| Cash and due from banks |
$ | 119,445 | $ | 102,772 | ||||
| Interest-earning balances due from Federal Reserve |
2,188 | 3,325 | ||||||
|
|
|
|
|
|||||
| Total cash and cash equivalents |
121,633 | 106,097 | ||||||
|
|
|
|
|
|||||
| Interest-earning balances due from depository institutions |
47,848 | 32,691 | ||||||
| Investment securities available-for-sale, at fair value (with amortized cost of $2,255,874 at December 31, 2016, and $2,337,715 at December 31, 2015) |
2,270,466 | 2,368,646 | ||||||
| Investment securities held-to-maturity (with fair value of $897,374 at December 31, 2016, and $853,039 at December 31, 2015) |
911,676 | 850,989 | ||||||
|
|
|
|
|
|||||
| Total investment securities |
3,182,142 | 3,219,635 | ||||||
|
|
|
|
|
|||||
| Investment in stock of Federal Home Loan Bank (FHLB) |
17,688 | 17,588 | ||||||
| Loans and lease finance receivables |
4,395,064 | 4,016,937 | ||||||
| Allowance for loan losses |
(61,540) | (59,156) | ||||||
|
|
|
|
|
|||||
| Net loans and lease finance receivables |
4,333,524 | 3,957,781 | ||||||
|
|
|
|
|
|||||
| Premises and equipment, net |
42,086 | 31,382 | ||||||
| Bank owned life insurance |
134,785 | 130,956 | ||||||
| Accrued interest receivable |
22,259 | 22,732 | ||||||
| Intangibles |
5,010 | 2,265 | ||||||
| Goodwill |
89,533 | 74,244 | ||||||
| Other real estate owned (OREO) |
4,527 | 6,993 | ||||||
| Income taxes |
45,429 | 47,251 | ||||||
| Asset held-for-sale |
3,411 | - | ||||||
| Other assets |
23,832 | 21,585 | ||||||
|
|
|
|
|
|||||
| Total assets |
$ | 8,073,707 | $ | 7,671,200 | ||||
|
|
|
|
|
|||||
| Liabilities and Stockholders’ Equity |
||||||||
| Deposits: |
||||||||
| Noninterest-bearing |
$ | 3,673,541 | $ | 3,250,174 | ||||
| Interest-bearing |
2,636,139 | 2,667,086 | ||||||
|
|
|
|
|
|||||
| Total deposits |
6,309,680 | 5,917,260 | ||||||
| Customer repurchase agreements |
603,028 | 690,704 | ||||||
| Other borrowings |
53,000 | 46,000 | ||||||
| Deferred compensation |
12,361 | 11,269 | ||||||
| Junior subordinated debentures |
25,774 | 25,774 | ||||||
| Payable for securities purchased |
23,777 | 1,696 | ||||||
| Other liabilities |
55,225 | 55,098 | ||||||
|
|
|
|
|
|||||
| Total liabilities |
7,082,845 | 6,747,801 | ||||||
|
|
|
|
|
|||||
| Commitments and Contingencies |
||||||||
| Stockholders’ Equity |
||||||||
| Common stock, authorized, 225,000,000 shares without par; issued and outstanding 108,251,981 at December 31, 2016, and 106,384,982 at December 31, 2015 |
531,192 | 502,571 | ||||||
| Retained earnings |
449,499 | 399,919 | ||||||
| Accumulated other comprehensive income, net of tax |
10,171 | 20,909 | ||||||
|
|
|
|
|
|||||
| Total stockholders’ equity |
990,862 | 923,399 | ||||||
|
|
|
|
|
|||||
| Total liabilities and stockholders’ equity |
$ | 8,073,707 | $ | 7,671,200 | ||||
|
|
|
|
|
|||||
See accompanying notes to the consolidated financial statements.
96
Table of Contents
CVB FINANCIAL CORP. AND SUBSIDIARIES
CONSOLIDATED STATEMENTS OF EARNINGS AND COMPREHENSIVE INCOME
(Dollars in thousands, except per share amounts)
| For the Year Ended December 31, | ||||||||||||
| 2016 | 2015 | 2014 | ||||||||||
| Interest income: |
||||||||||||
| Loans and leases, including fees |
$ | 192,992 | $ | 185,663 | $ | 181,619 | ||||||
| Investment securities: |
||||||||||||
| Investment securities available-for-sale |
47,702 | 63,190 | 68,214 | |||||||||
| Investment securities held-to-maturity |
20,227 | 9,018 | 164 | |||||||||
|
|
|
|
|
|
|
|||||||
| Total investment income |
67,929 | 72,208 | 68,378 | |||||||||
|
|
|
|
|
|
|
|||||||
| Dividends from FHLB stock |
2,224 | 2,774 | 2,130 | |||||||||
| Federal funds sold and interest-earning deposits with other institutions |
1,905 | 868 | 776 | |||||||||
|
|
|
|
|
|
|
|||||||
| Total interest income |
265,050 | 261,513 | 252,903 | |||||||||
|
|
|
|
|
|
|
|||||||
| Interest expense: |
||||||||||||
| Deposits |
5,957 | 5,266 | 4,977 | |||||||||
| Borrowings and customer repurchase agreements |
1,478 | 2,867 | 10,991 | |||||||||
| Junior subordinated debentures |
541 | 438 | 421 | |||||||||
|
|
|
|
|
|
|
|||||||
| Total interest expense |
7,976 | 8,571 | 16,389 | |||||||||
|
|
|
|
|
|
|
|||||||
| Net interest income before recapture of provision for loan losses |
257,074 | 252,942 | 236,514 | |||||||||
| Recapture of provision for loan losses |
(6,400) | (5,600) | (16,100) | |||||||||
|
|
|
|
|
|
|
|||||||
| Net interest income after recapture of provision for loan losses |
263,474 | 258,542 | 252,614 | |||||||||
|
|
|
|
|
|
|
|||||||
| Noninterest income: |
||||||||||||
| Service charges on deposit accounts |
15,066 | 15,567 | 15,778 | |||||||||
| Trust and investment services |
9,595 | 8,642 | 8,118 | |||||||||
| Bankcard services |
2,921 | 3,094 | 3,386 | |||||||||
| BOLI income |
2,612 | 2,561 | 2,428 | |||||||||
| Gain on sale of loans |
1,101 | 732 | 6,001 | |||||||||
| Decrease in FDIC loss sharing asset, net |
(5) | (902) | (3,591) | |||||||||
| Other |
4,262 | 3,789 | 4,292 | |||||||||
|
|
|
|
|
|
|
|||||||
| Total noninterest income |
35,552 | 33,483 | 36,412 | |||||||||
|
|
|
|
|
|
|
|||||||
| Noninterest expense: |
||||||||||||
| Salaries and employee benefits |
82,630 | 78,618 | 76,644 | |||||||||
| Occupancy and equipment |
15,641 | 14,892 | 15,264 | |||||||||
| Professional services |
5,054 | 5,757 | 5,460 | |||||||||
| Software licenses and maintenance |
5,465 | 5,368 | 5,402 | |||||||||
| Marketing and promotion |
5,027 | 5,015 | 5,195 | |||||||||
| Recapture of provision for unfunded loan commitments |
(450) | (500) | (1,250) | |||||||||
| Debt termination expense |
16 | 13,870 | - | |||||||||
| Acquisition related expenses |
1,897 | 475 | 1,973 | |||||||||
| Impairment loss on asset held-for-sale |
2,558 | - | - | |||||||||
| Legal settlement |
1,500 | - | - | |||||||||
| Other |
17,402 | 17,164 | 17,541 | |||||||||
|
|
|
|
|
|
|
|||||||
| Total noninterest expense |
136,740 | 140,659 | 126,229 | |||||||||
|
|
|
|
|
|
|
|||||||
| Earnings before income taxes |
162,286 | 151,366 | 162,797 | |||||||||
|
|
|
|
|
|
|
|||||||
| Income taxes |
60,857 | 52,221 | 58,776 | |||||||||
|
|
|
|
|
|
|
|||||||
| Net earnings |
$ | 101,429 | $ | 99,145 | $ | 104,021 | ||||||
|
|
|
|
|
|
|
|||||||
| Other comprehensive (loss) income: |
||||||||||||
| Unrealized (loss) gain on securities arising during the period, before tax |
$ | (17,966) | $ | (17,550) | $ | 69,661 | ||||||
| Less: Reclassification adjustment for net (gain) loss on securities included in net income |
(548) | 22 | - | |||||||||
|
|
|
|
|
|
|
|||||||
| Other comprehensive (loss) income, before tax |
(18,514) | (17,528) | 69,661 | |||||||||
| Less: Income tax benefit (expense) related to items of other comprehensive income |
7,776 | 7,362 | (29,256) | |||||||||
|
|
|
|
|
|
|
|||||||
| Other comprehensive (loss) income, net of tax |
(10,738) | (10,166) | 40,405 | |||||||||
|
|
|
|
|
|
|
|||||||
| Comprehensive income |
$ | 90,691 | $ | 88,979 | $ | 144,426 | ||||||
|
|
|
|
|
|
|
|||||||
| Basic earnings per common share |
$ | 0.94 | $ | 0.93 | $ | 0.98 | ||||||
| Diluted earnings per common share |
$ | 0.94 | $ | 0.93 | $ | 0.98 | ||||||
| Cash dividends declared per common share |
$ | 0.48 | $ | 0.48 | $ | 0.40 | ||||||
See accompanying notes to the consolidated financial statements.
97
Table of Contents
CVB FINANCIAL CORP. AND SUBSIDIARIES
CONSOLIDATED STATEMENTS OF STOCKHOLDERS’ EQUITY
(Dollars and shares in thousands)
| Common Shares Outstanding |
Common Stock | Retained Earnings |
Accumulated Other Comprehensive Income (Loss) |
Total | ||||||||||||||||
| Balance, January 1, 2014 |
105,370 | $ | 491,068 | $ | 290,149 | $ | (9,330) | $ | 771,887 | |||||||||||
| Repurchase of common stock |
(384) | (5,474) | - | - | (5,474) | |||||||||||||||
| Exercise of stock options |
512 | 5,522 | - | - | 5,522 | |||||||||||||||
| Tax benefit from exercise of stock options |
- | 1,116 | - | - | 1,116 | |||||||||||||||
| Shares issued pursuant to stock-based compensation plan |
395 | 2,988 | - | - | 2,988 | |||||||||||||||
| Cash dividends declared on common stock ($0.40 per share) |
- | - | (42,356) | - | (42,356) | |||||||||||||||
| Net earnings |
- | - | 104,021 | - | 104,021 | |||||||||||||||
| Other comprehensive income |
- | - | - | 40,405 | 40,405 | |||||||||||||||
|
|
|
|
|
|
|
|
|
|
|
|||||||||||
| Balance, December 31, 2014 |
105,893 | $ | 495,220 | $ | 351,814 | $ | 31,075 | $ | 878,109 | |||||||||||
|
|
|
|
|
|
|
|
|
|
|
|||||||||||
| Repurchase of common stock |
(54) | (834) | - | - | (834) | |||||||||||||||
| Exercise of stock options |
449 | 5,144 | - | - | 5,144 | |||||||||||||||
| Tax benefit from exercise of stock options |
- | 308 | - | - | 308 | |||||||||||||||
| Shares issued pursuant to stock-based compensation plan |
97 | 2,733 | - | - | 2,733 | |||||||||||||||
| Cash dividends declared on common stock ($0.48 per share) |
- | - | (51,040) | - | (51,040) | |||||||||||||||
| Net earnings |
- | - | 99,145 | - | 99,145 | |||||||||||||||
| Other comprehensive loss |
- | - | - | (10,166) | (10,166) | |||||||||||||||
|
|
|
|
|
|
|
|
|
|
|
|||||||||||
| Balance, December 31, 2015 |
106,385 | $ | 502,571 | $ | 399,919 | $ | 20,909 | $ | 923,399 | |||||||||||
|
|
|
|
|
|
|
|
|
|
|
|||||||||||
| Repurchase of common stock |
(116) | (1,907) | - | - | (1,907) | |||||||||||||||
| Issuance of common stock for acquisition of County Commerce Bank |
1,394 | 21,642 | - | - | 21,642 | |||||||||||||||
| Exercise of stock options |
483 | 5,151 | - | - | 5,151 | |||||||||||||||
| Tax benefit from exercise of stock options |
- | 932 | - | - | 932 | |||||||||||||||
| Shares issued pursuant to stock-based compensation plan |
106 | 2,803 | - | - | 2,803 | |||||||||||||||
| Cash dividends declared on common stock ($0.48 per share) |
- | - | (51,849) | - | (51,849) | |||||||||||||||
| Net earnings |
- | - | 101,429 | - | 101,429 | |||||||||||||||
| Other comprehensive loss |
- | - | - | (10,738) | (10,738) | |||||||||||||||
|
|
|
|
|
|
|
|
|
|
|
|||||||||||
| Balance, December 31, 2016 |
108,252 | $ | 531,192 | $ | 449,499 | $ | 10,171 | $ | 990,862 | |||||||||||
|
|
|
|
|
|
|
|
|
|
|
|||||||||||
See accompanying notes to the consolidated financial statements.
98
Table of Contents
CVB FINANCIAL CORP. AND SUBSIDIARIES
CONSOLIDATED STATEMENTS OF CASH FLOWS
(Dollars in thousands)
| For the Year Ended December 31, | ||||||||||||
| 2016 | 2015 | 2014 | ||||||||||
| Cash Flows from Operating Activities |
||||||||||||
| Interest and dividends received |
$ | 279,210 | $ | 277,593 | $ | 263,878 | ||||||
| Service charges and other fees received |
31,044 | 29,604 | 34,527 | |||||||||
| Interest paid |
(7,987) | (9,467) | (16,067) | |||||||||
| Net cash paid to vendors, employees and others |
(127,003) | (132,499) | (134,913) | |||||||||
| Income taxes paid, net |
(51,495) | (58,500) | (58,589) | |||||||||
| Payments to FDIC, loss share agreement |
(514) | (1,089) | (1,134) | |||||||||
|
|
|
|
|
|
|
|||||||
| Net cash provided by operating activities |
123,255 | 105,642 | 87,702 | |||||||||
|
|
|
|
|
|
|
|||||||
| Cash Flows from Investing Activities |
||||||||||||
| Proceeds from redemption of FHLB stock |
1,423 | 7,750 | 10,413 | |||||||||
| Net change in interest-earning balances from depository institutions |
47,179 | (5,573) | 53,687 | |||||||||
| Proceeds from sale of investment securities |
1,957 | 975 | - | |||||||||
| Proceeds from repayment of investment securities available-for-sale |
448,823 | 395,430 | 349,473 | |||||||||
| Proceeds from maturity of investment securities available-for-sale |
97,603 | 128,709 | 75,916 | |||||||||
| Purchases of investment securities available-for-sale |
(461,674) | (694,630) | (805,544) | |||||||||
| Proceeds from repayment and maturity of investment securities held-to-maturity |
281,141 | 51,025 | - | |||||||||
| Purchases of investment securities held-to-maturity |
(346,334) | - | - | |||||||||
| Net increase in loan and lease finance receivables |
(203,040) | (189,707) | (16,767) | |||||||||
| Proceeds from sale of loans |
6,417 | 3,629 | 9,668 | |||||||||
| Proceeds from sales of premises and equipment |
- | 926 | 663 | |||||||||
| Purchase of premises and equipment |
(12,615) | (1,869) | (1,893) | |||||||||
| Proceeds from sales of other real estate owned |
2,102 | 2,587 | 5,825 | |||||||||
| Cash used in sale of branch, net |
(8,217) | - | - | |||||||||
| Cash paid for acquisition, net of cash acquired |
(7,504) | - | 50,038 | |||||||||
|
|
|
|
|
|
|
|||||||
| Net cash used in investing activities |
(152,739) | (300,748) | (268,521) | |||||||||
|
|
|
|
|
|
|
|||||||
| Cash Flows from Financing Activities |
||||||||||||
| Net increase in other deposits |
541,210 | 378,321 | 291,005 | |||||||||
| Net (decrease) increase in time deposits |
(363,486) | (65,719) | 44,647 | |||||||||
| Repayment of FHLB advances |
(5,000) | (200,000) | - | |||||||||
| Net increase (decrease) in other borrowings |
7,000 | - | (23,000) | |||||||||
| Net (decrease) increase in customer repurchase agreements |
(87,255) | 127,077 | (79,624) | |||||||||
| Cash dividends on common stock |
(51,625) | (48,862) | (42,298) | |||||||||
| Repurchase of common stock |
(1,907) | (834) | (5,474) | |||||||||
| Proceeds from exercise of stock options |
5,151 | 5,144 | 5,522 | |||||||||
| Tax benefit related to exercise of stock options |
932 | 308 | 1,116 | |||||||||
|
|
|
|
|
|
|
|||||||
| Net cash provided by financing activities |
45,020 | 195,435 | 191,894 | |||||||||
|
|
|
|
|
|
|
|||||||
| Net increase in cash and cash equivalents |
15,536 | 329 | 11,075 | |||||||||
| Cash and cash equivalents, beginning of period |
106,097 | 105,768 | 94,693 | |||||||||
|
|
|
|
|
|
|
|||||||
| Cash and cash equivalents, end of period |
$ | 121,633 | $ | 106,097 | $ | 105,768 | ||||||
|
|
|
|
|
|
|
|||||||
99
Table of Contents
CVB FINANCIAL CORP. AND SUBSIDIARIES
CONSOLIDATED STATEMENTS OF CASH FLOWS (Continued)
(Dollars in thousands)
| For the Year Ended December 31, | ||||||||||||
| 2016 | 2015 | 2014 | ||||||||||
| Reconciliation of Net Earnings to Net Cash Provided by Operating Activities |
||||||||||||
| Net earnings |
$ | 101,429 | $ | 99,145 | $ | 104,021 | ||||||
| Adjustments to reconcile net earnings to net cash provided by operating activities: |
||||||||||||
| Gain on sale of loans |
(1,101) | (732) | (6,001) | |||||||||
| Gain on sale of branch |
(272) | - | - | |||||||||
| Loss (gain) on sale of OREO |
27 | (384) | (957) | |||||||||
| (Gain) loss on sale of investment securities |
(548) | 22 | - | |||||||||
| Impairment loss on asset held-for-sale |
2,558 | - | - | |||||||||
| Increase in bank owned life insurance |
(3,829) | (4,029) | (2,314) | |||||||||
| Net amortization of premiums and discounts on investment securities |
21,005 | 19,540 | 21,020 | |||||||||
| Accretion of PCI discount |
(2,506) | (4,032) | (5,825) | |||||||||
| Recapture of provision for loan losses |
(6,400) | (5,600) | (16,100) | |||||||||
| Recapture of provision for unfunded loan commitments |
(450) | (500) | (1,250) | |||||||||
| Valuation adjustment on other real estate owned |
337 | 162 | 65 | |||||||||
| Payments to FDIC, loss share agreement |
(514) | (1,089) | (1,134) | |||||||||
| Stock-based compensation |
2,803 | 2,733 | 2,988 | |||||||||
| Depreciation and amortization, net |
3,802 | (1,474) | 832 | |||||||||
| Change in other assets and liabilities |
6,914 | 1,880 | (7,643) | |||||||||
|
|
|
|
|
|
|
|||||||
| Total adjustments |
21,826 | 6,497 | (16,319) | |||||||||
|
|
|
|
|
|
|
|||||||
| Net cash provided by operating activities |
$ | 123,255 | $ | 105,642 | $ | 87,702 | ||||||
|
|
|
|
|
|
|
|||||||
| Supplemental Disclosure of Non-cash Investing Activities |
||||||||||||
| Securities purchased and not settled |
$ | 23,777 | $ | 1,696 | $ | - | ||||||
| Transfer of loans to other real estate owned |
$ | - | $ | 3,721 | $ | 1,963 | ||||||
| Issuance of common stock for CCB acquistion |
$ | 21,642 | $ | - | ||||||||
| Transfer of AFS securities to HTM securities |
$ | - | $ | 898,598 | $ | - | ||||||
See accompanying notes to the consolidated financial statements.
100
Table of Contents
CVB FINANCIAL CORP. AND SUBSIDIARIES
NOTES TO CONSOLIDATED FINANCIAL STATEMENTS
THREE YEARS ENDED DECEMBER 31, 2016
| 1. | BUSINESS |
The consolidated financial statements include CVB Financial Corp. (referred to herein on an unconsolidated basis as “CVB” and on a consolidated basis as “we,” “our” or the “Company”) and its wholly owned subsidiary: Citizens Business Bank (the “Bank” or “CBB”) after elimination of all intercompany transactions and balances. The Company has one inactive subsidiary, Chino Valley Bancorp. The Company is also the common stockholder of CVB Statutory Trust III. CVB Statutory Trust III was created in January 2006 to issue trust preferred securities in order to raise capital for the Company. In accordance with Financial Accounting Standards Board (“FASB”) Accounting Standards Codification (“ASC”) 810, Consolidation, this trust does not meet the criteria for consolidation.
The Company’s primary operations are related to traditional banking activities. This includes the acceptance of deposits and the lending and investing of money through the operations of the Bank. The Bank also provides trust and investment-related services to customers through its CitizensTrust Division. The Bank’s customers consist primarily of small to mid-sized businesses and individuals located in the Inland Empire, Los Angeles County, Orange County, San Diego County, Ventura County, Santa Barbara, and the Central Valley area of California. The Bank operates 42 Business Financial Centers, eight Commercial Banking Centers, and three trust offices. The Company is headquartered in the city of Ontario, California.
On February 29, 2016, we acquired County Commerce Bank (“CCB”), headquartered in Oxnard, CA, with four branch locations in Ventura County with total assets of approximately $253 million. This acquisition extends our geographic footprint northward into the central coast of California. Our consolidated financial statements for 2016 include CCB operations, post-merger. See Note 4 — Business Combinations, included herein.
On September 22, 2016, we announced that we entered into a merger agreement with Valley Commerce Bancorp (“VCBP”), pursuant to which its subsidiary, Valley Business Bank will merge into Citizens Business Bank. Valley Business Bank has four branch locations and total assets of approximately $416 million. The FDIC and Valley Commerce Bancorp’s shareholders have approved the transaction and we expect to close the transaction as soon as all remaining conditions have been fulfilled.
| 2. | BASIS OF PRESENTATION |
The accompanying consolidated financial statements and notes thereto have been prepared in accordance with the rules and regulations of the Securities and Exchange Commission (“SEC”) for Form 10-K and conform to practices within the banking industry and include all of the information and disclosures required by accounting principles generally accepted in the United States of America (“GAAP”) for financial reporting.
Reclassification — Certain amounts in the prior periods’ financial statements and related footnote disclosures have been reclassified to conform to the current presentation with no impact on previously reported net income or stockholders’ equity.
| 3. | SUMMARY OF SIGNIFICANT ACCOUNTING POLICIES |
Segments — The Company’s operating business units have been divided into two reportable segments: (i) Business Financial and Commercial Banking Centers (“Centers”) and (ii) Dairy & Livestock and Agribusiness. All other operations have been aggregated in “Other”. The Centers and Dairy & Livestock and Agribusiness are the focal points for customer sales and services and the primary focus of management of the Company. The Centers’ lines of business generally consist of loans, deposits, and fee generating products and services that the Bank offers to its clients and prospects. In 2016, Dairy & Livestock and Agribusiness was reflected as our second reportable segment. All other operating departments have been aggregated and included
101
Table of Contents
in the “Other” category for reporting purposes. Recapture of provision for loan losses was allocated by segment based on loan type in 2016. Prior period information has been conformed to the current presentation. Refer to Note 21 — Business Segments of these consolidated financial statements.
Net income is determined based on the actual net income of the business unit plus the allocated income or expense based on the sources and uses of funds for each business unit. Noninterest income and noninterest expense are those items directly attributable to a business unit. The Company allocates internal funds to the segments using a methodology that charges users of funds interest expense and credits providers of funds interest income with the net effect of this allocation being recorded in the “Other” category. Taxes are not included in the segments as this is accounted for at the corporate level.
Cash and cash equivalents — Cash on hand, cash items in the process of collection, and amounts due from correspondent banks, the Federal Reserve Bank and interest-bearing balances due from depository institutions with initial terms of ninety days or less, are included in Cash and cash equivalents.
Investment Securities — The Company classifies as held-to-maturity (“HTM”) those debt securities that the Company has the positive intent and ability to hold to maturity. Securities classified as trading are those securities that are bought and held principally for the purpose of selling them in the near term. All other debt and equity securities are classified as available-for-sale (“AFS”). Securities held-to-maturity are accounted for at cost and adjusted for amortization of premiums and accretion of discounts. Trading securities are accounted for at fair value with the unrealized gains and losses being included in current earnings. Available-for-sale securities are accounted for at fair value, with the net unrealized gains and losses, net of income tax effects, presented as a separate component of stockholders’ equity. Realized gains and losses on sales of securities are recognized in earnings at the time of sale and are determined on a specific-identification basis. Purchase premiums and discounts are recognized in interest income using the effective-yield method over the estimated terms of the securities. For mortgage-backed securities (“MBS”), the amortization or accretion is based on estimated average lives of the securities. The lives of these securities can fluctuate based on the amount of prepayments received on the underlying collateral of the securities. The Company’s investment in the Federal Home Loan Bank of San Francisco (“FHLB”) stock is carried at cost.
At each reporting date, securities are assessed to determine whether there is an other-than-temporary impairment (“OTTI”). Other-than-temporary impairment on investment securities is not recognized in earnings when there are credit losses on a debt security for which management does not intend to sell and for which it is more-likely-than-not that the Company will not have to sell prior to recovery of the noncredit impairment. Otherwise, the portion of the total impairment that is attributable to the credit loss would be recorded in earnings, and the remaining difference between the debt security’s amortized cost and its fair value would be included in other comprehensive income.
During the quarter ended September 30, 2015, investment securities were transferred from the available-for-sale security portfolio to the held-to-maturity security portfolio. Transfers of securities into the held-to-maturity category from the available-for-sale category are transferred at fair value at the date of transfer. The fair value of these securities at the date of transfer was $898.6 million. The unrealized holding gain or loss at the date of transfer is retained in accumulated other comprehensive income (“AOCI”) and in the carrying value of the held-to-maturity securities. The net unrealized holding gain at the date of transfer was $3.9 million after-tax and will continue to be reported in AOCI and amortized over the remaining life of the securities as a yield adjustment.
Loans Held-for-Sale — Loans held-for-sale include loans transferred from our held-for-investment portfolio when a decision is made to sell a loan(s) and are reported at the lower of cost or fair value. If a reduction in value is required at time of the transfer, a charge-off is recorded against the allowance for loan losses (“ALLL”). Normally a formal marketing strategy or plan for sale is developed at the time the decision to sell the loan(s) is made. Any subsequent decline in value or any subsequent gain on sale of the loan(s) is recorded in current earnings and reported as part of other noninterest income. Gains or losses on the sale of loans that are held-for-sale are recognized at the time of sale and determined by the difference between net sale proceeds and the net book value of the loans.
102
Table of Contents
Loans and Lease Finance Receivables — Loans and lease finance receivables that management has the intent and ability to hold for the foreseeable future or until maturity or payoff are reported at the principal balance outstanding, less deferred net loan origination fees and purchase price discounts. Purchase Credit Impaired (“PCI”) loans are those loans that when we acquired them were deemed to be impaired. PCI loans are included in total loans and lease finance receivables as of December 31, 2016. Refer to Note 7 — Loans and Lease Finance Receivables and Allowance for Loan Losses for total loans, excluding PCI loans, by type and to Note 6 — Acquired SJB Assets and FDIC Loss Sharing Asset for PCI loans by type.
In the ordinary course of business, the Company enters into commitments to extend credit to its customers. To the extent that such commitments are unfunded, the related unfunded amounts are not reflected in the accompanying consolidated financial statements.
The Company receives collateral to support loans, lease finance receivables, and commitments to extend credit for which collateral is deemed necessary. The most significant categories for which collateral is deemed necessary are real estate, principally commercial and industrial income-producing properties, Small Business Administration (“SBA”) loans, real estate mortgages, assets utilized in dairy & livestock and agribusiness, and various personal property assets utilized in commercial and industrial business governed by the Uniform Commercial Code.
Nonrefundable fees and direct costs associated with the origination or purchase of loans are deferred and netted against outstanding loan balances. The deferred net loan fees and costs and purchase price discounts are recognized in interest income over the loan term using the effective-yield method.
Interest on loans and lease finance receivables, excluding PCI loans, is credited to income based on the principal amounts of such loans or receivables outstanding. Loans are considered delinquent when principal or interest payments are past due 30 days or more and generally remain on accrual status between 30 and 89 days past due. Interest income is not recognized on loans and lease finance receivables when collection of interest is deemed by management to be doubtful. Loans, excluding PCI loans, on which the accrual of interest has been discontinued are designated as nonaccrual loans. In general, interest shall not accrue on any loan, excluding PCI loans, for which payment in full of principal and interest is not expected, or when the loan becomes 90 days past due, unless the loan is both well secured and in the process of collection. Factors considered in determining that the full collection of principal and interest is no longer probable include cash flow and liquidity of the borrower or property, the financial position of the guarantors and their willingness to support the loan as well as other factors, and this determination involves significant judgment. When an asset is placed on nonaccrual status, previously accrued but unpaid interest is reversed against income. Subsequent collections of cash are applied as reductions to the principal balance unless the loan is returned to accrual status. Interest is not recognized using a cash-basis method. Nonaccrual loans may be restored to accrual status when principal and interest become current and when the borrower is able to demonstrate payment performance for a sustained period, typically for six months. A nonaccrual loan may return to accrual status sooner based on other significant events or mitigating circumstances. This policy is consistently applied to all types of loans and lease finance receivables, excluding PCI loans.
Troubled Debt Restructurings — Loans are reported as a Troubled Debt Restructuring (“TDR”) if the Company for economic or legal reasons related to the debtor’s financial difficulties grants a concession to the debtor that it would not otherwise consider. Types of modifications that may be considered concessions, which in turn result in a TDR include, but are not limited to, (i) a reduction of the stated interest rate for the remaining original life of the debt, (ii) an extension of the maturity date or dates at a stated interest rate lower than the current market rate for new debt with similar risk, (iii) a reduction of the face amount or maturity amount of the debt as stated in the instrument or other agreement, or (iv) a reduction of interest. As a result of these concessions, restructured loans are considered impaired, and the measurement of impairment is based on the Company’s policy for impaired loans. In addition, the Company may provide a concession to the debtor where it offers collateral and the value of such collateral is significant in proportion to the nature of the concession
103
Table of Contents
requested, and it substantially reduces the Company’s risk of loss. In such cases, these modifications are not considered a TDR as, in substance, no concession was made as a result of the significant additional collateral obtained.
When determining whether or not a loan modification is a TDR under ASC 310-40, the Company evaluates loan modification requests from borrowers experiencing financial difficulties on a case-by-case basis. Any such modifications granted are unique to the borrower’s circumstances. Because of the Company’s focus on the commercial lending sector, each business customer has unique attributes, which in turn means that modifications of loans to those customers are not easily categorized by type, key features, or other terms, but are evaluated individually based on all relevant facts and circumstances pertaining to the modification request and the borrower’s/guarantor’s financial condition at the time of the request. The evaluation of whether or not a borrower is experiencing financial difficulties will include, among other relevant factors considered by the Company, a review of significant factors such as (i) whether the borrower is in default on any of its debt, (ii) whether the borrower is experiencing payment delinquency, (iii) whether the global cash flows of the borrower and the owner guarantor(s) of the borrower have diminished below what is necessary to service existing debt obligations, (iv) whether the borrower’s forecasted cash flows will be insufficient to service the debt in future periods or in accordance with the contractual terms of the existing agreement through maturity, (v) whether the borrower is unable to refinance the subject debt from other financing sources with similar terms, and (vi) whether the borrower is in jeopardy as a going-concern and/or considering bankruptcy. In any case, the debtor is presumed to be experiencing financial difficulties if the Company determines it is probable the debtor will default on the original loan if the modification is not granted.
The types of loans subject to modification vary greatly, but during the subject period are concentrated in commercial and industrial loans, dairy & livestock and agribusiness loans, and term loans to commercial real estate investors. Some examples of key features include payment deferrals and delays, interest rate reductions, and extensions or renewals where the contract rate may or may not be below the market rate of interest for debt with similar characteristics as those of the modified debt. The typical length of the modified terms ranges from three (3) to twelve (12) months; however, all actual modified terms will depend on the facts, circumstances and attributes of the specific borrower requesting a modification. In general, after a careful evaluation of all relevant facts and circumstances taken together, including the nature of any concession, certain modification requests will result in troubled debt restructurings while certain other modifications will not, pursuant to the criteria and judgments as discussed throughout this report. In certain cases, modification requests for delays or deferrals of principal were evaluated and determined to be exempt from TDR reporting because they constituted insignificant delays under ASC 310-40-15.
In situations where the Company has determined that the borrower is experiencing financial difficulties and is evaluating whether a concession is insignificant, and therefore does not result in a TDR, such analysis is based on an evaluation of both the amount and the timing of the restructured payments, including the following factors:
| 1. | Whether the amount of the restructured payments subject to delay is insignificant relative to the unpaid principal balance or collateral value of the debt and will result in an insignificant shortfall in the contractual amount due; and |
| 2. | The delay is insignificant relative to any of the following: |
| • | The frequency of payments due; |
| • | The debt’s original contractual maturity; or |
| • | The debt’s original expected duration. |
Most modified loans not classified and accounted for as a TDR were performing and paying as agreed under their original terms in the six-month period immediately preceding a request for modification. Subsequently, these modified loans have continued to perform under the modified terms and deferrals that amounted to
104
Table of Contents
insignificant delays, which in turn is supported by the facts and circumstances of each individual customer and loan as described above. Payment performance continues to be monitored once modifications are made. The Company’s favorable experience regarding “re-defaults” under modified terms, or upon return of the loan to its original terms, indicates that such relief may improve ultimate collection and reduces the Company’s risk of loss.
Impaired Loans — A loan is generally considered impaired when based on current events and information it is probable that the Company will be unable to collect all amounts due according to the contractual terms of the loan agreement. A loan, including a restructured loan, for which there is an insignificant delay relative to the frequency of payments due, and/or the original contractual maturity, is not considered an impaired loan. Generally, impaired loans include loans on nonaccrual status and TDRs.
The Company’s policy is to record a specific valuation allowance, which is included in the allowance for loan losses, or to charge off that portion of an impaired loan that represents the impairment or shortfall amount as determined utilizing one of the three methods described in ASC 310-10-35-22. Impairment on non-collateral dependent restructured loans is measured by comparing the present value of expected future cash flows on the restructured loans discounted at the interest rate of the original loan agreement to the loan’s carrying value. The impairment amount, if any, is generally charged off and recorded against the allowance for loan losses at the time impairment is measurable and a probable loss is determined. As a result, most of the TDRs have no specific allowance allocated because, consistent with the Company’s stated practice, any impairment is typically charged off in the period in which it is identified. The Company measures impairment based on the present value of expected future cash flows discounted at the loan’s effective interest rate, except that as a practical expedient, the Company may also measure impairment based on an observable market price for the loan, or the value of the collateral, for collateral dependent loans. Impairment on collateral dependent restructured loans is measured by determining the amount by which our recorded investment in the impaired loan exceeds the fair value of the collateral less estimated selling costs. The fair value is generally determined by one or more appraisals of the collateral, performed by a Company-approved third-party independent appraiser. The majority of impaired loans that are collateral dependent are charged off down to their estimated fair value of the collateral (less selling costs) at each reporting date based on current appraised value.
Appraisals of the collateral for impaired collateral dependent loans are typically ordered at the time the loan is identified as showing signs of inherent weakness. These appraisals are normally updated at least annually, or more frequently, if there are concerns or indications that the value of the collateral may have changed significantly since the previous appraisal. On an exception basis, a specific valuation allowance is recorded on collateral dependent impaired loans when a current appraisal is not yet available, a recent appraisal is still under review or on single-family residential (“SFR”) mortgage loans if the loans are currently under review for a loan modification. Such valuation allowances are generally based on previous appraisals adjusted for current market conditions, based on preliminary appraisal values that are still being reviewed or for SFR mortgage loans under review for modification on an appraisal or indications of comparable home sales from external sources.
Charge-offs of unsecured consumer loans are recorded when the loan reaches 120 days past due or sooner as circumstances indicate. Except for the charge-offs of unsecured consumer loans, the charge-off policy is applied consistently across all portfolio segments. Impaired single-family mortgage loans that have been modified in accordance with the various government modification programs are also measured based on the present value of the expected cash flows discounted at the loan’s pre-modification interest rate. The Company recognizes the change in present value attributable to the passage of time as interest income on such performing SFR mortgage loans and the amount of interest income recognized to date has been insignificant.
Provision and Allowance for Loan Losses — The allowance for loan losses is management’s estimate of probable losses inherent in the loan and lease receivables portfolio. The allowance is increased by the provision for loan losses and recoveries of prior loan losses, and it is decreased by recapture of provision for loan losses and by charge-offs taken when management believes the uncollectability of any loan is confirmed. Subsequent recoveries, if any, are added to the allowance. The determination of the balance in the allowance for loan losses is based on an analysis of the loan and lease finance receivables portfolio using a systematic methodology and reflects an amount that, in management’s judgment, is appropriate to provide for probable loan losses inherent in
105
Table of Contents
the portfolio, after giving consideration to the character of the loan portfolio, current economic conditions, past loan loss experience, and such other factors that would deserve current recognition in estimating inherent loan losses.
There are different qualitative risks for the loans in each portfolio segment. The construction and real estate segments’ predominant risk characteristic is the collateral and the geographic location of the property collateralizing the loan as well as the operating cash flow for commercial real estate properties. The commercial and industrial segment’s predominant risk characteristics are the cash flows of the businesses we lend to, the global cash flows and liquidity of the guarantors, as well as economic and market conditions. The dairy & livestock segment’s predominant risk characteristics are milk and beef prices in the market as well as the cost of feed and cattle. The Agribusiness segment’s predominant risk characteristics are the supply and demand conditions of the product, production seasonality, the scale of operations and ability to control costs, the availability and cost of water, and operator experience. The municipal lease segment’s predominant risk characteristics are the municipality’s general financial condition and tax revenues or if applicable the specific project related financial condition. The consumer, auto and other segment’s predominant risk characteristics are employment and income levels as they relate to consumers and cash flows of the businesses as they relate to equipment and vehicle leases to businesses.
The Company’s methodology is consistently applied across all portfolio segments taking into account the applicable historical loss rates and the qualitative factors applicable to each pool of loans. A key factor in the Company’s methodology is the loan risk rating (Pass, Special Mention, Substandard, Doubtful and Loss). Loan risk ratings are updated as facts related to the loan or borrower become available. In addition, all term loans in excess of $1.0 million are subject to an annual internal credit review process where all factors underlying the loan, borrower and guarantors are subject to review which may result in changes to the loan’s risk rating. Periodically, we assess various attributes utilized in adjusting our historical loss factors to reflect our view of current economic conditions. The estimate is reviewed quarterly by the Board of Directors and management and periodically by various regulatory agencies and, as adjustments become necessary, they are reported in earnings in the periods in which they become known.
Our methodology for assessing the appropriateness of the allowance is conducted on a regular basis and considers the Bank’s overall loan portfolio. The Bank’s methodology consists of two major phases.
In the first phase, individual loans are reviewed to identify loans for impairment. Impairment is measured based on the Company’s policy. If an impaired loan is determined to be a collateral dependent loan, the Company determines the fair value of the loan and if it is less than the recorded investment in the loan, the Company either recognizes an impairment as a specific allowance, or charges off the impaired balance if it determined that such amount represents a confirmed loss. For non-collateral dependent loans, the Company measures impairment based on the comparison of the loan’s carrying value to the present value of expected future cash flows discounted at the interest rate on the original loan agreement. Loans determined to be impaired are excluded from the formula allowance so as not to double count the loss exposure.
The second phase is conducted by evaluating or segmenting the remainder of the loan portfolio into groups or pools of loans with similar characteristics. In this second phase, groups or pools of homogeneous loans are reviewed to determine a portfolio formula allowance. In the case of the portfolio formula allowance, homogeneous portfolios, such as small business loans, consumer loans, dairy & livestock and agribusiness loans, and real estate loans, are aggregated or pooled in determining the appropriate allowance. The risk assessment process in this case emphasizes trends in the different portfolios for delinquency, loss, and other behavioral characteristics of the subject portfolio over a relevant period.
Included in this second phase is our consideration of qualitative factors, including, all known relevant internal and external factors that may affect the collectability of a loan. This includes our estimates of the amounts necessary for concentrations, economic uncertainties, the volatility of the market value of collateral, and other relevant factors. These qualitative factors are used to adjust the historical loan loss rates for each pool of loans to determine the probable loan losses inherent in the portfolio.
106
Table of Contents
Periodically, we assess various attributes utilized in adjusting our historical loss factors to reflect current economic conditions. The methodology is consistently applied across all the portfolio segments taking into account the applicable historical loss rates and the qualitative factors applicable to each pool of loans.
During the fourth quarter of 2015 the Bank implemented an enhanced ALLL methodology and governance. These enhancements included (i) changes to the look back period, (ii) further aggregation of the loan segments, (iii) updates of the historical loss rates, (iv) updates to the qualitative factors, and (v) updates to the documentation, controls and validation of the ALLL methodology. The look back period was changed from the previous rolling 20-quarters to a through-the-cycle time frame beginning with the first quarter of 2009 through the fourth quarter of 2015. This change encompassed the time period outlined and continues to expand by one quarter until such time that the current economic cycle ends, triggered by independent evidence that a recession has begun. This change was implemented to lengthen the look back period to produce meaningful results that more appropriately reflect the level of incurred losses in the Bank’s loan portfolio given the current, extended credit cycle. Similarly, the Bank analyzed its various loan segments and aggregated loans with similar risk characteristics into eight (8) segments in order to capture sufficient loss observations, and to produce more reliable historical loss rates for a given segment. In addition, the Bank enhanced its calculation of loss emergence periods for each loan segment and applied them to the through-the-cycle historical loss rates. The update to the qualitative factor component of the ALLL provided for increased use of quantitative metrics and application to each of the factors utilizing a comparison of current measurements to historical results within the range of the expanded look back period. Based upon the aforementioned changes in the ALLL methodology the documentation, controls, validation and governance processes have been further enhanced to ensure that the overall ALLL process is structured, transparent and repeatable. The Bank annually updates its ALLL methodology to ensure the relevance and reliability of key measures and assumptions that produce the allowance outcomes over the following four (4) quarters until the next update.
Purchase Credit Impaired Loans — PCI loans are those loans that we acquired in the San Joaquin Bank (“SJB”) acquisition for which we were “covered” for reimbursement for a substantial portion of any future losses under the terms of the FDIC loss sharing agreement. We account for PCI loans under ASC 310-30, Loans and Debt Securities Acquired with Deteriorated Credit Quality (“acquired impaired loan accounting”) when (i) we acquire loans deemed to be impaired when there is evidence of credit deterioration since their origination and it is probable at the date of acquisition that we would be unable to collect all contractually required payments and (ii) as a general policy election for non-impaired loans that we acquire in a distressed bank acquisition. Acquired impaired loans are accounted for individually or in pools of loans based on common risk characteristics. The excess of the loan’s or pool’s scheduled contractual principal and interest payments over all cash flows expected at acquisition is the nonaccretable difference. The remaining amount, representing the excess of the loan’s cash flows expected to be collected over the fair value is the accretable yield (accreted into interest income over the remaining life of the loan or pool). Refer to Note 6 — Acquired SJB Assets and FDIC Loss Sharing Asset for PCI loans by type at December 31, 2016.
Provision for loan losses on the PCI portfolio will be recorded if there is deterioration in the expected cash flows on PCI loans as a result of deteriorated credit quality, compared to those previously. The portion of the loss on SJB loans reimbursable from the FDIC was recorded in noninterest income as a decrease in the FDIC loss sharing asset. Decreases in expected cash flows on the acquired impaired loans as of the measurement date compared to previously estimated are recognized by recording a provision for loan losses on acquired impaired loans. Loans accounted for as part of a pool are measured based on the expected cash flows of the entire pool.
FDIC Loss Sharing Asset — On October 16, 2009, the Bank acquired substantially all of the assets and assumed substantially all of the liabilities of SJB from the FDIC in an FDIC-assisted transaction. The Bank entered into a loss sharing agreement with the FDIC, whereby the FDIC covered a substantial portion of any future losses on certain acquired assets. The acquired assets subject to the loss sharing agreement are referred to collectively as covered assets during the term of the indemnification agreement. Under the terms of such loss sharing agreement, the FDIC absorbs 80% of losses and shares in 80% of loss recoveries up to $144.0 million
107
Table of Contents
with respect to “covered” assets, after a first loss amount of $26.7 million. The FDIC will reimburse the Bank for 95% of losses and share in 95% of loss recoveries in excess of $144.0 million with respect to covered assets. The loss sharing agreement covered 5 years for commercial loans and 10 years for single-family residential loans from the October 16, 2009 acquisition date and the loss recovery provisions are in effect for 8 and 10 years, respectively, for commercial and single-family residential loans from the acquisition date.
The FDIC loss sharing asset was initially recorded at fair value which represents the present value of the estimated cash payments from the FDIC for future losses on covered loans. The ultimate collectability of this asset was dependent upon the performance of the underlying covered loans, the passage of time and claims paid by the FDIC. The loss estimates used in calculating the FDIC loss sharing asset were determined on the same basis as the loss estimates on the related covered loans and was the present value of the cash flows the Company expected to collect from the FDIC under the loss sharing agreement. The difference between the present value and the undiscounted cash flows the Company expected to collect from the FDIC was accreted (or amortized) into noninterest income over the life of the FDIC indemnification asset. The FDIC indemnification asset was adjusted for any changes in expected cash flows based on covered loan performance. Any increases in the cash flows of covered loans over those expected reduced the FDIC indemnification asset and any decreases in the cash flows of covered loans over those acquired decreased the FDIC indemnification asset, with the remaining balance amortized on the same basis as the discount, not to exceed its remaining contract life. These increases and decreases to the FDIC indemnification asset were recorded as adjustments to noninterest income. As the loss sharing agreement for commercial loans expired on October 16, 2014, the expected reimbursement from the FDIC under the shared-loss agreements has decreased and a net payable to the FDIC was included in other liabilities December 31, 2016.
Other Real Estate Owned — Other real estate owned (“OREO”) represents real estate acquired through foreclosure in lieu of repayment of commercial and real estate loans and is stated at fair value, less estimated costs to sell (fair value at time of foreclosure). Loan balances in excess of fair value of the real estate acquired at the date of acquisition are charged against the allowance for loan losses. Any subsequent operating expenses or income, reduction in estimated values, and gains or losses on disposition of such properties are charged to current operations. Gain recognition upon disposition of a property is dependent on the sale having met certain criteria relating to the buyer’s initial investment in the property sold.
Premises and Equipment — Premises and equipment are stated at cost, less accumulated depreciation, which is provided for in amounts sufficient to relate the cost of depreciable assets to operations over the estimated service lives of the respective asset and are computed on a straight-line basis. The ranges of useful lives of the principal classes of assets are as follows:
| Bank premises | 15 – 39 years | |||
| Leasehold improvements | Shorter of estimated economic lives of 15 years or term of the lease. | |||
| Computer equipment | 3 – 5 years | |||
| Furniture, fixtures and equipment | 5 – 7 years |
Long-lived assets are reviewed periodically for impairment when events or changes in circumstances indicate that the carrying amount may not be recoverable. The existence of impairment is based on undiscounted cash flows. To the extent impairment exists, the impairment is calculated as the difference in fair value of assets and their carrying value. The impairment loss, if any, would be recorded in noninterest expense.
Long-lived assets classified as held-for-sale are measured at the lower of its carrying amount or fair value less cost to sell. Assets-held-for sale include long-lived assets transferred from our “held-and-used” portfolio in the period in which the following criteria are met:
| • | Management, having the authority to approve the action, commits to a plan to sell the asset. |
| • | The asset is available for immediate sale, an active program to locate a buyer and other actions required to complete the plan to sell the asset have been initiated. |
108
Table of Contents
| • | The sale of the asset is probable, and transfer of the asset is expected to qualify for recognition as a completed sale, within one year. |
| • | The asset is being actively marketed for sale at a price that is reasonable in relation to its current fair value. |
| • | Actions required to complete the plan indicate that it is unlikely that significant changes to the plan will be made or that the plan will be withdrawn. |
Goodwill and Intangible Assets — Goodwill resulting from business combinations prior to January 1, 2009, represents the excess of the purchase price over the fair value of the net assets of the businesses acquired. Goodwill resulting from business combinations after January 1, 2009, is generally determined as the excess of the fair value of the consideration transferred, plus the fair value of any non-controlling interest in the acquiree, over the fair value of the net assets acquired and liabilities assumed as of the acquisition date. Goodwill and intangible assets acquired in a purchase business combination and determined to have an indefinite useful life are not amortized, but tested for impairment at least annually, or more frequently if events and circumstances exist that indicate that a goodwill impairment test should be performed.
Intangible assets with definite useful lives are amortized over their estimated useful lives to their estimated residual values. Goodwill is the only intangible asset with an indefinite life on our balance sheets. Based on the Company’s annual impairment test, there was zero recorded impairment as of December 31, 2016.
Other intangible assets consist of core deposit intangible assets arising from business combinations and are amortized using an accelerated method over their estimated useful lives.
Use of Fair Value — We use fair value measurements to record fair value adjustments to certain financial instruments and to determine fair value disclosures. Investment securities available-for-sale and interest-rate swaps are financial instruments recorded at fair value on a recurring basis. Additionally, from time to time, we may be required to record at fair value other assets on a non-recurring basis, such as impaired loans, OREO, goodwill, and other intangible assets. These non-recurring fair value adjustments typically involve application of lower-of-cost-or-market accounting or write-downs of individual assets. Further, we include in Note 20 — Fair Value Information of the consolidated financial statements information about the extent to which fair value is used to measure assets and liabilities, the valuation methodologies used and its impact to earnings. Additionally, for financial instruments not recorded at fair value we disclose the estimate of their fair value.
Bank Owned Life Insurance — The Company invests in Bank-Owned Life Insurance (“BOLI”). BOLI involves the purchasing of life insurance by the Company on a select group of employees. The Company is the owner and primary beneficiary of these policies. BOLI is recorded as an asset at the cash surrender value. Increases in the cash value of these policies, as well as insurance proceeds received, are recorded in other noninterest income and are not subject to income tax for as long as they are held for the life of the covered employee.
Income Taxes — Income taxes are accounted for under the asset and liability method. Deferred tax assets and liabilities are recognized for the future tax consequences attributable to differences between the financial statement carrying amounts of existing assets and liabilities and their respective tax bases and operating loss and tax credit carryforwards. Deferred tax assets and liabilities are measured using enacted tax rates expected to apply to taxable income in the years in which those temporary differences are expected to be recovered or settled. The effect on deferred tax assets and liabilities of a change in tax rates is recognized in income in the period that includes the enactment date. Future realization of deferred tax assets ultimately depends on the existence of sufficient taxable income of the appropriate character (for example, ordinary income or capital gain) within the carryback or carryforward periods available under the tax law. Based on historical and future expected taxable earnings and available strategies, the Company considers the future realization of these deferred tax assets more likely than not.
109
Table of Contents
The tax effects from an uncertain tax position are recognized in the financial statements only if, based on its merits, the position is more likely than not to be sustained on audit by the taxing authorities. Interest and penalties related to uncertain tax positions are recorded as part of other operating expense.
Earnings per Common Share — The Company calculates earnings per common share (“EPS”) using the two-class method. The two-class method requires the Company to present EPS as if all of the earnings for the period are distributed to common shareholders and any participating securities. All outstanding unvested share-based payment awards that contain rights to non-forfeitable dividends are considered participating securities. The Company grants restricted shares under the 2008 Equity Incentive Plan that qualify as participating securities. Restricted shares issued under this plan are entitled to dividends at the same rate as common stock. A reconciliation of the numerator and the denominator used in the computation of basic and diluted earnings per common share is included in Note 17 — Earnings Per Share Reconciliation of these consolidated financial statements.
Stock-Based Compensation — Consistent with the provisions of ASC 718, Stock Compensation, we recognize expense for the grant date fair value of stock options and restricted shares issued to employees, officers and non-employee directors over the their requisite service periods (generally the vesting period). The service periods may be subject to performance conditions.
The fair value of each stock option grant is estimated as of the grant date using the Black-Scholes option-pricing model. Management assumptions used at the time of grant impact the fair value of the option calculated under the Black-Scholes option-pricing model, and ultimately, the expense that will be recognized over the life of the option.
The grant date fair value of restricted stock awards is measured at the fair value of the Company’s common stock as if the restricted share was vested and issued on the date of grant.
Additional information is included in Note 18 — Stock Option Plans and Restricted Stock Awards of the consolidated financial statements included herein.
Derivative Financial Instruments — All derivative instruments, including certain derivative instruments embedded in other contracts, are recognized on the consolidated balance sheets at fair value. For derivatives designated as fair value hedges, changes in the fair value of the derivative and the hedged item related to the hedged risk are recognized in earnings. Changes in fair value of derivatives designated and accounted for as cash flow hedges, to the extent they are effective as hedges, are recorded in “Other Comprehensive Income,” net of deferred taxes, and are subsequently reclassified to earnings when the hedged transaction affects earnings. Any hedge ineffectiveness would be recognized in the income statement line item pertaining to the hedged item.
Statement of Cash Flows — Cash and cash equivalents, as reported in the statements of cash flows, include cash and due from banks, interest-bearing balances due from depository institutions and federal funds sold with original maturities of three months or less. Cash flows from loans and deposits are reported net.
CitizensTrust — This division provides trust, investment and brokerage related services and asset management, as well as financial planning, estate planning, retirement planning, and business succession planning services. CitizensTrust services its clients through three offices in Southern California: Pasadena, Ontario and Newport Beach. At December 31, 2016, CitizensTrust had approximately $2.69 billion in assets under management and administration, including $2.08 billion in assets under management. The amount of these funds and the related liability have not been recorded in the accompanying consolidated balance sheets because they are not assets or liabilities of the Bank or Company, with the exception of any funds held on deposit with the Bank.
Use of Estimates in the Preparation of Financial Statements — The preparation of financial statements in conformity with GAAP requires management to make estimates and assumptions that affect the reported amounts of assets and liabilities and disclosures of contingent assets and liabilities at the date of the financial
110
Table of Contents
statements and the reported amounts of revenues and expenses during the reporting period. Actual results could differ from those estimates. A material estimate that is particularly susceptible to significant change in the near term relates to the determination of the allowance for loan losses. Other significant estimates which may be subject to change include fair value determinations and disclosures, impairment of investments, goodwill, loans, as well as valuation of deferred tax assets, other intangibles and OREO.
Other Contingencies — In the ordinary course of business, the Company becomes involved in litigation. Based upon the Company’s internal records and discussions with legal counsel, the Company records accruals as appropriate, for estimates of the probable outcome of all cases brought against the Company. Except as discussed in Note 15 — Commitments and Contingencies at December 31, 2016, the Company does not have any litigation accruals and is not aware of any material pending legal action or complaints asserted against the Company.
Recent Accounting Pronouncements — In May 2014, the FASB issued ASU No. 2014-09, “Revenue from Contracts with Customers (Topic 606)”, which provides revenue recognition guidance that is intended to create greater consistency with respect to how and when revenue from contracts with customers is shown in the income statement. This update to the ASC requires an entity to recognize the amount of revenue to which it expects to be entitled for the transfer of promised goods or services to customers. The ASU will replace most existing revenue recognition guidance in U.S. GAAP when it becomes effective. In applying the revenue model to contracts within its scope, an entity should apply the following steps: (1) Identify the contract(s) with a customer, (2) Identify the performance obligations in the contract, (3) Determine the transaction price, (4) Allocate the transaction price to the performance obligations in the contract, and (5) Recognize revenue when (or as) the entity satisfies a performance obligation. The standard applies to all contracts with customers except those that are within the scope of other topics in the FASB Codification. The standard also requires significantly expanded disclosures about revenue recognition. In August 2015, the FASB issued ASU No. 2015-14, “Revenue from Contracts with Customers (Topic 606) - Deferral of the Effective Date”, which deferred the effective date for us of ASU No. 2014-09 to January 1, 2018. The Company intends to adopt the accounting standard during the first quarter of 2018, as required. The Company has not yet selected a transition method. The Company’s preliminary analysis suggests that the adoption of this accounting standard is not expected to have a material impact on the Company’s consolidated financial statements as substantially all of the Company’s revenues are excluded from the scope of the new standard. New accounting guidance related to the adoption of this standard continues to be released by the FASB, which could impact the Company’s preliminary analysis of materiality and may change the preliminary conclusions reached as to the application of this new guidance.
In February 2016, FASB issued ASU No. 2016-02, “Leases (Topic 842)”. ASU 2016-02 establishes a right-of-use (“ROU”) model that requires a lessee to record a ROU asset and a lease liability on the balance sheet for all leases with terms longer than 12 months. Leases will be classified as either finance or operating, with classification affecting the pattern of expense recognition in the income statement. The new standard is effective for fiscal years beginning after December 15, 2018, including interim periods within those fiscal years. A modified retrospective transition approach is required for lessees for capital and operating leases existing at, or entered into after, the beginning of the earliest comparative period presented in the financial statements, with certain practical expedients available. The Company is currently evaluating the impact of adoption of this ASU on its consolidated financial statements.
In June 2016, the FASB issued ASU No. 2016-13, “Financial Instruments – Credit Losses (Topic 326): Measurement of Credit Losses on Financial Instruments.” This ASU significantly changes how entities will measure credit losses for most financial assets and certain other instruments that are not measured at fair value through net income. The standard will replace the current “incurred loss” approach with an “expected loss” model. The new model, referred to as the Current Expected Credit Loss (“CECL”) model, will apply to: (1) financial assets subject to credit losses and measured at amortized cost, and (2) certain off-balance sheet credit exposures. This includes, but is not limited to, loans, leases, held-to-maturity securities, loan commitments, and financial guarantees. The CECL model does not apply to available-for-sale debt securities. For AFS debt securities with unrealized losses, entities will measure credit losses in a manner similar to what they do today,
111
Table of Contents
except that the losses will be recognized as allowances rather than reductions in the amortized cost of the securities. As a result, entities will recognize improvements to estimated credit losses immediately in earnings rather than as interest income over time, as they do today. ASU No. 2016-13 is effective for interim and annual reporting periods beginning after December 15, 2019. Entities will apply the standard’s provisions as a cumulative-effect adjustment to retained earnings as of the beginning of the first reporting period in which the guidance is effective (i.e., modified retrospective approach). The Company is currently evaluating the impact of adoption of this ASU on its consolidated financial statements.
In August 2016, the FASB issued ASU No. 2016-15, “Statement of Cash Flows (Topic 230): Classification of Certain Cash Receipts and Cash Payments.” The new guidance clarifies the classification within the statement of cash flows for certain transactions, including debt extinguishment costs, zero-coupon debt, contingent consideration related to business combinations, insurance proceeds, equity method distributions and beneficial interests in securitizations. The guidance also clarifies that cash flows with aspects of multiple classes of cash flows or that cannot be separated by source or use should be classified based on the activity that is likely to be the predominant source or use of cash flows for the item. This guidance is effective for fiscal years beginning after December 15, 2017 and will require application using a retrospective transition method. The Company is currently evaluating the impact of adoption of this ASU on its consolidated financial statements.
| 4. | BUSINESS COMBINATIONS |
County Commerce Bank Acquisition (“CCB”)
On February 29, 2016, the Bank acquired all of the assets and assumed all of the liabilities of CCB for $20.6 million in cash and $21.6 million in stock. As a result, CCB was merged with the Bank, the principal subsidiary of CVB. The Company believes this transaction serves to further expand its footprint northward into and along the central coast of California. At close, CCB had four branches located in Ventura, Oxnard, Camarillo, and Westlake Village. The systems integration of CCB and CBB was completed in April 2016.
Goodwill of $15.3 million from the acquisition represents the excess of the purchase price over the fair value of the net tangible and intangible assets acquired.
The total fair value of assets acquired approximated $252.4 million, which included $54.8 million in cash and balances due from depository institutions, $1.5 million in FHLB stock, $168.0 million in loans and lease finance receivables, $8.6 million in fixed assets, $3.9 million in core deposit intangible assets acquired and $289,000 in other assets. The total fair value of liabilities assumed was $230.8 million, which included $224.2 million in deposits, $5.0 million in FHLB advances and $1.6 million in other liabilities. The assets and liabilities, both tangible and intangible, were recorded at their estimated fair values as of February 29, 2016. The assets acquired and liabilities assumed have been accounted for under the acquisition method accounting. The purchase price allocation was finalized in the fourth quarter of 2016.
We have included the financial results of the business combination in the condensed consolidated statement of earnings and comprehensive income beginning on the acquisition date.
For the years ended December 31, 2016 and 2015, the Company incurred non-recurring merger related expenses associated with the CCB acquisition of $1.4 million and $475,000, respectively.
American Security Bank Acquisition (“ASB”)
On May 15, 2014, the Bank acquired all of the assets and assumed all of the liabilities of ASB for $57.0 million in cash. As a result, ASB was merged with CBB, the principal subsidiary of CVB. The Company believes this transaction serves to further expand its footprint in Southern California. At close, ASB had five branches located in the Southern California communities of: Newport Beach, Laguna Niguel, Corona, Lancaster, and Apple Valley. ASB also had two electronic branch vestibules in the High Desert area of California and a loan production office in Ontario, California. In the latter half of the third quarter of 2014, branch locations were
112
Table of Contents
consolidated and the two electronic banking vestibules were closed. By the end of 2014, the integration of ASB into CBB was completed. This included personnel decisions, center consolidations and system conversions.
Goodwill of $19.1 million from the acquisition represents the excess of the purchase price over the fair value of the net tangible and identified intangible assets acquired.
The total fair value of assets acquired approximated $436.4 million, which included $117.8 million in cash and cash due from banks, $44.5 million in investment securities available for sale, $1.9 million in FHLB stock, $242.7 million in loans receivable, $4.8 million in fixed assets, $2.1 million in core deposit intangible assets acquired, $1.6 million in OREO, and $1.8 million in other assets. The total fair value of liabilities assumed was $379.4 million, which included $378.4 million in deposits and $1.0 million in other liabilities. The assets and liabilities, both tangible and intangible, were recorded at their estimated fair values as of May 15, 2014. The assets acquired and liabilities assumed have been accounted for under the purchase accounting method. The final purchase price allocation was completed in the fourth quarter of 2014.
We have included the financial results of the business combination in the consolidated statement of earnings and comprehensive income beginning on the acquisition date.
For the years ended December 31, 2016 and 2015, the Company did not incur merger related expenses associated with the ASB acquisition.
| 5. | INVESTMENT SECURITIES |
The amortized cost and estimated fair value of investment securities are summarized below. The majority of securities held are traded in markets where similar assets are actively traded. Estimated fair values were obtained from an independent pricing service based upon market quotes.
| December 31, 2016 | ||||||||||||||||||||
| Amortized Cost |
Gross Unrealized Holding Gain |
Gross Unrealized Holding Loss |
Fair Value | Total Percent |
||||||||||||||||
| (Dollars in thousands) | ||||||||||||||||||||
| Investment securities available-for-sale: |
||||||||||||||||||||
| Government agency/GSE |
$ | 2,750 | $ | 2 | $ | - | $ | 2,752 | 0.12% | |||||||||||
| Residential mortgage-backed securities |
1,822,168 | 18,812 | (6,232) | 1,834,748 | 80.81% | |||||||||||||||
| CMO/REMIC - residential |
345,313 | 3,361 | (1,485) | 347,189 | 15.29% | |||||||||||||||
| Municipal bonds |
80,137 | 889 | (955) | 80,071 | 3.53% | |||||||||||||||
| Other securities |
5,506 | 200 | - | 5,706 | 0.25% | |||||||||||||||
|
|
|
|
|
|
|
|
|
|
|
|||||||||||
| Total available-for-sale securities |
$ | 2,255,874 | $ | 23,264 | $ | (8,672) | $ | 2,270,466 | 100.00% | |||||||||||
|
|
|
|
|
|
|
|
|
|
|
|||||||||||
| Investment securities held-to-maturity (1): |
||||||||||||||||||||
| Government agency/GSE |
$ | 182,648 | $ | 362 | (1,972) | $ | 181,038 | 20.03% | ||||||||||||
| Residential mortgage-backed securities |
193,699 | - | (1,892) | 191,807 | 21.25% | |||||||||||||||
| CMO |
244,419 | - | (6,808) | 237,611 | 26.81% | |||||||||||||||
| Municipal bonds |
290,910 | 776 | (4,768) | 286,918 | 31.91% | |||||||||||||||
|
|
|
|
|
|
|
|
|
|
|
|||||||||||
| Total held-to-maturity securities |
$ | 911,676 | $ | 1,138 | $ | (15,440) | $ | 897,374 | 100.00% | |||||||||||
|
|
|
|
|
|
|
|
|
|
|
|||||||||||
113
Table of Contents
| December 31, 2015 | ||||||||||||||||||||
| Amortized Cost |
Gross Unrealized Holding Gain |
Gross Unrealized Holding Loss |
Fair Value | Total Percent |
||||||||||||||||
| (Dollars in thousands) | ||||||||||||||||||||
| Investment securities available-for-sale: |
||||||||||||||||||||
| Government agency/GSE |
$ | 5,752 | $ | - | $ | (7) | $ | 5,745 | 0.24% | |||||||||||
| Residential mortgage-backed securities |
1,788,857 | 26,001 | (1,761) | 1,813,097 | 76.55% | |||||||||||||||
| CMO/REMIC - residential |
380,166 | 4,689 | (1,074) | 383,781 | 16.20% | |||||||||||||||
| Municipal bonds |
157,940 | 3,036 | (3) | 160,973 | 6.80% | |||||||||||||||
| Other securities |
5,000 | 50 | - | 5,050 | 0.21% | |||||||||||||||
|
|
|
|
|
|
|
|
|
|
|
|||||||||||
| Total available-for-sale securities |
$ | 2,337,715 | $ | 33,776 | $ | (2,845) | $ | 2,368,646 | 100.00% | |||||||||||
|
|
|
|
|
|
|
|
|
|
|
|||||||||||
| Investment securities held-to-maturity (1): |
||||||||||||||||||||
| Government agency/GSE |
$ | 293,338 | $ | 1,176 | $ | (734) | $ | 293,780 | 34.47% | |||||||||||
| Residential mortgage-backed securities |
232,053 | - | (1,293) | 230,760 | 27.27% | |||||||||||||||
| CMO |
1,284 | 569 | - | 1,853 | 0.15% | |||||||||||||||
| Municipal bonds |
324,314 | 3,051 | (719) | 326,646 | 38.11% | |||||||||||||||
|
|
|
|
|
|
|
|
|
|
|
|||||||||||
| Total held-to-maturity securities |
$ | 850,989 | $ | 4,796 | $ | (2,746) | $ | 853,039 | 100.00% | |||||||||||
|
|
|
|
|
|
|
|
|
|
|
|||||||||||
(1) Securities held-to-maturity are presented in the consolidated balance sheets at amortized cost.
During the quarter ended September 30, 2015, investment securities were transferred from the available-for-sale security portfolio to the held-to-maturity security portfolio. Transfers of securities into the held-to-maturity category from the available-for-sale category are transferred at fair value at the date of transfer. The fair value of these securities at the date of transfer was $898.6 million. The unrealized holding gain or loss at the date of transfer is retained in AOCI and in the carrying value of the held-to-maturity securities. The net unrealized holding gain at the date of transfer was $3.9 million after-tax and will continue to be reported in AOCI and amortized over the remaining life of the securities as a yield adjustment. At December 31, 2016, investment securities HTM totaled $911.7 million. The after-tax unrealized gain reported in AOCI on investment securities HTM was $1.7 million at December 31, 2016.
The following table provides information about the amount of interest income earned on investment securities which is fully taxable and which is exempt from regular federal income tax.
| For the Year Ended December 31, | ||||||||||||
| 2016 | 2015 | 2014 | ||||||||||
| (Dollars in thousands) | ||||||||||||
| Investment securities available-for-sale: |
||||||||||||
| Taxable |
$ | 43,538 | $ | 48,854 | $ | 47,301 | ||||||
| Tax-advantaged |
4,164 | 14,336 | 20,913 | |||||||||
|
|
|
|
|
|
|
|||||||
| Total interest income from |
47,702 | 63,190 | 68,214 | |||||||||
|
|
|
|
|
|
|
|||||||
| Investment securities held-to-maturity: |
||||||||||||
| Taxable |
10,183 | 4,451 | 164 | |||||||||
| Tax-advantaged |
10,044 | 4,567 | - | |||||||||
|
|
|
|
|
|
|
|||||||
| Total interest income from |
20,227 | 9,018 | 164 | |||||||||
|
|
|
|
|
|
|
|||||||
| Total interest income from investment securities |
$ | 67,929 | $ | 72,208 | $ | 68,378 | ||||||
|
|
|
|
|
|
|
|||||||
114
Table of Contents
Approximately 88% of the total investment securities portfolio at December 31, 2016 represents securities issued by the U.S government or U.S. government-sponsored enterprises, with the implied guarantee of payment of principal and interest. All non-agency available-for-sale Collateralized Mortgage Obligations (“CMO”)/Real Estate Mortgage Investment Conduit (“REMIC”) issues held are rated investment grade or better by either Standard & Poor’s or Moody’s, as of December 31, 2016 and 2015. At December 31, 2016, the Bank had $84,000 in total CMO backed by whole loans issued by private-label companies (nongovernment sponsored).
There was a $548,000 realized gain for the year ended December 31, 2016, compared to $22,000 in realized losses for the year ended December 31, 2015 and zero realized gains or losses for the year ended December 31, 2014.
The tables below show the Company’s investment securities’ gross unrealized losses and fair value by investment category and length of time that individual securities have been in a continuous unrealized loss position at December 31, 2016 and 2015. Management has reviewed individual securities to determine whether a decline in fair value below the amortized cost basis is other-than-temporary. The unrealized losses on these securities were primarily attributed to changes in interest rates. The issuers of these securities have not, to our knowledge, evidenced any cause for default on these securities. These securities have fluctuated in value since their purchase dates as market rates have fluctuated. However, we have the ability and the intention to hold these securities until their fair values recover to cost or maturity. As such, management does not deem these securities to be OTTI.
As of December 31, 2015, the Company had one OTTI HTM security with a net carrying value of $1.3 million. This security sold for a net gain of $546,000 in the third quarter of 2016. The Company did not record any charges for OTTI losses for the years ended December 31, 2016 and 2015.
| December 31, 2016 | ||||||||||||||||||||||||
| Less Than 12 Months | 12 Months or Longer | Total | ||||||||||||||||||||||
| Fair Value | Gross Unrealized Holding Losses |
Fair Value | Gross Unrealized Holding Losses |
Fair Value | Gross Unrealized Holding Losses |
|||||||||||||||||||
| (Dollars in thousands) | ||||||||||||||||||||||||
| Investment securities available-for-sale: |
||||||||||||||||||||||||
| Government agency/GSE |
$ | - | $ | - | $ | - | $ | - | $ | - | $ | - | ||||||||||||
| Residential mortgage-backed securities |
583,143 | (6,232) | - | - | 583,143 | (6,232) | ||||||||||||||||||
| CMO/REMIC - residential |
128,595 | (1,485) | - | - | 128,595 | (1,485) | ||||||||||||||||||
| Municipal bonds |
23,255 | (954) | 5,981 | (1) | 29,236 | (955) | ||||||||||||||||||
| Other securities |
- | - | - | - | - | - | ||||||||||||||||||
|
|
|
|
|
|
|
|
|
|
|
|
|
|||||||||||||
| Total available-for-sale securities |
$ | 734,993 | $ | (8,671) | $ | 5,981 | $ | (1) | $ | 740,974 | $ | (8,672) | ||||||||||||
|
|
|
|
|
|
|
|
|
|
|
|
|
|||||||||||||
| Investment securities held-to-maturity: |
||||||||||||||||||||||||
| Government agency/GSE |
$ | 76,854 | $ | (1,972) | $ | - | $ | - | $ | 76,854 | $ | (1,972) | ||||||||||||
| Residential mortgage-backed securities |
191,807 | (1,892) | - | - | 191,807 | (1,892) | ||||||||||||||||||
| CMO |
237,611 | (6,808) | - | - | 237,611 | (6,808) | ||||||||||||||||||
| Municipal bonds |
145,804 | (3,711) | 36,971 | (1,057) | 182,775 | (4,768) | ||||||||||||||||||
|
|
|
|
|
|
|
|
|
|
|
|
|
|||||||||||||
| Total held-to-maturity securities |
$ | 652,076 | $ | (14,383) | $ | 36,971 | $ | (1,057) | $ | 689,047 | $ | (15,440) | ||||||||||||
|
|
|
|
|
|
|
|
|
|
|
|
|
|||||||||||||
115
Table of Contents
| December 31, 2015 | ||||||||||||||||||||||||
| Less Than 12 Months | 12 Months or Longer | Total | ||||||||||||||||||||||
| Fair Value | Gross Unrealized Holding Losses |
Fair Value | Gross Unrealized Holding Losses |
Fair Value | Gross Unrealized Holding Losses |
|||||||||||||||||||
| (Dollars in thousands) | ||||||||||||||||||||||||
| Investment securities available-for-sale: |
||||||||||||||||||||||||
| Government agency/GSE |
$ | 5,745 | $ | (7) | $ | - | $ | - | $ | 5,745 | $ | (7) | ||||||||||||
| Residential mortgage-backed securities |
437,699 | (1,761) | - | - | 437,699 | (1,761) | ||||||||||||||||||
| CMO/REMIC - residential |
171,923 | (1,074) | - | - | 171,923 | (1,074) | ||||||||||||||||||
| Municipal bonds |
398 | (2) | 5,961 | (1) | 6,359 | (3) | ||||||||||||||||||
| Other securities |
- | - | - | - | - | - | ||||||||||||||||||
|
|
|
|
|
|
|
|
|
|
|
|
|
|||||||||||||
| Total available-for-sale securities |
$ | 615,765 | $ | (2,844) | $ | 5,961 | $ | (1) | $ | 621,726 | $ | (2,845) | ||||||||||||
|
|
|
|
|
|
|
|
|
|
|
|
|
|||||||||||||
| Investment securities held-to-maturity: |
||||||||||||||||||||||||
| Government agency/GSE |
$ | 84,495 | $ | (734) | $ | - | $ | - | $ | 84,495 | $ | (734) | ||||||||||||
| Residential mortgage-backed securities |
230,760 | (1,293) | - | - | 230,760 | (1,293) | ||||||||||||||||||
| CMO |
- | - | - | - | - | - | ||||||||||||||||||
| Municipal bonds |
110,119 | (719) | - | - | 110,119 | (719) | ||||||||||||||||||
|
|
|
|
|
|
|
|
|
|
|
|
|
|||||||||||||
| Total held-to-maturity securities |
$ | 425,374 | $ | (2,746) | $ | - | $ | - | $ | 425,374 | $ | (2,746) | ||||||||||||
|
|
|
|
|
|
|
|
|
|
|
|
|
|||||||||||||
The following summarizes our analysis of these securities and the unrealized losses. This assessment was based on the following factors: i) the length of the time and the extent to which the fair value has been less than amortized cost; ii) adverse condition specifically related to the security, an industry, or a geographic area and whether or not the Company expects to recover the entire amortized cost, iii) historical and implied volatility of the fair value of the security; iv) the payment structure of the security and the likelihood of the issuer being able to make payments in the future; v) failure of the issuer of the security to make scheduled interest or principal payments, vi) any changes to the rating of the security by a rating agency, and vii) recoveries or additional declines in fair value subsequent to the balance sheet date.
Government Agency & Government-Sponsored Enterprise (“GSE”) — The government agency bonds are backed by the full faith and credit of agencies of the U.S. Government. While the Government-Sponsored Enterprise bonds are not expressly guaranteed by the U.S. Government, they are currently being supported by the U.S. Government under a conservatorship arrangement. As of December 31, 2016, approximately $114.1 million in U.S. government agency bonds were callable. These securities are bullet securities, that is, they have a defined maturity date on which the principal is paid. The contractual term of these investments provides that the Company will receive the face value of the bond at maturity which will equal the amortized cost of the bond. Interest is received throughout the life of the security. Accordingly, it is expected that the securities would not be settled at a price less than the amortized cost of the bonds.
Mortgage-Backed Securities (“MBS”) and CMO/REMIC — Most of the Company’s mortgage-backed and CMO/REMIC securities are issued by Government Agencies or Government-Sponsored Enterprises such as Ginnie Mae, Fannie Mae and Freddie Mac. These securities are collateralized or backed by the underlying residential or commercial mortgages. All mortgage-backed securities are considered to be rated investment grade with a weighted average life of approximately 4.4 years. Of the total MBS/CMO, 99.997% have the implied guarantee of U.S. Government-Sponsored Agencies and Enterprises. The remaining 0.003% are issued by banks. Accordingly, it is expected that the securities would not be settled at a price less than the amortized cost of the bonds. There were no credit-related OTTI recognized in earnings for the years ended December 31, 2016 and 2015.
Municipal Bonds — The majority of the Company’s municipal bonds, with maturities of approximately 9.9 years, are insured by the largest U.S. bond insurance companies. The Company diversifies its holdings by owning selections of securities from different issuers and by holding securities from geographically diversified municipal issuers, thus reducing the Company’s exposure to any single adverse event. The decline in fair value is
116
Table of Contents
primarily due to the changes in interest rates. Since the Company does not intend to sell the investments and it is not more likely than not that the Company will be required to sell the investments before recovery of their amortized costs, these investments are not considered other than temporarily impaired at December 31, 2016.
At December 31, 2016 and 2015, investment securities having a carrying value of approximately $2.19 billion and $2.81 billion, respectively, were pledged to secure public deposits, short and long-term borrowings, and for other purposes as required or permitted by law.
The amortized cost and fair value of debt securities at December 31, 2016, by contractual maturity, are shown in the table below. Although mortgage-backed securities and CMO/REMIC have contractual maturities through 2057, expected maturities will differ from contractual maturities because borrowers may have the right to prepay such obligations without penalty. Mortgage-backed securities and CMO/REMIC are included in maturity categories based upon estimated prepayment speeds.
| December 31, 2016 | ||||||||||||||||
| Available-for-sale | Held-to-maturity | |||||||||||||||
| Amortized Cost |
Fair Value | Amortized Cost |
Fair Value | |||||||||||||
| (Dollars in thousands) | ||||||||||||||||
| Due in one year or less |
$ | 16,863 | $ | 17,004 | $ | - | $ | - | ||||||||
| Due after one year through five years |
1,974,483 | 1,986,171 | 355,263 | 349,455 | ||||||||||||
| Due after five years through ten years |
87,968 | 88,907 | 200,570 | 196,869 | ||||||||||||
| Due after ten years |
176,560 | 178,384 | 355,843 | 351,050 | ||||||||||||
|
|
|
|
|
|
|
|
|
|||||||||
| Total investment securities |
$ | 2,255,874 | $ | 2,270,466 | $ | 911,676 | $ | 897,374 | ||||||||
|
|
|
|
|
|
|
|
|
|||||||||
The investment in FHLB stock is periodically evaluated for impairment based on, among other things, the capital adequacy of the FHLB and its overall financial condition. No impairment losses have been recorded through December 31, 2016.
| 6. | ACQUIRED SJB ASSETS AND FDIC LOSS SHARING ASSET |
FDIC Assisted Acquisition
On October 16, 2009, the Bank acquired SJB and entered into a loss sharing agreements with the FDIC that is more fully discussed in Note 3 — Summary of Significant Accounting Policies included herein. The acquisition has been accounted for under the purchase method of accounting. The assets and liabilities were recorded at their estimated fair values as of the October 16, 2009 acquisition date. The acquired loans were accounted for as PCI loans. The application of the purchase method of accounting resulted in an after-tax gain of $12.3 million which was included in 2009 earnings. The gain is the negative goodwill resulting from the acquired assets and liabilities recognized at fair value.
At December 31, 2016, the remaining discount associated with the PCI loans approximated $1.5 million. Based on the Company’s regular forecast of expected cash flows from these loans, approximately $1.0 million of the related discount is expected to accrete into interest income over the remaining average lives of the respective pools, which approximates 2.5 years. The loss sharing agreement for commercial loans expired October 16, 2014.
117
Table of Contents
The following table provides a summary of PCI loans and lease finance receivables by type and by internal risk ratings (credit quality indicators) for the periods presented.
| December 31, | ||||||||
| 2016 | 2015 | |||||||
| (Dollars in thousands) | ||||||||
| Commercial and industrial |
$ | 2,309 | $ | 7,473 | ||||
| SBA |
327 | 393 | ||||||
| Real estate: |
||||||||
| Commercial real estate |
67,594 | 81,786 | ||||||
| Construction |
- | - | ||||||
| SFR mortgage |
178 | 193 | ||||||
| Dairy & livestock and agribusiness |
1,216 | 1,429 | ||||||
| Municipal lease finance receivables |
- | - | ||||||
| Consumer and other loans |
1,469 | 2,438 | ||||||
|
|
|
|
|
|||||
| Gross PCI loans |
73,093 | 93,712 | ||||||
| Less: Purchase accounting discount |
(1,508) | (3,872) | ||||||
|
|
|
|
|
|||||
| Gross PCI loans, net of discount |
71,585 | 89,840 | ||||||
| Less: Allowance for PCI loan losses |
(1,219) | - | ||||||
|
|
|
|
|
|||||
| Net PCI loans |
$ | 70,366 | $ | 89,840 | ||||
|
|
|
|
|
|||||
Credit Quality Indicators
The following table summarizes gross PCI loans by internal risk ratings for the periods presented.
| December 31, | ||||||||
| 2016 | 2015 | |||||||
| (Dollars in thousands) | ||||||||
| Pass |
$ | 59,409 | $ | 76,401 | ||||
| Special mention |
1,162 | 11,142 | ||||||
| Substandard |
12,522 | 6,169 | ||||||
| Doubtful & loss |
- | - | ||||||
|
|
|
|
|
|||||
| Total gross PCI loans |
$ | 73,093 | $ | 93,712 | ||||
|
|
|
|
|
|||||
118
Table of Contents
FDIC Loss Sharing Liability
The following table summarizes the activity related to the FDIC loss sharing liability for the periods presented.
| For the Year Ended December 31, | ||||||||
| 2016 | 2015 | |||||||
| (Dollars in thousands) | ||||||||
| Balance, beginning of period |
$ | (229) | $ | 299 | ||||
| FDIC share of recoveries, net of charge-offs |
(5) | (902) | ||||||
| Cash paid to (received from) FDIC, net |
514 | 1,089 | ||||||
| Net amortization (1) |
- | - | ||||||
| Other |
(782) | (715) | ||||||
|
|
|
|
|
|||||
| Balance, end of period |
$ | (502) | $ | (229) | ||||
|
|
|
|
|
|||||
| (1) | Net amortization included accelerated amortization as a result of loans being paid off in full, sold, or transferred to OREO. |
Through December 31, 2016, the Bank has submitted claims to the FDIC for net losses on PCI loans totaling $119.1 million.
| 7. | LOANS AND LEASE FINANCE RECEIVABLES AND ALLOWANCE FOR LOAN LOSSES |
The following table provides a summary of total loans and lease finance receivables, excluding PCI loans, by type.
| December 31, | ||||||||
| 2016 | 2015 | |||||||
| (Dollars in thousands) | ||||||||
| Commercial and industrial |
$ | 485,078 | $ | 434,099 | ||||
| SBA |
97,184 | 106,867 | ||||||
| Real estate: |
||||||||
| Commercial real estate |
2,930,141 | 2,643,184 | ||||||
| Construction |
85,879 | 68,563 | ||||||
| SFR mortgage |
250,605 | 233,754 | ||||||
| Dairy & livestock and agribusiness |
338,631 | 305,509 | ||||||
| Municipal lease finance receivables |
64,639 | 74,135 | ||||||
| Consumer and other loans |
78,274 | 69,278 | ||||||
|
|
|
|
|
|||||
| Gross loans, excluding PCI loans |
4,330,431 | 3,935,389 | ||||||
| Less: Deferred loan fees, net |
(6,952) | (8,292) | ||||||
|
|
|
|
|
|||||
| Gross loans, excluding PCI loans, net of deferred loan fees |
4,323,479 | 3,927,097 | ||||||
| Less: Allowance for loan losses |
(60,321) | (59,156) | ||||||
|
|
|
|
|
|||||
| Net loans, excluding PCI loans |
4,263,158 | 3,867,941 | ||||||
|
|
|
|
|
|||||
| PCI Loans |
73,093 | 93,712 | ||||||
| Discount on PCI loans |
(1,508) | (3,872) | ||||||
| Less: Allowance for loan losses |
(1,219) | - | ||||||
|
|
|
|
|
|||||
| PCI loans, net |
70,366 | 89,840 | ||||||
|
|
|
|
|
|||||
| Total loans and lease finance receivables |
$ | 4,333,524 | $ | 3,957,781 | ||||
|
|
|
|
|
|||||
119
Table of Contents
As of December 31, 2016, 75.43% of the total gross loan portfolio (excluding PCI loans) consisted of real estate loans, 67.66% of which consisted of commercial real estate loans. Substantially all of the Company’s real estate loans and construction loans are secured by real properties located in California. As of December 31, 2016, $180.6 million, or 6.16% of the total commercial real estate loans included loans secured by farmland, compared to $173.0 million, or 6.54%, at December 31, 2015. The loans secured by farmland included $127.1 million for loans secured by dairy & livestock land and $53.6 million for loans secured by agricultural land at December 31, 2016, compared to $128.4 million for loans secured by dairy & livestock land and $44.6 million for loans secured by agricultural land at December 31, 2015. As of December 31, 2016, dairy & livestock and agribusiness loans of $338.6 million was comprised of $317.9 million for dairy & livestock loans and $20.7 million for agribusiness loans, compared to $287.0 million for dairy & livestock loans and $18.5 million for agribusiness loans at December 31, 2015.
At December 31, 2016, the Company held approximately $2.00 billion of total fixed rate loans, including PCI loans.
At December 31, 2016 and 2015, loans totaling $3.11 billion and $2.91 billion, respectively, were pledged to secure the borrowings and available lines of credit from the FHLB and the Federal Reserve Bank.
There were no outstanding loans held-for-sale as of December 31, 2016 and 2015.
Credit Quality Indicators
Central to our credit risk management is our loan risk rating system. The originating officer assigns each loan an initial risk rating, which is reviewed and confirmed or changed, as appropriate, by credit management. Approvals are made based upon the amount of inherent credit risk specific to the transaction and are reviewed for appropriateness by senior line and credit management personnel. Credits are monitored by line and credit management personnel for deterioration in a borrower’s financial condition, which would impact the ability of the borrower to perform under the contract. Risk ratings are adjusted as necessary.
Loans are risk rated into the following categories (Credit Quality Indicators): Pass, Special Mention, Substandard, Doubtful and Loss. Each of these groups is assessed for the proper amount to be used in determining the adequacy of our allowance for losses. These categories can be described as follows:
Pass — These loans, including loans on the Bank’s internal watch list, range from minimal credit risk to lower than average, but still acceptable, credit risk. Watch list loans usually require more than normal management attention. Loans on the watch list may involve borrowers with adverse financial trends, higher debt/equity ratios, or weaker liquidity positions, but not to the degree of being considered a defined weakness or problem loan where risk of loss may be apparent.
Special Mention — Loans assigned to this category have potential weaknesses that deserve management’s close attention. If left uncorrected, these potential weaknesses may result in the deterioration of the repayment prospects for the asset or the Company’s credit position at some future date. Special mention assets are not adversely classified and do not expose the Company to sufficient risk to warrant adverse classification.
Substandard — Loans classified as substandard are inadequately protected by the current sound worth and paying capacity of the obligor or of the collateral pledged, if any. Assets so classified must have a well-defined weakness, or weaknesses, that jeopardize the liquidation of the debt. Substandard loans are characterized by the distinct possibility that the Company will sustain some loss if deficiencies are not corrected.
Doubtful — Loans classified as doubtful have all the weaknesses inherent in those classified substandard with the added characteristic that the weaknesses make collection or the liquidation in full, on the basis of currently existing facts, conditions and values, highly questionable and improbable.
120
Table of Contents
Loss — Loans classified as loss are considered uncollectible and of such little value that their continuance as bankable assets is not warranted. This classification does not mean that the loan has absolutely no recovery or salvage value, but rather that it is not practical or desirable to defer writing off this asset with insignificant value even though partial recovery may be effected in the future.
The following table summarizes loans by type, excluding PCI loans, according to our internal risk ratings for the periods presented.
| December 31, 2016 | ||||||||||||||||||||
| Pass | Special Mention |
Substandard | Doubtful & Loss |
Total | ||||||||||||||||
| (Dollars in thousands) | ||||||||||||||||||||
| Commercial and industrial |
$ | 449,658 | $ | 21,610 | $ | 13,809 | $ | 1 | $ | 485,078 | ||||||||||
| SBA |
80,138 | 10,553 | 6,482 | 11 | 97,184 | |||||||||||||||
| Real estate: |
||||||||||||||||||||
| Commercial real estate |
||||||||||||||||||||
| Owner occupied |
842,992 | 87,781 | 19,046 | - | 949,819 | |||||||||||||||
| Non-owner occupied |
1,941,203 | 23,534 | 15,585 | - | 1,980,322 | |||||||||||||||
| Construction |
||||||||||||||||||||
| Speculative |
48,841 | - | - | - | 48,841 | |||||||||||||||
| Non-speculative |
37,038 | - | - | - | 37,038 | |||||||||||||||
| SFR mortgage |
243,374 | 4,930 | 2,301 | - | 250,605 | |||||||||||||||
| Dairy & livestock and agribusiness |
187,819 | 114,106 | 36,706 | - | 338,631 | |||||||||||||||
| Municipal lease finance receivables |
60,102 | 4,537 | - | - | 64,639 | |||||||||||||||
| Consumer and other loans |
74,328 | 2,123 | 1,819 | 4 | 78,274 | |||||||||||||||
|
|
|
|
|
|
|
|
|
|
|
|||||||||||
| Total gross loans, excluding PCI loans |
$ | 3,965,493 | $ | 269,174 | $ | 95,748 | $ | 16 | $ | 4,330,431 | ||||||||||
|
|
|
|
|
|
|
|
|
|
|
|||||||||||
| December 31, 2015 | ||||||||||||||||||||
| Pass | Special Mention |
Substandard | Doubtful & Loss |
Total | ||||||||||||||||
| (Dollars in thousands) | ||||||||||||||||||||
| Commercial and industrial |
$ | 398,651 | $ | 33,000 | $ | 2,403 | $ | 45 | $ | 434,099 | ||||||||||
| SBA |
87,441 | 13,169 | 4,854 | 1,403 | 106,867 | |||||||||||||||
| Real estate: |
||||||||||||||||||||
| Commercial real estate |
||||||||||||||||||||
| Owner occupied |
772,114 | 54,758 | 11,481 | - | 838,353 | |||||||||||||||
| Non-owner occupied |
1,741,615 | 26,170 | 37,046 | - | 1,804,831 | |||||||||||||||
| Construction |
||||||||||||||||||||
| Speculative |
38,186 | - | 7,651 | - | 45,837 | |||||||||||||||
| Non-speculative |
22,726 | - | - | - | 22,726 | |||||||||||||||
| SFR mortgage |
227,207 | 3,556 | 2,991 | - | 233,754 | |||||||||||||||
| Dairy & livestock and agribusiness |
285,647 | 19,862 | - | - | 305,509 | |||||||||||||||
| Municipal lease finance receivables |
69,194 | 4,941 | - | - | 74,135 | |||||||||||||||
| Consumer and other loans |
64,844 | 1,618 | 2,708 | 108 | 69,278 | |||||||||||||||
|
|
|
|
|
|
|
|
|
|
|
|||||||||||
| Total gross loans, excluding PCI loans |
$ | 3,707,625 | $ | 157,074 | $ | 69,134 | $ | 1,556 | $ | 3,935,389 | ||||||||||
|
|
|
|
|
|
|
|
|
|
|
|||||||||||
Allowance for Loan Losses
The Bank’s Director Loan Committee provides Board oversight of the ALLL process and approves the ALLL methodology on a quarterly basis.
Our methodology for assessing the appropriateness of the allowance is conducted on a regular basis and considers the Bank’s overall loan portfolio. Refer to Note 3 — Summary of Significant Accounting Policies for a more detailed discussion concerning the allowance for loan losses.
Management believes that the ALLL was appropriate at December 31, 2016 and 2015. No assurance can be given that economic conditions which adversely affect the Company’s service areas or other circumstances will not be reflected in increased provisions for loan losses in the future.
121
Table of Contents
The following tables present the balance and activity related to the allowance for loan losses for held-for-investment loans by type for the periods presented.
| For the Year Ended December 31, 2016 | ||||||||||||||||||||
| Ending Balance December 31, 2015 |
Charge-offs | Recoveries | (Recapture of) Provision for Loan Losses |
Ending Balance December 31, 2016 |
||||||||||||||||
| (Dollars in thousands) | ||||||||||||||||||||
| Commercial and industrial |
$ | 8,588 | $ | (120) | $ | 630 | $ | (944) | $ | 8,154 | ||||||||||
| SBA |
993 | - | 40 | (162) | 871 | |||||||||||||||
| Real estate: |
||||||||||||||||||||
| Commercial real estate |
36,995 | - | 792 | (344) | 37,443 | |||||||||||||||
| Construction |
2,389 | - | 7,174 | (8,467) | 1,096 | |||||||||||||||
| SFR mortgage |
2,103 | (102) | - | 286 | 2,287 | |||||||||||||||
| Dairy & livestock and agribusiness |
6,029 | - | 216 | 2,296 | 8,541 | |||||||||||||||
| Municipal lease finance receivables |
1,153 | - | - | (212) | 941 | |||||||||||||||
| Consumer and other loans |
906 | (16) | 170 | (72) | 988 | |||||||||||||||
| PCI loans |
- | - | - | 1,219 | 1,219 | |||||||||||||||
|
|
|
|
|
|
|
|
|
|
|
|||||||||||
| Total allowance for loan losses |
$ | 59,156 | $ | (238) | $ | 9,022 | $ | (6,400) | $ | 61,540 | ||||||||||
|
|
|
|
|
|
|
|
|
|
|
|||||||||||
| For the Year Ended December 31, 2015 | ||||||||||||||||||||
| Ending Balance December 31, 2014 |
Charge-offs | Recoveries | (Recapture of) Provision for Loan Losses (1) |
Ending Balance December 31, 2015 |
||||||||||||||||
| (Dollars in thousands) | ||||||||||||||||||||
| Commercial and industrial |
$ | 7,074 | $ | (411) | $ | 319 | $ | 1,606 | $ | 8,588 | ||||||||||
| SBA |
2,557 | (37) | 41 | (1,568) | 993 | |||||||||||||||
| Real estate: |
||||||||||||||||||||
| Commercial real estate |
33,373 | (117) | 4,330 | (591) | 36,995 | |||||||||||||||
| Construction |
988 | - | 581 | 820 | 2,389 | |||||||||||||||
| SFR mortgage |
2,344 | (215) | 186 | (212) | 2,103 | |||||||||||||||
| Dairy & livestock and agribusiness |
5,479 | - | 407 | 143 | 6,029 | |||||||||||||||
| Municipal lease finance receivables |
1,412 | - | - | (259) | 1,153 | |||||||||||||||
| Consumer and other loans |
1,262 | (229) | 76 | (203) | 906 | |||||||||||||||
| Unallocated (1) |
5,336 | - | - | (5,336) | - | |||||||||||||||
|
|
|
|
|
|
|
|
|
|
|
|||||||||||
| Total allowance for loan losses |
$ | 59,825 | $ | (1,009) | $ | 5,940 | $ | (5,600) | $ | 59,156 | ||||||||||
|
|
|
|
|
|
|
|
|
|
|
|||||||||||
| For the Year Ended December 31, 2014 | ||||||||||||||||||||
| Ending Balance December 31, 2013 |
Charge-offs | Recoveries | (Recapture of) Provision for Loan Losses |
Ending Balance December 31, 2014 |
||||||||||||||||
| (Dollars in thousands) | ||||||||||||||||||||
| Commercial and industrial |
$ | 8,502 | $ | (888) | $ | 873 | $ | (1,413) | $ | 7,074 | ||||||||||
| SBA |
2,332 | (50) | 114 | 161 | 2,557 | |||||||||||||||
| Real estate: |
||||||||||||||||||||
| Commercial real estate |
39,402 | (353) | 140 | (5,816) | 33,373 | |||||||||||||||
| Construction |
1,305 | - | 885 | (1,202) | 988 | |||||||||||||||
| SFR mortgage |
2,718 | - | 401 | (775) | 2,344 | |||||||||||||||
| Dairy & livestock and agribusiness |
11,728 | (1,061) | 492 | (5,680) | 5,479 | |||||||||||||||
| Municipal lease finance receivables |
2,335 | - | - | (923) | 1,412 | |||||||||||||||
| Consumer and other loans |
960 | (17) | 154 | 165 | 1,262 | |||||||||||||||
| Unallocated (1) |
5,953 | - | - | (617) | 5,336 | |||||||||||||||
|
|
|
|
|
|
|
|
|
|
|
|||||||||||
| Total allowance for loan losses |
$ | 75,235 | $ | (2,369) | $ | 3,059 | $ | (16,100) | $ | 59,825 | ||||||||||
|
|
|
|
|
|
|
|
|
|
|
|||||||||||
| (1) | Based upon changes to our ALLL methodology, as described earlier in this document, beginning with the fourth quarter of 2015 and coinciding with the implementation of the new ALLL methodology, the Bank’s previous “unallocated reserve” was absorbed into the qualitative component of the allowance. |
122
Table of Contents
The following tables present the recorded investment in loans held-for-investment and the related allowance for loan losses by loan type, based on the Company’s methodology for determining the allowance for loan losses for the periods presented.
| December 31, 2016 | ||||||||||||||||||||||||
| Recorded Investment in Loans | Allowance for Loan Losses | |||||||||||||||||||||||
| Individually Evaluated for Impairment |
Collectively Evaluated for Impairment |
Acquired with Deteriorated Credit Quality |
Individually Evaluated for Impairment |
Collectively Evaluated for Impairment |
Acquired with Deteriorated Credit Quality |
|||||||||||||||||||
| (Dollars in thousands) | ||||||||||||||||||||||||
| Commercial and industrial |
$ | 901 | $ | 484,177 | $ | - | $ | 114 | $ | 8,040 | $ | - | ||||||||||||
| SBA |
3,582 | 93,602 | - | 27 | 844 | - | ||||||||||||||||||
| Real estate: |
||||||||||||||||||||||||
| Commercial real estate |
15,128 | 2,915,013 | - | - | 37,443 | - | ||||||||||||||||||
| Construction |
- | 85,879 | - | - | 1,096 | - | ||||||||||||||||||
| SFR mortgage |
5,174 | 245,431 | - | - | 2,287 | - | ||||||||||||||||||
| Dairy & livestock and agribusiness |
747 | 337,884 | - | - | 8,541 | - | ||||||||||||||||||
| Municipal lease finance receivables |
- | 64,639 | - | - | 941 | - | ||||||||||||||||||
| Consumer and other loans |
853 | 77,421 | - | - | 988 | - | ||||||||||||||||||
| PCI loans |
- | - | 71,585 | - | - | 1,219 | ||||||||||||||||||
|
|
|
|
|
|
|
|
|
|
|
|
|
|||||||||||||
| Total |
$ | 26,385 | $ | 4,304,046 | $ | 71,585 | $ | 141 | $ | 60,180 | $ | 1,219 | ||||||||||||
|
|
|
|
|
|
|
|
|
|
|
|
|
|||||||||||||
| December 31, 2015 | ||||||||||||||||||||||||
| Recorded Investment in Loans | Allowance for Loan Losses | |||||||||||||||||||||||
| Individually Evaluated for Impairment |
Collectively Evaluated for Impairment |
Acquired with Deteriorated Credit Quality |
Individually Evaluated for Impairment |
Collectively Evaluated for Impairment |
Acquired with Deteriorated Credit Quality |
|||||||||||||||||||
| (Dollars in thousands) | ||||||||||||||||||||||||
| Commercial and industrial |
$ | 1,643 | $ | 432,456 | $ | - | $ | 626 | $ | 7,962 | $ | - | ||||||||||||
| SBA |
3,248 | 103,619 | - | 10 | 983 | - | ||||||||||||||||||
| Real estate: |
||||||||||||||||||||||||
| Commercial real estate |
40,293 | 2,602,891 | - | - | 36,995 | - | ||||||||||||||||||
| Construction |
7,651 | 60,912 | - | 13 | 2,376 | - | ||||||||||||||||||
| SFR mortgage |
6,253 | 227,501 | - | 20 | 2,083 | - | ||||||||||||||||||
| Dairy & livestock and agribusiness |
3,685 | 301,824 | - | - | 6,029 | - | ||||||||||||||||||
| Municipal lease finance receivables |
- | 74,135 | - | - | 1,153 | - | ||||||||||||||||||
| Consumer and other loans |
933 | 68,345 | - | - | 906 | - | ||||||||||||||||||
| PCI loans |
- | - | 89,840 | - | - | - | ||||||||||||||||||
| Unallocated (1) |
- | - | - | - | - | - | ||||||||||||||||||
|
|
|
|
|
|
|
|
|
|
|
|
|
|||||||||||||
| Total |
$ | 63,706 | $ | 3,871,683 | $ | 89,840 | $ | 669 | $ | 58,487 | $ | - | ||||||||||||
|
|
|
|
|
|
|
|
|
|
|
|
|
|||||||||||||
| (1) | Based upon changes to our ALLL methodology, as described earlier in this document, beginning with the fourth quarter of 2015 and coinciding with the implementation of the new ALLL methodology, the Bank’s previous “unallocated reserve” was absorbed into the qualitative component of the allowance. |
Past Due and Nonperforming Loans
We seek to manage asset quality and control credit risk through diversification of the loan portfolio and the application of policies designed to promote sound underwriting and loan monitoring practices. The Bank’s Credit Management Division is in charge of monitoring asset quality, establishing credit policies and procedures and enforcing the consistent application of these policies and procedures across the Bank. Reviews of nonperforming, past due loans and larger credits, designed to identify potential charges to the allowance for loan losses, and to determine the adequacy of the allowance, are conducted on an ongoing basis. These reviews consider such factors as the financial strength of borrowers and any guarantors, the value of the applicable collateral, loan loss experience, estimated loan losses, growth in the loan portfolio, prevailing economic conditions and other factors. Refer to Note 3 — Summary of Significant Accounting Policies for additional discussion concerning the Bank’s policy for past due and nonperforming loans.
123
Table of Contents
A loan is reported as a TDR when the Bank grants a concession(s) to a borrower experiencing financial difficulties that the Bank would not otherwise consider. Examples of such concessions include a reduction in the interest rate, deferral of principal or accrued interest, extending the payment due dates or loan maturity date(s), or providing a lower interest rate than would be normally available for new debt of similar risk. As a result of these concessions, restructured loans are classified as impaired. Impairment reserves on non-collateral dependent restructured loans are measured by comparing the present value of expected future cash flows on the restructured loans discounted at the interest rate of the original loan agreement to the loan’s carrying value. These impairment reserves are recognized as a specific component to be provided for in the allowance for loan losses.
Generally, when loans are identified as impaired they are moved to our Special Assets Department. When we identify a loan as impaired, we measure the loan for potential impairment using discounted cash flows, unless the loan is determined to be collateral dependent. In these cases, we use the current fair value of collateral, less selling costs. Generally, the determination of fair value is established through obtaining external appraisals of the collateral.
The following tables present the recorded investment in, and the aging of, past due and nonaccrual loans, excluding PCI loans, by type of loans for the periods presented.
| December 31, 2016 | ||||||||||||||||||||||||
| 30-59 Days Past Due |
60-89 Days Past Due |
Total Past Due and Accruing |
Nonaccrual (1) | Current | Total Loans and Financing Receivables |
|||||||||||||||||||
| (Dollars in thousands) | ||||||||||||||||||||||||
| Commercial and industrial |
$ | - | $ | - | $ | - | $ | 156 | $ | 484,922 | 485,078 | |||||||||||||
| SBA |
352 | - | 352 | 2,737 | 94,095 | 97,184 | ||||||||||||||||||
| Real estate: |
||||||||||||||||||||||||
| Commercial real estate |
||||||||||||||||||||||||
| Owner occupied |
- | - | - | 635 | 949,184 | 949,819 | ||||||||||||||||||
| Non-owner occupied |
- | - | - | 1,048 | 1,979,274 | 1,980,322 | ||||||||||||||||||
| Construction |
||||||||||||||||||||||||
| Speculative (2) |
- | - | - | - | 48,841 | 48,841 | ||||||||||||||||||
| Non-speculative |
- | - | - | - | 37,038 | 37,038 | ||||||||||||||||||
| SFR mortgage |
- | - | - | 2,207 | 248,398 | 250,605 | ||||||||||||||||||
| Dairy & livestock and agribusiness |
- | - | - | - | 338,631 | 338,631 | ||||||||||||||||||
| Municipal lease finance receivables |
- | - | - | - | 64,639 | 64,639 | ||||||||||||||||||
| Consumer and other loans |
84 | - | 84 | 369 | 77,821 | 78,274 | ||||||||||||||||||
|
|
|
|
|
|
|
|
|
|
|
|
|
|||||||||||||
| Total gross loans, excluding PCI loans |
$ | 436 | $ | - | $ | 436 | $ | 7,152 | $ | 4,322,843 | $ | 4,330,431 | ||||||||||||
|
|
|
|
|
|
|
|
|
|
|
|
|
|||||||||||||
| (1) | As of December 31, 2016, $4.7 million of nonaccruing loans were current, $514,000 were 30-59 days past due, $435,000 were 60-89 days past due and $1.5 million were 90+ days past due. |
| (2) | Speculative construction loans are generally for properties where there is no identified buyer or renter. |
124
Table of Contents
| December 31, 2015 | ||||||||||||||||||||||||
| 30-59 Days Past Due |
60-89 Days Past Due |
Total Past Due and Accruing |
Nonaccrual (1) | Current | Total Loans and Financing Receivables |
|||||||||||||||||||
| (Dollars in thousands) | ||||||||||||||||||||||||
| Commercial and industrial |
$ | - | $ | - | $ | - | $ | 704 | $ | 433,395 | $ | 434,099 | ||||||||||||
| SBA |
- | - | - | 2,567 | 104,300 | 106,867 | ||||||||||||||||||
| Real estate: |
||||||||||||||||||||||||
| Commercial real estate |
||||||||||||||||||||||||
| Owner occupied |
- | - | - | 4,174 | 834,179 | 838,353 | ||||||||||||||||||
| Non-owner occupied |
354 | - | 354 | 10,367 | 1,794,110 | 1,804,831 | ||||||||||||||||||
| Construction |
||||||||||||||||||||||||
| Speculative (2) |
- | - | - | - | 45,837 | 45,837 | ||||||||||||||||||
| Non-speculative |
- | - | - | - | 22,726 | 22,726 | ||||||||||||||||||
| SFR mortgage |
1,082 | - | 1,082 | 2,688 | 229,984 | 233,754 | ||||||||||||||||||
| Dairy & livestock and agribusiness |
- | - | - | - | 305,509 | 305,509 | ||||||||||||||||||
| Municipal lease finance receivables |
- | - | - | - | 74,135 | 74,135 | ||||||||||||||||||
| Consumer and other loans |
- | - | - | 519 | 68,759 | 69,278 | ||||||||||||||||||
|
|
|
|
|
|
|
|
|
|
|
|
|
|||||||||||||
| Total gross loans, excluding PCI loans |
$ | 1,436 | $ | - | $ | 1,436 | $ | 21,019 | $ | 3,912,934 | $ | 3,935,389 | ||||||||||||
|
|
|
|
|
|
|
|
|
|
|
|
|
|||||||||||||
| (1) | As of December 31, 2015, $7.9 million of nonaccruing loans were current, $456,000 were 30-59 days past due, $9.1 million were 60-89 days past due and $3.5 million were 90+ days past due. |
| (2) | Speculative construction loans are generally for properties where there is no identified buyer or renter. |
Impaired Loans
At December 31, 2016, the Company had impaired loans, excluding PCI loans, of $26.4 million. Of this amount, there was $2.7 million of nonaccrual SBA loans, $2.2 million of nonaccrual SFR mortgage loans, $1.7 million of nonaccrual commercial real estate loans, $369,000 of nonaccrual consumer and other loans, and $156,000 of nonaccrual commercial and industrial loans. These impaired loans included $20.9 million of loans whose terms were modified in a troubled debt restructuring, of which $1.6 million are classified as nonaccrual. The remaining balance of $19.2 million consisted of 26 loans performing according to the restructured terms. The impaired loans had a specific allowance of $141,000 at December 31, 2016. At December 31, 2015, the Company had classified as impaired, loans, excluding PCI loans, with a balance of $63.7 million with a related allowance of $669,000.
125
Table of Contents
The following tables present information for held-for-investment loans, excluding PCI loans, individually evaluated for impairment by type of loans, as and for the periods presented.
| As of and For the Year Ended | ||||||||||||||||||||
| December 31, 2016 | ||||||||||||||||||||
| Recorded Investment |
Unpaid Principal Balance |
Related Allowance |
Average Recorded Investment |
Interest Income Recognized |
||||||||||||||||
| (Dollars in thousands) | ||||||||||||||||||||
| With no related allowance recorded: |
||||||||||||||||||||
| Commercial and industrial |
$ | 730 | $ | 1,646 | $ | - | $ | 832 | $ | 26 | ||||||||||
| SBA |
3,386 | 4,189 | - | 3,709 | 50 | |||||||||||||||
| Real estate: |
||||||||||||||||||||
| Commercial real estate |
||||||||||||||||||||
| Owner occupied |
1,797 | 2,276 | - | 1,410 | 70 | |||||||||||||||
| Non-owner occupied |
13,331 | 15,842 | - | 13,517 | 592 | |||||||||||||||
| Construction |
||||||||||||||||||||
| Speculative |
- | - | - | - | - | |||||||||||||||
| Non-speculative |
- | - | - | - | - | |||||||||||||||
| SFR mortgage |
5,174 | 6,075 | - | 5,327 | 135 | |||||||||||||||
| Dairy & livestock and agribusiness |
747 | 747 | - | 692 | 47 | |||||||||||||||
| Municipal lease finance receivables |
- | - | - | - | - | |||||||||||||||
| Consumer and other loans |
853 | 1,423 | - | 919 | 18 | |||||||||||||||
|
|
|
|
|
|
|
|
|
|
|
|||||||||||
| Total |
26,018 | 32,198 | - | 26,406 | 938 | |||||||||||||||
|
|
|
|
|
|
|
|
|
|
|
|||||||||||
| With a related allowance recorded: |
||||||||||||||||||||
| Commercial and industrial |
171 | 171 | 114 | 233 | 9 | |||||||||||||||
| SBA |
196 | 212 | 27 | 206 | 14 | |||||||||||||||
| Real estate: |
||||||||||||||||||||
| Commercial real estate |
||||||||||||||||||||
| Owner occupied |
- | - | - | - | - | |||||||||||||||
| Non-owner occupied |
- | - | - | - | - | |||||||||||||||
| Construction |
||||||||||||||||||||
| Speculative |
- | - | - | - | - | |||||||||||||||
| Non-speculative |
- | - | - | - | - | |||||||||||||||
| SFR mortgage |
- | - | - | - | - | |||||||||||||||
| Dairy & livestock and agribusiness |
- | - | - | - | - | |||||||||||||||
| Municipal lease finance receivables |
- | - | - | - | - | |||||||||||||||
| Consumer and other loans |
- | - | - | - | - | |||||||||||||||
|
|
|
|
|
|
|
|
|
|
|
|||||||||||
| Total |
367 | 383 | 141 | 439 | 23 | |||||||||||||||
|
|
|
|
|
|
|
|
|
|
|
|||||||||||
| Total impaired loans |
$ | 26,385 | $ | 32,581 | $ | 141 | $ | 26,845 | $ | 961 | ||||||||||
|
|
|
|
|
|
|
|
|
|
|
|||||||||||
126
Table of Contents
| As of and For the Year Ended | ||||||||||||||||||||
| December 31, 2015 | ||||||||||||||||||||
| Recorded Investment |
Unpaid Principal Balance |
Related Allowance |
Average Recorded Investment |
Interest Income Recognized |
||||||||||||||||
| (Dollars in thousands) | ||||||||||||||||||||
| With no related allowance recorded: |
||||||||||||||||||||
| Commercial and industrial |
$ | 1,017 | $ | 1,894 | $ | - | $ | 1,122 | $ | 38 | ||||||||||
| SBA |
3,207 | 3,877 | - | 3,333 | 51 | |||||||||||||||
| Real estate: |
||||||||||||||||||||
| Commercial real estate |
||||||||||||||||||||
| Owner occupied |
6,252 | 7,445 | - | 6,718 | 97 | |||||||||||||||
| Non-owner occupied |
34,041 | 37,177 | - | 34,639 | 1,787 | |||||||||||||||
| Construction |
||||||||||||||||||||
| Speculative |
- | - | - | - | - | |||||||||||||||
| Non-speculative |
- | - | - | - | - | |||||||||||||||
| SFR mortgage |
5,665 | 6,453 | - | 5,771 | 109 | |||||||||||||||
| Dairy & livestock and agribusiness |
3,685 | 3,684 | - | 3,687 | 177 | |||||||||||||||
| Municipal lease finance receivables |
- | - | - | - | - | |||||||||||||||
| Consumer and other loans |
890 | 1,454 | - | 922 | 17 | |||||||||||||||
|
|
|
|
|
|
|
|
|
|
|
|||||||||||
| Total |
54,757 | 61,984 | - | 56,192 | 2,276 | |||||||||||||||
|
|
|
|
|
|
|
|
|
|
|
|||||||||||
| With a related allowance recorded: |
||||||||||||||||||||
| Commercial and industrial |
626 | 695 | 626 | 637 | - | |||||||||||||||
| SBA |
41 | 47 | 10 | 45 | - | |||||||||||||||
| Real estate: |
||||||||||||||||||||
| Commercial real estate |
||||||||||||||||||||
| Owner occupied |
- | - | - | - | - | |||||||||||||||
| Non-owner occupied |
- | - | - | - | - | |||||||||||||||
| Construction |
||||||||||||||||||||
| Speculative |
7,651 | 7,651 | 13 | 7,651 | 388 | |||||||||||||||
| Non-speculative |
- | - | - | - | - | |||||||||||||||
| SFR mortgage |
588 | 640 | 20 | 607 | 12 | |||||||||||||||
| Dairy & livestock and agribusiness |
- | - | - | - | - | |||||||||||||||
| Municipal lease finance receivables |
- | - | - | - | - | |||||||||||||||
| Consumer and other loans |
43 | 45 | - | 45 | - | |||||||||||||||
|
|
|
|
|
|
|
|
|
|
|
|||||||||||
| Total |
8,949 | 9,078 | 669 | 8,985 | 400 | |||||||||||||||
|
|
|
|
|
|
|
|
|
|
|
|||||||||||
| Total impaired loans |
$ | 63,706 | $ | 71,062 | $ | 669 | $ | 65,177 | $ | 2,676 | ||||||||||
|
|
|
|
|
|
|
|
|
|
|
|||||||||||
127
Table of Contents
| As of and For the Year Ended | ||||||||||||||||||||
| December 31, 2014 | ||||||||||||||||||||
| Recorded Investment |
Unpaid Principal Balance |
Related Allowance |
Average Recorded Investment |
Interest Income Recognized |
||||||||||||||||
| (Dollars in thousands) | ||||||||||||||||||||
| With no related allowance recorded: |
||||||||||||||||||||
| Commercial and industrial |
$ | 2,391 | $ | 3,624 | $ | - | $ | 2,487 | $ | 41 | ||||||||||
| SBA |
1,853 | 2,197 | - | 1,886 | 53 | |||||||||||||||
| Real estate: |
||||||||||||||||||||
| Commercial real estate |
||||||||||||||||||||
| Owner occupied |
16,961 | 18,166 | - | 18,027 | 938 | |||||||||||||||
| Non-owner occupied |
30,068 | 38,156 | - | 30,133 | 723 | |||||||||||||||
| Construction |
||||||||||||||||||||
| Speculative |
7,651 | 7,651 | - | 7,651 | 310 | |||||||||||||||
| Non-speculative |
- | - | - | - | - | |||||||||||||||
| SFR mortgage |
6,512 | 7,493 | - | 6,566 | 110 | |||||||||||||||
| Dairy & livestock and agribusiness |
15,796 | 17,587 | - | 19,060 | 1,057 | |||||||||||||||
| Municipal lease finance receivables |
- | - | - | - | - | |||||||||||||||
| Consumer and other loans |
673 | 1,094 | - | 623 | 2 | |||||||||||||||
|
|
|
|
|
|
|
|
|
|
|
|||||||||||
| Total |
81,905 | 95,968 | - | 86,433 | 3,234 | |||||||||||||||
|
|
|
|
|
|
|
|
|
|
|
|||||||||||
| With a related allowance recorded: |
||||||||||||||||||||
| Commercial and industrial |
629 | 698 | 615 | 552 | - | |||||||||||||||
| SBA |
1,327 | 1,591 | 296 | 714 | - | |||||||||||||||
| Real estate: |
||||||||||||||||||||
| Commercial real estate |
||||||||||||||||||||
| Owner occupied |
- | - | - | - | - | |||||||||||||||
| Non-owner occupied |
982 | 1,278 | 154 | 573 | - | |||||||||||||||
| Construction |
||||||||||||||||||||
| Speculative |
- | - | - | - | - | |||||||||||||||
| Non-speculative |
- | - | - | - | - | |||||||||||||||
| SFR mortgage |
467 | 484 | 35 | 474 | - | |||||||||||||||
| Dairy & livestock and agribusiness |
- | - | - | - | - | |||||||||||||||
| Municipal lease finance receivables |
- | - | - | - | - | |||||||||||||||
| Consumer and other loans |
482 | 508 | 449 | 285 | - | |||||||||||||||
|
|
|
|
|
|
|
|
|
|
|
|||||||||||
| Total |
3,887 | 4,559 | 1,549 | 2,598 | - | |||||||||||||||
|
|
|
|
|
|
|
|
|
|
|
|||||||||||
| Total impaired loans |
$ | 85,792 | $ | 100,527 | $ | 1,549 | $ | 89,031 | $ | 3,234 | ||||||||||
|
|
|
|
|
|
|
|
|
|
|
|||||||||||
The Company recognizes the charge-off of the impairment allowance on impaired loans in the period in which a loss is identified for collateral dependent loans. Therefore, the majority of the nonaccrual loans as of December 31, 2016 and 2015 have already been written down to the estimated net realizable value. The impaired loans with a related allowance recorded are on nonaccrual loans where a charge-off is not yet processed, on nonaccrual SFR loans where there is a potential modification in process, or on smaller balance non-collateral dependent loans.
Reserve for Unfunded Loan Commitments
The allowance for off-balance sheet credit exposure relates to commitments to extend credit, letters of credit and undisbursed funds on lines of credit. The Company evaluates credit risk associated with the off-balance sheet loan commitments at the same time it evaluates credit risk associated with the loan and lease portfolio. The Company recorded a recapture of the reserve for unfunded loan commitments of $450,000 for the year ended December 31, 2016, compared with a recapture of provision for unfunded loan commitments of $500,000 for the year ended December 31, 2015 and a recapture of provision for unfunded loan commitments of $1.3 million for the year ended December 31, 2014. As of December 31, 2016 and December 31, 2015, the balance in this reserve was $6.7 million and $7.2 million, respectively, and was included in other liabilities.
128
Table of Contents
Troubled Debt Restructurings
Loans that are reported as TDRs are considered impaired and charge-off amounts are taken on an individual loan basis, as deemed appropriate. The majority of restructured loans are loans for which the terms of repayment have been renegotiated, resulting in a reduction in interest rate or deferral of principal. Refer to Note 3 — Summary of Significant Accounting Policies, Troubled Debt Restructurings, included herein.
As of December 31, 2016, there were $20.9 million of loans classified as a TDR, of which $1.6 million were nonperforming and $19.2 million were performing. TDRs on accrual status are comprised of loans that were accruing interest at the time of restructuring or have demonstrated repayment performance in compliance with the restructured terms for a sustained period and for which the Company anticipates full repayment of both principal and interest. At December 31, 2016, performing TDRs were comprised of six commercial real estate loans of $13.4 million, ten SFR mortgage loans of $3.0 million, two SBA loans of $845,000, one dairy & livestock and agribusiness loan of $747,000, five commercial and industrial loans of $745,000 and two consumer loans of $484,000.
The majority of TDRs have no specific allowance allocated as any impairment amount is normally charged off at the time a probable loss is determined. We have allocated $141,000 and $607,000 of specific allowance to TDRs as of December 31, 2016 and December 31, 2015, respectively.
The following table provides a summary of the activity related to TDRs for the periods presented.
| For the Year Ended December 31, | ||||||||
| 2016 | 2015 | |||||||
| (Dollars in thousands) | ||||||||
| Performing TDRs: |
||||||||
| Beginning balance |
$ | 42,687 | $ | 53,589 | ||||
| New modifications |
1,996 | 3,689 | ||||||
| Payoffs and payments, net |
(34,001) | (15,235) | ||||||
| TDRs returned to accrual status |
8,551 | 644 | ||||||
| TDRs placed on nonaccrual status |
- | - | ||||||
|
|
|
|
|
|||||
| Ending balance |
$ | 19,233 | $ | 42,687 | ||||
|
|
|
|
|
|||||
| Nonperforming TDRs: |
||||||||
| Beginning balance |
$ | 12,622 | $ | 20,285 | ||||
| New modifications |
102 | 661 | ||||||
| Charge-offs |
(38) | - | ||||||
| Transfer to OREO |
- | (842) | ||||||
| Payoffs and payments, net |
(2,509) | (6,838) | ||||||
| TDRs returned to accrual status |
(8,551) | (644) | ||||||
| TDRs placed on nonaccrual status |
- | - | ||||||
|
|
|
|
|
|||||
| Ending balance |
$ | 1,626 | $ | 12,622 | ||||
|
|
|
|
|
|||||
| Total TDRs |
$ | 20,859 | $ | 55,309 | ||||
|
|
|
|
|
|||||
129
Table of Contents
The following tables summarize loans modified as troubled debt restructurings for the periods presented.
Modifications (1)
| For the Year Ended December 31, 2016 | ||||||||||||||||||||
| Number of Loans |
Pre-Modification Outstanding Recorded Investment |
Post-Modification Outstanding Recorded Investment |
Outstanding Recorded Investment at December 31, 2016 |
Financial Effect Resulting From Modifications (2) |
||||||||||||||||
| (Dollars in thousands) | ||||||||||||||||||||
| Commercial and industrial: |
||||||||||||||||||||
| Interest rate reduction |
1 | $ | 112 | $ | 112 | $ | 103 | $ | - | |||||||||||
| Change in amortization period or maturity |
- | - | - | - | - | |||||||||||||||
| SBA: |
||||||||||||||||||||
| Interest rate reduction |
- | - | - | - | - | |||||||||||||||
| Change in amortization period or maturity |
2 | 214 | 214 | 196 | 28 | |||||||||||||||
| Real estate: |
||||||||||||||||||||
| Commercial real estate: |
||||||||||||||||||||
| Owner occupied |
||||||||||||||||||||
| Interest rate reduction |
- | - | - | - | - | |||||||||||||||
| Change in amortization period or maturity |
1 | 759 | 759 | 756 | - | |||||||||||||||
| Non-owner occupied |
||||||||||||||||||||
| Interest rate reduction |
- | - | - | - | - | |||||||||||||||
| Change in amortization period or maturity |
- | - | - | - | - | |||||||||||||||
| Consumer: |
||||||||||||||||||||
| Interest rate reduction |
- | - | - | - | - | |||||||||||||||
| Change in amortization period or maturity |
3 | 201 | 201 | 185 | - | |||||||||||||||
|
|
|
|
|
|
|
|
|
|
|
|||||||||||
| Total loans |
7 | $ | 1,286 | $ | 1,286 | $ | 1,240 | $ | 28 | |||||||||||
|
|
|
|
|
|
|
|
|
|
|
|||||||||||
| For the Year Ended December 31, 2015 | ||||||||||||||||||||
| Number of Loans |
Pre-Modification Outstanding Recorded Investment |
Post-Modification Outstanding Recorded Investment |
Outstanding Recorded Investment at December 31, 2015 |
Financial Effect Resulting From Modifications (2) |
||||||||||||||||
| (Dollars in thousands) | ||||||||||||||||||||
| Commercial and industrial: |
||||||||||||||||||||
| Interest rate reduction |
- | $ | - | $ | - | $ | - | $ | - | |||||||||||
| Change in amortization period or maturity |
1 | 203 | 203 | 203 | 203 | |||||||||||||||
| SBA: |
||||||||||||||||||||
| Interest rate reduction |
- | - | - | - | - | |||||||||||||||
| Change in amortization period or maturity |
1 | 330 | 330 | 320 | - | |||||||||||||||
| Real estate: |
||||||||||||||||||||
| Commercial real estate: |
||||||||||||||||||||
| Owner occupied |
||||||||||||||||||||
| Interest rate reduction |
- | - | - | - | - | |||||||||||||||
| Change in amortization period or maturity |
2 | 823 | 823 | 821 | - | |||||||||||||||
| Non-owner occupied |
||||||||||||||||||||
| Interest rate reduction |
1 | 2,376 | 2,376 | 2,316 | - | |||||||||||||||
| Change in amortization period or maturity |
1 | 280 | 280 | 280 | - | |||||||||||||||
| SFR mortgage: |
||||||||||||||||||||
| Interest rate reduction |
1 | 322 | 322 | 326 | - | |||||||||||||||
| Change in amortization period or maturity |
- | - | - | - | - | |||||||||||||||
|
|
|
|
|
|
|
|
|
|
|
|||||||||||
| Total loans |
7 | $ | 4,334 | $ | 4,334 | $ | 4,266 | $ | 203 | |||||||||||
|
|
|
|
|
|
|
|
|
|
|
|||||||||||
130
Table of Contents
| For the Year Ended December 31, 2014 | ||||||||||||||||||||
| Number of Loans |
Pre-Modification Outstanding Recorded Investment |
Post-Modification Outstanding Recorded Investment |
Outstanding Recorded Investment at December 31, 2014 |
Financial Effect Resulting From Modifications (2) |
||||||||||||||||
| (Dollars in thousands) | ||||||||||||||||||||
| Commercial and industrial: |
||||||||||||||||||||
| Interest rate reduction (3) (4) |
3 | $ | 553 | $ | 553 | $ | 522 | $ | 185 | |||||||||||
| Change in amortization period or maturity |
- | - | - | - | - | |||||||||||||||
| Real estate: |
||||||||||||||||||||
| Commercial real estate: |
||||||||||||||||||||
| Owner occupied |
||||||||||||||||||||
| Interest rate reduction (3) |
1 | 199 | 199 | 187 | - | |||||||||||||||
| Change in amortization period or maturity |
- | - | - | - | - | |||||||||||||||
| Non-owner occupied |
||||||||||||||||||||
| Interest rate reduction (3) |
3 | 3,573 | 3,573 | 3,469 | - | |||||||||||||||
| Change in amortization period or maturity |
- | - | - | - | - | |||||||||||||||
| Dairy & livestock and agribusiness: |
||||||||||||||||||||
| Interest rate reduction |
- | - | - | - | - | |||||||||||||||
| Change in amortization period or maturity |
- | - | - | - | - | |||||||||||||||
| Consumer: |
||||||||||||||||||||
| Interest rate reduction (4) |
1 | 421 | 421 | 419 | - | |||||||||||||||
| Change in amortization period or maturity |
- | - | - | - | - | |||||||||||||||
|
|
|
|
|
|
|
|
|
|
|
|||||||||||
| Total loans |
8 | $ | 4,746 | $ | 4,746 | $ | 4,597 | $ | 185 | |||||||||||
|
|
|
|
|
|
|
|
|
|
|
|||||||||||
| (1) | The tables above exclude modified loans that were paid off prior to the end of the period. |
| (2) | Financial effects resulting from modifications represent charge-offs and specific allowance recorded at modification date. |
| (3) | New modifications for the year ended December 31, 2014 included six TDRs acquired from ASB. |
| (4) | New modifications for the year ended December 31, 2014 included three TDRs that include both an interest rate reduction and a maturity extension. |
As of December 31, 2016, 2015 and 2014, there were no loans that were previously modified as a troubled debt restructuring within the previous 12 months that subsequently defaulted during each of the years ended December 31, 2016, 2015 and 2014, respectively.
| 8. | OTHER REAL ESTATE OWNED |
The following table summarizes the activity related to total OREO for the periods presented.
| For the Year Ended December 31, | ||||||||
| 2016 | 2015 | |||||||
| (Dollars in thousands) | ||||||||
| Balance, beginning of period |
$ | 6,993 | $ | 5,637 | ||||
| Additions |
- | 3,721 | ||||||
| Dispositions |
(2,129) | (2,203) | ||||||
| Valuation adjustments |
(337) | (162) | ||||||
|
|
|
|
|
|||||
| Balance, end of period |
$ | 4,527 | $ | 6,993 | ||||
|
|
|
|
|
|||||
131
Table of Contents
| 9. | GOODWILL AND OTHER INTANGIBLE ASSETS |
The following table presents the changes in the carrying amount of goodwill for the periods presented.
| As of and for the Year Ended December 31, | ||||||||
| 2016 | 2015 | |||||||
| (Dollars in thousands) | ||||||||
| Balance, beginning of period |
$ | 74,244 | $ | 74,244 | ||||
| Addition from the CCB acquisition |
15,289 | - | ||||||
|
|
|
|
|
|||||
| Balance, end of period |
$ | 89,533 | $ | 74,244 | ||||
|
|
|
|
|
|||||
The following summarizes activity of amortizable core deposit intangible (“CDI”) assets for the periods presented.
| As of and For the Year Ended December 31, | ||||||||||||||||||||||||
| 2016 | 2015 | |||||||||||||||||||||||
| Gross CDI | Accumulated | Net CDI | Gross CDI | Accumulated | Net CDI | |||||||||||||||||||
| Amount | Amortization | Amount | Amount | Amortization | Amount | |||||||||||||||||||
| (Dollars in thousands) | ||||||||||||||||||||||||
| Balance of intangible assets, beginning of period |
$ | 34,089 | $ | (31,824) | $ | 2,265 | $ | 34,089 | $ | (30,875) | $ | 3,214 | ||||||||||||
| Additions due to acquisitions |
3,851 | - | ||||||||||||||||||||||
|
|
|
|
|
|||||||||||||||||||||
| Balance of intangible assets, end of period |
$ | 37,940 | $ | (32,930) | $ | 5,010 | $ | 34,089 | $ | (31,824) | $ | 2,265 | ||||||||||||
|
|
|
|
|
|||||||||||||||||||||
| Aggregate amortization expense: |
||||||||||||||||||||||||
| For year ended December 31, |
$ | 1,106 | $ | 949 | ||||||||||||||||||||
| Estimated Amortization Expense: |
||||||||||||||||||||||||
| For the year ending December 31, 2017 |
$ | 1,066 | ||||||||||||||||||||||
| For the year ending December 31, 2018 |
989 | |||||||||||||||||||||||
| For the year ending December 31, 2019 |
751 | |||||||||||||||||||||||
| For the year ending December 31, 2020 |
402 | |||||||||||||||||||||||
| Thereafter |
1,802 | |||||||||||||||||||||||
At December 31, 2016 the weighted average remaining life of intangible assets is approximately 3.41 years.
| 10. | PREMISES AND EQUIPMENT |
Premises and equipment were comprised of the following for the periods presented.
| As of December 31, | ||||||||
| 2016 | 2015 | |||||||
| (Dollars in thousands) | ||||||||
| Land |
$ | 13,119 | $ | 8,425 | ||||
| Bank premises |
62,154 | 48,251 | ||||||
| Furniture and equipment |
28,759 | 36,265 | ||||||
|
|
|
|
|
|||||
| Premises and equipment, gross |
104,032 | 92,941 | ||||||
| Accumulated depreciation and amortization |
(61,946) | (61,559) | ||||||
|
|
|
|
|
|||||
| Premises and equipment, net |
$ | 42,086 | $ | 31,382 | ||||
|
|
|
|
|
|||||
In 2016, a decision was made to relocate our operations and technology departments to a new location to allow for future growth. A new location was identified and acquired in 2016 with a plan of relocation in the second quarter of 2017. In conjunction with the purchase of this new building, management pursued a plan to sell the existing building. In accordance with GAAP, this building was transferred from our long-lived asset portfolio to held-for-sale which resulted in an impairment loss of $2.6 million for the year ended December 31, 2016. At December 31, 2016, the fair value, net of selling costs, of this held-for-sale asset was $3.4 million.
132
Table of Contents
Leases
The Company leases land and buildings under operating leases for varying periods extending to 2026, at which time the Company can exercise options that could extend certain leases through 2036. The future minimum annual rental payments required for leases that have initial or remaining noncancelable lease terms in excess of one year as of December 31, 2016, excluding property taxes and insurance, are as follows:
| As of December 31, 2016 | ||||
| Year of maturity: |
(Dollars in thousands) | |||
| 2017 |
$ | 5,060 | ||
| 2018 |
3,690 | |||
| 2019 |
2,331 | |||
| 2020 |
1,232 | |||
| 2021 |
758 | |||
| Thereafter |
677 | |||
|
|
|
|||
| Total |
$ | 13,748 | ||
|
|
|
|||
Total rental expense for the Company was approximately $5.6 million, $5.5 million and $5.7 million for the years ended December 31, 2016, 2015 and 2014, respectively.
| 11. | OTHER ASSETS |
Other assets were comprised of the following for the periods presented.
| As of December 31, | ||||||||
| 2016 | 2015 | |||||||
| (Dollars in thousands) | ||||||||
| Prepaid expenses |
$ | 4,338 | $ | 4,104 | ||||
| Interest rate swaps |
5,783 | 9,344 | ||||||
| Other investments |
7,221 | 2,306 | ||||||
| Other assets |
6,490 | 5,831 | ||||||
|
|
|
|
|
|||||
| Total |
$ | 23,832 | $ | 21,585 | ||||
|
|
|
|
|
|||||
| 12. | INCOME TAXES |
Income tax expense consists of the following.
| For the Year Ended December 31, | ||||||||||||
| 2016 | 2015 | 2014 | ||||||||||
| (Dollars in thousands) | ||||||||||||
| Current provision: |
||||||||||||
| Federal |
$ | 41,195 | $ | 40,021 | $ | 38,957 | ||||||
| State |
17,944 | 17,040 | 15,968 | |||||||||
|
|
|
|
|
|
|
|||||||
| 59,139 | 57,061 | 54,925 | ||||||||||
|
|
|
|
|
|
|
|||||||
| Deferred provision/(benefit): |
||||||||||||
| Federal |
1,208 | (3,443) | 2,534 | |||||||||
| State |
510 | (1,397) | 1,317 | |||||||||
|
|
|
|
|
|
|
|||||||
| 1,718 | (4,840) | 3,851 | ||||||||||
|
|
|
|
|
|
|
|||||||
| Total |
$ | 60,857 | $ | 52,221 | $ | 58,776 | ||||||
|
|
|
|
|
|
|
|||||||
133
Table of Contents
Income tax asset consists of the following.
| As of December 31, | ||||||||
| 2016 | 2015 | |||||||
| (Dollars in thousands) | ||||||||
| Current: |
||||||||
| Federal |
$ | 4,399 | $ | 7,414 | ||||
| State |
538 | 2,988 | ||||||
|
|
|
|
|
|||||
| 4,937 | 10,402 | |||||||
|
|
|
|
|
|||||
| Deferred: |
||||||||
| Federal |
31,566 | 28,799 | ||||||
| State |
8,926 | 8,050 | ||||||
|
|
|
|
|
|||||
| 40,492 | 36,849 | |||||||
|
|
|
|
|
|||||
| Total |
$ | 45,429 | $ | 47,251 | ||||
|
|
|
|
|
|||||
The components of the net deferred tax asset are as follows.
| As of December 31, | ||||||||
| 2016 | 2015 | |||||||
| Federal |
(Dollars in thousands) | |||||||
| Deferred tax assets: |
||||||||
| Bad debt and credit loss deduction |
$ | 23,886 | $ | 23,180 | ||||
| Depreciation |
- | 121 | ||||||
| Net operating loss carryforward |
453 | 562 | ||||||
| Deferred compensation |
4,044 | 3,642 | ||||||
| PCI loans |
9,512 | 10,572 | ||||||
| FDIC loss sharing asset |
- | 210 | ||||||
| California franchise tax |
3,269 | 2,613 | ||||||
| Accrued expense |
4,046 | 3,005 | ||||||
| Other, net |
1,563 | 892 | ||||||
|
|
|
|
|
|||||
| Gross deferred tax asset |
46,773 | 44,797 | ||||||
|
|
|
|
|
|||||
| Deferred tax liabilities: |
||||||||
| Depreciation |
2,207 | - | ||||||
| Intangibles - acquisitions |
2,705 | 868 | ||||||
| FHLB stock |
2,612 | 2,747 | ||||||
| Deferred income |
3,130 | 2,745 | ||||||
| Unrealized gain on investment securities, net |
4,553 | 9,638 | ||||||
|
|
|
|
|
|||||
| Gross deferred tax liability |
15,207 | 15,998 | ||||||
|
|
|
|
|
|||||
| Net deferred tax asset – federal |
$ | 31,566 | $ | 28,799 | ||||
|
|
|
|
|
|||||
134
Table of Contents
| As of December 31, | ||||||||
| 2016 | 2015 | |||||||
| State |
||||||||
| Deferred tax assets: |
||||||||
| Bad debt and credit loss deduction |
$ | 7,398 | $ | 7,172 | ||||
| Depreciation |
39 | 440 | ||||||
| Net operating loss carryforward |
- | - | ||||||
| Deferred compensation |
1,252 | 1,127 | ||||||
| PCI loans |
2,635 | 3,242 | ||||||
| FDIC loss sharing asset |
- | 97 | ||||||
| Accrued expense |
1,253 | 931 | ||||||
| Other, net |
547 | 275 | ||||||
|
|
|
|
|
|||||
| Gross deferred tax asset |
13,124 | 13,284 | ||||||
|
|
|
|
|
|||||
| Deferred tax liabilities: |
||||||||
| Intangibles - acquistions |
838 | 269 | ||||||
| FHLB stock |
809 | 851 | ||||||
| Deferred income |
969 | 762 | ||||||
| Unrealized gain on investment securities, net |
1,582 | 3,352 | ||||||
|
|
|
|
|
|||||
| Gross deferred tax liability |
4,198 | 5,234 | ||||||
|
|
|
|
|
|||||
| Net deferred tax asset – state |
$ | 8,926 | $ | 8,050 | ||||
|
|
|
|
|
|||||
A reconciliation of the statutory income tax rate to the consolidated effective income tax rate follows.
| For the Year Ended December 31, | ||||||||||||||||||||||||
| 2016 | 2015 | 2014 | ||||||||||||||||||||||
| Amount | Percent | Amount | Percent | Amount | Percent | |||||||||||||||||||
| (Dollars in thousands) | ||||||||||||||||||||||||
| Federal income tax at statutory rate |
$ | 56,800 | 35.0% | $ | 52,978 | 35.0% | $ | 56,979 | 35.0% | |||||||||||||||
| State franchise taxes, net of federal benefit |
11,299 | 7.0% | 10,457 | 6.9% | 11,233 | 6.9% | ||||||||||||||||||
| Tax-exempt income |
(5,848) | (3.6%) | (7,619) | (5.0%) | (8,622) | (5.3%) | ||||||||||||||||||
| Tax credits |
(846) | (0.5%) | (1,014) | (0.7%) | (1,014) | (0.6%) | ||||||||||||||||||
| Other, net |
(548) | (0.4%) | (2,581) | (1.7%) | 200 | 0.1% | ||||||||||||||||||
|
|
|
|
|
|
|
|
|
|
|
|
|
|||||||||||||
| Provision for income taxes |
$ | 60,857 | 37.5% | $ | 52,221 | 34.5% | $ | 58,776 | 36.1% | |||||||||||||||
|
|
|
|
|
|
|
|
|
|
|
|
|
|||||||||||||
The change in unrecognized tax benefits in 2016 and 2015 follows.
| For the Year Ended December 31, | ||||||||
| 2016 | 2015 | |||||||
| (Dollars in thousands) | ||||||||
| Balance, beginning of period |
$ | 1,675 | $ | 3,016 | ||||
| Additions for tax positions related to prior years |
- | - | ||||||
| Reductions due to lapse of statue of limitations |
- | (156) | ||||||
| Settlement with tax authorities |
- | (1,185) | ||||||
|
|
|
|
|
|||||
| Balance, end of period |
$ | 1,675 | $ | 1,675 | ||||
|
|
|
|
|
|||||
The total amount of unrecognized tax benefits at December 31, 2016 of $1.7 million would, if recognized, affect the effective tax rate. The amount accrued for payment of interest as of December 31, 2016 was $212,000. The Company records interest and penalties related to uncertain tax positions as part of other operating expense. We do not expect the total amount of unrecognized tax benefits to significantly increase or decrease within the next twelve months.
135
Table of Contents
The Company is subject to federal income tax and franchise tax of the state of California. Our federal income tax returns for the years ended December 31, 2009 through 2015 are open to audit by the federal authorities and our California state tax returns for the years ended December 31, 2006 through 2015 are open to audit by state authorities.
| 13. | DEPOSITS |
The composition of deposits is summarized below.
| As of December 31, | ||||||||||||||||
| 2016 | 2015 | |||||||||||||||
| (Dollars in thousands) | ||||||||||||||||
| Noninterest-bearing deposits |
$ | 3,673,541 | 58.2% | $ | 3,250,174 | 54.9% | ||||||||||
| Interest-bearing deposits |
||||||||||||||||
| Investment checking |
407,058 | 6.5% | 367,253 | 6.2% | ||||||||||||
| Money market |
1,504,021 | 23.8% | 1,293,210 | 21.9% | ||||||||||||
| Savings |
342,236 | 5.4% | 296,135 | 5.0% | ||||||||||||
| Time deposits |
382,824 | 6.1% | 710,488 | 12.0% | ||||||||||||
|
|
|
|
|
|
|
|
|
|||||||||
| Total deposits |
$ | 6,309,680 | 100.0% | $ | 5,917,260 | 100.0% | ||||||||||
|
|
|
|
|
|
|
|
|
|||||||||
Time deposits with balances of $250,000 or more amounted to approximately $104.7 million and $418.0 million at December 31, 2016 and 2015, respectively. Interest expense on such deposits amounted to approximately $444,000, $787,000 and $667,000, for the years ended December 31, 2016, 2015 and 2014, respectively. Certificates of deposit totaling approximately $280.1 million from a single public depositor matured in 2016 and were not renewed.
At December 31, 2016, the scheduled maturities of time certificates of deposit are as follows.
| December 31, 2016 | ||||
| Year of maturity: |
(Dollars in thousands) | |||
| 2017 |
$ | 354,509 | ||
| 2018 |
8,711 | |||
| 2019 |
5,720 | |||
| 2020 |
4,499 | |||
| 2021 and thereafter |
9,385 | |||
|
|
|
|||
| Total |
$ | 382,824 | ||
|
|
|
|||
| 14. | BORROWINGS |
Customer Repurchase Agreements
In November 2006, the Bank began a repurchase agreement product with its customers. This product, known as Citizens Sweep Manager, sells the Bank’s securities overnight to its customers under an agreement to repurchase them the next day. As of December 31, 2016 and 2015, total funds borrowed under these agreements were $603.0 million and $690.7 million, respectively, with weighted average interest rates of 0.26% and 0.24%.
Federal Home Loan Bank Advances
On February 23, 2015 we repaid our last outstanding FHLB advance which carried a fixed interest rate of 4.52%. At December 31, 2014, FHLB advances were $199.5 million.
At December 31, 2016, $3.11 billion of loans and $2.19 billion of investment securities, at carrying value, were pledged to secure public deposits, short and long-term borrowings, and for other purposes as required or permitted by law.
136
Table of Contents
The Bank incurred prepayment penalties on borrowings of $16,000 in 2016, compared to $13.9 million for 2015 and zero for 2014.
Other Borrowings
At December 31, 2016, the Bank had $53.0 million in short-term borrowings with the FHLB at a cost of 55 basis points, compared to $46.0 million at a cost of 28 basis points at December 31, 2015.
Junior Subordinated Debentures
On January 31, 2006, CVB Statutory Trust III completed a $25,000,000 offering of Trust Preferred Securities and used the gross proceeds from the offering and other cash totaling $25,774,000 to purchase a like amount of junior subordinated debentures of the Company. The junior subordinated debentures were issued concurrent with the issuance of the Trust Preferred Securities. The interest on junior subordinated debentures, paid by the Company to CVB Statutory Trust III, represents the sole revenues of CVB Statutory Trust III and the sole source of dividend distributions to the holders of the Trust Preferred Securities. The Company has fully and conditionally guaranteed all of CVB Statutory Trust III’s obligations under the Trust Preferred Securities. The Company has the right, assuming no default has occurred, to defer payments of interest on the junior subordinated debenture at any time for a period not to exceed 20 consecutive quarters. The Trust Preferred Securities will mature on March 15, 2036, but became callable in part or in total on March 15, 2011 by CVB Statutory Trust III. The Trust Preferred Securities have a variable per annum rate equal to LIBOR (as defined in the indenture dated as of January 31, 2006 (“Indenture”) between the Company and U.S. Bank National Association, as debenture trustee) plus 1.38% (the “Variable Rate”). As of December 31, 2016, these securities continue to be outstanding.
| 15. | COMMITMENTS AND CONTINGENCIES |
Commitments
At December 31, 2016 and 2015, the Bank had commitments to extend credit of approximately $844.3 million and $744.0 million, respectively, and obligations under letters of credit of $36.5 million and $35.1 million, respectively. Commitments to extend credit are agreements to lend to customers, provided there is no violation of any condition established in the contract. Commitments generally have fixed expiration dates or other termination clauses and may require payment of a fee. Commitments are generally variable rate, and many of these commitments are expected to expire without being drawn upon. As such, the total commitment amounts do not necessarily represent future cash requirements. The Bank uses the same credit underwriting policies in granting or accepting such commitments or contingent obligations as it does for on-balance-sheet instruments, which consist of evaluating customers’ creditworthiness individually. The Bank had a reserve for unfunded loan commitments of $6.7 million as of December 31, 2016 and $7.2 million as of December 31, 2015 included in other liabilities.
Standby letters of credit are conditional commitments issued by the Bank to guarantee the financial performance of a customer to a third party. Those guarantees are primarily issued to support private borrowing or purchase arrangements. The credit risk involved in issuing letters of credit is essentially the same as that involved in extending loan facilities to customers. When deemed necessary, the Bank holds appropriate collateral supporting those commitments. Management does not anticipate any material losses as a result of these transactions.
At December 31, 2016, the Bank has available lines of credit totaling $3.17 billion from correspondent banks, FHLB and Federal Reserve Bank of which $2.78 billion were secured.
Other Contingencies
Certain lawsuits and claims arising in the ordinary course of business have been filed or are pending against us or our affiliates, including but not limited to actions involving federal and state securities law claims,
137
Table of Contents
employment, wage-hour and labor law claims, lender liability claims, negligence, and consumer and privacy claims, some of which may be styled as “class action” or representative cases.
The Company is involved in the following legal actions and complaints which we currently believe could be material to us.
A purported shareholder class action complaint was filed against the Company on August 23, 2010, in an action captioned Lloyd v. CVB Financial Corp., et al., Case No. CV 10-06256- MMM, in the United States District Court for the Central District of California. Along with the Company, Christopher D. Myers (our President and Chief Executive Officer) and Edward J. Biebrich, Jr. (our former Chief Financial Officer) were also named as defendants. On September 14, 2010, a second purported shareholder class action complaint was filed against the Company, in an action originally captioned Englund v. CVB Financial Corp., et al., Case No. CV 10-06815-RGK, in the United States District Court for the Central District of California. The Englund complaint named the same defendants as the Lloyd complaint and made allegations substantially similar to those included in the Lloyd complaint. On January 21, 2011, the District Court consolidated the two actions for all purposes under the Lloyd action, now captioned as Case No. CV 10-06256-MMM (PJWx). At the same time, the District Court also appointed the Jacksonville Police and Fire Pension Fund (the “Jacksonville Fund”) as lead plaintiff in the consolidated action and approved the Jacksonville Fund’s selection of lead counsel for the plaintiffs in the consolidated action. On March 7, 2011, the Jacksonville Fund filed a consolidated complaint naming the same defendants and alleging violations by all defendants of Section 10(b) of the Securities Exchange Act of 1934 and Rule 10b-5 promulgated thereunder and violations by the individual defendants of Section 20(a) of the Exchange Act. The consolidated complaint alleges that defendants, among other things, misrepresented and failed to disclose conditions adversely affecting the Company throughout the purported class period, which was originally alleged to be between October 21, 2009 and August 9, 2010 (but which has subsequently been shortened to the period between March 4, 2010 and August 9, 2010). Specifically, defendants are alleged to have violated applicable accounting rules and to have made misrepresentations in connection with the Company’s allowance for loan loss methodology, loan underwriting guidelines, methodology for grading loans, and the process for making provisions for loan losses. The consolidated complaint sought compensatory damages and other relief in favor of the purported class.
On October 26, 2016, the Parties entered into a Stipulation and Settlement (“Securities Settlement”) to resolve the litigation for a payment of $6.2 million. The Securities Settlement is being funded solely with insurance proceeds, and involves no admission of liability whatsoever. On December 5, 2016, the Court entered an order preliminarily approving the Securities Settlement. The Securities Settlement is subject to final court approval, which is currently scheduled for hearing March 13, 2017.
A former employee and branch-based service manager filed a complaint against the Company, on December 29, 2014, in an action entitled Glenda Morgan v. Citizens Business Bank, et al., Case No. BC568004, in the Superior Court for Los Angeles County, individually and on behalf of the Company’s branch-based employees and managers who are classified as “exempt” under California and federal employment laws. The case is styled as a putative class action lawsuit and alleges, among other things, that (i) the Company misclassified certain employees and managers as “exempt” employees, (ii) the Company violated California’s wage and hour, overtime, meal break and rest break rules and regulations, (iii) certain employees did not receive proper expense reimbursements, (iv) the Company did not maintain accurate and complete payroll records, and (v) the Company engaged in unfair business practices. On February 11, 2015, the same law firm representing Morgan filed a second complaint, entitled Jessica Osuna v. Citizens Business Bank, et al., Case No. CIVDS1501781, in the Superior Court for San Bernardino County, alleging wage and hour claims on behalf of the Company’s “non-exempt” hourly employees. On April 6, 2015, these two cases were consolidated in a first amended complaint in Los Angeles County Superior Court. The first amended complaint sought class certification, the appointment of the plaintiffs as class representatives, and an unspecified amount of damages and penalties. Subsequently, related cases were filed by the same law firm in the Superior Court for San Bernardino County, alleging (1) violations of the Labor Code and seeking penalties under the California Private
138
Table of Contents
Attorney General Act of 2004 and (2) seeking a declaratory judgment that certain releases signed by CBB employees were invalid.
On November 28, 2016, the parties reached an agreement in principal to settle all of the related wage and hour class action lawsuits (“Wage-Hour Settlement”). Plaintiffs will dismiss all their lawsuits with prejudice in exchange for the payment of $1,500,000 to the putative class members, after attorneys’ fees and costs. The Wage-Hour Settlement is subject to court approval. The parties are preparing the Wage-Hour Settlement documents and will seek preliminary approval from the court during the first quarter of 2017. We anticipate that the Wage-Hour Settlement will be concluded sometime in the second quarter of 2017.
Where appropriate, we establish accruals in accordance with FASB guidance over loss contingencies (ASC 450). As of December 31, 2016, the Company had established a litigation accrual of $1.5 million for the Wage –Hour Settlement. Our accruals for loss contingencies are reviewed quarterly and adjusted as additional information becomes available. We disclose the amount accrued if we believe it is material or if we believe such disclosure is necessary for our financial statements to not be misleading. If a loss is not both probable and reasonably estimable, or if an exposure to loss exists in excess of the amount previously accrued, we assess whether there is at least a reasonable possibility that a loss, or additional loss, may have been incurred, and we adjust our accruals and disclosures accordingly. We do not presently believe that the ultimate resolution of the foregoing matters will have a material adverse effect on the Company’s results of operations, financial condition, or cash flows. The outcome of litigation and other legal and regulatory matters is inherently uncertain, however, and it is possible that one or more of the legal matters currently pending or threatened could have a material adverse effect on our liquidity, consolidated financial position, and/or results of operations.
| 16. | EMPLOYEE BENEFIT PLANS |
Deferred Compensation Plans
As of December 31, 2016, the Company has various deferred compensation plans, and severance arrangements it assumed through the acquisition of other banks in prior years. These plans require the Company to make periodic payments to former employees upon retirement, upon a change in control, and in certain instances, to beneficiaries of former employees upon death. Payments made by the Company under these agreements totaled approximately $610,000, $751,000 and $866,000 for each of the years ended December 31, 2016, 2015 and 2014, respectively. The total expense recorded by the Company for these deferred compensation agreements was approximately $684,000, $600,000 and $544,000 for each of the years ended December 31, 2016, 2015 and 2014, respectively.
On December 22, 2006, the Company approved a deferred compensation plan for its President and Chief Executive Officer, Christopher D. Myers. Under the plan, which became effective on January 1, 2007, Mr. Myers may defer up to 75% of his base salary and up to 100% of his bonus for each calendar year in which the Plan is effective. The Company has the discretion to make additional contributions to the Plan for the benefit of Mr. Myers. No discretionary payments were made by the Company during the years ended December 31, 2016, 2015 and 2014.
On March 31, 2007, the Company approved the Executive Non-qualified Excess Plan, a deferred compensation plan for certain management employees to provide a means by which they may elect to defer receipt of compensation in order to provide retirement benefits. The plan is intended to be unfunded and primarily serve the purpose of providing deferred compensation benefits for a select group of employees. The Bank, however, does fund the cost of these plans through the purchase of life insurance policies, which are recorded in other assets of the consolidated balance sheets. At December 31, 2016 and 2015, the amount of deferred compensation liability was $2.9 million and $2.5 million, respectively.
139
Table of Contents
401(k) and Profit Sharing Plan
The Bank sponsors a 401(k) and profit-sharing plan for the benefit of its employees. Employees are eligible to participate in the plan immediately upon hire. Employees may make contributions to the plan under the plan’s 401(k) component. The Bank contributes 3%, non-matching, to the plan to comply with ERISA’s safe harbor provisions. The Bank may make additional contributions under the plan’s profit-sharing component, subject to certain limitations. The Bank’s total contributions are determined by the Board of Directors and amounted to approximately $2.8 million in 2016, $2.8 million in 2015 and $3.1 million in 2014.
| 17. | EARNINGS PER SHARE RECONCILIATION |
Basic earnings per common share are computed by dividing income allocated to common stockholders by the weighted-average number of common shares outstanding during each period. The computation of diluted earnings per common share considers the number of tax-effected shares issuable upon the assumed exercise of outstanding common stock options. Antidilutive common shares are not included in the calculation of diluted earnings per common share. For the years ended December 31, 2016, 2015 and 2014, shares deemed to be antidilutive, and thus excluded from the computation of earnings per common share were 291,000, 238,000 and 213,000 million, respectively.
The table below shows earnings per common share and diluted earnings per common share, and reconciles the numerator and denominator of both earnings per common share calculations.
| For the Year Ended December 31, | ||||||||||||
| 2016 | 2015 | 2014 | ||||||||||
| (In thousands, except per share amounts) | ||||||||||||
| Earnings per common share: |
||||||||||||
| Net earnings |
$ | 101,429 | $ | 99,145 | $ | 104,021 | ||||||
| Less: Net earnings allocated to restricted stock |
421 | 515 | 544 | |||||||||
|
|
|
|
|
|
|
|||||||
| Net earnings allocated to common shareholders |
$ | 101,008 | $ | 98,630 | $ | 103,477 | ||||||
|
|
|
|
|
|
|
|||||||
| Weighted average shares outstanding |
107,282 | 105,715 | 105,239 | |||||||||
| Basic earnings per common share |
$ | 0.94 | $ | 0.93 | $ | 0.98 | ||||||
|
|
|
|
|
|
|
|||||||
| Diluted earnings per common share: |
||||||||||||
| Net income allocated to common shareholders |
$ | 101,008 | $ | 98,630 | $ | 103,477 | ||||||
|
|
|
|
|
|
|
|||||||
| Weighted average shares outstanding |
107,282 | 105,715 | 105,239 | |||||||||
| Incremental shares from assumed exercise of outstanding options |
405 | 477 | 520 | |||||||||
|
|
|
|
|
|
|
|||||||
| Diluted weighted average shares outstanding |
107,687 | 106,192 | 105,759 | |||||||||
| Diluted earnings per common share |
$ | 0.94 | $ | 0.93 | $ | 0.98 | ||||||
|
|
|
|
|
|
|
|||||||
| 18. | STOCK OPTION PLANS AND RESTRICTED STOCK AWARDS |
In May 2008, the shareholders approved the 2008 Equity Incentive Plan which authorizes the issuance of up to 3,949,891 shares of Company common stock for grants of stock options and restricted stock to employees, officers, consultants and directors of the Company and its subsidiaries, and expires in 2018. The plan authorizes the issuance of incentive and non-qualified stock options, as well as, restricted stock awards. The 2008 Equity Incentive Plan replaced the 2000 Stock Option Plan. No further grants will be made under the 2000 Stock Option Plan, but shares may continue to be issued under such plan pursuant to grants previously made. As of December 31, 2016, we have 17,500 outstanding options under our 2000 Stock Option Plan.
140
Table of Contents
Stock Options
The Company expensed $485,000, $549,000 and $876,000, for the years ended December 31, 2016, 2015 and 2014, respectively.
The estimated fair value of the options granted during 2016 and prior years was calculated using the Black-Scholes options pricing model. There were 121,500, 83,000 and 169,000 options granted during 2016, 2015 and 2014, respectively. The options will vest, in equal installments, over a five-year period. The fair value of each stock option granted in 2016, 2015 and 2014, was estimated on the date of grant using the following weighted-average assumptions.
| For the Year Ended December 31, | ||||||||||||
| 2016 | 2015 | 2014 | ||||||||||
| Dividend yield |
2.9% | 2.5% | 2.6% | |||||||||
| Volatility |
33.1% | 47.7% | 50.3% | |||||||||
| Risk-free interest rate |
1.2% | 1.5% | 1.5% | |||||||||
| Expected life |
5.6 years | 6.1 years | 6.3 years | |||||||||
| Weighted average grant date fair value |
$3.96 | $5.83 | $5.70 | |||||||||
The expected volatility is solely based on the daily historical stock price volatility over the expected option life. The expected life of options granted is derived from the output of the option valuation model and represents the period of time an optionee will hold an option before exercising it. The risk-free rate for periods within the contractual life of the option is based on the U.S. Treasury five-year constant maturity yield curve in effect at the time of the grant. The Company estimates its forfeiture rates based on its historical experience. The forfeiture rate for 2016 was 6.0%.
The following table presents option activity under the Company’s stock option plans as of and for the year ended December 31, 2016.
| Number of Stock Options Outstanding |
Weighted Average Exercise Price |
Weighted Average Remaining Contractual Term |
Aggregate Intrinsic Value |
|||||||||||||
| (In thousands) | (In years) | (In thousands) | ||||||||||||||
| Outstanding at January 1, 2016 |
1,288 | $ 11.00 | ||||||||||||||
| Granted |
122 | 16.71 | ||||||||||||||
| Exercised |
(483) | 10.65 | ||||||||||||||
| Forfeited or expired |
(51) | 12.99 | ||||||||||||||
|
|
|
|
|
|||||||||||||
| Outstanding at December 31, 2016 |
876 | $ 11.88 | 5.06 | $ 9,684 | ||||||||||||
|
|
|
|
|
|||||||||||||
| Vested or expected to vest at December 31, 2016 |
834 | $ 11.70 | 4.90 | $ 9,369 | ||||||||||||
| Exercisable at December 31, 2016 |
568 | $ 9.95 | 3.44 | $ 7,370 | ||||||||||||
The total intrinsic value of options exercised during the years ended December 31, 2016, 2015 and 2014 was $3.9 million, $2.1 million and $2.5 million, respectively.
As of December 31, 2016, there was a total of $978,000 in unrecognized compensation cost related to nonvested options granted under the Plan. That cost is expected to be recognized over a weighted-average period of approximately 3.2 years. The total fair value of options vested was $489,000, $524,000 and $841,000 during 2016, 2015 and 2014, respectively. Cash received from stock option exercises was $5.2 million, $5.1 million and $5.5 million, in 2016, 2015 and 2014, respectively.
141
Table of Contents
At December 31, 2016, options for the purchase of 876,036 shares of the Company’s common stock were outstanding under the above plans, of which options to purchase 567,836 shares were exercisable at prices ranging from $7.68 to $18.14.
The Company has a policy of issuing new shares to satisfy share option exercises.
Restricted Stock
Under the 2008 Equity Incentive Plan, the Company granted 166,500, 97,000 and 400,000 restricted stock awards during 2016, 2015 and 2014 respectively. The weighted average grant date fair value of restricted stock awards granted in 2016, 2015 and 2014 was $16.89 per share, $16.07 per share and $14.78 per share, respectively. These awards will vest, in equal installments, over a period of three or five years.
Compensation cost is recognized over the requisite service period, which is five years, and amounted to $2.3 million, $2.2 million and $2.1 million during the years ended December 31, 2016, 2015 and 2014, respectively. Total unrecognized compensation cost related to restricted stock awards was $5.0 million at December 31, 2016.
The table below summarizes activity related to the Company’s non-vested restricted shares for the year ended December 31, 2016.
| Shares | Weighted Average Fair Value |
|||||||
| (In thousands) | ||||||||
| Nonvested at January 1, 2016 |
506 | $ 14.55 | ||||||
| Granted |
166 | 16.89 | ||||||
| Vested |
(152) | 14.58 | ||||||
| Forfeited |
(60) | 14.24 | ||||||
|
|
|
|
|
|||||
| Nonvested at December 31, 2016 |
460 | $ 15.43 | ||||||
|
|
|
|
|
|||||
Under the 2008 Equity Incentive Plan, 647,192 shares of common stock were available for the granting of future options and restricted stock awards as of December 31, 2016.
| 19. | REGULATORY MATTERS |
The Company (on a consolidated basis) and the Bank are subject to various regulatory capital requirements administered by the federal banking regulatory agencies. Failure to meet minimum capital requirements can initiate certain mandatory, and possibly additional discretionary, actions by regulators that, if undertaken, could have a direct, material effect on the Company’s and the Bank’s financial statements. Under capital adequacy guidelines and the regulatory framework for prompt corrective action, the Company and Bank must meet specific capital guidelines that involve quantitative measures of assets, liabilities, and certain off-balance-sheet items as calculated under regulatory accounting practices. The capital amounts and classification are also subject to qualitative judgment by the regulators about components, risk-weightings, and other factors. Prompt corrective action provisions are not applicable to bank holding companies.
Effective January 1, 2015, the Company and the Bank became subject to a new regulatory capital measure called Common Equity Tier 1 (“CET1”) to risk-weighted assets which was implemented as a result of the “Basel III” regulatory capital reforms and changes required by the Dodd-Frank Act.
Basel III also introduces a new “capital conservation buffer,” composed entirely of CET1, on top of minimum risk-weighted asset ratios. The capital conservation buffer is designed to absorb losses during periods of economic stress. Banking institutions with a ratio of CET1 to risk-weighted assets above the minimum
142
Table of Contents
requirement but below the capital conservation buffer will face constraints on dividends, equity repurchases and payment of discretionary bonuses based on the amount of the shortfall. The implementation of the capital conservation buffer began on January 1, 2016 at 0.625% and will be phased in over a four-year period (increasing by that amount on each subsequent January 1, until it reaches 2.5% on January 1, 2019). Thus, when fully phased in on January 1, 2019, the Bank will be required to maintain this additional capital conservation buffer of 2.5% of CET1.
Quantitative measures established by regulation to ensure capital adequacy require the Company and the Bank to maintain minimum amounts and ratios (set forth in the table below) of total capital, Tier 1 capital and CET1 capital to risk-weighted assets, and of Tier 1 capital to average assets. Management believes that, as of December 31, 2016 and 2015, the Company and the Bank meet all capital adequacy requirements to which they are subject.
As of December 31, 2016 and 2015, the most recent notifications from the FDIC categorized the Bank as well capitalized under the regulatory framework for prompt corrective action. To be categorized as well capitalized, the minimum total risk-based, Tier 1 risk-based, CET1 risk-based, and Tier 1 leverage (tangible Tier 1 capital divided by average total assets) ratios as set forth in the table below must be maintained. There are no conditions or events since said notification that management believes have changed the Bank’s category.
143
Table of Contents
As of December 31, 2016 and 2015, the Company had $25.0 million of trust-preferred securities, which were included in Tier 1 capital for regulatory purposes, respectively. The following table summarizes regulatory capital amounts and ratios for the Company and the Bank as of December 31, 2016 and 2015.
| Actual | For Capital Adequacy Purposes |
To Be Well Capitalized under Prompt Corrective Action Provisions |
||||||||||||||||||||||||||||||
| Amount | Ratio | Amount | Ratio | Amount | Ratio | |||||||||||||||||||||||||||
| (Dollars in thousands) | ||||||||||||||||||||||||||||||||
| As of December 31, 2016: |
||||||||||||||||||||||||||||||||
| Total Capital (to Risk-Weighted Assets) |
||||||||||||||||||||||||||||||||
| Company |
$ | 982,461 | 18.19% | $ | 432,081 | ³ | 8.00% | N/A | ||||||||||||||||||||||||
| Bank |
$ | 971,681 | 18.01% | $ | 431,576 | ³ | 8.00% | $ | 539,471 | ³ | 10.00% | |||||||||||||||||||||
| Tier 1 Capital (to Risk-Weighted Assets) |
||||||||||||||||||||||||||||||||
| Company |
$ | 914,937 | 16.94% | $ | 324,061 | ³ | 6.00% | N/A | ||||||||||||||||||||||||
| Bank |
$ | 904,236 | 16.76% | $ | 323,682 | ³ | 6.00% | $ | 431,576 | ³ | 8.00% | |||||||||||||||||||||
| Common equity Tier 1 capital ratio |
||||||||||||||||||||||||||||||||
| Company |
$ | 890,118 | 16.48% | $ | 243,046 | ³ | 4.50% | N/A | ||||||||||||||||||||||||
| Bank |
$ | 904,236 | 16.76% | $ | 242,762 | ³ | 4.50% | $ | 350,656 | ³ | 6.50% | |||||||||||||||||||||
| Tier 1 Capital (to Average-Assets) |
||||||||||||||||||||||||||||||||
| Company |
$ | 914,937 | 11.49% | $ | 318,552 | ³ | 4.00% | N/A | ||||||||||||||||||||||||
| Bank |
$ | 904,236 | 11.36% | $ | 318,305 | ³ | 4.00% | $ | 397,882 | ³ | 5.00% | |||||||||||||||||||||
| As of December 31, 2015: |
||||||||||||||||||||||||||||||||
| Total Capital (to Risk-Weighted Assets) |
||||||||||||||||||||||||||||||||
| Company |
$ | 914,972 | 18.23% | $ | 401,532 | ³ | 8.00% | N/A | ||||||||||||||||||||||||
| Bank |
$ | 905,563 | 18.06% | $ | 401,053 | ³ | 8.00% | $ | 501,316 | ³ | 10.00% | |||||||||||||||||||||
| Tier 1 Capital (to Risk-Weighted Assets) |
||||||||||||||||||||||||||||||||
| Company |
$ | 852,189 | 16.98% | $ | 301,149 | ³ | 6.00% | N/A | ||||||||||||||||||||||||
| Bank |
$ | 842,854 | 16.81% | $ | 300,790 | ³ | 6.00% | $ | 401,053 | ³ | 8.00% | |||||||||||||||||||||
| Common equity Tier 1 capital ratio |
||||||||||||||||||||||||||||||||
| Company |
$ | 827,547 | 16.49% | $ | 225,861 | ³ | 4.50% | N/A | ||||||||||||||||||||||||
| Bank |
$ | 842,854 | 16.81% | $ | 225,592 | ³ | 4.50% | $ | 325,856 | ³ | 6.50% | |||||||||||||||||||||
| Tier 1 Capital (to Average-Assets) |
||||||||||||||||||||||||||||||||
| Company |
$ | 852,189 | 11.22% | $ | 303,794 | ³ | 4.00% | N/A | ||||||||||||||||||||||||
| Bank |
$ | 842,854 | 11.11% | $ | 303,527 | ³ | 4.00% | $ | 379,409 | ³ | 5.00% | |||||||||||||||||||||
In addition, California Banking Law limits the amount of dividends a bank can pay without obtaining prior approval from bank regulators. Under this law, the Bank could, as of December 31, 2016, declare and pay additional dividends of approximately $174.6 million.
| 20. | FAIR VALUE INFORMATION |
Fair Value Hierarchy
Fair value is the exchange price that would be received for an asset or paid to transfer a liability (exit price) in the principal or most advantageous market for the asset or liability in an orderly transaction between market participants on the measurement date.
144
Table of Contents
The following disclosure provides the fair value information for financial assets and liabilities as of December 31, 2016. The fair value hierarchy prioritizes the inputs to valuation techniques used to measure fair value into three broad levels (Level 1, Level 2 and Level 3).
| • | Level 1 — includes assets and liabilities that have an active market that provides an objective quoted value for each unit. Here the active market quoted value is used to measure the fair value. Level 1 has the most objective measurement of fair value. Level 2 is less objective and Level 3 is the least objective (most subjective) in estimating fair value. |
| • | Level 2 — assets and liabilities are ones where there is no active market in the same assets, but where there are parallel markets or alternative means to estimate fair value using observable information inputs such as the value placed on similar assets or liability that were recently traded. |
| • | Level 3 — fair values are based on information from the entity that reports these values in their financial statements. Such data are referred to as unobservable, in that the valuations are not based on data available to parties outside the entity. |
Observable and unobservable inputs are the key elements that separate the levels in the fair value hierarchy. Inputs here refer explicitly to the types of information used to obtain the fair value of the asset or liability.
Observable inputs include data sources and market prices available and visible outside of the entity. While there will continue to be judgments required when an active market price is not available, these inputs are external to the entity and observable outside the entity; they are consequently considered more objective than internal unobservable inputs used for Level 3 fair value.
Unobservable inputs are data and analyses that are developed within the entity to assess the fair value, such as management estimates of future benefits from use of assets.
There were no transfers in and out of Level 1 and Level 2 during the years ended December 31, 2016 and 2015.
Determination of Fair Value
The following is a description of valuation methodologies used for assets and liabilities recorded at fair value and for estimating fair value for financial instruments not recorded at fair value.
Cash and Cash Equivalents — The carrying amount of cash and cash equivalents is considered to approximate fair value due to the liquidity of these instruments.
Interest-Bearing Balances Due from Depository Institutions — The carrying value of due from depository institutions is considered to approximate fair value due to the short-term nature of these deposits.
FHLB Stock — The carrying amount of FHLB stock approximates fair value, as the stock may be sold back to the FHLB at carrying value.
Investment Securities (Available-for-sale and Held-to-Maturity) — Investment securities are generally valued based upon quotes obtained from an independent third-party pricing service, which uses evaluated pricing applications and model processes. Observable market inputs, such as, benchmark yields, reported trades, broker/dealer quotes, issuer spreads, two-sided markets, benchmark securities, bids, offers and reference data are considered as part of the evaluation. The inputs are related directly to the security being evaluated, or indirectly to a similarly situated security. Market assumptions and market data are utilized in the valuation models. The Company reviews the market prices provided by the third-party pricing service for reasonableness based on the Company’s understanding of the market place and credit issues related to the securities. The Company has not made any adjustments to the market quotes provided by them and, accordingly, the Company categorized its investment portfolio within Level 2 of the fair value hierarchy.
145
Table of Contents
Loans — The carrying amount of loans and lease finance receivables is their contractual amounts outstanding, reduced by deferred net loan origination fees, purchase price discounts and the allocable portion of the allowance for loan losses.
The fair value of loans, other than loans on nonaccrual status, was estimated by discounting the remaining contractual cash flows using the estimated current rate at which similar loans would be made to borrowers with similar credit risk characteristics and for the same remaining maturities, reduced by deferred net loan origination fees and the allocable portion of the allowance for loan losses. Accordingly, in determining the estimated current rate for discounting purposes, no adjustment has been made for any change in borrowers’ specific credit risks since the origination or purchase of such loans. Rather, the allocable portion of the allowance for loan losses and the purchase price discounts are considered to provide for such changes in estimating fair value. As a result, this fair is not necessarily the value which would be derived using an exit price. These loans are included within Level 3 of the fair value hierarchy.
Impaired loans and OREO are generally measured using the fair value of the underlying collateral, which is determined based on the most recent appraisal information received, less costs to sell. Appraised values may be adjusted based on factors such as the changes in market conditions from the time of valuation or discounted cash flows of the property. As such, these loans and OREO fall within Level 3 of the fair value hierarchy.
The majority of our commitments to extend credit carry current market interest rates if converted to loans. Because these commitments are generally unassignable by either the borrower or us, they only have value to the borrower and us. The estimated fair value approximates the recorded deferred fee amounts and is excluded from the following table because it is not material.
Swaps — The fair value of the interest rate swap contracts are provided by our counterparty using a system that constructs a yield curve based on cash LIBOR rates, Eurodollar futures contracts, and 3-year through 30-year swap rates. The yield curve determines the valuations of the interest rate swaps. Accordingly, each swap is categorized as a Level 2 valuation.
Asset held-for-sale — The carrying amount of asset held-for-sale reflects the lower cost of market, less costs to sell. The fair value of asset held-for-sale is primarily based on independent third-party appraisal information. Appraised values may be adjusted based on factors such as the changes in market conditions from the time of valuation. As such, asset held-for-sale is categorized as a Level 3 of the fair value hierarchy.
Deposits & Borrowings — The amounts payable to depositors for demand, savings, and money market accounts, and short-term borrowings are considered to approximate fair value. The fair value of fixed-maturity certificates of deposit is estimated using the rates currently offered for deposits of similar remaining maturities. The fair value of long-term borrowings and junior subordinated debentures is estimated using the rates currently offered for borrowings of similar remaining maturities. Interest-bearing deposits and borrowings are included within Level 2 of the fair value hierarchy.
146
Table of Contents
Assets and Liabilities Measured at Fair Value on a Recurring Basis
The tables below present the balances of assets and liabilities measured at fair value on a recurring basis for the periods presented.
| Carrying Value at December 31, 2016 |
Quoted Prices in Active Markets for Identical Assets (Level 1) |
Significant Other Observable Inputs (Level 2) |
Significant Unobservable Inputs (Level 3) |
|||||||||||||
| (Dollars in thousands) | ||||||||||||||||
| Description of assets |
||||||||||||||||
| Investment securities - AFS: |
||||||||||||||||
| Government agency/GSE |
$ | 2,752 | $ | - | $ | 2,752 | $ | - | ||||||||
| Residential mortgage-backed securities |
1,834,748 | - | 1,834,748 | - | ||||||||||||
| CMO/REMIC - residential |
347,189 | - | 347,189 | - | ||||||||||||
| Municipal bonds |
80,071 | - | 80,071 | - | ||||||||||||
| Other securities |
5,706 | - | 5,706 | - | ||||||||||||
|
|
|
|
|
|
|
|
|
|||||||||
| Total investment securities - AFS |
2,270,466 | - | 2,270,466 | - | ||||||||||||
| Interest rate swaps |
5,783 | - | 5,783 | - | ||||||||||||
|
|
|
|
|
|
|
|
|
|||||||||
| Total assets |
$ | 2,276,249 | $ | - | $ | 2,276,249 | $ | - | ||||||||
|
|
|
|
|
|
|
|
|
|||||||||
| Description of liability |
||||||||||||||||
| Interest rate swaps |
$ | 5,783 | $ | - | $ | 5,783 | $ | - | ||||||||
|
|
|
|
|
|
|
|
|
|||||||||
| Total liabilities |
$ | 5,783 | $ | - | $ | 5,783 | $ | - | ||||||||
|
|
|
|
|
|
|
|
|
|||||||||
| Carrying Value at December 31, 2015 |
Quoted Prices in Active Markets for Identical Assets (Level 1) |
Significant Other Observable Inputs (Level 2) |
Significant Unobservable Inputs (Level 3) |
|||||||||||||
| (Dollars in thousands) | ||||||||||||||||
| Description of assets |
||||||||||||||||
| Investment securities - AFS: |
||||||||||||||||
| Government agency/GSE |
$ | 5,745 | $ | - | $ | 5,745 | $ | - | ||||||||
| Residential mortgage-backed securities |
1,813,097 | - | 1,813,097 | - | ||||||||||||
| CMO/REMIC - residential |
383,781 | - | 383,781 | - | ||||||||||||
| Municipal bonds |
160,973 | - | 160,973 | - | ||||||||||||
| Other securities |
5,050 | - | 5,050 | - | ||||||||||||
|
|
|
|
|
|
|
|
|
|||||||||
| Total investment securities - AFS |
2,368,646 | - | 2,368,646 | - | ||||||||||||
| Interest rate swaps |
9,344 | - | 9,344 | - | ||||||||||||
|
|
|
|
|
|
|
|
|
|||||||||
| Total assets |
$ | 2,377,990 | $ | - | $ | 2,377,990 | $ | - | ||||||||
|
|
|
|
|
|
|
|
|
|||||||||
| Description of liability |
||||||||||||||||
| Interest rate swaps |
$ | 9,344 | $ | - | $ | 9,344 | $ | - | ||||||||
|
|
|
|
|
|
|
|
|
|||||||||
| Total liabilities |
$ | 9,344 | $ | - | $ | 9,344 | $ | - | ||||||||
|
|
|
|
|
|
|
|
|
|||||||||
147
Table of Contents
Assets and Liabilities Measured at Fair Value on a Non-Recurring Basis
We may be required to measure certain assets at fair value on a non-recurring basis in accordance with GAAP. These adjustments to fair value usually result from application of lower of cost or fair value accounting or write-downs of individual assets. For assets measured at fair value on a non-recurring basis that were held on the balance sheet at December 31, 2016 and 2015, respectively, the following tables provide the level of valuation assumptions used to determine each adjustment and the carrying value of the related assets that had losses during the period.
| Carrying Value at December 31, 2016 |
Quoted Prices in Active Markets for Identical Assets (Level 1) |
Significant Other Observable Inputs (Level 2) |
Significant Unobservable Inputs (Level 3) |
Total Losses For the Year Ended December 31, 2016 |
||||||||||||||||
| (Dollars in thousands) | ||||||||||||||||||||
| Description of assets |
||||||||||||||||||||
| Impaired loans, excluding PCI loans: |
||||||||||||||||||||
| Commercial and industrial |
$ | 65 | $ | - | $ | - | $ | 65 | $ | 8 | ||||||||||
| SBA |
196 | - | - | 196 | 27 | |||||||||||||||
| Real estate: |
||||||||||||||||||||
| Commercial real estate |
- | - | - | - | - | |||||||||||||||
| Construction |
- | - | - | - | - | |||||||||||||||
| SFR mortgage |
- | - | - | - | - | |||||||||||||||
| Dairy & livestock and agribusiness |
- | - | - | - | - | |||||||||||||||
| Consumer and other loans |
- | - | - | - | - | |||||||||||||||
| Other real estate owned |
- | - | - | - | - | |||||||||||||||
| Asset held-for-sale |
3,411 | - | - | 3,411 | 2,558 | |||||||||||||||
|
|
|
|
|
|
|
|
|
|
|
|||||||||||
| Total assets |
$ | 3,672 | $ | - | $ | - | $ | 3,672 | $ | 2,593 | ||||||||||
|
|
|
|
|
|
|
|
|
|
|
|||||||||||
| Carrying Value at December 31, 2015 |
Quoted Prices in Active Markets for Identical Assets (Level 1) |
Significant Other Observable Inputs (Level 2) |
Significant Unobservable Inputs (Level 3) |
Total Losses For the Year Ended December 31, 2015 |
||||||||||||||||
| (Dollars in thousands) | ||||||||||||||||||||
| Description of assets |
||||||||||||||||||||
| Impaired loans, excluding PCI loans: |
||||||||||||||||||||
| Commercial and industrial |
$ | 228 | $ | - | $ | - | $ | 228 | $ | 228 | ||||||||||
| SBA |
41 | - | - | 41 | 15 | |||||||||||||||
| Real estate: |
||||||||||||||||||||
| Commercial real estate |
- | - | - | - | - | |||||||||||||||
| Construction |
7,651 | - | - | 7,651 | 13 | |||||||||||||||
| SFR mortgage |
588 | - | - | 588 | 20 | |||||||||||||||
| Dairy & livestock and agribusiness |
- | - | - | - | - | |||||||||||||||
| Consumer and other loans |
258 | - | - | 258 | 101 | |||||||||||||||
| Other real estate owned |
948 | - | - | 948 | 162 | |||||||||||||||
|
|
|
|
|
|
|
|
|
|
|
|||||||||||
| Total assets |
$ | 9,714 | $ | - | $ | - | $ | 9,714 | $ | 539 | ||||||||||
|
|
|
|
|
|
|
|
|
|
|
|||||||||||
148
Table of Contents
Fair Value of Financial Instruments
The following disclosure presents estimated fair value of financial instruments. The estimated fair value amounts have been determined by the Company using available market information and appropriate valuation methodologies. However, considerable judgment is required to develop the estimates of fair value. Accordingly, the estimates presented below are not necessarily indicative of the amounts the Company may realize in a current market exchange as of December 31, 2016 and 2015, respectively. The use of different market assumptions and/or estimation methodologies may have a material effect on the estimated fair value amounts.
| December 31, 2016 | ||||||||||||||||||||
| Estimated Fair Value | ||||||||||||||||||||
| Carrying Amount |
Level 1 | Level 2 | Level 3 | Total | ||||||||||||||||
| (Dollars in thousands) | ||||||||||||||||||||
| Assets |
||||||||||||||||||||
| Total cash and cash equivalents |
$ | 119,445 | $ | 119,445 | $ | - | $ | - | $ | 119,445 | ||||||||||
| Interest-earning balances due from depository institutions |
2,188 | - | 2,188 | - | 2,188 | |||||||||||||||
| FHLB stock |
17,688 | - | 17,688 | - | 17,688 | |||||||||||||||
| Investment securities available-for-sale |
2,270,466 | - | 2,270,466 | - | 2,270,466 | |||||||||||||||
| Investment securities held-to-maturity |
911,676 | - | 897,374 | - | 897,374 | |||||||||||||||
| Total loans, net of allowance for loan losses |
4,333,524 | - | - | 4,306,225 | 4,306,225 | |||||||||||||||
| Swaps |
5,783 | - | 5,783 | - | 5,783 | |||||||||||||||
| Liabilities |
||||||||||||||||||||
| Deposits: |
||||||||||||||||||||
| Noninterest-bearing |
$ | 3,673,541 | $ | 3,673,541 | $ | - | $ | - | $ | 3,673,541 | ||||||||||
| Interest-bearing |
2,636,139 | - | 2,634,443 | - | 2,634,443 | |||||||||||||||
| Borrowings |
656,028 | - | 655,820 | - | 655,820 | |||||||||||||||
| Junior subordinated debentures |
25,774 | - | - | 18,463 | 18,463 | |||||||||||||||
| Swaps |
5,783 | - | 5,783 | - | 5,783 | |||||||||||||||
| December 31, 2015 | ||||||||||||||||||||
| Estimated Fair Value | ||||||||||||||||||||
| Carrying Amount |
Level 1 | Level 2 | Level 3 | Total | ||||||||||||||||
| (Dollars in thousands) | ||||||||||||||||||||
| Assets |
||||||||||||||||||||
| Total cash and cash equivalents |
$ | 106,097 | $ | 106,097 | $ | - | $ | - | $ | 106,097 | ||||||||||
| Interest-earning balances due from depository institutions |
32,691 | - | 32,691 | - | 32,691 | |||||||||||||||
| FHLB stock |
17,588 | - | 17,588 | - | 17,588 | |||||||||||||||
| Investment securities available-for-sale |
2,368,646 | - | 2,368,646 | - | 2,368,646 | |||||||||||||||
| Investment securities held-to-maturity |
850,989 | - | 851,186 | 1,853 | 853,039 | |||||||||||||||
| Total loans, net of allowance for loan losses |
3,957,781 | - | - | 3,971,329 | 3,971,329 | |||||||||||||||
| Swaps |
9,344 | - | 9,344 | - | 9,344 | |||||||||||||||
| Liabilities |
||||||||||||||||||||
| Deposits: |
||||||||||||||||||||
| Noninterest-bearing |
$ | 3,250,174 | $ | 3,250,174 | $ | - | $ | - | $ | 3,250,174 | ||||||||||
| Interest-bearing |
2,667,086 | - | 2,666,186 | - | 2,666,186 | |||||||||||||||
| Borrowings |
736,704 | - | 736,575 | - | 736,575 | |||||||||||||||
| Junior subordinated debentures |
25,774 | - | - | 27,210 | 27,210 | |||||||||||||||
| Swaps |
9,344 | - | 9,344 | - | 9,344 | |||||||||||||||
The fair value estimates presented herein are based on pertinent information available to management as of December 31, 2016 and 2015. Although management is not aware of any factors that would significantly affect the estimated fair value amounts, such amounts have not been comprehensively revalued for purposes of these financial statements since that date, and therefore, current estimates of fair value may differ significantly from the amounts presented above.
149
Table of Contents
| 21. | BUSINESS SEGMENTS |
The Company has identified two principal reportable segments: Business Financial and Commercial Banking Centers (“Centers”) and Dairy & Livestock and Agribusiness. All other operations have been aggregated in “Other”. The Bank has 42 Business Financial Centers and eight Commercial Banking Centers organized in geographic regions, which are the focal points for customer sales and services. The Company utilizes an internal reporting system to measure the performance of various operating departments within the Bank which is the basis for determining the Bank’s reportable segments. The chief operating decision maker (currently our CEO) regularly reviews the financial information of these two segments in deciding how to allocate resources and to assess performance. Our two principal reporting segments, Centers and Dairy & Livestock and Agribusiness, are aggregated into separate operating segments as their products and services are similar and are sold to similar types of customers, have similar production and distribution processes, have similar economic characteristics, and have similar reporting and organizational structures. In 2016, Dairy & Livestock and Agribusiness was reflected as our second reportable segment. All other operating departments have been aggregated and included in “Other” for reporting purposes. Recapture of provision for loan losses was allocated by segment based on loan type in 2016. Prior period information has been conformed to the current presentation. In addition, the Company allocates internal funds to the segments using a methodology that charges users of funds interest expense and credits providers of funds interest income with the net effect of this allocation being recorded in the ”Other” category.
The following tables present the selected financial information for these two business segments. GAAP does not have an authoritative body of knowledge regarding the management accounting used in presenting segment financial information. The accounting policies for each of the business units is the same as those policies identified for the consolidated Company and disclosed in Note 3 — Summary of Significant Accounting Policies, included herein. The income numbers represent the actual income and expenses of each business unit. In addition, each segment has allocated income and expenses based on management’s internal reporting system, which allows management to determine the performance of each of its business units. Loan fees included in the “Centers” category are the actual loan fees paid to the Company by its customers. These fees are eliminated and deferred in the “Other” category, resulting in deferred loan fees for the condensed consolidated financial statements. All income and expense items not directly associated with the Centers’ business segment are grouped in the “Other” category. Future changes in the Company’s management structure or reporting methodologies may result in changes in the measurement of operating segment results.
The following tables present the operating results and other key financial measures for the individual operating segments for the periods presented.
| For the Year Ended December 31, 2016 | ||||||||||||||||
| Centers | Dairy & livestock and agribusiness |
Other (1) | Total | |||||||||||||
| (Dollars in thousands) | ||||||||||||||||
| Net interest income |
$ | 178,183 | $ | 7,973 | $ | 70,918 | $ | 257,074 | ||||||||
| (Recapture of) provision for loan losses |
(172) | 2,296 | (8,524) | (6,400) | ||||||||||||
|
|
|
|
|
|
|
|
|
|||||||||
| Net interest income after (recapture of) provision for loan losses |
178,355 | 5,677 | 79,442 | 263,474 | ||||||||||||
|
|
|
|
|
|
|
|
|
|||||||||
| Noninterest income |
20,179 | 223 | 15,150 | 35,552 | ||||||||||||
| Noninterest expense |
50,110 | 1,958 | 84,656 | 136,724 | ||||||||||||
| Debt termination expense |
- | - | 16 | 16 | ||||||||||||
|
|
|
|
|
|
|
|
|
|||||||||
| Segment pre-tax profit (loss) |
$ | 148,424 | $ | 3,942 | $ | 9,920 | $ | 162,286 | ||||||||
|
|
|
|
|
|
|
|
|
|||||||||
| Goodwill |
$ | 89,533 | $ | - | $ | - | $ | 89,533 | ||||||||
|
|
|
|
|
|
|
|
|
|||||||||
| Segment assets as of December 31, 2016 |
$ | 7,024,986 | $ | 473,670 | $ | 575,052 | $ | 8,073,707 | ||||||||
|
|
|
|
|
|
|
|
|
|||||||||
| (1) | Includes the elimination of certain items that are included in more than one department, most of which represents products and services for Centers’ customers. |
150
Table of Contents
| For the Year Ended December 31, 2015 | ||||||||||||||||
| Centers | Dairy & livestock and agribusiness |
Other (1) | Total | |||||||||||||
| (Dollars in thousands) | ||||||||||||||||
| Net interest income |
$ | 167,633 | $ | 7,558 | $ | 77,751 | $ | 252,942 | ||||||||
| (Recapture of) provision for loan losses |
(6,711) | 143 | 968 | (5,600) | ||||||||||||
|
|
|
|
|
|
|
|
|
|||||||||
| Net interest income after (recapture of) provision for loan losses |
174,344 | 7,415 | 76,783 | 258,542 | ||||||||||||
|
|
|
|
|
|
|
|
|
|||||||||
| Noninterest income |
20,677 | 261 | 12,545 | 33,483 | ||||||||||||
| Noninterest expense |
48,568 | 1,844 | 76,377 | 126,789 | ||||||||||||
| Debt termination expense |
- | - | 13,870 | 13,870 | ||||||||||||
|
|
|
|
|
|
|
|
|
|||||||||
| Segment pre-tax profit (loss) |
$ | 146,453 | $ | 5,832 | $ | (919) | $ | 151,366 | ||||||||
|
|
|
|
|
|
|
|
|
|||||||||
| Goodwill |
$ | 74,244 | $ | - | $ | - | $ | 74,244 | ||||||||
|
|
|
|
|
|
|
|
|
|||||||||
| Segment assets as of December 31, 2015 |
$ | 6,441,751 | $ | 458,214 | $ | 771,235 | $ | 7,671,200 | ||||||||
|
|
|
|
|
|
|
|
|
|||||||||
| (1) | Includes the elimination of certain items that are included in more than one department, most of which represents products and services for Centers’ customers. |
| For the Year Ended December 31, 2014 | ||||||||||||||||
| Centers | Dairy & livestock and agribusiness |
Other (1) | Total | |||||||||||||
| (Dollars in thousands) | ||||||||||||||||
| Net interest income |
$ | 159,932 | $ | 6,500 | $ | 70,082 | $ | 236,514 | ||||||||
| Recapture of provision for loan losses |
(9,204) | (5,680) | (1,216) | (16,100) | ||||||||||||
|
|
|
|
|
|
|
|
|
|||||||||
| Net interest income after recapture of provision for loan losses |
169,136 | 12,180 | 71,298 | 252,614 | ||||||||||||
|
|
|
|
|
|
|
|
|
|||||||||
| Noninterest income |
20,513 | 281 | 15,618 | 36,412 | ||||||||||||
| Noninterest expense |
47,493 | 1,757 | 76,979 | 126,229 | ||||||||||||
| Debt termination expense |
- | - | - | - | ||||||||||||
|
|
|
|
|
|
|
|
|
|||||||||
| Segment pre-tax profit (loss) |
$ | 142,156 | $ | 10,704 | $ | 9,937 | $ | 162,797 | ||||||||
|
|
|
|
|
|
|
|
|
|||||||||
| Goodwill |
$ | 74,244 | $ | - | $ | - | $ | 74,244 | ||||||||
|
|
|
|
|
|
|
|
|
|||||||||
| Segment assets as of December 31, 2014 |
$ | 5,988,858 | $ | 430,181 | $ | 958,880 | $ | 7,377,920 | ||||||||
|
|
|
|
|
|
|
|
|
|||||||||
| (1) | Includes the elimination of certain items that are included in more than one department, most of which represents products and services for Centers’ customers. |
| 22. | DERIVATIVE FINANCIAL INSTRUMENTS |
The Bank is exposed to certain risks relating to its ongoing business operations and utilizes interest rate swap agreements (“swaps”) as part of its asset/liability management strategy to help manage its interest rate risk position. As of December 31, 2016, the Bank has entered into 83 interest-rate swap agreements with customers. The Bank then entered into identical offsetting swaps with a counterparty bank. The swap agreements are not designated as hedging instruments. The purpose of entering into offsetting derivatives not designated as a hedging instrument is to provide the Bank a variable-rate loan receivable and to provide the customer the financial effects of a fixed-rate loan without creating significant volatility in the Bank’s earnings.
The structure of the swaps is as follows. The Bank enters into a swap with its customers to allow them to convert variable rate loans to fixed rate loans, and at the same time, the Bank enters into a swap with the counterparty bank to allow the Bank to pass on the interest-rate risk associated with fixed rate loans. The net effect of the transaction allows the Bank to receive interest on the loan from the customer at a variable rate based on LIBOR plus a spread. The changes in the fair value of the swaps primarily offset each other and therefore
151
Table of Contents
should not have a significant impact on the Company’s results of operations, although the Company does incur credit and counterparty risk with respect to performance on the swap agreements by the Bank’s customer and counterparty, respectively. Our interest rate swap derivatives are subject to a master netting arrangement with one counterparty bank. None of our derivative assets and liabilities are offset in the balance sheet.
We believe our risk of loss associated with our counterparty borrowers related to interest rate swaps is mitigated as the loans with swaps are underwritten to take into account potential additional exposure, although there can be no assurances in this regard since the performance of our swaps is subject to market and counterparty risk.
Balance Sheet Classification of Derivative Financial Instruments
As of December 31, 2016 and 2015, the total notional amount of the Company’s swaps was $202.7 million and $189.0 million, respectively. The location of the asset and liability, and their respective fair values are summarized in the tables below.
| December 31, 2016 | ||||||||||||||||
| Asset Derivatives | Liability Derivatives | |||||||||||||||
| Balance Sheet Location |
Fair Value |
Balance Sheet Location |
Fair Value |
|||||||||||||
| (Dollars in thousands) | ||||||||||||||||
| Derivatives not designated as hedging instruments: |
||||||||||||||||
| Interest rate swaps |
Other assets | $ | 5,783 | Other liabilities | $ | 5,783 | ||||||||||
|
|
|
|
|
|||||||||||||
| Total derivatives |
$ | 5,783 | $ | 5,783 | ||||||||||||
|
|
|
|
|
|||||||||||||
| December 31, 2015 | ||||||||||||||||
| Asset Derivatives | Liability Derivatives | |||||||||||||||
| Balance Sheet Location |
Fair Value |
Balance Sheet Location |
Fair Value |
|||||||||||||
| (Dollars in thousands) | ||||||||||||||||
| Derivatives not designated as hedging instruments: |
||||||||||||||||
| Interest rate swaps |
Other assets | $ | 9,344 | Other liabilities | $ | 9,344 | ||||||||||
|
|
|
|
|
|||||||||||||
| Total derivatives |
$ | 9,344 | $ | 9,344 | ||||||||||||
|
|
|
|
|
|||||||||||||
The Effect of Derivative Financial Instruments on the Consolidated Statements of Earnings
The following table summarizes the effect of derivative financial instruments on the consolidated statements of earnings for the periods presented.
| Derivatives Not |
Location of Gain Recognized in Income on Derivative Instruments |
Amount of Gain Recognized in Income on Derivative Instruments |
||||||||||||
| For the Year Ended December 31, | ||||||||||||||
| 2016 | 2015 | 2014 | ||||||||||||
| (Dollars in thousands) | ||||||||||||||
| Interest rate swaps |
Other income | $ | 691 | $ | 333 | $ | 133 | |||||||
|
|
|
|
|
|
|
|||||||||
| Total |
$ | 691 | $ | 333 | $ | 133 | ||||||||
|
|
|
|
|
|
|
|||||||||
152
Table of Contents
| 23. | OTHER COMPREHENSIVE INCOME (LOSS) |
The tables below provide a summary of the components of OCI for the periods presented.
| For the Year Ended December 31, | ||||||||||||||||||||||||||||||||||||
| 2016 | 2015 | 2014 | ||||||||||||||||||||||||||||||||||
| Before-tax | Tax effect | After-tax | Before-tax | Tax effect | After-tax | Before-tax | Tax effect | After-tax | ||||||||||||||||||||||||||||
| (Dollars in thousands) | ||||||||||||||||||||||||||||||||||||
| Investment securities: |
||||||||||||||||||||||||||||||||||||
| Net change in fair value recorded in accumulated OCI |
$ | (15,792) | $ | (6,633) | $ | (9,159) | $ | (22,667) | $ | (9,519) | $ | (13,148) | $ | 69,661 | $ | 29,256 | $ | 40,405 | ||||||||||||||||||
| Cumulative-effect adjustment for unrealized gains on securities transferred from available-for-sale to held-to-maturity |
- | - | - | 6,690 | 2,808 | 3,882 | - | - | - | |||||||||||||||||||||||||||
| Amortization of unrealized (gains)/ losses on securities transferred from available-for-sale to held-to- maturity |
(2,174) | (913) | (1,261) | (1,573) | (660) | (913) | - | - | - | |||||||||||||||||||||||||||
| Net realized (gain)/loss reclassified into earnings |
(548) | (230) | (318) | 22 | 9 | 13 | - | - | - | |||||||||||||||||||||||||||
|
|
|
|
|
|
|
|
|
|
|
|
|
|
|
|
|
|
|
|||||||||||||||||||
| Net change |
$ | (18,514) | $ | (7,776) | $ | (10,738) | $ | (17,528) | $ | (7,362) | $ | (10,166) | $ | 69,661 | $ | 29,256 | $ | 40,405 | ||||||||||||||||||
|
|
|
|
|
|
|
|
|
|
|
|
|
|
|
|
|
|
|
|||||||||||||||||||
| 24. | BALANCE SHEET OFFSETTING |
Assets and liabilities relating to certain financial instruments, including, derivatives and securities sold under repurchase agreements (“repurchase agreements”), may be eligible for offset in the consolidated balance sheets as permitted under accounting guidance. As noted above, our interest rate swap derivatives are subject to a master netting arrangement with one counterparty bank. Our interest rate swap derivatives require the Company to pledge investment securities as collateral based on certain risk thresholds. Investment securities that have been pledged by the Company to the counterparty bank continue to be reported in the Company’s consolidated balance sheets unless the Company defaults. We offer a repurchase agreement product to our customers, which include master netting agreements that allow for the netting of collateral positions. This product, known as Citizens Sweep Manager, sells certain of our securities overnight to our customers under an agreement to repurchase them the next day. The repurchase agreements are not offset in the consolidated balances.
| Gross Amounts Recognized in the Consolidated Balance Sheets |
Gross Amounts Offset in the Consolidated Balance Sheets |
Net Amounts of Assets Presented in the Consolidated Balance Sheets |
Gross Amounts Not Offset in the Consolidated Balance Sheets |
Net Amount | ||||||||||||||||||||
| Financial Instruments |
Collateral Pledged |
|||||||||||||||||||||||
| (Dollars in thousands) | ||||||||||||||||||||||||
| December 31, 2016 |
||||||||||||||||||||||||
| Financial assets: |
||||||||||||||||||||||||
| Derivatives not designated as hedging instruments |
$ | 5,783 | $ | - | $ | - | $ | 5,783 | $ | - | $ | 5,783 | ||||||||||||
|
|
|
|
|
|
|
|
|
|
|
|
|
|||||||||||||
| Total |
$ | 5,783 | $ | - | $ | - | $ | 5,783 | $ | - | $ | 5,783 | ||||||||||||
|
|
|
|
|
|
|
|
|
|
|
|
|
|||||||||||||
| Financial liabilities: |
||||||||||||||||||||||||
| Derivatives not designated as hedging instruments |
$ | 6,855 | $ | (1,072) | $ | 5,783 | $ | 1,072 | $ | (12,800) | $ | (5,945) | ||||||||||||
| Repurchase agreements |
603,028 | - | 603,028 | - | (683,413) | (80,385) | ||||||||||||||||||
|
|
|
|
|
|
|
|
|
|
|
|
|
|||||||||||||
| Total |
$ | 609,883 | $ | (1,072) | $ | 608,811 | $ | 1,072 | $ | (696,213) | $ | (86,330) | ||||||||||||
|
|
|
|
|
|
|
|
|
|
|
|
|
|||||||||||||
153
Table of Contents
| Gross Amounts Recognized in the Consolidated Balance Sheets |
Gross Amounts Offset in the Consolidated Balance Sheets |
Net Amounts of Assets Presented in the Consolidated Balance Sheets |
Gross Amounts Not Offset in the Consolidated Balance Sheets |
Net Amount | ||||||||||||||||||||
| Financial Instruments |
Collateral Pledged |
|||||||||||||||||||||||
| (Dollars in thousands) | ||||||||||||||||||||||||
| December 31, 2015 |
||||||||||||||||||||||||
| Financial assets: |
||||||||||||||||||||||||
| Derivatives not designated as hedging instruments |
$ | 9,344 | $ | - | $ | - | $ | 9,344 | $ | - | $ | 9,344 | ||||||||||||
|
|
|
|
|
|
|
|
|
|
|
|
|
|||||||||||||
| Total |
$ | 9,344 | $ | - | $ | - | $ | 9,344 | $ | - | $ | 9,344 | ||||||||||||
|
|
|
|
|
|
|
|
|
|
|
|
|
|||||||||||||
| Financial liabilities: |
||||||||||||||||||||||||
| Derivatives not designated as hedging instruments |
$ | 9,348 | $ | (4) | $ | 9,344 | $ | 4 | $ | (16,572) | $ | (7,224) | ||||||||||||
| Repurchase agreements |
690,704 | - | 690,704 | - | (721,102) | (30,398) | ||||||||||||||||||
|
|
|
|
|
|
|
|
|
|
|
|
|
|||||||||||||
| Total |
$ | 700,052 | $ | (4) | $ | 700,048 | $ | 4 | $ | (737,674) | $ | (37,622) | ||||||||||||
|
|
|
|
|
|
|
|
|
|
|
|
|
|||||||||||||
| 25. | CONDENSED FINANCIAL INFORMATION OF PARENT COMPANY |
The following tables provide the parent company only condensed balance sheets, condensed statements of earnings and condensed statements of cash flows for the periods presented.
CVB FINANCIAL CORP.
CONDENSED BALANCE SHEETS
| As of December 31, | ||||||||
| 2016 | 2015 | |||||||
| (Dollars in thousands) | ||||||||
| Assets |
||||||||
| Investment in subsidiaries |
$ | 1,005,160 | $ | 939,064 | ||||
| Other assets, net |
24,754 | 23,642 | ||||||
|
|
|
|
|
|||||
| Total assets |
$ | 1,029,914 | $ | 962,706 | ||||
|
|
|
|
|
|||||
| Liabilities |
$ | 39,052 | $ | 39,307 | ||||
| Stockholders’ equity |
990,862 | 923,399 | ||||||
|
|
|
|
|
|||||
| Total liabilities and stockholders’ equity |
$ | 1,029,914 | $ | 962,706 | ||||
|
|
|
|
|
|||||
CVB FINANCIAL CORP.
CONDENSED STATEMENTS OF EARNINGS
| For the Year Ended December 31, | ||||||||||||
| 2016 | 2015 | 2014 | ||||||||||
| (Dollars in thousands) | ||||||||||||
| Excess in net earnings of subsidiaries |
$ | 55,192 | $ | 53,259 | $ | 66,119 | ||||||
| Dividends from the Bank |
49,000 | 49,000 | 41,000 | |||||||||
| Other expense, net |
(2,763) | (3,114) | (3,098) | |||||||||
|
|
|
|
|
|
|
|||||||
| Net earnings |
$ | 101,429 | $ | 99,145 | $ | 104,021 | ||||||
|
|
|
|
|
|
|
|||||||
154
Table of Contents
CVB FINANCIAL CORP.
CONDENSED STATEMENTS OF CASH FLOWS
| For the Year Ended December 31, | ||||||||||||
| 2016 | 2015 | 2014 | ||||||||||
| (Dollars in thousands) | ||||||||||||
| Cash Flows from Operating Activities |
||||||||||||
| Net earnings |
$ | 101,429 | $ | 99,145 | $ | 104,021 | ||||||
|
|
|
|
|
|
|
|||||||
| Adjustments to reconcile net earnings to cash used in operating activities: |
||||||||||||
| Earnings of subsidiaries |
(104,192) | (102,259) | (107,119) | |||||||||
| Tax settlement received from the Bank |
2,557 | 1,233 | 1,812 | |||||||||
| Stock-based compensation |
2,803 | 2,733 | 2,988 | |||||||||
| Other operating activities, net |
(3,362) | (2,180) | (3,080) | |||||||||
|
|
|
|
|
|
|
|||||||
| Total adjustments |
(102,194) | (100,473) | (105,399) | |||||||||
|
|
|
|
|
|
|
|||||||
| Net cash used in operating activities |
(765) | (1,328) | (1,378) | |||||||||
|
|
|
|
|
|
|
|||||||
| Cash Flows from Investing Activities |
||||||||||||
| Dividends received from the Bank |
49,000 | 49,000 | 41,000 | |||||||||
|
|
|
|
|
|
|
|||||||
| Net cash provided by investing activities |
49,000 | 49,000 | 41,000 | |||||||||
|
|
|
|
|
|
|
|||||||
| Cash Flows from Financing Activities |
||||||||||||
| Cash dividends on common stock |
(51,625) | (48,862) | (42,298) | |||||||||
| Proceeds from exercise of stock options |
5,151 | 5,144 | 5,522 | |||||||||
| Tax benefit related to exercise of stock options |
932 | 308 | 1,116 | |||||||||
| Repurchase of common stock |
(1,907) | (834) | (5,474) | |||||||||
|
|
|
|
|
|
|
|||||||
| Net cash used in financing activities |
(47,449) | (44,244) | (41,134) | |||||||||
|
|
|
|
|
|
|
|||||||
| Net increase (decrease) in cash and cash equivalents |
786 | 3,428 | (1,512) | |||||||||
| Cash and cash equivalents, beginning of period |
16,960 | 13,532 | 15,044 | |||||||||
|
|
|
|
|
|
|
|||||||
| Cash and cash equivalents, end of period |
$ | 17,746 | $ | 16,960 | $ | 13,532 | ||||||
|
|
|
|
|
|
|
|||||||
| 26. | QUARTERLY FINANCIAL DATA (UNAUDITED) |
The following table sets forth our unaudited, quarterly results for the periods indicated.
| For the Three Months Ended | ||||||||||||||||
| December 31, | September 30, | June 30, | March 31, | |||||||||||||
| (Dollars in thousands, except per share amounts) | ||||||||||||||||
| 2016 |
||||||||||||||||
| Net interest income |
$ | 65,441 | $ | 63,161 | $ | 65,956 | $ | 62,516 | ||||||||
| Recapture of provision for loan losses |
(4,400) | (2,000) | - | - | ||||||||||||
| Net earnings |
27,076 | 25,448 | 25,514 | 23,391 | ||||||||||||
| Basic earnings per common share |
0.25 | 0.23 | 0.23 | 0.22 | ||||||||||||
| Diluted earnings per common share |
0.25 | 0.23 | 0.23 | 0.22 | ||||||||||||
| 2015 |
||||||||||||||||
| Net interest income |
$ | 63,258 | $ | 65,917 | $ | 62,758 | $ | 61,009 | ||||||||
| Recapture of provision for loan losses |
(1,100) | (2,500) | (2,000) | - | ||||||||||||
| Net earnings |
28,613 | 27,886 | 26,813 | 15,833 | ||||||||||||
| Basic earnings per common share |
0.27 | 0.26 | 0.25 | 0.15 | ||||||||||||
| Diluted earnings per common share |
0.27 | 0.26 | 0.25 | 0.15 | ||||||||||||
155
Table of Contents
Report of Independent Registered Public Accounting Firm
The Board of Directors and Stockholders
CVB Financial Corp.:
We have audited the accompanying consolidated balance sheets of CVB Financial Corp. and subsidiaries (the Company) as of December 31, 2016 and 2015, and the related consolidated statements of earnings and comprehensive income, stockholders’ equity, and cash flows for each of the years in the three year period ended December 31, 2016. These consolidated financial statements are the responsibility of the Company’s management. Our responsibility is to express an opinion on these consolidated financial statements based on our audits.
We conducted our audits in accordance with the standards of the Public Company Accounting Oversight Board (United States). Those standards require that we plan and perform the audit to obtain reasonable assurance about whether the financial statements are free of material misstatement. An audit includes examining, on a test basis, evidence supporting the amounts and disclosures in the financial statements. An audit also includes assessing the accounting principles used and significant estimates made by management, as well as evaluating the overall financial statement presentation. We believe that our audits provide a reasonable basis for our opinion.
In our opinion, the consolidated financial statements referred to above present fairly, in all material respects, the financial position of CVB Financial Corp. and subsidiaries as of December 31, 2016 and 2015, and the results of their operations and their cash flows for each of the years in the three year period ended December 31, 2016, in conformity with U.S. generally accepted accounting principles.
We also have audited, in accordance with the standards of the Public Company Accounting Oversight Board (United States), CVB Financial Corp. and subsidiaries’ internal control over financial reporting as of December 31, 2016, based on criteria established in Internal Control — Integrated Framework (2013) issued by the Committee of Sponsoring Organizations of the Treadway Commission (COSO), and our report dated March 1, 2017 expressed an unqualified opinion on the effectiveness of the Company’s internal control over financial reporting.
/s/ KPMG LLP
Los Angeles, California
March 1, 2017
156
Table of Contents
INDEX TO EXHIBITS
|
Exhibit No. |
||
| 2.1 | Purchase and Assumption Agreement Whole Bank All Deposits, among the Federal Deposit Insurance Corporation, receiver of San Joaquin Bank, Bakersfield, California, the Federal Deposit Insurance Corporation and Citizens Business Bank, dated as of October 16, 2009, and related addendum. (1) | |
| 3.1 | Articles of Incorporation of CVB Financial Corp., as amended (2) | |
| 3.2 | Bylaws of CVB Financial Corp., as amended (3) | |
| 4.1 | Form of CVB Financial Corp.’s Common Stock certificate (4) | |
| 10.1(a) | Employment Agreement by and among Christopher D. Myers, CVB Financial Corp. and Citizens Business Bank, dated February 4, 2014 †(5) | |
| 10.1(b) | Restricted Stock Agreement by and between CVB Financial Corp. and Christopher D. Myers dated June 1, 2006 †(6) | |
| 10.1(c) | Deferred Compensation Plan for Christopher D. Myers, effective January 1, 2007 †(7) | |
| 10.2 | CVB Financial Corp. 401(k) & Profit Sharing Plan, as amended †(8) | |
| 10.3 | Form of Indemnification Agreement (9) | |
| 10.4 | CVB Financial Corp. 2000 Stock Option Plan †(10) | |
| 10.5(a) | CVB Financial Corp. 2008 Equity Incentive Plan †(11) | |
| 10.5(b) | CVB Financial Corp. Amendment No. 1 to the 2008 Equity Incentive Plan †(12) | |
| 10.5(c) | CVB Financial Corp. Amendment No. 2 to the 2008 Equity Incentive Plan †(13) | |
| 10.5(d) | CVB Financial Corp. Amendment No. 3 to the 2008 Equity Incentive Plan†(14) | |
| 10.5(e) | CVB Financial Corp. Amendment No. 4 to the 2008 Equity Incentive Plan† | |
| 10.5(f) | Form of Stock Option Agreement pursuant to the 2008 Equity Compensation Plan †(15) | |
| 10.5(g) | Form of Restricted Stock Agreement pursuant to the 2008 Equity Compensation Plan †(16) | |
| 10.6 | The Executive Non Qualified Excess Plan(SM) Plan Document effective February 21, 2007 †(17) | |
| 10.7(a) | Offer letter for David A. Brager, dated November 17, 2010 †(18) | |
| 10.7(b) | Severance Compensation Agreement for David A. Brager, dated January 1, 2012 †(19) | |
| 10.8(a) | Offer letter for David C. Harvey, dated December 7, 2009 †(20) | |
| 10.8(b) | Severance Compensation Agreement for David C. Harvey, dated January 1, 2012 †(21) | |
| 10.9 | CVB Financial Corp. 2015 Executive Incentive Plan †(22) | |
| 10.10 | Consulting Services Agreement among CVB Financial Corp., Citizens Business Bank and Richard C. Thomas †(23) | |
| 10.11 | Waiver and General Release Agreement among CVB Financial Corp. Citizens Business Bank and Richard C. Thomas †(24) | |
| 10.12(a) | Offer Letter for E. Allen Nicholson executed April 30, 2016 †(25). | |
| 10.12(b) | Severance Compensation Agreement for E. Allen Nicholson dated June 1, 2016†(26) | |
157
Table of Contents
|
Exhibit No. |
||
| 10.13(a) | Offer Letter for David Farnsworth dated July 1, 2016 †.(27) | |
| 10.13(b) | Severance Compensation Agreement for David Farnsworth dated July 18, 2016†(28) | |
| 12 | Statements regarding computation of ratios | |
| 21 | Subsidiaries of the Company (29) | |
| 23 | Consent of KPMG LLP | |
| 31.1 | Certification of Christopher D. Myers pursuant to Section 302 of the Sarbanes-Oxley Act of 2002 | |
| 31.2 | Certification of E. Allen Nicholson pursuant to Section 302 of the Sarbanes-Oxley Act of 2002 | |
| 32.1 | Certification of Christopher D. Myers pursuant to Section 906 of the Sarbanes-Oxley Act of 2002 | |
| 32.2 | Certification of E. Allen Nicholson pursuant to Section 906 of the Sarbanes-Oxley Act of 2002 | |
| 101.INS | XBRL Instance Document | |
| 101.SCH | XBRL Taxonomy Extension Schema Document | |
| 101.CAL | XBRL Taxonomy Extension Calculation Linkbase Document | |
| 101.DEF | XBRL Taxonomy Extension Definition Linkbase Document | |
| 101.LAB | XBRL Taxonomy Extension Label Linkbase Document | |
| 101.PRE | XBRL Taxonomy Extension Presentation Linkbase Document | |
| † | Indicates a management contract or compensation plan. |
| * | Except as noted below, Form 8-A12G, Form 8-K, Form 10-Q, Form 10-K and Form DEF 14A identified in the exhibit index have SEC file number 001-10140. |
| D | We have entered into the following trust preferred security issuances and agree to furnish a copy to the SEC upon request: |
| (a) | Indenture by and between CVB Financial Corp. and U.S. Bank, National Association, as Trustee, dated as of January 31, 2006 (CVB Statutory Trust III). |
| (1) | Incorporated herein by reference to Exhibit 2.1 to our Current Report on Form 8-K filed with the SEC on October 20, 2009. |
| (2) | Incorporated herein by reference to Exhibit 3.1 to our Form 10-Q filed with the SEC on August 9, 2010. |
| (3) | Incorporated herein by reference to Exhibits 3.2(A) and 3.2(B) to our Annual Report on Form 10-K filed with the SEC on February 27, 2009. |
| (4) | Incorporated herein by reference to Exhibit 4.1 to our Form 8-A12G filed with the SEC on June 11, 2001. |
| (5) | Incorporated herein by reference to Exhibit 10.1 to our Current Report on Form 8-K filed with the SEC on February 6, 2014. |
| (6) | Incorporated herein by reference to Exhibit 10.2 to our Current Report on Form 8-K filed with the SEC on June 7, 2006. |
| (7) | Incorporated herein by reference to Exhibit 10.23 to our Annual Report on Form 10-K filed with the SEC on March 1, 2007. |
| (8) | Incorporated herein by reference to Exhibit 10.1 to the Annual Report on Form 10-K filed with the SEC on February 29 2016. |
| (9) | Incorporated herein by reference to Exhibit 10.1 to the Current Report on Form 8-K filed June 29, 2016. |
| (10) | Incorporated herein by reference to Exhibit 99.1 to our Registration Statement on Form S-8 filed with the SEC on July 12, 2000, Commission file number 333-41198. |
| (11) | Incorporated herein by reference to Annex A to our Definitive Proxy Statement on Form DEF 14A filed with the SEC on April 16, 2008. |
158
Table of Contents
| (12) | Incorporated herein by reference to Exhibit 10.2 to our Current Report on Form 8-K filed with the SEC on September 22, 2009 |
| (13) | Incorporated herein by reference to Exhibit 10.1 to our Current Report on Form 8-K filed with the SEC on November 24, 2009. |
| (14) | Incorporated herein by reference to Exhibit 10.2 to our Current Report on Form 8-K filed with the SEC on February 6, 2014. |
| (15) | Incorporated herein by reference to Exhibit 10.2 to our Current Report on Form 8-K filed with the SEC on May 23, 2008. |
| (16) | Incorporated herein by reference to Exhibit 10.3 to our Current Report on Form 8-K filed with the SEC on May 23, 2008. |
| (17) | Incorporated herein by reference to Exhibit 10.26 to our Annual Report on Form 10-K filed with the SEC on March 1, 2007. |
| (18) | Incorporated herein by reference to Exhibit 10.13(A) to our Annual Report on Form 10-K filed with the SEC on February 29, 2012. |
| (19) | Incorporated herein by reference to Exhibit 10.13 (B) to our Annual Report on Form 10-K filed with the SEC on February 29, 2012. |
| (20) | Incorporated herein by reference to Exhibit 10.21(A) to our Annual Report on Form 10-K filed with the SEC on March 4, 2010. |
| (21) | Incorporated herein by reference to Exhibit 10.15(B) to our Annual Report on Form 10-K filed with the SEC on February 29, 2012. |
| (22) | Incorporated herein by reference to Annex A to our Definitive Proxy Statement on Form DEF 14A filed with the SEC on April 3, 2015. |
| (23) | Incorporated herein by reference to Exhibit 10.1 to the Current Report on Form 8-K filed April 27, 2016 |
| (24) | Incorporated herein by reference to Exhibit 10.2 to the Current Report on Form 8-K filed April 27, 2016 |
| (25) | Incorporated herein by reference to Exhibit 10.1 to the Current Report on Form 8-K filed May 5, 2016. |
| (26) | Incorporated herein by reference to Exhibit 10.1 to the Quarterly Report on Form 10-Q filed November 9, 2016. |
| (27) | Incorporated herein by reference to Exhibit 10.3 to the Quarterly Report on Form 10-Q filed November 9, 2016. |
| (28) | Incorporated herein by reference to Exhibit 10.2 to the Quarterly Report on Form 10-Q filed November 9, 2016. |
| (29) | Incorporated herein by reference to Exhibit 23 to the Annual Report on Form 10-K filed with the SEC on February 29 2016. |
159