Attached files
| file | filename |
|---|---|
| 8-K - FORM 8-K - Luther Burbank Corp | f8k_030518.htm |
Exhibit 99.1

December 31, 2017 John Biggs President & Chief Executive Officer Laura Tarantino Executive Vice President & Chief Financial Officer Investor Presentation

2 Forward - Looking Statement This communication contains a number of forward - looking statements within the meaning of the Private Securities Litigation Reform Act of 1995 . These forward - looking statements reflect our current views with respect to, among other things, future events and our results of operations, financial condition and financial performance . All statements contained in this communication that are not clearly historical in nature are forward - looking, and the words such as "anticipate," "believe," “continue,” "could," "estimate," "expect," “impact,” "intend," "seek," "may," "outlook," "plan," "potential," "predict," "project," "should," "will," "would" and similar terms and phrases are generally intended to identify forward - looking statements . These forward - looking statements are not historical facts, and are based on current expectations, estimates and projections about our industry, management’s beliefs and certain assumptions made by management, many of which, by their nature, are inherently uncertain and beyond our control . Accordingly, we caution you that any such forward - looking statements are not guarantees of future performance and are subject to risks, assumptions and uncertainties that are difficult to predict . Although we believe that the expectations reflected in these forward - looking statements are reasonable as of the date made, actual results may prove to be materially different from the results expressed or implied by the forward - looking statements . Such factors include, without limitation, the “Risk Factors” referenced in our Registration Statement on Form S - 1 filed with the Securities and Exchange Commission (“SEC”) . The risks and uncertainties listed from time to time in our reports and documents filed with the SEC, and the following factors : business and economic conditions generally and in the financial services industry, nationally and within our current and future geographic market areas ; economic, market, operational, liquidity, credit and interest rate risks associated with our business ; the occurrence of significant natural or man - made disasters , including fires, earthquakes, and terrorist acts ; our management of risks inherent in our real estate loan portfolio, and the risk of a prolonged downturn in the real estate market ; our ability to achieve organic loan and deposit growth and the composition of such growth ; the fiscal position of the U . S federal government and the soundness of other financial institutions ; changes in consumer spending and savings habits ; technological and social media changes ; the laws and regulations applicable to our business ; increased competition in the financial services industry ; changes in the level of our nonperforming assets and charge - offs ; our involvement from time to time in legal proceedings and examination and remedial actions by regulators ; the composition of our management team and our ability to attract and retain key personnel ; material weaknesses in our internal control over financial reporting ; systems failures or interruptions involving our information technology and telecommunications systems ; and potential exposure to fraud, negligence, computer theft and cyber - crime . The Company can give no assurance that any goal or expectation set forth in forward - looking statements can be achieved and readers are cautioned not to place undue reliance on such statements . These forward - looking statements are made as of the date of this communication, and the Company does not intend, and assumes no obligation, to update any forward - looking statement to reflect events or circumstances after the date on which the statement is made or to reflect the occurrence of unanticipated events or circumstances, except as required by law
3 Use of Non - GAAP Financial Measures This investor presentation contains certain financial measures that are not measures recognized under U . S . generally accepted accounting principles (GAAP) and therefore are considered non - GAAP financial measures . The Company’s management uses these non - GAAP financial measures in their analysis of the Company’s performance, financial condition and the efficiency of its operations . Management believes that these non - GAAP financial measures provide a greater understanding of ongoing operations and enhance comparability of results with prior periods as well as demonstrate the effects of significant gains and changes in the current period . The Company’s management also believes that investors find these non - GAAP financial measures useful as they assist investors in understanding our underlying operations performance and the analysis of ongoing operating trends . However, the non - GAAP financial measures discussed herein should not be considered in isolation or as a substitute for the most directly comparable or other financial measures calculated in accordance with GAAP . Moreover, the manner in which we calculate the non - GAAP financial measures discussed herein may differ from that of other companies reporting measures with similar names . You should understand how such other banking organizations calculate their financial measures similar or with names similar to the non - GAAP financial measures we have discussed herein when comparing such non - GAAP financial measures . Below is a listing of the non - GAAP financial measures used in this investor presentation . • Pro forma net income, return on average assets, return on average equity and per share amounts are calculated by adding back our franchise S Corporation tax to net income, and using a combined C Corporation effective tax rate for Federal and California income taxed of 42 . 0 % . This calculation reflects only the changes in our status as an S Corporation and does not give effect to any other transaction . Efficiency ratio is defined as noninterest expenses divided by operation revenue, which is equal to net interest income plus noninterest income . • Tangible book value per common share and tangible common equity to tangible assets are non - GAAP measures that exclude the impact of goodwill and are used by the Company’s management to evaluate capital adequacy . Because intangible assets such as goodwill vary extensively from company to company, we believe that the presentation of these non - GAAP financial measures allows investors to more easily compare the Company’s capital position to other companies . A reconciliation to these non - GAAP financial measures to the most directly comparable GAAP measures are provided on the appendix to this investor presentation .

4 2017: Q3 - Completed $626 million MFR securitization; Q4 – Closed IPO at $10.75 per share & raised $138 million net proceeds or $98 million after special dividend Luther Burbank’s More Than 34 - Year History Note: Branch deposits as of 12/31/2017. 1983: Luther Burbank S&LA was chartered in Santa Rosa, CA; an initial $2 million is the only equity raise, prior to our recent IPO, in our 34 - year history 1996: Completed acquisition of New Horizon S&LA, our only acquisition 2000: Converted to a federal savings association and changed our name to Luther Burbank Savings 2006: Issued $61.9 million in notes related to Trust Preferred Securities 2014: Issued $95 million in senior notes with a 6.50% fixed coupon to refinance the notes issued between 2009 and 2011 2016: Converted to a state - chartered commercial bank (OCC to FDIC) 2009 - 2011: Issued $62.7 million in senior notes with a 9.875% fixed coupon to friends and family 1996 - 2006: Migration to apartment lending; expanded products to include jumbo single - family lending 1990’s 1980’s 2000’s 2010’s 1983: Opened Santa Rosa Total Deposits: $1.1bn 1996: Opened San Rafael Total Deposits: $559mm 2015: Opened Long Beach Total Deposits: $148mm 2007: Opened Encino Total Deposits: $388mm 2010: Opened Beverly Hills Total Deposits: $348mm 2000: Opened Los Altos Total Deposits: $291mm 2008: Opened Toluca Lake Total Deposits: $232mm 2009: Opened Pasadena Total Deposits: $253mm 2012: Opened San Jose Total Deposits: $126mm 1983 - 1989: Specialty CRE lender including land, C&D, joint ventures and commercial

5 Franchise Overview and Financial Highlights (1) Consolidated financials as of or for the twelve months ended 12/31/2017 . C - Corp assumes 42% tax rate . See non - GAAP reconciliation in Appendix hereto. (2) Includes multifamily residential, commercial real estate, and construction loans. Financial Highlights 12/31/2017 (1) Total Assets ($mm) $5,704 Total Loans ($mm) $5,042 Total Deposits ($mm) $3,951 Loans / Deposits 128% Tangible Book Value / Tang. Assets 9.6% Leverage Capital Ratio 11.3% Total Risk - Based Capital Ratio 18.8% Total CRE Loans (2) / Total Risk - Based Capital 470% ROAA (C - Corp) 0.69% ROAE (C - Corp) 8.89% Net Interest Margin 2.05% EPS – Fully Diluted (C - Corp) $0.88 Efficiency Ratio 47.8% Noninterest Expense / Avg. Assets 1.03% NPAs (Excl. TDRs) / Assets 0.12% ALLL / Loans HFI 0.60% Full - Time Equivalent Employees 263 Branch (9) Loan Production Office (9) * Highlighted counties indicate current lending markets Our Small Network of Large Branches OR CA WA San Francisco Los Angeles 1 2 5 9 3 6 7 8 4 A 1 5 9 4 3 7 6 8 2 Date December 31, 2017 Established Deposits ($mm) 1 Santa Rosa Oct. 1983 1,117.1 2 San Rafael Sep. 1996 558.8 3 Encino Aug. 2007 388.0 4 Beverly Hills Jul. 2010 347.7 5 Los Altos Aug. 2000 291.3 6 Pasadena May 2009 253.4 7 Toluca Lake Jan. 2008 232.1 8 Long Beach Jun. 2015 148.2 9 San Jose Jun. 2012 125.8 A Manhattan Beach 253.9 Online/Brokered Deposits 56.1 Business Banking 178.8 Total Deposits 3,951.2 # Branch Location

6 History of Profitability Well - Positioned in Strategic Markets Demonstrated Organic Growth Engine Strong Management Team and Robust Infrastructure Strong Asset Quality Efficient Operations Key Highlights Note: Financial data as of or for the twelve months ended 12/31/2017. See non - GAAP reconciliation in Appendix hereto. 4 3 2 1 6 5 » Recorded consecutive quarterly profits since our second quarter of operations » Survived and prospered through numerous economic cycles during our more than 34 - year history » West Coast gateway cities in supply - constrained markets with strong job growth and limited affordable housing » Achieve deeper penetration of our lending and deposit gathering operations in our attractive West Coast markets » Expand into contiguous markets on the West Coast to complete our Seattle to San Diego footprint » Multifamily: professional real estate investors focused on investing in stable, cash - flowing assets » Single Family: primary residence, second home, vacation property or investment property » Retail Deposits: strong base built on a high level of service, competitive rates and our reputation for strength and security » Led by President & CEO John Biggs (30+ years of banking experience) » Invested heavily in people and infrastructure over the last four years » Our most important focus » Strict, quality oriented underwriting and credit monitoring processes » 0.12% NPAs (excluding TDRs) / Total Assets » Maintain a small network of large branches ($385 million avg. branch size) » 47.8% efficiency ratio, 1.03% noninterest expense / average assets and 263 FTEs 1. History of Profitability 2. Well - Positioned in Strategic Markets 3. Demonstrated Organic Growth Engine 4. Strong Management Team and Robust Infrastructure 5. Strong Asset Quality 6. Efficient Operations
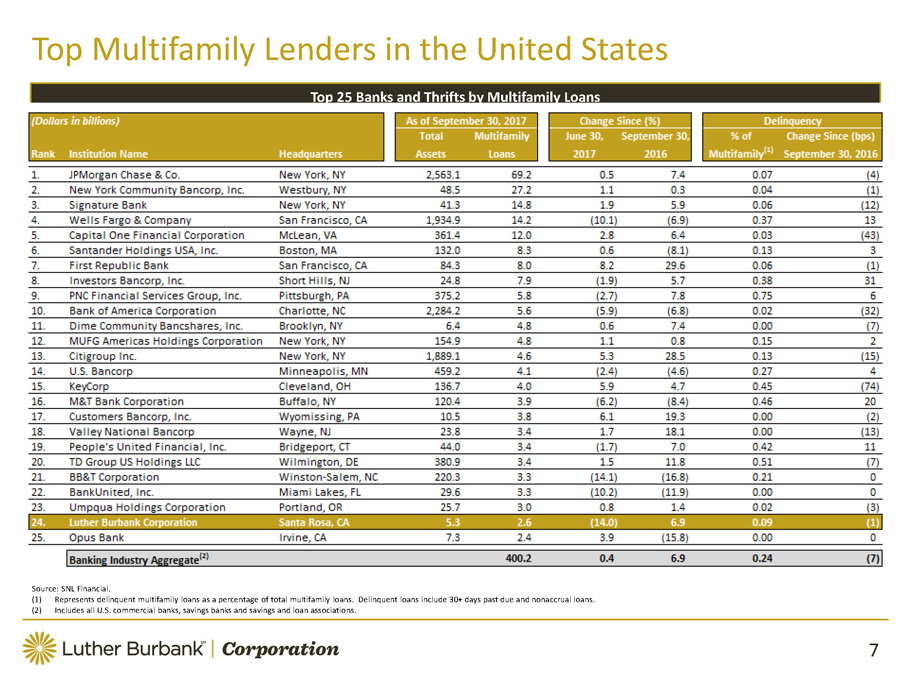
7 Top Multifamily Lenders in the United States Source: SNL Financial. (1) Represents delinquent multifamily loans as a percentage of total multifamily loans. Delinquent loans include 30+ days past due and nona ccr ual loans. (2) Includes all U.S. commercial banks, savings banks and savings and loan associations. Top 25 Banks and Thrifts by Multifamily Loans
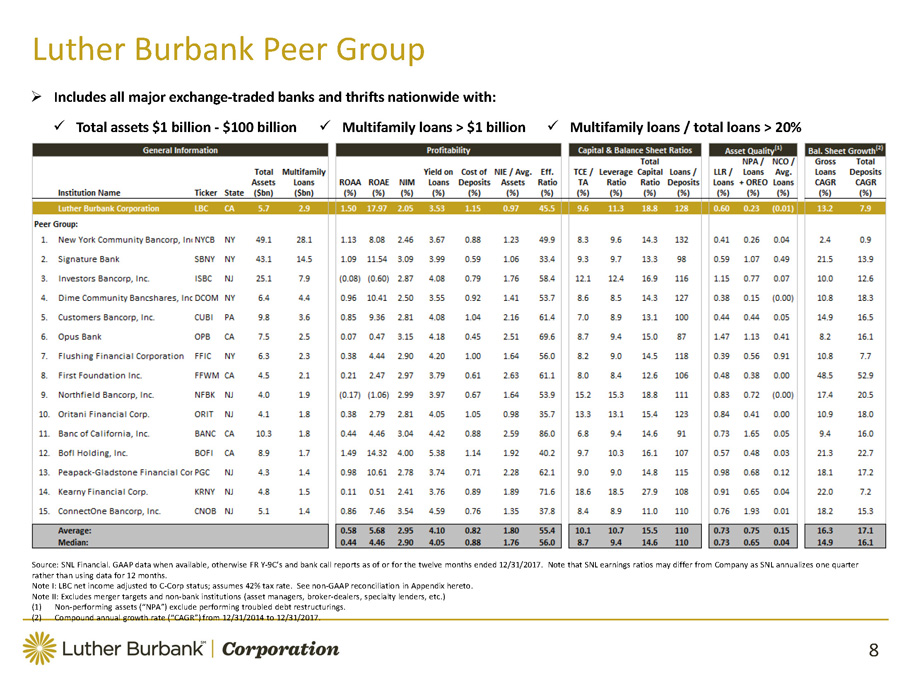
8 Luther Burbank Peer Group Source: SNL Financial. GAAP data when available, otherwise FR Y - 9C’s and bank call reports as of or for the twelve months ended 12/31/2017. Note that SNL earnings ratios may differ from Company as SNL annualizes one qu arter rather than using data for 12 months. Note I: LBC net income adjusted to C - Corp status; assumes 42% tax rate. See non - GAAP reconciliation in Appendix hereto. Note II: Excludes merger targets and non - bank institutions (asset managers, broker - dealers, specialty lenders, etc.) (1) Non - performing assets (“NPA”) exclude performing troubled debt restructurings. (2) Compound annual growth rate (“CAGR”) from 12/31/2014 to 12/31/2017. » Includes all major exchange - traded banks and thrifts nationwide with : x Total assets $ 1 billion - $ 100 billion x Multifamily loans > $1 billion x Multifamily loans / total loans > 20 %

9 Our Lending Business Note: Data as of 12/31/2017. Multifamily Residential Loans Markets: » High barrier to entry for new development; little land to develop » Limited supply of new housing » High variance between cost to own and rent Deals: » Stabilized and seasoned assets » Older, smaller properties with rents at/below market levels, catering to lower and middle income renters Sponsors: » Experienced real estate professionals who desire regular income/cash flow streams and are focused on building wealth steadily over time Single - Family Residential Loans Property Types: » Both owner - occupied and investor owned Broker Network: » Primarily third party mortgage brokers with the intention of retaining these loans in our portfolio Originations: » Majority are for purchase transactions » Also provide refinancing Underwriting Focus: » Debt ratios » Credit scores » Borrower’s liquidity and cash reserves 0.12% NPAs (excluding TDRs) / Assets 0.14% NPLs / Loans Multifamily Portfolio Highlights » $1.5 million average loan balance » 15.4 units average » 56.6% average loan - to - value ratio » 1.54x average debt service coverage ratio Single - Family Portfolio Highlights » $865 thousand average loan balance » 65.1% average loan - to - value ratio » 748 average credit score

10 » First Mortgages » Hybrid Structures • 25 - or 30 - year amortization • 10 - , 25 - or 30 - year maturities • 3 - , 5 - or 7 - year fixed periods » Interest Only Option • Lower loan - to - value ratios • Underwrite at amortizing payment » Investor - Owner Purchase or Refinance Our Lending Products Multifamily / Commercial Real Estate Lending Single - Family Residential Lending » First Mortgages » Hybrid Structures • 30 - or 40 - year amortization • 30 - or 40 - year maturities • 3 - , 5 - or 7 - year fixed periods » Full Documentation » Purchase or Refinance Transactions » No longer offering Construction loans » Primary Residence, Second Home or Investor programs » Grow Program • First - time homebuyer

11 Loan Portfolio (1) As of or for the twelve months ended 12/31/2017. Historical Loan Growth 3.43% yield on loans; 3.76% weighted average coupon (1) Loan Portfolio Composition Multifamily Loans by Lending Area Single - Family Loans by Lending Area

12 Asset Quality » Risk management is a core competency of our business » Extensive expertise among our lending and credit administration staff and executive officers » Credit decisions are made efficiently and consistent with our underwriting standards » Continuous evaluation of risk & return » Strict separation between business development and credit decisions » Vigilant response to adverse economic conditions and specific problem credits » Strict, quality oriented underwriting and credit monitoring processes » 12/31/2017 NPAs / Total Assets of 0.12%; NPLs / Total Loans of 0.14% » Decrease in NPAs and loans 90+ days past due to total assets over each of the four years ended December 31, 2016 » Only one foreclosure in the past two years Culture Approach Results (1) Excludes performing troubled debt restructurings. Nonperforming Assets (1) / Total Assets

13 LOAN ORIGINATION VOLUME AND RATES 2018 Update: • Total loans originated calendar YTD February 28, 2018: $295.1 million at a weighted average coupon of 4.23% • Total loan pipeline at February 28, 2018 $392.1 million ($220.9 million CRE & $171.2 million SFR)

14 Deposit Composition (1) For the twelve months ended 12/31/2017. Historical Deposit Growth & Portfolio Composition 1.05% cost of total deposits (1) Deposit Breakdown by Branch Date December 31, 2017 Established Deposits ($mm) 1 Santa Rosa Oct. 1983 1,117.1 2 San Rafael Sep. 1996 558.8 3 Encino Aug. 2007 388.0 4 Beverly Hills Jul. 2010 347.7 5 Los Altos Aug. 2000 291.3 6 Pasadena May 2009 253.4 7 Toluca Lake Jan. 2008 232.1 8 Long Beach Jun. 2015 148.2 9 San Jose Jun. 2012 125.8 A Manhattan Beach 253.9 Online/Brokered Deposits 56.1 Business Banking 178.8 Total Deposits 3,951.2 # Branch Location

15 Deposit Products and Services Strong base built on a high level of service, competitive products and a reputation for strength and security Deposit Solutions Fully Supported Checking and Savings Products Tailored Products Full Suite of Cash Management Solutions Digital and Mobile Options Robust Reporting and Security Real Time Information Reporting » Competitively priced checking and savings products » No cost access (checks/ATM/debit card) » Online and mobile banking » Bill pay and other payment solutions » Strong security protocols » Tailored business checking and savings products » Operating accounts supported by full cash management platform » Strong security against fraud and other online threats » Remote and mobile options » Real time information reporting » Custom payment solutions Personal Banking Products Business Banking Products
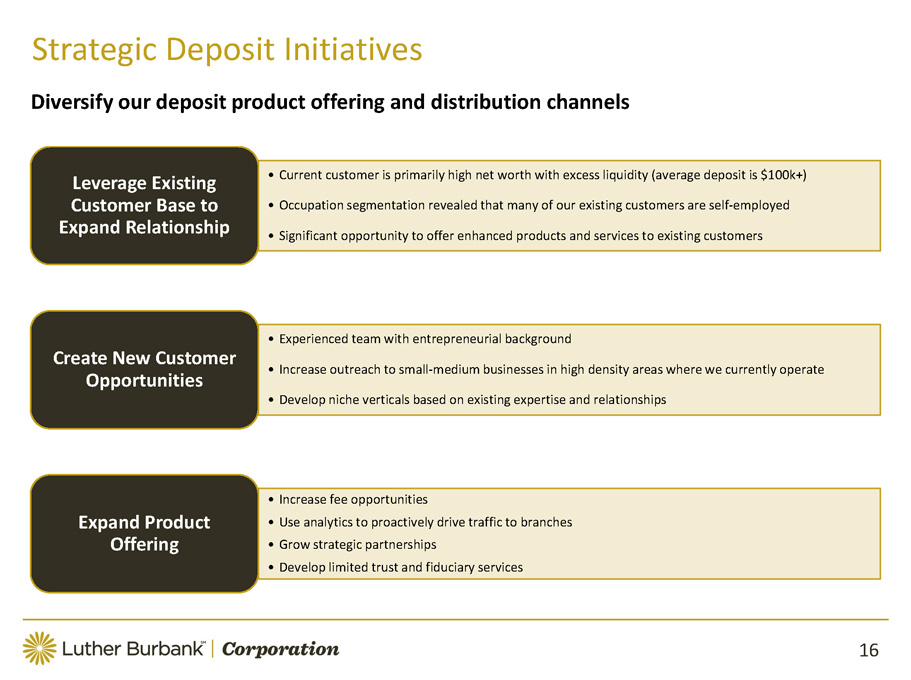
16 Strategic Deposit Initiatives Diversify our deposit product offering and distribution channels • Current customer is primarily high net worth with excess liquidity (average deposit is $100k+) • Occupation segmentation revealed that many of our existing customers are self - employed • Significant opportunity to offer enhanced products and services to existing customers Leverage Existing Customer Base to Expand Relationship • Experienced team with entrepreneurial background • Increase outreach to small - medium businesses in high density areas where we currently operate • Develop niche verticals based on existing expertise and relationships Create New Customer Opportunities • Increase fee opportunities • Use analytics to proactively drive traffic to branches • Grow strategic partnerships • Develop limited trust and fiduciary services Expand Product Offering
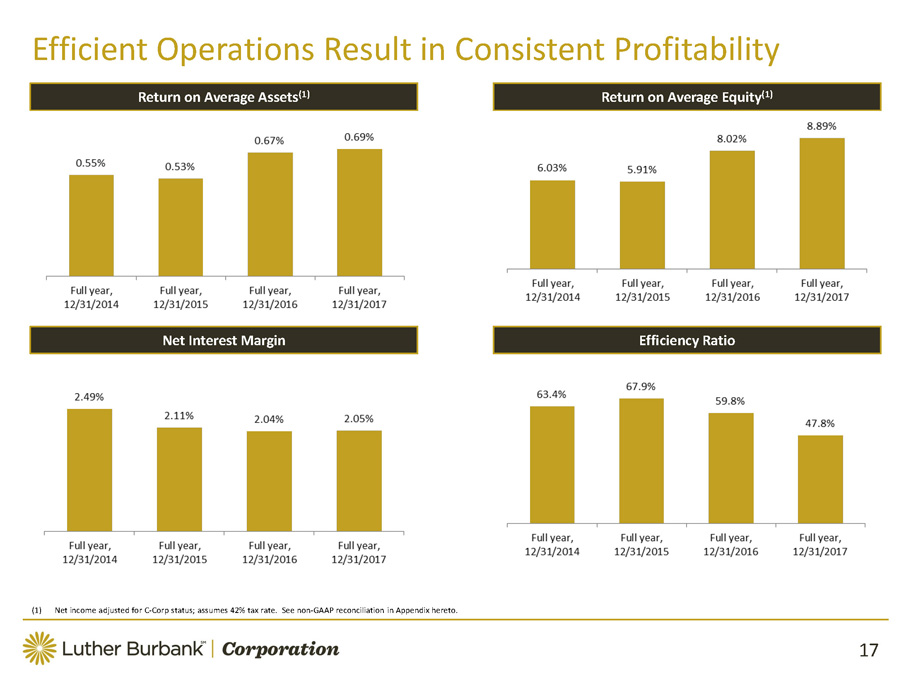
17 Efficient Operations Result in Consistent Profitability (1) Net income adjusted for C - Corp status; assumes 42% tax rate. See non - GAAP reconciliation in Appendix hereto. Return on Average Assets (1) Return on Average Equity (1) Net Interest Margin Efficiency Ratio

18 Interest Rate Risk Analysis On a quarterly basis, the Company measures and reports NII at Risk to isolate the change in income related solely to interest earning assets and interest - bearing liabilities. It models instantaneous parallel shifts in market interest rates, implied by the forward yield curve over the next one year period. NII Impact EVE Impact Interest Rate Risk to Earnings (NII) Interest Rate Risk to Capital (EVE) December 31, 2017 Change in ($ in millions) Interest Rates $ Change % Change (basis points) NII NII + 400 BP (30.1) (24.2%) + 300 BP (19.7) (15.8%) + 200 BP (11.9) (9.5%) + 100 BP (6.5) (5.2%) - 100 BP 7.0 5.6% Interest Rate Risk to Capital (EVE) December 31, 2017 Change in ($ in millions) Interest Rates $ Change % Change (basis points) EVE EVE + 400 BP (334.9) (56.9%) + 300 BP (221.9) (37.7%) + 200 BP (129.5) (22.0%) + 100 BP (57.5) (9.8%) - 100 BP 49.4 8.4%

19 Deposits - Cost of Funds Comparison
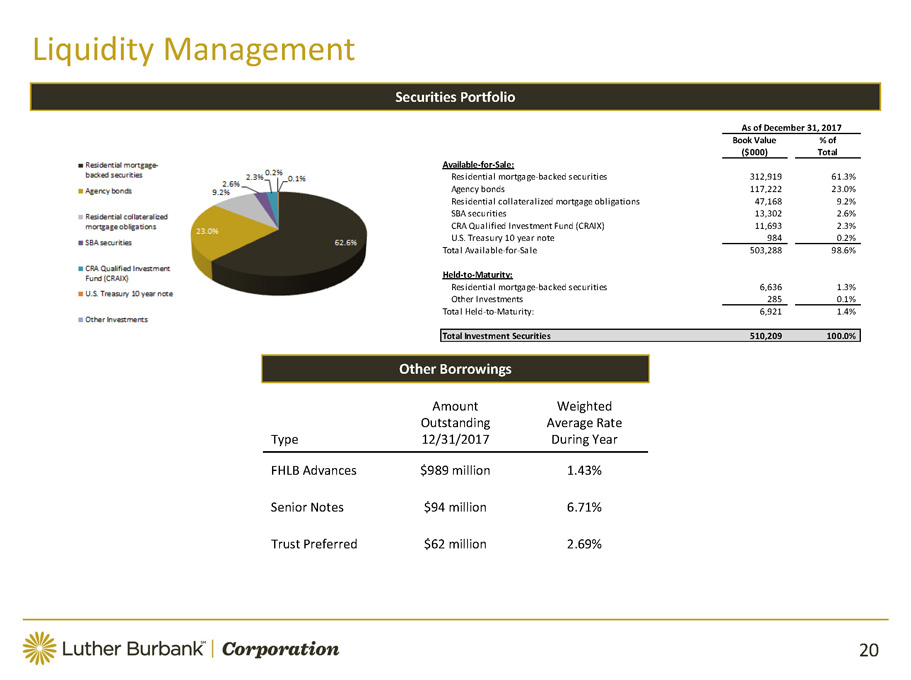
20 Liquidity Management Other Borrowings Type Amount Outstanding 12/31/2017 Weighted Average Rate During Year FHLB Advances $989 million 1.43% Senior Notes $94 million 6.71% Trust Preferred $62 million 2.69% Securities Portfolio As of December 31, 2017 Book Value ($000) % of Total Available-for-Sale: Residential mortgage-backed securities 312,919 61.3% Agency bonds 117,222 23.0% Residential collateralized mortgage obligations 47,168 9.2% SBA securities 13,302 2.6% CRA Qualified Investment Fund (CRAIX) 11,693 2.3% U.S. Treasury 10 year note 984 0.2% Total Available-for-Sale 503,288 98.6% Held-to-Maturity: Residential mortgage-backed securities 6,636 1.3% Other Investments 285 0.1% Total Held-to-Maturity: 6,921 1.4% Total Investment Securities 510,209 100.0%
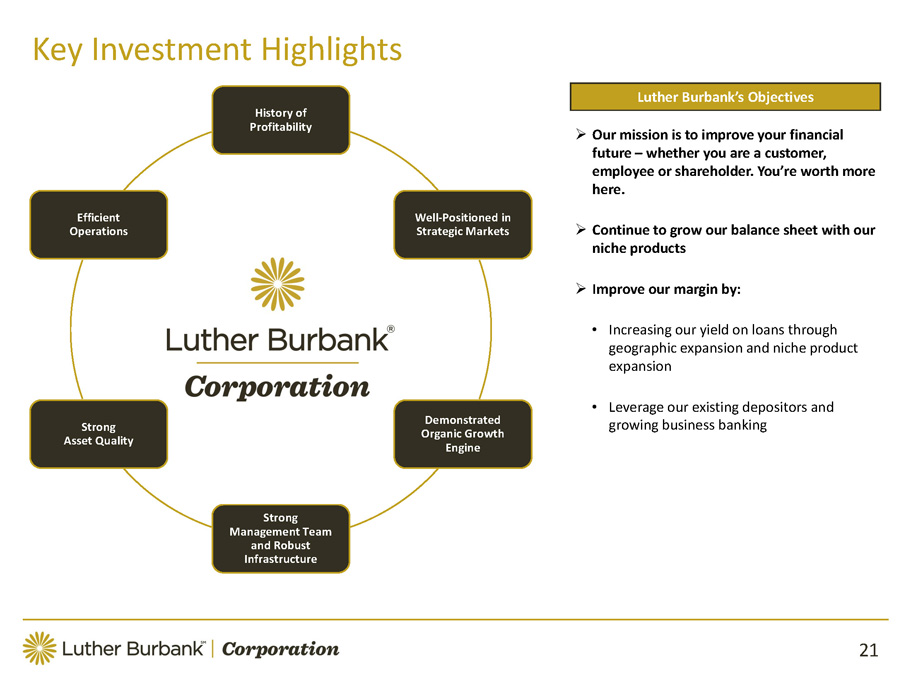
21 History of Profitability Well - Positioned in Strategic Markets Demonstrated Organic Growth Engine Strong Management Team and Robust Infrastructure Strong Asset Quality Efficient Operations Key Investment Highlights » Our mission is to improve your financial future – whether you are a customer, employee or shareholder. You’re worth more here. » Continue to grow our balance sheet with our niche products » Improve our margin by: • Increasing our yield on loans through geographic expansion and niche product expansion • Leverage our existing depositors and growing business banking Luther Burbank’s Objectives

Appendix

23 Balance Sheet (1) Unaudited Dec. 31, 2017 (1) Dec. 31, 2016 Dec. 31, 2015 ASSETS Cash and cash equivalents $ 75,578 $ 59,208 $ 65,562 Available for sale investment securities, at fair value 503,288 459,162 377,669 Held to maturity investment securities, at amortized cost (fair value of $6,925 in 2017, $7,571 in 2016 and $9,396 in 2015) 6,921 7,561 9,331 Loans held for sale - 34,974 18,086 Loans receivable, net of allowance for loan losses of $30,312, $33,298 and $45,509 as of December 31, 2017, 2016 and 2015, respectively 5,011,235 4,406,468 3,809,994 Accrued interest receivable 14,901 12,141 10,491 Federal Home Loan Bank ("FHLB") stock, at cost 27,733 30,410 18,379 Premises and equipment, net 22,452 24,356 24,217 Goodwill 3,297 3,297 3,297 Prepaid expenses and other assets 38,975 26,008 24,753 Total assets $ 5,704,380 $ 5,063,585 $ 4,361,779 LIABILITIES AND STOCKHOLDERS' EQUITY Liabilities: Deposits $ 3,951,238 $ 3,333,969 $ 3,121,247 Federal Home Loan Bank advances 989,260 1,111,886 668,311 Junior subordinated deferrable interest debentures 61,857 61,857 61,857 Senior debt $95,000 face amount, 6.5% interest rate, due September 30, 2024 (less debt issuance costs of $839, $972 and $1,106 at December 31, 2017, 2016 and 2015, respectively) 94,161 94,028 93,894 Accrued interest payable 1,781 1,302 697 Other liabilities and accrued expenses 56,338 56,168 44,474 Total liabilities $ 5,154,635 $ 4,659,210 $ 3,990,480 Stockholders' equity: Common stock, no par value; 100,000,000 shares authorized; 56,422,662, 42,000,000 and 42,000,000 shares issued and outstanding at December 31, 2017, 2016 and 2015, respectively 458,570 2,262 2,262 Unearned Restricted Stock Award common stock (4,283) - - Retained earnings 102,459 407,648 372,327 Accumulated other comprehensive loss, net of taxes (7,001) (5,535) (3,290) Total stockholders' equity $ 549,745 $ 404,375 $ 371,299 Total liabilities and stockholders' equity $ 5,704,380 $ 5,063,585 $ 4,361,779 As of,

24 Income Statement (1) Unaudited (2) Tax benefit for the year ending 2017 reflects impact of restating deferred tax asset for S - Corporation termination and H.R.1 a s well as deductibility of certain IPO costs totaling $8.2 million. 2017 (1) 2016 2015 Interest income: Interest and fees on loans $ 166,573 $ 139,385 $ 124,249 Interest and dividends on investment securities 7,714 4,774 3,297 Total interest income 174,287 144,159 127,546 Interest expense: Interest on deposits 38,813 31,648 29,150 Interest on FHLB advances 16,555 10,219 6,073 Interest on junior subordinated deferrable interest debentures 1,665 1,348 1,101 Interest on other borrowings 6,309 6,309 6,309 Total interest expense 63,342 49,524 42,633 Net interest income before provision for loan losses 110,945 94,635 84,913 Reversal of provision for loan losses (3,372) (12,703) (7,141) Net interest income after reversal of provision for loan losses 114,317 107,338 92,054 Noninterest income: Increase in cash surrender value of life insurance 192 233 252 Net gain on sale of loans 3,277 3,884 2,947 FHLB dividends 2,473 2,848 2,750 Other income 1,516 879 975 Total noninterest income 7,458 7,844 6,924 Noninterest expense: Compensation and related benefits 36,524 38,551 37,231 Deposit insurance premium 1,812 1,725 5,166 Professional and regulatory fees 2,034 2,577 2,817 Occupancy 5,155 5,477 5,453 Depreciation and amortization 2,903 2,873 2,290 Data processing 3,167 3,322 3,254 Marketing 935 875 1,335 Other expenses 4,014 5,842 4,793 Total noninterest expense 56,544 61,242 62,339 Income before (benefit)/ provision for income taxes 65,231 53,940 36,639 (Benefit)/ provision for income taxes (2) (4,153) 1,819 1,247 Net income $ 69,384 $ 52,121 $ 35,392 Basic earnings per common share $ 1.62 $ 1.24 $ 0.84 Diluted earnings per common share $ 1.62 $ 1.24 $ 0.84 Weighted average common shares outstanding - basic 42,916,879 42,000,000 42,000,000 Weighted average common shares outstanding - diluted 42,957,936 42,000,000 42,000,000 For the year ended December 31,

25 Non - GAAP Reconciliation (1) Unaudited 2017 (1) 2016 2015 2014 Tangible book value Total assets 5,704,380 5,063,585 4,361,779 3,969,047 Less: Goodwill (3,297) (3,297) (3,297) (3,297) Less: Total liabilities (5,154,635) (4,659,210) (3,990,480) (3,619,539) Tangible book value 546,448 401,078 368,002 346,211 Pro forma provision for income tax Net income before income taxes 65,231 53,940 36,639 35,721 Total effective pro forma tax rate 42% 42% 42% 42% Pro forma provision for income taxes 27,397 22,655 15,388 15,003 Pro forma net income Net income before income taxes 65,231 53,940 36,639 35,721 Pro forma provision for income taxes 27,397 22,655 15,388 15,003 Pro forma net income 37,834 31,285 21,251 20,718 Pro forma ratios and per share data Pro forma net income (numerator) $ 37,834 $ 31,285 $ 21,251 $ 20,718 Average assets (denominator) 5,485,832 4,676,676 4,040,381 3,796,649 Pro forma return on average assets 0.69% 0.67% 0.53% 0.55% Average stockholders' equity (denominator) 425,698 390,318 359,359 343,412 Pro forma return on average stockholders' equity 8.89% 8.02% 5.91% 6.03% Weighted average shares outstanding - diluted (denominator) 42,957,936 42,000,000 42,000,000 42,000,000 Pro forma net income per common share—diluted $ 0.88 $ 0.74 $ 0.51 $ 0.49 For the years ended December 31,

26 Non - GAAP Reconciliation (1) Unaudited 2017 (1) 2016 2015 2014 Efficiency ratio Noninterest expense (numerator) 56,544 61,242 62,339 61,886 Net interest income 110,945 94,635 84,913 93,999 Noninterest income 7,458 7,844 6,924 3,608 Operating revenue (denominator) 118,403 102,479 91,837 97,607 Efficiency ratio 47.8% 59.8% 67.9% 63.4% Tangible assets Total assets 5,704,380 5,063,585 4,361,779 3,969,047 Less: Goodwill (3,297) (3,297) (3,297) (3,297) Tangible assets 5,701,083 5,060,288 4,358,482 3,965,750 Tangible book value to tangible assets Tangiblebook value (numerator) 546,448 401,078 368,002 346,211 Tangible assets (denominator) 5,701,083 5,060,288 4,358,482 3,965,750 Tangible book value to tangible assets 9.6% 7.9% 8.4% 8.7% For the years ended December 31,