Attached files
| file | filename |
|---|---|
| EX-32 - CERTIFICATION PURSUANT TO RULE 13A-14(B), AS REQUIRED BY 18 U.S.C. SECTION 1350 - SNYDER'S-LANCE, INC. | lnce-12302017xex32.htm |
| EX-31.2 - CERTIFICATION OF CHIEF FINANCIAL OFFICER - SNYDER'S-LANCE, INC. | lnce-12302017xex312.htm |
| EX-31.1 - CERTIFICATION OF CHIEF EXECUTIVE OFFICER - SNYDER'S-LANCE, INC. | lnce-12302017xex311.htm |
| EX-23.1 - CONSENT OF PRICEWATERHOUSECOOPERS LLP - SNYDER'S-LANCE, INC. | lnce-12302017xex231.htm |
| EX-21 - LIST OF THE SUBSIDIARIES OF THE REGISTRANT - SNYDER'S-LANCE, INC. | lnce-12302017xex21.htm |
| EX-12 - COMPUTATION OF RATIO OF EARNINGS TO FIXED CHARGES - SNYDER'S-LANCE, INC. | lnce-12302017xex12.htm |
SECURITIES AND EXCHANGE COMMISSION
Washington, D.C. 20549
FORM 10-K
[X] | ANNUAL REPORT PURSUANT TO SECTION 13 OR 15(d) OF THE SECURITIES EXCHANGE ACT OF 1934 |
For the fiscal year ended December 30, 2017
[ ] | TRANSITION REPORT PURSUANT TO SECTION 13 OR 15(d) OF THE SECURITIES EXCHANGE ACT OF 1934 |
For the transition period from to
Commission file number 0-398

SNYDER’S-LANCE, INC.
(Exact name of Registrant as specified in its charter)
North Carolina | 56-0292920 | |
(State of incorporation) | (I.R.S. Employer Identification Number) | |
13515 Ballantyne Corporate Place, Charlotte, North Carolina 28277 | ||
(Address of principal executive offices) (zip code) | ||
Post Office Box 32368, Charlotte, North Carolina 28232-2368 | ||
(Mailing address of principal executive offices) (zip code) | ||
Registrant’s telephone number, including area code: (704) 554-1421
Securities Registered Pursuant to Section 12(b) of the Act:
Title of Each Class | Name of Each Exchange on Which Registered | |
$0.83-1/3 Par Value Common Stock | The NASDAQ Stock Market LLC | |
Securities Registered Pursuant to Section 12(g) of the Act: NONE
Indicate by checkmark if the Registrant is a well-known seasoned issuer, as defined in Rule 405 of the Securities Act. Yes þ No o
Indicate by checkmark if the Registrant is not required to file reports pursuant to Section 13 or Section 15(d) of the Act. Yes o No þ
Indicate by check mark whether the Registrant (1) has filed all reports required to be filed by Section 13 or 15(d) of the Securities Exchange Act of 1934 during the preceding 12 months (or for such shorter period that the Registrant was required to file such reports), and (2) has been subject to such filing requirements for the past 90 days. Yes þ No o
Indicate by check mark whether the registrant has submitted electronically and posted on its corporate Web site, if any, every Interactive Data File required to be submitted and posted pursuant to Rule 405 of Regulation S-T during the preceding 12 months (or for such shorter period that the registrant was required to submit and post such files). Yes þ No o
Indicate by check mark if disclosure of delinquent filers pursuant to Item 405 of Regulation S-K is not contained herein, and will not be contained, to the best of Registrant’s knowledge, in definitive proxy or information statements incorporated by reference in Part III of this Form 10-K or any amendment to this Form 10-K. o
Indicate by check mark whether the Registrant is a large accelerated filer, an accelerated filer, a non-accelerated filer, or a smaller reporting company. See definitions of “large accelerated filer,” “accelerated filer” and “smaller reporting company” in Rule 12b-2 of the Exchange Act (Check One):
Large accelerated filer þ | Accelerated filer o | Non-accelerated filer o | Smaller reporting company o | |||
(do not check if a smaller reporting company) | ||||||
If an emerging growth company, indicate by check mark if the registrant has elected not to use the extended transition period for complying with any new or revised financial accounting standards provided pursuant to Section 13(a) of the Exchange Act. ¨
Indicate by check mark whether the Registrant is a shell company (as defined in Rule 12b-2 of the Act). Yes o No þ
The aggregate market value of shares of the Registrant’s $0.83-1/3 par value Common Stock, its only outstanding class of voting or nonvoting common equity, held by non-affiliates as of June 30, 2017, the last business day of the Registrant’s most recently completed second fiscal quarter, was $2,603,789,780.
The number of shares outstanding of the Registrant’s $0.83-1/3 par value Common Stock, its only outstanding class of Common Stock, as of February 23, 2018, was 98,320,444 shares.
Documents Incorporated by Reference
The information that is required to be included in Part III of this Annual Report on Form 10-K is incorporated by reference to either a definitive proxy statement or an amendment to this Annual Report on Form 10-K, which will be filed with the Securities and Exchange Commission within 120 days after the end of the Registrant's fiscal year ended December 30, 2017.
FORM 10-K
TABLE OF CONTENTS
Page | ||
Item 1 | ||
Item 1A | ||
Item 1B | ||
Item 2 | ||
Item 3 | ||
Item 4 | ||
Item 5 | ||
Item 6 | ||
Item 7 | ||
Item 7A | ||
Item 8 | ||
Item 9 | ||
Item 9A | ||
Item 9B | ||
Item 10 | ||
Item 11 | ||
Item 12 | ||
Item 13 | ||
Item 14 | ||
Item 15 | ||
Item 16 | ||
Exhibit 12 | Ratio of Earnings to Fixed Charges | |
Exhibit 21 | Subsidiaries of Snyder’s-Lance, Inc. | |
Exhibit 23.1 | Consent of PricewaterhouseCoopers LLP | |
Exhibit 31.1 | Section 302 Certification of the CEO | |
Exhibit 31.2 | Section 302 Certification of the CFO | |
Exhibit 32 | Section 906 Certification of the CEO and CFO | |
Note: Portions of the Company's Amendment to Form 10-K, which will be filed with the Securities and Exchange Commission within 120 days after the end of the Registrant's fiscal year ended December 30, 2017, are incorporated into Part III, Items 10, 11, 12, 13, and 14. Executive Officers of the Company is included in Part I of this Form 10-K.
PART I
Cautionary Information About Forward-Looking Statements
This document includes “forward-looking statements” within the meaning of the Private Securities Litigation Reform Act of 1995. Forward-looking statements include statements about our estimates, expectations, beliefs, intentions or strategies for the future, and the assumptions underlying such statements. We use the words “anticipates,” “believes,” "continues," "could," "designed," “estimates,” “expects,” “forecasts,” "goal," "initiate," "intends," “may,” “objective,” "plan," "potential," "pursue," "should," "target," "will," "would," or the negative of any of these words or similar expressions to identify our forward-looking statements that represent our judgment about possible future events. In making these statements we rely on assumptions and analyses based on our experience and perception of historical trends, current conditions and expected future developments as well as other factors we consider appropriate under the circumstances. We believe these judgments are reasonable, but these statements are not guarantees of any events or financial results, and our actual results may differ materially due to a variety of important factors, both positive and negative. Factors that could cause these differences include, but are not limited to, the factors set forth under Part I, Item 1A - Risk Factors.
Caution should be taken not to place undue reliance on our forward-looking statements, which reflect the expectations of management only as of the time such statements are made. Except as required by law, we undertake no obligation to update publicly or revise any forward-looking statement, whether as a result of new information, future events or otherwise.
Item 1. Business
General
Snyder's-Lance, Inc., a North Carolina corporation incorporated in 1926, is engaged in the manufacturing, distribution, marketing and sale of snack food products in North America and Europe. These products include pretzels, sandwich crackers, kettle cooked chips, pretzel crackers, popcorn, nuts, potato chips, tortilla chips, cookies, restaurant style crackers, and other salty snacks. Our brands include Snyder’s of Hanover®, the market share leader in the pretzel category in the United States ("US"), and Lance®, which is the number one ranked sandwich cracker in the US, as well as Cape Cod® kettle cooked chips and Kettle Brand® potato chips, which combined make us the market leader in the kettle chips category in the US. In addition, Snack Factory® Pretzel Crisps® is the market share leader in deli snacks and Pop Secret® popcorn currently ranks second in the microwave popcorn category. Late July® is the number one organic and non-genetically modified organism ("non-GMO") tortilla chip in the US. These products demonstrate our successful history of providing irresistible, high-quality snacks dating back over 100 years.
Snyder’s-Lance, Inc. is headquartered in Charlotte, North Carolina. References to “Snyder’s-Lance,” the “Company,” “we,” “us” or “our” refer to Snyder’s-Lance, Inc. and its subsidiaries, as the context requires.
Agreement and Plan of Merger
On December 18, 2017, we entered into an Agreement and Plan of Merger (the “Merger Agreement”) with Campbell Soup Company, a New Jersey corporation (“Campbell”), and Twist Merger Sub, Inc., a North Carolina corporation and a wholly-owned subsidiary of Campbell (“Merger Sub”), pursuant to which Merger Sub will merge with and into the Company, with the Company continuing as the surviving corporation and as a wholly-owned subsidiary of Campbell (the “Merger”). The parties anticipate that the Merger will close late in the first quarter of calendar year 2018.
Subject to the terms and conditions of the Merger Agreement, at the effective time of the Merger (the “Effective Time”), each share of our common stock, $0.83-1/3 par value, outstanding immediately prior to the Effective Time will be converted into the right to receive an amount in cash equal to $50.00 per share, without interest and subject to any required tax withholding.
The Merger Agreement contains various representations, warranties and covenants by the Company and Campbell. The Merger Agreement requires the Company to call and hold a special shareholder meeting, which is scheduled for March 23, 2018, and requires our Board of Directors to recommend that the Company’s shareholders approve the Merger Agreement and the Merger, except our Board of Directors may, in certain circumstances, change its recommendation, subject to complying with specified notice and other conditions set forth in the Merger Agreement. Additionally, the Company agreed that, among other things, it will not (i) solicit, initiate, facilitate or encourage the submission of any Acquisition Proposal (as defined in the Merger Agreement) or any proposal or offer that may reasonably be expected to lead to an Acquisition Proposal or (ii) enter into, continue or otherwise participate in discussions or negotiations with, or disclose non-public information to, any third party relating to any Acquisition Proposal or any proposal or offer that may reasonably be expected to lead to an Acquisition Proposal. Subject to the terms of the Merger Agreement, prior to the approval of the Merger Agreement by the Company’s shareholders, the Company may, however, engage in negotiations or discussions with and provide non-public information to a third party that has made an unsolicited, bona fide, written Acquisition Proposal that our Board of Directors determines in good faith, after consultation with its outside legal
1
counsel and financial advisor, constitutes, or could reasonably be expected to result in, a Superior Proposal (as defined in the Merger Agreement) and that failure to take such actions would be reasonably likely to be inconsistent with its fiduciary duties under applicable law.
Prior to the approval of the Merger Agreement by the Company’s shareholders, our Board of Directors may, upon receipt of a Superior Proposal, and in certain other circumstances set forth in the Merger Agreement, change its recommendation that the Company’s shareholders approve the Merger Agreement and the Merger, subject to complying with specified notice and other conditions set forth in the Merger Agreement, including, if requested by Campbell, negotiating in good faith with Campbell to make such revisions to the Merger Agreement in response to such Superior Proposal. If our Board of Directors changes its recommendation that the Company’s shareholders approve the Merger Agreement and the Merger, Campbell may terminate the Merger Agreement. In addition, prior to obtaining such shareholder approval, the Company may terminate the Merger Agreement to enter into a definitive agreement providing for a Superior Proposal, subject to payment of the termination fee described below and only following compliance with specified notice and other conditions set forth in the Merger Agreement, including giving Campbell the opportunity to propose changes to the Merger Agreement so that any such proposal would cease to constitute a Superior Proposal.
The Merger Agreement requires the Company and Campbell to use reasonable best efforts to take all actions necessary under applicable law to consummate the transactions contemplated by the Merger Agreement. The Merger Agreement contains certain termination rights for each of the Company and Campbell, including the right of each party to terminate the Merger Agreement if the Merger has not been consummated by the “end date” of September 18, 2018.
The Merger Agreement provides for the payment by the Company to Campbell of a termination fee in the amount of $149 million in the case of a termination of the Merger Agreement under certain circumstances described in the Merger Agreement, including if: (i) (a) the Merger Agreement is terminated by Campbell or the Company because the Merger is not consummated by the end date or the Company’s shareholders do not approve the Merger Agreement, or by Campbell because of a breach of a representation, warranty or covenant of the Company that would cause the related closing condition to be incapable of being satisfied or cured by the end date or, if curable, is not cured by the Company by the earlier of 30 days after receipt of written notice of such breach and three business days prior to the end date, (b) any person publicly discloses a bona fide Acquisition Proposal, which Acquisition Proposal had not been publicly withdrawn prior to the special meeting of the Company’s shareholders, and (c) within 12 months after such termination the Company enters into a definitive agreement with respect to any Acquisition Proposal, (ii) our Board of Directors changes its recommendation or (iii) the Company enters into definitive transaction documentation providing for a Superior Proposal.
Campbell will be required to pay the Company a termination fee of $198.6 million in the event the Merger Agreement is terminated by the Company, subject to certain limitations set forth in the Merger Agreement, if (i) there has been a breach of a representation, warranty or covenant of Campbell or Merger Sub that would cause the related closing condition to be incapable of being satisfied or cured by the end date or, if curable, is not cured by Campbell or Merger Sub by the earlier of 30 days after receipt of written notice of such breach and three business days prior to the end date, or (ii) the conditions to Campbell and Merger Sub’s obligations to consummate the closing have been satisfied or waived (other than those conditions that by their terms are to be satisfied by actions taken at the closing; provided that such conditions are then capable of being satisfied), Campbell has failed to consummate the Merger within two business days of the date the closing should have occurred and the Company has notified Campbell in writing that all of the conditions to closing have been satisfied (or waived) and it intends to terminate the Merger Agreement if Campbell and Merger Sub fail to consummate the transactions contemplated thereby within two business days.
The Merger Agreement has been approved by the boards of directors of each of the Company and Campbell. The obligations of the parties to consummate the Merger are subject to customary closing conditions, including, among others: approval of the Merger Agreement and Merger by holders of 75% of the outstanding shares of the our common stock; the accuracy of the representations and warranties of each party (subject to certain exceptions as set forth in the Merger Agreement); each of the parties having performed in all material respects all of their respective obligations under the Merger Agreement; and the absence of any injunctions or other legal restraints.
On December 18, 2017, certain trusts affiliated with Patricia A. Warehime, a member of our Board, and members of her immediate family, each such trust being a shareholder of the Company (collectively, the “Warehime Holders”), entered into a voting agreement with Campbell, pursuant to which the Warehime Holders agreed, among other things, to vote the shares of Company common stock over which they have voting power in favor of the approval of the Merger Agreement and the transactions contemplated thereby, including the Merger. As of February 16, 2018, the record date for the special meeting of our shareholders, the Warehime Holders owned 12,851,757 shares, or approximately 13.1% of the shares of our common stock outstanding and entitled to vote at the special meeting.
2
Certain terms of the Merger Agreement and Voting Agreement are summarized, and the Merger Agreement and Voting Agreement have been filed as exhibits to the Current Report on Form 8-K filed by the Company on January 18, 2018.
Recent Acquisitions and Divestiture
In recent years, we have acquired several companies and brands as we seek future growth both organically as well as through acquisitions.
In October of 2012, we completed the acquisition of Snack Factory, LLC and certain of its affiliates ("Snack Factory"), which added a Core brand to our portfolio, Snack Factory® Pretzel Crisps®. The Snack Factory® brand is known for its innovative flavor profiles, commitment to providing the highest-quality ingredients and a broadening base of passionate consumers. In June of 2014, we completed the acquisition of Baptista’s Bakery, Inc. ("Baptista's"), which is the sole manufacturer of our Snack Factory® Pretzel Crisps® products. In addition, Baptista's is an industry leader in the development, innovation and manufacturing of highly-differentiated snack foods, including organic, non-GMO, all natural and gluten-free products. In October of 2014, we made an additional investment in Late July Snacks, LLC ("Late July") which increased our total ownership interest to 80%. Late July is a leader in organic and non-GMO salty snacks and the investment supports our goal of having a stronger presence in "better-for-you" snacks.
On February 29, 2016, we completed the acquisition of all of the outstanding stock of Diamond Foods, Inc. ("Diamond Foods"). The strategic combination of Snyder's-Lance and Diamond Foods brought together two established companies with strong brands, and created an innovative, highly complementary and diversified portfolio of branded snacks. Diamond Foods was a leading snack food company with five brands, including: Kettle Brand® potato chips; KETTLE® Chips; Pop Secret® popcorn; Emerald® snack nuts; and Diamond of California® culinary nuts. The transaction expanded our footprint in "better-for-you" snacking, and increased our existing natural food channel presence. In addition, this transaction expanded and strengthened our distribution network in the US, and provided us with a platform for growth in the United Kingdom ("U.K.") and certain other countries within Europe.
On September 1, 2016, we completed the acquisition of Metcalfe's Skinny Limited ("Metcalfe") by acquiring the remaining 74% interest. Metcalfe owns the U.K.'s leading premium ready-to-eat ("RTE") popcorn brand, and also incorporates a fast growing range of corn and rice cake products. The U.K. popcorn market is one of the fastest growing categories within the U.K. snack food industry, as consumers increasingly seek out "better-for-you" snacking options.
On December 31, 2016, we completed the carve-out and sale of our culinary nuts business (comprised primarily of the Diamond of California® brand, and the Stockton, CA facility; collectively "Diamond of California"). We had previously entered the culinary nuts business as a result of the Diamond Foods acquisition. This divestiture aligns with our strategy to focus more resources on growth opportunities for our snack food brands.
Products
We are engaged in the manufacturing, distribution, marketing and sale of snack food products. These products include pretzels, sandwich crackers, kettle cooked chips, pretzel crackers, popcorn, nuts, potato chips, tortilla chips, cookies, restaurant style crackers, and other salty snacks. Our products are packaged in various single-serve, multi-pack, family-size and party-size configurations. Our branded products are principally sold under trademarks owned by us. While the majority of our branded products are manufactured by us, certain branded products are contract manufactured, due to required expertise, ingredients or equipment, or increased demand.
We also sell Partner brand products, which consist of third-party branded products that we sell to independent business owners ("IBO") through the national direct-store-delivery distribution network ("DSD network"), in order to broaden the portfolio of product offerings for the IBOs. In addition, we contract with other branded food manufacturers to produce their products and periodically sell certain semi-finished goods to other manufacturers.
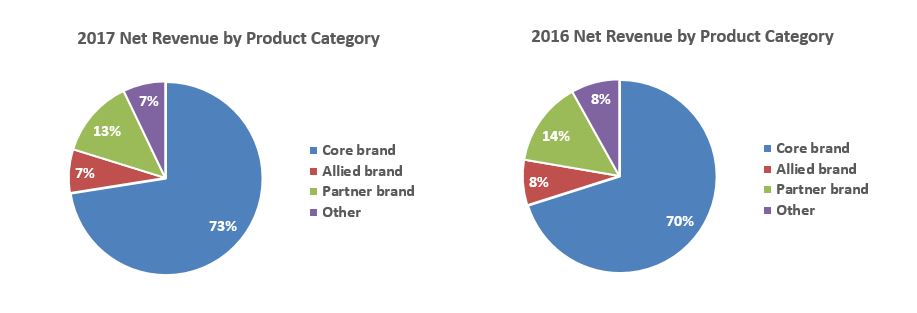
Overall sales of our products are relatively consistent throughout the year, although demand for certain products may be influenced by holidays, changes in seasons, or other annual events. In 2017, Core branded products represented approximately 73% of net revenue from continuing operations, while net revenue from Allied brand, Partner brand and Other products represented approximately 7%, 13% and 7%, respectively. In 2016, Core branded products represented approximately 70% of net revenue, while net revenue from Allied brand, Partner brand and Other products represented approximately 8%, 14% and 8%, respectively. In 2015, Branded products represented 62% of net revenue, while net revenue from Allied brand, Partner brand and Other products represented 10%, 18% and 10%, respectively. The decrease each year in both Partner brand and Other products is a result of the acquisition of the Diamond Foods core brands and the shift in our strategic direction.
3
Intellectual Property
Trademarks that are important to our business are protected by registration or other means in the US and most other international markets where the related products are sold. We own various registered trademarks for use with our Branded products, including: Snyder’s of Hanover®; Lance®; Kettle Brand®; Cape Cod®; Snack Factory® Pretzel Crisps®; Pop Secret®; KETTLE® Chips; Emerald®; and Late July® (collectively, "Core" brands), and Tom’s®; Jays®; Archway®; Stella D’oro®; O-Ke-Doke®; Metcalfe’s skinny®; Krunchers!®; and Eatsmart SnacksTM (collectively, "Allied" brands) as well as a variety of other marks and designs. On a limited basis, we license trademarks for use on certain products that are classified as Branded products. Solely for convenience, trademarks and trade names referred to in this Annual Report on Form 10-K may appear without the ® or ™ symbols, but references are not intended to indicate, in any way, that we will not assert our rights to these trademarks and trade names to the fullest extent under applicable law.
Overall Strategy
Our goal is to deliver simple moments of happiness to everyone, everywhere, by providing uncompromisingly delicious snacks made with simple ingredients. We believe that snacks made with simple ingredients, are simply better food. As we grow, we will remain focused on delivering margin expansion through our Performance Transformation Plan, announced by us in April 2017 (the “Transformation Plan”). We expect our growth will be a result of organic investments in our research and development capabilities, and inorganic growth through strategic acquisitions.
Our strategy is built around five supporting initiatives:
• | Optimize the portfolio for growth in wholesome natural snacks. To do so we are focusing on strengthening our core brand innovation pipeline and bringing our existing brands to greater scale to more effectively compete. This involves exiting platforms with little advantage or disadvantaged scale while simultaneously evaluating new, scalable snack markets through both organic growth and inorganic mergers and acquisitions. |
• | Build superior brand preference. We build brand preference by continuously elevating our focus on product taste and quality, increasing investments in world class marketing vehicles, and renovating product ingredients around those qualifications most preferred by our consumers. In parallel we aim to continuously increase the sustainability, convenience, and functional advantage of our product packaging. These efforts will complement our focus on building improved price realization across our portfolio consistent with our value proposition. |
• | Provide the right products, in the right places, at the right times. The DSD network combined with our direct distribution capability allow us to offer our products in a broad array of large and fast growing retail channels where consumers prefer to shop. We are focused on growing in emerging channels and always delivering our products on-time and in-full. |
• | Pursue operational efficiencies. We are improving complexity by reducing manufacturing and distribution complexity and optimizing our product offering through stock keeping unit ("SKU") rationalization. In addition, we leverage zero-based-budgeting to eliminate non-critical expenses and implement proven technologies to improve operational performance. |
4
• | Foster a diverse culture centered on our values. We believe that a culture rich in diversity of thought, experiences and identity yields a strong and resilient organization. We also seek to build a safe and supporting environment, invest in our employees to build their capabilities and experiences, and recognize and reward everyone for their contributions. We believe that this philosophy ultimately benefits our shareholders in the form of a higher performing company. |
Research and Development
We consider research and development of new products to be a significant part of our overall strategy, and are committed to developing innovative, high-quality products that exceed consumer expectations. A team of professional product developers, including microbiologists, food scientists and culinary experts, work in collaboration with innovation, marketing, manufacturing and sales leaders, to develop products that meet changing consumer demands. Our research and development staff incorporates product ideas from all areas of our business in order to formulate new products. In addition to developing new products, the research and development staff routinely reformulates and improves existing products based on advances in ingredients and technology, and conducts value engineering to maintain competitive price points. We own a 60,000 square foot Research and Development Center in Hanover, Pennsylvania, where we conduct much of our research and development. In addition, we have a research and development facility adjacent to our production facility in Salem, Oregon. Our research and development costs were approximately $6.2 million, $10.0 million and $6.2 million in 2017, 2016 and 2015, respectively.
Marketing
Our marketing efforts are focused on building long-term brand equity through effective consumer marketing. In addition to volume building trade promotions to market our products, our advertising efforts utilize television, radio, print, digital, mobile and social media aimed at increasing consumer preference and usage of our brands. We also use consumer promotions, sponsorships and partnerships which include free trial offers, targeted coupons and on-package offers to generate trial usage and increase purchase frequency. These marketing efforts are an integral part of our overall strategy to grow our brands and reach more consumers in order to build superior brand preference.
We work with third-party information agencies, such as Information Resources, Inc. ("IRI"), Nielsen and other syndicated market data providers, to monitor the effectiveness of our marketing and measure product growth. All information regarding our brand market positions in the US included in this Annual Report on Form 10-K is from IRI and is based on retail dollar sales.
Distribution
We distribute snack food products throughout the US using the DSD network. The DSD network is made up of over 3,200 routes that are primarily owned and operated by IBOs. We also ship products directly to third-party distributors in areas where the DSD network does not operate. Through our direct distribution network, we distribute products directly to retail customers or to third-party distributors using freight carriers or our own transportation fleet. In Europe, we sell our salty snack products through our sales personnel directly to national grocery, co-op and impulse store chains. In 2017, approximately 55% of net revenue was generated by products distributed through the DSD network while the remaining 45% was generated by products distributed through our direct distribution network.
In order to maintain and expand the DSD network, we routinely participate in certain route purchase and sale activities. These activities include the following:
• | Acquisition of regional distributor businesses - As we expand the DSD network, we continue to look for potential regional distributor business acquisition targets in areas where we do not currently have a DSD network. Upon acquisition, the acquired routes may be reengineered to include our products and retail locations and are then sold to a new or current IBO, as described below. |
• | Reengineering of zones - Periodically, we undertake a route reengineering project for a particular geography or zone. The reasons for route reengineering projects vary, but are typically due to increased sales volume associated with new retail locations and/or the addition of new Branded or Partner brand products to the routes in that zone. In these cases, we repurchase all of the IBO routes in that zone. The repurchased routes are then reengineered, which normally results in the addition of new IBO routes (territories) because of the additional volume. Routes are then resold, usually to the original IBO, however, the original IBO has no obligation to repurchase. Upon completion, these route reengineering projects may result in modest net gains on the sale of route businesses due to the value added during the reengineering through additional volume and/or retail locations. |
• | Sale of company-owned routes - Some routes remain company-owned primarily because they need additional sales volume in order to become sustainable routes for IBOs. As we build up the volume on these routes through increased distribution of our Branded and Partner brand products, we would sell these routes to IBOs which could result in gains. |
5
• | IBO defaults - There are times when the IBOs are not successful and the IBO's distributor agreement with us is terminated. In these instances, if the existing IBO is unable to sell the route to another third party, we may repurchase the route at a price defined in the distributor agreement. We generally put the repurchased route up for sale to another third-party IBO. The subsequent sales transaction generally results in a nominal gain or loss. |
Capital Expenditures
We have invested significant capital in our facilities to ensure sufficient capacity, efficient production, effective use of technology, excellent quality, and a positive working environment for our associates. In 2017, 2016 and 2015, we had capital expenditures of $69.4 million, $73.3 million and $51.5 million, respectively. For 2018, we expect capital expenditures to be in line with 2017 expenditures. Capital spending will be used to upgrade equipment, increase capacity at our manufacturing facilities and is believed to be adequate to maintain and support our revenue growth over the next few years.
Customers
Through the DSD network, we sell our Branded and Partner brand products to IBOs that, in turn, sell to grocery/mass merchandisers, club stores, discount stores, convenience stores, food service establishments and various other retail customers, including drug stores, schools, military and government facilities and “up and down the street” outlets such as recreational facilities, offices and other independent retailers. In addition, we sell our Branded products directly to retail customers and third-party distributors, both in the US and abroad. We also contract with other branded food manufacturers to produce their products or provide semi-finished goods.
Substantially all of our revenue is from sales to customers in the US. Sales to our largest retail customer, Wal-Mart Stores, Inc. ("Wal-Mart"), either through IBOs or our direct distribution network, were approximately 13% of net revenue in 2017, 2016 and 2015. Our sales to Wal-Mart do not include sales of our products made to Wal-Mart by third-party distributors outside of the DSD network. Sales to these third-party distributors represent approximately 6% of our net revenue and may increase sales of our products to Wal-Mart by an amount we are unable to estimate. Our top ten retail customers accounted for approximately 55% of our net revenue during 2017, excluding sales of our products made by third-party distributors.
Raw Materials
The principal raw materials used to manufacture our products are flour, potatoes, oil, peanuts, other nuts, corn, sugar, chocolate, cheese and seasonings. The principal packaging supplies used are flexible film, cartons, trays, boxes and bags. These raw materials and supplies are normally available in adequate quantities in the commercial market and are generally contracted from three to twelve months in advance, depending on market conditions.
Competition and Industry
Our products are sold in highly competitive markets. Generally, we compete with companies engaged in the manufacturing, distribution, marketing and sale of snack food products, some of which have greater revenue and resources than we do. The principal methods of competition are price, service, product quality, product offerings and distribution. The methods of competition and our competitive position vary according to the geographic location, the particular product categories and the activities of our competitors.
Environmental Matters
Our operations are subject to various federal, state and local laws and regulations with respect to environmental matters. We are not a party to any material proceedings arising under these laws or regulations for the periods covered by this Annual Report on Form 10-K. We believe we are in compliance with all material environmental regulations affecting our facilities and operations and that continued compliance will not have a material impact on our capital expenditures, earnings or competitive position.
Regulation
The manufacture and sale of snack food products is highly regulated. In the US our activities are subject to regulation by various federal government agencies, including the Food and Drug Administration, US Department of Agriculture, Federal Trade Commission, Department of Labor and Department of Commerce, as well as various state and local agencies. Our business is also regulated by similar agencies outside of the US.
Sustainability
We are committed to reducing the impact that our products and operations have on the environment. We work to minimize our environmental impact by implementing more sustainable business operations and doing more with less, as we remain committed to being a responsible corporate citizen. At our bakery in Hanover, Pennsylvania, we own a solar farm that produces 3.5 megawatts of electricity that supplies 100% of the power needed at our R&D Center onsite as well as approximately 30% of the power used by the bakery for production during the day. Our Kettle Chip plant in Salem, Oregon captures solar energy by taking advantage of solar panels on the roof and is one of the largest solar installations in the northwest. The Kettle Chip plant in Beloit, Wisconsin, which was the first LEED Gold Certified food manufacturing plant in the United States, uses wind turbines to offset utility usage
6
from the local power plant. In addition, our Supply Chain team has implemented improved recycling initiatives across the organization in order to strive to bring our manufacturing plants to landfill free operations and manufacturing. At our chip producing plants, we recycle the oil used in kettle chip production to vendors that convert it to other products like biodiesel for use in many other applications. We carry the focus on sustainability beyond production. Our headquarters facility implements a single stream waste vendor so that no matter which receptacle you use, everything that can be is sorted and recycled. We also implemented motion activated light sensors in our offices and manufacturing plants to make sure we only use light when a facility is occupied.
Employees
As of December 30, 2017, we had approximately 5,900 active employees located in the US and U.K. compared to approximately 6,100 active employees as of December 31, 2016. None of our employees are covered by a collective bargaining agreement.
Available Information
Annual Reports on Form 10-K, Quarterly Reports on Form 10-Q and Current Reports on Form 8-K, amendments to these reports, and exhibits are available on our Investor Relations website free of charge at www.snyderslance.com. All required reports are made available on the website as soon as reasonably practicable after they are filed with or furnished to the Securities and Exchange Commission.
Item 1A. Risk Factors
In addition to the other information in this Annual Report on Form 10-K, the following risk factors should be considered carefully in evaluating our business. Our business, financial condition or results of operations may be adversely affected by any of these risks. Additional risks and uncertainties, including risks that we do not presently know of or currently deem insignificant, may also impair our business, financial condition or results of operations.
Risks related to our Merger with Campbell
The failure to complete or delays in completing the merger with Campbell could adversely affect our business and our stock price.
Consummation of the merger with Campbell is subject to customary closing conditions, including approval by our shareholders. There can be no assurance that these conditions will be satisfactorily met or validly waived, or that our Company and Campbell will be able to successfully consummate the Merger, on the anticipated terms or at all. We will have incurred significant costs, including the diversion of management resources and transaction-related expenses for which we will receive little or no benefit, if the Merger is not consummated. Additionally, we may be required, in certain circumstances, to pay a termination fee of $149 million, as provided in the Merger Agreement. The Merger Agreement may be terminated by either party if the merger is not completed on or September 18, 2018. In addition, the Merger Agreement contains certain other termination rights for both us and Campbell. A failed transaction may result in negative publicity. Any of these events, individually or in combination, could have an adverse effect on our results of operations and financial condition.
The pending merger could adversely affect our business, financial results and operations, including our relationships with customers, vendors and employees.
The proposed merger with Campbell could cause material disruptions in and create uncertainty surrounding our business. This could affect our relationships with customers, vendors and employees, which could have an adverse effect on our business, financial results and operations. In particular, we could lose important personnel if some employees decide to leave in light of the proposed Merger. We could potentially lose customers or suppliers, or our customers or suppliers could modify their relationships with us in an adverse manner. In addition, we have devoted, and will continue to devote, significant management resources to complete the Merger. This may cause our business and operating results to suffer.
The Merger Agreement also places restrictions on how we conduct our business before the merger is completed. These restrictions could result in our inability to respond effectively, and in a timely manner, to competitive pressures, industry developments and future opportunities. This could harm our business, financial results and operations.
Risks related to our business
Our performance may be impacted by general economic conditions or an economic downturn.
An overall decline in economic activity could adversely impact our business and financial results. Economic uncertainty may reduce consumer spending as consumers make decisions on what to include in their food budgets. This could also result in a shift in consumer preference toward private label products. Shifts in consumer spending could result in increased pressure from competitors or customers that may require us to increase promotional spending or reduce the prices of some of our products and/or limit our ability to increase or maintain prices, which could lower our revenue and profitability.
7
Instability in financial markets may impact our ability, or increase the cost, to enter into new credit agreements in the future. Additionally, it may weaken the ability of our customers, suppliers, IBOs, third-party distributors, banks, insurance companies and other business partners to perform their obligations in the normal course of business, which could expose us to losses or disrupt the supply of inputs we rely upon to conduct our business. If one or more of our key business partners fail to perform as expected or contracted for any reason, our business could be negatively impacted.
Volatility in the price or availability of the inputs we depend on, including raw materials, packaging, energy and labor, could adversely impact our financial results.
Our financial results could be adversely impacted by changes in the cost or availability of raw materials and packaging. While we often obtain substantial commitments for future delivery of certain raw materials, continued long-term increases in the costs of raw materials and packaging, including but not limited to cost increases due to the tightening of supply, could adversely affect our financial results.
Our transportation and logistics system is dependent upon gasoline and diesel fuel, and our manufacturing operations depend on natural gas. While we may enter into forward purchase contracts to reduce the volatility associated with some of these costs, continued long-term changes in the cost or availability of these energy sources could adversely impact our financial results.
Our continued growth requires us to hire, retain and develop a highly skilled workforce and talented management team. Our financial results could be adversely affected by increased costs due to increased competition for employees, higher employee turnover or increased employee benefit costs.
We operate in the highly competitive food industry.
Price competition and industry consolidation could adversely impact our financial results. The sales of most of our products are subject to significant competition primarily through promotional discounting and other price cutting techniques by competitors, some of whom are significantly larger with greater resources. In addition, there is continuing consolidation in the snack food industry and in retail outlets for snack foods, either of which could increase competition. Significant competition increases the possibility that we could lose one or more major customers, lose existing product authorizations at customer locations, lose market share and/or shelf space, increase expenditures or reduce selling prices, which could have an adverse impact on our business or financial results.
Price increases for our products that we initiate may negatively impact our financial results if not properly implemented or accepted by our customers. Future price increases, such as those made in order to offset increased input costs, may reduce our overall sales volume, which could reduce our revenue and operating profit. We may be unable to implement price increases driven by higher input costs on a timely basis or at all, either of which may reduce our operating profit. Additionally, if market prices for certain inputs decline significantly below the prices we are required by contract to pay, customer pressure to reduce the prices for our products could lower our revenue and operating profit.
Changes in our top retail customer relationships could impact our revenue and profitability.
We are exposed to risks resulting from several large retail customers that account for a significant portion of our revenue. Our top ten retail customers accounted for approximately 55% of our net revenue during 2017, excluding sales of our products made by third-party distributors who are outside of the DSD network, with our largest retail customer, Wal-Mart, representing approximately 13% of our 2017, 2016 and 2015 net revenue. The loss of one or more of our large retail customers could adversely affect our financial results. These customers typically make purchase decisions based on a combination of price, service, product quality, product offerings, consumer demand, as well as distribution capabilities and generally do not enter into long-term contracts. In addition, these significant retail customers may change their business practices related to inventories, product displays, logistics or other aspects of the customer-supplier relationship. Our results of operations could be adversely affected if revenue from one or more of these customers is significantly reduced or if the cost of complying with customers’ demands is significant. If receivables from one or more of these customers become uncollectible, our financial results may be adversely impacted.
We may be unable to maintain our profitability in the face of a consolidating retail environment.
As the retail grocery industry continues to consolidate and our retail customers grow larger and become more sophisticated, our retail customers may demand lower pricing and increased promotional programs. Further, these customers are reducing their inventories and increasing their emphasis on products that hold either the number one or number two market position and private label products. If we fail to use our sales and marketing expertise to maintain our category leadership positions to respond to these trends, or if we lower our prices or increase promotional support of our products and are unable to increase the volume of our products sold, our profitability and financial condition may be adversely affected.
Demand for our products may be adversely affected by changes in consumer preferences and tastes or if we are unable to innovate or market our products effectively.
8
We are a consumer products company operating in highly competitive markets and rely on continued demand for our products. To generate revenue and profits, we must sell products that appeal to our customers and consumers. Any significant changes in consumer preferences or any inability on our part to anticipate or react to such changes could result in reduced demand for our products and erosion of our competitive and financial position. Our success depends on our ability to respond to consumer trends, including concerns of consumers regarding health and wellness, obesity, product attributes and ingredients. In addition, changes in product category consumption or consumer demographics could result in reduced demand for our products. Consumer preferences may shift due to a variety of factors, including the aging of the general population, changes in social trends, or changes in travel, vacation or leisure activity patterns. Any of these changes may reduce consumers’ willingness to purchase our products and negatively impact our financial results.
Our continued success also is dependent on product innovation, including maintaining a robust pipeline of new products, and the effectiveness of advertising and promotional campaigns, marketing programs and product packaging. Although we devote significant resources to meet this goal, there can be no assurance as to the continued ability to develop and launch successful new products or variants of existing products, or to effectively execute advertising and promotional campaigns and marketing programs.
Tax matters, including changes in tax laws and rates, disagreements with taxing authorities and imposition of new taxes, could adversely impact our results of operations and financial condition.
In December 2017, the United States enacted tax reform legislation (“Tax Act”). The Tax Act implements many new US domestic and international tax provisions. Many aspects of the Tax Act are unclear, and although additional clarifying guidance is expected to be issued in the future (by the Internal Revenue Service (“IRS”), the US Treasury Department or via a technical correction law change), it may not be clarified for some time. In addition, many US states have not yet updated their laws to take into account the new federal legislation. As a result, we have not yet been able to determine the full impact of the new laws on our results of operations and financial condition. It is possible that Tax Act, or interpretations under it, could change and could have an adverse effect on us, and such effect could be material.
In addition, foreign jurisdictions may also enact tax legislation that could significantly affect our ongoing operations. For example, foreign tax authorities could impose rate changes along with additional corporate tax provisions that would disallow or tax perceived base erosion or profit shifting. Aspects of the Tax Act may lead foreign jurisdictions to respond by enacting additional tax legislation that is unfavorable to us.
Adverse changes in the underlying profitability or financial outlook of our operations in several jurisdictions could lead to changes in the ability to realize our deferred tax assets and result in a charge to our income tax provision. Additionally, changes in tax laws in the US or in other countries where we have significant operations could materially affect deferred tax assets and liabilities and our income tax provision.
We are also subject to tax audits by governmental authorities. Although we believe our tax estimates are reasonable, if a taxing authority disagrees with the positions we have taken, we could face additional tax liabilities, including interest and penalties. Unexpected results from one or more such tax audits could significantly adversely affect our income tax provision and our results of operations.
The decision by British voters to exit the European Union may further negatively impact our operations.
The June 2016 referendum by British voters to exit the European Union (“Brexit”) caused uncertainty in global markets and resulted in a sharp decline in the value of the British pound, as compared to the US dollar and other currencies. As the U.K. negotiates its exit from the European Union, volatility in exchange rates and in U.K. interest rates may continue. In the near term, a weaker British pound compared to the US dollar during a reporting period causes local currency results of our U.K. operations to be translated into fewer US dollars; a weaker British pound compared to other currencies increases the cost of goods imported into our U.K. operations and may decrease the profitability of our U.K. operations; and a higher U.K. interest rate may have a dampening effect on the U.K. economy. In the longer term, any impact from Brexit on our U.K. operations will depend, in part, on the outcome of tariff, trade, regulatory and other negotiations. However, as a result of weakening demand, whether a function of Brexit or consumer preference, we recognized impairment charges of $46.3 million and $11.8 million against our European goodwill and KETTLE® Chips U.K. trademark, respectively during 2017. Further erosion of such operations, whether by consumer demand or the impact of Brexit could result in additional impairments related to our U.K. operations.
9
Our results may be adversely affected by the failure to execute acquisitions and divestitures successfully.
Our ability to meet our objectives with respect to the acquisition of new businesses or the divestiture of existing businesses may depend in part on our ability to identify suitable buyers and sellers, negotiate favorable financial terms and other contractual terms, and obtain all necessary regulatory approvals. If we pursue strategic acquisitions, divestitures, or joint ventures, we may incur significant costs and may not be able to consummate the transactions or obtain financing. Potential risks of acquisitions also include the inability to integrate acquired businesses efficiently into our existing operations; diversion of management's attention from other business concerns; potential loss of key employees and/or customers of acquired businesses; potential assumption of unknown liabilities; the inability to implement promptly an effective control environment; potential impairment charges if purchase assumptions are not achieved or market conditions decline; and the risks inherent in entering markets or lines of business with which we have limited or no prior experience. Acquisitions outside the US may present unique challenges and increase our exposure to risks associated with foreign operations, including foreign currency risks and risks associated with local regulatory agencies.
Future acquisitions also could result in potentially dilutive issuances of equity securities or the incurrence of debt, which could adversely affect our financial results. In the event we enter into strategic transactions or relationships, our financial results may differ from expectations. We may not be able to achieve expected returns and other benefits as a result of potential acquisitions or divestitures.
Potential risks for any future divestitures, if any, include the inability to separate divested businesses or business units from our Company effectively and efficiently and to reduce or eliminate associated overhead costs. We are reliant on Diamond of California to supply walnuts under a Supply Agreement. Failure of Diamond of California to provide quality products under this arrangement could adversely affect our financial results.
Our business or financial results may be negatively affected if acquisitions or divestitures are not successfully implemented or completed.
The loss of key personnel could have an adverse effect on our financial results and growth prospects.
There are risks associated with our ability to retain key employees. If certain key employees terminate their employment, it could negatively impact manufacturing, sales, marketing or development activities. In addition, we may not be able to locate suitable replacements for key employees or offer employment to potential replacements on acceptable terms.
Failure to effectively execute and accomplish our strategy could adversely affect our financial results.
We utilize several operating strategies to increase revenue and improve operating performance. If we are unsuccessful due to unplanned events, our ability to manage change or unfavorable market conditions, our financial performance could be adversely affected.
Concerns with the safety and quality of certain food products or ingredients could cause consumers to avoid our products.
We could be adversely affected if consumers in our principal markets lose confidence in the safety and quality of certain products or ingredients. Negative publicity about these concerns, whether or not valid, may discourage consumers from buying our products or cause disruptions in production or distribution of our products and negatively impact our business and financial results.
If our products become adulterated, misbranded or mislabeled, we might need to recall those items and we may experience product liability claims if consumers are injured or become sick.
We may need to recall some of our products if they become adulterated or if they are mislabeled, and may also be liable if the consumption of any of our products causes injury to consumers. A widespread recall could result in significant losses due to the costs of a recall, the destruction of product inventory, and lost sales due to the unavailability of the affected product for a period of time. A significant product recall or product liability claim could also result in adverse publicity, damage to our reputation, and a loss of consumer confidence in the safety and/or quality of our products, ingredients or packaging. Such a loss of confidence could occur even in the absence of a recall or a major product liability claim. We also may become involved in lawsuits and legal proceedings if it is alleged that the consumption of any of our products causes injury or illness. A product recall or an adverse result in any such litigation could have an adverse effect on our operating and financial results. We may also lose customer confidence for our entire Branded portfolio as a result of any such recall or proceeding.
Disruption of our supply chain could have an adverse impact on our business and financial results.
Our ability to manufacture and sell our products may be impaired by damage or disruption to our manufacturing or distribution capabilities, or to the capabilities of our suppliers or contract manufacturers, due to factors that are hard to predict or beyond our control, such as adverse weather conditions, natural disasters, fire, pandemics or other events. Failure to take adequate steps to mitigate the likelihood or potential impact of such events, or to effectively manage such events if they occur, may adversely affect our business or financial results, particularly in circumstances where a product or ingredient is sourced from a single supplier or
10
location. In addition, in light of recent transportation industry legislation, the number of freight carriers could decrease and create carrier shortages and higher freight costs.
We may be adversely impacted by inadequacies in, or security breaches of, our information technology systems.
We increasingly rely on information technology systems to conduct our business. These systems can enhance efficiency and business processes but also present risks of unauthorized access to our networks or data centers. If unauthorized parties gain access to our systems, they could obtain and exploit confidential business, customer, or employee information and harm our competitive position. In addition, these information systems may experience damage, failures, interruptions, errors, inefficiencies, attacks or suffer from fires or natural disasters, any of which could have an adverse effect on our business and financial results if not adequately mitigated by our security measures and disaster recovery plans.
Furthermore, with multiple information technology systems as a result of acquisitions, we may encounter difficulties assimilating or integrating data. In addition, we are currently in the process of consolidating systems which could provide additional security or business disruption risks which could have an adverse impact on our business and financial results.
Improper use or misuse of social media may have an adverse effect on our business and financial results.
Consumers are moving away from traditional means of electronic mail towards new forms of electronic communication, including social media. We support new ways of sharing data and communicating with customers using methods such as social networking. However, misuse of social networking by individuals, customers, competitors, or employees may result in unfavorable media attention which could negatively affect our business. Further, our competitors are increasingly using social media networks to market and advertise products. If we are unable to compete in this environment it could adversely affect our financial results.
The DSD network relies on a significant number of IBOs, and such reliance could affect our ability to efficiently and profitably distribute and market products, maintain existing markets and expand business into other geographic markets.
The DSD network relies on over 2,800 IBOs for the sale and distribution of Branded and Partner brand products. IBOs must make a commitment of capital and/or obtain financing to purchase a route business and other equipment to conduct their business. Certain financing arrangements, through third-party lending institutions, are made available to IBOs and require us to repurchase a route business if the IBO defaults on their loan and we then are required to collect any shortfall from the IBO, to the extent possible. The inability of IBOs, in the aggregate, to make timely payments could require write-offs of accounts receivable or increased provisions made against accounts receivable, either of which could adversely affect our financial results.
The ability to maintain a DSD network depends on a number of factors, many of which are outside of our control. Some of these factors include: (i) the level of demand for the brands and products which are available in a particular distribution area; (ii) the ability to price products at levels competitive with those offered by competing producers; and (iii) the ability to deliver products in the quantity and at the time ordered by IBOs and retail customers. There can be no assurance that we will be able to mitigate the risks related to all or any of these factors in any of our current or prospective geographic areas of distribution. To the extent that any of these factors have an adverse effect on our relationships with IBOs, thus limiting maintenance and expansion of the sales market, our revenue and financial results may be adversely impacted.
Identifying new IBOs can be time-consuming and any resulting delay may be disruptive and costly to the business. There also is no assurance that we will be able to maintain current distribution relationships or establish and maintain successful relationships with IBOs in new geographic distribution areas. There is the possibility that we will have to incur significant expenses to attract and maintain IBOs in one or more geographic distribution areas. The occurrence of any of these factors could result in increased expense or a significant decrease in sales volume through the DSD network and harm our business and financial results.
A disruption in the operation of the DSD network could negatively affect our results of operations, financial condition and cash flows.
We believe that the DSD network is a significant competitive advantage. A material negative change in our relationship with the IBOs could materially and negatively affect our financial condition, results of operations, cash flows, and ability to operate and conduct our business. In addition, litigation or one or more adverse rulings by courts or regulatory or governmental bodies regarding the DSD network, including actions or decisions that could affect the independent contractor classifications of the IBOs, or an adverse judgment against us for actions taken by the IBOs could materially and negatively affect our financial condition, results of operations, cash flows, and ability to operate and conduct our business.
11
Continued success depends on the protection of our trademarks and other proprietary intellectual property rights.
We maintain numerous trademarks and other intellectual property rights, which are important to our success and competitive position, and the loss of or our inability to enforce trademark and other proprietary intellectual property rights could harm our business. We devote substantial resources to the establishment and protection of our trademarks and other proprietary intellectual property rights on a worldwide basis. Efforts to establish and protect trademarks and other proprietary intellectual property rights may not be adequate to prevent imitation of products by others or to prevent others from seeking to block sales of our products. In addition, the laws and enforcement mechanisms of some foreign countries may not allow for the protection of proprietary rights to the same extent as in the US and other countries.
Impairment in the carrying value of goodwill or other intangible assets could have an adverse impact on our financial results.
The net carrying value of goodwill represents the fair value of acquired businesses in excess of identifiable assets and liabilities, and the net carrying value of other intangibles represents the fair value of trademarks, customer relationships, route intangibles and other acquired intangibles. Pursuant to generally accepted accounting principles in the US ("GAAP"), we are required to perform impairment tests on our goodwill and indefinite-lived intangible assets annually, or at any time when events occur, which could impact the value of our reporting unit or our indefinite-lived intangibles. These values depend on a variety of factors, including the success of our business, market conditions, earnings growth and expected cash flows. Impairments to goodwill and other intangible assets may be caused by factors outside our control, such as increasing competitive pricing pressures, changes in discount rates based on changes in cost of capital or lower than expected sales and profit growth rates. In addition, if we see the need to consolidate certain brands, we could experience impairment of our trademark intangible assets. During 2017, we recognized impairment charges of $46.3 million and $58.4 million for goodwill and trademarks, respectively. Significant and unanticipated changes in our business could require additional non-cash charges for impairment in a future period which may significantly affect our financial results in the period of such charge.
A significant portion of our outstanding shares of common stock is controlled by a few individuals, and their interests may conflict with those of other shareholders.
As of December 18, 2017, Patricia A. Warehime beneficially owned in the aggregate approximately 14.5% of our outstanding common stock based upon a Schedule 13D/A filed on January 22, 2018 by Mrs. Warehime. Mrs. Warehime serves as one of our directors. As a result, Mrs. Warehime may be able to exercise significant influence over us and certain matters requiring approval of our shareholders, including the approval of significant corporate transactions, such as a merger or other sale of our company or its assets. This could limit the ability of our other shareholders to influence corporate matters and may have the effect of delaying or preventing a third party from acquiring control of our Company. In addition, Mrs. Warehime may have actual or potential interests that diverge from the interests of our other shareholders.
On December 18, 2017, the Warehime Holders entered into a voting agreement with Campbell, pursuant to which the Warehime Holders agreed, among other things, to vote the shares of Company common stock over which they have voting power in favor of the approval of the Merger Agreement and the transactions contemplated thereby, including the Merger. As of February 16, 2018, the record date for the special meeting of our shareholders, the Warehime Holders owned 12,851,757 shares, or approximately 13.1% of the shares of our common stock outstanding and entitled to vote at the special meeting.
New regulations or legislation could adversely affect our business and financial results.
Food production and marketing are highly regulated by a variety of federal, state and other governmental agencies. New or increased government regulation of the food industry, including but not limited to areas related to food safety, chemical composition, production processes, traceability, product quality, packaging, labeling, school lunch guidelines, promotions, marketing and advertising (particularly such communications that are directed toward children), product recalls, records, storage and distribution could adversely impact our results of operations by increasing production costs or restricting our methods of operation and distribution. These regulations may address food industry or societal factors, such as obesity, nutritional and environmental concerns and diet trends.
We are subject to increasing legal complexity and could be party to litigation that may adversely affect our business.
Increasing legal complexity may continue to affect our operations and results in material ways. We are or could be subject to legal proceedings that may adversely affect our business, including class actions, administrative proceedings, government investigations, employment and personal injury claims, disputes with current or former suppliers, claims by current or former IBOs, and intellectual property claims (including claims that we infringed another party’s trademarks, copyrights, or patents). Inconsistent standards imposed by governmental authorities can adversely affect our business and increase our exposure to litigation. Litigation involving the independent contractor classification of the IBOs, as well as litigation related to disclosure made by us in connection therewith, if determined adversely, could increase costs, negatively impact our business prospects and the business prospects of the IBOs and subject us to incremental liability for their actions. We are also subject to the legal and compliance risks associated with privacy,
12
data collection, protection and management, in particular as it relates to information we collect from our employees, as well as information we collect when we provide products to customers, IBOs and retailers.
We may not be able to successfully execute our international expansion strategies.
We plan to drive additional growth and profitability through international distribution channels. Consumer demand, behavior, taste and purchasing trends may differ in international markets and, as a result, sales of our products may not be successful or meet expectations, or the margins on those sales may be less than currently anticipated. We may also face difficulties integrating foreign business operations with our current sourcing, distribution, information technology systems and other operations. Any of these challenges could hinder our success in new markets or new distribution channels. There can be no assurance that we will successfully complete any planned international expansion or that any new business will be profitable or meet our expectations.
Our foreign operations pose additional risks to our business.
We operate our business and market our products internationally. Our foreign operations are subject to the risks described above, as well as risks related to fluctuations in currency values, foreign currency exchange controls, compliance with foreign laws, compliance with applicable US laws, including the Foreign Corrupt Practices Act, and other economic or political uncertainties. International sales are subject to risks related to general economic conditions, imposition of tariffs, quotas, trade barriers and other restrictions, enforcement of remedies in foreign jurisdictions and compliance with applicable foreign laws, and other economic and political uncertainties. All of these risks could result in increased costs or decreased revenues, which could adversely affect our financial results.
We may not realize the benefits that we expect from our Transformation Plan.
In April 2017, we announced the Transformation Plan, our plan to significantly improve our financial performance by focusing on the following six areas: (i) reduce direct spending and accelerate zero-based budgeting to improve indirect costs, (ii) reduce manufacturing and distribution network complexity and improve productivity, (iii) reduce business complexity through SKU rationalization and ongoing portfolio maintenance, (iv) improve trade spend productivity and effectiveness and optimize brand assortment, (v) reset working/non-working ratios and increase investment in our core branded portfolio and (vi) elevate the performance of the existing IBOs and DSD network. As a part of the plan, on June 26, 2017, our Board of Directors approved the closure of our manufacturing facility in Perry, Florida and an incremental reduction in workforce across the organization. In 2017, we have eliminated approximately 300 jobs. The full scope of the Transformation Plan and specific actions to be taken are currently being developed by senior management and our Board of Directors.
The successful design and implementation of the Transformation Plan present significant challenges, many of which are beyond our control. In addition, the Transformation Plan may not advance our business strategy as expected. Events and circumstances, such as financial or strategic difficulties, delays, and unexpected costs may occur that could result in our not realizing all or any of the anticipated benefits or our not realizing the anticipated benefits on our expected timetable. If we are unable to realize the anticipated financial performance of the Transformation Plan, our ability to fund other initiatives may be adversely affected. Any failure to implement the Transformation Plan in accordance with our expectations could adversely affect our financial condition, results of operations, and cash flows.
In addition, the complexity of the Transformation Plan requires a substantial amount of management and operational resources. Our management team must successfully implement administrative and operational changes necessary to achieve the anticipated benefits of the Transformation Plan. These and related demands on our resources may divert the organization's attention from existing core businesses, integrating financial or other systems, have adverse effects on existing business relationships with suppliers and customers, and impact employee morale. As a result, our financial condition, results of operations, or cash flows may be adversely affected.
13
Risks related to our substantial indebtedness
We have substantial debt, which could adversely affect our financial health, our ability to obtain financing in the future, react to changes in our business, and make payments on our debt.
As of December 30, 2017 we had an aggregate principal amount of $1.1 billion of outstanding debt. Our substantial debt could have important consequences to holders of our common stock, including the following:
• | Our ability to obtain additional financing for working capital, capital expenditures, acquisitions, debt service requirements, acquisitions or general corporate purposes may be impaired in the future |
• | A substantial portion of our cash flow from operations must be dedicated to the payment of principal and interest on our indebtedness, thereby reducing the funds available to us for other purposes |
• | We are exposed to the risk of increased interest rates because a substantial portion of our borrowings are at variable rates |
• | It may be more difficult for us to satisfy our obligations to our lenders, resulting in possible defaults on and acceleration of such indebtedness |
• | We may be more vulnerable to general adverse economic and industry conditions |
• | We may be at a competitive disadvantage compared to our competitors with less debt or comparable debt at more favorable interest rates and they, as a result, may be better positioned to withstand economic downturns |
• | Our ability to refinance indebtedness may be limited or the associated costs may increase |
• | Our flexibility to adjust to changing market conditions and ability to withstand competitive pressures could be limited, or we may be prevented from carrying out capital spending that is necessary or important to our growth strategy and efforts to improve operating margins or our business |
The agreements and instruments governing our debt contain restrictions and limitations that could significantly impact our ability to operate our business.
Our credit facilities contain covenants that, among other things, restrict our ability to do the following:
• | Dispose of assets |
• | Incur additional indebtedness (including guarantees of additional indebtedness) |
• | Pay dividends and make certain payments |
• | Create liens on assets |
• | Make investments (including joint ventures) |
• | Engage in mergers, consolidations or sales of all or substantially all of our assets |
• | Engage in certain transactions with affiliates |
• | Change the business conducted by us |
• | Amend specific debt agreements |
Our ability to comply with these provisions in future periods will depend on our ongoing financial and operating performance, which in turn will be subject to economic conditions and to financial, market and competitive factors, many of which are beyond our control. Our ability to comply with these provisions in future periods will also depend substantially on the pricing of our products, our success at implementing cost reduction initiatives and our ability to successfully implement our overall business strategy.
The restrictions under the terms of our credit facilities may prevent us from taking actions that we believe would be in the best interest of our business, and may make it difficult for us to successfully execute our business strategy or effectively compete with companies that are not similarly restricted. We may also incur future debt obligations that might subject us to additional restrictive covenants that could affect our financial and operational flexibility. We cannot assure you that we will be granted waivers or amendments to these agreements if for any reason we are unable to comply with these agreements or that we will be able to refinance our debt on terms acceptable to us, or at all.
Our ability to comply with the covenants and restrictions contained in our credit facilities may be affected by economic, financial and industry conditions beyond our control. The breach of any of these covenants or restrictions could result in a default under our credit facilities that would permit the applicable lenders or note holders, as the case may be, to declare all amounts outstanding thereunder to be due and payable, together with accrued and unpaid interest. In any such case, we may be unable to borrow under and may not be able to repay the amounts due under our credit facilities. This could have serious consequences to our financial condition and results of operations and could cause us to become bankrupt or insolvent.
14
Our ability to generate the significant amount of cash needed to pay interest and principal on our debt facilities and our ability to refinance all or a portion of our indebtedness or obtain additional financing depends on many factors beyond our control.
Our ability to make scheduled payments on, or to refinance our obligations under our debt will depend on our financial and operating performance. This, in turn, will be subject to prevailing economic and competitive conditions and to the financial and business factors, many of which may be beyond our control, as described under “Risk Factors-Risks Related to Our Business” above.
If our cash flow and capital resources are insufficient to fund our debt service obligations, we may be forced to reduce or delay capital expenditures, sell assets, seek to obtain additional equity capital or restructure our debt. In the future, our cash flow and capital resources may not be sufficient for payments of interest on and principal of our debt, and such alternative measures may not be successful and may not permit us to meet our scheduled debt service obligations.
We cannot be assured that we will be able to refinance any of our indebtedness or obtain additional financing, particularly because of our anticipated high levels of debt and the debt incurrence restrictions imposed by the agreements governing our debt, as well as prevailing market conditions. In the absence of such operating results and resources, we could face substantial liquidity problems and might be required to dispose of material assets or operations to meet our debt service and other obligations. Our credit facilities restrict our ability to dispose of assets and use the proceeds from any such dispositions. As a result, we cannot assure you we will be able to consummate those sales, or if we do, what the timing of the sales will be, or whether the proceeds that we realize will be adequate to meet the debt service obligations when due.
We are exposed to interest rate volatility, which could negatively impact our financial results.
We are exposed to interest rate volatility since the interest rates associated with portions of our debt are variable. While we mitigate a portion of this volatility by entering into interest rate swap agreements, those agreements could lock our interest rates above the market rates. As a result, an increase in interest rates, whether because of an increase in market interest rates or a decrease in our creditworthiness, would increase the cost of servicing our debt and could materially reduce our profitability and cash flows.
Item 1B. Unresolved Staff Comments
None.
15
Item 2. Properties
Our corporate headquarters is located in Charlotte, North Carolina. We have additional administrative offices in Hanover, Pennsylvania supporting the DSD network and in Norwich, England supporting our European operations. Our manufacturing operations are located in Charlotte, North Carolina; Hanover, Pennsylvania; Franklin, Wisconsin; Goodyear, Arizona; Columbus, Georgia; Jeffersonville, Indiana; Hyannis, Massachusetts; Ashland, Ohio; Salem, Oregon; Beloit, Wisconsin; Norwich, England; Wednesbury, England and Van Buren, Indiana. Additionally, our research and development centers are located in Hanover, Pennsylvania and Salem, Oregon.
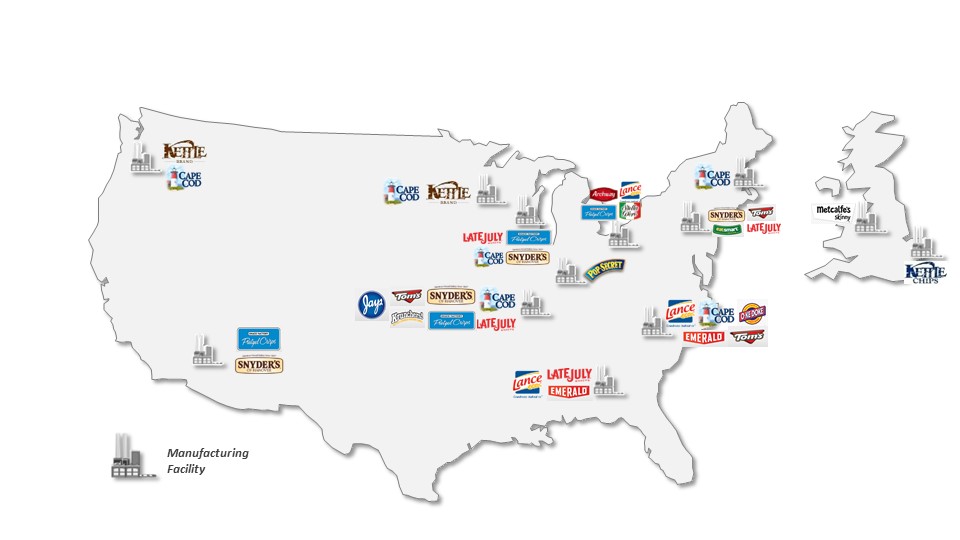
The map above illustrates some of the products manufactured at each facility.
We also lease or own over 100 warehouses as well as numerous stockrooms, sales offices and administrative offices throughout the US to support our operations and DSD network. In addition, we lease warehousing facilities in Snetterton, England.
The facilities and properties that we own, lease and operate are maintained in good condition and are believed to be suitable and adequate for our present needs. We believe that we have sufficient production capacity or the ability to increase capacity to meet anticipated demand in 2018.
Item 3. Legal Proceedings
Information regarding legal proceedings is available in Note 17, Commitments and Contingencies, to the consolidated financial statements in this report.
Item 4. Mine Safety Disclosures
Not applicable.
16
Executive Officers of the Company
Information about each of our executive officers, as defined in Rule 3b-7 of the Securities Exchange Act of 1934, as amended (the "Exchange Act"), as of February 22, 2018, is as follows:
Name | Age | Information About Officers | Hire Date | |||
Brian J. Driscoll | 59 | President and Chief Executive Officer of Snyder's-Lance, Inc. since June 2017; Interim President and Chief Executive Officer of Snyder’s-Lance, Inc. from April 2017 to June 2017; President and Chief Executive Officer of Diamond Foods, Inc. from May 2012 to February 2016; Chief Executive Officer of Hostess Brands from June 2010 to March 2012; Various senior management positions at Kraft Foods, Inc. from 2002 to June 2010, including President, Sales, Customer Service and Logistics, Kraft North America from 2007 to 2010. Mr. Driscoll has also served as a director on multiple company boards including Snyder’s-Lance, Inc., beginning in February 2016 and Diamond Foods, Inc. from May 2012 to February 2016. | 2017 | |||
Alexander W. Pease | 46 | Executive Vice President and Chief Financial Officer of Snyder’s-Lance, Inc. since November 2016; Principal of McKinsey and Company from 2015 to 2016; Senior Vice President and Chief Financial Officer of Enpro Industries from 2011 to 2015; Principal of McKinsey and Company from 2007 to 2011. | 2016 | |||
Andrea Frohning | 48 | Senior Vice President and Chief Human Resources Officer of Snyder's-Lance, Inc. since March 2016; Vice President Human Resources of Crane Co. from 2013 to 2016; Vice President Human Resources of Hubbell Electrical Systems, Hubbell Inc. from 2009 to 2013. | 2016 | |||
John T. Maples | 58 | Chief Customer Officer, Direct Sales of Snyder's-Lance, Inc. since July 2017; Vice President & General Manager, Direct Sales at Snyder’s-Lance, Inc. from January 2015 to January 2016. Senior Vice President of Sales Strategy at ConAgra Foods from June 2012 to December 2014. Chief Marketing Officer at Primo Water from March 2011 to May 2012. Various roles with PepsiCo from June 1982 to February 2011 including Senior Vice President of Sales and Business Development for PepsiCo in Wal-Mart and Sam’s Club and Vice President of Channel Sales for Quaker Oats. Mr. Maples has also served as a member of the board of directors of Delta Dental of Illinois since 2003. | 2015 | |||
Gail Sharps Myers | 48 | Senior Vice President, Chief Legal Officer, General Counsel and Secretary of Snyder's-Lance, Inc. since January 2015; Senior Vice President, Deputy General Counsel, Chief Compliance Counsel and Assistant Secretary of US Foods, Inc. from 2014 to 2015, Senior Vice President, Deputy General Counsel and Secretary of US Foods, Inc. from 2011 to 2014; Vice President Business Law and Assistant Secretary of US Foods, Inc. from 2009 to 2011. | 2015 | |||
Margaret E. Wicklund | 57 | Senior Vice President, Corporate Controller, Principal Accounting Officer and Assistant Secretary of Snyder’s-Lance, Inc. since December 2010. She has held various positions in Snyder’s-Lance, Inc. and, Lance, Inc. in her over 25 years of service to the Company. | 1992 | |||
17
PART II
Item 5. Market for Registrant’s Common Equity, Related Stockholder Matters and Issuer Purchases of Equity Securities
Market for Registrant’s Capital Stock
Our $0.83-1/3 par value Common Stock trades under the symbol "LNCE" on the NASDAQ Global Select Market. We had 4,599 shareholders of record as of February 22, 2018.
The following table sets forth the high and low intraday sale price quotations and dividend information for each interim period of the years ended December 30, 2017 and December 31, 2016:
2017 Interim Periods | High Price | Low Price | Dividend Paid | |||||||||
First quarter (13 weeks ended April 1, 2017) | $ | 40.69 | $ | 36.71 | $ | 0.16 | ||||||
Second quarter (13 weeks ended July 1, 2017) | 40.85 | 31.03 | 0.16 | |||||||||
Third quarter (13 weeks ended September 30, 2017) | 39.52 | 33.83 | 0.16 | |||||||||
Fourth quarter (13 weeks ended December 30, 2017) | 50.67 | 33.70 | 0.16 | |||||||||
2016 Interim Periods | High Price | Low Price | Dividend Paid | |||||||||
First quarter (13 weeks ended April 2, 2016) | $ | 36.20 | $ | 27.93 | $ | 0.16 | ||||||
Second quarter (13 weeks ended July 2, 2016) | 34.12 | 28.92 | 0.16 | |||||||||
Third quarter (13 weeks ended October 1, 2016) | 36.61 | 32.99 | 0.16 | |||||||||
Fourth quarter (13 weeks ended December 31, 2016) | 38.99 | 33.18 | 0.16 | |||||||||
On February 7, 2018, our Board of Directors declared a quarterly cash dividend of $0.16 per share payable on March 2, 2018 to shareholders of record on February 22, 2018. Our Board of Directors will consider the amount of future cash dividends on a quarterly basis.
We entered into a senior unsecured credit agreement as amended (the “Credit Agreement”) on December 16, 2015 with the term lenders and Bank of America, N.A., as administrative agent. The Credit Agreement restricts our payment of cash dividends and repurchases of our common stock if, after payment of any such dividends or any such repurchases of our common stock, our consolidated stockholders’ equity would be less than $500 million. As of December 30, 2017, our consolidated stockholders’ equity was $2,022.3 million and we were in compliance with this covenant.
Issuer Purchases of Equity Securities
The following table presents information with respect to repurchases of our common stock made during the fourth quarter of 2017, by us or any of our “affiliated purchasers” as defined in Rule 10b-18(a)(3) under the Exchange Act:
Period | Total Number of Shares Purchased (1) | Average Price Paid Per Share | Total Number of Shares Purchased as Part of Publicly Announced Plans or Programs | Maximum Number of Shares that May Yet Be Purchased Under the Plans or Programs (2) | |||||||||
October 1, 2017 - October 31, 2017 | 3,951 | $ | 38.81 | — | — | ||||||||
November 1, 2017 - November 30, 2017 | 66 | 35.98 | — | — | |||||||||
December 1, 2017 - December 30, 2017 | — | — | — | — | |||||||||
Total | 4,017 | $ | 38.76 | — | — | ||||||||
(1) Represents shares withheld by us pursuant to provisions in agreements with recipients of restricted stock granted under our equity compensation plans that allow us to withhold the number of shares with a fair value equal to the tax withholding due upon vesting of the restricted shares.
(2) At this time the board of directors has not authorized management to repurchase any of our common stock in the market.
18
The following table provides information concerning our outstanding equity compensation arrangements as of December 30, 2017.
Plan Category | Number of securities to be issued upon exercise of outstanding options, warrants and rights (a) | Weighted-average exercise price of outstanding options, warrants and rights (b) | Number of securities available for future issuance under equity compensation plans, excluding securities reflected in column (a) (c) | |||||||
Equity compensation plans approved by stockholders(1) | 3,238,525 | $ | 33.23 | 1,837,570 | ||||||
Equity compensation plans not approved by stockholders(2)(3) | 833,113 | 10.86 | — | |||||||
Total | 4,071,638 | $ | 28.65 | 1,837,570 | ||||||
(1) Includes the Lance, Inc. 2003 Key Employee Stock Plan, which was approved by the stockholders on April 24, 2003, the Lance, Inc. 2007 Key Employee Stock Plan, as amended, which was approved by the stockholders on May 4, 2010, the Snyder’s-Lance, Inc. 2012 Key Employee Incentive Plan, which was approved by the stockholders on May 3, 2012, and the Snyder’s-Lance, Inc. 2016 Key Employee Incentive Plan, which was approved by the stockholders on May 4, 2016.
(2) Includes the Snyder’s of Hanover, Inc. Non-qualified Stock Option Plan, as amended on September 30, 2010. Outstanding options under the plan were assumed by the Company in connection with the merger.
(3) Includes the Diamond Foods, Inc. 2005 Equity Incentive Plan which was approved by Diamond stockholders on March 10, 2005 and the 2015 Equity Incentive Plan which was approved by Diamond stockholders on January 13, 2015. Outstanding options under the plan were assumed by the Company in connection with the acquisition.
19
Return to Shareholders Performance Graph
This graph and table compares the yearly percentage change in the cumulative total shareholder return on the Company’s common stock against the cumulative total shareholder return or the Russell 2000 Index and a group of the Company’s peers for the five-year period commencing on the last trading day of the Company’s fiscal year 2012 and ending on the Company’s last trading day of fiscal 2017. The graph and table assumes that $100 was invested on December 29, 2012 in the Company’s common stock, in the Russell 2000 Index and in a portfolio of companies in the peer group. The value in each consecutive year includes share price appreciation and assumes that dividends paid were reinvested.
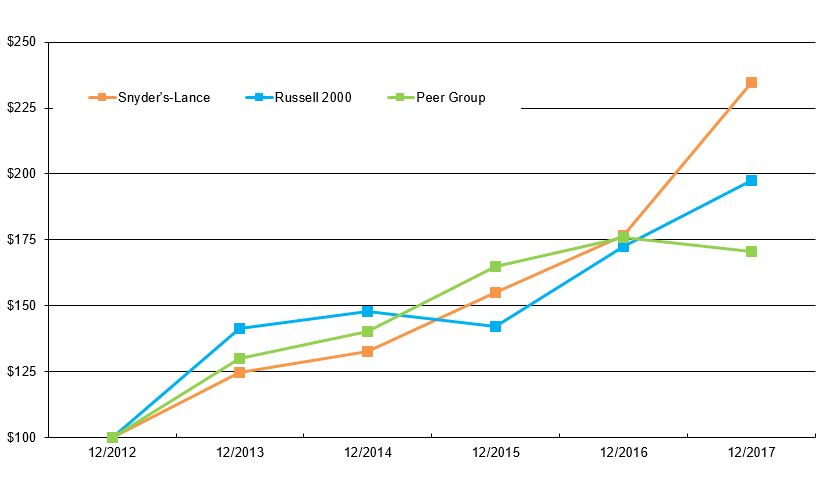
12/2012 | 12/2013 | 12/2014 | 12/2015 | 12/2016 | 12/2017 | |||||||||||||||||||
Snyder's-Lance, Inc. | $ | 100 | $ | 125 | $ | 133 | $ | 155 | $ | 177 | $ | 235 | ||||||||||||
Russell 2000 Index | 100 | 141 | 148 | 142 | 172 | 198 | ||||||||||||||||||
Peer Group | 100 | 130 | 140 | 165 | 176 | 170 | ||||||||||||||||||
The peer group consists of Campbell Soup Co., ConAgra Foods, Inc., Flowers Foods, Inc. General Mills, Inc., J&J Snack Foods Corp., Kellogg Co., Mondelez International, Inc., The Hain Celestial Group, Inc. and the J.M Smucker Company.
20
Item 6. Selected Financial Data
The following table sets forth selected historical financial data for the five-year period ended December 30, 2017. The selected financial data set forth below should be read in conjunction with “Management’s Discussion and Analysis of Financial Condition and Results of Operations” and the audited financial statements. The prior year amounts have been reclassified as necessary for consistent presentation.
Results of Operations (in thousands): | 2017 | 2016 | 2015 | 2014 | 2013 | |||||||||||||||
Net revenue (1) (2) (3) | $ | 2,226,837 | $ | 2,109,227 | $ | 1,656,399 | $ | 1,620,920 | $ | 1,504,332 | ||||||||||
Cost of sales | 1,426,666 | 1,345,437 | 1,077,110 | 1,042,458 | 963,073 | |||||||||||||||
Gross profit | 800,171 | 763,790 | 579,289 | 578,462 | 541,259 | |||||||||||||||
Gross margin | 35.9 | % | 36.2 | % | 35.0 | % | 35.7 | % | 36.0 | % | ||||||||||
Income before income taxes (4) (5) (6) (7) (8) | 1,263 | 67,123 | 79,603 | 91,508 | 87,900 | |||||||||||||||
Income from continuing operations, net of tax (9) | 147,407 | 41,803 | 50,718 | 59,217 | 55,603 | |||||||||||||||
Income/(loss) from discontinued operations, net of income tax (10) (11) (12) | 1,936 | (27,100 | ) | — | 133,316 | 23,481 | ||||||||||||||
Net income attributable to Snyder’s-Lance, Inc. | $ | 148,492 | $ | 14,885 | $ | 50,685 | $ | 192,591 | $ | 78,720 | ||||||||||
Average Number of Common Shares Outstanding (in thousands): | ||||||||||||||||||||
Basic | 96,594 | 91,873 | 70,487 | 69,966 | 69,102 | |||||||||||||||
Diluted | 97,467 | 92,891 | 71,142 | 70,656 | 69,877 | |||||||||||||||
Per Share of Common Stock: | ||||||||||||||||||||
Basic earnings per share from continuing operations | $ | 1.51 | $ | 0.46 | $ | 0.72 | $ | 0.84 | $ | 0.80 | ||||||||||
Basic earnings/(loss) per share from discontinued operations | 0.02 | (0.29 | ) | — | 1.90 | 0.33 | ||||||||||||||
Total basic earnings per share | $ | 1.53 | $ | 0.17 | $ | 0.72 | $ | 2.74 | $ | 1.13 | ||||||||||
Diluted earnings per share from continuing operations | $ | 1.50 | $ | 0.45 | $ | 0.71 | $ | 0.84 | $ | 0.79 | ||||||||||
Diluted earnings/(loss) per share from discontinued operations | 0.02 | (0.29 | ) | — | 1.88 | 0.33 | ||||||||||||||
Total diluted earnings per share | $ | 1.52 | $ | 0.16 | $ | 0.71 | $ | 2.72 | $ | 1.12 | ||||||||||
Dividends declared per common share | $ | 0.64 | $ | 0.64 | $ | 0.64 | $ | 0.64 | $ | 0.64 | ||||||||||
Financial Status at Year-end (in thousands): | ||||||||||||||||||||
Total assets (13) (14) | $ | 3,618,337 | $ | 3,834,076 | $ | 1,810,704 | $ | 1,849,056 | $ | 1,752,758 | ||||||||||
Long-term debt, net of current portion (13) | $ | 1,025,533 | $ | 1,245,959 | $ | 372,301 | $ | 437,233 | $ | 478,671 | ||||||||||
Total debt (13) | $ | 1,074,533 | $ | 1,294,959 | $ | 380,842 | $ | 445,794 | $ | 495,962 | ||||||||||
21
Footnotes:
(1) | 2016 net revenue included $443 million of incremental net revenue attributable to the acquisition of Diamond Foods. |
(2) | 2015 net revenue increased compared to 2014, in part due to the full year impact of the acquisition of Baptista's Bakery and consolidation of Late July, which occurred in June 2014 and October 2014, respectively. The increase was partially offset by approximately $30 million of net revenue generated during 2014 as a result of the fifty-third week. |
(3) | 2014 net revenue increased compared to 2013 approximately $30 million, as a result of the fifty-third week and $44 million as a result of the acquisition of Baptista's in June 2014 and the consolidation of the results of Late July subsequent to our additional investment in October 2014. |
(4) | 2017 pretax income was impacted by approximately $104.7 million of goodwill and intangible asset impairments, approximately $30 million of costs associated with the Transformation plan, and approximately $9 million of costs related to the transfer of production of the Emerald products. |
(5) | 2016 pretax income was impacted by approximately $66 million of transaction and integration related expenses due to the acquisition of Diamond Foods, approximately $11 million of additional cost of sales due to the step-up of inventory from the acquisition of Diamond Foods, approximately $5 million for the loss on prepayment of debt, and approximately $4 million in asset impairments primarily related to the transfer of production location for certain products. |
(6) | 2015 pretax income was impacted by approximately $8 million in transaction-related fees associated with the pending acquisition of Diamond Foods, approximately $12 million in asset impairment charges primarily related to the transfer of production location for certain products and approximately $6 million in settlements of certain litigation. |
(7) | 2014 pretax income was impacted by a gain on the revaluation of our prior equity investment in Late July of approximately $17 million, impairment charges of approximately $13 million and approximately $4 million of expense associated with our margin improvement and restructuring plan. |
(8) | 2013 pretax income was impacted by certain self-funded medical claims that resulted in approximately $5 million in incremental expenses as well as impairment charges of approximately $2 million associated with one of our trademarks. |
(9) | 2017 income from continuing operations, net of income tax included a $162.4 million income tax benefit for the provisional tax impacts related to a one-time transition tax and the revaluation of the deferred tax balances as a result of the Tax Act enacted in December 2017. |
(10) | 2016 loss from discontinued operations, net of income tax, included a $33 million pretax loss on the sale of Diamond of California. |
(11) | 2014 income from discontinued operations, net of income tax, included a $223 million pretax gain on the sale of Private Brands. |
(12) | 2013 income from discontinued operations, net of income tax is the operating activities of our Private Brands, which were sold in 2014. |
(13) | 2016 total assets includes $2.2 billion acquired from Diamond Foods, and total debt increased due to the issuance of $1.1 billion of debt in conjunction with the Diamond Foods acquisition. |
(14) | 2014 total assets increased from 2013 primarily due to the acquisition of Baptista's and Late July, partially offset by the sale of Private Brands. |
22
Item 7. Management’s Discussion and Analysis of Financial Condition and Results of Operations
The following Management's Discussion and Analysis of Financial Condition and Results of Operations ("MD&A") is intended to help the reader understand Snyder's-Lance, Inc., our operations and our present business environment. MD&A is provided as a supplement to, and should be read in conjunction with, our consolidated financial statements and accompanying notes to the financial statements. This discussion contains forward-looking statements that involve risks and uncertainties. The forward-looking statements are not historical facts, but rather are based on current expectations, estimates, assumptions and projections about our industry, business and future financial results. Our actual results could differ materially from the results contemplated by these forward-looking statements due to a number of factors, including those discussed under Part I, Item 1A—Risk Factors and other sections in this Annual Report on Form 10-K.
MD&A is based upon our consolidated financial statements, which have been prepared in accordance with GAAP. The preparation of these financial statements requires us to make estimates and judgments about future events that affect the reported amounts of assets, liabilities, revenues and expenses, and related disclosure of contingent assets and liabilities. Future events and their effects cannot be determined with absolute certainty. Therefore, management’s determination of estimates and judgments about the carrying values of assets and liabilities requires the exercise of judgment in the selection and application of assumptions based on various factors, including historical experience, current and expected economic conditions and other factors believed to be reasonable under the circumstances. We routinely evaluate our estimates, including those related to sales and promotional allowances, customer returns, allowances for doubtful accounts, inventory valuations, useful lives of fixed assets and related impairment, long-term investments, hedge transactions, goodwill and intangible asset valuations and impairments, incentive compensation, income taxes, self-insurance, contingencies and litigation. Actual results may differ from these estimates under different assumptions or conditions.
Executive Summary
2017 was a year of transition and transformation within our Company. We began the year with a disappointing first quarter caused by the convergence of category softness, lower net price realization, unfavorable mix, cost headwinds and certain execution lapses, which stalled our earnings momentum, pressured our full year outlook and exposed underlying cost inefficiencies. The results of the first quarter and the issues identified, resulted in our Board of Directors and senior management team conducting a comprehensive review of our Company's operations. This comprehensive review had the goal of significantly improving our financial performance to deliver greater value to our shareholders. As a result of this review, we initiated the Transformation Plan focused on six key areas:
• | SG&A Expense Efficiency. Reduce direct spending and accelerate zero-based budgeting to improve indirect costs. |
• | Manufacturing and Supply Chain Productivity. Reduce manufacturing and distribution network complexity and improve productivity. |
• | Product and Portfolio Optimization. Reduce business complexity through SKU rationalization and ongoing portfolio maintenance. |
• | Price Realization. Improve trade spend productivity and effectiveness and optimize brand assortment. |
• | Marketing Investment Optimization. Reset working/non-working ratios and increase investment in our core branded portfolio. |
• | Channel Execution Excellence. Elevate the performance of the existing IBOs and DSD network. |
We are anticipating that the Transformation Plan will result in 14% operating profit margin (on an adjusted basis) and an incremental operating income of $175 million improvement to our operating income by 2020. During 2017, the initial actions taken under the plan included the closure of our Perry, Florida manufacturing facility, reductions in workforce across the organization, and initial steps in the process of SKU rationalization. In 2018, we expect to take additional steps to achieve all of the key areas outlined above.
Agreement and Plan of Merger
On December 18, 2017, we entered into the Merger Agreement with Campbell and Merger Sub, pursuant to which Merger Sub will merge with and into the Company, with the Company continuing as the surviving corporation and as a wholly-owned subsidiary of Campbell. The parties anticipate that the Merger will close late in the first quarter of calendar year 2018.
Subject to the terms and conditions of the Merger Agreement, at the Effective Time, each share of our common stock, $0.83-1/3 par value, outstanding immediately prior to the Effective Time will be converted into the right to receive an amount in cash equal to $50.00 per share, without interest and subject to any required tax withholding.
23
The Merger Agreement contains various representations, warranties and covenants by the Company and Campbell. The Merger Agreement requires the Company to call and hold a special shareholder meeting, which is scheduled for March 23, 2018, and requires our Board of Directors to recommend that the Company’s shareholders approve the Merger Agreement and the Merger, except our Board of Directors may, in certain circumstances, change its recommendation, subject to complying with specified notice and other conditions set forth in the Merger Agreement. Additionally, the Company agreed that, among other things, it will not (i) solicit, initiate, facilitate or encourage the submission of any Acquisition Proposal or any proposal or offer that may reasonably be expected to lead to an Acquisition Proposal or (ii) enter into, continue or otherwise participate in discussions or negotiations with, or disclose non-public information to, any third party relating to any Acquisition Proposal or any proposal or offer that may reasonably be expected to lead to an Acquisition Proposal. Subject to the terms of the Merger Agreement, prior to the approval of the Merger Agreement by the Company’s shareholders, the Company may, however, engage in negotiations or discussions with and provide non-public information to a third party that has made an unsolicited, bona fide, written Acquisition Proposal that our Board of Directors determines in good faith, after consultation with its outside legal counsel and financial advisor, constitutes, or could reasonably be expected to result in, a Superior Proposal and that failure to take such actions would be reasonably likely to be inconsistent with its fiduciary duties under applicable law.
Prior to the approval of the Merger Agreement by the Company’s shareholders, our Board of Directors may, upon receipt of a Superior Proposal, and in certain other circumstances set forth in the Merger Agreement, change its recommendation that the Company’s shareholders approve the Merger Agreement and the Merger, subject to complying with specified notice and other conditions set forth in the Merger Agreement, including, if requested by Campbell, negotiating in good faith with Campbell to make such revisions to the Merger Agreement in response to such Superior Proposal. If our Board of Directors changes its recommendation that the Company’s shareholders approve the Merger Agreement and the Merger, Campbell may terminate the Merger Agreement. In addition, prior to obtaining such shareholder approval, the Company may terminate the Merger Agreement to enter into a definitive agreement providing for a Superior Proposal, subject to payment of the termination fee described below and only following compliance with specified notice and other conditions set forth in the Merger Agreement, including giving Campbell the opportunity to propose changes to the Merger Agreement so that any such proposal would cease to constitute a Superior Proposal.
The Merger Agreement requires the Company and Campbell to use reasonable best efforts to take all actions necessary under applicable law to consummate the transactions contemplated by the Merger Agreement. The Merger Agreement contains certain termination rights for each of the Company and Campbell, including the right of each party to terminate the Merger Agreement if the Merger has not been consummated by the “end date” of September 18, 2018.
The Merger Agreement provides for the payment by the Company to Campbell of a termination fee in the amount of $149 million in the case of a termination of the Merger Agreement under certain circumstances described in the Merger Agreement, including if: (i) (a) the Merger Agreement is terminated by Campbell or the Company because the Merger is not consummated by the end date or the Company’s shareholders do not approve the Merger Agreement, or by Campbell because of a breach of a representation, warranty or covenant of the Company that would cause the related closing condition to be incapable of being satisfied or cured by the end date or, if curable, is not cured by the Company by the earlier of 30 days after receipt of written notice of such breach and three business days prior to the end date, (b) any person publicly discloses a bona fide Acquisition Proposal, which Acquisition Proposal had not been publicly withdrawn prior to the special meeting of the Company’s shareholders, and (c) within 12 months after such termination the Company enters into a definitive agreement with respect to any Acquisition Proposal, (ii) our Board of Directors changes its recommendation or (iii) the Company enters into definitive transaction documentation providing for a Superior Proposal.
Campbell will be required to pay the Company a termination fee of $198.6 million in the event the Merger Agreement is terminated by the Company, subject to certain limitations set forth in the Merger Agreement, if (i) there has been a breach of a representation, warranty or covenant of Campbell or Merger Sub that would cause the related closing condition to be incapable of being satisfied or cured by the end date or, if curable, is not cured by Campbell or Merger Sub by the earlier of 30 days after receipt of written notice of such breach and three business days prior to the end date, or (ii) the conditions to Campbell and Merger Sub’s obligations to consummate the closing have been satisfied or waived (other than those conditions that by their terms are to be satisfied by actions taken at the closing; provided that such conditions are then capable of being satisfied), Campbell has failed to consummate the Merger within two business days of the date the closing should have occurred and the Company has notified Campbell in writing that all of the conditions to closing have been satisfied (or waived) and it intends to terminate the Merger Agreement if Campbell and Merger Sub fail to consummate the transactions contemplated thereby within two business days.
24
The Merger Agreement has been approved by the boards of directors of each of the Company and Campbell. The obligations of the parties to consummate the Merger are subject to customary closing conditions, including, among others: approval of the Merger Agreement and Merger by holders of 75% of the outstanding shares of the our common stock; the accuracy of the representations and warranties of each party (subject to certain exceptions as set forth in the Merger Agreement); each of the parties having performed in all material respects all of their respective obligations under the Merger Agreement; and the absence of any injunctions or other legal restraints.
On December 18, 2017, the Warehime Holders entered into a voting agreement with Campbell, pursuant to which the Warehime Holders agreed, among other things, to vote the shares of Company common stock over which they have voting power in favor of the approval of the Merger Agreement and the transactions contemplated thereby, including the Merger. As of February 16, 2018, the record date for the special meeting of our shareholders, the Warehime Holders owned 12,851,757 shares, or approximately 13.1% of the shares of our common stock outstanding and entitled to vote at the special meeting.
Certain terms of the Merger Agreement and Voting Agreement are summarized, and the Merger Agreement and Voting Agreement have been filed as exhibits to the Current Report on Form 8-K filed by the Company on January 18, 2018.
See “Item 1A. Risk Factors - Risks Relating to our Merger with Campbell” for a description of certain risks related to the proposed Merger.
2017 Performance
Overall, net revenue increased in 2017 compared to 2016 due to the incremental revenue associated with the contribution of the legacy Diamond Foods brands as we did not own Diamond Foods for the first nine weeks of 2016 and growth in all our legacy Snyder's-Lance core brands. Our 2017 results were also impacted by the following:
• | Transaction and integration related expenses - We incurred $3.0 million in transaction and integration related expenses in selling, general and administrative expense related to the acquisition of Diamond Foods during 2017, compared to $66.3 million in 2016. |
• | Goodwill and tradename impairments - We recognized $104.7 million in non-cash impairment charges to our U.K. goodwill and certain tradenames. |
• | Transformation Plan charges and expenses - We incurred $29.6 million in charges related to the Transformation Plan. |
• | Emerald move and required packaging changes - We incurred $9.1 million related to relocating production from Stockton, California, and associated professional fees due to our divestiture of the Diamond of California business. In addition, we incurred higher than normal manufacturing costs due to the inefficiencies caused by the ramping up of Emerald production capacity in our new Charlotte, North Carolina facility. |
• | Merger Agreement with Campbell - We incurred $2.1 million in charges related to the anticipated acquisition by Campbell. |
• | Service and distribution costs - Our service and distribution costs were higher than the prior year due to carrier capacity issues in the trucking industry and higher fuel costs as compared to 2016. These issues resulted in service and distribution costs being 0.9% of net revenue higher than the prior year. |
• | Incentive compensation expense - As a result of our performance, our annual cash incentive award achieved lower attainment levels in the year, resulting in $15 million lower incentive compensation expense as compared to the prior year. |
• | US Tax Reform - As a result of the 2017 Tax Act, we recorded a one-time benefit in income taxes of $162.4 million primarily from the revaluation of our deferred tax balances. |
25
In spite of the operational challenges in 2017, our Core brands had strong performance in the marketplace during the year. A discussion of the trends for each of our Core brands is included below:
• | Our Snyder's of Hanover® products improved its substantial lead over our closest competitor in the category during the year. The pretzel category improved slightly throughout the year and our growth outpaced the category. |
• | Our Lance® branded sandwich crackers also gained market share throughout 2017 and increased its substantial market share leadership position. The sandwich crackers category as a whole was flat during the year as our growth was offset by declines from other competitors. |
• | Combined, our Kettle Brand® and Cape Cod® branded chips hold a dominant share of the kettle chips market. Both brands grew in terms of dollars and market share in a category that declined during the year. |
• | During 2017, Snack Factory® Pretzel Crisps® became the market leader in deli snacks. In a growing category, our products outpaced the category to take the number one position. |
• | Our Pop Secret® branded microwave popcorn faced a challenging year in a declining category. While we maintained our position as the second largest microwave popcorn brand, our brands lost market share in the current year. |
• | Our KETTLE Chips® in the U.K. faced strong competitive and economic headwinds during the year as consumers preference shifted towards private label products. As a result, our branded products declined in market share. |
• | Our operational challenges with our Emerald® branded products lead to our inability to fulfill certain customer orders during the second half of the year. As a result, we lost sales and market share in a flat category. |
• | The double-digit growth in our Late July® products drove growth in the category. Our products gained market share as our growth outpaced the category growth during the year. |
26
Results of Operations
Year Ended December 30, 2017 Compared to Year Ended December 31, 2016
(in millions) | 2017 | 2016 | Favorable/ (Unfavorable) Variance | ||||||||||||||||||
Net revenue | $ | 2,226.8 | 100.0 | % | $ | 2,109.2 | 100.0 | % | $ | 117.6 | 5.6 | % | |||||||||
Cost of sales | 1,426.6 | 64.1 | % | 1,345.4 | 63.8 | % | (81.2 | ) | (6.0 | )% | |||||||||||
Gross profit | 800.2 | 35.9 | % | 763.8 | 36.2 | % | 36.4 | 4.8 | % | ||||||||||||
Selling, general and administrative expenses | 643.9 | 28.9 | % | 594.0 | 28.2 | % | (49.9 | ) | (8.4 | )% | |||||||||||
Transaction and integration related expenses | 3.0 | 0.1 | % | 66.3 | 3.1 | % | 63.3 | 95.5 | % | ||||||||||||
Impairment charges | 114.8 | 5.2 | % | 4.5 | 0.2 | % | (110.3 | ) | (2,451.1 | )% | |||||||||||
Other operating (income), net | — | — | % | (5.6 | ) | (0.3 | )% | (5.6 | ) | 100.0 | % | ||||||||||
Operating income | 38.5 | 1.7 | % | 104.6 | 5.0 | % | (66.1 | ) | (63.2 | )% | |||||||||||
Other (income)/expense, net | (1.5 | ) | (0.1 | )% | 0.1 | — | % | 1.6 | nm | ||||||||||||
Income before interest and income taxes | 40.0 | 1.8 | % | 104.5 | 5.0 | % | (64.5 | ) | (61.7 | )% | |||||||||||
Loss on early extinguishment of debt | — | — | % | 4.7 | 0.2 | % | 4.7 | 100.0 | % | ||||||||||||
Interest expense, net | 38.8 | 1.8 | % | 32.7 | 1.6 | % | (6.1 | ) | (18.7 | )% | |||||||||||
Income tax (benefit)/expense | (146.2 | ) | (6.6 | )% | 25.3 | 1.2 | % | 171.5 | nm | ||||||||||||
Income from continuing operations | 147.4 | 6.6 | % | 41.8 | 2.0 | % | 105.6 | 252.6 | % | ||||||||||||
Income/(loss) from discontinued operations, net of income tax | 1.9 | 0.1 | % | (27.1 | ) | (1.3 | )% | 29.0 | nm | ||||||||||||
Net income | $ | 149.3 | 6.7 | % | $ | 14.7 | 0.7 | % | $ | 134.6 | 915.6 | % | |||||||||
nm = not meaningful
Net Revenue
Net revenue by product category was as follows:
(in millions) | 2017 | 2016 | Favorable/ (Unfavorable) Variance | ||||||||||||||||||
Branded | |||||||||||||||||||||
Core brand | $ | 1,613.7 | 72.5 | % | $ | 1,478.6 | 70.1 | % | $ | 135.1 | 9.1 | % | |||||||||
Allied brand | 163.4 | 7.3 | % | 159.7 | 7.6 | % | $ | 3.7 | 2.3 | % | |||||||||||
Total Branded | 1,777.1 | 79.8 | % | 1,638.3 | 77.7 | % | $ | 138.8 | 8.5 | % | |||||||||||
Partner brand | 291.6 | 13.1 | % | 300.4 | 14.2 | % | (8.8 | ) | (2.9 | )% | |||||||||||
Other | 158.1 | 7.1 | % | 170.5 | 8.1 | % | (12.4 | ) | (7.3 | )% | |||||||||||
Net revenue | $ | 2,226.8 | 100.0 | % | $ | 2,109.2 | 100.0 | % | $ | 117.6 | 5.6 | % | |||||||||
Net revenue increased $117.6 million, or 5.6%, in 2017, compared to 2016, primarily due to increased revenue associated with the contribution of Diamond Foods. Approximately 3% of the revenue increase relates to the incremental revenue from the acquisition of Diamond Foods given that we did not own Diamond Foods for the first nine weeks of 2016.
Our core brand net revenue increased $135.1 million, or 9.1%, compared to 2016. The incremental revenue from the first nine weeks of 2017 from the acquired Diamond Foods core brands accounted approximately 5% of the increase. The legacy Snyder's-Lance brands growth was driven by the following:
• | Snack Factory® and Late July® brands have experienced significant growth and strong market share gains in the current year due to expanded distribution and increased volumes across our sales channels. |
• | Snyder's of Hanover® and Cape Cod® brands were both up mid-single digits, driven by new product introductions and increased distribution. |
27
• | Lance® branded products are up mid-single digits with volume increases more than offsetting slight distribution losses during the year. |
For the legacy Diamond Foods brands, all brands were up year-over-year compared to 2016, due to the incremental revenue from the first nine weeks of the year. However, the incremental revenue was partially offset by decreases in revenue in comparable periods due to the following:
• | Pop Secret® branded products experienced volume declines due changing consumer preferences and less effective promotional spending which more than offset slight distribution gains during the year. |
• | Emerald® branded product revenue was negatively impacted, particularly in the second half of the year, as we were unable to meet customer demand due to the transition of production to our Charlotte, NC facility. These production shortfalls were substantially resolved by the end of the year. |
• | Kettle Brand® chips in the US and KETTLE Chips® in the U.K. had slight volume declines as a result of category softness and competitive challenges. |
Allied branded products net revenue increased $3.7 million, or 2.3%, compared to 2016. This increase is primarily due to our acquisition of the remaining 74% interest in Metcalfe on September 1, 2016. The increase from this incremental revenue was partially offset by declines across many of our Allied brands.
Partner brand net revenue decreased $8.8 million, or 2.9%, compared to 2016, primarily due to volume declines for certain partner brand products. Other net revenue decreased $12.4 million, or 7.3%, compared to 2016, due primarily to the planned exit of certain contract manufacturing agreements and the loss of certain contract manufactured products. We expect this trend to continue in the near term as our strategic priorities are focused on our branded products.
Gross Profit
Gross profit increased $36.4 million, but decreased 0.3% as a percentage of net revenue compared to 2016. The dollar increase in gross profit was due to increased sales volume primarily due to the acquisition of Diamond Foods and volume increases in legacy Snyder's-Lance branded revenue. 2017 gross profit margin was negatively impacted by $7.2 million of expense related to the Transformation Plan, and $6.7 million of discrete expenses related to relocating production from Stockton, California, due to our divestiture of the Diamond of California business, and higher than normal manufacturing costs due to the inefficiencies caused by the ramping up of Emerald production capacity in our new Charlotte, North Carolina facility. In addition, the increase in promotional spending as a percentage of revenue, resulted in approximately 1.5% lower gross profit margin for 2017 compared to 2016. These challenges were partially offset by manufacturing efficiencies across our production facilities and scrap reductions. Gross profit in 2016 was negatively impacted by an $11.3 million inventory step-up recognized in the prior year on inventory acquired in the acquisition of Diamond Foods.
Selling, General and Administrative Expenses
Selling, general and administrative expenses increased $49.9 million in 2017, compared to 2016, and increased 0.7% as a percentage of net revenue. The increase in selling, general and administrative expenses was primarily due to additional expenses attributable to Diamond Foods and increases variable costs related to volume increases in legacy Snyder's-Lance branded revenue. In addition, in 2017, we incurred $13.5 million of expense related to the Transformation Plan, $2.3 million of expense related to costs associated with the Stockton TSA and associated professional fees due to our divestiture of the Diamond of California business, and $2.1 million in charges related to the anticipated acquisition by Campbell. In addition, we incurred $7.1 million of expenses related to the retirement of our former president and chief executive officer. This amount includes $3.7 million of retirement agreement expenses and $3.4 million of non-cash stock-based compensation expenses which resulted from the modification of certain non-vested awards previously granted to him. Selling, general and administrative expenses as a percentage of revenue were flat excluding the items above due to higher distribution expenses from carrier shortages and rising fuel costs, offset by lower incentive compensation expenses due to lower attainment for our performance-based awards and lower salary costs due to the reductions in workforce as a part of the Transformation Plan.
Transaction and Integration Related Expenses
We recognized $3.0 million in Diamond Foods transaction and integration related expenses during 2017, compared to $66.3 million in 2016. The costs incurred in 2017 included legal and other professional fees and idle facility lease costs. The 2016 expenses in continuing operations included $17.5 million of severance and retention benefits and $16.4 million of accelerated stock-based compensation, which related primarily to change in control provisions and severance agreements with Diamond Foods personnel. The remaining 2016 costs include investment banking fees as well as other professional fees and legal costs associated with the acquisition and integration of Diamond Foods.
28
Impairment Charges
We recognized $114.8 million in impairment charges during 2017, compared to $4.5 million during 2016. Our 2017 charges include $46.3 million related to goodwill in our European reporting unit and $58.4 million related to certain of our trademarks. For additional information, see “Critical Accounting Estimates” in this discussion and analysis. The total impairment charge also includes $8.9 million of asset impairment expense as a result of our Transformation Plan. The remaining $1.2 million of impairment charges in 2017 are related to manufacturing assets that no longer had business use.
During 2016, we recorded impairment of $2.3 million for certain machinery and equipment we retained after the sale of Diamond of California, but no longer had the ability to use. We also incurred impairment charges of $1.4 million related to the discontinuation of manufacturing certain products. In addition, in 2016, we recorded $0.8 million of impairments related to route businesses.
Other Operating Income, Net
Our other operating income netted to zero in 2017 primarily due to net gains on route businesses of $2.3 million offset by a loss of sale of property and equipment of $1.4 million and an early termination of a capital lease fee of $0.8 million. Net gains on the sale of route businesses in 2017 consisted of $9.4 million in gains, partially offset by $7.1 million in losses. The majority of the route business sales in 2017 were due to route reengineering projects that were initiated in order to maximize the efficiency of route territories for the IBOs.
We recognized $5.6 million of other operating income, net in 2016 primarily due to a $4.3 million insurance settlement related to a business interruption claim that resulted from an unexpected production outage in the fourth quarter of 2015. In addition, during 2016, we also recognized $1.3 million in net gains on the sale of route businesses. Net gains on the sale of route businesses in 2016 consisted of $5.5 million in gains, partially offset by $4.2 million in losses. The majority of the route business sales in 2016 were due to route reengineering projects that were initiated in order to maximize the efficiency of route territories for the IBOs.
Other (Income)/Expense, Net
We recognized other income of $1.5 million in 2017 primarily due to the proceeds from a class action insurance settlement of $0.8 million and $0.6 million of net equity income from our interests in Yellow Chips Holding B.V. and Natural Food Works Group, LLC.
Interest Expense, Net
Interest expense increased $6.1 million during 2017 compared to 2016. The increase in net interest expense was the result of additional debt obtained to finance the acquisition of Diamond Foods and somewhat higher interest rates on outstanding debt.
Income Tax (Benefit) / Expense
The effective income tax rate was a benefit of 11,567.5% in 2017, compared to expense of 37.7% in 2016. In 2017, the effective income tax rate was favorably impacted by the enactment of the Tax Act, which included numerous changes to many aspects of U.S. corporate income taxation by, among other things, lowering the corporate income tax rate from 35% to 21%, implementing a territorial tax system and imposing a one-time transition tax on deemed repatriated earning of foreign subsidiaries. As a result, we have recognized a net tax benefit of $162.4 million for the provisional tax impacts related to the one-time transition tax and the revaluation of deferred tax balances for the year ended December 30, 2017. In 2016, the effective income tax rate is in excess of the statutory rate primarily due to non-deductible Diamond Foods related transaction costs in 2016.
Income/(Loss) from Discontinued Operations, Net of Income Tax
Income from discontinued operations, net of income tax, included in 2017 was primarily a result of the pretax out-of-period adjustment of $2.6 million for the walnut price liability during the year.
Loss from discontinued operations, net of income tax, included in 2016 was primarily due to the loss on the sale of Diamond of California, partially offset by income generated by discontinued operations prior to the sale.
29
Year Ended December 31, 2016 Compared to Year Ended January 2, 2016
(in millions) | 2016 | 2015 | Favorable/ (Unfavorable) Variance | ||||||||||||||||||
Net revenue | $ | 2,109.2 | 100.0 | % | $ | 1,656.4 | 100.0 | % | $ | 452.8 | 27.3 | % | |||||||||
Cost of sales | 1,345.4 | 63.8 | % | 1,077.1 | 65.0 | % | (268.3 | ) | (24.9 | )% | |||||||||||
Gross profit | 763.8 | 36.2 | % | 579.3 | 35.0 | % | 184.5 | 31.8 | % | ||||||||||||
Selling, general and administrative expenses | 594.0 | 28.2 | % | 464.5 | 28.0 | % | (129.5 | ) | (27.9 | )% | |||||||||||
Transaction and integration related expenses | 66.3 | 3.1 | % | 7.7 | 0.5 | % | (58.6 | ) | (761.0 | )% | |||||||||||
Settlements of certain litigation | — | — | % | 5.7 | 0.3 | % | 5.7 | 100.0 | % | ||||||||||||
Impairment charges | 4.5 | 0.2 | % | 12.0 | 0.7 | % | 7.5 | 62.5 | % | ||||||||||||
Other operating income, net | (5.6 | ) | (0.3 | )% | (1.2 | ) | — | % | 4.4 | 366.7 | % | ||||||||||
Operating income | 104.6 | 5.0 | % | 90.6 | 5.5 | % | 14.0 | 15.5 | % | ||||||||||||
Other expense, net | 0.1 | — | % | 0.1 | — | % | — | — | % | ||||||||||||
Income before interest and income taxes | 104.5 | 5.0 | % | 90.5 | 5.5 | % | 14.0 | 15.5 | % | ||||||||||||
Loss on early extinguishment of debt | 4.7 | 0.2 | % | — | — | % | (4.7 | ) | nm | ||||||||||||
Interest expense, net | 32.7 | 1.6 | % | 10.9 | 0.7 | % | (21.8 | ) | (200.0 | )% | |||||||||||
Income tax expense | 25.3 | 1.2 | % | 28.9 | 1.7 | % | 3.6 | 12.5 | % | ||||||||||||
Income from continuing operations | 41.8 | 2.0 | % | 50.7 | 3.1 | % | (8.9 | ) | (17.6 | )% | |||||||||||
Loss from discontinued operations, net of income tax | (27.1 | ) | (1.3 | )% | — | — | % | (27.1 | ) | nm | |||||||||||
Net income | $ | 14.7 | 0.7 | % | $ | 50.7 | 3.1 | % | $ | (36.0 | ) | (71.0 | )% | ||||||||
nm = not meaningful
Net Revenue
Net revenue by product category was as follows:
(in millions) | 2016 | 2015 | Favorable/ (Unfavorable) Variance | ||||||||||||||||||
Branded | |||||||||||||||||||||
Core brand | $ | 1,478.6 | 70.1 | % | $ | 1,032.5 | 62.3 | % | $ | 446.1 | 43.2 | % | |||||||||
Allied brand | 159.7 | 7.6 | % | 157.7 | 9.6 | % | 2.0 | 1.3 | % | ||||||||||||
Total Branded | 1,638.3 | 77.7 | % | 1,190.2 | 71.9 | % | 448.1 | 37.6 | % | ||||||||||||
Partner brand | 300.4 | 14.2 | % | 300.5 | 18.1 | % | (0.1 | ) | — | % | |||||||||||
Other | 170.5 | 8.1 | % | 165.7 | 10.0 | % | 4.8 | 2.9 | % | ||||||||||||
Net revenue | $ | 2,109.2 | 100.0 | % | $ | 1,656.4 | 100.0 | % | $ | 452.8 | 27.3 | % | |||||||||
Net revenue increased $452.8 million, or 27.3%, in 2016 compared to 2015, primarily due to the increased revenue associated with the contribution of Diamond Foods. Excluding the revenue increase from Diamond Foods, overall net revenue increased 0.6%, as increased Total Branded revenue was partially offset by a decrease in the Other revenue category.
30
The following table reflects revenue by product category adjusted for incremental revenue attributable to Diamond Foods and compares net revenue excluding the Diamond Foods contribution for 2016 to net revenue for 2015:
(in millions) | 2016 Net Revenue | Incremental Diamond Foods Net Revenue | 2016 Net Revenue excluding Diamond Foods (1) | 2015 Net Revenue | Favorable/ (Unfavorable) Variance | ||||||||||||||||||
Branded | |||||||||||||||||||||||
Core brand | $ | 1,478.6 | $ | 430.2 | $ | 1,048.4 | $ | 1,032.5 | $ | 15.9 | 1.5 | % | |||||||||||
Allied brand | 159.7 | — | 159.7 | 157.7 | $ | 2.0 | 1.3 | % | |||||||||||||||
Total Branded | $ | 1,638.3 | $ | 430.2 | $ | 1,208.1 | $ | 1,190.2 | $ | 17.9 | 1.5 | % | |||||||||||
Partner brand | 300.4 | — | 300.4 | 300.5 | (0.1 | ) | — | % | |||||||||||||||
Other | 170.5 | 13.3 | 157.2 | 165.7 | (8.5 | ) | (5.1 | )% | |||||||||||||||
Net revenue | $ | 2,109.2 | $ | 443.5 | $ | 1,665.7 | $ | 1,656.4 | $ | 9.3 | 0.6 | % | |||||||||||
(1) The non-GAAP measure and related comparisons in the table above should be considered in addition to, not as a substitute for, our net revenue disclosure, as well as other measures of financial performance reported in accordance with GAAP, and may not be comparable to similarly titled measures used by other companies. Our management believes the presentation of 2016 Net Revenue excluding Diamond Foods is useful for providing increased transparency and assisting investors in understanding our ongoing operating performance.
Core brand net revenue increased $446.1 million, or 43.2%, compared to 2015, primarily due to incremental revenue from Diamond Foods. Core brand net revenue, excluding Diamond Foods, was up $15.9 million, or 1.5% compared to 2015. Core branded volume increased by approximately 6% and allied branded volume decreased by approximately 1% in 2016. All of our Core brands increased market share in the IRI covered channels. The volume increase was partially offset by lower net price realization due to additional investments in promotional spending necessary to drive sales in a highly competitive environment. Net revenue from our legacy Core brands increased by more than 2% as 3-5% growth in Lance®, Snack Factory® Pretzel Crisps®, and Cape Cod®, and greater than 10% growth in Late July® was partially offset by a slight decline in net revenue from Snyder's of Hanover®. However, Snyder's of Hanover® net revenue showed marked improvement in the second half of the year due to the brand renovation efforts undertaken in the first half of the year, including the Pretzels Baby® marketing and advertising campaign.
Allied brand net revenue increased 2.0 million, or 1.3% compared to 2015, primarily due to our acquisition of the remaining 74% interest of the Metcalfe business on September 1, 2016.
Partner brand net revenue declined slightly in 2016 compared to 2015 as volume declines for certain Partner brand products were substantially offset by volume increases in other Partner brands.
Other net revenue, excluding Diamond Foods, decreased $8.5 million, or 5.1%, due primarily to the planned exit of certain contract manufacturing agreements, as well as increased Branded production at certain manufacturing facilities which limited the capacity for contract manufacturing.
Gross Profit
Gross profit increased $184.5 million, and 1.2% as a percentage of net revenue compared to 2015. The dollar increase in gross margin was due to increased sales volume primarily due to the acquisition of Diamond Foods. The increase in gross profit as a percentage of net revenue in 2016 was due to lower input costs, increased productivity at our manufacturing facilities, and a higher mix of Branded sales, which typically have a higher gross margin than Partner brand or Other sales. These increases were partially offset by increased investment in promotional spending compared to 2015, to support the growth of our Core brands, as well as the inventory step-up of $11.3 million required for purchase accounting associated with the Diamond Foods acquisition. The increase in promotional spending as a percentage of revenue, excluding Diamond Foods, resulted in approximately $27.0 million of additional promotional expense compared to 2015, or approximately 1.3% lower gross profit as a percentage of revenue for 2016 compared to 2015.
Selling, General and Administrative Expenses
Selling, general and administrative expenses increased $129.5 million in 2016, compared to 2015, and increased 0.2% as a percentage of net revenue. The increase in selling, general and administrative expenses was primarily due to additional expenses attributable to Diamond Foods. The increase in selling, general and administrative expenses as a percentage of revenue was due to increased investments in marketing and advertising to support our Branded products, as well as higher incentive compensation expense due to improved operating performance. These increases were largely offset by synergies realized in conjunction with the integration of Diamond Foods as well as other margin enhancement initiatives.
31
Transaction-related Expenses
We recognized $66.3 million in Diamond Foods transaction and integration related expenses during 2016. These expenses in continuing operations included $17.5 million of severance and retention benefits and $16.4 million of accelerated stock-based compensation, which related primarily to change in control provisions and severance agreements with Diamond Foods personnel. The remaining costs include investment banking fees as well as other professional fees and legal costs associated with the acquisition and integration of Diamond Foods. We recognized $7.7 million of Diamond Foods related transaction expenses during 2015 for professional fees and legal costs associated with the acquisition.
Settlement of Certain Litigation
During 2015, we recognized 5.7 million in expense associated with settlements reached in our "all-natural" and IBO class action lawsuits. There were no significant litigation settlements in 2016.
Impairment Charges
Impairment charges of $4.5 million were recorded during 2016, compared to $12.0 million during 2015. During 2016, we sold the Diamond of California business which included certain tangible assets (see Note 4 to the consolidated financial statements included in Item 8 for further information). In connection with this transaction, we recorded impairment of $2.3 million for certain machinery and equipment we retained, but no longer have the ability to use. We also incurred impairment charges of $1.4 million related to the discontinuation of manufacturing certain products. During 2015, we made the decision to move the production of certain products and provide additional packaging alternatives to improve operational efficiency, which resulted in fixed asset impairment charges of $11.5 million in 2015. In addition, in 2016, we recorded $0.8 million of impairments related to route businesses compared to $0.5 million in 2015.
Other Operating Income, Net
We recognized other operating income of $5.6 million in 2016 primarily due to a $4.3 million insurance settlement related to a business interruption claim that resulted from an unexpected production outage in the fourth quarter of 2015. In addition, during 2016, we also recognized $1.3 million in net gains on the sale of route businesses. Net gains on the sale of route businesses in 2016 consisted of $5.5 million in gains, partially offset by $4.2 million in losses. The majority of the route business sales in 2016 were due to route reengineering projects that were initiated in order to maximize the efficiency of route territories for the IBOs.
Other operating income in 2015 of $1.3 million primarily consisted of $1.9 million in net gains on the sale of route businesses, partially offset by loss on sale of fixed assets. For 2015, net gains on the sale of route businesses consisted of $3.3 million in gains, partially offset by $1.4 million in losses. The majority of the net gains on the sale of route business during 2015 were due to the decision to sell certain route businesses that were previously Company-owned as well as route reengineering projects.
Loss on Early Extinguishment of Debt
In February of 2016, using available borrowings from our existing credit facilities, we repaid our $100 million private placement senior notes, which were due in June 2017. The total repayment was approximately $106 million, and resulted in a loss on early extinguishment of $4.7 million.
Interest Expense, Net
Interest expense increased $21.8 million during 2016, compared to 2015. The increase in net interest expense was the result of additional debt obtained to finance the acquisition of Diamond Foods.
Income Tax Expense
The effective income tax rate increased to 37.7% in 2016 from 36.3% in 2015. The increase in the effective income tax rate in 2016 was primarily due to non-deductible Diamond Foods related transaction costs in 2016.
Loss from Discontinued Operations, Net of Income Tax
Loss from discontinued operations, net of income tax, included in 2016 was primarily due to the loss on the sale of Diamond of California, partially offset by income generated by discontinued operations prior to the sale. See Note 4 to the consolidated financial statements included in Item 8 for additional information related to this sale. There were no discontinued operations in 2015.
32
Liquidity and Capital Resources
Liquidity
Liquidity represents our ability to generate sufficient cash flows from operating activities to meet our obligations as well as our ability to obtain appropriate financing. Therefore, liquidity should not be considered separately from capital resources that consist primarily of current and potentially available funds for use in achieving our objectives. Currently, our liquidity needs arise primarily from acquisitions, working capital requirements, capital expenditures for fixed assets and dividends. We believe we have sufficient liquidity available to enable us to meet these demands throughout the next twelve months as well as over the long-term.
Cash Flows
The following table sets forth a summary of our cash flows for each of the past three years:
(in thousands) | 2017 | 2016 | 2015 | |||||||||
Net cash provided by/(used in): | ||||||||||||
Operating activities | $ | 196,859 | $ | 267,369 | $ | 146,154 | ||||||
Investing activities | 50,477 | (1,117,113 | ) | (44,026 | ) | |||||||
Financing activities | (264,946 | ) | 846,838 | (98,396 | ) | |||||||
Effect of exchange rate changes on cash | 636 | (1,042 | ) | — | ||||||||
Net (decrease)/increase | $ | (16,974 | ) | $ | (3,948 | ) | $ | 3,732 | ||||
We adopted ASU No. 2016-09, Improvements to Employee Share-Based Payment Accounting in the first quarter of 2017. As a result, excess tax benefits for share-based payments, which were previously presented as a financing cash flow, are now reflected in operating cash flows. We elected to adopt this provision of the accounting standard prospectively, which resulted in income tax benefit of $6.9 million included in operating activities in 2017.
Additionally, we early adopted ASU No. 2016-15, Classification of Certain Cash Receipts and Cash Payments and ASU No. 2016-18, Restricted Cash in the first quarter of 2017. These amendments are required to be adopted retrospectively. The impact of adopting ASU No. 2016-15 was a reclassification of $6.2 million cash outflows from operating activities to financing activities for the penalty recognized on early extinguishment of our private placement senior notes during 2016. The adoption of ASU No. 2016-18 resulted in reclassifications of $0.3 million cash inflows from investing activities to operating activities for each of the years 2017 and 2016.
Operating Cash Flows
Cash provided by operating activities decreased $70.5 million in 2017, compared to 2016. In 2017, there were certain negative working capital trends including increased inventory for promotional events and a decrease in accrued incentive compensation, which was partially offset by increased accounts payable. The majority of the positive working capital in 2016 was associated with a reduction in Diamond Foods related inventory, the increase in the payable to growers, as well as an increase in accounts payable.
Cash flow provided by operating activities increased $121.2 million in 2016, compared to 2015. This includes the aforementioned $6.2 million reclassification from cash outflows from operating activities to repayments of long-term debt within financing activities. Operating cash flows increased approximately $42 million, due to an increase in the payable to growers balance from the time of the Diamond Foods acquisition to the time of the divestiture of Diamond of California. We also paid considerably less income taxes in 2016, because we used net operating losses acquired in the Diamond Foods acquisition to offset most current taxes payable.
Investing Cash Flows
Cash provided by investing activities totaled $50.5 million in 2017, compared to cash used in investing activities of $1,117.1 million in 2016. The increase in cash provided by investing activities was primarily driven by the 2016 acquisition of Diamond Foods, which accounted for approximately $1.0 billion of the cash used in 2016. In addition, we had proceeds from the sale of Diamond of California in 2017, which accounted for $119.7 million of the increase.
Capital expenditures for fixed assets, principally manufacturing equipment, decreased to $69.4 million in 2017 from $73.3 million in 2016. Purchases of route businesses, net of sales, resulted in cash inflows of $2.7 million in 2017, compared to net cash outflows of $2.6 million in 2016. The majority of the net cash outflows generated from the purchase of routes, net of proceeds from route sales, in 2016 were due to restructuring certain routes at the end of 2016, which we had not sold as of the end of 2016.
Cash used by investing activities totaled $1,117.1 million in 2016, compared with $44.0 million in 2015. This includes a reclassification of $0.3 million cash inflows from investing activities to operating activities in 2016 due to the adoption of ASU
33
No. 2016-18, Restricted Cash as discussed in Note 3, New Accounting Standards. The increase in cash used in investing activities was primarily driven by the acquisition of Diamond Foods, which accounted for approximately $1.0 billion of the increase.
Capital expenditures for fixed assets, principally manufacturing equipment, increased from $51.5 million in 2015 to $73.3 million in 2016, primarily due to additional capital expenditures necessary to support the acquired Diamond Foods business, of which approximately $0.5 million related to discontinued operations. Purchases of route businesses, net of sales, resulted in cash outflows of $2.6 million in 2016, compared to net cash inflows of $4.8 million in 2015. The majority of the net cash outflows generated from the purchase of routes, net of proceeds from route sales, in 2016 were due to restructuring certain routes at the end of 2016, which we had not sold as of the end of 2016.
Financing Cash Flows
Net cash used in financing activities of $264.9 million in 2017, was primarily attributable to repayments of long-term debt and net repayments on the revolving credit facility of $221.1 million and dividends paid of $62.0 million. These cash outflows were partially offset by net proceeds of $28.0 million from the issuance of common stock upon the exercise of employee stock options.
Net cash provided by financing activities of $846.8 million in 2016, was principally due to proceeds from the issuance of long-term debt of $1.13 billion that were used primarily to fund the acquisition of Diamond Foods. This significant cash inflow was partially offset by dividends paid of $57.6 million and repayments of long-term debt of $444.8 million. Included in the 2016 repayments of long-term debt are $6.2 million of cash outflows reclassified from operating cash flows, due to the adoption of ASU No. 2016-15, Classification of Certain Cash Receipts and Cash Payments as discussed in Note 3, New Accounting Standards. In addition we received net proceeds from our revolving credit facility of $227.0 million. This compared to cash used in financing activities of $98.4 million in 2015, which was principally due to dividends paid of $45.2 million, as well as debt repayments of $57.5 million.
On February 7, 2018, our Board of Directors declared a quarterly cash dividend of $0.16 per share payable on March 2, 2018 to shareholders of record on February 22, 2018.
Debt
Unused and available borrowings were $320.0 million under our existing credit facilities at December 30, 2017, as compared to $148.0 million at December 31, 2016. Under certain circumstances and subject to certain conditions, we have the option to increase available credit under the Credit Agreement by up to $200 million during the life of the facility. We also maintain standby letters of credit in connection with our self-insurance reserves for casualty claims. The total amount of these letters of credit was $9.0 million as of December 30, 2017.
In February of 2016, using available borrowings from our existing credit facilities and cash on hand, we repaid our $100 million private placement senior notes which were due in June 2017. The total repayment was approximately $106 million, and resulted in a loss on early extinguishment of approximately $4.7 million.
Credit Agreement
In conjunction with our acquisition of Diamond Foods, we entered into a senior unsecured credit agreement with the term lenders party thereto (the "Term Lenders") and Bank of America, N.A., as administrative agent ("Credit Agreement"). Under the Credit Agreement, the Term Lenders provided (i) senior unsecured term loans in an original aggregate principal amount of $830 million maturing five years after the funding date (the “Senior Five Year Term Loans”) and (ii) senior unsecured term loans in an original aggregate principal amount of $300 million maturing ten years after the funding date (the “Senior Ten Year Term Loans”). The $1.13 billion in proceeds from the Credit Agreement were used to finance, in part, the cash component of the acquisition consideration, to repay indebtedness of Diamond Foods and Snyder's-Lance, and to pay certain fees and expenses incurred in connection with the acquisition.
Loans outstanding under the Credit Agreement bear interest, at our option, either at (i) a Eurodollar rate plus an applicable margin specified in the Credit Agreement or (ii) a base rate plus an applicable margin specified in the Credit Agreement. The applicable margin added to the Eurodollar rate or base rate, as the case may be, is subject to adjustment after the end of each fiscal quarter based on changes in the Company’s adjusted total net debt to earnings before interest, taxes, depreciation and amortization ("EBITDA") ratio.
34
The outstanding principal amount of the Senior Five Year Term Loans is payable in equal quarterly installments of $10.4 million on the last business day of each quarter. These payments began in the second quarter of 2016 and continue through December 2020. The remaining unamortized balance is payable in February 2021. The outstanding principal amount of the Senior Ten Year Term Loans is payable in quarterly principal installments of $15.0 million beginning in the second quarter of 2021 and continuing through December 2025. The remaining unamortized balance is payable in February 2026. The Credit Agreement also contains optional prepayment provisions.
Our obligations under the Amended and Restated Credit Agreement are guaranteed by all of our existing and future direct and indirect wholly-owned domestic subsidiaries other than any such subsidiaries that, taken together, do not represent more than 10% of the total domestic assets or domestic revenues of the Company and its wholly-owned domestic subsidiaries. The Amended and Restated Credit Agreement contains customary representations, warranties and covenants. The financial covenants pursuant to the Amended and Restated Credit Agreement included a maximum total debt to EBITDA ratio, as defined in the Amended and Restated Credit Agreement ("Original EBITDA Covenant Ratio"). On May 8, 2017, we amended our Amended and Restated Credit Agreement to extend the maximum total debt to EBITDA ratio covenant ("May 2017 Amended EBITDA Covenant Ratio"). Such EBITDA ratios were as follows:
Original EBITDA Covenant Ratio | May 2017 Amended EBITDA Covenant Ratio | |||||
Second and Third Quarters 2016 | 4.75 | N/A | ||||
Fourth Quarter 2016 and First Quarter 2017 | 4.25 | N/A | ||||
Second Quarter 2017 | 4.00 | 4.25 | ||||
Third Quarter 2017 | 3.75 | 4.25 | ||||
Fourth Quarter 2017 and First Quarter 2018 | 3.50 | 4.25 | ||||
Second Quarter 2018 | 3.50 | 4.00 | ||||
Third Quarter 2018 | 3.50 | 3.75 | ||||
Fourth Quarter 2018 and Thereafter to Maturity | 3.50 | 3.50 | ||||
In addition to the EBITDA ratio, the financial covenants also include a minimum interest coverage ratio of 2.50 to 1.00. We are currently in compliance and expect to remain in compliance with this covenant. Other covenants include, but are not limited to, limitations on: (i) liens, (ii) dispositions of assets, (iii) mergers and consolidations, (iv) loans and investments, (v) subsidiary indebtedness, (vi) transactions with affiliates and (vii) certain dividends and distributions. The Credit Agreement contains customary events of default, including a cross default provision and change of control provisions. If an event of default occurs and is continuing, we may be required to repay all amounts outstanding under the Credit Agreement.
Total interest expense under all credit agreements for 2017, 2016 and 2015 was $39.3 million, $32.9 million, and $11.1 million, respectively.
Contractual Obligations
We lease certain facilities and equipment under contracts classified as operating leases. Total rental expense, excluding discontinued operations, was $42.7 million, $37.6 million and $27.2 million in 2017, 2016 and 2015, respectively.
In order to mitigate the risks of volatility in commodity markets to which we are exposed, we have entered into forward purchase agreements with certain suppliers based on market prices, forward price projections and expected usage levels. Purchase commitments for certain ingredients, packaging materials and energy totaled $226.3 million and $157.2 million as of December 30, 2017 and December 31, 2016, respectively. In addition to these commitments, we have contracts for certain ingredients and packaging materials where we have secured a fixed price but do not have a minimum purchase quantity. We generally contract from approximately three months to twelve months in advance for certain major ingredients and packaging. We also have a licensing contract which totaled $9.6 million as of December 31, 2017, and continues through 2020.
We have contracts to receive services from syndicated market data providers through 2023. Our commitment for these services ranges from $4.6 million to $5.3 million per year, throughout the life of the contracts and totals $27.0 million as of December 30, 2017.
35
Contractual obligations as of December 30, 2017 were:
(in thousands) | Payments Due by Period | |||||||||||||||||||
Total | 2018 | 2019-2020 | 2021-2022 | Thereafter | ||||||||||||||||
Purchase commitments | $ | 262,988 | $ | 235,758 | $ | 15,264 | $ | 9,496 | $ | 2,470 | ||||||||||
Debt, including interest payable (1) | 1,225,029 | 84,169 | 366,582 | 527,821 | 246,457 | |||||||||||||||
Capital lease, including interest | 915 | 671 | 244 | — | — | |||||||||||||||
Operating lease obligations | 106,654 | 22,374 | 33,426 | 17,924 | 32,930 | |||||||||||||||
Accrued long-term incentive plan | 3,783 | 1,300 | 1,424 | 1,059 | — | |||||||||||||||
Unrecognized tax benefits (2) | 4,094 | — | — | — | — | |||||||||||||||
Other liabilities (3) | 23,378 | — | — | — | — | |||||||||||||||
Total contractual obligations | $ | 1,626,841 | $ | 344,272 | $ | 416,940 | $ | 556,300 | $ | 281,857 | ||||||||||
(1) Variable interest will be paid in future periods based on the outstanding balance at that time.
(2) Unrecognized tax benefits relate to uncertain tax positions recorded under accounting guidance that we have adopted and include associated interest and penalties. As we are not able to reasonably estimate the timing of the payments or the amount by which the liability will increase or decrease over time, the related balances have not been reflected in the "Payments Due by Period" section of the table.
(3) Amounts represent future cash payments to satisfy certain noncurrent liabilities recorded on our Consolidated Balance Sheets, including the short-term portion of these long-term liabilities. Included in these noncurrent liabilities on our Consolidated Balance Sheets as of December 30, 2017 were $18.4 million in accrued insurance liabilities and $5.0 million in other liabilities. As the specific payment dates for these liabilities is unknown, the related balances have not been reflected in the "Payments Due by Period" section of the table.
Off-Balance Sheet Arrangements
We do not have any off-balance sheet arrangements that have, or are reasonably likely to have, a current or future material effect on our financial condition, results of operations, liquidity or cash flows.
We currently provide a partial guarantee for loans made to IBOs by certain third-party financial institutions for the purchase of route businesses. The outstanding aggregate balance on these loans was approximately $177.2 million as of December 30, 2017 compared to approximately $154.1 million as of December 31, 2016. The $23.1 million increase in the guarantee was primarily due to new IBO loans as a result of zone restructuring and sale of additional routes. The annual maximum amount of future payments we could be required to make under the guarantees equates to 25% of the outstanding loan balance on the first day of each calendar year plus 25% of the amount of any new loans issued during such calendar year. These loans are collateralized by the route businesses for which the loans are made. Accordingly, we have the ability to recover substantially all of the outstanding loan value upon default, and our liability associated with this guarantee is not material.
Critical Accounting Estimates
Preparing the consolidated financial statements requires management to make estimates and assumptions that affect the reported amounts of assets, liabilities, revenue and expenses. We believe the following estimates and assumptions to be critical accounting estimates. These estimates and assumptions may be material due to the levels of subjectivity and judgment necessary to account for highly uncertain matters or the susceptibility of such matters to change, and may have a material impact on our financial condition or operating performance. Actual results may differ from these estimates under different assumptions or conditions.
Revenue Recognition
We recognize revenue when title and risk of loss passes to our customers. Allowances for sales returns, stale products, promotions and discounts are recorded as reductions of revenue in the consolidated financial statements. The timing of revenue recognition varies based on the types of products sold and the distribution method.
Revenue for products sold to IBOs in the DSD network is recognized when the IBO purchases the inventory from our warehouses or the products are shipped to the stockroom. Revenue for products sold to retail customers through routes operated by our associates is recognized when the product is delivered to the customer.
Revenue for products shipped directly to customers from our warehouses is recognized based on the shipping terms listed on the shipping documentation. Products shipped with terms FOB shipping point are recognized as revenue at the time the product leaves our warehouses. Products shipped with terms FOB destination are recognized as revenue based on the anticipated receipt date by the customer.
36
We allow certain customers to return products under agreed upon circumstances. We record a returns allowance for damaged products and other products not sold by the expiration date on the product label. This allowance is estimated based on a percentage of historical sales returns and current market information.
We record certain reductions to revenue for promotional allowances. There are several different types of promotional allowances such as off-invoice allowances, rebates and shelf space allowances. An off-invoice allowance is a reduction to the sales price that is directly deducted from the invoice amount. We record the amount of the deduction as a reduction to revenue when the transaction occurs. Rebates are offered to retail customers based on the quantity of product purchased over a period of time. Based on the nature of these allowances, the exact amount of the rebate is not known at the time the product is sold to the customer. An estimate of the expected rebate amount is recorded as a reduction to revenue at the time of the sale and a corresponding accrued liability is recorded. The accrued liability is monitored throughout the time period covered by the promotion, and is based on historical information and the progress of the customer against the target amount. We also record certain allowances for coupon redemptions, scan-back promotions and other promotional activities as a reduction to revenue. The accrued liabilities for these allowances are monitored throughout the time period covered by the coupon or promotion.
Shelf space allowances are capitalized and amortized over the lesser of twelve months or the life of the agreement and recorded as a reduction to revenue. Capitalized shelf space allowances are evaluated for impairment on an ongoing basis.
Total allowances for sales returns, rebates, coupons, scan-backs and other promotional activities recorded in the Consolidated Balance Sheets was $43.8 million and $39.8 million as of December 30, 2017 and December 31, 2016.
As further discussed in Note 3, we have adopted ASC 606, Revenue from Contracts with Customers, on December 31, 2017, the first day of our fiscal 2018. See Note 3 for additional information.
Allowance for Doubtful Accounts
The determination of the allowance for doubtful accounts is based on management’s estimate of uncollectible accounts receivable. We record a general reserve based on analysis of historical data and aging of accounts receivable. In addition, management records specific reserves for receivable balances that are considered at higher risk due to known facts regarding the customer. The assumptions for this determination are reviewed quarterly to ensure that business conditions or other circumstances are consistent with the assumptions. The allowance for doubtful accounts was $2.6 million and $1.3 million as of December 30, 2017 and December 31, 2016, respectively.
Self-Insurance Reserves
We maintain reserves for the self-funded portions of employee medical insurance benefits. Our portion of employee medical claims is limited to $0.4 million per participant annually by stop-loss insurance coverage. The accrual for incurred but not reported medical insurance claims was $4.2 million and $3.9 million in 2017 and 2016, respectively.
We maintain self-insurance reserves for workers’ compensation and auto liability for individual losses up to the deductibles which are currently $0.8 million per individual loss for workers' compensation, $0.5 million for auto liability per accident and $0.3 million for auto physical damage per accident. In addition, certain general and product liability claims are self-funded for individual losses up to the $0.8 million insurance deductible. Claims in excess of the deductible are fully insured up to $100 million per occurrence and in the aggregate. We evaluate input from a third-party actuary in the estimation of the casualty insurance obligation on an annual basis. In determining the ultimate loss and reserve requirements, we use various actuarial assumptions, including compensation trends, health care cost trends and discount rates. In 2017, we used a discount rate of 2.0%, the same rate used in 2016, based on treasury rates over the estimated future payout period.
We also use historical information for claims frequency and severity in order to establish loss development factors. For 2017 and 2016, we had accrued liabilities related to the retained risks of $18.4 million and $17.3 million, respectively, included in the accruals for casualty insurance claims in our Consolidated Balance Sheets. The liabilities related to our casualty insurance claims were partially offset by estimated reimbursements for amounts in excess of our deductibles associated with these claims of $4.9 million and $4.6 million for 2017 and 2016, respectively, which are included in other noncurrent assets in our Consolidated Balance Sheets.
Impairment Analysis of Goodwill and Intangible Assets
Goodwill is tested for impairment on an annual basis, and between annual tests if indicators of potential impairment exist, for each identified reporting unit using a fair-value-based approach. Consistent with the prior year analysis, we have two reporting units, North America and Europe.
The annual impairment analysis of goodwill requires us to project future financial performance, including revenue and profit growth, fixed asset and working capital investments, income tax rates and our weighted average cost of capital. These projections rely upon historical performance, anticipated market conditions and forward-looking business plans.
37
As a result of the decrease in actual and forecasted net revenue and operating income in our European reporting unit, as well as the narrow difference between estimated fair value and carrying value as of our 2016 analysis, we performed an interim impairment analysis on the goodwill of the European reporting unit as of September 30, 2017. The impairment analysis of goodwill was performed using a discounted cash flow model and assumed a combined average annual revenue growth of approximately 1.4% during the valuation period. We also assumed a 1.5% terminal growth rate for the reporting period. This compares to a combined average annual revenue growth of approximately 3.1% and a terminal growth rate of 3.0% used in the impairment analysis as of December 31, 2016. We use a combination of internal and external data to develop the weighted average cost of capital, which was 7.5% for Europe. This assumption remained unchanged from the previous analysis. Significant investments in fixed assets and working capital to support the assumed revenue growth are estimated and factored into the analysis. If the assumed revenue growth is not achieved, anticipated investments in fixed assets and working capital could be reduced. At September 30, 2017, the goodwill impairment analysis resulted in impairment indicated for our European reporting unit. As described in Note 3, we adopted ASU 2017-04 in the current year. As such, we calculated the impairment as the excess fair value over carrying value of the reporting unit. We recognized a non-cash impairment charge of $46.3 million as of September 30, 2017.
For the year end European impairment analysis of goodwill, we used a discounted cash flow model, as of December 30, 2017, and assumed a combined average annual revenue growth rate of approximately 1.7%. The increase of 0.3% from the September 30, 2017 analysis is attributable to a slight increase in anticipated inflation in the European market. We assumed a terminal growth rate of 1.5%, which is consistent with the previous analysis. We use a combination of internal and external data to develop the weighted average cost of capital, which was 8.0% for the European reporting unit, which is a 0.5% increase from the September 30, 2017 analysis. The increase is attributable to an increase in the currency risk premium for the U.K. As of December 30, 2017, the goodwill impairment analysis resulted in our European reporting unit having a fair value less than 15% higher than the carrying value. We performed sensitivity analysis on our weighted average cost of capital and we determined that a 50 basis point increase in the weighted average cost of capital would indicate additional impairment of approximately $6 million. A 50 basis point decrease in the terminal growth rate used for the European reporting unit would not have resulted in the implied fair value being less than the carrying value.
We performed our annual analysis for the goodwill associated with the North American reporting unit as of December 30, 2017. We used a discounted cash flow model and assumed a combined average annual revenue growth rate of approximately 2.1%, which is a decrease of 1.0% from the prior year analysis. We assumed a terminal growth rate of 2.0%, which also represents a decrease of 1.0% from the prior year analysis. We use a combination of internal and external data to develop the weighted average cost of capital, which was 7.0% for the North American reporting unit, consistent with the prior year analysis. As of December 30, 2017, the goodwill impairment analysis resulted in our North American reporting unit having a fair value substantially in excess of its carrying value. We performed sensitivity analysis on our weighted average cost of capital and we determined that a 50 basis point increase in the weighted average cost of capital would not have resulted in our North American reporting units' implied fair value being less than the carrying value. Additionally, a 50 basis point decrease in the terminal growth rate used for the North American reporting unit would also not have resulted in the implied fair value being less than the carrying value.
Indefinite-lived intangible assets are also tested for impairment on an annual basis, and between tests if indicators of potential impairment exist. Our trademarks are valued using the relief-from-royalty method under the income approach, which requires us to estimate unobservable factors such as a royalty rate and discount rate and identify relevant projected revenue. As of December 31, 2016, we identified $563.6 million of trademarks which had a fair value which was reasonably close to the carrying value, of which $550.7 million related to trademarks acquired as a part of the acquisition of Diamond Foods during the first quarter of 2016. As a result of the decrease in current year net sales and the impact on future projections in our Pop Secret, Emerald, and KETTLE Chips (U.K.) branded products, as well as the narrow difference between estimated fair value and carrying value as of our annual test, we performed an interim impairment analysis of those trademarks as of September 30, 2017. The tables below compare the assumptions used in the third quarter’s analysis to the last annual analysis.
Assumptions as of the third quarter and last annual analysis:
38
September 30, 2017 | December 31, 2016 | |||||||||||||||||
Emerald® | Pop Secret® | KETTLE® Chips (U.K.) | Emerald® | Pop Secret® | KETTLE® Chips (U.K.) | |||||||||||||
Annual revenue growth during valuation period | 1.1 | % | (2.0 | )% | 1.2 | % | 1.9 | % | 0.7 | % | 2.8 | % | ||||||
Terminal growth rate | 1.0 | % | 1.0 | % | 1.5 | % | 2.0 | % | 1.0 | % | 2.0 | % | ||||||
WACC | 7.0 | % | 7.0 | % | 7.5 | % | 7.0 | % | 7.0 | % | 7.5 | % | ||||||
Royalty rate | 1.5 | % | 7.0 | % | 6.0 | % | 1.0 | % | 8.0 | % | 6.0 | % | ||||||
We calculated the impairment as the excess fair value over carrying value of each trademark. We recognized a non-cash impairment charge of $58.4 million as of September 30, 2017 for Pop Secret and KETTLE Chips (U.K.). As a result of this interim analysis, no impairment of the Emerald trademark was recognized.
For our indefinite-lived intangible assets annual impairment analysis, we valued our trademarks using the relief-from-royalty method under the income approach, which requires us to estimate unobservable factors such as a royalty rate and discount rate and identify relevant projected revenue. As of December 30, 2017 we identified $160.2 million of trademarks which had a fair value which exceeds the carrying value by less than 15%. This includes our KETTLE Chips (U.K.) and Pop Secret tradenames. Any adverse changes in the use of these trademarks or the sales volume of the associated products could result in an impairment charge in the future. The difference between the fair value and carrying value of our Emerald tradename is greater than 15% as of December 30, 2017.
Our route intangible assets are valued by comparing the current fair market value for the route assets to the associated carrying value. The fair market value is computed using the route sales average for each route or group of routes multiplied by the market multiple for the area in which the route is located. As a result of the analysis, we recognized no route intangible asset impairments in 2017 and recognized impairment charges of $0.8 million and $0.5 million in 2016 and 2015, respectively. Many of our route territories have fair values that approximate carrying value. Any economic declines or other adverse changes such as decreased demand for our products in those areas could result in future impairment charges.
Our definite-lived intangible assets, primarily customer and contractual relationships and patents, are tested for impairment if events or changes in circumstances indicate that it is more likely than not that fair value is less than carrying value. No event-driven impairment assessments were deemed necessary for 2017, 2016 or 2015.
Route Intangible Purchase and Sale Transactions
We purchase and sell routes as a part of the DSD network. Routes subject to purchase and sale transactions represent integrated sets of inputs, activities and processes that are capable of being conducted and managed by IBOs for the purpose of providing a return directly to the IBOs. However, they do not meet the definition of a business for accounting purposes in accordance with ASU 2017-01, Clarifying the Definition of a Business which we adopted in the fourth quarter of 2017 as discussed in Note 3. Upon acquisition of a route, we allocate the entire purchase price to an indefinite-lived route intangible, representing the perpetual and exclusive distribution right in the route (territory). We recognize a gain or a loss on the sale of a route upon completion of the sales transaction and signing of the relevant documents. Gain or loss on sale is determined by comparing the basis of the route sold, which will be comprised primarily of the associated indefinite-lived intangible, to the proceeds received from the IBO. For 2017, 2016 and 2015, we recognized net gains on the sale of route businesses of $2.3 million, $1.3 million and $1.9 million, respectively. Net gains on the sale of route businesses in 2017 consisted of $9.4 million in gains, partially offset by $7.1 million in losses. Net gains on the sale of route businesses in 2016 consisted of $5.5 million in gains, partially offset by $4.2 million in losses. For 2015, net gains on the sale of route businesses consisted of $3.3 million in gains, partially offset by $1.4 million in losses.
Impairment Analysis of Fixed Assets
Fixed assets are reviewed for impairment whenever events or changes in circumstances indicate that the carrying amount of an asset or asset group may not be recoverable. Recoverability of assets or asset groups to be held and used is measured by a comparison of the carrying amount of an asset or asset group to future net cash flows expected to be generated by the asset or asset group. If such assets or asset groups are considered to be impaired, the impairment to be recognized is measured by the amount by which the carrying amount of the assets or asset groups exceeds the fair value of the assets or asset groups. There were $10.1 million in fixed asset impairment charges recorded during 2017, compared to $3.7 million during 2016, and $11.5 million during 2015.
Equity-Based Incentive Compensation Expense
Determining the fair value of share-based awards at the grant date requires judgment, including estimating the expected term, expected stock price volatility, risk-free interest rate and expected dividends. Judgment is required in estimating the amount of
39
share-based awards that are expected to be forfeited before vesting. In addition, our long-term equity incentive plans require assumptions and projections of future operating results and financial metrics. Actual results may differ from these assumptions and projections, which could have a material impact on our financial results. Information regarding assumptions can be found in Note 8 to the consolidated financial statements included in Item 8.
Discontinued Operations Presentation
In order to be reported within discontinued operations, our disposal of a component or group of components must represent a strategic shift that will have a major effect on our operations and financial results. Discontinued Operations are reported when a component of an entity (“component”) that can be clearly distinguished operationally, and for financial reporting purposes from the rest of the entity meets the threshold for reporting in discontinued operations, provided that:
• | the component meets the “held for sale” criteria; |
• | the operations and cash flows of the component have been, or will be, eliminated from the ongoing operations of the entity as a result of the disposal transaction; and |
• | the entity will not have any significant continuing involvement in the operations of the component after the disposal transaction. |
In the Consolidated Statements of Income, income from discontinued operations is reported separately from income and expenses from continuing operations and prior periods are presented on a comparable basis. In the Consolidated Balance Sheets, the assets and liabilities of discontinued operations are presented separately from assets and liabilities of continuing operations and prior periods are presented on a comparable basis. Many provisions of reporting discontinued operations involve judgment in determining whether results from operations, assets and liabilities will be reported as continuing or discontinued operations. As a result of the sale of Diamond of California, revenues and expenses that no longer continued after the sale of Diamond of California, and where we had no substantial continuing involvement, were reclassified to discontinued operations in the Consolidated Statements of Income.
Provision for Income Taxes
Our effective tax rate is based on the level and mix of income of our separate legal entities, statutory tax rates, business credits available in the various jurisdictions in which we operate and permanent tax differences. Significant judgment is required in evaluating tax positions that affect the annual tax rate. We recognize the effect of income tax positions only if these positions are more likely than not of being sustained. We adjust these liabilities in light of changing facts and circumstances, such as the progress of a tax audit.
Deferred tax assets and liabilities are recognized for the future tax consequences attributable to differences between the financial statement carrying amounts of existing assets and liabilities and their respective tax bases. Deferred tax assets and liabilities are measured using enacted tax rates expected to apply to the taxable income in the years in which those temporary differences are expected to be recovered or settled. The effect on deferred tax assets and liabilities of a change in tax rate is recognized in income in the period that includes the enactment date. We estimate valuation allowances on deferred tax assets for the portions that we do not believe will be fully utilized based on projected earnings and usage. Deferred tax assets and liabilities, along with related valuation allowances, are netted by tax jurisdiction and classified as noncurrent on the balance sheet.
US Tax Reform
On December 22, 2017, the Tax Cuts and Jobs Act (the "Tax Act") was signed into law. The Tax Act made numerous changes to many aspects of U.S. corporate income taxation by, among other things, lowering the US corporate income tax rate from 35% to 21%, implementing a territorial tax system and imposing a one-time transition tax on deemed repatriated earning of foreign subsidiaries. As a result of the Tax Act, the Company revalued its net deferred tax liabilities to reflect the tax rate expected to apply in the years in which the temporary differences are expected to reverse. This resulted in an approximate $123.2 million tax benefit. The Tax Act provides a dividends received deduction for any future dividends from non-U.S. subsidiaries to their U.S. parent company. The Tax Act also imposes a one-time deemed repatriation of accumulated post-1986 foreign earnings which have not been previously taxed. The Company recorded a provisional estimate for this transition tax of approximately $7.5 million. Through the third quarter of 2017 the Company had recorded taxes of approximately $46.7 million on the amount of basis difference in foreign subsidiaries which is not indefinitely reinvested. In the fourth quarter of 2017 the Company has recorded a benefit to reflect the reduced rate at which any remaining basis difference will be taxed.
The SEC staff issued Staff Accounting Bulletin No. 118 ("SAB 118") to address the application of GAAP in situations when a registrant does not have the necessary information available, prepared, or analyzed (including computations) in reasonable detail to complete the accounting for certain income tax effects of the Tax Act and allows the registrant to record provisional amounts during a measurement period not to extend beyond one year of the enactment date. We have recognized a net tax benefit of $162.4 million for the provisional tax impacts related to the one-time transition tax and the revaluation of deferred tax balances and included these estimates in our consolidated financial statements for the year ended December 30, 2017. We are in the process of analyzing the impact of the various provisions of the Tax Act. The ultimate impact may materially differ from these provisional
40
amounts due to, among other things, additional analysis, changes in interpretations and assumptions we have made, additional regulatory guidance that may be issued, and actions we may take as a result of the Tax Act. We expect to complete our analysis within the measurement period in accordance with SAB 118. See Note 13, Income Taxes, for further details on the impact of the Tax Act.
New Accounting Standards
See Note 3 to the consolidated financial statements included in Item 8 for a summary of new accounting standards.
Item 7A. Quantitative and Qualitative Disclosures about Market Risk
We are exposed to certain commodity, interest rate, and foreign currency risks as part of our ongoing business operations. We may use derivative financial instruments, where appropriate, to manage some of these risks related to interest rates. We do not use derivatives for trading purposes.
Commodity Risk
We purchase certain raw materials that are subject to price volatility caused by weather, market conditions, growing and harvesting conditions, governmental actions and other factors beyond our control. Our most significant raw material requirements include flour, potatoes, oil, peanuts, other nuts, corn, sugar, chocolate, cheese and seasonings. We also purchase packaging materials that are subject to price volatility. In the normal course of business, in order to mitigate the risks of volatility in commodity markets to which we are exposed, we enter into forward purchase agreements with certain suppliers based on market prices, forward price projections and expected usage levels. Amounts committed under these forward purchase agreements are discussed in Note 17 to the consolidated financial statements in Item 8.
Interest Rate Risk
Our variable-rate debt obligations incur interest at floating rates based on changes in the Eurodollar rate and US base rate interest. To manage exposure to changing interest rates, we selectively enter into interest rate swap agreements to maintain a desired proportion of fixed to variable-rate debt. See Note 15 to the consolidated financial statements in Item 8 for further information related to our interest rate swap agreements. While these interest rate swap agreements fixed a portion of the interest rate at a predictable level, pre-tax interest expense would have been $1.2 million, $1.0 million, and $0.6 million lower without these swaps during 2017, 2016 and 2015, respectively. Including the effect of the interest rate swap agreement, the weighted average interest rate was 3.41% and 2.95%, respectively, as of December 30, 2017 and December 31, 2016. A 10% increase in the Eurodollar rate would not have significantly impacted interest expense during 2017.
Credit Risk
We are exposed to credit risks related to our accounts and notes receivable. We perform ongoing credit evaluations of our customers to minimize the potential exposure. For 2017, 2016 and 2015, net bad debt expense was $1.7 million, $0.5 million and $1.1 million, respectively. Allowances for doubtful accounts were $2.6 million and $1.3 million as of December 30, 2017 and December 31, 2016, respectively.
Foreign Currency Exchange Risk
We have operations outside the US with foreign currency denominated assets and liabilities, primarily in the U.K. Because we have foreign currency denominated assets and liabilities, financial exposure may result, primarily from the timing of transactions and the movement of exchange rates. Our risks pertaining to Brexit are discussed in Part I, Item1A - Risk Factors.
For our US operations, our sales of finished goods and purchases of raw materials and supplies from outside the US are predominantly denominated in US dollars. However, certain revenues and expenses have been, and are expected to be, subject to the effect of foreign currency fluctuations, and these fluctuations may have an impact on operating results.
41
Item 8. Financial Statements and Supplementary Data
SNYDER’S-LANCE, INC. AND SUBSIDIARIES
Consolidated Statements of Income
For the Fiscal Years Ended December 30, 2017, December 31, 2016 and January 2, 2016
(in thousands, except per share data) | 2017 | 2016 | 2015 | |||||||||
Net revenue | $ | 2,226,837 | $ | 2,109,227 | $ | 1,656,399 | ||||||
Cost of sales | 1,426,666 | 1,345,437 | 1,077,110 | |||||||||
Gross profit | 800,171 | 763,790 | 579,289 | |||||||||
Selling, general and administrative expenses | 643,865 | 593,957 | 464,534 | |||||||||
Transaction and integration related expenses | 3,002 | 66,272 | 7,702 | |||||||||
Settlements of certain litigation | — | — | 5,675 | |||||||||
Impairment charges | 114,783 | 4,466 | 11,997 | |||||||||
Other operating expense/(income), net | 7 | (5,554 | ) | (1,251 | ) | |||||||
Operating income | 38,514 | 104,649 | 90,632 | |||||||||
Other (income)/expense, net | (1,514 | ) | 164 | 176 | ||||||||
Income before interest and income taxes | 40,028 | 104,485 | 90,456 | |||||||||
Loss on early extinguishment of debt | — | 4,749 | — | |||||||||
Interest expense, net | 38,765 | 32,613 | 10,853 | |||||||||
Income before income taxes | 1,263 | 67,123 | 79,603 | |||||||||
Income tax (benefit)/expense | (146,144 | ) | 25,320 | 28,885 | ||||||||
Income from continuing operations | 147,407 | 41,803 | 50,718 | |||||||||
Income/(loss) from discontinued operations, net of income tax | 1,936 | (27,100 | ) | — | ||||||||
Net income | 149,343 | 14,703 | 50,718 | |||||||||
Net income/(loss) attributable to non-controlling interests | 851 | (182 | ) | 33 | ||||||||
Net income attributable to Snyder’s-Lance, Inc. | $ | 148,492 | $ | 14,885 | $ | 50,685 | ||||||
Amounts attributable to Snyder's-Lance, Inc.: | ||||||||||||
Continuing operations | $ | 146,556 | $ | 41,985 | $ | 50,685 | ||||||
Discontinued operations | 1,936 | (27,100 | ) | — | ||||||||
Net income attributable to Snyder's-Lance, Inc. | $ | 148,492 | $ | 14,885 | $ | 50,685 | ||||||
Basic earnings per share: | ||||||||||||
Continuing operations | $ | 1.51 | $ | 0.46 | $ | 0.72 | ||||||
Discontinued operations | 0.02 | (0.29 | ) | — | ||||||||
Total basic earnings per share | $ | 1.53 | $ | 0.17 | $ | 0.72 | ||||||
Diluted earnings per share: | ||||||||||||
Continuing operations | $ | 1.50 | $ | 0.45 | $ | 0.71 | ||||||
Discontinued operations | 0.02 | (0.29 | ) | — | ||||||||
Total diluted earnings per share | $ | 1.52 | $ | 0.16 | $ | 0.71 | ||||||
Dividends declared per common share | $ | 0.64 | $ | 0.64 | $ | 0.64 | ||||||
See Notes to the consolidated financial statements.
42
SNYDER’S-LANCE, INC. AND SUBSIDIARIES
Consolidated Statements of Comprehensive Income
For the Fiscal Years Ended December 30, 2017, December 31, 2016 and January 2, 2016
(in thousands) | 2017 | 2016 | 2015 | |||||||||
Net income | $ | 149,343 | $ | 14,703 | $ | 50,718 | ||||||
Net unrealized gain/(loss) on derivative instruments, net of income tax (expense)/benefit of $(1,224), ($4,447), and $247 | 1,557 | 6,953 | (360 | ) | ||||||||
Foreign currency translation adjustment | 18,517 | (24,300 | ) | 737 | ||||||||
Total other comprehensive income/(loss) | 20,074 | (17,347 | ) | 377 | ||||||||
Total comprehensive income/(loss) | 169,417 | (2,644 | ) | 51,095 | ||||||||
Comprehensive income/(loss) attributable to non-controlling interests | 851 | (182 | ) | 33 | ||||||||
Total comprehensive income/(loss) attributable to Snyder’s-Lance, Inc. | $ | 168,566 | $ | (2,462 | ) | $ | 51,062 | |||||
See Notes to the consolidated financial statements.
43
SNYDER’S-LANCE, INC. AND SUBSIDIARIES
Consolidated Balance Sheets
As of December 30, 2017 and December 31, 2016
(in thousands, except share data) | 2017 | 2016 | ||||||
ASSETS | ||||||||
Current assets: | ||||||||
Cash and cash equivalents | $ | 18,703 | $ | 35,409 | ||||
Restricted cash | 446 | 714 | ||||||
Accounts receivable, net of allowances of $2,567 and $1,290, respectively | 219,267 | 210,723 | ||||||
Receivable from sale of Diamond of California | — | 118,577 | ||||||
Inventories, net | 189,889 | 173,456 | ||||||
Prepaid income taxes and income taxes receivable | 5,899 | 5,744 | ||||||
Assets held for sale | 18,945 | 19,568 | ||||||
Prepaid expenses and other current assets | 30,242 | 27,666 | ||||||
Total current assets | 483,391 | 591,857 | ||||||
Noncurrent assets: | ||||||||
Fixed assets, net | 492,437 | 501,884 | ||||||
Goodwill | 1,282,372 | 1,318,362 | ||||||
Other intangible assets, net | 1,301,228 | 1,373,800 | ||||||
Other noncurrent assets | 58,909 | 48,173 | ||||||
Total assets | $ | 3,618,337 | $ | 3,834,076 | ||||
LIABILITIES AND STOCKHOLDERS’ EQUITY | ||||||||
Current liabilities: | ||||||||
Current portion of long-term debt | $ | 49,000 | $ | 49,000 | ||||
Accounts payable | 111,971 | 99,249 | ||||||
Accrued compensation | 31,568 | 44,901 | ||||||
Accrued casualty insurance claims | 3,571 | 4,266 | ||||||
Accrued marketing, selling and promotional costs | 57,774 | 50,179 | ||||||
Other payables and accrued liabilities | 45,797 | 47,958 | ||||||
Total current liabilities | 299,681 | 295,553 | ||||||
Noncurrent liabilities: | ||||||||
Long-term debt, net | 1,025,533 | 1,245,959 | ||||||
Deferred income taxes, net | 234,878 | 378,236 | ||||||
Accrued casualty insurance claims | 14,831 | 13,049 | ||||||
Other noncurrent liabilities | 21,125 | 25,609 | ||||||
Total liabilities | 1,596,048 | 1,958,406 | ||||||
Commitments and contingencies | ||||||||
Stockholders’ equity: | ||||||||
Common stock, $0.83 1/3 par value. 110,000,000 shares authorized; 97,857,940 and 96,242,784 shares outstanding, respectively | 81,545 | 80,199 | ||||||
Preferred stock, $1.00 par value. 5,000,000 shares authorized; no shares outstanding | — | — | ||||||
Additional paid-in capital | 1,636,500 | 1,598,678 | ||||||
Retained earnings | 282,259 | 195,733 | ||||||
Accumulated other comprehensive income/(loss) | 2,097 | (17,977 | ) | |||||
Total Snyder’s-Lance, Inc. stockholders’ equity | 2,002,401 | 1,856,633 | ||||||
Non-controlling interests | 19,888 | 19,037 | ||||||
Total stockholders’ equity | 2,022,289 | 1,875,670 | ||||||
Total liabilities and stockholders’ equity | $ | 3,618,337 | $ | 3,834,076 | ||||
See Notes to the consolidated financial statements.
44
SNYDER’S-LANCE, INC. AND SUBSIDIARIES
Consolidated Statements of Stockholders’ Equity
For the Fiscal Years Ended December 30, 2017, December 31, 2016 and January 2, 2016
(in thousands, except share and per share data) | Shares | Common Stock | Additional Paid-in Capital | Retained Earnings | Accumulated Other Comprehensive Income/(Loss) | Non-controlling Interests | Total | ||||||||||||||||||||
Balance, January 3, 2015 | 70,406,086 | $ | 58,669 | $ | 776,930 | $ | 232,812 | $ | (1,007 | ) | $ | 19,304 | $ | 1,086,708 | |||||||||||||
Total comprehensive income | 50,685 | 377 | 33 | 51,095 | |||||||||||||||||||||||
Dividends paid to stockholders ($0.64 per share) | (45,183 | ) | (45,183 | ) | |||||||||||||||||||||||
Amortization of stock options | 2,194 | 2,194 | |||||||||||||||||||||||||
Stock options exercised, including $2,326 tax benefit | 496,828 | 414 | 9,772 | 10,186 | |||||||||||||||||||||||
Issuance and amortization of restricted stock, net of cancellations | 88,983 | 75 | 3,348 | 3,423 | |||||||||||||||||||||||
Repurchases of common stock | (23,843 | ) | (20 | ) | (816 | ) | (836 | ) | |||||||||||||||||||
Balance, January 2, 2016 | 70,968,054 | $ | 59,138 | $ | 791,428 | $ | 238,314 | $ | (630 | ) | $ | 19,337 | $ | 1,107,587 | |||||||||||||
Total comprehensive income/(loss) | 14,885 | (17,347 | ) | (182 | ) | (2,644 | ) | ||||||||||||||||||||
Dividends paid to stockholders ($0.64 per share) | (57,466 | ) | (57,466 | ) | |||||||||||||||||||||||
Dividends paid to non-controlling interests | (118 | ) | (118 | ) | |||||||||||||||||||||||
Issuance of common stock and stock-based awards assumed in the Diamond Foods acquisition | 24,363,738 | 20,302 | 780,685 | 800,987 | |||||||||||||||||||||||
Amortization of stock options, restricted units and performance-based restricted units | 21,642 | 21,642 | |||||||||||||||||||||||||
Stock options exercised and restricted units vested (net of shares surrendered for tax withholding), including $910 tax benefit | 897,875 | 748 | 2,897 | 3,645 | |||||||||||||||||||||||
Issuance and amortization of restricted shares, net of cancellations | 106,457 | 89 | 4,917 | 5,006 | |||||||||||||||||||||||
Repurchases of common stock | (93,340 | ) | (78 | ) | (2,891 | ) | (2,969 | ) | |||||||||||||||||||
Balance, December 31, 2016 | 96,242,784 | $ | 80,199 | $ | 1,598,678 | $ | 195,733 | $ | (17,977 | ) | $ | 19,037 | $ | 1,875,670 | |||||||||||||
Total comprehensive income/(loss) | 148,492 | 20,074 | 851 | 169,417 | |||||||||||||||||||||||
Dividends paid to stockholders ($0.64 per share) | (61,966 | ) | (61,966 | ) | |||||||||||||||||||||||
Amortization of stock options, restricted units and performance-based restricted units | 9,502 | 9,502 | |||||||||||||||||||||||||
Stock options exercised and restricted units vested (net of shares surrendered for tax withholding) | 1,363,436 | 1,136 | 25,983 | 27,119 | |||||||||||||||||||||||
Issuance and amortization of restricted shares, net of cancellations | 298,236 | 249 | 4,139 | 4,388 | |||||||||||||||||||||||
Repurchases of common stock | (46,516 | ) | (39 | ) | (1,802 | ) | (1,841 | ) | |||||||||||||||||||
Balance, December 30, 2017 | 97,857,940 | $ | 81,545 | $ | 1,636,500 | $ | 282,259 | $ | 2,097 | $ | 19,888 | $ | 2,022,289 | ||||||||||||||
See Notes to the consolidated financial statements.
45
SNYDER’S-LANCE, INC. AND SUBSIDIARIES
Consolidated Statements of Cash Flows
For the Fiscal Years Ended December 30, 2017, December 31, 2016 and January 2, 2016
(in thousands) | 2017 | 2016 | 2015 | |||||||||
Operating activities: | ||||||||||||
Net income | $ | 149,343 | $ | 14,703 | $ | 50,718 | ||||||
Adjustments to reconcile net income to cash from operating activities: | ||||||||||||
Depreciation and amortization | 96,911 | 99,251 | 70,379 | |||||||||
Stock-based compensation expense | 13,890 | 26,648 | 5,616 | |||||||||
Loss on sale of fixed assets, net | 1,437 | 141 | 420 | |||||||||
(Gain)/loss on disposal of Diamond of California | (3,069 | ) | 32,645 | — | ||||||||
Gain on sale of route businesses | (2,255 | ) | (1,341 | ) | (1,913 | ) | ||||||
Loss on early extinguishment of debt | — | 4,749 | — | |||||||||
Impairment charges | 114,783 | 4,466 | 11,997 | |||||||||
Derecognition of cumulative translation adjustment | — | — | 737 | |||||||||
Deferred income taxes | (153,963 | ) | 24,811 | 2,433 | ||||||||
Provision for doubtful accounts | 1,733 | 472 | 1,104 | |||||||||
Changes in operating assets and liabilities, excluding business acquisitions, and foreign currency translation adjustments: | ||||||||||||
Accounts receivable | (6,487 | ) | (34,047 | ) | (6,349 | ) | ||||||
Inventory | (15,663 | ) | 2,036 | 5,242 | ||||||||
Other current assets | (941 | ) | 2,861 | 2,463 | ||||||||
Accounts payable | 9,629 | 21,762 | (2,468 | ) | ||||||||
Payable to growers | — | 41,948 | — | |||||||||
Other accrued liabilities | (7,378 | ) | 18,312 | 6,970 | ||||||||
Other noncurrent assets | (3,596 | ) | 6,531 | 709 | ||||||||
Other noncurrent liabilities | 2,485 | 1,421 | (1,904 | ) | ||||||||
Net cash provided by operating activities | 196,859 | 267,369 | 146,154 | |||||||||
Investing activities: | ||||||||||||
Purchases of fixed assets | (69,429 | ) | (73,261 | ) | (51,468 | ) | ||||||
Purchases of route businesses | (53,907 | ) | (42,206 | ) | (22,568 | ) | ||||||
Purchases of equity method investments | (1,500 | ) | — | — | ||||||||
Proceeds from sale of fixed assets and insurance recoveries | 544 | 1,409 | 1,776 | |||||||||
Proceeds from sale of route businesses | 56,584 | 39,619 | 27,408 | |||||||||
Proceeds from sale of investments | 1,090 | — | 826 | |||||||||
Proceeds from sale of discontinued operations | 119,658 | — | — | |||||||||
Business acquisitions, net of cash acquired | (2,563 | ) | (1,042,674 | ) | — | |||||||
Net cash provided by/(used in) investing activities | 50,477 | (1,117,113 | ) | (44,026 | ) | |||||||
Financing activities: | ||||||||||||
Dividends paid to stockholders and non-controlling interests | (61,966 | ) | (57,584 | ) | (45,183 | ) | ||||||
Debt issuance costs | (2,441 | ) | (6,047 | ) | (5,065 | ) | ||||||
Issuances of common stock | 27,970 | 10,096 | 7,862 | |||||||||
Excess tax benefits from stock-based compensation | — | 910 | 2,326 | |||||||||
Share repurchases, including shares surrendered for tax withholding | (2,692 | ) | (10,330 | ) | (836 | ) | ||||||
Payments on capital leases | (4,817 | ) | (2,412 | ) | — | |||||||
Repayments of long-term debt | (49,000 | ) | (444,795 | ) | (7,500 | ) | ||||||
Proceeds from issuance of long-term debt | — | 1,130,000 | — | |||||||||
Repayments of revolving credit facility | (365,500 | ) | (120,000 | ) | (50,000 | ) | ||||||
Proceeds from revolving credit facility | 193,500 | 347,000 | — | |||||||||
Net cash (used in)/provided by financing activities | (264,946 | ) | 846,838 | (98,396 | ) | |||||||
Effect of exchange rate changes on cash | 636 | (1,042 | ) | — | ||||||||
Net (decrease)/increase | (16,974 | ) | (3,948 | ) | 3,732 | |||||||
Cash, cash equivalents and restricted cash at beginning of fiscal year | 36,123 | 40,071 | 36,339 | |||||||||
Cash, cash equivalents and restricted cash at end of fiscal year | $ | 19,149 | $ | 36,123 | $ | 40,071 | ||||||
Non-cash investing activities: | ||||||||||||
(Increase)/decrease in fixed asset expenditures included in accounts payable | $ | (508 | ) | $ | (215 | ) | $ | 712 | ||||
Proceeds from the sale of discontinued operations, not yet received, less transaction costs, not yet paid | $ | 800 | $ | 125,772 | $ | — | ||||||
Non-cash financing activities: | ||||||||||||
Common stock and stock-based compensation issued for business acquisitions (Note 5) | $ | — | $ | 800,987 | $ | — | ||||||
Supplemental information: | ||||||||||||
Cash paid for income taxes, net of refunds of $676, $2,000 and $2,608, respectively | $ | 5,458 | $ | 9,582 | $ | 23,068 | ||||||
Cash paid for interest | $ | 36,831 | $ | 30,894 | $ | 11,523 | ||||||
See Notes to the consolidated financial statements.
46
SNYDER'S-LANCE, INC. AND SUBSIDIARIES
Notes to the Consolidated Financial Statements
For the Fiscal Years Ended December 30, 2017, December 31, 2016 and January 2, 2016
NOTE 1. OPERATIONS AND SUMMARY OF SIGNIFICANT ACCOUNTING POLICIES
Operations
We are engaged in the manufacturing, distribution, marketing and sale of snack food products. These products include pretzels, sandwich crackers, kettle cooked chips, pretzel crackers, popcorn, nuts, potato chips, tortilla chips, cookies, restaurant style crackers, and other salty snacks. Our products are packaged in various single-serve, multi-pack, family-size and party-size configurations. Our Branded products are principally sold under the Snyder’s of Hanover®, Lance®, Cape Cod®, Snack Factory® Pretzel Crisps®, Pop Secret®, Emerald®, Kettle Brand®, KETTLE® Chips, Late July®, Metcalfe’s skinny®, Tom’s®, Archway®, Jays®, Stella D’oro®, Eatsmart SnacksTM, Krunchers!® and O-Ke-Doke® and other brand names.
We also sell Partner brand products, which consist of third-party branded products that we sell to the independent business owners ("IBO") through our national direct-store-delivery distribution network ("DSD network"), in order to broaden the portfolio of product offerings for the IBOs. In addition, we contract with other branded food manufacturers to produce their products and periodically sell certain semi-finished goods to other manufacturers.
We distribute snack food products throughout the United States ("US") using the DSD network. The DSD network is made up of over 3,200 routes that are primarily owned and operated by IBOs. We also ship products directly to third-party distributors in areas where the DSD network does not operate. Through our direct distribution network, we distribute products directly to retail customers or to third-party distributors using freight carriers or our own transportation fleet.
Through the DSD network, we sell our Branded and Partner brand products to IBOs that distribute to grocery/mass merchandisers, club stores, discount stores, convenience stores, food service establishments and various other retail customers, including drug stores, schools, military and government facilities and “up and down the street” outlets such as recreational facilities, offices and other independent retailers. In addition, we sell our Branded products directly to retail customers and third-party distributors. In the United Kingdom ("U.K.") and certain other countries within Europe, we sell our salty snack products through our sales personnel and through third-party distributors to national grocery, co-op and impulse store chains.
Our corporate headquarters is located in Charlotte, North Carolina. We have additional administrative offices in Hanover, Pennsylvania supporting the DSD network and in Norwich, England supporting our European operations. Our manufacturing operations are located in Charlotte, North Carolina; Hanover, Pennsylvania; Franklin, Wisconsin; Goodyear, Arizona; Columbus, Georgia; Jeffersonville, Indiana; Hyannis, Massachusetts; Ashland, Ohio; Salem, Oregon; Beloit, Wisconsin; Norwich, England; Wednesbury, England and Van Buren, Indiana. Additionally, our research and development centers are located in Hanover, Pennsylvania and Salem, Oregon.
Principles of Consolidation
The accompanying consolidated financial statements include the accounts of Snyder’s-Lance, Inc. and its subsidiaries. All intercompany transactions and balances have been eliminated. Certain prior year amounts have been reclassified to conform to current year presentation. We have elected to separately disclose other operating (income)/expense, net and other (income)/expense, net. In addition, we have included the caption operating income on our Consolidated Statements of Income. The items included in other operating (income)/expense, net include: gains or losses on sale of property, plant and equipment; gains or losses on sale of route businesses; and royalty income. The items included in other (income)/expense, net include: foreign exchange gains or losses and equity income or losses from nonconsolidated entities. These reclassifications had no effect on previously reported results of operations or retained earnings.
The Company's fiscal year ends on the Saturday closest to December 31 and, as a result, a 53rd week is added every fifth or sixth year. The Company's 2017, 2016 and 2015 fiscal years each contained 52 weeks and ended on December 30, 2017, December 31, 2016 and January 2, 2016, respectively.
Discontinued Operations Presentation
In order to be reported within discontinued operations, our disposal of a component or group of components must represent a strategic shift that will have a major effect on our operations and financial results. We aggregate the results of operations for discontinued operations into a single line item in the income statement. General corporate overhead is not allocated to discontinued operations.
47
As discussed in Note 4, amounts included in the Consolidated Statements of Income for prior periods have been reclassified to separate amounts related to discontinued operations from continuing operations. Accordingly, unless otherwise stated, amounts disclosed within the notes to the consolidated financial statements exclude amounts related to discontinued operations. The Consolidated Statements of Cash Flows were not adjusted for presentation of discontinued operations, but certain items are disclosed in Note 4 to the consolidated financial statements.
Business Combinations
We account for business combinations under the provisions of Accounting Standards Codification ("ASC") Topic 805-10, Business Combinations ("ASC 805-10"), which requires that the purchase method of accounting be used for all business combinations. Assets acquired and liabilities assumed, including non-controlling interests, are recorded at the date of acquisition at their respective fair values. ASC 805-10 also specifies criteria that intangible assets acquired in a business combination must meet to be recognized and reported apart from goodwill. Goodwill represents the excess purchase price over the fair value of the tangible net assets and intangible assets acquired in a business combination. Acquisition-related expenses are recognized separately from the business combinations and are expensed as incurred.
Use of Estimates
The preparation of financial statements in conformity with generally accepted accounting principles in the US ("GAAP") requires management to make estimates and assumptions that affect the reported amounts of assets and liabilities, the disclosure of contingent liabilities at the date of the consolidated financial statements and the reported amounts of revenue and expenses during the periods reported. Examples include sales and promotional allowances, customer returns, allowances for doubtful accounts, inventory valuations, useful lives of fixed assets and related impairment, long-term investments, hedge transactions, goodwill and intangible asset valuations and impairments, incentive compensation, income taxes, self-insurance, contingencies and litigation. Actual results may differ from these estimates under different assumptions or conditions.
Non-controlling Interests
We own 80% of Late July Snacks, LLC (“Late July”) and consolidate its balance sheet and operating results into our consolidated financial statements. The associated non-controlling interest is classified as equity, with the consolidated net income adjusted to exclude the net income or loss attributable to the non-controlling interest.
Revenue Recognition
We recognize revenue when title and risk of loss passes to our customers. Allowances for sales returns, stale products, promotions and discounts are recorded as reductions of revenue in the consolidated financial statements. The timing of revenue recognition varies based on the types of products sold and the distribution method.
Revenue for products sold to IBOs in the DSD network is recognized when the IBO purchases the inventory from our warehouses or the products are shipped to the stockroom. Revenue for products sold to retail customers through routes operated by company associates is recognized when the product is delivered to the customer.
Revenue for products shipped directly to customers from our warehouses is recognized based on the shipping terms listed on the shipping documentation. Products shipped with terms FOB shipping point are recognized as revenue at the time the product leaves our warehouses. Products shipped with terms FOB destination are recognized as revenue based on the anticipated receipt date by the customer.
We allow certain customers to return products under agreed upon circumstances. We record a returns allowance for damaged products and other products not sold by the expiration date on the product label. This allowance is estimated based on a percentage of historical sales returns and current market information.
We record certain reductions to revenue for promotional allowances. There are several different types of promotional allowances such as off-invoice allowances, rebates and shelf space allowances. An off-invoice allowance is a reduction to the sales price that is directly deducted from the invoice amount. We record the amount of the deduction as a reduction to revenue when the transaction occurs. Rebates are offered to retail customers based on the quantity of product purchased over a period of time. Based on the nature of these allowances, the exact amount of the rebate is not known at the time the product is sold to the customer. An estimate of the expected rebate is recorded as a reduction to revenue at the time of the sale and a corresponding accrued liability is recorded. The accrued liability is monitored throughout the time period covered by the promotion, and is based on historical information and the progress of the customer against the target amount. We also record certain allowances for coupon redemptions, scan-back promotions and other promotional activities. These promotions are estimated and recorded as a reduction of revenue at the time the associated sale. The accrued liabilities for these allowances are monitored throughout the time period covered by the coupon or promotion.
Shelf space allowances are capitalized and amortized over the lesser of twelve months or the life of the agreement and recorded as a reduction to revenue. Capitalized shelf space allowances are evaluated for impairment on an ongoing basis.
48
Total allowances for sales returns, rebates, coupons, scan-backs and other promotional activities recorded in the Consolidated Balance Sheets was $43.8 million and $39.8 million as of December 30, 2017 and December 31, 2016, respectively.
Allowance for Doubtful Accounts
The determination of the allowance for doubtful accounts is based on management’s estimate of uncollectible accounts receivable. We record a general reserve based on analysis of historical data and aging of accounts receivable. In addition, management records specific reserves for receivable balances that are considered at higher risk due to known facts regarding the customer. The assumptions for this determination are reviewed quarterly to ensure that business conditions or other circumstances are consistent with the assumptions.
Fair Value
We have classified assets and liabilities required to be measured at fair value into the fair value hierarchy as set forth below:
Level 1 | - | Quoted prices in active markets for identical assets and liabilities. |
Level 2 | - | Observable inputs other than quoted prices for identical assets and liabilities. |
Level 3 | - | Unobservable inputs for which there is little or no market data available, which requires us to develop our own assumptions. |
See Note 14 for more information on fair value measurements.
Cash and Cash Equivalents
We consider all highly liquid investments purchased with an original maturity of three months or less to be cash equivalents.
Restricted Cash
Restricted cash represents cash and cash equivalents which can only be used for retention of certain employees.
Inventories
Inventories are valued at the lower of cost or net realizable value using the first-in first-out (FIFO) method.
Fixed Assets
Depreciation of fixed assets is computed using the straight-line method over the estimated useful lives of long-term depreciable assets. Leasehold improvements are depreciated over the estimated life of the improvement or the life of the lease, whichever is shorter. Estimated lives are based on historical experience, maintenance practices, technological changes and future business plans. The following table summarizes the majority of our estimated useful lives of long-term depreciable assets:
Useful Life | |
Buildings and building improvements | 10-45 years |
Land improvements | 10-20 years |
Machinery, equipment and computer systems | 3-20 years |
Furniture and fixtures | 3-12 years |
Trucks, trailers and automobiles | 3-10 years |
Fixed assets are reviewed for impairment whenever events or changes in circumstances indicate that the carrying amount of an asset or asset group may not be recoverable. Recoverability of assets or asset groups to be held and used is measured by a comparison of the carrying amount of an asset or asset group to future net cash flows expected to be generated by the asset or asset group. If such assets or asset groups are considered to be impaired, the impairment to be recognized is measured by the amount by which the carrying amount of the assets or asset groups exceeds the fair value of the assets or asset groups. Assets held for sale are reported at the lower of the carrying amount or fair value less cost to sell.
Route Intangible Purchase and Sale Transactions
We purchase and sell routes as a part of the DSD network. Routes subject to purchase and sale transactions represent integrated sets of inputs, activities and processes that are capable of being conducted and managed by IBOs for the purpose of providing a return directly to the IBOs. However, they do not meet the definition of a business for accounting purposes in accordance with Accounting Standards Update ("ASU") 2017-01, Clarifying the Definition of a Business which we adopted in the fourth quarter of 2017 as discussed in Note 3. Upon acquisition of a route, we allocate the purchase price to an indefinite-lived route intangible, representing our perpetual and exclusive distribution right in the route. We recognize a gain or a loss on the sale of a route upon completion of the sales transaction and signing of the relevant documents. Gain or loss on the sale is determined by comparing the basis of the route sold, which will be comprised primarily of the associated indefinite-lived intangible, to the proceeds received from the IBO.
49
Goodwill and Other Intangible Assets
Goodwill is tested for impairment on an annual basis, and between annual tests if indicators of potential impairment exist, using a fair-value-based approach.
We are required to evaluate and determine our reporting units for purposes of performing the annual impairment analysis of goodwill. Our 2017 and 2016 analyses identified two reporting units, North America and Europe. The annual impairment analysis of goodwill and other indefinite-lived intangible assets also requires us to project future financial performance, including revenue and profit growth, fixed asset and working capital investments, income tax rates and our weighted average cost of capital. These projections rely upon historical performance, anticipated market conditions and forward-looking business plans.
Goodwill determined at the time of an acquisition represents the future economic benefit arising from other assets acquired that could not be individually identified and separately recognized. The goodwill is attributable to the general reputation, assembled workforce, acquisition synergies and the expected future cash flows of the business.
Our trademarks are valued using the relief-from-royalty method under the income approach, which requires us to estimate a royalty rate, identify relevant projected revenue, and select an appropriate discount rate. Our route intangible assets are valued by comparing the current fair market value for the route assets to the associated book value. The fair market value is computed using the route sales average for each route or group of routes multiplied by the market multiple for the area in which the route is located. Other intangible assets, primarily customer and contractual relationships and patents, are tested for impairment if events or changes in circumstances indicate that it is more likely than not that fair value is less than book value.
Amortizable intangible assets are amortized using the straight-line method over their estimated useful lives, which is the period over which economic benefits are expected to be provided.
Equity Method Investments
Investments where we have the ability to exercise significant influence, but do not control, are accounted for under the equity method of accounting and are included in other noncurrent assets on our Consolidated Balance Sheets. Under this method of accounting, our share of the net earnings or losses of the investee is included in other income, net on our Consolidated Statements of Income. We evaluate our equity method investments for impairment whenever events or changes in circumstances indicate that the carrying amounts of such investments may be impaired. If a decline in the value of an equity method investment is determined to be other than temporary, a loss is recorded in earnings in the current period. Our equity method investments totaled $11.7 million and $8.4 million as of December 30, 2017 and December 31, 2016, respectively.
Income Taxes
Our effective tax rate is based on the level and mix of income of our separate legal entities, statutory tax rates, business credits available in the various jurisdictions in which we operate and permanent tax differences. Significant judgment is required in evaluating tax positions that affect the annual tax rate. We recognize the effect of income tax positions only if these positions are more likely than not of being sustained. We adjust these liabilities in light of changing facts and circumstances, such as the progress of a tax audit.
Deferred tax assets and liabilities are recognized for the future tax consequences attributable to differences between the financial statement carrying amounts of existing assets and liabilities and their respective tax bases. Deferred tax assets and liabilities are measured using enacted tax rates expected to apply to the taxable income in the years in which those temporary differences are expected to be recovered or settled. The effect on deferred tax assets and liabilities of a change in tax rate is recognized in income in the period that includes the enactment date. We estimate valuation allowances on deferred tax assets for the portions that we do not believe will be fully utilized based on projected earnings and usage. Deferred tax assets and liabilities, along with related valuation allowances, are netted by tax jurisdiction and classified as noncurrent on the balance sheet.
US Tax Reform
On December 22, 2017, the Tax Cuts and Jobs Act (the "Tax Act") was signed into law. The Tax Act made numerous changes to many aspects of U.S. corporate income taxation by, among other things, lowering the US corporate income tax rate from 35% to 21%, implementing a territorial tax system and imposing a one-time transition tax on deemed repatriated earning of foreign subsidiaries. As a result of the Tax Act, the Company revalued its net deferred tax liabilities to reflect the tax rate expected to apply in the years in which the temporary differences are expected to reverse. This resulted in an approximate $123.2 million tax benefit. The Tax Act provides a dividends received deduction for any future dividends from non-U.S. subsidiaries to their U.S. parent company. The Tax Act also imposes a one-time deemed repatriation of accumulated post-1986 foreign earnings which have not been previously taxed. The Company recorded a provisional estimate for this transition tax of approximately $7.5 million. Through the third quarter of 2017 the Company had recorded taxes of approximately $46.7 million on the amount of basis difference in foreign subsidiaries which is not indefinitely reinvested. In the fourth quarter of 2017 the Company has recorded a benefit to reflect the reduced rate at which any remaining basis difference will be taxed.
50
The SEC staff issued Staff Accounting Bulletin No. 118 ("SAB 118") to address the application of GAAP in situations when a registrant does not have the necessary information available, prepared, or analyzed (including computations) in reasonable detail to complete the accounting for certain income tax effects of the Tax Act and allows the registrant to record provisional amounts during a measurement period not to extend beyond one year of the enactment date. We have recognized a net tax benefit of $162.4 million for the provisional tax impacts related to the one-time transition tax and the revaluation of deferred tax balances and included these estimates in our consolidated financial statements for the year ended December 30, 2017. We are in the process of analyzing the impact of the various provisions of the Tax Act. The ultimate impact may materially differ from these provisional amounts due to, among other things, additional analysis, changes in interpretations and assumptions we have made, additional regulatory guidance that may be issued, and actions we may take as a result of the Tax Act. We expect to complete our analysis within the measurement period in accordance with SAB 118. See Note 13, Income Taxes, for further details on the impact of the Tax Act.
Employee and Non-Employee Stock-Based Compensation Arrangements
We account for stock option awards based on the fair value-method using the Black-Scholes model. Compensation expense for stock options is recognized using straight-line attribution over the vesting period, which is usually three years, and is adjusted for a forfeiture rate based on historical and estimated future experience.
Compensation expense for restricted shares and restricted units is recognized over the vesting period, which is generally three years, based on the closing stock price on the grant date. Restricted shares receive or accrue the same dividend as common shares outstanding. Non-employee restricted units receive or accrue a non-forfeitable dividend equivalent that is added to the number of units available to vest and is equal to the dividends paid on common shares outstanding.
The fair value of market condition, performance-based restricted units granted to our employees is estimated on the date of grant using a Monte Carlo valuation model, which requires the input of subjective assumptions. The risk free interest rate is based on rates of US Treasury issues with a remaining life equal to the expected life of the performance-based restricted units. The time to maturity reflects the remaining performance period at the grant date. The expected volatility is based on the historical volatility of our common stock over the expected life as we believe this is a reasonable estimate of future volatility.
Compensation expense for performance-based restricted units is recognized using straight-line attribution over the performance period, which is approximately three years, and is adjusted for a forfeiture rate based on historical and estimated future experience. Performance-based restricted units receive or accrue a forfeitable dividend equivalent that is added to the number of units available to vest and is equal to the dividends paid on common shares outstanding.
Self-Insurance Reserves
We maintain reserves for the self-funded portions of employee medical insurance benefits. Our portion of employee medical claims is limited to $0.4 million per participant annually by stop-loss insurance coverage. The accrual for incurred but not reported medical insurance claims was $4.2 million and $3.9 million in 2017 and 2016, respectively.
We maintain self-insurance reserves for workers’ compensation and auto liability for individual losses up to the deductibles which are currently $0.8 million per individual loss for workers' compensation, $0.5 million for auto liability per accident and $0.3 million for auto physical damage per accident. In addition, certain general and product liability claims are self-funded for individual losses up to the $0.8 million insurance deductible. Claims in excess of the deductible are fully insured up to $100 million per occurrence and in the aggregate. We evaluate input from a third-party actuary in the estimation of the casualty insurance obligation on an annual basis. In determining the ultimate loss and reserve requirements, we use various actuarial assumptions, including compensation trends, healthcare cost trends and discount rates. In 2017, we used a discount rate of 2.0%, the same rate used in 2016, based on treasury rates over the estimated future payout period.
We also use historical information for claims frequency and severity in order to establish loss development factors. As of December 30, 2017 and December 31, 2016, we had accrued liabilities related to the retained risks of $18.4 million and $17.3 million, respectively, included in the accruals for casualty insurance claims in our Consolidated Balance Sheets. The liabilities related to our casualty insurance claims were partially offset by estimated reimbursements for amounts in excess of our deductibles associated with these claims of $4.9 million and $4.6 million for 2017 and 2016, respectively, which are included in other noncurrent assets in our Consolidated Balance Sheets.
Derivative Financial Instruments
We are exposed to certain interest rate risks as part of our ongoing business operations and may use derivative financial instruments, where appropriate, to manage these risks. If we elect to do so, and if the instrument meets certain criteria, management designates its derivatives as cash flow hedges. For designated cash flow hedges, the effective portion of the change in fair value is included in accumulated other comprehensive income, net of related tax effects, with the corresponding asset or liability recorded in the
51
Consolidated Balance Sheets. The ineffective portion of the gain or loss, if any, is immediately recognized in the same caption where the hedged items are recognized in the Consolidated Statements of Income. We do not use derivatives for speculative purposes.
Earnings Per Share
Basic earnings per share from continuing and discontinued operations is computed by dividing income from continuing and discontinued operations attributable to Snyder's-Lance, respectively, by the weighted average number of common shares outstanding during each period.
Diluted earnings per share gives effect to all securities representing potential common shares that were dilutive and outstanding during the period. In the calculation of diluted earnings per share, the denominator includes the number of additional common shares that would have been outstanding if our outstanding dilutive stock options had been exercised pursuant to the treasury stock method, or if our outstanding dilutive restricted units or performance-based restricted units had vested and converted to common stock. Anti-dilutive shares are excluded from the dilutive earnings calculation. No adjustment to reported net income is required when computing diluted earnings per share.
Unvested share-based payment awards that contain non-forfeitable rights to dividends or dividend equivalents are participating securities and are treated as a separate class of securities in calculating earnings per share pursuant to the two-class method. We have granted and expect to continue to grant restricted shares with non-forfeitable rights to dividends and restricted units with non-forfeitable rights to dividend equivalents. We include these awards in our calculation of basic and diluted earnings per share using the two-class method when we have undistributed income after considering the effect of dividends declared during the period.
Advertising Costs
Advertising costs (except production costs) are expensed as incurred. Advertising production costs are expensed in the period that the advertisement first takes place or when a decision has been made to not use the advertisement. Advertising costs included in selling, general and administrative expenses on the Consolidated Statements of Income were $59.8 million, $54.7 million and $31.8 million during 2017, 2016 and 2015, respectively.
Research and Development
We conduct research and development for the purpose of developing innovative, high-quality products that exceed consumer expectations. Our efforts include the use of professional product developers such as microbiologists, food scientists and culinary experts who all work in collaboration with innovation, marketing, manufacturing and sales leaders to develop products to meet changing consumer demands as well as formulate new products. In addition to developing new products, the research and development staff routinely reformulates and improves existing products based on advances in ingredients and technology, and conducts value engineering to maintain competitive price points. Our research and development costs were approximately $6.2 million, $10.0 million and $6.2 million in 2017, 2016 and 2015, respectively, and are included in cost of sales in the Consolidated Statements of Income.
Shipping and Handling Costs
We do not bill customers separately for shipping and handling of product. These costs are included as part of selling, general and administrative expenses on the Consolidated Statements of Income. Shipping and handling costs were $179.9 million, $152.4 million and $112.6 million during 2017, 2016 and 2015, respectively.
Loss Contingencies
Various legal actions, claims, and other contingencies arise in the normal course of our business. Specific reserves are provided for loss contingencies to the extent we conclude that a loss is both probable and reasonably estimable. We use a case-by-case evaluation of the underlying data and update our evaluation as further information becomes known. Legal costs are expensed as incurred.
Foreign Currency Translation
The functional currency of our foreign operations is the applicable local currency, the British pound and Euro. The functional currency is translated into US dollars for balance sheet accounts using currency exchange rates in effect as of the balance sheet date, and for revenue and expense accounts using an average exchange rate in effect during the applicable period.
NOTE 2. MERGER AGREEMENT WITH CAMPBELL SOUP COMPANY
On December 18, 2017, we entered into an Agreement and Plan of Merger (the “Merger Agreement”) to be acquired by the Campbell Soup Company ("Campbell"). At the time of the merger, each of our shares of $0.83-1/3 par value common stock will be converted into the right to receive $50.00. The approximate final purchase price is expected to be $4.9 billion and represents a total enterprise value, including debt, of approximately $6.0 billion.
52
The obligations of the parties to consummate the transaction under the Merger Agreement are subject to customary closing conditions. Among those conditions, we are required to call and hold a special shareholder meeting and it is required that our Board of Directors recommend that our shareholders approve the Merger Agreement. Our Board of Directors has made such recommendation in the definitive proxy statement filed with the SEC on February 20, 2018 in advance of the shareholder meeting to be held on March 23, 2018. In connection with the Merger Agreement, certain trusts affiliated with Patricia A. Warehime, a member of our Board, and members of her immediate family, each such trust being a shareholder of the Company (collectively, the “Warehime Holders”), entered into a voting agreement with Campbell, pursuant to which the Warehime Holders agreed, among other things, to vote the shares of Company common stock over which they have voting power in favor of the approval of the merger agreement and the transactions contemplated thereby, including the merger. As of February 16, 2018, the record date for the special meeting, the Warehime Holders owned 12,851,757 shares, or approximately 13.1% of the shares of Company common stock outstanding and entitled to vote at the special meeting. The transactions contemplated by the Merger Agreement are subject to the satisfaction or waiver of certain customary conditions, including the approval of the Merger Agreement by our shareholders, expiration (or earlier termination) of the waiting period under the Hart-Scott-Rodino Antitrust Improvements Act of 1976, as amended, which was satisfied on February 2, 2018 when the waiting period was terminated, the absence of any legal prohibitions, the accuracy of the representations and warranties of the parties, and compliance by the parties with their respective obligations under the Merger Agreement. Assuming all conditions are met, we expect this transaction will close late in the first quarter of 2018.
Under certain circumstances defined within the Merger Agreement, in the event that we terminate the Merger Agreement, we would be required to pay a termination fee in the amount of $149.0 million. In the event that Campbell terminates the agreement, subject to certain limitation set forth in the Merger Agreement, they would be required to pay a termination fee of $198.6 million.
Four putative class action lawsuits related to the proposed Merger were filed by purported shareholders of the Company. These lawsuits (together, the “Actions”) captioned Shaev v. Snyder’s-Lance, Inc., et al. (Case No.3:18-cv-00039) (the “Shaev Action”), Sciabacucchi v. Snyder’s-Lance, Inc., et al. (Case No. 3:18-cv-00049-RJCDCK) (the “Sciabacucchi Action”), Kendall v. Snyder’s-Lance, Inc., et al. (Case No. 3:18-cv-00051) (the “Kendall Action”), and Daniel v. Snyder’s-Lance, Inc., et al. (Case No. 3:18-cv-00058) (the “Daniel Action”) were filed in the United States District Court for the Western District of North Carolina on January 25, 2018, January 29, 2018, January 30, 2018, and January 31, 2018, respectively. The Actions name as defendants the Company and the members of the Company’s Board, and allege that the defendants filed a materially incomplete and misleading proxy statement on Schedule 14A in violation of Sections 14(a) and 20(a) of the Exchange Act of 1934, as amended (the “Exchange Act”) and SEC Rule 14a-9. Additionally, the Sciabacucchi Action names Campbell as a defendant, and alleges that Campbell violated Section 20(a) of the Exchange Act. The Kendall Action seeks to enjoin the shareholder vote on the proposed merger, and the Shaev, Sciabacucchi, and Daniel Actions seek to enjoin the defendants from proceeding with or consummating the proposed merger or, in the event the merger is consummated, request that the Court issue an order rescinding the merger and/or awarding rescissory damages. Additionally, the Shaev and Kendall Actions seek that the Court direct defendants to account for alleged damages, and all the Actions seek attorneys’ and expert fees and expenses. The Company believes these Actions are without merit.
In the fourth quarter of 2017, we incurred $2.1 million of professional fees associated with this transaction. During the first quarter of 2018 through the time of closing, we expect to incur approximately $50 million to $60 million of additional expenses for additional professional fees and costs related to the merger. Under the terms of the change in control provisions of our incentive compensation awards and the terms of the Merger Agreement, all time-based, unvested equity awards will vest immediately and all performance-based awards will vest pro-rata at the higher of actual or target attainment. This will result in approximately $20 million to $25 million of additional expense recorded at the time of close due to this acceleration.
NOTE 3. NEW ACCOUNTING STANDARDS
Recently Adopted
On January 5, 2017 the Financial Accounting Standards Board (“FASB”) issued ASU 2017-01, Clarifying the Definition of a Business. This accounting standard clarifies the definition of a business to assist entities with evaluating whether transactions should be accounted for as acquisitions (or disposals) of assets or businesses. Under the new guidance, an entity first determines whether substantially all of the fair value of the gross assets acquired is concentrated in a single identifiable asset or a group of similar identifiable assets. If this threshold is met, the assets are not considered a business for the purpose of allocating the purchase price. If it is not met, the entity then evaluates whether the set meets the requirements that a business include, at a minimum, an input and a substantive process that together significantly contribute to the ability to create outputs. Under the new guidance, the purchase or sale of a route will no longer be considered the purchase or sale of a business for accounting purposes due to the fact that the perpetual and exclusive distribution rights (a route) represent substantially all of the fair value of any given acquisition from or disposition to an IBO. There has been no change to our relationships or interactions with the IBOs. However, under the new guidance, we will no longer allocate any of the purchase price to goodwill upon acquisition of a route and we will no longer
53
perform a relative fair value allocation of goodwill upon divestitures. We have adopted this accounting standard prospectively at the beginning of the fourth quarter of 2017. Although we will no longer have goodwill allocated on future route acquisitions or divestitures, we will continue to record gains and losses associated with the sale of routes. The impact from adopting the standard is disclosed in Note 11, Goodwill and Other Intangible Assets, and is not material to our consolidated financial statements.
On November 17, 2016, the FASB issued ASU No. 2016-18, Restricted Cash. This accounting standard requires that a statement of cash flows explain the change during the period in the total of cash, cash equivalents, and amounts generally described as restricted cash or restricted cash equivalents. Therefore, amounts generally described as restricted cash and restricted cash equivalents should be included with cash and cash equivalents when reconciling the beginning-of-period and end-of-period total amounts shown on the statement of cash flows. The new guidance is effective for interim and annual reporting periods beginning after December 15, 2017 and early adoption is permitted. The amendment should be adopted retrospectively. We early adopted this guidance in the first quarter of 2017 and the adoption resulted in reclassifications of $0.3 million cash inflows from investing activities to operating activities for each of the twelve months ended December 30, 2017 and December 31, 2016 and no reclassifications for the twelve months ended January 2, 2016.
The following table provides a reconciliation of cash, cash equivalents and restricted cash reported within the Consolidated Balance Sheets that sum to the total of the same such amounts shown in the Consolidated Statement of Cash Flows.
(in thousands) | December 30, 2017 | December 31, 2016 | January 2, 2016 | |||||||||
Cash and cash equivalents | $ | 18,703 | $ | 35,409 | $ | 39,105 | ||||||
Restricted cash | 446 | 714 | 966 | |||||||||
Total cash, cash equivalents and restricted cash shown in the Consolidated Statement of Cash Flows | $ | 19,149 | $ | 36,123 | $ | 40,071 | ||||||
On August 26, 2016, the FASB issued ASU No. 2016-15, Classification of Certain Cash Receipts and Cash Payments. This accounting standard is intended to eliminate diversity in practice in how certain cash receipts and cash payments are presented and classified in the statement of cash flows. The updated guidance is effective for interim and annual reporting periods beginning after December 15, 2017, and early adoption is permitted. We adopted this guidance in the first quarter of 2017 and the impact on our Consolidated Statements of Cash Flows was a reclassification of $6.2 million cash outflows from operating activities to repayments of long-term debt within financing activities for the twelve months ended December 31, 2016.
The table below summarizes the impact on the Statement of Cash Flows for the twelve months of 2016.
(in thousands) | Previous Classification | Impact | Current Classification | |||||||||
Operating activities: | ||||||||||||
Gain on write-off of debt premium | $ | (1,341 | ) | $ | 1,341 | $ | — | |||||
Loss on early extinguishment of debt | — | 4,749 | 4,749 | |||||||||
Other noncurrent liabilities | 1,341 | 80 | 1,421 | |||||||||
Net cash provided by operating activities | 261,199 | 6,170 | 267,369 | |||||||||
Financing activities: | ||||||||||||
Repayments of long-term debt | (438,625 | ) | (6,170 | ) | (444,795 | ) | ||||||
Net cash provided by financing activities | $ | 853,008 | $ | (6,170 | ) | $ | 846,838 | |||||
54
On March 30, 2016, the FASB issued ASU No. 2016-09, Improvements to Employee Share-Based Payment Accounting. The updated guidance is effective for interim and annual reporting periods beginning after December 15, 2016. The updated guidance includes multiple provisions intended to simplify various aspects of the accounting for share-based payments. We adopted the accounting standard in the first quarter of 2017 and the impact to our consolidated financial statements are as follows:
• | Excess tax benefits for share-based payments were previously recognized through income tax receivable and equity, and presented as a financing cash flow. As a result of adopting this accounting standard, excess tax benefits for share-based payments are recognized as an adjustment to income tax expense and reflected in operating cash flows. We elected to adopt this provision of the accounting standard prospectively which resulted in income tax benefit of $6.9 million for the year ended December 30, 2017. |
• | The guidance allows the employer to withhold up to the maximum statutory tax rates in the applicable jurisdictions without triggering liability accounting. Our accounting treatment of outstanding equity awards was not impacted by our adoption of this provision of the accounting standard. |
• | The guidance allows for a policy election to account for forfeitures as they occur rather than on an estimated basis. We did not make this election, and continue to account for forfeitures on an estimated basis. |
On January 26, 2017 the FASB issued ASU 2017-04, Simplifying the Test for Goodwill Impairment. This accounting standard simplifies how an entity is required to test goodwill for impairment by eliminating step 2 from the goodwill impairment test, which measures a goodwill impairment loss by comparing the implied fair value of a reporting unit’s goodwill with the carrying amount. Instead, entities should perform annual or interim goodwill impairment tests by comparing the fair value of a reporting unit with its carrying amount and recognize an impairment charge for the excess of carrying amount over the fair value of the respective reporting unit. The guidance is effective for annual or interim goodwill impairment tests in fiscal years beginning after December 15, 2019. Early adoption of the ASU is permitted for interim or annual goodwill impairment tests performed on testing dates after January 1, 2017. We adopted this standard in the second quarter of 2017 and applied its guidance in our goodwill impairment testing procedures performed during the third and fourth quarters of 2017, as discussed further in Note 11.
Not Yet Adopted
On May 28, 2014, the FASB issued ASU No. 2014-09, Revenue from Contracts with Customers (Topic 606), which provides for a single five-step model to be applied to all revenue from contracts with customers. The guidance also requires improved disclosures to help users of the financial statements better understand the nature, amount, timing and uncertainty of revenue that is recognized. In August 2015, the FASB issued ASU No. 2015-14, Revenue from Contracts with Customers: Deferral of the Effective Date, which deferred the effective date of ASU No. 2014-09 by one year, to December 15, 2017 for interim and annual reporting periods beginning after that date.
We have completed our review of customer contracts and do not expect a material impact to our balance sheet. The immaterial impact of adopting ASU No. 2014-09 primarily relates to the following:
• | Coupon liabilities will commence when control of the goods are transferred to the customer rather than when the coupon is distributed, which will accelerate the recognition of coupon expense under the new standard. |
• | Contract manufacturing arrangements are recognized as revenue when product is delivered to the customer. If any of our contracts create an asset without an alternative use and an enforceable right to payment, then we would recognize revenue at the time of production rather than shipment under the new standard. The right to payment is enforceable under certain contracts. |
We have adopted ASC Topic 606, Revenue from Contracts with Customers, on December 31, 2017, the first day of our fiscal 2018. We applied the modified retrospective approach and the impact of adoption was not material.
On October 24, 2016, the FASB issued ASU No. 2016-16, Intra-Entity Transfers of Assets Other Than Inventory. This accounting standard is intended to improve the accounting for the income tax consequences of intra-entity transfers of assets other than inventory. The updated guidance indicates that an entity should recognize the income tax consequences of an intra-entity transfer of an asset other than inventory when the transfer occurs instead of when the asset has been sold to an outside party. The updated guidance is effective for annual reporting periods beginning after December 15, 2017, including interim reporting periods within those annual reporting periods, and early adoption is permitted. The amendments are to be applied on a modified retrospective basis through a cumulative-effect adjustment directly to retained earnings as of the beginning of the period of the adoption. We
55
have adopted ASU No. 2016-16, Intra-Entity Transfers of Assets Other Than Inventory, on December 31, 2017, the first day of our fiscal 2018. There was no impact of adoption to the financial statements.
On May 10, 2017 the FASB issued ASU No. 2017-09, Scope of Modification Accounting. This accounting standard provides clarity when applying the guidance in Topic 718, Compensation-Stock Compensation, to a change to the terms or conditions of a share-based payment award. The ASU provides guidance on which changes to the terms or conditions of a share-based payment award require an entity to apply modification accounting. According to this accounting standard, an entity should account for the effects of a modification unless the fair value, vesting conditions, and classification of the modified award are the same as the original award. The updated guidance is effective for annual reporting periods, and interim reporting periods within those annual reporting periods, beginning after December 15, 2017. We have adopted ASU No. 2017-09, Scope of Modification Accounting, on December 31, 2017, the first day of our fiscal 2018. There was no impact of adoption to the financial statements.
On August 28, 2017, the FASB issued ASU 2017-12, Targeted Improvements to Accounting for Hedging Activities. The objective of this accounting standard is to better align hedge accounting with an organization’s risk management activities in the financial statements. For our cash flow hedges of variable interest rate risk, the new guidance will allow the variability in cash flows attributable to the contractually specified interest rate to be designated as the hedged risk. The new guidance also requires an entity to present the earnings effect of the hedging instrument in the same income statement line item in which the earnings effect of the hedged item is reported, thus eliminating the separate presentation of hedge ineffectiveness. The updated guidance is effective for annual reporting periods, and interim reporting periods within those annual reporting periods, beginning after December 15, 2018. Early adoption is permitted. We plan to adopt this standard in the first quarter of 2019 and do not expect a material impact to the financial statements upon adoption.
On February 25, 2016, the FASB issued ASU No. 2016-02, Leases. This ASU requires us to recognize a lease liability for the obligation to make lease payments, measured at the present value on a discounted basis, and a right-of-use (“ROU”) asset for the right to use the underlying asset for the duration of the lease term, measured at the lease liability amount adjusted for lease prepayments, lease incentives received and initial direct costs. The lease liability and ROU asset are recognized in the balance sheet at the commencement of the lease. For income statement purposes, the FASB retained a dual model, requiring leases to be classified as either operating or finance. Operating leases will result in straight line expense while finance leases will result in a front-loaded expense pattern. Classification will be based on criteria that are largely similar to those applied in current lease accounting. ASU 2016-02 is effective for annual reporting periods, including interim periods within those periods, beginning after December 15, 2018, and requires the use of a modified retrospective approach for leases that exist or are entered into after the beginning of the earliest comparative period presented in the financial statements. Early application of the ASU is permitted. We are in the process of evaluating lease accounting software and developing an inventory of our lease arrangements in order to determine the impact this accounting standard will have on our financial statements. Based on our assessment to date, we expect this guidance will have a material impact on our balance sheet due to the amount of our lease commitments, but we are unable to quantify the impact at this time.
Other amendments to GAAP in the US that have been issued by the FASB or other standards-setting bodies that do not require adoption until a future date are not expected to have a material impact on our consolidated financial statements upon adoption.
56
NOTE 4. DISCONTINUED OPERATIONS
Sale of Diamond of California
On November 28, 2016, we entered into a definitive agreement to sell our culinary nuts business (comprised primarily of the Diamond of California® brand and the Stockton, CA facility; collectively "Diamond of California"). The sale of Diamond of California represented a strategic shift in our business and aligns with the Company's strategy to focus more resources on the growth opportunities for our snack food brands. On December 31, 2016, we completed the sale for estimated net proceeds of $128.6 million, consisting of $118.6 million of cash and $10 million in a promissory note. As of December 31, 2016, we had a receivable due from the purchaser recorded in receivable from sale of Diamond of California on our Consolidated Balance Sheet. We received the cash proceeds from the sale of Diamond of California on January 3, 2017. During 2017, we finalized the calculation of working capital in accordance with the sale agreement which had an immaterial impact to discontinued operations. Also during 2017, we adjusted our walnut price liability to reflect the final prices contained within the California Department of Food and Agriculture Walnut/Raisin/Prune Report State Summary - 2016 Crop Year. In addition, in 2017, we identified and recorded a pretax out-of-period correction of $2.6 million ($1.7 million after tax) to reduce the walnut price liability which related to an error recorded in the fourth quarter of 2016. We concluded that the correction of the error was not material to these or our previously issued financial statements.
The promissory note is due on June 30, 2025. Interest on the principal balance in this promissory note accrues at a rate per annum equal to the 30-day LIBOR rate, plus 3.00%, provided that in no event shall the applicable rate exceed 6.00% per annum. The note is recorded within other noncurrent assets on our Consolidated Balance Sheets.
As a result of the sale of Diamond of California, revenues and expenses that no longer continued after the sale of Diamond of California, and where we had no substantial continuing involvement, were reclassified to discontinued operations in the Consolidated Statements of Income.
For 2017 and 2016, income statement amounts associated with discontinued operations were as follows:
(in thousands) | 2017 | 2016 | ||||||
Net revenue | $ | — | $ | 204,443 | ||||
Cost of sales | — | 156,008 | ||||||
Gross profit | — | 48,435 | ||||||
Selling, general and administrative | — | 33,638 | ||||||
(Gain) loss on sale of Diamond of California | (3,069 | ) | 32,645 | |||||
Income (loss) from discontinued operations before income taxes | 3,069 | (17,848 | ) | |||||
Income tax expense | 1,133 | 9,252 | ||||||
Income (loss) from discontinued operations, net of income tax | $ | 1,936 | $ | (27,100 | ) | |||
The discontinued operations pretax income activity for 2017 generated income tax expense of $1.1 million, for an effective tax rate of 36.9%. The discontinued operations pretax loss activity for 2016 generated income tax expense of $9.2 million, for an effective tax rate of (51.8)%. The tax expense for 2016 is generated by the sale of Diamond of California, which included sale of goodwill which had no tax basis and for which no deferred tax liability was recorded.
57
During 2016, we recorded a pretax loss in discontinued operations of approximately $32.6 million on the sale of Diamond of California, which was calculated as follows:
(in thousands) | Total | |||
Net proceeds | $ | 128,577 | ||
Less carrying value of net assets transferred: | ||||
Transaction related expenses | 2,805 | |||
Net working capital | 31,874 | |||
Pension liability and other long-term assets and liabilities, net | (11,071 | ) | ||
Fixed assets, net | 19,695 | |||
Goodwill (1) | 48,845 | |||
Other intangible assets, net | 69,074 | |||
Loss on sale of Diamond of California | $ | (32,645 | ) | |
(1) The component of goodwill included in the carrying amount of net assets transferred was based on the fair value of Diamond of California relative to the fair value of the remaining business within its reporting unit in accordance with FASB ASC 350, Intangibles - Goodwill and Other.
The following table provides depreciation, amortization, capital expenditures, sale proceeds, and significant operating non-cash items of discontinued operations for 2017 and 2016.
(in thousands) | 2017 | 2016 | |||||
Cash flows from discontinued operating activities | |||||||
Depreciation and amortization | $ | — | $ | 4,467 | |||
Stock-based compensation expense | — | 2,101 | |||||
(Gain)/loss on sale of Diamond of California | (3,069 | ) | 32,645 | ||||
Payable to growers (1) | — | 41,948 | |||||
Cash flows from discontinued investing activities | |||||||
Capital expenditures | $ | — | $ | 514 | |||
Proceeds from sale of discontinued operations | 119,658 | — | |||||
Non-cash discontinued investing activities | |||||||
Proceeds from the sale of discontinued operations, not yet received, less transaction costs, not yet paid | $ | 800 | $ | 125,772 | |||
(1) The operating cash inflow generated by the increase in payable to growers from $38.3 million acquired on February 29, 2016 to $80.3 million sold in the disposition of Diamond of California on December 31, 2016.
As a result of the sale of Diamond of California, we had a significant amount of stock-based compensation awards that accelerated vesting at the sale date due to change in control provisions. We recognized $1.3 million in stock-based compensation expense from awards that vested due to acceleration clauses within employment agreements with employees who were terminated as part of the sale.
In connection with the sale of Diamond of California, we entered into a Supply Agreement ("Walnut Supply Agreement") to procure walnuts from the purchaser for an initial term of five years subsequent to the sale transaction, which will be used in the manufacture of Emerald® branded products. Under this agreement, the purchaser has the right to match third party offers for sale of such walnuts to us.
58
Additionally, we entered into a Transition Services Agreement ("Stockton TSA") and a Facility Use Agreement ("Stockton FUA"), both effective immediately subsequent to the sale transaction, to facilitate the orderly transfer of Emerald® and Pop Secret® business operations to Company-owned facilities. The Stockton TSA stipulated certain finance, accounting, sales, marketing, human resources, information technology, supply chain, manufacturing, and other general services to be provided between us and the purchaser, during an initial term of 120 days, with extension provisions if necessitated. The Stockton FUA had an initial term of six months, with extension provisions if necessitated, and provided us with the right to access Diamond of California's Stockton, CA manufacturing facility, for the purpose of manufacturing certain Emerald® branded products. Permitted uses under this agreement include use of certain equipment and storage of inventories related to the Emerald® production process. Services under the Stockton TSA and the Stockton FUA are completed at this time. We also entered into a contract manufacturing agreement with the purchaser to manufacture certain products for us throughout 2017. At this time, the contract manufacturing agreement has ended.
NOTE 5. BUSINESS ACQUISITIONS
2017 Acquisitions
Acquisition of Cornpoppers Limited
On September 25, 2017, we acquired Cornpoppers Limited ("Cornpoppers") for approximately $2.6 million, of which $2.1 million has been allocated to goodwill. Cornpoppers is a U.K. popcorn manufacturer supplying branded and private label popcorn products to retailers and wholesalers.
Acquisition of Natural Food Works Group, LLC
On February 17, 2017, we made a $1.5 million investment for approximately 23% of the ownership in Natural Food Works Group, LLC, an experienced food manufacturer specializing in natural and organic products. We are accounting for this investment under the equity method.
2016 Acquisitions
Acquisition of Diamond Foods
On February 29, 2016, we acquired Diamond Foods, Inc. ("Diamond Foods") for $1,857.2 million in a cash and stock transaction, including our repayment of $651.0 million of Diamond Foods’ indebtedness, accrued interest and related fees. Diamond Foods, a leading snack food company that possessed five brands, including: Kettle Brand® potato chips; KETTLE® Chips; Pop Secret® popcorn; Emerald® snack nuts; and Diamond of California® culinary nuts. As a result of the acquisition, Diamond Foods became our wholly-owned subsidiary. We also obtained 26% of the outstanding shares of Metcalfe's Skinny Limited ("Metcalfe"), owner of Metcalfe's skinny®, a premium ready-to-eat ("RTE") popcorn brand in the U.K., which is described below.
At the effective time of the acquisition of Diamond Foods, each share of Diamond Foods common stock that was issued and outstanding immediately prior to the effective time (other than (i) treasury shares held by Diamond Foods, (ii) shares owned by Snyder’s-Lance or any of our subsidiaries and (iii) shares that were owned by stockholders who had perfected and not withdrawn a demand for appraisal rights pursuant to Delaware law) were cancelled and converted into the right to receive $12.50 in cash and 0.775 shares of Snyder’s-Lance common stock, par value $0.83-1/3 per share. Additionally, at the effective time of the acquisition of Diamond Foods, all of its outstanding stock-based compensation awards, then comprised of restricted shares, restricted units, performance-based restricted units, and stock options, converted to replacement Snyder's-Lance awards or were settled with merger consideration. The fair value of the replacement awards, whether vested or unvested, was included in the purchase price to the extent that pre-acquisition services had been rendered. The purchase price also included the fair value of accelerated vesting for awards that vested at the acquisition date due to change in control provisions. The remainder of the fair value of the unvested outstanding replacement awards is being recognized as compensation expense over the applicable future vesting period in the periods following the acquisition date.
59
The following is a summary of consideration transferred in the acquisition of Diamond Foods:
Conversion Calculation | Fair Value (in thousands) | |||||||
Diamond Foods common shares outstanding as of February 29, 2016 | 31,062,164 | |||||||
Multiplied by 0.775 per the Merger Agreement | 0.775 | |||||||
Total Snyder's-Lance common shares issued to Diamond Foods stockholders | 24,071,839 | |||||||
Multiplied by Snyder's-Lance closing stock price as of February 26, 2016 | $ | 32.34 | ||||||
Total stock consideration for outstanding common shares | $ | 778,483 | ||||||
Cash consideration of $12.50 per Diamond Foods common share outstanding as of February 29, 2016, including cash paid in lieu of fractional converted shares | 388,318 | |||||||
Total cash and stock consideration to stockholders | $ | 1,166,801 | ||||||
Fair value of replacement cash awards and stock-based awards attributable to pre-acquisition service, including awards that accelerated vesting at acquisition date due to change in control provisions (1) | 28,211 | |||||||
Repayment of Diamond Foods’ outstanding debt due to change in control provisions (2) | 651,044 | |||||||
Liability for value of Dissenters' merger consideration (3) | 12,418 | |||||||
Total fair value of consideration transferred | $ | 1,858,474 | ||||||
Effective settlement of accounts payable owed by us to Diamond Foods at acquisition date | (1,295 | ) | ||||||
Total purchase consideration | $ | 1,857,179 | ||||||
(1) The fair value of the Snyder's-Lance replacement cash awards, settled common stock, restricted share awards, restricted unit awards and stock options was calculated as of February 29, 2016 using conversion terms outlined in the Merger Agreement. The closing stock price on February 26, 2016, the last trading day before closing, was used in the fair valuation of settled common stock, restricted share awards and restricted unit awards. The fair value of the stock options was estimated using the Black-Scholes valuation model utilizing the assumptions noted below:
Assumptions used for the valuation of replacement Snyder's-Lance stock options: | |
Stock price as of February 26, 2016 | $32.34 |
Post-conversion exercise price | $11.75 - $80.24 |
Average expected volatility | 31.18% |
Expected dividend yield | 1.98% |
Weighted average risk-free interest rate | 0.33% |
Weighted average expected life | 0.3 years |
Black-Scholes weighted average value per option | $15.22 |
The expected volatility of the Snyder’s-Lance stock price was based on average historical volatility, which was based on observations and a duration consistent with the expected life assumption. The weighted average expected life of the option was calculated using the simplified method by using the vesting term of the option and the option expiration date. The risk-free interest rate was based on US treasury securities with maturities equal to the expected life of the option.
(2) Repayment of Diamond Foods’ outstanding debt was required as part of the consideration to be transferred due to change in control provisions that were triggered upon acquisition. The repayment amount was calculated as of February 29, 2016 by taking Diamond Foods’ outstanding long-term debt and current portion of long-term debt of $633.2 million and adding accrued interest of $9.0 million and a prepayment penalty of $8.8 million.
(3) Estimate of merger consideration unpaid and owed to certain Diamond Foods stockholders as of the acquisition date that would have otherwise received $12.50 in cash and 0.775 shares of Snyder’s-Lance common stock for each share of Diamond Foods common stock held, which was paid during 2016.
60
The acquisition was accounted for as a business combination. Management has used its best estimate in the allocation of the purchase price to assets acquired and liabilities assumed based on the estimated fair value of such assets and liabilities. The following table summarizes the allocation of assets acquired and liabilities assumed as part of the acquisition:
(in thousands) | Purchase Price Allocation | |||
Cash and cash equivalents | $ | 22,340 | ||
Accounts receivable | 78,991 | |||
Inventories | 156,712 | |||
Prepaid expenses and other current assets | 13,575 | |||
Fixed assets | 128,210 | |||
Goodwill | 831,228 | |||
Other intangible assets | 950,294 | |||
Equity investments | 12,595 | |||
Other long term assets | 973 | |||
Total assets acquired | 2,194,918 | |||
Accounts payable, and other current liabilities, including payable to growers | 121,635 | |||
Deferred income tax liability, net | 194,413 | |||
Other long term liabilities | 21,691 | |||
Total liabilities assumed | 337,739 | |||
Net assets acquired (1) | $ | 1,857,179 | ||
(1) Net assets acquired include the effective settlement of $1.3 million in accounts payable owed by us to Diamond Foods at the time of the acquisition.
As of December 31, 2016, the purchase price allocation was considered complete. Of the estimated $950.3 million of acquired intangible assets, $355.3 million were assigned to customer relationships and is being amortized over 20 years. The remaining value of acquired intangible assets of $595.0 million was assigned to trademarks, which are not subject to amortization because they have indefinite lives. The increase in the carrying value of assets to fair value as a result of purchase price adjustments is not deductible for income tax purposes.
Goodwill represents the future economic benefit arising from other assets acquired that could not be individually identified and separately recognized. The goodwill is attributable to the general reputation, assembled workforce, acquisition synergies and the expected future cash flows of Diamond Foods' business.
We recorded a net deferred tax liability of $194.4 million related to the acquisition of Diamond Foods. We recorded deferred tax liabilities of $384.6 million relating primarily to basis differences in identified intangible assets acquired, which includes $49.2 million related to un-repatriated foreign earnings, based on management’s assessment of the amount of earnings not considered to be indefinitely reinvested. We recorded a deferred tax asset of $190.2 million, of which $143.7 million was recorded for federal and state net operating loss carryforwards, and a further $9.4 million for other federal and state tax credit carryforwards. In addition, a valuation allowance of $10.7 million has been recorded, based on management’s assessment of the ability to utilize these deferred tax assets.
Transaction and integration related expenses associated with the acquisition of Diamond Foods were approximately $3.0 million, $66.3 million and $7.7 million for 2017, 2016 and 2015, respectively, and are included in a separate line in the Consolidated Statements of Income. The costs incurred in 2017 included legal and other professional fees and idle facility lease costs. Transaction and integration expenses in continuing operations for 2016, include $17.5 million of severance and retention benefits, and $16.4 million of accelerated stock-based compensation, which was recognized due to the change in control and severance agreements for the Diamond Foods executive team. The remaining costs were primarily investment banking fees, as well as other professional and legal fees associated with completion of the acquisition, and subsequent integration of Diamond Foods.
61
Diamond Foods' results were included in our Consolidated Statements of Income from February 29, 2016. We recognized incremental Diamond Foods net revenue of $443.5 million in 2016. A portion of Diamond Foods revenue was eliminated in consolidation because it was sold to other Snyder's-Lance subsidiaries for distribution through the DSD network. As a result of progress we have made integrating Diamond Foods, it is impracticable to disclose separately Diamond Foods' contributions to income before income taxes in 2016.
The following unaudited pro forma consolidated financial information has been prepared, as if the acquisition of Diamond Foods had taken place at the beginning of 2015. These unaudited pro forma results include estimates and assumptions regarding increased amortization of intangible assets related to the acquisition, reduced interest expense related to lower interest rates associated with the new combined debt, and the related income tax effects. Pro forma results are not necessarily indicative of the results that would have occurred if the acquisition had occurred on the date indicated, or that may result in the future for various reasons, including the potential impact of revenue and cost synergies on the business.
(in thousands) | 2016 | 2015 | ||||||
Net revenue (1) | $ | 2,443,284 | $ | 2,469,732 | ||||
Net income attributable to Snyder's-Lance, Inc. (1) | $ | 64,027 | $ | 75,498 | ||||
(1)The unaudited pro forma consolidated financial information does not reflect the sale of Diamond of California.
The unaudited pro forma consolidated financial information for 2016 and 2015 included increased amortization expense of $2.1 million and $10.0 million, respectively, as a result of acquired intangible assets. In addition, the unaudited pro forma consolidated financial information for 2016 and 2015 included reduced interest expense related to debt of $1.3 million and $13.0 million, respectively. This reduction is due to the lower interest rates associated with our new combined debt, as more fully described in Note 12.
We also included a reduction in cost of goods sold of $15.9 million in the unaudited pro forma consolidated financial information for 2016, related to the elimination of the inventory step-up recorded during the year in connection with the Diamond Foods acquisition. We included additional cost of goods sold in the unaudited pro forma financial information for 2015 of $15.6 million. The net incremental expense represents the financial impact of the inventory step-up recorded in connection with the Diamond Foods acquisition.
For 2016, we included a reduction in non-recurring transaction-related expenses of $50.2 million, which were directly related to the Diamond Foods acquisition. These transaction-related expenses, and additional transaction-related expenses incurred prior to the end of 2015, were included as additional expenses of $60.4 million in the unaudited pro forma consolidated financial information for the first quarter of 2015.
Acquisition of Metcalfe's Skinny Limited
In January 2016, Diamond Foods obtained 26% of the outstanding shares of Metcalfe, which we acquired in the Diamond Foods’ transaction. On September 1, 2016, we completed the acquisition of Metcalfe by acquiring the remaining 74% interest for approximately $9.7 million. Metcalfe is the owner of Metcalfe's skinny®, a premium RTE popcorn brand in the U.K., in addition to a growing range of corn and rice cake products.
Because of our purchase of the remaining 74% interest in Metcalfe, the equity of the entire entity was increased to fair value, which resulted in the revaluation of our prior 26% interest. However, as this 26% interest was recorded at fair value in the Diamond Foods opening balance sheet on February 29, 2016, the revaluation did not result in a significant gain or loss. The fair value of 100% of Metcalfe was determined to be $13.2 million, of which $1.5 million was preliminarily allocated to current assets, $7.2 million to goodwill, $8.8 million to other intangible assets and $4.3 million to total liabilities. Goodwill represents the future economic benefit arising from other assets acquired that could not be individually identified and separately recognized. Prior to our acquisition of the remaining 74% of Metcalfe, our share of income for the period subsequent to February 29, 2016, was not material and was included in other income, net, in the Consolidated Statements of Income. Subsequent to our acquisition of the remaining 74% of Metcalfe on September 1, 2016, Metcalfe's results were consolidated into our Consolidated Statements of Income. Net revenue and net income from Metcalfe for the period subsequent to acquisition of the remaining 74% was not material.
62
NOTE 6. PERFORMANCE TRANSFORMATION PLAN
As announced on April 17, 2017, our Board of Directors and senior management team have been conducting a comprehensive review of our Company’s operations with the goal of significantly improving our financial performance to deliver greater value to shareholders. As a result of this review, we have initiated a Performance Transformation Plan (the "Transformation Plan") focused on six key areas:
• | SG&A Expense Efficiency. Reduce direct spending and accelerate zero-based budgeting to improve indirect costs. |
• | Manufacturing and Supply Chain Productivity. Reduce manufacturing and distribution network complexity and improve productivity. |
• | Product and Portfolio Optimization. Reduce business complexity through stock keeping unit ("SKU") rationalization and ongoing portfolio maintenance. |
• | Price Realization. Improve trade spend productivity and effectiveness and optimize brand assortment. |
• | Marketing Investment Optimization. Reset working/non-working ratios and increase investment in our core branded portfolio. |
• | Channel Execution Excellence. Elevate the performance of the existing IBO and DSD network. |
As part of the plan, on June 26, 2017, our Board of Directors approved the closure of our manufacturing facility in Perry, Florida and an incremental reduction in workforce across the organization which continued into the third and fourth quarters of 2017. To date, we have eliminated approximately 300 jobs. The production of products previously manufactured in the Perry facility has been relocated to facilities with available capacity. A liability of $1.2 million is included in accrued compensation on the Condensed Consolidated Balance Sheet as of December 30, 2017.
During the year ended December 30, 2017, changes to the balance related to the Transformation Plan were as follows:
(in thousands) | Severance and Related Costs (1) | Asset Impairments | Professional Fees | Other (2) | Total | |||||||||||||||
Liability balance, December 31, 2016 | $ | — | $ | — | $ | — | $ | — | $ | — | ||||||||||
Charges | 9,011 | 8,859 | 7,278 | 4,454 | 29,602 | |||||||||||||||
Cash spent | (7,420 | ) | — | (7,278 | ) | (309 | ) | (15,007 | ) | |||||||||||
Non-cash settlements/adjustments | (440 | ) | (8,859 | ) | — | (4,145 | ) | (13,444 | ) | |||||||||||
Liability balance, December 30, 2017 | $ | 1,151 | $ | — | $ | — | $ | — | $ | 1,151 | ||||||||||
(1) This represents only the accrued severance and related costs for the Transformation Plan. This does not include all severance accrued as of December 31, 2016 or December 30, 2017.
(2)This primarily represents write off of certain materials and packaging associated with our elimination of certain SKU items.
The following table summarizes recognized charges related to the Transformation Plan in 2017:
(in thousands) | Year ended | |||
December 30, 2017 | ||||
Cost of sales | $ | 7,223 | ||
Selling, general, and administrative | 13,520 | |||
Impairment charges | 8,859 | |||
Total | $ | 29,602 | ||
The full scope of the Transformation Plan and specific actions to be taken continue to be developed by senior management and our Board of Directors. These plans will evolve over the course of the Transformation Plan. At this point in time, we cannot reasonably estimate the future expenses and cash payments, nor their timing other than those outlined above. The Transformation Plan is targeting completion in 2020. We are anticipating that the Transformation Plan will result in 14% operating profit margin (on an adjusted basis) and an incremental operating income of $175 million improvement to our operating income by 2020. These targets are based on our adjusted results, as approved by our Board of Directors and may not align with our GAAP results. As of December 30, 2017, we have achieved incremental operating income and are on pace with where we expected to be at this point in time.
63
NOTE 7. EARNINGS PER SHARE
The calculation of basic and diluted earnings per share using the two-class method, for income from continuing operations:
(in thousands, except per share data) | 2017 | 2016 | 2015 | |||||||||
Basic EPS: | ||||||||||||
Income from continuing operations | $ | 146,556 | $ | 41,985 | $ | 50,685 | ||||||
Less: Income from continuing operations allocated to participating securities | 472 | — | 137 | |||||||||
Income from continuing operations allocated to common shares | $ | 146,084 | $ | 41,985 | $ | 50,548 | ||||||
Weighted average shares outstanding – Basic | 96,594 | 91,873 | 70,487 | |||||||||
Earnings per share – Basic | $ | 1.51 | $ | 0.46 | $ | 0.72 | ||||||
Diluted EPS: | ||||||||||||
Weighted average shares outstanding – Basic | 96,594 | 91,873 | 70,487 | |||||||||
Effect of dilutive stock options, restricted units and performance-based restricted units on shares outstanding | 873 | 1,018 | 655 | |||||||||
Weighted average shares outstanding – Diluted | 97,467 | 92,891 | 71,142 | |||||||||
Earnings per share – Diluted | $ | 1.50 | $ | 0.45 | $ | 0.71 | ||||||
There were approximately 2.0 million and 1.3 million stock options and restricted units excluded from the calculation of diluted earnings per share for 2017 and 2016, respectively, because their effects were anti-dilutive. There were no anti-dilutive shares in 2015.
NOTE 8. STOCK-BASED COMPENSATION
Total stock-based incentive expense recorded in the Consolidated Statements of Income was $13.9 million, $24.5 million and $5.6 million for 2017, 2016 and 2015, respectively. In addition, we recorded $0.3 million, $3.8 million and $1.1 million in incentive compensation expense for performance-based cash incentives in 2017, 2016 and 2015, respectively.
On April 11, 2017, Carl E. Lee, Jr. retired from his positions as President and Chief Executive Officer and a member of the Board of Directors of our Company, as well as from his positions as an officer and/or director of each of our subsidiaries. As part of Mr. Lee's retirement agreement, certain of his stock based compensation awards were modified, which resulted in the recognition of an additional $3.4 million of stock-based compensation expense during 2017, which is included in the amounts above.
Key Employee Incentive Plans
On May 4, 2016, at the Annual Meeting of Stockholders, the 2016 Key Employee Incentive Plan (the “Plan”) was approved. The Plan authorizes the grant of incentive stock options, non-qualified stock options, stock appreciation rights (SARs), restricted stock and performance equity awards, and expires in May 2022. The Plan also authorizes other awards denominated in monetary units or shares of common stock payable in cash or shares of common stock. The Plan provides for up to 4.0 million of securities available for future issuance, of which only 0.7 million can be used for restricted stock or performance share awards. Including shares carried over from the 2012 Key Employee Incentive Plan, as of December 30, 2017, there were approximately 0.7 million of restricted shares and 1.8 million of other securities available for future issuance under the 2016 Plan.
Long-term Incentive Plans
Under our long-term incentive plan, approximately 150 key employees are granted performance-based cash awards, performance-based restricted units, stock options and restricted shares. The amount of awards issued to employees is approved by the Board of Directors.
Diamond Foods Replacement Awards
The acquisition of Diamond Foods, as discussed further in Note 5, resulted in a significant amount of prior Diamond Foods stock-based compensation awards converting to replacement Snyder's-Lance awards. Many of these awards vested at the acquisition date due to change in control provisions. In addition, included in 2016 transaction and integration related expenses on the Consolidated Statements of Income, we recognized $15.4 million in stock-based compensation expense and $1.0 million in cash compensation expense from replacement awards that vested due to acceleration clauses within employment agreements for former Diamond Foods personnel.
64
As of December 30, 2017, the replacement Snyder's-Lance stock-based awards that remained outstanding were as follows:
• | 54,663 restricted units with unrecognized compensation expense of $1.6 million and vesting dates ranging from January 7, 2018 to January 18, 2020. |
• | 472,500 stock options that are fully vested and have exercise prices that range from $11.75 to $65.71. The total intrinsic value of these options was $16.9 million as of December 30, 2017. |
Enterprise Incentive Plan
As a part of the Transformation Plan, we initiated an enterprise-wide performance plan aimed at incentivizing our employees to achieve the targets described in Note 6. Performance-based awards were made under this plan for the period commencing as of August 31, 2017 and ending at the end of the 2020 fiscal year. These awards vest in the first quarter of 2021 and 2022. Approximately 150 key employees were granted a total of 1,630,588 performance-based stock options and 250,169 performance-based restricted share awards. These awards are included within the amounts granted within the Employee Stock Options and Employee Restricted Shares tables below, respectively. The awards vest at the end of the performance period, based on the Company's actual performance against pre-established operating profit margin and operating income targets. In order to receive the shares, the recipient must be employed by the Company on the vesting date. The number of stock options and shares of common stock to be awarded is based on the achievement of targeted performance and may range from 0 percent to 200 percent of the targeted amount. We reassess at each reporting date whether achievement of each of the performance conditions is probable, as well as estimate forfeitures, and adjust compensation expense recognized as appropriate. At December 30, 2017, we assessed the operating profit margin and operating income to be probably of achievement. For all salaried employees not subject to the equity grant and employed with the company on August 31, 2017, awards will be made in cash at the end of the performance period and paid in full in the first quarter of 2021.
Employee Stock Options
Employee stock options vest in periods ranging up to five years after the grant date with the majority vesting over three years. The exercise price, which equals the fair market value of our common stock at the date of grant, ranges from $2.88 to $65.71 per share for the outstanding options as of December 30, 2017.
We account for option awards based on the fair value-method using the Black-Scholes model. The following assumptions were used to determine the weighted average fair value of options granted during 2017, 2016 and 2015.
2017 | 2016 | 2015 | |||||||||
Assumptions used in Black-Scholes pricing model: | |||||||||||
Expected dividend yield | 1.73 | % | 2.07 | % | 2.06 | % | |||||
Risk-free interest rate | 1.62 | % | 1.19 | % | 1.44 | % | |||||
Weighted average expected life | 4.5 years | 4.8 years | 4.5 years | ||||||||
Expected volatility | 19.75 | % | 20.43 | % | 22.57 | % | |||||
Weighted average fair value per share of options granted | $ | 6.19 | $ | 4.47 | $ | 5.03 | |||||
The expected dividend yield is based on the projected annual dividend payment per share divided by the stock price at the date of grant. The risk free interest rate is based on rates of US Treasury issues with a remaining life equal to the expected life of the option. For 2017, 2016 and 2015 grants, the expected life of the option is calculated using historical exercise patterns to estimate expected term. The expected volatility is based on the historical volatility of our common stock over the expected life as we believe this is a reasonable estimate of future volatility.
65
The changes in options outstanding for the years ended December 30, 2017, December 31, 2016 and January 2, 2016 were as follows:
Number of shares | Outstanding Weighted Average Exercise Price | Weighted average contractual term (in years) | Aggregate intrinsic value (in millions) | ||||||||||
Outstanding at January 3, 2015 | 2,486,282 | $ | 17.33 | 6.9 | $ | 31.4 | |||||||
Granted | 384,453 | 31.02 | |||||||||||
Exercised | (496,828 | ) | 15.82 | ||||||||||
Expired/forfeited | (56,114 | ) | 28.36 | ||||||||||
Outstanding at January 2, 2016 | 2,317,793 | $ | 19.66 | 6.4 | $ | 33.9 | |||||||
Granted | 1,143,753 | 30.93 | |||||||||||
Assumed DMND options | 1,038,575 | 20.00 | |||||||||||
Exercised | (599,868 | ) | 16.83 | ||||||||||
Expired/forfeited | (183,344 | ) | 44.73 | ||||||||||
Outstanding at December 31, 2016 | 3,716,909 | $ | 22.44 | 6.6 | $ | 59.5 | |||||||
Granted | 2,324,307 | 36.64 | |||||||||||
Exercised | (1,355,159 | ) | 22.21 | ||||||||||
Expired/forfeited | (614,419 | ) | 35.53 | ||||||||||
Outstanding at December 30, 2017 | 4,071,638 | $ | 28.65 | 7.9 | $ | 86.5 | |||||||
Exercisable at January 2, 2016 | 1,283,284 | $ | 15.38 | 5.6 | $ | 24.3 | |||||||
Exercisable at December 31, 2016 | 2,290,991 | $ | 17.36 | 5.2 | $ | 48.5 | |||||||
Exercisable at December 30, 2017 | 1,501,368 | $ | 17.03 | 5.1 | $ | 49.7 | |||||||
As of December 30, 2017, there was $13.8 million of unrecognized compensation expense, related to outstanding stock options that will be recognized over a weighted average period of 3.2 years. Unrecognized compensation expense related to stock options was $4.3 million as of December 31, 2016 and $2.1 million as of January 2, 2016. Cash received from option exercises during 2017, 2016 and 2015 was $28.4 million, $10.1 million and $7.9 million, respectively. The benefit realized for the tax deductions from option exercises was $6.9 million, $0.9 million and $2.3 million, respectively, during 2017, 2016 and 2015. The increase in the tax benefit in the current year is related to the adopted of ASU No. 2016-09, Improvements to Employee Share-Based Payment Accounting. Refer to Note 3 for more information. The total intrinsic value of stock options exercised during 2017, 2016 and 2015 was $26.0 million, $9.5 million and $9.0 million, respectively. During 2017, 520,517 stock options vested with a weighted average exercise price of $30.46 and a weighted average vesting date fair value of $39.69.
66
Employee Restricted Shares
The changes in restricted share awards outstanding for the years ended December 30, 2017, December 31, 2016 and January 2, 2016 were as follows:
Restricted Share Awards Outstanding | Weighted Average Grant Date Fair Value | |||||
Balance at January 3, 2015 | 181,767 | $ | 25.87 | |||
Granted | 74,874 | 31.02 | ||||
Vested | (78,410 | ) | 25.12 | |||
Forfeited | (11,872 | ) | 28.19 | |||
Balance at January 2, 2016 | 166,359 | $ | 28.38 | |||
Granted | 102,477 | 30.60 | ||||
Diamond Foods awards assumed | 143,183 | 32.34 | ||||
Vested | (220,155 | ) | 30.73 | |||
Forfeited | (12,020 | ) | 30.07 | |||
Balance at December 31, 2016 | 179,844 | $ | 29.80 | |||
Granted | 349,684 | 36.59 | ||||
Vested | (123,863 | ) | 30.62 | |||
Forfeited | (62,941 | ) | 34.88 | |||
Balance at December 30, 2017 | 342,724 | $ | 35.51 | |||
The deferred portion of these restricted shares is included in the Consolidated Balance Sheets as additional paid-in capital. As of December 30, 2017, there was $11.4 million in unrecognized compensation expense related to restricted shares that will be recognized over a weighted average period of 3.5 years. Unrecognized compensation expense related to restricted shares was $2.9 million as of December 31, 2016 and $2.5 million as of January 2, 2016. To cover withholding taxes payable by employees upon the vesting of restricted shares in 2017, we repurchased 46,516 shares of common stock. To cover withholding taxes payable by employees upon the vesting of restricted shares in 2016, we repurchased 22,959 shares of common stock for the vesting of Snyder's-Lance employee incentive awards and 70,381 shares for the vesting of replacement awards converted from prior Diamond awards. During 2015, we repurchased 27,235 shares to cover withholding taxes.
Employee Performance-Based Restricted Units
During 2017 and 2016, we granted 73,133 and 81,999 performance-based restricted units, respectively. Recipients of these awards receive shares of the Company's common stock at the end of the performance period, based on the Company's actual performance against pre-established return on invested capital goals and total shareholder return goals. In order to receive the shares, the recipient must be employed by the Company on the vesting date. The performance-based restricted units represent the number of shares of common stock to be awarded based on the achievement of targeted performance and may range from 0 percent to 200 percent of the targeted amount. The fair value of the awards was determined using a Monte Carlo simulation and is being amortized over the performance period. We reassess at each reporting date whether achievement of each of the performance conditions is probable, as well as estimate forfeitures, and adjust compensation expense recognized as appropriate. At December 30, 2017 and December 31, 2016, we assessed the total shareholder return target as probable of achievement. At December 30, 2017 and December 31, 2016, we assessed the return on invested capital as below target and probable of achievement, respectively.
The following table provides a summary of the assumptions used in the Monte Carlo simulation:
2017 | 2016 | ||||||
Assumptions used in Monte Carlo simulation: | |||||||
Risk-free interest rate | 1.21 | % | 0.95 | % | |||
Time to maturity | 2.8 years | 2.8 years | |||||
Expected volatility | 25.70 | % | 26.40 | % | |||
Grant date fair value of performance-based restricted units | $ | 38.41 | $ | 19.41 | |||
67
The changes in performance-based restricted units outstanding for the years ended December 30, 2017 and December 31, 2016 were as follows:
Number of Units | Weighted Average Grant Date Fair Value | |||||
Balance at January 2, 2016 | — | $ | — | |||
Granted | 81,999 | 19.41 | ||||
Dividend equivalents | 1,115 | 19.41 | ||||
Vested | (818 | ) | 19.41 | |||
Forfeited | (6,789 | ) | 19.41 | |||
Balance at December 31, 2016 | 75,507 | $ | 19.41 | |||
Granted | 73,133 | 38.41 | ||||
Dividend equivalents | 1,079 | 37.66 | ||||
Forfeited | (44,086 | ) | 29.99 | |||
Balance at December 30, 2017 | 105,633 | $ | 28.16 | |||
The deferred portion of these performance-based restricted units is included in the Consolidated Balance Sheets as additional paid-in capital. As of December 30, 2017, there was $2.3 million in unamortized compensation expense related to performance-based restricted units that will be recognized over a period of 1.6 years.
Non-Employee Director Awards
In February 2014, the Snyder's-Lance, Inc. 2014 Director Stock Plan ("2014 Director Plan") was approved. The 2014 Director Plan is intended to attract and retain persons of exceptional ability to serve as directors and to further align the interests of directors and stockholders in enhancing the value of our common stock and to encourage such directors to remain with and to devote their best efforts to the Company. The Board of Directors reserved 400,000 shares of common stock for issuance under the 2014 Director Plan. This number was subject to adjustment in the event of stock dividends and splits, recapitalizations and similar transactions. As of December 30, 2017, there were approximately 234,000 shares available for future issuance under the Plan.
In 2017, we awarded 12,000 shares of restricted shares to our directors, at a grant date fair value of $35.81 and subject to certain vesting restrictions. During 2016 and 2015, we awarded 16,000 and 20,000 restricted shares, respectively, to our directors with grant date fair values of $30.99 and $29.66, respectively. Compensation cost associated with these restricted shares is recognized over the one-year vesting period, at which time the earned portion is charged against current earnings. The deferred portion of these restricted shares is included in the Consolidated Balance Sheets as additional paid-in capital.
In addition to restricted shares, we granted 28,000 restricted units in 2017 and 28,000 restricted units in 2016 to our directors with grant date fair values of $35.81 and $30.99, respectively, which was based on the closing market price of the stock on the date of the grant. Awards are subject to certain vesting restrictions. Compensation cost associated with these restricted units is recognized over the one-year vesting period, at which time the earned portion is charged against current earnings. The deferred portion of these restricted units is included in the Consolidated Balance Sheets as additional paid-in capital.
Performance-Based Cash Incentive Plans
Performance-based cash awards vest over a three year performance period and are accounted for as liability awards. At December 30, 2017 and December 31, 2016, the accrual for these awards was $3.8 million and $6.1 million, respectively.
Employee Stock Purchase Plan
Through December 18, 2017, we had an employee stock purchase plan under which shares of common stock are purchased on the open market with employee and employer contributions. This plan was frozen concurrent with the Company entering into Merger Agreement with Campbell Soup Company as further outlined in Note 2. The plan provided for the Company to contribute an amount equal to 10% of the employees’ contributions. We contributed approximately $0.2 million to the employee stock purchase plan in 2017, 2016 and 2015.
68
NOTE 9. INVENTORIES
Inventories as of December 30, 2017 and December 31, 2016 consisted of the following:
(in thousands) | 2017 | 2016 | ||||||
Finished goods | $ | 113,220 | $ | 102,056 | ||||
Raw materials | 31,258 | 32,095 | ||||||
Maintenance parts, packaging and supplies | 45,411 | 39,305 | ||||||
Total inventories, net | $ | 189,889 | $ | 173,456 | ||||
NOTE 10. FIXED ASSETS
Fixed assets as of December 30, 2017 and December 31, 2016 consisted of the following:
(in thousands) | 2017 | 2016 | ||||||
Land and land improvements | $ | 41,273 | $ | 37,835 | ||||
Buildings and building improvements | 196,407 | 192,874 | ||||||
Machinery, equipment and computer systems | 656,507 | 607,869 | ||||||
Trucks, trailers and automobiles | 33,822 | 32,723 | ||||||
Furniture and fixtures | 4,580 | 4,720 | ||||||
Construction in progress | 17,361 | 22,098 | ||||||
Capital leases(1) | 2,722 | 3,303 | ||||||
$ | 952,672 | $ | 901,422 | |||||
Accumulated depreciation | (459,436 | ) | (399,472 | ) | ||||
493,236 | 501,950 | |||||||
Fixed assets held for sale | (799 | ) | (66 | ) | ||||
Fixed assets, net | $ | 492,437 | $ | 501,884 | ||||
(1) Gross amounts of assets recorded under capital leases represent machinery and equipment as of December 30, 2017 and December 31, 2016.
Depreciation expense related to fixed assets was $69.5 million during 2017, $70.1 million during 2016 and $59.6 million during 2015. The increase in depreciation expense for 2016 as compared to 2015 was primarily due to the acquisition of Diamond Foods in early 2016 (see Note 5 for further information).
There were fixed asset impairment charges of $10.1 million recorded during 2017, $3.7 million recorded during 2016, and $11.5 million recorded during 2015. During 2017, we closed our Perry, Florida manufacturing facility, as part of our Transformation Plan described in Note 6, resulting in an impairment charge of $7.2 million. The remaining impairment is related to manufacturing assets for which we no longer have a business use. During 2016, we sold the Diamond of California business along with certain tangible assets (see Note 4 for further information). In connection with this transaction, we re-purposed the machinery and equipment not included in the sale and recorded impairment of $2.3 million for certain assets which we no longer have the ability to use. We also incurred impairment charges of $1.4 million primarily related to machinery and equipment no longer in use due to the discontinuation of manufacturing of certain products. During 2015, we made the decision to relocate the production of certain products to improve operational efficiency. As part of this decision, certain packaging equipment was replaced in order to provide additional packaging alternatives. These actions resulted in impairment charges. The fair value remaining for these fixed assets was determined using Level 3 inputs such as the salvage value on similar assets previously sold.
69
NOTE 11. GOODWILL AND OTHER INTANGIBLE ASSETS
The changes in the carrying amount of goodwill for 2017 and 2016 are as follows:
(in thousands) | Carrying Amount | |||
Balance as of January 2, 2016 | $ | 539,119 | ||
Business acquisitions | 838,243 | |||
Enterprise goodwill attributable to discontinued operations | (48,845 | ) | ||
Changes in foreign currency exchange rate | (9,625 | ) | ||
Goodwill reclassified to assets held for sale | (530 | ) | ||
Balance as of December 31, 2016 | $ | 1,318,362 | ||
Business acquisition and measurement period adjustments | 2,400 | |||
Changes in foreign currency exchange rate | 6,567 | |||
Goodwill reclassified from assets held for sale, net | 1,378 | |||
Impairments | (46,335 | ) | ||
Balance as of December 30, 2017 | $ | 1,282,372 | ||
As of the date of our 2016 annual impairment analysis, the fair value of our European reporting unit was estimated to be approximately 15% above the carrying value. The net sales and operating income of our businesses in the U.K. continued to be adversely impacted by macroeconomic challenges and changing consumer shopping behavior through the third quarter of 2017, and as a result, the actual and forecasted net revenue and operating income are below the amounts contemplated in the 2016 annual impairment analysis. Based on the declining performance levels and the relatively small difference between the fair value and carrying value of the reporting unit in the 2016 annual impairment analysis, we performed an interim impairment analysis of our European reporting unit as of September 30, 2017. The goodwill impairment analysis was performed by computing the fair value of the reporting unit and comparing it to the carrying value, including goodwill. In accordance with the applicable guidance, we tested other assets for impairment before goodwill. As described in Note 3, New Accounting Standards, the Company adopted ASU 2017-04, Simplifying the Test for Goodwill Impairment, in the second quarter of 2017, which simplifies the subsequent measurement of goodwill by eliminating Step 2 from the goodwill impairment test. The Company determined the fair value of the European reporting unit using a discounted cash flow method (income approach). Significant assumptions used in the assessment included our updated long-range cash flow projections for the European business, discount rate, and tax rate. As a result of this analysis, we recognized a $46.3 million impairment charge related to the goodwill in our European reporting unit. We performed an annual goodwill assessment and the computed fair value is greater than the carrying value at December 30, 2017, therefore no additional impairment has been recorded. Based on the assessment, the $51.5 million of goodwill associated with the European reporting unit remains susceptible to future impairment charges as the fair value is less than 15% higher than the carrying value.
As described in Note 3, New Accounting Standards, the Company adopted ASU 2017-01, Clarifying the Definition of a Business, which clarifies the definition of a business to assist entities with evaluating whether transactions should be accounted for as acquisitions (or disposals) of assets or businesses. Under the new guidance, we will no longer allocate any of the purchase price to goodwill upon acquisition of a route and we will no longer perform a relative fair value allocation of goodwill upon divestitures. As a result, $1.5 million of goodwill that was previously allocated to routes held for sale was reclassified to goodwill, this is partially offset against $0.2 million of goodwill which was reclassified to routes held for sale prior to the adoption of the standard.
Prior to 2017, there have been no historical impairments to goodwill.
70
As of December 30, 2017 and December 31, 2016, acquired intangible assets consisted of the following:
(in thousands) | Gross Carrying Amount | Cumulative Impairments | Accumulated Amortization | Net Carrying Amount | ||||||||||||
As of December 30, 2017: | ||||||||||||||||
Customer and contractual relationships (1) – amortized | $ | 501,987 | $ | — | $ | (84,928 | ) | $ | 417,059 | |||||||
Non-compete agreement – amortized | 710 | — | (537 | ) | 173 | |||||||||||
Reacquired rights – amortized | 3,100 | — | (2,488 | ) | 612 | |||||||||||
Patents – amortized | 8,600 | — | (4,090 | ) | 4,510 | |||||||||||
Developed technology – amortized | 2,700 | — | (640 | ) | 2,060 | |||||||||||
Routes – unamortized | 10,425 | (45 | ) | — | 10,380 | |||||||||||
Trademarks (2) – unamortized | 931,519 | (65,085 | ) | — | 866,434 | |||||||||||
Balance as of December 30, 2017 | $ | 1,459,041 | $ | (65,130 | ) | $ | (92,683 | ) | $ | 1,301,228 | ||||||
As of December 31, 2016: | ||||||||||||||||
Customer and contractual relationships – amortized | $ | 493,026 | $ | — | $ | (58,314 | ) | $ | 434,712 | |||||||
Non-compete agreement – amortized | 710 | — | (417 | ) | 293 | |||||||||||
Reacquired rights – amortized | 3,100 | — | (2,101 | ) | 999 | |||||||||||
Patents – amortized | 8,600 | — | (3,308 | ) | 5,292 | |||||||||||
Developed technology - amortized | 2,700 | — | (460 | ) | 2,240 | |||||||||||
Routes – unamortized | 10,869 | (45 | ) | — | 10,824 | |||||||||||
Trademarks – unamortized | 926,140 | (6,700 | ) | — | 919,440 | |||||||||||
Balance as of December 31, 2016 | $ | 1,445,145 | $ | (6,745 | ) | $ | (64,600 | ) | $ | 1,373,800 | ||||||
(1) The translation impact on customer relationships was an increase of $9.0 million.
(2) The translation impact on trademarks was an increase of $5.4 million.
Intangible assets subject to amortization are being amortized over a weighted average useful life of 19.4 years. The intangible assets related to customer and contractual relationships are being amortized over a weighted average useful life of 19.6 years and will be amortized through February 2036. The intangible assets related to patents are being amortized over 11 years, reacquired rights are being amortized over 8 years, and intangible assets related to developed technology are being amortized over 15 years. Amortization expense related to intangibles was $27.4 million, $24.7 million and $10.7 million during 2017, 2016 and 2015, respectively.
Annual amortization expense for these intangible assets will be as follows:
(in thousands) | Amount | |||
2018 | $ | 26,657 | ||
2019 | 26,305 | |||
2020 | 25,976 | |||
2021 | 25,976 | |||
2022 | 25,976 | |||
Thereafter | 293,524 | |||
Total intangible asset amortization expense | $ | 424,414 | ||
Trademarks are deemed to have indefinite useful lives because they are expected to generate cash flows indefinitely. Although not amortized, they are reviewed for impairment as conditions change or at least on an annual basis. As disclosed in previous quarters, the carrying value of the trademarks acquired in the Diamond Foods acquisition had approximated the fair value of these trademarks since the time of the acquisition. In the third quarter of 2017, the net revenue performance of certain brands and the impact on future projections were triggering events prompting us to perform interim impairment analyses over Pop Secret, Emerald, and
71
KETTLE® Chips (U.K). The net revenue declines in the third quarter and long-term projections for Pop Secret branded products are a result of category declines from shifts in consumer preferences. The net revenue declines in the current year for Emerald branded products related to our inability to meet customer demand earlier in 2017 due to delays incurred as the result of the move of production to our Charlotte, NC plant. For our KETTLE® branded products in the U.K., the challenges noted above for the European reporting unit also apply. The fair value of these trade names were determined using a relief from royalty method (income approach). Significant assumptions used in this assessment included our updated long-range net revenue projections, royalty rate, discount rate, and tax rate. Based on the analysis performed over our Pop Secret trademark as of September 30, 2017, we recognized a $46.6 million impairment charge as we believe the decline in current year net revenue is symptomatic of a declining subcategory and have updated our long-term net revenue projections accordingly. We recognized no impairment charges as a result of our interim analysis of the Emerald trademark as we do not believe that the third quarter decline in net revenue is indicative of a long-term trend and we expect to recover the short-falls following the completion of the move of production to the Charlotte, NC facility. As a result of the analysis performed over the KETTLE® Chips U.K. trademark, we recognized an $11.8 million impairment charge.
In the fourth quarter, we performed our annual analysis for each of our tradenames and we have not identified additional impairment. We have $160.2 million carrying value in trademarks that have a carrying value that approximates fair value. Any adverse changes in the use of these trademarks or declines in the net revenue volumes of the associated products from the projected amounts, or changes in the royalty rates or discount rates, could result in an impairment charge in the future.
As discussed in Note 6, an initiative of our Transformation Plan is SKU rationalization to reduce complexity within the organization. If this process results in significant elimination of SKUs or a strategic shift away from investing in the brands for which the trademarks' carrying value approximates its fair value, the reduction in future cash flow may result in an impairment of these trademarks. As of December 30, 2017, no such strategic decisions have been finalized which will impact the brands with at-risk trademarks.
The impairment analysis utilized a significant number of unobservable Level 3 inputs, such as revenue and cash flow assumptions. See Note 14, Fair Value Measurements, for a definition of Level 3 inputs. The conclusion of the initiatives under the Transformation Plan may result in additional charges being recognized in a future quarter.
The changes in the carrying amount of route intangible assets for 2017 and 2016 were as follows:
(in thousands) | Carrying Amount | |||
Balance as of January 2, 2016 | $ | 11,063 | ||
Impairment charges | (45 | ) | ||
Routes reclassified to assets held for sale | (194 | ) | ||
Balance as of December 31, 2016 | $ | 10,824 | ||
Routes reclassified to assets held for sale | (444 | ) | ||
Balance as of December 30, 2017 | $ | 10,380 | ||
Route businesses, including route intangibles and associated goodwill, allocated to assets held for sale represent assets available for sale in their present condition and for which actions to complete a sale have been initiated. The changes in the carrying amount of route businesses held for sale for 2017 and 2016 were as follows:
(in thousands) | Carrying Amount | |||
Balance as of January 2, 2016 | $ | 15,590 | ||
Purchases of route businesses held for sale | 42,206 | |||
Sales of route businesses held for sale | (38,278 | ) | ||
Reclassifications from route intangibles and goodwill | 724 | |||
Impairment of route businesses held for sale | (740 | ) | ||
Balance as of December 31, 2016 | $ | 19,502 | ||
Purchases of route businesses held for sale | 53,907 | |||
Sales of route businesses held for sale | (54,329 | ) | ||
Reclassifications from route intangibles and goodwill | 605 | |||
Reclassification of Goodwill due to adoption of new accounting standard | (1,539 | ) | ||
Balance as of December 30, 2017 | $ | 18,146 | ||
72
We recorded no impairments for route businesses held for sale during 2017. We recorded $0.7 million and $0.5 million of impairments to our route businesses held for sale during 2016 and 2015, respectively. The impairments were due to declines in the fair value of the route businesses in certain regions. The fair value of the route businesses was determined using Level 3 inputs such as market multiples for similar route businesses.
During 2017, net gains on the sale of route businesses consisted of $9.4 million in gains and $7.1 million in losses. During 2016, net gains on the sale of route businesses consisted of $5.5 million in gains and $4.2 million in losses. During 2015, net gains on the sale of route businesses consisted of $3.3 million in gains and $1.4 million in losses. The majority of the route business purchases and sales were due to the reengineering of route businesses to accommodate new customers and additional Partner brand business obtained in the impacted markets as well as the decision to sell certain route businesses that were previously owned by us. See Note 18 for further information related to IBOs.
NOTE 12. LONG-TERM DEBT
Debt outstanding as of December 30, 2017 and December 31, 2016 consisted of the following:
(in thousands) | 2017 | 2016 | ||||||
Senior unsecured term loan due February 2021, interest payable based on the 1-month Eurodollar rate plus an applicable margin of 1.750% (All-in blended rate of 3.169% as of December 30, 2017, including applicable margin) (1) (5) | $ | 457,375 | $ | 498,875 | ||||
Senior unsecured term loan due February 2026, interest payable based on the 1-month Eurodollar rate plus an applicable margin of 2.125% (All-in blended rate of 3.796% as of December 30, 2017, including applicable margin) (2) (5) | 300,000 | 300,000 | ||||||
Unsecured term loan due May 2024, interest payable based on the 1-month Eurodollar rate plus an applicable margin of 2.075% (All-in blended rate of 3.624% as of December 30, 2017, including applicable margin) (3) (6) | 150,000 | 150,000 | ||||||
Unsecured term loan due May 2019, interest payable based on the 1-month Eurodollar rate plus an applicable margin of 1.700% (All-in blended rate of 3.271% as of December 30, 2017, including applicable margin) (4) (6) | 121,875 | 129,375 | ||||||
Unsecured base rate revolving loan due May 2019, interest was payable at the agreement base rate plus applicable margin of 0.450% (Balance reduced amount available under the unsecured revolving credit facility.) (6) | — | 200,000 | ||||||
Unsecured revolving credit facility due May 2019, interest payable based on the 1-month Eurodollar rate plus applicable margin of 1.450% (All-in rate of 3.019% as of December 30, 2017, including applicable margin) (6) | 55,000 | 27,000 | ||||||
Debt issuance costs, net | (9,717 | ) | (10,291 | ) | ||||
Total debt, net | 1,074,533 | 1,294,959 | ||||||
Less current portion of long-term debt | (49,000 | ) | (49,000 | ) | ||||
Total long-term debt, net | $ | 1,025,533 | $ | 1,245,959 | ||||
(1) We hold an interest rate swap agreement which effectively fixes the variable rate (Eurodollar portion) to 1.271% on $230.0 million of underlying notional amount from June 2017 through February 2021. See Note 15 for further details.
(2) We hold three interest rate swap agreements, the first effectively fixing the variable rate (Eurodollar portion) to 1.337% on $100.0 million of underlying notional amount from June 2017 through June 2021; the second effectively fixing the variable rate to 1.615% on $100.0 million of underlying notional amount from June 2017 through June 2024; and the third effectively fixing the variable rate (Eurodollar portion) to 2.06% on $100.0 million of underlying notional from June 2017 through December 2022. See Note 15 for further details.
(3) We hold two interest rate swap agreements, the first effectively fixing the variable rate (Eurodollar portion) to 1.975% on $50.0 million of underlying notional amount from present through May 2022 and the second effectively fixing the variable rate to 1.236% on $70.0 million of underlying notional amount from June 2017 through June 2020. See Note 15 for further details.
(4) We hold an interest rate swap agreement which effectively fixes the variable rate (Eurodollar portion) to 1.580% on $25.0 million of underlying notional amount from present through May 2019. See Note15 for further details.
(5) Under the Credit Agreement as defined below.
(6) Under the Amended and Restated Credit Agreement as defined below.
73
Annual maturities of long-term debt as of December 30, 2017 are as follows:
(in thousands) | Amount | |||
2018 | $ | 49,000 | ||
2019 | 233,375 | |||
2020 | 71,500 | |||
2021 | 407,875 | |||
2022 | 90,000 | |||
Thereafter | 232,500 | |||
Total long-term debt maturities | $ | 1,084,250 | ||
In conjunction with our acquisition of Diamond Foods, we entered into a senior unsecured credit agreement as amended with the lenders party (the “Term Lenders”) and Bank of America, N.A., as administrative agent (the "Credit Agreement"). Under the Credit Agreement, the Term Lenders provided (i) senior unsecured term loans in an original aggregate principal amount of $830.0 million maturing five years after the funding date (the “Senior Five Year Term Loans”) and (ii) senior unsecured term loans in an original aggregate principal amount of $300.0 million maturing ten years after the funding date (the “Senior Ten Year Term Loans”). The $1.13 billion in proceeds from the Credit Agreement were used to finance, in part, the cash component of the acquisition consideration, to repay indebtedness of Diamond Foods and us, and to pay certain fees and expenses incurred in connection with the Diamond Foods acquisition.
Loans outstanding under the Credit Agreement bear interest, at our option, either at (i) a Eurodollar rate plus an applicable margin specified in the Credit Agreement or (ii) a base rate plus an applicable margin specified in the Credit Agreement. The applicable margin added to the Eurodollar rate or base rate, as the case may be, is subject to adjustment after the end of each fiscal quarter based on changes in the Company’s adjusted total net debt-to-EBITDA ratio.
Under the Credit Agreement, the outstanding principal amount of the Senior Five Year Term Loans is payable in equal quarterly installments of $10.4 million on the last business day of each quarter. These payments began in the second quarter of 2016 and continue through December 2020. The remaining unamortized balance is payable in February 2021. The outstanding principal amount of the Senior Ten Year Term Loans is payable in quarterly principal installments of $15.0 million beginning in the second quarter of 2021 and continuing through December 2025. The remaining unamortized balance is payable in February 2026. The Credit Agreement also contains optional prepayment provisions.
As a result of the Credit Agreement, we entered into certain amendments to our existing credit agreement (the "Amended and Restated Credit Agreement"). Our Amended and Restated Credit Agreement contains a revolving credit facility which allows us to make revolving credit borrowings of up to $375.0 million through May 2019. As of December 30, 2017, and December 31, 2016, we had available $320.0 million and $148.0 million, respectively, of unused borrowings. Under certain circumstances and subject to certain conditions, we have the option to increase available credit under the revolving credit agreement by up to $200.0 million for the remaining life of the facility. Revolving credit borrowings incur interest based on a Eurodollar or base rate plus an applicable margin of between 0.795% and 1.450%. The applicable margin is determined by certain financial ratios and was 1.450% as of December 30, 2017. The revolving credit facility also requires us to pay a facility fee ranging from 0.08% to 0.25% on the entire $375.0 million based on certain financial ratios. The facility fee rate was 0.250% on December 30, 2017.
Loans outstanding under the Amended and Restated Credit Agreement bear interest, at our option, either at (i) a Eurodollar rate plus an applicable margin specified in the Amended and Restated Credit Agreement or (ii) a base rate plus an applicable margin specified in the Amended and Restated Credit Agreement. The applicable margin added to a Eurodollar rate or base rate, as the case may be, is subject to adjustment after the end of each fiscal quarter based on changes in our adjusted total net debt-to-EBITDA ratio.
Under the Amended and Restated Credit Agreement, the outstanding principal amount of the unsecured five year term loans is payable in equal quarterly installments of $1.9 million on the last business day of each quarter. These payments began in the second quarter of 2014 and continue through March 2019. The remaining unamortized balance is payable in May 2019. The outstanding principal amount of the unsecured ten year term loans is payable in quarterly principal installments of $7.5 million beginning in the third quarter of 2019 and continuing through March 2024. The remaining unamortized balance is payable in May 2024. The Amended and Restated Credit Agreement also contains optional prepayment provisions.
74
In February 2016, using available borrowings from the revolving credit facility of our Amended and Restated Credit Agreement and cash on hand, we repaid our $100.0 million private placement senior notes which were due in June 2017. The total repayment was approximately $106 million, and resulted in a loss on early extinguishment of approximately $4.7 million. The loss on early extinguishment of debt was calculated as follows:
(in thousands) | Amount | |||
Repayment of private placement senior notes | $ | 100,000 | ||
Penalty on early extinguishment | 6,170 | |||
Book value of private placement debt, including unamortized fair value adjustment | (101,421 | ) | ||
Loss on early extinguishment of debt | $ | 4,749 | ||
On February 27, 2017, we entered into an amendment to the Credit Agreement with the term lenders party to the Credit Agreement and Bank of America, N.A., which amended the definition of EBIT in the Credit Agreement to be EBITDA minus, to the extent included in determining EBITDA, depreciation and amortization of the Company and its subsidiaries for the computation period.
Our obligations under the Amended and Restated Credit Agreement are guaranteed by all of our existing and future direct and indirect wholly-owned domestic subsidiaries other than any such subsidiaries that, taken together, do not represent more than 10% of the total domestic assets or domestic revenues of the Company and its wholly-owned domestic subsidiaries. The Amended and Restated Credit Agreement contains customary representations, warranties and covenants. The financial covenants pursuant to the Amended and Restated Credit Agreement included a maximum total debt to EBITDA ratio, as defined in the Amended and Restated Credit Agreement ("Original EBITDA Covenant Ratio"). On May 8, 2017, we amended our Amended and Restated Credit Agreement to extend the maximum total debt to EBITDA ratio covenant ("May 2017 Amended EBITDA Covenant Ratio"). Such EBITDA ratios were as follows:
Original EBITDA Covenant Ratio | May 2017 Amended EBITDA Covenant Ratio | |||||
Second and Third Quarters 2016 | 4.75 | N/A | ||||
Fourth Quarter 2016 and First Quarter 2017 | 4.25 | N/A | ||||
Second Quarter 2017 | 4.00 | 4.25 | ||||
Third Quarter 2017 | 3.75 | 4.25 | ||||
Fourth Quarter 2017 and First Quarter 2018 | 3.50 | 4.25 | ||||
Second Quarter 2018 | 3.50 | 4.00 | ||||
Third Quarter 2018 | 3.50 | 3.75 | ||||
Fourth Quarter 2018 and Thereafter to Maturity | 3.50 | 3.50 | ||||
In addition to the EBITDA ratio, the financial covenants also include a minimum interest coverage ratio of 2.50 to 1.00.
In addition, our Amended Credit Agreement provides for adjusted EBITDA to include up to $20.0 million, during the lifetime of the Amended Credit Agreement, of non-recurring costs and expenses paid in cash, as defined. We paid approximately $2.4 million in Consent and Administrative fees associated with the amendment but there were no revisions to the Amended Credit Agreement that will impact the effective interest rate as originally provided. The $2.4 million in fees were capitalized as debt issuance costs. Total debt issuance costs associated with the Credit Agreement of approximately $11.0 million were capitalized in late 2015 and the first quarter of 2016. Total debt issuance costs associated with the Amended and Restated Credit Agreement were deferred in fiscal 2014. All such capitalized debt issuance costs are being amortized over the life of the applicable loans.
Other covenants include, but are not limited to, limitations on: (i) liens, (ii) dispositions of assets, (iii) mergers and consolidations, (iv) loans and investments, (v) subsidiary indebtedness, (vi) transactions with affiliates and (vii) certain dividends and distributions. The Amended and Restated Credit Agreement contains customary events of default, including a cross default provision and change of control provisions. If an event of default occurs and is continuing, we may be required to repay all amounts outstanding under the Amended and Restated Credit Agreement.
As of December 30, 2017, we were in compliance with all debt covenants across both credit agreements.
Including the effect of interest rate swap agreements, the weighted average interest rate was 3.41%, 2.95% and 3.14%, respectively, as of December 30, 2017, December 31, 2016, and January 2, 2016. See Note 15 for further information on our interest rate swap agreements.
75
Total interest expense under all credit agreements for 2017, 2016 and 2015 was $39.3 million, $32.9 million, and $11.1 million, respectively. Included in total interest expense is debt issuance cost amortization expense of $2.9 million, $2.1 million, and $0.5 million for 2017, 2016, and 2015, respectively.
NOTE 13. INCOME TAXES
On December 22, 2017, the Tax Act was signed into law. The Tax Act made numerous changes to many aspects of U.S. corporate income taxation by, among other things, lowering the corporate income tax rate from 35% to 21%, implementing a territorial tax system and imposing a one-time transition tax on deemed repatriated earning of foreign subsidiaries. As a result of the Tax Act, the Company revalued its net deferred tax liabilities to reflect the tax rate expected to apply in the years in which the temporary differences are expected to reverse. This resulted in an approximate $123.2 million tax benefit.
The Tax Act provides a full dividends received deduction for any future dividends from non-U.S. subsidiaries to their U.S. parent company. The Tax Act also imposes a one-time deemed repatriation of accumulated post-1986 foreign earnings which have not been previously taxed. The Company recorded a provisional estimate for this transition tax of approximately $7.5 million. Through the third quarter of 2017 the Company had recorded taxes of approximately $46.7 million on the amount of basis difference in foreign subsidiaries which is not indefinitely reinvested. In the fourth quarter of 2017, the Company has recorded a benefit to reflect the reduced rate at which any remaining basis difference will be taxed.
The SEC staff issued SAB 118 to address the application of GAAP in situations when a registrant does not have the necessary information available, prepared, or analyzed (including computations) in reasonable detail to complete the accounting for certain income tax effects of the Tax Act and allows the registrant to record provisional amounts during a measurement period not to extend beyond one year of the enactment date. We have recognized a net tax benefit of $162.4 million for the provisional tax impacts related to the one-time transition tax and the revaluation of deferred tax balances and included these estimates in our consolidated financial statements for the year ended December 30, 2017. We are in the process of analyzing the impact of the various provisions of the Tax Act. The ultimate impact may materially differ from these provisional amounts due to, among other things, additional analysis, changes in interpretations and assumptions we have made, additional regulatory guidance that may be issued, and actions we may take as a result of the Tax Act. We expect to complete our analysis within the measurement period in accordance with SAB 118.
Relevant to the current consolidated financial statements is the Company's selection of an accounting policy with respect to the new Global Intangible Low-Tax Income ("GILTI"). The Company will elect to treat the GILTI as a period cost, therefore no deferred tax effects have been recorded.
Income tax (benefit)/expense from continuing operations for the years ended December 30, 2017, December 31, 2016 and January 2, 2016 consists of the following:
(in thousands) | 2017 | 2016 | 2015 | |||||||||
Current: | ||||||||||||
Federal | $ | 7,014 | $ | 920 | $ | 22,479 | ||||||
State and other | 1,726 | 4,387 | 3,842 | |||||||||
Foreign | 211 | — | 131 | |||||||||
$ | 8,951 | $ | 5,307 | $ | 26,452 | |||||||
Deferred: | ||||||||||||
Federal | $ | (153,957 | ) | $ | 23,413 | $ | 3,109 | |||||
State and other | 1,562 | (370 | ) | (676 | ) | |||||||
Foreign | (2,700 | ) | (3,030 | ) | — | |||||||
$ | (155,095 | ) | $ | 20,013 | $ | 2,433 | ||||||
Income tax (benefit)/expense | $ | (146,144 | ) | $ | 25,320 | $ | 28,885 | |||||
The foreign provision for income taxes is based on a foreign pre-tax loss of $61.3 million in 2017, $35.0 million in 2016 and foreign pre-tax earnings of $0.4 million in 2015. All accumulated earnings and profits of foreign subsidiaries are deemed to have been remitted as part of the one-time transition tax. Future earnings of our foreign subsidiaries will be considered to be indefinitely reinvested.
76
Reconciliations of the federal income tax rate to our effective income tax rate for the years ended December 30, 2017, December 31, 2016 and January 2, 2016 are as follows:
2017 | 2016 | 2015 | ||||||
Statutory income tax rate | 35.0 | % | 35.0 | % | 35.0 | % | ||
State and local income taxes, net of federal income tax benefit | 173.7 | % | 3.9 | % | 2.6 | % | ||
Net favorable foreign income taxes as a result of tax adjustments and tax rate differences | 162.3 | % | (3.7 | )% | — | % | ||
Effect of US rate change in year of enactment | (12,852.9 | )% | — | % | — | % | ||
Effect of U.K. rate change in year of enactment | — | % | (1.9 | )% | — | % | ||
Non-deductible goodwill on sale of route businesses | 3.2 | % | 0.1 | % | 0.4 | % | ||
Deduction for inventory contributions | (100.5 | )% | (0.5 | )% | (0.3 | )% | ||
Meals and entertainment | 20.3 | % | 0.7 | % | 0.5 | % | ||
IRC 199 deduction | — | % | — | % | (2.6 | )% | ||
Change in uncertain tax positions | (48.6 | )% | 0.8 | % | (1.5 | )% | ||
Non-deductible transaction costs | 59.8 | % | 4.7 | % | 2.0 | % | ||
Excess tax benefits for share-based payments | (548.0 | )% | — | % | — | % | ||
Goodwill impairment | 1,275.0 | % | — | % | — | % | ||
Executive compensation | 239.8 | % | — | % | — | % | ||
Miscellaneous items, net | 13.4 | % | (1.4 | )% | 0.2 | % | ||
Effective income tax rate | (11,567.5 | )% | 37.7 | % | 36.3 | % | ||
77
The tax effects of temporary differences that give rise to significant portions of the deferred tax assets and deferred tax liabilities at December 30, 2017 and December 31, 2016, are presented below:
(in thousands) | 2017 | 2016 | ||||||
Deferred tax assets: | ||||||||
Reserves for employee compensation, deductible when paid for income tax purposes, accrued for financial reporting purposes | $ | 11,762 | $ | 28,560 | ||||
Reserves for insurance claims, deductible when paid for income tax purposes, accrued for financial reporting purposes | 3,421 | 4,850 | ||||||
Other reserves, deductible when paid for income tax purposes, accrued for financial reporting purposes | 10,858 | 14,947 | ||||||
Basis difference in fixed rate debt | — | 187 | ||||||
Inventories, principally due to additional costs capitalized for income tax purposes | 3,587 | 4,790 | ||||||
Federal NOLs and tax credit carryforwards | 42,443 | 83,157 | ||||||
Net state operating loss and tax credit carryforwards | 30,439 | 24,123 | ||||||
Total gross deferred tax assets | $ | 102,510 | $ | 160,614 | ||||
Less valuation allowance | (14,170 | ) | (11,283 | ) | ||||
Net deferred tax assets | $ | 88,340 | $ | 149,331 | ||||
Deferred tax liabilities: | ||||||||
Fixed assets, principally due to differences in depreciation, net of impairment reserves | $ | (38,439 | ) | $ | (56,851 | ) | ||
Intangible assets, principally due to differences in amortization and acquisition basis differences | (264,472 | ) | (405,060 | ) | ||||
Employee compensation, principally due to change in method of accounting | — | (1,278 | ) | |||||
Unrealized gains, taxable when realized for income tax purposes, included in other comprehensive income | (3,405 | ) | (4,040 | ) | ||||
Basis difference in noncurrent investments | (6,371 | ) | (8,298 | ) | ||||
Unremitted foreign earnings | — | (42,211 | ) | |||||
Prepaid expenses and other costs deductible for tax, amortized for financial reporting purposes | (2,659 | ) | (4,417 | ) | ||||
Total gross deferred tax liabilities | $ | (315,346 | ) | $ | (522,155 | ) | ||
Deferred income taxes, net | $ | (227,006 | ) | $ | (372,824 | ) | ||
Included in the deferred income taxes, net above are $7.9 million and $5.4 million of deferred tax assets, which are included in Other noncurrent assets on the consolidated balance sheets as of December 30, 2017 and December 31, 2016, respectively.
As of December 30, 2017, we have approximately $20.2 million of state tax loss carryforwards available to offset future taxable income. Most of these loss carryforwards expire at various times between 2018 and 2036. Based on projected income levels and our future state tax profile, we believe it is more likely than not that several of these loss carryforwards will not be utilized prior to their expiration. Therefore, a valuation allowance of approximately $4.6 million has been established to account for the expected realizable value of the state loss carryforwards.
As of December 30, 2017, we have approximately $11.1 million of state tax credits available to offset future tax liabilities. Most of these credits expire at the end of 2023. Based on projected income levels and our future state tax profile, we believe it is more likely than not that most of these credits will not be utilized prior to their expiration. Therefore, a valuation allowance of approximately $9.6 million has been established to account for the expected realizable valuation of the state tax credits.
Our effective tax rate is based on the level and mix of income of our separate legal entities, statutory tax rates, business credits available in the various jurisdictions in which we operate and permanent tax differences. Significant judgment is required in evaluating tax positions that affect the annual tax rate. The effective income tax rate is lower than the federal statutory rate primarily due to the Tax Act which was signed into law on December 22, 2017. The effect of state and local taxes on the 2017 and 2016 effective tax rate includes the impact of a revaluation of deferred tax assets and liabilities due to enacted changes in the statutory rates in various state jurisdictions.
78
We have recorded gross unrecognized tax benefits, as of December 30, 2017, totaling $4.8 million and related interest and penalties of $0.7 million in other noncurrent liabilities on the Consolidated Balance Sheets. Approximately $4.7 million would affect the effective tax rate if subsequently recognized. This amount includes $0.6 million and $0.1 million of interest and penalties, respectively. We expect certain income tax audits will be settled, positions will be resolved through administrative procedures or statutes of limitations will expire for various tax authorities during the next twelve months, resulting in a potential $0.8 million reduction of the unrecognized tax benefit. We classify interest and penalties associated with income tax positions within income tax expense.
We have open years for income tax audit purposes in our major taxing jurisdictions according to statutes as follows:
Jurisdiction | Open Years | |
US federal | 2014 and forward | |
California | 2011 and forward | |
North Carolina | 2014 and forward | |
New York | 2014 and forward | |
Illinois | 2014 and forward | |
United Kingdom | 2016 and forward | |
A reconciliation of the beginning and ending amount of the gross unrecognized tax benefits is as follows:
(in thousands) | Amount | |||
Balance at January 2, 2016 | $ | 2,735 | ||
Additions for tax positions taken during the current period | 653 | |||
Additions for tax positions taken during a prior period | 873 | |||
Additions for positions resulting from business combination | 2,425 | |||
Reductions resulting from a lapse of the statute of limitations | (852 | ) | ||
Balance at December 31, 2016 | $ | 5,834 | ||
Additions for tax positions taken during the current period | 400 | |||
Additions for tax positions taken during a prior period | 248 | |||
Reductions resulting from a lapse of the statute of limitations | (1,650 | ) | ||
Balance at December 30, 2017 | $ | 4,832 | ||
79
NOTE 14. FAIR VALUE MEASUREMENTS
The following table summarizes information regarding financial assets and financial liabilities that are measured at fair value at December 30, 2017 and December 31, 2016.
(in thousands) | Book Value | Quoted Prices in Active Markets for Identical Assets (Level 1) | Significant Other Observable Inputs (Level 2) | Significant Unobservable Inputs (Level 3) | ||||||||||||
Balance as of December 30, 2017 | ||||||||||||||||
Assets: | ||||||||||||||||
Cash and cash equivalents | $ | 18,703 | $ | 18,703 | $ | — | $ | — | ||||||||
Restricted cash | 446 | 446 | — | — | ||||||||||||
Interest rate swaps | 13,136 | — | 13,136 | — | ||||||||||||
Assets held for fully funded deferred compensation plan | 5,898 | 5,898 | — | — | ||||||||||||
Total assets | $ | 38,183 | $ | 25,047 | $ | 13,136 | $ | — | ||||||||
Liabilities: | ||||||||||||||||
Deferred compensation plan obligations | $ | 5,898 | $ | 5,898 | $ | — | $ | — | ||||||||
IBNR - Casualty | 7,329 | — | 7,329 | — | ||||||||||||
IBNR - Medical | 4,238 | — | 4,238 | — | ||||||||||||
Total liabilities | $ | 17,465 | $ | 5,898 | $ | 11,567 | $ | — | ||||||||
Balance as of December 31, 2016 | ||||||||||||||||
Assets: | ||||||||||||||||
Cash and cash equivalents | $ | 35,409 | $ | 35,409 | $ | — | $ | — | ||||||||
Restricted cash | 714 | 714 | — | — | ||||||||||||
Interest rate swaps | 10,748 | — | 10,748 | — | ||||||||||||
Assets held for fully funded deferred compensation plan | 5,192 | 5,192 | — | — | ||||||||||||
Total assets | $ | 52,063 | $ | 41,315 | $ | 10,748 | $ | — | ||||||||
Liabilities: | ||||||||||||||||
Interest rate swaps | $ | 392 | $ | — | $ | 392 | $ | — | ||||||||
Deferred compensation plan obligations | 5,192 | 5,192 | — | — | ||||||||||||
IBNR - Casualty | 7,555 | — | 7,555 | — | ||||||||||||
IBNR - Medical | 3,855 | — | 3,855 | — | ||||||||||||
Total liabilities | $ | 16,994 | $ | 5,192 | $ | 11,802 | $ | — | ||||||||
There were no changes among the levels of our fair value instruments during 2017.
The fair value of outstanding debt, including current maturities, was approximately $1,084 million and $1,305 million as of December 30, 2017 and December 31, 2016, respectively. These Level 2 fair value estimates were based on similar debt with the same maturities, company credit rating and interest rates. We own 51% of the outstanding shares of Yellow Chips Holding B.V. (“Yellow Chips”), which produces vegetable chips and organic potato chips primarily for the Dutch and other European markets. The investment is accounted for under the equity method, as the other owners have substantive participating rights that provide them with significant influence greater than ours over the financial performance of Yellow Chips. We own approximately 23% of Natural Food Works Group, LLC, an experienced food manufacturer specializing in natural and organic products. The fair value of equity method investments measured on a non-recurring basis are classified as a Level 3 fair value measurement.
During 2017, 2016 and 2015 due to impairments, the fair values of certain fixed assets and route intangibles were measured using Level 3 inputs as disclosed in Note 10 and Note 11 to the consolidated financial statements. In addition, our annually required goodwill and indefinite-lived intangible impairment tests, as well as the initial valuation of intangible assets included in business acquisitions, are performed using financial models that include Level 3 inputs.
80
NOTE 15. DERIVATIVE INSTRUMENTS
The fair value of the derivative instrument assets and liabilities in the Consolidated Balance Sheets using Level 2 inputs as of December 30, 2017 and December 31, 2016 were as follows:
(in thousands) | Balance Sheet Location | 2017 | 2016 | |||||||
Derivatives designated as hedges: | ||||||||||
Interest rate swaps | Other noncurrent assets | $ | 13,136 | $ | 10,748 | |||||
Interest rate swaps | Other noncurrent liabilities | — | (392 | ) | ||||||
Total fair value of derivative instruments | $ | 13,136 | $ | 10,356 | ||||||
Interest Rate Swaps
Our variable-rate debt obligations incur interest at floating rates based on changes in the Eurodollar rate and US base rate interest. To manage exposure to changing interest rates, we selectively enter into interest rate swap agreements to maintain a desired proportion of fixed to variable-rate debt. These swaps are accounted for as cash flow hedges. The fair value of interest rate swaps was determined utilizing a market approach model using the notional amount of the interest rate swaps and the observable inputs of time to maturity and interest rates. The notional amount of the interest rate swaps designated as hedging instruments as of December 30, 2017 and December 31, 2016 was $675.0 million and $575.0 million, respectively.
In November 2016, we entered into four interest rate swap agreements to manage the exposure to changing interest rates on long-term debt. We entered into two of the agreements in order to fix a portion of our term loan due in February 2026. The first, with a notional amount of $100 million at an interest rate of 1.62%, plus applicable margins, is effective for the interest periods from June 2017 through June 2024. A second agreement, with a notional amount of $100 million at an interest rate of 1.34%, plus applicable margins, is effective for the interest periods from June 2017 through June 2021. We entered into a third agreement with a notional amount of $230 million in order to fix a portion of our term loan due in February 2021 at an interest rate of 1.27%, plus applicable margins, which is effective for the interest periods from June 2017 through February 2021. A fourth agreement, with a notional amount of $70 million was entered to fix a portion of our term loan due in May 2024 at an interest rate of 1.24%, plus applicable margins, and is effective for the interest periods from June 2017 through June 2020.
In February 2015, we also entered into two interest rate swap agreements to manage the exposure to changing interest rates on long-term debt. We entered into an agreement with a notional amount of $25.0 million in order to fix a portion of our term loan due in May 2019 at an interest rate of 1.58%, plus applicable margins, effective for the interest periods from May 2015 through May 2019. A second agreement with a notional amount of $50.0 million was entered into in order to fix a portion of our term loan due in May 2024 at an interest rate of 1.98%, plus applicable margins, effective for the interest periods from May 2015 through May 2022.
On February 23, 2017 we entered into an additional interest rate swap agreement to fix the variable rate on a portion of our $300 million term loans due February 2026. The new swap effectively fixes the variable rate to 2.06% on $100.0 million of underlying notional from June 2017 through December 2022.
Changes in Other Comprehensive Income (Loss)
The changes in unrealized gains and losses, net of income tax, included in other comprehensive income was due to fluctuations in interest rates and foreign exchange rates for the years ended December 30, 2017, December 31, 2016 and January 2, 2016 were as follows:
(in thousands) | 2017 | 2016 | 2015 | |||||||||
Gain/(loss) on interest rate swaps, net of income tax (expense)/benefit of $(1,224), ($4,447), and $247, respectively | $ | 1,557 | $ | 6,953 | $ | (360 | ) | |||||
Total change in unrealized gains/(losses) from derivative instruments, net of income tax (effective portion) | $ | 1,557 | $ | 6,953 | $ | (360 | ) | |||||
Based on current valuations, the amount expected to be reclassified from Other Comprehensive into earnings within the next 12 months is a gain of $1.7 million.
81
NOTE 16. POSTRETIREMENT BENEFIT PLANS
All Snyder’s-Lance, Inc. US employees are eligible to participate in a defined contribution retirement plan. This 401(k) plan provides participants with matching contributions equal to 100% of the first 4% of qualified wages and 50% of the next 1% of qualified wages. In addition, our U.K. employees are entitled to participate in a defined contribution retirement plan. During 2017, 2016 and 2015, total expenses associated with these retirement plans were $14.4 million, $12.8 million and $11.3 million, respectively.
NOTE 17. COMMITMENTS AND CONTINGENCIES
Contractual Obligations
We have entered into contractual agreements providing benefits to certain key employees in the event of termination without cause or other circumstances. Commitments under these agreements were $17.5 million and $8.5 million at December 30, 2017 and December 31, 2016, respectively. Our long-term incentive plans have change in control provisions which would result in $17.9 million of additional compensation expense in the event of a change in control on December 30, 2017, $1.2 million of which relates to Diamond Foods replacement awards.
We lease certain facilities and equipment under contracts classified as operating leases. We sublease two facilities acquired in the Diamond Foods acquisition. Total rental expense was $42.7 million in 2017, $37.6 million in 2016 and $27.2 million in 2015.
Future minimum lease commitments for operating leases at December 30, 2017 are as follows:
(in thousands) | Lease Payments | Less Sublease Income | Net | |||||||
2018 | $ | 22,374 | $ | 1,343 | $ | 21,031 | ||||
2019 | 18,187 | 1,322 | 16,865 | |||||||
2020 | 15,239 | 1,156 | 14,083 | |||||||
2021 | 10,699 | 196 | 10,503 | |||||||
2022 | 7,225 | — | 7,225 | |||||||
Thereafter | 32,930 | — | 32,930 | |||||||
Total operating lease commitments | $ | 106,654 | $ | 4,017 | $ | 102,637 | ||||
Future minimum lease commitments for our capital lease at December 30, 2017 are as follows:
(in thousands) | Amount | |||
2018 | $ | 671 | ||
2019 | 244 | |||
Total capital lease commitments | 915 | |||
Less amount representing interest | (13 | ) | ||
Present value of capital lease obligations | $ | 902 | ||
In order to mitigate the risks of volatility in commodity markets to which we are exposed, we have entered into forward purchase agreements with certain suppliers based on market prices, forward price projections and expected usage levels. Purchase commitments for certain ingredients, packaging materials and energy totaled $226.3 million and $157.2 million as of December 30, 2017 and December 31, 2016. The increase in purchase commitments was primarily due to timing of raw material purchase contracts for the upcoming year. In addition to these commitments, we have contracts for certain ingredients and packaging materials where we have secured a fixed price but do not have a minimum purchase quantity. We generally contract from approximately three months to twelve months in advance for certain major ingredients and packaging. We also have a licensing contract which totaled $9.6 million as of December 30, 2017, and continues through 2020.
We have contracts to receive services from syndicated market data providers through 2023. Our commitment for these services ranges from $4.6 million to $5.3 million each year throughout the life of the contracts.
We also maintain standby letters of credit in connection with our self-insurance reserves for casualty claims. The total amount of these letters of credit was $9.0 million as of December 30, 2017. The total amount of letters of credit as of December 31, 2016 was $12.6 million.
82
Guarantees
We currently provide a partial guarantee for loans made to IBOs by certain third-party financial institutions for the purchase of route businesses. The outstanding aggregate balance on these loans was approximately $177.2 million as of December 30, 2017 compared to approximately $154.1 million as of December 31, 2016. The $23.1 million increase in the outstanding loans was primarily due to new IBO loans as a result of zone restructuring and sale of additional routes. The annual maximum amount of future payments we could be required to make under the guarantees equates to 25% of the outstanding loan balance on the first day of each calendar year plus 25% of the amount of any new loans issued during such calendar year. These loans are collateralized by the route businesses for which the loans are made. Accordingly, we have the ability to recover substantially all of the outstanding loan value upon default, and our liability associated with this guarantee is not material.
Legal Matters
Merger Agreement Legal Proceedings
Four putative class action lawsuits related to the proposed Merger were filed by purported shareholders of the Company. These Actions captioned Shaev v. Snyder’s-Lance, Inc., et al. (Case No.3:18-cv-00039), Sciabacucchi v. Snyder’s-Lance, Inc., et al. (Case No. 3:18-cv-00049-RJCDCK), Kendall v. Snyder’s-Lance, Inc., et al. (Case No. 3:18-cv-00051), and Daniel v. Snyder’s-Lance, Inc., et al. (Case No. 3:18-cv-00058) were filed in the United States District Court for the Western District of North Carolina on January 25, 2018, January 29, 2018, January 30, 2018, and January 31, 2018, respectively. The Actions name as defendants the Company and the members of the Company’s Board, and allege that the defendants filed a materially incomplete and misleading proxy statement on Schedule 14A in violation of Sections 14(a) and 20(a) of the Exchange Act and SEC Rule 14a-9. Additionally, the Sciabacucchi Action names Campbell as a defendant, and alleges that Campbell violated Section 20(a) of the Exchange Act. The Kendall Action seeks to enjoin the shareholder vote on the proposed merger, and the Shaev, Sciabacucchi, and Daniel Actions seek to enjoin the defendants from proceeding with or consummating the proposed merger or, in the event the merger is consummated, request that the Court issue an order rescinding the merger and/or awarding rescissory damages. Additionally, the Shaev and Kendall Actions seek that the Court direct defendants to account for alleged damages, and all the Actions seek attorneys’ and expert fees and expenses. The Company believes these Actions are without merit.
IBO Litigation
Antonio Oliveira et. al. v. S-L Distribution Company, Inc. et. al.
On June 13, 2016, the plaintiffs filed a lawsuit in the United States District Court for the Middle District of Pennsylvania against S-L Distribution Company, Inc. (subsequently converted to S-L Distribution Company, LLC and referred to hereinafter as "SLD") and S-L Routes, LLC seeking damages for alleged violations of the Massachusetts Wage Act and unjust enrichment. Plaintiffs are former and current IBOs in Massachusetts that have alleged they were misclassified as independent contractors instead of employees. On September 14, 2016, a Stipulation of Dismissal was entered with the court whereby the pending action was dismissed and the parties agreed to arbitration. On September 6, 2017, mediation was held, but the parties were unable to resolve this matter. Arbitration is anticipated to be held in mid-2018 absent the parties reaching an amicable resolution in the interim. We believe we have strong defenses to all the claims that have been asserted against us. At this time, we cannot reasonably estimate the possible loss or range of loss, if any, from this lawsuit.
Jonathan Scheurer LLC v. S-L Distribution Company, LLC
On December 8, 2016, plaintiff served a putative class action on behalf of all similarly situated IBOs in New Jersey against our distribution subsidiary, SLD. Plaintiff is a former IBO whose distributor agreement was terminated pursuant to the buyback and re-engineering of routes in New Jersey in 2011, resulting from the merger of Snyder’s of Hanover, Inc. and Lance, Inc. The lawsuit seeks statewide class certification on behalf of a class comprised of IBOs in New Jersey for alleged violations of the New Jersey Franchise Practices Act relative to various terminations of the distributor agreement. Discovery is ongoing and a status conference was held on February 27, 2018. We believe we have strong defenses to all the claims that have been asserted against us. At this time, no demand has been made, and we cannot reasonably estimate the possible loss or range of loss, if any, from this lawsuit.
Macedonia Distributing Inc. v. S-L Distribution Company, LLC
On July 21, 2017, plaintiff filed a putative class action in the United States District Court for the Central District of California on behalf of all similarly situated IBOs in California against SLD. Plaintiff is a former IBO whose distributor agreement was terminated pursuant to the buyback and re-engineering of routes in California in 2017. The lawsuit seeks statewide class certification on behalf of a class comprised of IBOs in California for alleged violations of the California Franchise Relations Act and California’s Unfair Competition Law relative to various terminations of the distributor agreement. SLD has filed a Motion to Transfer and a Motion to Dismiss. The court has continued ruling on the motions while the parties complete limited discovery on whether a franchise existed under applicable law. After briefing by the parties, a hearing will be conducted on June 4, 2018. We believe we have strong defenses to all the claims that have been asserted against us. At this time, no demand has been made, and we cannot reasonably estimate the possible loss or range of loss, if any, from this lawsuit.
83
California Labor Code Matters
Sparks v. Diamond Foods, Inc.
On November 25, 2015, former employee, Patricia Sparks, filed a putative class action lawsuit in San Francisco Superior Court against Diamond Foods alleging Diamond Food’s violation of the California Labor Code by failing to include on wage statements the start date of the pay period and the name and address of the employer entity. Plaintiff amended her complaint on January 4, 2016 to add a claim for penalties under California’s Private Attorneys General Act based on the same alleged underlying violations. Diamond Food's timely answered the First Amended Complaint on March 7, 2016. The parties attended the initial case management conference on May 2, 2016 and a further case management conference occurred on August 1, 2016. On September 19, 2016, the parties to this litigation reached a tentative settlement pursuant to which we have agreed to pay $0.7 million on a class wide basis. We signed a memorandum of understanding reflecting this preliminary settlement amount. The parties submitted a settlement agreement to the court and the court granted preliminary approval of the settlement on February 24, 2017. On July 5, 2017, the parties appeared before the court on Plaintiff’s Motion for Final Approval of the Settlement. At the hearing, the judge requested supplemental briefing from the Plaintiff, which Plaintiff filed on July 14, 2017. On July 19, 2017, the court entered an order granting Final Approval of the Settlement, Attorneys’ Fees, and Costs. The judge granted final approval of the maximum settlement amount of $0.7 million, which was paid on October 17, 2017 pursuant to the terms of the settlement agreement.
Bensman v. Diamond Foods, LLC et. al.
On April 4, 2017, Diamond Foods, LLC employee, Della Bensman, filed a putative class action lawsuit in San Joaquin Superior Court against Diamond Foods, LLC and Snyder’s-Lance, Inc. alleging the companies’ violations of the California Labor Code. Plaintiff alleges the companies failed to provide third rest breaks when Plaintiff or other employees worked a shift over ten hours and failed to provide accurate itemized wage statements for employees in periods in which they worked more than ten hours and did not received a third rest break. Plaintiff’s Complaint also includes a claim for penalties under California’s Private Attorneys General Act and an unfair business practices claim pursuant to the California Business and Professions Code based on the same underlying violations. On June 16, 2017, we filed a Demurrer seeking dismissal of Plaintiff’s claim regarding our failure to provide accurate wage statements. On January 2, 2018, the parties filed a joint stipulation to stay the case through March 1, 2018 and continue the hearing on the Demurrer. On February 2, 2018, the parties engaged in mediation. Although this action was not resolved at mediation, settlement discussions are ongoing. The Demurrer hearing is currently scheduled for March 21, 2018.
Food Labeling Litigation
Swearingen et. al. v. Late July Snacks, LLC
A putative class action suit was filed against Late July on September 18, 2013, and is pending in the District Court for the Northern District of California. The action accuses Late July of violating federal and state law by using the term “evaporated cane juice” (“ECJ”) in the ingredients list on its products’ labels. The plaintiffs’ complaint alleges ECJ is not the common and usual name for the ingredient at issue and is misleading. The complaint attempts to state claims for violation of California’s Unfair Competition Law, California’s False Advertising Law, California’s Consumers Legal Remedies Act, and unjust enrichment. Late July filed a motion to dismiss the complaint on November 27, 2013, based on the primary jurisdiction doctrine, lack of standing, and failure to state a claim. On May 22, 2014, the court stayed the action, applying the doctrine of primary jurisdiction, due to the FDA’s ongoing consideration of the issue of using the term ECJ on food labels. On May 26, 2016, the FDA issued its guidance for industry on the topic. As a result, the stay was lifted on July 22, 2016. On August 31, 2016, Plaintiffs filed an amended complaint that, among other things, relies on the FDA’s recently issued guidance. Late July filed a motion to dismiss the Amended Complaint, and hearing on that motion was held on February 16, 2017. On May 5, 2017, the Court entered an Order granting in part and denying in part Late July’s Motion to Dismiss. The Court dismissed the class allegations and the claim for injunctive relief, but allowed the two individual plaintiffs’ claims for damages to proceed. The Order did allow Plaintiffs leave to amend their complaint, and on June 2, 2017, Plaintiffs filed their Second Amended Complaint. In response, Late July filed a Motion to Dismiss on June 30, 2017. On October 16, 2017, the Court entered an Order granting in part and denying in part Late July’s Motion to Dismiss, once again dismissing Plaintiffs claim for injunctive relief. At this time, we cannot reasonably estimate the possible loss or range of loss, if any, from this lawsuit.
Other
We are currently subject to various other legal proceedings and environmental matters arising in the normal course of business which are not expected to have a material effect on our condensed consolidated financial statements. We record a liability when we believe that it is probable that a loss has been incurred and the amount can be reasonably estimated. If we determine that a loss is possible and a range of such loss can be reasonably estimated, we will disclose the range of the possible loss. Significant judgment is required to determine both likelihood of there being, and the estimated amount of, a loss related to such matters. We cannot currently estimate our potential liability, damages or range of potential loss in connection with our other outstanding legal proceedings beyond amounts accrued, if any.
84
NOTE 18. RELATED PARTY TRANSACTIONS
We have an 80.0% ownership of Late July. We also have a $6.0 million line of credit between the Company and Late July, of which $3.9 million was drawn by Late July in order to repay certain obligations. The balance of $3.9 million remains outstanding as of December 30, 2017, and is eliminated in consolidation.
As part of our acquisition of Diamond Foods, we obtained 51.0% of the outstanding shares of Yellow Chips. The investment is accounted for under the equity method, as the other owners have substantive participating rights that provide them with significant influence greater than ours over the financial performance of Yellow Chips. As of December 30, 2017, we have a €2.4 million loan receivable outstanding with Yellow Chips.
We have two facilities used to support distribution of our products in the northeastern US that are leased from an entity owned by two of our employees. One of the employees was Peter L. Michaud, a former officer of the Company. There were $0.4 million in lease payments made to this entity during each of the years 2017, 2016, and 2015.
One of the members of our Board of Directors, Lawrence Jackson, is also a member of the Board of Directors of Information Resources, Inc. ("IRI"), which we began using as our syndicated market data provider at the end of 2015. Total payments made to IRI for these services were $4.7 million and $3.5 million in 2017 and 2016, respectively.
ARWCO Corporation, MAW Associates, LP and Warehime Enterprises, Inc. are significantly owned or controlled by Patricia A. Warehime, a member of our Board of Directors and a beneficial owner of more than 14% of our common stock. Among other unrelated business activities, these entities provide financing to IBOs for the purchase of route businesses. We have entered into loan service agreements with these related parties that require us to repurchase certain distribution assets in the event an IBO defaults on a loan with the related party. We are required to repurchase the route assets 30 days after default at the value as defined in the loan service agreement, which approximates fair market value. As of December 30, 2017, there were outstanding loans made to IBOs by the related parties of approximately $15.6 million, compared to $21.5 million as of December 31, 2016. Transactions with these related parties are primarily related to the collection and remittance of loan payments on notes receivable held by the affiliates. If IBOs default on loans, the related parties will purchase inventory in order to service the routes prior to our requirement to repurchase the route assets. Revenue from the sale of inventory to these related parties was approximately $0.6 million for 2017, $0.5 million for 2016, and $0.7 million for 2015. In addition, we are reimbursed for certain overhead and administrative services associated with the services provided to these related parties. The receivables from, payables to and administrative fees from these entities are not significant for any period presented.
One of our directors, C. Peter Carlucci, Jr., is a member of Eckert Seamans Cherin & Mellott, LLC (“Eckert”), which serves as one of our outside legal firms. Expenses incurred for services provided by Eckert were $0.4 million, $0.3 million, and $0.7 million for 2017, 2016 and 2015, respectively.
NOTE 19. OTHER COMPREHENSIVE INCOME
Total comprehensive income attributable to us, determined as net income adjusted by total other comprehensive income, was income of $168.6 million, loss of $2.5 million and income of $51.1 million for the years ended December 30, 2017, December 31, 2016 and January 2, 2016, respectively. Total other comprehensive income presently consists of foreign currency translation adjustments and unrealized gains and losses from our derivative financial instruments accounted for as cash flow hedges.
Amounts reclassified out of accumulated other comprehensive income, net of tax, consisted of the following:
(in thousands) | Income Statement Location | 2017 | 2016 | 2015 | ||||||||||
Losses on cash flow hedges reclassified out of accumulated other comprehensive income: | ||||||||||||||
Interest rate swaps, net of tax of $492, $394, and $515, respectively | Interest expense, net | $ | (735 | ) | $ | (625 | ) | $ | (749 | ) | ||||
Total cash flow hedge reclassifications, net of tax | $ | (735 | ) | $ | (625 | ) | $ | (749 | ) | |||||
Foreign currency translation adjustments reclassified from accumulated other comprehensive income | Other income/(expense), net | $ | — | $ | — | $ | (1,236 | ) | ||||||
Total amounts reclassified from accumulated other comprehensive income | $ | (735 | ) | $ | (625 | ) | $ | (1,985 | ) | |||||
85
During 2017, changes to the balance in accumulated other comprehensive loss were as follows:
(in thousands) | Gains/(Losses) on Cash Flow Hedges | Foreign Currency Translation Adjustment | Total | |||||||||
Balance as of December 31, 2016 | $ | 6,323 | $ | (24,300 | ) | $ | (17,977 | ) | ||||
Other comprehensive income before reclassifications | 822 | 18,517 | 19,339 | |||||||||
Losses reclassified from accumulated other comprehensive income | 735 | — | 735 | |||||||||
Total other comprehensive income | 1,557 | 18,517 | 20,074 | |||||||||
Balance as of December 30, 2017 | $ | 7,880 | $ | (5,783 | ) | $ | 2,097 | |||||
During 2016, changes to the balance in accumulated other comprehensive loss were as follows:
(in thousands) | Gains/(Losses) on Cash Flow Hedges | Foreign Currency Translation Adjustment | Total | |||||||||
Balance as of January 2, 2016 | $ | (630 | ) | $ | — | $ | (630 | ) | ||||
Other comprehensive income/(loss) before reclassifications | 6,328 | (24,300 | ) | (17,972 | ) | |||||||
Losses reclassified from accumulated other comprehensive income | 625 | — | 625 | |||||||||
Total other comprehensive income/(loss) | 6,953 | (24,300 | ) | (17,347 | ) | |||||||
Balance as of December 31, 2016 | $ | 6,323 | $ | (24,300 | ) | $ | (17,977 | ) | ||||
During 2015, changes to the balance in accumulated other comprehensive income/(loss) were as follows:
(in thousands) | Gains/(Losses) on Cash Flow Hedges | Foreign Currency Translation Adjustment | Total | |||||||||
Balance as of January 3, 2015 | $ | (270 | ) | $ | (737 | ) | $ | (1,007 | ) | |||
Other comprehensive loss before reclassifications | (1,109 | ) | (499 | ) | (1,608 | ) | ||||||
Losses reclassified from accumulated other comprehensive income | 749 | 1,236 | 1,985 | |||||||||
Total other comprehensive (loss)/income | (360 | ) | 737 | 377 | ||||||||
Balance as of January 2, 2016 | $ | (630 | ) | $ | — | $ | (630 | ) | ||||
NOTE 20. SEGMENT REPORTING
We are engaged in the manufacturing, distribution, marketing and sale of snack food products. We have two operating segments based on geographic operations that we aggregate into one reportable segment. We define operating segments as components of an organization for which discrete financial information is available and operating results are evaluated on a regular basis by the chief operating decision maker (“CODM”) in order to assess performance and allocate resources. Our CODM is our President and Chief Executive Officer. Characteristics of our organization which were relied upon in making the determination of two operating segments include the nature of the products that we sell, our organization's internal structure, and the information that is regularly reviewed by the CODM for the purpose of assessing performance and allocating resources. We aggregate our operating segments into a single reportable segment based on similarities between the operating segments’ economic characteristics, nature of products sold, production process, type of customer, methods of distribution, and regulatory environment.
86
Revenue by Product Category
Net revenue by product category was as follows:
(in thousands) | 2017 | 2016 | 2015 | |||||||||
Branded | ||||||||||||
Core brand | $ | 1,613,682 | $ | 1,478,601 | $ | 1,032,461 | ||||||
Allied brand | 163,393 | 159,695 | 157,730 | |||||||||
Total Branded | 1,777,075 | 1,638,296 | 1,190,191 | |||||||||
Partner brand | 291,580 | 300,436 | 300,480 | |||||||||
Other | 158,182 | 170,495 | 165,728 | |||||||||
Net revenue | $ | 2,226,837 | $ | 2,109,227 | $ | 1,656,399 | ||||||
Geographic Information
Revenue is attributable to the US, the Company’s country of domicile, and to international locations based on the country in which the product is produced. Net revenue by geographic location was as follows:
(in thousands) | 2017 | 2016 | 2015 | |||||||||
Location: | ||||||||||||
United States | $ | 2,115,227 | $ | 2,012,147 | $ | 1,656,399 | ||||||
International | 111,610 | 97,080 | — | |||||||||
Net revenue | $ | 2,226,837 | $ | 2,109,227 | $ | 1,656,399 | ||||||
Long-lived assets located in the US and international locations as of December 30, 2017 and December 31, 2016, were as follows:
(in thousands) | 2017 | 2016 | ||||||
Location: | ||||||||
United States | $ | 466,290 | $ | 477,450 | ||||
International | 26,147 | 24,434 | ||||||
Total | $ | 492,437 | $ | 501,884 | ||||
NOTE 21. SIGNIFICANT CUSTOMERS
Sales to our largest retail customer, Wal-Mart Stores, Inc. ("Wal-Mart"), either through IBOs or our direct distribution network, were approximately 13% of net revenue in 2017, 2016, and 2015. Our sales to Wal-Mart do not include sales of our products that may be made to Wal-Mart by third-party distributors outside the DSD network. Sales to these third-party distributors represent approximately 6% of our net revenue and may increase sales of our products to Wal-Mart by an amount we are unable to estimate. Accounts receivable as of December 30, 2017 and December 31, 2016, included receivables from Wal-Mart totaling $23.7 million and $21.0 million, respectively.
87
NOTE 22. QUARTERLY FINANCIAL INFORMATION (UNAUDITED)
A summary of quarterly financial information follows:
(in thousands, except per share data) | 2017 Quarter Ended | |||||||||||||||
April 1 | July 1 | September 30 | December 30 | |||||||||||||
Net revenue | $ | 531,501 | $ | 579,595 | $ | 564,184 | $ | 551,557 | ||||||||
Cost of sales | 346,735 | 369,308 | 357,993 | 352,630 | ||||||||||||
Gross profit | 184,766 | 210,287 | 206,191 | 198,927 | ||||||||||||
Selling, general and administrative | 159,463 | 179,239 | 154,811 | 150,352 | ||||||||||||
Transaction and integration related expenses | 1,107 | 478 | 276 | 1,141 | ||||||||||||
Impairment charges (1) | — | 7,920 | 105,230 | 1,633 | ||||||||||||
Other operating expense/(income), net | 270 | 205 | (279 | ) | (189 | ) | ||||||||||
Operating income/(expense) | 23,926 | 22,445 | (53,847 | ) | 45,990 | |||||||||||
Other income, net | (1,016 | ) | (218 | ) | (227 | ) | (53 | ) | ||||||||
Income/(loss) before interest and income taxes | 24,942 | 22,663 | (53,620 | ) | 46,043 | |||||||||||
Interest expense, net | 8,954 | 9,492 | 10,141 | 10,178 | ||||||||||||
Income/(loss) before income taxes | 15,988 | 13,171 | (63,761 | ) | 35,865 | |||||||||||
Income tax expense/(benefit) (2)(3) | 4,662 | 8,270 | (6,043 | ) | (153,033 | ) | ||||||||||
Income/(loss) from continuing operations | 11,326 | 4,901 | (57,718 | ) | 188,898 | |||||||||||
(Loss)/income from discontinued operations, net of income tax | — | (341 | ) | 1,473 | 804 | |||||||||||
Net income/(loss) | 11,326 | 4,560 | (56,245 | ) | 189,702 | |||||||||||
Net income attributable to non-controlling interests | 164 | 590 | 18 | 79 | ||||||||||||
Net income/(loss) attributable to Snyder’s-Lance, Inc. | $ | 11,162 | $ | 3,970 | $ | (56,263 | ) | $ | 189,623 | |||||||
Basic earnings/(loss) per share: | ||||||||||||||||
Continuing operations | $ | 0.12 | $ | 0.04 | $ | (0.60 | ) | $ | 1.94 | |||||||
Discontinued operations | — | — | 0.02 | 0.01 | ||||||||||||
Total basic earnings/(loss) per share | $ | 0.12 | $ | 0.04 | $ | (0.58 | ) | $ | 1.95 | |||||||
Diluted earnings/(loss) per share: | ||||||||||||||||
Continuing operations | $ | 0.11 | $ | 0.04 | $ | (0.60 | ) | $ | 1.92 | |||||||
Discontinued operations | — | — | 0.02 | 0.01 | ||||||||||||
Total diluted earnings/(loss) per share | $ | 0.11 | $ | 0.04 | $ | (0.58 | ) | $ | 1.93 | |||||||
Dividends declared per common share | $ | 0.16 | $ | 0.16 | $ | 0.16 | $ | 0.16 | ||||||||
Footnotes:
(1) During the second quarter of 2017, we recognized impairment charges of $7.9 million. Of this, $7.2 million relates to the write-down of fixed assets associated with our decision to close our manufacturing facility in Perry, Florida. During the third quarter of 2017, we recognized a $46.3 million impairment of goodwill associated with our European reporting unit, $46.6 million impairment of our Pop Secret® trademark and $11.8 million impairment of our KETTLE® Chips U.K. trademark. During the fourth quarter of 2017, we recognized an impairment charge of $1.6 million associated with manufacturing assets for which we no longer had a business use.
(2) During the third quarter of 2017, we recognized an income tax benefit which was driven by the goodwill impairment recognized, which is non-deductible for tax purposes, and the discrete tax impact of the trademark impairments recognized in the third quarter of 2017.
(3) During the fourth quarter of 2017, we recognized an income tax benefit of $162.4 million for the provisional tax impacts of the Tax Act enacted in December 2017 and revaluation of our deferred income tax balances.
88
(in thousands, except per share data) | 2016 Quarter Ended | |||||||||||||||
April 2 (4) | July 2 | October 1 | December 31 | |||||||||||||
Net revenue | $ | 447,869 | $ | 561,292 | $ | 543,903 | $ | 556,163 | ||||||||
Cost of sales | 304,779 | 349,736 | 344,807 | 346,115 | ||||||||||||
Gross profit (1) | 143,090 | 211,556 | 199,096 | 210,048 | ||||||||||||
Selling, general and administrative | 121,555 | 160,121 | 152,980 | 159,301 | ||||||||||||
Transaction and integration related expenses | 48,978 | 9,945 | 3,656 | 3,693 | ||||||||||||
Impairment charges | 374 | 489 | 507 | 3,096 | ||||||||||||
Other operating income, net (2) | (505 | ) | (914 | ) | (3,776 | ) | (359 | ) | ||||||||
Operating (loss)/income | (27,312 | ) | 41,915 | 45,729 | 44,317 | |||||||||||
Other (income)/expense, net | (328 | ) | (227 | ) | 305 | 414 | ||||||||||
(Loss)/income before interest and income taxes | (26,984 | ) | 42,142 | 45,424 | 43,903 | |||||||||||
Loss on early extinguishment of debt | 4,749 | — | — | — | ||||||||||||
Interest expense, net | 4,729 | 9,361 | 9,215 | 9,308 | ||||||||||||
(Loss)/income before income taxes | (36,462 | ) | 32,781 | 36,209 | 34,595 | |||||||||||
Income tax (benefit)/expense | (13,614 | ) | 12,381 | 10,663 | 15,890 | |||||||||||
(Loss)/income from continuing operations | (22,848 | ) | 20,400 | 25,546 | 18,705 | |||||||||||
(Loss)/income from discontinued operations, net of income tax (3) | (2,546 | ) | (783 | ) | 3,655 | (27,426 | ) | |||||||||
Net (loss)/income | (25,394 | ) | 19,617 | 29,201 | (8,721 | ) | ||||||||||
Net income/(loss) attributable to non-controlling interests | 37 | (64 | ) | (114 | ) | (41 | ) | |||||||||
Net (loss)/income attributable to Snyder’s-Lance, Inc. | $ | (25,431 | ) | $ | 19,681 | $ | 29,315 | $ | (8,680 | ) | ||||||
Basic (loss)/earnings per share: | ||||||||||||||||
Continuing operations | $ | (0.29 | ) | $ | 0.21 | $ | 0.26 | $ | 0.19 | |||||||
Discontinued operations | (0.03 | ) | — | 0.04 | (0.28 | ) | ||||||||||
Total basic (loss)/earnings per share | $ | (0.32 | ) | $ | 0.21 | $ | 0.30 | $ | (0.09 | ) | ||||||
Diluted (loss)/earnings per share: | ||||||||||||||||
Continuing operations | $ | (0.29 | ) | $ | 0.21 | $ | 0.26 | $ | 0.19 | |||||||
Discontinued operations | (0.03 | ) | (0.01 | ) | 0.04 | (0.28 | ) | |||||||||
Total diluted (loss)/earnings per share | $ | (0.32 | ) | $ | 0.20 | $ | 0.30 | $ | (0.09 | ) | ||||||
Dividends declared per common share | $ | 0.16 | $ | 0.16 | $ | 0.16 | $ | 0.16 | ||||||||
Footnotes:
(1) During the first quarter of 2016, our gross profit was negatively impacted by the inventory step-up of $13.6 million required for purchase accounting related to the Diamond Foods acquisition.
(2) During the third quarter of 2016, we recognized an insurance settlement of $3.8 million related to a business interruption claim that resulted from an unexpected production outage in the fourth quarter of 2015.
(3) During the fourth quarter of 2016, we recognized a $32.6 million pre-tax loss on the sale of Diamond of California.
(4) As Diamond Foods was acquired on February 29, 2016, the first quarter revenue and expenses, with the exception of transaction and integration related expenses, are substantially less than the other three quarters.
89
NOTE 23. SUBSEQUENT EVENTS
On February 7, 2018, our Board of Directors declared a quarterly cash dividend of $0.16 per share payable on March 2, 2018 to shareholders of record on February 22, 2018.
Refer to Note 2 for information regarding the status of the anticipated acquisition of our company by Campbell Soup Company.
90
SCHEDULE II – VALUATION AND QUALIFYING ACCOUNTS
For the Fiscal Years Ended December 30, 2017, December 31, 2016 and January 2, 2016
(in thousands) | Beginning Balance | Additions/(Reductions) to Expense or Other Accounts | Deductions | Ending Balance | ||||||||||||
Fiscal year ended December 30, 2017 | ||||||||||||||||
Allowance for doubtful accounts | $ | 1,290 | $ | 1,733 | $ | (456 | ) | $ | 2,567 | |||||||
Deferred tax asset valuation allowance | $ | 11,283 | $ | 3,047 | $ | (160 | ) | $ | 14,170 | |||||||
Fiscal year ended December 31, 2016 | ||||||||||||||||
Allowance for doubtful accounts | $ | 917 | $ | 472 | $ | (99 | ) | $ | 1,290 | |||||||
Deferred tax asset valuation allowance | $ | 637 | $ | 10,664 | $ | (18 | ) | $ | 11,283 | |||||||
Fiscal year ended January 2, 2016 | ||||||||||||||||
Allowance for doubtful accounts | $ | 1,778 | $ | 1,104 | $ | (1,965 | ) | $ | 917 | |||||||
Deferred tax asset valuation allowance | $ | 626 | $ | 11 | $ | — | $ | 637 | ||||||||
91
Report of Independent Registered Public Accounting Firm
To the Board of Directors and Stockholders of Snyder’s-Lance, Inc.:
Opinions on the Financial Statements and Internal Control over Financial Reporting
We have audited the accompanying consolidated balance sheets of Snyder’s-Lance, Inc. and its subsidiaries as of December 30, 2017 and December 31, 2016, and the related consolidated statements of income, comprehensive income, stockholders’ equity and cash flows for each of the three years in the period ended December 30, 2017, including the related notes and financial statement schedule listed in the index appearing under Item 15(a)(2) (collectively referred to as the “consolidated financial statements”). We also have audited the Company's internal control over financial reporting as of December 30, 2017, based on criteria established in Internal Control - Integrated Framework (2013) issued by the Committee of Sponsoring Organizations of the Treadway Commission (COSO).
In our opinion, the consolidated financial statements referred to above present fairly, in all material respects, the financial position of the Company as of December 30, 2017 and December 31, 2016, and the results of their operations and their cash flows for each of the three years in the period ended December 30, 2017 in conformity with accounting principles generally accepted in the United States of America. Also in our opinion, the Company maintained, in all material respects, effective internal control over financial reporting as of December 30, 2017, based on criteria established in Internal Control - Integrated Framework (2013) issued by the COSO.
Basis for Opinions
The Company's management is responsible for these consolidated financial statements, for maintaining effective internal control over financial reporting, and for its assessment of the effectiveness of internal control over financial reporting, included in Management’s Report on Internal Control over Financial Reporting appearing under Item 9A. Our responsibility is to express opinions on the Company’s consolidated financial statements and on the Company's internal control over financial reporting based on our audits. We are a public accounting firm registered with the Public Company Accounting Oversight Board (United States) ("PCAOB") and are required to be independent with respect to the Company in accordance with the U.S. federal securities laws and the applicable rules and regulations of the Securities and Exchange Commission and the PCAOB.
We conducted our audits in accordance with the standards of the PCAOB. Those standards require that we plan and perform the audits to obtain reasonable assurance about whether the consolidated financial statements are free of material misstatement, whether due to error or fraud, and whether effective internal control over financial reporting was maintained in all material respects.
Our audits of the consolidated financial statements included performing procedures to assess the risks of material misstatement of the consolidated financial statements, whether due to error or fraud, and performing procedures that respond to those risks. Such procedures included examining, on a test basis, evidence regarding the amounts and disclosures in the consolidated financial statements. Our audits also included evaluating the accounting principles used and significant estimates made by management, as well as evaluating the overall presentation of the consolidated financial statements. Our audit of internal control over financial reporting included obtaining an understanding of internal control over financial reporting, assessing the risk that a material weakness exists, and testing and evaluating the design and operating effectiveness of internal control based on the assessed risk. Our audits also included performing such other procedures as we considered necessary in the circumstances. We believe that our audits provide a reasonable basis for our opinions.
Definition and Limitations of Internal Control over Financial Reporting
A company’s internal control over financial reporting is a process designed to provide reasonable assurance regarding the reliability of financial reporting and the preparation of financial statements for external purposes in accordance with generally accepted accounting principles. A company’s internal control over financial reporting includes those policies and procedures that (i) pertain to the maintenance of records that, in reasonable detail, accurately and fairly reflect the transactions and dispositions of the assets of the company; (ii) provide reasonable assurance that transactions are recorded as necessary to permit preparation of financial statements in accordance with generally accepted accounting principles, and that receipts and expenditures of the company are being made only in accordance with authorizations of management and directors of the company; and (iii) provide reasonable assurance regarding prevention or timely detection of unauthorized acquisition, use, or disposition of the company’s assets that could have a material effect on the financial statements.
92
Because of its inherent limitations, internal control over financial reporting may not prevent or detect misstatements. Also, projections of any evaluation of effectiveness to future periods are subject to the risk that controls may become inadequate because of changes in conditions, or that the degree of compliance with the policies or procedures may deteriorate.
/s/ PricewaterhouseCoopers LLP
Charlotte, North Carolina
February 28, 2018
We have served as the Company’s auditor since 2014.
93
Item 9. Changes in and Disagreements with Accountants on Accounting and Financial Disclosure
Not applicable.
Item 9A. Controls and Procedures
Disclosure Controls and Procedures
As of the end of the period covered by this report, and pursuant to Rule 13a-15(b) of the Securities Exchange Act of 1934 (the “Exchange Act”), we conducted an evaluation under the supervision and with the participation of management, including our Chief Executive Officer and Chief Financial Officer, of the effectiveness of the design and operation of our disclosure controls and procedures as defined in Rules 13a-15(e) and 15d-15(e) of the Exchange Act. Based upon that evaluation, our Chief Executive Officer and Chief Financial Officer concluded that our disclosure controls and procedures were effective as of December 30, 2017.
Management's Report on Internal Control over Financial Reporting
Our management is responsible for establishing and maintaining adequate internal control over financial reporting, as such term is defined in Rules 13a-15(f) and 15d-15(e) of the Exchange Act. Under the supervision and with the participation of our management, including the Chief Executive Officer and Chief Financial Officer, we conducted an evaluation of the effectiveness of our internal control over financial reporting based on the criteria established in Internal Control - Integrated Framework (2013) by the Committee of Sponsoring Organizations of the Treadway Commission. Based on that evaluation, our management concluded that our internal control over financial reporting was effective as of December 30, 2017.
The effectiveness of the Company's internal control over financial reporting as of December 30, 2017 has been audited by PricewaterhouseCoopers LLP, an independent registered public accounting firm, as stated in their report which appears herein.
Changes in Internal Control over Financial Reporting
There have been no changes in our internal control over financial reporting as defined in Rules 13a-15(f) and 15d-15(f) during the quarter ended December 30, 2017 that have materially affected, or are reasonably likely to materially affect, our internal control over financial reporting.
Item 9B. Other Information
None.
94
PART III
Item 10. Directors, Executive Officers and Corporate Governance
In addition to the information provided in Part I of this Form 10-K on the Executive Officers of the Company and the information below on the Code of Conduct, additional information required hereunder is incorporated herein by reference to either a definitive proxy statement or an amendment to this Annual Report on Form 10-K to be filed within 120 days of the Company's fiscal year ended December 30, 2017.
Code of Conduct
We have adopted a Code of Conduct that covers our officers, our Senior Financial Officers, including the Chief Executive Officer, Chief Financial Officer, Treasurer, Corporate Controller and Principal Accounting Officer and our employees. In addition, we have adopted a Code of Ethics which covers the members of the Board of Directors. Information about these codes are posted on our website at www.snyderslance.com.
We will disclose any substantive amendments to, or waivers from, our Code of Conduct for the Board of Directors on our website or in a report on Form 8-K.
Item 11. Executive Compensation
The information required hereunder is incorporate herein by reference to either a definitive proxy statement or an amendment to this Annual Report on Form 10-K to be filed within 120 days of the Company's fiscal year ended December 30, 2017.
Item 12. Security Ownership of Certain Beneficial Owners and Management and Related Stockholder Matters
The information required hereunder is incorporated herein by reference to either a definitive proxy statement or an amendment to this Annual Report on Form 10-K to be filed within 120 days of the Company's fiscal year ended December 30, 2017.
Item 13. Certain Relationships and Related Transactions and Director Independence
The information required hereunder is incorporated herein by reference to either a definitive proxy statement or an amendment to this Annual Report on Form 10-K to be filed within 120 days of the Company's fiscal year ended December 30, 2017.
Item 14. Principal Accountant Fees and Services
The information required hereunder is incorporated herein by reference to either a definitive proxy statement or an amendment to this Annual Report on Form 10-K to be filed within 120 days of the Company's fiscal year ended December 30, 2017.
PART IV
Item 15. Exhibits and Financial Statement Schedules
(a) 1. Financial Statements
The following financial statements are filed as part of this report:
95
Page | |
(a) | 2. Financial Schedules. |
The following financial schedules are filed as part of this report:
Schedules other than that listed above have been omitted because of the absence of conditions under which they are required or because information required is included in financial statements or the notes thereto.
(a) | 3. Exhibit Index. |
96
97
98
99
101 The following materials from the Registrant’s Annual Report on Form 10-K for the fiscal year ended December 30, 2017 formatted in XBRL (eXtensible Business Reporting Language): (i) the Consolidated Statements of Income, (ii) the Consolidated Statements of Comprehensive Income, (iii) the Consolidated Balance Sheets, (iv) the Consolidated Statements of Stockholders’ Equity, (v) the Consolidated Statements of Cash Flows and (vi) Notes to the consolidated financial statements.
________________________________________
* Management contract or compensatory plan or arrangement.
100
Item 16. Form 10-K Summary
None.
SIGNATURES
Pursuant to the requirements of Section 13 or 15(d) of the Securities Exchange Act of 1934, the Registrant has duly caused this Annual Report to be signed on its behalf by the undersigned, thereunto duly authorized.
SNYDER’S-LANCE, INC. | |||
Dated: February 28, 2018 | By: | /s/ Brian J. Driscoll | |
Brian J. Driscoll | |||
President and Chief Executive Officer | |||
Pursuant to the requirements of the Securities Exchange Act of 1934, this Annual Report has been signed below by the following persons on behalf of the Registrant and in the capacities and on the dates indicated.
Signature | Capacity | Date | ||
/s/ Brian J. Driscoll | President and Chief Executive Officer | February 28, 2018 | ||
Brian J. Driscoll | and Director | |||
(Principal Executive Officer) | ||||
/s/ Alexander W. Pease | Executive Vice President, Chief Financial | February 28, 2018 | ||
Alexander W. Pease | Officer | |||
(Principal Financial Officer) | ||||
/s/ Margaret E. Wicklund | Senior Vice President, Corporate Controller | February 28, 2018 | ||
Margaret E. Wicklund | and Assistant Secretary | |||
(Principal Accounting Officer) | ||||
/s/ James W. Johnston | Chairman of the Board of Directors | February 28, 2018 | ||
James W. Johnston | ||||
/s/ Jeffrey A. Atkins | Director | February 28, 2018 | ||
Jeffrey A. Atkins | ||||
/s/ Peter P. Brubaker | Director | February 28, 2018 | ||
Peter P. Brubaker | ||||
101
/s/ C. Peter Carlucci, Jr. | Director | February 28, 2018 | ||
C. Peter Carlucci, Jr. | ||||
/s/ John E. Denton | Director | February 28, 2018 | ||
John E. Denton | ||||
/s/ Lawrence V. Jackson | Director | February 28, 2018 | ||
Lawrence V. Jackson | ||||
/s/ David C. Moran | Director | February 28, 2018 | ||
David C. Moran | ||||
/s/ Dan C. Swander | Director | February 28, 2018 | ||
Dan C. Swander | ||||
/s/ Isaiah Tidwell | Director | February 28, 2018 | ||
Isaiah Tidwell | ||||
/s/ Patricia A. Warehime | Director | February 28, 2018 | ||
Patricia A. Warehime | ||||
102