Attached files
| file | filename |
|---|---|
| 8-K - 8-K - Evoqua Water Technologies Corp. | a18-3810_48k.htm |
This presentation contains forward-looking statements within the meaning of the Private Securities Litigation Reform Act of 1995. All of these forward-looking statements are based on our current expectations, assumptions, estimates and projections. While we believe these expectations, assumptions, estimates and projections are reasonable, such forward-looking statements are only predictions and involve known and unknown risks and uncertainties, many of which are beyond our control. These and other important factors may cause our actual results, performance or achievements to differ materially from any future results, performance or achievements expressed or implied by these forward-looking statements, or could affect our share price. Some of the factors that could cause actual results to differ materially from those expressed or implied by the forward-looking statements include among other things, general global economic and business conditions; our ability to compete successfully in our markets; our ability to continue to develop or acquire new products, services and solutions and adapt our business to meet the demands of our customers, comply with changes to government regulations and achieve market acceptance with acceptable margins; our ability to implement our growth strategy, including acquisitions and our ability to identify suitable acquisition targets; our ability to operate or integrate any acquired businesses, assets or product lines profitably or otherwise successfully implement our growth strategy; delays in enactment or repeals of environmental laws and regulations; the potential for us to become subject to claims relating to handling, storage, release or disposal of hazardous materials; risks associated with product defects and unanticipated or improper use of our products; the potential for us to incur liabilities to customers as a result of warranty claims of failure to meet performance guarantees; our ability to meet our customers’ safety standards or the potential for adverse publicity affecting our reputation as a result of incidents such as workplace accidents, mechanical failures, spills, uncontrolled discharges, damage to customer or third-party property or the transmission of contaminants or diseases; litigation, regulatory or enforcement actions and reputational risk as a result of the nature of our business or our participation in large-scale projects; seasonality of sales and weather conditions; risks related to government customers, including potential challenges to our government contracts or our eligibility to serve government customers; the potential for our contracts with federal, state and local governments to be terminated or adversely modified prior to completion; risks related to foreign, federal, state and local environmental, health and safety laws and regulations and the costs associated therewith; risks associated with international sales and operations, including our operations in China; our ability to adequately protect our intellectual property from third-party infringement; our increasing dependence on the continuous and reliable operation of our information technology systems; risks related to our substantial indebtedness; our need for a significant amount of cash, which depends on many factors beyond our control; AEA’s influence over us; and other factors to be described in the “Risk Factors” section in our Annual Report on Form 10-K for the fiscal year ended September 30, 2017. All statements other than statements of historical fact included in the presentation are forward-looking statements including, but not limited to, expected financial outlook for fiscal 2018. Any forward-looking statement that we make in this presentation speaks only as of February 28, 2018. We undertake no obligation to update or revise, or to publicly announce any update or revision to, any of the forward-looking statements made herein, whether as a result of new information, future events or otherwise. Use of Non-GAAP Financial Measures - This presentation contains “non-GAAP financial measures,” which are adjusted financial measures that are not calculated and presented in accordance with generally accepted accounting principles in the United States, or “GAAP.” These non-GAAP adjusted financial measures are provided as additional information for investors. We believe these non-GAAP adjusted financial measures, such as Adjusted EBITDA and free cash flow, are helpful to management and investors in highlighting trends in our operating results, because they exclude, among other things, certain results of decisions that are outside the control of management, while other measures can differ significantly depending on long-term strategic decisions regarding capital structure, the tax jurisdictions in which we operate and capital investments. The presentation of this additional information is not meant to be considered in isolation or as a substitute for GAAP measures of net income (loss), or net cash provided by (used in) operating activities prepared in accordance with GAAP. For reconciliations of the non-GAAP adjusted financial measures used in this presentation to the nearest respective GAAP measures, see the Appendix to this presentation. Forward-Looking Statement Safe Harbor
Investor Visit - February 28, 2018 Agenda Time Description Presenter 10:00 am - 10:05 am Welcome and Introductions; Safety Review Dan Brailer, V.P. Investor Relations 10:05 am - 10:35 am Business Overview / Strategy Ron Keating, Chief Executive Officer 10:35 am - 10:50 am Financial Overview Ben Stas, Chief Financial Officer 10:50 am - 11:00 am Industrial Segment Overview Rodney Aulick, Pres., Industrial Segment 11:00 am - 11:10 am Municipal Segment Overview Malcolm Kinnaird, Pres. Municipal Segment 11:10 am - 11:20 am Products Segment Overview Ken Rodi, Pres., Products Segment 11:20 am - 11:30 am B r e a k 11:30 am - 11:45 am Water Market Trends / M&A Snehal Desai, Exec. V.P., Chief Growth Officer 11:45 am - 12:00 pm Water One® Assurance Tour David Szweda, V.P. Service Operations 12:00 pm - 1:00 pm Lunch and Q&A Evoqua Leadership Team 1:00 pm - 2:00 pm Pittsburgh Allegheny County Thermal - Facility Overview and Tour Tony Purcell, Heavy Industry Regional Director 2:00 pm Departures
Ron Keating Chief Executive Officer
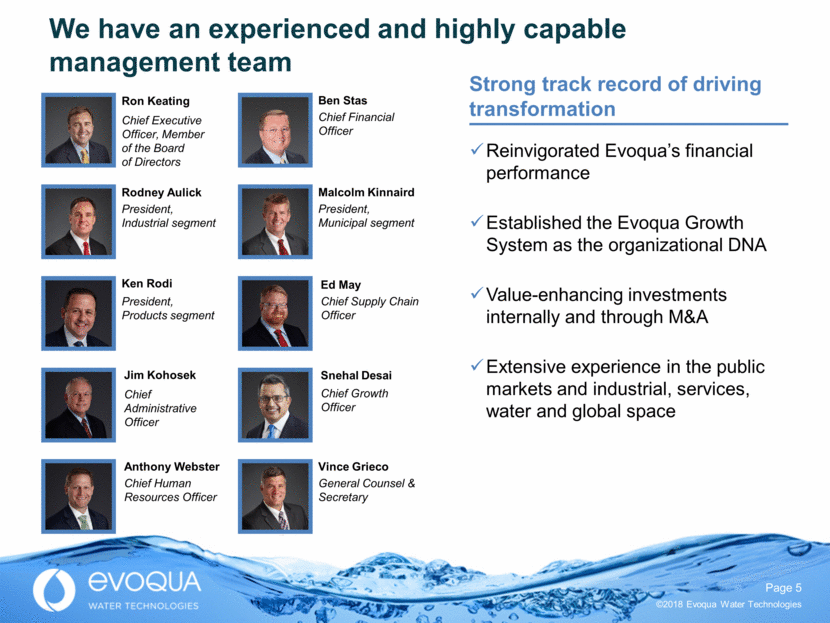
Malcolm Kinnaird President, Municipal segment Reinvigorated Evoqua’s financial performance Established the Evoqua Growth System as the organizational DNA Value-enhancing investments internally and through M&A Extensive experience in the public markets and industrial, services, water and global space We have an experienced and highly capable management team Ron Keating Chief Executive Officer, Member of the Board of Directors Ben Stas Chief Financial Officer Rodney Aulick President, Industrial segment Ken Rodi President, Products segment Vince Grieco General Counsel & Secretary Snehal Desai Chief Growth Officer Ed May Chief Supply Chain Officer Anthony Webster Chief Human Resources Officer Jim Kohosek Chief Administrative Officer Strong track record of driving transformation
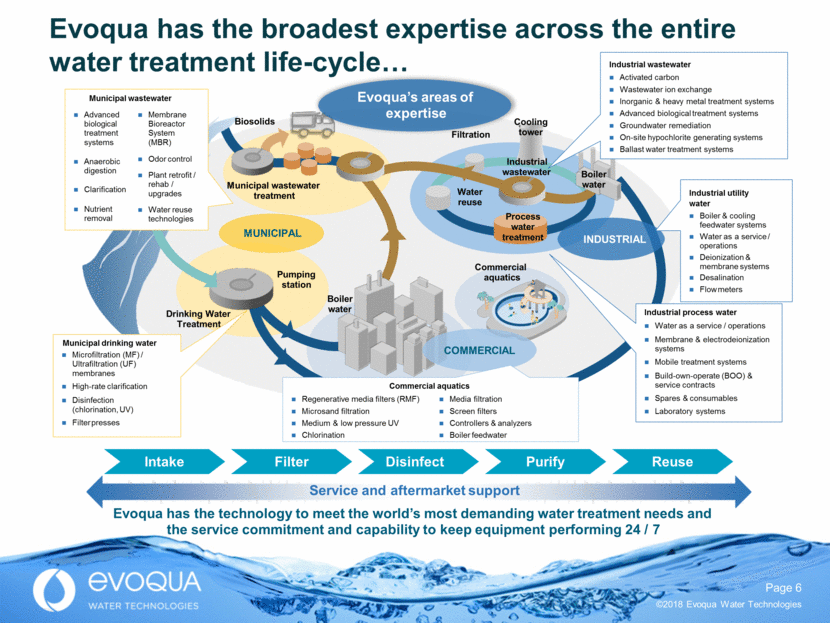
MUNICIPAL Drinking Water Treatment Pumping station Process water treatment Water reuse Filtration Industrial wastewater Municipal wastewater treatment Biosolids COMMERCIAL INDUSTRIAL Commercial aquatics Boiler water Cooling tower Boiler water Evoqua has the technology to meet the world’s most demanding water treatment needs and the service commitment and capability to keep equipment performing 24 / 7 Filter Intake Service and aftermarket support Purify Reuse Evoqua’s areas of expertise Advanced biological treatment systems Anaerobic digestion Clarification Nutrient removal Membrane Bioreactor System (MBR) Odor control Plant retrofit / rehab / upgrades Water reuse technologies Municipal wastewater Municipal drinking water Microfiltration (MF) / Ultrafiltration (UF) membranes High-rate clarification Disinfection (chlorination, UV) Filter presses Industrial utility water Boiler & cooling feedwater systems Water as a service / operations Deionization & membrane systems Desalination Flow meters Industrial process water Water as a service / operations Membrane & electrodeionization systems Mobile treatment systems Build-own-operate (BOO) & service contracts Spares & consumables Laboratory systems Industrial wastewater Activated carbon Wastewater ion exchange Inorganic & heavy metal treatment systems Advanced biological treatment systems Groundwater remediation On-site hypochlorite generating systems Ballast water treatment systems Evoqua has the broadest expertise across the entire water treatment life-cycle Commercial aquatics Regenerative media filters (RMF) Microsand filtration Medium & low pressure UV Chlorination Media filtration Screen filters Controllers & analyzers Boiler feedwater Disinfect
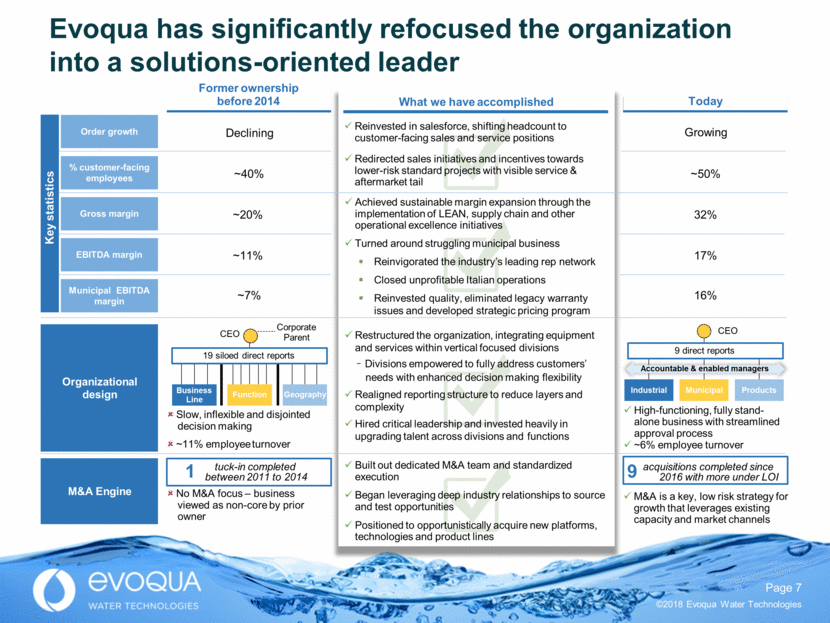
Former ownership before 2014 Today ~20% Declining ~40% 32% ~50% Gross margin EBITDA margin % customer-facing employees Order growth Municipal EBITDA margin Key statistics Reinvested in salesforce, shifting headcount to customer-facing sales and service positions Redirected sales initiatives and incentives towards lower-risk standard projects with visible service & aftermarket tail Organizational design Restructured the organization, integrating equipment and services within vertical focused divisions - Divisions empowered to fully address customers’ needs with enhanced decision making flexibility Realigned reporting structure to reduce layers and complexity Hired critical leadership and invested heavily in upgrading talent across divisions and functions Achieved sustainable margin expansion through the implementation of LEAN, supply chain and other operational excellence initiatives Turned around struggling municipal business Reinvigorated the industry’s leading rep network Closed unprofitable Italian operations Reinvested quality, eliminated legacy warranty issues and developed strategic pricing program What we have accomplished No M&A focus – business viewed as non-core by prior owner tuck-in completed between 2011 to 2014 1 M&A is a key, low risk strategy for growth that leverages existing capacity and market channels acquisitions completed since 2016 with more under LOI 9 CEO 9 direct reports Accountable & enabled managers Industrial Municipal Products High-functioning, fully stand- alone business with streamlined approval process ~6% employee turnover Evoqua has significantly refocused the organization into a solutions-oriented leader ~11% ~7% 17% 16% M&A Engine CEO Corporate Parent Slow, inflexible and disjointed decision making ~11% employee turnover Business Line Function Geography 19 siloed direct reports Growing Built out dedicated M&A team and standardized execution Began leveraging deep industry relationships to source and test opportunities Positioned to opportunistically acquire new platforms, technologies and product lines
Sources: American Water Works Association, International Monetary Fund, United States Environmental Protection Agency, United Nations Department of Economic and Social Affairs, National Geographic Global macro trends / sustainability will drive substantial long-term growth Environmental regulation All 50 U.S. states face issues relating to existing and emerging contaminants Renewed focus on infrastructure investment $1 trillion estimated over 25 years for critical drinking water and wastewater repairs in U.S. Population growth Clean water crisis 20% of world aquifers already estimated overexploited Urbanization 2.5 billion people expected to be added to the world’s urban population by 2050, further stressing water infrastructure Water scarcity 66% of the world’s population will live in water-stressed regions by 2025 Economic growth 3.9% estimated 2018 global GDP growth Customers want partners like Evoqua to drive their sustainability efforts 2,000+ gallons / day virtual footprint for average American Embedded water 33% growth in world population by 2050
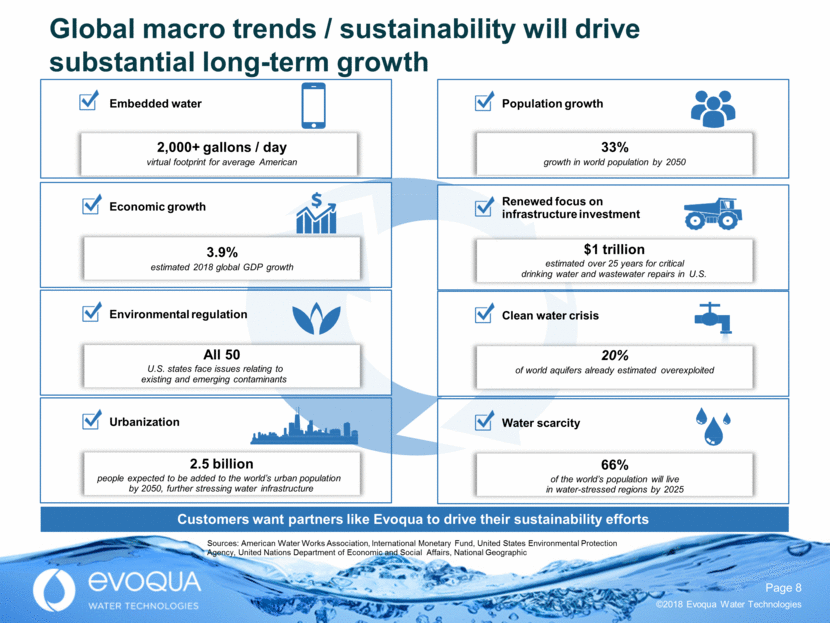
Provides equipment and support for process water, utility water, boiler feedwater and the treatment of steam condensate Enables environmental regulatory compliance through a wide portfolio of wastewater technologies Meets stringent process and wastewater requirements in both RD&E and manufacturing FDA compliance drives ~80% of revenue Provides reliably clean drinking water to the largest cities in the world through integrated membrane systems and disinfection products Manages water intake screens, boiler feed water systems (including polishing using continuous electrodeionization) and condensate polishing Enables environmental regulatory compliance through a wide portfolio of wastewater technologies Develops efficient and reliable waste treatment systems to handle specific performance requirements Offers comprehensive and customizable odor control solutions and services Meets the rigorous treatment demands across aquatic applications for leisure facilities, fountains and theme parks General boiler and cooling feedwater systems Ensures process / ingredient water complies with regulations and provides solutions for water conservation Provides comprehensive technology for wastewater treatment and recycle / reuse Enables next generation of wafer size / geometry with ultrapure input water and treatment of contaminated wastewater Pharma / Health Microelectronics Hydrocarbon & Chemical Processing Food & Beverage Power Municipal Drinking Water Municipal Wastewater Provides full-service process water and wastewater treatment services supported by a mobile fleet guaranteeing maximum up-time General Manufacturing Provides solutions and services to the industry for maritime growth prevention, biological fouling protection and ballast water treatment Maritime Commercial Aquatics No single vertical is greater than 25% of Evoqua revenue Attractive and diverse vertical exposure
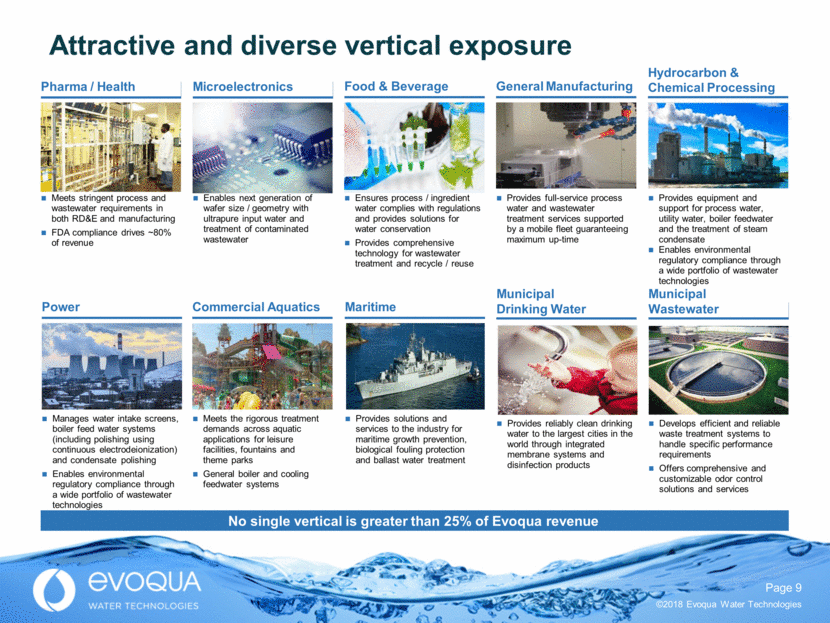
Representative customers(1) Industrial Full life cycle service and solutions for process and utility water Water as a service Filtration / Disinfection Anode technology Electrodeionization Analyzers and controllers ($ in millions) Full range of products for wastewater and drinking water applications Broad services for odor and corrosion control 24% 15% 23% Municipal Products LTM(3) 12/31/2017 EBITDA margin(2) Services and solutions LTM(3) 12/31/2017 revenue Trademarks shown are those of their respective owners. EBITDA margin is defined as EBITDA as a percentage of revenue. For the definition of EBITDA and a reconciliation to operating profit, its most directly comparable financial measure presented in accordance with GAAP, see the Appendix hereto. Last twelve months calculated as the sum of FY 2017 and Q1'18 EBITDA , less Q1'17 EBITDA, excludes central functions costs. $663 $278 $324 We serve our customers through three operating segments
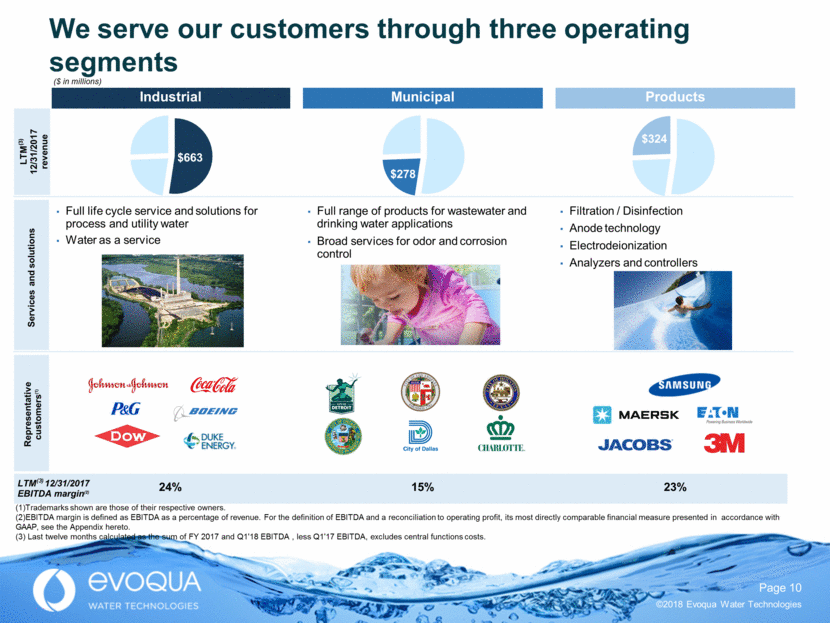
Water One® (per gallon) On-demand services (As needed) Service branches 4x as many local service branches as the next largest competitor Preventative maintenance (Quarterly to monthly) Operating services (Weekly to daily) Sticky revenue with high retention Highly visible revenue base Attractive margins putting us within 2 hours of 90%+ of our 25,000+ industrial customers (emerging) Evoqua has an unmatched service and support network
Deploy Water One® smart technology across installed base Introduce new, innovative technologies (e.g., NEXED®, Mark IV) Drive acquisition strategy and complement internal RD&E technologies, markets, geographies Product, Technology & Acquisitions Leverage customer intimate business model to drive penetration of existing customers Execute high-value, low-risk sales improvement initiatives and leverage multiple channels Expand in underpenetrated regions with a focus on service and aftermarket Exploit foundation of large, global markets with strong tailwinds Build on #1 market share and ability to provide full-suite of products and solutions Target vertical-specific water treatment growth opportunities Core market penetration Market growth Margin expansion Focused growth in high margin offerings Water One®, Aftermarket, Defender, etc Drive operating leverage through capacity utilization with limited additional investment required Execute operational improvements via LEAN, ePro, supply chain, VAVE, shared services, etc Evoqua’s Multi-Pronged Growth Strategy
Ben Stas Chief Financial Officer
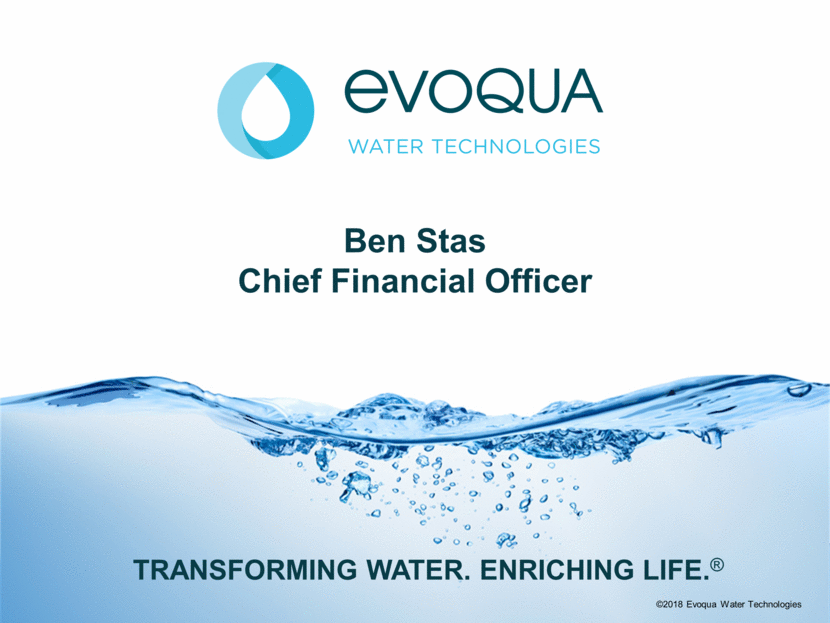
FY 2014 FY 2015 FY 2016 FY 2017 FY 2018E $117 $120 $160 $208 $255 FY 2015 FY 2016 FY 2017 FY 2018E $1,097 $1,061 $1,137 $1,247 $1,360 % growth % margin % growth Revenue 5% CAGR(2) $1,330 2018 Outlook (2) 7-9% 9.7% 7.2% (3.3%) 17-19% 16.6% 14.1% 11.3% 10.7% 13-23% 2.3% 33.5% 29.7% For the definition of Adjusted EBITDA and a reconciliation to net income (loss), its most directly comparable financial measure presented in accordance with GAAP, see the Appendix hereto. Represents CAGR from FY 2014 to FY 2018 using the midpoint of the FY 2018 outlook range. Represents Successor Period 2014 (January 16, 2014 through September 30, 2014) and Predecessor Period 2014 (October 1, 2013 through January 15, 2014) combined. $235 2018 Outlook 20% CAGR(2) FY 2014(3) (3) Summary of historical financials ($ in millions, FYE September 30) ($ in millions, FYE September 30) Adjusted EBITDA(1)
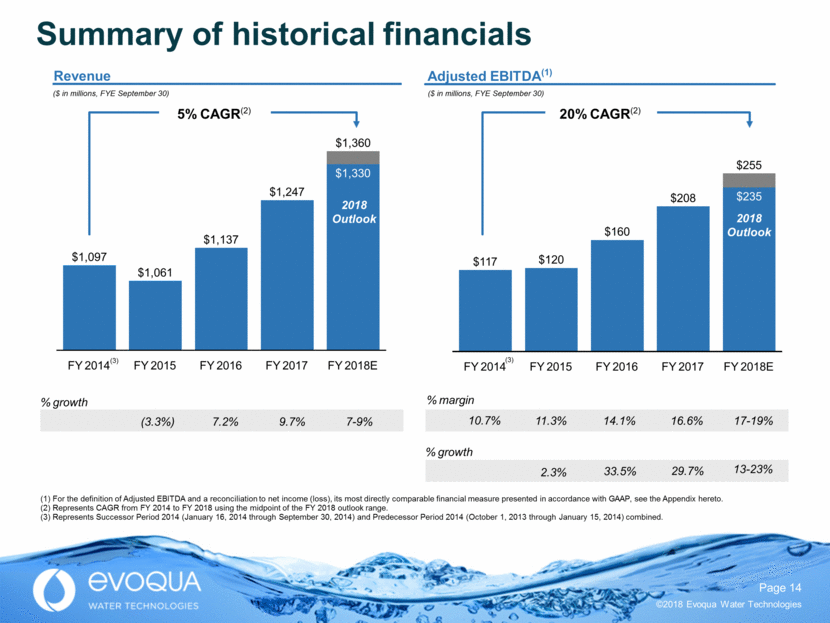
Q1'18 $279.9 $297.1 Q1'18 $37.2 $40.0 Q1'17 % margin(3) ($ in millions) Q1'17 Adjusted EBITDA(1) Revenue Highlights First Quarter 2018 Revenue growth of 6.1% 4.8% from tuck-in acquisitions 1.3% pro forma growth(2) Driven by 4.2% growth in Industrial segment Prior year included large projects (timing) in Municipal and Products Segments Adjusted EBITDA growth of 7.4% Adjusted EBITDA margin of 13.5% Accretive impact of acquisitions Lower costs from cost improvement initiatives Partly offset by large project related product mix and aftermarket timing impacts ($ in millions) 13.3% 13.5% (1) For the definition of Adjusted EBITDA and a reconciliation to net income (loss), its most directly comparable financial measure presented in accordance with GAAP, see the Appendix hereto. (2) For the definition of pro forma growth and a reconciliation to revenue, its most directly comparable financial measure presented in accordance with GAAP, see the Appendix hereto. (3) Adjusted EBITDA margin % is defined as Adjusted EBITDA as a percentage of revenue. +7.4% growth +6.1% growth First quarter 2018 performance highlights
Initiatives achieved to date Reduced spans and layers Strategic sourcing and supply chain excellence Branch optimization International restructuring Water One® remote system monitoring and other data analytics Company-wide IT upgrades Internet of Things (“IoT”) opportunities across the platform Consolidate and manage global spending through the ePro procurement processes Improved IT systems Deploying LEAN throughout Continuous improvement of operations, processes and organizational structure Offshore engineering initiative Service network logistics Cost Savings and Profitable Growth Continuing progress Supply Chain Operational excellence Connectivity
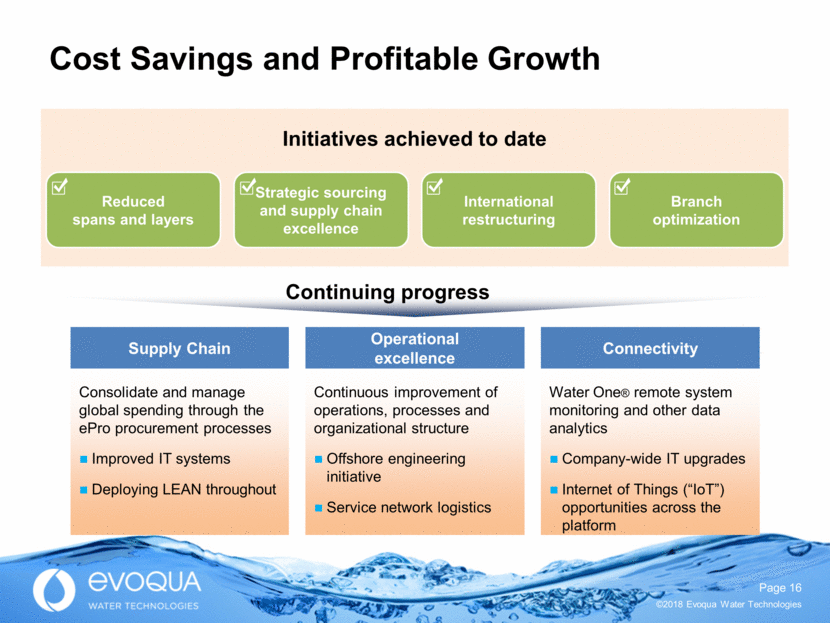
Full Year Revenue $1.33 to $1.36 billion Adjusted EBITDA(1) $235 to $255 million Notes: Excludes unannounced acquisitions For the definition of Adjusted EBITDA and a reconciliation to net income (loss), its most directly comparable financial measure presented in accordance with GAAP, see the Appendix hereto. 2018 Full year outlook
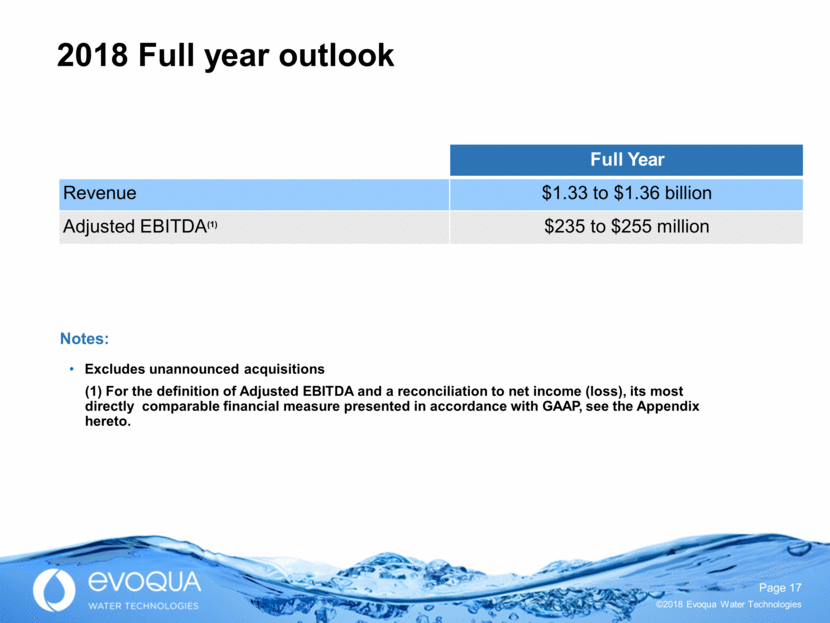
Number-one market position in North America(1) Positioned to capitalize on favorable industry growth dynamics Iconic brands and differentiated technologies Unparalleled service network Large installed base Significant operating leverage Experienced management team Proven organic and inorganic growth platform (1) (1) Source: Amane Advisors, data as of 2016. Key investment highlights
Appendix
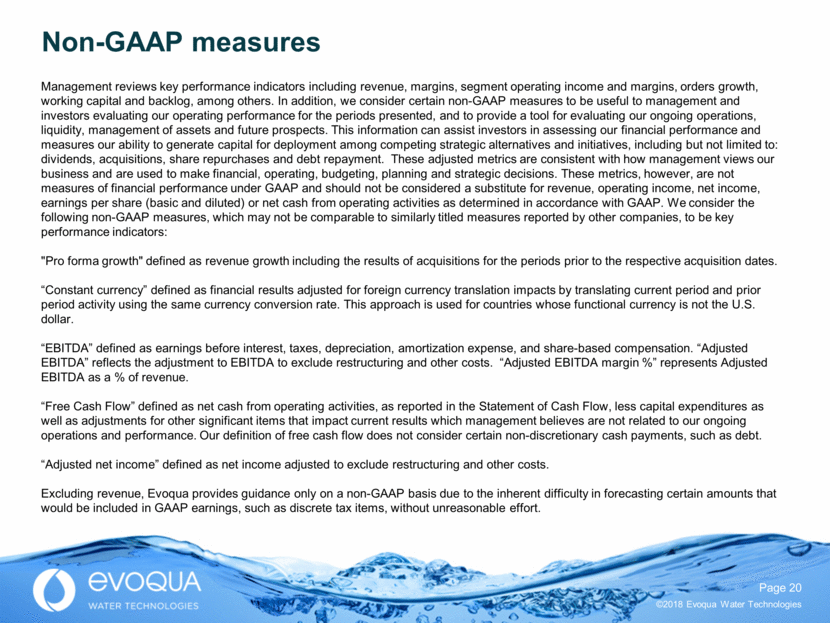
Management reviews key performance indicators including revenue, margins, segment operating income and margins, orders growth, working capital and backlog, among others. In addition, we consider certain non-GAAP measures to be useful to management and investors evaluating our operating performance for the periods presented, and to provide a tool for evaluating our ongoing operations, liquidity, management of assets and future prospects. This information can assist investors in assessing our financial performance and measures our ability to generate capital for deployment among competing strategic alternatives and initiatives, including but not limited to: dividends, acquisitions, share repurchases and debt repayment. These adjusted metrics are consistent with how management views our business and are used to make financial, operating, budgeting, planning and strategic decisions. These metrics, however, are not measures of financial performance under GAAP and should not be considered a substitute for revenue, operating income, net income, earnings per share (basic and diluted) or net cash from operating activities as determined in accordance with GAAP. We consider the following non-GAAP measures, which may not be comparable to similarly titled measures reported by other companies, to be key performance indicators: "Pro forma growth" defined as revenue growth including the results of acquisitions for the periods prior to the respective acquisition dates. “Constant currency” defined as financial results adjusted for foreign currency translation impacts by translating current period and prior period activity using the same currency conversion rate. This approach is used for countries whose functional currency is not the U.S. dollar. “EBITDA” defined as earnings before interest, taxes, depreciation, amortization expense, and share-based compensation. “Adjusted EBITDA” reflects the adjustment to EBITDA to exclude restructuring and other costs. “Adjusted EBITDA margin %” represents Adjusted EBITDA as a % of revenue. “Free Cash Flow” defined as net cash from operating activities, as reported in the Statement of Cash Flow, less capital expenditures as well as adjustments for other significant items that impact current results which management believes are not related to our ongoing operations and performance. Our definition of free cash flow does not consider certain non-discretionary cash payments, such as debt. “Adjusted net income” defined as net income adjusted to exclude restructuring and other costs. Excluding revenue, Evoqua provides guidance only on a non-GAAP basis due to the inherent difficulty in forecasting certain amounts that would be included in GAAP earnings, such as discrete tax items, without unreasonable effort. Non-GAAP measures
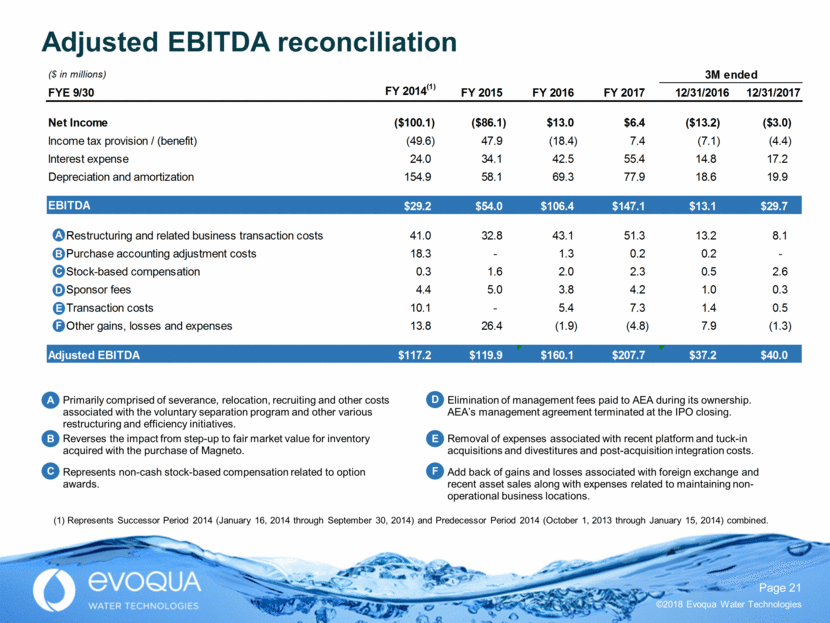
Adjusted EBITDA reconciliation A B C D E F A B C D E F Primarily comprised of severance, relocation, recruiting and other costs associated with the voluntary separation program and other various restructuring and efficiency initiatives. Reverses the impact from step-up to fair market value for inventory acquired with the purchase of Magneto. Represents non-cash stock-based compensation related to option awards. Elimination of management fees paid to AEA during its ownership. AEA’s management agreement terminated at the IPO closing. Removal of expenses associated with recent platform and tuck-in acquisitions and divestitures and post-acquisition integration costs. Add back of gains and losses associated with foreign exchange and recent asset sales along with expenses related to maintaining non-operational business locations. (1) Represents Successor Period 2014 (January 16, 2014 through September 30, 2014) and Predecessor Period 2014 (October 1, 2013 through January 15, 2014) combined. ($ in millions) FYE 9/30 FY 2014 (1) FY 2015 FY 2016 FY 2017 12/31/2016 12/31/2017 Net Income ($100.1) ($86.1) $13.0 $6.4 ($13.2) ($3.0) Income tax provision / (benefit) (49.6) 47.9 (18.4) 7.4 (7.1) (4.4) Interest expense 24.0 34.1 42.5 55.4 14.8 17.2 Depreciation and amortization 154.9 58.1 69.3 77.9 18.6 19.9 EBITDA $29.2 $54.0 $106.4 $147.1 $13.1 $29.7 Restructuring and related business transaction costs 41.0 32.8 43.1 51.3 13.2 8.1 Purchase accounting adjustment costs 18.3 - 1.3 0.2 0.2 - Stock-based compensation 0.3 1.6 2.0 2.3 0.5 2.6 Sponsor fees 4.4 5.0 3.8 4.2 1.0 0.3 Transaction costs 10.1 - 5.4 7.3 1.4 0.5 Other gains, losses and expenses 13.8 26.4 (1.9) (4.8) 7.9 (1.3) Adjusted EBITDA $117.2 $119.9 $160.1 $207.7 $37.2 $40.0 3M ended
Rodney Aulick Industrial Segment
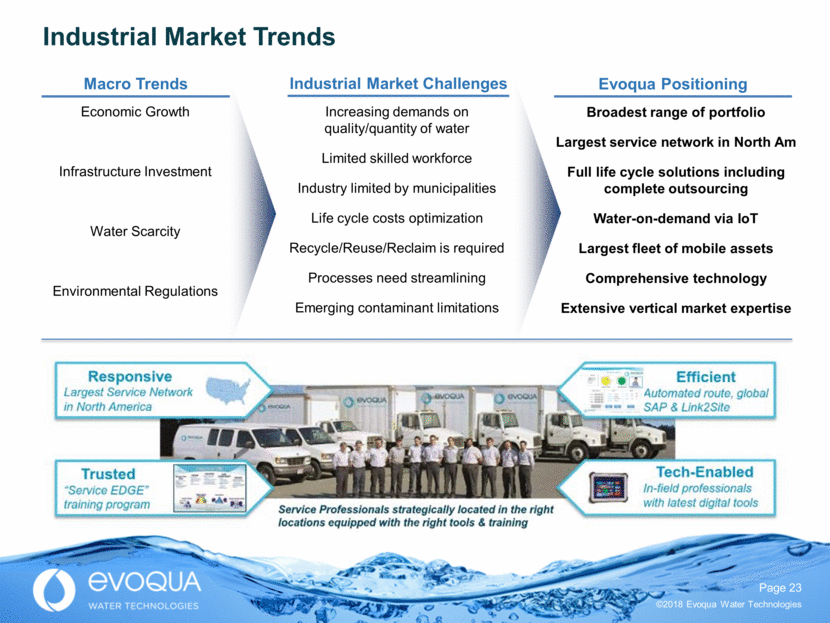
Industrial Market Trends Economic Growth Infrastructure Investment Water Scarcity Environmental Regulations Increasing demands on quality/quantity of water Limited skilled workforce Industry limited by municipalities Life cycle costs optimization Recycle/Reuse/Reclaim is required Processes need streamlining Emerging contaminant limitations Macro Trends Industrial Market Challenges Broadest range of portfolio Largest service network in North Am Full life cycle solutions including complete outsourcing Water-on-demand via IoT Largest fleet of mobile assets Comprehensive technology Extensive vertical market expertise Evoqua Positioning
Winning Customers with Water One® Assurance Services Win Back Hospital Deionized Water Account in Southeast Lost account two years ago to a competitor Rebid in January 2018 Customer wanted better control over unanticipated and high service event costs Offered Water One® Assurance Services Full-capacity DI tank configuration enables them to use their system at full capacity Simple, yet innovative, new offer that gave us a clear advantage over all competitors Customer Signed Price Per Gallon Water One® Assurance Contract Annualized price was higher than current billing Consistent monthly billing based upon water usage Provides relevant information on water demand against hospital activity Challenge Solution Result Water One® Assurance Installation Customer - General Medical Center
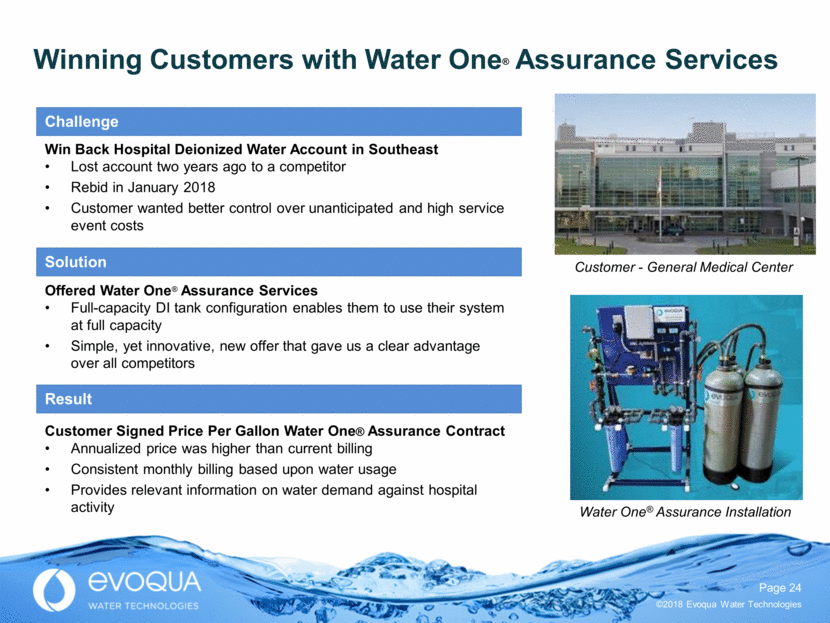
Winning Customers via Broadest Portfolio & Mobile Backup Evoqua Memcor® at Power Plant “One Evoqua”: Selling Municipal technology into Industrial Market Product: Memcor® Ultrafiltration System for process water treatment Site: Virginia Customer need: Increasing limits on use of Municipal feedwater due to industrial growth, namely data centers Why Evoqua was selected: Long-term service customer Complete solution offering Security of supply via mobile asset fleet for backup
Malcolm Kinnaird Municipal Segment
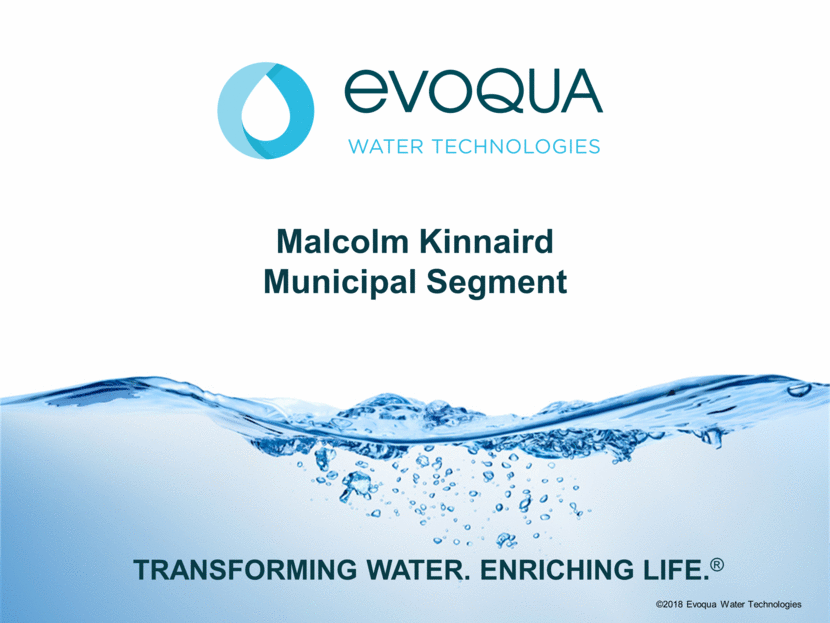
Municipal Market Trends Population Growth Decaying Infrastructure / Investment Water Scarcity Stringent Environmental Standards Capacity Constraints Aging Workforce Consistently meeting standards Need to recycle, reuse and reclaim High energy costs Low-cost bid model Aging workforce Long book to bill cycles in capital Macro Trends Municipal Market Challenges 100+ years of experience 8000+ US installations Technology that works Broadest WWT portfolio Innovative technologies to solve complex regulatory problems Ability to combine technologies Evoqua Positioning Real time web monitoring & dosing Alarm notifications Customized customer applications Used in corrosion control systems Link2Site® IoT Systems
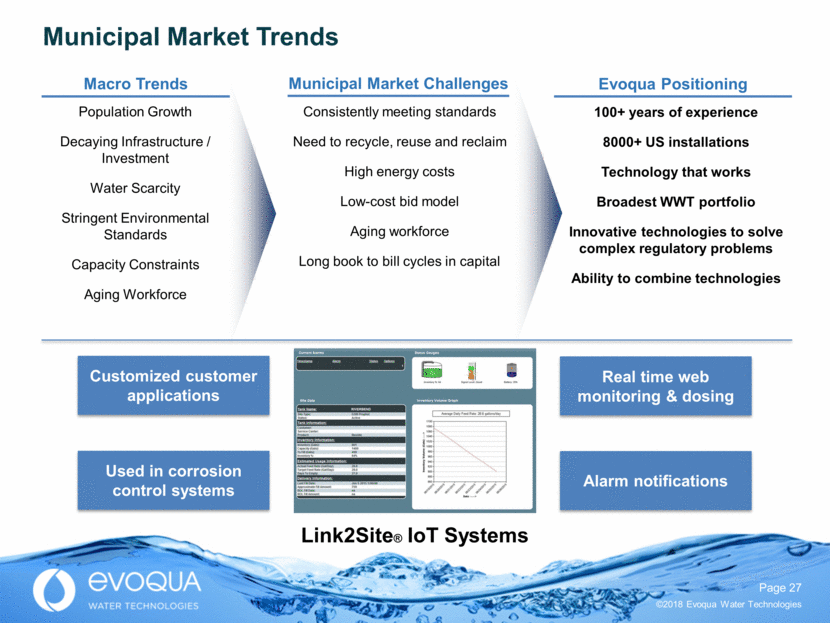
Aerial view of Changi WRP Multi-Product, Multi-Decade Customer Strong relationships, broad portfolio and past reference & performance are keys to winning Singapore Changi Water Reclamation Plant Built on 80 acres of reclaimed land 176 MGD and expanding to 220 MGD Part of the PUB’s NEWater system that fulfills 30% of Singaporean water demand Evoqua at Changi 25+ years relationship Continuous engagement to service A/M, build relationships & drive capital specifications Maximize Evoqua share of wallet Recent Wins and Opportunities MBR 4710 B40N modules with MemPulse First Memcor win with PUB in 10+ years Culmination of 2+ year approval process Awarded in May 2017 Odor Control Biological & activated carbon systems Strong prior references in Singapore Strong local rep relationship Awarded in Nov. 2017 Chain & Scrappers Skimmers with pivotal flights for scum removal Awarded in Nov. 2017 Additional opportunities exist in 2018
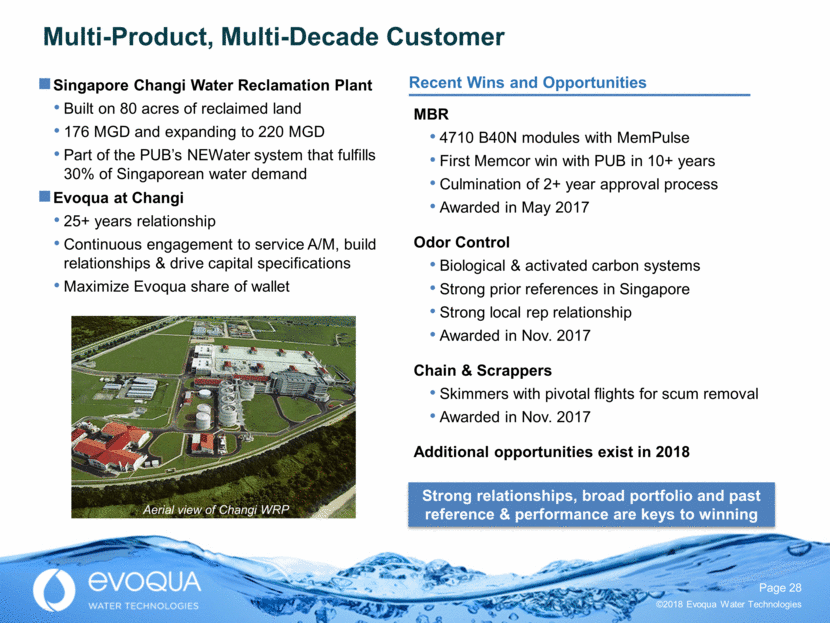
Membrane Tanks Memcor® UF Cell Background Achievements Memcor® Supports Guinness World Record In 1997, Orange County Water District (OCWD) proposed the construction of a Groundwater Replenishment System (GWRS) to reclaim secondary treated wastewater Treatment included Evoqua’s Memcor® CS system 20+ years of relationship The OCWD received the Lee Kuan Yew Water Prize in 2014 during Singapore International Water Week for its pioneering work In 2014, GWRS added 44 MGD of capacity, an important step in helping OCWD achieve the world record this year The record now stands at 100,008,000 gallons – a Guinness World Record, achieved Feb. 15, 2018
Ken Rodi Products Segment
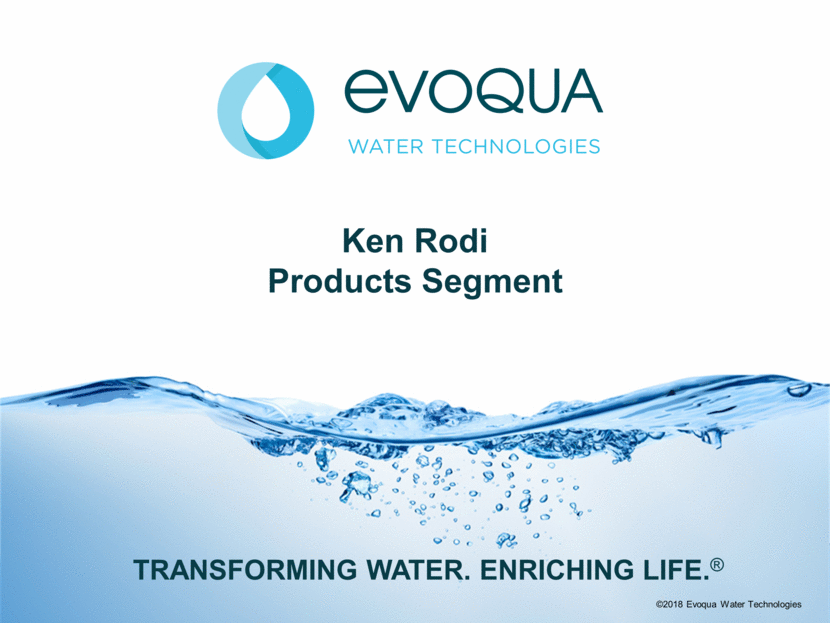
Market Trends Water Scarcity Urbanization Emerging Contaminants Environmental Regulations Increasing demands on quality / quantity of water Push to recycle / reuse High cost of land and limited space Invasive species more prevalent due to globalization Microbes becoming more tolerant to traditional chemicals Macro Trends Market Challenges Broadest advanced disinfection offering Linked technologies provide competitive advantage Largest install base in industry Thought leadership and process expertise Extensive aftermarket support and service network Evoqua Positioning
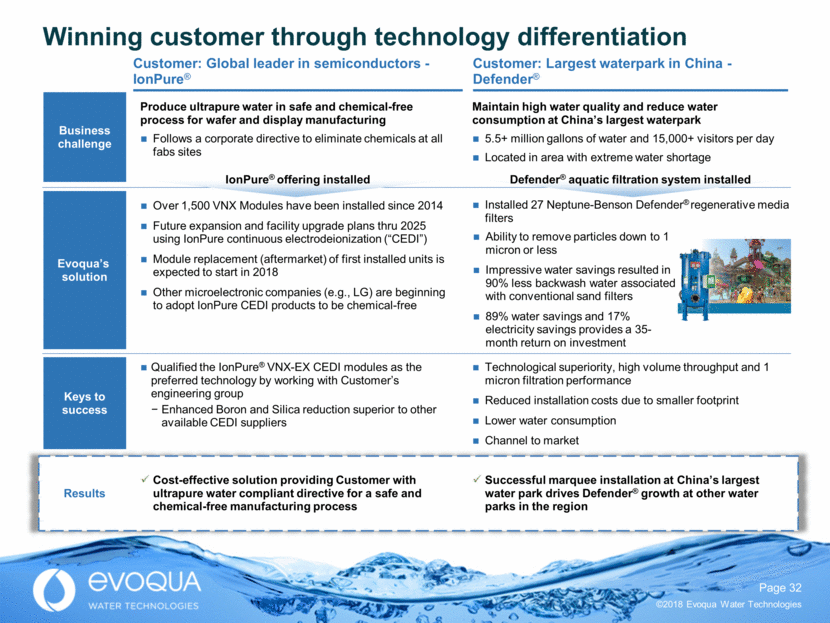
Winning customer through technology differentiation Successful marquee installation at China’s largest water park drives Defender® growth at other water parks in the region Business challenge Evoqua’s solution Keys to success Produce ultrapure water in safe and chemical-free process for wafer and display manufacturing Follows a corporate directive to eliminate chemicals at all fabs sites Qualified the IonPure® VNX-EX CEDI modules as the preferred technology by working with Customer’s engineering group Enhanced Boron and Silica reduction superior to other available CEDI suppliers Cost-effective solution providing Customer with ultrapure water compliant directive for a safe and chemical-free manufacturing process IonPure® offering installed Over 1,500 VNX Modules have been installed since 2014 Future expansion and facility upgrade plans thru 2025 using IonPure continuous electrodeionization (“CEDI”) Module replacement (aftermarket) of first installed units is expected to start in 2018 Other microelectronic companies (e.g., LG) are beginning to adopt IonPure CEDI products to be chemical-free Maintain high water quality and reduce water consumption at China’s largest waterpark 5.5+ million gallons of water and 15,000+ visitors per day Located in area with extreme water shortage Technological superiority, high volume throughput and 1 micron filtration performance Reduced installation costs due to smaller footprint Lower water consumption Channel to market Installed 27 Neptune-Benson Defender® regenerative media filters Ability to remove particles down to 1 micron or less Impressive water savings resulted in 90% less backwash water associated with conventional sand filters 89% water savings and 17% electricity savings provides a 35-month return on investment Results Defender® aquatic filtration system installed Customer: Global leader in semiconductors - IonPure® Customer: Largest waterpark in China - Defender®
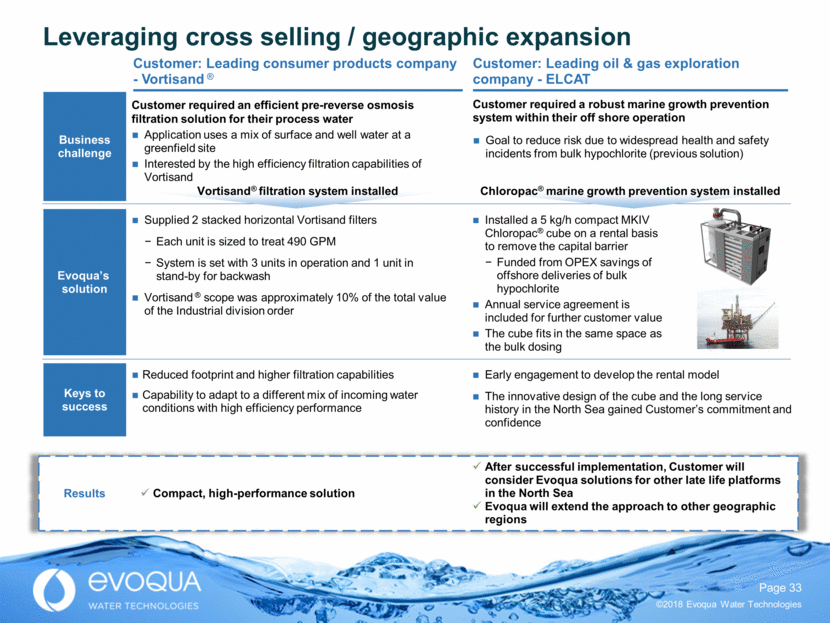
Results Leveraging cross selling / geographic expansion Customer required an efficient pre-reverse osmosis filtration solution for their process water Application uses a mix of surface and well water at a greenfield site Interested by the high efficiency filtration capabilities of Vortisand Reduced footprint and higher filtration capabilities Capability to adapt to a different mix of incoming water conditions with high efficiency performance Supplied 2 stacked horizontal Vortisand filters Each unit is sized to treat 490 GPM System is set with 3 units in operation and 1 unit in stand-by for backwash Vortisand ® scope was approximately 10% of the total value of the Industrial division order Vortisand® filtration system installed Customer required a robust marine growth prevention system within their off shore operation Goal to reduce risk due to widespread health and safety incidents from bulk hypochlorite (previous solution) Early engagement to develop the rental model The innovative design of the cube and the long service history in the North Sea gained Customer’s commitment and confidence After successful implementation, Customer will consider Evoqua solutions for other late life platforms in the North Sea Evoqua will extend the approach to other geographic regions Installed a 5 kg/h compact MKIV Chloropac® cube on a rental basis to remove the capital barrier Funded from OPEX savings of offshore deliveries of bulk hypochlorite Annual service agreement is included for further customer value The cube fits in the same space as the bulk dosing Chloropac® marine growth prevention system installed Compact, high-performance solution Business challenge Evoqua’s solution Keys to success Customer: Leading consumer products company - Vortisand ® Customer: Leading oil & gas exploration company - ELCAT
Snehal Desai Chief Growth Officer
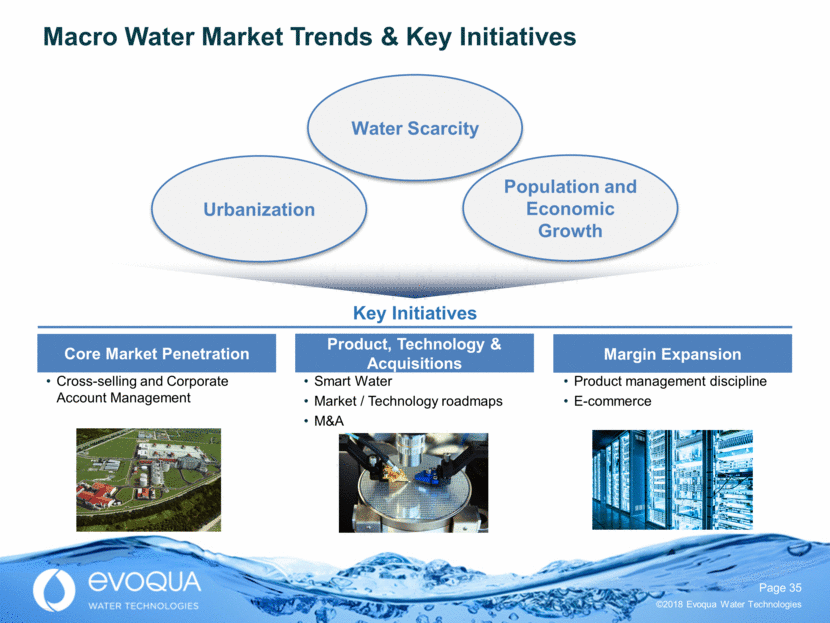
Macro Water Market Trends & Key Initiatives Core Market Penetration Margin Expansion Product, Technology & Acquisitions Key Initiatives Cross-selling and Corporate Account Management Smart Water Market / Technology roadmaps M&A Product management discipline E-commerce Water Scarcity Population and Economic Growth Urbanization
Proven ability to drive value creation through tuck-in acquisitions Acquire access to new geographies, new verticals and / or new technologies - Complements internal RD&E efforts - Lower execution risk given ability to field test technologies and asses viability through customer use-cases April 2016 Anodes for the electrochemical industry Refurbishment of electrochlorination cells for seawater electrolysis July 2016 Leading screen filtration technologies August 2016 N.A. manufacturer and marketer of UV technology May 2017 Leader in TX high purity water systems and service Significant industry consolidation opportunity supports attractive growth outlook April 2016 Accelerated growth in commercial aquatics Revenue and cost synergies from highly complementary product offering November 2016 Engineered solutions for industrial wastewater market Role of M&A Dedicated M&A platform Proven results Professional and proven acquisition team Long runway for growth given current market share - Numerous regional “mom and pops” Robust pipeline including transformational and tuck-in opportunities Proven ability to execute and “buy down” multiple paid via significant synergy realization - Opportunities and immediate focus upon both sales channel leverage and EBITDA improvement - Utilize documented, tested integration process to ensure replicable results Acquisitions immediately accretive due to consolidation of back-office, reduced RD&E time to market and leveraging of market channels Strong execution achieved starting in 2016 after M&A infrastructure put in place Robust inorganic growth opportunities January 2018 Geographic market expansion with high-purity water equipment and systems & service deionization June 2017 Designer and producer of filters and irrigation components for the agriculture and industrial markets June 2017 Biological treatment and waste-to-energy solutions: significant expansion of industrial wastewater offering
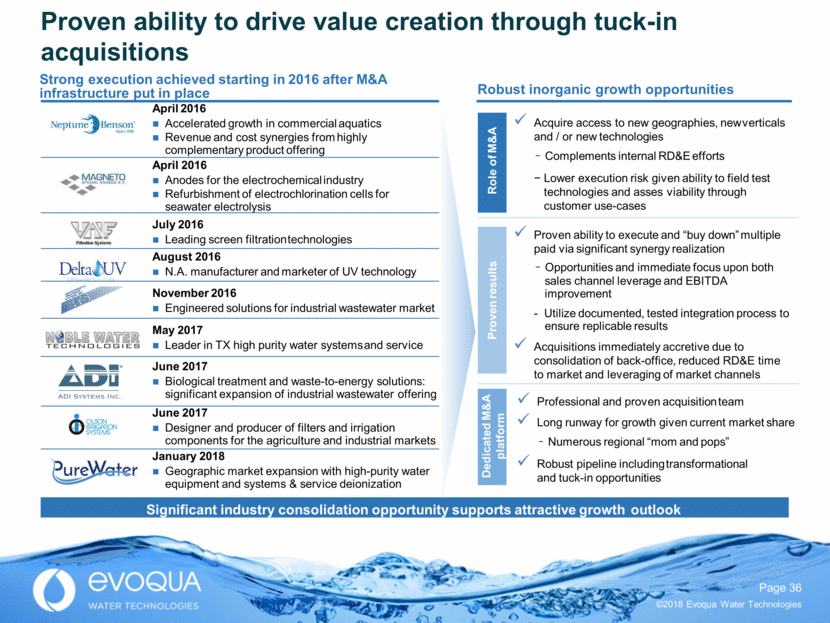
Water One® Assurance - Outsourcing Transitioning from single product offering to life cycle service partnership Responsive to problems Proactively prevent problems Historical model Water One® model Reactive service schedules Preplanned service schedules Inefficient routing Efficient utilization of service resources Per-event revenue model Per gallon revenue model Water One® opportunity Water One® Reverse Osmosis Water One® Assurance (Deionization) Water One® is a highly attractive smart water opportunity that is currently our fastest growing service offering Increased revenue impact: Share of wallet expansion Market share gain – competitive differentiator Data analytics drive effective sales planning Increased profitability impact: Improved service route efficiencies Extended product life and reduced service calls Predictive monitoring of water quality
David Szweda Vice President, Service Operations
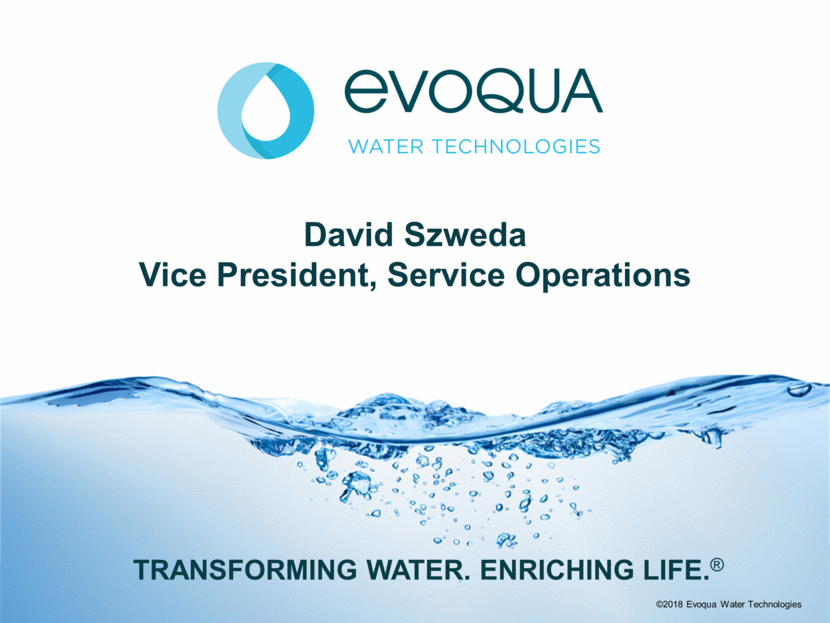
March 2018 – Roll out Microsoft Field Service to our Service Techs Optimize service workflows and provide enhanced capabilities Automated dispatching of technicians Prepare for automated work order creation from our connected platform Enhance our value proposition, drive customer intimacy and increase margins through a combination of connected technologies, digital solutions and data science June 2017 – Rolled out Windows10 Tablets to our Service Techs Access to the same software as the rest of the company Quote customers on new parts and services while onsite Provide hardware for new field service cloud applications and sensors Transform service offerings into Water as a Service (WaaS) Key focus will be Industrial Increase efficiency in Build-Own- Operates and Operating Contracts Connected Technologies Digital Solutions Data Science Launch new IoT Cloud Platform on Microsoft Azure in April 2018 Implement enhanced eCommerce solution GPS mobile asset tracking integrated with IoT and Field Service Deliver new insights from connected data sources through disciplined data science Enhanced automation through better data science and artificial intelligence Solutions better connected to data Digital Business
Phase 1 – Birmingham Business Case Phase 2 – Boston Pilot Phase 3 – North America Rollout Plan 46 customers converted to Water One® Assurance (highest volume customers) Call-ins reduced from 50% to 12% of total service orders (improved route efficiencies) Shift in work from reactive to proactive wallet share expansion (Water as a Service) New standardized units (wall or floor mount) & pricing model Service installation efficiency & quality 173 existing SDI customers to be converted in FY18 to Water One® Assurance Command Center opened in Pittsburgh – February 2018 Targeted attack plan – Q2 FY18: Competition – Customer Value – Efficiencies Generation 2 panel to add predictive monitoring water quality and system performance Water One® Assurance (Deionization)
