Attached files
| file | filename |
|---|---|
| EX-32.2 - EX-32.2 - CrossAmerica Partners LP | capl-ex322_6.htm |
| EX-32.1 - EX-32.1 - CrossAmerica Partners LP | capl-ex321_7.htm |
| EX-31.2 - EX-31.2 - CrossAmerica Partners LP | capl-ex312_8.htm |
| EX-31.1 - EX-31.1 - CrossAmerica Partners LP | capl-ex311_9.htm |
| EX-23.1 - EX-23.1 - CrossAmerica Partners LP | capl-ex231_10.htm |
| EX-21.1 - EX-21.1 - CrossAmerica Partners LP | capl-ex211_11.htm |
FORM 10-K
UNITED STATES SECURITIES AND EXCHANGE COMMISSION
Washington, D.C. 20549
(Mark One)
|
|
☒ |
ANNUAL REPORT PURSUANT TO SECTION 13 OR 15(d) OF THE SECURITIES EXCHANGE ACT OF 1934 |
For the fiscal year ended December 31, 2017
OR
|
|
☐ |
TRANSITION REPORT PURSUANT TO SECTION 13 OR 15(d) OF THE SECURITIES EXCHANGE ACT OF 1934 |
For the transition period from to
Commission File No. 001-35711

CROSSAMERICA PARTNERS LP
(Exact name of registrant as specified in its charter)
|
Delaware |
|
45-4165414 |
|
(State or Other Jurisdiction of Incorporation or Organization) |
|
(I.R.S. Employer Identification No.) |
|
|
|
|
|
515 Hamilton Street, Suite 200 Allentown, PA |
|
18101 (Zip Code) (610) 625-8000 |
|
(Address of Principal Executive Offices) |
|
(Registrant’s telephone number, including area code) |
Securities registered pursuant to Section 12(b) of the Act: Common units representing limited partner interests, $0.01 par value per share listed on the New York Stock Exchange.
Securities registered pursuant to Section 12(g) of the Act: None.
Indicate by check mark if the registrant is a well-known seasoned issuer, as defined in Rule 405 of the Securities Act. Yes ☐ No ☒
Indicate by check mark if the registrant is not required to file reports pursuant to Section 13 or Section 15(d) of the Act. Yes ☐ No ☒
Indicate by check mark whether the registrant (1) has filed all reports required to be filed by Section 13 or 15(d) of the Securities Exchange Act of 1934 during the preceding 12 months (or for such shorter period that the registrant was required to file such reports), and (2) has been subject to such filing requirements for the past 90 days. Yes ☒ No ☐
Indicate by check mark whether the registrant has submitted electronically and posted on its corporate Web site, if any, every Interactive Data File required to be submitted and posted pursuant to Rule 405 of Regulation S-T (§232.405 of this chapter) during the preceding 12 months (or for such shorter period that the registrant was required to submit and post such files). Yes ☒ No ☐
Indicate by check mark if disclosure of delinquent filers pursuant to Item 405 of Regulation S-K (§229.405 of this chapter) is not contained herein, and will not be contained, to the best of registrant’s knowledge, in definitive proxy or information statements incorporated by reference in Part III of this Form 10-K or any amendment to this Form 10-K. ☐
Indicate by check mark whether the registrant is a large accelerated filer, an accelerated filer, a non-accelerated filer, or a smaller reporting company. See the definitions of “large accelerated filer,” “accelerated filer,” and “smaller reporting company” in Rule 12b-2 of the Exchange Act. Large accelerated filer ☐ Accelerated filer ☒ Non-accelerated filer ☐ Smaller reporting company ☐
Indicate by check mark whether the registrant is a shell company (as defined in Rule 12b-2 of the Exchange Act). Yes ☐ No ☒
The aggregate market value of the voting and non-voting common stock held by non-affiliates was approximately $479.4 million based on the last sales price quoted as of June 30, 2017 on the New York Stock Exchange, the last business day of the registrant’s most recently completed second fiscal quarter.
As of February 21, 2018, the registrant had outstanding 34,111,461 common units.
Documents Incorporated by Reference: None.
The following is a list of certain acronyms and terms generally used in the industry and throughout this document:
|
CrossAmerica Partners LP and subsidiaries: |
|||
|
|
|
|
|
|
CrossAmerica Partner LP |
CrossAmerica, the Partnership, we, us, our |
||
|
|
|
|
|
|
LGP Operations LLC |
a wholly owned subsidiary of the Partnership |
||
|
|
|
|
|
|
LGW |
Lehigh Gas Wholesale LLC |
||
|
|
|
|
|
|
LGPR |
LGP Realty Holdings LP |
||
|
|
|
|
|
|
LGWS |
Lehigh Gas Wholesale Services, Inc. and subsidiaries |
||
|
|
|
||
|
CrossAmerica Partners LP related and affiliated parties: |
|||
|
|
|
|
|
|
Circle K |
Circle K Stores Inc., a Texas corporation, and a wholly owned subsidiary of Couche-Tard |
||
|
|
|
|
|
|
Couche-Tard |
Alimentation Couche-Tard Inc. (TSX: ATD.A ATD.B) |
||
|
Couche-Tard Board |
the Board of Directors of Couche-Tard |
||
|
|
|
|
|
|
CST |
CST Brands, LLC and subsidiaries, indirectly owned by Circle K |
||
|
|
|
|
|
|
DMI |
Dunne Manning Inc., an entity affiliated with Joseph V. Topper, Jr., a member of the Board, and a related party and large holder of our common units. |
||
|
|
|
|
|
|
DMR |
Dunne Manning Realty LP, an entity affiliated with Joseph V. Topper, Jr., a member of the Board and a related party. |
||
|
|
|
|
|
|
DMS |
Dunne Manning Stores LLC (formerly known as Lehigh Gas-Ohio, LLC), an entity associated with the family of Joseph V. Topper, Jr., a member of the Board and a related party. DMS is an operator of retail motor fuel stations. DMS leases retail sites from us in accordance with a master lease agreement with us and DMS purchases substantially all of its motor fuel for these sites from us on a wholesale basis under rack plus pricing. The financial results of DMS are not consolidated with ours. |
||
|
|
|
|
|
|
General Partner |
CrossAmerica GP LLC, the General Partner of CrossAmerica, a Delaware limited liability company. |
||
|
|
|
|
|
|
CST Fuel Supply |
CST Fuel Supply LP is the parent of CST Marketing and Supply. As of December 31, 2017, our total limited partner interest in CST Fuel Supply was 17.5%. |
||
|
|
|
|
|
|
CST Marketing and Supply |
CST Marketing and Supply, LLC, CST’s wholesale motor fuel supply business, which provides wholesale fuel distribution to the majority of CST’s U.S. retail convenience stores on a fixed markup per gallon. |
||
|
|
|
|
|
|
CST Services |
CST Services, LLC, a wholly owned subsidiary of Circle K |
||
|
|
|
|
|
|
Topper Group |
Joseph V. Topper, Jr., collectively with those of his affiliates and family trusts that have ownership interests in our Predecessor Entities, including DMI |
||
|
|
|
|
|
|
Topstar |
Topstar Enterprises, an entity affiliated with Joseph V. Topper, Jr. Topstar is an operator of convenience stores that leases retail sites from us, but does not purchase fuel from us. |
||
|
|
|
||
|
Recent Acquisitions: |
|||
|
|
|
|
|
|
PMI |
Petroleum Marketers, Inc., acquired in April 2014 |
||
|
|
|
|
|
|
Nice N Easy Assets |
The assets acquired from Nice N Easy Grocery Shoppes in November 2014 |
||
|
|
|
|
|
|
Landmark Assets |
The assets acquired from Landmark Industries in January 2015 |
||
1
|
|
|
|
|
|
Erickson |
Erickson Oil Products, Inc., acquired in February 2015 |
||
|
|
|
|
|
|
One Stop |
M&J Operations, LLC, acquired in July 2015 |
||
|
|
|
|
|
|
Franchised Holiday Stores |
The franchised Holiday stores acquired in March 2016 |
||
|
|
|
|
|
|
State Oil Assets |
The assets acquired from State Oil Company in September 2016 |
||
|
|
|
|
|
|
Jet-Pep Assets |
The assets acquired from Jet-Pep, Inc. in November 2017 |
||
|
|
|
||
|
Other Defined Terms: |
|
||
|
|
|
|
|
|
Amended Omnibus Agreement |
The Amended and Restated Omnibus Agreement, dated October 1, 2014, as amended on February 17, 2016 by and among CrossAmerica, the General Partner, DMI, DMS, CST Services and Joseph V. Topper, Jr., which amends and restates the original omnibus agreement that was executed in connection with CrossAmerica’s initial public offering on October 30, 2012. The terms of the Amended Omnibus Agreement were approved by the conflicts committee of the Board. Pursuant to the Amended Omnibus Agreement, CST Services agrees, among other things, to provide, or cause to be provided, to the Partnership certain management services. |
||
|
|
|
|
|
|
ASC |
Accounting Standards Codification |
||
|
|
|
|
|
|
ASU |
Accounting Standards Update |
||
|
|
|
|
|
|
Board |
Board of Directors of our General Partner |
||
|
|
|
|
|
|
BP |
BP p.l.c. |
||
|
|
|
|
|
|
Branded Motor Fuels |
Motor fuels that are purchased from major integrated oil companies and refiners under supply agreements. We take legal title to the motor fuel when we receive it at the rack and generally arrange for a third-party transportation provider to take delivery of the motor fuel at the rack and deliver it to the appropriate sites in our network. |
||
|
|
|
|
|
|
DTW |
Dealer tank wagon contracts, which are variable cent per gallon priced wholesale motor fuel distribution or supply contracts; DTW also refers to the pricing methodology under such contracts |
||
|
|
|
|
|
|
EBITDA |
Earnings before interest, taxes, depreciation, amortization and accretion, a non-GAAP financial measure |
||
|
|
|
|
|
|
EICP |
The Partnership’s Lehigh Gas Partners LP Executive Income Continuity Plan, as amended |
||
|
|
|
|
|
|
Exchange Act |
Securities Exchange Act of 1934, as amended |
||
|
|
|
|
|
|
ExxonMobil |
ExxonMobil Corporation |
||
|
|
|
|
|
|
FASB |
Financial Accounting Standards Board |
||
|
|
|
|
|
|
Form 10-K |
CrossAmerica’s Annual Report on Form 10-K for the year ended December 31, 2017 |
||
|
|
|
||
|
FTC |
U.S. Federal Trade Commission |
||
|
|
|
|
|
|
Getty Lease |
In May 2012, the Predecessor Entity, which represents the portion of the business of Dunne Manning Inc. and its subsidiaries and affiliates contributed to the Partnership in connection with the IPO, entered into a 15-year master lease agreement with renewal options of up to an additional 20 years with Getty Realty Corporation. The Partnership pays fixed rent, which increases 1.5% per year. In addition, the lease requires contingent rent payments based on gallons of motor fuel sold. The Partnership leases sites under the lease in Delaware, Maine, Maryland, Massachusetts, New Hampshire, New Jersey, Pennsylvania and Rhode Island. |
||
|
|
|
|
|
|
GP Purchase |
CST’s purchase from DMI (formerly known as Lehigh Gas Corporation) of 100% of the membership interests in the sole member of the General Partner |
||
|
|
|
|
|
2
|
Incentive Distribution Rights represent the right to receive an increasing percentage of quarterly distributions after the target distribution levels have been achieved, as defined in our Partnership Agreement. Circle K is the indirect owner of 100% of the outstanding IDRs of CrossAmerica. |
|||
|
|
|
|
|
|
IDR Purchase |
CST’s purchase of all of the membership interests in limited liability companies formed by the 2004 Irrevocable Agreement of Trust of Joseph V. Topper, Sr. and the 2008 Irrevocable Agreement of Trust of John B. Reilly, Jr., which owned all of the IDRs in CrossAmerica (formerly known as Lehigh Gas Partners LP). |
||
|
|
|
|
|
|
Internal Revenue Code |
Internal Revenue Code of 1986, as amended |
||
|
|
|
|
|
|
IPO |
Initial public offering of CrossAmerica Partners LP on October 30, 2012 |
||
|
|
|
|
|
|
IRS |
Internal Revenue Service |
||
|
|
|
|
|
|
LIBOR |
London Interbank Offered Rate |
||
|
|
|
|
|
|
Merger |
The merger of Ultra Acquisition Corp. with CST, with CST surviving the merger as a wholly owned subsidiary of Circle K, which closed on June 28, 2017. See Merger Agreement below |
||
|
|
|
|
|
|
Merger Agreement |
CST’s Agreement and Plan of Merger (the “Merger Agreement”) entered into on August 21, 2016 with Circle K and Ultra Acquisition Corp., a Delaware corporation and an indirect, wholly owned subsidiary of Circle K (“Merger Sub”). Under and subject to the terms and conditions of the Merger Agreement, on June 28, 2017, Merger Sub was merged with and into CST, with CST surviving the Merger as a wholly owned subsidiary of Circle K. |
||
|
|
|
|
|
|
Merger Sub |
Ultra Acquisition Corp., a Delaware corporation and an indirect, wholly owned subsidiary of Circle K |
||
|
|
|
|
|
|
MD&A |
Management’s Discussion and Analysis of Financial Condition and Results of Operations |
||
|
|
|
|
|
|
Motiva |
Motiva Enterprises, LLC |
||
|
|
|
|
|
|
NTI |
CST’s new to industry stores opened after January 1, 2008, which is generally when CST began designing and operating its larger format stores that accommodate broader merchandise categories and food offerings and have more fuel dispensers than its legacy stores |
||
|
|
|
|
|
|
NYSE |
New York Stock Exchange |
||
|
|
|
|
|
|
Partnership Agreement |
The First Amended and Restated Agreement of Limited Partnership of CrossAmerica Partners LP, dated as of October 1, 2014, as amended |
||
|
|
|
|
|
|
Plan |
In connection with the IPO, the General Partner adopted the Lehigh Gas Partners LP 2012 Incentive Award Plan, a long-term incentive plan for employees, officers, consultants and directors of the General Partner and any of its affiliates who perform services for the Partnership |
||
|
|
|
|
|
|
Predecessor Entities |
Wholesale distribution business of DMS and real property and leasehold interests contributed in connection with the IPO |
||
|
|
|
|
|
|
QSR |
Quick service restaurant |
||
|
|
|
|
|
|
Retail site |
A general term to refer to convenience stores, including those operated by commission agents, independent dealers, Circle K, DMS or lessee dealers, as well as company operated sites |
||
|
|
|
|
|
|
RIN |
Renewable identification number, an identifier used by governmental agencies to track a specific batch of renewable fuel |
||
|
|
|
|
|
|
SEC |
U.S. Securities and Exchange Commission |
||
|
|
|
|
|
|
Tax Cuts and Jobs Act |
On December 22, 2017, the U.S. government enacted tax legislation formally known as Public Law No. 115-97, commonly referred to as the Tax Cuts and Jobs Act |
||
|
|
|
|
|
|
Terms Discounts |
Discounts for prompt payment and other rebates and incentives from our suppliers for a majority of the gallons of motor fuel purchased by us, which are recorded within cost of sales. Prompt payment discounts are based on a percentage of the purchase price of motor fuel. |
||
|
|
|
|
|
3
|
U.S. Generally Accepted Accounting Principles |
|||
|
|
|
|
|
|
UST |
Underground storage tanks |
||
|
|
|
|
|
|
Valero |
Valero Energy Corporation and, where appropriate in context, one or more of its subsidiaries, or all of them taken as a whole |
||
|
|
|
|
|
|
WTI |
West Texas Intermediate crude oil |
||
4
CAUTIONARY STATEMENT REGARDING FORWARD-LOOKING STATEMENTS
This Form 10-K includes forward-looking statements, including in the section entitled “Management’s Discussion and Analysis of Financial Condition and Results of Operations.” Forward-looking statements include the information concerning our possible or assumed future results of operations, business strategies, financing plans, competitive position, credit ratings, distribution growth, potential growth opportunities, potential operating performance improvements, potential improvements in return on capital employed, the effects of competition and the effects of future legislation or regulations. You can identify our forward-looking statements by the words “anticipate,” “estimate,” “believe,” “continue,” “could,” “intend,” “may,” “plan,” “potential,” “predict,” “seek,” “should,” “will,” “would,” “expect,” “objective,” “projection,” “forecast,” “guidance,” “outlook,” “effort,” “target” and similar expressions. Such statements are based on management’s current views and assumptions, and involve risks and uncertainties that could affect expected results. These forward-looking statements include, among other things, statements regarding:
|
|
• |
future retail and wholesale gross profits, including gasoline, diesel and convenience store merchandise gross profits; |
|
|
• |
our anticipated level of capital investments, primarily through acquisitions, and the effect of these capital investments on our results of operations; |
|
|
• |
anticipated trends in the demand for, and volumes sold of, gasoline and diesel in the regions where we operate; |
|
|
• |
volatility in the equity and credit markets limiting access to capital markets; |
|
|
• |
our ability to integrate acquired businesses and to transition retail sites to lessee dealer operated sites; |
|
|
• |
expectations regarding environmental, tax and other regulatory initiatives; and |
|
|
• |
the effect of general economic and other conditions on our business. |
In general, we based the forward-looking statements included in this quarterly report on our current expectations, estimates and projections about our company and the industry in which we operate. We caution you that these statements are not guarantees of future performance as they involve assumptions that, while made in good faith, may prove to be incorrect, and involve risks and uncertainties we cannot predict. In addition, we based many of these forward-looking statements on assumptions about future events that may prove to be inaccurate. Accordingly, our actual outcomes and results may differ materially from what we have expressed or forecasted in the forward-looking statements. Any differences could result from a variety of factors, including the following:
|
|
• |
Couche-Tard’s business strategy and operations and Couche-Tard’s conflicts of interest with us; |
|
|
• |
availability of cash flow to pay the current quarterly distributions on our common units; |
|
|
• |
the availability and cost of competing motor fuels; |
|
|
• |
motor fuel price volatility or a reduction in demand for motor fuels; |
|
|
• |
competition in the industries and geographical areas in which we operate; |
|
|
• |
the consummation of financing, acquisition or disposition transactions and the effect thereof on our business; |
|
|
• |
our existing or future indebtedness; |
|
|
• |
our liquidity, results of operations and financial condition; |
|
|
• |
failure to comply with applicable tax and other regulations or governmental policies; |
|
|
• |
future legislation and changes in regulations, governmental policies, immigration laws and restrictions or changes in enforcement or interpretations thereof; |
|
|
• |
future regulations and actions that could expand the non-exempt status of employees under the Fair Labor Standards Act; |
|
|
• |
future income tax legislation; |
|
|
• |
changes in energy policy; |
|
|
• |
increases in energy conservation efforts; |
|
|
• |
technological advances; |
|
|
• |
the impact of worldwide economic and political conditions; |
5
|
|
• |
weather conditions or catastrophic weather-related damage; |
|
|
• |
earthquakes and other natural disasters; |
|
|
• |
hazards and risks associated with transporting and storing motor fuel; |
|
|
• |
unexpected environmental liabilities; |
|
|
• |
the outcome of pending or future litigation; and |
|
|
• |
our ability to comply with federal and state laws and regulations, including those related to environmental matters, the sale of alcohol, cigarettes and fresh foods, employment, health benefits, including the Affordable Care Act, immigration, and international trade. |
You should consider the areas of risk described above, as well as those set forth in the section entitled “Risk Factors” included in this Form 10-K, in connection with considering any forward-looking statements that may be made by us and our businesses generally. We cannot assure you that projected results or events reflected in the forward-looking statements will be achieved or will occur. The forward-looking statements included in this report are made as of the date of this report. We undertake no obligation to publicly release any revisions to any forward-looking statements, to report events or to report the occurrence of unanticipated events after the date of this report.
6
ITEMS 1., 1A. and 2. BUSINESS, RISK FACTORS AND PROPERTIES
Overview
We are a Delaware limited partnership primarily engaged in the wholesale distribution of motor fuel and the ownership and leasing of real estate used in the retail distribution of motor fuel. We also generate revenues from the operation of retail sites.
On June 28, 2017, a wholly owned subsidiary of Circle K, merged with and into CST, with CST surviving the Merger as an indirect, wholly owned subsidiary of Circle K. Circle K is a wholly owned subsidiary of Couche-Tard.
As a result of the Merger, Circle K indirectly owns all of the membership interests in the sole member of our General Partner, as well as a 21.1% limited partner interest in the Partnership and all of the outstanding IDRs of the Partnership. Circle K, through its indirect ownership interest in the sole member of our General Partner, has the ability to appoint all of the members of the Board and to control and manage the operations and activities of the Partnership.
Our principal executive offices address is 515 Hamilton Street, Suite 200, Allentown, PA 18101, and our telephone number is (610) 625-8000. Our common units trade on the NYSE under the ticker symbol “CAPL.”
The financial statements reflect the consolidated results of the Partnership and its wholly owned subsidiaries. Our primary operations are conducted by the following consolidated wholly owned subsidiaries:
|
|
• |
LGW, which distributes motor fuels on a wholesale basis and generates qualified income under Section 7704(d) of the Internal Revenue Code; |
|
|
• |
LGPR, which functions as the real estate holding company of CrossAmerica and holds assets that generate qualified rental income under Section 7704(d) of the Internal Revenue Code; and |
|
|
• |
LGWS, which owns and leases (or leases and sub-leases) real estate and personal property used in the retail distribution of motor fuels, as well as provides maintenance and other services to its customers. In addition, LGWS distributes motor fuels on a retail basis and sells convenience merchandise items to end customers at company operated retail sites and sells motor fuel on a retail basis at sites operated by commission agents. Income from LGWS generally is not qualifying income under Section 7704(d) of the Internal Revenue Code. |
We conduct our business through two operating segments, Wholesale and Retail. As of December 31, 2017, we distributed motor fuel to over 1,200 sites located in 31 states (Alabama, Arizona, Arkansas, Colorado, Delaware, Florida, Georgia, Illinois, Indiana, Kentucky, Louisiana, Maine, Maryland, Massachusetts, Michigan, Minnesota, New Hampshire, New Jersey, New Mexico, New York, North Carolina, Ohio, Pennsylvania, Rhode Island, South Dakota, Tennessee, Texas, Vermont, Virginia, West Virginia and Wisconsin).
In 2015, we issued our common units as consideration in the purchase of equity interests in CST Fuel Supply and the real property associated with certain of CST’s NTI retail sites. In addition, we also issued, and may continue to issue, common units as payment to Circle K for charges and expenses incurred by us under the Amended Omnibus Agreement. There is no obligation for Circle K to accept common units representing limited partner interests in lieu of cash for amounts due under the Amended Omnibus Agreement. CST also acquired our common units through open market purchases from September 2015 through December 2015. At December 31, 2017, Circle K indirectly owned 21.1% of our limited partner interests.
Available Information
Our internet website is www.crossamericapartners.com. Information on this website is not part of this Form 10-K. Annual reports on our Form 10-K, quarterly reports on our Form 10-Q and our current reports on Form 8-K filed with (or furnished to) the SEC are available on this website free of charge, soon after such material is filed or furnished. In this same location, we also post our corporate governance guidelines, code of ethics and business conduct and the charters of the committees of our Board. These documents are available in print to any unitholder that makes a written request to CrossAmerica Partners L.P. Attn: Corporate Secretary, 515 Hamilton Street, Suite 200, Allentown, Pennsylvania 18101.
Couche-Tard’s internet website is corpo.couche-tard.com/en. Information on this website is not part of this Form 10-K. Annual and quarterly reports are available on this website free of charge. In this same location, Couche-Tard also posts its corporate governance guidelines, code of ethics and conduct and a description of the committees of the Couche-Tard Board. These documents are available in print to any stockholder that makes a written request to Alimentation Couche-Tard, Inc. Attn: Corporate Secretary, 4204 Industrial Boulevard, Laval, Quebec, Canada H7L 0E3.
7
Wholesale Segment
Our primary operation is the wholesale distribution of motor fuel. Our Wholesale segment generated 2017 revenues of $1.9 billion. We are one of the ten largest independent distributors by motor fuel volume in the United States for ExxonMobil, BP and Shell, and we also distribute Chevron, Sunoco, Valero, Gulf, Citgo, Marathon and Phillips 66-branded motor fuels (approximately 86% of the motor fuel we distributed during 2017 was branded). We receive a fixed mark-up per gallon of motor fuel on approximately 85% of gallons sold to our customers. The remaining gallons are primarily DTW priced contracts with our customers. These contracts provide for variable, market based pricing. An increase in DTW gross profit results from the acquisition cost of wholesale motor fuel declining at a faster rate as compared to the rate retail motor fuel prices decline. Conversely, our DTW motor fuel gross profit declines when the cost of wholesale motor fuel increases at a faster rate as compared to the rate retail motor fuel prices increase.
Regarding our supplier relationships, a majority of our total gallons of motor fuel purchased are subject to discounts for prompt payment and other rebates and incentives, which are recorded within cost of sales. Prompt payment discounts are based on a percentage of the purchase price of motor fuel. As such, the dollar value of these discounts increase and decrease corresponding with motor fuel prices. Therefore, in periods of lower wholesale motor fuel prices, our gross profit is negatively affected and, in periods of higher wholesale motor fuel prices, our gross profit is positively affected (as it relates to these discounts). Based on our current volumes, we estimate a $10 per barrel change in the price of crude oil would impact our overall annual wholesale motor fuel gross profit by approximately $2 million related to these payment discounts.
The following table highlights the aggregate volume of motor fuel distributed by our Wholesale segment to each of our principal customer groups by gallons sold for the periods (in millions):
|
|
|
Gallons of Motor Fuel Distributed Year Ended December 31, |
|
|
Wholesale Fuel Distribution Sites End of Year |
|
||||||||||||||||||
|
|
|
2017 |
|
|
2016 |
|
|
2015 |
|
|
2017 |
|
|
2016 |
|
|
2015 |
|
||||||
|
Independent dealers (a) |
|
|
346.2 |
|
|
|
362.3 |
|
|
|
418.1 |
|
|
|
384 |
|
|
|
403 |
|
|
|
370 |
|
|
Lessee dealers |
|
|
309.6 |
|
|
|
268.4 |
|
|
|
169.7 |
|
|
|
438 |
|
|
|
420 |
|
|
|
290 |
|
|
DMS |
|
|
138.4 |
|
|
|
164.6 |
|
|
|
177.6 |
|
|
|
146 |
|
|
|
153 |
|
|
|
191 |
|
|
Circle K |
|
|
78.1 |
|
|
|
78.9 |
|
|
|
77.3 |
|
|
|
43 |
|
|
|
43 |
|
|
|
43 |
|
|
Commission agents |
|
|
86.3 |
|
|
|
75.7 |
|
|
|
75.6 |
|
|
|
181 |
|
|
|
95 |
|
|
|
66 |
|
|
Company operated retail sites |
|
|
73.4 |
|
|
|
84.7 |
|
|
|
133.1 |
|
|
|
70 |
|
|
|
73 |
|
|
|
115 |
|
|
Total |
|
|
1,032.0 |
|
|
|
1,034.6 |
|
|
|
1,051.4 |
|
|
|
1,262 |
|
|
|
1,187 |
|
|
|
1,075 |
|
|
(a) |
Gallons distributed to independent dealers include gallons distributed to subwholesalers and commercial accounts, which are not included in the site counts reported above. |
Independent Dealer Sites
|
|
• |
The independent dealer owns or leases the property and owns all motor fuel and convenience store inventory. |
|
|
• |
We contract to exclusively distribute motor fuel to the independent dealer at a fixed mark-up per gallon or, in some cases, DTW. |
|
|
• |
Distribution contracts with independent dealers are typically seven to 10 years in length. |
|
|
• |
As of December 31, 2017, the average remaining distribution contract term was 5.7 years. |
Lessee Dealer Sites
|
|
• |
We own or lease the property and then lease or sublease the site to a dealer. |
|
|
• |
The lessee dealer owns all motor fuel and retail site inventory and sets its own pricing and gross profit margins. |
|
|
• |
We collect wholesale motor fuel margins at a fixed mark-up per gallon or, in some cases, DTW. |
|
|
• |
Under our distribution contracts, we agree to supply a particular branded motor fuel or unbranded motor fuel to a site or group of sites and arrange for all transportation. |
|
|
• |
Exclusive distribution contracts with dealers who lease property from us run concurrent in length to the retail site’s lease period (generally three to 10 years). |
8
|
|
• |
As of December 31, 2017, the average remaining lease agreement term was 3.7 years. |
DMS Sites
|
|
• |
We own or lease the property and then lease or sublease the site to DMS. |
|
|
• |
We entered into a 15-year motor fuel distribution agreement with DMS pursuant to which we distribute to DMS motor fuel at a fixed mark-up per gallon. |
|
|
• |
We entered into 15-year triple-net lease agreements with DMS pursuant to which DMS leases sites from us. |
|
|
• |
DMS owns motor fuel and retail site inventory and sets its own pricing and gross profit margin. |
|
|
• |
As of December 31, 2017, the average remaining term on our motor fuel distribution agreements with DMS was 9.8 years. The average remaining term on our lease agreements with DMS was 10.3 years. |
Circle K Sites
|
|
• |
In conjunction with the joint acquisitions of Nice N Easy Assets in 2014 and Landmark Assets with CST in 2015, we own the property and lease the retail sites to Circle K. Concurrently with these acquisitions, we entered into a 10-year motor fuel distribution agreement with CST, pursuant to which we distribute to Circle K motor fuels at a fixed mark-up per gallon. |
|
|
• |
We lease sites to Circle K under a 10-year triple-net master lease agreement. |
|
|
• |
Circle K owns all motor fuel and retail site inventory and sets its own pricing and gross profit margin. |
|
|
• |
As of December 31, 2017, the remaining term on our fuel distribution agreement was 6.9 years. The average remaining term on our lease agreements with Circle K was 7.1 years. |
Rental Income
We also generate revenues through leasing or subleasing our real estate. We own or lease real and personal property and we lease or sublease to tenants, the substantial majority of which are wholesale customers as described above. As such, we manage our real estate leasing activities congruently with our Wholesale segment. We own approximately 59% of our properties that we lease to our dealers or utilize in our retail business. Our lease agreements with third party landlords have an average remaining lease term of 6.2 years as of December 31, 2017. Not all of the rental income we earn is a qualified source of income under Section 7704(d) of the Internal Revenue Code. Rental income from Circle K is not qualifying income under Section 7704(d) of the Internal Revenue Code.
The following table presents rental income (in thousands), including rental income from commission agents that is included in the Retail segment, and the number of sites from which rental income was generated:
|
|
|
Rental Income Year Ended December 31, |
|
|
Sites from which Rental Income was Generated End of Year |
|
||||||||||||||||||
|
|
|
2017 |
|
|
2016 |
|
|
2015 |
|
|
2017 |
|
|
2016 |
|
|
2015 |
|
||||||
|
Total |
|
$ |
86.3 |
|
|
$ |
80.6 |
|
|
$ |
65.4 |
|
|
|
885 |
|
|
|
810 |
|
|
|
691 |
|
CST Fuel Supply
As of December 31, 2017, our total limited partner interest in CST Fuel Supply was 17.5%. We receive pro rata distributions from CST Fuel Supply related to CST Marketing and Supply’s distribution of motor fuel to the majority of CST’s U.S. retail sites.
9
Our Retail segment generated 2017 revenues of $492 million. We own or lease and operate retail sites. Subsequent to an acquisition, we evaluate the eventual long-term operation of each retail site acquired: (a) to be converted into a lessee dealer or (b) other strategic alternatives, including selling the site to Circle K for them to operate as a retail site. By converting retail sites into lessee dealers, we continue to benefit from motor fuel distribution volumes as well as rental income from lease or sublease arrangements while reducing operating expenses. For the year ended December 31, 2017, we converted three company operated retail sites in our Retail segment to lessee dealers in our Wholesale segment. As of December 31, 2017, we continue to operate 71 retail sites, including one liquor store to which we do not distribute fuel on a wholesale basis.
Commission Sites
|
|
• |
We own or lease the property and then lease or sublease the site to the commission agent, who pays rent to us and operates all the non-fuel related operations at the sites for its own account. |
|
|
• |
We own the motor fuel inventory at the sites, set the motor fuel pricing at the sites, and generate revenue from the retail sale of motor fuels to the end customer. |
|
|
• |
We pay the commission agent a commission for each gallon of motor fuel sold at the site. |
|
|
• |
LGW distributes motor fuel on a wholesale basis to LGWS, which owns the motor fuel inventory and distributes motor fuel to commission sites. LGW records qualifying wholesale motor fuel distribution gross income and LGWS records the non-qualifying retail gross income. |
|
|
• |
As of December 31, 2017, the average remaining motor fuel distribution and lease agreement term was 1.6 years. |
Company Operated Sites
|
|
• |
We own or lease the property, operate the retail site and retain all profits from motor fuel and retail site operations. |
|
|
• |
We own the motor fuel inventory at the sites and set the motor fuel pricing at the sites. |
|
|
• |
We maintain inventory from the time of the purchase of motor fuel from third party suppliers until the retail sale to the end customer. On average, we maintain approximately 5-days’ worth of motor fuel sales in inventory at each site. |
|
|
• |
LGW distributes on a wholesale basis all of the motor fuel required by our company operated sites, which owns the motor fuel inventory and distributes motor fuel to retail customers. LGW records qualifying wholesale motor fuel distribution gross income and LGWS records the non-qualifying retail distribution gross income. |
10
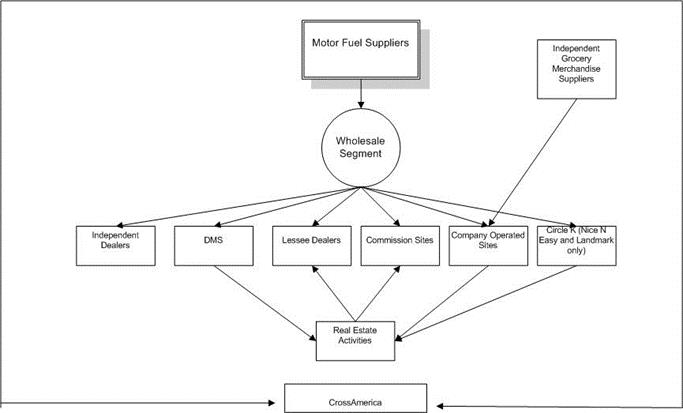
The following chart depicts how motor fuel is procured and distributed to our customer groups and how convenience merchandise items are procured and distributed to our company operated retail sites. The chart also depicts the relationship of our real estate activities to our customer groups.
Business Strategy and Objective
Our primary business objective is to generate sufficient cash flows from operations to make quarterly cash distributions to our unitholders and, over time, to increase our quarterly cash distributions. The amount of any distribution is subject to the discretion of the Board, and the Board may modify or revoke the cash distribution policy at any time. Our Partnership Agreement does not require us to pay any distributions.
Our business strategy to achieve our objective of paying and, over time, increasing our quarterly cash distributions, is focused on the following key initiatives:
|
|
• |
Expand within and beyond our existing markets through acquisitions, either on our own or as joint acquisitions with Circle K, as demonstrated by the Jet-Pep Assets acquisition. Since our IPO and through February 21, 2018, we have completed acquisitions for a total of approximately 600 fee and leasehold sites for total consideration of approximately $1.0 billion; |
|
|
• |
Enhance our real estate business’ cash flows by owning or leasing sites in prime locations; |
|
|
• |
Increase our Wholesale segment by expanding market share; |
|
|
• |
Maintain strong relationships with major integrated oil companies and refiners; |
|
|
• |
Convert company operated retail sites to lessee dealer sites to provide for more stable cash flows and maximize qualified income; and |
|
|
• |
As part of our business strategy with Circle K, we intend, when favorable market conditions exist and pending approval by the Board’s independent conflicts committee and our Board, and the approval of the Couche-Tard Board, as applicable, and mutual agreement upon terms and other conditions, to purchase certain assets from Circle K, which could include a portion of the independent dealer and lessee dealer wholesale business of Circle K and certain non-core retail convenience sites of Circle K with the intent to convert them to lessee dealer sites. |
11
We believe our competitive strengths will allow us to capitalize on our strategic opportunities, including:
|
|
• |
Stable cash flows from real estate rent income and wholesale motor fuel distribution; |
|
|
• |
Established history of acquiring sites and successfully integrating these sites and operations into our existing business; |
|
|
• |
Long-term relationships with major integrated oil companies and other key suppliers; and |
|
|
• |
Prime real estate locations in areas with high traffic and considerable motor fuel consumption. |
Supplier Arrangements
We distribute Branded Motor Fuel under the Exxon, Mobil, BP, Shell, Chevron, Sunoco, Valero, Gulf, Citgo, Marathon and Phillips 66 brands to our customers. Branded Motor Fuels are purchased from major integrated oil companies and refiners under supply agreements. For the year ended December 31, 2017, our Wholesale segment purchased approximately 28%, 27% and 16% of its motor fuel from ExxonMobil, BP and Motiva, respectively. We purchase the motor fuel at the supplier’s applicable terminal rack price, which typically changes daily. Certain suppliers offer volume rebates or incentive payments to drive volumes and provide an incentive for branding new locations. Certain suppliers require that all or a portion of any such incentive payments be repaid to the supplier in the event that the sites are rebranded within a stated number of years. We also purchase unbranded motor fuel for distribution at a rack price. As of December 31, 2017, our supply agreements had a weighted-average remaining term of approximately 1.6 years.
We purchase fuel supplied to sites acquired in our Jet-Pep Asset acquisition from Circle K. See “Item 7. Management’s Discussion and Analysis of Financial Condition and Results of Operations—Significant Factors Affecting our Profitability—The Significance of Crude Oil and Wholesale Motor Fuel Prices on Our Revenues, Cost of Sales and Gross Profit” for additional discussion of the terms under which this fuel is purchased from Circle K.
Competition
Our Wholesale segment competes with other motor fuel distributors. Major competitive factors for us include, among others, customer service, price and quality of service and availability of products.
The convenience store industry is highly competitive and characterized by ease of entry and constant change in the number and type of retailers offering products and services of the type we sell in our retail sites. We compete with other retail site chains, independently owned retail sites, motor fuel stations, supermarkets, drugstores, discount stores, dollar stores, club stores and hypermarkets. Major competitive factors include, among others, location, ease of access, product and service selection, motor fuel brands, pricing, customer service, store appearance, and cleanliness.
Seasonality
Our business exhibits substantial seasonality due to our wholesale and retail sites being located in certain geographic areas that are affected by seasonal weather and temperature trends and associated changes in retail customer activity during different seasons. Historically, sales volumes have been highest in the second and third quarters (during the summer activity months) and lowest during the winter months in the first and fourth quarters.
Trade Names, Service Marks and Trademarks
We are a wholesale distributor of motor fuel for various major integrated oil companies and are licensed to market/resell motor fuel under their respective motor fuel brands.
We are not aware of any facts that would negatively affect our continuing use of any trademarks, trade names or service marks.
Environmental Laws and Regulations
We are subject to extensive federal, state and local environmental laws and regulations, including those relating to USTs, the release or discharge of materials into the air, water and soil, waste management, pollution prevention measures, storage, handling, use and disposal of hazardous materials, the exposure of persons to hazardous materials, greenhouse gas emissions, and characteristics, composition, storage and sale of motor fuel and the health and safety of our employees. We incorporate by reference into this section our disclosures included in Note 2 under the captions “Environmental Matters” and “Asset Retirement Obligations” and Note 10 under the caption “Asset Retirement Obligations” to the financial statements.
12
Our retail sites are subject to regulation by federal, state, and/or local agencies and to licensing and regulations by state and local health, sanitation, safety, fire and other departments relating to the development and operation of retail sites, including regulations relating to zoning and building requirements and the preparation and sale of food.
Our retail sites are also subject to federal, state and/or local laws governing such matters as wage rates, overtime, working conditions and citizenship requirements. At the federal, state and local levels where we operate, there are proposals under consideration from time to time to increase minimum wage rates and modify or restrict immigration policies.
Employees
The General Partner manages our operations and activities, Under the Amended Omnibus Agreement, employees of Circle K provide management services to us. As of December 31, 2017, pursuant to the Amended Omnibus Agreement, 92 employees of Circle K provided exclusive management services to us.
As of December 31, 2017, we had 604 employees who provide services to our Retail segment, all of whom are employed by one of our subsidiaries.
13
If any of the following risks were to occur, our business, financial condition or results of operations could be materially and adversely affected. In that case, we might not be able to pay distributions on our common units, the trading price of our common units could decline and you could lose all or part of your investment. Also, please read “Cautionary Statement Regarding Forward-Looking Statements.”
Limited partner interests are inherently different from the capital stock of a corporation although many of the business risks to which we are subject are similar to those that would be faced by a corporation engaged in a similar business.
Risks Relating to Our Industry and Our Business
We may not have sufficient distributable cash from operations to enable us to pay our quarterly distribution following the establishment of cash available for distribution and payment of fees and expenses.
We may not have sufficient cash each quarter to pay quarterly distribution at current levels or at all.
The amount of cash we can distribute on our common units principally depends upon the amount of cash we generate from our operations, which will fluctuate from quarter to quarter based on, among other things:
|
|
• |
demand for motor fuel products in the markets we serve, including seasonal fluctuations, and the margin per gallon we earn selling and distributing motor fuel; |
|
|
• |
the wholesale price of motor fuel and its impact on the payment discounts we receive; |
|
|
• |
seasonal trends in the industries in which we operate; |
|
|
• |
the impact that severe storms could have to our suppliers’ operations; |
|
|
• |
competition from other companies that sell motor fuel products or operate retail sites in our targeted market areas; |
|
|
• |
the inability to identify and acquire suitable sites or to negotiate acceptable leases for such sites; |
|
|
• |
the potential inability to obtain adequate financing to fund our expansion; |
|
|
• |
the level of our operating costs, including the amount and manner in which payments to Circle K are made under the Amended Omnibus Agreement; |
|
|
• |
prevailing economic conditions; |
|
|
• |
regulatory actions affecting the supply of or demand for motor fuel, our operations, our existing contracts or our operating costs; and |
|
|
• |
volatility of prices for motor fuel. |
In addition, the actual amount of cash we will have available for distribution will depend on other factors such as:
|
|
• |
the level of capital expenditures we make; |
|
|
• |
the restrictions contained in our credit facility; |
|
|
• |
our debt service requirements; |
|
|
• |
the cost of acquisitions; |
|
|
• |
fluctuations in our working capital needs; |
|
|
• |
our ability to borrow under our credit facility to make distributions to our unitholders; and |
|
|
• |
the amount, if any, of cash reserves established by our General Partner in its discretion. |
There is no guarantee that we will distribute quarterly cash distributions to our unitholders in any quarter.
14
The amount of cash we have available for distribution to unitholders depends primarily on our cash flow rather than on our profitability, which may prevent us from making cash distributions, even during periods when we record net income.
The amount of cash we have available for distribution depends primarily on our cash flow, and not solely on profitability, which will be affected by non-cash items. As a result, we may make cash distributions during periods when we record losses for financial accounting purposes and may not make cash distributions during periods when we record net income for financial accounting purposes.
If we are unable to make acquisitions on economically acceptable terms, our future growth and ability to increase distributions to unitholders will be limited.
Our strategy to grow our business and increase distributions to unitholders is dependent on our ability to make acquisitions that result in an increase in cash flow. Our growth strategy is based, in large part, on our expectation of ongoing divestitures of retail and wholesale fuel distribution assets by industry participants. We may be unable to make accretive acquisitions for any of the following reasons:
|
|
• |
we are unable to identify attractive acquisition candidates or negotiate acceptable purchase contracts for them; |
|
|
• |
we are unable to raise financing for such acquisitions on economically acceptable terms, for example if the market price for our common units declines; |
|
|
• |
we are outbid by competitors; or |
|
|
• |
we or the seller are unable to obtain any necessary consents. |
If we are unable to make acquisitions on economically acceptable terms, our future growth and ability to increase distributions to unitholders will be limited. In addition, if we consummate any future acquisitions, our capitalization and results of operations may change significantly. We may also consummate acquisitions, which at the time of consummation we believe will be accretive, but ultimately may not be accretive. If any of these events occurred, our future growth could be adversely affected.
Any acquisitions are subject to substantial risks that could adversely affect our business, financial condition and results of operations and reduce our ability to make distributions to unitholders.
Any acquisitions involve potential risks, including, among other things:
|
|
• |
the validity of our assumptions about revenues, capital expenditures and operating costs of the acquired business or assets, as well as assumptions about achieving synergies with our existing business; |
|
|
• |
the incurrence of substantial unforeseen environmental and other liabilities arising out of the acquired businesses or assets, including liabilities arising from the operation of the acquired businesses or assets prior to our acquisition, for which we are not indemnified or for which the indemnity is inadequate; |
|
|
• |
the costs associated with additional debt or equity capital, which may result in a significant increase in our interest expense and financial leverage resulting from any additional debt incurred to finance the acquisition, or the issuance of additional common units on which we will make distributions, either of which could offset the expected accretion to our unitholders from any such acquisition and could be exacerbated by volatility in the equity or debt capital markets; |
|
|
• |
a failure to realize anticipated benefits, such as increased available distributable cash flow, enhanced competitive position or new customer relationships; |
|
|
• |
the inability to timely and effectively integrate the operations of recently acquired businesses or assets, particularly those in new geographic areas or in new lines of business; |
|
|
• |
a decrease in our liquidity by using a significant portion of our available cash or borrowing capacity to finance the acquisition; |
|
|
• |
the incurrence of other significant charges, such as impairment of goodwill or other intangible assets, asset devaluation or restructuring charges; |
|
|
• |
performance from the acquired assets and businesses that is below the forecasts we used in evaluating the acquisition; |
|
|
• |
a significant increase in our working capital requirements; |
|
|
• |
competition in our targeted market areas; |
15
|
|
• |
diversion of our management’s attention from other business concerns. |
In addition, our ability to purchase or lease additional sites involves certain potential risks, including the inability to identify and acquire suitable sites or to negotiate acceptable leases or subleases for such sites and difficulties in adapting our distribution and other operational and management systems to an expanded network of sites.
Our reviews of businesses or assets proposed to be acquired are inherently imperfect because it generally is not feasible to perform an in-depth review of businesses and assets involved in each acquisition. Even a detailed review of assets and businesses may not necessarily reveal existing or potential problems, nor will it permit a buyer to become sufficiently familiar with the assets or businesses to fully assess their deficiencies and potential. For example, inspections may not always be performed on every asset, and environmental problems, such as groundwater contamination, are not necessarily observable even when an inspection is undertaken. Unitholders will not have the opportunity to evaluate the economic, financial and other relevant information that we will consider in determining the application of our funds and other resources toward the acquisition of certain businesses or assets.
Given Couche-Tard’s size and the magnitude of its acquisitions and our joint acquisitions with them, we may be subject to FTC review and be required to divest sites even in transactions with which we are not involved.
One of our business strategies is to expand within and beyond our existing locations through acquisitions, either on our own or through joint acquisitions with Couche-Tard. The FTC may review these acquisitions and, in certain cases, we or Couche-Tard may enter into consent decrees to remedy the FTC’s competitive concerns, including by divesting sites. The FTC may not view us as an independent competitor of Couche-Tard for purposes of its substantive antitrust analysis. As a result, FTC consent decrees may require us to make divestitures, even if the transaction is solely a Couche-Tard acquisition. Similarly, Couche-Tard, as the owner of our General Partner, may not support acquisitions that may result in overlaps between the target company and Couche-Tard assets. Further, the possibility of an extended FTC review, which may result in divestiture requests may render potential acquisitions uneconomic or put us at a disadvantage as compared to other bidders. In addition, FTC reviews are costly, potentially adding significant transaction costs, and may negatively impact or delay the execution of our acquisition strategy.
Volatility in crude oil and wholesale motor fuel costs affect our business, financial condition and results of operations and our ability to make distributions to unitholders.
For the year ended December 31, 2017, motor fuel revenues accounted for 91% of our total revenues and motor fuel gross profit accounted for 41% of total gross profit. Wholesale motor fuel costs are directly related to, and fluctuate with, the price of crude oil. Volatility in the price of crude oil, and subsequently wholesale motor fuel prices, is caused by many factors, including general political conditions, acts of war or terrorism, instability in oil producing regions, particularly in the Middle East and South America, and the value of U.S. dollars relative to other foreign currencies, particularly those of oil producing nations. In addition, the supply of motor fuel and our wholesale purchase costs could be adversely affected in the event of a shortage or oversupply of product, which could result from, among other things, interruptions of fuel production at oil refineries, new supply sources, sustained increases or decreases in global demand or the fact that our motor fuel contracts do not guarantee an uninterrupted, unlimited supply of motor fuel.
Significant increases and volatility in wholesale motor fuel costs could result in lower gross profit dollars, as an increase in the retail price of motor fuel could impact consumer demand for motor fuel and convenience merchandise and could result in lower wholesale motor fuel gross profit dollars. Dramatic increases in oil prices reduce retail motor fuel gross profits, because wholesale motor fuel costs typically increase faster than retailers are able to pass them along to customers. In addition, significant decreases in oil prices and the corresponding decreases in wholesale motor fuel sales prices can result in lower revenues and gross profit margins, as our wholesale motor fuel gross profits include discounts from our suppliers calculated as a percentage of the cost of wholesale motor fuel. As the market prices of crude oil, and, correspondingly, the market prices of wholesale motor fuel, experience significant and rapid fluctuations, we attempt to pass along wholesale motor fuel price changes to our customers through retail price changes; however, we are not always able to do so immediately. The timing of any related increase or decrease in sales prices is affected by competitive conditions in each geographic market in which we operate. As such, our revenues and gross profit for motor fuel can increase or decrease significantly and rapidly over short periods of time and potentially adversely impact our business, financial condition, results of operations and ability to make distributions to our unitholders. The volatility in crude oil and wholesale motor fuel costs and sales prices makes it extremely difficult to forecast future motor fuel gross profits or predict the effect that future wholesale costs and sales price fluctuations will have on our operating results and financial condition.
16
Seasonality in wholesale motor fuel costs and sales, as well as merchandise sales, affect our business, financial condition and results of operations and our ability to make distributions to unitholders.
Oil prices, wholesale motor fuel costs, motor fuel sales volumes, motor fuel gross profits and merchandise sales often experience seasonal fluctuations. For example, consumer demand for motor fuel typically increases during the summer driving season and typically falls during the winter months. Travel, recreation and construction are typically higher in these months in the geographic areas in which we operate, increasing the demand for motor fuel and merchandise that we sell. Therefore, our revenues are typically higher in the second and third quarters of our fiscal year. A significant change in any of these factors, including a significant decrease in consumer demand (other than typical seasonal variations), could materially affect our motor fuel and merchandise volumes, motor fuel gross profit and overall customer traffic, which in turn could have a material adverse effect on our business, financial condition, results of operations and cash available for distribution to our unitholders.
Both the wholesale motor fuel distribution and the retail motor fuel industries are characterized by intense competition and fragmentation, and our failure to effectively compete could adversely affect our business, financial condition and results of operations and reduce our ability to make distributions to unitholders.
The markets for distribution of wholesale motor fuel and the sale of retail motor fuel are highly competitive and fragmented, which results in narrow margins. We have numerous competitors and some may have significantly greater resources and name recognition than we do. We rely on our ability to provide value added reliable services and to control our operating costs to maintain our margins and competitive position. If we were to fail to maintain the quality of our services, wholesale customers could choose alternative distribution sources and retail customers could purchase from other retailers, each decreasing our margins. Furthermore, there can be no assurance that major integrated oil companies will not decide to distribute their own products in direct competition with us or that large wholesale customers will not attempt to buy directly from the major integrated oil companies. The occurrence of any of these events could have a material adverse effect on our business, results of operations and our ability to make distributions.
Changes in credit or debit card expenses could reduce our gross profit, especially on motor fuel sold at our company operated retail sites.
A significant portion of our sales at our company operated retail sites involve payment using credit or debit cards. We are assessed fees as a percentage of transaction amounts and not as a fixed dollar amount or percentage of our gross profits. Higher motor fuel prices result in higher credit and debit card expenses, and an increase in credit or debit card use or an increase in fees would have a similar effect. Therefore, credit and debit card fees charged on motor fuel purchases that are more expensive as a result of higher motor fuel prices are not necessarily accompanied by higher gross profits. In fact, such fees may cause lower gross profits. Lower gross profits on motor fuel sales caused by higher fees may decrease our overall gross profit and could have a material adverse effect on our business, financial condition, results of operations and cash available for distribution to our unitholders.
General economic conditions that are largely out of our control could adversely affect our business, financial condition and results of operations and reduce our ability to make distributions to unitholders.
Recessionary economic conditions, higher interest rates, higher motor fuel and other energy costs, inflation, increases in commodity prices, higher levels of unemployment, higher consumer debt levels, higher tax rates and other changes in tax laws or other economic factors may affect consumer spending or buying habits, and could adversely affect the demand for motor fuel and convenience items we sell at our retail sites. Unfavorable economic conditions, higher motor fuel prices and unemployment levels can affect consumer confidence, spending patterns and miles driven, with many customers “trading down” to lower priced products in certain categories when unfavorable conditions exist. These factors can lead to sales declines in both motor fuel and general merchandise, and in turn have an adverse impact on our business, financial condition and results of operations.
A tightening of credit in the financial markets or an increase in interest rates may make it more difficult for wholesale customers and suppliers to obtain financing and, depending on the degree to which it occurs, there may be a material increase in the nonpayment or other nonperformance by our customers and suppliers. Even if our credit review and analysis mechanisms work properly, we may experience financial losses in our dealings with these third parties. A material increase in the nonpayment or other nonperformance by our wholesale customers and/or suppliers could adversely affect our business, financial condition, results of operations and cash available for distribution to our unitholders.
Changes in consumer behavior and travel as a result of changing economic conditions, labor strikes or otherwise could adversely affect our business, financial condition and results of operations and reduce our ability to make distributions to unitholders.
In the retail motor fuel industry, customer traffic is generally driven by consumer preferences and spending trends, growth rates for commercial truck traffic and trends in travel and weather. Changes in economic conditions generally, or in the regions in
17
which we operate, could adversely affect consumer spending patterns and travel in our markets. In particular, weakening economic conditions may result in decreases in miles driven and discretionary consumer spending and travel, which affect spending on motor fuel and convenience items. In addition, changes in the types of products and services demanded by consumers or labor strikes in the construction industry or other industries that employ customers who visit our stores, may adversely affect our sales and gross profit. Additionally, negative publicity or perception surrounding motor fuel suppliers could adversely affect reputation and brand image, which may negatively affect our motor fuel sales and gross profit. Similarly, advanced technology and increased use of hybrid cars or cars using alternative fuels would reduce demand for motor fuel. Our success depends on our ability to anticipate and respond in a timely manner to changing consumer demands and preferences while continuing to sell products and services that remain relevant to the consumer and thus will positively impact overall merchandise gross profit.
Laws, regulations, technological, political and scientific developments regarding climate change and fuel efficiency may decrease demand for motor fuel.
Developments aimed at reducing greenhouse gas emissions’ contribution to climate change may decrease the demand or increase the cost for our major product, petroleum-based motor fuel. Attitudes toward this product and its relationship to the environment may significantly affect our effectiveness in marketing our product and sales. Government efforts to steer the public toward non-petroleum-based fuel dependent modes of transportation may foster a negative perception toward motor fuel or increase costs for our product, thus affecting the public’s attitude toward our major product. New technologies that increase fuel efficiency or offer alternative vehicle power sources or laws or regulations to increase fuel efficiency, reduce consumption or offer alternative vehicle power sources may result in decreased demand for petroleum-based motor fuel. We may also incur increased costs for our product, which we may not be able to pass along to our customers. These developments could potentially have a material adverse effect on our business, financial condition, results of operations and cash available for distribution to our unitholders.
Future tobacco legislation, campaigns to discourage smoking, increased use of tobacco alternatives, increases in tobacco taxes and wholesale cost increases of tobacco products could adversely affect our business, financial condition and results of operations and reduce our ability to make distributions to unitholders.
Sales of tobacco products have historically accounted for a significant portion of our total sales of retail site merchandise. Increases in wholesale cigarette costs and tax increases on tobacco products, as well as future legislation, national and local campaigns to discourage smoking in the U.S., and increased use of tobacco alternatives such as electronic cigarettes, may have an adverse effect on the demand for tobacco products and therefore reduce our revenues and profits. Competitive pressures in our markets can make it difficult to pass price increases on to our customers. These factors could materially and adversely affect our retail price of cigarettes, cigarette unit volume and sales, merchandise gross profit and overall customer traffic. Reduced sales of tobacco products or smaller gross profits on the sales we make could have a material adverse effect on our business, financial condition, results of operations and cash available for distribution to our unitholders.
Currently, major cigarette manufacturers offer substantial rebates to retailers. We include these rebates as a component of our gross profit. In the event these rebates are no longer offered, or decreased, our profit from cigarette sales will decrease accordingly. In addition, reduced retail display allowances on cigarettes offered by cigarette manufacturers negatively affect gross profits. These factors could materially affect our retail price of cigarettes, cigarette unit volume and revenues, merchandise gross profit and overall customer traffic, which could in turn have a material adverse effect on our business, financial condition, results of operations and cash available for distribution to our unitholders.
We are subject to extensive government laws and regulations, and the cost of compliance with such laws and regulations can be material.
Our business and properties are subject to extensive local, state and federal governmental laws and regulations relating to, among other things, environmental conditions, the sale of alcohol, tobacco and money orders, employment conditions, including minimum wage requirements, and public accessibility requirements. The cost of compliance with these laws and regulations can have a material adverse effect on our operating results and financial condition. In addition, failure to comply with local, state, provincial and federal laws and regulations to which our operations are subject may result in penalties and costs that could adversely affect our business and our operating results.
In certain areas where our retail sites are located, state or local laws limit the retail sites’ hours of operation or their sale of alcoholic beverages, tobacco products, possible inhalants and lottery tickets, in particular to minors. Failure to comply with these laws could adversely affect our revenues and results of operations because these state and local regulatory agencies have the power to revoke, suspend or deny applications for and renewals of permits and licenses relating to the sale of these products or to seek other remedies, such as the imposition of fines or other penalties. Moreover, these laws may impact our sales volumes in general, as customers who purchase certain products such as alcoholic beverages typically buy other products when they shop. Laws that curtail the consumer’s ability to buy certain products at our retail sites may curtail consumer demand for other products that we sell.
18
If a portion of our workforce were to create or become part of a labor union, we could be forced to increase our compensation levels in order to avoid work disruptions or stoppages. Any appreciable increase in the statutory minimum wage or unionization of our workforce could result in an increase in our labor costs and such cost increase, or the penalties for failing to comply with such statutory minimums, could adversely affect our business, financial condition, results of operations and cash available for distribution to our unitholders.
Further, the Affordable Care Act requires us to provide additional health insurance benefits to our employees, or health insurance coverage to additional employees, and has increased our costs and expenses.
Any changes in the laws or regulations described above that are adverse to us and our properties could affect our operating and financial performance. In addition, new regulations are proposed from time to time which, if adopted, could have a material adverse effect on our operating results and financial condition.
We are subject to extensive government laws and regulations concerning our employees, and the cost of compliance with such laws and regulations can be material.
Regulations related to wages and other compensation affect our business. Any appreciable increase in applicable employment laws and regulations, including the statutory minimum wage, exemption levels or overtime regulations could result in an increase in labor costs and such cost increase, or the penalties for failing to comply with such statutory minimums, could adversely affect our business, financial condition, results of operations and cash available for distribution to our unitholders.
Further, the Affordable Care Act and related reforms make and will continue to make sweeping and fundamental changes to the U.S. health care system. This requires us to provide additional health insurance benefits to the employees providing services to us, or health insurance coverage to additional employees, and as a result may increase our costs and expenses. In addition, we are directly and indirectly affected by new tax legislation and regulation and the interpretation of tax laws and regulations. This includes potential changes in tax laws or the interpretation of tax laws relating to incentive compensation such as profit interests. Changes in such legislation, regulation or interpretation could have an adverse effect on our incentive compensation structures and thereby could have a material adverse effect on our business, financial condition, results of operations and cash available for distribution to our unitholders.
Any changes in the employment, benefit plan, tax or labor laws or regulations described above or new regulations proposed from time to time, could have a material adverse effect on our employment practices, our business, financial condition, results of operations and cash available for distribution to our unitholders.
We are subject to extensive federal, state and local environmental laws, and the cost of complying with such laws may be material.
Our operations are subject to a variety of environmental laws and regulations, including those relating to emissions to the air, discharges into water, releases of hazardous and toxic substances and remediation of contaminated sites. Under various federal, state and local laws and regulations, we may, as the owner or operator, be liable for the costs of removal or remediation of contamination at our current locations or our former locations, whether or not we knew of, or were responsible for, the presence of such contamination. In particular, as an owner and operator of motor fueling stations, we face risks relating to petroleum product contamination that other retail site operators not engaged in such activities would not face. The remediation costs and other costs required to clean up or treat contaminated sites could be substantial. Contamination on and from our current or former locations may subject us to liability to third parties or governmental authorities for injuries to persons, property or natural resources and may adversely affect our ability to sell or rent our properties or to borrow money using such properties as collateral.
In the U.S., persons who dispose of or arrange for the disposal or treatment of hazardous or toxic substances at third party sites may also be liable for the costs of removal or remediation of such substances at these disposal sites although such sites are not owned by such persons. Our current and historic operation of many locations and the disposal of contaminated soil and groundwater wastes generated during cleanups of contamination at such locations could expose us to such liability.
We are subject to extensive environmental laws and regulations regulating USTs and vapor recovery systems. Compliance with existing and future environmental laws regulating such tanks and systems may require significant expenditures. We pay fees to state “leaking UST” trust funds in states where they exist. These state trust funds are expected to pay or reimburse us for remediation expenses related to contamination associated with USTs subject to their jurisdiction. Such payments are always subject to a deductible paid by us, specified per incident caps and specified maximum annual payments, which vary among the funds.
19
Additionally, such funds may have eligibility requirements that not all of our sites will meet. To the extent state funds or other responsible parties do not pay or delay payments for remediation, we will be obligated to make these payments, which, in the aggregate, could have a material adverse effect on our business, financial condition, results of operations and cash available for distribution to our unitholders. We can give no assurance that these funds or responsible third parties are or will continue to remain viable.
Motor fuel operations present risks of soil and groundwater contamination. In the future, we may incur substantial expenditures for remediation of contamination that has not been discovered at existing locations or locations which we may acquire. We regularly monitor our facilities for environmental contamination and record liabilities on our financial statements to cover potential environmental remediation and compliance costs when probable to occur and reasonably estimable. However, we can make no assurance that the liabilities we have recorded are the only environmental liabilities relating to our current and former locations, that material environmental conditions not known to us do not exist, that future laws or regulations will not impose material environmental liability on us or that our actual environmental liabilities will not exceed our reserves. In addition, failure to comply with any environmental regulations or an increase in regulations could have a material adverse effect on our business, financial condition, results of operations and cash available for distribution to our unitholders.
Unfavorable weather conditions could adversely affect our business, financial condition and results of operations and reduce our ability to make distributions to unitholders.
Our retail sites are located in regions throughout the U.S. that are susceptible to certain severe weather events , such as hurricanes, flooding, severe thunderstorms, snowstorms, tornadoes and extreme heat and cold. Inclement weather conditions could damage our facilities, our suppliers or could have a significant impact on consumer behavior, travel and retail site traffic patterns, as well as our ability to operate our retail sites. We could also be affected by regional occurrences, such as energy shortages or increases in energy prices, fires or other natural disasters. Besides these more obvious consequences of severe weather, our ability to insure these locations and the related cost of such insurance could have a material adverse effect on our business, financial condition, results of operations and cash available for distribution to our unitholders.
We could be adversely affected if we are not able to attract and retain a strong management team.
We are dependent on our ability to attract and retain a strong management team. If, for any reason, we are not able to attract and retain qualified senior personnel, our business, financial condition, results of operations and cash flows could be adversely affected. We also are dependent on our ability to recruit qualified retail site and field managers. Failure to attract and retain these individuals at reasonable compensation levels could have a material adverse effect on our business, financial condition, results of operations and cash available for distribution to our unitholders.
We depend on three principal suppliers for the majority of our motor fuel. A disruption in supply or a change in our relationship with any one of them could adversely affect our business, financial condition and results of operations and reduce our ability to make distributions to unitholders.
ExxonMobil, BP and Motiva collectively supplied approximately 71% of our motor fuel purchases in 2017. We purchased approximately 28%, 27% and 16% of our motor fuel from ExxonMobil, BP and Motiva, respectively. A change of motor fuel suppliers, a disruption in supply or a significant change in pricing with any of these suppliers could have a material adverse effect on our business, financial condition, results of operations and cash available for distribution to our unitholders.
We rely on our suppliers to provide trade credit terms to adequately fund our on-going operations.
Our business is impacted by the availability of trade credit to fund motor fuel purchases and inventory purchases of our retail sites. An actual or perceived downgrade in our liquidity or operations could cause our suppliers to seek credit support in the form of additional collateral, limit the extension of trade credit or otherwise materially modify their payment terms. Any material changes in the payments terms, including payment discounts, or availability of trade credit provided by our principal suppliers could have a material adverse effect on our business, financial condition, results of operations and cash available for distribution to our unitholders.
20
Pending or future litigation could adversely affect our financial condition and results of operations. Litigation and publicity concerning motor fuel or food quality, health and other issues could result in significant liabilities or litigation costs and cause consumers to avoid our retail sites.
Retail site businesses can be adversely affected by litigation and complaints from customers or government agencies resulting from motor fuel or food quality, illness or other health or environmental concerns or operating issues stemming from one or more locations. Additionally, we may become a party to individual personal injury, off-specification motor fuel, products liability, consumer protection act, contract disputes, wage and hour unemployment claims and other legal actions in the ordinary course of our business and we are occasionally exposed to industry-wide or class-action claims arising from the products we carry or industry-specific business practices. Adverse publicity about these allegations may negatively affect us, regardless of whether the allegations are true, by discouraging customers from purchasing motor fuel, merchandise or food at one or more of our retail sites. We could also incur significant liabilities if a lawsuit or claim results in a decision against us. Even if we are successful in defending such litigation, our litigation costs could be significant, and the litigation may divert time and money away from our operations and adversely affect our performance. Our defense costs and any resulting damage awards may not be fully covered by our insurance policies.
The dangers inherent in the storage and transport of motor fuel could cause disruptions and could expose us to potentially significant losses, costs or liabilities.
We store motor fuel in storage tanks at our retail sites. These operations are subject to significant hazards and risks inherent in storing and transporting motor fuel. These hazards and risks include, but are not limited to, fires, explosions, traffic accidents, spills, discharges and other releases, any of which could result in distribution difficulties and disruptions, environmental pollution, governmentally imposed fines or cleanup obligations, personal injury or wrongful death claims and other damage to our properties and the properties of others. Any such event could have a material adverse effect on our business, financial condition, results of operations and cash available for distribution to our unitholders.
We depend on third party transportation providers for the transportation of substantially all of our motor fuel. Thus, a change of providers or a significant change in our relationship with any of these providers could adversely affect our business, financial condition and results of operations and reduce our ability to make distributions to unitholders.
Substantially all of the motor fuel we distribute is transported from motor fuel terminals to gas stations by third party carriers. A change of transportation providers, a disruption in service or a significant change in our relationship with any of these transportation carriers could have a material adverse effect on our business, financial condition, results of operations and cash available for distribution to our unitholders.
We are subject to federal, state and local laws and regulations that govern the product quality specifications of the motor fuel that we distribute and sell.
Various federal, state and local agencies have the authority to prescribe specific product quality specifications to the sale of commodities. Changes in product quality specifications, such as reformulated fuels mandates, reduced sulfur content in refined petroleum products or other more stringent requirements for fuels, could reduce our ability to procure product and our sales volume, require us to incur additional handling costs, and/or require the expenditure of capital. If we are unable to procure product or to recover these costs through increased sales, our ability to meet our financial obligations could be adversely affected. Failure to comply with these regulations could result in substantial penalties.
21
Our motor fuel sales in our Wholesale segment are generated under contracts that must be renegotiated or replaced periodically. If we are unable to successfully renegotiate or replace these contracts, then our business, financial condition and results of operations and ability to make distributions to unitholders could be adversely affected.
Our Wholesale segment’s motor fuel sales are generated under contracts that must be periodically renegotiated or replaced. We may be unable to renegotiate or replace these contracts when they expire, and the terms of any renegotiated contracts may not be as favorable as the contracts they replace. Whether these contracts are successfully renegotiated or replaced is often times subject to factors beyond our control. Such factors include fluctuations in motor fuel prices, counterparty ability to pay for or accept the contracted volumes and a competitive marketplace for the services offered by us. If we cannot successfully renegotiate or replace our contracts or must renegotiate or replace them on less favorable terms, sales from these arrangements could decline, which could have a material adverse effect on our business, financial condition, results of operations and cash available for distribution to our unitholders.
Further, we have contracts with certain multi-site lessee dealers, including DMS, that provide for the ability for each party to sever or recapture a certain number of sites from the contract. If sites are severed, we will need to replace the dealer, and it is possible that the agreement with the new dealer may not provide for an equivalent fuel margin and/or rental income stream, which could have a material adverse effect on our business, financial condition, results of operations and cash available for distribution to our unitholders.
We rely on our IT systems and network infrastructure to manage numerous aspects of our business, and a disruption of these systems could adversely affect our business, financial condition and results of operations and reduce our ability to make distributions to unitholders.
We depend on our IT systems and network infrastructure to manage numerous aspects of our business and provide analytical information to management. These systems are an essential component of our business and growth strategies, and a serious disruption to them could significantly limit our ability to manage and operate our business efficiently. These systems are vulnerable to, among other things, damage and interruption from power loss or natural disasters, computer system and network failures, loss of telecommunications services, physical and electronic loss of data, security breaches and computer viruses, which could result in a loss of sensitive business information, systems interruption or the disruption of our business operations. To protect against unauthorized access or attacks, we have implemented infrastructure protection technologies and disaster recovery plans, but there can be no assurance that a technology systems breach or systems failure could not have a material adverse effect on our business, financial condition, results of operations and cash available for distribution to our unitholders.
Our business and our reputation could be adversely affected by the failure to protect sensitive customer, employee or vendor data, whether as a result of cyber security attacks or otherwise, or to comply with applicable regulations relating to data security and privacy.
In the normal course of our business as a motor fuel and merchandise retailer, we obtain large amounts of personal data, including credit and debit card information from our customers. While we have invested significant amounts in the protection of our IT systems and maintain what we believe are adequate security controls over individually identifiable customer, employee and vendor data provided to us, a breakdown or a breach in our systems that results in the unauthorized release of individually identifiable customer or other sensitive data could nonetheless occur.
Cyber attacks are rapidly evolving and becoming increasingly sophisticated. A successful cyber attack resulting in the loss of sensitive customer, employee or vendor data could adversely affect our reputation, results of operations, financial condition and liquidity, and could result in litigation against us or the imposition of penalties. Moreover, a security breach could require that we expend significant additional resources to upgrade further the security measures that we employ to guard against cyber attacks.
Further, complying with continually evolving regulations associated with the protection of credit and debit card information is costly and taking these measures does not necessarily provide an offsetting financial benefit to us. Failure to comply with these regulations could cause us or our dealers to be required to discontinue operating. The cost of compliance and the ramifications of non-compliance could have a material adverse effect on our business, financial condition, results of operations and cash available for distribution to our unitholders.
22
Our debt levels and debt agreement covenants may limit our flexibility in obtaining additional financing and in pursuing other business opportunities.
We have a significant amount of debt. At December 31, 2017, we had $534.0 million of total debt and $37.3 million of availability under the revolving credit facility. Our credit agreement requires, among other things, that we have, after giving effect to any acquisition, at least $20.0 million, in the aggregate, of borrowing availability under the revolving credit facility and unrestricted cash on the balance sheet on the date of such acquisition. Our level of indebtedness could have important consequences to us, including the following:
|
|
• |
our ability to obtain additional financing, if necessary, for working capital, capital expenditures, acquisitions or other purposes may be impaired or such financing may not be available on favorable terms; |
|
|
• |
covenants contained in our credit facility will require us to meet financial tests that may affect our flexibility in planning for and reacting to changes in our business, including possible acquisition opportunities; |
|
|
• |
we will need a substantial portion of our cash flow to make interest payments on our indebtedness, reducing the funds that would otherwise be available for operations, future business opportunities and distributions to unitholders; |
|
|
• |
our debt level will make us more vulnerable than our competitors with less debt to competitive pressures or a downturn in our business or the economy generally; and |
|
|
• |
our debt level may limit our flexibility in responding to changing business and economic conditions. |
Our ability to service our indebtedness will depend upon, among other things, our future financial and operating performance, which will be affected by prevailing economic conditions and financial, business, regulatory and other factors, some of which are beyond our control. If our operating results are not sufficient to service our current or future indebtedness, we will be forced to take actions, such as reducing distributions, reducing or delaying our business activities, acquisitions, investments and/or capital expenditures, selling assets, restructuring or refinancing our indebtedness, or seeking additional equity capital or bankruptcy protection. We may not be able to effect any of these actions on satisfactory terms, or at all.
Our credit facility contains operating and financial restrictions that may limit our business, financing activities and ability to make distributions to unitholders.
The operating and financial restrictions and covenants in our credit facility and any future financing agreements could adversely affect our ability to finance future operations or capital needs or to engage, expand or pursue our business activities. For example, our credit facility may restrict our ability to:
|
|
• |
make distributions if any potential default or event of default occurs; |
|
|
• |
incur additional indebtedness, including the issuance of certain preferred equity interests, or guarantee other indebtedness; |
|
|
• |
grant liens or make certain negative pledges; |
|
|
• |
make certain advances, loans or investments; |
|
|
• |
make any material change to the nature of our business, including mergers, consolidations, liquidations and dissolutions; |
|
|
• |
make certain capital expenditures in excess of specified levels; |
|
|
• |
acquire another company; |
|
|
• |
enter into a sale-leaseback transaction or certain sales or leases of assets; |
|
|
• |
enter into certain affiliate transactions; or |
|
|
• |
make certain repurchases of equity interests. |
Our credit facility will limit our ability to pay distributions upon the occurrence of the following events, among others:
|
|
• |
failure to pay any principal when due or failure to pay any interest, fees or other amounts owing under our credit facility when due, subject to any applicable grace period; |
|
|
• |
failure of any representation or warranty in our credit agreement to be true and correct, and the failure of any representation or warranty in any other agreement delivered in connection with our credit facility to be true and correct in any material respect; |
23
|
|
• |
failure to perform or otherwise comply with the covenants in our credit facility or in other loan documents beyond the applicable notice and grace period; |
|
|
• |
any default in the performance of any obligation or condition beyond the applicable grace period relating to any other indebtedness of more than $7.5 million; |
|
|
• |
failure of the lenders to have a perfected first priority security interest in the collateral pledged by any loan party; |
|
|
• |
the entry of one or more judgments in excess of $20.0 million, to the extent any payments pursuant to the judgment are not covered by insurance; |
|
|
• |
a change in ownership control of us or our General Partner; |
|
|
• |
a violation of the Employee Retirement Income Security Act of 1974, or “ERISA”; and |
|
|
• |
a bankruptcy or insolvency event involving us or any of our subsidiaries. |
Our ability to comply with the covenants and restrictions contained in our credit facility may be affected by events beyond our control, including prevailing economic, financial and industry conditions. If market or other economic conditions deteriorate, our ability to comply with these covenants may be impaired. If we violate any of the restrictions, covenants, ratios or tests in our credit facility, the debt issued under the credit facility may become immediately due and payable, and our lenders’ commitment to make further loans to us may terminate. We might not have, or be able to obtain, sufficient funds to make these accelerated payments. In addition, our obligations under our credit facility will be secured by substantially all of our assets, and if we are unable to repay our indebtedness under our credit facility, the lenders could seek to foreclose on such assets.
We may not be able to lease sites we own or sub-lease sites we lease on favorable terms and any such failure could adversely affect our business, financial condition and results of operations and reduce our ability to make distributions to unitholders.
We may lease and/or sub-lease certain sites to lessee dealers, commission agents, Circle K or to DMS where the rent expense is more than the lease payments. If we are unable to obtain tenants on favorable terms for sites we own or lease, the lease payments we receive may not be adequate to cover our rent expense for leased sites and may not be adequate to ensure that we meet our debt service requirements. We cannot provide any assurance that the margins on our wholesale distribution of motor fuels to these sites will be adequate to off-set unfavorable lease terms. The occurrence of these events could have a material adverse effect on our business, financial condition, results of operations and cash available for distribution to our unitholders.
The operations at sites we own or lease are subject to inherent risk, operational hazards and unforeseen interruptions and insurance may not adequately cover any such exposure. The occurrence of a significant event or release that is not fully insured could adversely affect our business, financial condition and results of operations and reduce our ability to make distributions to unitholders.
The presence of flammable and combustible products at our sites provides the potential for fires and explosions that could destroy both property and human life. Furthermore, our operations are subject to unforeseen interruptions such as natural disasters, adverse weather and other events beyond our control. Motor fuels also have the potential to cause environmental damage if improperly handled or released. If any of these events were to occur, we could incur substantial losses and/or curtailment of related operations because of personal injury or loss of life, severe damage to and destruction of property and equipment, and pollution or other environmental damage.
We are not fully insured against all risks incident to our business. We may be unable to maintain or obtain insurance of the type and amount we desire at reasonable rates. As a result of market conditions, premiums and deductibles for certain of our insurance policies have increased and could escalate further. In some instances, certain insurance could become unavailable or available only for reduced amounts of coverage. If we were to incur a significant liability for which we were not fully insured, it could have a material adverse effect on our business, financial condition, results of operations and cash available for distribution to our unitholders.
24
We are relying on DMI to indemnify us for any costs or expenses that we incur for environmental liabilities and third-party claims, regardless of when a claim is made, that are based on environmental conditions in existence prior to the closing of the IPO at our Predecessor’s sites. To the extent escrow accounts, insurance and/or payments from DMI are not sufficient to cover any such costs or expenses, our business, financial condition and results of operations and ability to make distributions to unitholders could be adversely affected.
The Amended Omnibus Agreement provides that DMI must indemnify us for any costs or expenses that we incur for environmental liabilities and third-party claims, regardless of when a claim is made, that are based on environmental conditions in existence prior to the closing of the IPO at our Predecessor’s sites. DMI is the beneficiary of escrow accounts created to cover the cost to remediate certain environmental liabilities. In addition, DMI maintains insurance policies to cover environmental liabilities and/or, where available, participates in state programs that may also assist in funding the costs of environmental liabilities. There are certain sites that were acquired by us in connection with the IPO with existing environmental liabilities that are not covered by escrow accounts, state funds or insurance policies. As of December 31, 2017, DMI had an aggregate of approximately $1.7 million of environmental liabilities on sites acquired by us that are not covered by escrow accounts, state funds or insurance policies. To the extent escrow accounts, insurance and/or payments from DMI are not sufficient to cover any such costs or expenses, our business, liquidity and results of operations could be adversely affected.
Risks Inherent in an Investment in Us
Couche-Tard controls us and may have conflicts of interest with us.
Couche-Tard controls and manages the operations and activities of the Partnership, including the election of our Board; decisions regarding mergers, consolidations or acquisitions, the sale of all or substantially all of our assets and other matters affecting our capital structure; and other significant decisions that could impact our financial results and the amount of cash available for distribution to our unitholders. In addition, Couche-Tard may compete directly with us for future acquisitions, which may conflict with our core strategy to grow our business and increase distributions to unitholders. As long as Couche-Tard owns all of the membership interests in the sole member of our General Partner, it will effectively control our decisions, operations and activities.
Couche-Tard owns all of the membership interests in the sole member of our General Partner, which has sole responsibility for conducting our business and managing our operations. Our General Partner and its affiliates, including Couche-Tard, have conflicts of interest with us and limited fiduciary duties and they may favor their own interests to the detriment of us and our unitholders.
Couche-Tard owns the sole member of and controls our General Partner and has the ability to appoint all of the directors of our Board. Although our General Partner has a legal duty to manage us in good faith, the General Partner and its executive officers (as employees of affiliates of Couche-Tard) have a fiduciary duty to manage our General Partner in a manner beneficial to its owner, Couche-Tard. Furthermore, certain officers of our General Partner are directors of our Board or officers of affiliates of our General Partner. Therefore, conflicts of interest may arise between us and our unitholders, on the one hand, and our General Partner and its affiliates, including Couche-Tard, on the other hand. In resolving these conflicts of interest, under the Partnership Agreement, our General Partner may favor its own interests and the interests of Couche-Tard over our interests and the interests of our common unitholders. These conflicts include the following situations, among others:
|
|
• |
our General Partner is allowed to take into account the interests of parties other than us, such as Couche-Tard, in resolving conflicts of interest, which has the effect of limiting its fiduciary duty to our unitholders; |
|
|
• |
neither our Partnership Agreement nor any other agreement requires Couche-Tard to pursue a business strategy that favors us; |
|
|
• |
officers of our General Partner who provide services to us may devote time to affiliates of our General Partner and may be compensated for services rendered to such affiliate; |
|
|
• |
our Partnership Agreement limits the liability of and reduces fiduciary duties owed by our General Partner and also restricts the remedies available to unitholders for actions that, without the limitations, might constitute breaches of fiduciary duty; |
|
|
• |
except in limited circumstances, our General Partner has the power and authority to conduct our business without unitholder approval; |
|
|
• |
our General Partner determines the amount and timing of asset purchases and sales, borrowings, issuances of additional partnership securities and the creation, reductions or increases of cash reserves, each of which can affect the amount of cash that is available for distribution to our unitholders, and to the holders of the IDRs; |
25
|
|
• |
our General Partner may cause us to borrow funds in order to permit the payment of cash distributions, even if the purpose or effect of the borrowing is to make incentive distributions; |
|
|
• |
our Partnership Agreement permits us to distribute up to $15 million as operating surplus, even if it is generated from asset sales, non-working capital borrowings or other sources that would otherwise constitute capital surplus. This cash may be used to fund distributions on the IDRs; |
|
|
• |
our Partnership Agreement does not restrict our General Partner from causing us to pay it or its affiliates for any services rendered to us or entering into additional contractual arrangements with its affiliates on our behalf; |
|
|
• |
our General Partner intends to limit its liability regarding our contractual and other obligations; |
|
|
• |
our General Partner may exercise its right to call and purchase our common units if it and its affiliates own more than 80% of our common units; |
|
|
• |
our General Partner controls the enforcement of obligations that it and its affiliates owe to us; |
|
|
• |
our General Partner decides whether to retain separate counsel, accountants or others to perform services for us; |
|
|
• |
the holders of our IDRs may transfer their IDRs without unitholder approval; and |
|
|
• |
our General Partner may elect to cause us to issue common units to the holders of our IDRs in connection with a reset of the target distribution levels related to the IDRs without the approval of the independent conflicts committee of the Board or the unitholders. This election may result in lower distributions to the common unitholders in certain situations. |
Couche-Tard or the Board may modify or revoke our cash distribution policy at any time at their discretion. Our Partnership Agreement does not require us to pay any distributions at all.
The Board has adopted a cash distribution policy pursuant to which we intend to distribute quarterly an amount at least equal to the minimum quarterly distribution of $0.4375 per unit on all of our units to the extent we have sufficient cash from our operations after the establishment of reserves and the payment of our expenses. However, Couche-Tard, as the owner of our General Partner, or the Board may change such policy at any time at their discretion and could elect not to pay distributions for one or more quarters. In addition, our credit facility includes specified restrictions on our ability to make distributions.
Our Partnership Agreement does not require us to pay any distributions at all. Accordingly, investors are cautioned not to place undue reliance on the permanence of our distribution policy in making an investment decision. Any modification or revocation of our cash distribution policy could substantially reduce or eliminate the amounts of distributions to our unitholders. The amount of distributions we make, if any, and the decision to make any distribution at all will be determined by Couche-Tard as the owner of all of the membership interests in the sole member of our General Partner, whose interests may differ from those of our common unitholders.
We rely on the employees of Couche-Tard to provide key management services to our business pursuant to the Amended Omnibus Agreement. If our Amended Omnibus Agreement were to be terminated, we may not be able to find suitable replacements to perform such services for us without interruption to our business or increased costs.
Under our Amended Omnibus Agreement, Couche-Tard provides us with the personnel necessary to support our management, administrative and operating services, including accounting, tax, legal, internal audit, risk management and compliance, environmental compliance and remediation management oversight, treasury, information technology and other administrative functions, as well as the management and operation of our wholesale distribution and retail business. If our Amended Omnibus Agreement is terminated, we may suffer interruptions to our business or increased costs to replace these services.
26
Distributions with respect to our 17.5% interest in CST Fuel Supply are at the discretion of Couche-Tard.
Couche-Tard controls the general partner of CST Fuel Supply and its wholly owned subsidiary, CST Marketing and Supply. The Partnership owns a 17.5% limited partner interest in CST Fuel Supply and derives substantial economic benefit from distributions made by CST Fuel Supply; however, there is no contractual obligation on Couche-Tard to cause CST Fuel Supply to make distributions, and the decisions as to timing and amount of any distributions are controlled by Couche-Tard. Any decrease in the distributions from CST Fuel Supply with respect to our interest could have a material adverse effect on our business, financial condition, results of operations and cash available for distribution to our unitholders.
The liability of DMI and Couche-Tard is limited under our Amended Omnibus Agreement and we have agreed to indemnify DMI and Couche-Tard against certain liabilities, which may expose us to significant expenses.
The Amended Omnibus Agreement provides that we must indemnify DMI and Couche-Tard for certain liabilities, including any liabilities incurred by Couche-Tard attributable to the operating and administrative services provided to us under the agreement, other than liabilities resulting from DMI’s or Couche-Tard’s bad faith, fraud, or willful misconduct, as applicable.
Our General Partner has and intends to limit its liability regarding our obligations.
Our General Partner has and intends to limit its liability under contractual arrangements between us and third parties so that the counterparties to such arrangements have recourse only against our assets, and not against our General Partner or its assets. Our General Partner may therefore cause us to incur indebtedness or other obligations that are nonrecourse to our General Partner. Our Partnership Agreement provides that any action taken by our General Partner to limit its liability is not a breach of our General Partner’s fiduciary duties, even if we could have obtained more favorable terms without the limitation on liability. In addition, we are obligated to reimburse or indemnify our General Partner to the extent that it incurs obligations on our behalf. Any such reimbursement or indemnification payments would reduce the amount of cash otherwise available for distribution to our unitholders.
If we distribute a significant portion of our cash available for distribution to our partners, our ability to grow and make acquisitions could be limited.
We may determine to distribute a significant portion of our cash available for distribution to our unitholders. In addition, we expect to rely primarily upon external financing sources, including commercial bank borrowings and the issuance of debt and equity securities, to fund our acquisitions and expansion capital expenditures. To the extent we are unable to finance growth externally, distributing a significant portion of our cash available for distribution may impair our ability to grow.
In addition, if we distribute a significant portion of our cash available for distribution, our growth may lag behind the growth of businesses that reinvest all of their cash to expand ongoing operations. To the extent we issue additional units in connection with any acquisitions or expansion capital expenditures, the payment of distributions on those additional units may increase the risk that we will be unable to maintain or increase our per unit distribution level. There are no limitations in our Partnership Agreement or our credit facility on our ability to issue additional units, provided there is no default under the credit facility. The incurrence of additional commercial borrowings or other debt to finance our growth strategy would result in increased interest expense, which, in turn, may impact the cash available for distribution to our unitholders.
Our Partnership Agreement replaces, eliminates and modifies, as applicable, the duties, including the fiduciary duties, of our General Partner, the Board or any committee thereof, and modifies the burden of proof in any action brought against the General Partner, the Board or any committee thereof.
Our Partnership Agreement contains provisions that modify the duties of the General Partner, including the fiduciary duties of the General Partner, and restricts the remedies available to unitholders for actions taken by our General Partner that might otherwise constitute breaches of fiduciary duty under Delaware partnership law. For example, our Partnership Agreement:
|
|
• |
provides that whenever our General Partner, the Board or any committee of the Board makes a determination or takes, or declines to take, any other action in its capacity as the general partner of the Partnership, our General Partner is required to make such determination, or take or decline to take such other action, in good faith, and will not be subject to any higher standard under any Delaware Act, or any other law, rule or regulation, or at equity; |
|
|
• |
provides that any determination, act or failure to act by our General Partner will be deemed in good faith unless such party believed such determination, other action or failure to act, given the totality of the circumstance, was adverse to the interests of the Partnership; |
27
|
|
determination or failure to act, the Person bringing or prosecuting such proceeding shall have the burden of proving that such determination, action or failure to act was not in good faith; |
|
|
• |
provides that whenever the General Partner makes a determination or takes or declines to take any other action in its individual capacity as opposed to in its capacity as the general partner of the Partnership, whether under the Partnership Agreement or any other agreement contemplated thereby, then the General Partner, or any affiliate thereof, are entitled to the fullest extent permitted by law, to make such determination or to take or decline to take such other action free of any fiduciary duty, duty of good faith, obligation imposed by Delaware Act, law, rule or in equity to the Partnership, any limited partner or any Person who acquires an interest in a Partnership interest or any other Person who is bound by the Partnership Agreement. Examples of decisions that our General Partner may make in its individual capacity include: |
|
|
• |
how to allocate business opportunities among us and its affiliates; |
|
|
• |
whether to exercise its call right; |
|
|
• |
whether to elect to reset target distribution levels; and |
|
|
• |
whether or not to consent to any merger or consolidation of the Partnership or amendment to the Partnership Agreement. |
|
|
• |
provides that our General Partner and its officers and directors will not be liable for monetary damages to the Partnership or our limited partners resulting from any act or omission unless there has been a final and non-appealable judgment entered by a court of competent jurisdiction determining that our General Partner or its officers and directors, as the case may be, acted in bad faith or, in the case of a criminal matter, acted with knowledge that the conduct was criminal; |
|
|
• |
provides that the General Partner may consult with legal counsel, accountants, appraisers, management consultants, investment bankers and other consultants and advisers selected by it, and any act taken or omitted in reliance upon the advice or opinion (including an opinion of counsel) of such persons as to matters that the General Partner reasonably believes to be within such person’s professional or expert competence shall be conclusively presumed to have been done or omitted in good faith and in accordance with such advice or opinion; and |
|
|
• |
provides that our General Partner will not be in breach of its obligations under the Partnership Agreement or its fiduciary duties to us or our limited partners if a transaction with an affiliate or the resolution of a conflict of interest is: |
|
|
• |
approved by the independent conflicts committee of the Board, although our General Partner is not obligated to seek such approval; or |
|
|
• |
approved by the vote of a majority of the outstanding common units, excluding any common units owned by our General Partner and its affiliates. |
By purchasing a common unit, a unitholder is treated as having consented to the provisions in the Partnership Agreement, including the provisions discussed above.
Our General Partner’s affiliates, including Couche-Tard, may compete with us.
Our Partnership Agreement provides that our General Partner will be restricted from engaging in any business activities other than acting as our General Partner and those activities incidental to its ownership interest in us. Except as provided in the Amended Omnibus Agreement, affiliates of our General Partner are not prohibited from engaging in other businesses or activities, including those that might be in direct competition with us.
28
Pursuant to the terms of our Partnership Agreement, the doctrine of corporate opportunity, or any analogous doctrine, does not apply to our General Partner, Couche-Tard or any of their affiliates, including their executive officers and directors. Any such person or entity that becomes aware of a potential transaction, agreement, arrangement or other matter that may be an opportunity for us will not have any duty to communicate or offer such opportunity to us. Any such person or entity will not be liable to us or to any limited partner for breach of any fiduciary duty or other duty by reason of the fact that such person or entity pursues or acquires such opportunity for itself, directs such opportunity to another person or entity or does not communicate such opportunity or information to us. This may create actual and potential conflicts of interest between us and affiliates of our General Partner and result in less than favorable treatment of us and our unitholders. Conflicts of interest may arise in the future between us and our unitholders, on the one hand, and the affiliates of our General Partner and Couche-Tard, on the other hand. In resolving these conflicts, Couche-Tard may favor its own interests over the interests of our unitholders.
Couche-Tard, as the holder of our IDRs, may elect to cause us to issue common units to the holders of our IDRs in connection with a resetting of the target distribution levels related to the IDRs, without the approval of the independent conflicts committee of the Board or the holders of our common units. This could result in lower distributions to holders of our common units.
Under the Partnership Agreement, the holders of our IDRs have the right, at any time when the holders of our IDRs have received incentive distributions at the highest level to which they are entitled (50%) for each of the prior four consecutive fiscal quarters, to reset the initial target distribution levels at higher levels based on our distributions at the time of the exercise of the reset election. Following such a reset election, the minimum quarterly distribution will be adjusted to equal the reset minimum quarterly distribution and the target distribution levels will be reset to correspondingly higher levels based on percentage increases above the reset minimum quarterly distribution.
If the holder of our IDRs elects to reset the target distribution levels, it will be entitled to receive a number of common units. The number of common units to be issued to the holder of our IDRs will equal the number of common units that would have entitled the holder of our IDRs to an aggregate quarterly cash distribution in the prior quarter equal to the distributions to the holder of our IDRs on the IDRs in the prior quarter. It is possible that the holder of our IDRs could exercise this reset election at a time when it is experiencing, or expects to experience, declines in the cash distributions that the holder of our IDRs receives related to the IDRs and may, therefore, desire to be issued common units rather than retain the right to receive IDRs based on the initial target distribution levels. This risk could be elevated if our IDRs are transferred to another party. As a result, a reset election may cause our common unitholders to experience a reduction in the amount of cash distributions that our common unitholders would have otherwise received had we not issued new common units to the holder of our IDRs in connection with resetting the target distribution levels.
Holders of our common units have limited voting rights and are not entitled to elect our General Partner or the directors of the Board, which could reduce the price at which the common units will trade.
Unlike the holders of common stock in a corporation, unitholders have only limited voting rights on matters affecting our business and, therefore, limited ability to influence management’s decisions regarding our business. Unitholders will have no right on an annual or ongoing basis to elect the members of our Board. The Board, including the independent directors, is chosen entirely by Couche-Tard, as a result of its ownership of all the membership interests in the sole member of our General Partner, and not by our unitholders. Unlike publicly traded corporations, we will not conduct annual meetings of our unitholders to elect directors or conduct other matters routinely conducted at annual meetings of stockholders of corporations. As a result of these limitations, the price at which the common units will trade could be diminished because of the absence or reduction of a takeover premium in the trading price.
Even if holders of our common units are dissatisfied, they may not be able to remove our General Partner.
If our unitholders are dissatisfied with the performance of our General Partner, they will have limited ability to remove our General Partner. The vote of the holders of at least 66 2⁄3% of all outstanding common units voting together as a single class is required to remove our General Partner. As of February 21, 2018, Circle K owned approximately 21.1% of our outstanding common units and the Topper Group, including DMI, owned approximately 22.4% of our outstanding common units. Pursuant to a voting agreement, dated October 1, 2014, the Topper Group agreed to vote such units in accordance with the recommendation of the Board, allowing Couche-Tard to effectively block the removal of the General Partner. The voting agreement will remain in effect so long as Mr. Topper is the beneficial owner of 10% or more of the outstanding common units of the Partnership.
29
Our General Partner interest or the control of our General Partner may be transferred to a third party without unitholder consent.
Our General Partner may transfer its General Partner interest to a third party in a merger or in a sale of all or substantially all of its assets without the consent of our unitholders. Furthermore, our Partnership Agreement does not restrict the ability of the members of our General Partner to transfer its membership interests in the sole member of our General Partner to a third party. The new members of our General Partner would then be in a position to replace the Board and executive officers of our General Partner with their own designees and thereby exert significant control over the decisions taken by the Board and executive officers of our General Partner. This effectively permits a “change of control” without the vote or consent of the unitholders.
Our General Partner has a call right that may require unitholders to sell their common units at an undesirable time or price.
If at any time our General Partner and its affiliates hold more than 80% of the common units, our General Partner will have the right, but not the obligation, which it may assign to any of its affiliates or to us, to acquire all, but not less than all, of the common units held by unaffiliated persons at a price equal to the greater of (1) the average of the daily closing price of the common units over the 20 trading days preceding the date three days before notice of exercise of the call right is first mailed and (2) the highest per-unit price paid by our General Partner or any of its affiliates for common units during the 90-day period preceding the date such notice is first mailed. As a result, unitholders may be required to sell their common units at an undesirable time or price and may not receive any return or a negative return on their investment. Unitholders may also incur a tax liability upon a sale of their units. Our General Partner is not obligated to obtain a fairness opinion regarding the value of the common units to be repurchased by it upon exercise of the call right. There is no restriction in our Partnership Agreement that prevents our General Partner from issuing additional common units and exercising its call right. If our General Partner exercised its call right, the effect would be to take us private and, if the units were subsequently deregistered, we would no longer be subject to the reporting requirements of the Exchange Act. As of December 31, 2017, Circle K owned approximately 21.1% of our outstanding common units.
The market price of our common units could be adversely affected by sales of substantial amounts of our common units in the public or private markets, including sales by the Topper Group, DMI or other large holders.
As of February 21, 2018, we had 34,111,461 common units outstanding. Sales by the Topper Group, DMI or other large holders such as Couche-Tard, of a substantial number of our common units in the public markets, or the perception that such sales might occur, could have a material adverse effect on the price of our common units or could impair our ability to obtain capital through an offering of equity securities. In addition, we have agreed to provide registration rights to the Topper Group, including DMI. Under our Partnership Agreement and pursuant to a registration rights agreement that we have entered into, the Topper Group and DMI have registration rights relating to the offer and sale of any units that they hold, subject to certain limitations.
We may issue unlimited additional units without unitholder approval, which would dilute existing unitholder ownership interests.
Our Partnership Agreement does not limit the number of additional limited partner interests, including limited partner interests that rank senior to the common units that we may issue at any time without the approval of our unitholders. The issuance of additional common units or other equity interests of equal or senior rank could have the following effects:
|
|
• |
our existing unitholders’ proportionate ownership interest in us will decrease; |
|
|
• |
the amount of cash available for distribution on each unit may decrease; |
|
|
• |
the risk that a shortfall in the payment of the minimum quarterly distribution will be borne by our common unitholders will increase; |
|
|
• |
the ratio of taxable income to distributions may increase; |
|
|
• |
the relative voting strength of each previously outstanding unit may be diminished; |
|
|
• |
the claims of the common unitholders to our assets in the event of our liquidation may be subordinated; and |
|
|
• |
the market price of our common units may decline. |
30
Our General Partner’s discretion in establishing cash reserves may reduce the amount of cash available for distribution to unitholders.
The Partnership Agreement requires our General Partner to deduct from operating surplus cash reserves that it determines are necessary to fund our future operating expenditures. The General Partner may reduce cash available for distribution by establishing cash reserves for the proper conduct of our business, to comply with applicable law or agreements to which we are a party or to provide funds for future distributions to partners. These cash reserves will affect the amount of cash available for distribution to unitholders.
Our Partnership Agreement restricts the voting rights of unitholders owning 20% or more of our common units.
Our Partnership Agreement restricts unitholders’ voting rights by providing that any units held by a person or group that owns 20% or more of any class of units then outstanding, other than our General Partner and its affiliates, their transferees and persons who acquired such units with the prior approval of the Board, cannot vote on any matter.
Management fees and cost reimbursements due to our General Partner and Couche-Tard for services provided to us or on our behalf will reduce cash available for distribution to our unitholders. The amount and timing of such reimbursements will be determined by our General Partner.
Prior to making any distribution on our common units, we will pay Couche-Tard the management fee and reimburse our General Partner and Couche-Tard for all out-of-pocket third-party expenses they incur and payments they make on our behalf, pursuant to the Amended Omnibus Agreement. Our Partnership Agreement provides that our General Partner will determine in good faith the expenses that are allocable to us. In addition, pursuant to the Amended Omnibus Agreement, Couche-Tard will be entitled to reimbursement for certain expenses that they incur on our behalf. Our Partnership Agreement does not limit the amount of expenses for which our General Partner and Couche-Tard may be reimbursed. The reimbursement of expenses and payment of fees, if any, to our General Partner and Couche-Tard will reduce the amount of cash available to pay distributions to our unitholders.
Unitholders may have liability to repay distributions and in certain circumstances may be personally liable for the obligations of the partnership.
Under certain circumstances, unitholders may have to repay amounts wrongfully returned or distributed to them. Under Section 17-607 of the Delaware Revised Uniform Limited Partnership Act (the “Delaware Act”), we may not make a distribution to our unitholders if the distribution would cause our liabilities to exceed the fair value of our assets. Delaware law provides that for a period of three years from the date of the impermissible distribution, limited partners who received the distribution and who knew at the time of the distribution that it violated Delaware law will be liable to the limited partnership for the distribution amount. Liabilities to partners on account of their partnership interests and liabilities that are non-recourse to the partnership are not counted for purposes of determining whether a distribution is permitted.
It may be determined that the right, or the exercise of the right by the limited partners as a group, to (i) remove or replace our General Partner, (ii) approve some amendments to our Partnership Agreement or (iii) take other action under our Partnership Agreement constitutes “participation in the control” of our business. A limited partner that participates in the control of our business within the meaning of the Delaware Act may be held personally liable for our obligations under the laws of Delaware, to the same extent as our General Partner. This liability would extend to persons who transact business with us under the reasonable belief that the limited partner is a General Partner. Neither our Partnership Agreement nor the Delaware Act specifically provides for legal recourse against our General Partner if a limited partner were to lose limited liability through any fault of our General Partner.
The NYSE does not require a publicly traded partnership like us to comply with certain of its corporate governance requirements.
Our common units are listed on the NYSE. Because we are a publicly traded partnership, the NYSE does not require us to have a majority of independent directors on our Board. Additionally, the NYSE does not require us as a publicly traded partnership to maintain a compensation committee or a nominating and corporate governance committee.
Accordingly, unitholders will not have the same protections afforded to corporations (other than “controlled companies”) that are subject to all of the NYSE corporate governance requirements.
31
An increase in interest rates may cause the market price of our common units to decline and a significant increase in interest rates could adversely affect our ability to service our indebtedness.
Like all equity investments, an investment in our common units is subject to certain risks. Borrowings under the credit facility will bear interest at variable rates. If market interest rates increase, such variable-rate debt will create higher debt service requirements, which could adversely affect our cash flow and ability to make cash distributions. In exchange for accepting these risks, investors may expect to receive a higher rate of return than would otherwise be obtainable from lower-risk investments. Accordingly, as interest rates rise, the ability of investors to obtain higher risk-adjusted rates of return by purchasing government-backed debt securities may cause a corresponding decline in demand for riskier investments generally, including yield-based equity investments such as publicly traded limited partnership interests. Reduced demand for our common units resulting from investors seeking other more favorable investment opportunities may cause the trading price of our common units to decline.
The interest rate on our credit facility is variable; therefore, we have exposure to movements in interest rates. A significant increase in interest rates could adversely affect our ability to service our indebtedness. The increased cost could make the financing of our business activities more expensive. These added expenses could have an adverse effect on our financial condition, results of operations and cash available for distribution to our unitholders.
Tax Risks
Our tax treatment depends in large part on our status as a partnership for U.S. federal income tax purposes and our otherwise not being subject to a material amount of U.S. federal, state and local income or franchise tax. If the IRS were to treat us as a corporation for U.S. federal income tax purposes or if we were to otherwise be subject to a material amount of additional entity level income, franchise or other taxation for U.S. federal, state or local tax purposes, then our cash available for distribution to our unitholders would be substantially reduced.
The anticipated after-tax benefit of an investment in our common units depends largely on our being treated as a partnership for U.S. federal income tax purposes. First, a partnership is exempt from U.S. federal income tax, and the partnership’s income is instead allocated to the partners for inclusion on their tax returns. Second, under the Tax Cuts and Jobs Act, the partner may also deduct from the partnership’s taxable income allocable to such partner an amount equal to 20% of such qualified business income (subject to certain limits), resulting in a lower effective tax rate for the partner with respect to the partnership’s income. A publicly traded partnership, such as us, may be treated as a corporation, instead of being treated as a partnership, for U.S. federal income tax purposes unless 90% or more of its gross income for every taxable year it is publicly traded consists of qualifying income. Based on our current operations we believe that we will be able to satisfy this requirement and, thus, be able to be treated as a partnership, rather than a corporation, for U.S. federal income tax purposes. However, a change in our business, or a change in current law, could also cause us to be treated as a corporation for U.S. federal income tax purposes or otherwise subject us to entity-level taxation.
If we were required to be treated as a corporation for U.S. federal income tax purposes or otherwise subject to entity-level taxation, then we would pay U.S. federal income tax on our taxable income at the corporate tax rate which, under current law, is 21%. We would also likely pay state and local income tax at varying rates. Distributions to our unitholders would generally be taxed again as either a dividend (to the extent of our current and accumulated earnings and profits) and/or as taxable gain after recovery of a unitholder’s U.S. federal income tax basis in their units, and no income, gains, losses, deductions or credits would flow through to our unitholders. Because a U.S. federal income tax would be imposed upon us as a corporation, our cash available for distribution to our unitholders would be substantially reduced. Thus, treatment of us as a corporation would result in a material reduction in the anticipated cash flow and after-tax return to our unitholders, likely causing a substantial reduction in the value of our common units.
At the state level, were we to be subject to federal income tax, we would also be subject to the income tax provisions of many states. Moreover, because of widespread state budget deficits and other reasons, several states are evaluating ways to independently subject partnerships to entity-level taxation through the imposition of state income taxes, franchise taxes and other forms of taxation. Imposition of any additional such taxes on us or an increase in the existing tax rates would reduce the cash available for distribution to our unitholders.
Our Partnership Agreement provides that if a law is enacted or existing law is modified or interpreted in a manner that results in us becoming subject to either: (a) entity-level taxation for U.S. federal, state, local and/or foreign income and/or withholding tax purposes to which we were not subject prior to such enactment, modification or interpretation, and/or (b) an increased amount of one or more of such taxes (including as a result of an increase in tax rates), then the minimum quarterly distribution amounts and the target distribution amounts may be adjusted (i.e., reduced) to reflect the impact of that law on us.
32
We have subsidiaries that are treated as corporations for U.S. federal income tax purposes and are subject to entity-level U.S. federal, state and local income and franchise tax.
We conduct a portion of our operations and business through one or more direct and indirect subsidiaries that are treated as corporations for federal income tax purposes (including LGWS). We may elect to conduct additional operations through these corporate subsidiaries in the future. These corporate subsidiaries are subject to corporate-level taxes, which reduce the cash available for distribution to us and, in turn, to unitholders. If the IRS were to successfully assert that these corporations have more tax liability than we anticipate or legislation were enacted that increased the corporate tax rate, our cash available for distribution to unit holders would be further reduced.
A significant amount of our income is attributable to our leasing of real property to DMS. If DMS were to become related to us for U.S. federal income tax purposes, the real property rents that we receive from DMS would no longer constitute qualifying income and we would likely be treated as a corporation for U.S. federal income tax purposes.
A significant amount of our qualifying income is composed of real property rents from DMS attributable to the sites that DMS leases from us. In general, any real property rents that we receive from a tenant or sub-tenant of ours in which we, directly or indirectly, own or are treated as owning by reason of the application of certain constructive ownership rules: (a) at least 10% of such tenant’s or sub-tenant’s stock (voting power or value) in the case where such tenant or sub-tenant is a corporation for U.S. federal income tax purposes, or (b) an interest of at least 10% of such tenant’s or sub-tenant’s assets or net profits in the case where such tenant or sub-tenant is not a corporation for U.S. federal income tax purposes (as would be the case with respect to DMS), would not constitute qualifying income. After applying certain constructive ownership rules, we will be treated as owning the 5% interest in the assets and net profits of DMS that Joseph V. Topper, Jr. actually and constructively owns. If we were considered to directly or indirectly own an interest of 10% or more of the assets or net profits of DMS, then the real property rents that we receive from DMS would no longer constitute qualifying income in which case, based on our current operations, we would likely no longer qualify to be treated as a “partnership” (and instead would be treated as a corporation) for U.S. federal income tax purposes.
Our and DMS’ governing documents contain transfer restrictions designed to prevent us from being treated as directly or indirectly owning by reason of the application of constructive ownership rules an interest of 10% or more of DMS’ assets or net profits. We received an opinion of counsel at the closing of the IPO that transfer restrictions are generally enforceable under Delaware law, but a court could determine that these restrictions are inapplicable or unenforceable.
The tax treatment of publicly traded partnerships or an investment in our common units could be subject to potential legislative, judicial or administrative changes and differing interpretations, possibly on a retroactive basis.
The present U.S. federal income tax treatment of publicly traded partnerships, including us, or of an investment in our common units may be modified by administrative, legislative or judicial changes or differing interpretations at any time. For example, from time to time, members of Congress propose and consider such substantive changes to the existing federal income tax laws that affect publicly traded partnerships. If successful, these proposals or other similar proposals could eliminate the qualifying income exception upon which we rely for our treatment as a partnership for U.S. federal income tax purposes.
Any modification to the U.S. federal income tax laws may be applied retroactively and could make it more difficult or impossible for us to be treated as a partnership for U.S. federal income tax purposes. We are unable to predict whether any of these changes or other proposals will ultimately be enacted. Any such changes could negatively impact the value of an investment in our common units.
If the IRS contests the U.S. federal income tax positions we take, the market for our common units may be adversely impacted and the costs of any contest will reduce our cash available for distribution to our unitholders. We have not requested any ruling from the IRS with respect to our treatment as a partnership for U.S. federal income tax purposes or any other U.S. federal income tax matter affecting us. The IRS may adopt positions that differ from the positions we take. It may be necessary to resort to administrative or court proceedings to sustain some or all of the positions we take. A court may not agree with some or all of the positions we take. Any contest with the IRS may materially and adversely impact the market for our common units and the price at which they trade. In addition, the costs of any contest with the IRS, which will be borne indirectly by our unitholders and our General Partner, will result in a reduction in cash available for distribution.
33
Our unitholders are required to pay taxes on their share of income from us even if they do not receive any cash distributions from us.
Our unitholders are required to pay U.S. federal income taxes and, in some cases, state and local taxes, on their allocable share of our taxable income and gain even if they do not receive any cash distributions from us. Our unitholders may not receive cash distributions from us equal to their share of our taxable income or even equal to the actual tax due with respect to that income.
Tax gain or loss on the disposition of our common units could be more or less than expected.
If a unitholder sells common units, the unitholder will recognize a gain or loss equal to the difference between the amount realized and that unitholder’s tax basis in those common units. Distributions per common unit in excess of a unitholder’s allocable share of our net taxable income result in a decrease in that unitholder’s tax basis in its common units. The amount of this decreased tax basis, with respect to the units sold will, in effect, become taxable income to that unitholder, if that unitholder sells such units at a price greater than that unitholder’s tax basis in those units, even if the sales price received is less than the original cost. Furthermore, a substantial portion of the amount realized, whether or not representing gain, may be taxed as ordinary income due to potential recapture of depreciation and amortization deductions and certain other items. In addition, because the amount realized includes a unitholder’s share of our non-recourse liabilities, if a unitholder sells units, that unitholder may incur a tax liability in excess of the amount of cash received from the sale.
Tax-exempt organizations and non-U.S. persons face unique tax issues from owning common units that may result in adverse tax consequences to them.
Investment in our common units by an organization that is exempt from U.S. federal income tax, such as employee benefit plans, individual retirement accounts and non-U.S. persons raises issues unique to them. For example, a substantial amount of our U.S. federal taxable income and gain constitute gross income from an unrelated trade or business and the amount thereof allocable to a tax-exempt organization would be taxable to such organization as unrelated business taxable income. Distributions to a non-U.S. person that holds our common units will be reduced by U.S. federal withholding taxes imposed at the highest applicable U.S. federal income tax rate and such non-U.S. person will be required to file U.S. federal income tax returns and pay U.S. federal income tax, to the extent not previously withheld, on his, her or its allocable share of our taxable income and gain. Any tax-exempt organization or a non-U.S. person should consult its tax advisor before investing in our common units.
Our unitholders are subject to state and local income taxes and return filing requirements in states and localities where they do not live as a result of investing in our common units.
In addition to U.S. federal income taxes, our unitholders will likely be subject to other taxes, such as state and local income taxes, unincorporated business taxes and estate, inheritance or intangible taxes that are imposed by the various jurisdictions in which we do business or own property, even if they do not live in any of those jurisdictions. Our unitholders will likely be required to file state and local income tax returns and pay state and local income taxes in some or all of these various jurisdictions. Further, our unitholders may be subject to penalties for failure to comply with those requirements. We currently conduct business in Alabama, Arizona, Arkansas, Colorado, Delaware, Florida, Georgia, Illinois, Indiana, Kentucky, Louisiana, Maine, Maryland, Massachusetts, Michigan, Minnesota, New Hampshire, New Jersey, New Mexico, New York, North Carolina, Ohio, Pennsylvania, Rhode Island, South Dakota, Tennessee, Texas, Vermont, Virginia, West Virginia and Wisconsin Each unit holder must assess the need to file and pay income tax in these states on their allocated share of partnership taxable income. We may own property or conduct business in other states, localities or foreign countries in the future. It is the responsibility of each unitholder to file all U.S. federal, state, local and foreign tax returns. Our counsel has not rendered an opinion on the state, local or non-U.S. tax consequences of an investment in our common units.
We will treat each purchaser of our common units as having the same tax benefits without regard to the actual common units purchased. The IRS may challenge this treatment, which could adversely affect the value of the common units.
Because we cannot match transferors and transferees of common units, we will adopt depreciation and amortization positions that may not conform to all aspects of existing Treasury Regulations. A successful IRS challenge to those positions could adversely affect the amount of U.S. federal income tax benefits available to our unitholders. It also could affect the timing of these tax benefits or the amount of gain for U.S. federal income tax purposes from any sale of common units and could have a negative impact on the value of our common units or result in audit adjustments to a unitholder’s U.S. federal income tax returns.
34
We prorate our items of income, gain, loss and deduction for U.S. federal income tax purposes and allocate them between transferors and transferees of our common units each month based upon the ownership of our common units on the first business day of each month and as of the opening of the applicable exchange on which our common units are listed, instead of on the basis of the date a particular common unit is transferred. The IRS may challenge this treatment, which could change the allocation of items of income, gain, loss and deduction among our unitholders.
We generally prorate our items of income, gain, loss and deduction between transferors and transferees of our common units each month based upon the ownership of our common units on the first day of each month, instead of on the basis of the date a particular common unit is transferred. Although simplifying conventions are contemplated by the Code and most publicly traded partnerships use similar simplifying conventions, the use of this method may not be permitted under existing Treasury Regulations as there is no direct or indirect controlling authority on this issue. The Department of the Treasury and the IRS have issued Treasury Regulations that provide a safe harbor pursuant to which a publicly traded partnership may use a similar monthly simplifying convention to allocate tax items among transferor and transferee unitholders. The Treasury Regulations do not specifically authorize the use of the proration method we have adopted. If the IRS were to successfully challenge our proration method, we may be required to change the allocation of items of income, gain, loss and deduction among our unitholders.
If a unitholder loans their common units to a short seller to cover a short sale of common units, they may be considered to have disposed of those common units for U.S. federal income tax purposes. If so, the unitholder would no longer be treated for U.S. federal income tax purposes as a partner with respect to those common units during the period of the loan and they may recognize gain or loss from such deemed disposition.
During the period of the loan of common units to the short seller, any of our income, gain, loss or deduction with respect to such common units may not be reportable by the respective unitholder, and any cash distributions received by the unitholder as to those common units could be fully taxable to them as ordinary income. Our counsel has not rendered an opinion regarding the treatment of a unitholder where common units are loaned to a short seller to cover a short sale of common units. Unitholders desiring to assure their status as partners and avoid the risk of gain recognition from a loan of their common units are urged to modify any applicable brokerage account agreements to prohibit their brokers from borrowing their common units.
We have adopted certain valuation methodologies that may result in a shift of income, gain, loss and deduction between our General Partner and the unitholders. The IRS may challenge this treatment, which could adversely affect the value of the common units.
When we issue additional units or engage in certain other transactions, our General Partner will determine the fair market value of our assets and allocate any unrealized gain or loss attributable to our assets to the capital accounts of our unitholders and our General Partner. Although we may from time to time consult with professional appraisers regarding valuation matters, including the valuation of our assets, our General Partner will make many of the fair market value determinations of our assets using a methodology based on the market value of our common units as a means to measure the fair market value of our assets. Our methodology may be viewed as understating or overstating the value of our assets. In that case, there may be a shift of income, gain, loss and deduction between certain unitholders and our General Partner, which may be unfavorable to such unitholders. The IRS may challenge our valuation methods and allocations of income, gain, loss and deduction between our General Partner and certain of our unitholders.
A successful IRS challenge to these methods or allocations could adversely affect the amount of taxable income, gain or loss being allocated to our unitholders for U.S. federal income tax purposes. It also could affect the amount of taxable gain from our unitholders’ sale of common units and could have a negative impact on the value of the common units or result in audit adjustments to our unitholders’ U.S. federal income tax returns without the benefit of additional deductions.
If the IRS were to contest the U.S. federal income tax positions we take, it may adversely impact the market for our common units, and the costs of any such contest would reduce distributable cash flow to our unitholders.
The Bipartisan Budget Act of 2015 requires large partnerships to pay federal tax deficiencies at the partnership level, unless the partnership elects to take into account any federal tax deficiency by including the adjustment in the Form K-1s of the partners for the audited year. If we are audited, we will determine at that time whether to pay the tax deficiency, if any, at the partnership level or to include the adjustment in the Form K-1s of the partners for the audited year.
35
The following table shows the aggregate number of sites we owned or leased by customer groups at December 31, 2017:
|
|
|
Owned Sites |
|
|
Leased Sites |
|
|
Total Sites |
|
|
Percentage of Total Sites |
|
||||
|
Lessee dealers |
|
|
225 |
|
|
|
258 |
|
|
|
483 |
|
|
|
51 |
% |
|
DMS |
|
|
70 |
|
|
|
77 |
|
|
|
147 |
|
|
|
15 |
% |
|
Circle K |
|
|
73 |
|
|
|
— |
|
|
|
73 |
|
|
|
8 |
% |
|
Commission agents |
|
|
134 |
|
|
|
48 |
|
|
|
182 |
|
|
|
19 |
% |
|
Company operated retail sites |
|
|
62 |
|
|
|
9 |
|
|
|
71 |
|
|
|
7 |
% |
|
Total |
|
|
564 |
|
|
|
392 |
|
|
|
956 |
|
|
|
100 |
% |
We conduct business at sites located in Alabama, Arizona, Arkansas, Colorado, Delaware, Florida, Georgia, Illinois, Indiana, Kentucky, Louisiana, Maine, Maryland, Massachusetts, Michigan, Minnesota, New Hampshire, New Jersey, New Mexico, New York, North Carolina, Ohio, Pennsylvania, Rhode Island, South Dakota, Tennessee, Texas, Vermont, Virginia, West Virginia and Wisconsin.
The following table provides a history of our sites acquired, changes between customer groups or sold during 2017:
|
|
|
Lessee Dealers |
|
|
DMS |
|
|
Circle K |
|
|
Commission Agents |
|
|
Company Operated |
|
|
Total |
|
||||||
|
Number at beginning of period |
|
|
468 |
|
|
|
168 |
|
|
|
74 |
|
|
|
100 |
|
|
|
76 |
|
|
|
886 |
|
|
Acquired |
|
|
2 |
|
|
|
— |
|
|
|
— |
|
|
|
100 |
|
|
|
— |
|
|
|
102 |
|
|
Changes between customer groups |
|
|
29 |
|
|
|
(7 |
) |
|
|
— |
|
|
|
(17 |
) |
|
|
(5 |
) |
|
|
- |
|
|
Sold |
|
|
(14 |
) |
|
|
(14 |
) |
|
|
(1 |
) |
|
|
(1 |
) |
|
|
— |
|
|
|
(30 |
) |
|
Other |
|
|
(2 |
) |
|
|
— |
|
|
|
— |
|
|
|
— |
|
|
|
— |
|
|
|
(2 |
) |
|
Number at end of period (a) |
|
|
483 |
|
|
|
147 |
|
|
|
73 |
|
|
|
182 |
|
|
|
71 |
|
|
|
956 |
|
|
(a) |
This amount excludes 384 independent dealer sites and includes 29 closed sites and 54 sites where we only collect rent. |
Our principal executive offices are in Allentown, Pennsylvania in approximately 27,000 square feet of leased office space.
ITEM 1B. UNRESOLVED STAFF COMMENTS
None.
We are from time to time party to various lawsuits, claims and other legal proceedings that arise in the ordinary course of business. These actions typically seek, among other things, compensation for alleged personal injury, breach of contract, property damages, environmental damages, employment-related claims and damages, punitive damages, civil penalties or other losses, or injunctive or declaratory relief. With respect to all such lawsuits, claims and proceedings, we record a reserve when it is probable that a liability has been incurred and the amount of loss can be reasonably estimated. In addition, we disclose matters for which management believes a material loss is at least reasonably possible. None of these proceedings, separately or in the aggregate, are expected to have a material adverse effect on our consolidated financial position, results of operations or cash flows. In all instances, management has assessed the matter based on current information and made a judgment concerning its potential outcome, giving due consideration to the nature of the claim, the amount and nature of damages sought and the probability of success. Management’s judgment may prove materially inaccurate, and such judgment is made subject to the known uncertainties of litigation.
36
We were a co-defendant, together with our General Partner, CST and CST Services LLC, in a lawsuit brought by a former executive of CST Services who, until March 2015, provided services to us as Chief Investment Officer and Vice President of Finance (Court of Common Pleas, Lehigh County, Pennsylvania, case number 2015-1003). In connection with CST’s acquisition of our General Partner in 2014, the plaintiff alleged breach of contract and associated claims relating to his termination of employment and claimed severance benefits under the EICP. In October 2017, a jury awarded the plaintiff a total of $1.7 million. Under the EICP, we were also obligated to pay reasonable legal expenses incurred by the plaintiff in connection with this dispute.
Additional information regarding legal proceedings is included in Note 15 to the financial statements.
ITEM 4. MINE SAFETY DISCLOSURES
Not applicable.
37
ITEM 5. MARKET FOR REGISTRANT’S COMMON EQUITY, RELATED STOCKHOLDER MATTERS AND ISSUER PURCHASES OF EQUITY SECURITIES
As of February 21, 2018, we had 34,111,461 common units outstanding, held by approximately 20 holders of record. Our common units are listed and trade on the NYSE under the symbol “CAPL.” Included in the number of common units outstanding are 6,389,346 common units currently owned by Circle K, which cannot be transferred absent registration with the SEC or an available exemption from the SEC’s registration requirements. See “Security Ownership of Certain Beneficial Owners and Management and Related Unitholder Matters.”
The following table sets forth, for the periods indicated, the high and low sales prices for our common units, as reported by the NYSE, and cash distributions paid per common unit. The last reported sales price of our common units on the NYSE on February 21, 2018 was $23.36 per share.
|
|
|
Common Unit Price Range |
|
|
Cash Distributions Paid per Unit |
|
||||||
|
|
|
High |
|
|
Low |
|
|
|
|
|
||
|
2016 |
|
|
|
|
|
|
|
|
|
|
|
|
|
First Quarter |
|
$ |
26.65 |
|
|
$ |
17.39 |
|
|
$ |
0.5925 |
|
|
Second Quarter |
|
|
25.50 |
|
|
|
22.50 |
|
|
|
0.5975 |
|
|
Third Quarter |
|
|
26.95 |
|
|
|
23.01 |
|
|
|
0.6025 |
|
|
Fourth Quarter |
|
|
27.91 |
|
|
|
24.07 |
|
|
|
0.6075 |
|
|
2017 |
|
|
|
|
|
|
|
|
|
|
|
|
|
First Quarter |
|
$ |
27.94 |
|
|
$ |
24.10 |
|
|
$ |
0.6125 |
|
|
Second Quarter |
|
|
26.42 |
|
|
|
23.26 |
|
|
|
0.6175 |
|
|
Third Quarter |
|
|
29.80 |
|
|
|
24.85 |
|
|
|
0.6225 |
|
|
Fourth Quarter |
|
|
27.71 |
|
|
|
22.57 |
|
|
|
0.6275 |
|
Cash Distribution Policy
General
The Board has adopted a policy to make cash distributions per unit each quarter, in an amount determined by the Board following the end of such quarter. In general, we expect that cash distributed for each quarter will equal cash generated from operations less cash needed for maintenance capital expenditures, accrued but unpaid expenses (including the management fee to Circle K), reimbursement of expenses incurred by our General Partner, debt service and other contractual obligations and reserves for future operating and capital needs or for future distributions to our partners. We expect that the Board will reserve excess cash, from time to time, in an effort to sustain or permit gradual or consistent increases in quarterly distributions. Restrictions in our credit facility could limit our ability to pay distributions upon the occurrence of certain events. See “Item 7. Management’s Discussion and Analysis of Financial Condition and Results of Operations—Liquidity and Capital Resources—Credit Facility.” The Board may also determine to borrow to fund distributions in quarters when we generate less cash available for distribution than necessary to sustain or grow our cash distributions per unit. The factors that we believe will be the primary drivers of our cash generated from operations are changes in demand for motor fuels, the number of sites to which we distribute motor fuels, the margin per gallon we are able to generate at such sites and the profitability of sites we own and lease.
Our cash distribution policy, established by our General Partner, is to distribute each quarter an amount at least equal to the minimum quarterly distribution of $0.4375 per unit on all units ($1.75 per unit on an annualized basis). The distribution declared by the Board on January 24, 2018 was $0.6275 per unit (or $2.51 per unit on an annualized basis). Our General Partner may determine at any time that it is in the best interest of our Partnership to modify or revoke our cash distribution policy. Modification of our cash distribution policy may result in distributions of amounts less than, or greater than, our minimum quarterly distribution, and revocation of our cash distribution policy could result in no distributions at all. In addition, our credit facility includes certain restrictions on our ability to make cash distributions.
38
IDRs represent the right to receive an increasing percentage (15.0%, 25.0% and 50.0%) of our quarterly distributions from operating surplus after the minimum quarterly distribution and the target distribution levels (as described under Minimum Quarterly Distribution below) have been achieved. Circle K holds our IDRs and has the right to transfer these rights at any time. The distributions declared since March 2014 exceed the 15% threshold and the distributions declared since June 2015 exceed the 25% threshold.
Minimum Quarterly Distribution
If cash distributions to our unitholders exceed $0.5031 per unit in any quarter, our unitholders and the holders of our IDRs, will receive distributions according to the following percentage allocations:
|
Total Quarterly Distribution Per Common and Subordinated Unit |
|
Marginal Percentage Interest in Distribution |
|
|||||
|
Target Amount |
|
Unitholders |
|
|
Holders of IDRs |
|
||
|
above $0.5031 up to $0.5469 |
|
|
85 |
% |
|
|
15 |
% |
|
above $0.5469 up to $0.6563 |
|
|
75 |
% |
|
|
25 |
% |
|
above $0.6563 |
|
|
50 |
% |
|
|
50 |
% |
Quarterly distribution activity during the last two years was as follows:
|
Quarter Ended |
|
Record Date |
|
Payment Date |
|
Cash Distributions Paid per Unit |
|
|
Cash Distribution (in millions) |
|
||
|
December 31, 2015 |
|
February 12, 2016 |
|
February 24, 2016 |
|
$ |
0.5925 |
|
|
$ |
19.6 |
|
|
March 31, 2016 |
|
May 19, 2016 |
|
May 31, 2016 |
|
|
0.5975 |
|
|
|
19.9 |
|
|
June 30, 2016 |
|
August 8, 2016 |
|
August 15, 2016 |
|
|
0.6025 |
|
|
|
20.1 |
|
|
September 30, 2016 |
|
November 4, 2016 |
|
November 15, 2016 |
|
|
0.6075 |
|
|
|
20.4 |
|
|
December 31, 2016 |
|
February 6, 2017 |
|
February 13, 2017 |
|
|
0.6125 |
|
|
|
20.5 |
|
|
March 31, 2017 |
|
May 8, 2017 |
|
May 15, 2017 |
|
|
0.6175 |
|
|
|
20.9 |
|
|
June 30, 2017 |
|
August 7, 2017 |
|
August 14, 2017 |
|
|
0.6225 |
|
|
|
21.1 |
|
|
September 30, 2017 |
|
November 6, 2017 |
|
November 13, 2017 |
|
|
0.6275 |
|
|
|
21.3 |
|
|
December 31, 2017 |
|
February 5, 2018 |
|
February 12, 2018 |
|
|
0.6275 |
|
|
|
21.4 |
|
We expect to continue the practice of paying quarterly cash distributions, though the timing, declaration, amount and payment of future distributions to unitholders will fall within the discretion of the Board. Our indebtedness also restricts our ability to pay distributions. As such, there can be no assurance we will continue to pay distributions in the future.
Subordination Period
On February 25, 2016, the subordination period under the Partnership Agreement ended. At that time, each outstanding subordinated unit converted into one common unit and as such participates pro rata with the other common units in cash distributions.
Unregistered Sales of Equity Securities and Use of Proceeds
Through December 31, 2017, we issued an aggregate of 6,389,346 common units to CST or Circle K as consideration for asset purchases and partial settlement of the management fee. These units are restricted and cannot be transferred absent registration with the SEC or an available exemption from the SEC’s registration requirements. These issuances were made in reliance on Section 4(a)(2) of the Securities Act of 1933, as amended. See “Security Ownership of Certain Beneficial Owners and Management and Related Unitholder Matters.”
39
Common Unit Repurchase Program
On November 2, 2015, our Board approved a common unit repurchase program under Rule 10b-18 of the Exchange Act authorizing us to repurchase up to an aggregate of $25 million of the common units representing limited partner interests in the Partnership. Under the program, we may make purchases in the open market after November 9, 2015 in accordance with Rule 10b-18 of the Exchange Act, or in privately negotiated transactions, pursuant to a trading plan under Rule 10b5-1 of the Exchange Act or otherwise. Any purchases will be funded from available cash on hand. The common unit repurchase program does not require us to acquire any specific number of common units and may be suspended or terminated by us at any time without prior notice. The purchases will not be made from any officer, director or control person of CrossAmerica or Couche-Tard. Since inception, we repurchased $6.9 million, or 287,621 common units, at an average price of $23.84 per common unit. We made no repurchases during 2017.
Common Unit Purchases by CST
On September 21, 2015, CST approved a unit purchase program under Rule 10b-18 of the Exchange Act, authorizing CST to purchase up to an aggregate of $50 million of the common units representing limited partner interests in us. The unit purchase program does not have a fixed expiration date and may be modified, suspended or terminated at any time at CST’s discretion. Through December 31, 2015, CST had purchased $19.8 million, or 804,667 common units, at an average price of $24.64 per common unit, which cannot be transferred absent registration with the SEC or an available exemption from the SEC’s registration requirements. CST and Circle K made no purchases of common units during 2016 or 2017.
Management Fee Issuance
As approved by the independent conflicts committee of the Board, the Partnership and Circle K mutually agreed to settle, from time to time, a portion of the full amount due under the terms of the Amended Omnibus Agreement in newly issued common units representing limited partner interests in the Partnership. These issuances of common units were made in reliance on Section 4(a)(2) of the Securities Act of 1933, as amended. We issued the following common units to CST or Circle K for the periods presented below under the terms of the Amended Omnibus Agreement:
|
Quarter Ended |
|
Date of Issuance |
|
Number of Common Units Issued |
|
|
|
June 30, 2015 |
|
July 16, 2015 |
|
|
145,056 |
|
|
September 30, 2015 |
|
October 26, 2015 |
|
|
114,256 |
|
|
December 31, 2015 |
|
March 31, 2016 |
|
|
145,137 |
|
|
March 31, 2016 |
|
May 9, 2016 |
|
|
83,218 |
|
|
June 30, 2016 |
|
August 2, 2016 |
|
|
101,087 |
|
|
September 30, 2016 |
|
October 27, 2016 |
|
|
110,824 |
|
|
December 31, 2016 |
|
February 28, 2017 |
|
|
171,039 |
|
|
March 31, 2017 |
|
May 10, 2017 |
|
|
128,983 |
|
|
June 30, 2017 |
|
August 9, 2017 |
|
|
124,003 |
|
|
September 30, 2017 |
|
November 10, 2017 |
|
|
126,491 |
|
|
December 31, 2017 |
|
March 1, 2018 |
|
|
136,882 |
|
ITEM 6. SELECTED FINANCIAL DATA
The following selected financial data reflect the operating data for the periods and as of the dates indicated.
To ensure a full understanding, you should read the selected financial data presented below in conjunction with “Management’s Discussion and Analysis of Financial Condition and Results of Operations” and the financial statements and accompanying notes included in this Form 10-K.
40
The financial data below are presented in thousands.
|
|
|
For the Year Ended December 31, |
|
|||||||||||||||||
|
|
|
2017 |
|
|
2016 |
|
|
2015 |
|
|
2014 |
|
|
2013 |
|
|||||
|
Income Statement Data: |
|
|
|
|
|
|
|
|
|
|
|
|
|
|
|
|
|
|
|
|
|
Total revenues (a) |
|
$ |
2,094,827 |
|
|
$ |
1,869,806 |
|
|
$ |
2,226,271 |
|
|
$ |
2,664,868 |
|
|
$ |
1,936,059 |
|
|
Operating income |
|
|
32,419 |
|
|
|
32,171 |
|
|
|
26,017 |
|
|
|
8,640 |
|
|
|
30,177 |
|
|
Income (loss) from continuing operations after income taxes |
|
|
23,176 |
|
|
|
10,715 |
|
|
|
11,462 |
|
|
|
(6,171 |
) |
|
|
18,070 |
|
|
Net income (loss) attributable to limited partners |
|
|
23,158 |
|
|
|
10,704 |
|
|
|
11,441 |
|
|
|
(6,162 |
) |
|
|
18,070 |
|
|
Net income (loss) per common and subordinated unit-basic |
|
$ |
0.56 |
|
|
$ |
0.22 |
|
|
$ |
0.35 |
|
|
$ |
(0.32 |
) |
|
$ |
1.18 |
|
|
Net income (loss) per common and subordinated unit-diluted |
|
$ |
0.56 |
|
|
$ |
0.22 |
|
|
$ |
0.35 |
|
|
$ |
(0.32 |
) |
|
$ |
1.18 |
|
|
Operating Data: |
|
|
|
|
|
|
|
|
|
|
|
|
|
|
|
|
|
|
|
|
|
Wholesale |
|
|
|
|
|
|
|
|
|
|
|
|
|
|
|
|
|
|
|
|
|
Average motor fuel distribution sites |
|
|
1,183 |
|
|
|
1,128 |
|
|
|
1,064 |
|
|
|
923 |
|
|
|
708 |
|
|
Gallons of motor fuel distributed (in millions) |
|
|
1,032.0 |
|
|
|
1,034.6 |
|
|
|
1,051.4 |
|
|
|
887.7 |
|
|
|
637.8 |
|
|
Motor fuel gross margin |
|
$ |
58,844 |
|
|
$ |
54,112 |
|
|
$ |
58,606 |
|
|
$ |
60,606 |
|
|
$ |
43,850 |
|
|
Motor fuel gross margin per gallon (b) |
|
$ |
0.057 |
|
|
$ |
0.052 |
|
|
$ |
0.056 |
|
|
$ |
0.068 |
|
|
$ |
0.069 |
|
|
Rent income (a) |
|
$ |
79,344 |
|
|
$ |
74,955 |
|
|
$ |
59,956 |
|
|
$ |
47,348 |
|
|
$ |
40,210 |
|
|
Retail |
|
|
|
|
|
|
|
|
|
|
|
|
|
|
|
|
|
|
|
|
|
Average total system sites |
|
|
168 |
|
|
|
157 |
|
|
|
202 |
|
|
|
119 |
|
|
|
21 |
|
|
Gallons of motor fuel sold (in millions) |
|
|
160.6 |
|
|
|
159.7 |
|
|
|
211.2 |
|
|
|
136.5 |
|
|
|
20.2 |
|
|
Motor fuel gross margin per gallon |
|
$ |
0.045 |
|
|
$ |
0.053 |
|
|
$ |
0.092 |
|
|
$ |
0.059 |
|
|
$ |
0.032 |
|
|
Merchandise gross margin percentage |
|
|
24.4 |
% |
|
|
24.6 |
% |
|
|
26.3 |
% |
|
|
30.6 |
% |
|
n/a |
|
|
|
Other Financial Data (unaudited) |
|
|
|
|
|
|
|
|
|
|
|
|
|
|
|
|
|
|
|
|
|
Adjusted EBITDA (c) |
|
$ |
109,077 |
|
|
$ |
103,634 |
|
|
$ |
90,314 |
|
|
$ |
61,424 |
|
|
$ |
54,904 |
|
|
Distributable Cash Flow (c) |
|
$ |
81,234 |
|
|
$ |
81,628 |
|
|
$ |
69,733 |
|
|
$ |
44,063 |
|
|
$ |
39,296 |
|
|
Distributions paid per common unit |
|
$ |
2.4800 |
|
|
$ |
2.4000 |
|
|
$ |
2.2300 |
|
|
$ |
2.0800 |
|
|
$ |
1.7273 |
|
|
Distribution Coverage (c) |
|
0.97x |
|
|
1.02x |
|
|
1.08x |
|
|
1.06x |
|
|
1.49x |
|
|||||
|
(a) |
Prior to 2016, we netted lease executory costs such as real estate taxes, maintenance and utilities that we paid and re-billed customers against rental income on our statement of income. During the first quarter of 2016, we began accounting for such amounts as rent income and operating expenses and reflected this change in presentation retrospectively back through 2014. |
|
(b) |
Fuel margin per gallon represents (1) total revenues from motor fuel sales, less total cost of revenues from motor fuel sales, divided by (2) total gallons of motor fuel distributed. |
|
(c) |
See reconciliation of non-GAAP financial measures under the heading “Management’s Discussion of Financial Condition and Results of Operations—Results of Operations—Non-GAAP Financial Measures” below. |
|
|
|
As of December 31, |
|
|||||||||||||||||
|
|
|
2017 |
|
|
2016 |
|
|
2015 |
|
|
2014 |
|
|
2013 |
|
|||||
|
Balance Sheet Data: |
|
|
|
|
|
|
|
|
|
|
|
|
|
|
|
|
|
|
|
|
|
Cash and cash equivalents |
|
$ |
3,897 |
|
|
$ |
1,350 |
|
|
$ |
1,192 |
|
|
$ |
15,170 |
|
|
$ |
4,115 |
|
|
Total current assets (a) |
|
|
80,506 |
|
|
|
65,407 |
|
|
|
58,119 |
|
|
|
76,805 |
|
|
|
35,496 |
|
|
Total assets (a) (b) |
|
|
947,236 |
|
|
|
931,989 |
|
|
|
861,444 |
|
|
|
598,446 |
|
|
|
391,621 |
|
|
Total current liabilities (a) |
|
|
93,473 |
|
|
|
75,133 |
|
|
|
74,898 |
|
|
|
95,222 |
|
|
|
38,857 |
|
|
Long-term debt, excluding current portion (b) |
|
|
529,147 |
|
|
|
465,119 |
|
|
|
403,714 |
|
|
|
226,815 |
|
|
|
173,509 |
|
|
Total liabilities (a) (b) |
|
|
776,217 |
|
|
|
711,178 |
|
|
|
592,588 |
|
|
|
407,955 |
|
|
|
296,950 |
|
|
Total equity |
|
|
171,019 |
|
|
|
220,811 |
|
|
|
268,856 |
|
|
|
190,491 |
|
|
|
94,671 |
|
|
(a) |
Balances as of December 31, 2013 were not retrospectively adjusted for the adoption of ASU 2015-17, which related to the presentation of deferred taxes. |
|
(b) |
Balances as of December 31, 2013 were not retrospectively adjusted for the adoption of ASU 2015-03, which related to the presentation of deferred financing costs. |
41
ITEM 7. MANAGEMENT’S DISCUSSION AND ANALYSIS OF FINANCIAL CONDITION AND RESULTS OF OPERATIONS
The following MD&A is intended to help the reader understand our results of operations and financial condition. This section is provided as a supplement to, and should be read in conjunction with Items 1., 1A. and 8. (which includes our consolidated financial statements) contained in this report.
MD&A is organized as follows:
|
|
• |
CST’s Merger—This section provides information on the Merger. |
|
|
• |
Significant Factors Affecting Our Profitability—This section describes the significant impact on our results of operations caused by crude oil commodity price volatility, seasonality and acquisition and financing activities. |
|
|
• |
Results of Operations—This section provides an analysis of our results of operations, including the results of operations of our business segments, for the years ended December 31, 2017, 2016 and 2015 and non-GAAP financial measures. |
|
|
• |
Liquidity and Capital Resources—This section provides a discussion of our financial condition and cash flows. It also includes a discussion of our debt, capital requirements, other matters impacting our liquidity and capital resources and an outlook for our business. |
|
|
• |
New Accounting Policies—This section describes new accounting pronouncements that we have already adopted, those that we are required to adopt in the future and those that became applicable in the current year as a result of new circumstances. |
|
|
• |
Critical Accounting Policies Involving Critical Accounting Estimates—This section describes the accounting policies and estimates that we consider most important for our business and that require significant judgment. |
Couche-Tard and CST Merger
On June 28, 2017, a wholly owned subsidiary of Circle K merged with and into CST, with CST surviving the Merger as an indirect, wholly owned subsidiary of Circle K. Circle K is a wholly owned subsidiary of Couche-Tard.
As a result of the Merger, Circle K indirectly owns all of the membership interests in the sole member of our General Partner, as well as a 21.1% limited partner interest in the Partnership and all of the outstanding IDRs of the Partnership. Circle K, through its indirect ownership interest in the sole member of our General Partner, has the ability to appoint all of the members of the Board and to control and manage the operations and activities of the Partnership.
Significant Factors Affecting our Profitability
The Significance of Crude Oil and Wholesale Motor Fuel Prices on Our Revenues, Cost of Sales and Gross Profit
Wholesale segment
The prices paid to our motor fuel suppliers for wholesale motor fuel (which affects our cost of sales) are highly correlated to the price of crude oil. The crude oil commodity markets are highly volatile, and the market prices of crude oil, and, correspondingly, the market prices of wholesale motor fuel, experience significant and rapid fluctuations. We receive a fixed mark-up per gallon on approximately 85% of gallons sold to our customers. The remaining gallons are primarily DTW priced contracts with our customers. These contracts provide for variable, market based pricing that results in motor fuel gross profit effects similar to retail motor fuel gross profits (as crude oil prices decline, motor fuel gross profit generally increases, as discussed in our Retail segment below). The increase in DTW gross profit results from the acquisition cost of wholesale motor fuel declining at a faster rate as compared to the rate retail motor fuel prices decline. Conversely, our DTW motor fuel gross profit declines when the cost of wholesale motor fuel increases at a faster rate as compared to the rate retail motor fuel prices increase.
CrossAmerica purchases motor fuel for our Jet-Pep Assets from Circle K at Circle K’s cost plus terminal and administration fees of $0.015 per gallon. Circle K’s cost to supply these sites includes price fluctuations associated with index-based motor fuel pricing for pipeline delivery and the generation and sale of RINs. Circle K has implemented a motor fuel price hedging program to mitigate the price risk during delivery; however, we are exposed to more price risk with these motor fuel purchases from Circle K as compared to our other motor fuel purchases.
42
Regarding our supplier relationships, a majority of our total gallons purchased are subject to Terms Discounts. The dollar value of these discounts increases and decreases corresponding to motor fuel prices. Therefore, in periods of lower wholesale motor fuel prices, our gross profit is negatively affected and, in periods of higher wholesale motor fuel prices, our gross profit is positively affected (as it relates to these discounts).
Retail segment
We attempt to pass along wholesale motor fuel price changes to our retail customers through “at the pump” retail price changes; however, market conditions do not always allow us to do so immediately. The timing of any related increase or decrease in “at the pump” retail prices is affected by competitive conditions in each geographic market in which we operate. As such, the prices we charge our customers for motor fuel and the gross profit we receive on our motor fuel sales can increase or decrease significantly over short periods of time.
Changes in our average motor fuel selling price per gallon and gross margin are directly related to the changes in crude oil and wholesale motor fuel prices. Variations in our reported revenues and cost of sales are, therefore, primarily related to the price of crude oil and wholesale motor fuel prices and generally not as a result of changes in motor fuel sales volumes, unless otherwise indicated and discussed below.
We typically experience lower retail motor fuel gross profits in periods when the wholesale cost of motor fuel increases, and higher retail motor fuel gross profits in periods when the wholesale cost of motor fuel declines.
Seasonality Effects on Volumes
Our business is subject to seasonality due to our wholesale and retail sites being located in certain geographic areas that are affected by seasonal weather and temperature trends and associated changes in retail customer activity during different seasons. Historically, sales volumes have been highest in the second and third quarters (during the summer months) and lowest during the winter months in the first and fourth quarters.
Impact of Inflation
Inflation affects our financial performance by increasing certain of our operating expenses and cost of goods sold. Operating expenses include labor costs, leases, and general and administrative expenses. While our Wholesale segment benefits from higher Terms Discounts as a result of higher fuel costs, inflation could negatively impact our Retail segment as a result of higher motor fuel, merchandise and operating costs. Although we have historically been able to pass on increased costs through price increases, there can be no assurance that we will be able to do so in the future.
Acquisition and Financing Activity
Our results of operations and financial condition are also impacted by our acquisition and financing activities as summarized below.
2015
|
|
• |
In January 2015, we closed on the purchase of a 5% limited partner equity interest in CST Fuel Supply for approximately 1.5 million common units with an aggregate consideration of $60.0 million on the date of closing. |
|
|
• |
In January 2015, in connection with the joint acquisition by CST and the Partnership of 22 retail sites from Landmark Assets, we acquired the real property of the 22 fee sites for $41.2 million. |
|
|
• |
In February 2015, we closed on the purchase of all of the outstanding capital stock of Erickson and certain related assets for an aggregate purchase price of $83.8 million, including working capital. |
|
|
• |
In June 2015, we closed on the sale of 4.6 million common units for net proceeds of approximately $138.5 million. In July 2015, we closed on the sale of an additional 0.2 million common units for net proceeds of approximately $6.4 million in accordance with the underwriters’ option to purchase additional common units associated with the June offering. We used the proceeds to reduce indebtedness outstanding under our credit facility. |
|
|
• |
In July 2015, we closed on the purchase of a 12.5% limited partner equity interest in CST Fuel Supply for approximately 3.3 million common units and cash in the amount of $17.5 million, with an aggregate consideration of approximately $110.9 million on the date of closing. |
43
|
|
• |
In July 2015, we closed on the purchase of retail sites from One Stop and certain related assets for $45.0 million, including working capital. |
2016
|
|
• |
On February 5, 2016, we purchased independent dealer and sub-wholesaler contracts from CST for $2.9 million. |
|
|
• |
On March 29, 2016, we closed on the acquisition of Franchised Holiday Stores and company operated liquor stores from S/S/G Corporation for approximately $52.4 million, including working capital. |
|
|
• |
On July 7, 2016, CST provided an $18.2 million refund payment to us related to our interest in CST Fuel Supply. |
|
|
• |
On September 27, 2016, we acquired the State Oil Assets located in the greater Chicago market for approximately $41.9 million, including working capital. |
|
|
• |
On December 13, 2016, we amended our credit facility to provide additional flexibility to support achieving our growth strategy. |
|
|
• |
On December 21, 2016, we sold the real property at 17 fee sites acquired in the State Oil Assets acquisition for $25.0 million in proceeds, which were used to repay borrowings under the credit facility. We subsequently leased these sites back under a triple net lease agreement. |
2017
|
|
• |
On September 6, 2017, we sold two properties to an unaffiliated third party as a result of the FTC’s requirements associated with the Merger for $6.7 million. |
|
|
• |
On September 27, 2017, as approved by the independent conflicts committee of our Board, we sold 29 properties to DMR for $18.9 million. These sites were generally sites at which we did not supply fuel or represented vacant land. |
|
|
• |
On November 28, 2017, we acquired the Jet-Pep Assets located in Alabama for approximately $75.6 million, including working capital. |
Separation Benefits and Retention Bonuses
During 2017, the Partnership recognized a $5.4 million charge for certain severance and benefit costs associated with certain officers and other employees of CST Services who provided services to the Partnership and who terminated employment upon the consummation of the Merger, which constituted a change in control, as defined in the EICP and CST’s severance plans. Such costs are included in general and administrative expenses and were primarily paid by Circle K in the third quarter of 2017. Accounts payable to related parties includes these costs as we will reimburse Circle K.
In addition, certain participants in the EICP received retention bonuses that will be paid in annual installments that began in July 2017 and will continue through July 2019. The Partnership recorded a $1.0 million charge during 2017 in connection with the payments made by Circle K in July 2017, which were included in general and administrative expenses. In addition, the Partnership recognized a $0.7 million charge in 2017 for the payments expected to be made in July 2018 and July 2019. The Partnership anticipates recognizing future charges totaling $0.9 million over the remaining retention period, of which $0.8 million is anticipated to be recognized in 2018.
We were a co-defendant, together with our General Partner, CST and CST Services LLC, in a lawsuit brought by a former executive of CST Services who, until March 2015, provided services to us as Chief Investment Officer and Vice President of Finance (Court of Common Pleas, Lehigh County, Pennsylvania, case number 2015-1003). In connection with CST’s acquisition of our General Partner in 2014, the plaintiff alleged breach of contract and associated claims relating to his termination of employment and claimed severance benefits under the EICP. In October 2017, a jury awarded the plaintiff a total of $1.7 million. Under the EICP, we were also obligated to pay reasonable legal expenses incurred by the plaintiff in connection with this dispute.
44
On November 28, 2017, we closed on the acquisition of the real property and the fuel supply business of 101 commission operated retail sites, including 92 fee simple sites, the leasehold interest in five real property sites and the fuel supply business to four independent commission sites, all located in Alabama, from Jet-Pep, Inc. and affiliated entities, for an aggregate cash consideration of $75.6 million, including working capital. On the same day, Circle K closed on the acquisition of certain related retail and terminal assets from Jet-Pep, Inc. and affiliated entities.
Results of Operations
Consolidated Income Statement Analysis
Below is an analysis of our consolidated statements of income and provides the primary reasons for significant increases and decreases in the various income statement line items from period to period. Our consolidated statements of income are as follows (in thousands):
|
|
|
Year Ended December 31, |
|
|||||||||
|
|
|
2017 |
|
|
2016 |
|
|
2015 |
|
|||
|
Operating revenues |
|
$ |
2,094,827 |
|
|
$ |
1,869,806 |
|
|
$ |
2,226,271 |
|
|
Cost of sales |
|
|
1,934,061 |
|
|
|
1,714,239 |
|
|
|
2,056,807 |
|
|
Gross profit |
|
|
160,766 |
|
|
|
155,567 |
|
|
|
169,464 |
|
|
|
|
|
|
|
|
|
|
|
|
|
|
|
|
Income from CST Fuel Supply equity interests |
|
|
14,906 |
|
|
|
16,048 |
|
|
|
10,528 |
|
|
Operating expenses: |
|
|
|
|
|
|
|
|
|
|
|
|
|
Operating expenses |
|
|
61,297 |
|
|
|
61,074 |
|
|
|
72,229 |
|
|
General and administrative expenses |
|
|
27,887 |
|
|
|
24,156 |
|
|
|
36,238 |
|
|
Depreciation, amortization and accretion expense |
|
|
57,470 |
|
|
|
54,412 |
|
|
|
48,227 |
|
|
Total operating expenses |
|
|
146,654 |
|
|
|
139,642 |
|
|
|
156,694 |
|
|
Gain on sales of assets, net |
|
|
3,401 |
|
|
|
198 |
|
|
|
2,719 |
|
|
Operating income |
|
|
32,419 |
|
|
|
32,171 |
|
|
|
26,017 |
|
|
Other income (expense), net |
|
|
439 |
|
|
|
848 |
|
|
|
396 |
|
|
Interest expense |
|
|
(27,919 |
) |
|
|
(22,757 |
) |
|
|
(18,493 |
) |
|
Income before income taxes |
|
|
4,939 |
|
|
|
10,262 |
|
|
|
7,920 |
|
|
Income tax benefit |
|
|
(18,237 |
) |
|
|
(453 |
) |
|
|
(3,542 |
) |
|
Net income |
|
|
23,176 |
|
|
|
10,715 |
|
|
|
11,462 |
|
|
Net income attributable to noncontrolling interests |
|
|
18 |
|
|
|
11 |
|
|
|
21 |
|
|
Net income attributable to limited partners |
|
|
23,158 |
|
|
|
10,704 |
|
|
|
11,441 |
|
|
IDR distributions |
|
|
(4,337 |
) |
|
|
(3,392 |
) |
|
|
(1,390 |
) |
|
Net income available to limited partners |
|
$ |
18,821 |
|
|
$ |
7,312 |
|
|
$ |
10,051 |
|
Year Ended December 31, 2017 Compared to Year Ended December 31, 2016
Consolidated Results
Operating revenues increased $225 million, or 12%, while gross profit increased $5.2 million, or 3.3%.
Operating revenues
Significant items impacting these results prior to the elimination of intercompany revenues were:
|
|
• |
A $240 million, or 15%, increase in our Wholesale segment revenues primarily attributable to the increase in crude oil prices. The average daily spot price of WTI crude oil increased 17% to $50.78 per barrel in 2017, compared to $43.29 per barrel in 2016. The wholesale price of motor fuel is highly correlated to the price of crude oil. See “Significant Factors Affecting our Profitability—The Significance of Crude Oil and Wholesale Motor Fuel Prices on Our Revenues, Cost of Sales and Gross Profit.” |
|
|
• |
A $24 million, or 5%, increase in our Retail segment revenues primarily attributable to the increase in crude oil prices, largely offset by conversion of company operated retail sites to lessee dealer sites. See “Significant Factors Affecting our Profitability—The Significance of Crude Oil and Wholesale Motor Fuel Prices on Our Revenues, Cost of Sales and Gross Profit.” |
45
We present the results of operations of our segments on a consistent basis with how our management views the business. Therefore, our segments are presented before intersegment eliminations (which consist of motor fuel sold by our Wholesale segment to our Retail segment). As a result, in order to reconcile to our consolidated change in operating revenues, a discussion of the change in intersegment revenues is included in our consolidated MD&A discussion.
Our intersegment revenues increased $39.2 million or 16%, primarily attributable to the increase in wholesale motor fuel prices discussed above.
Cost of sales
Cost of sales increased $220 million or 13% as a result of the increase in wholesale motor fuel prices. See “Results of Operations—Segment Results” for additional gross profit analyses.
Operating expenses
See “Results of Operations—Segment Results” for additional operating expenses analyses.
General and administrative expenses
General and administrative expenses increased $3.7 million primarily attributable to a $7.1 million charge recorded upon closing of the Merger for certain severance and benefit costs for certain terminated officers and other employees of CST Services who provided services to the Partnership and retention bonuses to certain EICP participants and a $1.7 million charge related to a court ruling in favor of a former executive’s claim to benefits under the EICP change in control provisions, partially offset by a $1.5 million decrease driven by the integration of prior year acquisitions and other cost savings initiatives and a $3.5 million decrease in management fees charged by Circle K and equity compensation expense as a result of personnel and salary reductions effective at the time of the Merger.
Depreciation, amortization and accretion expense
Depreciation, amortization and accretion expense increased $3.1 million primarily driven by our recent acquisitions.
Gain on sales of assets, net
During 2017, we recorded a $2.2 million gain on the sale of two properties as required by the FTC in connection with the Merger and a $0.8 million gain on the sale of 29 properties to DMR. We also recorded a $0.8 million gain related to the renewal of a contract by DMS with one of its customers, which triggered an earn out payment to be paid by DMS to us in connection with a contract entered into with DMS at the time of CST’s acquisition of our General Partner in October 2014.
Interest expense
Interest expense increased $5.2 million due to an increase in the average interest rate charged on our credit facility borrowings from 3.5% to 4.2% and additional borrowings to fund our recent acquisitions. In addition, we incurred $1.6 million of interest expense in 2017 related to our sale leaseback executed in December 2016.
Income tax benefit
We recorded an income tax benefit of $18.2 million and $0.5 million for 2017 and 2016, respectively. The benefit in 2017 was primarily due to the Tax Cuts and Jobs Act, which resulted in a net benefit of $13.2 million. In addition, as a result of a reassessment of the positive and negative evidence supporting whether or not a valuation allowance for deferred tax assets is needed, we released the entire $3.7 million valuation allowance in 2017. See Note 19 for additional information.
46
Year Ended December 31, 2016 Compared to Year Ended December 31, 2015
Consolidated Results
Operating revenues declined $356 million, or 16%, while gross profit declined $13.9 million, or 8%.
Operating revenues
Significant items impacting these results prior to the elimination of intercompany revenues were:
|
|
• |
A $268 million, or 14%, decline in our Wholesale segment revenues primarily attributable to: |
|
|
• |
A $254 million decline (95% of the total decline in Wholesale Segment operating revenues) attributable to a decrease in the wholesale price of our motor fuel. The average daily spot price of West Texas Intermediate crude oil decreased 11% to $43.29 per barrel during 2016, compared to $48.66 per barrel during 2015. The wholesale price of motor fuel is highly correlated to the price of crude oil. |
|
|
• |
A $29.5 million decrease as a result of the divestiture of low margin wholesale fuel supply contracts and other assets acquired in the PMI acquisition, partially offset by the impact of the Erickson, One Stop, Franchised Holiday Stores and State Oil Assets acquisitions. |
|
|
• |
Partially offsetting this decline was a $15 million increase primarily related to rental income associated with the acquisition from CST of NTI retail sites in July 2015 and the State Oil Assets acquisition as well as converting company operated retail sites to lessee dealer sites. |
|
|
• |
A $205 million, or 31%, decline in our Retail segment revenues primarily attributable to: |
|
|
• |
A decline of $45 million primarily attributable to a decrease in the retail price of our motor fuel driven by a decline in wholesale motor fuel prices as noted above. |
|
|
• |
A decrease of $124 million from a 24% decrease in motor fuel volumes sold related to the conversion of company operated retail sites to lessee dealer sites during 2015 and 2016, partially offset by the incremental volume generated by the Franchised Holiday Stores acquisition. |
|
|
• |
A $37 million decline in our merchandise revenues attributable to the conversion of company operated retail sites to lessee dealer sites during 2015 and 2016, partially offset by the incremental merchandise revenues generated by the Franchised Holiday Stores acquisition. |
Intersegment revenues
We present the results of operations of our segments consistently with how our management views the business. Therefore, our segments are presented before intersegment eliminations (which consist of motor fuel sold by our Wholesale segment to our Retail segment). As a result, in order to reconcile to our consolidated change in operating revenues, a discussion of the change in intersegment revenues is included in our consolidated MD&A discussion.
Our intersegment revenues decreased $116.9 million, primarily attributable to the declines in price and volume discussed above.
Cost of sales
Cost of sales declined $343 million as a result of the decline in the wholesale price and gallons sold of motor fuel as noted above. See “Results of Operations—Segment Results” for additional gross profit analyses.
Income from CST Fuel Supply equity interests
See “Results of Operations—Segment Results—Wholesale” for discussion.
Operating expenses
See “Results of Operations—Segment Results” for additional operating expenses analyses.
47
General and administrative expenses
General and administrative expenses declined $12.1 million primarily attributable to the integration of prior year acquisitions and other cost savings initiatives, which reduced expenses by approximately $9.9 million. Additionally, equity-based compensation expense decreased $1.2 million as a result of less equity awards being granted in 2016 as compared to 2015.
Depreciation, amortization and accretion expense
Depreciation, amortization and accretion expense increased $6.2 million primarily driven by our 2015 and 2016 acquisitions.
Interest expense
Interest expense increased $4.3 million due to additional borrowings during 2015 and 2016 to fund acquisitions.
Income tax benefit
We recorded income tax benefits of $0.5 million and $3.5 million for 2016 and 2015, respectively. The decrease in the income tax benefit was primarily due to a decrease in the loss generated by our corporate subsidiaries. In addition, we recorded a reduction in the valuation allowance of $0.2 million during 2015.
Segment Results
We present the results of operations of our segments consistent with how our management views the business. Therefore, our segments are presented before intersegment eliminations (which consist of motor fuel sold by our Wholesale segment to our Retail segment). These comparisons are not necessarily indicative of future results.
48
The following table highlights the results of operations and certain operating metrics of our Wholesale segment. The narrative following these tables provides an analysis of the results of operations of that segment (thousands of dollars, except for the number of distribution sites and per gallon amounts):
|
|
|
Year Ended December 31, |
|
|||||||||
|
|
|
2017 |
|
|
2016 |
|
|
2015 |
|
|||
|
Gross profit: |
|
|
|
|
|
|
|
|
|
|
|
|
|
Motor fuel–third party |
|
$ |
34,474 |
|
|
$ |
29,242 |
|
|
$ |
29,377 |
|
|
Motor fuel–intersegment and related party |
|
|
24,370 |
|
|
|
24,870 |
|
|
|
29,229 |
|
|
Motor fuel gross profit |
|
|
58,844 |
|
|
|
54,112 |
|
|
|
58,606 |
|
|
Rent and other |
|
|
64,197 |
|
|
|
58,672 |
|
|
|
45,757 |
|
|
Total gross profit |
|
|
123,041 |
|
|
|
112,784 |
|
|
|
104,363 |
|
|
Income from CST Fuel Supply equity interests(a) |
|
|
14,906 |
|
|
|
16,048 |
|
|
|
10,528 |
|
|
Operating expenses |
|
|
(29,323 |
) |
|
|
(25,956 |
) |
|
|
(26,091 |
) |
|
Adjusted EBITDA(b) |
|
$ |
108,624 |
|
|
$ |
102,876 |
|
|
$ |
88,800 |
|
|
Motor fuel distribution sites (end of period):(c) |
|
|
|
|
|
|
|
|
|
|
|
|
|
Motor fuel–third party |
|
|
|
|
|
|
|
|
|
|
|
|
|
Independent dealers(d) |
|
|
384 |
|
|
|
403 |
|
|
|
370 |
|
|
Lessee dealers(e) |
|
|
438 |
|
|
|
420 |
|
|
|
290 |
|
|
Total motor fuel distribution–third party sites |
|
|
822 |
|
|
|
823 |
|
|
|
660 |
|
|
Motor fuel–intersegment and related party |
|
|
|
|
|
|
|
|
|
|
|
|
|
DMS (related party)(f) |
|
|
146 |
|
|
|
153 |
|
|
|
191 |
|
|
Circle K (related party) |
|
|
43 |
|
|
|
43 |
|
|
|
43 |
|
|
Commission agents (Retail segment)(g) |
|
|
181 |
|
|
|
95 |
|
|
|
66 |
|
|
Company operated retail sites (Retail segment) |
|
|
70 |
|
|
|
73 |
|
|
|
115 |
|
|
Total motor fuel distribution–intersegment and related party sites |
|
|
440 |
|
|
|
364 |
|
|
|
415 |
|
|
Motor fuel distribution sites (average during the period): |
|
|
|
|
|
|
|
|
|
|
|
|
|
Motor fuel-third party distribution |
|
|
823 |
|
|
|
749 |
|
|
|
626 |
|
|
Motor fuel-intersegment and related party distribution |
|
|
360 |
|
|
|
379 |
|
|
|
438 |
|
|
Total motor fuel distribution sites |
|
|
1,183 |
|
|
|
1,128 |
|
|
|
1,064 |
|
|
Volume of gallons distributed (in thousands) |
|
|
|
|
|
|
|
|
|
|
|
|
|
Third party |
|
|
655,754 |
|
|
|
630,777 |
|
|
|
553,849 |
|
|
Intersegment and related party |
|
|
376,212 |
|
|
|
403,808 |
|
|
|
497,508 |
|
|
Total volume of gallons distributed |
|
|
1,031,966 |
|
|
|
1,034,585 |
|
|
|
1,051,357 |
|
|
|
|
|
|
|
|
|
|
|
|
|
|
|
|
Wholesale margin per gallon |
|
$ |
0.057 |
|
|
$ |
0.052 |
|
|
$ |
0.056 |
|
|
(a) |
Represents income from our equity interest in CST Fuel Supply. |
|
(b) |
Please see the reconciliation of our segment’s Adjusted EBITDA to consolidated net income (loss) under the heading “Results of Operations—Non-GAAP Financial Measures.” |
|
(c) |
In addition, as of December 31, 2017 and 2016, respectively, we distributed motor fuel to 15 and 14 sub-wholesalers who distributed to additional sites. |
|
(d) |
The decrease in the independent dealer site count from December 31, 2016 to December 31, 2017 was primarily attributable to a net 19 terminated motor fuel supply contracts that were not renewed. |
|
(e) |
The increase in the lessee dealer site count from December 31, 2016 to December 31, 2017 was primarily attributable to the conversion of DMS and commission sites to lessee dealer sites. |
|
(f) |
The decrease in the DMS site count from December 31, 2016 to December 31, 2017 was primarily attributable to the conversion of DMS sites to lessee dealer sites. |
|
(g) |
The increase in the commission agent site count from December 31, 2016 to December 31, 2017 was primarily due to the 101 sites acquired in the Jet-Pep Assets acquisition, partially offset by the conversion of commission sites to lessee dealer sites. |
49
Year Ended December 31, 2017 Compared to Year Ended December 31, 2016
The results were driven by:
Motor fuel gross profit
The $4.7 million or 9% increase in motor fuel gross profit was primarily due to a higher margin per gallon realized primarily due to higher DTW margins as a result of the movements in crude prices throughout both periods and increased payment discounts and incentives due to the increase in motor fuel prices. The average daily spot price of WTI crude oil increased 17% to $50.78 per barrel for 2017, compared to $43.29 per barrel for 2016. See “Significant Factors Affecting our Profitability—The Significance of Crude Oil and Wholesale Motor Fuel Prices on Our Revenues, Cost of Sales and Gross Profit.”
Rent and other gross profit
Rent and other gross profit increased $5.5 million primarily as a result of our September 2016 acquisition of the State Oil Assets, as well as converting company operated retail sites to lessee dealer sites throughout 2016 and 2017, partially offset by 25 DMS sites being converted to commission agent sites in the fourth quarter of 2016, which resulted in the rent income from these 25 sites being included in the retail segment rather than the wholesale segment.
Income from CST Fuel Supply equity interests
The decline of $1.1 million was primarily attributable to CST’s July 2016 divestiture of its California and Wyoming retail sites and a decrease in volume driven by the impacts of Hurricane Harvey.
Operating expenses
Operating expenses increased $3.4 million primarily as a result of our September 2016 State Oil Assets acquisition, which is substantially offset by an increase in rent income, as well as our conversion of company operated retail sites to lessee dealer sites throughout 2016 and 2017.
Year Ended December 31, 2016 Compared to Year Ended December 31, 2015
The results were driven by:
Motor fuel gross profit
The $4.5 million decrease in motor fuel gross profit was due to a $3.6 million decline primarily from decreased payment discounts and incentives due to the decline in motor fuel prices as a result of the decrease in crude oil and the remaining decline was primarily due to a decline in motor fuel gallons sold due to the termination of commercial wholesale fuel supply contracts and disposing certain terminal assets acquired in the PMI acquisition, partially offset by the impact of the Erickson, One Stop, Franchised Holiday Stores and State Oil Assets acquisitions. The average daily spot price of West Texas Intermediate crude oil decreased 11% to $43.29 per barrel during 2016, compared to $48.66 during 2015. See “Significant Factors Affecting our Profitability—The Significance of Crude Oil and Wholesale Motor Fuel Prices on Our Revenues, Cost of Sales and Gross Profit.”
Rent and other gross profit
Rent and other margin increased $13 million primarily as a result of our acquisition from CST of NTI retail sites in July 2015 and the State Oil Assets acquisition in September 2016, as well as converting company operated retail sites to lessee dealer sites.
Income from CST Fuel Supply equity interests
Income from our investment in CST Fuel Supply increased $5.5 million as a result of the additional 12.5% equity interest we acquired in July 2015, partially offset by CST’s sale of its California and Wyoming retail sites.
Operating expenses
Operating expenses decreased $0.1 million primarily from a $5.2 million cost savings associated with disposing of certain transportation and terminal assets acquired in the PMI acquisition, partially offset by an increase in operating expenses driven by our acquisitions.
50
The following table highlights the results of operations and certain operating metrics of our Retail segment. The narrative following these tables provides an analysis of the results of operations of that segment (thousands of dollars, except for the number of retail sites and per gallon amounts):
|
|
|
Year Ended December 31, |
|
|||||||||
|
|
|
2017 |
|
|
2016 |
|
|
2015 |
|
|||
|
Gross profit: |
|
|
|
|
|
|
|
|
|
|
|
|
|
Motor fuel |
|
$ |
7,276 |
|
|
$ |
8,538 |
|
|
$ |
19,444 |
|
|
Merchandise and services |
|
|
25,434 |
|
|
|
30,068 |
|
|
|
41,690 |
|
|
Rent and other |
|
|
5,001 |
|
|
|
4,073 |
|
|
|
4,014 |
|
|
Total gross profit |
|
|
37,711 |
|
|
|
42,679 |
|
|
|
65,148 |
|
|
Operating expenses |
|
|
(31,974 |
) |
|
|
(35,118 |
) |
|
|
(46,138 |
) |
|
Acquisition-related costs |
|
|
— |
|
|
|
212 |
|
|
|
— |
|
|
Inventory fair value adjustments(a) |
|
|
— |
|
|
|
91 |
|
|
|
1,356 |
|
|
Adjusted EBITDA(b) |
|
$ |
5,737 |
|
|
$ |
7,864 |
|
|
$ |
20,366 |
|
|
|
|
|
|
|
|
|
|
|
|
|
|
|
|
Retail sites (end of period): |
|
|
|
|
|
|
|
|
|
|
|
|
|
Commission agents(c) |
|
|
181 |
|
|
|
95 |
|
|
|
66 |
|
|
Company operated retail sites(d) |
|
|
71 |
|
|
|
76 |
|
|
|
116 |
|
|
Total system sites at the end of the period |
|
|
252 |
|
|
|
171 |
|
|
|
182 |
|
|
|
|
|
|
|
|
|
|
|
|
|
|
|
|
Total system operating statistics: |
|
|
|
|
|
|
|
|
|
|
|
|
|
Average retail fuel sites during the period(c)(d) |
|
|
168 |
|
|
|
157 |
|
|
|
202 |
|
|
Motor fuel sales (gallons per site per day) |
|
|
2,620 |
|
|
|
2,780 |
|
|
|
2,862 |
|
|
Motor fuel gross profit per gallon, net of credit card fees and commissions |
|
$ |
0.045 |
|
|
$ |
0.053 |
|
|
$ |
0.092 |
|
|
|
|
|
|
|
|
|
|
|
|
|
|
|
|
Commission agents statistics: |
|
|
|
|
|
|
|
|
|
|
|
|
|
Average retail fuel sites during the period(c) |
|
|
97 |
|
|
|
71 |
|
|
|
70 |
|
|
Motor fuel gross profit per gallon, net of credit card fees and commissions |
|
$ |
0.011 |
|
|
$ |
0.018 |
|
|
$ |
0.023 |
|
|
|
|
|
|
|
|
|
|
|
|
|
|
|
|
Company operated retail site statistics: |
|
|
|
|
|
|
|
|
|
|
|
|
|
Average retail fuel sites during the period(d) |
|
|
71 |
|
|
|
86 |
|
|
|
132 |
|
|
Motor fuel gross profit per gallon, net of credit card fees |
|
$ |
0.087 |
|
|
$ |
0.085 |
|
|
$ |
0.130 |
|
|
Merchandise and services gross profit percentage, net of credit card fees |
|
|
24.4 |
% |
|
|
24.6 |
% |
|
|
26.3 |
% |
|
(a) |
The inventory fair value adjustment represents the expensing of the step-up in value ascribed to inventory acquired in the Franchised Holiday Stores acquisition. |
|
(b) |
Please see the reconciliation of our segment’s Adjusted EBITDA to consolidated net income under the heading “Results of Operations—Non-GAAP Financial Measures” below. |
|
(c) |
The increase in the commission agent site count from December 31, 2016 to December 31, 2017 was due primarily to the 101 sites acquired in the Jet-Pep Assets acquisition, partially offset by the conversion of commission sites to lessee dealer sites. |
|
(d) |
The decrease in company operated retail sites relates to the conversion of company operated retail sites to lessee dealer sites. |
51
Year Ended December 31, 2017 Compared to Year Ended December 31, 2016
Gross profit declined $5.0 million, while operating expenses declined $3.1 million.
These results were impacted by:
Gross profit
|
|
• |
Our motor fuel gross profit decreased $1.3 million attributable to a 15% decrease in margin per gallon as a result of the movement in crude oil prices throughout the two periods. See “Significant Factors Affecting our Profitability—The Significance of Crude Oil and Wholesale Motor Fuel Prices on Our Revenues, Cost of Sales and Gross Profit.” |
|
|
• |
Our merchandise and services gross profit decreased $4.6 million or 15% as a result of the conversion of company operated retail sites to lessee dealer sites, partially offset by the incremental gross profit generated by the March 2016 Franchised Holiday Stores acquisition. |
|
|
• |
Our rent and other gross profit increased $0.9 million primarily from 25 DMS sites being converted to commission agent sites in the fourth quarter of 2016, which resulted in the rent income from these sites being included in the retail segment rather than the wholesale segment. In the second quarter of 2017, some of these 25 sites were converted to lessee dealer sites, which resulted in the rent income being included in the wholesale segment rather than the retail segment. |
Operating expenses
|
|
• |
The $3.1 million decline in operating expenses was attributable to the conversion of company operated retail sites to lessee dealer sites, partially offset by the impact of the March 2016 Franchised Holiday Stores acquisition and the 25 DMS sites being converted to commission agent sites in the fourth quarter of 2016. In the second quarter of 2017, some of these 25 sites were converted to lessee dealer sites, which resulted in the operating expenses being included in the wholesale segment rather than the retail segment. |
Year Ended December 31, 2016 Compared to Year Ended December 31, 2015
Gross profit declined $22.5 million, while operating expenses declined $11.0 million.
These results were impacted by:
Gross profit
|
|
• |
Our motor fuel gross profit decreased $10.9 million attributable to a 24% decrease in volume driven by the conversion of company operated retail sites acquired in prior acquisitions to lessee dealer sites during 2015 and 2016 and a 42% decrease in margin per gallon as a result of crude oil prices being more volatile during the second half of 2015 than the second half of 2016 and the resulting impact on our motor fuel gross margin. The daily spot price of WTI crude oil decreased approximately 35% during the last six months of 2015 compared to an increase of approximately 10% during the same period of 2016. See “Significant Factors Affecting our Profitability—The Significance of Crude Oil and Wholesale Motor Fuel Prices on Our Revenues, Cost of Sales and Gross Profit.” |
|
|
• |
Our merchandise and services gross profit declined $11.6 million as a result of the conversion of company operated retail sites to lessee dealer sites in 2015 and 2016, partially offset by the incremental gross profit generated by the Franchised Holiday Stores acquisition. The decline in our merchandise gross profit percentage was the result of low gross margin items, such as cigarettes, comprising a higher percentage of our merchandise sales as a result of the change in product mix of our stores following our 2015 acquisitions and conversion of company operated retail sites to lessee dealer sites. |
Operating expenses
|
|
• |
An $11.0 million decline in operating expenses attributable to the conversion of company operated retail sites to lessee dealer sites, partially offset by the impact of the Erickson, One Stop and Franchised Holiday Stores acquisitions. |
52
We use non-GAAP financial measures EBITDA, Adjusted EBITDA, Distributable Cash Flow and Distribution Coverage Ratio. EBITDA represents net income available to us before deducting interest expense, income taxes, depreciation, amortization and accretion. Adjusted EBITDA represents EBITDA as further adjusted to exclude equity funded expenses related to incentive compensation and the Amended Omnibus Agreement, gains or losses on sales of assets, certain discrete acquisition related costs, such as legal and other professional fees and severance expenses associated with recently acquired companies, and certain other discrete non-cash items arising from purchase accounting. Distributable Cash Flow represents Adjusted EBITDA less cash interest expense, sustaining capital expenditures and current income tax expense. Distribution Coverage Ratio is computed by dividing Distributable Cash Flow by the weighted average diluted common and subordinated units and then dividing that result by the distributions paid per limited partner unit.
EBITDA, Adjusted EBITDA, Distributable Cash Flow and Distribution Coverage Ratio are used as supplemental financial measures by management and by external users of our financial statements, such as investors and lenders. EBITDA and Adjusted EBITDA are used to assess our financial performance without regard to financing methods, capital structure or income taxes and the ability to incur and service debt and to fund capital expenditures. In addition, Adjusted EBITDA is used to assess the operating performance of our business on a consistent basis by excluding the impact of items which do not result directly from the wholesale distribution of motor fuel, the leasing of real property, or the day to day operations of our retail site activities. EBITDA, Adjusted EBITDA, Distributable Cash Flow and Distribution Coverage Ratio are also used to assess the ability to generate cash sufficient to make distributions to our unitholders.
We believe the presentation of EBITDA, Adjusted EBITDA, Distributable Cash Flow and Distribution Coverage Ratio provides useful information to investors in assessing the financial condition and results of operations. EBITDA, Adjusted EBITDA, Distributable Cash Flow and Distribution Coverage Ratio should not be considered alternatives to net income or any other measure of financial performance or liquidity presented in accordance with U.S. GAAP. EBITDA, Adjusted EBITDA, Distributable Cash Flow and Distribution Coverage Ratio have important limitations as analytical tools because they exclude some but not all items that affect net income. Additionally, because EBITDA, Adjusted EBITDA, Distributable Cash Flow and Distribution Coverage Ratio may be defined differently by other companies in our industry, our definitions may not be comparable to similarly titled measures of other companies, thereby diminishing their utility.
The following table presents reconciliations of EBITDA, Adjusted EBITDA, and Distributable Cash Flow to net income, the most directly comparable U.S. GAAP financial measure, for each of the periods indicated (in thousands, except for per unit amounts):
|
|
|
Year Ended December 31, |
|
|||||||||
|
|
|
2017 |
|
|
2016 |
|
|
2015 |
|
|||
|
Net income available to limited partners |
|
$ |
18,821 |
|
|
$ |
7,312 |
|
|
$ |
10,051 |
|
|
Interest expense |
|
|
27,919 |
|
|
|
22,757 |
|
|
|
18,493 |
|
|
Income tax benefit |
|
|
(18,237 |
) |
|
|
(453 |
) |
|
|
(3,542 |
) |
|
Depreciation, amortization and accretion |
|
|
57,470 |
|
|
|
54,412 |
|
|
|
48,227 |
|
|
EBITDA |
|
|
85,973 |
|
|
|
84,028 |
|
|
|
73,229 |
|
|
Equity funded expenses related to incentive compensation and the Amended Omnibus Agreement (a) |
|
|
15,131 |
|
|
|
16,060 |
|
|
|
14,036 |
|
|
Gain on sales of assets, net |
|
|
(3,401 |
) |
|
|
(198 |
) |
|
|
(2,719 |
) |
|
Acquisition-related costs (b) |
|
|
11,374 |
|
|
|
3,318 |
|
|
|
4,412 |
|
|
Working capital adjustment |
|
|
— |
|
|
|
335 |
|
|
|
— |
|
|
Inventory fair value adjustments |
|
|
— |
|
|
|
91 |
|
|
|
1,356 |
|
|
Adjusted EBITDA |
|
|
109,077 |
|
|
|
103,634 |
|
|
|
90,314 |
|
|
Cash interest expense |
|
|
(26,211 |
) |
|
|
(20,974 |
) |
|
|
(16,689 |
) |
|
Sustaining capital expenditures (c) |
|
|
(1,648 |
) |
|
|
(798 |
) |
|
|
(1,318 |
) |
|
Current income tax expense |
|
|
16 |
|
|
|
(234 |
) |
|
|
(2,574 |
) |
|
Distributable Cash Flow |
|
$ |
81,234 |
|
|
$ |
81,628 |
|
|
$ |
69,733 |
|
|
Weighted average diluted common and subordinated units |
|
|
33,855 |
|
|
|
33,367 |
|
|
|
29,086 |
|
|
Distributions paid per limited partner unit (d) |
|
$ |
2.4800 |
|
|
$ |
2.4000 |
|
|
$ |
2.2300 |
|
|
Distribution Coverage Ratio (e) |
|
0.97x |
|
|
1.02x |
|
|
1.08x |
|
|||
53
|
(b) |
Relates to certain discrete acquisition related costs, such as legal and other professional fees, separation benefit costs and purchase accounting adjustments associated with recently acquired businesses. Acquisition-related costs for 2017 include certain separation benefit costs and retention bonuses paid to certain EICP participants associated with the Merger. Acquisition-related costs for 2017 also includes a $1.7 million charge related to a court ruling in favor of a former executive’s claim to benefits under the EICP in connection with CST’s acquisition of our General Partner. See “Significant Factors Affecting our Profitability—Separation Benefits and Retention Bonuses” for additional information. |
|
(c) |
Under the Partnership Agreement, sustaining capital expenditures are capital expenditures made to maintain our long-term operating income or operating capacity. Examples of sustaining capital expenditures are those made to maintain existing contract volumes, including payments to renew existing distribution contracts, or to maintain our sites in conditions suitable to lease, such as parking lot or roof replacement/renovation, or to replace equipment required to operate the existing business. |
|
(d) |
On January 24, 2018, the Board approved a quarterly distribution of $0.6275 per unit attributable to the fourth quarter of 2017. The distribution is payable on February 12, 2018 to all unitholders of record on February 5, 2018. |
|
(e) |
The distribution coverage ratio is computed by dividing Distributable Cash Flow by the weighted average diluted common and subordinated units and then dividing that result by the distributions paid per limited partner unit. |
The following table reconciles our segment Adjusted EBITDA to Consolidated Adjusted EBITDA presented in the table above (in thousands):
|
|
|
Year Ended December 31, |
|
|||||||||
|
|
|
2017 |
|
|
2016 |
|
|
2015 |
|
|||
|
Adjusted EBITDA - Wholesale segment |
|
$ |
108,624 |
|
|
$ |
102,876 |
|
|
$ |
88,800 |
|
|
Adjusted EBITDA - Retail segment |
|
|
5,737 |
|
|
|
7,864 |
|
|
|
20,366 |
|
|
Adjusted EBITDA - Total segment |
|
$ |
114,361 |
|
|
$ |
110,740 |
|
|
$ |
109,166 |
|
|
Reconciling items: |
|
|
|
|
|
|
|
|
|
|
|
|
|
Elimination of intersegment profit in ending inventory balance |
|
|
14 |
|
|
|
104 |
|
|
|
(47 |
) |
|
General and administrative expenses |
|
|
(27,887 |
) |
|
|
(24,156 |
) |
|
|
(36,238 |
) |
|
Other income (expense), net |
|
|
439 |
|
|
|
848 |
|
|
|
396 |
|
|
Equity funded expenses related to incentive compensation and the Amended Omnibus Agreement |
|
|
15,131 |
|
|
|
16,060 |
|
|
|
14,036 |
|
|
Working capital adjustment |
|
|
— |
|
|
|
335 |
|
|
|
— |
|
|
Acquisition-related costs |
|
|
11,374 |
|
|
|
3,106 |
|
|
|
4,412 |
|
|
Net income attributable to noncontrolling interests |
|
|
(18 |
) |
|
|
(11 |
) |
|
|
(21 |
) |
|
IDR distributions |
|
|
(4,337 |
) |
|
|
(3,392 |
) |
|
|
(1,390 |
) |
|
Consolidated Adjusted EBITDA |
|
$ |
109,077 |
|
|
$ |
103,634 |
|
|
$ |
90,314 |
|
54
Liquidity and Capital Resources
Liquidity
Our principal liquidity requirements are to finance our operations, fund acquisitions, service our debt and pay distributions to our unitholders and IDR distributions. We expect our ongoing sources of liquidity to include cash generated by our operations and borrowings under the revolving credit facility and, if available to us on acceptable terms, issuances of equity and debt securities. We regularly evaluate alternate sources of capital, including sale-leaseback financing of real property with third parties, to support our liquidity requirements.
Our ability to meet our debt service obligations and other capital requirements, including capital expenditures, acquisitions, and partnership distributions, will depend on our future operating performance, which, in turn, will be subject to general economic, financial, business, competitive, legislative, regulatory and other conditions, many of which are beyond our control. As a normal part of our business, depending on market conditions, we will, from time to time, consider opportunities to repay, redeem, repurchase or refinance our indebtedness. Changes in our operating plans, lower than anticipated sales, increased expenses, acquisitions or other events may cause us to seek additional debt or equity financing in future periods.
We believe that we will have sufficient cash flow from operations, borrowing capacity under the revolving credit facility and access to capital markets and alternate sources of funding to meet our financial commitments, debt service obligations, contingencies, anticipated capital expenditures and partnership distributions. However, we are subject to business and operational risks that could adversely affect our cash flow. A material decrease in our cash flows would likely produce an adverse effect on our borrowing capacity as well as our ability to issue additional equity and/or debt securities.
Cash Flows
The following table summarizes cash flow activity (in thousands):
|
|
|
Year Ended December 31, |
|
|||||||||
|
|
|
2017 |
|
|
2016 |
|
|
2015 |
|
|||
|
Net cash provided by operating activities |
|
$ |
88,960 |
|
|
$ |
79,440 |
|
|
$ |
64,487 |
|
|
Net cash used in investing activities |
|
|
(60,113 |
) |
|
|
(96,906 |
) |
|
|
(311,518 |
) |
|
Net cash (used in) provided by financing activities |
|
|
(26,300 |
) |
|
|
17,624 |
|
|
|
233,053 |
|
Operating Activities
Net cash provided by operating activities increased $9.5 million for 2017 compared to 2016, driven primarily by incremental cash flow generated by our March 2016 Franchised Holiday Stores, September 2016 State Oil Assets and November 2017 Jet-Pep Assets acquisitions. In addition, we paid $1.1 million more of the management fees related to the services provided under the Amended Omnibus Agreement in common units issued to CST (pre-Merger) and Circle K (post-Merger) in 2017 compared to 2016.
Net cash provided by operating activities increased $15.0 million in 2016 compared to 2015, driven primarily by incremental cash flow generated by our acquisitions. In addition, we settled $3.2 million more in management fees in equity with CST in 2016 compared to 2015.
Investing Activities
In 2017, we paid $75.6 million in the Jet-Pep Assets acquisition and incurred $12.5 million in capital expenditures. In addition, we received $27.6 million of proceeds on sales, largely driven by the sale of 29 properties to DMR and two properties sold as a result of the FTC’s requirements associated with the Merger.
In 2016, we paid $94.2 million in the Franchised Holiday Stores and State Oil Assets acquisitions and $2.9 million for independent dealer and sub-wholesaler contracts purchased from CST. We also incurred $20.8 million of capital expenditures and received $17.5 million in proceeds from the refund payment related to CST's sale of the California and Wyoming assets.
In 2015, we paid $167.8 million in the Landmark Assets, Erickson and One Stop acquisitions and $141.9 million on the acquisitions of CST’s NTIs and CST Fuel Supply equity interests. We also had $10.2 million in capital expenditures.
55
In 2017, we paid $88.2 million in distributions and made net borrowings on our credit facility of $64.5 million.
In 2016, we paid $83.6 million in distributions and purchased $3.3 million in common units under our common unit purchase program. We received $25.0 million in proceeds on the sale-leaseback transaction and had $83.1 million in net borrowings under our credit facility to fund our acquisitions.
In 2015, we received $144.9 million in net proceeds on equity offerings and $158.0 million in net borrowings under our credit facility to fund our acquisitions. We paid $66.1 million in distributions and purchased $3.6 million in common units under our common unit purchase program.
Refund payment related to CST sale of California and Wyoming assets
On July 7, 2016, in connection with the divestiture of certain California and Wyoming assets and the related decrease in supplied fuel volumes and as approved by the independent conflicts committee of the Board, CST provided a refund payment to the purchase price paid by us for our interest in CST Fuel Supply. The total refund payment received by us was approximately $18.2 million. See Note 12 to the financial statements for additional information.
Distributions
Distribution activity for 2017 was as follows:
|
Quarter Ended |
|
Record Date |
|
Payment Date |
|
Cash Distribution (per unit) |
|
|
Cash Distribution (in thousands) |
|
||
|
December 31, 2016 |
|
February 6, 2017 |
|
February 13, 2017 |
|
$ |
0.6125 |
|
|
$ |
20,541 |
|
|
March 31, 2017 |
|
May 8, 2017 |
|
May 15, 2017 |
|
|
0.6175 |
|
|
|
20,832 |
|
|
June 30, 2017 |
|
August 7, 2017 |
|
August 14, 2017 |
|
|
0.6225 |
|
|
|
21,081 |
|
|
September 30, 2017 |
|
November 6, 2017 |
|
November 13, 2017 |
|
|
0.6275 |
|
|
|
21,332 |
|
|
December 31, 2017 |
|
February 5, 2018 |
|
February 12, 2018 |
|
|
0.6275 |
|
|
|
21,413 |
|
The amount of any distribution is subject to the discretion of the Board, which may modify or revoke our cash distribution policy at any time. Our Partnership Agreement does not require us to pay any distributions. As such, there can be no assurance we will continue to pay distributions in the future.
IDRs
We distributed $4.3 million and $3.4 million to CST and Circle K with respect to the IDRs in 2017 and 2016, respectively.
Expiration of the Subordination Period
In accordance with the terms of the Partnership Agreement, on February 25, 2016, the first business day after the payment of the fourth quarter 2015 distribution of $0.5925 per unit, the subordination period under the Partnership Agreement ended. At that time, each of the 7,525,000 outstanding subordinated units converted into one common unit and now participates in distributions pro rata with other common units.
Debt
As of December 31, 2017, our consolidated debt and capital lease obligations consisted of the following (in thousands):
|
$550 million revolving credit facility |
|
$ |
506,000 |
|
|
Capital lease obligations |
|
|
27,220 |
|
|
Note payable |
|
|
765 |
|
|
Total debt and capital lease obligations |
|
|
533,985 |
|
|
Current portion |
|
|
2,916 |
|
|
Noncurrent portion |
|
|
531,069 |
|
|
Deferred financing costs, net |
|
|
1,922 |
|
|
Noncurrent portion, net of deferred financing costs |
|
$ |
529,147 |
|
56
Our revolving credit facility is secured by substantially all of our assets. Our borrowings under the revolving credit facility had a weighted-average interest rate of 4.44% as of December 31, 2017 (LIBOR plus an applicable margin, which was 3.00% as of December 31, 2017). Letters of credit outstanding at December 31, 2017 totaled $6.7 million. The amount of availability under the revolving credit facility at February 21, 2018, after taking into consideration debt covenant restrictions, was $17.6 million. In connection with future acquisitions, the revolving credit facility requires, among other things, that we have, after giving effect to such acquisition, at least $20 million in the aggregate of borrowing availability under the revolving credit facility and unrestricted cash on the balance sheet on the date of such acquisition. We are required to maintain a total leverage ratio (as defined in the revolving credit facility) for the most recently completed four fiscal quarters of less than or equal to 4.50 : 1.00, except for the quarter in which a material acquisition occurs and the first three full fiscal quarters following a material acquisition, generally defined as an acquisition with a purchase price of at least $30.0 million, with a ratio of 5.00 : 1.00, and a consolidated interest coverage ratio (as defined in the revolving credit facility) of greater than or equal to 2.75 : 1.00. The computation of our total leverage ratio allows for a pro forma application of the EBITDA (as defined in the revolving credit facility) of acquired entities and was 4.14 : 1.00 as of December 31, 2017. As of December 31, 2017, we were in compliance with these financial covenant ratios.
Renegotiation of Rocky Top Purchase Obligation
In connection with the Rocky Top acquisition that we completed in September 2013, we entered into a deferred seller financing arrangement, which obligated us to purchase certain sites over a 5-year period for an average $5.2 million per year beginning in 2016 at an approximately 7.7% capitalization rate. In June 2016, we renegotiated the terms with the sellers, eliminating the deferred seller financing obligation and agreeing to terms of a new lease of the assets for an initial term of 15 years and eight months with four renewal options of five years each. Under this triple net lease, annual rent is initially $1.8 million based on a 6.5% capitalization rate and increases 1.5% per year. However, because of the continuing involvement we have with the sites through the lease and sublease of the properties, we recorded the liability on our balance sheet at fair value in June 2016, which approximated its carrying value. This sale-leaseback liability is classified within accrued expenses and other current liabilities and other noncurrent liabilities on the balance sheet.
Sale Leaseback Transaction
In December 2016, we sold the real property at 17 sites acquired through the State Oil Assets asset acquisition for cash proceeds of $25.0 million, which were used to repay borrowings on the credit facility. We leased these properties for an initial term of 15 years with three renewal options of approximately five years each. Under the triple net lease, annual rent is initially $1.6 million based on a 6.5% capitalization rate and increases every five years based on inflation. Because of the continuing involvement we have with the sites through the lease and sublease of the properties, we recorded a liability for the proceeds received and are amortizing this liability over the lease term as rent payments are made. This sale-leaseback liability is classified within accrued expenses and other current liabilities and other noncurrent liabilities on the balance sheet.
Capital Expenditures
We make investments to expand, upgrade and enhance existing assets. We categorize our capital requirements as either sustaining capital expenditures, growth capital expenditures or acquisition capital expenditures. Sustaining capital expenditures are those capital expenditures required to maintain our long-term operating income or operating capacity. Acquisition and growth capital expenditures are those capital expenditures that we expect will increase our operating income or operating capacity over the long term. We have the ability to fund our capital expenditures by additional borrowings under our revolving credit facility or, if available to us on acceptable terms, issuing additional equity, debt securities or other options, such as the sale of assets. With the significant decline in energy prices since 2014, access to the capital markets has tightened for the energy and MLP industries as a whole, which has impacted our cost of capital and our ability to raise equity and debt financing at favorable terms. Our ability to access the capital markets may have an impact on our ability to fund acquisitions. We may not be able to complete any offering of securities or other options on terms acceptable to us, if at all.
The following table outlines our capital expenditures and acquisitions for 2017, 2016 and 2015 (in thousands):
|
|
|
Year Ended December 31, |
|
|||||||||
|
|
|
2017 |
|
|
2016 |
|
|
2015 |
|
|||
|
Sustaining capital |
|
$ |
1,648 |
|
|
$ |
798 |
|
|
$ |
1,318 |
|
|
Growth |
|
|
10,840 |
|
|
|
19,978 |
|
|
|
8,865 |
|
|
Acquisitions |
|
|
75,627 |
|
|
|
97,134 |
|
|
|
309,702 |
|
|
Total capital expenditures and acquisitions |
|
$ |
88,115 |
|
|
$ |
117,910 |
|
|
$ |
319,885 |
|
57
Our contractual obligations as of December 31, 2017 are summarized below (in thousands):
|
|
|
Payments Due by Period |
|
|||||||||||||||||||||||||
|
|
|
2018 |
|
|
2019 |
|
|
2020 |
|
|
2021 |
|
|
2022 |
|
|
Thereafter |
|
|
Total |
|
|||||||
|
Long-term debt |
|
$ |
765 |
|
|
$ |
506,000 |
|
|
$ |
— |
|
|
$ |
— |
|
|
$ |
— |
|
|
$ |
— |
|
|
$ |
506,765 |
|
|
Interest payments on debt |
|
|
22,282 |
|
|
|
3,711 |
|
|
|
— |
|
|
|
— |
|
|
|
— |
|
|
|
— |
|
|
|
25,993 |
|
|
Capital lease obligations |
|
|
2,975 |
|
|
|
3,079 |
|
|
|
3,176 |
|
|
|
3,274 |
|
|
|
3,374 |
|
|
|
15,799 |
|
|
|
31,677 |
|
|
Operating lease obligations |
|
|
17,249 |
|
|
|
15,629 |
|
|
|
13,377 |
|
|
|
10,702 |
|
|
|
9,113 |
|
|
|
29,810 |
|
|
|
95,880 |
|
|
Management fees |
|
|
10,272 |
|
|
|
7,704 |
|
|
|
— |
|
|
|
— |
|
|
|
— |
|
|
|
— |
|
|
|
17,976 |
|
|
Sale-leaseback obligations |
|
|
6,605 |
|
|
|
6,673 |
|
|
|
6,649 |
|
|
|
6,740 |
|
|
|
6,832 |
|
|
|
62,886 |
|
|
|
96,385 |
|
|
Other liabilities |
|
|
— |
|
|
|
6,116 |
|
|
|
1,221 |
|
|
|
821 |
|
|
|
718 |
|
|
|
41,567 |
|
|
|
50,443 |
|
|
Total consolidated obligations |
|
$ |
60,148 |
|
|
$ |
548,912 |
|
|
$ |
24,423 |
|
|
$ |
21,537 |
|
|
$ |
20,037 |
|
|
$ |
150,062 |
|
|
$ |
825,119 |
|
Interest Payments on Debt
Such amounts include estimates of interest expense related to our credit facility assuming a 4.5% interest rate.
Capital Lease Obligations
We have certain retail site properties under capital leases. Capital lease obligations in the table above include both principal and interest.
Operating Lease Obligations
The operating lease obligations include leases for land, office facilities and retail sites. Operating lease obligations reflected in the table above include all operating leases that have initial or remaining non-cancelable terms in excess of one year, and are not reduced by minimum rentals to be received by us under subleases. In addition, such amounts do not reflect contingent rentals that may be incurred in addition to minimum rentals.
Our principal executive offices are in Allentown, Pennsylvania, in an office space leased by Circle K, for which the rent is charged to us as a cost under the Amended Omnibus Agreement. Future lease payments on this office lease are included within operating lease obligations.
Sale Leaseback Obligations
The payments in the table above represent payments on sale-leaseback transactions for which the sale was not recognized as a result of the continuing involvement with the sites. As such, the table above includes the payments under the lease.
Management Fees
The payments in the table above represent contractually obligated payments under the Amended Omnibus Agreement. See Note 12 to the financial statements for additional information.
Other Liabilities
Other liabilities include asset retirement obligations described in Note 10 to the financial statements and exclude other liabilities whose payment period or amount is not determinable. For purposes of reflecting amounts for asset retirement obligations in the table above, we have made our best estimate of expected payments based on information available as of December 31, 2017.
Under the terms of various supply agreements, the Partnership is obligated to minimum volume purchases measured in gallons of motor fuel. Future minimum volume purchase requirements are 347 million gallons in 2018, reducing to 33 million gallons in 2022. Future minimum volume purchase requirements from 2023 through 2024 total 50 million gallons. The aggregate dollar amount of the future minimum volume purchase requirements is dependent on the future weighted average wholesale cost per gallon charged under the applicable supply agreements. The amounts and timing of the related payment obligations cannot reasonably be estimated reliably. As a result, payment of these amounts has been excluded from the table above. See Note 15 to the financial statements for additional information.
58
Off-Balance Sheet Arrangements
The Amended Omnibus Agreement contingently requires us to perform environmental remediation work as further discussed in Note 14 to the financial statements. We also have operating leases and motor fuel purchase commitments as previously discussed in “Contractual Obligations” and in Notes 13 and 15 to the financial statements.
Other Matters Impacting Liquidity and Capital Resources
Concentration of Customers
In 2017, we distributed approximately 13% of our total wholesale distribution volumes to DMS and its affiliates and DMS and its affiliates accounted for approximately 22% of our rental income. In 2017, we distributed 8% of our total wholesale distribution volume to Circle K retail sites that are not supplied by CST Fuel Supply and received 20% of our rental income from Circle K. For more information regarding transactions with DMS and its affiliates and CST or Circle K, see Note 12 to the financial statements for additional information.
Common Unit Offering
On June 19, 2015, we closed on the sale to the public of 4.6 million common units for net proceeds of approximately $138.5 million. On July 16, 2015, we closed on the sale of an additional 0.2 million common units for net proceeds of approximately $6.4 million in accordance with the underwriters’ option to purchase additional common units. See Note 17 to the financial statements for additional information.
Partnership Common Unit Purchases by CST
On September 21, 2015, CST approved a common unit purchase program under Rule 10b-18 of the Exchange Act, authorizing CST to purchase up to an aggregate of $50 million of the common units representing limited partner interests in the Partnership. The unit purchase program does not have a fixed expiration date and may be modified, suspended or terminated at any time at CST’s discretion. CST made no purchases under the common unit purchase program during 2016 or 2017. From inception until December 31, 2015, CST had purchased $19.8 million, or 804,667 common units, at an average price of $24.64 per common unit, which common units cannot be transferred absent registration with the SEC or an available exemption from the SEC’s registration requirements.
Common Unit Repurchase Program
In November 2015, the Board approved a common unit repurchase program under Rule 10b-18 of the Exchange Act authorizing us to repurchase up to an aggregate of $25 million of the common units representing limited partner interests in the Partnership. Under the program, we may make purchases in the open market in accordance with Rule 10b-18 of the Exchange Act, or in privately negotiated transactions, pursuant to a trading plan under Rule 10b5-1 of the Exchange Act or otherwise. Any purchases will be funded from available cash on hand. The common unit repurchase program does not require us to acquire any specific number of common units and may be suspended or terminated by us at any time without prior notice. The purchases will not be made from any officer, director or control person of the Partnership or CST. We did not repurchase any common units under the plan in 2017. The following table shows the purchases made through December 31, 2016:
|
Period |
|
Total Number of Units Purchased |
|
|
Average Price Paid per Unit |
|
|
Total Cost of Units Purchased |
|
|
Amount Remaining under the Program |
|
||||
|
2015 |
|
|
154,158 |
|
|
$ |
23.37 |
|
|
$ |
3,603,071 |
|
|
$ |
21,396,929 |
|
|
2016 |
|
|
133,463 |
|
|
|
24.37 |
|
|
|
3,252,653 |
|
|
|
18,144,276 |
|
|
Total |
|
|
287,621 |
|
|
$ |
23.84 |
|
|
$ |
6,855,724 |
|
|
$ |
18,144,276 |
|
Purchase of CST Fuel Supply Equity Interests
In January 2015 and again in July 2015, we closed on the purchase of a 5% and 12.5%, respectively, limited partner equity interest in CST Fuel Supply for aggregate consideration of 4.8 million common units and cash in the amount of $17.5 million. See Note 12 to the financial statements for additional information.
59
Acquisition of Landmark Assets
In January 2015, in connection with the joint acquisition by CST and CrossAmerica of 22 retail sites from Landmark Assets, we acquired the real property of the 22 fee sites for $41.2 million. See Note 3 to the financial statements for additional information.
Acquisition of Erickson
In February 2015, we closed on the purchase of all of the outstanding capital stock of Erickson and certain related assets for an aggregate purchase price of $83.8 million, including working capital and net of cash acquired. See Note 3 to the financial statements for additional information.
Purchase of NTI retail sites
In July 2015, we completed the purchase of real property at 29 NTIs from CST in exchange for an aggregate consideration of approximately 0.3 million common units and cash in the amount of $124.4 million, with an aggregate consideration of $134.0 million on the date of closing. See Note 12 to the financial statements for additional information.
Acquisition of One Stop
In July 2015, we closed on the purchase of retail sites from One Stop and certain related assets for $45.0 million, including working capital and net of cash acquired. See Note 3 to the financial statements for additional information.
Purchase of Wholesale Fuel Supply Contracts from CST
In February 2016, CST sold 21 independent dealer contracts and 11 sub-wholesaler contracts to us for $2.9 million. See Notes 3 and 12 to the financial statements for additional information.
Acquisition of Franchised Holiday Stores
On March 29, 2016, we closed on the acquisition of 31 Franchise Holiday Stores and three company operated liquor stores from S/S/G Corporation for approximately $52.4 million, including working capital. See Note 3 to the financial statements for additional information.
Acquisition of State Oil Assets
On September 27, 2016, we acquired certain assets of State Oil Company located in the greater Chicago market for approximately $41.9 million, including working capital. See Note 3 to the financial statements for additional information.
Acquisition of Jet-Pep Assets
On November 28, 2017, we acquired certain assets of Jet-Pep, Inc. and affiliated companies located in Alabama for approximately $75.6 million, including working capital. See Note 3 to the financial statements for additional information.
Contingencies
Environmental Matters
See Note 14 to the financial statements for a discussion of our environmental matters.
Legal Matters
See Note 15 to the financial statements for a discussion of our legal matters.
Quarterly Results of Operations
See Note 23 to the financial statements for financial and operating quarterly data for each quarter of 2017 and 2016.
60
As noted previously, the prices paid to our motor fuel suppliers for wholesale motor fuel (which affects our costs of sales) are highly correlated to the price of crude oil. The crude oil commodity markets are highly volatile, and the market prices of crude oil, and, correspondingly, the market prices of wholesale motor fuel, experience significant and rapid fluctuations, which affect our motor fuel gross profit. See “Significant Factors Affecting our Profitability—The Significance of Crude Oil and Wholesale Motor Fuel Prices on Our Revenues, Cost of Sales and Gross Profit” for additional information.
We expect our rent income to increase in 2018 based on our recent acquisitions and our expectation that we will continue to convert company operated retail sites to lessee dealers.
We will continue to evaluate acquisitions on an opportunistic basis. Additionally, we will pursue acquisition targets that fit into our strategy. Whether we will be able to execute acquisitions will depend on market conditions, availability of suitable acquisition targets at attractive terms, acquisition related compliance with customary regulatory requirements, and our ability to finance such acquisitions on favorable terms and in compliance with our debt covenant restrictions.
New Accounting Policies
For information on recent accounting pronouncements impacting our business, see Note 2 to the financial statements.
Critical Accounting Policies Involving Critical Accounting Estimates
We prepare our financial statements in conformity with U.S. GAAP. The preparation of these financial statements requires us to make estimates and assumptions that affect the reported amounts of assets and liabilities and disclosure of contingent assets and liabilities at the date of the financial statements and the reported amount of revenues and expenses during the reporting period. Actual results could differ from those estimates. See Note 2 to the financial statements for a summary of our significant accounting policies.
Critical accounting policies are those we believe are both most important to the portrayal of our financial condition and results, and require our most difficult, subjective or complex judgments, often because we must make estimates about the effect of matters that are inherently uncertain. Judgments and uncertainties affecting the application of those policies may result in materially different amounts being reported under different conditions or using different assumptions. We believe the following policies to be the most critical in understanding the judgments that are involved in preparing our financial statements.
Revenue Recognition
We recognize revenues from wholesale motor fuel sales when motor fuel is delivered to the customer. The purchase and delivery of motor fuels generally occurs on the same day. We recognize revenues from retail sales when motor fuel is sold to the customer. We record inventory from the time of the purchase of motor fuels from third party suppliers until the retail sale to the end customer.
We recognize revenue from leasing arrangements ratably over the term of the underlying lease. Renewals are not assumed unless reasonably assured.
Revenues from retail food and merchandise sales are recognized net of applicable provisions for discounts and allowances upon delivery, generally at the point of sale.
Accounts receivable primarily result from the sale of motor fuels to customers and rental fees for retail sites. The majority of our accounts receivable relate to motor fuel sales that can generally be described as high volume and low margin activities. Credit is extended to a customer based on an evaluation of the customer’s financial condition. In certain circumstances collateral may be required from the customer. Receivables are recorded at face value, without interest or discount.
The provision for bad debts is generally based upon a specific analysis of aged accounts while also factoring in any new business conditions that might impact the historical analysis, such as market conditions and bankruptcies of particular customers. Bad debt provisions are included in selling, general and administrative expenses.
We review all accounts receivable balances on at least a quarterly basis and provide an allowance for doubtful accounts based on historical experience and on a specific identification basis.
61
LGW collects motor fuel taxes, which consist of various pass through taxes collected from customers on behalf of taxing authorities, and remits such taxes directly to those taxing authorities. LGW’s accounting policy is to exclude the tax collected and remitted from wholesale revenues and cost of sales and account for them as liabilities. LGWS’s retail sales and cost of sales include motor fuel taxes as the taxes are included in the cost paid for motor fuel and LGWS has no direct responsibility to collect or remit such taxes to the taxing authorities.
Asset Acquisitions and Business Combinations
We early adopted ASU 2017-01, Business Combinations (Topic 805): Clarifying the Definition of a Business, effective January 1, 2017. Under this guidance, we first determine whether substantially all of the fair value of the set of gross assets acquired is concentrated in a single identifiable asset or a group of similar identifiable assets. If this threshold is met, the set is not a business. If this threshold is not met, we determine whether the set meets the definition of a business.
A business is defined as an integrated set of assets and activities that is capable of being conducted and managed for the purpose of providing a return to investors or other owners, members or participants. A business typically has inputs, processes applied to those inputs and outputs that are used to generate a return to investors, but outputs are not required for a set to be a business. A business must include, at a minimum, an input and a substantive process that together significantly contribute to the ability to create outputs.
We account for asset acquisitions (i.e. transactions involving the acquisition of a set of assets that does not meet the definition of a business) in accordance with the guidance under ASC 805-50 and other applicable guidance. Asset acquisitions are generally accounted for by allocating the cost of the acquisition to the individual assets acquired and liabilities assumed on a relative fair value basis. Two of the key differences in accounting for transactions as asset acquisitions as compared to business combination are summarized below:
|
|
• |
Transaction costs are capitalized as a component of the cost of the assets acquired rather than expensed as incurred; |
|
|
• |
Goodwill is not recognized. Rather, any excess consideration transferred over the fair value of the net assets acquired is allocated on a relative fair value basis to the identifiable net assets other than certain non-qualifying assets as defined in the guidance. |
We account for business combinations in accordance with the guidance under ASC 805–Business Combinations. The purchase price is recorded for assets acquired and liabilities assumed based on fair value. The excess of the fair value of the consideration conveyed over the fair value of the net assets acquired is recorded as goodwill.
The income statement includes the results of operations for each acquisition from their respective date of acquisition.
Whether we account for a transaction as an asset acquisition or a business combination, determining the fair value of these items requires management’s judgment, the utilization of independent valuation experts and involves the use of significant estimates and assumptions with respect to the timing and amounts of future cash inflows and outflows, discount rates, market prices and asset lives, among other items. The judgments made in the determination of the estimated fair value assigned to the assets acquired, the liabilities assumed and any noncontrolling interest in the investee, as well as the estimated useful life of each asset and the duration of each liability, can materially impact the financial statements in periods after acquisition, such as through depreciation and amortization. For more information on our acquisitions, see Note 3 to the financial statements.
Goodwill
Goodwill represents the excess of cost over the fair value of assets of businesses acquired. Goodwill is not amortized, but instead is tested for impairment at the reporting unit level at least annually, and more frequently if events and circumstances indicate that the goodwill might be impaired. The annual impairment testing date of goodwill is October 1.
We early adopted ASU 2017-04, Intangibles–Goodwill and Other (Topic 350): Simplifying the Test for Goodwill Impairment, effective January 1, 2017.
In performing our annual impairment analysis, ASC 350–20, Intangibles–Goodwill and Other, allows us to use qualitative factors to determine whether it is more likely than not (likelihood of more than 50%) that the fair value of a reporting unit is less than its carrying amount, including goodwill.
If, after assessing the totality of events or circumstances, we determine that it is more likely than not that the fair value of a reporting unit exceeds its carrying amount, no further testing is necessary. However, if we determine that it is more likely than not that the fair value of a reporting unit is less than its carrying amount, then we perform the goodwill impairment test.
62
In the goodwill impairment test, the reporting unit’s carrying amount (including goodwill) and its fair value are compared. If the estimated fair value of a reporting unit is less than the carrying value, an impairment charge is recognized for the deficit up to the amount of goodwill recorded.
At December 31, 2017, we had $89.1 million of goodwill recorded in our segments. After assessing the totality of events and circumstances, we determined that it is more likely than not that the fair value of our reporting units exceed their carrying amounts and therefore goodwill is not impaired at December 31, 2017.
Asset Retirement Obligations
When we install or acquire USTs, we recognize the estimated future cost to remove our USTs over their estimated useful lives. We record a discounted liability for the fair value of an asset retirement obligation with a corresponding increase to the carrying value of the related long-lived asset at the time a UST is installed. We depreciate the amount added to property and equipment and recognize accretion expense in connection with the discounted liability over the remaining life of the UST.
We base our estimates of such future costs on our prior experience with removal and include normal and customary costs we expect to incur associated with UST removal. We compare our cost estimates with our actual removal cost experience on an annual basis, and when the actual costs we experience exceed our original estimates, we will recognize an additional liability for estimated future costs to remove the USTs. Because these estimates are subjective and are currently based on historical costs with adjustments for estimated future changes in the associated costs, the dollar amount of these obligations could change as more information is obtained.
As of December 31, 2017 and 2016, our liabilities related to the removal of USTs recorded in the consolidated financial statements were $31.5 million and $27.8 million, respectively. A 10% change in our estimate of anticipated future costs for removal of USTs as of December 31, 2017 would change our asset retirement obligation by approximately $3.1 million. See also Note 10 under the caption “Asset Retirement Obligations” to the financial statements.
Environmental Liabilities
As of December 31, 2017 and 2016, our environmental reserves recorded in the consolidated financial statements were $3.5 million and $4.2 million, respectively. These environmental reserves represent our estimates for future expenditures for remediation and related litigation associated with contaminated retail sites as a result of releases (e.g. overfills, spills and releases) and are based on current regulations, historical results and certain other factors.
Environmental liabilities that we have recorded are based on internal and external estimates of costs to remediate retail sites. Factors considered in the estimates of the liability are the expected cost and the estimated length of time to remediate each contaminated site. Estimated remediation costs are not discounted because the timing of payments cannot be reasonably estimated. Reimbursements under state trust fund programs are recognized when received because such amounts are insignificant. The adequacy of the liability is evaluated quarterly and adjustments are made based on updated experience at existing retail sites, newly identified retail sites and changes in governmental policy. A 10% change in our estimate of future costs related to environmental liabilities recorded as of December 31, 2017 would change our environmental liabilities and operating expenses by $0.4 million. See Note 14 to the financial statements for additional information.
Tax Matters
As a limited partnership, we are not subject to federal and state income taxes. Income tax attributable to our taxable income, which may differ significantly from income for financial statement purposes, is assessed at the individual level of the unit holder. We are subject to a statutory requirement that non-qualifying income, as defined by the Internal Revenue Code, cannot exceed 10% of total gross income for the calendar year. If non-qualifying income exceeds this statutory limit, we would be taxed as a corporation. The non-qualifying income did not exceed the statutory limit in any period.
Certain activities that generate non-qualifying income are conducted through our wholly owned taxable corporate subsidiary, LGWS. Current and deferred income taxes are recognized on the earnings of LGWS. Deferred income tax assets and liabilities are recognized for the future tax consequences attributable to temporary differences between the financial statement carrying amounts of existing assets and liabilities and their respective tax bases and are measured using enacted tax rates.
Valuation allowances are initially recorded and reevaluated each reporting period by assessing the likelihood of the ultimate realization of a deferred tax asset. We consider a number of factors in assessing the realization of a deferred tax asset, including the reversal of temporary differences, projections of future taxable income and ongoing prudent and feasible tax planning strategies. The amount of deferred tax assets ultimately realized may differ materially from the estimates utilized in the computation of valuation allowances and may materially impact the financial statements in the future.
63
As a result of a reassessment of the positive and negative evidence supporting whether or not a valuation allowance for deferred tax assets is needed, we released the entire $3.7 million valuation allowance in 2017. See Note 19 to the financial statements for additional information.
ITEM 7A. QUANTITATIVE AND QUALITATIVE DISCLOSURES ABOUT MARKET RISK
Market Risk
We purchase gasoline and diesel fuel from several suppliers at costs that are subject to market volatility. These purchases are generally made pursuant to contracts or at market prices established with the supplier. We do not currently engage in hedging activities for these purchases due to our pricing structure that allows us to generally pass on price changes to our customers and related parties.
Interest Rate Risk
As of December 31, 2017, we had $506.0 million outstanding on our revolving credit facility. Our outstanding borrowings bear interest at LIBOR plus an applicable margin, which was 3.00% at December 31, 2017. Our borrowings had a weighted-average interest rate at December 31, 2017 of 4.44%. A one percentage point change in our average rate would impact annual interest expense by approximately $5.1 million.
Commodity Price Risk
We have not historically hedged or managed our price risk with respect to our commodity inventories (gasoline and diesel fuel), as the time period between the purchases of our motor fuel inventory and the sales to our customers is very short.
CrossAmerica purchases motor fuel for our Jet-Pep Assets from Circle K at Circle K’s cost plus terminal and administration fees of $0.015 per gallon. Circle K’s cost to supply these sites includes price fluctuations associated with index-based motor fuel pricing for pipeline delivery and the generation and sale of RINs. Circle K has implemented a motor fuel price hedging program to mitigate the price risk during delivery, thereby lowering our exposure. As such, we are exposed to more price risk with these motor fuel purchases from Circle K as compared to our other motor fuel purchases.
Regarding our supplier relationships, a majority of our total gallons purchased are subject to discounts for prompt payment and other rebates and incentives, which are recorded within cost of sales. Prompt payment discounts are based on a percentage of the purchase price of motor fuel. As such, the dollar value of these discounts increase and decrease corresponding with motor fuel prices. We have not historically hedged or managed our price risk with respect to these terms discounts. Based on our current volumes, we estimate a $10 per barrel change in the price of crude oil would impact our annual wholesale motor fuel gross profit by approximately $2 million related to these payment discounts.
Foreign Currency Risk
Our operations are located in the U.S., and therefore are not subject to foreign currency risk.
MANAGEMENT’S REPORT ON INTERNAL CONTROL OVER FINANCIAL REPORTING
The SEC, as required by Section 404 of the Sarbanes-Oxley Act, adopted rules requiring companies to file reports with the SEC to include a management report on such company’s internal control over financial reporting in its Form 10-K. In addition, our independent registered public accounting firm must attest to our internal control over financial reporting.
The management of CrossAmerica is responsible for establishing and maintaining adequate internal control over financial reporting. This internal control system was designed to provide reasonable assurance to the company’s management and Board regarding the preparation and fair presentation of published financial statements. All internal control systems, no matter how well designed, have inherent limitations. Therefore, even those systems determined to be effective can provide only reasonable assurance with respect to financial statement preparation and presentation. CrossAmerica management assessed the effectiveness of the company’s internal control over financial reporting as of December 31, 2017. In making this assessment, it used the criteria set forth by the Committee of Sponsoring Organizations of the Treadway Commission (COSO) in Internal Control-Integrated Framework, 2013 version. Based on our assessment, we believe that, as of December 31, 2017, the Partnership’s internal control over financial reporting is effective based on those criteria.
Attestation Report of the Independent Registered Public Accounting Firm
Grant Thornton LLP, our independent registered public accounting firm, has audited our internal control over financial reporting as of December 31, 2017. Their report dated February 26, 2018, expressed an unqualified opinion on our internal control over financial reporting.
64
REPORT OF INDEPENDENT REGISTERED PUBLIC ACCOUNTING FIRM
Board of Directors, General Partner and Limited Partners
CrossAmerica Partners LP
We have audited the accompanying consolidated balance sheets of CrossAmerica Partners LP (a Delaware Limited Partnership) and subsidiaries (the “Partnership”) as of December 31, 2017 and 2016, the related consolidated statements of income, changes in partners’ capital and comprehensive income and cash flows for each of the three years in the period ended December 31, 2017. In our opinion, the financial statements present fairly, in all material respects, the financial position of the Partnership as of December 31, 2017 and 2016, and the results of its operations and its cash flows for each of the three years in the period ended December 31, 2017, in conformity with accounting principles generally accepted in the United States of America.
We also have audited, in accordance with the standards of the Public Company Accounting Oversight Board (United States) (“PCAOB”), the Company’s internal control over financial reporting as of December 31, 2017, based on criteria established in the 2013 Internal Control—Integrated Framework issued by the Committee of Sponsoring Organizations of the Treadway Commission (“COSO”), and our report dated February 26, 2018 expressed an unqualified opinion.
Basis for opinion
These financial statements are the responsibility of the Partnership’s management. Our responsibility is to express an opinion on the Partnership’s financial statements based on our audits. We are a public accounting firm registered with the PCAOB and are required to be independent with respect to the Partnership in accordance with the U.S. federal securities laws and the applicable rules and regulations of the Securities and Exchange Commission and the PCAOB.
We conducted our audits in accordance with the standards of the PCAOB. Those standards require that we plan and perform the audit to obtain reasonable assurance about whether the financial statements are free of material misstatement, whether due to error or fraud. Our audits included performing procedures to assess the risks of material misstatement of the financial statements, whether due to error or fraud, and performing procedures that respond to those risks. Such procedures included examining, on a test basis, evidence supporting the amounts and disclosures in the financial statements. Our audits also included evaluating the accounting principles used and significant estimates made by management, as well as evaluating the overall presentation of the financial statements. We believe that our audits provide a reasonable basis for our opinion.
/s/ GRANT THORNTON LLP
We have served as the Company’s auditor since 2011.
Philadelphia, Pennsylvania
February 26, 2018
65
REPORT OF INDEPENDENT REGISTERED PUBLIC ACCOUNTING FIRM
Board of Directors, General Partner and Limited Partners
CrossAmerica Partners LP
Opinion on internal control over financial reporting
We have audited the internal control over financial reporting of CrossAmerica Partners LP (a Delaware Partnership) and subsidiaries (the “Partnership”) as of December 31, 2017 based on criteria established in the 2013 Internal Control—Integrated Framework issued by the Committee of Sponsoring Organizations of the Treadway Commission (“COSO”). In our opinion, the Company maintained, in all material respects, effective internal control over financial reporting as of December 31, 2017, based on criteria established in the 2013 Internal Control—Integrated Framework issued by COSO.
We also have audited, in accordance with the standards of the Public Company Accounting Oversight Board (United States) (“PCAOB”), the consolidated financial statements of the Partnership as of and for the year ended December 31, 2017, and our report dated February 26, 2018, expressed an unqualified opinion on those financial statements.
Basis for opinion
The Partnership’s management is responsible for maintaining effective internal control over financial reporting and for its assessment of the effectiveness of internal control over financial reporting, included in the accompanying Management’s Report on Internal Control over Financial Reporting. Our responsibility is to express an opinion on the Company’s internal control over financial reporting based on our audit. We are a public accounting firm registered with the PCAOB and are required to be independent with respect to the Company in accordance with the U.S. federal securities laws and the applicable rules and regulations of the Securities and Exchange Commission and the PCAOB.
We conducted our audits in accordance with the standards of the PCAOB. Those standards require that we plan and perform the audit to obtain reasonable assurance about whether effective internal control over financial reporting was maintained in all material respects. Our audit included obtaining an understanding of internal control over financial reporting, assessing the risk that a material weakness exists, testing and evaluating the design and operating effectiveness of internal control based on the assessed risk, and performing such other procedures as we considered necessary in the circumstances. We believe that our audit provides a reasonable basis for our opinion.
Definition and limitations of internal control over financial reporting
A company’s internal control over financial reporting is a process designed to provide reasonable assurance regarding the reliability of financial reporting and the preparation of financial statements for external purposes in accordance with generally accepted accounting principles. A company’s internal control over financial reporting includes those policies and procedures that (1) pertain to the maintenance of records that, in reasonable detail, accurately and fairly reflect the transactions and dispositions of the assets of the company; (2) provide reasonable assurance that transactions are recorded as necessary to permit preparation of financial statements in accordance with generally accepted accounting principles, and that receipts and expenditures of the company are being made only in accordance with authorizations of management and directors of the company; and (3) provide reasonable assurance regarding prevention or timely detection of unauthorized acquisition, use, or disposition of the company’s assets that could have a material effect on the financial statements.
Because of its inherent limitations, internal control over financial reporting may not prevent or detect misstatements. Also, projections of any evaluation of effectiveness to future periods are subject to the risk that controls may become inadequate because of changes in conditions, or that the degree of compliance with the policies or procedures may deteriorate.
/s/ GRANT THORNTON LLP
Philadelphia, Pennsylvania
February 26, 2018
66
(Thousands of Dollars, except unit data)
|
|
|
December 31, |
|
|||||
|
|
|
2017 |
|
|
2016 |
|
||
|
|
|
|
|
|
|
|
|
|
|
ASSETS |
|
|
|
|
|
|
|
|
|
Current assets: |
|
|
|
|
|
|
|
|
|
Cash |
|
$ |
3,897 |
|
|
$ |
1,350 |
|
|
Accounts receivable, net of allowances of $277 and $487, respectively |
|
|
27,792 |
|
|
|
29,251 |
|
|
Accounts receivable from related parties |
|
|
14,459 |
|
|
|
12,975 |
|
|
Inventories |
|
|
15,122 |
|
|
|
13,164 |
|
|
Assets held for sale |
|
|
11,708 |
|
|
|
2,111 |
|
|
Other current assets |
|
|
7,528 |
|
|
|
6,556 |
|
|
Total current assets |
|
|
80,506 |
|
|
|
65,407 |
|
|
Property and equipment, net |
|
|
681,000 |
|
|
|
677,329 |
|
|
Intangible assets, net |
|
|
76,063 |
|
|
|
80,760 |
|
|
Goodwill |
|
|
89,109 |
|
|
|
89,109 |
|
|
Other assets |
|
|
20,558 |
|
|
|
19,384 |
|
|
Total assets |
|
$ |
947,236 |
|
|
$ |
931,989 |
|
|
|
|
|
|
|
|
|
|
|
|
LIABILITIES AND EQUITY |
|
|
|
|
|
|
|
|
|
Current liabilities: |
|
|
|
|
|
|
|
|
|
Current portion of debt and capital lease obligations |
|
$ |
2,916 |
|
|
$ |
2,100 |
|
|
Accounts payable |
|
|
35,789 |
|
|
|
34,903 |
|
|
Accounts payable to related parties |
|
|
25,512 |
|
|
|
9,958 |
|
|
Accrued expenses and other current liabilities |
|
|
17,015 |
|
|
|
15,705 |
|
|
Motor fuel taxes payable |
|
|
12,241 |
|
|
|
12,467 |
|
|
Total current liabilities |
|
|
93,473 |
|
|
|
75,133 |
|
|
Debt and capital lease obligations, less current portion |
|
|
529,147 |
|
|
|
465,119 |
|
|
Deferred tax liabilities, net |
|
|
24,069 |
|
|
|
42,923 |
|
|
Asset retirement obligations |
|
|
31,467 |
|
|
|
27,750 |
|
|
Other long-term liabilities |
|
|
98,061 |
|
|
|
100,253 |
|
|
Total liabilities |
|
|
776,217 |
|
|
|
711,178 |
|
|
|
|
|
|
|
|
|
|
|
|
Commitments and contingencies |
|
|
|
|
|
|
|
|
|
|
|
|
|
|
|
|
|
|
|
Equity: |
|
|
|
|
|
|
|
|
|
Partners’ Capital |
|
|
|
|
|
|
|
|
|
Common units—(34,111,461 and 33,524,952 units issued and outstanding at December 31, 2017 and December 31, 2016, respectively) |
|
|
171,337 |
|
|
|
221,044 |
|
|
General Partner’s interest |
|
|
— |
|
|
|
— |
|
|
Total Partners’ Capital |
|
|
171,337 |
|
|
|
221,044 |
|
|
Noncontrolling interests |
|
|
(318 |
) |
|
|
(233 |
) |
|
Total equity |
|
|
171,019 |
|
|
|
220,811 |
|
|
Total liabilities and equity |
|
$ |
947,236 |
|
|
$ |
931,989 |
|
See Notes to Consolidated Financial Statements.
67
CONSOLIDATED STATEMENTS OF INCOME
(Thousands of Dollars, Except Unit and Per Unit Amounts)
|
|
|
For the Year Ended December 31, |
|
|||||||||
|
|
|
2017 |
|
|
2016 |
|
|
2015 |
|
|||
|
Operating revenues(a) |
|
$ |
2,094,827 |
|
|
$ |
1,869,806 |
|
|
$ |
2,226,271 |
|
|
Costs of sales(b) |
|
|
1,934,061 |
|
|
|
1,714,239 |
|
|
|
2,056,807 |
|
|
Gross profit |
|
|
160,766 |
|
|
|
155,567 |
|
|
|
169,464 |
|
|
Income from CST Fuel Supply equity interests |
|
|
14,906 |
|
|
|
16,048 |
|
|
|
10,528 |
|
|
Operating expenses: |
|
|
|
|
|
|
|
|
|
|
|
|
|
Operating expenses |
|
|
61,297 |
|
|
|
61,074 |
|
|
|
72,229 |
|
|
General and administrative expenses |
|
|
27,887 |
|
|
|
24,156 |
|
|
|
36,238 |
|
|
Depreciation, amortization and accretion expense |
|
|
57,470 |
|
|
|
54,412 |
|
|
|
48,227 |
|
|
Total operating expenses |
|
|
146,654 |
|
|
|
139,642 |
|
|
|
156,694 |
|
|
Gain on sales of assets, net |
|
|
3,401 |
|
|
|
198 |
|
|
|
2,719 |
|
|
Operating income |
|
|
32,419 |
|
|
|
32,171 |
|
|
|
26,017 |
|
|
Other income (expense), net |
|
|
439 |
|
|
|
848 |
|
|
|
396 |
|
|
Interest expense |
|
|
(27,919 |
) |
|
|
(22,757 |
) |
|
|
(18,493 |
) |
|
Income before income taxes |
|
|
4,939 |
|
|
|
10,262 |
|
|
|
7,920 |
|
|
Income tax benefit |
|
|
(18,237 |
) |
|
|
(453 |
) |
|
|
(3,542 |
) |
|
Net income |
|
|
23,176 |
|
|
|
10,715 |
|
|
|
11,462 |
|
|
Less: net income attributable to noncontrolling interests |
|
|
18 |
|
|
|
11 |
|
|
|
21 |
|
|
Net income attributable to limited partners |
|
|
23,158 |
|
|
|
10,704 |
|
|
|
11,441 |
|
|
IDR distributions |
|
|
(4,337 |
) |
|
|
(3,392 |
) |
|
|
(1,390 |
) |
|
Net income available to limited partners |
|
$ |
18,821 |
|
|
$ |
7,312 |
|
|
$ |
10,051 |
|
|
Net income per limited partner unit: |
|
|
|
|
|
|
|
|
|
|
|
|
|
Basic earnings per common unit |
|
$ |
0.56 |
|
|
$ |
0.22 |
|
|
$ |
0.35 |
|
|
Diluted earnings per common unit |
|
$ |
0.56 |
|
|
$ |
0.22 |
|
|
$ |
0.35 |
|
|
Basic and diluted earnings per subordinated unit |
|
n/a |
|
|
$ |
0.22 |
|
|
$ |
0.35 |
|
|
|
Weighted-average limited partner units: |
|
|
|
|
|
|
|
|
|
|
|
|
|
Basic common units |
|
|
33,844,823 |
|
|
|
32,159,156 |
|
|
|
21,462,665 |
|
|
Diluted common units |
|
|
33,855,345 |
|
|
|
32,216,004 |
|
|
|
21,561,403 |
|
|
Basic and diluted subordinated units |
|
|
— |
|
|
|
1,151,366 |
|
|
|
7,525,000 |
|
|
Total diluted common and subordinated units |
|
|
33,855,345 |
|
|
|
33,367,370 |
|
|
|
29,086,403 |
|
|
Distribution paid per common and subordinated unit |
|
$ |
2.4800 |
|
|
$ |
2.4000 |
|
|
$ |
2.2300 |
|
|
Distribution declared (with respect to each respective period) per common and subordinated unit |
|
$ |
2.4950 |
|
|
$ |
2.4200 |
|
|
$ |
2.2800 |
|
|
Supplemental information: |
|
|
|
|
|
|
|
|
|
|
|
|
|
(a) Includes excise taxes of: |
|
$ |
79,937 |
|
|
$ |
79,537 |
|
|
$ |
99,339 |
|
|
(a) Includes revenues from fuel sales to and rental income from related parties of: |
|
|
414,781 |
|
|
|
411,945 |
|
|
|
494,090 |
|
|
(a) Includes rental income of: |
|
|
86,314 |
|
|
|
80,594 |
|
|
|
65,431 |
|
|
(b) Includes rental expense of: |
|
|
19,472 |
|
|
|
19,656 |
|
|
|
17,024 |
|
See Notes to Consolidated Financial Statements.
68
CONSOLIDATED STATEMENTS OF CASH FLOWS
(Thousands of Dollars)
|
|
|
For the Year Ended December 31, |
|
|||||||||
|
|
|
2017 |
|
|
2016 |
|
|
2015 |
|
|||
|
Cash flows from operating activities: |
|
|
|
|
|
|
|
|
|
|
|
|
|
Net income |
|
$ |
23,176 |
|
|
$ |
10,715 |
|
|
$ |
11,462 |
|
|
Adjustments to reconcile net income to net cash flows provided by operating activities: |
|
|
|
|
|
|
|
|
|
|
|
|
|
Depreciation, amortization and accretion expense |
|
|
57,470 |
|
|
|
54,412 |
|
|
|
48,227 |
|
|
Amortization of deferred financing costs |
|
|
1,707 |
|
|
|
1,666 |
|
|
|
1,475 |
|
|
Amortization of below market leases, net |
|
|
70 |
|
|
|
198 |
|
|
|
394 |
|
|
Provision for losses on doubtful accounts |
|
|
103 |
|
|
|
36 |
|
|
|
521 |
|
|
Deferred income taxes |
|
|
(18,853 |
) |
|
|
(686 |
) |
|
|
(6,116 |
) |
|
Equity-based employees and directors compensation expense |
|
|
1,931 |
|
|
|
3,927 |
|
|
|
5,119 |
|
|
Amended Omnibus Agreement fees settled in common units |
|
|
13,200 |
|
|
|
12,133 |
|
|
|
8,917 |
|
|
Gain on sales of assets, net |
|
|
(3,401 |
) |
|
|
(198 |
) |
|
|
(2,719 |
) |
|
Gain on settlement of capital lease obligations |
|
|
— |
|
|
|
(132 |
) |
|
|
(25 |
) |
|
Erickson working capital adjustment |
|
|
— |
|
|
|
335 |
|
|
|
— |
|
|
Changes in working capital, net of acquisitions |
|
|
13,557 |
|
|
|
(2,966 |
) |
|
|
(2,768 |
) |
|
Net cash provided by operating activities |
|
|
88,960 |
|
|
|
79,440 |
|
|
|
64,487 |
|
|
Cash flows from investing activities: |
|
|
|
|
|
|
|
|
|
|
|
|
|
Proceeds from sale of property and equipment |
|
|
27,552 |
|
|
|
2,682 |
|
|
|
6,409 |
|
|
Capital expenditures |
|
|
(12,488 |
) |
|
|
(20,776 |
) |
|
|
(10,183 |
) |
|
Principal payments received on notes receivable |
|
|
450 |
|
|
|
794 |
|
|
|
1,958 |
|
|
Refund payment related to the sale by CST of California and Wyoming assets |
|
|
— |
|
|
|
17,528 |
|
|
|
— |
|
|
Cash paid in connection with acquisitions, net of cash acquired |
|
|
(75,627 |
) |
|
|
(94,234 |
) |
|
|
(167,777 |
) |
|
Cash paid to CST in connection with acquisitions |
|
|
— |
|
|
|
(2,900 |
) |
|
|
(141,925 |
) |
|
Net cash used in investing activities |
|
|
(60,113 |
) |
|
|
(96,906 |
) |
|
|
(311,518 |
) |
|
Cash flows from financing activities: |
|
|
|
|
|
|
|
|
|
|
|
|
|
Borrowings under the revolving credit facility |
|
|
205,121 |
|
|
|
214,788 |
|
|
|
369,495 |
|
|
Repayments on the revolving credit facility |
|
|
(140,621 |
) |
|
|
(131,699 |
) |
|
|
(211,484 |
) |
|
Proceeds from issuance of common units |
|
|
— |
|
|
|
— |
|
|
|
144,939 |
|
|
Proceeds from sale leaseback transactions |
|
|
— |
|
|
|
25,035 |
|
|
|
— |
|
|
Repurchases of common units |
|
|
— |
|
|
|
(3,252 |
) |
|
|
(3,603 |
) |
|
Payments of long-term debt and capital lease obligations |
|
|
(2,032 |
) |
|
|
(2,262 |
) |
|
|
(1,983 |
) |
|
Payments of sale leaseback obligations |
|
|
(865 |
) |
|
|
(734 |
) |
|
|
(682 |
) |
|
Payment of deferred financing costs |
|
|
(6 |
) |
|
|
(694 |
) |
|
|
— |
|
|
Repayments from related party |
|
|
— |
|
|
|
— |
|
|
|
2,465 |
|
|
Contributions from Circle K |
|
|
329 |
|
|
|
— |
|
|
|
— |
|
|
Distributions paid on distribution equivalent rights |
|
|
(22 |
) |
|
|
(45 |
) |
|
|
(13 |
) |
|
Distributions paid to holders of the IDRs |
|
|
(4,337 |
) |
|
|
(3,392 |
) |
|
|
(1,390 |
) |
|
Distributions paid to noncontrolling interests |
|
|
(103 |
) |
|
|
(109 |
) |
|
|
(125 |
) |
|
Distributions paid on common and subordinated units |
|
|
(83,764 |
) |
|
|
(80,012 |
) |
|
|
(64,566 |
) |
|
Net cash (used in) provided by financing activities |
|
|
(26,300 |
) |
|
|
17,624 |
|
|
|
233,053 |
|
|
Net increase (decrease) in cash |
|
|
2,547 |
|
|
|
158 |
|
|
|
(13,978 |
) |
|
Cash at beginning of period |
|
|
1,350 |
|
|
|
1,192 |
|
|
|
15,170 |
|
|
Cash at end of period |
|
$ |
3,897 |
|
|
$ |
1,350 |
|
|
$ |
1,192 |
|
See Notes to Consolidated Financial Statements.
69
CONSOLIDATED STATEMENTS OF PARTNERS’ CAPITAL AND COMPREHENSIVE INCOME
(Thousands of Dollars, Except Unit and Per Unit Amounts)
|
|
|
Limited Partners’ Interest |
|
|
General |
|
|
Incentive |
|
|
|
|
|
|
|
|
|
|||||||||||||||
|
|
|
Common Unitholders |
|
|
Subordinated Units - Affiliates |
|
|
Partner’s Interest |
|
|
Distribution Rights |
|
|
Noncontrolling Interest |
|
|
Equity |
|
||||||||||||||
|
|
|
Units |
|
|
Dollars |
|
|
Units |
|
|
Dollars |
|
|
Dollars |
|
|
Dollars |
|
|
Dollars |
|
|
Dollars |
|
||||||||
|
Balance at December 31, 2014 |
|
|
15,437,704 |
|
|
$ |
281,817 |
|
|
|
7,525,000 |
|
|
$ |
(91,295 |
) |
|
$ |
— |
|
|
$ |
— |
|
|
$ |
(31 |
) |
|
$ |
190,491 |
|
|
Vesting of incentive and director awards, net of units withheld for taxes |
|
|
96,812 |
|
|
|
3,261 |
|
|
|
— |
|
|
|
— |
|
|
|
— |
|
|
|
— |
|
|
|
— |
|
|
|
3,261 |
|
|
Issuance of units to CST for the payment of fees under the Amended Omnibus Agreement |
|
|
259,312 |
|
|
|
7,200 |
|
|
|
— |
|
|
|
— |
|
|
|
— |
|
|
|
— |
|
|
|
— |
|
|
|
7,200 |
|
|
Issuance of units to CST in connection with sale of fuel supply interests and purchase of NTIs |
|
|
5,139,252 |
|
|
|
163,292 |
|
|
|
— |
|
|
|
— |
|
|
|
— |
|
|
|
— |
|
|
|
— |
|
|
|
163,292 |
|
|
Distributions to CST in connection with sale of fuel supply interests |
|
|
— |
|
|
|
(182,092 |
) |
|
|
— |
|
|
|
— |
|
|
|
— |
|
|
|
— |
|
|
|
— |
|
|
|
(182,092 |
) |
|
Repurchase of common units |
|
|
(154,158 |
) |
|
|
(3,603 |
) |
|
|
— |
|
|
|
— |
|
|
|
— |
|
|
|
— |
|
|
|
— |
|
|
|
(3,603 |
) |
|
Proceeds of equity offering and overallotment exercise, net of issuance costs |
|
|
4,807,000 |
|
|
|
144,939 |
|
|
|
— |
|
|
|
— |
|
|
|
— |
|
|
|
— |
|
|
|
— |
|
|
|
144,939 |
|
|
Net income and comprehensive income |
|
|
— |
|
|
|
7,442 |
|
|
|
— |
|
|
|
2,609 |
|
|
|
— |
|
|
|
1,390 |
|
|
|
21 |
|
|
|
11,462 |
|
|
Distributions paid |
|
|
— |
|
|
|
(47,798 |
) |
|
|
— |
|
|
|
(16,781 |
) |
|
|
— |
|
|
|
(1,390 |
) |
|
|
(125 |
) |
|
|
(66,094 |
) |
|
Balance at December 31, 2015 |
|
|
25,585,922 |
|
|
|
374,458 |
|
|
|
7,525,000 |
|
|
|
(105,467 |
) |
|
|
— |
|
|
|
— |
|
|
|
(135 |
) |
|
|
268,856 |
|
|
Vesting of incentive and director awards, net of units withheld for taxes |
|
|
107,227 |
|
|
|
2,606 |
|
|
|
— |
|
|
|
— |
|
|
|
— |
|
|
|
— |
|
|
|
— |
|
|
|
2,606 |
|
|
Conversion of subordinated units |
|
|
7,525,000 |
|
|
|
(109,673 |
) |
|
|
(7,525,000 |
) |
|
|
109,673 |
|
|
|
— |
|
|
|
— |
|
|
|
— |
|
|
|
— |
|
|
Issuance of units to CST for the payment of fees due under the Amended Omnibus Agreement |
|
|
468,645 |
|
|
|
11,245 |
|
|
|
— |
|
|
|
— |
|
|
|
— |
|
|
|
— |
|
|
|
— |
|
|
|
11,245 |
|
|
Distributions to CST in connection with the purchase of independent dealer and subwholesaler contracts |
|
|
— |
|
|
|
(2,900 |
) |
|
|
— |
|
|
|
— |
|
|
|
— |
|
|
|
— |
|
|
|
— |
|
|
|
(2,900 |
) |
|
Refund payment related to the sale of California and Wyoming assets |
|
|
(28,379 |
) |
|
|
17,528 |
|
|
|
— |
|
|
|
— |
|
|
|
— |
|
|
|
— |
|
|
|
— |
|
|
|
17,528 |
|
|
Repurchase of common units |
|
|
(133,463 |
) |
|
|
(3,252 |
) |
|
|
— |
|
|
|
— |
|
|
|
— |
|
|
|
— |
|
|
|
— |
|
|
|
(3,252 |
) |
|
Net income and comprehensive income |
|
|
— |
|
|
|
7,059 |
|
|
|
— |
|
|
|
253 |
|
|
|
— |
|
|
|
3,392 |
|
|
|
11 |
|
|
|
10,715 |
|
|
Distributions paid |
|
|
|
|
|
|
(75,598 |
) |
|
|
— |
|
|
|
(4,459 |
) |
|
|
— |
|
|
|
(3,392 |
) |
|
|
(109 |
) |
|
|
(83,558 |
) |
|
Other |
|
|
— |
|
|
|
(429 |
) |
|
|
— |
|
|
|
— |
|
|
|
— |
|
|
|
— |
|
|
|
— |
|
|
|
(429 |
) |
|
Balance at December 31, 2016 |
|
|
33,524,952 |
|
|
|
221,044 |
|
|
|
— |
|
|
|
— |
|
|
|
— |
|
|
|
— |
|
|
|
(233 |
) |
|
|
220,811 |
|
|
Vesting of incentive and director awards, net of units withheld for taxes |
|
|
35,993 |
|
|
|
896 |
|
|
|
— |
|
|
|
— |
|
|
|
— |
|
|
|
— |
|
|
|
— |
|
|
|
896 |
|
|
Issuance of units to CST and Circle K for the payment of fees due under the Amended Omnibus Agreement |
|
|
550,516 |
|
|
|
14,033 |
|
|
|
— |
|
|
|
— |
|
|
|
— |
|
|
|
— |
|
|
|
— |
|
|
|
14,033 |
|
|
Contributions from Circle K |
|
|
— |
|
|
|
329 |
|
|
|
— |
|
|
|
— |
|
|
|
— |
|
|
|
— |
|
|
|
— |
|
|
|
329 |
|
|
Net income and comprehensive income |
|
|
— |
|
|
|
18,821 |
|
|
|
— |
|
|
|
— |
|
|
|
— |
|
|
|
4,337 |
|
|
|
18 |
|
|
|
23,176 |
|
|
Distributions paid |
|
|
— |
|
|
|
(83,786 |
) |
|
|
— |
|
|
|
— |
|
|
|
— |
|
|
|
(4,337 |
) |
|
|
(103 |
) |
|
|
(88,226 |
) |
|
Balance at December 31, 2017 |
|
|
34,111,461 |
|
|
$ |
171,337 |
|
|
|
— |
|
|
$ |
— |
|
|
$ |
— |
|
|
$ |
— |
|
|
$ |
(318 |
) |
|
$ |
171,019 |
|
See Notes to Consolidated Financial Statements.
70
CROSSAMERICA PARTNERS LP
NOTES TO CONSOLIDATED FINANCIAL STATEMENTS
Note 1. DESCRIPTION OF BUSINESS
Couche- Tard and CST Merger
CST entered into the Merger Agreement dated as of August 21, 2016, with Circle K and Merger Sub. On June 28, 2017, Merger Sub merged with and into CST, at which time the separate corporate existence of Merger Sub ceased, and CST survived the Merger as an indirect, wholly owned subsidiary of Circle K. Circle K is a wholly owned subsidiary of Couche-Tard.
As a result of the Merger, Circle K indirectly owns all of the membership interests in the sole member of our General Partner, as well as a 21.1% limited partner interest in the Partnership and all of the IDRs of the Partnership. Circle K, through its indirect ownership interest in the sole member of our General Partner, has the ability to appoint all of the members of the Board and to control and manage our operations and activities.
Description of Business
Our business consists of:
|
|
• |
the wholesale distribution of motor fuels; |
|
|
• |
the retail distribution of motor fuels to end customers at retail sites operated by commission agents or us; |
|
|
• |
the owning or leasing of retail sites used in the retail distribution of motor fuels and, in turn, generating rental income from the lease or sublease of the retail sites; and |
|
|
• |
the operation of retail sites. |
The financial statements reflect the consolidated results of the Partnership and its wholly owned subsidiaries. Our primary operations are conducted by the following consolidated wholly owned subsidiaries:
|
|
• |
LGW, which distributes motor fuels on a wholesale basis and generates qualified income under Section 7704(d) of the Internal Revenue Code; |
|
|
• |
LGPR, which functions as our real estate holding company and holds assets that generate qualified rental income under Section 7704(d) of the Internal Revenue Code; and |
|
|
• |
LGWS, which owns and leases (or leases and sub-leases) real estate and personal property used in the retail distribution of motor fuels, as well as provides maintenance and other services to its customers. In addition, LGWS distributes motor fuels on a retail basis and sells convenience merchandise items to end customers at company operated retail sites and sells motor fuel on a retail basis at sites operated by commission agents. Income from LGWS generally is not qualifying income under Section 7704(d) of the Internal Revenue Code. |
In 2015, we issued our common units as consideration in the purchase of equity interests in CST Fuel Supply and the real property associated with certain of CST’s NTI retail sites. In addition, we also issued, and may continue to issue, common units as payment to Circle K for charges and expenses incurred by us under the Amended Omnibus Agreement. There is no obligation for Circle K to accept common units representing limited partner interests in lieu of cash for amounts due under the Amended Omnibus Agreement. CST also acquired our common units through open market purchases from September 2015 through December 2015. At December 31, 2017, Circle K indirectly owned 21.1% of our limited partner interests.
Note 2. SIGNIFICANT ACCOUNTING POLICIES
Principles of Consolidation
These consolidated financial statements were prepared in accordance with U.S. GAAP. These financial statements include the consolidated accounts of CrossAmerica and subsidiaries. All intercompany accounts and transactions have been eliminated in consolidation.
71
CROSSAMERICA PARTNERS LP
NOTES TO CONSOLIDATED FINANCIAL STATEMENTS
The preparation of financial statements in conformity with U.S. GAAP requires management to make estimates and assumptions that affect the reported amounts of assets and liabilities at the date of the financial statements and the reported amounts of revenues and expenses during the reporting periods. Actual results and outcomes could differ from those estimates and assumptions. On an ongoing basis, management reviews its estimates based on currently available information. Changes in facts and circumstances could result in revised estimates and assumptions.
Cash and Cash Equivalents
We consider all short-term investments with maturity of three months or less at the date of purchase to be cash equivalents. Cash and cash equivalents are stated at cost, which, for cash equivalents, approximates fair value due to their short-term maturity. We are potentially subject to financial instrument concentration of credit risk through our cash and cash equivalents. We maintain cash and cash equivalents with several major financial institutions. We have not experienced any losses on our cash equivalents.
Receivables
Accounts receivable primarily result from the sales of motor fuels to customers and rental fees for retail sites. The majority of our accounts receivable relate to our motor fuel sales that can generally be described as high volume and low margin activities. Credit is extended to a customer based on an evaluation of the customer’s financial condition. In certain circumstances collateral may be required from the customer. Receivables are recorded at face value, without interest or discount. Receivables include amounts due from financial institutions for customer credit and debit card transactions.
The provision for bad debts is generally based upon a specific analysis of aged accounts while also factoring in any new business conditions that might impact the historical analysis, such as market conditions and bankruptcies of particular customers. Bad debt provisions are included in selling, general and administrative expenses.
We review all accounts receivable balances on at least a quarterly basis and provide an allowance for doubtful accounts based on historical experience and on a specific identification basis.
Inventories
Motor fuel inventory consists of gasoline, diesel fuel and other petroleum products and is stated at the lower of average cost or net realizable value using the first-in, first-out method. We record inventory from the time of the purchase of motor fuels from third party suppliers until the retail sale to the end customer.
Food and merchandise inventory is valued at the lower of average cost or net realizable value using the first-in, first-out method, net of a reserve for potentially obsolete or slow-moving inventory.
Debt Issuance Costs
Debt issuance costs that are incurred in connection with the issuance of debt are deferred and amortized to interest expense using the straight line method (which approximates the effective interest method) over the contractual term of the underlying indebtedness. Debt issuance costs are classified as a reduction of the associated liability.
Asset Acquisitions and Business Combinations
We early adopted ASU 2017-01, Business Combinations (Topic 805): Clarifying the Definition of a Business, effective January 1, 2017. Under this guidance, we first determine whether substantially all of the fair value of the set of gross assets acquired is concentrated in a single identifiable asset or a group of similar identifiable assets. If this threshold is met, the set is not a business. If this threshold is not met, we determine whether the set meets the definition of a business.
A business is defined an integrated set of assets and activities that is capable of being conducted and managed for the purpose of providing a return to investors or other owners, members or participants. A business typically has inputs, processes applied to those inputs and outputs that are used to generate a return to investors, but outputs are not required for a set to be a business. A business must include, at a minimum, an input and a substantive process that together significantly contribute to the ability to create outputs.
72
CROSSAMERICA PARTNERS LP
NOTES TO CONSOLIDATED FINANCIAL STATEMENTS
We account for asset acquisitions (i.e. transactions involving the acquisition of a set of assets that does not meet the definition of a business) in accordance with the guidance under ASC 805-50 and other applicable guidance. Asset acquisitions are generally accounted for by allocating the cost of the acquisition, including acquisition costs, to the individual assets acquired and liabilities assumed on a relative fair value basis.
We account for business combinations in accordance with the guidance under ASC 805–Business Combinations. The purchase price is recorded for assets acquired and liabilities assumed based on fair value. The excess of the fair value of the consideration conveyed over the fair value of the net assets acquired is recorded as goodwill.
The income statement includes the results of operations for each acquisition from their respective date of acquisition.
Whether we account for a transaction as an asset acquisition or a business combination, determining the fair value of these items requires management’s judgment, the utilization of independent valuation experts and involves the use of significant estimates and assumptions with respect to the timing and amounts of future cash inflows and outflows, discount rates, market prices and asset lives, among other items. The judgments made in the determination of the estimated fair value assigned to the assets acquired, the liabilities assumed and any noncontrolling interest in the investee, as well as the estimated useful life of each asset and the duration of each liability, can materially impact the financial statements in periods after acquisition, such as through depreciation and amortization. See Note 3 for additional information on our acquisitions.
Property and Equipment
Property and equipment is recorded at cost, which equals fair value in the case of a business combination or generally approximates fair value in the case of an asset acquisition. Depreciation is recognized using the straight-line method over the estimated useful lives of the related assets, including: 10 to 20 years for buildings and improvements and five to 30 years for equipment. Amortization of leasehold improvements is based upon the shorter of the remaining terms of the leases including renewal periods that are reasonably assured, or the estimated useful lives, which generally range from seven to 10 years.
Expenditures for major renewals and betterments that extend the useful lives of property and equipment are capitalized. Maintenance and repairs are charged to operations as incurred. Gains or losses on the disposition of property and equipment are recorded in the period the sale meets the criteria for recognition.
Intangible Assets
Intangible assets are recorded at fair value in the case of a business combination or at a value that generally approximates fair value in the case of an asset acquisition. Intangible assets associated with wholesale fuel supply contracts, wholesale fuel distribution rights and trademarks are amortized over 10 years. Covenants not to compete are amortized over the shorter of the contract term or five years. Intangible assets associated with above and below market leases are amortized over the applicable lease term. Intangible assets with definite useful lives are amortized over their respective estimated useful lives and reviewed for impairment if we believe that changes or triggering events have occurred that could have caused the carrying value of the intangible assets to exceed its fair value. Intangible assets with indefinite lives are not amortized, but are tested for impairment annually or more frequently if events and circumstances indicate that the intangible assets might be impaired.
Impairment of Assets
Long-lived assets, which include property and equipment and finite-lived intangible assets, are tested for recoverability whenever events or changes in circumstances indicate that the carrying amount of the asset may not be recoverable. A long-lived asset is not recoverable if its carrying amount exceeds the sum of the undiscounted cash flows expected to result from its use and eventual disposition. If a long-lived asset is not recoverable, an impairment loss is recognized for the amount by which the carrying amount of the long-lived asset exceeds its fair value, with fair value determined based on discounted estimated net cash flows or other appropriate methods.
Goodwill
Goodwill represents the excess of cost over the fair value of assets of businesses acquired. Goodwill is not amortized, but instead is tested for impairment at the reporting unit level at least annually, and more frequently if events and circumstances indicate that the goodwill might be impaired. The annual impairment testing date of goodwill is October 1.
73
CROSSAMERICA PARTNERS LP
NOTES TO CONSOLIDATED FINANCIAL STATEMENTS
We early adopted ASU 2017-04, Intangibles–Goodwill and Other (Topic 350): Simplifying the Test for Goodwill Impairment, effective January 1, 2017.
In performing our annual impairment analysis, ASC 350–20, Intangibles–Goodwill and Other, allows us to use qualitative factors to determine whether it is more likely than not (likelihood of more than 50%) that the fair value of a reporting unit is less than its carrying amount, including goodwill.
If, after assessing the totality of events or circumstances, we determine that it is more likely than not that the fair value of a reporting unit exceeds its carrying amount, no further testing is necessary. However, if we determine that it is more likely than not that the fair value of a reporting unit is less than its carrying amount, then we perform the goodwill impairment test.
In the goodwill impairment test, the reporting unit’s carrying amount (including goodwill) and its fair value are compared. If the estimated fair value of a reporting unit is less than the carrying value, an impairment charge is recognized for the deficit up to the amount of goodwill recorded.
No goodwill was impaired for any period presented.
Environmental Matters
Liabilities for future remediation costs are recorded when environmental assessments from governmental regulatory agencies and/or remedial efforts are probable and the costs can be reasonably estimated. Other than for assessments, the timing and magnitude of these accruals generally are based on the completion of investigations or other studies or a commitment to a formal plan of action. Environmental liabilities are based on best estimates of probable undiscounted future costs using currently available technology and applying current regulations, as well as our own internal environmental policies. Environmental liabilities are difficult to assess and estimate due to uncertainties related to the magnitude of possible remediation, the timing of such remediation and the determination of our obligation in proportion to other parties. Such estimates are subject to change due to many factors, including the identification of new retail sites requiring remediation, changes in environmental laws and regulations and their interpretation, additional information related to the extent and nature of remediation efforts and potential improvements in remediation technologies. Amounts recorded for environmental liabilities have not been reduced by possible recoveries from third parties.
Asset Retirement Obligations
We record a liability, which is referred to as an asset retirement obligation, at fair value for the estimated cost to remove underground storage tanks (USTs) used to store motor fuel at owned and leased retail sites at the time we incur that liability, which is generally when the UST is installed or upon entering the lease. We record a discounted liability for the fair value of an asset retirement obligation with a corresponding increase to the carrying value of the related long-lived asset. We depreciate the amount added to property and equipment and recognize accretion expense in connection with the discounted liability over the estimated remaining life of the UST. Accretion expense is reflected in depreciation, amortization and accretion expense. We base our estimates of the anticipated future costs for removal of a UST on our prior experience with removal. Removal costs include the cost to remove the USTs, soil remediation costs resulting from the spillage of small quantities of motor fuel in the normal operations of our business and other miscellaneous costs. We review our assumptions for computing the estimated liability for the removal of USTs on an annual basis. Any change in estimated cash flows is reflected as an adjustment to the liability and the associated asset.
Segment Reporting
We present our segment reporting in accordance with ASC 280–Segment Reporting and engage in both the wholesale and retail distribution of motor fuels, primarily gasoline and diesel fuel. We present our results to our chief operating decision maker segregated between wholesale and retail activities. As a result, we are deemed to conduct our business in two segments: 1) the wholesale segment and 2) the retail segment. The class of customer and gross margins are sufficiently different between these two businesses to warrant two reportable segments. See Note 21 for additional information.
Revenue Recognition
Revenues from the delivery of motor fuel are recorded upon delivery to our customers, by which time the price is fixed, title to the products has transferred and payment has either been received or collection is reasonably assured, net of applicable discounts and allowances.
74
CROSSAMERICA PARTNERS LP
NOTES TO CONSOLIDATED FINANCIAL STATEMENTS
Revenues from the sale of convenience store products are recognized at the time of sale to the customer.
Revenues from leasing arrangements for which we are the lessor are recognized ratably over the term of the underlying lease.
Cost of Sales
We include in our cost of sales all costs we incur to acquire motor fuel and merchandise, including the costs of purchasing, storing and transporting inventory prior to delivery to our customers. A component of our cost of sales is the discount for prompt payment and other rebates, discounts and incentives offered by our suppliers. Prompt payment discounts from suppliers are based on a percentage of the purchase price of motor fuel and the dollar value of these discounts varies with motor fuel prices. Cost of sales does not include any depreciation of our property and equipment, as these amounts are included in depreciation, amortization and accretion expense on our statements of income.
Motor Fuel Taxes
LGW collects motor fuel taxes, which consist of various pass through taxes collected from customers on behalf of taxing authorities, and remits such taxes directly to those taxing authorities. LGW’s accounting policy is to exclude the taxes collected and remitted from wholesale revenues and cost of sales and account for them as liabilities. LGWS’s retail sales and cost of sales include motor fuel taxes as the taxes are included in the cost paid for motor fuel and LGWS has no direct responsibility to collect or remit such taxes to the taxing authorities.
Lease Accounting
We account for leases in accordance with ASC 840–Leases. We lease certain retail sites from third parties under long-term arrangements with various expiration dates. U.S. GAAP requires leases be evaluated and classified as either operating or capital for financial reporting purposes. The lease term used for lease evaluation includes option periods only in instances in which the exercise of the option period can be reasonably assured and failure to exercise such options would result in an economic penalty. Minimum lease payments are expensed on a straight-line basis over the term of the lease including renewal periods that are reasonably assured at the inception of the lease. In addition to minimum lease payments, certain leases require additional contingent payments based on sales volume or future inflation.
We are the lessee in certain sale-leaseback transactions for certain retail sites, and as we have continuing involvement in the underlying retail sites through a sublease with a lessee dealer or the lease agreement has a repurchase feature, the sale-leaseback arrangements are accounted for as financing transactions.
Income Taxes
Our wholly owned taxable subsidiaries recognize deferred income tax assets and liabilities for the expected future income tax consequences of temporary differences between financial statement carrying amounts and the related income tax basis.
Income tax attributable to our earnings and losses, excluding the earnings and losses of our wholly owned taxable subsidiaries, are assessed at the individual level of the unitholder. Accordingly, we do not record a provision for income taxes other than for those earnings and losses generated or incurred by our wholly owned taxable subsidiaries.
Tax positions not meeting the more-likely-than-not recognition threshold at the financial statement date may not be recognized or continue to be recognized under the accounting guidance for income taxes. Where required, we recognize interest and penalties for uncertain tax positions in income taxes.
Valuation allowances are initially recorded and reevaluated each reporting period by assessing the likelihood of the ultimate realization of a deferred tax asset. Management considers a number of factors in assessing the realization of a deferred tax asset, including the reversal of temporary differences, projections of future taxable income and ongoing prudent and feasible tax planning strategies. The amount of deferred tax assets ultimately realized may differ materially from the estimates utilized in the computation of valuation allowances and may materially impact the financial statements in the future.
75
CROSSAMERICA PARTNERS LP
NOTES TO CONSOLIDATED FINANCIAL STATEMENTS
In addition to the common and subordinated units, we have identified the IDRs as participating securities and compute income per unit using the two-class method under which any excess of distributions declared over net income shall be allocated to the partners based on their respective sharing of income specified in the Partnership Agreement. Net income per common unit applicable to limited partners (including common and subordinated unitholders) is computed by dividing the limited partners’ interest in net income, after deducting any incentive distributions, by the weighted-average number of outstanding common and subordinated units. As discussed in Note 17, all subordinated units converted to common units in the first quarter of 2016.
New Accounting Pronouncements
In May 2014, the FASB issued ASU 2014-09–Revenue from Contracts with Customers (Topic 606), which results in comprehensive new revenue accounting guidance, requires enhanced disclosures to help users of financial statements better understand the nature, amount, timing, and uncertainty of revenue that is recognized, and develops a common revenue standard under U.S. GAAP and International Financial Reporting Standards. Specifically, the core principle of the guidance is that an entity should recognize revenue to depict the transfer of promised goods or services to customers in an amount that reflects the consideration to which the entity expects to be entitled in exchange for those goods and services. This guidance was effective January 1, 2018 and we applied the modified retrospective method of adoption. We have completed our assessment and have not identified any material impact on the financial statements, although it will affect disclosures. This guidance applies to over 90% of our revenues as the only primary revenue stream outside the scope of this guidance is rental income.
In February 2016, the FASB issued ASU 2016-02–Leases (Topic 842). This standard modifies existing guidance for reporting organizations that enter into leases to increase transparency by recognizing lease assets and lease liabilities on the balance sheet and disclosing key information about leasing arrangements. ASU 2016-02 is effective for fiscal years and interim periods within those years beginning after December 15, 2018, and requires a modified retrospective approach to adoption. Early adoption is permitted. Management continues to evaluate the impact of this new guidance, but the adoption will have a material impact on our balance sheet as we will be required to recognize right-of-use assets and lease liabilities for operating leases. We will not adopt this guidance early. We intend to apply each of the practical expedients in adopting this new guidance.
In October 2016, the FASB issued ASU 2016-16–Income Taxes (Topic 740): Intra-Entity Transfers of Assets Other Than Inventory. This standard requires companies to account for income tax effects of intercompany transactions other than inventory in the period in which the transfer occurs rather than when the assets are transferred outside of the consolidated entity. We have chosen to early adopt the standard effective January 1, 2017, which had no impact as of the date of adoption but could apply to future intra-entity transactions and require us to recognize the income tax effects of those transactions in the period in which the transfer occurs.
In January 2017, the FASB issued ASU 2017-01–Business Combinations (Topic 805): Clarifying the Definition of a Business. This standard clarifies the definition of a business with the objective of adding guidance to assist entities with evaluating whether transactions should be accounted for as acquisitions (or disposals) of assets or businesses. The definition of a business affects many areas of accounting including acquisitions, disposals, goodwill and consolidation. We early adopted this standard effective January 1, 2017. Although there was no impact upon adoption, among other things, this guidance results in the capitalization rather than expensing of acquisition costs in transactions that are accounted for as asset acquisitions rather than business combinations under the new definition of a business.
In January 2017, the FASB issued ASU 2017-04–Intangibles–Goodwill and Other (Topic 350): Simplifying the Test for Goodwill Impairment. This standard removes Step 2 of the goodwill impairment test. A goodwill impairment will now be the amount by which a reporting unit’s carrying value exceeds its fair value, not to exceed the carrying amount of goodwill. Management early adopted this guidance effective January 1, 2017, which had no impact upon adoption but could result in a change in the measurement of an impairment loss if an impairment was required to be recorded in the future.
Certain other new financial accounting pronouncements have become effective for our financial statements and the adoption of these pronouncements will not affect our financial position or results of operations, nor will they require any additional disclosures.
Concentration Risk
For 2017, 2016 and 2015, we distributed approximately 13%, 16% and 17% of our total wholesale distribution volume to Dunne Manning Stores LLC, an entity associated with the family of a member of the Board (DMS) and DMS accounted for approximately 22%, 26% and 36% of our rental income, respectively.
76
CROSSAMERICA PARTNERS LP
NOTES TO CONSOLIDATED FINANCIAL STATEMENTS
For 2017, 2016 and 2015, we distributed 8%, 8% and 7% of our total wholesale distribution volume to CST retail sites that are not supplied by CST Fuel Supply and received 20%, 21% and 17% of our rental income from CST, respectively.
For more information regarding transactions with DMS and its affiliates and CST, see Note 12.
In 2017, our wholesale business purchased approximately 28%, 27% and 16% of its motor fuel from ExxonMobil, BP and Motiva, respectively. In 2016, our wholesale business purchased approximately 30%, 25% and 24% of its motor fuel from ExxonMobil, BP and Motiva, respectively. In 2015, our wholesale business purchased approximately 30%, 26% and 26% of its motor fuel from ExxonMobil, BP and Motiva, respectively. No other fuel suppliers accounted for 10% or more of our motor fuel purchases during 2017, 2016 or 2015.
Valero supplied substantially all of the motor fuel purchased by CST Fuel Supply during all periods presented. CST Fuel Supply purchased approximately 1.7 billion, 1.8 billion and 1.9 billion gallons of motor fuel from Valero for 2017, 2016 and 2015, respectively.
Note 3. ACQUISITIONS
Jet-Pep Assets Acquisition
On November 28, 2017, we closed on the acquisition of the real property and the fuel supply business of 101 commission operated retail sites, including 92 fee simple sites, the leasehold interest in five real property sites and the fuel supply business to four independent commission sites, all located in Alabama, from Jet-Pep, Inc. and affiliated entities, for aggregate cash consideration of $75.6 million, including the value of the motor fuel inventory contained in the retail sites and net of the assumption of certain liabilities. On the same day, Circle K closed on the acquisition of certain related retail and terminal assets from Jet-Pep, Inc. and affiliated entities.
The set of assets acquired did not meet the definition of a business under ASU 2017-01, and as such, this transaction was accounted for as an asset acquisition. The values ascribed to the assets acquired and liabilities assumed on the date of acquisition were as follows (in thousands):
|
Current assets (excluding cash and inventories) |
|
$ |
263 |
|
|
Inventories |
|
|
3,294 |
|
|
Assets held for sale |
|
|
2,030 |
|
|
Property and equipment |
|
|
63,450 |
|
|
Intangible assets |
|
|
11,174 |
|
|
Accrued expenses and other current liabilities |
|
|
(59 |
) |
|
Asset retirement obligations |
|
|
(3,275 |
) |
|
Other noncurrent liabilities |
|
|
(1,250 |
) |
|
Total consideration |
|
$ |
75,627 |
|
The value of land was based on a market approach. The value of buildings and equipment was based on a cost approach. The buildings and equipment are being depreciated on a straight-line basis, with estimated remaining useful lives of 20 years for the buildings and five to 10 years for equipment.
The $9.2 million value of the wholesale fuel distribution rights included in intangibles was based on an income approach and management believes the level and timing of cash flows represent relevant market participant assumptions. The wholesale fuel distribution rights are being amortized on a straight-line basis over an estimated useful life of approximately 10 years.
The $0.5 million value of the wholesale fuel supply agreements was based on an income approach, and management believes the level and timing of cash flows represent relevant market participant assumptions. The wholesale fuel supply agreements are being amortized on an accelerated basis over an estimated useful life of approximately 10 years.
The $1.0 million value of the trademarks was based on an income approach using the present value of incremental after-tax cash flows attributable solely to the trademark.
The $0.5 million value of the covenant not to compete was based on an income approach using the difference between the present value of after-tax cash flows with and without the covenant not to compete in place. The covenant not to compete intangible asset is being amortized on a straight-line basis over a 5-year period.
77
CROSSAMERICA PARTNERS LP
NOTES TO CONSOLIDATED FINANCIAL STATEMENTS
Operating revenues since the date of acquisition were $15.5 million for the year ended December 31, 2017.
Acquisition of State Oil Assets
On September 27, 2016, we closed on the acquisition of 57 controlled retail sites (56 fee sites and one leased site) and certain other assets of State Oil Company, being operated as 55 lessee dealer accounts and two non-fuel tenant locations, as well as 25 independent dealer accounts located in the greater Chicago market for approximately $41.9 million, including working capital.
In December 2016, we sold 17 of these retail sites. See Note 10 for additional information.
Acquisition of Franchised Holiday Stores
On March 29, 2016, we closed on the acquisition of 31 Franchised Holiday Stores and three liquor stores from S/S/G Corporation for approximately $52.4 million, including working capital. Of the 34 stores, 31 are located in Wisconsin and three are located in Minnesota. The acquisition was funded by borrowings under our credit facility.
Purchase of Wholesale Fuel Supply Contracts from CST
In February 2016, we purchased 21 independent dealer contracts and 11 sub-wholesaler contracts from CST for $2.9 million. See Note 12 for additional information.
Note 4. ASSETS HELD FOR SALE
We have classified 12 and four sites as held for sale at December 31, 2017 and December 31, 2016. Of the sites held for sale at December 31, 2017, 11 are required to be divested per an FTC order in connection with Couche-Tard’s acquisition of Holiday Stationstores, Inc. and the joint acquisition of Jet-Pep Assets by Couche-Tard and us. These assets are expected to be sold in 2018. Assets held for sale were as follows (in thousands):
|
|
|
December 31, |
|
|||||
|
|
|
2017 |
|
|
2016 |
|
||
|
Land |
|
$ |
4,946 |
|
|
$ |
882 |
|
|
Buildings and site improvements |
|
|
5,785 |
|
|
|
1,054 |
|
|
Equipment |
|
|
2,485 |
|
|
|
702 |
|
|
Total |
|
|
13,216 |
|
|
|
2,638 |
|
|
Less accumulated depreciation |
|
|
(1,508 |
) |
|
|
(527 |
) |
|
Assets held for sale |
|
$ |
11,708 |
|
|
$ |
2,111 |
|
During 2017, as approved by the independent conflicts committee of our Board, we sold 29 properties to Dunne Manning Realty LP, an entity affiliated with a member of the Board (DMR), for $18.9 million, resulting in a $0.8 million gain. These sites were generally sites at which we did not supply fuel or represented vacant land. See Note 12 for additional information.
During 2017, we sold two properties as a result of the FTC’s requirements associated with the Merger for $6.7 million, resulting in a gain of $2.2 million. In addition, Circle K agreed to reimburse us for the tax liability incurred on the required sale, resulting in additional proceeds of $0.3 million, which was accounted for as a contribution to partners’ capital. See Note 12 for additional information.
During 2017, DMS renewed its contract with one of its customers, triggering a $0.8 million earn-out payment by DMS to us under a contract entered into with DMS at the time of CST acquiring our General Partner in October 2014, which was recorded as a gain. See Note 12 for additional information.
78
CROSSAMERICA PARTNERS LP
NOTES TO CONSOLIDATED FINANCIAL STATEMENTS
Changes in the allowance for doubtful accounts consisted of the following (in thousands):
|
|
|
Year Ended December 31, |
|
|||||||||
|
|
|
2017 |
|
|
2016 |
|
|
2015 |
|
|||
|
Balance as of beginning of year |
|
$ |
487 |
|
|
$ |
1,090 |
|
|
$ |
754 |
|
|
Increase in allowance charged to expense |
|
|
103 |
|
|
|
36 |
|
|
|
521 |
|
|
Accounts charged against the allowance, net of recoveries |
|
|
(313 |
) |
|
|
(639 |
) |
|
|
(185 |
) |
|
Balance as of end of year |
|
$ |
277 |
|
|
$ |
487 |
|
|
$ |
1,090 |
|
Notes receivable from lessee dealers totaled $3.2 million and $3.5 million at December 31, 2017 and 2016, respectively, and are included in other current assets and other noncurrent assets on the consolidated balance sheets.
Note 6. INVENTORIES
Inventories consisted of the following (in thousands):
|
|
|
December 31, |
|
|||||
|
|
|
2017 |
|
|
2016 |
|
||
|
Retail site merchandise |
|
$ |
7,806 |
|
|
$ |
8,374 |
|
|
Motor fuel |
|
|
7,316 |
|
|
|
4,790 |
|
|
Inventories |
|
$ |
15,122 |
|
|
$ |
13,164 |
|
Note 7. PROPERTY AND EQUIPMENT
Property and equipment, net consisted of the following (in thousands):
|
|
|
December 31, |
|
|||||
|
|
|
2017 |
|
|
2016 |
|
||
|
Land |
|
$ |
285,682 |
|
|
$ |
280,400 |
|
|
Buildings and site improvements |
|
|
362,207 |
|
|
|
346,834 |
|
|
Leasehold improvements |
|
|
10,155 |
|
|
|
9,095 |
|
|
Equipment |
|
|
185,733 |
|
|
|
169,245 |
|
|
Construction in progress |
|
|
1,797 |
|
|
|
3,173 |
|
|
Property and equipment, at cost |
|
|
845,574 |
|
|
|
808,747 |
|
|
Accumulated depreciation and amortization |
|
|
(164,574 |
) |
|
|
(131,418 |
) |
|
Property and equipment, net |
|
$ |
681,000 |
|
|
$ |
677,329 |
|
Approximately $601.3 million of property and equipment, net was used for leasing purposes at December 31, 2017.
We are the lessee in certain sale-leaseback transactions for certain retail sites, and because we have continuing involvement in the underlying retail sites, or the lease agreement has a repurchase feature, the sale-leaseback arrangements are accounted for as lease financing obligations. The table above includes these retail sites, as well as certain leases accounted for as capital leases. The total cost and accumulated amortization of property and equipment recorded by us under sale leaseback transactions and capital leases was $103.0 million and $30.6 million, respectively, at December 31, 2017 and $101.0 million and $23.9 million, respectively, at December 31, 2016.
See Note 11 for future minimum rental payments on capital lease obligations and Note 10 for future minimum rental payments on sale-leaseback obligations.
Depreciation expense, including amortization of assets recorded under sale-leasebacks and capital lease obligations, was approximately $42.5 million, $39.5 million and $33.7 million for 2017, 2016 and 2015, respectively. These amounts include impairments primarily recorded when sites were classified as assets held for sale amounting to $1.3 million, $1.1 million and $0.4 million for 2017, 2016 and 2015, respectively.
79
CROSSAMERICA PARTNERS LP
NOTES TO CONSOLIDATED FINANCIAL STATEMENTS
Intangible assets consisted of the following (in thousands):
|
|
|
December 31, 2017 |
|
|
December 31, 2016 |
|
||||||||||||||||||
|
|
|
Gross Amount |
|
|
Accumulated Amortization |
|
|
Net Carrying Amount |
|
|
Gross Amount |
|
|
Accumulated Amortization |
|
|
Net Carrying Amount |
|
||||||
|
Wholesale fuel supply contracts/rights |
|
$ |
127,955 |
|
|
$ |
(56,915 |
) |
|
$ |
71,040 |
|
|
$ |
118,201 |
|
|
$ |
(44,298 |
) |
|
$ |
73,903 |
|
|
Trademarks |
|
|
2,064 |
|
|
|
(863 |
) |
|
|
1,201 |
|
|
|
1,094 |
|
|
|
(685 |
) |
|
|
409 |
|
|
Covenant not to compete |
|
|
4,581 |
|
|
|
(3,300 |
) |
|
|
1,281 |
|
|
|
4,131 |
|
|
|
(2,503 |
) |
|
|
1,628 |
|
|
Below market leases |
|
|
11,401 |
|
|
|
(8,860 |
) |
|
|
2,541 |
|
|
|
12,081 |
|
|
|
(7,261 |
) |
|
|
4,820 |
|
|
Total intangible assets |
|
$ |
146,001 |
|
|
$ |
(69,938 |
) |
|
$ |
76,063 |
|
|
$ |
135,507 |
|
|
$ |
(54,747 |
) |
|
$ |
80,760 |
|
Intangible assets associated with wholesale fuel supply contracts/rights are amortized over 10 years using either an accelerated or straight-line amortization method as appropriate. Trademarks are amortized over five years. Covenants not to compete are amortized over the shorter of the contract term or five years. Intangible assets associated with above and below market leases are amortized over the applicable lease term.
Amortization expense, including amortization of above and below market lease intangible assets, which is classified as rent expense, was $13.7 million, $13.7 million and $13.4 million for the years ended December 31, 2017, 2016 and 2015, respectively. Aggregate amortization expense is expected to be $14.8 million, $12.4 million, $12.1 million, $11.5 million and $10.7 million for the years ending December 31, 2018, 2019, 2020, 2021 and 2022, respectively.
Note 9. GOODWILL
There were no changes in goodwill during 2017. Changes in goodwill during 2016 consisted of the following (in thousands):
|
|
|
Wholesale Segment |
|
|
Retail Segment |
|
|
Consolidated |
|
|||
|
Balance at December 31, 2015 |
|
$ |
61,548 |
|
|
$ |
19,273 |
|
|
$ |
80,821 |
|
|
Acquisitions |
|
|
1,720 |
|
|
|
6,568 |
|
|
|
8,288 |
|
|
Reassignment |
|
|
6,489 |
|
|
|
(6,489 |
) |
|
|
— |
|
|
Balance at December 31, 2016 and 2017 |
|
$ |
69,757 |
|
|
$ |
19,352 |
|
|
$ |
89,109 |
|
Our business strategy includes the conversion of retail sites from company operated retail sites to lessee dealers. As a result of these conversions, there is a reduction in future cash flows in the Retail segment and an expected increase in future cash flows that will be received by the Wholesale segment subsequent to the date of conversion. The effect of these conversions during 2016 was a $6.5 million reassignment of goodwill originally assigned to the Retail segment to the Wholesale segment. There was no reassignment during 2017.
Note 10. ACCRUED EXPENSES AND OTHER LONG-TERM LIABILITIES
Accrued expenses and other current liabilities consisted of the following (in thousands):
|
|
|
December 31, |
|
|||||
|
|
|
2017 |
|
|
2016 |
|
||
|
Taxes other than income |
|
$ |
8,303 |
|
|
$ |
7,177 |
|
|
Current portion of environmental liabilities |
|
|
1,611 |
|
|
|
1,602 |
|
|
Interest |
|
|
1,223 |
|
|
|
993 |
|
|
Current portion of sale leaseback obligations |
|
|
1,020 |
|
|
|
856 |
|
|
Equity-based incentive compensation |
|
|
707 |
|
|
|
1,758 |
|
|
Professional fees |
|
|
522 |
|
|
|
464 |
|
|
Payroll |
|
|
531 |
|
|
|
491 |
|
|
Termination benefits |
|
|
245 |
|
|
|
151 |
|
|
Other |
|
|
2,853 |
|
|
|
2,213 |
|
|
Total accrued expenses and other current liabilities |
|
$ |
17,015 |
|
|
$ |
15,705 |
|
80
CROSSAMERICA PARTNERS LP
NOTES TO CONSOLIDATED FINANCIAL STATEMENTS
Other long-term liabilities consisted of the following (in thousands):
|
|
|
December 31, |
|
|||||
|
|
|
2017 |
|
|
2016 |
|
||
|
Sale leaseback obligations, net of deferred financing costs |
|
$ |
76,447 |
|
|
$ |
77,412 |
|
|
Security deposits |
|
|
10,593 |
|
|
|
9,443 |
|
|
Environmental liabilities |
|
|
1,926 |
|
|
|
2,567 |
|
|
Above market leases |
|
|
2,886 |
|
|
|
4,841 |
|
|
Deferred rent expense |
|
|
2,968 |
|
|
|
3,105 |
|
|
Other |
|
|
3,241 |
|
|
|
2,885 |
|
|
Total other long-term liabilities |
|
$ |
98,061 |
|
|
$ |
100,253 |
|
Sale Leaseback Obligations
We are the lessee in certain sale-leaseback transactions for certain retail sites that expire through 2032, and as we have continuing involvement in the underlying retail sites through a sublease with a lessee dealer or the lease agreement has a repurchase feature, the sale-leaseback arrangements are accounted for as lease financing obligations. In lieu of recognizing rent expense for the lease rental payments, we record interest expense, which amounted to $3.9 million, $3.3 million and $2.4 million for 2017, 2016 and 2015, respectively. The future minimum lease payments under sale leaseback financing obligations as of December 31, 2017 are as follows (in thousands):
|
2018 |
|
$ |
6,605 |
|
|
2019 |
|
|
6,673 |
|
|
2020 |
|
|
6,649 |
|
|
2021 |
|
|
6,740 |
|
|
2022 |
|
|
6,832 |
|
|
Thereafter |
|
|
62,886 |
|
|
Total future minimum lease payments |
|
|
96,385 |
|
|
Less interest component |
|
|
64,693 |
|
|
Present value of minimum lease payments |
|
|
31,692 |
|
|
Plus net book value of property at end of lease |
|
|
24,510 |
|
|
Plus deferred gain to be recognized at end of lease |
|
|
22,077 |
|
|
Gross sale leaseback obligations |
|
|
78,279 |
|
|
Current portion |
|
|
1,020 |
|
|
Long-term portion |
|
|
77,259 |
|
|
Deferred financing costs, net |
|
|
812 |
|
|
Long-term portion, net of deferred financing costs |
|
$ |
76,447 |
|
Renegotiation of Rocky Top Purchase Obligation
In connection with the Rocky Top acquisition completed in September 2013, we entered into a deferred seller financing arrangement, which obligated us to purchase certain retail sites over a 5-year period for an average of $5.2 million per year beginning in 2016 at an approximately 7.7% capitalization rate. In June 2016, we renegotiated the terms with the sellers, eliminating the deferred seller financing obligation and agreeing to terms of a new lease of the assets for an initial term of 15 years and eight months with four renewal options of five years each. Under this triple net lease, annual rent is initially $1.8 million based on a 6.5% capitalization rate and increases 1.5% per year. However, because of the continuing involvement we have with the retail sites through the lease and sublease of the properties, we recorded the liability on our balance sheet at fair value in June 2016, which approximated its carrying value. These lease financing obligations are classified within accrued expenses and other current liabilities and other noncurrent liabilities on the consolidated balance sheet.
Sale Leaseback Transaction
In December 2016, we sold the real property at 17 retail sites acquired through the State Oil Assets acquisition for cash proceeds of $25.0 million, which were used to repay borrowings on the credit facility. We lease these properties for an initial term of 15 years with three renewal options of approximately five years each. Under the triple net lease, annual rent is initially $1.6 million based on a 6.5% capitalization rate and increases every five years based on inflation. Because of the continuing involvement we have with the retail sites through the lease and sublease of the properties, we recorded a liability for the proceeds received and are amortizing this liability over the lease term as rent payments are made.
81
CROSSAMERICA PARTNERS LP
NOTES TO CONSOLIDATED FINANCIAL STATEMENTS
Environmental laws in the U.S. require the permanent closure of USTs within one to two years after the USTs are no longer in service, depending on the jurisdiction in which the USTs are located. We have estimated that USTs at our owned retail sites will remain in service approximately 30 years and that we will have an obligation to remove those USTs at that time. For our leased retail sites, our lease agreements generally require that we remove certain improvements, primarily USTs and signage, upon termination of the lease, and so an asset retirement obligation is incurred upon entering the lease. There are no assets that are legally restricted for purposes of settling our asset retirement obligations.
A rollforward of our asset retirement obligation is below (in thousands):
|
|
|
December 31, |
|
|||||
|
|
|
2017 |
|
|
2016 |
|
||
|
Beginning balance |
|
$ |
27,750 |
|
|
$ |
23,484 |
|
|
Recognition of asset retirement obligations |
|
|
3,525 |
|
|
|
3,205 |
|
|
Changes in estimated cash flows or settlement dates |
|
|
(1,078 |
) |
|
|
(291 |
) |
|
Accretion |
|
|
1,427 |
|
|
|
1,403 |
|
|
Obligations settled |
|
|
(157 |
) |
|
|
(51 |
) |
|
Ending balance |
|
$ |
31,467 |
|
|
$ |
27,750 |
|
Note 11. DEBT
Our balances for long-term debt and capital lease obligations are as follows (in thousands):
|
|
|
December 31, |
|
|||||
|
|
|
2017 |
|
|
2016 |
|
||
|
$550 million revolving credit facility |
|
$ |
506,000 |
|
|
$ |
441,500 |
|
|
Capital lease obligations |
|
|
27,220 |
|
|
|
28,455 |
|
|
Note payable |
|
|
765 |
|
|
|
822 |
|
|
Total debt and capital lease obligations |
|
|
533,985 |
|
|
|
470,777 |
|
|
Current portion |
|
|
2,916 |
|
|
|
2,100 |
|
|
Noncurrent portion |
|
|
531,069 |
|
|
|
468,677 |
|
|
Deferred financing costs, net |
|
|
1,922 |
|
|
|
3,558 |
|
|
Noncurrent portion, net of deferred financing costs |
|
$ |
529,147 |
|
|
$ |
465,119 |
|
The following represents principal payments on debt and future minimum lease payments on capital lease obligations for the next five years (in thousands):
|
|
|
Debt |
|
|
Capital Lease Obligations |
|
|
Total |
|
|||
|
2018 |
|
$ |
765 |
|
|
$ |
2,975 |
|
|
$ |
3,740 |
|
|
2019 |
|
|
506,000 |
|
|
|
3,079 |
|
|
|
509,079 |
|
|
2020 |
|
|
— |
|
|
|
3,176 |
|
|
|
3,176 |
|
|
2021 |
|
|
— |
|
|
|
3,274 |
|
|
|
3,274 |
|
|
2022 |
|
|
— |
|
|
|
3,374 |
|
|
|
3,374 |
|
|
Thereafter |
|
|
— |
|
|
|
15,799 |
|
|
|
15,799 |
|
|
Total future minimum lease payments |
|
|
506,765 |
|
|
|
31,677 |
|
|
|
538,442 |
|
|
Less interest component |
|
|
— |
|
|
|
4,457 |
|
|
|
4,457 |
|
|
|
|
|
506,765 |
|
|
|
27,220 |
|
|
|
533,985 |
|
|
Current portion |
|
|
765 |
|
|
|
2,151 |
|
|
|
2,916 |
|
|
Long-term portion |
|
$ |
506,000 |
|
|
$ |
25,069 |
|
|
$ |
531,069 |
|
82
CROSSAMERICA PARTNERS LP
NOTES TO CONSOLIDATED FINANCIAL STATEMENTS
The credit facility is a senior secured revolving credit facility maturing on March 4, 2019, with a total borrowing capacity of $550.0 million, under which swing-line loans may be drawn up to $25.0 million and standby letters of credit may be issued up to an aggregate of $45.0 million. The credit facility may be increased, from time to time, upon our written request, subject to certain conditions, up to an additional $100.0 million. Letters of credit outstanding at December 31, 2017 and 2016 totaled $6.7 million and $6.5 million, respectively. The amount of availability at December 31, 2017 under the revolving credit facility, after taking into account outstanding letters of credit and debt covenant constraints, was $37.3 million. In connection with future acquisitions, the revolving credit facility requires, among other things that we have, after giving effect to such acquisition, at least $20.0 million, in the aggregate, of borrowing availability under the revolving credit facility and unrestricted cash on the balance sheet on the date of such acquisition. All obligations under the credit facility are secured by substantially all of the assets of the Partnership and its subsidiaries.
Outstanding borrowings under the revolving credit facility bear interest at LIBOR plus an applicable margin, which was 3.00% at December 31, 2017. Our borrowings had a weighted-average interest rate of 4.44% at December 31, 2017.
We are required to comply with certain financial covenants under the credit facility. We are required to maintain a total leverage ratio (as defined in the credit facility) for the most recently completed four fiscal quarters of less than or equal to 4.50 : 1.00, except for periods following a material acquisition, generally defined as an acquisition with a purchase price of at least $30.0 million. The total leverage ratio shall not exceed 5.00 : 1.00 for the quarter in which a material acquisition closes and the first three full fiscal quarters following the closing of a material acquisition. If we issued Qualified Senior Notes (as defined in the credit facility) in the aggregate principal amount of $175.0 million or greater, the ratio shall not exceed 5.50 : 1.00. If we issued Qualified Senior Notes of $175.0 million or greater, we are also required to maintain a senior leverage ratio (as defined in the credit facility) of less than or equal to 3.00 : 1.00 and a consolidated interest coverage ratio (as defined in the credit facility) of at least 2.75 : 1.00. As of December 31, 2017, we were in compliance with these financial covenants.
The credit facility prohibits us from making distributions to our unitholders if any potential default or event of default occurs or would result from the distribution, or we are not in compliance with our financial covenants. In addition, the credit facility contains various covenants which may limit, among other things, our ability to grant liens; create, incur, assume, or suffer to exist other indebtedness; or make any material change to the nature of our business, including mergers, liquidations, and dissolutions; and make certain investments, acquisitions or dispositions.
Note Payable
In connection with a June 2013 acquisition of certain retail sites in Florida, we issued a $1.0 million note payable with interest at 4.0%. The note matures July 1, 2018, at which time a balloon payment for all outstanding principal and any unpaid interest is due. The loan is secured by all the real and personal property at these retail sites.
Capital Lease Obligations
In May 2012, the Predecessor Entities entered into a 15-year master lease agreement with renewal options of up to an additional 20 years with Getty. Pursuant to the lease, the Predecessor Entities originally leased 105 retail sites in Massachusetts, New Hampshire and Maine. The lease was assigned to the Partnership. In December 2012, the agreement was amended to add an additional 25 retail sites in New Jersey. Since then, the agreement has been amended from time to time to add an insignificant number of additional retail sites. We pay fixed rent, which increases 1.5% per year. In addition, the lease requires contingent rent payments based on gallons of motor fuel sold.
Because the fair value of the land at lease inception was estimated to represent more than 25% of the total fair value of the real property subject to the lease, the land element of the lease was analyzed for operating or capital treatment separately from the rest of the property subject to the lease. The land element of the lease was classified as an operating lease and all of the other property was classified as a capital lease. As such, future minimum lease payments are included in both the capital lease obligations table above as well as the operating lease table in Notes 11 and 13.
Through December 31, 2017, certain retail sites have been terminated from the lease. Any property and equipment or capital lease obligations associated with these retail sites were removed from the balance sheet.
83
CROSSAMERICA PARTNERS LP
NOTES TO CONSOLIDATED FINANCIAL STATEMENTS
Note 12. RELATED PARTY TRANSACTIONS
Transactions with Circle K
Fuel Sales and Rental Income
We sell wholesale motor fuel under a master fuel distribution agreement to 49 Circle K retail sites and lease real property on 73 retail sites to Circle K under a master lease agreement each having initial 10-year terms. The fuel distribution agreement provides us with a fixed wholesale mark-up per gallon. The master lease agreement is a triple net lease.
Revenues from wholesale fuel sales and real property rental income from CST and Circle K were as follows (in thousands):
|
|
|
For the Year Ended December 31, |
|
|||||||||
|
|
|
2017 |
|
|
2016 |
|
|
2015 |
|
|||
|
Revenues from motor fuel sales to CST and Circle K |
|
$ |
136,649 |
|
|
$ |
118,745 |
|
|
$ |
135,813 |
|
|
Rental income from CST and Circle K |
|
|
17,021 |
|
|
|
17,188 |
|
|
|
11,422 |
|
Accounts receivable from Circle K for fuel amounted to $3.9 million and $3.2 million at December 31, 2017 and December 31, 2016, respectively.
Amended Omnibus Agreement and Management Fees
We incurred $13.9 million, $15.9 million and $15.3 million for 2017, 2016 and 2015, respectively, including incentive compensation costs and non-cash stock-based compensation expense under the Amended Omnibus Agreement, which are recorded as a component of operating expenses and general and administrative expenses in the statement of income. Amounts payable to Circle K and CST were $25.3 million and $10.0 million at December 31, 2017 and December 31, 2016, respectively. The amounts payable at December 31, 2017 include separation benefits associated with the Merger and equity compensation expense associated with CST stock-based awards. See Note 24 for additional information.
Common Units Issued to CST and Circle K as Consideration for Amounts due Under the Amended Omnibus Agreement
As approved by the independent conflicts committee of the Board, the Partnership, CST and Circle K mutually agreed to settle, from time to time, some or all of the amounts due under the terms of the Amended Omnibus Agreement in newly issued common units representing limited partner interests in the Partnership. We issued the following common units to CST or Circle K as consideration for amounts due under the terms of the Amended Omnibus Agreement:
|
Year |
|
Number of Common Units Issued |
|
|
|
2015 |
|
|
259,312 |
|
|
2016 |
|
|
440,266 |
|
|
2017 |
|
|
550,516 |
|
Circle K will receive 136,882 common units on March 1, 2018 as a portion of the payment for the management fees for the fourth quarter of 2017.
CST Fuel Supply Equity Interests
CST Fuel Supply provides wholesale motor fuel distribution to the majority of CST’s legacy U.S. retail sites at cost plus a fixed markup per gallon. We owned a 17.5% total interest in CST Fuel Supply at December 31, 2017 and 2016. We account for the income derived from our equity interest of CST Fuel Supply as “Income from CST Fuel Supply equity interests” on our statement of income, which amounted to $14.9 million, $16.0 million and $10.5 million for 2017, 2016 and 2015, respectively. Accounts receivable from Circle K and CST related to this income amounted to $1.2 million at December 31, 2017 and December 31, 2016.
In connection with the Merger, the FTC approved a final order requiring the divestiture of certain CST retail fuel stations. As a result, in September 2017, 61 sites were sold to a third party and removed from the fuel distribution agreement between CST Marketing and Supply and CST Services. CST Marketing and Supply no longer supplies fuel to such sites. To compensate for the decrease in the amount of motor fuels sold by CST Marketing and Supply, Circle K agreed to purchase at least 114.9 million gallons annually (the “Annual Commitment”) in addition to the volumes continued to be sold under the fuel distribution agreement to retail fuel stations that remain with Circle K after the divestiture. In addition, should Circle-K fail to purchase all or a portion of the Annual Commitment, Circle K has agreed to make monthly payments to CST Marketing and Supply in the
84
CROSSAMERICA PARTNERS LP
NOTES TO CONSOLIDATED FINANCIAL STATEMENTS
amount of the seller’s margin of $0.05 per gallon under the fuel distribution agreement multiplied by the number of gallons not physically sold pursuant to the Annual Commitment. Consequently, the Partnership, by virtue of its 17.5% ownership interest in CST Fuel Supply, the 100% owner of CST Marketing and Supply, will continue to receive its share from the volumes sold to the 61 retail sites prior to the FTC mandated divestiture. This agreement continues until the fuel distribution agreement between CST Marketing and Supply and CST Services is terminated, which had an initial term of 10 years expiring in December 2024.
In July 2016, CST provided a refund payment to us related to our 17.5% interest in CST Fuel Supply resulting from the sale by CST of 79 retail sites in California and Wyoming to 7-Eleven, Inc. and its wholly-owned subsidiary, SEI Fuel Services, Inc., to which CST Fuel Supply no longer supplies motor fuel. The purpose of the refund payment was to make us whole for the decrease in the value of our interest in CST Fuel Supply arising from sales volume decreases. The total refund payment received by us, as approved by the independent conflicts committee of the Board, was approximately $18.2 million ($17.5 million in cash with the remainder in our common units owned by CST) and was accounted for as a contribution to equity.
Purchase of Fuel from CST and Circle K
We purchase the fuel supplied to 32 retail sites from CST Fuel Supply of which we own a 17.5% interest, and resell the wholesale motor fuel to independent dealers and sub-wholesalers. We purchased $23.8 million and $20.4 million of motor fuel from CST Fuel Supply for the year ended December 31, 2017 and 2016, respectively, in connection with these retail sites.
We also purchase the fuel supplied to 101 retail sites acquired in the Jet-Pep Assets acquisition from a terminal owned and operated by Circle K. We purchased $11.3 million of motor fuel from Circle K in 2017.
Circle K acquired Holiday Stationstores, Inc. (Holiday) on December 15, 2017. Prior to that acquisition, we were a franchisee of Holiday (Franchised Holiday Stores), purchased fuel from Holiday and paid a franchise fee to Holiday. As a result of Circle K’s acquisition, we purchase fuel from Circle K to supply our Holiday-branded sites. For 2017, these purchases amounted to $1.9 million. We also pay a franchise fee to Circle K, which for 2017 was insignificant.
IDR and Common Unit Distributions
We distributed $4.3 million, $3.4 million and $1.4 million to CST or Circle K related to its ownership of our IDRs and $17.0 million, $15.5 million and $8.1 million related to its ownership of our common units during 2017, 2016 and 2015, respectively.
Income Tax Reimbursement
As discussed in Note 4, we sold two properties during the year ended December 31, 2017 as a result of the FTC’s requirements associated with Couche-Tard’s acquisition of CST. Circle K agreed to reimburse us for the tax liability incurred on the required sale, resulting in additional proceeds of $0.3 million, which was accounted for as a contribution to partners’ capital.
Wholesale Motor Fuel Sales and Real Estate Rentals
Revenues from motor fuel sales and rental income from DMS and its affiliates were as follows (in thousands):
|
|
|
For the Year Ended December 31, |
|
|||||||||
|
|
|
2017 |
|
|
2016 |
|
|
2015 |
|
|||
|
Revenues from motor fuel sales to DMS and its affiliates |
|
$ |
241,895 |
|
|
$ |
254,292 |
|
|
$ |
322,918 |
|
|
Rental income from DMS and its affiliates |
|
|
18,753 |
|
|
|
21,208 |
|
|
|
23,474 |
|
Accounts receivable from DMS and its affiliates totaled $9.3 million and $8.6 million at December 31, 2017 and December 31, 2016, respectively.
Revenue from rental income from Topstar Enterprises, an entity affiliated with a member of the Board, was $0.5 million for 2017, 2016 and 2015.
We lease real estate from certain entities affiliated with Joseph V. Topper, Jr., director of the Board. Rent expense paid to these entities was $0.9 million for 2017, 2016 and 2015.
As discussed in Note 4, DMS renewed its contract with one of its customers, triggering a $0.8 million earn-out payment by DMS to us under a contract entered into with DMS at the time of CST acquiring our General Partner in October 2014.
85
CROSSAMERICA PARTNERS LP
NOTES TO CONSOLIDATED FINANCIAL STATEMENTS
Also as discussed in Note 4, we sold 29 properties to DMR during 2017 for $18.9 million, resulting in a gain of $0.8 million.
Maintenance and Environmental Costs
Certain maintenance and environmental monitoring and remediation activities are performed by an entity affiliated with Joseph V. Topper, Jr., a member of the Board, as approved by the independent conflicts committee of the Board. We incurred charges with this related party of $1.5 million, $1.6 million and $1.3 million for 2017, 2016 and 2015, respectively. Accounts payable to this related party amounted to $0.2 million at December 31, 2017.
Aircraft Usage Costs
From time to time, we lease, on a non-exclusive basis, aircraft owned by a group of individuals that includes Joseph V. Topper, Jr. and John B. Reilly, III, members of our Board, as previously approved in August 2013 by the independent conflicts committee of the Board. We incurred $0.2 million for 2015.
Principal Executive Offices
Our principal executive offices are in Allentown, Pennsylvania. We sublease office space from Circle K that Circle K leases from an affiliate of John B. Reilly, III and Joseph V. Topper, Jr., members of our Board. The management fee charged by Circle K to us under the Amended Omnibus Agreement incorporates this rental expense, which amounted to $0.7 million, $0.6 million and $0.3 million for 2017, 2016 and 2015, respectively.
Public Relations and Website Consulting Services
We have engaged a company affiliated with a member of the Board for public relations and website consulting services. The cost of these services amounted to $0.1 million for 2017, 2016 and 2015.
Note 13. OPERATING LEASES
Operating Leases of Retail Sites as Lessee
We lease retail sites from third parties under certain non-cancelable operating leases that expire from time to time through 2030. Total rent expense amounted to $21.3 million, $21.7 million and $22.4 million for 2017, 2016 and 2015, respectively.
The future minimum lease payments under operating leases as of December 31, 2017 were as follows (in thousands):
|
2018 |
|
$ |
17,249 |
|
|
2019 |
|
|
15,629 |
|
|
2020 |
|
|
13,377 |
|
|
2021 |
|
|
10,702 |
|
|
2022 |
|
|
9,113 |
|
|
Thereafter |
|
|
29,810 |
|
|
Total future minimum lease payments |
|
$ |
95,880 |
|
The future minimum lease payments presented above do not include contingent rent based on future inflation, future revenues or volumes, or amounts that may be paid as reimbursements for certain operating costs incurred by the lessor. Most lease agreements include provisions for renewals.
Contingent rent expense, based on gallons sold, was approximately $1.9 million, $2.1 million and $1.3 million for 2017, 2016 and 2015, respectively.
86
CROSSAMERICA PARTNERS LP
NOTES TO CONSOLIDATED FINANCIAL STATEMENTS
Operating Leases of Retail Sites as Lessor
Motor fuel stations are leased to tenants under operating leases with various expiration dates ranging through 2032.
The future minimum lease payments under non-cancelable operating leases with third parties, Circle K and DMS as of December 31, 2017 were as follows (in thousands):
|
|
|
Third Party |
|
|
Circle K |
|
|
DMS |
|
|
Total |
|
||||
|
2018 |
|
$ |
32,364 |
|
|
$ |
14,178 |
|
|
$ |
14,433 |
|
|
$ |
60,975 |
|
|
2019 |
|
|
26,565 |
|
|
|
14,178 |
|
|
|
14,649 |
|
|
|
55,392 |
|
|
2020 |
|
|
21,242 |
|
|
|
14,178 |
|
|
|
14,869 |
|
|
|
50,289 |
|
|
2021 |
|
|
17,751 |
|
|
|
14,178 |
|
|
|
15,092 |
|
|
|
47,021 |
|
|
2022 |
|
|
16,201 |
|
|
|
14,178 |
|
|
|
15,319 |
|
|
|
45,698 |
|
|
Thereafter |
|
|
52,061 |
|
|
|
33,027 |
|
|
|
83,029 |
|
|
|
168,117 |
|
|
Total future minimum lease payments |
|
|
166,184 |
|
|
|
103,917 |
|
|
|
157,391 |
|
|
|
427,492 |
|
Through the first five years of the lease with DMS, the lease agreement allows for a limited number of sites to be removed from the lease by each of DMS and us. In November 2017, we entered into an amendment of the master lease with DMS that extended the date through which certain retail sites may be removed from the lease by one year to December 2018.
The future minimum lease payments presented above do not include contingent rent based on future inflation, future revenues or volumes of the lessee, or amounts that may be received as tenant reimbursements for certain operating costs. Most lease agreements include provisions for renewals.
Deferred rent income from straight-line rent relates to the cumulative amount by which straight-line rental income recorded to date exceeds cash rents billed to date under the lease agreement and totaled $6.9 million and $5.6 million at December 31, 2017 and 2016, respectively.
Note 14. ENVIRONMENTAL MATTERS
We currently own or lease retail sites where refined petroleum products are being or have been handled. These retail sites and the refined petroleum products handled thereon may be subject to federal and state environmental laws and regulations. Under such laws and regulations, we could be required to remove or remediate containerized hazardous liquids or associated generated wastes (including wastes disposed of or abandoned by prior owners or operators), to remediate contaminated property arising from the release of liquids or wastes into the environment, including contaminated groundwater, or to implement best management practices to prevent future contamination.
We maintain insurance of various types with varying levels of coverage that is considered adequate under the circumstances to cover operations and properties. The insurance policies are subject to deductibles that are considered reasonable and not excessive. In addition, we have entered into indemnification and escrow agreements with various sellers in conjunction with several of their respective acquisitions, as further described below. Financial responsibility for environmental remediation is negotiated in connection with each acquisition transaction. In each case, an assessment is made of potential environmental liability exposure based on available information. Based on that assessment and relevant economic and risk factors, a determination is made whether to, and the extent to which we will assume liability for existing environmental conditions.
The table below presents a rollforward of our environmental liability (in thousands):
|
|
|
December 31, |
|
|||||
|
|
|
2017 |
|
|
2016 |
|
||
|
Beginning balance |
|
$ |
4,169 |
|
|
$ |
2,753 |
|
|
Provision for new environmental losses |
|
|
1,334 |
|
|
|
199 |
|
|
Changes in estimates for previously incurred losses |
|
|
(579 |
) |
|
|
1,752 |
|
|
Payments |
|
|
(1,387 |
) |
|
|
(535 |
) |
|
Total balance |
|
|
3,537 |
|
|
|
4,169 |
|
|
Current portion, included within accrued expenses and other current liabilities |
|
|
1,611 |
|
|
|
1,602 |
|
|
Long-term portion, included within other long-term liabilities |
|
$ |
1,926 |
|
|
$ |
2,567 |
|
87
CROSSAMERICA PARTNERS LP
NOTES TO CONSOLIDATED FINANCIAL STATEMENTS
At December 31, 2017, we were indemnified by third-party escrow funds, state funds or insurance totaling $3.4 million, which are recorded as indemnification assets and included within other noncurrent assets on the balance sheet. State funds represent probable state reimbursement amounts. Reimbursement will depend upon the continued maintenance and solvency of the state. Insurance coverage represents amounts deemed probable of reimbursement under insurance policies.
The estimates used in these reserves are based on all known facts at the time and an assessment of the ultimate remedial action outcomes. We will adjust loss accruals as further information becomes available or circumstances change. Among the many uncertainties that impact the estimates are the necessary regulatory approvals for, and potential modifications of remediation plans, the amount of data available upon initial assessment of the impact of soil or water contamination, changes in costs associated with environmental remediation services and equipment and the possibility of existing legal claims giving rise to additional claims.
Environmental liabilities related to the sites contributed to the Partnership in connection with our IPO have not been assigned to us, and are still the responsibility of the Predecessor Entity. Under the Amended Omnibus Agreement, the Predecessor Entity must indemnify us for any costs or expenses that it incurs for environmental liabilities and third-party claims, regardless of when a claim is made, that are based on environmental conditions in existence prior to the closing of the IPO for contributed sites. As such, these environmental liabilities and indemnification assets are recorded on the balance sheet of the Predecessor Entity rather than the balance sheet of the Partnership.
Note 15. COMMITMENTS AND CONTINGENCIES
Purchase Commitments
The future minimum volume purchase requirements under the existing supply agreements are approximate gallons, with a purchase price at prevailing market rates for wholesale distributions. We purchased approximately 928.0 million, 869.6 million and 884.6 million gallons of motor fuel under the existing supply agreements for 2017, 2016 and 2015, respectively. The following provides total annual future minimum volume purchase requirements (in thousands of gallons):
|
2018 |
|
|
346,842 |
|
|
2019 |
|
|
314,934 |
|
|
2020 |
|
|
40,729 |
|
|
2021 |
|
|
32,980 |
|
|
2022 |
|
|
32,980 |
|
|
Thereafter |
|
|
50,000 |
|
|
Total |
|
|
818,465 |
|
In the event for a given contract year we fail to purchase the required minimum volume, the underlying third party’s exclusive remedies (depending on the magnitude of the failure) are either termination of the supply agreement and/or a financial penalty per gallon based on the volume shortfall for the given year. We did not incur any significant penalties for the periods presented.
Litigation Matters
We are from time to time party to various lawsuits, claims and other legal proceedings that arise in the ordinary course of business. These actions typically seek, among other things, compensation for alleged personal injury, breach of contract, property damages, environmental damages, employment-related claims and damages, punitive damages, civil penalties or other losses, or injunctive or declaratory relief. With respect to all such lawsuits, claims and proceedings, we record a reserve when it is probable that a liability has been incurred and the amount of loss can be reasonably estimated. In addition, we disclose matters for which management believes a material loss is at least reasonably possible. None of these proceedings, separately or in the aggregate, are expected to have a material adverse effect on our consolidated financial position, results of operations or cash flows. In all instances, management has assessed the matter based on current information and made a judgment concerning its potential outcome, giving due consideration to the nature of the claim, the amount and nature of damages sought and the probability of success. Management’s judgment may prove materially inaccurate, and such judgment is made subject to the known uncertainties of litigation.
88
CROSSAMERICA PARTNERS LP
NOTES TO CONSOLIDATED FINANCIAL STATEMENTS
We were a co-defendant, together with our General Partner, CST and CST Services, in a lawsuit brought by a former executive of CST Services who, until March 2015, provided services to us as Chief Investment Officer and Vice President of Finance (Court of Common Pleas, Lehigh County, Pennsylvania, case number 2015-1003). In connection with CST’s acquisition of our General Partner in 2014, the plaintiff alleged breach of contract and associated claims relating to his termination of employment and claimed severance benefits under the EICP. In October 2017, a jury awarded the plaintiff a total of $1.7 million. Such amount was recorded in general and administrative expenses in 2017. Under the EICP, we were also obligated to pay reasonable legal expenses incurred by the plaintiff in connection with this dispute, which we expensed as incurred. The Partnership incurred total legal fees related to this case of $0.8 million for the year ended December 31, 2017.
Note 16. FAIR VALUE MEASUREMENTS
General
We measure and report certain financial and non-financial assets and liabilities on a fair value basis. Fair value is the price that would be received to sell an asset or paid to transfer a liability in an orderly transaction between market participants at the measurement date (exit price). U.S. GAAP specifies a three-level hierarchy that is used when measuring and disclosing fair value. The fair value hierarchy gives the highest priority to quoted prices available in active markets (i.e., observable inputs) and the lowest priority to data lacking transparency (i.e., unobservable inputs). An instrument’s categorization within the fair value hierarchy is based on the lowest level of significant input to its valuation. The following is a description of the three hierarchy levels.
Level 1—Unadjusted quoted prices in active markets that are accessible at the measurement date for identical, unrestricted assets or liabilities. Active markets are considered to be those in which transactions for the assets or liabilities occur in sufficient frequency and volume to provide pricing information on an ongoing basis.
Level 2—Quoted prices in markets that are not active, or inputs which are observable, either directly or indirectly, for substantially the full term of the asset or liability. This category includes quoted prices for similar assets or liabilities in active markets and quoted prices for identical or similar assets or liabilities in inactive markets.
Level 3—Unobservable inputs are not corroborated by market data. This category is comprised of financial and non-financial assets and liabilities whose fair value is estimated based on internally developed models or methodologies using significant inputs that are generally less readily observable from objective sources.
Transfers into or out of any hierarchy level are recognized at the end of the reporting period in which the transfers occurred. There were no transfers between any levels in 2017 or 2016.
As further discussed in Note 18, we have accrued for unvested phantom units and vested and unvested profits interests as a liability and adjust that liability on a recurring basis based on the market price of our common units each balance sheet date. Such fair value measurements are deemed Level 1 measurements.
Financial Instruments
The fair value of our accounts receivable, notes receivable, and accounts payable approximated their carrying values as of December 31, 2017 and 2016 due to the short-term maturity of these instruments. The fair value of the revolving credit facility approximated its carrying values of $506.0 million as of December 31, 2017 and $441.5 million as of December 31, 2016, due to the frequency with which interest rates are reset and the consistency of the market spread.
Note 17. PARTNERS’ CAPITAL
We issued common units (net of units withheld for income taxes) as a result of the vesting of phantom units and conversion of profits interests previously issued primarily to CST employees who provide services principally to CrossAmerica totaling 35,993 common units in 2017, 107,227 common units in 2016 and 90,671 common units in 2015. See Note 18 for additional information.
In January 2015, we issued 1,497,946 common units to a subsidiary of CST in connection with the acquisition of a 5% interest in CST Fuel Supply. See Note 12 for additional information.
On June 19, 2015, we closed on the sale of 4.6 million common units for net proceeds of approximately $138.5 million. On July 16, 2015, we closed on the sale of an additional 0.2 million common units for net proceeds of approximately $6.4 million in accordance with the underwriters’ option to purchase additional common units associated with the June offering. We used the net proceeds from this offering to reduce indebtedness outstanding under its revolving credit facility.
On July 1, 2015, we issued 3,303,208 of our common units to a subsidiary of CST in connection with the acquisition of an additional 12.5% equity interest in CST Fuel Supply. See Note 12 for additional information.
89
CROSSAMERICA PARTNERS LP
NOTES TO CONSOLIDATED FINANCIAL STATEMENTS
On July 1, 2015, we issued 338,098 of our common units to subsidiaries of CST in connection with the acquisition of real property at 29 NTIs. See Note 12 for additional information.
See Note 12 for information regarding the issuance of common units to CST and Circle K as payment of a portion of the amounts due under the terms of the Amended Omnibus Agreement.
Common Unit Repurchase Program
In November 2015, the Board approved a common unit repurchase program under Rule 10b-18 of the Exchange Act authorizing us to repurchase up to an aggregate of $25.0 million of the common units representing limited partner interests in the Partnership. Under the program, we may make purchases in the open market in accordance with Rule 10b-18 of the Exchange Act, or in privately negotiated transactions, pursuant to a trading plan under Rule 10b5-1 of the Exchange Act or otherwise. Any purchases will be funded from available cash on hand. The common unit repurchase program does not require us to acquire any specific number of our common units and may be suspended or terminated by us at any time without prior notice. The purchases will not be made from any officer, director or control person of the Partnership or CST. The following table shows the purchases made through December 31, 2016. No purchases were made in 2017.
|
Period |
|
Total Number of Units Purchased |
|
|
Average Price Paid per Unit |
|
|
Total Cost of Units Purchased |
|
|
Amount Remaining under the Program |
|
||||
|
2015 |
|
|
154,158 |
|
|
$ |
23.37 |
|
|
$ |
3,603,071 |
|
|
$ |
21,396,929 |
|
|
2016 |
|
|
133,463 |
|
|
|
24.37 |
|
|
|
3,252,653 |
|
|
|
18,144,276 |
|
|
Total |
|
|
287,621 |
|
|
$ |
23.84 |
|
|
$ |
6,855,724 |
|
|
$ |
18,144,276 |
|
CST Purchases of Common Units
On September 21, 2015, CST announced that the independent executive committee of its board of directors approved a common unit purchase program under Rule 10b-18 of the Exchange Act, authorizing CST to purchase up to an aggregate of $50 million of the common units representing limited partner interests in us. The common unit purchase program does not have a fixed expiration date and may be modified, suspended or terminated at any time at CST’s discretion.
CST made no purchases under the unit purchase program in 2016 or 2017. From inception until December 31, 2015, CST had purchased $19.8 million, or 804,667 common units, at an average price of $24.64 per common unit, which units cannot be transferred absent registration with the SEC or an available exemption from the SEC’s registration requirements.
Distributions
Quarterly distribution activity for 2017 was as follows:
|
Quarter Ended |
|
Record Date |
|
Payment Date |
|
Cash Distribution (per unit) |
|
|
Cash Distribution (in thousands) |
|
||
|
December 31, 2016 |
|
February 6, 2017 |
|
February 13, 2017 |
|
$ |
0.6125 |
|
|
$ |
20,541 |
|
|
March 31, 2017 |
|
May 8, 2017 |
|
May 15, 2017 |
|
|
0.6175 |
|
|
|
20,832 |
|
|
June 30, 2017 |
|
August 7, 2017 |
|
August 14, 2017 |
|
|
0.6225 |
|
|
|
21,081 |
|
|
September 30, 2017 |
|
November 6, 2017 |
|
November 13, 2017 |
|
|
0.6275 |
|
|
|
21,332 |
|
|
December 31, 2017 |
|
February 5, 2018 |
|
February 12, 2018 |
|
|
0.6275 |
|
|
|
21,413 |
|
The amount of any distribution is subject to the discretion of the Board, which may modify or revoke our cash distribution policy at any time. Our Partnership Agreement does not require us to pay any distributions. As such, there can be no assurance we will continue to pay distributions in the future.
Conversion of Subordinated Units
On February 25, 2016, the first business day after the payment of the distribution of $0.5925 per unit for the fourth quarter of 2015, the subordination period under the Partnership Agreement ended. At that time, each outstanding subordinated unit converted into one common unit and participates pro rata with the other common units in cash distributions.
90
CROSSAMERICA PARTNERS LP
NOTES TO CONSOLIDATED FINANCIAL STATEMENTS
Note 18. EQUITY-BASED COMPENSATION
Partnership Equity-Based Awards
The maximum number of common units that may be delivered with respect to awards under the Plan is 1,505,000. Generally, the Plan provides for grants of restricted units, unit options, performance awards, phantom units, unit awards, unit appreciation rights, distribution equivalent rights, and other unit-based awards, with various limits and restrictions attached to these awards on a grant-by-grant basis. The Plan is administered by the Board or a committee thereof.
The Board may terminate or amend the Plan at any time with respect to any common units for which a grant has not yet been made. The Board also has the right to alter or amend the Plan or any part of the Plan from time to time, including increasing the number of common units that may be granted, subject to unitholder approval as required by the exchange upon which common units are listed at that time; however, no change in any outstanding grant may be made that would adversely affect the rights of a participant with respect to awards granted to a participant prior to the effective date of such amendment or termination, except that the Board may amend any award to satisfy the requirements of Section 409A of the Internal Revenue Code. The Plan will expire on the tenth anniversary of its approval, when common units are no longer available under the Plan for grants or upon its termination by the Board, whichever occurs first.
In March 2014, we contributed our investments in our operating subsidiaries and certain other assets and liabilities to LGP Operations. Since March 2014, LGP Operations granted profits interests, which are represented by Class B Units in LGP Operations. Upon vesting, Class B Unitholders will be entitled to receive cash distributions proportionate to those received by common unitholders. Class B Units are redeemable two years after they were granted, subject to certain limitations, for cash or common units at the discretion of the Board.
Because the Class B Units are an interest in the equity of LGP Operations, they represent a noncontrolling interest from our perspective. As such, the Class B Units are presented as a noncontrolling interest on the balance sheet and the Class B Unitholders’ interest in the net income of LGP Operations is presented as net income attributable to noncontrolling interests on the statement of income.
It is our intent to settle the phantom units upon vesting by issuing common units and to settle the profits interests upon conversion by the grantee by issuing common units. However, the awards may be settled in cash at the discretion of the Board.
Under the Plan, the Partnership granted 1,233 phantom units in June 2017 to an employee of Circle K who provides services to the Partnership; such phantom units will vest in equal annual installments on the first, second and third anniversaries of the date of grant and this award was accompanied by tandem distribution equivalent rights that entitle the holder to cash payments equal to the amount of unit distributions authorized to be paid to the holders of our common units. There were no grants of equity-based awards in 2016 to employees. There are 2,620 nonvested phantom units outstanding at December 31, 2017.
Since we grant awards to employees of CST who provide services to us under the Amended Omnibus Agreement, and since the grants may be settled in cash, unvested phantom units and vested and unvested profits interests receive fair value variable accounting treatment. As such, they are measured at fair value at each balance sheet reporting date and the cumulative compensation cost recognized is classified as a liability, which is included in accrued expenses and other current liabilities on the consolidated balance sheet. The balance of the accrual at December 31, 2017 and December 31, 2016 totaled $0.7 million and $1.8 million, respectively.
We record equity-based compensation as a component of general and administrative expenses in the statements of income. Compensation expense for the years ended December 31, 2017, 2016 and 2015 was $0.1 million, $1.3 million and $3.0 million, respectively. The weighted average period over which compensation expense related to nonvested awards will be recognized was approximately 1.2 years as of December 31, 2017.
CST Awards
Before the Merger was completed, CST granted equity-based awards of approximately 47,000, 102,000 and 163,000 in the form of time vested restricted stock units of CST, stock options of CST and market share units of CST in 2017, 2016 and 2015, respectively, which were granted to certain employees of CST for services rendered on our behalf. Certain expenses associated with these awards that were charged to us under the Amended Omnibus Agreement amounted to $1.7 million, $2.3 million and $2.2 million for 2017, 2016 and 2015, respectively.
91
CROSSAMERICA PARTNERS LP
NOTES TO CONSOLIDATED FINANCIAL STATEMENTS
At the completion of the Merger, each CST stock option, restricted stock unit and market share unit that was outstanding immediately prior to the completion of the Merger, excluding the CST restricted stock units granted in February 2017, whether vested or unvested, became fully vested and converted into the right to receive a cash payment as defined in the Merger Agreement. The Partnership was allocated a $0.4 million charge upon the accelerated vesting of these awards, included in the expense amounts for the year ended December 31, 2017 set forth above.
At the completion of the Merger, each award of CST restricted stock units that was granted in February 2017 converted into the right to receive a cash payment as defined in the Merger Agreement, but such award will remain subject to the same vesting terms and payment schedule as those set forth in the original restricted stock unit award agreement; provided that such award will vest in full upon an involuntary termination of employment without cause, or termination for “Good Reason,” or termination due to death, “Disability” or “Retirement.” Unrecognized compensation expense associated with CST restricted stock units granted in February 2017 amounted to $0.7 million as of December 31, 2017, which will be recognized over the vesting term through January 2020.
Awards to Members of the Board
In November 2016, the Partnership granted 5,364 phantom units to non-employee directors of the Board as a portion of director compensation. Such awards vested upon the Merger.
In August 2017, the Partnership granted 10,539 phantom units to non-employee directors of the Board as a portion of director compensation. Such awards vest over one year and this award was accompanied by tandem distribution equivalent rights that entitle the holder to cash payments equal to the amount of unit distributions authorized to be paid to the holders of our common units.
The liability for these awards at December 31, 2017 and December 31, 2016 was not significant. The associated compensation expense was $0.2 million and $0.3 million for 2017 and 2016, respectively. The expense for 2015 was not significant.
Note 19. INCOME TAXES
As a limited partnership, we are not subject to federal and state income taxes, however our corporate subsidiaries are subject to income taxes. Income tax attributable to our taxable income, which may differ significantly from income for financial statement purposes, is assessed at the individual limited partner unit holder level. We are subject to a statutory requirement that non-qualifying income, as defined by the Internal Revenue Code, cannot exceed 10% of total gross income for the calendar year. If non-qualifying income exceeds this statutory limit, we would be taxed as a corporation. The non-qualifying income did not exceed the statutory limit in any period presented. The reported balance of our net liabilities was greater than the related tax basis of net liabilities by $3.4 million at December 31, 2017 and $9.1 million at December 31, 2016.
Certain activities that generate non-qualifying income are conducted through LGWS. LGWS is a tax paying corporate subsidiary of ours that is subject to federal and state income taxes. Current and deferred income taxes are recognized on the earnings of LGWS. Deferred income tax assets and liabilities are recognized for the future tax consequences attributable to temporary differences between the financial statement carrying amounts of existing assets and liabilities and their respective tax bases and are measured using enacted tax rates.
The Tax Cuts and Jobs Act made changes that affect us including (1) reducing the federal corporate income tax rate to 21 percent beginning January 1, 2018, and (2) providing for the immediate expensing for tax purposes for certain qualified depreciable assets placed in service after September 27, 2017. As a result of the rate change, we recognized a net tax benefit of $13.2 million due to the reduction of our net deferred tax liability.
The Tax cuts and Jobs Act also includes certain limitations on deductions effective for the tax year 2018 and forward, related to deductions for interest expense, employee compensation, and meals and entertainment. These limitations are being evaluated and may impact us. We anticipate that U.S. regulatory agencies and state governments will issue further guidance regarding the changes in deductibility which we will incorporate in our future estimates.
92
CROSSAMERICA PARTNERS LP
NOTES TO CONSOLIDATED FINANCIAL STATEMENTS
Components of income tax expense related to net income were as follows (in thousands):
|
|
|
For the Year Ended December 31, |
|
|||||||||
|
|
|
2017 |
|
|
2016 |
|
|
2015 |
|
|||
|
Current |
|
|
|
|
|
|
|
|
|
|
|
|
|
U.S. federal |
|
$ |
210 |
|
|
$ |
309 |
|
|
$ |
1,630 |
|
|
U.S. state |
|
|
406 |
|
|
|
(75 |
) |
|
|
944 |
|
|
Total current |
|
|
616 |
|
|
|
234 |
|
|
|
2,574 |
|
|
|
|
|
|
|
|
|
|
|
|
|
|
|
|
Deferred |
|
|
|
|
|
|
|
|
|
|
|
|
|
U.S. federal |
|
|
(16,064 |
) |
|
|
(1,369 |
) |
|
|
(4,279 |
) |
|
U.S. state |
|
|
(2,789 |
) |
|
|
682 |
|
|
|
(1,837 |
) |
|
Total deferred |
|
|
(18,853 |
) |
|
|
(687 |
) |
|
|
(6,116 |
) |
|
Income tax benefit |
|
$ |
(18,237 |
) |
|
$ |
(453 |
) |
|
$ |
(3,542 |
) |
The difference between the actual income tax provision and income taxes computed by applying the U.S. federal statutory rate to earnings (losses) before income taxes is attributable to the following (in thousands):
|
|
|
For the Year Ended December 31, |
|
|||||||||
|
|
|
2017 |
|
|
2016 |
|
|
2015 |
|
|||
|
Consolidated income from continuing operations before income taxes - all domestic |
|
$ |
4,939 |
|
|
$ |
10,262 |
|
|
$ |
7,920 |
|
|
Income from continuing operations before income taxes of non-taxable entities |
|
|
(7,769 |
) |
|
|
(13,408 |
) |
|
|
(18,409 |
) |
|
Loss from continuing operations before income taxes of corporate entities |
|
|
(2,830 |
) |
|
|
(3,146 |
) |
|
|
(10,489 |
) |
|
Federal income tax benefit at statutory rate |
|
|
(962 |
) |
|
|
(1,070 |
) |
|
|
(3,566 |
) |
|
Increase (decrease) due to: |
|
|
|
|
|
|
|
|
|
|
|
|
|
Nondeductible expenses |
|
|
384 |
|
|
|
(37 |
) |
|
|
198 |
|
|
Tax on gains not recognized for book income |
|
|
112 |
|
|
|
1,104 |
|
|
|
— |
|
|
Change in valuation allowance |
|
|
(3,713 |
) |
|
|
67 |
|
|
|
(247 |
) |
|
State income taxes, net of federal income tax benefit |
|
|
(878 |
) |
|
|
40 |
|
|
|
(343 |
) |
|
Non-taxable refund |
|
|
— |
|
|
|
(589 |
) |
|
|
— |
|
|
Rate change |
|
|
(13,180 |
) |
|
|
— |
|
|
|
— |
|
|
Other |
|
|
— |
|
|
|
32 |
|
|
|
416 |
|
|
Total income tax benefit |
|
$ |
(18,237 |
) |
|
$ |
(453 |
) |
|
$ |
(3,542 |
) |
93
CROSSAMERICA PARTNERS LP
NOTES TO CONSOLIDATED FINANCIAL STATEMENTS
The tax effects of significant temporary differences representing deferred income tax assets and liabilities were as follows (in thousands):
|
|
|
December 31, |
|
|||||
|
|
|
2017 |
|
|
2016 |
|
||
|
Deferred income tax assets: |
|
|
|
|
|
|
|
|
|
Deferred rent expense |
|
$ |
1,298 |
|
|
$ |
1,244 |
|
|
Above market lease liability |
|
|
275 |
|
|
|
895 |
|
|
Capital lease and sale leaseback financing obligations |
|
|
14,677 |
|
|
|
22,557 |
|
|
Asset retirement obligations |
|
|
7,250 |
|
|
|
9,445 |
|
|
Other assets |
|
|
794 |
|
|
|
1,625 |
|
|
Total deferred income tax assets |
|
|
24,294 |
|
|
|
35,766 |
|
|
Less: Valuation allowance |
|
|
— |
|
|
|
(5,495 |
) |
|
Net deferred income tax assets |
|
|
24,294 |
|
|
|
30,271 |
|
|
|
|
|
|
|
|
|
|
|
|
Deferred income tax liabilities: |
|
|
|
|
|
|
|
|
|
Deferred rent income |
|
|
1,307 |
|
|
|
982 |
|
|
Property and equipment |
|
|
45,549 |
|
|
|
67,523 |
|
|
Intangibles |
|
|
679 |
|
|
|
3,832 |
|
|
Other assets |
|
|
828 |
|
|
|
857 |
|
|
Total deferred income tax liabilities |
|
|
48,363 |
|
|
|
73,194 |
|
|
Net deferred income tax liabilities |
|
$ |
24,069 |
|
|
$ |
42,923 |
|
A valuation allowance is required when it is more likely than not that all or a portion of a deferred tax asset will not be realized. All available evidence, both positive and negative, must be considered in determining the need for a valuation allowance. The valuation allowance at December 31, 2016 related primarily to the uncertainty of the availability of future profits to realize the tax benefit of the existing deductible temporary differences. Positive evidence considered in our 2017 assessment included: 1) reversals of taxable temporary differences in future tax years; 2) an observable history of reporting taxable income; 3) projections of future taxable income; 4) feasible and prudent tax planning strategies; and 5) the impact of recently enacted tax reform. Under the Tax Cuts and Jobs Act, among other provisions, any net operating losses generated after 2017 can be carried forward indefinitely. This change, in part, allows for the consideration as a future source of taxable income, reversals of deferred tax liabilities related to indefinite lived liabilities. This income is sufficient to offset the indefinite lived asset generated by the reversals and provides additional positive evidence of future income allowing for the release of the valuation allowance. The release resulted in a tax benefit of $3.7 million.
Changes in the valuation allowance account consisted of the following (in thousands):
|
|
|
For the Year Ended December 31, |
|
|||||||||
|
|
|
2017 |
|
|
2016 |
|
|
2015 |
|
|||
|
Balance at beginning of period |
|
$ |
5,495 |
|
|
$ |
5,428 |
|
|
$ |
5,675 |
|
|
Charged to costs and expenses (a) |
|
|
(5,495 |
) |
|
|
67 |
|
|
|
(247 |
) |
|
Balance at end of period |
|
$ |
— |
|
|
$ |
5,495 |
|
|
$ |
5,428 |
|
|
(a) |
Of the 2017 amount charged to costs and expenses, $1.8 million primarily relates to the reduction in the tax rate used to compute the valuation allowance as a result of the Tax Cuts and Jobs Act. |
We provide tax reserves for federal, state and local and uncertain tax positions. The development of these tax positions requires subjective, critical estimates and judgments about tax matters, potential outcomes and timing. Although the outcome of potential tax examinations is uncertain, in management’s opinion, adequate provisions for income taxes have been made for potential liabilities resulting from these reviews. If actual outcomes differ materially from these estimates, they could have a material impact on our financial condition and results of operations. Differences between actual results and assumptions, or changes in assumptions in future periods, are recorded in the period they become known. To the extent additional information becomes available prior to resolution, such accruals are adjusted to reflect probable outcomes.
As of December 31, 2017 and 2016, we did not have unrecognized tax benefits. Our practice is to recognize interest and penalties related to income tax matters in income tax expense. We had no material interest and penalties for the years ended December 31, 2017, 2016 and 2015.
94
CROSSAMERICA PARTNERS LP
NOTES TO CONSOLIDATED FINANCIAL STATEMENTS
We file income tax returns with the U.S. federal government as well as the many state jurisdictions in which we operate. The statute remains open for tax years 2014 through 2017; therefore, these years remain subject to examination by federal, state and local jurisdiction authorities.
Note 20. NET INCOME PER LIMITED PARTNER UNIT
Under the Partnership Agreement, a subsidiary of Circle K, as the holder of our IDRs, has an interest in distributions from us that are increasing percentages starting at 15% of quarterly distributions out of the operating surplus (as defined in our Partnership Agreement) in excess of $0.5031 per limited partner unit.
In addition to the common units, we have identified the IDRs as participating securities and compute income per unit using the two-class method under which any excess of distributions declared over net income shall be allocated to the partners based on their respective sharing of income as specified in the Partnership Agreement. Net income per unit applicable to limited partners is computed by dividing the limited partners’ interest in net income, after deducting the IDRs, by the weighted-average number of outstanding common units.
As discussed in Note 17, on February 25, 2016, the subordinated units converted into common units and participates pro-rata with the other common units in cash distributions.
The following tables provide a reconciliation of net income and weighted-average units used in computing basic and diluted net income per limited partner unit for the following periods (in thousands, except unit and per unit amounts):
|
|
|
Years Ended December 31, |
|
|||||||||||||||||||||
|
|
|
2017 |
|
|
2016 |
|
|
2015 |
|
|||||||||||||||
|
|
|
Common Units |
|
|
Subordinated Units |
|
|
Common Units |
|
|
Subordinated Units |
|
|
Common Units |
|
|
Subordinated Units |
|
||||||
|
Numerator: |
|
|
|
|
|
|
|
|
|
|
|
|
|
|
|
|
|
|
|
|
|
|
|
|
|
Distributions paid(a) |
|
$ |
83,786 |
|
|
$ |
— |
|
|
$ |
75,598 |
|
|
$ |
4,459 |
|
|
$ |
47,798 |
|
|
$ |
16,781 |
|
|
Allocation of distributions in excess of net income(b) |
|
|
(64,965 |
) |
|
|
— |
|
|
|
(68,539 |
) |
|
|
(4,206 |
) |
|
|
(40,356 |
) |
|
|
(14,172 |
) |
|
Limited partners’ interest in net income - basic |
|
|
18,821 |
|
|
|
— |
|
|
|
7,059 |
|
|
|
253 |
|
|
|
7,442 |
|
|
|
2,609 |
|
|
Adjustment for phantom units |
|
|
— |
|
|
|
— |
|
|
|
— |
|
|
|
— |
|
|
|
9 |
|
|
|
— |
|
|
Limited partners’ interest in net income - diluted |
|
$ |
18,821 |
|
|
$ |
— |
|
|
$ |
7,059 |
|
|
$ |
253 |
|
|
$ |
7,451 |
|
|
$ |
2,609 |
|
|
Denominator: |
|
|
|
|
|
|
|
|
|
|
|
|
|
|
|
|
|
|
|
|
|
|
|
|
|
Weighted average limited partnership units outstanding - basic |
|
|
33,844,823 |
|
|
|
— |
|
|
|
32,159,156 |
|
|
|
1,151,366 |
|
|
|
21,462,665 |
|
|
|
7,525,000 |
|
|
Adjustment for phantom units |
|
|
10,522 |
|
|
|
— |
|
|
|
56,848 |
|
|
|
— |
|
|
|
98,738 |
|
|
|
- |
|
|
Weighted average limited partnership units outstanding - diluted |
|
|
33,855,345 |
|
|
|
— |
|
|
|
32,216,004 |
|
|
|
1,151,366 |
|
|
|
21,561,403 |
|
|
|
7,525,000 |
|
|
Net income per limited partnership unit - basic |
|
$ |
0.56 |
|
|
$ |
— |
|
|
$ |
0.22 |
|
|
$ |
0.22 |
|
|
$ |
0.35 |
|
|
$ |
0.35 |
|
|
Net income per limited partnership unit - diluted |
|
$ |
0.56 |
|
|
$ |
— |
|
|
$ |
0.22 |
|
|
$ |
0.22 |
|
|
$ |
0.35 |
|
|
$ |
0.35 |
|
|
(a) |
Distributions paid per unit were $2.48, $2.40 and $2.23 during 2017, 2016 and 2015, respectively. |
|
(b) |
Allocation of distributions in excess of net income is based on a pro rata proportion to the common and subordinated units as outlined in the Partnership Agreement. |
95
CROSSAMERICA PARTNERS LP
NOTES TO CONSOLIDATED FINANCIAL STATEMENTS
We conduct our business in two segments: 1) the Wholesale segment and 2) the Retail segment. The wholesale segment includes the wholesale distribution of motor fuel to lessee dealers, independent dealers, commission agents, DMS, Circle K and company operated retail sites. We have exclusive motor fuel distribution contracts with lessee dealers who lease the property from us. We also have exclusive distribution contracts with independent dealers to distribute motor fuel but do not collect rent from the independent dealers. Similar to lessee dealers, we have motor fuel distribution agreements with DMS and Circle K and collect rent from both. The Retail segment includes the sale of convenience merchandise items, the retail sale of motor fuel at company operated retail sites and the retail sale of motor fuel at retail sites operated by commission agents. A commission agent is a retail site where we retain title to the motor fuel inventory and sell it directly to our end user customers. At commission agent retail sites, we manage motor fuel inventory pricing and retain the gross profit on motor fuel sales, less a commission to the agent who operates the retail site. Similar to our Wholesale segment, we also generate revenues through leasing or subleasing real estate in our Retail segment.
As part of our evaluation of the economic performance of our retail sites, we will from time to time convert company owned retail sites from our Retail segment to lessee dealers in our Wholesale segment. As a result, we no longer generate revenues from the retail sale of motor fuel or merchandise at these stores subsequent to the date of conversion and we no longer incur retail operating expenses related to these retail sites. However, we continue to supply these retail sites with motor fuel on a wholesale basis pursuant to the fuel supply contract with the lessee dealer. Further, we continue to own/lease the property and earn rental income under lease/sublease agreements with the lessee dealers under triple net leases. The lessee dealer owns all motor fuel and convenience merchandise and retains all gross profit on such operating activities.
Unallocated items consist primarily of general and administrative expenses, depreciation, amortization and accretion expense, gains on sales of assets, net, and the elimination of the Retail segment’s intersegment cost of revenues from motor fuel sales against the Wholesale segment’s intersegment revenues from motor fuel sales. The profit in ending inventory generated by the intersegment motor fuel sales is also eliminated. Total assets by segment are not presented as management does not currently assess performance or allocate resources based on that data.
96
CROSSAMERICA PARTNERS LP
NOTES TO CONSOLIDATED FINANCIAL STATEMENTS
The following table reflects activity related to our reportable segments (in thousands):
|
|
|
Wholesale |
|
|
Retail |
|
|
Unallocated |
|
|
Consolidated |
|
||||
|
Year Ended December 31, 2017 |
|
|
|
|
|
|
|
|
|
|
|
|
|
|
|
|
|
Revenues from fuel sales to external customers |
|
$ |
1,521,408 |
|
|
$ |
380,387 |
|
|
$ |
— |
|
|
$ |
1,901,795 |
|
|
Intersegment revenues from fuel sales |
|
|
281,561 |
|
|
|
— |
|
|
|
(281,561 |
) |
|
|
— |
|
|
Revenues from food and merchandise sales |
|
|
— |
|
|
|
104,362 |
|
|
|
— |
|
|
|
104,362 |
|
|
Rent income |
|
|
79,344 |
|
|
|
6,970 |
|
|
|
— |
|
|
|
86,314 |
|
|
Other revenue |
|
|
2,356 |
|
|
|
— |
|
|
|
— |
|
|
|
2,356 |
|
|
Total revenues |
|
$ |
1,884,669 |
|
|
$ |
491,719 |
|
|
$ |
(281,561 |
) |
|
$ |
2,094,827 |
|
|
Income from CST Fuel Supply equity interests |
|
$ |
14,906 |
|
|
$ |
— |
|
|
$ |
— |
|
|
$ |
14,906 |
|
|
Operating income (loss) |
|
$ |
108,624 |
|
|
$ |
5,737 |
|
|
$ |
(81,942 |
) |
|
$ |
32,419 |
|
|
Year Ended December 31, 2016 |
|
|
|
|
|
|
|
|
|
|
|
|
|
|
|
|
|
Revenues from fuel sales to external customers |
|
$ |
1,325,563 |
|
|
$ |
339,758 |
|
|
$ |
— |
|
|
$ |
1,665,321 |
|
|
Intersegment revenues from fuel sales |
|
|
242,399 |
|
|
|
— |
|
|
|
(242,399 |
) |
|
|
— |
|
|
Revenues from food and merchandise sales |
|
|
— |
|
|
|
122,084 |
|
|
|
— |
|
|
|
122,084 |
|
|
Rent income |
|
|
74,955 |
|
|
|
5,639 |
|
|
|
— |
|
|
|
80,594 |
|
|
Other revenue |
|
|
1,807 |
|
|
|
— |
|
|
|
— |
|
|
|
1,807 |
|
|
Total revenues |
|
$ |
1,644,724 |
|
|
$ |
467,481 |
|
|
$ |
(242,399 |
) |
|
$ |
1,869,806 |
|
|
Income from CST Fuel Supply equity interests |
|
$ |
16,048 |
|
|
$ |
— |
|
|
$ |
— |
|
|
$ |
16,048 |
|
|
Operating income (loss) |
|
$ |
102,876 |
|
|
$ |
7,561 |
|
|
$ |
(78,266 |
) |
|
$ |
32,171 |
|
|
Year Ended December 31, 2015 |
|
|
|
|
|
|
|
|
|
|
|
|
|
|
|
|
|
Revenues from fuel sales to external customers |
|
$ |
1,492,425 |
|
|
$ |
508,335 |
|
|
$ |
— |
|
|
$ |
2,000,760 |
|
|
Intersegment revenues from fuel sales |
|
|
359,294 |
|
|
|
— |
|
|
|
(359,294 |
) |
|
|
— |
|
|
Revenues from food and merchandise sales |
|
|
— |
|
|
|
158,716 |
|
|
|
— |
|
|
|
158,716 |
|
|
Rent income |
|
|
59,956 |
|
|
|
5,475 |
|
|
|
— |
|
|
|
65,431 |
|
|
Other revenue |
|
|
1,254 |
|
|
|
110 |
|
|
|
— |
|
|
|
1,364 |
|
|
Total revenues |
|
$ |
1,912,929 |
|
|
$ |
672,636 |
|
|
$ |
(359,294 |
) |
|
$ |
2,226,271 |
|
|
Income from CST Fuel Supply equity interests |
|
$ |
10,528 |
|
|
$ |
— |
|
|
$ |
— |
|
|
$ |
10,528 |
|
|
Operating income (loss) |
|
$ |
88,800 |
|
|
$ |
19,010 |
|
|
$ |
(81,793 |
) |
|
$ |
26,017 |
|
Note 22. SUPPLEMENTAL CASH FLOW INFORMATION
In order to determine net cash provided by operating activities, net income is adjusted by, among other things, changes in current assets and current liabilities as follows (in thousands):
|
|
|
For the Year Ended December 31, |
|
|||||||||
|
|
|
2017 |
|
|
2016 |
|
|
2015 |
|
|||
|
Decrease (increase): |
|
|
|
|
|
|
|
|
|
|
|
|
|
Accounts receivable |
|
$ |
1,263 |
|
|
$ |
(6,052 |
) |
|
$ |
5,381 |
|
|
Accounts receivable from related parties |
|
|
(666 |
) |
|
|
(2,104 |
) |
|
|
(2,428 |
) |
|
Inventories |
|
|
863 |
|
|
|
4,960 |
|
|
|
9,857 |
|
|
Other current assets |
|
|
(1,718 |
) |
|
|
2,345 |
|
|
|
3,092 |
|
|
Other assets |
|
|
(3,248 |
) |
|
|
(7,643 |
) |
|
|
(1,356 |
) |
|
Increase (decrease): |
|
|
|
|
|
|
|
|
|
|
|
|
|
Accounts payable |
|
|
886 |
|
|
|
2,132 |
|
|
|
(12,339 |
) |
|
Accounts payable to related parties |
|
|
14,778 |
|
|
|
(1,851 |
) |
|
|
6,867 |
|
|
Motor fuel taxes payable |
|
|
(226 |
) |
|
|
2,649 |
|
|
|
(1,652 |
) |
|
Accrued expenses and other current liabilities |
|
|
1,708 |
|
|
|
(1,239 |
) |
|
|
(11,772 |
) |
|
Other long-term liabilities |
|
|
(83 |
) |
|
|
3,837 |
|
|
|
1,582 |
|
|
Changes in working capital, net of acquisitions |
|
$ |
13,557 |
|
|
$ |
(2,966 |
) |
|
$ |
(2,768 |
) |
The above changes in current assets and current liabilities may differ from changes between amounts reflected in the applicable balance sheets for the respective periods due to acquisitions.
97
CROSSAMERICA PARTNERS LP
NOTES TO CONSOLIDATED FINANCIAL STATEMENTS
Supplemental disclosure of cash flow information (in thousands):
|
|
|
For the Year Ended December 31, |
|
|||||||||
|
|
|
2017 |
|
|
2016 |
|
|
2015 |
|
|||
|
Cash paid for interest |
|
$ |
25,984 |
|
|
$ |
21,127 |
|
|
$ |
16,689 |
|
|
Cash paid for income taxes, net of refunds received |
|
|
1,756 |
|
|
|
808 |
|
|
|
5,023 |
|
Supplemental schedule of non-cash investing and financing activities (in thousands):
|
|
|
For the Year Ended December 31, |
|
|||||||||
|
|
|
2017 |
|
|
2016 |
|
|
2015 |
|
|||
|
Sale of property and equipment in Section 1031 like-kind exchange transactions |
|
$ |
(1,650 |
) |
|
$ |
(2,232 |
) |
|
$ |
(322 |
) |
|
Acquisition of equity investment in CST Fuel Supply funded by issuance of common units |
|
|
— |
|
|
|
— |
|
|
|
384 |
|
|
Acquisition of property through foreclosure on note receivable |
|
|
— |
|
|
|
— |
|
|
|
930 |
|
|
Removal of property and equipment and capital lease obligation for retail sites terminated from Getty lease |
|
|
— |
|
|
|
810 |
|
|
|
1,333 |
|
|
Changes in estimate of asset retirement obligations |
|
|
(1,078 |
) |
|
|
(291 |
) |
|
|
(591 |
) |
|
Issuance of capital lease obligations and recognition of asset retirement obligation related to Getty lease |
|
|
740 |
|
|
|
1,223 |
|
|
|
— |
|
|
Amended Omnibus Agreement fees settled in our common units |
|
|
14,033 |
|
|
|
11,245 |
|
|
|
7,200 |
|
|
Units issued to CST as consideration for the NTIs and the equity interest in CST Fuel Supply |
|
|
— |
|
|
|
— |
|
|
|
163,292 |
|
Note 23. QUARTERLY FINANCIAL DATA (UNAUDITED)
The following table summarizes quarterly financial data for the years ended December 31, 2017 and 2016 (in thousands):
|
|
|
2017 Quarter Ended |
|
|||||||||||||
|
|
|
March 31 |
|
|
June 30 |
|
|
September 30 |
|
|
December 31 |
|
||||
|
Operating revenues |
|
$ |
469,286 |
|
|
$ |
528,789 |
|
|
$ |
544,092 |
|
|
$ |
552,660 |
|
|
Gross profit |
|
|
37,446 |
|
|
|
41,622 |
|
|
|
41,575 |
|
|
|
40,123 |
|
|
Operating income |
|
|
5,580 |
|
|
|
2,718 |
|
|
|
12,284 |
|
|
|
11,837 |
|
|
Net income (loss) attributable to limited partners |
|
|
1,696 |
|
|
|
(3,993 |
) |
|
|
4,333 |
|
|
|
21,122 |
|
|
Basic earnings (loss) per common unit(a) |
|
|
0.02 |
|
|
|
(0.15 |
) |
|
|
0.10 |
|
|
|
0.59 |
|
|
Diluted earnings (loss) per common unit(a) |
|
|
0.02 |
|
|
|
(0.15 |
) |
|
|
0.10 |
|
|
|
0.59 |
|
|
|
|
|
|
|
|
|
|
|
|
|
|
|
|
|
|
|
|
|
|
2016 Quarter Ended |
|
|||||||||||||
|
|
|
March 31 |
|
|
June 30 |
|
|
September 30 |
|
|
December 31 |
|
||||
|
Operating revenues |
|
$ |
367,740 |
|
|
$ |
512,644 |
|
|
$ |
487,950 |
|
|
$ |
501,472 |
|
|
Gross profit |
|
|
37,190 |
|
|
|
40,515 |
|
|
|
39,138 |
|
|
|
38,724 |
|
|
Operating income |
|
|
5,921 |
|
|
|
9,356 |
|
|
|
9,993 |
|
|
|
6,901 |
|
|
Net income attributable to limited partners |
|
|
1,767 |
|
|
|
3,626 |
|
|
|
2,989 |
|
|
|
2,322 |
|
|
Basic earnings per common unit(a) |
|
|
0.03 |
|
|
|
0.08 |
|
|
|
0.06 |
|
|
|
0.04 |
|
|
Diluted earnings per common unit(a) |
|
|
0.03 |
|
|
|
0.08 |
|
|
|
0.06 |
|
|
|
0.04 |
|
|
(a) |
Earnings (loss) per common unit amounts are computed independently for each of the quarters presented. Therefore, the sum of the quarterly earnings per share amounts may not equal the annual earnings per share amounts. |
98
CROSSAMERICA PARTNERS LP
NOTES TO CONSOLIDATED FINANCIAL STATEMENTS
During the second quarter of 2017, the Partnership recognized a $5.4 million charge for severance and benefit costs associated with certain officers and other employees of CST Services who provided services to the Partnership and who terminated employment upon the consummation of the Merger, which constituted a change in control, as defined in the EICP and CST’s severance plans. Such costs are included in general and administrative expenses and were paid by Circle K in 2017. Accounts payable to related parties includes these costs as we will reimburse Circle K.
In addition, certain participants in the EICP received retention bonuses that will be paid in annual installments that began in July 2017 and will continue through July 2019. The Partnership recorded a $1.0 million charge during 2017 in connection with the payments made by Circle K in July 2017, which were included in general and administrative expenses. In addition, the Partnership recognized a $0.7 million charge in 2017 for the payments expected to be made in July 2018 and July 2019. The Partnership anticipates recognizing future charges totaling $0.9 million over the remaining retention period, of which $0.8 million is anticipated to be recognized in 2018.
See Note 15 for information regarding a $1.7 million charge recorded in 2017 for EICP severance payments to a former executive.
The following table presents a rollforward of accrued separation benefits:
|
|
|
December 31, |
|
|||||
|
|
|
2017 |
|
|
2016 |
|
||
|
Beginning balance |
|
$ |
255 |
|
|
$ |
1,665 |
|
|
Provision for separation benefits |
|
|
8,916 |
|
|
|
435 |
|
|
Separation benefits paid |
|
|
(602 |
) |
|
|
(1,845 |
) |
|
Ending balance |
|
$ |
8,569 |
|
|
$ |
255 |
|
99
100
ITEM 9. CHANGES IN AND DISAGREEMENTS WITH ACCOUNTANTS ON ACCOUNTING AND FINANCIAL DISCLOSURE
None.
ITEM 9A. CONTROLS AND PROCEDURES
(a) Evaluation of Disclosure Controls and Procedures
Our management has evaluated, with the participation of our principal executive officer and principal financial officer, the effectiveness of our disclosure controls and procedures (as defined in Rules 13a-15(f) under the Securities Exchange Act of 1934) as of the end of the period covered by this report, and has concluded that our disclosure controls and procedures were effective as of December 31, 2017.
Internal Control over Financial Reporting
|
|
(a) |
Management's Report on Internal Control over Financial Reporting |
The management report on our internal control over financial reporting appears in Item 8 and is incorporated herein by reference.
|
|
(b) |
Attestation Report of the Independent Registered Public Accounting Firm |
Grant Thornton LLP’s report on our internal control over financial reporting appears in Item 8 and is incorporated herein by reference.
|
|
(c) |
Changes in Internal Control over Financial Reporting |
There were no changes in our internal control over financial reporting (as that term is defined in Rules 13a-15(f) and 15d-15(f) under the Exchange Act) that occurred during the quarter ended December 31, 2017, that have materially affected, or are reasonably likely to materially affect, our internal control over financial reporting.
None.
101
ITEM 10. DIRECTORS, EXECUTIVE OFFICERS AND CORPORATE GOVERNANCE
Management of CrossAmerica Partners LP
Our General Partner manages our operations and activities on our behalf. The sole member of our General Partner is owned by Couche-Tard, which gives it sole and exclusive authority over our General Partner. Couche-Tard indirectly owns all of the membership interests in our General Partner. All of our executive officers are employed by an affiliate of Couche-Tard.
Our General Partner has a Board that oversees our management, operations and activities. Our unitholders are not entitled to elect the directors of the Board or participate in our management or operations. Couche-Tard, as the indirect owner of our General Partner, has the right to appoint all members of the Board. Our General Partner owes a fiduciary duty to our unitholders. However, our Partnership Agreement contains provisions that limit the fiduciary duties that our General Partner owes to our unitholders. Our General Partner is liable, as general partner, for all of our debts (to the extent not paid from our assets), except for indebtedness or other obligations that are made specifically nonrecourse to it. Whenever possible, our General Partner intends to incur indebtedness or other obligations that are nonrecourse. Except as described in our Partnership Agreement and subject to its fiduciary duty to act in good faith, our General Partner has exclusive management power over our business and affairs.
Our General Partner does not have any employees. All of the personnel who conduct our business are employed by Couche-Tard, and their services are provided to us pursuant to the Amended Omnibus Agreement, with the exception of the employees who provide services to our Retail segment, all of whom are employed by a subsidiary of the Partnership.
Directors and Executive Officers
The Partnership does not directly employ any of the persons responsible for managing or operating the Partnership. We are managed and operated by the Board and the executive officers appointed by our General Partner who are employees of an affiliate of Couche-Tard. The following table shows information for the directors of our General Partner and our executive officers appointed by our General Partner.
Directors and Executive Officers of the General Partner
|
Current Directors and Executive Officers (1) |
|
Age (2) |
|
|
Position with our General Partner |
|
|
Timothy A. Miller |
|
|
45 |
|
|
Chairman of the Board |
|
Jeremy L. Bergeron |
|
|
45 |
|
|
Director, President and Chief Executive Officer |
|
Jean Bernier |
|
|
61 |
|
|
Director |
|
Justin A. Gannon |
|
|
68 |
|
|
Director |
|
Mickey Kim |
|
|
59 |
|
|
Director |
|
John B. Reilly, III |
|
|
56 |
|
|
Director |
|
Joseph V. Topper, Jr. |
|
|
62 |
|
|
Director |
|
Claude Tessier |
|
|
54 |
|
|
Director |
|
Evan W. Smith |
|
|
47 |
|
|
Vice President of Finance and Chief Financial Officer |
|
George W. Wilkins |
|
|
44 |
|
|
Vice President of Operations (Appointed January 24, 2018) |
|
(1) |
Matthew McCure served as Vice President, Operations until his resignation on January 24, 2018 |
|
(2) |
as of December 31, 2017 |
Our General Partner’s directors hold office until the earlier of their death, resignation, removal or disqualification or until their successors have been elected and qualified. Our executive officers serve at the discretion of the Board. In selecting and appointing directors to the Board, Couche-Tard, as the owner of the sole member of our General Partner, does not apply a formal diversity policy or set of guidelines. However, when appointing new directors, Couche-Tard as the owner of the sole member of our General Partner, will consider each individual director’s qualifications, skills, business experience and capacity to serve as a director, as described below for each director, and the diversity of these attributes for the Board as a whole.
Timothy A. Miller was appointed Chairman of the Board on June 2017. He joined Couche-Tard in January 2012, and he is currently serving as Senior Vice President, Operations and Global Fuels. From February 2016 to November 2017, he held the position of Senior Vice President, Global Fuels. From October 2012 to January 2016, he held the position of Vice President, Fuel. Mr. Miller joined Couche-Tard as Director of Fuels, Real Estate and Facilities. Prior to joining Couche-Tard, he was with BP Plc. for 16 years in a variety of operational, supply, business development and strategy roles in the United States and Europe. He holds a bachelor’s degree in Business Administration from Southern Illinois University.
102
Jeremy L. Bergeron has been the President and Chief Executive Officer of our General Partner since June 2017 and has served as a director of the Board since October 2015. He was appointed President of our General Partner in March 2015. Prior to that, Mr. Bergeron served as the Senior Vice President of Integration & Development Operations for CST Brands, Inc. and he served as Vice President and Treasurer for CST Brands, Inc. since its spin-off from Valero Energy Corporation (NYSE: VLO) in 2013. Mr. Bergeron was with Valero Energy Corporation for 17 years and held several management positions with increasing levels of responsibility. He earned a bachelor’s degree in Business Administration in Management and Information Systems from the University of the Incarnate Word and a Master’s degree in Business Administration from the University of Texas at San Antonio. He is also a 2014 graduate of the Stanford Executive Program.
Jean Bernier was appointed as a director of the Board in June 2017. As of December 31, 2017, Mr. Bernier stepped down as Group President, Global Fuels and North-East Operations of Couche-Tard, a position he held since March 2016, and assumed the role as advisor to the Couche-Tard Chief Executive Officer as of that date. He previously held the position of Group President Fuel Americas and Operations North East since July 2012. Mr. Bernier has over 25 years of experience in the convenience store, fuel and grocery store sectors of the retail industry. Prior to joining Couche-Tard in 2012, Mr. Bernier was Executive Vice President of Valero Energy Corporation (NYSE: VLO) as well as President of Ultramar Ltd., the Canadian subsidiary of Valero Energy Corporation, where he was responsible for the company’s retail operations as well as corporate functions of communications, supply chain management and information services. From 1996 to 2011, Mr. Bernier held various senior management roles with Ultramar Ltd., including Vice-President Retail Operations in 1998 and 1999 and President from 1999 to 2011. Prior to joining Ultramar Ltd., Mr. Bernier served for nine years in a variety of senior management positions at Provigo, Inc. and held President, Vice-President and Chief Operating Officer level positions. Mr. Bernier holds a bachelor’s degree from the Université de Montréal and a Master’s degree in Industrial Relations from the University of Waterloo, Ontario.
Justin A. Gannon has served as a director of the Board and chairman of the audit committee and member of the conflicts committee since October 2014. Mr. Gannon has acted as an independent consultant and private investor since September 2013. From February 2003 through August 2013, Mr. Gannon served in various roles at Grant Thornton LLP, including as National Leader of Merger and Acquisition Development from June 2011 through August 2013, Central Region Managing Partner from January 2010 through June 2011, Office Managing Partner in Houston, Texas from August 2007 through June 2011 and Office Managing Partner in Kansas City, Missouri from August 2005 to July 2007. From 1971 through 2002, Mr. Gannon worked at Arthur Andersen LLP. Since December 2014, Mr. Gannon has served on the board of directors of California Resources Corporation (NYSE: CRC) where he serves as chair of the audit committee and member of the compensation committee. Since April 2017, Mr. Gannon has served on the board of directors of Vantage Energy Acquisition Corp. (NASDAQ: VEACU) where he serves as chairman of the audit committee and a member of the compensation committee. He is a former chairman of the board of directors of American Red Cross Chapters in the Tulsa, Oklahoma and San Antonio, Texas areas. Mr. Gannon received a bachelor’s degree in Accounting from Loyola Marymount University and is a Certified Public Accountant licensed in California (inactive) and Texas.
Mickey Kim was appointed as a director of the Board in June 2017 and he serves as chairman of the conflicts committee and member of the audit committee. Mr. Kim is a Member, Chief Operating Officer and Chief Compliance Officer of Kirr, Marbach & Company, LLC (“KM”), a registered investment adviser. Mr. Kim joined KM in 1986 and has been the firm’s Chief Operating Officer since 1996 and Chief Compliance Officer since 2004. Mr. Kim has also served as Vice-President, Treasurer and Secretary of Kirr, Marbach Partners Funds, Inc., a registered investment company, since 1998. Prior to his position with KM, Mr. Kim was a Senior Research Analyst at Driehaus Capital Management, a Chicago investment management firm, from 1982 to 1985. Mr. Kim has been a Chartered Financial Analyst (CFA) charterholder since 1985 and passed the Certified Public Accountant examination in 1980. He holds a bachelor’s degree in Accounting from the University of Illinois (1980) and a Master’s degree in Business Administration from the University of Chicago (1982).
John B. Reilly, III has served as a director of the Board since May 2012. He is a member of the audit committee and conflicts committee of the Board since October 2014. Mr. Reilly has served as the President of City Center Investment Corp since May 2011. Prior to then, he was President of Landmark Communities and Managing Partner of Traditions of America since 1998. Mr. Reilly has thirty years of experience in commercial and residential real estate development and planning, finance management and law. Mr. Reilly serves as a trustee of Lafayette College and also served as the chairman of the board of trustees for the Lehigh Valley Health Network. He holds a Juris Doctor degree from Fordham University Law School and a bachelor’s degree in economics from Lafayette College. He is a Certified Public Accountant and a member of the Pennsylvania Bar Association.
103
Claude Tessier was appointed as a director of the Board since June 2017. He has served as Chief Financial Officer of Couche-Tard since January 2016. Prior to joining Couche-Tard, Mr. Tessier held the position of President of the IGA Operations Business Unit at Sobeys Inc. from 2012 to 2016 and was a member of Sobeys Inc.’s Executive Committee. He joined the management team of Sobeys Quebec Inc. in 2003 as Senior Vice President, Finance & Strategic Planning. Mr. Tessier has spent most of his professional career in the food industry after serving in several finance positions. Prior to his position with Sobeys Inc., Mr. Tessier gained more than 15 years of senior financial leadership experience with Fly Furniture America, Provigo, Inc. and Costco Wholesale Canada Ltd, including in Chief Financial Officer and Vice President roles. He has also held management positions in Mallette International and PricewaterhouseCoopers LLP (formerly Coopers & Lybrand). Furthermore, he has been involved with various social and community organizations, most notably the Fondation Charles Bruneau. He also participated in the fundraising campaign of the Fondation de l’Institut de tourisme et d’hôtellerie du Québec. He currently serves as a board member for La Maison des Soins Palliatifs de Laval, a non-profit organization that provides care for patients in terminal phase of illness. Mr. Tessier holds a bachelor’s degree in Accounting from the Université du Québec à Montréal and has been a member of the Canadian Institute of Chartered Accountants since 1987.
Joseph V. Topper, Jr. has been the President of DMI since 2015. Mr. Topper served as President and Chief Executive Officer of the General Partner from October 2012 to March 2015. Mr. Topper resigned as President effective March 2015 and his term as Chief Executive Officer ended on September 2015. Mr. Topper also served as chairman of the Board from October 28, 2012 through September 30, 2014. Mr. Topper has over 25 years of management experience in the wholesale and retail fuel distribution business. In 1987, Mr. Topper purchased his family’s retail fuel business and five years later founded DMI (formerly known as Lehigh Gas Corporation), where he was the Chief Executive Officer since 1992. Mr. Topper currently serves as chairman of the board of trustees for Villanova University and the board of directors for Lehigh Valley PBS. He served on the board of directors of CST Brands, Inc. from October 2014 until December 2016. He is the past President of the board of directors for Lehigh Valley PBS and the Lehigh Valley PBS Foundation. He also served as a board member for the Good Shepherd Rehabilitation Hospital in Allentown. Mr. Topper holds a Master’s degree of Business Administration from Lehigh University and a bachelor’s degree in Accounting from Villanova University. Mr. Topper is also a Certified Public Accountant.
Evan Smith was appointed Vice President of Finance and Chief Financial Officer of our General Partner in June 2017. He was previously Vice President and Treasurer of CST Brands Inc. since April 2015. He has more than 20 years of finance and capital markets experience, including working as an investment fund manager with US Global Investors, a sell-side equity research analyst with Sanders Morris Harris, and a valuation consultant for Arthur Andersen where he began his career in 1994. Mr. Smith has been a CFA charter holder since 2001 and earned a bachelor’s degree in Mechanical Engineering from the University of Texas at Austin.
George Wilkins was appointed Vice President of Operations of our General Partner in January 2018. He has served as Vice President since July 2014. Previously, Mr. Wilkins was our Wholesale General Manager since March 2012. During that time, he was responsible for growing and developing our network of dealer operated locations. From 2010 to 2011, Mr. Wilkins worked for LUKOIL North America, where he served as Director of Wholesale Operations and Marketing and as Brand Manager from 2004 to 2010. Mr. Wilkins has over 20 years of diverse experience working for major oil companies, including ConocoPhillips as East Coast Marketing Manager and Regional Strategy Manager for Mobil Oil Corporation. Mr. Wilkins holds a bachelor’s degree in Business Management from Drexel University, as well as an Executive MBA degree from Villanova University.
Director Independence
Section 303A of the NYSE Listed Company Manual provides that limited partnerships are not required to have a majority of independent directors. The Board has adopted a policy that the Board has at all times at least three independent directors or such higher number as may be necessary to comply with the applicable federal securities law requirements. For the purposes of this policy, “independent director” has the meaning set forth in Section 10A(m)(3) of the Exchange Act, any applicable stock exchange rules and the rules and regulations promulgated in the Partnership governance guidelines available on its website www.crossamericapartners.com.
The Board has determined Messrs. Kim, Gannon and Reilly to be independent as defined under the independence standards established by the NYSE and the Exchange Act. These directors, whom we refer to as independent directors, are not officers or employees of our General Partner or its affiliates, and have been determined by the Board to be otherwise independent of Couche-Tard and its affiliates.
104
The Board consists of eight members. The Board holds regular and special meetings at any time as may be necessary. Regular meetings may be held without notice on dates set by the Board from time to time. Special meetings of the Board or meetings of any committee thereof may be held at the request of the Chairman of the Board or a majority of the Board (or a majority of the members of such committee) upon at least two days (if the meeting is to be held in person) or 24 hours (if the meeting is to be held telephonically) prior oral or written notice to the other members of the Board or committee or upon such shorter notice as may be approved by the directors or members of such committee. A quorum for a regular or special meeting will exist when a majority of the members are participating in the meeting either in person or by telephone conference. Any action required or permitted to be taken at a meeting of the Board or at any committee may be taken without a meeting if such action is evidenced in writing and signed by a majority of the members of the Board.
Committees of the Board
The Board has an audit committee and a conflicts committee. The charter for each of the committees can be found in its entirety on the Partnership’s website at www.crossamericapartners.com under the “Corporate Governance” tab in the “Investors” section. As a limited partnership, we are not required by NYSE rules to have a compensation committee or a nominating and corporate governance committee. During 2017, the Board held three meetings before the completion of the Merger (“Pre-Merger”) and three meetings after the completion of the Merger (“Post-Merger”) and each director attended 100% of the Board and respective committee meetings while she or he was a director.
Audit Committee
Effective October 1, 2014, Messrs. Gannon and Reilly have served as members of the audit committee and, on June 28, 2017, Mr. Kim was appointed as member of the audit committee. Mr. Gannon serves as chair. The audit committee is comprised entirely of directors who meet the financial literacy standards of the NYSE and the Exchange Act. The rules and regulations established by the NYSE and the Exchange Act also generally require that our audit committee consist entirely of independent directors. The Board has determined that Messrs. Gannon, Kim and Reilly meet the independence standards required of audit committee members by the NYSE and the Exchange Act and they meet the financial literacy standards of directors who serve on the audit committee, and Mr. Gannon is an “audit committee financial expert” as defined by SEC rules. The audit committee assists the Board in its oversight of the integrity of our financial statements and our compliance with legal and regulatory requirements, Partnership policies and controls, the independent auditor’s qualifications and independence, the performance of the Partnership’s internal audit function and risk assessment and risk management. The audit committee has sole authority with respect to the appointment, retention, compensation, evaluation, oversight of the work and termination of our independent auditors and has the authority to obtain advice and assistance from outside legal, accounting or other advisors as the audit committee deems necessary to carry out its duties and receives appropriate funding, as determined by the audit committee, from the Partnership for such advice and assistance. In 2017, the audit committee held two meetings Pre-Merger and three meetings Post-Merger.
Conflicts Committee
Effective October 1, 2014, Messrs. Gannon and Reilly have served are as members of the conflicts committee, and, on June 28, 2017, Mr. Kim was appointed as chair and member of the conflicts committee. Pursuant to our Partnership Agreement, the members of the conflicts committee may not be officers or employees of our General Partner or directors, officers or employees of its affiliates, must not be holders of any ownership interest in the General Partner or any of its affiliates, other than Partnership units, that is determined by the Board of Directors, after reasonable inquiry, to be likely to have an adverse impact on the ability of such director to fulfill his or her obligations as a member of the Conflicts Committee, and must meet the independence standards established by the NYSE and the Exchange Act to serve on an audit committee of a board of directors. The Board has determined that Messrs. Kim, Gannon and Reilly qualify to serve on the conflicts committee. The conflicts committee is responsible for reviewing specific matters that the Board believes may involve conflicts of interest between the General Partner and its affiliates and the Partnership. The conflicts committee determines if the resolution of such conflict is fair and reasonable to the Partnership. In 2017, the conflicts committee held one meeting Pre-Merger and fourteen meetings Post-Merger.
Meeting of Independent Directors and Communications with Directors
The independent members of the audit committee have met in executive sessions without members of management. The chairman presides over each executive session of the independent directors. Any independent director may request that additional executive sessions of the independent directors be held, and the presiding independent director for the previous session will determine whether to call any such meeting.
105
Unitholders or interested parties may communicate directly with the Board, any committee of the Board, any independent director, or any one director, by sending written correspondence by mail addressed to the Board, committee or director to the attention of our Corporate Secretary at the following address: c/o Corporate Secretary, CrossAmerica Partners LP, 515 Hamilton Street, Suite 200, Allentown, PA 18101. Communications are distributed to the Board, committee of the Board, or director, as appropriate, depending on the facts and circumstances outlined in the communication. Commercial solicitations or communications will not be forwarded.
Meetings of Unitholders
Our Partnership Agreement provides that the General Partner manages and operates us and that, unlike holders of common stock in a corporation, unitholders only have limited voting rights on matters affecting our business or governance as set forth in our Partnership Agreement. Accordingly, we do not hold annual meetings of unitholders.
Section 16(a) Beneficial Ownership Reporting Compliance
Section 16(a) of the Exchange Act requires members of the Board and executive officers, and beneficial owners of more than 10% of a class of our equity securities registered pursuant to Section 12 of the Exchange Act (collectively, the “Reporting Persons”), to file reports of beneficial ownership and reports of changes in beneficial ownership of such securities with the SEC. Reporting Persons are required by SEC regulations to furnish to us copies of all Section 16(a) forms filed with the SEC.
SEC regulations require us to identify in this Form 10-K anyone who filed a required report late during the most recent fiscal year. Based on our review of forms we received, or written representations from Reporting Persons stating that they were not required to file these forms, we believe that during 2016 all Section 16(a) filing requirements were satisfied on a timely basis.
Code of Ethics and Business Conduct
The Board has adopted a Code of Ethics and Business Conduct that applies to directors of the General Partner and our executive officers. Our General Partner also expects all employees of Couche-Tard providing services to or for the benefit of the Partnership and its operating subsidiaries to adhere to the Code of Ethics and Business Conduct. The Code of Ethics and Business Conduct can be found on CrossAmerica Partners’ website at www.crossamericapartners.com under the “Corporate Governance” tab in the “Investors” section. The Board has also adopted Corporate Governance Guidelines that outline important policies and practices regarding our governance, which can also be found in its entirety on CrossAmerica Partners’ website at www.crossamericapartners.com under the “Corporate Governance” tab in the “Investors” section. Requests for print copies of the Code of Ethics and Business Conduct and/or the Corporate Governance Guidelines may be directed to Investor Relations at info@crossamericapartners.com or to Investor Relations, CrossAmerica Partners LP, 515 Hamilton Street, Suite 200, Allentown, PA 18101 or made by telephone at (610) 625-8005. The information contained on, or connected to, our website is not incorporated by reference into this Annual Report on Form 10-K and should not be considered part of this or any other report that we file with or furnish to the SEC.
Reimbursement of Expenses of Our General Partner
Except as otherwise set forth in our Amended Omnibus Agreement, our Partnership Agreement requires us to reimburse our General Partner for all direct and indirect expenses it incurs or payments it makes on our behalf and all other expenses reasonably allocable to us or otherwise incurred by our General Partner in connection with operating our business. The Partnership Agreement does not limit the amount of expenses for which our General Partner and its affiliates may be reimbursed. These expenses include (without limitation) salary, bonus, incentive compensation and other amounts paid to persons who perform services for us or on our behalf and expenses allocated to our General Partner by its affiliates. Our General Partner is entitled to determine in good faith the expenses that are allocable to us. Please read “Item 13. Certain Relationships and Related Party Transactions and Director Independence - Amended Omnibus Agreement.”
ITEM 11. EXECUTIVE COMPENSATION
COMPENSATION DISCUSSION AND ANALYSIS
Overview
We do not directly employ or compensate any of our executive officers, including our named executive officers (“NEOs”), or other employees who provide services necessary for managing our business. Our General Partner also does not directly employ any of its executive officers or other employees. For the fiscal year ending December 31, 2017, all executive officers, including our NEOs, and other personnel who provide services to or on behalf of the Partnership were employed and compensated by an affiliate of CST until the Merger and by an affiliate of Couche-Tard since. Under our Partnership Agreement, the General Partner manages our operations and activities on our behalf.
106
Pursuant to the terms of the Amended Omnibus Agreement, an affiliate of Couche-Tard provides services to us, including the cash compensation for the services provided by our NEOs, and we pay Couche-Tard a management fee, which is approved by the independent conflicts committee of the Board. The Amended Omnibus Agreement is more fully described in Note 12 to the financial statements.
Pre-Merger, the Compensation Committee of the board of directors of CST (the “CST Compensation Committee”) had ultimate decision-making authority with respect to the total compensation of our NEOs. Post-Merger, since the Partnership is supported by employees of an affiliate of Couche-Tard, the compensation philosophy and practices of Couche-Tard have been used to determine the total compensation of our NEOs and all compensation decisions are in the sole discretion of Couche-Tard. All or a portion of such compensation may be allocated for reimbursement under the Amended Omnibus Agreement, depending on the time devoted of the NEOs’ time to their roles in the Partnership.
Named Executive Officers
As of December 31, 2017, our NEOs were:
|
|
• |
Jeremy L. Bergeron, President and Chief Executive Officer |
|
|
• |
Evan W. Smith, Vice President Finance and Chief Financial Officer, since June 28, 2017 |
|
|
• |
Matt McCure, Vice President, Operations, since June 28, 2017 |
The following individuals served as executive officers until the completion of the Merger on June 28, 2017:
|
|
• |
Clayton E. Killinger, Executive Vice President and Chief Financial Officer |
|
|
• |
David F. Hrinak, Executive Vice President and Chief Operating Officer |
|
|
• |
Hamlet T. Newsom, Jr., Vice President, General Counsel, Corporate Secretary and Chief Compliance Officer |
Employment for Messrs. Killinger, Hrinak and Newsom was terminated as of date of the Merger, June 28, 2017. Their compensation was determined by the CST Compensation Committee, some or all of which was allocated to us as part of the management fee under the Amended Omnibus Agreement.
Mr. McCure served as Vice President, Operations until his resignation on January 24, 2018. None of Mr. McCure’s compensation was allocated to us as part of the management fee under the Amended Omnibus Agreement nor did the General Partner require the Partnership to reimburse any of Mr. McCure’s compensation.
Except for the management fee we pay to Couche-Tard under the Amended Omnibus Agreement, we do not otherwise pay or reimburse any compensation amounts to or for our NEOs. Awards that CST, Couche-Tard and/or the Partnership granted under their respective plans can be found under the sections “Elements of Executive Compensation- Pre-Merger Long-Term Incentive Compensation: Equity Awards” and “Elements of Executive Compensation- Post-Merger Long-Term Incentive Compensation: Equity Awards.”
Pre-Merger Compensation Objectives and Philosophy
The compensation philosophy of the CST Compensation Committee determined the compensation for some of our NEOs Pre-Merger. Those compensation determinations were not subject to approval by us, our Board or any committees thereof.
Pre-Merger Elements of Executive Compensation
The core elements of the executive compensation program at CST were base salary, short-term incentives (in the form of annual performance-based cash incentives) and long-term incentives (in the form of time-vested equity awards). The CST Compensation Committee adopted guidelines for allocating compensation among base salary, short-term incentive compensation and long-term incentive compensation, between cash and non-cash compensation, and among different forms of non-cash compensation, as shown in the table below. CST’s executive compensation program was evaluated on an ongoing basis and was adapted, as necessary, to ensure continued alignment between long-term company performance and executive compensation.
107
The compensation for our NEOs prior to the Merger reflected in the 2017 Summary Compensation Table was paid by CST, some or all of which was allocated to us under the Amended Omnibus Agreement as discussed below.
|
Elements of Executive Compensation |
Type of Payment/Benefit |
Purpose |
|
Base salary |
Fixed cash payments with each executive generally eligible for annual increase |
To attract and retain qualified executives |
|
Short-term incentive compensation |
Variable annual cash payment tied to key performance metrics and targets, and individual performance assessments |
To motivate and reward performance of key business and financial metrics to deliver returns to Partnership unitholders and CST shareholders |
|
Long-term incentive compensation |
Restricted Stock Units (“CST RSUs”) |
To align long-term interests of NEOs with those of the Partnership’s unitholders and CST shareholders |
Pre-Merger Base Salary
The CST Compensation Committee approved the following base salaries for the 2017 fiscal year:
|
Name (1) |
|
2017 Annual Base Salary Pre-Merger |
|
|
|
Jeremy L. Bergeron |
|
$ |
396,500 |
|
|
Clayton E. Killinger |
|
|
656,500 |
|
|
David F. Hrinak |
|
|
380,600 |
|
|
Hamlet T. Newsom |
|
|
327,500 |
|
|
(1) |
100% of Mr. Bergeron’s compensation, 25% of Mr. Killinger’s compensation, 100% of Mr. Hrinak’s compensation and 75% of Mr. Newsom’s compensation was allocated to the Partnership as part of the management fee under the Amended Omnibus Agreement. Messrs. Smith and McCure were appointed executive officers on June 28, 2017 or Post-Merger. |
Pre-Merger Short-Term Incentive Compensation: Annual Performance-Based Cash Incentive
The CST Compensation Committee approved the 2017 Merger short-term incentive plan (“CST Bonus”), including the following performance metrics:
|
2017 Performance Metrics |
% Weight |
Why Performance Metric Is Used |
Payout Range |
|
CST Brands Total Non-Fuel Gross Margin versus budget for the period ending at the closing of the Merger |
50% |
Total Non-Fuel Gross Margin represents the total non-fuel gross profit dollars for the CST retail stores. A major strategic goal for CST was to increase the contribution of non-fuel margins to 70% of overall gross profit, including food and merchandise, by enhancing offerings of made to order food, proprietary food and private label programs and an expanded selection of store merchandise, including food, beverage and snack categories. CST believed this performance metric aligned the short-term incentive objectives with the long-term strategies of CST by (i) improving inside store profitability levels and increasing the number of customers that visit the CST network; and (ii) promoting merchandise gross profit growth through the pursuit of quality convenience store acquisitions that contribute to the core asset base, and organic new store growth. |
0 - 200% |
|
Consolidated Earnings Before Interest, Taxes, Depreciation and Amortization (EBITDA) versus budget for the period ending at the closing of the Merger |
50% |
This metric measured the EBITDA for both the Partnership and CST on a consolidated basis, which was a reflection of how well the Partnership and CST were performing overall against the established goals, representing a holistic view of the Partnership’s and CST’s strategies. This performance metric was a key driver of unitholder return over time. |
0 - 200% |
108
As determined by the CST Compensation Committee, each of these performance metrics had a threshold, target and maximum level for the performance year. The maximum incentive award payable to some of our executive officers under the short-term incentive program for the fiscal year ended December 31, 2017, based on the performance metrics described above, was 200% of their respective incentive award targets.
Mr. Bergeron received a pro-rata amount of the CST Bonus with an achievement factor of 126% for the period ending at the closing of the Merger (as approved by the CST Compensation Committee) paid in December 2017, which was allocated to us under the Amended Omnibus Agreement. Since employment for Messrs. Killinger and Newsom was terminated at the Merger, their severance payments, pursuant to their separation agreements, included payment of a pro-rata CST Bonus at target, a portion of which was allocated to us under the Amended Omnibus Agreement. Although employment for Mr. Hrinak was also terminated at the Merger, he was not eligible to receive a pro-rata CST Bonus, as per the terms of the EICP.
|
Name (1) |
|
2017 Annual Base Salary Pre-Merger |
|
|
Target Short- Term Incentive as a % of Base Salary |
|
|
Short-Term Incentive Potential Target at 100% |
|
|
2017 Short- Term Incentive Payment Approved |
|
||||
|
Jeremy L. Bergeron |
|
$ |
396,500 |
|
|
|
65 |
% |
|
$ |
257,725 |
|
|
$ |
162,367 |
|
|
Clayton E. Killinger |
|
|
656,500 |
|
|
|
75 |
% |
|
|
492,375 |
|
|
|
246,188 |
|
|
David F. Hrinak |
|
|
380,600 |
|
|
|
60 |
% |
|
|
228,360 |
|
|
|
— |
|
|
Hamlet T. Newsom, Jr. |
|
|
327,500 |
|
|
|
50 |
% |
|
|
163,750 |
|
|
|
81,875 |
|
|
(1) |
100% of Mr. Bergeron’s compensation, 25% of Mr. Killinger’s compensation, 100% of Mr. Hrinak’s compensation and 75% of Mr. Newsom’s compensation was allocated to the Partnership as part of the management fee under the Amended Omnibus Agreement. Messrs. Smith and McCure were appointed executive officers on June 28, 2017 or Post-Merger. |
Pre-Merger Long-Term Incentive Compensation: Equity Awards
Grants of CST Equity Awards
Pre-Merger and in 2017, the CST Compensation Committee approved the grant of equity awards in the form of CST RSUs for some of our NEOs, which, at the Merger, were converted into the right to receive a cash payment equal to the product of (x) the number of shares of CST common stock subject to such award as of the completion of the Merger and (y) the merger consideration, but such awards remained subject to the same vesting terms and payment schedule as those set forth in the original CST RSU award agreement; provided that, upon completion of the Merger, such award will vest in full upon an involuntary termination of employment without cause, or termination for “Good Reason”, or termination due to death, “Disability” or “Retirement.”
Grants of CrossAmerica Equity Awards
Our General Partner previously adopted the Plan for employees, officers, consultants and directors of our General Partner and its affiliates who perform services for us. The Plan provides for the grant of restricted units, unit options, performance awards, phantom units, unit awards, unit appreciation rights, distribution equivalent rights and other unit-based awards. In 2017, no CrossAmerica equity awards were granted to executive officers Pre-Merger. Pre-Merger, non-employee directors of the Board received CrossAmerica equity award grants in the form of phantom units for their service on the Board.
Phantom Units
A phantom unit represents a notional common unit granted under the Plan, which, upon vesting, entitles the holder of the phantom units to receive either a common unit or an amount of cash equal to the fair market value of a common unit at the time of vesting. All or a portion of the phantom units may be settled in common units or cash at the discretion of the Board. Phantom unit awards issued in April 2015 or thereafter are accompanied by tandem distribution equivalent rights that entitle the holder to cash payments equal to the amount of distribution authorized to be paid to the holder of common units. Prior to April 2015, phantom unit awards were issued without distribution equivalent rights.
109
Profits interests are represented by Class B Units in our wholly owned subsidiary, LGP Operations, and are designed to constitute “profits interests” within the meaning of the Internal Revenue Code, and published Internal Revenue Service guidance. Class B Units generally will not be taxed at the time of grant, though the holder will be required to report on his/her income tax return his/her allocable share of LGP Operations’ income, gain, loss, deduction and credit, regardless of whether LGP Operations makes a distribution of cash. Instead, such units are generally taxed upon at disposition of the unit or upon the receipt of distributions of money to the extent that such amounts received exceed the holder’s tax basis in the units. Generally, no deduction is available to the Partnership or LGP Operations upon the grant, vesting or disposition of the Class B Units. The profits interests are subject to vesting schedules determined by the Board. Holders of vested Class B Units are entitled to receive distributions from LGP Operations generally on the same terms as our unitholders. Vested Class B Units are redeemable for cash or our common units at the discretion of the Board, beginning on the second anniversary of the grant date at a conversion ratio of not greater than 1:1. In February 2017, the Board approved the redemption of 42,855 profits interests for our common units for participants who elected to redeem their awards after two years from the date of grant. This Board approval included Mr. Topper’s 28,947 profits interests, which he elected not to redeem and are still outstanding.
Post-Merger Compensation Objectives and Philosophy
Post-Merger, the responsibility and authority for compensation-related decisions for Messrs. Bergeron and Smith remain with the human resources department of Circle K. Such compensation determinations were not subject to approval by us, our Board or any committees thereof.
The compensation philosophy of Couche-Tard is based on performance and the achievement of predetermined objectives and it is a reflection of the entrepreneurial culture of Couche-Tard, and one where the financial interests of its executives are aligned with the performance of the company and the investors they represent. The compensation strategy includes variable components linked to short term, medium term and long term performance. Compensation plans and programs for executives are designed to (i) recruit, develop and retain talented executives; (ii) reward exceptional performance by rewarding them through predetermined and quantifiable objectives; (iii) establish a direct relation between the interests of the executives and those of the shareholders of Couche-Tard and the unitholders of the Partnership by favoring the creation of value on the short, medium and long term; (iv) encourage teamwork and promote company values; and (v) support the company’s business strategy. Couche-Tard’s compensation plans and programs are established based on internal principles of equity that take into consideration the role, nature and level of each of the executives as well as external principles of equity such as fair, equitable and competitive compensation terms in comparison to peers as well as those of the market in general.
Post-Merger Elements of Executive Compensation
The three main components to the remuneration of Couche-Tard’s executive compensation program are base salary, annual incentive plan and long-term incentive plan, as shown in the table below.
110
The compensation for two of our NEOs, Messrs. Bergeron and Smith, Post-Merger is reflected in the 2017 Summary Compensation Table and was allocated to us under the Amended Omnibus Agreement.
|
Elements of Executive Compensation |
Description |
Objectives |
|
Base salary |
Annual compensation is based on the functional responsibilities and competences of the executives |
Attract, retain and motivate |
|
Annual Incentive Plan (“AIP”) |
Bonus plan ranging from 40% to 60% of base salary, which payment is determined by (i) financial objectives (75%); and (ii) personal key result areas (KRAs) (25%) |
Motivate executives to achieve objectives with a higher degree of difficulty and thereby achieve or exceed the business plan of the company
Create accountability among executives for the achievement of these financial objectives
Align the short-term interests of executives with those of the company and its shareholders |
|
Long-term incentive compensation |
Phantom stock unit plan. Grants vary according to position held and individual contribution Performance payouts also vary depending on the achievement of special measurable objectives that are key to the financial success of the company |
Align long-term interests of executives with those of the company and its shareholders |
Post-Merger Base Salary
|
Name (1) |
|
2017 Annual Base Salary Post-Merger |
|
|
|
Jeremy L. Bergeron |
|
$ |
300,000 |
|
|
Evan W. Smith |
|
|
215,500 |
|
|
(1) |
None of Mr. McCure’s compensation was allocated to us as part of the management fee under the Amended Omnibus Agreement nor did the General Partner require the Partnership to reimburse any of Mr. McCure’s compensation. Mr. McCure was Vice President, Operations from June 28, 2017 to January 24, 2018. |
Post-Merger Short-Term Incentive Compensation: Annual Incentive Plan (AIP)
The Couche-Tard AIP is one of the key components of the “at-risk” compensation. The AIP is utilized to reward short-term performance achievements and to motivate and reward executives for their contributions toward meeting financial and strategic goals.
111
For Messrs. Bergeron and Smith, Couche-Tard determined to include, as part of their compensation, the 2017 AIP plan for the Couche-Tard fiscal year ending on April 29, 2018, including the following performance metrics:
|
2017 Performance Metrics |
% Weight |
Why Performance Metric Is Used |
Payout Range |
|
Financial objectives based on the achievement of (i) the business unit’s budgeted earnings (60%); and (ii) Couche-Tard’s budgeted net earnings (40%). If the financial objectives are met at less than 90%, no bonus is paid on the financial objectives component If the budgeted net earnings of Couche-Tard are attained at 90%, bonus should be 10% on the financial objectives component and scaled-up by 10% for each additional percentage point up to a maximum of 250% for Mr. Bergeron and 130% for Mr. Smith of the financial objectives component when the budgeted net earnings reaches a threshold of 130% for Mr. Bergeron and 110% for Mr. Smith |
75% |
The purpose of this performance metric is to motivate executives to achieve objectives with a higher degree of difficulty and thereby achieve or exceed the business plan of Couche-Tard. |
0 – 250% |
|
KRAs is a metric that includes personal objectives established at the beginning of the measurement period |
25% |
|
0 – 100% |
Performance metrics and achievement factor will be calculated once the measurement period ends by April 29, 2018.
|
Name |
|
2017 Annual Base Salary Post-Merger |
|
|
Target AIP as a % of Base Salary |
|
|
AIP Target at 100% |
|
|||
|
Jeremy L. Bergeron |
|
$ |
300,000 |
|
|
|
60 |
% |
|
$ |
180,000 |
|
|
Evan W. Smith |
|
|
215,500 |
|
|
|
40 |
% |
|
|
86,200 |
|
Post-Merger Long-Term Incentive Compensation: Couche-Tard Equity Awards and CrossAmerica Equity Awards
Grants of Couche-Tard Equity Awards
In 2017, Messrs. Bergeron and Smith received grants of Phantom Stock Units (“Couche-Tard PSUs”), which were granted in a percentage of base salary considering the position held by the executive. PSUs vest in three years less a day from the grant date and are payable in cash upon vesting. The Couche-Tard PSU payment is subject to two objectives, one related to employment service (35%) and the other based on Couche-Tard’s performance (65%). The performance objectives are determined at the time of the Couche-Tard PSU grant. The performance objectives are based on financial and competitive components. The degree of difficulty in the nature of these performance objectives is such that their attainment is not guaranteed. The Couche-Tard PSU grant price and payment price, as established, should not be less than the weighted average closing price for a board lot of the Couche-Tard Subordinate Voting Shares traded on the Toronto Stock Exchange for the five trading days preceding the date of grant or date of payment, as applicable.
Grants of CrossAmerica Equity Awards
In 2017, no CrossAmerica equity awards were granted to executive officers Post-Merger. Post-Merger, non-employee directors of the Board received CrossAmerica equity award grants in the form of phantom units for their service on the Board.
112
During 2017, our NEOs, except for Mr. McCure, were eligible to participate in the CST Brands Savings Plan (“CST 401(k)”), a qualified “Safe Harbor” 401(k) retirement plan. All contributions made under CST 401(k) were 100% vested at all times. Messrs. Bergeron and Smith were eligible to participate in the CST 401(k) until December 31, 2017.
Pre-Merger, some of our NEOs were eligible to participate in the CST Brands Excess Savings Plan (the “Excess Savings Plan”), which was a non-qualified deferred compensation program that provides benefits to CST employees whose annual contributions to CST Brands Savings Plan are subject to regulatory limitations. All balances under the Excess Savings Plan were paid at the Merger to all Participants, including some of our NEOs.
Effective January 1, 2016, certain employees, including some of our NEOs, were eligible to participate in the CST Nonqualified Deferred Compensation Plan (the “NQDC”) pursuant to which NEOs were allowed the opportunity to defer up to 75% of their base salary, up to 100% of their annual bonus and up to 100% of their annual grant of CST RSUs for that calendar year. Pursuant to the Merger Agreement, the CST Compensation Committee approved the termination of the NQDC upon closing of the Merger. All deferrals of base salary and excess savings plan accounts were 100% vested and vesting of deferrals of other bonus or equity awards was determined in accordance with the terms of the applicable awards.
Pre-Merger, some of our NEOs also receive the same benefits as those generally available to other employees of CST, which were in place until December 31, 2017. Both CST subsidized and voluntary benefit programs were provided and included medical, dental, vision, life insurance and disability coverage.
Post-Merger, Messrs. Bergeron and Smith were eligible to receive the same benefits as those generally available to Circle K executives, including a company vehicle as well as other Circle K subsidized and voluntary benefit programs, including medical, dental, vision, life insurance, disability coverage and financial planning. Mr. McCure was also eligible to receive the same benefits as those generally available to Circle K executives; however, those benefits were not allocated to the Partnership as part of the Amended Omnibus Agreement nor did the General Partner require the Partnership to reimburse Mr. McCure’s benefit amounts.
Other Compensation Policies and Practices
Insider Trading Policy
We maintain an insider trading policy (the “Insider Trading Policy”) that governs trading in our units by directors of the Board and executive officers of the General Partner and Couche-Tard, as well as certain other employees who may have regular access to material non-public information about us. These policies include pre-clearance requirements for all trades and periodic trading “black-out” periods designed with reference to our quarterly financial reporting schedule.
Restrictions on Hedging, Pledging and Other Transactions
Our Insider Trading Policy prohibits (a) speculative transactions such as short sales, puts, calls or other similar derivative transactions, hedging or monetization transactions with respect to the Partnership securities; (b) holding securities of the Partnership in a margin account; and (c) pledging Partnership securities as collateral for loans. Transactions that are otherwise prohibited by our Insider Trading Policy may be approved by the General Counsel of the General Partner, as the compliance officer of our Insider Trading Policy. Compliance with these policies is monitored by the Board. A copy of our Insider Trading Policy is available in its entirety on the CrossAmerica Partners’ website at www.crossamericapartners.com under the “Corporate Governance” tab in the “Investors” section.
113
We have adopted a “clawback” policy that applies to any bonuses and other incentive and equity compensation awarded to our executive officers. This policy provides that, in the event of a material restatement of the Partnership’s financial results due to material noncompliance with certain financial reporting requirements, the Board, or the appropriate committee of the Board, will review all such incentive compensation and, if such incentive compensation would have been lower had it been calculated based on the restated results, the Board, or the appropriate committee of the Board, will (to the extent permitted by law and as appropriate under the circumstances) use reasonable efforts to seek to recover for the benefit of the Partnership all or a portion of such incentive compensation, subject to a three-year look-back period. In July 2015, the SEC proposed new Rule 10D-1 under the Exchange Act to implement the provisions of Section 954 of the Dodd-Frank Wall Street Reform and Consumer Protection Act of 2012, or the Dodd-Frank Act, which requires the SEC to adopt rules relating to the disclosure of a company’s compensation recovery, or “clawback,” policies in connection with an accounting restatement. Once the SEC issues final rules regarding clawback policies, we intend to review and, if necessary, amend our policy to comply with such rules.
Impact of Regulatory Requirements
We are a limited partnership and not a corporation for U.S. federal income tax purposes. Therefore, we believe that the compensation paid to the NEOs is not subject to the deduction limitations under Section 162(m) of the Internal Revenue Code and therefore is generally fully deductible for U.S. federal income tax purposes.
Non-Qualified Deferred Compensation. Certain payments under the Partnership’s Executive Income Continuity Plan (the “EICP”) may be subject to the tax rules applicable to non-qualified deferred compensation arrangements of the American Jobs Creation Act of 2004. We believe we are in compliance with such statutory provisions.
Accounting for Stock-Based Compensation. We account for stock-based compensation in accordance with the requirements of FASB ASC Topic 718 for all of our stock-based compensation plans. See Note 18 of the notes to the financial statements for a discussion of all assumptions made in the calculation of this amount.
Risk Assessment
The ACT HR Committee oversees the risk assessment of the compensation programs, policies and practices for all employees. A discussion of this risk assessment is included in Couche-Tard’s Compensation Discussion and Analysis in Part III of Couche-Tard’s Management Proxy Circular disclosed on July 7, 2017, which is available on the Investors Relations section of the Couche-Tard website at www.corpo.couche-tard.com.
Compensation Committee Report*
The members of the Board have reviewed and discussed the Compensation Discussion and Analysis included in this Annual Report on Form 10-K with management and, based on such review and discussions and such other matters the Board deemed relevant and appropriate, the Board has approved the inclusion of the Compensation Discussion and Analysis in this Annual Report on Form 10-K.
|
|
|
|
|
Members of the Board: |
|
Timothy A. Miller |
|
Jeremy L. Bergeron |
|
Jean Bernier |
|
Justin A. Gannon |
|
Mickey Kim |
|
John B. Reilly, III |
|
Claude Tessier |
|
Joseph V. Topper, Jr. |
As a publicly traded limited partnership, we are not required to and do not have a compensation committee. Accordingly, the Compensation Committee Report required by Item 407(e)(5) of Regulation S-K is given by the Board as specified by Item 407(e)(5)(i) of Regulation S-K.
114
The foregoing compensation committee report is not “soliciting material,” is not deemed filed with the SEC, and is not to be incorporated by reference into any of the Partnership’s filings under the Securities Act, or the Exchange Act, respectively, whether made before or after the date of this annual report on Form 10-K and irrespective of any general incorporation language therein.
Summary Compensation Table
The following table sets forth certain information with respect to compensation of our NEOs. Except for the management fee we paid to CST and Couche-Tard under the Amended Omnibus Agreement, we did not pay or reimburse any cash compensation amounts to or for our NEOs in 2017.
|
Name and Principal Position |
|
Year |
|
Salary ($) |
|
|
Bonus ($) |
|
|
Stock Awards ($) (1)(2) |
|
|
Options Awards ($) (1)(3) |
|
|
Non-Equity Incentive Plan Compensation ($) (4) |
|
|
Change in Pension Value and Non- qualified Deferred Compensation Earnings ($) (5)(6) |
|
|
All Other Compensation ($) (7) |
|
|
Total ($) (8) |
|
||||||||
|
Jeremy L. Bergeron |
|
2017 |
|
|
349,711 |
|
|
|
— |
|
|
|
1,009,784 |
|
|
|
— |
|
|
|
162,367 |
|
|
|
523 |
|
|
|
522,454 |
|
|
|
2,044,839 |
|
|
President and Chief Executive |
|
2016 |
|
|
385,000 |
|
|
|
21,600 |
|
|
|
449,235 |
|
|
|
224,595 |
|
|
|
225,225 |
|
|
|
5,279 |
|
|
|
14,517 |
|
|
|
1,325,451 |
|
|
Officer |
|
2015 |
|
|
359,296 |
|
|
|
21,600 |
|
|
|
248,082 |
|
|
|
175,219 |
|
|
|
224,250 |
|
|
|
3,986 |
|
|
|
74,841 |
|
|
|
1,107,274 |
|
|
Evan W. Smith (9) |
|
2017 |
|
|
114,935 |
|
|
|
— |
|
|
|
113,508 |
|
|
|
— |
|
|
|
— |
|
|
|
— |
|
|
|
251,789 |
|
|
|
480,232 |
|
|
Vice President of Finance and |
|
|
|
|
|
|
|
|
|
|
|
|
|
|
|
|
|
|
|
|
|
|
|
|
|
|
|
|
|
|
|
|
|
|
|
Chief Financial Officer |
|
|
|
|
|
|
|
|
|
|
|
|
|
|
|
|
|
|
|
|
|
|
|
|
|
|
|
|
|
|
|
|
|
|
|
Clayton E. Killinger (10) |
|
2017 |
|
|
85,219 |
|
|
|
— |
|
|
|
361,027 |
|
|
|
— |
|
|
|
61,547 |
|
|
|
1,963 |
|
|
|
590,273 |
|
|
|
1,100,029 |
|
|
Former Vice President, |
|
2016 |
|
|
656,500 |
|
|
|
— |
|
|
|
962,955 |
|
|
|
481,442 |
|
|
|
443,138 |
|
|
|
17,368 |
|
|
|
13,760 |
|
|
|
2,575,163 |
|
|
Chief Financial Officer |
|
2015 |
|
|
654,981 |
|
|
|
— |
|
|
|
488,041 |
|
|
|
732,015 |
|
|
|
438,750 |
|
|
|
16,489 |
|
|
|
17,617 |
|
|
|
2,347,893 |
|
|
Matthew McCure (11) |
|
2017 |
|
|
— |
|
|
|
— |
|
|
|
— |
|
|
|
— |
|
|
|
— |
|
|
|
— |
|
|
|
— |
|
|
|
— |
|
|
Vice President Operations |
|
|
|
|
|
|
|
|
|
|
|
|
|
|
|
|
|
|
|
|
|
|
|
|
|
|
|
|
|
|
|
|
|
|
|
David F. Hrinak |
|
2017 |
|
|
191,764 |
|
|
|
50,000 |
|
|
|
399,675 |
|
|
|
— |
|
|
|
— |
|
|
|
100 |
|
|
|
1,865,208 |
|
|
|
2,506,747 |
|
|
Former Executive Vice |
|
2016 |
|
|
371,300 |
|
|
|
50,000 |
|
|
|
259,968 |
|
|
|
129,966 |
|
|
|
200,502 |
|
|
|
4,252 |
|
|
|
13,648 |
|
|
|
1,029,636 |
|
|
President, Chief |
|
2015 |
|
|
361,118 |
|
|
|
50,000 |
|
|
|
491,003 |
|
|
|
211,408 |
|
|
|
196,500 |
|
|
|
— |
|
|
|
2,421 |
|
|
|
1,312,450 |
|
|
Operations Officer |
|
|
|
|
|
|
|
|
|
|
|
|
|
|
|
|
|
|
|
|
|
|
|
|
|
|
|
|
|
|
|
|
|
|
|
Hamlet T. Newsom, Jr. (10) |
|
2017 |
|
|
127,536 |
|
|
|
— |
|
|
|
159,667 |
|
|
|
— |
|
|
|
61,406 |
|
|
|
1,112 |
|
|
|
560,358 |
|
|
|
910,080 |
|
|
Former Vice President, |
|
2016 |
|
|
318,000 |
|
|
|
— |
|
|
|
137,854 |
|
|
|
68,915 |
|
|
|
143,100 |
|
|
|
2,120 |
|
|
|
11,307 |
|
|
|
681,296 |
|
|
General Counsel, |
|
2015 |
|
|
236,301 |
|
|
|
— |
|
|
|
88,554 |
|
|
|
132,714 |
|
|
|
117,750 |
|
|
|
— |
|
|
|
9,925 |
|
|
|
585,244 |
|
|
Corporate Secretary and |
|
|
|
|
|
|
|
|
|
|
|
|
|
|
|
|
|
|
|
|
|
|
|
|
|
|
|
|
|
|
|
|
|
|
|
Chief Compliance Officer |
|
|
|
|
|
|
|
|
|
|
|
|
|
|
|
|
|
|
|
|
|
|
|
|
|
|
|
|
|
|
|
|
|
|
|
(1) |
The amounts shown represent the grant fair value of awards for each of the fiscal years shown computed in accordance with Financial Accounting Standard Board Accounting Standards Codification Topic 718, Compensation-Stock Compensation. See Note 18 of the notes of our consolidated financial statements included in our Annual Report on Form 10-K for the year ended December 31, 2017 filed with the SEC for a discussion of all assumptions made in the calculation of this amount. |
|
(2) |
See the Grants of Plan-Based Awards table for more information regarding CST RSUs and Couche-Tard PSUs units awarded in 2017. |
|
(3) |
There were no stock options granted to NEOs in 2017. |
|
(4) |
The amounts in this column represent cash payment earned under the 2015, 2016 and 2017 CST short-term incentive plans |
|
(5) |
The amounts in this column represent the change in value in the Excess Savings Plan for fiscal years 2015, 2016 and 2017. See the Non-Qualified Deferred Compensation table for additional information for 2017. |
|
(6) |
The General Partner does not sponsor any pension benefit plans and none of our NEOs contribute to such a plan. |
|
(7) |
The amounts listed as “All Other Compensation” for 2017 are composed of these items: |
115
|
All Other Compensation |
|
Bergeron |
|
|
Smith (9) |
|
|
Killinger |
|
|
Hrinak |
|
|
Newsom |
|
|||||
|
Severance |
|
$ |
— |
|
|
$ |
— |
|
|
$ |
574,438 |
|
|
$ |
1,820,790 |
|
|
$ |
548,972 |
|
|
Circle K Special Consideration Payment |
|
|
489,058 |
|
|
|
245,928 |
|
|
|
— |
|
|
|
— |
|
|
|
— |
|
|
CST Savings Plan Company Matching Contribution |
|
|
7,320 |
|
|
|
— |
|
|
|
1,515 |
|
|
|
7,905 |
|
|
|
3,779 |
|
|
Moving Expenses |
|
|
21,987 |
|
|
|
— |
|
|
|
— |
|
|
|
— |
|
|
|
— |
|
|
Payment of Accrued Vacation upon Separation |
|
|
— |
|
|
|
— |
|
|
|
13,769 |
|
|
|
30,741 |
|
|
|
6,259 |
|
|
Premiums for group-term life insurance |
|
|
1,656 |
|
|
|
1,064 |
|
|
|
317 |
|
|
|
965 |
|
|
|
622 |
|
|
Premiums for personal liability insurance |
|
|
2,432 |
|
|
|
717 |
|
|
|
234 |
|
|
|
4,807 |
|
|
|
726 |
|
|
Total All Other Compensation |
|
$ |
522,453 |
|
|
$ |
247,709 |
|
|
$ |
590,273 |
|
|
$ |
1,865,208 |
|
|
$ |
560,358 |
|
|
(8) |
Represents amounts allocated to the Partnership under the Amended Omnibus Agreement. |
|
(9) |
Mr. Smith became an executive officer on June 28, 2017, therefore, summary compensation information is presented only for the period June 28, 2017 through December 31, 2017. |
|
(10) |
The amounts shown for 2017 represent the portion of compensation paid to Messrs. Killinger and Newsom by CST that was allocated to us under the Amended Omnibus Agreement. The percentage of compensation allocated to us under the Amended Omnibus Agreement was 25% and 75% of total compensation paid for Mr. Killinger and Mr. Newsom, respectively, in 2017. |
|
(11) |
None of Mr. McCure’s compensation was allocated to the Partnership as part of the Management Fee under the Amended Omnibus Agreement nor did the General Partner require the Partnership for reimbursement of Mr. McCure’s compensation. |
Bergeron Retention Bonus
At the completion of the Merger, Mr. Bergeron was awarded a retention bonus of $978,116 payable in equal installments in each of July 2017 and July 2018; provided that, in the event Couche-Tard sells its interest in the Partnership and Mr. Bergeron is discharged prior to July 2018, all remaining payments will be accelerated.
Smith Retention Bonus
At the completion of the Merger, Mr. Smith was appointed Vice President Finance and Chief Financial Officer, and was awarded a retention bonus of $737,784 payable in equal installments in each of July 2017, July 2018 and July 2019; provided that, payment of (i) the remaining amount of the retention bonus; and (ii) a lump sum equal to the value remaining under Couche-Tard’s medical, dental and other insurance benefits will be accelerated in the event Couche-Tard sells its interest in the Partnership and Mr. Smith is discharged prior to July 2019.
116
The following table provides information regarding grants of plan-based awards to our NEOs during fiscal year 2017. All awards during fiscal year 2017 were in the form of CST RSUs (Pre-Merger) and Couche-Tard PSUs (Post-Merger).
|
|
|
|
|
|
|
Estimated Future Payouts Under Non-Equity Incentive Plan Awards |
|
|
Estimated Future Payouts Under Equity Incentive Plan Awards (1) |
|
|
All Other Stock Awards: Number of Shares of Stock or Units |
|
|
All Other Option Awards: Number of Securities Underlying Options |
|
|
Exercise or Base Price of Option Awards |
|
|
Grant Date Fair Value of Stock and Option Awards |
|
||||||||||||||||||||||
|
Name |
|
Grant Date |
|
|
Threshold ($) |
|
|
Target ($) |
|
|
Maximum ($) |
|
|
Threshold (#) |
|
|
Target (#) |
|
|
Maximum (#) |
|
|
(#) (2) |
|
|
(#) |
|
|
($/Sh) |
|
|
($) (3) |
|
|||||||||||
|
Jeremy L. Bergeron |
|
|||||||||||||||||||||||||||||||||||||||||||
|
CST STI Plan (4) |
|
|
— |
|
|
|
2,577 |
|
|
|
257,725 |
|
|
|
515,450 |
|
|
|
— |
|
|
|
— |
|
|
|
— |
|
|
|
— |
|
|
|
— |
|
|
|
— |
|
|
|
— |
|
|
ACT AIP (5) |
|
|
— |
|
|
|
45,000 |
|
|
|
180,000 |
|
|
|
382,500 |
|
|
|
— |
|
|
|
— |
|
|
|
— |
|
|
|
— |
|
|
|
— |
|
|
|
— |
|
|
|
— |
|
|
CST LTI Plan |
|
2/16/17 |
|
|
|
— |
|
|
|
— |
|
|
|
— |
|
|
|
— |
|
|
|
— |
|
|
|
— |
|
|
|
14,352 |
|
|
|
— |
|
|
|
— |
|
|
|
693,776 |
|
|
|
ACT LTI Plan |
|
7/20/17 |
|
|
|
— |
|
|
|
— |
|
|
|
— |
|
|
|
1,733 |
|
|
|
4,950 |
|
|
|
4,950 |
|
|
|
— |
|
|
|
— |
|
|
|
— |
|
|
|
316,008 |
|
|
|
Evan W. Smith (6) |
|
|||||||||||||||||||||||||||||||||||||||||||
|
ACT AIP (5) |
|
|
— |
|
|
|
21,550 |
|
|
|
86,200 |
|
|
|
183,175 |
|
|
|
— |
|
|
|
— |
|
|
|
— |
|
|
|
— |
|
|
|
— |
|
|
|
— |
|
|
|
— |
|
|
ACT AIP |
|
7/20/17 |
|
|
|
— |
|
|
|
— |
|
|
|
— |
|
|
|
622 |
|
|
|
1,778 |
|
|
|
1,778 |
|
|
|
— |
|
|
|
— |
|
|
|
— |
|
|
|
113,508 |
|
|
|
Clayton E. Killinger |
|
|||||||||||||||||||||||||||||||||||||||||||
|
CST STI Plan (4) |
|
|
— |
|
|
|
4,924 |
|
|
|
492,375 |
|
|
|
984,750 |
|
|
|
— |
|
|
|
— |
|
|
|
— |
|
|
|
— |
|
|
|
— |
|
|
|
— |
|
|
|
— |
|
|
CST LTI Plan |
|
2/16/17 |
|
|
|
— |
|
|
|
— |
|
|
|
— |
|
|
|
— |
|
|
|
— |
|
|
|
— |
|
|
|
29,874 |
|
|
|
— |
|
|
|
— |
|
|
|
1,444,109 |
|
|
|
Matthew McCure (7) |
|
|||||||||||||||||||||||||||||||||||||||||||
|
CST STI Plan |
|
|
— |
|
|
|
— |
|
|
|
— |
|
|
|
— |
|
|
|
— |
|
|
|
— |
|
|
|
— |
|
|
|
— |
|
|
|
— |
|
|
|
— |
|
|
|
— |
|
|
CST LTI Plan |
|
|
— |
|
|
|
— |
|
|
|
— |
|
|
|
— |
|
|
|
— |
|
|
|
— |
|
|
|
— |
|
|
|
— |
|
|
|
— |
|
|
|
— |
|
|
|
— |
|
|
David F. Hrinak |
|
|||||||||||||||||||||||||||||||||||||||||||
|
CST STI Plan (4) |
|
|
— |
|
|
|
2,284 |
|
|
|
228,360 |
|
|
|
456,720 |
|
|
|
— |
|
|
|
— |
|
|
|
— |
|
|
|
— |
|
|
|
— |
|
|
|
— |
|
|
|
— |
|
|
CST LTI Plan |
|
2/16/17 |
|
|
|
— |
|
|
|
— |
|
|
|
— |
|
|
|
— |
|
|
|
— |
|
|
|
— |
|
|
|
8,268 |
|
|
|
— |
|
|
|
— |
|
|
|
399,675 |
|
|
|
Hamlet T. Newsom, Jr. |
|
|||||||||||||||||||||||||||||||||||||||||||
|
CST STI Plan (4) |
|
|
— |
|
|
|
1,638 |
|
|
|
163,750 |
|
|
|
327,500 |
|
|
|
— |
|
|
|
— |
|
|
|
— |
|
|
|
— |
|
|
|
— |
|
|
|
— |
|
|
|
— |
|
|
CST LTI Plan |
|
2/16/17 |
|
|
|
— |
|
|
|
— |
|
|
|
— |
|
|
|
— |
|
|
|
— |
|
|
|
— |
|
|
|
4,404 |
|
|
|
— |
|
|
|
— |
|
|
|
212,889 |
|
|
|
(1) |
Represents an award of Couche-Tard PSUs under the Couche-Tard long-term incentive plan. 35% of the Couche-Tard PSUs are subject to service-based restrictions until July 19, 2020 and 65% vest in full three (3) years from the date of grant based on the achievement of certain performance goals. The threshold amount represents the service-based portion of the award, which will vest without regard to company performance if the executive remains employed over the vesting term. |
|
(2) |
Represents an award of CST RSUs under the CST long-term incentive program. At the completion of the Merger, these CST RSUs were converted into the right to receive a cash payment equal to the product of (x) the number of shares of CST common stock subject to such award as of the completion of the Merger and (y) the merger consideration, but such awards remained subject to the same vesting terms and payment schedule as those set forth in the original CST RSU award agreement; provided that, upon completion of the Merger, such award will vest in full upon an involuntary termination of employment without cause, or termination for “Good Reason”, or termination due to death, “Disability” or “Retirement.” |
|
(3) |
The amounts shown represent the grant date fair value of awards for each of the fiscal years shown computed in accordance with Financial Accounting Standards Board Accounting Standards Codification Topic 718, Compensation-Stock Compensation. |
|
(4) |
The amounts in these rows represent the potential payouts under the 2017 CST short term incentive plan ("CST STI Plan"). The threshold payout is the minimum amount payable, the target payout represents the amount payable for achieving the target level of performance, and the maximum payout represents the maximum amount payable. Since employment for Messrs. Killinger and Newsom was terminated at the Merger, their severance payments, pursuant to their separation agreements, included payment of a pro-rata bonus at target ("CST Bonus") under the CST STI Plan, a portion of which was allocated to us under the Amended Omnibus Agreement. Although employment for Mr. Hrinak was also terminated at the Merger, he was not eligible to receive a pro-rata CST Bonus, as per the terms of the EICP. Mr. Bergeron received a pro-rata amount of the CST Bonus with an achievement factor of 126% for the period ending at the closing of the Merger, which was paid in December 2017 and allocated to us under the Amended Omnibus Agreement. Of their total compensation, 25% of Mr. Killinger’s compensation and 75% of Mr. Newsom’s compensation was allocated to us under the Amended Omnibus Agreement. Therefore, the same percentage of their respective Grant Date Fair Value of Stock Awards is included in the Summary Compensation Table for each of Messrs. Killinger and Newsom. |
117
|
(6) |
Mr. Smith became an executive officer on June 28, 2017, therefore, compensation information is presented only for the period June 29, 2017 through December 31, 2017. |
|
(7) |
None of Mr. McCure’s compensation was allocated to the Partnership as part of the Management Fee under the Amended Omnibus Agreement nor did the General Partner require the Partnership to reimburse any of Mr. McCure’s compensation. |
Outstanding Equity Awards at Fiscal Year End
The following table provides information regarding the number of outstanding equity awards held by our NEOs at December 31, 2017.
|
|
|
Option Awards |
|
|
Stock Awards (1) |
|
||||||||||||||||||||||||||
|
Name |
|
Number of Securities Underlying Unexercised Options Exercisable (#) |
|
|
Number of Securities Underlying Unexercised Options Unexerciseabe (#) |
|
|
Option Exercise Price ($) |
|
|
Option Expiration Date |
|
|
Number of Shares or Units of Stock That Have Not Vested (#) (2) |
|
|
Market Value of Shares or Units of Stock That Have Not Vested ($) |
|
|
Equity Incentive Plan Awards Number of Unearned Shares, Units, or Other Rights That Have Not Vested (3) |
|
|
Equity Incentive Plan Awards: Market or Payout Value of Unearned Shares, Units or Other Rights That Have Not Vested |
|
||||||||
|
Jeremy L. Bergeron |
|
|
— |
|
|
|
— |
|
|
|
— |
|
|
|
— |
|
|
|
1,387 |
|
|
|
32,941 |
|
|
|
— |
|
|
|
— |
|
|
|
|
|
— |
|
|
|
— |
|
|
|
— |
|
|
|
— |
|
|
|
— |
|
|
|
— |
|
|
|
4,950 |
|
|
|
324,671 |
|
|
Evan W. Smith |
|
|
— |
|
|
|
— |
|
|
|
— |
|
|
|
— |
|
|
|
— |
|
|
|
— |
|
|
|
— |
|
|
|
— |
|
|
|
|
|
— |
|
|
|
— |
|
|
|
— |
|
|
|
— |
|
|
|
— |
|
|
|
— |
|
|
|
— |
|
|
|
— |
|
|
Clayton E. Killinger |
|
|
— |
|
|
|
— |
|
|
|
— |
|
|
|
— |
|
|
|
— |
|
|
|
— |
|
|
|
1,778 |
|
|
|
116,619 |
|
|
|
|
|
— |
|
|
|
— |
|
|
|
— |
|
|
|
— |
|
|
|
— |
|
|
|
— |
|
|
|
— |
|
|
|
— |
|
|
Matthew McCure |
|
|
— |
|
|
|
— |
|
|
|
— |
|
|
|
— |
|
|
|
— |
|
|
|
— |
|
|
|
— |
|
|
|
— |
|
|
|
|
|
— |
|
|
|
— |
|
|
|
— |
|
|
|
— |
|
|
|
— |
|
|
|
— |
|
|
|
— |
|
|
|
— |
|
|
David F. Hrinak |
|
|
— |
|
|
|
— |
|
|
|
— |
|
|
|
— |
|
|
|
— |
|
|
|
— |
|
|
|
— |
|
|
|
— |
|
|
|
|
|
— |
|
|
|
— |
|
|
|
— |
|
|
|
— |
|
|
|
— |
|
|
|
— |
|
|
|
— |
|
|
|
— |
|
|
Hamlet T. Newsom, Jr. |
|
|
— |
|
|
|
— |
|
|
|
— |
|
|
|
— |
|
|
|
— |
|
|
|
— |
|
|
|
— |
|
|
|
— |
|
|
|
|
|
|
|
|
|
|
|
|
|
|
|
|
|
|
|
|
|
|
|
|
|
|
|
|
|
|
|
|
|
|
|
|
(1) |
The amounts in the Stock Awards section include CrossAmerica Phantom Units and Couche-Tard PSUs. |
|
|
|
(2) |
CrossAmerica Phantom Units vest in one-third (1/3) increments every year for three years on the first, second and third anniversaries of the date of grant. |
|
|
|
(3) |
35% of the Couche-Tard PSUs are subject to service-based restrictions until July 19, 2020 and 65% vest in full three (3) years from the date of grant based on the achievement of certain performance goals. |
118
Option Exercises and Equity Vested
The following table sets forth information regarding vesting of awards of the Partnership as well as CST equity awards for our NEOs for the fiscal year ended December 31, 2017.
|
|
|
Option Awards |
|
|
Stock Awards |
|
||||||||||||
|
Name |
|
Number of Shares or Units Acquired on Exercise (#) |
|
|
|
Value Realized on Exercise ($) |
|
|
Number of Shares or Units of Stock Acquired on Vesting (#) |
|
|
|
Value Realized on Vesting ($) |
|
||||
|
Jeremy L. Bergeron |
|
|
— |
|
|
|
|
— |
|
|
|
1,387 |
|
(1) |
|
|
34,593 |
|
|
Evan W. Smith (4) |
|
|
— |
|
|
|
|
— |
|
|
|
— |
|
|
|
|
— |
|
|
Clayton E. Killinger |
|
|
186,415 |
|
(2) |
|
|
2,248,656 |
|
|
|
73,118 |
|
(3) |
|
|
3,545,222 |
|
|
Matthew McCure (4) |
|
|
— |
|
|
|
|
— |
|
|
|
— |
|
|
|
|
— |
|
|
David F. Hrinak |
|
|
31,344 |
|
(5) |
|
|
254,407 |
|
|
|
21,025 |
|
(6) |
|
|
1,019,848 |
|
|
Hamlet T. Newsom, Jr. |
|
|
— |
|
|
|
|
— |
|
|
|
6,400 |
|
(7) |
|
|
310,592 |
|
|
(1) |
Represents an amount that includes one third (1/3) of an award of phantom units in the Partnership vested on April 14, 2017, representing 1,387 units. |
|
|
|
(2) |
Upon the CIC, all outstanding stock options were cancelled and cashed out. The total number of shares includes 25,000 stock options granted on May 6, 2013; 50,043 stock options granted on March 10, 2014; 67,842 stock options granted on March 12, 2015; and 43,530 stock options granted on March 8, 2016. |
|
|
|
(3) |
Represents an amount that includes one third (1/3) of a CST RSU award vested on March 10, 2017, representing 6,294 shares of CST common stock; one third (1/3) of a CST RSU award vested on March 12, 2017, representing 3,929 shares of CST common stock; one third (1/3) of a CST RSU award vested on March 8, 2017, representing 4,141 shares of CST common stock; one third (1/3) of a CST RSU award vested on June 28, 2017, representing 3,929 shares of CST common stock; two thirds (2/3) of a CST RSU award vested on June 28, 2017, representing 8,282 shares of CST common stock; a CST market share units award granted on March 8, 2016 vested in full on June 28, 2017 representing 16,669 shares of CST common stock; and an CST RSU award vested in full on June 28, 2017, representing 29,874 shares of CST common stock. |
|
|
|
(4) |
Mr. Smith became an executive officer on June 28, 2017, therefore, compensation information is presented only for the period June 29, 2017 through December 31, 2017. None of Mr. McCure’s compensation was allocated to the Partnership as part of the Management Fee under the Amended Omnibus Agreement nor did the General Partner require the Partnership for reimbursement of Mr. McCure’s compensation. |
|
|
|
(5) |
Upon the completion of the Merger, all outstanding CST stock options were cancelled and cashed out. The total number of shares includes 19,593 stock options granted on March 12, 2015 and 11,751 stock options granted on March 8, 2016. |
|
(6) |
Represents an amount that includes one third (1/3) of a CST RSU award vested on March 12, 2017, representing 1,135 shares of CST common stock; one third (1/3) of a CST RSU award vested on March 8, 2017, representing 1,118 shares of CST common stock; one third (1/3) of a CST RSU award vested on June 28, 2017, representing 1,135 shares of CST common stock; one third (1/3) of a CST RSU award vested on June 28, 2017, representing 2,634 shares of CST common stock; two thirds (2/3) of a CST RSU award vested on June 28, 2017, representing 2,236 shares of CST common stock; a CST market share units award granted on March 8, 2016 vested in full on June 28, 2017 representing 4,499 shares of CST common stock; and an CST RSU award vested in full on June 28, 2017, representing 8,268 shares of CST common stock. |
|
|
|
(7) |
Represents an amount that includes one third (1/3) of a CST RSU award vested on June 28, 2017, representing 889 shares of CST common stock; a CST market share units award granted on March 8, 2016 vested in full on June 28, 2017 representing 1,107 shares of CST common stock; and an CST RSU award vested in full on June 28, 2017, representing 4,404 shares of CST common stock. |
119
Non-Qualified Deferred Compensation
The following tables include non-qualified deferred compensation.
Pre-Merger Excess Savings Plan
CST established the Excess Savings Plan, which was a non-qualified deferred compensation program to provide benefits to CST employees whose annual contributions to the CST Brands Savings Plan (a qualified 401(k) plan) were subject to the regulatory limitations. Under the Excess Savings Plan, CST made annual contributions in the first quarter of each year for the previous fiscal year. Some of our NEOs participated in the Excess Savings Plan during the fiscal year ended December 31, 2017. The following table provides information concerning the contributions, earnings, withdrawals and distributions in the Excess Savings Plan during the fiscal year ended December 31, 2017.
|
Name |
|
Executive contributions in last FY ($) |
|
|
Registrant contributions in last FY ($) (1) |
|
|
Aggregate earnings in last FY ($) (1) |
|
|
Aggregate withdrawals/ distributions ($) |
|
|
Aggregate balance at last FYE ($) |
|
|||||
|
Jeremy L. Bergeron |
|
|
— |
|
|
|
305 |
|
|
|
218 |
|
|
|
9,787 |
|
|
|
— |
|
|
Evan W. Smith |
|
|
— |
|
|
|
— |
|
|
|
— |
|
|
|
— |
|
|
|
— |
|
|
Clayton E. Killinger |
|
|
— |
|
|
|
6,565 |
|
|
|
1,288 |
|
|
|
62,550 |
|
|
|
— |
|
|
David F. Hrinak |
|
|
— |
|
|
|
— |
|
|
|
100 |
|
|
|
4,352 |
|
|
|
— |
|
|
Hamlet T. Newsom, Jr. |
|
|
— |
|
|
|
1,260 |
|
|
|
223 |
|
|
|
3,603 |
|
|
|
— |
|
|
(1) |
The sum of the amounts in these columns is included in the "Change in Pension Value and Non-Qualified Deferred Compensation Earnings" for 2017 in the Summary Compensation Table for each NEO. |
Pre-Merger Non-Qualified Deferred Compensation Plan
Some of our NEOs participated in the CST Non-Qualified Deferred Compensation Plan and were offered to defer up to 75% of their base salary, up to 100% of their annual bonus and up to 100% of their annual grant of CST RSUs for the year ended December 31, 2017. All deferrals of base salary were 100% vested and vesting of deferrals of other bonus or equity awards is determined in accordance with the terms of the applicable awards.
|
Name |
|
Executive contributions in last FY ($) (1) |
|
|
Registrant contributions in last FY ($) |
|
|
Aggregate Earning in last FY ($) |
|
|
Aggregate withdrawals/ distributions ($) |
|
|
Aggregate balance at last FYE ($) |
|
|||||
|
Jeremy L. Bergeron |
|
|
— |
|
|
|
— |
|
|
|
— |
|
|
|
— |
|
|
|
— |
|
|
Evan W. Smith |
|
|
— |
|
|
|
— |
|
|
|
— |
|
|
|
— |
|
|
|
— |
|
|
Clayton E. Killinger |
|
|
— |
|
|
|
— |
|
|
|
— |
|
|
|
— |
|
|
|
— |
|
|
David F. Hrinak |
|
|
— |
|
|
|
— |
|
|
|
— |
|
|
|
— |
|
|
|
— |
|
|
Hamlet T. Newsom, Jr. |
|
|
8,646 |
|
|
|
— |
|
|
|
33,100 |
|
|
|
248,889 |
|
|
|
— |
|
|
(1) |
All amounts in this column are included in the values reflected in the Summary Compensation Table for 2017 in the income category from which they were deferred. |
Post-Merger Non-Qualified Deferred Compensation Plan
For the fiscal year ended December 31, 2017, Messrs. Bergeron and Smith were not participants of the Couche-Tard executive retirement plan, a non-qualified plan that provides an annual company contribution equivalent to 8% of the executive base salary into a defined contribution account.
Potential Payments upon Termination or Change in Control
Our executive officers may be entitled to certain payments upon termination of their employment under certain circumstances, in each case, as more fully described below. Any such payments that are to be made in cash will be subject to reimbursement under the Amended Omnibus Agreement.
120
Executive Income Continuity Plan (the “EICP”)
The Partnership adopted the EICP on May 28, 2014 for all persons who are designated as executive officers of the General Partner by resolution of the Board (the “Officers”) and any persons who provide management services to the Partnership and are designated as plan participants by the Board (each a “Participant”).
Mr. Hrinak, who was our Executive Vice President and Chief Operating Officer until his termination on June 28, 2017, received all benefits under the EICP and continues to receive certain vested medical benefits. Messrs. Killinger and Newsom received all benefits under the EICP upon their termination of employment on June 28, 2017.
Under the EICP, if an Officer is terminated from providing management services to the Partnership or the General Partner other than due to death, disability, retirement, cause or voluntary resignation (other than for good reason (as defined in the EICP)) (a “Termination”), then such Officer is entitled to receive a severance payment, paid in 12 equal monthly installments, equal to the sum of (i) the Officer’s annual salary as of the date of termination, plus (ii) the amount of the Officer’s annual target bonus under the applicable annual incentive compensation plan in place at the time the termination occurs (the sum of (i) and (ii), the “Compensation Amount”). In addition, the Officer (and his dependents, as applicable) will receive the continuation of their medical, dental and other benefits for a period of one year from the date of termination, all unvested awards under the Partnership’s Plan held by such Officer shall vest immediately upon Termination and the Officer is also entitled to be reimbursed for outplacement services for one year subsequent to the Termination, and, in certain circumstances, reimbursement of relocation expenses and legal fees and expenses (all such benefits, the “Continued Benefits”). If the Termination of an Officer occurs in connection with, or within 24 months after, a change in control of the Partnership (which occurred as a result of the Merger), then the Officer will receive a severance payment, paid in a single lump sum in cash, equal to 2.99 times the Compensation Amount, with the exception of Mr. Killinger, whose severance payment under the EICP was capped at 2.0 times the amount payable under the CST Separation Agreement.
CST Separation Agreements
Under separation agreements with CST (“CST Separation Agreement”), following their termination in connection with the Merger, each of Messrs. Killinger and Newsom were entitled to:
|
|
• |
A lump sum cash severance payment equal to the product of (a) 2.0 (for Mr. Killinger) and 1.5 (for Mr. Newsom), multiplied by (b) the sum of the executive’s annual base salary plus target annual short term incentive opportunity; |
|
|
• |
A lump sum cash payment equal to the executive’s target annual short term incentive opportunity for 2017, prorated for the portion of the year elapsed as of the last day of the month of termination, which payment is payable in a lump sum; and, |
|
|
• |
Continued medical, dental and other insurance benefits for a period of three years from the date of termination on the same basis as immediately prior to the date of termination. |
As a condition of receiving the severance benefits under the CST Separation Agreements, each of the executives executed a release of claims and agreed to comply, until June 28, 2018, with restrictive covenants concerning non-competition and non-solicitation of employees, as well as perpetual confidentiality and non-disparagement covenants.
Since the termination in connection with the Merger triggered payment under both the CST Separation Agreement and the EICP, the EICP provides that payments and benefits would be the greater of those provided in either of the CST Separation Agreement or EICP, with the exception of Mr. Killinger. As a result, the payments to Mr. Newsom were based on the EICP, or 2.99 times the Compensation Amount and 75% was allocated to the Partnership. Mr. Killinger received severance payments under both the EICP and the CST Separation Agreement, with his cash severance payments under the EICP capped at the amount of cash severance payable under his CST Separation Agreement. Of the aggregate payment made to Mr. Killinger, 25% was allocated to the Partnership.
All payments due under the EICP are conditioned on the execution by the Participant of a release and non-disparagement agreement.
If amounts payable to an Officer under the EICP (together with any other amounts that are payable by the Partnership as a result of a change in control (collectively, the “Payments”) exceed the amount allowed under Section 280G of the Code for such Officer, thereby subjecting the Officer to an excise tax under section 4999 of the Code, then the Payments shall either be: (i) reduced to the level at which no excise tax applies, such that the full amount of the Payments would be equal to three times the Officer’s “base amount” (as defined in the Code), or (ii) paid in full, which would subject the Officer to the excise tax. The Partnership will determine, in good faith, which outcome produces the best net after tax position for an Officer, but the Partnership will not provide any gross-up payments for excise taxes.
121
Second Amended and Restated EICP
As permitted under the EICP, on August 18, 2017, the Board approved the Second Amended and Restated CrossAmerica Partners LP EICP (“Second Amendment”), subject to receipt of all required Officer and Participant consents (“Consents”). The Second Amendment will become effective upon receipt of all consents. As of the date of this filing, not all Consents have been received from Participants.
Once effective, the Second Amendment will provide:
|
|
• |
No additional individuals will become Participants on or after June 28, 2017; and |
|
|
• |
With the exception of specified continuing employees of ACT who perform services for the Partnership, no amounts under the EICP will be payable in case of a termination post-Merger. |
|
|
• |
The EICP will automatically terminate on December 31, 2020 or, if earlier, the date as of which all payments and benefits due under the terms of the EICP have been paid to all individuals who were Participants on June 28, 2017. |
Therefore, the table below estimates the amount of compensation and benefits to be provided to each of our NEOs in the event of termination of such NEO’s employment under certain circumstances, pursuant to the current terms of the EICP. These amounts are estimates of the amounts that would be paid or provided to our NEOs upon termination of employment or a change in control had the termination occurred on December 31, 2017. The actual amounts can only be determined at the time of such NEO’s separation from Couche-Tard. Accordingly, if termination had taken place prior to December 31, 2017, the amounts payable with respect to the short-term incentive program would have been reduced to reflect the pro rata portion of the NEO’s annual target short-term incentive award.
|
Name |
|
Severance Benefit |
|
Termination by the Company Without Cause (other than for Good Reason) ($) |
|
|
Termination by the Company for Good Reason or Without Cause in Connection with a Change of Control ($) |
|
|
||
|
Jeremy L. Bergeron |
|
Separation Payment |
|
|
480,000 |
|
(1) |
|
1,435,200 |
|
(2) |
|
|
|
Long-Term Incentive Plan |
|
|
696,503 |
|
(3) |
|
1,054,114 |
|
(3)(4) |
|
|
|
Health Benefits |
|
|
24,007 |
|
(5) |
|
72,022 |
|
(6) |
|
Evan W. Smith |
|
Separation Payment |
|
|
301,700 |
|
(1) |
|
902,083 |
|
(2) |
|
|
|
Long-Term Incentive Plan |
|
|
153,452 |
|
(3) |
|
270,071 |
|
(3)(4) |
|
|
|
Health Benefits |
|
|
13,393 |
|
(5) |
|
40,180 |
|
(6) |
|
(1) |
Represents 100% of the executive officer's annual base salary and target short-term incentive in effect at December 31, 2017, as provided for in the EICP. |
|
|
|
(2) |
Represents 299% of the executive officer's annual base salary and target short-term incentive in effect at December 31, 2017, as provided for in the EICP. |
|
(3) |
Amounts include CST RSUs that were converted into the right to receive a cash payment equal to $696,502.56 and $153,451.86 for Messrs. Bergeron and Smith, respectively. Such awards remained subject to the same vesting terms and payment schedule as those set forth in the original CST RSU award agreement; provided that, upon completion of the Merger, such award will vest in full upon an involuntary termination of employment without cause, or termination for “Good Reason”, or termination due to death, “Disability” or “Retirement.” |
|
(4) |
Executive's outstanding ACT PSUs and unvested CrossAmerica phantom units would immediately vest upon termination in connection with a change in control. |
|
(5) |
Represents estimated payments for continued coverage under current health plans for up to one year, as provided for the in the EICP. |
|
(6) |
Represents estimated payments for continued coverage under current health plans for up to three years, as provided for the in the EICP. |
Principal Executive Officer Pay Ratio
We are providing the following information about the relationship of the annual total compensation of our employees and the annual total compensation of Jeremy L. Bergeron, our Principal Executive Officer (our “PEO”):
122
For the year ended December 31, 2017, our last completed fiscal year:
|
|
▪ |
the median of the annual total compensation of all employees of the Partnership (other than our PEO) was $16,446; and |
|
|
▪ |
the annual total compensation of our PEO, as reported above in the Summary Compensation Table was $2,044,839. |
Based on this information for the year ended December 31, 2017, we reasonably estimate that the ratio of our PEO’s annual total compensation to the annual total compensation of our median employee was 124:1. Our pay ratio estimate has been calculated in a manner consistent with Item 402(u) of Regulation S-K.
As of October 2, 2017, we had 578 employees (including full-time, part-time and temporary employees) providing services to our Retail segment, all of whom were employed by one of our subsidiaries. Most of these employees are customer service associates who service our retail sites; the majority of these employees are part-time employees who do not work more than 30 hours a week. For purposes of identifying our median employee, we did not include the 92 employees of Circle K who provided exclusive management services to us as of October 2, 2017, as those individuals are employed by Circle K and not by us. As discussed in this Form 10-K, our PEO is an employee of Circle K, but we are including his annual total compensation in the determination of the PEO pay ratio, as required under SEC rules.
We identified our median employee based on the aggregate salary actually paid during the year ended December 31, 2017 to our 578 employees.
For purposes of determining aggregate salary, we included the amount of base salary and overtime the employee received during the year and all other pay elements related to base salary including, but not limited to, holiday pay, vacation pay and other paid time off, if any. Aggregate salary amounts did not include any cash bonuses, commissions or other compensation. In making this determination, we annualized the compensation of all full-time and part-time permanent employees who were hired in 2017 but were not employed by us for the entire year ended December 31, 2017.
Once we identified our median employee, we then determined that employee’s annual total compensation, including any perquisites and other benefits, in the same manner that we determine the annual total compensation of our NEOs for purposes of the Summary Compensation Table disclosed above. The annual total compensation of our median employee, a retail store customer service associate, was determined to be $16,446. This annual total compensation amount for our median employee was then compared to the annual total compensation of our PEO, disclosed above in the Summary Compensation Table, of $2,044,839. The elements included in the PEO’s annual total compensation are fully discussed above in the footnotes to the Summary Compensation Table.
Director Compensation
Overview
On December 31, 2017, the following were members to the Board: Timothy A. Miller, Chairman of the Board and Senior Vice President, Global Fuels of Couche-Tard; Jeremy L. Bergeron, President and Chief Executive Officer of our General Partner; Claude Tessier, Chief Financial Officer of Couche-Tard; Jean Bernier, Group President, Global Fuels and North-East Operations of Couche-Tard; and John B. Reilly, III; Joseph V. Topper, Jr.; Mickey Kim; and Justin A. Gannon, as non-employee directors of the board of directors of our General Partner.
Director Compensation for Fiscal Year 2017
Pre-Merger, each non-employee director received cash compensation of $60,000 per year (paid on a quarterly basis). The chairman of each of the audit committee and conflicts committee received additional cash compensation of $10,000 per the fiscal year ended December 31, 2017 (paid on a quarterly basis).
Post-Merger, each non-employee director received cash compensation of $45,000 per year (paid on a quarterly basis). The chairman of each of the audit committee and conflicts committee received additional cash compensation of $10,000 per the fiscal year ended December 31, 2017 (paid on a quarterly basis). In addition, each non-employee director received $1,000 per each Board meeting attended or $500 per each Committee meeting attended.
In August 2017, non-employee directors Messrs. Reilly, Topper and Gannon received an award of 2,804 phantom units in an amount equal to $72,500 based on the closing price of the Partnership’s common units on the date of grant as compensation for their service from April 1, 2017 until June 28, 2018; and Mr. Kim received an award of 2,127 phantom units in an amount equal to $55,000 based on the closing price of the Partnership’s common units on the date of grant as compensation for his service from June 28, 2017 until June 28, 2018. Such phantom units will be fully vested on the one-year anniversary of the grant date and include the payment made by the Partnership of distribution equivalent rights equal to the amount of distributions authorized to be paid to holders of common units of the Partnership.
123
Our directors are reimbursed for all out-of-pocket expenses in connection with attending meetings of the Board or its committees. To the extent permitted under Delaware law, each director is fully indemnified by us for actions associated with being a director.
The following table provides the compensation amounts for each of our non-employee directors for the fiscal year ended December 31, 2017.
|
Current Directors |
|
Fees Earned or Paid in Cash ($) (1) |
|
|
Stock or Unit Awards and Option Awards ($) (2) |
|
|
All Other Compensation ($) |
|
|
Total ($) |
|
||||
|
Timothy A. Miller (3) |
|
|
— |
|
|
|
— |
|
|
|
— |
|
|
|
— |
|
|
Joseph V. Topper, Jr. (4) |
|
|
55,500 |
|
|
|
72,500 |
|
|
|
— |
|
|
|
128,000 |
|
|
John B. Reilly III (4) |
|
|
64,500 |
|
|
|
72,500 |
|
|
|
— |
|
|
|
137,000 |
|
|
Jean Bernier (3) |
|
|
— |
|
|
|
— |
|
|
|
— |
|
|
|
— |
|
|
Claude Tessier (3) |
|
|
— |
|
|
|
— |
|
|
|
— |
|
|
|
— |
|
|
Mickey Kim (4)(5) |
|
|
39,500 |
|
|
|
55,000 |
|
|
|
— |
|
|
|
94,500 |
|
|
Justin A. Gannon (4)(5) |
|
|
74,500 |
|
|
|
72,500 |
|
|
|
— |
|
|
|
147,000 |
|
|
Jeremy L. Bergeron (6) |
|
|
— |
|
|
|
— |
|
|
|
— |
|
|
|
— |
|
|
Former Directors |
|
|
|
|
|
|
|
|
|
|
|
|
|
|
|
|
|
Kimberly S. Lubel (7) |
|
|
— |
|
|
|
— |
|
|
|
— |
|
|
|
— |
|
|
Clayton E. Killinger (7) |
|
|
— |
|
|
|
— |
|
|
|
— |
|
|
|
— |
|
|
Gene Edwards (8) |
|
|
35,000 |
|
|
|
— |
|
|
|
— |
|
|
|
35,000 |
|
|
(1) |
Pre-Merger each Director received a cash retainer of $60,000 (paid quarterly) and an additional $10,000 to chairs of the Committees. Post-Merger each Director received a cash retainer of $45,000 (paid quarterly) and an additional $10,000 to chairs of the Committees. In addition, each non-employee director received $1,000 per each Board meeting attended or $500 per each Committee meeting attended. |
|
|
|
(2) |
Under the Plan, the directors will have the ability to elect to receive either phantom units or profits interests. Phantom units and profits interests can be converted to common units or cash, at the discretion of the Board. |
|
|
|
(3) |
Messrs. Miller, Bernier and Tessier were employees of Couche-Tard as of December 31, 2017 and did not receive any compensation for their services as directors of the Board for the year ended December 31, 2017. On December 31, 2017, Mr. Bernier stepped down from his position as Group President, Global Fuels and North-East Operations of Couche-Tard; however, Mr. Bernier will remain in the Board as a non-employee director. |
|
|
|
(4) |
As part of the compensation to non-employee directors for the period April 1, 2017 to June 28, 2018, each of Messrs. Gannon, Reilly and Topper received an equity grant of 2,804 phantom units of the Partnership based upon a fair market value of $25.86 per unit, which was the NYSE closing price of our common units on August 10, 2017. Mr. Kim received an equity grant of 2,127 phantom units of the Partnership based upon a fair market value of $25.86 per unit, which was NYSE closing price of our common units on August 10, 2017. Each of these phantom units will vest in one installment on the anniversary of the date of grant. These phantom unit awards were accompanied by tandem distribution equivalent rights that entitle the holder to cash payments equal to the amount of unit distributions authorized to be paid to the holders of Partnership common units. |
|
(5) |
Messrs. Kim and Gannon received additional cash compensation of $10,000 per year for their service as chairman of the conflicts committee and audit committee, respectively. |
|
(6) |
Mr. Bergeron is an employee of Circle K and did not receive any compensation for his services as director of the Board for the year ending December 31, 2017. |
|
(7) |
Ms. Lubel and Mr. Killinger were employees of CST and did not receive any compensation for their services as directors of the Board for the year ending December 31, 2017. |
|
(8) |
Mr. Edwards received additional cash compensation of $5,000 for his service as chairman of the conflicts committee from January 1 through June 28, 2017. |
Compensation Committee Interlocks and Insider Participation
None of the directors or executive officers of our General Partner served as members of the compensation committee of another entity that has or had an executive officer who served as a member of our Board during the year ended December 31, 2017. We do not have a separate compensation committee. Decisions regarding the compensation of our NEOs are made, as applicable, by Couche-Tard as the owner of our General Partner.
124
ITEM 12. SECURITY OWNERSHIP OF CERTAIN BENEFICIAL OWNERS AND MANAGEMENT AND RELATED UNITHOLDER MATTERS
As of February 14, 2018, the following table sets forth the beneficial ownership of our common and subordinated units of:
|
|
• |
Each person known by us to be a beneficial owner of more than 5% of our outstanding common units; |
|
|
• |
Our General Partner; |
|
|
• |
Each NEO and director of the Board; and |
|
|
• |
All of the executive officers and directors of the Board, as a group. |
|
|
|
Beneficial Ownership of Common Units |
|
||||||
|
Name of Beneficial Owner |
|
Number of Units |
|
|
|
Percent of Class |
|
||
|
Greater than 5% Stockholders |
|
|
|
|
|
|
|
|
|
|
Harvest Fund Advisors LLC |
|
|
3,060,165 |
|
(1) |
|
|
8.971 |
% |
|
Oppenheimer Funds, Inc. |
|
|
3,416,122 |
|
(2) |
|
|
10.015 |
% |
|
CrossAmerica GP LLC |
|
|
— |
|
(3) |
|
|
— |
|
|
Dunne Manning Inc. (fka Lehigh Gas Corporation) |
|
|
3,782,216 |
|
(4)(5) |
|
|
11.088 |
% |
|
Energy Realty Partners, LLC |
|
|
1,854,943 |
|
(4)(5) |
|
|
5.438 |
% |
|
Alimentation Couche-Tard Inc. |
|
|
14,850,543 |
|
(6) |
|
|
43.535 |
% |
|
Directors |
|
|
|
|
|
|
|
|
|
|
Jeremy L. Bergeron |
|
|
12,448 |
|
(7) |
|
* |
|
|
|
Timothy A. Miller |
|
|
— |
|
|
|
* |
|
|
|
Jean Bernier |
|
|
— |
|
|
|
* |
|
|
|
Justin A. Gannon |
|
|
8,257 |
|
|
|
* |
|
|
|
Mickey Kim |
|
|
— |
|
|
|
* |
|
|
|
John B. Reilly, III |
|
|
930,972 |
|
(8) |
|
|
2.729 |
% |
|
Claude Tessier |
|
|
— |
|
|
|
* |
|
|
|
Joseph V. Topper, Jr. |
|
|
7,656,530 |
|
(4)(5)(9)(10) |
|
|
22.446 |
% |
|
Named Executive Officers |
|
|
|
|
|
|
|
|
|
|
Evan Smith |
|
|
— |
|
|
|
* |
|
|
|
George Wilkins |
|
|
— |
|
|
|
* |
|
|
|
Directors and executive officers as a group (10 persons) |
|
|
8,608,207 |
|
|
|
|
25.236 |
% |
|
* |
The percentage of units beneficially owned does not exceed one percent of the common units outstanding |
|
|
|
(1) |
Harvest Fund Advisors LLC has (i) sole power to vote 3,060,165 common units and (ii) sole power to dispose of 3,060,165 common units, based on its Schedule 13F filed as of December 31, 2017. The address for Harvest Fund Advisors LLC is 100 W. Lancaster Avenue, Suite 200, Wayne, PA 19087. |
|
(2) |
Oppenheimer Funds, Inc. has (i) sole power to vote 3,416,122 common units and (ii) sole power to dispose of 3,416,122 common units, based on its Schedule 13G filed as of December 31, 2017. The address for Oppenheimer Funds, Inc. is Two World Financial Center, 225 Liberty Street, New York, NY 10281. |
|
(3) |
CrossAmerica GP LLC is the general partner of the Partnership and is wholly owned by CST. |
|
(4) |
In connection with the GP Purchase, Mr. Topper entered into a Voting Agreement dated as of October 1, 2014 by and among Mr. Topper, the Topper Trust, Dunne Manning Inc. ("DMI"), an entity wholly owned by the 2004 Irrevocable Agreement of Trust of Joseph V. Topper, Sr. for which Mr. Topper is the trustee (the “Topper Trust” and collectively, the “Topper Entities”), and CST (the “Voting Agreement”), pursuant to which each of the Topper Entities agrees that at any meeting of the holders of common units of the Partnership, it will vote or cause to be voted such Topper Entities’ units, in accordance with the recommendation of the Board. The Voting Agreement will remain in effect with respect to any Topper Entities for so long as any such Topper Entities is the beneficial owner of 10% or more of the outstanding common units of the Partnership. |
|
(5) |
The common units shown as beneficially owned by Mr. Topper include units beneficially owned by entities that are controlled by Mr. Topper, including DMI and Energy Realty Partners, LLC. The units that are beneficially owned by Mr. Topper by way of his control of DMI and Energy Realty Partners, LLC are also shown as beneficially owned by those entities in the table above. The units shown as beneficially owned by Mr. Topper include 28,947 common units to be issued upon the conversion of vested profits interests in March 2018, unless Mr. Topper elects not to redeem them. See “Executive Compensation-Compensation Discussion and Analysis-Pre-Merger Elements of Executive Compensation-Pre-Merger Long-Term Incentive Compensation: Equity Awards - Profits Interests” for a description of the profits interests. |
125
|
(7) |
Consists of 11,061 CrossAmerica common units and 1,387 CrossAmerica phantom units that will vest on April 14, 2018. |
|
(8) |
Mr. Reilly may be deemed to share beneficial ownership of 738,501 common units beneficially owned by the 2008 Irrevocable Agreement of Trust of John B. Reilly, Jr. (the “Reilly Trust”) in his capacity as one of two trustees of the Reilly Trust. |
|
(9) |
Mr. Topper, as director of the Board, sole director of DMI and a trustee of a trust that is the sole shareholder of DMI, may be deemed to have beneficial ownership of the units beneficially owned by DMI. The units beneficially owned by DMI are included in the number of common units shown as beneficially owned by Mr. Topper in the table above. |
|
(10) |
Mr. Topper, as the sole manager and indirect owner of Energy Realty Partners, LLC, may be deemed to have beneficial ownership of the units beneficially owned by Energy Realty Partners, LLC. The units beneficially owned by Energy Realty Partners, LLC are included in the number of units shown as beneficially owned by Mr. Topper in the table above. |
Securities Authorized For Issuance under Equity Compensation Plans
The following table summarizes information about our equity compensation plans as of December 31, 2017:
|
Plan Category |
|
Number of securities to be issued upon exercise of outstanding options, warrants and rights (1) |
|
|
Weighted-average exercise price of outstanding options, warrants and rights |
|
Number of securities remaining available for future issuance under equity compensation plans |
|
||
|
Equity compensation plans approved by security holders: |
|
|
|
|
|
|
|
|
|
|
|
Lehigh Gas Partners LP 2012 Incentive Award Plan |
|
|
42,106 |
|
|
n/a |
|
|
766,318 |
|
See Note 18 to the financial statements for a discussion of the material terms of the Plan.
126
ITEM 13. CERTAIN RELATIONSHIPS AND RELATED PARTY TRANSACTIONS, AND DIRECTOR INDEPENDENCE
As of February 21, 2018, Circle K owned 21.1% of the Partnership’s outstanding units and, pursuant to a voting agreement with Joseph V. Topper, Jr. and certain affiliates, has the power to direct the vote of an additional 22.4% of the Partnership’s outstanding units. Circle K also owns the IDRs.
As of February 21, 2018, Mr. Topper owned or controlled 22.4% of the Partnership’s common units; however, pursuant to a voting agreement Mr. Topper has agreed to vote such common units of CrossAmerica as directed by Circle K.
As of February 21, 2018, John B. Reilly, III owned or controlled 2.7% of the Partnership’s outstanding units.
The following is a description of related party transactions, since January 1, 2017, to which the Partnership was or is a party, in which the amount involved exceeds $120,000 and in which a director, executive officer, holder of more than 5% of our common units or any member of their immediate family had or will have a direct or indirect material interest, other than the arrangements that are described under “Item 12-Potential Payments Upon Termination or Change in Control.” The terms of the transactions and agreements disclosed in this section were determined by and among related parties and, consequently, are not the result of arm’s length negotiations. Such terms are not necessarily at least as favorable to the parties to these transactions and agreements as the terms that could have been obtained from unrelated third parties.
Distributions and Payments to our General Partner and Certain Related Parties
The following table summarizes the distributions and payments to be made by us to our General Partner and certain related parties in connection with the ongoing operation of our business and distributions and payments that would be made by us if we were to liquidate in accordance with the terms of our partnership agreement.
Operational Stage
|
|
||
|
|
|
|
|
Distributions |
|
We will generally make cash distributions to the unitholders, including Circle K, its affiliates, Messrs. Topper and Reilly and their respective affiliates. Assuming we have sufficient cash available for distribution to pay the full minimum quarterly distribution on all of our outstanding units for four quarters, Circle K and its affiliates, Messrs. Topper and Reilly and their respective affiliates would receive an annual distribution of $27.6 million, collectively, on their common units. If distributions exceed the minimum quarterly distribution and other higher target levels, Circle K, as the holder of the IDRs, is entitled to increasing percentages of the distributions, up to 50.0% of the distributions above the highest target level. Cash distributions to our General Partner, DMI and its affiliates, Messrs. Topper and Reilly and their respective affiliates amounted to $38.0 million and $36.0 million in 2017 and 2016, respectively. |
|
|
||
|
|
|
|
|
Payments to our General Partner and its affiliates |
|
For the year ended December 31, 2017, we paid Circle K a Management Fee of $856,000 per month plus a variable fee of between zero and $0.003 per gallon for wholesale fuel distribution and $0.015 per gallon for retail fuel distribution at sites operated by commission agents. In addition, the Partnership is required to reimburse Circle K for certain outsourced services to be provided by Circle K to or on behalf of the Partnership. The Partnership incurred $13.9 million and $15.9 million in management fees under the Amended Omnibus Agreement for 2017 and 2016, respectively. Circle K and CrossAmerica have the right to negotiate the amount of the management fee on an annual basis, or more often as circumstances require. |
|
|
|
|
|
Liquidation Stage |
|
|
|
|
|
|
|
Liquidation |
|
Upon our liquidation, the partners, including our General Partner, is entitled to receive liquidating distributions according to their particular capital account balances. |
127
Ownership of Our General Partner
Since October 1, 2014, CST (and since June 28, 2017, Circle K) has indirectly owned all of the membership interests of our General Partner.
Agreements with CST and Circle K and their Affiliates
On October 1, 2014, in connection with the GP Purchase, we entered into certain agreements with CST and Circle K and their affiliates, as described in more detail below.
Amended Omnibus Agreement
We entered into the Amended and Restated Omnibus Agreement on October 1, 2014, by and among CrossAmerica, the General Partner, DMI, DMS, CST Services and Joseph V. Topper, Jr. The terms of the Amended Omnibus Agreement were approved by the independent conflicts committee of our Board. Pursuant to the Amended Omnibus Agreement, CST Services agrees, among other things, to provide, or cause to be provided, to the Partnership certain management services.
Amounts payable to Circle K related to these transactions were $25.3 million and $10.0 million at December 31, 2017 and 2016, respectively. At the end of each calendar year, we and Circle K have the right to negotiate a reduction or increase to the amounts due under the Amended Omnibus Agreement for such year. Circle K and we also have the right to negotiate the amount of the annual management fee as circumstances require. CrossAmerica, CST and Circle K mutually agreed to settle certain amounts due under the terms of the Amended Omnibus Agreement in newly issued common units representing limited partner interests in us. As a result in 2017 and 2016, we issued 550,516 and 440,266 limited partner units to CST Services and Circle K valued at $14.0 million and $11.2 million, respectively. Circle K and CrossAmerica agreed to settle $3.3 million of the fourth quarter 2017 management fee in limited partner units. See Note 12 to the financial statements for additional information.
Management Services and Term. Pursuant to the Amended Omnibus Agreement, Circle K provides us and our General Partner with management, administrative and operating services. These services include accounting, tax, legal, internal audit, risk management and compliance, environmental compliance and remediation management oversight, treasury, information technology and other administrative functions. Circle K provides the Partnership and our General Partner with personnel necessary to carry out these services and any other services necessary to operate the Partnership’s business as requested by the Partnership. We do not have any obligation to directly compensate the officers of our General Partner or employees of Circle K; however, the Partnership reimburses Circle K under the Amended Omnibus Agreement for its services to the General Partner and Partnership, as described in this section.
The initial term of the Amended Omnibus Agreement is five years and will automatically renew for additional one year terms unless any party provides written notice to the other parties 180 days prior to the end of the then annual term. The Partnership has the right to terminate the agreement at any time upon 180 days’ prior written notice.
Fees and Reimbursements. As indicated previously, we pay Circle K a management fee for providing services. Services provided by, or on behalf of, Circle K, not outsourced to an independent third party, include accounting; administrative; billing and invoicing; books and record keeping; budgeting, forecasting, and financial planning and analysis; management (including the management and oversight of the MLP’s wholesale motor fuel distribution and real estate business consistent with past practice); operations; payroll; contract administration; maintenance of internal controls; financial reporting, including SEC reporting and compliance; office space; purchasing and materials management; risk management and administration of insurance programs; information technology (includes hardware and software existing or acquired in the future for which title is retained by Circle K); in-house legal; compensation, benefits and human resources administration; cash management; corporate finance, treasury credit and debt administration; employee training; and miscellaneous administration and overhead expenses. In addition, the Partnership is required to reimburse Circle K for certain outsourced services to be provided by Circle K to or on behalf of the Partnership, as set forth in the Amended Omnibus Agreement.
128
Rights of First Refusal. The Amended Omnibus Agreement provides that Mr. Topper, DMI and DMS agree, and are required to cause their controlled affiliates to agree, that for so long as Mr. Topper is an officer or director of the General Partner or CST, if (a) Mr. Topper, DMI, DMS, or any of their controlled affiliates have the opportunity to acquire assets used, or a controlling interest in any business primarily engaged, in the wholesale motor fuel distribution or retail gas station operation businesses, and (b) the assets or businesses proposed to be acquired have a value exceeding $5.0 million in the aggregate, then Mr. Topper, DMI, DMS, or their controlled affiliates will offer such acquisition opportunity to the Partnership and give the Partnership a reasonable opportunity to acquire, at the same price plus any related transaction costs and expenses, such assets or business, either before or promptly after the consummation of such acquisition by Mr. Topper, DMI, DMS, or their controlled affiliates. The decision to acquire or not acquire any such assets or businesses requires the approval of the conflicts committee of the Board. Any assets or businesses that the Partnership does not acquire pursuant to the right of first refusal may be acquired and operated by Mr. Topper, DMI, DMS or their controlled affiliates.
Rights of First Offer. The Amended Omnibus Agreement provides that Mr. Topper, DMI and DMS agree, and are required to cause their controlled affiliates to agree, for so long as Mr. Topper is an officer or director of the General Partner or CST, to notify the Partnership of their desire to sell any of their assets or businesses if (a) Mr. Topper, DMI, DMS, or any of their controlled affiliates, decides to attempt to sell (other than to another controlled affiliate of Mr. Topper, DMI or DMS) any assets used, or any interest in any business primarily engaged, in the wholesale motor fuel distribution or retail gas station operation businesses, to a third party and (b) the assets or businesses proposed to be sold have a value exceeding $5.0 million in the aggregate. Prior to selling such assets or businesses to a third party, Mr. Topper, DMI and DMS are required to negotiate with the Partnership exclusively and in good faith for a reasonable period of time in order to give the Partnership an opportunity to enter into definitive documentation for the purchase and sale of such assets or businesses on terms that are mutually acceptable to Mr. Topper, DMI, DMS, or their controlled affiliates, and the Partnership. If the Partnership and Mr. Topper, DMI, DMS, or their controlled affiliates have not entered into a letter of intent or a definitive purchase and sale agreement with respect to such assets or businesses within such period, Mr. Topper, DMI, DMS, and their controlled affiliates, have the right to sell such assets or businesses to a third party following the expiration of such period on any terms that are acceptable to Mr. Topper, DMI, DMS, or their controlled affiliates, and such third party. The decision to acquire or not to acquire assets or businesses pursuant to this right requires the approval of the conflicts committee of the Board.
Review of Management Fee. At the end of each calendar year, we have the right to submit to Circle K a proposal to reduce the amount of the management fee for such year if we believe that the services performed by Circle K do not justify payment of the amount of management fees paid by us for such year. In addition, Circle K has the right, at the end of each calendar year, to submit to us a proposal to increase the amount of the management fee for such year if Circle K believes that the services performed by Circle K justify an increase in the management fee. If any such proposal is submitted, we will negotiate with Circle K to determine if the management fee for such year should be reduced or increased, and, if so, the amount of such reduction or increase. In addition, upon a material change in our structure or our business, the conflicts committee of our General Partner will review the management fee. If the conflicts committee determines that, based on a change in our structure or our business, the management fee should be modified or otherwise altered, we will negotiate with Circle K to determine the appropriate modification or alteration of the management fee. Effective January 1, 2016, the fixed component of the management fee was increased to $856,000 per month, which was approved by the conflicts committee of the Board.
General Indemnification; Limitation of Liability. Pursuant to the Amended Omnibus Agreement, we are required to indemnify Circle K for any liabilities incurred by Circle K attributable to the management, administrative and operating services provided to us under the agreement, other than liabilities resulting from Circle K’s bad faith, fraud or willful misconduct. In addition, Circle K is required to indemnify us for any liabilities we incur as a result of Circle K’s bad faith, fraud or willful misconduct in providing management, administrative and operating services under the Amended Omnibus Agreement. Other than indemnification claims based on Circle K’s bad faith, fraud or willful misconduct, Circle K’s liability to us for services provided under the Amended Omnibus Agreement cannot exceed $5,000,000 in the aggregate.
Fuel Sales and Rental Income
We sell wholesale motor fuel under a master fuel distribution agreement to 49 Circle K retail sites and lease real property on 73 retail sites to Circle K under a master lease agreement, each having initial 10-year terms. The fuel distribution agreement provides us with a fixed wholesale mark-up per gallon. The master lease agreement is a triple net lease.
129
Revenues from motor fuel sales and real property rental income from CST and Circle K were as follows (in thousands):
|
|
|
For the Year Ended December 31, |
|
|||||
|
|
|
2017 |
|
|
2016 |
|
||
|
Revenues from motor fuel sales to CST and Circle K |
|
$ |
136,649 |
|
|
$ |
118,745 |
|
|
Rental income from CST and Circle K |
|
|
17,021 |
|
|
|
17,188 |
|
Receivables from CST or Circle K were $3.9 million and $3.2 million at December 31, 2017 and 2016, respectively, related to these transactions.
Investment in CST Fuel Supply
As further discussed in Note 12 to the financial statements, we have a 17.5% limited partner equity interest in CST Fuel Supply. CST Fuel Supply distributes motor fuel primarily to CST’s retail sites at its cost plus a fixed margin of $0.05 per gallon and has no material net assets. CST Fuel Supply distributed approximately 1.7 billion and 1.8 billion gallons of motor fuel during 2017 and 2016, respectively. For 2017 and 2016, we recorded income of $14.9 million and $16.0 million from CST Fuel Supply. Accounts receivable from Circle K and CST related to this income amounted to $1.2 million at December 31, 2017 and December 31, 2016.
Refund payment related to CST sale of California and Wyoming Assets
In July 2016, CST provided a refund payment to us related to our 17.5% interest in CST Fuel Supply resulting from the sale by CST of 79 retail sites in California and Wyoming to 7-Eleven, Inc. and its wholly-owned subsidiary, SEI Fuel Services, Inc., to which CST Fuel Supply no longer supplies motor fuel. The purpose of the refund payment was to make us whole for the decrease in the value of our interest in CST Fuel Supply arising from sales volume decreases. The total refund payment received by the Partnership, as approved by the conflicts committee of the Board, was approximately $18.2 million ($17.5 million in cash with the remainder in common units owned by CST) and was accounted for as a contribution to equity.
Purchase of Motor Fuel from Circle K
We purchase the fuel supplied to 101 sites acquired in the Jet-Pep Assets acquisition from a terminal owned and operated by Circle K. We purchased $11.3 million of motor fuel from Circle K in 2017.
In connection with the December 15, 2017 closing of Circle K’s acquisition of Holiday, we also purchased fuel from Circle K to supply our Holiday-branded sites. For 2017, these purchases amounted to $1.9 million.
Purchase of Wholesale Fuel Supply Contracts from CST
In February 2016, we purchased 21 independent dealer contracts and 11 sub-wholesaler contracts from CST for $2.9 million with historic annual volumes of approximately 20 million gallons. This transaction was approved on our behalf by the conflicts committee of the Board.
We purchase the fuel supplied to these 32 sites from CST Fuel Supply, in which we own a 17.5% interest, and resell the wholesale motor fuel to the independent dealers and sub-wholesalers. We purchased $23.8 million and $20.4 million of motor fuel from CST Fuel Supply in 2017 and 2016, respectively.
Agreements with DMI and Affiliates
DMI is affiliated with our former President and Chief Executive Officer and current director of the Board, Mr. Topper.
Lease Agreements for our Principal Executive Offices
Our principal executive offices are in Allentown, Pennsylvania. Through February 2016, we subleased office space from CST that CST leased from DMI. Since February 2016, we have subleased office space from Circle K that Circle K leased from an affiliate of John B. Reilly, III, a director of our Board. The management fee charged by Circle K to the Partnership, under the Amended Omnibus Agreement, incorporates this rental expense, and amounted to $0.7 million and $0.6 million for 2017 and 2016, respectively.
130
DMS is affiliated with our former President and Chief Executive Officer and current director of the Board, Mr. Topper.
DMS is an operator of convenience stores that purchases substantially all of its motor fuel requirements from us on a wholesale basis. DMS also leases certain retail site real estate from us in accordance with a master lease agreement.
Revenues from fuel sales and rental income from DMS and its affiliates were as follows (in thousands):
|
|
|
For the Year Ended December 31, |
|
|||||
|
|
|
2017 |
|
|
2016 |
|
||
|
Revenues from motor fuel sales to DMS and its affiliates |
|
$ |
241,895 |
|
|
$ |
254,292 |
|
|
Rental income from DMS and its affiliates |
|
|
18,753 |
|
|
|
21,208 |
|
Motor fuel is sold to DMS at our cost plus a fixed mark-up per gallon. Receivables from DMS totaled $9.3 million and $8.6 million at December 31, 2017 and 2016, respectively.
Wholesale Fuel Supply Agreement with DMS
In connection with the IPO, the Partnership and DMS entered into a PMPA Franchise Agreement pursuant to which the Partnership is the exclusive distributor of motor fuel to all sites operated by DMS for a period of 15 years. We have the right to impose the brand of fuel that is distributed to DMS. There are no minimum volume requirements that DMS is required to satisfy. We charged DMS rack-plus prices for each grade of product in effect at the time title to the product passes to DMS. We have a right of first refusal in connection with any proposed transfer by DMS of its interest in the wholesale supply agreement. The wholesale supply agreement contains cross-default provisions with each lease agreement with DMS.
Lease Agreement with DMS
On May 28, 2014, we entered into a master lease agreement with DMS, with an effective date of June 1, 2014, which consolidated multiple individual leases then in effect between DMS and the Partnership into a single master lease agreement.
In November 2017, we entered into an amendment of the master lease with DMS that extended the date through which certain retail sites may be removed from the lease by one year to December 2018.
Maintenance and Environmental Costs
Certain maintenance and environmental monitoring and remediation activities are undertaken by Synergy Environmental, Inc., an entity affiliated with Mr. Topper as approved by the conflicts committee of the Board. We paid $1.5 million and $1.6 million to this related party for 2017 and 2016, respectively. Accounts payable to this related party amounted to $0.2 million at December 31, 2017.
Other Related Party Transactions
Lease and Supply Agreements with other Related Parties
The Partnership leases certain motor fuel stations to Top Star, a related party of Mr. Topper, under cancelable operating leases. Rent income under these agreements was $0.5 million for 2017 and 2016.
The Partnership leases certain motor fuel stations from related parties of Mr. Topper, under cancelable operating leases. Rent expense under these agreements was $0.9 million for 2017 and 2016.
Review, Approval and Ratification of Related Person Transactions
The Board has adopted a Code of Ethics and Business Conduct that provides that the Board or its authorized committee will periodically review all related person transactions that are required to be disclosed under SEC rules and, when appropriate, initially authorize or ratify all such transactions. In the event that the Board or its authorized committee considers ratification of a related person transaction and determines not to so ratify, the Code of Ethics and Business Conduct provides that our management will make all reasonable efforts to cancel or annul the transaction.
131
The Code of Ethics and Business Conduct provides that, in determining whether or not to recommend the initial approval or ratification of a related person transaction, the Board or its authorized committee should consider all of the relevant facts and circumstances available, including (if applicable) but not limited to: (i) whether there is an appropriate business justification for the transaction; (ii) the benefits that accrue to us as a result of the transaction; (iii) the terms available to unrelated third parties entering into similar transactions; (iv) the impact of the transaction on a director’s independence (in the event the related person is a director, an immediate family member of a director or an entity in which a director or an immediately family member of a director is a partner, shareholder, member or executive officer); (v) the availability of other sources for comparable products or services; (vi) whether it is a single transaction or a series of ongoing, related transactions; and (vii) whether entering into the transaction would be consistent with the Code of Ethics and Business Conduct.
Director Independence
For a discussion of the independence of the Board, please see “Item 10. Directors, Executive Officers and Corporate Governance Management.”
ITEM 14. PRINCIPAL ACCOUNTANT FEES AND SERVICES
The audit committee of the board of directors of our General Partner selected Grant Thornton LLP, or Grant Thornton, an independent registered public accounting firm, to audit our consolidated financial statements for the year ended December 31, 2017. The audit committee’s charter requires the audit committee to approve in advance all audit and non-audit services to be provided by our independent registered public accounting firm. All services reported in the audit, audit-related, tax and all other fees categories below with respect to this Annual Report on Form 10-K for the year ended December 31, 2017 were approved by the audit committee.
The following table summarizes the aggregate Grant Thornton fees that were allocated to us for independent auditing, tax and related services for each of the last two fiscal years (in thousands):
|
|
|
Year Ended December 31, |
|
|||||
|
|
|
2017 |
|
|
2016 |
|
||
|
Audit fees (1) |
|
$ |
1,133 |
|
|
$ |
1,334 |
|
|
Audit-related fees (2) |
|
|
— |
|
|
|
— |
|
|
Tax fees (3) |
|
|
— |
|
|
|
— |
|
|
All other fees (4) |
|
|
— |
|
|
|
— |
|
|
Total |
|
$ |
1,133 |
|
|
$ |
1,334 |
|
|
(1) |
Audit fees represent amounts billed for each of the years presented for professional services rendered in connection with those services normally provided in connection with statutory and regulatory filings or engagements including comfort letters, consents and other services related to SEC matters. |
|
(2) |
Audit-related fees represent amounts billed in each of the years presented for assurance and related services that are reasonably related to the performance of the annual audit or quarterly reviews. |
|
(3) |
Tax fees represent amounts billed in each of the years presented for professional services rendered in connection with tax compliance, tax advice and tax planning. |
|
(4) |
All other fees represent amounts billed in each of the years presented for services not classifiable under the other categories listed in the table above. No such services were rendered by Grant Thornton during 2017 or 2016. |
Audit Committee Approval of Audit and Non-audit Services
The audit committee of the board of directors of our General Partner has adopted a pre-approval policy with respect to services which may be performed by Grant Thornton. This policy lists specific audit-related services as well as any other services that Grant Thornton is authorized to perform and sets out specific dollar limits for each specific service, which may not be exceeded without additional audit committee authorization. The audit committee reviews the policy at least annually in order to approve services and limits for the current year. Any service that is not clearly enumerated in the policy must receive specific pre-approval by the audit committee prior to engagement.
132
ITEM 15. EXHIBITS AND FINANCIAL STATEMENT SCHEDULES
|
|
(a) |
1. Financial Statements. The following consolidated financial statements of CrossAmerica Partners, LP are included in Part II, Item 8 of this Form 10-K: |
2. Financial Statement Schedules and Other Financial Information. No financial statement schedules are submitted because either they are inapplicable or because the required information is included in the financial statements or notes thereto.
3. EXHIBITS. Filed as part of this Form 10-K are the following exhibits:
|
Exhibit No. |
|
Description |
|
2.1 |
|
|
|
|
|
|
|
2.2 |
|
|
|
|
|
|
|
2.3 |
|
|
|
|
|
|
|
2.4 |
|
|
|
|
|
|
|
2.5 |
|
|
|
|
|
|
|
3.1 |
|
|
|
|
|
|
|
3.2 |
|
|
|
|
|
|
|
3.3 |
|
|
|
|
|
|
|
3.4 |
|
|
|
|
|
|
133
|
Exhibit No. |
|
Description |
|
|
||
|
|
|
|
|
10.1 |
|
|
|
|
|
|
|
10.2 |
|
|
|
|
|
|
|
10.3 |
|
|
|
|
|
|
|
10.4 |
|
|
|
|
|
|
|
10.5 |
|
|
|
|
|
|
|
10.6 |
|
|
|
|
|
|
|
10.7 |
|
|
|
|
|
|
|
10.8 |
|
|
|
|
|
|
|
10.9 |
|
|
|
|
|
|
|
10.10 |
|
|
|
|
|
|
|
10.11 |
|
|
|
|
|
|
134
|
Exhibit No. |
|
Description |
|
|
||
|
|
|
|
|
10.13 |
|
|
|
|
|
|
|
10.14 |
|
|
|
|
|
|
|
10.15 |
|
|
|
|
|
|
|
10.16 |
|
|
|
|
|
|
|
10.17 |
|
|
|
|
|
|
|
10.18 |
|
|
|
|
|
|
|
10.19 |
|
|
|
|
|
|
|
10.20 |
|
|
|
|
|
|
|
10.21 |
|
|
|
|
|
|
|
10.22 |
|
|
|
|
|
|
|
10.23 |
|
|
|
|
|
|
|
10.24 |
|
|
|
|
|
|
|
10.25 |
|
|
|
|
|
|
|
10.26 |
|
|
|
|
|
|
|
10.27 |
|
135
|
Exhibit No. |
|
Description |
|
|
|
|
|
10.28 |
|
|
|
|
|
|
|
10.29 |
|
|
|
|
|
|
|
10.30 |
|
|
|
|
|
|
|
21.1 * |
|
|
|
|
|
|
|
23.1 * |
|
|
|
|
|
|
|
31.1 * |
|
|
|
|
|
|
|
31.2 * |
|
|
|
|
|
|
|
32.1*† |
|
Certification of Principal Executive Officer of CrossAmerica GP LLC pursuant to 18 U.S.C. §1350 |
|
|
|
|
|
32.2*† |
|
Certification of Principal Financial Officer of CrossAmerica GP LLC pursuant to 18 U.S.C. §1350 |
|
|
|
|
|
101.INS * |
|
XBRL Instance Document |
|
|
|
|
|
101.SCH * |
|
XBRL Taxonomy Extension Schema Document |
|
|
|
|
|
101.CAL * |
|
XBRL Taxonomy Extension Calculation Linkbase Document |
|
|
|
|
|
101.LAB * |
|
XBRL Taxonomy Extension Label Linkbase Document |
|
|
|
|
|
101.PRE * |
|
XBRL Taxonomy Extension Presentation Linkbase Document |
|
|
|
|
|
101.DEF * |
|
XBRL Taxonomy Extension Definition Linkbase Document |
|
* |
Filed herewith |
|
† |
Not considered to be “filed” for purposes of Section 18 of the Securities Exchange Act of 1934 or otherwise subject to the liabilities of that section. |
136
Pursuant to the requirements of Section 13 or 15(d) of the Securities Exchange Act of 1934, the registrant has duly caused this report to be signed on its behalf by the undersigned, thereunto duly authorized.
|
CROSSAMERICA PARTNERS LP |
||
|
|
|
|
|
By: |
|
CROSSAMERICA GP LLC, its General Partner |
|
|
|
|
|
By: |
|
/s/ Jeremy L. Bergeron |
|
|
|
Jeremy L. Bergeron |
|
|
|
President |
|
|
|
(On behalf of the registrant, and in the capacity of Principal Executive Officer) |
Date: February 26, 2018
Pursuant to the requirements of the Securities Exchange Act of 1934, this report has been signed below by the following persons on behalf of the registrant and in the capacities indicated on February 26, 2018.
|
Signature |
|
Title |
|
|
|
|
|
/s/ Timothy A. Miller |
|
Chairman of the Board of Directors |
|
Timothy A. Miller |
|
|
|
/s/ Jeremy L. Bergeron |
|
President, Chief Executive Officer and Director (Principal Executive Officer) |
|
Jeremy L. Bergeron |
|
|
|
/s/ Evan W. Smith |
|
Vice President of Finance and Chief Financial Officer (Principal Financial and Accounting Officer) |
|
Evan W. Smith |
|
|
|
|
|
|
|
/s/ Jean Bernier |
|
Director |
|
Jean Bernier |
|
|
|
|
|
|
|
/s/ Justin A. Gannon |
|
Director |
|
Justin A. Gannon |
|
|
|
|
|
|
|
/s/ Mickey Kim |
|
Director |
|
Mickey Kim |
|
|
|
|
|
|
|
/s/ John B. Reilly, III |
|
Director |
|
John B. Reilly, III |
|
|
|
|
|
|
|
/s/ Claude Tessier |
|
Director |
|
Claude Tessier |
|
|
|
|
|
|
|
/s/ Joseph V. Topper, Jr. |
|
Director |
|
Joseph V. Topper, Jr. |
|
|
137