Attached files
| file | filename |
|---|---|
| 8-K - 8-K - AES CORP | q42017earningsrelease-form.htm |

Press Release
Investor Contact: Ahmed Pasha 703-682-6451
Media Contact: Amy Ackerman 703-682-6399
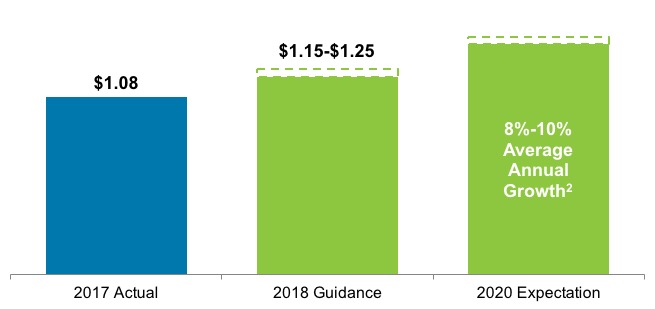
AES Continues to Transform and Simplify; Achieved 2017 Guidance and Initiates 2018 Adjusted EPS Guidance of $1.15 to $1.25
Strategic Highlights
• | Reshaping the portfolio to deliver attractive returns and reduce carbon emissions |
◦ | In 2017, acquired 2.3 GW of renewables and announced the exit of 4.3 GW of coal-fired generation |
◦ | Establishing a goal to reduce carbon intensity (tons of carbon dioxide/MWh) by 50% from 2016 to 2030 |
◦ | On track to achieve investment grade credit metrics in 2019 |
• | Maximizing efficiency with a new organizational structure yielding $100 million in incremental cost savings |
• | Improving clarity in financial results by reclassifying Eletropaulo, a utility in Brazil, as discontinued operations |
• | Reaffirming expectation for 8% to 10% average annual growth in Adjusted EPS through 2020 |
2017 Financial Results
• | Diluted EPS of ($0.77), primarily driven by a one-time non-cash charge of $1.08 related to the enactment of the U.S. Tax Cuts and Jobs Act |
• | Adjusted EPS of $1.08, compared to guidance of $1.00 to $1.10 |
ARLINGTON, Va., February 27, 2018 – The AES Corporation (NYSE: AES) today reported financial results for the year ended December 31, 2017.
Full year 2017 Diluted Earnings Per Share from Continuing Operations (Diluted EPS) was $0.77, a decrease of $0.73 compared to full year 2016, reflecting a one-time non-cash charge on deemed repatriation of foreign earnings, resulting from the enactment of the U.S. Tax Cuts and Jobs Act in the fourth quarter of 2017. This impact was partially offset by lower impairment expense.
Full year 2017 Adjusted Earnings Per Share (Adjusted EPS, a non-GAAP financial measure) increased $0.14 to $1.08, primarily driven by higher margins, particularly at the Company's Mexico, Central America and the Caribbean (MCAC) Strategic Business Unit (SBU), and contributions from new businesses, including sPower in the United States.
Consolidated Net Cash Provided by Operating Activities for full year 2017 was $2,489 million, a decrease of $395 million compared to full year 2016. This decrease was primarily driven by the large receivables collection in 2016 at Maritza in Bulgaria, which was partially offset by higher margins. Full year 2017 Consolidated Free Cash Flow (a non-GAAP financial measure) decreased $323 million to $1,921 million compared to full year 2016, primarily due to the same drivers as Consolidated Net Cash Provided by Operating Activities.
"In 2017 we achieved our financial guidance for all metrics and made further progress on our strategic objectives," said Andrés Gluski, AES President and Chief Executive Officer. "We accelerated the transformation of our portfolio by exiting 4.3 GW of merchant coal-fired capacity and acquiring 2.3 GW of long-term contracted renewables earning attractive returns. We also launched Fluence, our joint venture with Siemens, to market our proprietary Advancion energy storage solution in 160 countries. At AES, we are well positioned to deliver sustainable and attractive returns to our shareholders, while reducing our carbon intensity by 50% from 2016 to 2030."
"This year, we will prepay $1 billion in Parent debt, putting us on track to achieve investment grade credit metrics in 2019, one year ahead of our prior plan," said Tom O'Flynn, AES Executive Vice President and Chief Financial Officer. "As a result of our recently announced restructuring, we expect to achieve an additional $100 million in annual cost savings, strengthening our ability to deliver on our 8% to 10% average annual growth rate in Adjusted EPS and Parent Free Cash Flow through 2020."
Key Financial Results
Fourth Quarter | Full Year | Full Year 2017 Guidance | |||||||||||||
$ in Millions, Except Per Share Amounts | 2017 | 2016 | 2017 | 2016 | |||||||||||
Diluted Loss per Share from Continuing Operations | $ | (1.03 | ) | $ | (0.35 | ) | $ | (0.77 | ) | $ | (0.04 | ) | N/A | ||
Adjusted EPS1 | $ | 0.43 | $ | 0.30 | $ | 1.08 | $ | 0.94 | $1.00-$1.10 | ||||||
Consolidated Net Cash Provided by Operating Activities | $ | 800 | $ | 702 | $ | 2,489 | $ | 2,884 | $2,000-$2,800 | ||||||
Consolidated Free Cash Flow 1 | $ | 668 | $ | 535 | 1,921 | 2,244 | $1,400-$2,000 | ||||||||
1 | A non-GAAP financial measure. See “Non-GAAP Financial Measures” for definitions and reconciliations to the most comparable GAAP financial measures. |
Guidance and Expectations
The Company is issuing 2018 Adjusted EPS guidance of $1.15 to $1.25 and reaffirming its average annual growth rate target of 8% to 10% through 2020. Year-over-year growth in 2018 is primarily driven by contributions from new businesses, cost savings and lower Parent interest.
Adjusted EPS1 Guidance and Expectations
1 | A non-GAAP financial measure. See “Non-GAAP Financial Measures” for definitions and reconciliations to the most comparable GAAP financial measures. |
2 | From 2017 Adjusted EPS of $1.08, in line with prior expectation for 8% to 10% average annual growth through 2020 from the mid-point of 2016 Adjusted EPS guidance of $0.95 to $1.05. |
The Company will no longer provide guidance for Consolidated Free Cash Flow, as this metric does not accurately reflect the Company's ownership interest in the underlying businesses given the high level of cash flow attributable to noncontrolling interest. The Company believes that Parent Free Cash Flow (a non-GAAP financial metric) is the most appropriate metric to reflect its ability to achieve its financial goals, including strengthening its balance sheet and delivering value to shareholders.
For 2018, the Company expects Parent Free Cash Flow of $600 million to $675 million. Relatively flat expectations for 2018 reflect lower expected distributions from AES Gener, to ensure the maintenance of its investment grade rating, as well as severance payments associated with incremental cost savings. However, the Company expects to achieve higher Parent Free Cash Flow in 2019 and 2020, to deliver 8% to 10% average annual growth in Parent Free Cash Flow through 2020 from the Company's 2017 Parent Free Cash Flow of $637 million.
The Company's 2018 guidance and expectations through 2020 are based on foreign currency and commodity forward curves as of December 31, 2017.
Strategic Highlights
• | In February 2018, the Company announced a reorganization as a part of its on-going strategy to simplify its portfolio and optimize its cost structure. |
◦ | The reorganization will result in an additional $100 million in annual cost savings to be realized through 2019. In the fourth quarter of 2017, the Company recorded $31 million in restructuring costs associated with these savings. These restructuring costs were excluded from Adjusted EPS. |
• | In the fourth quarter of 2017, the Company reclassified Eletropaulo, the Brazilian utility in which AES has a 17% economic interest, as discontinued operations. In 2017, Eletropaulo generated revenue of $3.3 billion and net income from operations of $3 million. |
• | The Company is establishing a goal to reduce its carbon intensity (tons of carbon dioxide/MWh) by 50% from 2016 to 2030. The Company has already taken steps that are expected to reduce its carbon intensity by 25%, or 20 million tons of carbon dioxide emissions, from 2016 to 2020, including: |
◦ | In 2017, the Company announced the sale or retirement of 4,322 MW of merchant coal-fired generation, representing 37% of the Company's coal-fired capacity. |
▪ | This includes the sales of 1,743 MW in Kazakhstan, 739 MW at DPL in Ohio and 630 MW in the Philippines and the retirement of an additional 1,210 MW at DPL. |
◦ | In 2017, the Company acquired 2,307 MW of renewable generation capacity with long-term contracts in the United States, Brazil and Mexico. |
▪ | This includes 1,445 MW of solar generation, primarily from the 1,145 MW sPower portfolio (US), and 862 MW of wind capacity in Brazil and Mexico. |
◦ | The Company currently has 4,401 MW of capacity under construction and expected to come on-line through 2021. |
▪ | In 2017, completed construction of 279 MW of solar, natural gas and energy storage capacity in the Dominican Republic and the United States. |
◦ | In January 2018, AES and Siemens completed the formation of the Fluence energy storage joint venture. |
◦ | In 2018, sPower signed long-term Power Purchase Agreements (PPA) for 582 MW of solar and wind to be completed in 2019 and 2020. |
Non-GAAP Financial Measures
See Non-GAAP Financial Measures for definitions of Adjusted Earnings Per Share, Adjusted Pre-Tax Contributions and Consolidated Free Cash Flow, as well as reconciliations to the most comparable GAAP financial measures.
Attachments
Condensed Consolidated Statements of Operations, Segment Information, Condensed Consolidated Balance Sheets, Condensed Consolidated Statements of Cash Flows, Non-GAAP Financial Measures, Parent Financial Information, 2017 Financial Guidance Elements and 2018 Financial Guidance Elements.
Conference Call Information
AES will host a conference call on Tuesday, February 27, 2018 at 9:00 a.m. Eastern Standard Time (EST). Interested parties may listen to the teleconference by dialing 1-888-317-6003 at least ten minutes before the start of the call. International callers should dial +1-412-317-6061. The Conference ID for this call is 7348000. Internet access to the conference call and presentation materials will be available on the AES website at www.aes.com by selecting “Investors” and then “Presentations and Webcasts.”
A webcast replay, as well as a replay in downloadable MP3 format, will be accessible at www.aes.com beginning shortly after the completion of the call.
About AES
The AES Corporation (NYSE: AES) is a Fortune 200 global power company. We provide affordable, sustainable energy to 15 countries through our diverse portfolio of distribution businesses as well as thermal and renewable generation facilities. Our workforce is committed to operational excellence and meeting the world’s changing power needs. Our 2017 revenues were $11 billion and we own and manage $33 billion in total assets. To learn more, please visit www.aes.com. Follow AES on Twitter @TheAESCorp.
Safe Harbor Disclosure
This news release contains forward-looking statements within the meaning of the Securities Act of 1933 and of the Securities Exchange Act of 1934. Such forward-looking statements include, but are not limited to, those related to future earnings, growth and financial and operating performance. Forward-looking statements are not intended to be a guarantee of future results, but instead constitute AES’ current expectations based on reasonable assumptions. Forecasted financial information is based on certain material assumptions. These assumptions include, but are not limited to, our accurate projections of future interest rates, commodity price and foreign currency pricing, continued normal levels of operating performance and electricity volume at our distribution companies and operational performance at our generation businesses consistent with historical levels, as well as achievements of planned productivity improvements and incremental growth investments at normalized investment levels and rates of return consistent with prior experience.
Actual results could differ materially from those projected in our forward-looking statements due to risks, uncertainties and other factors. Important factors that could affect actual results are discussed in AES’ filings with the Securities and Exchange Commission (the “SEC”), including, but not limited to, the risks discussed under Item 1A “Risk Factors” and Item 7: Management’s Discussion & Analysis in AES’ 2017 Annual Report on Form 10-K and in subsequent reports filed with the SEC. Readers are encouraged to read AES’ filings to learn more about the risk factors associated with AES’ business. AES undertakes no obligation to update or revise any forward-looking statements, whether as a result of new information, future events or otherwise.
Any Stockholder who desires a copy of the Company’s 2017 Annual Report on Form 10-K dated on or about February 27, 2018 with the SEC may obtain a copy (excluding Exhibits) without charge by addressing a request to the Office of the Corporate Secretary, The AES Corporation, 4300 Wilson Boulevard, Arlington, Virginia 22203. Exhibits also may be requested, but a charge equal to the reproduction cost thereof will be made. A copy of the Form 10-K may be obtained by visiting the Company’s website at www.aes.com.
#
THE AES CORPORATION
Condensed Consolidated Statements of Operations (Unaudited)
Year Ended December 31, | ||||||||||||
2017 | 2016 | 2015 | ||||||||||
(in millions, except per share amounts) | ||||||||||||
Revenue: | ||||||||||||
Regulated | $ | 3,109 | $ | 3,310 | $ | 3,240 | ||||||
Non-Regulated | 7,421 | 6,971 | 8,020 | |||||||||
Total revenue | 10,530 | 10,281 | 11,260 | |||||||||
Cost of Sales: | ||||||||||||
Regulated | (2,656 | ) | (2,844 | ) | (3,074 | ) | ||||||
Non-Regulated | (5,410 | ) | (5,057 | ) | (5,523 | ) | ||||||
Total cost of sales | (8,066 | ) | (7,901 | ) | (8,597 | ) | ||||||
Operating margin | 2,464 | 2,380 | 2,663 | |||||||||
General and administrative expenses | (215 | ) | (194 | ) | (196 | ) | ||||||
Interest expense | (1,170 | ) | (1,134 | ) | (1,145 | ) | ||||||
Interest income | 244 | 245 | 256 | |||||||||
Loss on extinguishment of debt | (68 | ) | (13 | ) | (182 | ) | ||||||
Other expense | (57 | ) | (79 | ) | (24 | ) | ||||||
Other income | 120 | 64 | 84 | |||||||||
Gain (loss) on disposal and sale of businesses | (52 | ) | 29 | 29 | ||||||||
Goodwill impairment expense | — | — | (317 | ) | ||||||||
Asset impairment expense | (537 | ) | (1,096 | ) | (285 | ) | ||||||
Foreign currency transaction gains (losses) | 42 | (15 | ) | 106 | ||||||||
INCOME FROM CONTINUING OPERATIONS BEFORE TAXES AND EQUITY IN EARNINGS OF AFFILIATES | 771 | 187 | 989 | |||||||||
Income tax expense | (990 | ) | (32 | ) | (412 | ) | ||||||
Net equity in earnings of affiliates | 71 | 36 | 105 | |||||||||
INCOME (LOSS) FROM CONTINUING OPERATIONS | (148 | ) | 191 | 682 | ||||||||
Income (loss) from operations of discontinued businesses, net of income tax benefit (expense) of $(21), $229, and $(53), respectively | (18 | ) | 151 | 80 | ||||||||
Net loss from disposal and impairments of discontinued businesses, net of income tax benefit of $0, $266, and $0, respectively | (611 | ) | (1,119 | ) | — | |||||||
NET INCOME (LOSS) | (777 | ) | (777 | ) | 762 | |||||||
Less: Income from continuing operations attributable to noncontrolling interests and redeemable stock of subsidiaries | (359 | ) | (211 | ) | (364 | ) | ||||||
Less: Income from discontinued operations attributable to noncontrolling interests | (25 | ) | (142 | ) | (92 | ) | ||||||
NET INCOME (LOSS) ATTRIBUTABLE TO THE AES CORPORATION | $ | (1,161 | ) | $ | (1,130 | ) | $ | 306 | ||||
AMOUNTS ATTRIBUTABLE TO THE AES CORPORATION COMMON STOCKHOLDERS: | ||||||||||||
Income (loss) from continuing operations, net of tax | $ | (507 | ) | $ | (20 | ) | $ | 318 | ||||
Loss from discontinued operations, net of tax | (654 | ) | (1,110 | ) | (12 | ) | ||||||
NET INCOME (LOSS) ATTRIBUTABLE TO THE AES CORPORATION | $ | (1,161 | ) | $ | (1,130 | ) | $ | 306 | ||||
BASIC EARNINGS PER SHARE: | ||||||||||||
Income (loss) from continuing operations attributable to The AES Corporation common stockholders, net of tax | $ | (0.77 | ) | $ | (0.04 | ) | $ | 0.46 | ||||
Loss from discontinued operations attributable to The AES Corporation common stockholders, net of tax | (0.99 | ) | (1.68 | ) | (0.01 | ) | ||||||
NET INCOME (LOSS) ATTRIBUTABLE TO THE AES CORPORATION COMMON STOCKHOLDERS | $ | (1.76 | ) | $ | (1.72 | ) | $ | 0.45 | ||||
DILUTED EARNINGS PER SHARE: | ||||||||||||
Income (loss) from continuing operations attributable to The AES Corporation common stockholders, net of tax | $ | (0.77 | ) | $ | (0.04 | ) | $ | 0.46 | ||||
Loss from discontinued operations attributable to The AES Corporation common stockholders, net of tax | (0.99 | ) | (1.68 | ) | (0.02 | ) | ||||||
NET INCOME (LOSS) ATTRIBUTABLE TO THE AES CORPORATION COMMON STOCKHOLDERS | $ | (1.76 | ) | $ | (1.72 | ) | $ | 0.44 | ||||
DIVIDENDS DECLARED PER COMMON SHARE | $ | 0.49 | $ | 0.45 | $ | 0.41 | ||||||
Three Months Ended December 31, | ||||||||
2017 | 2016 | |||||||
(in millions, except per share amounts) | ||||||||
Revenue: | ||||||||
Regulated | $ | 660 | $ | 816 | ||||
Non-Regulated | 1,983 | 1,844 | ||||||
Total revenue | 2,643 | 2,660 | ||||||
Cost of Sales: | ||||||||
Regulated | (553 | ) | (708 | ) | ||||
Non-Regulated | (1,447 | ) | (1,320 | ) | ||||
Total cost of sales | (2,000 | ) | (2,028 | ) | ||||
Operating margin | 643 | 632 | ||||||
General and administrative expenses | (60 | ) | (59 | ) | ||||
Interest expense | (310 | ) | (283 | ) | ||||
Interest income | 59 | 64 | ||||||
Loss on extinguishment of debt | (24 | ) | (1 | ) | ||||
Other expense | 11 | (53 | ) | |||||
Other income | 17 | 21 | ||||||
Gain (loss) on disposal and sale of businesses | (3 | ) | (1 | ) | ||||
Asset impairment expense | (277 | ) | (623 | ) | ||||
Foreign currency transaction gains (losses) | 28 | 1 | ||||||
INCOME FROM CONTINUING OPERATIONS BEFORE TAXES AND EQUITY IN EARNINGS OF AFFILIATES | 84 | (302 | ) | |||||
Income tax expense | (744 | ) | 155 | |||||
Net equity in earnings of affiliates | 38 | 11 | ||||||
INCOME (LOSS) FROM CONTINUING OPERATIONS | (622 | ) | (136 | ) | ||||
Income (loss) from operations of discontinued businesses, net of income tax benefit (expense) of $(21), $229, and $(53), respectively | (53 | ) | 180 | |||||
Net loss from disposal and impairments of discontinued businesses, net of income tax benefit of $0, $266, and $0, respectively | (611 | ) | (737 | ) | ||||
NET INCOME (LOSS) | (1,286 | ) | (693 | ) | ||||
Noncontrolling interests: | ||||||||
Less: Income from continuing operations attributable to noncontrolling interests and redeemable stock of subsidiaries | (61 | ) | (96 | ) | ||||
Less: Income from discontinued operations attributable to noncontrolling interests | 5 | (160 | ) | |||||
NET INCOME (LOSS) ATTRIBUTABLE TO THE AES CORPORATION | $ | (1,342 | ) | $ | (949 | ) | ||
AMOUNTS ATTRIBUTABLE TO THE AES CORPORATION COMMON STOCKHOLDERS: | ||||||||
Income (loss) from continuing operations, net of tax | $ | (683 | ) | $ | (232 | ) | ||
Loss from discontinued operations, net of tax | (659 | ) | (717 | ) | ||||
NET INCOME (LOSS) ATTRIBUTABLE TO THE AES CORPORATION | $ | (1,342 | ) | $ | (949 | ) | ||
BASIC EARNINGS PER SHARE: | ||||||||
Income (loss) from continuing operations attributable to The AES Corporation common stockholders, net of tax | $ | (1.03 | ) | $ | (0.35 | ) | ||
Loss from discontinued operations attributable to The AES Corporation common stockholders, net of tax | (1.00 | ) | (1.09 | ) | ||||
NET INCOME (LOSS) ATTRIBUTABLE TO THE AES CORPORATION COMMON STOCKHOLDERS | $ | (2.03 | ) | $ | (1.44 | ) | ||
DILUTED EARNINGS PER SHARE: | ||||||||
Income (loss) from continuing operations attributable to The AES Corporation common stockholders, net of tax | $ | (1.03 | ) | $ | (0.35 | ) | ||
Loss from discontinued operations attributable to The AES Corporation common stockholders, net of tax | (1.00 | ) | (1.09 | ) | ||||
NET INCOME (LOSS) ATTRIBUTABLE TO THE AES CORPORATION COMMON STOCKHOLDERS | $ | (2.03 | ) | $ | (1.44 | ) | ||
DIVIDENDS DECLARED PER COMMON SHARE | $ | 0.25 | $ | 0.23 | ||||
THE AES CORPORATION | |||||||||||||||
Strategic Business Unit (SBU) Information | |||||||||||||||
(Unaudited) | |||||||||||||||
Three Months Ended December 31, | Year Ended December 31, | ||||||||||||||
(in millions) | 2017 | 2016 | 2017 | 2016 | |||||||||||
REVENUE | |||||||||||||||
US | $ | 784 | $ | 847 | $ | 3,229 | $ | 3,429 | |||||||
Andes | 731 | 642 | 2,710 | 2,506 | |||||||||||
Brazil | 144 | 111 | 542 | 450 | |||||||||||
MCAC | 597 | 576 | 2,448 | 2,172 | |||||||||||
Eurasia | 386 | 421 | 1,590 | 1,670 | |||||||||||
Corporate, Other and Inter-SBU eliminations | 1 | 63 | 11 | 54 | |||||||||||
Total Revenue | $ | 2,643 | $ | 2,660 | $ | 10,530 | $ | 10,281 | |||||||
THE AES CORPORATION
Condensed Consolidated Balance Sheets (Unaudited)
December 31, 2017 | December 31, 2016 | ||||||
(in millions, except share and per share data) | |||||||
ASSETS | |||||||
CURRENT ASSETS | |||||||
Cash and cash equivalents | $ | 949 | $ | 1,244 | |||
Restricted cash | 274 | 277 | |||||
Short-term investments | 424 | 530 | |||||
Accounts receivable, net of allowance for doubtful accounts of $10 and $17, respectively | 1,463 | 1,421 | |||||
Inventory | 562 | 622 | |||||
Prepaid expenses | 62 | 72 | |||||
Other current assets | 630 | 657 | |||||
Current assets of discontinued operations and held-for-sale businesses | 2,034 | 1,593 | |||||
Total current assets | 6,398 | 6,416 | |||||
NONCURRENT ASSETS | |||||||
Property, Plant and Equipment: | |||||||
Land | 502 | 518 | |||||
Electric generation, distribution assets and other | 24,119 | 24,911 | |||||
Accumulated depreciation | (7,942 | ) | (7,919 | ) | |||
Construction in progress | 3,617 | 2,905 | |||||
Property, plant and equipment, net | 20,296 | 20,415 | |||||
Other Assets: | |||||||
Investments in and advances to affiliates | 1,197 | 621 | |||||
Debt service reserves and other deposits | 565 | 438 | |||||
Goodwill | 1,059 | 1,157 | |||||
Other intangible assets, net of accumulated amortization of $441 and $399, respectively | 366 | 287 | |||||
Deferred income taxes | 130 | 227 | |||||
Service concession assets, net of accumulated amortization of $206 and $114, respectively | 1,360 | 1,445 | |||||
Other noncurrent assets | 1,741 | 1,775 | |||||
Noncurrent assets of discontinued operations and held-for-sale businesses | — | 3,343 | |||||
Total other assets | 6,418 | 9,293 | |||||
TOTAL ASSETS | $ | 33,112 | $ | 36,124 | |||
LIABILITIES AND EQUITY | |||||||
CURRENT LIABILITIES | |||||||
Accounts payable | $ | 1,371 | $ | 1,238 | |||
Accrued interest | 228 | 216 | |||||
Accrued and other liabilities | 1,232 | 1,117 | |||||
Non-recourse debt, including $1,012 and $273, respectively, related to variable interest entities | 2,164 | 1,052 | |||||
Current liabilities of discontinued operations and held-for-sale businesses | 1,033 | 1,654 | |||||
Total current liabilities | 6,028 | 5,277 | |||||
NONCURRENT LIABILITIES | |||||||
Recourse debt | 4,625 | 4,671 | |||||
Non-recourse debt, including $1,358 and $1,502 respectively, related to variable interest entities | 13,176 | 13,731 | |||||
Deferred income taxes | 1,006 | 804 | |||||
Pension and other postretirement liabilities | 230 | 237 | |||||
Other noncurrent liabilities | 2,365 | 2,327 | |||||
Noncurrent liabilities of discontinued operations and held-for-sale businesses | — | 2,595 | |||||
Total noncurrent liabilities | 21,402 | 24,365 | |||||
Commitments and Contingencies | |||||||
Redeemable stock of subsidiaries | 837 | 782 | |||||
EQUITY | |||||||
THE AES CORPORATION STOCKHOLDERS’ EQUITY | |||||||
Common stock ($0.01 par value, 1,200,000,000 shares authorized; 816,312,913 issued and 660,388,128 outstanding at December 31, 2017 and 816,061,123 issued and 659,182,232 outstanding at December 31, 2016) | 8 | 8 | |||||
Additional paid-in capital | 8,501 | 8,592 | |||||
Accumulated deficit | (2,276 | ) | (1,146 | ) | |||
Accumulated other comprehensive loss | (1,876 | ) | (2,756 | ) | |||
Treasury stock, at cost (155,924,785 and 156,878,891 shares at December 31, 2017 and 2016, respectively) | (1,892 | ) | (1,904 | ) | |||
Total AES Corporation stockholders’ equity | 2,465 | 2,794 | |||||
NONCONTROLLING INTERESTS | 2,380 | 2,906 | |||||
Total equity | 4,845 | 5,700 | |||||
TOTAL LIABILITIES AND EQUITY | $ | 33,112 | $ | 36,124 | |||
THE AES CORPORATION
Condensed Consolidated Statements of Cash Flows
(Unaudited)
Three Months Ended December 31, | Year Ended December 31, | ||||||||||||||
2017 | 2016 | 2017 | 2016 | ||||||||||||
OPERATING ACTIVITIES: | (in millions) | (in millions) | |||||||||||||
Net income (loss) | $ | (1,286 | ) | $ | (693 | ) | $ | (777 | ) | $ | (777 | ) | |||
Adjustments to net income (loss): | |||||||||||||||
Depreciation and amortization | 285 | 299 | 1,169 | 1,176 | |||||||||||
Loss (gain) on sales and disposals of businesses | 3 | 1 | 52 | (29 | ) | ||||||||||
Impairment expenses | 277 | 623 | 537 | 1,098 | |||||||||||
Deferred income taxes | 675 | (318 | ) | 672 | (793 | ) | |||||||||
Provisions for (reversals of) contingencies | 4 | 20 | 34 | 48 | |||||||||||
Loss on extinguishment of debt | 24 | 8 | 68 | 20 | |||||||||||
Loss on sale and disposal of assets | 9 | 12 | 43 | 38 | |||||||||||
Net loss from disposal and impairments of discontinued businesses | 611 | 600 | 611 | 1,383 | |||||||||||
Other | 85 | 62 | 146 | 168 | |||||||||||
Changes in operating assets and liabilities: | |||||||||||||||
(Increase) decrease in accounts receivable | 102 | (98 | ) | (177 | ) | 237 | |||||||||
(Increase) decrease in inventory | 38 | 6 | (28 | ) | 42 | ||||||||||
(Increase) decrease in prepaid expenses and other current assets | (33 | ) | 200 | 107 | 870 | ||||||||||
(Increase) decrease in other assets | (29 | ) | (14 | ) | (295 | ) | (251 | ) | |||||||
Increase (decrease) in accounts payable and other current liabilities | 1 | (53 | ) | 163 | (620 | ) | |||||||||
Increase (decrease) in income tax payables, net and other tax payables | 57 | 71 | 53 | (199 | ) | ||||||||||
Increase (decrease) in other liabilities | (23 | ) | (24 | ) | 111 | 473 | |||||||||
Net cash provided by operating activities | 800 | 702 | 2,489 | 2,884 | |||||||||||
INVESTING ACTIVITIES: | |||||||||||||||
Capital expenditures | (590 | ) | (575 | ) | (2,177 | ) | (2,345 | ) | |||||||
Acquisitions of businesses, net of cash acquired, and equity method investments | (19 | ) | 6 | (625 | ) | (55 | ) | ||||||||
Proceeds from the sale of businesses, net of cash sold, and equity method investments | 69 | 474 | 108 | 631 | |||||||||||
Sale of short-term investments | 598 | 1,157 | 3,540 | 4,904 | |||||||||||
Purchase of short-term investments | (637 | ) | (1,354 | ) | (3,310 | ) | (5,151 | ) | |||||||
Increase in restricted cash, debt service reserves, and other assets | 176 | 62 | (135 | ) | (61 | ) | |||||||||
Contributions to equity investments | (39 | ) | (2 | ) | (89 | ) | (6 | ) | |||||||
Other investing | (25 | ) | (7 | ) | (61 | ) | (25 | ) | |||||||
Net cash used in investing activities | (467 | ) | (239 | ) | (2,749 | ) | (2,108 | ) | |||||||
FINANCING ACTIVITIES: | |||||||||||||||
Borrowings under the revolving credit facilities | 667 | 386 | 2,156 | 1,465 | |||||||||||
Repayments under the revolving credit facilities | (891 | ) | (577 | ) | (1,742 | ) | (1,433 | ) | |||||||
Issuance of recourse debt | — | — | 1,025 | 500 | |||||||||||
Repayments of recourse debt | — | — | (1,353 | ) | (808 | ) | |||||||||
Issuance of non-recourse debt | 519 | 860 | 3,222 | 2,978 | |||||||||||
Repayments of non-recourse debt | (629 | ) | (946 | ) | (2,360 | ) | (2,666 | ) | |||||||
Payments for financing fees | (4 | ) | (19 | ) | (100 | ) | (105 | ) | |||||||
Distributions to noncontrolling interests | (161 | ) | (120 | ) | (424 | ) | (476 | ) | |||||||
Contributions from noncontrolling interests and redeemable security holders | 14 | 36 | 73 | 190 | |||||||||||
Proceeds from the sale of redeemable stock of subsidiaries | — | — | — | 134 | |||||||||||
Dividends paid on AES common stock | (79 | ) | (72 | ) | (317 | ) | (290 | ) | |||||||
Payments for financed capital expenditures | (79 | ) | (5 | ) | (179 | ) | (113 | ) | |||||||
Purchase of treasury stock | — | — | — | (79 | ) | ||||||||||
Proceeds from sales to noncontrolling interests, net of transaction costs | 34 | — | 94 | — | |||||||||||
Other financing | (26 | ) | (32 | ) | (52 | ) | (44 | ) | |||||||
Net cash provided by (used in) financing activities | (635 | ) | (489 | ) | 43 | (747 | ) | ||||||||
Effect of exchange rate changes on cash | (6 | ) | 2 | 3 | 9 | ||||||||||
Decrease (increase) in cash of discontinued operations and held-for-sale businesses | (13 | ) | (10 | ) | (81 | ) | (12 | ) | |||||||
Total increase (decrease) in cash and cash equivalents | (321 | ) | (34 | ) | (295 | ) | 26 | ||||||||
Cash and cash equivalents, beginning | 1,270 | 1,278 | 1,244 | 1,218 | |||||||||||
Cash and cash equivalents, ending | $ | 949 | $ | 1,244 | $ | 949 | $ | 1,244 | |||||||
SUPPLEMENTAL DISCLOSURES: | |||||||||||||||
Cash payments for interest, net of amounts capitalized | $ | 399 | $ | 436 | $ | 1,196 | $ | 1,273 | |||||||
Cash payments for income taxes, net of refunds | $ | 86 | $ | 62 | $ | 377 | $ | 487 | |||||||
SCHEDULE OF NONCASH INVESTING AND FINANCING ACTIVITIES: | |||||||||||||||
Assets acquired through capital lease and other liabilities | $ | — | $ | — | $ | — | $ | 5 | |||||||
Dividends declared but not yet paid | $ | 86 | $ | 174 | $ | 86 | $ | 174 | |||||||
Conversion of Alto Maipo loans and accounts payable into equity | $ | — | $ | — | $ | 279 | $ | — | |||||||
Return Share Transfer Payment due | $ | 75 | $ | — | $ | 75 | $ | — | |||||||
THE AES CORPORATION
NON-GAAP FINANCIAL MEASURES
(Unaudited)
RECONCILIATION OF ADJUSTED PRE-TAX CONTRIBUTION (PTC) AND ADJUSTED EPS
Adjusted PTC is defined as pre-tax income from continuing operations attributable to AES excluding gains or losses of the consolidated entity due to (a) unrealized gains or losses related to derivative transactions; (b) unrealized foreign currency gains or losses; (c) gains, losses and associated benefits and costs due to dispositions and acquisitions of business interests, including early plant closures; (d) losses due to impairments; (e) gains, losses and costs due to the early retirement of debt; and (f) costs directly associated with a major restructuring program, including, but not limited to, workforce reduction efforts, relocations, and office consolidation. Adjusted PTC also includes net equity in earnings of affiliates on an after-tax basis adjusted for the same gains or losses excluded from consolidated entities.
Adjusted EPS is defined as diluted earnings per share from continuing operations excluding gains or losses of both consolidated entities and entities accounted for under the equity method due to (a) unrealized gains or losses related to derivative transactions; (b) unrealized foreign currency gains or losses; (c) gains or losses and associated benefits and costs due to dispositions and acquisitions of business interests, including early plant closures, and the tax impact from the repatriation of sales proceeds; (d) losses due to impairments; (e) gains, losses and costs due to the early retirement of debt; (f) costs directly associated with a major restructuring program, including, but not limited to, workforce reduction efforts, relocations, and office consolidation; and (g) tax benefit or expense related to the enactment effects of 2017 U.S. tax law reform.
The GAAP measure most comparable to Adjusted PTC is income from continuing operations attributable to AES. The GAAP measure most comparable to Adjusted EPS is diluted earnings per share from continuing operations. We believe that Adjusted PTC and Adjusted EPS better reflect the underlying business performance of the Company and are considered in the Company’s internal evaluation of financial performance. Factors in this determination include the variability due to unrealized gains or losses related to derivative transactions, unrealized foreign currency gains or losses, losses due to impairments and strategic decisions to dispose of or acquire business interests, retire debt or implement restructuring initiatives, which affect results in a given period or periods. In addition, for Adjusted PTC, earnings before tax represents the business performance of the Company before the application of statutory income tax rates and tax adjustments, including the effects of tax planning, corresponding to the various jurisdictions in which the Company operates. Adjusted PTC and Adjusted EPS should not be construed as alternatives to income from continuing operations attributable to AES and diluted earnings per share from continuing operations, which are determined in accordance with GAAP.
For the year ending December 31, 2017, the Company changed the definition of Adjusted PTC and Adjusted EPS to exclude (a) associated benefits and costs due to acquisitions, dispositions, and early plant closures; including the tax impact of decisions made at the time of sale to repatriate sales proceeds, and (b) costs directly associated with a major restructuring program, including, but not limited to, workforce reduction efforts, relocations, and office consolidation. We further changed the definition of Adjusted EPS to exclude tax benefit or expense related to the enactment effects of 2017 U.S. tax law reform. We believe excluding these benefits and costs better reflect the business performance by removing the variability caused by strategic decisions to dispose or acquire business interests or close plants early, as well as the costs directly associated with a major restructuring program and the impact of the 2017 U.S. tax law reform. The Company has also reflected these changes in the comparative period.
Reconciliation of GAAP to Non-GAAP Diluted Loss per Share | Three Months Ended December 31, | Year Ended December 31, | |||||||||||||
(in millions, except per share data) | 2017 | 2016 | 2017 | 2016 | |||||||||||
GAAP Diluted Loss per Share from Continuing Operations | $ | (1.03 | ) | $ | (0.35 | ) | $ | (0.77 | ) | $ | (0.04 | ) | |||
Effect of Dilutive Securities | — | — | 0.01 | — | |||||||||||
NON-GAAP Diluted Loss per Share | $ | (1.03 | ) | $ | (0.35 | ) | $ | (0.76 | ) | $ | (0.04 | ) | |||
THE AES CORPORATION
NON-GAAP FINANCIAL MEASURES
(Unaudited)
RECONCILIATION OF ADJUSTED PRE-TAX CONTRIBUTION (PTC) AND ADJUSTED EPS
Three Months Ended December 31, 2017 | Three Months Ended December 31, 2016 | Twelve Months Ended December 31, 2017 | Twelve Months Ended December 31, 2016 | |||||||||||||||||||||||||||||
Net of NCI(1) | Per Share (Diluted) Net of NCI(1) | Net of NCI(1) | Per Share (Diluted) Net of NCI(1) | Net of NCI(1) | Per Share (Diluted) Net of NCI(1) | Net of NCI(1) | Per Share (Diluted) Net of NCI(1) | |||||||||||||||||||||||||
(in millions, except per share amounts) | ||||||||||||||||||||||||||||||||
Loss from continuing operations, net of tax, attributable to AES and Diluted EPS | $ | (683 | ) | $ | (1.03 | ) | $ | (232 | ) | $ | (0.35 | ) | $ | (507 | ) | $ | (0.76 | ) | $ | (20 | ) | $ | (0.04 | ) | ||||||||
Add: Income tax (benefit) expense attributable to AES | 689 | (181 | ) | 828 | (111 | ) | ||||||||||||||||||||||||||
Pre-tax contribution | $ | 6 | $ | (413 | ) | $ | 321 | $ | (131 | ) | ||||||||||||||||||||||
Adjustments | ||||||||||||||||||||||||||||||||
Unrealized derivative (gains) losses | $ | 4 | $ | 0.01 | $ | (10 | ) | $ | (0.02 | ) | $ | (3 | ) | $ | — | $ | (9 | ) | $ | (0.01 | ) | |||||||||||
Unrealized foreign currency (gains) losses | (6 | ) | (0.01 | ) | 10 | 0.01 | (59 | ) | (0.10 | ) | 22 | 0.03 | ||||||||||||||||||||
Disposition/acquisition losses | 14 | 0.02 | 11 | 0.02 | 123 | 0.19 | (2) | 6 | 0.01 | (3) | ||||||||||||||||||||||
Impairment losses | 279 | 0.42 | (4) | 624 | 0.95 | (5) | 542 | 0.82 | (6) | 933 | 1.41 | (7) | ||||||||||||||||||||
Losses on extinguishment of debt | 19 | 0.03 | (8) | 3 | — | 62 | 0.09 | (9) | 29 | 0.05 | (10) | |||||||||||||||||||||
Restructuring costs | 31 | 0.05 | — | — | 31 | 0.05 | — | — | ||||||||||||||||||||||||
U.S. Tax Law Reform Impact | 1.08 | (11) | — | 1.08 | (11) | — | ||||||||||||||||||||||||||
Less: Net income tax benefit | (0.14 | ) | (12) | (0.31 | ) | (13) | (0.29 | ) | (14) | (0.51 | ) | (15) | ||||||||||||||||||||
Adjusted PTC and Adjusted EPS | $ | 347 | $ | 0.43 | $ | 225 | $ | 0.30 | $ | 1,017 | $ | 1.08 | $ | 850 | $ | 0.94 | ||||||||||||||||
_____________________________
(1) | NCI is defined as Noncontrolling Interests |
(2) | Amount primarily relates to loss on sale of Kazakhstan CHPs of $49 million, or $0.07 per share, realized derivative losses associated with the sale of Sul of $38 million, or $0.06 per share, loss on sale of Kazakhstan Hydroelectric plants of $33 million, or $0.05 per share, costs associated with early plant closure of DPL of $24 million, or $0.04 per share; partially offset by gain on Masinloc contingent consideration of $23 million, or $0.03 per share and gain on sale of Zimmer and Miami Fort of $13 million, or $0.02 per share. |
(3) | Amount primarily relates to the loss on deconsolidation of UK Wind of $20 million, or $0.03 per share and losses associated with the sale of Sul of $10 million, or $0.02; partially offset by the gain on sale of DPLER of $22 million, or $0.03 per share. |
(4) | Amount primarily relates to asset impairment at Laurel Mountain of $121 million, or $0.18 per share and DPL of $109 million, or $0.17 per share. |
(5) | Amount primarily relates to asset impairments at DPL of $624 million, or $0.94 per share. |
(6) | Amount primarily relates to asset impairment at Kazakhstan CHPs of $94 million, or $0.14 per share, at Kazakhstan hydroelectric plants of $92 million, or $0.14 per share, at Laurel Mountain of $121 million, or $0.18 per share, at DPL of $175 million, or $0.27 per share and at Kilroot of $37 million, or $0.05 per share. |
(7) | Amount primarily relates to asset impairments at DPL of $859 million, or $1.30 per share; $159 million at Buffalo Gap II ($49 million, or $0.07 per share, net of NCI); and $77 million at Buffalo Gap I ($23 million, or $0.03 per share, net of NCI). |
(8) | Amount primarily relates to losses on early retirement of debt at AES Gener of $20 million, or $0.02 per share. |
(9) | Amount primarily relates to losses on early retirement of debt at the Parent Company of $92 million, or $0.14 per share, at AES Gener of $20 million, or $0.02 per share, at IPALCO of $9 million or 0.01 per share; partially offset by a gain on early retirement of debt at Alicura of $65 million, or $0.10 per share. |
(10) | Amount primarily relates to the loss on early retirement of debt at the Parent Company of $19 million, or $0.03 per share. |
(11) | Amount relates to a one-time transition tax on foreign earnings of $675 million, or $1.02 per share and the remeasurement of deferred tax assets and liabilities to lower corporate tax rates of $39 million, or $0.06 per share. |
(12) | Amount primarily relates to the income tax benefit associated with asset impairment losses and restructuring costs of $66 million, or $0.10 and $10 million or $0.02 per share respectively for the three months ended December 31, 2017. |
(13) | Amount primarily relates to the income tax benefit associated with losses on impairment of $209 million, or $0.32 per share in the three months ended December 31, 2016. |
(14) | Amount primarily relates to the income tax benefit associated with asset impairment losses of $148 million, or $0.22 per share in the twelve months ended December 31, 2017. |
(15) | Amount primarily relates to the income tax benefit associated with asset impairment of $332 million, or $0.50 per share in the twelve months ended December 31, 2016. |
THE AES CORPORATION
NON-GAAP FINANCIAL MEASURES
(Unaudited)
AES is a holding company that derives its income and cash flows from the activities of its subsidiaries, some of which may not be wholly-owned by the Company.
The Company's non-GAAP metrics are Consolidated Free Cash Flow, Adjusted Pre-tax Contribution (“Adjusted PTC”) and Adjusted Earnings Per Share (“Adjusted EPS”) used by management and external users of our consolidated financial statements such as investors, industry analysts and lenders.
Consolidated Free Cash Flow (“Free Cash Flow”) is defined as net cash from operating activities (adjusted for service concession asset capital expenditures) less maintenance capital expenditures (including non-recoverable environmental capital expenditures), net of reinsurance proceeds from third parties. The company also excludes environmental capital expenditures that are expected to be recovered through regulatory, contractual or other mechanisms.
The GAAP measure most comparable to Free Cash Flow is net cash provided by operating activities. We believe that Free Cash Flow is a useful measure for evaluating our financial condition because it represents the amount of cash generated by the business after the funding of maintenance capital expenditures that may be available for investing in growth opportunities or for repaying debt.
Three Months Ended | Twelve Months Ended | |||||||||||||||
December 31, | December 31, | |||||||||||||||
2017 | 2016 | 2017 | 2016 | |||||||||||||
(in millions) | ||||||||||||||||
Reconciliation of Total Capital Expenditures for Free Cash Flow Calculation Below: | ||||||||||||||||
Maintenance Capital Expenditures | $ | 130 | $ | 160 | $ | 564 | $ | 624 | ||||||||
Environmental Capital Expenditures | 20 | 33 | 77 | 231 | ||||||||||||
Growth Capital Expenditures | 519 | 387 | 1,715 | 1,603 | ||||||||||||
Total Capital Expenditures | $ | 669 | $ | 580 | $ | 2,356 | $ | 2,458 | ||||||||
Reconciliation of Free Cash Flow | ||||||||||||||||
Consolidated Operating Cash Flow | $ | 800 | $ | 702 | $ | 2,489 | $ | 2,884 | ||||||||
Add: Capital Expenditures Related to Service Concession Assets (1) | 1 | 2 | 6 | 29 | ||||||||||||
Less: Maintenance Capital Expenditures, net of reinsurance proceeds | (128 | ) | (160 | ) | (551 | ) | (624 | ) | ||||||||
Less: Non-Recoverable Environmental Capital Expenditures (2) | (5 | ) | (9 | ) | (23 | ) | (45 | ) | ||||||||
Free Cash Flow | $ | 668 | $ | 535 | $ | 1,921 | $ | 2,244 | ||||||||
_____________________________
(1) | Service concession asset expenditures are included in net cash provided by operating activities, but are excluded from the free cash flow non-GAAP metric. |
(2) | Excludes IPALCO’s recoverable environmental capital expenditures of $15 million and $24 million for the three months ended December 31, 2017 and December 31, 2016, respectively, as well as, $54 million and $186 million for the years ended December 31, 2017 and 2016 respectively. |
The AES Corporation | ||||||||||||
Parent Financial Information | ||||||||||||
Parent only data: last four quarters | ||||||||||||
(in millions) | 4 Quarters Ended | |||||||||||
Total subsidiary distributions & returns of capital to Parent | December 31, 2017 | September 30, 2017 | June 30, 2017 | March 31, 2017 | ||||||||
Actual | Actual | Actual | Actual | |||||||||
Subsidiary distributions (1) to Parent & QHCs | $ | 1,203 | $ | 1,170 | $ | 1,274 | $ | 1,236 | ||||
Returns of capital distributions to Parent & QHCs | — | 80 | 82 | 30 | ||||||||
Total subsidiary distributions & returns of capital to Parent | $ | 1,203 | $ | 1,250 | $ | 1,356 | $ | 1,266 | ||||
Parent only data: quarterly | ||||||||||||
(in millions) | Quarter Ended | |||||||||||
Total subsidiary distributions & returns of capital to Parent | December 31, 2017 | September 30, 2017 | June 30, 2017 | March 31, 2017 | ||||||||
Actual | Actual | Actual | Actual | |||||||||
Subsidiary distributions (1) to Parent & QHCs | $ | 459 | $ | 160 | $ | 375 | $ | 209 | ||||
Returns of capital distributions to Parent & QHCs | (67 | ) | 2 | 66 | — | |||||||
Total subsidiary distributions & returns of capital to Parent | $ | 392 | $ | 162 | $ | 441 | $ | 209 | ||||
Parent Company Liquidity (2) | ||||||||||||
(in millions) | Balance at | |||||||||||
December 31, 2017 | September 30, 2017 | June 30, 2017 | March 31, 2017 | |||||||||
Actual | Actual | Actual | Actual | |||||||||
Cash at Parent & Cash at QHCs (3) | $ | 11 | $ | 81 | $ | 127 | $ | 52 | ||||
Availability under credit facilities | 858 | 551 | 1,093 | 667 | ||||||||
Ending liquidity | $ | 869 | $ | 632 | $ | 1,220 | $ | 719 | ||||
_____________________________
(1) | Subsidiary distributions should not be construed as an alternative to Net Cash Provided by Operating Activities which is determined in accordance with GAAP. Subsidiary distributions are important to the Parent Company because the Parent Company is a holding company that does not derive any significant direct revenues from its own activities but instead relies on its subsidiaries’ business activities and the resultant distributions to fund the debt service, investment and other cash needs of the holding company. The reconciliation of the difference between the subsidiary distributions and the Net Cash Provided by Operating Activities consists of cash generated from operating activities that is retained at the subsidiaries for a variety of reasons which are both discretionary and non-discretionary in nature. These factors include, but are not limited to, retention of cash to fund capital expenditures at the subsidiary, cash retention associated with non-recourse debt covenant restrictions and related debt service requirements at the subsidiaries, retention of cash related to sufficiency of local GAAP statutory retained earnings at the subsidiaries, retention of cash for working capital needs at the subsidiaries, and other similar timing differences between when the cash is generated at the subsidiaries and when it reaches the Parent Company and related holding companies. |
(2) | Parent Company Liquidity is defined as cash at the Parent Company plus available borrowings under existing credit facility plus cash at qualified holding companies (QHCs). AES believes that unconsolidated Parent Company liquidity is important to the liquidity position of AES as a Parent Company because of the non-recourse nature of most of AES’ indebtedness. |
(3) | The cash held at QHCs represents cash sent to subsidiaries of the company domiciled outside of the US. Such subsidiaries had no contractual restrictions on their ability to send cash to AES, the Parent Company. Cash at those subsidiaries was used for investment and related activities outside of the US. These investments included equity investments and loans to other foreign subsidiaries as well as development and general costs and expenses incurred outside the US. Since the cash held by these QHCs is available to the Parent, AES uses the combined measure of subsidiary distributions to Parent and QHCs as a useful measure of cash available to the Parent to meet its international liquidity needs. |
THE AES CORPORATION
2017 FINANCIAL GUIDANCE ELEMENTS 1
2017 Financial Guidance | |
As of 11/2/17 | |
Income Statement Guidance | |
Adjusted Earnings Per Share 2 | $1.00-$1.10 |
Cash Flow Guidance | |
Consolidated Net Cash Provided by Operating Activities | $2,000-$2,800 million |
Consolidated Free Cash Flow 3 | $1,400-$2,000 million |
Reconciliation of Free Cash Flow Guidance | |
Consolidated Net Cash from Operating Activities | $2,000-$2,800 million |
Less: Maintenance Capital Expenditures | $600-$800 million |
Consolidated Free Cash Flow 3 | $1,400-$2,000 million |
_____________________________
1 | 2017 Guidance is based on expectations for future foreign exchange rates and commodity prices as of September 30, 2017. |
2 | The Company is not able to provide a corresponding GAAP equivalent for its Adjusted EPS guidance. In providing its full year 2017 Adjusted EPS guidance, the Company notes that there could be differences between expected reported earnings and estimated operating earnings, including the items listed below. Therefore, management is not able to estimate the aggregate impact, if any, of these items on reported earnings. As of December 31, 2017, the impact of these items was as follows: (a) unrealized gains or losses related to derivative transactions represent a gain of $3 million; (b) unrealized foreign currency gains or losses represent a gain of $60 million; (c) gains or losses and associated benefits and costs due to dispositions and acquisitions of business interests, including early plant closures, and the tax impact of the repatriation of sales proceeds represent a loss of $114 million; (d) losses due to impairments of $394 million; (e) gains, losses and costs due to the early retirement of debt represent a loss of $42 million; (f) costs directly associated with a major restructuring program, including, but not limited to, workforce reduction efforts, relocations, and office consolidation of $21 million; and (g) tax benefit or expense related to the enactment effects of 2017 U.S. tax law reform of $714 million. |
3 | Free Cash Flow is reconciled above. Free Cash Flow, a non-GAAP financial measure, is defined as net cash from operating activities (adjusted for service concession asset capital expenditures) less maintenance capital expenditures (including non-recoverable environmental capital expenditures), net of reinsurance proceeds from third parties. The GAAP measure most comparable to Free Cash Flow is net cash provided by operating activities. AES believes that Free Cash Flow is a useful measure for evaluating our financial condition because it represents the amount of cash generated by the business after the funding of maintenance capital expenditures that may be available for investing in growth opportunities or for repaying debt. Free Cash Flow should not be construed as an alternative to net cash from operating activities, which is determined in accordance with GAAP. |
THE AES CORPORATION
2018 FINANCIAL GUIDANCE ELEMENTS 1

1 | 2018 Guidance is based on expectations for future foreign exchange rates and commodity prices as of December 31, 2017. |
2 | The Company is not able to provide a corresponding GAAP equivalent for its Adjusted EPS guidance. In providing its full year 2018 Adjusted EPS guidance, the Company notes that there could be differences between expected reported earnings and estimated operating earnings for matters such as, but not limited to: (a) unrealized gains or losses related to derivative transactions; (b) unrealized foreign currency gains or losses; (c) gains or losses and associated benefits and costs due to dispositions and acquisitions of business interests, including early plant closures, and the tax impact of the repatriation of sales proceeds; (d) losses due to impairments; (e) gains, losses and costs due to the early retirement of debt; (f) costs directly associated with a major restructuring program, including, but not limited to, workforce reduction efforts, relocations, and office consolidation; and (g) tax benefit or expense related to the enactment effects of 2017 U.S. tax law reform. |
3 | From 2017 Adjusted EPS of $1.08, in line with prior expectation for 8% to 10% average annual growth through 2020 from the mid-point of 2016 Adjusted EPS guidance of $0.95 to $1.05. |