Attached files
| file | filename |
|---|---|
| EX-24 - POWER OF ATTORNEY - USG CORP | usg_ex24x1231201710-k.htm |
| EX-21 - SUBSIDIARIES - USG CORP | usg_ex21x1231201710-k.htm |
| EX-95 - MINE SAFETY DISCLOSURES - USG CORP | usg_ex95x1231201710-k.htm |
| EX-32.2 - SECTION 1350 CERTIFICATION OF USG CORPORATION'S CHIEF FINANCIAL OFFICER - USG CORP | usg_ex322x1231201710-k.htm |
| EX-32.1 - SECTION 1350 CERTIFICATION OF USG CORPORATION'S CHIEF EXECUTIVE OFFICER - USG CORP | usg_ex321x1231201710-k.htm |
| EX-31.2 - RULE 13A - 14(A) CERTIFICATION OF USG CORPORATION'S CHIEF FINANCIAL OFFICER - USG CORP | usg_ex312x1231201710-k.htm |
| EX-31.1 - RULE 13A - 14(A) CERTIFICATION OF USG CORPORATION'S CHIEF EXECUTIVE OFFICER - USG CORP | usg_ex311x1231201710-k.htm |
| EX-23.1 - CONSENT OF INDEPENDENT REGISTERED PUBLIC ACCOUNTING FIRM, DELOITTE & TOUCHE LLP - USG CORP | usg_ex231x1231201710-k.htm |
| EX-10.29 - 2018 ANNUAL MANAGEMENT INCENTIVE PROGRAM OF USG CORPORATION - USG CORP | usg_ex1029x1231201710-k.htm |
UNITED STATES
SECURITIES AND EXCHANGE COMMISSION
Washington, D.C. 20549
FORM 10-K
(Mark One)
x | ANNUAL REPORT PURSUANT TO SECTION 13 OR 15(d) OF THE SECURITIES EXCHANGE ACT OF 1934 |
For the fiscal year ended December 31, 2017 | |
OR | |
o | TRANSITION REPORT PURSUANT TO SECTION 13 OR 15(d) OF THE SECURITIES EXCHANGE ACT OF 1934 |
For the transition period from to | |
Commission File Number 1-8864
USG CORPORATION
(Exact name of Registrant as Specified in its Charter)
Delaware | 36-3329400 | |
(State or Other Jurisdiction of Incorporation or Organization) | (I.R.S. Employer Identification No.) | |
550 W. Adams Street, Chicago, Illinois | 60661-3676 | |
(Address of Principal Executive Offices) | (Zip Code) | |
Registrant’s Telephone Number, Including Area Code: (312) 436-4000 | ||
Securities Registered Pursuant to Section 12(b) of the Act: | ||
Title of Each Class | Name of Exchange on Which Registered | |
Common Stock, $0.10 par value | New York Stock Exchange | |
Chicago Stock Exchange | ||
Preferred Stock Purchase Rights (subject to Rights | New York Stock Exchange | |
Agreement dated December 21, 2006, as amended) | Chicago Stock Exchange | |
Securities Registered Pursuant to Section 12(g) of the Act: None
Indicate by check mark if the registrant is a well-known seasoned issuer, as defined in Rule 405 of the Securities Act. Yes x No o
Indicate by check mark if the registrant is not required to file reports pursuant to Section 13 or 15(d) of the Exchange Act. Yes o No x
Indicate by check mark whether the registrant (1) has filed all reports required to be filed by Section 13 or 15(d) of the Securities Exchange Act of 1934 during the preceding 12 months (or for such shorter period that the registrant was required to file such reports), and (2) has been subject to such filing requirements for the past 90 days. Yes x No o
Indicate by check mark whether the registrant has submitted electronically and posted on its corporate Web site, if any, every Interactive Data File required to be submitted and posted pursuant to Rule 405 of Regulation S-T (§232.405 of this chapter) during the preceding 12 months (or for such shorter period that the registrant was required to submit and post such files). Yes x No o
Indicate by check mark if disclosure of delinquent filers pursuant to Item 405 of Regulation S-K is not contained herein, and will not be contained, to the best of registrant’s knowledge, in definitive proxy or information statements incorporated by reference in Part III of this Form 10-K or any amendment to this Form 10-K. x
Indicate by check mark whether the registrant is a large accelerated filer, an accelerated filer, a non-accelerated filer, smaller reporting company, or an emerging growth company. See the definitions of “large accelerated filer,” “accelerated filer,” “smaller reporting company,” and "emerging growth company" in Rule 12b-2 of the Exchange Act.
Large accelerated filer | x | Accelerated filer | o | |||
Non-accelerated filer | o | (Do not check if smaller reporting company) | ||||
Smaller reporting company | o | |||||
Emerging growth company | o | |||||
If an emerging growth company, indicate by check mark if the registrant has elected not to use the extended transition period for complying with any new or revised financial accounting standards provided pursuant to Section 13(a) of the Exchange Act. o
Indicate by check mark whether the registrant is a shell company (as defined in Exchange Act Rule 12b-2). Yes o No x
The aggregate market value of the registrant’s common stock held by non-affiliates computed by reference to the New York Stock Exchange closing price on June 30, 2017 (the last business day of the registrant’s most recently completed second fiscal quarter) was approximately $2,461,833,172. Solely for this purpose, directors, executive officers and greater than 10% record shareholders are considered the affiliates of the registrant.
The number of shares of the registrant’s common stock outstanding as of January 31, 2018 was 141,056,498.
Documents Incorporated By Reference: Certain sections of USG Corporation’s definitive Proxy Statement for use in connection with its 2018 annual meeting of stockholders, to be filed subsequently, are incorporated by reference into Part III of this Form 10-K Report where indicated.
TABLE OF CONTENTS
Page | ||
Item 1. | ||
Item 1A. | ||
Item 1B. | ||
Item 2. | ||
Item 3. | ||
Item 4. | ||
Item 5. | ||
Item 6. | ||
Item 7. | ||
Item 7A. | ||
Item 8. | ||
Item 9. | ||
Item 9A. | ||
Item 9B. | ||
Item 10. | ||
Item 11. | ||
Item 12. | ||
Item 13. | ||
Item 14. | ||
Item 15. | ||
Item 16. | ||
PART I
Item 1. | BUSINESS |
In this annual report on Form 10-K, “USG,” “we,” “our” and “us” refer to USG Corporation, a Delaware corporation, and its subsidiaries included in the consolidated financial statements, except as otherwise indicated or as the context otherwise requires.
General
USG, through our subsidiaries and joint ventures, is a leading manufacturer of building materials and innovative solutions that was originally formed in 1902. We produce a wide range of products for use in new residential, new nonresidential, and residential and nonresidential repair and remodel construction as well as products used in certain industrial processes. Our businesses are cyclical in nature and sensitive to changes in general economic conditions, including, in particular, conditions in the North American housing and construction-based markets. Our expansion through two 50/50 joint ventures we formed in 2014 with Boral Limited, referred to as USG Boral Building Products, or UBBP, into the markets of Asia, Australasia, and the Middle East has significantly increased our exposure to the economic conditions in those areas.
The effects of market conditions on our operations are discussed in Part II, Item 7, Management’s Discussion and Analysis of Financial Condition and Results of Operations.
Segments
During the fourth quarter of 2017, we realigned our operating structure to reflect changes in our organizational structure and management's operation and view of our businesses. Our realigned operating structure is generally aligned by product type and consists of three divisions, in addition to UBBP: Gypsum, Performance Materials and Ceilings. The operations of the divisions are similar throughout North America.
As a result of our realigned operating structure, we changed the composition of our reportable segments effective for the quarter ended December 31, 2017 to align with how we manage our businesses, review operating performance and allocate resources considering the discrete information available for the geographies within those divisions. We now have five reportable segments: U.S. Wallboard and Surfaces, U.S. Performance Materials, U.S. Ceilings, Canada, and UBBP. Our prior period results have been recast to reflect these changes and present comparative year over year information by segment. See Note 14, Segments, to the consolidated financial statements in Part II, Item 8 of this report for financial information regarding our reportable segments.
Our reportable segments are determined considering both qualitative and quantitative metrics for aggregation of the product type within geographies for which discrete financial information is available. Our U.S. Wallboard and Surfaces, U.S. Performance Materials and U.S. Ceilings reportable segments were identified based on products manufactured and marketed as discussed below. Our Canada segment is a separately reportable segment, as while it has similar qualitative factors to U.S. operations, it has different quantitative metrics and, therefore, cannot be aggregated. Our operating segments in Mexico and Latin America, as well as our mining operation in Little Narrows, Nova Scotia, Canada, which we indefinitely idled in 2016, and our shipping company, which we exited in 2015, are now included in Other as reconciling items to our consolidated segments. There has been no change to our UBBP segment.
1
The following graph reflects the breakdown by segment of our 2017 consolidated net sales of $3.2 billion.
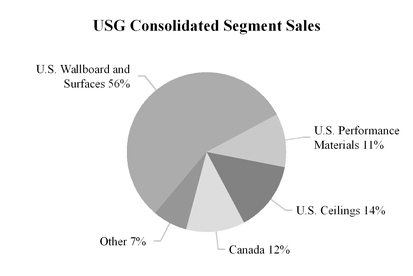
Net sales of UBBP of $1.2 billion are excluded from the graph above as the joint ventures are accounted for as equity method investments.
Gypsum
BUSINESS
Our Gypsum division manufactures and markets gypsum and related products in the United States, Canada and Mexico. It is composed of our U.S. Wallboard and Surfaces segment and the Gypsum operations of our Canada segment. Our Gypsum operations in Mexico do not rise to the level of a reportable segment and thus are included in Other. We are the largest manufacturer of gypsum wallboard in the United States and accounted for approximately 25.4% of total industry shipments of gypsum board in 2017. The gypsum board market, as determined by the Gypsum Association, includes gypsum wallboard, other gypsum-related paneling products and imports. As such, we've included the Gypsum products of USG Sheetrock® brand gypsum wallboard and Securock® brand glass mat sheathing and the Performance Materials product of Fiberock® brand gypsum fiber panels in our estimate of our market share of the gypsum board market. In Canada, we accounted for approximately 42% of Canadian domestic shipments of gypsum wallboard in 2017 and are the largest manufacturer of gypsum wallboard in Canada.
PRODUCTS
Gypsum's products are used in a variety of building applications to construct walls and ceilings of residential, nonresidential and institutional buildings, as well as in certain industrial applications. We also produce gypsum-based products for agricultural and industrial customers to use in a wide variety of applications, including soil conditioning, road repair, fireproofing and ceramics. The major product lines within the Gypsum division are:
WALLBOARD | |
USG Sheetrock® brand gypsum wallboard and Securock® brand glass mat sheathing portfolios | Gypsum panels that provide aesthetic as well as sound-dampening, fire-retarding, abuse-resistance and moisture-control value |
SURFACES | |
USG Sheetrock® brand joint compound portfolio, as well as corner bead, joint tape, and plaster | Used for finishing wallboard joints |
Construction plaster products, sold under the brand names Red Top®, Imperial®, Diamond® and Supremo™ and industrial gypsum | Used to provide a custom finish for residential and commercial interiors and provide aesthetic, sound-dampening, fire-retarding and abuse-resistance value |
As the leader in lightweight innovation, we offer the industry's broadest portfolio of lightweight gypsum panels for use in interior wall and ceiling applications including our USG Sheetrock® Brand UltraLight Panels and our newly launched USG Sheetrock® Brand EcoSmart Panels.
2
MANUFACTURING
Our Gypsum division manufactures products at 41 plants located throughout the United States, Canada, and Mexico, some of which are shared with the Performance Materials division.
Gypsum rock is mined or quarried at 12 company-owned locations in North America. Our mines and quarries provided approximately 50% of the gypsum used by our plants in North America in 2017. Some of our manufacturing plants purchase or acquire synthetic gypsum and natural gypsum rock from outside sources. In 2017, outside sources of synthetic gypsum and natural gypsum rock accounted for approximately 43% and 7%, respectively, of the gypsum used in our North American plants.
Synthetic gypsum is a byproduct of flue gas desulphurization carried out by electric generation or industrial plants that burn coal as a fuel. The suppliers of this kind of gypsum are primarily power companies, which are required to operate scrubbing equipment for their coal-fired generating plants under federal environmental regulations. We have entered into a number of long-term supply agreements to acquire synthetic gypsum. Certain power companies have switched to using natural gas instead of coal for their electric generation needs. In the event more power companies switch to using natural gas instead of coal, the availability of synthetic gypsum may decrease which could result in an increase to our cost. See Item 1A, Risk Factors.
We produce wallboard paper at four company-owned production facilities located in the United States. Vertical integration in paper helps to ensure a continuous supply of high-quality paper that is tailored to the specific needs of our production processes. We augment our paper needs through purchases from outside suppliers when necessary. We did not make any material purchases of paper from outside suppliers in 2017.
MARKETING AND DISTRIBUTION
Our Gypsum products are marketed and distributed through specialty wallboard distributors, building materials dealers, home improvement centers and other retailers and contractors. Sales of Gypsum products are seasonal in the sense that sales are generally greater from spring through autumn than during the remaining part of the year.
Based on our estimates using publicly available data, internal surveys and industry shipment data for gypsum board, as reported by the Gypsum Association, we estimate that during 2017 volume demand for gypsum board was generated by:
• | residential and nonresidential repair and remodel activity of about 51%, |
• | new residential construction of about 39%, |
• | new nonresidential construction of about 7%, and |
• | other activities, such as exports and temporary construction, of about 3%. |
COMPETITION
Industry shipments of gypsum board in the United States (including gypsum wallboard, other gypsum-related paneling products and imports), as reported by the Gypsum Association, were an estimated 25.7 billion square feet in 2017, up approximately 3% from 25.0 billion square feet in 2016. Our share of the gypsum board market in the United States, which includes for comparability shipments of USG Sheetrock® brand gypsum wallboard, Fiberock® brand gypsum fiber panels and Securock® brand glass mat sheathing, increased to 25.4% in 2017 from 24.6% in 2016.
The principal methods of competition are quality and range of products, including introduction of new products, product availability, pricing, compatibility of systems and product design features. Our principal competitors include
United States | Canada | Mexico | |||
National Gypsum Company | x | ||||
Continental Building Products, Inc. | x | x | |||
American Gypsum Company LLC (a unit of Eagle Materials Inc.) | x | ||||
PABCO Gypsum (a division of PABCO Building Products) | x | ||||
CertainTeed Corporation (a subsidiary of Compagnie de Saint-Gobain SA) | x | x | |||
Georgia-Pacific (a subsidiary of Koch Industries, Inc.) | x | x | |||
Cabot Gypsum Company | x | ||||
Panel Rey, S.A. (a Grupo Promax Company) | x | x | |||
Plaka (a unit of Knauf International GmbH) | x | ||||
3
Performance Materials
BUSINESS
Our Performance Materials division manufactures and markets a series of innovative products in the United States that provide solutions to our customers to help close the skilled labor gap and increase job site efficiency. It consists solely of our U.S. Performance Materials segment.
PRODUCTS
Performance Materials products are used in a variety of interior and exterior building applications of residential and nonresidential buildings, as well as in certain industrial applications. These products can be grouped under three product categories of underlayment, building envelope and structural. The major products within these three categories are as follows:
UNDERLAYMENT | |
USG Durock® brand cement board | Provides water and fire-resistant assemblies for both interior and exterior applications |
Fiberock® brand backerboard | Includes abuse-resistant interior wall panels, tile backer boards, and flooring underlayments |
USG Durock™ brand shower systems | A fully bonded waterproofing system for tiled shower installations |
Levelrock® brand systems of poured gypsum flooring | Provides surface leveling, enhanced sound-dampening and fire-resistant performance for residential and commercial flooring applications |
BUILDING ENVELOPE | |
Securock® ExoAir® 430 air barrier system | Integrated gypsum sheathing panels with pre-applied fluid air barrier membrane that provides structural performance and moisture, mold and air control |
Securock® brand roof board portfolios | Roof boards for use in low-slope commercial roofing systems that provides moisture, mold and fire resistant value |
STRUCTURAL | |
USG Structural Panels | High-strength, reinforced factory made concrete panels for use in subfloor, roof deck, foundation walls and other noncombustible applications |
MANUFACTURING
Our Performance Materials division manufactures products at 11 plants located throughout the United States, most of which are shared with our Gypsum division.
MARKETING AND DISTRIBUTION
Our Performance Materials products are marketed and distributed through specialty distributors, home improvement centers, contractors and other retailers. Sales of Performance Materials products are generally greater from spring through autumn than during the remaining part of the year. Based on our estimates using internal surveys, we estimate that during 2017 volume demand was generated by:
• | new nonresidential construction of about 35% |
• | new residential construction of about 35%, and |
• | residential and nonresidential repair and remodel activity of about 30%. |
COMPETITION
The principal methods of competition are quality and range of products, including introduction of new products, product availability, pricing, compatibility of systems and product design features. Our principal competitors include National Gypsum Company, Georgia Pacific, James Hardie Building Products, Schluter Systems, the ARDEX Group and Laticrete.
Ceilings
BUSINESS
Our Ceilings division manufactures and markets ceiling interior systems products in the United States, Canada and Mexico. It consists of our U.S. Ceilings segment and the ceilings operations of our Canada segment. Our ceilings operations in Mexico do not rise to the level of a reportable segment and thus are included in Other. We are a leading manufacturer and supplier of interior ceilings products including ceiling tile, ceiling grid, and specialty ceilings used primarily in nonresidential applications.
4
In 2017, we acquired Ceilings Plus, a leader in the specialty ceilings market. We estimate that we are the second-largest manufacturer of ceiling grid and acoustical ceiling tile.
PRODUCTS
The major product lines within the Ceilings division are:
CEILING TILE | |
Radar™, Eclipse™, Mars™ and Halcyon™ | Provides qualities such as sound absorption, fire retardation and convenient access to the space above the ceiling for electrical and mechanical systems, air distribution and maintenance |
CEILING GRID | |
Donn®, DX®, Fineline®, Centricitee™ and Identitee® DXI™ | Provides qualities such as fire retardation and convenient access to the space above the ceiling for electrical and mechanical systems, air distribution and maintenance |
SPECIALTY CEILINGS | |
Curvatura™, Compasso®, Radians®, Illusions™, Multiples™, Runways™, Barz™, Planx™, Mirra™, Corniche™,Wallforms™ and Parti™ | Provides qualities such as aesthetics, sound absorption, fire retardation and convenient access to the space above the ceiling for electrical and mechanical systems, air distribution and maintenance |
ENSEMBLETM | |
Ensemble™ | Provides a monolithic drywall look with acoustical performance |
MANUFACTURING
Our Ceilings division manufactures products at 10 plants located in the United States and Canada. Principal raw materials used to produce Ceilings’ products include mineral fiber, aluminum, steel, perlite and starch. We produce mineral fiber and obtain all others from outside suppliers.
MARKETING AND DISTRIBUTION
Ceilings sells products primarily in markets related to the construction and renovation of nonresidential buildings. During 2017, based on our estimates using internal surveys, approximately:
• | 75% of its net sales were from repair and remodel activity, primarily nonresidential, |
• | 20% of its net sales were from new nonresidential construction, and |
• | 5% of its net sales were from new residential construction. |
Products are marketed and distributed through a network of distributors, installation contractors and home improvement centers. Sales of Ceilings’ products are seasonal in nature and are generally lower in the fourth quarter of the calendar year as compared to the first three quarters of the year.
COMPETITION
Principal methods of competition are quality and range of products, including introduction of new products, product availability, pricing, compatibility of systems and product design features. Our principal competitors include the following:
United States | Canada | Mexico | |||
Ceiling Tile | |||||
Armstrong World Industries, Inc., | x | x | x | ||
Rockfon (a subsidiary of Rockwool International A/S) | x | x | |||
CertainTeed Corporation (a subsidiary of Compagnie de Saint-Gobain SA) | x | x | x | ||
Odenwald Faserplattenwerk GmbH (OWA) | x | x | x | ||
Ceiling Grid | |||||
WAVE (a joint venture between Armstrong World Industries, Inc. and Worthington Industries) | x | x | |||
Chicago Metallic Corporation (a subsidiary of Rockwool International A/S) | x | x | x | ||
CertainTeed Corporation (a subsidiary of Compagnie de Saint-Gobain SA) | x | x | x | ||
5
USG Boral Building Products
BUSINESS
In 2014, we and certain of our subsidiaries formed 50/50 joint ventures with Boral Limited, or Boral. These joint ventures are referred to as USG Boral Building Products, or UBBP. UBBP manufactures, distributes and sells certain building products, mines raw gypsum and sells natural and synthetic gypsum throughout Asia, Australasia and the Middle East. UBBP is a leader in most of the markets it serves. See Note 4 to the consolidated financial statements in Part II, Item 8 of this report for additional information related to our equity method investments.
PRODUCTS
UBBP manufactures and distributes products for wall, ceiling, floor lining and exterior systems that utilize gypsum wallboard, referred to as plasterboard in the regions in which UBBP operates, mineral fiber ceiling tiles, steel grid and joint compound. UBBP's significant brand names include USG Boral Sheetrock® premium plasterboard, USG Boral NextGen®, Elephant®, Jayaboard®, Durock® and Donn® DX®. UBBP launched USG Boral Sheetrock® products, which leverages USG technology, in Australia, South Korea, Indonesia, Vietnam, China, Thailand, India and Oman. UBBP is able to sell USG Boral Sheetrock® at a premium price in some markets and acceptance of lightweight technology continues to increase, which is led by Australia with a conversion rate above 90%.
MANUFACTURING
UBBP has 23 plasterboard lines, three gypsum mines and 36 other non-board lines for metal products, metal ceiling grid, ceiling tile, joint compound, and cornice throughout twelve countries in Asia, Australasia and the Middle East.
Executive Officers of the Registrant
See Part III, Item 10, Directors, Executive Officers and Corporate Governance - Executive Officers of the Registrant (as of February 14, 2018).
Other Information
RESEARCH AND DEVELOPMENT
To contribute to our high standards and our leadership in the building materials industry, we perform extensive research and development at the USG Corporate Innovation Center in Libertyville, Illinois, using open innovation models and outside partnerships. Research team members collaborate with suppliers, universities and national research laboratories to provide product support and to develop new products and technologies for our divisions. With fire, acoustical, structural and environmental testing capabilities, the research center allows us to conduct our own on-site evaluation of products and systems. Chemical analysis and materials characterization support product development and safety/quality assessment programs. Development activities can be taken to an on-site pilot plant before being transferred to a full-size plant. Research and development activities have been focused on customer preferred system solutions. We expense research and development expenditures as incurred. These expenditures amounted to $23 million, $24 million and $23 million in 2017, 2016 and 2015, respectively. UBBP also operates a research and development center in Thailand.
SUSTAINABILITY
The adoption of green building codes and standards such as the Leadership in Energy and Environmental Design, or LEED, rating system established by the U.S. Green Building Council to encourage the design and construction of buildings that are environmentally friendly, combined with an increase in customer preference for products that can assist in obtaining LEED credit or are otherwise environmentally preferable, has increased demand for products, systems and services that contribute to building sustainable spaces. Many of our products meet the requirements for the awarding of LEED credits, and we continue to develop new products and systems to address market demand for products that enable construction of buildings that require fewer natural resources to build, operate and maintain. Our competitors also have developed and introduced to the market more environmentally responsible products.
We expect that there will be increased demand over time for products, systems and services that meet regulatory and customer sustainability standards and preferences and decreased demand for products that produce significant greenhouse gas emissions. We also believe that our ability to continue to provide these products and systems to our customers will be necessary to maintain our competitive position in the marketplace.
ENERGY
Our primary supplies of energy have been adequate, and we have not been required to curtail operations as a result of insufficient supplies. Supplies are likely to remain sufficient for our projected requirements. Currently, we are using swap
6
contracts to hedge a significant portion of our anticipated purchases of natural gas to be used in our manufacturing operations over the next 12 months and beyond. We review our positions regularly and make adjustments as market conditions warrant.
SIGNIFICANT CUSTOMERS
On a worldwide basis, for each of the years ended December 31, 2017, 2016, and 2015, The Home Depot accounted for 23%, 23% and 23% of our net consolidated sales, respectively, and L&W Supply Corporation, or L&W, accounted for 16%, 19% and 18% of our consolidated net sales, respectively. On October 31, 2016, we completed the sale of L&W to American Builders & Contractors Supply Co., Inc., or ABC Supply, for $675 million inclusive of the final working capital adjustment. Additionally, we entered into a supply agreement with L&W that governs sales of wallboard and certain other products from USG to L&W. Our U.S. Wallboard and Surfaces, U.S. Performance Materials, U.S. Ceilings and Canada segments each had net sales to these customers in each of those years.
INTELLECTUAL PROPERTY
We consider patents, copyrights, trademarks, trade secrets, proprietary technology and similar intellectual property as critical to our success. We hold numerous patents and have registered numerous trademarks of varying duration in multiple legal jurisdictions. Further, we have filed patent applications and applications for the registration of trademarks in the United States and internationally. Although we consider our patents, licenses and trade secrets to constitute valuable assets, we do not regard any of our businesses as being materially dependent upon individual patents, trade secrets, or licenses.
OTHER
Because we generally fill orders upon receipt, no segment has any significant order backlog.
None of our segments has any special working capital requirements.
No material part of our business is subject to renegotiation of profits or termination of contracts or subcontracts at the election of any government.
As of December 31, 2017, we had approximately 6,800 employees worldwide in our consolidated operations.
See Note 14 to the consolidated financial statements in Part II, Item 8 of this report for financial information pertaining to net sales and long-lived assets by geographic region and net sales, operating profit and total assets by reportable segment. Our prior period results have been recast to reflect the changes to our reportable segments noted above and present comparative year over year information. See also Item 1A, Risk Factors, for information regarding the risks associated with conducting business in international locations, as well as the possible effects that compliance with environmental laws and regulations may have on our businesses and operating results.
Available Information
We maintain a website at www.usg.com and make available at this website our annual report on Form 10-K, quarterly reports on Form 10-Q, current reports on Form 8-K and all amendments to those reports as soon as reasonably practicable after they are electronically filed with or furnished to the Securities and Exchange Commission, or SEC. The information on our website is not, and will not be deemed to be, a part of this Annual Report on Form 10-K, or incorporated into any of our other filings with the SEC, except where we expressly incorporated such information. If you wish to receive a paper copy of any exhibit to our reports filed with or furnished to the SEC, the exhibit may be obtained, upon payment of reasonable expenses, by writing to: Corporate Secretary, USG Corporation, 550 West Adams Street, Chicago, Illinois 60661-3676.
7
Item 1A. | RISK FACTORS |
Our business, financial condition, operating results and cash flows are subject to various risks and uncertainties. We have described below significant factors that may adversely affect us and our industry. You should carefully consider these factors, together with all of the other information in this annual report on Form 10-K and in other documents that we file with the SEC, before making any investment decision about our securities.
Our businesses are cyclical, regional and seasonal in nature and subject to industry downturns.
Our businesses are cyclical and sensitive to changes in general economic conditions, including, in particular, conditions in the North American housing and construction-based markets. Housing starts in the United States were 1.202 million in 2017 and remain below the historical average of 1.44 million, while new nonresidential construction and the residential and nonresidential repair and remodel market in the United States have experienced only modest increases over the past several years. Moreover, we operate in a variety of regional markets, so our businesses are subject not only to general economic conditions, but also to localized economic conditions in each of those regions. Housing and construction-based markets are impacted by broader economic circumstances, including employment levels, the availability of skilled labor, household formation, home ownership rate, new and existing home price trends, availability of mortgage financing, interest rates, deductibility of mortgage interest and real estate taxes, consumer confidence, job growth and discretionary business investment, and these markets may experience a downturn. Adverse conditions in the markets or regions where we operate, or the failure of these markets or regions to return to historical levels, may have a material adverse effect on our business, financial condition, operating results and cash flows.
In addition, our businesses are seasonal, which has caused in the past, and will likely cause in the future, our quarterly results to vary significantly. Unfavorable weather conditions, such as snow or heavy rainfall, could reduce construction activity and adversely affect demand for our products.
We operate in highly competitive markets, and we may not be able to maintain current price levels, or achieve price increases, for our products.
The markets for our products are very competitive, and our ability to effectively compete further varies by region. Principal methods of competition include quality and range of products, including introduction of new products, product availability, pricing, compatibility of systems and product design features. Prices for our products are affected by supply and demand in the markets for our products and available production capacity. Currently, there is excess wallboard production capacity industry wide in the United States and Canada. Several of our competitors have also recently added or are in the process of adding capacity and new competitors have entered certain markets, including imports from Mexico into certain regions in the South, which could lead to our inability to implement price increases or cause us to reduce pricing in an effort to maintain or grow our sales, and could negatively affect our ability to sell higher-priced products or lead to lower demand for our products. We implemented a price increase for wallboard effective in January 2018, however it is uncertain whether we will be able to maintain any increase in our selling prices or implement additional increases in 2018, as was the case in 2017. Any of the foregoing could adversely affect our business, financial condition, operating results and cash flows.
We are dependent on sales to our major customers, and the number of our customers with significant buying power is increasing.
For the year ended December 31, 2017, our two largest customers, The Home Depot and L&W, collectively accounted for approximately 39% of our sales, while our top ten customers collectively accounted for approximately 60% of our sales. We face strong competition for these and our other major customers. As is customary in our industry, we generally do not enter into long-term contracts with our customers, who may choose to reduce or delay purchases of our products at any time. If one or more of our major customers reduces or delays substantial orders, our business, financial condition, operating results and cash flows may be materially and adversely affected, particularly for the period in which the reduction or delay occurs and also possibly for subsequent periods.
Certain of our customers are also large companies with significant buying power. In addition, consolidation currently taking place in the gypsum specialty dealer channel will likely further enhance the ability of certain of our customers to seek more favorable terms, including pricing, for the products that they purchase from us. Accordingly, our ability to maintain or raise prices in the future may continue to be limited, including during periods of raw material and other cost increases, as was the case in 2017. If we are forced to reduce prices or to maintain prices during periods of increased costs, or if we lose customers because of pricing or other methods of competition, our business, financial condition, operating results and cash flows may be materially and adversely affected.
8
L&W is currently our largest customer in the gypsum specialty dealer channel, purchasing approximately 21% of our wallboard production in 2017, among other products we manufacture. Specialty dealers often have multiple suppliers for product categories. Following the sale of L&W in 2016, L&W diversified its supplier base, resulting in a reduction in our sales to L&W in 2017 compared to 2016. We expect this reduction to continue in 2018. In connection with the closing of the sale of L&W, we entered into a supply agreement that provides for L&W to purchase minimum volumes of our wallboard and certain other products over the near term, with volume minimums generally stepping down for those products over time. To address any loss of sales to L&W both during and after the term of the supply agreement, we have made efforts to grow our business with current customers and serve new customers. However, our efforts to replace any loss of sales to L&W may not continue to be successful, and we may experience market share loss or unfavorable pricing, in which case our net sales, operating results and cash flows may be materially and adversely impacted.
Increased costs, or decreased availability, of key raw materials, energy or transportation will increase our cost of products sold.
The cost and availability of raw materials, energy and transportation are critical to our operations. For example, we use substantial quantities of gypsum, synthetic gypsum, wastepaper, mineral fiber, steel, perlite and starch. The cost of certain of these items has been volatile, and availability has sometimes been limited. We obtain some of these materials from a limited number of suppliers or sole source suppliers, which increases the risk of unavailability. As we saw in 2017, we may not be able to pass increased raw material, energy or transportation costs on to our customers if the market or existing agreements with our customers do not allow us to raise the prices of our finished products. If price adjustments for our finished products significantly trail the increase in raw material, transportation or energy costs, or if we cannot effectively hedge against cost increases, our operating results and cash flows may be materially and adversely affected.
Approximately 43% of the gypsum used in our plants is synthetic gypsum. Nine of our Gypsum plants in operation use synthetic gypsum for all of their needs, while another four use it for some of their needs. The suppliers of synthetic gypsum are primarily power companies, and certain power companies have switched to using natural gas instead of coal for their electric generation needs. In addition, existing or future changes in environmental regulations may make it more difficult or costly for power companies to burn coal, which may result in a further shift away from coal-based sources of energy. In the event more power companies switch to using natural gas instead of coal, the availability of synthetic gypsum may continue to decrease. We could incur substantial costs in connection with any significant reduction in the availability of synthetic gypsum, including costs to convert our plants to use natural gypsum or increased costs to transport synthetic gypsum to our plants from farther away, which may materially and adversely affect our business, financial condition, operating results and cash flows.
During 2017, wastepaper pricing in the old corrugated containers (OCC) markets was one of the primary drivers of increased wallboard manufacturing cost. We buy various grades of wastepaper, and shortages occur periodically in one or more grades and may vary among geographic regions. As a result, we have experienced, and expect in the future to experience, volatility in wastepaper availability and its cost, affecting the mix of products manufactured at particular locations or the cost of producing them.
We use natural gas extensively in the production of our products in the United States, Canada and Mexico. The price of natural gas can fluctuate significantly because of weather, environmental or other regulatory changes, which can materially impact our results of operations for a particular period. In an attempt to reduce our price risk related to fluctuations in natural gas prices, we enter into hedging agreements using swaps for natural gas purchases in the United States and Canada. Because we hedge the majority of our exposures, we would not be able to participate, for the portion we hedged, in substantial or extended declines in natural gas prices. As a result, our costs would remain elevated in such an environment. During periods of rising natural gas prices on the other hand, our production costs will rise to a lesser extent because of our hedging activities.
Transportation costs are also a significant portion of our variable costs. Increases in the cost of fuel, or if we are required to transport raw materials or finished products over longer distances, as was the case in 2017 in order to meet demand resulting from the hurricane in Texas, could result in material increases in the cost of transportation that could adversely affect our operating profits.
Our facilities may experience unexpected operational difficulties or catastrophic events.
Our facilities may be forced to cease operations unexpectedly due to equipment failures or events beyond our control, such as hurricanes, fires, floods, earthquakes or other environmental catastrophes. Any downtime or facility damage may hinder our ability to meet customer demand, reduce our sales or impede our ability to transport our products in an efficient and cost-effective manner, and could require that we make significant capital expenditures. Several of our plants, and production lines within our plants, are dedicated to specific products. If any of those plants or lines is unable to operate for a prolonged period, it
9
would reduce our ability to effectively compete in the markets for those products, which could materially and adversely affect our business, financial condition, operating results and cash flows.
We do not have majority control over UBBP, which involves risks not otherwise present when we operate our business through wholly-owned entities.
A substantial portion of our international operations are conducted through 50/50 joint ventures with Boral Limited, or Boral. These joint ventures are referred to as UBBP. UBBP involves risks not otherwise present when we operate our business through wholly-owned entities, including:
• | Certain major decisions with respect to UBBP require the majority or unanimous approval of the joint ventures’ boards or shareholders, which could result in a deadlock given the 50/50 ownership and equal board representation structure. Boral may have economic or other business interests or goals that are or become inconsistent with ours, and we may not be able to obtain approval of certain matters that would be in our or UBBP’s best interests. In addition, we may be required to spend additional resources to resolve any dispute with Boral. |
• | A deadlock with respect to certain fundamental decisions may result in the triggering of a sale process of UBBP. In such a case, the terms of the sale may be less attractive than if we had held onto our investment. |
• | UBBP is operated in accordance with the terms of a Shareholders Agreement that limits our ability to transfer our interest in UBBP. As a result, we may be unable to sell our interest in UBBP when we would otherwise like. |
• | UBBP may not pay dividends if such payments are, among other things, restricted pursuant to the terms of the credit facilities maintained by UBBP, inconsistent with the then-applicable strategic plan, or illegal. Accordingly, we may not receive dividend payments from UBBP in the amounts that we currently anticipate or at all, which may adversely impact our ability to receive any economic benefit from UBBP. |
• | If we or Boral are subject to a change of control, or if certain other events of default under the Shareholders Agreement occur with respect to us or Boral, we or Boral, as applicable, may be required to sell our or Boral's, as applicable, entire interest in UBBP at fair market value, as determined in accordance with the Shareholders Agreement. In the event we are forced to sell our interest in UBBP, it may be under terms that are not favorable to us. In the event Boral is the party that triggers the event of default we will have the right to acquire Boral’s interest in UBBP, but it may be on terms that we do not find favorable. In this circumstance, if we do not complete the acquisition due to lack of funding or otherwise, we would remain in the joint venture with Boral, but possibly under ownership that we do not find acceptable. |
• | In certain circumstances, a capital call may be issued to the shareholders of UBBP in order to obtain additional funding for the joint ventures' operations. If we do not provide capital and Boral does, Boral may receive additional shares in UBBP, thereby diluting our interest and diminishing our rights under the Shareholders Agreement. Further, although we intend for UBBP to be self-funding, we may nonetheless determine in the future that we need to provide additional capital in order for UBBP to continue operating. |
• | Boral may become insolvent, refuse to make additional capital contributions or fail to meet its obligations under the Shareholders Agreement or the two share sale and subscription agreements entered into with Boral, which may result in certain liabilities to us. |
• | In the event we exit UBBP, we may be restricted from competing in certain markets, many of which we anticipate to be high-growth markets, until the later of the third anniversary of our exit and ten years from the commencement of UBBP. In addition, in the event we exit UBBP, certain of our intellectual property will continue to be licensed to UBBP on a non-exclusive basis after our exit is completed. |
• | UBBP relies in part on new products and technology we develop. UBBP is contractually entitled to some, but not all, of our new products. If UBBP is unable to successfully implement new products to which it has a license, or if we are unable to agree on the terms for the contribution of new technology to UBBP, the joint ventures may not be able to effectively compete or grow their businesses. |
• | UBBP is required to protect our licensed trade secrets and confidential intellectual property in its territory, which includes countries where there is a high risk of intellectual property loss, and we also expend significant efforts to secure and enforce our intellectual property rights in UBBP’s territory. If UBBP is not diligent with its protections or our efforts are insufficient and competitors acquire our trade secrets and confidential intellectual property, then there may be a material adverse impact on our business both inside and outside of UBBP’s territory. |
10
If any of these risks were to materialize, our business, financial condition, operating results and cash flows could be materially and adversely impacted.
Our international operations expose us to risks that would not otherwise be present in our U.S. operations.
Our international business operations in the countries within the territory of UBBP and in Canada and Mexico, including our ability to introduce new products into these markets, are important to our future operations, growth and prospects. Our foreign operations and our international expansion subject us to a number of risks, including:
• | sensitivity to general economic conditions in each of the countries in which we or UBBP operate, including, in particular, the housing and construction-based markets; |
• | compliance with United States laws affecting operations outside of the United States, such as the Foreign Corrupt Practices Act or similar anti-bribery laws and regulations, or corruption in foreign countries; |
• | compliance with a variety of local laws and regulations, including environmental and safety laws and regulations |
• | changes in tax laws and the interpretation of those laws; |
• | imposition of more or new tariffs, quotas, trade barriers, and similar restrictions on our sales outside the United States, including cross-border intercompany sales; |
• | fluctuations in currency values and the impact on our consolidated results; |
• | changes in foreign currency exchange controls; |
• | discriminatory or conflicting fiscal policies; |
• | difficulties enforcing intellectual property and contractual rights, and securing information and infrastructure, in certain jurisdictions; |
• | greater risk of uncollectible accounts and longer collection cycles; and |
• | nationalization of properties by foreign governments. |
Moreover, political and economic changes or volatility, geopolitical regional conflicts, terrorist activity, political unrest, civil strife, acts of war, epidemics, public corruption and other economic or political uncertainties could interrupt and negatively affect our business operations. All of these factors could result in increased costs or decreased revenues, and could materially and adversely affect our business, financial condition, operating results and cash flows.
Our success is dependent on our ability to innovate and protect our intellectual property and other proprietary rights.
We maintain a leadership position and price premium in part because of our innovation and introduction of new products. As a result, our success also depends, in part, upon securing and enforcing our intellectual property rights. We rely on a combination of contractual rights, patent, copyright, trademark and trade secret laws to establish and protect our intellectual property. Despite our efforts to safeguard and maintain our intellectual property, the steps we have taken may be limited in their effect. Existing trade secret, patent, trademark and copyright laws offer only limited protection, and it may be expensive and time consuming to assert these protections against competitors who infringe on our rights and our patents could be invalidated or circumvented. In addition, others may develop substantially equivalent or superseding proprietary technology, or competitors may offer similar competing products that do not infringe on our intellectual property rights, thereby substantially reducing the value of our proprietary rights. Moreover, the laws of some foreign countries in which our products are or may be manufactured or sold may not protect our products or intellectual property rights to the same extent as do the laws of the United States. This risk may be heightened in connection with our investments in UBBP because it results in the use of our intellectual property in additional foreign jurisdictions, some of which lack robust or accessible intellectual property protection enforcement mechanisms.
We intend to continue making investments in research and development to develop new and improved products and more efficient manufacturing methods in order to maintain our market leadership position. If we do not make these investments, or our investments are not successful, our revenues, operating results and market share may be materially and adversely affected.
11
Capital expenditures to maintain our market leadership position and expand our businesses may not achieve their intended results.
In order to standardize and automate production across our businesses, we are investing in capital improvement projects, including an anticipated $300 million investment in advanced manufacturing over four years, which we believe will materially improve our operating results. In addition, many of our facilities have been in operation for many years and require capital expenditures to maintain optimal efficiency. Future downturns in our industry or businesses may prevent us from having the funds necessary to make anticipated capital expenditures, and there may be delays or cost increases in completing these projects. Further, our return on investment from our advanced manufacturing investments or other capital expenditures may not be sufficient to recover the expenses associated with these initiatives and we may not achieve the expected $100 million in incremental EBITDA by the end of 2020.
A disruption in our information technology systems due to a catastrophic event or security breach could interrupt or damage our operations.
In the conduct of our business we collect, use, transmit and store data on information systems, which are vulnerable to an increasing threat of continually evolving cyber security risks. Any security breach or compromise of our information systems could significantly impact our operations, damage our reputation, cause the disclosure of confidential customer, employee, supplier or company information, including our intellectual property, and result in significant losses, litigation, fines and costs. The security measures we have implemented to protect against unauthorized access to our information systems and data may not be sufficient to prevent breaches. The regulatory environment related to information security, data collection and privacy is evolving, with new and constantly changing requirements applicable to our business, and compliance with those requirements could result in additional costs.
We also compete through our use and improvement of information technology. In order to remain competitive, we need to provide customers with timely, accurate, easy-to-access information about product availability, orders and delivery status. While we have provided manual processes for short-term failures and disaster recovery capability, a prolonged disruption of systems or other failure to meet customers’ expectations regarding the capabilities and reliability of our systems may materially and adversely affect our operating results.
Compliance with environmental and safety laws and regulations or product safety concerns could cause us to make modifications to how we manufacture our products, negatively affect our results and also require that we make significant capital investments or otherwise increase our costs.
We operate 49 plants and 12 mines and quarries in North America. As a result, we are subject to numerous federal, state, local and foreign laws and regulations governing the protection of the environment and occupational health and safety, including laws regulating air emissions, wastewater discharges, the management and disposal of hazardous materials and wastes, and the health and safety of our employees. We are also required to obtain permits from governmental authorities for certain operations. If we were to fail to comply with these laws, regulations or permits, we could incur fines, penalties or other sanctions and be subject to private litigation. In addition, in the past we have been, and in the future could be, held responsible for costs and damages arising from any contamination at our past or present facilities or at third-party waste disposal sites. Further, new environmental and safety laws and regulations may cause us to incur material expenses relating to compliance, impact the availability and cost of raw materials and have a material and adverse impact on our operations and results.
While the U.S. EPA has begun the process to repeal the Clean Power Plan, under which the U.S. EPA would have set state-specific goals for greenhouse gas, or GHG, emissions reductions, certain states, provinces and foreign countries are considering measures to reduce emission of GHGs, including carbon dioxide and methane, and many have already adopted GHG regulation or legislation. Regulations requiring reductions in GHG emissions could affect future expansions or modifications at our plants, mines and quarries and may require that we incur significant costs and additional capital investment to satisfy permitting requirements. In addition, enactment of new climate change legislation, regulatory initiatives or treaties impacting the locations where we conduct business could have a material adverse effect on our operations. For example, legislation establishing a “carbon tax” on energy use or a “cap and trade,” could materially and adversely increase the cost of energy used in our manufacturing processes.
Legal challenges to the U.S. EPA’s final rule regarding the use of synthetic gypsum, or subsequent state legislation, could also result in laws or regulations that adversely affect the classification, use, storage and disposal of synthetic gypsum. Such laws or regulations may require significant capital investments to convert those plants and lines that use synthetic gypsum to natural gypsum.
12
The building materials industry has been subject to claims relating to raw materials, as well as claims for incidents of catastrophic loss, such as building fires. We have rigorous product safety and quality standards and a strong commitment to product safety and quality. However, if our products do not meet applicable safety standards or customers’ expectations regarding safety, we could experience decreased sales, increased costs and/or be exposed to legal and reputational risks. Events that give rise to actual, potential or perceived product safety concerns could expose us to government enforcement action and/or private litigation. Reputational damage caused by real or perceived product safety concerns could negatively affect our business and results of operations, and product liability insurance coverage may not be available or adequate in all circumstances to cover claims that may arise in the future.
Legal and governmental proceedings, including those involving antitrust, tax, environmental, intellectual property or other matters, may result in significant costs.
We are party to litigation and governmental proceedings, including, but not limited to, a federal grand jury investigation of the gypsum drywall industry. We could become subject to legal claims in the future, some of which could become material. We may also initiate legal proceedings in order to defend and enforce our proprietary rights. The outcome of legal and governmental proceedings may differ from our expectations because the outcomes of litigation and governmental proceedings are often difficult to reliably predict. Various developments can lead to changes in management’s estimates of liabilities. Those developments include judicial rulings or judgments, settlements, or regulatory developments or changes in applicable law. A future adverse ruling, settlement or unfavorable development could result in charges that could have a material adverse effect on our results of operations in any particular period, or we could be unsuccessful in protecting our intellectual property. For a more detailed discussion of certain of the legal proceedings in which we are involved, see Item 3, Legal Proceedings, below.
A small number of our stockholders could significantly influence our business, affairs and stock price.
Based on filings made with the SEC, we believe that, as of January 31, 2018, two stockholders collectively controlled approximately 41% of our common stock. Accordingly, a small number of our stockholders could affect matters requiring approval by stockholders, including the election of directors and the approval of potential business combination transactions. One or more of these stockholders may have interests that differ from other stockholders and may vote on such matters in a way that is adverse to the interests of those other stockholders. In addition, if one or more of these stockholders engage in sales of our common stock, our share price may decline.
We may pursue acquisitions, joint ventures and other transactions to complement or expand our businesses, which even if completed, may involve a number of risks.
We may pursue additional opportunities to acquire businesses or technologies and to form joint ventures that we believe could complement, enhance or expand our current businesses or product lines or that might otherwise offer us growth opportunities. Such pursuits may be costly and unsuccessful and cause diversion of management’s attention from day-to-day operations. Even if completed, potential issues associated with these activities could include, among other things, difficulty with integrating business operations, infrastructure and personnel, and our ability to realize the full extent of the expected returns, benefits, cost savings or synergies as a result of a transaction within the anticipated time frame, or at all.
Significant changes in factors and assumptions used to measure our defined benefit plan obligations, actual investment returns on pension assets and other factors could negatively impact our operating results and cash flows.
The recognition of costs and liabilities associated with the pension and postretirement plans is affected by assumptions made by management and used by actuaries engaged by us to calculate the benefit obligations and the expenses recognized for these plans. The inputs used in developing the required estimates are calculated using a number of assumptions, which represent management’s best estimate of the future. The assumptions that have the most significant impact on costs and liabilities are the discount rate, the estimated long-term return on plan assets for the funded plans, retirement rates, and mortality rates. These assumptions are generally updated annually.
As of December 31, 2017, our pension plans were underfunded by $193 million and our unfunded postretirement plan liabilities were approximately $150 million. In recent years, declining interest rates have negatively impacted the funded status of our pension and postretirement plans. Funding requirements for our pension plans may become more significant. If our cash flows and capital resources are insufficient to fund our obligations under these pension and postretirement plans, we could be forced to reduce or delay investments and capital expenditures, seek additional capital, or incur indebtedness.
13
We may not be able to fully execute our stock repurchase program and may not otherwise return capital to our stockholders in the foreseeable future.
In 2017 we announced a stock repurchase program in which we may repurchase up to $250 million of our common stock. On February 1, 2018 we announced an increase in this stock repurchase program, bringing the total size of the program to $500 million. There is no guarantee as to the exact number of shares or value that will be repurchased under the stock repurchase program and we may discontinue purchases at any time. Whether we make any further repurchases will depend on many factors, including but not limited to our business and financial performance, the business and market conditions at the time, including the price of our shares, and other factors that management considers relevant. Additionally, we expect to fund repurchases under our stock repurchase program through cash on hand, which may impact our ability to pursue potential strategic opportunities. Although our stock repurchase program is intended to enhance long-term stockholder value, short-term stock price fluctuations could reduce the program’s effectiveness and there can be no assurance that any stock repurchases will enhance stockholder value.
Our credit agreement limits our ability to pay a dividend or repurchase our stock unless specified borrowing availability and fixed charge coverage ratio tests are met, and it prohibits payment of a dividend or repurchase of our stock if a default exists under the agreement. Accordingly, we may be required to cease repurchasing stock for periods of time in order to maintain compliance with our credit agreement terms. In addition, we have not paid a dividend on our common stock since the first quarter of 2001, and there can be no assurance that we will do so in the foreseeable future. If we do not pay dividends or continue to execute on our stock repurchase program, investors will have to rely on the possibility of stock appreciation and sell their shares to realize a return on their investment.
If we experience an “ownership change” within the meaning of the Internal Revenue Code, utilization of our net operating loss, or NOL, carryforwards would be subject to an annual limitation.
Our NOL carryforwards are a substantial asset for us. The Internal Revenue Code imposes limitations on a corporation’s ability to utilize NOLs if it experiences an “ownership change,” which may result from transactions increasing the ownership of certain stockholders in the stock of a corporation by more than 50 percentage points over a rolling three-year period. If we were to experience an ownership change, utilization of our NOLs would be subject to an annual limitation that may be carried over to later years within the allowed NOL carryforward period. Over the entire carryforward period, we may not be able to use all our NOLs due to the aforementioned annual limitation. If an ownership change had occurred as of December 31, 2017, our annual U.S. federal NOL utilization would have been limited to approximately $107 million per year.
Although we have our stockholder rights plan and transfer restrictions in our Restated Certificate of Incorporation, which are intended to reduce the likelihood of an “ownership change” that could adversely affect our NOL untilization, we cannot provide assurance that these restrictions on transferability will prevent all transfers that could result in such an “ownership change.” There also can be no assurance that the transfer restrictions in our Restated Certificate of Incorporation will be enforceable against all of our stockholders absent a court determination confirming such enforceability. The transfer restrictions may be subject to challenge on legal or equitable grounds.
We may not be able to pursue certain strategic opportunities unless we increase our indebtedness and leverage ratio. Our level of indebtedness also requires us to dedicate a portion of our cash flow to debt payments and limits our ability to engage in certain business activities.
As of December 31, 2017, we had $1.1 billion of outstanding debt, consisting of senior notes and industrial revenue bonds, which is within our target leverage ratio range of 1.5x to 2.0x adjusted debt/EBITDA. We may not be able to pursue certain strategic opportunities that may otherwise be available to us without incurring additional indebtedness and thereby increasing our leverage ratio outside of our target range.
Our current debt service obligations also require us to dedicate a portion of our cash flow from operating activities to payments on our indebtedness, which reduces the availability to use our cash flow for other purposes, including capital expenditures, research and development efforts, potential acquisitions or investments. If we are unable to fund our business activities, meet our obligations under our debt agreements or are contractually restricted from pursuing activities or transactions that we believe are in our long-term best interests, our business, financial condition, results of operations and cash flows could be adversely affected. Our indebtedness also may increase our vulnerability to economic and industry downturns and changing market conditions and place us at a competitive disadvantage relative to competitors that have less debt. We are required to post letters of credit or cash as collateral primarily in connection with our hedging transactions, insurance programs and bonding activities. The amounts of collateral we are required to post may vary based on our financial position and credit ratings. Use of letters of credit as collateral reduces our borrowing availability under our domestic revolving credit agreement and, therefore, like the use of cash as collateral, reduces our overall liquidity and our ability to fund other business activities.
14
The terms of our debt agreements, including our credit facility, may also limit our ability to engage in certain activities and transactions that may be in our long-term interest. Among other things, unless we obtain approval, the covenants contained in our debt agreements may restrict or limit our ability to incur additional indebtedness, pay dividends or repurchase our common stock, make guarantees, sell our assets or make other fundamental changes, engage in mergers, acquisitions and dispositions, make investments, change our business purpose, or enter into certain transactions with affiliates. We may also be required to maintain specified financial ratios, which may require that we take action to reduce our debt or to act in a manner contrary to our current business plans. Our ability to comply with these covenants and financial ratios may be affected by events beyond our control, and we may not be able to continue to meet those covenants and ratios. Breach of any of the covenants or ratios contained in the agreements governing our debt, or our inability to pay interest on, or principal of, our outstanding debt as it becomes due, could result in an event of default, in which case, our lenders could declare all amounts outstanding to be immediately due and payable. If this occurs, we may not be able to refinance the accelerated debt on favorable terms, or at all, or repay the accelerated debt, and our liquidity may be adversely impacted.
Item 1B. | UNRESOLVED STAFF COMMENTS |
None
15
Item 2.PROPERTIES
Our leased corporate headquarters is located in Chicago, Illinois. We operate plants, mines, quarries, and other facilities throughout North America. The locations of our production properties in operation for our consolidated segments as of December 31, 2017 are as follows (plants are owned unless otherwise indicated):
U.S. Wallboard and Surfaces | U.S. Performance Materials | U.S. Ceilings | ||||||||||||||
Gypsum wallboard and other gypsum products | Surface preparation and joint treatment products | Under-layment | Building Envelope | Structural | Ceiling Tile | Ceiling Grid | Specialty Ceilings | |||||||||
Alabaster (Tawas City), Michigan | x | |||||||||||||||
Aliquippa, Pennsylvania* | x | |||||||||||||||
Atlanta, Georgia*** | x | |||||||||||||||
Auburn, Washington | x | |||||||||||||||
Baltimore, Maryland* | x | x | x | |||||||||||||
Bridgeport, Alabama* | x | x | ||||||||||||||
Cartersville, Georgia | x | |||||||||||||||
Chamblee, Georgia | x | |||||||||||||||
Cloquet, Minnesota | x | |||||||||||||||
Commerce, California*** | x | |||||||||||||||
Dallas, Texas | x | |||||||||||||||
Delavan, Wisconsin | x | |||||||||||||||
Detroit (River Rouge), Michigan | x | x | ||||||||||||||
East Chicago, Indiana* | x | x | ||||||||||||||
Fort Dodge, Iowa | x | x | x | |||||||||||||
Galena Park, Texas* | x | x | ||||||||||||||
Greenville, Mississippi | x | |||||||||||||||
Gypsum, Ohio* | x | x | x | |||||||||||||
Jacksonville, Florida* | x | x | x | |||||||||||||
New Orleans, Louisiana* | x | |||||||||||||||
Norfolk, Virginia* | x | |||||||||||||||
North Kansas City, Missouri | x | |||||||||||||||
Oakfield, New York | x | |||||||||||||||
Otsego, Michigan | x | |||||||||||||||
Phoenix (Glendale), Arizona*** | x | |||||||||||||||
Plaster City, California | x | x | ||||||||||||||
Port Reading, New Jersey | x | |||||||||||||||
Rainier, Oregon | x | |||||||||||||||
Shoals, Indiana** | x | |||||||||||||||
Sigurd, Utah | x | x | ||||||||||||||
Southard, Oklahoma | x | x | ||||||||||||||
Sperry, Iowa** | x | |||||||||||||||
Stockton, California | x | |||||||||||||||
Sweetwater, Texas | x | x | x | |||||||||||||
Torrance, California | x | x | ||||||||||||||
Walworth, Wisconsin | x | |||||||||||||||
Washingtonville, Pennsylvania* | x | |||||||||||||||
Westlake, Ohio | x | x | ||||||||||||||
Weirton, West Virginia*** | x | |||||||||||||||
* Plants supplied fully by synthetic gypsum
** Plants supplied partially by synthetic gypsum
*** Leased
16
Canada | ||||||||
Gypsum wallboard and other gypsum products | Surface preparation and joint treatment products | Ceiling Grid | Specialty Ceilings | |||||
Calgary, Alberta, Canada*** | x | |||||||
Hagersville, Ontario, Canada** | x | x | ||||||
Montreal, Quebec, Canada** | x | x | ||||||
Oakville, Ontario, Canada | x | x | ||||||
Surrey, British Columbia, Canada*** | x | |||||||
** Plants supplied partially by synthetic gypsum
*** Leased
OTHER
We operate in facilities located in Monterrey, Nuevo Leon, Mexico; Puebla, Puebla, Mexico; Saltillo, Coahuila, Mexico; San Luis Potosi, San Luis Potosi, Mexico; and Tecoman, Colima, Mexico for our gypsum wallboard and other gypsum products that are not included in the above reportable segments.
We produce paper at facilities in Galena Park, Texas; North Kansas City, Missouri; Oakfield, New York; and Otsego, Michigan. We operate mines or quarries in Alabaster, Michigan; Fort Dodge, Iowa; Hagersville, Ontario, Canada; Monterrey, Nuevo Leon, Mexico; Plaster City, California; San Luis Potosi, San Luis Potosi, Mexico; Shoals, Indiana; Sigurd, Utah; Southard, Oklahoma; Sperry, Iowa; Spruce Pine, North Carolina; Sweetwater, Texas; and Tecoman, Colima, Mexico. We operate a mica-processing plant at Spruce Pine, North Carolina. We manufacture mineral fiber products at Red Wing, Minnesota, and Walworth, Wisconsin, and metal specialty systems at Oakville, Ontario, Canada.
Gypsum's Sheetrock® brand gypsum wallboard plants operated at approximately 66% of capacity during 2017.
Item 3. | LEGAL PROCEEDINGS |
See Part II, Item 8, Financial Statements and Supplementary Data - Notes to Consolidated Financial Statements, Note 18, Litigation, for information on legal proceedings.
Item 4. | MINE SAFETY DISCLOSURES |
The information concerning mine safety violations or other regulatory matters required by Section 1503(a) of the Dodd-Frank Wall Street Reform and Consumer Protection Act and Item 104 of Regulation S-K promulgated by the SEC is included in Exhibit 95 to this report.
17
PART II
Item 5. | MARKET FOR THE REGISTRANT’S COMMON EQUITY, RELATED STOCKHOLDER MATTERS AND ISSUER PURCHASES OF EQUITY SECURITIES |
Our common stock trades on the New York Stock Exchange, or NYSE, and the Chicago Stock Exchange under the symbol USG. The NYSE is the principal market for our common stock. As of January 31, 2018, there were 1,742 record holders of our common stock. We currently do not pay dividends on our common stock. Our credit facility limits our ability to pay cash dividends on or repurchase our common stock unless specified borrowing availability and fixed charge ratios are met. See Item 7, Management's Discussion and Analysis of Financial Condition and Results of Operations, Liquidity, for more information regarding these restrictions.
The following table sets forth for the indicated periods the high and low intra-day sales prices per share for our common stock on the NYSE in 2017 and 2016.
2017 | 2016 | ||||||||||||||
High | Low | High | Low | ||||||||||||
First quarter | $ | 34.67 | $ | 28.14 | $ | 24.99 | $ | 15.85 | |||||||
Second quarter | 32.97 | 27.89 | 29.98 | 24.30 | |||||||||||
Third quarter | 32.96 | 25.60 | 30.84 | 25.31 | |||||||||||
Fourth quarter | 38.91 | 31.70 | 32.26 | 23.71 | |||||||||||
See Part III, Item 12, Security Ownership of Certain Beneficial Owners and Management and Related Stockholder Matters, for information regarding common stock authorized for issuance under equity compensation plans.
Pursuant to our Deferred Compensation Program for Non-Employee Directors, four of our non-employee directors deferred the $120,000 annual grant and one of our non-employee directors deferred a portion of the quarterly retainer payment that those non-employee directors were entitled to receive on December 31, 2017 under our Non-Employee Director Compensation Program into a total of 12,963 deferred stock units. These units will increase or decrease in value in direct proportion to the market value of our common stock and will be paid in shares of common stock following termination of service as a director. The issuance of these deferred stock units was effected through a private placement under Section 4(a)(2) of the Securities Act and was exempt from registration under Section 5 of the Securities Act.
18
PERFORMANCE GRAPH
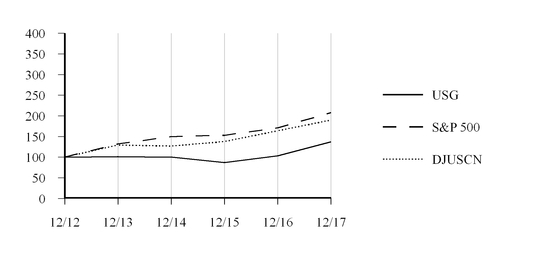
The following graph and table compare the cumulative total stockholder return on our common stock with the Standard and Poor’s 500 Index, or S&P 500, and the Dow Jones U.S. Construction and Materials Index, or DJUSCN, in each case assuming an initial investment of $100 and full dividend reinvestment, for the five-year period ended December 31, 2017.
Value of Investment as of December 31, | |||||||||||||||||||||||
2012 | 2013 | 2014 | 2015 | 2016 | 2017 | ||||||||||||||||||
USG | $ | 100 | $ | 101 | $ | 100 | $ | 87 | $ | 103 | $ | 137 | |||||||||||
S&P 500 | 100 | 132 | 150 | 153 | 171 | 208 | |||||||||||||||||
DJUSCN | 100 | 129 | 127 | 138 | 164 | 190 | |||||||||||||||||
All amounts are rounded to the nearest dollar.
On February 1, 2017, we announced that our Board of Directors approved a stock repurchase program of $250 million, and on February 1, 2018 we announced an increase in this stock repurchase program, bringing the total size of the program to $500 million. Under the program, we may repurchase shares from time to time in open market transactions or in privately-negotiated transactions in accordance with applicable securities laws, including under plans complying with Rule 10b5-1 under the Exchange Act. We may discontinue the program at any time, and the program has no set expiration date. The timing and amount of any repurchase of shares is determined by our management, based on its evaluation of market conditions, cash on hand, applicable legal requirements and other factors. The following table provides information about purchases of our common stock we made during the three months ended December 31, 2017:
Issuer Purchases of Equity Securities | ||||||||||||||
Period | Total number of shares purchased | Average price paid per share | Total number of shares purchased as part of publicly announced plans or programs | Approximate dollar value of shares that may yet be purchased under the plans or programs (millions) | ||||||||||
October 1, 2017 to October 31, 2017 | 364,201 | $ | 32.83 | 364,201 | $ | 85 | ||||||||
November 1, 2017 to November 30, 2017 | 356,375 | $ | 34.77 | 356,375 | $ | 72 | ||||||||
December 1, 2017 to December 31, 2017 (a) | 161,275 | $ | 37.47 | 161,275 | $ | 66 | ||||||||
Total | 881,851 | 881,851 | ||||||||||||
(a) | Approximate dollar value of shares that may yet be purchased under the plans or programs as of December 31, 2017 does not include the additional $250 million approved by our Board of Directors in 2018. |
19
Item 6. | SELECTED FINANCIAL DATA |
(millions, except per-share and employee data) | Years Ended December 31, | ||||||||||||||||||
2017 | 2016 | 2015 (a) | 2014 (a) | 2013 (a) | |||||||||||||||
Statement of Income Data: | |||||||||||||||||||
Net sales | $ | 3,204 | $ | 3,017 | $ | 2,913 | $ | 2,904 | $ | 2,792 | |||||||||
Cost of products sold | 2,539 | 2,312 | 2,263 | 2,279 | 2,232 | ||||||||||||||
Gross profit | 665 | 705 | 650 | 625 | 560 | ||||||||||||||
Selling and administrative expenses | 298 | 304 | 302 | 323 | 302 | ||||||||||||||
Litigation settlement charge (b) | — | — | — | 48 | — | ||||||||||||||
Long-lived asset impairment charges (c) | — | 10 | — | 90 | — | ||||||||||||||
Shipping operations (d) | — | (3 | ) | (7 | ) | 15 | — | ||||||||||||
Restructuring charges | — | — | — | — | 4 | ||||||||||||||
Operating profit | 367 | 394 | 355 | 149 | 254 | ||||||||||||||
Income (loss) from equity method investments | 59 | 49 | 48 | 33 | (1 | ) | |||||||||||||
Interest expense, net | (65 | ) | (141 | ) | (161 | ) | (178 | ) | (200 | ) | |||||||||
Income and gain from sale of equity method investment to related party (e) | — | — | 13 | 2 | 2 | ||||||||||||||
Gain on deconsolidation of subsidiaries and consolidated joint ventures (f) | — | — | — | 27 | — | ||||||||||||||
Loss on extinguishment of debt | (22 | ) | (37 | ) | (19 | ) | — | — | |||||||||||
Other (expense) income, net | (4 | ) | 9 | — | — | — | |||||||||||||
Income from continuing operations before income taxes | 335 | 274 | 236 | 33 | 55 | ||||||||||||||
Income tax (expense) benefit (g) | (238 | ) | (63 | ) | 740 | (7 | ) | (11 | ) | ||||||||||
Income from continuing operations | 97 | 211 | 976 | 26 | 44 | ||||||||||||||
(Loss) income from discontinued operations, net of tax | (9 | ) | 20 | 15 | 12 | 2 | |||||||||||||
Gain on sale of discontinued operations, net of tax (a) | — | 279 | — | — | — | ||||||||||||||
Net income | 88 | 510 | 991 | 38 | 46 | ||||||||||||||
Less: Net income (loss) attributable to noncontrolling interest | — | — | — | 1 | (1 | ) | |||||||||||||
Net income attributable to USG | $ | 88 | $ | 510 | $ | 991 | $ | 37 | $ | 47 | |||||||||
Income from continuing operations per average common share: | |||||||||||||||||||
Basic | $ | 0.67 | $ | 1.45 | $ | 6.70 | $ | 0.18 | $ | 0.40 | |||||||||
Diluted | 0.66 | 1.44 | 6.62 | 0.17 | 0.39 | ||||||||||||||
Balance Sheet Data (as of the end of the year): | |||||||||||||||||||
Working capital | $ | 576 | $ | 527 | $ | 408 | $ | 546 | $ | 1,080 | |||||||||
Current ratio | 2.39 | 2.25 | 1.41 | 1.97 | 2.90 | ||||||||||||||
Cash and cash equivalents (a) | 394 | 427 | 442 | 231 | 815 | ||||||||||||||
Property, plant and equipment, net (a) | 1,762 | 1,707 | 1,771 | 1,891 | 2,088 | ||||||||||||||
Total assets | 3,851 | 3,869 | 4,736 | 3,936 | 4,051 | ||||||||||||||
Long-term debt (h) | 1,078 | 1,083 | 1,675 | 2,191 | 2,275 | ||||||||||||||
Total stockholders’ equity | 1,845 | 1,886 | 1,436 | 408 | 662 | ||||||||||||||
(a) | Results have been adjusted from the originally reported amounts to reflect L&W, which was sold on October 31, 2016, as a discontinued operation. We recorded a gain of $279 million on the sale of the business. See Note 3 to our consolidated financial statements in Part II, Item 8 of this report. |
(b) | Reflects a charge related to the settlement of the U.S. wallboard pricing class action lawsuits. |
(c) | Reflects long–lived asset impairment charges on mining operations in 2016. See Note 12 to our consolidated financial statements in Part II, Item 8 of this report. The amount in 2014 reflects impairment charges on manufacturing facilities, capitalized costs for the construction of future facilities and ocean vessels. |
(d) | Item relates to our shipping operations. See Note 13 to our consolidated financial statements in Part II, Item 8 of this report. |
(e) | Reflects the gain recorded on the sale of our equity method investment in our Knauf-USG joint venture to our 50/50 joint venture partner in 2015 and our share of the net income from the equity method investment for all periods presented. See Note 4 to our consolidated financial statements in Part II, Item 8 of this report. |
(f) | Reflects the gain recorded on the deconsolidation and contribution to UBBP of our wholly-owned subsidiaries in Singapore, Malaysia, New Zealand, and Australia and our consolidated joint ventures in Oman. |
(g) | Income tax expense for 2017 includes $145 million of expense related to the Tax Cuts and Jobs Act, or the 2017 Tax Act. The 2015 benefit includes the reversal of a tax valuation allowance of $731 million. See Note 15 to our consolidated financial statements in Part II, Item 8 of this report. |
(h) | Excludes currently maturing portion of long-term debt. |
20
Item 7. | MANAGEMENT’S DISCUSSION AND ANALYSIS OF FINANCIAL CONDITION AND RESULTS OF OPERATIONS |
OVERVIEW
USG, through our subsidiaries and joint ventures, is a leading manufacturer of building materials and innovative solutions. We produce a wide range of products under recognized brand names including Sheetrock®, Durock®, Fiberock®, and Securock® serving the new residential, new nonresidential, and residential and nonresidential repair and remodel construction markets as well as products used in certain industrial processes, enabling our customers to build the outstanding spaces where people live, work and play.
KEY STRATEGIES
In 2017, we outlined our strategy which includes the following four pillars:
• | Profitably grow our core portfolio, |
• | Innovate to address industry challenges, |
• | Align and enable our organization, and |
• | Maintain disciplined capital allocation. |
In addition, in the fourth quarter of 2017 we realigned our organizational structure to reflect three divisions, in addition to UBBP: Gypsum, Performance Materials and Ceilings. As a result of our realigned operating structure, we changed the composition of our reportable segments effective for the quarter ended December 31, 2017 to align with how we manage our businesses, review operating performance and allocate resources considering the discrete information available for the geographies within those divisions. We now have five reportable segments: U.S. Wallboard and Surfaces, U.S. Performance Materials, U.S. Ceilings, Canada, and UBBP.
MARKET CONDITIONS AND OUTLOOK
Our businesses are cyclical in nature and sensitive to changes in general economic conditions, including, in particular, conditions in the housing and construction-based markets in North America. Our business in the markets of Asia, Australasia, and the Middle East also significantly exposes us to the economic conditions in those areas. However, the UBBP joint ventures have helped diversify USG’s overall exposure to changes in the North American economic conditions. The markets we serve can be broadly categorized as new residential construction, new nonresidential construction and repair and remodel activity, which includes both residential and nonresidential construction.
The following table summarizes the current market conditions and outlook for our primary end markets in North America.
End Market | Lead time | Metric | Source | Market Condition/Outlook |
New Residential | Installation of gypsum products(a) into a single family home typically follows a housing start by 90-120 days | Housing starts (seasonally adjusted) | U.S. Census Bureau | 2017 - 1.202 million 2016 - 1.174 million |
Industry forecast (Blue Chip Economic Indicators) | 2018 - 1.22 million to 1.35 million (b) | |||
USG forecast | 2018 estimated - 1.25 million (c) | |||
New Nonresidential | Installation of gypsum(a) and ceilings products typically follows signing of construction contracts by about 12 to 18 months | Change in floor space for which contracts are signed | Dodge Data & Analytics | 2017 from 2016 - 2% increase |
Industry forecast (Dodge Data & Analytics) (d) | 2018 from 2017 - 2% increase | |||
USG forecast | 2018 estimated to increase by low to mid single digits | |||
Repair and Remodel (e) | Remodels typically begin within two years from purchase | Sales of existing homes (seasonally adjusted) | National Association of Realtors | 2017 - 5.51 million 2016 - 5.45 million |
Overall repair and remodel spending for gypsum products | USG forecast | 2018 spending estimated to increase by low to mid single digits | ||
(a) | Gypsum products include products manufactured and marketed by our U.S. Wallboard and Surfaces segment and Fiberock® brand gypsum fiber panels manufactured and marketed by our U.S. Performance Materials segment. |
(b) | Forecast based on the average of the bottom ten and top ten forecasts included in the report, respectively. |
(c) | USG estimate is based on the seasonally adjusted annual rate of housing starts. |
(d) | Dodge Data & Analytics' forecast includes several building types which do not generate significant demand for our products. |
(e) | The repair and remodel market includes renovation of both residential and nonresidential buildings. |
21
As indicated in the table above, we expect modest improvement in the U.S. construction markets over the next twelve months. However, while sales of products in our U.S. Wallboard and Surfaces and U.S. Performance Materials segments have generally improved with the modest recovery in residential housing, the segments continue to be adversely affected by the low level of residential and other construction activity compared to historical averages. The results of our U.S. Ceilings segment, which primarily serves the nonresidential market, have shown some improvement over the longer term. However, the results also continue to be adversely affected by the low levels of new nonresidential construction activity as compared to historical averages. Our U.S. Ceilings segment is also adversely affected by changing construction preferences, such as the shift to open plenum and specialty ceilings. We acquired Ceilings Plus in 2017 to help address this trend.
We also expect modest improvement in the construction industry in Canada. Other international markets, including those that are within the UBBP territory, provide opportunities for our operations to serve the demand in these regions. Australia is expected to experience a decline in housing starts; however, these housing starts are expected to remain above the long-term average. The construction industry in South Korea has slowed, driven by increased government regulations. The construction industry in Thailand is showing slight improvement due to growth in the government infrastructure market. Several emerging markets which are within the UBBP territory are forecasted to experience growth. The international markets within the UBBP territory are beginning to adopt Western building practices, which provide more opportunities. We anticipate that the performance of the UBBP joint ventures will partially offset some of the potential cyclicality in our North American businesses.
The following table summarizes the industry information on U.S. wallboard shipments and capacity.
U.S. Industry Information | Metric | Source | Market Condition/Outlook |
U.S. industry shipments of gypsum board (a) | Billion of square feet (bsf) | Gypsum Association | Twelve months 2017 - 25.7 bsf Twelve months 2016 - 25.0 bsf |
USG forecast | 2018 shipments expected to increase by low single digits | ||
U.S. wallboard capacity | Billion of square feet (bsf) | USG estimate | 1/1/2018 - 34.0 bsf |
U.S. industry capacity utilization rate | Annualized shipments as a percentage of industry capacity | USG estimate | Twelve months 2017 - 76% Twelve months 2016 - 75% |
(a) | The gypsum board market as determined by the Gypsum Association includes gypsum wallboard, other gypsum-related paneling products, such as glass mat sheathing and gypsum fiber boards, and imports. |
We shipped 6.12 billion square feet of USG Sheetrock® brand gypsum wallboard in 2017, a 6% increase from 5.76 billion square feet in 2016. Our share of the gypsum board market in the United States, which includes, for comparability, shipments of Gypsum products of USG Sheetrock® brand gypsum wallboard and Securock® brand glass mat sheathing and Performance Materials product of Fiberock® brand gypsum fiber panels, increased to 25.4% in 2017 from 24.6% in 2016.
There is excess wallboard production capacity industry-wide in the United States. Based on current industry trends and forecasts, demand for gypsum wallboard is expected to increase in 2018, but the magnitude of any increase will depend on the levels of housing starts and repair and remodel activity, among other factors. We project that the industry capacity utilization rate will increase modestly in 2018 compared to 2017.
We could experience pressure on gypsum wallboard selling prices and our gross margins at these levels of capacity utilization. Our U.S. Wallboard and Surfaces segment implemented a price increase for wallboard in January 2018. However, it is uncertain that we will be able to maintain the increase or obtain additional price increases in our selling prices. If we are unable to maintain or implement additional price increases, our net sales, operating results and cash flows may be materially and adversely impacted.
22
GEOGRAPHIC INFORMATION
In 2017, we recorded $3.2 billion of net sales in our consolidated statement of income, and net sales for UBBP, which are not included in our consolidated statements of income, were $1.2 billion. The following charts reflect the geographic breakdown of net sales for the year ended December 31, 2017.
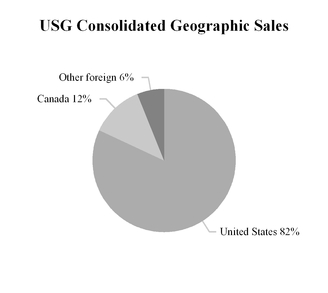
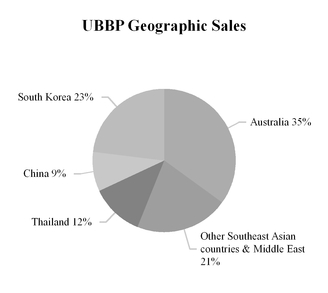
CURRENCY IMPACT
The impact of currency on consolidated and segment results for 2017 and 2016 has been derived by translating current period results at the year-to-date average foreign currency rates for the period ending December 31, 2016 and December 31, 2015, respectively.
PRESENTATION OF FINANCIALS
In connection with the preparation of this report, certain adjustments related to our implementation of the Tax Cuts and Jobs Act, or the 2017 Tax Act, were recorded in our financial statements subsequent to our earnings release furnished on Form 8-K on February 1, 2018. The non-cash tax charge related to the revaluation and change in realizability of our deferred tax assets was increased from $138 million to $145 million.
23
CONSOLIDATED RESULTS OF OPERATIONS
Favorable (Unfavorable) | |||||||||||||||||||||||||
2017 vs. 2016 | 2016 vs. 2015 | ||||||||||||||||||||||||
(millions, except per-share data) | 2017 | 2016 | 2015 | $ | % | $ | % | ||||||||||||||||||
Net sales | $ | 3,204 | $ | 3,017 | $ | 2,913 | $ | 187 | 6 | % | $ | 104 | 4 | % | |||||||||||
Cost of products sold | 2,539 | 2,312 | 2,263 | (227 | ) | (10 | )% | (49 | ) | (2 | )% | ||||||||||||||
Gross profit | 665 | 705 | 650 | (40 | ) | (6 | )% | 55 | 8 | % | |||||||||||||||
Selling and administrative expenses | 298 | 304 | 302 | 6 | 2 | % | (2 | ) | (1 | )% | |||||||||||||||
Long-lived asset impairment charges | — | 10 | — | 10 | 100 | % | (10 | ) | * | ||||||||||||||||
Recovery of receivable | — | (3 | ) | (6 | ) | (3 | ) | (100 | )% | (3 | ) | (50 | )% | ||||||||||||
Gain on disposal of shipping operations, net | — | — | (1 | ) | — | — | % | (1 | ) | (100 | )% | ||||||||||||||
Operating profit | 367 | 394 | 355 | (27 | ) | (7 | )% | 39 | 11 | % | |||||||||||||||
Income from equity method investments | 59 | 49 | 48 | 10 | 20 | % | 1 | 2 | % | ||||||||||||||||
Interest expense | (69 | ) | (145 | ) | (163 | ) | 76 | 52 | % | 18 | 11 | % | |||||||||||||
Interest income | 4 | 4 | 2 | — | — | % | 2 | 100 | % | ||||||||||||||||
Income and gain on sale from equity method investment to related party | — | — | 13 | — | — | % | (13 | ) | (100 | )% | |||||||||||||||
Loss on extinguishment of debt | (22 | ) | (37 | ) | (19 | ) | 15 | 41 | % | (18 | ) | (95 | )% | ||||||||||||
Other (expense) income, net | (4 | ) | 9 | — | (13 | ) | * | 9 | * | ||||||||||||||||
Income from continuing operations before income taxes | 335 | 274 | 236 | 61 | 22 | % | 38 | 16 | % | ||||||||||||||||
Income tax (expense) benefit | (238 | ) | (63 | ) | 740 | (175 | ) | * | (803 | ) | * | ||||||||||||||
Income from continuing operations | 97 | 211 | 976 | (114 | ) | (54 | )% | (765 | ) | (78 | )% | ||||||||||||||
(Loss) income from discontinued operations, net of tax | (9 | ) | 20 | 15 | (29 | ) | * | 5 | 33 | % | |||||||||||||||
Gain on sale of discontinued operations, net of tax | — | 279 | — | (279 | ) | * | 279 | * | |||||||||||||||||
Net income | $ | 88 | $ | 510 | $ | 991 | $ | (422 | ) | (83 | )% | $ | (481 | ) | (49 | )% | |||||||||
Diluted earnings per share - net income | $ | 0.60 | $ | 3.46 | $ | 6.73 | $ | (2.86 | ) | $ | (3.27 | ) | |||||||||||||
* not meaningful | |||||||||||||||||||||||||
NET SALES
Consolidated net sales in 2017 increased $187 million, or 6%, compared with 2016, driven by higher net sales in all four consolidated segments. The increase reflected higher volumes of USG Sheetrock® brand gypsum wallboard, USG Sheetrock® brand joint compound, USG Durock® brand cement board, USG Durock™ brand glass-mat tile backerboard, Fiberock® brand tile backerboard and underlayment and ceiling tile offset by lower volumes of ceiling grid and lower prices for gypsum wallboard and joint compound. On a consolidated basis, foreign currency exchange rate fluctuations positively impacted our net sales by $6 million.
Consolidated net sales in 2016 increased $104 million, or 4%, compared with 2015 driven by higher net sales in all four consolidated segments. The increased sales were driven by higher volumes of USG Sheetrock® brand gypsum wallboard, USG Sheetrock® brand joint compound, USG Durock® brand cement board, Levelrock® brand gypsum underlayment, structural panels and ceiling grid offset by lower prices of gypsum wallboard, joint compound and ceiling grid. On a consolidated basis, foreign currency exchange rate fluctuations negatively impacted our net sales by $34 million.
GROSS PROFIT
Gross profit was $665 million in 2017 compared to $705 million in 2016. As a percentage of net sales, gross profit was 20.8% in 2017 and 23.4% in 2016. The decrease of $40 million in gross profit was driven by increased costs of manufacturing due primarily to higher costs of raw materials, notably waste paper and steel, a $3 million less favorable adjustment to our asset retirement obligation due to changes in cash flow estimates and an additional $3 million of pension settlement charges. Also driving the decrease was the absence of $7 million for items recorded in 2016, which included a gain of $11 million for the sale of surplus property offset by a $2 million adjustment to customer reserves and $2 million of severance and other charges related to the decision to indefinitely idle our mining operations in Little Narrows, Nova Scotia, Canada.
Gross profit increased $55 million from $650 million in 2015 to $705 in 2016. As a percentage of net sales, gross profit was 23.4% in 2016 and 22.3% in 2015. The increase reflected lower manufacturing costs driven primarily by lower natural gas prices and lower costs of steel offset by increased costs of waste paper. Also driving the improvement was a $11 million gain recorded on the sale of surplus property offset by a $2 million adjustment to customer reserves and $2 million of severance and other charges related to the decision to indefinitely idle our mining operations in Little Narrows, Nova Scotia, Canada.
24
SELLING AND ADMINISTRATIVE EXPENSES
Selling and administrative expenses totaled $298 million in 2017, $304 million in 2016 and $302 million in 2015. As a percentage of net sales, selling and administrative expenses decreased to 9.3% in 2017 compared to 10.1% in 2016 and 10.4% in 2015. The decrease of $6 million in selling and administrative expenses for 2017 reflected lower pension settlement expense of $11 million and the absence of $4 million for the exit of commercial office space, which reflected the remaining lease term and accelerated depreciation, offset by higher costs for marketing and services including those in support of product growth initiatives.
The increase in selling and administrative expenses from 2015 to 2016 was driven by $13 million in pension settlement charges and $4 million for the remaining lease term and accelerated depreciation associated with the exit of commercial office space. Offsetting these charges are lower net compensation costs and lower marketing expenses.
LONG-LIVED ASSET IMPAIRMENT CHARGES
We recorded long-lived asset impairment charges of $10 million in 2016. These charges resulted from the decision to indefinitely idle our mining operations in Little Narrows, Nova Scotia, Canada, after completing a review of our gypsum sourcing needs. See Note 12 to our consolidated financial statements in Part II, Item 8 of this report for additional information related to long-lived asset impairment charges.
RECOVERY ON RECEIVABLE
In 2016 and 2015, we recovered $3 million and $6 million, respectively, of a previously deemed uncollectible receivable through a settlement agreement. See Note 13 to our consolidated financial statements in Part II, Item 8 of this report for additional information.
GAIN ON DISPOSAL OF SHIPPING OPERATIONS, NET
During the second quarter of 2015, we recorded a net gain on the disposal of our shipping operations of $1 million. This reflected a gain on sale of our two self-unloading vessels of $7 million and charges to wind down our shipping operations of $6 million. See Note 13 to our consolidated financial statements in Part II, Item 8 of this report for additional information.
INCOME FROM EQUITY METHOD INVESTMENTS
Income from equity method investments was $59 million in 2017, $49 million in 2016, and $48 million in 2015. The increase from 2016 to 2017 was driven by an increase in the net income of UBBP, which was due to a favorable currency impact of $2 million and the absence of $8 million in impairment charges recorded in 2016.
The increase from 2015 to 2016 was driven by an increase in the net income of UBBP, which reflected higher sales and operating profit year over year offset by $8 million of long-lived asset impairment charges in China and Oman. Foreign currency exchange rate fluctuations due to the strengthening of the U.S. dollar negatively impacted our share of equity earnings by $1 million in 2016.
INTEREST EXPENSE
Interest expense was $69 million in 2017, $145 million in 2016 and $163 million in 2015. The decrease in interest expense for both comparative periods primarily reflected lower debt levels and lower interest rates on our outstanding debt. The decline was driven by repayments of $1.1 billion of debt in 2016 and $21 million in 2015.
INCOME AND GAIN ON SALE FROM EQUITY METHOD INVESTMENT TO RELATED PARTY
In 2015, upon the sale of our 50% share of the Knauf-USG joint venture to Knauf, we recorded a gain of $11 million, or $6 million net of tax. Our share of the income from the equity method investment in 2015 through the date of sale amounted to $2 million. See Note 4 to our consolidated financial statements in Part II, Item 8 of this report for additional information.
LOSS ON EXTINGUISHMENT OF DEBT
We recorded a loss on extinguishment of debt, including premiums and write-off of unamortized debt issuance costs, of $22 million in 2017, $37 million in 2016 and $19 million in 2015. The loss in 2017 included $21 million primarily for premiums paid as a result of a tender offer and repurchase of our 7.75% Senior Notes due 2018, referred to as our 7.75% Notes, and write-off of $1 million for deferred fees upon the amendment of our credit facility. The loss in 2016 was a result of the early redemption of our 6.3% Senior Notes due 2016 throughout 2016 and repayment in December of our 7.875% Senior Notes due 2020 and 5.875% Senior Notes due 2021. The loss in 2015 resulted from the tender offer and repurchase of our 8.375% Senior Notes due 2018.
25
OTHER (EXPENSE) INCOME, NET
In 2017, we recorded $4 million in other expense, which primarily reflected net losses on foreign currency transactions. We recorded $9 million of net other income in 2016 which included net gains on foreign currency transactions and the receipt of the remaining payments under a settlement agreement with our former trading partner of which $4 million was recorded as other income. See Note 13 to the consolidated financial statements in Part II, Item 8 of this report for additional information.
INCOME TAX EXPENSE (BENEFIT)
Our effective tax rate was 71.0% in 2017, 22.9% in 2016, and not meaningful in 2015. Our effective tax rate has historically been sensitive to the geographic mix of earnings. When the percentage of pretax earnings generated outside of the United States increased, our effective tax rate generally decreased. Conversely, when the percentage of pretax earnings generated outside of the United States decreased, our effective tax rate generally increased.
The effective tax rate for each of 2017, 2016 and 2015 was significantly impacted by the charges and credits described in detail below. Excluding the impact of these charges and credits, the effective tax rate was 27.8% in 2017, 30.7% in 2016 and 36.9% in 2015.
Income tax expense was $238 million in 2017 compared with income tax expense of $63 million in 2016. The income tax expense in 2017 included a $145 million non-cash tax charge related to the revaluation and change in realizability of our deferred tax assets due to the change in U.S. federal tax law under the Tax Cuts and Jobs Act, or the 2017 Tax Act.
Income tax expense was $63 million in 2016 compared with income tax benefit of $740 million in 2015. The income tax
expense in 2016 was related to tax expense from domestic, foreign, state and local jurisdictions. This expense was partially offset by foreign tax credits attributable to tax planning strategies to optimize foreign tax credit utilization and management’s intention to amend its tax returns for the tax years 2012-2014 in order to claim credits for previously deducted foreign tax.
The income tax benefit in 2015 primarily resulted from the reversal of a substantial portion of our deferred tax asset valuation allowance of $731 million. In addition, tax benefits of $5 million were recorded for Federal law changes in 2015 related to alternative minimum tax credit monetization, or AMT credits. These benefits recorded were offset slightly by tax expense for certain foreign, state and local jurisdictions of $7 million. Due to the effects of reversing our deferred tax asset valuation allowance, our effective tax rate for 2015 was abnormally low.
(LOSS) INCOME FROM DISCONTINUED OPERATIONS, NET OF TAX
We recorded a loss from discontinued operations of $9 million for 2017 which primarily related to a pension settlement charge triggered by lump sum benefits paid to former employees of L&W. We recorded income from discontinued operations of $20 million for 2016 and $15 million for 2015 which primarily reflected the income recorded by L&W prior to the sale to ABC Supply on October 31, 2016. We also recorded losses of $1 million and $2 million in 2017 and 2016, respectively, related to our European operations which were sold in December 2012. See Note 3 to our consolidated financial statements in Part II, Item 8 of this report for additional information.
GAIN ON SALE OF DISCONTINUED OPERATIONS, NET OF TAX
On October 31, 2016, we completed the sale of L&W, our distribution business, to ABC Supply and received proceeds of $675 million, inclusive of a $6 million final working capital adjustment that was received subsequent to year end. The sale resulted in a gain on sale, net of tax, of $279 million. See Note 3 to our consolidated financial statements in Part II, Item 8 of this report for additional information.
26
SEGMENT RESULTS OF OPERATIONS
Net sales and operating profit (loss) for our consolidated reportable segments were as follows:
Favorable (Unfavorable) | |||||||||||||||||||||||||
2017 vs. 2016 | 2016 vs. 2015 | ||||||||||||||||||||||||
(millions) | 2017 | 2016(a) | 2015(b) | $ | % | $ | % | ||||||||||||||||||
Net Sales: | |||||||||||||||||||||||||
U.S. Wallboard and Surfaces | $ | 1,916 | $ | 1,778 | $ | 1,720 | $ | 138 | 8 | % | $ | 58 | 3 | % | |||||||||||
U.S. Performance Materials | 373 | 357 | 321 | 16 | 4 | % | 36 | 11 | % | ||||||||||||||||
U.S. Ceilings | 477 | 467 | 464 | 10 | 2 | % | 3 | 1 | % | ||||||||||||||||
Canada | 405 | 389 | 372 | 16 | 4 | % | 17 | 5 | % | ||||||||||||||||
Other | 245 | 220 | 239 | 25 | 11 | % | (19 | ) | (8 | )% | |||||||||||||||
Eliminations | (212 | ) | (194 | ) | (203 | ) | (18 | ) | (9 | )% | 9 | 4 | % | ||||||||||||
Total | $ | 3,204 | $ | 3,017 | $ | 2,913 | $ | 187 | 6 | % | $ | 104 | 4 | % | |||||||||||
Operating Profit (Loss): | |||||||||||||||||||||||||
U.S. Wallboard and Surfaces | $ | 314 | $ | 334 | $ | 298 | (20 | ) | (6 | )% | $ | 36 | 12 | % | |||||||||||
U.S. Performance Materials | 26 | 41 | 31 | (15 | ) | (37 | )% | 10 | 32 | % | |||||||||||||||
U.S. Ceilings | 95 | 101 | 80 | (6 | ) | (6 | )% | 21 | 26 | % | |||||||||||||||
Canada | 12 | 26 | 10 | (14 | ) | (54 | )% | 16 | * | ||||||||||||||||
Other | 11 | (4 | ) | 30 | 15 | * | (34 | ) | * | ||||||||||||||||
Corporate | (90 | ) | (104 | ) | (94 | ) | 14 | 13 | % | (10 | ) | (11 | )% | ||||||||||||
Eliminations | (1 | ) | — | — | (1 | ) | * | — | * | ||||||||||||||||
Total | $ | 367 | $ | 394 | $ | 355 | $ | (27 | ) | (7 | )% | $ | 39 | 11 | % | ||||||||||
* | Not meaningful |
(a) | Operating profit in 2016 included a gain of $11 million recorded on the sale of surplus property related to U.S. Wallboard and Surfaces and $10 million of long-lived asset impairment charges, $2 million of severance and $3 million of recovery of loss on receivable in Other. |
(b) | Operating profit in 2015 included $1 million for a net gain on sale of the ships and costs to wind-up our shipping business business, a $6 million recovery of a portion of the receivable deemed uncollectible in 2014 and a pre-tax gain on the sale of assets of $10 million in Other. |
U.S. Wallboard and Surfaces
Our U.S. Wallboard and Surfaces segment manufactures and markets gypsum and related products in the United States. These products are used in a variety of building applications to construct walls and ceilings of residential, nonresidential and institutional buildings, as well as in certain industrial applications.
2017 COMPARED WITH 2016
Net sales for U.S. Wallboard and Surfaces in 2017 were $1.9 billion, an increase of $138 million, or 8%, compared with 2016. The net sales increase was due to the following:
Sales | Volume | Price | |||||||||||||||
(millions) | $ | % | $ | % | $ | % | |||||||||||
Change to 2017 from 2016 | |||||||||||||||||
USG Sheetrock® brand gypsum wallboard | $ | 52 | 6 | % | $ | 59 | 6 | % | $ | (7 | ) | — | % | ||||
USG Sheetrock® brand joint compound | 21 | 6 | % | 23 | 6 | % | (2 | ) | — | % | |||||||
Other | 65 | ||||||||||||||||
Total increase in net sales | $ | 138 | 8 | % | |||||||||||||
The increase in net sales reflected higher volumes of USG Sheetrock® brand gypsum wallboard due to higher shipments to big box retailers and specialty dealers, including new customers, and higher volumes of USG Sheetrock® brand joint compound as a result of higher shipments to big box retailers. We shipped 6.12 billion square feet of USG Sheetrock® brand gypsum wallboard in 2017, a 6% increase from 5.76 square feet in 2016. Offsetting the increase in volumes were lower average selling prices in USG Sheetrock® brand gypsum wallboard and USG Sheetrock® brand joint compound primarily driven by a change in mix and regional pricing differences as we balance price and volume across the country with new customers and the continued transition under the L&W supply agreement.
27
Sales also increased by $65 million due to net sales of other products including glass-mat panels, paper and joint compound accessory products, $8 million in higher royalties and higher freight as a result of higher sales.
Operating profit for U.S. Wallboard and Surfaces was $314 million in 2017 and $334 million in 2016, or a $20 million decrease, and reflected the following:
Operating Profit | Volume | Price | Cost | ||||||||||||
(millions) | $ | $ | $ | $ | |||||||||||
Change to 2017 from 2016 | |||||||||||||||
USG Sheetrock® brand gypsum wallboard | $ | (16 | ) | $ | 26 | $ | (7 | ) | $ | (35 | ) | ||||
USG Sheetrock® brand joint compound | (1 | ) | 6 | (2 | ) | (5 | ) | ||||||||
Other | (3 | ) | |||||||||||||
Total decrease in operating profit | $ | (20 | ) | ||||||||||||
The decrease in operating profit primarily reflected higher per unit costs of USG Sheetrock® brand gypsum wallboard and USG Sheetrock® brand joint compound partially offset by higher volumes of these products as discussed above. Higher manufacturing per unit costs of USG Sheetrock® brand gypsum wallboard reflected an increase in per unit cost of 11% for raw materials, primarily due to waste paper. Offsetting the higher costs for raw materials were improved per unit costs of 3% for energy and 2% for fixed costs due to higher volumes. The increased per unit costs of USG Sheetrock® brand joint compound were also driven by increased costs of raw materials.
Further contributing to the decrease in operating profit in 2017 was a $5 million less favorable adjustment year over year to our asset retirement obligations due to changes in cash flow estimates, an incremental $1 million of pension settlement expense and the absence of $9 million for items recorded in 2016, which included a gain of $11 million for the sale of surplus property offset by a $2 million adjustment to customer reserves. Offsetting the decrease in operating profit was higher gross profit of $9 million on other products including glass-mat panels, and lower selling and administrative expenses of $3 million. As a percentage of sales, selling and administrative expenses decreased 50 basis points.
2016 COMPARED WITH 2015
Net sales for U.S. Wallboard and Surfaces in 2016 increased $58 million, or 3%, compared with 2015. The net sales increase was due to the following:
Sales | Volume | Price | |||||||||||||||
(millions) | $ | % | $ | % | $ | % | |||||||||||
Change to 2016 from 2015 | |||||||||||||||||
USG Sheetrock® brand gypsum wallboard | $ | 46 | 5 | % | $ | 54 | 6 | % | $ | (8 | ) | (1 | )% | ||||
USG Sheetrock® brand joint compound | 16 | 4 | % | 18 | 5 | % | (2 | ) | (1 | )% | |||||||
Other | (4 | ) | |||||||||||||||
Total increase in net sales | $ | 58 | 3 | % | |||||||||||||
Net sales of USG Sheetrock® brand gypsum wallboard increased $46 million, or 5%, reflecting a 6% increase in volume offset by a 1% decrease in wallboard average selling prices. The increase in volume was driven by higher shipments to the core channels of distribution which includes big box retailers, specialty dealers and pro dealers. We shipped 5.76 billion square feet of USG Sheetrock® brand gypsum wallboard in 2016, a 6% increase from 5.44 billion square feet in 2015. The decrease in average selling prices reflected changes in mix and regional pricing differences. Sales of USG Sheetrock® brand joint compound increased $16 million driven largely by increased shipments to specialty dealers, pro dealers and big box retailers offset by a 1% decrease in average selling prices due to product mix.
The decrease in Other reflected a $25 million reduction in sales for inventory sold by U.S. Wallboard and Surfaces to L&W that was included in L&W’s inventory as of October 31, 2016. This was offset by higher sales of other products, including glass mat panels, joint compound accessories, and bead and trim products, of $15 million and by an increase in freight as a result of higher product sales.
28
Operating profit for U.S. Wallboard and Surfaces was $334 million in 2016 and $298 million in 2015, or a $36 million increase, and reflected the following:
Operating Profit | Volume | Price | Cost | ||||||||||||
(millions) | $ | $ | $ | $ | |||||||||||
Change to 2016 from 2015 | |||||||||||||||
USG Sheetrock® brand gypsum wallboard | $ | 23 | $ | 24 | $ | (8 | ) | $ | 7 | ||||||
USG Sheetrock® brand joint compound | 11 | 4 | (2 | ) | 9 | ||||||||||
Other | 2 | ||||||||||||||
Total increase in operating profit | $ | 36 | |||||||||||||
The increase in operating profit in 2016 reflected gross profit improvement for USG Sheetrock® brand gypsum wallboard and USG Sheetrock® brand joint compound. Manufacturing costs per unit improved for USG Sheetrock® brand gypsum wallboard which was reflected in $7 million of increased operating profit. The lower cost was driven by a reduction in per unit cost of 11% for energy costs as a result of lower natural gas prices and of 8% for fixed costs due to higher volumes. Offsetting some of these cost savings was a 4% increase in raw material costs driven by waste paper and synthetic gypsum and a 4% increase in conversion costs driven partially by higher labor costs. Manufacturing costs per unit for USG Sheetrock® brand joint compound decreased due to lower raw material costs, driven primarily by pails, latex, and thickener and lower fixed costs due to improved volumes.
Gross profit improvement of $5 million on other gypsum products contributed to improved operating profit driven by product mix, in addition to a gain of $11 million on the sale of surplus property, a favorable adjustment of $3 million for our asset retirement obligations and improved selling and administrative expenses of $2 million. Offsetting these improvements to operating profit was a $11 million reduction in gross profit for inventory sold by U.S. Wallboard and Surfaces to L&W that was included in L&W's inventory as of October 31, 2016, an adjustment to customer reserves of $2 million and a pension settlement of $6 million. As a percentage of net sales, selling and administrative expenses declined by 30 basis points driven primarily by lower net compensation costs.
U.S. Performance Materials
Our U.S. Performance Materials segment manufactures and markets a series of innovative products in the United States in the product categories of underlayment, building envelope and structural. These products are used in a variety of interior and exterior building applications of residential and nonresidential buildings, as well as in certain industrial applications.
2017 COMPARED WITH 2016
Net sales for U.S. Performance Materials in 2017 were $373 million, an increase of $16 million, or 4%, compared with 2016. The net sales increase was due to the following:
Sales | Volume | Price | |||||||||||||||
(millions) | $ | % | $ | % | $ | % | |||||||||||
Change to 2017 from 2016 | |||||||||||||||||
USG Durock® brand cement board | $ | 3 | 2 | % | $ | 3 | 2 | % | $ | — | — | % | |||||
USG Durock™ brand glass-mat tile backerboard | 3 | 39 | % | 3 | 39 | % | — | — | % | ||||||||
Fiberock® brand tile backerboard and underlayment | 2 | 7 | % | 3 | 12 | % | (1 | ) | (5 | )% | |||||||
Other | 8 | ||||||||||||||||
Total increase in net sales | $ | 16 | 4 | % | |||||||||||||
The increase in net sales in 2017 was driven by increased volumes of USG Durock® brand cement board, USG Durock™ brand glass-mat tile backerboard and Fiberock® brand tile backerboard and underlayment. The higher volumes of these products primarily reflected increased sales into the repair and remodel market with higher shipments to big box retailers and specialty dealers. Lower average selling price of Fiberock® brand tile backerboard and underlayment slightly offset the increases in volumes.
The increase in Other reflected higher sales of $8 million of other products including Securock® brand roof boards, Levelrock® brand gypsum underlayment, tile and flooring accessories and Securock® ExoAir® 430 air barrier system and higher freight due to increased shipments.
29
Operating profit for U.S. Performance Materials was $26 million in 2017 and $41 million in 2016, or a $15 million decrease, and reflected the following:
Operating Profit | Volume | Price | Cost | ||||||||||||
(millions) | $ | $ | $ | $ | |||||||||||
Change to 2017 from 2016 | |||||||||||||||
USG Durock® brand cement board | $ | (2 | ) | $ | 1 | $ | — | $ | (3 | ) | |||||
USG Durock™ brand glass-mat tile backerboard | 1 | 1 | — | — | |||||||||||
Fiberock® brand tile backerboard and underlayment | (1 | ) | 1 | (1 | ) | (1 | ) | ||||||||
Other | (13 | ) | |||||||||||||
Total decrease in operating profit | $ | (15 | ) | ||||||||||||
The decrease in operating profit in 2017 reflected lower gross profit on USG Durock® brand cement board and Fiberock® brand tile backerboard and underlayment as a result of higher per unit cost offset by higher gross profit on USG Durock™ brand glass-mat tile backerboard. The increased per unit cost for Durock® brand cement board primarily reflected increased transportation costs offset by lower cost of raw materials. The higher cost per unit for Fiberock® brand tile backerboard and underlayment was driven by an increase in the cost of raw materials, primarily waste paper, and increased transportation costs offset slightly by lower energy costs.
Included in Other was lower gross profit on other products of $8 million, including Securock® brand roof boards, which reflected higher costs of raw materials and transportation costs, a $1 million increase in operational reserves and $4 million of higher selling and administrative expenses. As a percentage of sales, selling and administrative expenses increased 100 basis points which reflected increased marketing and compensation costs.
2016 COMPARED WITH 2015
Net sales for U.S. Performance Materials in 2016 increased $36 million, or 11%, compared with 2015. The net sales increase was due to the following:
Sales | Volume | Price | |||||||||||||||
(millions) | $ | % | $ | % | $ | % | |||||||||||
Change to 2016 from 2015 | |||||||||||||||||
USG Durock® brand cement board | $ | 10 | 8 | % | $ | 8 | 6 | % | $ | 2 | 2 | % | |||||
Levelrock® brand gypsum underlayment | 11 | 22 | % | 11 | 22 | % | — | — | % | ||||||||
Structural panels | 7 | 89 | % | 6 | 84 | % | 1 | 5 | % | ||||||||
Other | 8 | ||||||||||||||||
Total increase in net sales | $ | 36 | 11 | % | |||||||||||||
Net sales of USG Durock® brand cement board increased $10 million, driven by higher volumes and higher average selling price. The higher volumes reflected increased shipments to customers in the repair and remodel market, big box retailers and specialty dealers. Net sales of Levelrock® brand gypsum underlayment increased by $11 million driven by higher volume which reflected an improvement in the multi-family housing construction market as well as sales of accessory products. Net sales of structural panels increased $7 million due primarily to higher volumes as a result of organic growth.
The increase in Other of $8 million included higher sales of other products of $9 million, including Fiberock® brand tile backerboard, USG Durock™ brand glass-mat tile backerboard and Securock® brand gypsum-fiber roof boards and an increase in freight as a result of higher sales. Offsetting this increase in Other was a $4 million reduction in sales for inventory sold by U.S. Performance Materials to L&W that was included in L&W’s inventory as of October 31, 2016.
30
Operating profit for U.S. Performance Materials was $41 million in 2016 and $31 million in 2015, or a $10 million increase, and reflected the following:
Operating Profit | Volume | Price | Cost | ||||||||||||
(millions) | $ | $ | $ | $ | |||||||||||
Change to 2016 from 2015 | |||||||||||||||
USG Durock® brand cement board | $ | 4 | $ | 2 | $ | 2 | $ | — | |||||||
Levelrock® brand gypsum underlayment | 3 | 10 | — | (7 | ) | ||||||||||
Structural panels | 1 | 1 | 1 | (1 | ) | ||||||||||
Other | 2 | ||||||||||||||
Total increase in operating profit | $ | 10 | |||||||||||||
The increase in operating profit for 2016 reflected gross profit improvement for USG Durock® brand cement board, Levelrock® brand gypsum underlayment and structural panels reflective of higher sales as discussed above. Further driving the increase in operating profit for 2016 were higher gross profits of $5 million on other products, including Fiberock® brand tile backerboard and underlayment, USG Durock™ brand glass-mat tile backerboard and Securock® brand gypsum-fiber roof boards, offset by a $2 million reduction in gross profit for inventory sold by U.S. Performance Materials to L&W that was included in L&W's inventory as of October 31, 2016. Also impacting operating profit was a pension settlement of $2 million offset by a decrease of $1 million of selling and administrative expenses. As a percentage of net sales, selling and administrative expenses declined by 120 basis points driven primarily by lower net compensation costs.
U.S. Ceilings
Our U.S. Ceilings segment manufactures and markets ceiling interior systems products in the United States and is a leading supplier of interior ceilings products used primarily in nonresidential applications.
2017 COMPARED WITH 2016
Net sales for U.S. Ceilings increased to $477 million in 2017, a $10 million, or 2%, increase from $467 million in 2016. The increase reflected the following:
Sales | Volume | Price | |||||||||||||||
(millions) | $ | % | $ | % | $ | % | |||||||||||
Change to 2017 to 2016 | |||||||||||||||||
Ceiling grid | $ | (2 | ) | (1 | )% | $ | (3 | ) | (2 | )% | $ | 1 | 1 | % | |||
Ceiling tile | 6 | 2 | % | 6 | 2 | % | — | — | % | ||||||||
Other | 6 | ||||||||||||||||
Total increase in net sales | $ | 10 | |||||||||||||||
The increase in net sales reflected higher sales of ceiling tile of $6 million due to higher volumes, primarily to our specialty dealers, offset by lower sales of ceiling grid of $2 million as a result of lower volumes, primarily to our customers in the retail channel. The increase in other included one month of net sales of $4 million from Ceilings Plus for specialty ceilings, $1 million in higher royalties and higher freight due to increased sales.
Operating profit for U.S. Ceilings of $95 million in 2017 decreased $6 million, or 6%, from $101 million in 2016. The decrease reflected the following:
Operating Profit | Volume | Price | Cost | ||||||||||||
(millions) | $ | $ | $ | $ | |||||||||||
Change to 2017 from 2016 | |||||||||||||||
Ceiling grid | $ | (8 | ) | $ | (2 | ) | $ | 1 | $ | (7 | ) | ||||
Ceiling tile | (2 | ) | — | — | (2 | ) | |||||||||
Other | 4 | ||||||||||||||
Total decrease in operating profit | $ | (6 | ) | ||||||||||||
31
The decrease in operating profit for 2017 was driven by a decrease in gross profit for both ceiling grid and ceiling tile in 2017 compared with 2016. The lower gross profit for ceiling grid reflected lower volumes and higher per unit cost partially offset by higher average selling price. The higher per unit cost for ceiling grid was due to an increase in raw materials costs, primarily steel. The decrease in gross profit for ceiling tile primarily reflected higher per unit cost which was driven by an increase in energy costs due to higher prices of natural gas. Other primarily included a decrease in miscellaneous costs and selling and administrative expenses. As a percentage of sales, selling and administrative expenses declined by 50 basis points.
2016 COMPARED WITH 2015
Net sales for U.S. Ceilings increased to $467 million in 2016, a $3 million, or 1%, increase from $464 million in 2015. The increase reflected the following:
Sales | Volume | Price | |||||||||||||||
(millions) | $ | % | $ | % | $ | % | |||||||||||
Change to 2016 from 2015 | |||||||||||||||||
Ceiling grid | $ | 3 | 3 | % | $ | 5 | 4 | % | $ | (2 | ) | (1 | )% | ||||
Ceiling tile | 1 | 1 | % | (1 | ) | — | % | 2 | 1 | % | |||||||
Other | (1 | ) | |||||||||||||||
Total increase in net sales | $ | 3 | 1 | % | |||||||||||||
The increase in sales for ceiling grid was driven by higher volumes of 4% offset by lower prices. The increase in volume for ceiling grid reflected improved market conditions and product mix. The increase in ceiling tile reflected higher prices offset by lower volumes. The decrease in Other included a $3 million increase in sales for inventory sold by U.S. Ceilings to L&W that was included in L&W’s inventory as of October 31, 2016 offset by lower freight.
Operating profit for U.S. Ceilings of $101 million in 2016 increased $21 million, or 26%, from $80 million in 2015. The increase reflected the following:
Operating Profit | Volume | Price | Cost | ||||||||||||
(millions) | $ | $ | $ | $ | |||||||||||
Change to 2016 from 2015 | |||||||||||||||
Ceiling grid | $ | 7 | $ | 3 | $ | (1 | ) | $ | 5 | ||||||
Ceiling tile | 10 | — | 3 | 7 | |||||||||||
Other | 4 | ||||||||||||||
Total increase in operating profit | $ | 21 | |||||||||||||
The increase in operating profit for 2016 reflected the improvement in volume and cost for ceiling grid and in price and cost for ceiling tile. The increase in volume for ceiling grid reflected improved market conditions and product mix. The reduction in cost of ceiling grid was largely driven by lower per unit cost for ceiling grid, which reflected lower raw material costs led by lower steel prices, lower conversion reflective of improved efficiencies and fixed costs driven by increased volumes. The higher price for ceiling tile was primarily due to product mix. The lower cost for ceiling tile was due to lower costs per unit for raw materials, energy and conversion costs due to improved efficiencies. Per unit energy costs also declined as a result of favorable energy prices.
Included in the increase in Other was $1 million of gross profit on sales by U.S. Ceilings to L&W that were included in L&W's inventory as of October 31, 2016. Also driving the increase in Other was a decrease in selling and administrative expenses due to lower net compensation costs offset by a pension settlement of $2 million. As a percentage of sales, selling and administrative expenses declined by 40 basis points.
Canada
Our Canada segment manufactures gypsum products and ceiling grid and markets gypsum products, ceiling grid and ceiling tile in Canada and is a leading supplier of gypsum wallboard. These products are used in a variety of building applications, including residential, nonresidential and institutional buildings, as well as in certain industrial applications.
32
2017 COMPARED WITH 2016
Net sales for our Canada segment in 2017 were $405 million, an increase of $16 million compared to net sales in 2016 of $389 million. Sales of gypsum wallboard increased $15 million due to a 10% increase of average selling price offset by a 2% decrease in volume. The increase in the average selling price reflected the final decisions of the Canadian authorities on the minimum pricing of gypsum board into Western Canada. The decisions were as a result of an anti-dumping proceeding initiated by a competing Canadian wallboard manufacturer. The minimum pricing of gypsum board in Western Canada also reduced our volumes. The increase in net sales in 2017 was also driven by an increase of $5 million in other products, including glass-mat panels, industrial products and specialty ceilings, and a favorable impact of foreign currency translation of $7 million offset by a decrease in net sales of joint treatment of $3 million and ceiling tile of $2 million and lower freight of $6 million.
Operating profit for our Canada segment was $12 million in 2017 compared with $26 million in 2016. This decrease of $14 million reflected a lower gross profit on joint treatment of $3 million and ceiling grid of $1 million. Also negatively impacting operating profit were increased royalties of $9 million, higher losses on our foreign exchange contracts of $7 million and higher other miscellaneous costs of $4 million. Offsetting these reductions to operating profit was an increase in gross profit for gypsum wallboard of $10 million driven primarily by the increase in average selling price offset by an increase of 6% in cost due to higher costs of waste paper. Selling and administrative expenses decreased 40 basis points as a percentage of sales.
2016 COMPARED WITH 2015
Net sales for our Canada segment in 2016 were $389 million, an increase of $17 million or 5%, compared with 2015. The increase was driven primarily by a $21 million increase in net sales of gypsum wallboard, a $4 million increase in net sales of joint treatment and an adjustment of an accrual for volume rebate incentives of $4 million. The higher wallboard sales reflected higher average selling prices of 11%, largely resulting from a preliminary decision on minimum pricing imposed by Canadian authorities discussed above. Offsetting the higher sales was a $14 million unfavorable impact of foreign currency due to the strengthening of the U.S. Dollar.
Operating profit for our Canada segment increased $16 million to $26 million in 2016 from $10 million in 2015. The increase was driven by higher gross profit on gypsum wallboard of $9 million, on ceiling tile of $2 million and on joint treatment of $1 million, an adjustment of an accrual for volume rebate incentives of $4 million and lower miscellaneous and selling and administrative costs of $7 million. Gross profit of gypsum wallboard improved due to higher average selling prices of 11% offset by higher per unit cost of 7% due to increased employee costs. Offsetting these increases was a $9 million unfavorable impact of foreign currency.
USG Boral Building Products
UBBP, our 50/50 joint ventures with Boral Limited, manufactures, distributes and sells certain building products, mines raw gypsum and sells natural and synthetic gypsum throughout Asia, Australasia and the Middle East. UBBP also manufactures and distributes products for wall, ceiling, floor lining and exterior systems that utilize gypsum wallboard, referred to as plasterboard in the regions in which UBBP operates, mineral fiber ceiling tiles, steel grid and joint compound. The following reflects the net sales and operating profit as recorded by UBBP and the equity income recorded by USG:
Favorable (Unfavorable) | |||||||||||||||||||||||||
2017 vs. 2016 | 2016 vs. 2015 | ||||||||||||||||||||||||
(millions) | 2017 | 2016 | 2015 | $ | % | $ | % | ||||||||||||||||||
Net sales | $ | 1,200 | $ | 1,052 | $ | 1,003 | $ | 148 | 14 | % | $ | 49 | 5 | % | |||||||||||
Operating profit (a) | 160 | 133 | 124 | 27 | 20 | % | 9 | 7 | % | ||||||||||||||||
Income from equity method investments - UBBP (b) | 59 | 49 | 48 | 10 | 20 | % | 1 | 2 | % | ||||||||||||||||
(a) | Operating profit in 2016 included long-lived asset impairment charges of $14 million for Oman and $8 million for China. |
(b) | Income from equity method investments - UBBP in 2016 included long-lived asset impairment charges of $4 million for Oman and $4 million for China. |
2017 COMPARED WITH 2016
Net sales for UBBP increased $148 million to $1.2 billion in 2017. The increase reflected higher shipments of plasterboard in South Korea, China, Australia, and Thailand, offset by lower shipments in Vietnam and Thailand. Plasterboard shipments increased 7% in 2017 to 4.9 billion square feet from 4.6 billion square feet in 2016 and reflected continued improved market acceptance of lightweight products. Shipments of adjacent products, including joint compounds and steel studs, also increased in 2017 as compared 2016. Net sales of UBBP also reflected a favorable impact of currency translation of $27 million.
33
Operating profit for UBBP increased to $160 million in 2017 from $133 million in 2016. The increase of $27 million reflected improved margins in Australia, South Korea, Thailand, China and Indonesia. While margins improved overall, UBBP incurred higher costs for raw materials, notably waste paper and steel, and for energy. UBBP's operating profit also included a favorable currency impact of $4 million. Offsetting the increased margins were higher selling and administrative expenses reflective of higher sales. Operating profit for 2016 also included impairment of long-lived assets in China of $8 million and in Oman of $14 million.
Our share of equity income from UBBP was $59 million in 2017 compared to $49 million in 2016. The increase was driven by a favorable currency impact of $2 million and the absence of the 2016 long-lived asset impairment charges.
2016 COMPARED WITH 2015
Net sales for UBBP in 2016 increased $49 million from $1.003 billion in 2015 to $1.052 billion in 2016. The increase reflected higher plasterboard shipments in South Korea, Australia, Vietnam and India offset by lower shipments in China and unfavorable impact of currency translation of $17 million. Plasterboard shipments increased 4% in 2016 to 4.6 billion square feet from 4.4 billion square feet in 2015.
Operating profit for UBBP increased to $133 million in 2016 from $124 million in 2015. The increase reflected improved margins in Australia, South Korea, Vietnam and India, realized synergy savings and improved market acceptance of lightweight products offset by an impairment of long-lived assets in China of $8 million and in Oman of $14 million and an increase in selling and administrative expenses. Operating profit was negatively impacted by $2 million by the strengthening of the U.S. Dollar.
Our share of equity income from UBBP was $49 million in 2016 compared to $48 million in 2015. The increase from 2015 to 2016 primarily is driven by growth in the business year over year offset by impairment of long-lived asset in China of $4 million and in Oman of $4 million and unfavorable impact of foreign currency of $1 million due to the strengthening of the U.S. Dollar.
Corporate
Operating expenses for Corporate were $90 million in 2017, $104 million in 2016 and $94 million in 2015. The decrease reflected a $9 million lower pension settlement charge, the absence of $4 million in charges for the remaining lease term and accelerated depreciation associated with the exit of commercial office space, and lower costs for incentive compensation offset by higher costs for marketing and services including those in support of product growth initiatives.
The increase in 2016 compared to 2015 was due primarily to pension settlement charges of $10 million, $4 million in charges for the remaining lease term and accelerated depreciation associated with the exit of commercial office space and increased costs for incentive compensation offset by lower information technology spend.
Liquidity and Capital Resources
LIQUIDITY
As of December 31, 2017, we had $493 million of cash and cash equivalents and marketable securities compared with $518 million as of December 31, 2016. See discussion below under Cash Flows for an explanation of this change. Our total liquidity was $648 million as of December 31, 2017 (including $155 million of borrowing availability under our credit facility) compared to $603 million as of December 31, 2016 (including $85 million of borrowing availability under our credit facility). The increase in liquidity reflected increased borrowing availability as a result of our amended and restated credit facility discussed below.
We invest in cash equivalents and marketable securities pursuant to an investment policy that has preservation of principal as its primary objective. The policy includes provisions regarding diversification, credit quality and maturity profile that are designed to minimize the overall risk profile of our investment portfolio. The securities in the portfolio are subject to normal market fluctuations. See Note 5 to the consolidated financial statements in Part II, Item 8 of this report for additional information regarding our investments in marketable securities.
Total debt as of December 31, 2017 and 2016 consisted of senior notes and industrial revenue bonds and amounted to $1.078 billion ($1.089 billion in aggregate principal amount less $11 million of unamortized debt issuance costs) and $1.083 billion ($1.089 billion in aggregate principal amount less $6 million of unamortized original issue discount and debt issuance costs), respectively. See Note 6 to the consolidated financial statements in Part II, Item 8 of this report for additional information about our debt.
34
During 2017, we amended and restated our credit facility agreement. Our amended and restated agreement increased the maximum borrowing limit from $180 million to $220 million (including a $50 million borrowing sublimit for our Canadian subsidiary, CGC Inc., or CGC) that is available to fund working capital needs and other general corporate purposes and matures on May 1, 2022. The facility is guaranteed by certain of our significant subsidiaries and secured by such parties’ eligible trade receivables and inventory. The maximum borrowing limit under the credit agreement may be increased up to $450 million at our request and with our lenders’ approval. The credit agreement contains other covenants and events of default that are customary for similar agreements and may limit our ability to take various actions including our ability to pay a dividend or repurchase our stock.
The maximum borrowing limit under the credit agreement is currently $220 million. The credit agreement also specifies that the maximum principal that may be borrowed is impacted by any outstanding borrowings and letters of credit under the credit agreement, by a borrowing base (comprised of eligible trade receivables and inventory), and the minimum excess availability that may be required due to the Covenant Trigger Threshold, described below, being applicable. As of December 31, 2017, the maximum principal we could borrow after taking into account the foregoing factors was approximately $155 million.
The credit agreement contains a covenant that would require us to maintain a minimum fixed charge coverage ratio of not less than 1.0-to-1.0 in the event that excess availability falls below the Covenant Trigger Threshold equal to 10% of the lesser of (a) the aggregate revolving commitment and (b) the aggregate of the USG and CGC borrowing base. As of December 31, 2017, our fixed charge coverage ratio was 1.25-to-1.0; and therefore, we are not required to maintain minimum excess availability of no less than the Covenant Trigger Threshold so that the financial covenant will remain inapplicable.
As of December 31, 2017 and during the year then ended, there were no borrowings under the facility. Had there been any borrowings as of that date, the applicable interest rate would have been 2.69% for loans in the U.S. and 2.54% for loans in Canada. Outstanding letters of credit as of December 31, 2017 totaled $29 million.
CASH FLOWS
The following table presents a summary of our cash flows:
(millions) | 2017 | 2016 | 2015 | ||||||||
Net cash provided by (used for): | |||||||||||
Operating activities from continuing operations | $ | 382 | $ | 314 | $ | 279 | |||||
Investing activities from continuing operations | (225 | ) | 79 | (61 | ) | ||||||
Financing activities from continuing operations | (202 | ) | (1,129 | ) | (44 | ) | |||||
Discontinued operations | 6 | 726 | 47 | ||||||||
Effect of exchange rate changes on cash | 6 | (5 | ) | (10 | ) | ||||||
Net (decrease) increase in cash and cash equivalents | $ | (33 | ) | $ | (15 | ) | $ | 211 | |||
Operating Activities: Net cash provided by operating activities increased in 2017 from 2016 due primarily to lower cash payments to our pension and postretirement plans and lower cash payments for interest. In 2017, we contributed $77 million to our pension and postretirement plans as compared to $174 million in 2016. We made $82 million in interest payments in 2017 as compared to $153 million in 2016. The decrease in interest payments primarily reflected lower debt levels and lower interest rates on our outstanding debt. These lower cash outflows were offset by an increase in cash outflows related to working capital. This was led by an increase in accounts receivable as a result of higher sales, an increase in inventories due to increased costs for raw materials and a decrease in accrued employee compensation and interest expense, offset by an increase in accounts payable, which also reflected higher costs of materials.
As of December 31, 2017, working capital (current assets less current liabilities) amounted to $576 million, and the ratio of current assets to current liabilities was 2.39-to-1. As of December 31, 2016, working capital amounted to $527 million, and the ratio of current assets to current liabilities was 2.25-to-1.
Higher cash provided by operating activities in 2016 compared to 2015 primarily reflected improved gross profit. Also driving the increase in operating cash flow was improved working capital. Our net cash outflow for accounts receivable, inventories, accounts payable and accrued expenses of continuing operations was lower in 2016 compared to 2015. Cash outflows for accrued expenses in 2015 included $39 million pursuant to the settlement agreement with the direct purchaser class in the U.S. wallboard pricing class action lawsuit. Excluding this payment, 2016 still reflected lower net cash outflow driven by initiatives over accounts payable offset by lower inflow from accounts receivable. As of December 31, 2015, working capital amounted to $408 million, and the ratio of current assets to current liabilities was 1.41-to-1.
35
Investing Activities: Investing cash flows used $225 million of net cash in 2017 and provided $79 million of net cash during 2016. Net purchases of marketable securities was $8 million in 2017 compared to net sales of $139 million in 2016. Significant cash outflows in 2017 reflected $168 million for capital expenditures and $52 million for our 2017 acquisition of Ceilings Plus. The increase of $85 million in 2017 as compared to 2016 for capital expenditures reflected expenditures for the replacement, modernization and expansion of operations, including Advanced Manufacturing initiatives.
Investing cash flows provided $79 million of net cash in 2016 and used $61 million of net cash during 2015. Net sales of marketable securities were $139 million in 2016 compared to net purchases of $76 million in 2015. Cash outflows for capital expenditures decreased in 2016 by $4 million as compared to 2015. The net increase in cash inflows from marketable securities and capital expenditures were offset by the lower cash inflows for the net proceeds of asset dispositions primarily due to the sale of a surplus property in Mexico and of our ships owned by GTL and for the disposition of our Knauf USG joint venture in 2015.
Financing Activities: The net cash used for financing activities in 2017 reflected the $520 million paid to redeem $500 million of our 7.75% Notes, including tender premiums, and the repurchase of $184 million of common stock under our stock repurchase program. This was partially offset by the issuance of $500 million of our 4.875% Senior Notes due 2027, referred to as our 4.875% Notes, net of debt issuance fees.
The net cash used for financing activities in 2016 was driven by the repayment of $1.1 billion of debt during the year. The net cash used for financing activities in 2015 included $365 million paid to repurchase $350 million of our 8.375% Senior Notes due 2018, including tender premiums, offset by the $344 million of proceeds received from the issuance of $350 million of 5.5% Senior Notes, net of debt issuance costs, and $21 million used to repay our ship mortgage facility.
Discontinued Operations: Net cash provided by discontinued operations was $6 million, $726 million and $47 million for 2017, 2016 and 2015, respectively. The cash received in 2017 primarily reflected a working capital adjustment associated with the sale of L&W. The higher cash inflow in 2016 as compared to 2015 reflected cash received for the sale of L&W of $669 million and higher cash inflows for accounts payable offset by higher cash outflows for accounts receivable and inventories.
LIQUIDITY OUTLOOK
In 2018, we plan to spend approximately $250 million on capital expenditures in the normal course of our business, which includes approximately $90 million allocated for advanced manufacturing projects to standardize and automate production across our businesses, approximately $95 million for growth investments, and approximately $65 million for maintenance. Estimated future spending on approved capital expenditures for the replacement, modernization and expansion of operations totaled $172 million as of December 31, 2017.
We also plan to incur approximately $370 million in selling and administrative expenses in 2018, including $31 million on strategic investments to support and grow our businesses and $15 million on integration and divisional realignment costs. Interest payments for 2018 are expected to decrease to $57 million from $85 million in 2017 which primarily reflects lower interest rates due to the refinancing of our 7.75% Notes to our 4.875% Notes.
We expect to make tax payments of approximately $8 million for foreign jurisdictions. Our utilization of our net operating loss, or NOL,carryforwards will limit our cash payments for U.S. income taxes.
The 2017 Tax Act significantly changes U.S. corporate income tax laws by, among other things, reducing the U.S. corporate income tax rate to 21% and creating a quasi-territorial tax system with a one-time mandatory tax on previously deferred foreign earnings. Excluding the impact of any discrete items, the provisions of the 2017 Tax Act are expected to reduce our effective tax rate in 2018 by approximately 10 to 13 percentage points compared to what the rate would have otherwise been in the absence of the 2017 Tax Act. Amounts adjusted in the measurement period under SEC Staff Accounting Bulletin No. 118, "Income Tax Accounting Implications of the Tax Cuts and Jobs Act", will be recorded as discrete items in the period in which the accounting for these items is complete. Our estimate of our effective tax rate does not include an estimate for the resolution of items which we identified as provisional. In addition, the ultimate impact on our effective tax rate will vary based upon the percentage of pretax earnings that we generate in the United States as compared to the rest of the world. See Note 15 to our consolidated financial statements in Part II, Item 8 of this report for additional information regarding those items and our NOL carryforwards. We do not anticipate that resolution of such item will result in a material change to our estimate of the effective tax rate or the impact on cash paid for taxes.
We expect to fund our capital expenditures, our selling and administrative expenses and our interest and tax payments with cash from operations or cash on hand.
On February 1, 2018, we announced that our Board of Directors approved a $250 million increase to our stock repurchase program, bringing the total authorization to $500 million. During 2017, we repurchased $184 million, leaving $316
36
million of authorization remaining. The timing and the amount of any additional repurchases will be determined based on market conditions and other factors. We expect that stock repurchases will be executed within 18 months and funded with available cash on hand. See Part II, Item 5 of this report.
Since formation, UBBP was funded from its net cash flows from operations and third-party financing. It is our intent that as an ongoing operation, UBBP will continue to self-fund. UBBP is targeting the distribution of 50% of combined after tax profits to USG and Boral, however, this dividend may be adjusted by the UBBP board with unanimous resolution. During the second and fourth quarters of 2017, UBBP paid cash dividends on earnings through September 30, 2017 of which our 50% share totaled $42 million.
In the event certain performance targets are satisfied by UBBP, we will be obligated to pay Boral an earnout payment in an amount up to $50 million in 2019, based on UBBP performance during the first five years. We have not recorded a liability for this earnout payment as we have concluded that it is currently not probable that the five-year performance target will be achieved.
We believe that cash on hand, cash equivalents, marketable securities, cash available from future operations and our credit facility will provide sufficient liquidity to fund our operations for at least the next 12 months. Cash requirements include, among other things, capital expenditures, working capital needs, employee retirement plans funding, interest payments and other contractual obligations.
CONTRACTUAL OBLIGATIONS AND OTHER COMMITMENTS
As of December 31, 2017, our contractual obligations and commitments were as follows:
Payments Due by Period | |||||||||||||||||||
(millions) | Total | 2018 | 2019 - 2020 | 2021 - 2022 | Thereafter | ||||||||||||||
Debt obligations (a) | $ | 1,089 | $ | — | $ | — | $ | — | $ | 1,089 | |||||||||
Other long-term liabilities (b) | 531 | 15 | 39 | 9 | 468 | ||||||||||||||
Interest payments (c) | 519 | 57 | 114 | 114 | 234 | ||||||||||||||
Purchase obligations (d) | 618 | 129 | 191 | 125 | 173 | ||||||||||||||
Capital expenditures (e) | 172 | 127 | 45 | — | — | ||||||||||||||
Operating leases | 130 | 36 | 56 | 29 | 9 | ||||||||||||||
Unrecognized tax benefits (f) | 12 | 2 | 4 | 5 | 1 | ||||||||||||||
Earnout payment (g) | 50 | — | 50 | — | — | ||||||||||||||
Total | $ | 3,121 | $ | 366 | $ | 499 | $ | 282 | $ | 1,974 | |||||||||
(a) | Excludes unamortized deferred issuance costs of $11 million. |
(b) | Other long-term liabilities primarily consist of asset retirement obligations that principally extend over a 50-year period. The majority of associated payments are payable toward the latter part of that period. |
(c) | Reflects estimated interest payments on debt obligations as of December 31, 2017. |
(d) | Purchase obligations primarily consist of contracts to purchase energy, certain raw materials and finished goods. |
(e) | Reflects estimates of future spending on active capital projects that were approved prior to December 31, 2017 but were not completed by that date. |
(f) | Reflects estimated payments (if required) of gross unrecognized tax benefits. |
(g) | Reflects potential maximum earnout payment for our investments in UBBP up to $50 million based on performance during the first five years. |
The table above excludes liabilities related to both our defined benefit pension plans and postretirement benefits (retiree health care and life insurance). For 2017, our defined benefit pension plans had no minimum funding requirements under the Employee Retirement Income Security Act of 1974. We are evaluating our level of funding for pension plans and currently estimate that we will contribute approximately $63 million to our pension plans in 2018. We voluntarily provide postretirement benefits for eligible employees and retirees and estimate cash payments to be $9 million in 2018. See Note 9 to the consolidated financial statements in Part II, Item 8 for additional information on future expected cash payments for pension and other postretirement benefits.
OFF-BALANCE-SHEET ARRANGEMENTS
With the exception of letters of credit, it is not our business practice to use off-balance-sheet arrangements, such as third-party special-purpose entities.
37
GUARANTEES
We are party to a variety of agreements under which we may be obligated to indemnify a third party with respect to certain matters. We do not consider the maximum potential amount of future payments that we could be required to make under these agreements to be material.
Legal Contingencies
We are named as defendants in litigation arising from our operations, including lawsuits or claims arising from commercial disputes, product performance or warranties, products liability, and worksite or vehicular accidents.
In 2015, USG, our subsidiary United States Gypsum Company, our former subsidiary L&W Supply Corporation, and seven other wallboard manufacturers were named as defendants in a lawsuit filed by twelve homebuilders alleging that the defendants conspired to fix the price of wallboard sold in the United States. Earlier, in 2013, class action lawsuits making similar allegations were filed in Canada on behalf of a class of purchasers of wallboard in Canada. We believe that the cost, if any, of resolving the homebuilders’ lawsuit and Canadian class action litigation will not have a material effect on our results of operations, financial position or cash flows.
In 2015, United States Gypsum Company was served with a federal grand jury subpoena requesting the production of company records in connection with a federal investigation of the gypsum drywall industry. Two former employees of USG have also been served with subpoenas. We believe the investigation, although a separate proceeding, is related to the same events at issue in the litigation discussed above. We are fully cooperating with the grand jury investigation. We believe we acted in full compliance with the law, and we do not expect the resolution of this matter to result in any material effect on our business, financial position, liquidity or results of operations; however, we can provide no assurances as to the scope, timing, or outcome of any such investigation.
See Note 18 to the consolidated financial statements in Part II, Item 8 of this report for additional information regarding litigation matters. See, also, Part I, Item 1A, Risk Factors, for information regarding the possible effects of environmental laws and regulations on our businesses.
Critical Accounting Policies
In preparing our consolidated financial statements in conformity with accounting principles generally accepted in the United States, we make decisions that impact the reported amounts of assets, liabilities, revenues and expenses, and related disclosures. Such decisions include the selection of the appropriate accounting principles to be applied and the assumptions on which to base accounting estimates. In reaching such decisions, we apply judgments based on our understanding and analysis of the relevant circumstances, current developments and historical experience. Actual amounts could differ materially from those estimated at the time the consolidated financial statements are prepared.
Our significant accounting policies are described in Note 1 to the consolidated financial statements in Part II, Item 8 of this report. Some of these significant accounting policies require us to make difficult, subjective or complex judgments or estimates. An accounting estimate is considered to be critical if it meets both of the following criteria: (1) the estimate requires assumptions about matters that are highly uncertain at the time the accounting estimate is made and (2) different estimates reasonably could have been used, or changes in the estimate are reasonably likely to occur from period to period, that would have a material impact on the presentation of our financial condition, changes in financial condition, results of operations or cash flows. Our critical accounting estimates are as follows:
EMPLOYEE RETIREMENT PLANS
We maintain defined benefit pension plans for most of our employees. Most of these plans require employee contributions in order to accrue benefits. We also maintain plans that provide postretirement benefits (retiree health care and life insurance) for eligible existing retirees and for eligible active employees who may qualify for coverage in the future. The accounting for these plans depend on assumptions made by management, which are used by actuaries we engage to calculate the projected and accumulated benefit obligations and the annual expense recognized for these plans. The assumptions used in developing the required estimates primarily include discount rates, expected return on plan assets for the funded plans, compensation increase rates, retirement rates, mortality rates and, for postretirement benefits, retirement rates and levels of a company-provided subsidy.
38
We determined the assumed discount rate based on a hypothetical AA yield curve represented by a series of annualized individual discount rates. Each underlying bond issue is required to have a credit rating of Aa or better by Moody’s Investors Service or a credit rating of AA or better by Standard & Poor’s Global Ratings. We consider the underlying types of bonds and our projected cash flows of the plans in evaluating the yield curve selected. The use of a different discount rate would impact net pension and postretirement benefit costs and benefit obligations. In determining the expected return on plan assets, we use a “building block” approach, which incorporates historical experience, our pension plan investment guidelines, asset allocation, and expectations for long-term rates of return. The use of a different rate of return would impact net pension costs. A one-half percentage point change in the assumed discount rate and return on plan asset rate would have the following effects (dollars in millions):
Increase (Decrease) in | |||||||||
Assumptions | Percentage Change | 2018 Net Annual Benefit Cost | 2017 Projected Benefit Obligation | ||||||
Pension Benefits: | |||||||||
Discount rate | 0.5% increase | $ | (7 | ) | $ | (92 | ) | ||
Discount rate | 0.5% decrease | 7 | 102 | ||||||
Expected return on plan assets | 0.5% increase | (7 | ) | N/A | |||||
Expected return on plan assets | 0.5% decrease | 7 | N/A | ||||||
Postretirement Benefits: | |||||||||
Discount rate | 0.5% increase | $ | (1 | ) | $ | (10 | ) | ||
Discount rate | 0.5% decrease | 1 | 11 | ||||||
Compensation increase rates are based on historical experience and anticipated future management actions. Retirement rates are based primarily on actual plan experience, while standard actuarial tables are used to estimate mortality rates.
We no longer have significant exposure to health care cost trend rates due to the modifications we made to our U.S. postretirement health care plan to limit the increase in the annual amount we pay for retiree health care coverage for certain current and future retirees to 3% and to require retiree medical plan participants to purchase individual coverage in the Affordable Insurance Exchanges or individual Medicare marketplace effective January 1, 2016 using a company-funded subsidy based upon years of service at retirement.
Results that differ from these assumptions are accumulated and amortized over future periods and, therefore, generally affect the net benefit cost of future periods. The sensitivity of assumptions reflects the impact of changing one assumption at a time and is specific to conditions at the end of 2017. Economic factors and conditions could affect multiple assumptions simultaneously, and the effects of changes in assumptions are not necessarily linear.
See Note 9 to our consolidated financial statements in Part II, Item 8 of this report for additional information regarding costs, plan obligations, plan assets discount rates and other assumptions.
INCOME TAXES
We record income taxes (benefit) under the asset and liability method. Under this method, deferred tax assets and liabilities are recognized based on the future tax consequences to temporary differences between the financial statement carrying values of existing assets and liabilities and their respective tax bases. Deferred tax assets and liabilities are measured using enacted tax rates expected to apply in the years in which the temporary differences are expected to be recovered or paid.
The 2017 Tax Act amends the Internal Revenue Code to reduce tax rates and modify policies, credits and deductions. For businesses, the 2017 Tax Act reduces the corporate federal tax rate from a maximum of 35% to a flat 21%. The provisional effect on deferred tax assets and liabilities of the change in tax rates was recognized in earnings in the period ended December 31, 2017, which was when the change was enacted.
A reduction of the carrying values of deferred tax assets by a valuation allowance is required if, based on the available evidence, it is more likely than not that such assets will not be realized. The need to establish valuation allowances for deferred tax assets is assessed periodically. In assessing the requirement for, and amount of, a valuation allowance in accordance with the more-likely-than-not standard, we give appropriate consideration to all positive and negative evidence related to the realization of the deferred tax assets. This assessment considers, among other matters, the nature, frequency and severity of current and cumulative losses, forecasts of future profitability, the duration of statutory carryforward periods, our experience with operating loss and tax credit carryforwards not expiring unused and tax planning strategies. A history of cumulative losses for a certain threshold period is a significant form of negative evidence used in the assessment, and we are required to have a policy regarding the duration of the threshold period. We believe the historical cyclical nature of our operations show economic
39
cycles ranging from 7 to 10 years with demand troughs historically showing recovery over four years. Accordingly, we have a policy of four years as our threshold period for cumulative losses.
We weigh, based upon the level of objectivity, all available evidence in our assessment related to the realization of deferred tax assets. Our ability to generate sufficient taxable income in the future, taking into consideration federal foreign tax credits limitations and expirations and state laws on NOL expirations, will determine the need for a valuation allowance. The 2017 Tax Act made significant and material changes to the federal tax system related to the taxation of economic activity within and outside the United States, including a transition tax on unremitted foreign earnings, changes to the foreign tax credits system, carryforward periods and other limitations thereon. Our ability to realize our deferred tax assets, including our foreign tax credit carryforwards, is subject to further clarification of the 2017 Tax Act. As a result, the actual impact on the realizability of our net deferred tax assets may vary from the estimated amount due to uncertainties in our preliminary assessment and estimate. Amounts adjusted in the measurement period for resolution of such uncertainties under SEC Staff Accounting Bulletin No. 118 will be recorded as discrete items in the period in which the accounting for these items is complete.
We recognize the tax benefits of an uncertain tax position only if those benefits are more likely than not to be sustained upon examination by the relevant taxing authorities. Unrecognized tax benefits are subsequently recognized at the time the more-likely-than-not recognition threshold is met, the tax matter is effectively settled or the statute of limitations for the relevant taxing authority to examine and challenge the tax position has expired, whichever is earlier.
See Note 15 to our consolidated financial statements in Part II, Item 8 of this report for additional information regarding these items. We do not anticipate that resolution of such items will result in a material change to our estimate of the effective tax rate or the impact on cash paid for taxes.
Recently Issued Accounting Pronouncements
See Note 2, Recent Accounting Pronouncements, to the consolidated financial statements in Part II, Item 8 of this report for information related to new accounting standards.
Forward-Looking Statements
This report contains forward-looking statements within the meaning of the Private Securities Litigation Reform Act of 1995 related to management’s expectations about future conditions. Any forward-looking statements represent our views only as of today and should not be relied upon as representing our views as of any subsequent date, and we undertake no obligation to update any forward-looking statement. Forward-looking statements include, but are not limited to, statements under the following headings: (1) “Business” about: (a) the availability of synthetic gypsum and sufficiency of energy supplies; and (b) demand for new products and systems that meet regulatory and customer sustainability standards and preferences and our ability to provide such products and systems to maintain our competitive position; (2) “Risk Factors” about significant factors that may adversely affect us and our industry; (3) “Legal Proceedings” and "Legal Contingencies" about the outcome and effect of ongoing and future legal and governmental proceedings; and (4) “Management’s Discussion and Analysis” about: (a) market conditions and outlook, including anticipated growth in new residential and nonresidential construction and repair and remodel spending, and the construction industries in the U.S. and Canada, anticipated growth or decline in countries within the UBBP territory, UBBP's effect on the cyclicality of our North American businesses, U.S. industry shipments of gypsum board, demand for gypsum wallboard and industry capacity utilization rate, and our selling prices and margins; (b) our liquidity outlook, including our expected capital expenditures, selling and administrative expenses, and interest and tax payments, and the funding thereof, our estimate of our effective tax rate and the impact on cash paid for taxes, the timing and funding of our stock repurchase program, UBBP's dividend policy and its ability to self-fund, and cash requirements and adequacy of resources to fund them; and (c) future contributions to our pension plans.
Some of the risk factors that affect our business and financial results are discussed in this report under the caption “Risk Factors.” You should recognize that actual business, market or other conditions, including the risk factors discussed in “Risk Factors” and those described elsewhere in this report or in our other Securities and Exchange Commission filings, could cause our actual results to differ materially from those stated in the forward-looking statements.
40
Item 7A. | QUANTITATIVE AND QUALITATIVE DISCLOSURES ABOUT MARKET RISK |
We use derivative instruments to manage selected commodity price and foreign currency exposures. We do not use derivative instruments for speculative trading purposes, and we typically do not hedge beyond six years.
COMMODITY PRICE RISK
We use swap contracts to manage our exposure to fluctuations in commodity prices associated with anticipated purchases of natural gas. Currently, a significant portion of our anticipated purchases of natural gas is hedged for 2018. The aggregate notional amount of these hedge contracts in place as of December 31, 2017 was 38 million mmBTUs, and they mature by December 31, 2022. We review our positions regularly and make adjustments as market and business conditions warrant. The fair value of these contracts was a $12 million unrealized loss as of December 31, 2017.
A sensitivity analysis was prepared to estimate the potential change in the fair value of our natural gas hedge contracts assuming a hypothetical 10% change in market prices. Based on the results of this analysis, which may differ from actual results, the potential change in the fair value of our natural gas hedge contracts as of December 31, 2017 and 2016 was $9 million and $10 million, respectively. This analysis does not consider the underlying exposure.
FOREIGN CURRENCY EXCHANGE RISK
We have foreign exchange forward contracts to hedge forecasted purchases of products and services denominated in foreign currencies. The notional amount of these contracts was $95 million as of December 31, 2017, and they mature by December 31, 2018. The fair value of these contracts was a $3 million unrealized loss as of December 31, 2017.
A sensitivity analysis was prepared to estimate the potential change in the fair value of our foreign exchange forward contracts assuming a hypothetical 10% change in foreign exchange rates. Based on the results of this analysis, which may differ from actual results, the potential change in the fair value of our foreign exchange forward contracts as of December 31, 2017 and 2016 was $11 million and $9 million, respectively. This analysis does not consider the underlying exposure.
INTEREST RATE RISK
As of December 31, 2017, all of our outstanding debt was fixed-rate debt. Consequently, our debt is not subject to risk from changing interest rates.
A sensitivity analysis was prepared to estimate the potential change in fair value of our marketable securities portfolio assuming a hypothetical 100-basis-point increase in interest rates. Based on the results of this analysis, which may differ from actual results, the potential change in fair value of our marketable securities as of December 31, 2017 and 2016 was immaterial in both years.
See Notes 1 and 7 to the consolidated financial statements in Part II, Item 8 for additional information regarding our financial exposures.
41
Item 8.FINANCIAL STATEMENTS AND SUPPLEMENTARY DATA
Page | ||
CONSOLIDATED FINANCIAL STATEMENTS: | ||
1. | ||
2. | ||
3 | ||
4 | ||
5 | ||
6. | ||
7. | ||
8. | ||
9. | ||
10. | ||
11. | ||
12. | ||
13. | ||
14. | ||
15. | ||
16. | ||
17. | ||
18. | ||
19. | ||
20. | ||
All other schedules have been omitted because they are not required or applicable or the information is included in the consolidated financial statements or notes thereto.
42
USG CORPORATION
CONSOLIDATED STATEMENTS OF INCOME
(millions, except share and per-share data) | Years Ended December 31, | ||||||||||
2017 | 2016 | 2015 | |||||||||
Net sales | $ | 3,204 | $ | 3,017 | $ | 2,913 | |||||
Cost of products sold | 2,539 | 2,312 | 2,263 | ||||||||
Gross profit | 665 | 705 | 650 | ||||||||
Selling and administrative expenses | 298 | 304 | 302 | ||||||||
Long-lived asset impairment charges | — | 10 | — | ||||||||
Recovery of receivable | — | (3 | ) | (6 | ) | ||||||
Gain on disposal of shipping operations, net | — | — | (1 | ) | |||||||
Operating profit | 367 | 394 | 355 | ||||||||
Income from equity method investments | 59 | 49 | 48 | ||||||||
Interest expense | (69 | ) | (145 | ) | (163 | ) | |||||
Interest income | 4 | 4 | 2 | ||||||||
Income and gain from the sale of equity method investment to related party | — | — | 13 | ||||||||
Loss on extinguishment of debt | (22 | ) | (37 | ) | (19 | ) | |||||
Other (expense) income, net | (4 | ) | 9 | — | |||||||
Income from continuing operations before income taxes | 335 | 274 | 236 | ||||||||
Income tax (expense) benefit | (238 | ) | (63 | ) | 740 | ||||||
Income from continuing operations | 97 | 211 | 976 | ||||||||
(Loss) income from discontinued operations, net of tax | (9 | ) | 20 | 15 | |||||||
Gain on sale of discontinued operations, net of tax | — | 279 | — | ||||||||
Net income | $ | 88 | $ | 510 | $ | 991 | |||||
Earnings per common share - basic: | |||||||||||
Income from continuing operations | $ | 0.67 | $ | 1.45 | $ | 6.70 | |||||
(Loss) income from and gain on sale of discontinued operations | (0.06 | ) | 2.04 | 0.11 | |||||||
Net income | $ | 0.61 | $ | 3.49 | $ | 6.81 | |||||
Earnings per common share - diluted: | |||||||||||
Income from continuing operations | $ | 0.66 | $ | 1.44 | $ | 6.62 | |||||
(Loss) income from and gain on sale of discontinued operations | (0.06 | ) | 2.02 | 0.11 | |||||||
Net income | $ | 0.60 | $ | 3.46 | $ | 6.73 | |||||
Average common shares | 144,447,488 | 145,929,506 | 145,457,208 | ||||||||
Dilutive awards under long-term incentive plan | 2,263,358 | 1,731,473 | 1,624,866 | ||||||||
Deferred shares for non-employee directors | — | — | 164,526 | ||||||||
Average diluted common shares | 146,710,846 | 147,660,979 | 147,246,600 | ||||||||
See accompanying Notes to Consolidated Financial Statements
43
USG CORPORATION
CONSOLIDATED STATEMENTS OF COMPREHENSIVE INCOME
(millions) | Years Ended December 31, | ||||||||||
2017 | 2016 | 2015 | |||||||||
Net income | $ | 88 | $ | 510 | $ | 991 | |||||
Other comprehensive income (loss), net of tax: | |||||||||||
Derivatives qualifying as cash flow hedges: | |||||||||||
(Loss) gain on derivatives qualifying as cash flow hedges, net of tax (benefit) of ($10), $2, and $4, respectively | (14 | ) | 1 | (5 | ) | ||||||
Less: Reclassification adjustment for loss on derivatives included in net income, net of tax (benefit) of ($3), ($4), and $2, respectively | (3 | ) | (6 | ) | (9 | ) | |||||
Derivatives qualifying as cash flow hedges, net of tax (benefit) of ($7), $6, and $2, respectively | (11 | ) | 7 | 4 | |||||||
Pension and postretirement benefits: | |||||||||||
Changes in pension and postretirement benefits, net of tax (benefit) of ($27), ($19), and $6, respectively | (65 | ) | (34 | ) | 74 | ||||||
Less: Amortization of prior service benefit cost included in net periodic benefit cost, net of tax (benefit) of ($10), ($7), and ($1), respectively | (14 | ) | (9 | ) | (7 | ) | |||||
Pension and postretirement benefits, net of tax (benefit) of ($17), ($12), and $7, respectively | (51 | ) | (25 | ) | 81 | ||||||
Foreign currency translation: | |||||||||||
Changes in foreign currency translation, net of tax of $0 in all periods | 58 | (53 | ) | (67 | ) | ||||||
Less: Translation loss realized upon sale of foreign entities, net of tax of $0 in all periods | — | — | (6 | ) | |||||||
Foreign currency translation, net of tax of $0 in all periods | 58 | (53 | ) | (61 | ) | ||||||
Other comprehensive (loss) income, net of tax | (4 | ) | (71 | ) | 24 | ||||||
Comprehensive income | $ | 84 | $ | 439 | $ | 1,015 | |||||
See accompanying Notes to Consolidated Financial Statements
44
USG CORPORATION
CONSOLIDATED BALANCE SHEETS
(millions, except share data) | As of December 31, | |||||||
2017 | 2016 | |||||||
Assets | ||||||||
Cash and cash equivalents | $ | 394 | $ | 427 | ||||
Short-term marketable securities | 62 | 62 | ||||||
Receivables (net of reserves: 2017 - $9 and 2016 - $8) | 233 | 183 | ||||||
Inventories | 252 | 236 | ||||||
Income taxes receivable | 15 | 1 | ||||||
Other current assets | 35 | 40 | ||||||
Total current assets | 991 | 949 | ||||||
Long-term marketable securities | 37 | 29 | ||||||
Property, plant and equipment, net | 1,762 | 1,707 | ||||||
Deferred income taxes | 287 | 492 | ||||||
Equity method investments | 686 | 628 | ||||||
Goodwill and intangible assets | 43 | 8 | ||||||
Other assets | 45 | 56 | ||||||
Total assets | $ | 3,851 | $ | 3,869 | ||||
Liabilities and Stockholders’ Equity | ||||||||
Accounts payable | $ | 280 | $ | 237 | ||||
Accrued expenses | 135 | 175 | ||||||
Income taxes payable | — | 10 | ||||||
Total current liabilities | 415 | 422 | ||||||
Long-term debt | 1,078 | 1,083 | ||||||
Deferred income taxes | 4 | 4 | ||||||
Pension and other postretirement benefits | 326 | 290 | ||||||
Other liabilities | 183 | 184 | ||||||
Total liabilities | 2,006 | 1,983 | ||||||
Stockholders’ Equity: | ||||||||
Preferred stock – $1 par value, authorized 36,000,000 shares; outstanding - none | — | — | ||||||
Common stock – $0.10 par value; authorized 200,000,000 shares; issued: 2017 - 146,513,000 shares and 2016 - 146,167,000 shares | 15 | 15 | ||||||
Treasury stock at cost; 2017 - 5,571,000 shares and 2016 - 0 shares | (169 | ) | — | |||||
Additional paid-in capital | 3,057 | 3,038 | ||||||
Accumulated other comprehensive loss | (389 | ) | (385 | ) | ||||
Retained earnings (accumulated deficit) | (669 | ) | (782 | ) | ||||
Total stockholders’ equity | 1,845 | 1,886 | ||||||
Total liabilities and stockholders’ equity | $ | 3,851 | $ | 3,869 | ||||
See accompanying Notes to Consolidated Financial Statements
45
Years Ended December 31, | |||||||||||
(millions) | 2017 | 2016 | 2015 | ||||||||
Operating Activities | |||||||||||
Net income | $ | 88 | $ | 510 | $ | 991 | |||||
Less: (Loss) income from discontinued operations, net of tax | (9 | ) | 20 | 15 | |||||||
Less: Gain on sale of discontinued operations, net of tax | — | 279 | — | ||||||||
Income from continuing operations | 97 | 211 | 976 | ||||||||
Adjustments to reconcile income from continuing operations to net cash: | |||||||||||
Depreciation, depletion, and amortization | 132 | 134 | 131 | ||||||||
Loss on extinguishment of debt | 22 | 37 | 19 | ||||||||
Long-lived asset impairment charges | — | 10 | — | ||||||||
Recovery of receivable | — | (3 | ) | (6 | ) | ||||||
Share-based compensation expense | 18 | 18 | 14 | ||||||||
Deferred income taxes | 255 | 57 | (742 | ) | |||||||
(Loss) gain on asset dispositions | 1 | (9 | ) | (13 | ) | ||||||
Gain from the sale of equity method investment to related party | — | — | (6 | ) | |||||||
Income from equity method investments | (59 | ) | (49 | ) | (50 | ) | |||||
Dividends received from equity method investments | 42 | 47 | 38 | ||||||||
Pension settlement | 12 | 20 | 1 | ||||||||
(Increase) decrease in working capital | |||||||||||
Receivables | (32 | ) | 6 | 21 | |||||||
Income taxes receivable | (12 | ) | 3 | (3 | ) | ||||||
Inventories | (13 | ) | (20 | ) | (16 | ) | |||||
Other current assets | (3 | ) | 9 | 1 | |||||||
Payables | 20 | 21 | (16 | ) | |||||||
Accrued expenses | (36 | ) | (39 | ) | (61 | ) | |||||
Decrease in other assets | 4 | — | 4 | ||||||||
Decrease in pension and other postretirement benefits | (57 | ) | (142 | ) | (28 | ) | |||||
Decrease in other liabilities | (13 | ) | (6 | ) | (7 | ) | |||||
Other, net | 4 | 9 | 22 | ||||||||
Net cash provided by operating activities of continuing operations | 382 | 314 | 279 | ||||||||
Net cash provided by operating activities of discontinued operations | — | 59 | 52 | ||||||||
Net cash provided by operating activities | $ | 382 | $ | 373 | $ | 331 | |||||
Investing Activities | |||||||||||
Purchases of marketable securities | (105 | ) | (274 | ) | (246 | ) | |||||
Sales or maturities of marketable securities | 97 | 413 | 170 | ||||||||
Capital expenditures | (168 | ) | (83 | ) | (87 | ) | |||||
Proceeds from asset dispositions | 2 | 12 | 58 | ||||||||
Net proceeds from the sale of equity method investment to related party | — | — | 52 | ||||||||
Acquisition of business | (52 | ) | — | — | |||||||
Return of capital | — | 1 | — | ||||||||
Insurance proceeds | 1 | 1 | — | ||||||||
Return (deposit) of restricted cash | — | 9 | (8 | ) | |||||||
Net cash (used for) provided by investing activities of continuing operations | (225 | ) | 79 | (61 | ) | ||||||
Net cash provided by (used for) investing activities of discontinued operations | 6 | 667 | (2 | ) | |||||||
Net cash (used for) provided by investing activities | $ | (219 | ) | $ | 746 | $ | (63 | ) | |||
Financing Activities | |||||||||||
Issuance of debt | 500 | — | 350 | ||||||||
Repayment of debt | (521 | ) | (1,131 | ) | (386 | ) | |||||
Payment of debt issuance fees | (8 | ) | — | (6 | ) | ||||||
Issuance of common stock | 15 | 4 | 6 | ||||||||
Repurchase of common stock | (184 | ) | — | — | |||||||
Repurchases of common stock to satisfy employee tax withholding obligations | (4 | ) | (2 | ) | (8 | ) | |||||
Net cash used for financing activities of continuing operations | $ | (202 | ) | $ | (1,129 | ) | $ | (44 | ) | ||
(continued on the next page) | |||||||||||
46
Years Ended December 31, | |||||||||||
(millions) | 2017 | 2016 | 2015 | ||||||||
Effect of exchange rate changes on cash | 6 | (5 | ) | (10 | ) | ||||||
Net (decrease) increase in cash and cash equivalents from continuing operations | (39 | ) | (741 | ) | 164 | ||||||
Net increase in cash and cash equivalents from discontinued operations | 6 | 726 | 50 | ||||||||
Change in cash balance included in discontinued operations | — | — | (3 | ) | |||||||
Net (decrease) increase in cash and cash equivalents | $ | (33 | ) | $ | (15 | ) | $ | 211 | |||
Cash and cash equivalents at beginning of period | 427 | 442 | 231 | ||||||||
Cash and cash equivalents at end of period | $ | 394 | $ | 427 | $ | 442 | |||||
Supplemental Cash Flow Disclosures: | |||||||||||
Interest paid, net of interest capitalized | $ | 82 | $ | 153 | $ | 158 | |||||
Income taxes paid, net of refunds received | 10 | 4 | — | ||||||||
Noncash Investing and Financing Activities: | |||||||||||
Amount in accounts payable for capital expenditures | 18 | 15 | 5 | ||||||||
Reversal of USG Boral Building Products earnout | — | (24 | ) | — | |||||||
See accompanying Notes to Consolidated Financial Statements
47
USG CORPORATION
CONSOLIDATED STATEMENTS OF STOCKHOLDERS’ EQUITY
(millions, except share data) | Common Shares Issued (000) | Treasury Shares (000) | Common Stock | Treasury Stock | Additional Paid-in Capital | Accumulated Other Comprehensive Income (Loss) | Retained Earnings (Deficit) | Stockholders' Equity | Non-controlling Interest | Total | |||||||||||||||||||||||||||
Balance as of January 1, 2015 | 144,768 | — | $ | 14 | $ | — | $ | 3,014 | $ | (338 | ) | $ | (2,283 | ) | $ | 407 | $ | 1 | $ | 408 | |||||||||||||||||
Net income | 991 | 991 | 991 | ||||||||||||||||||||||||||||||||||
Other comprehensive income | 24 | 24 | 24 | ||||||||||||||||||||||||||||||||||
Share-based compensation | 15 | 15 | 15 | ||||||||||||||||||||||||||||||||||
Stock issuances | 899 | 283 | 1 | 8 | (2 | ) | 7 | 7 | |||||||||||||||||||||||||||||
Repurchase of common stock | (283 | ) | (8 | ) | (8 | ) | (8 | ) | |||||||||||||||||||||||||||||
Changes in noncontrolling interest | — | (1 | ) | (1 | ) | ||||||||||||||||||||||||||||||||
Balance as of December 31, 2015 | 145,667 | — | $ | 15 | $ | — | $ | 3,027 | $ | (314 | ) | $ | (1,292 | ) | $ | 1,436 | $ | — | $ | 1,436 | |||||||||||||||||
Net income | 510 | 510 | 510 | ||||||||||||||||||||||||||||||||||
Other comprehensive loss | (71 | ) | (71 | ) | (71 | ) | |||||||||||||||||||||||||||||||
Share-based compensation | 18 | 18 | 18 | ||||||||||||||||||||||||||||||||||
Tax deficiencies in share-based compensation | (11 | ) | (11 | ) | (11 | ) | |||||||||||||||||||||||||||||||
Stock issuances | 500 | 85 | — | 2 | 4 | 6 | 6 | ||||||||||||||||||||||||||||||
Repurchase of common stock | (85 | ) | (2 | ) | (2 | ) | (2 | ) | |||||||||||||||||||||||||||||
Balance as of December 31, 2016 | 146,167 | — | $ | 15 | $ | — | $ | 3,038 | $ | (385 | ) | $ | (782 | ) | $ | 1,886 | $ | — | $ | 1,886 | |||||||||||||||||
Impact due to adoption of ASU 2016-09 | 25 | 25 | 25 | ||||||||||||||||||||||||||||||||||
Net income | 88 | 88 | 88 | ||||||||||||||||||||||||||||||||||
Other comprehensive loss | (4 | ) | (4 | ) | (4 | ) | |||||||||||||||||||||||||||||||
Share-based compensation | 18 | 18 | 18 | ||||||||||||||||||||||||||||||||||
Stock issuances | 346 | 577 | — | 19 | (5 | ) | 14 | 14 | |||||||||||||||||||||||||||||
Repurchase of common stock | (6,148 | ) | (188 | ) | (188 | ) | (188 | ) | |||||||||||||||||||||||||||||
Other | 6 | 6 | 6 | ||||||||||||||||||||||||||||||||||
Balance as of December 31, 2017 | 146,513 | (5,571 | ) | $ | 15 | $ | (169 | ) | $ | 3,057 | $ | (389 | ) | $ | (669 | ) | $ | 1,845 | $ | — | $ | 1,845 | |||||||||||||||
See accompanying Notes to Consolidated Financial Statements
48
NOTES TO CONSOLIDATED FINANCIAL STATEMENTS
In the following Notes to Consolidated Financial Statements, “USG,” “we,” “our” and “us” refer to USG Corporation and its subsidiaries included in the consolidated financial statements, except as otherwise indicated or as the context otherwise requires.
1. | Significant Accounting Policies |
Nature of Operations
USG, through our subsidiaries and joint ventures, is a leading manufacturer of building materials and innovative solutions. We produce a wide range of products for use in new residential, new nonresidential, and residential and nonresidential repair and remodel construction as well as products used in certain industrial processes. Our products are distributed through building materials dealers, home improvement centers and other retailers and specialty wallboard distributors and sold directly to contractors.
Segments
During the fourth quarter of 2017, we realigned our operating structure to reflect changes in our organizational structure and management's operation and view of our businesses. Our realigned operating structure is generally aligned by product type and consists of three divisions, in addition to our USG Boral Building Products, or UBBP, our joint ventures in Asia, Australasia and the Middle East: Gypsum, Performance Materials and Ceilings. The operations of the divisions are similar throughout North America.
This change to our operating structure modified how the business is managed and the financial information received by the chief operating decision maker to assess operating performance and allocate resources, and thus, triggered a review of our segment structure. Effective for the quarter ended December 31, 2017, we changed the composition of our reportable segments to reflect this change. We now have five reportable segments: U.S. Wallboard and Surfaces, U.S. Performance Materials, U.S. Ceilings, Canada, and UBBP. Our prior period results have been recast to reflect these changes and present comparative year over year information by segment. See Note 14, Segments.
Our reportable segments are determined considering both qualitative and quantitative metrics for aggregation of the product type within geographies for which discrete financial information is available. Our U.S. Wallboard and Surfaces, U.S. Performance Materials and U.S. Ceilings reportable segments were identified based on products manufactured and marketed. Our Canada segment is a separately reportable segment, as while it has similar qualitative factors to U.S. operations, it has different quantitative metrics and, therefore, cannot be aggregated. Our operating segments in Mexico and Latin America, as well as our mining operation in Little Narrows, Nova Scotia, Canada, which we indefinitely idled in 2016, and our shipping company, which we exited in 2015, are now included in Other as reconciling items to our consolidated segments. There has been no change to our UBBP segment.
Consolidation and Presentation
Our consolidated financial statements include the accounts of USG Corporation and its majority-owned subsidiaries. Entities in which we have more than a 20% but not more than 50% ownership interest are accounted for using the equity method of accounting. All intercompany balances and transactions are eliminated in consolidation.
Certain other reclassifications have been made to prior year amounts in order to conform with current year presentation. On our consolidated balance sheet, we reclassified the balance of our intangible assets from '"Other assets" to "Goodwill and intangible assets."
Use of Estimates
The preparation of our consolidated financial statements in conformity with accounting principles generally accepted in the United States of America requires management to make estimates and assumptions. These estimates and assumptions affect the reported amounts of assets, liabilities, revenues and expenses. Actual results could differ from these estimates.
Revenue Recognition
We recognize revenue when shipment is received by the customer. We enter into agreements with customers to offer rebates, generally based on achievement of specified sales levels and various marketing allowances that are common industry practice. Estimated reductions to revenue for customer programs and incentive offerings, including promotions and other volume–based incentives, are recorded in the period in which the sale occurs. Provisions for early payment discounts are accrued in the same period in which the sale occurs.
49
Shipping and Handling Costs
Shipping and handling costs billed to customers are included in net sales and the related costs are presented in cost of products sold.
Advertising
Advertising expenses consist of media advertising and related production costs and sponsorships. We charge advertising expenses to earnings as incurred. These expenses amounted to $10 million, $12 million and $16 million for the years ended December 31, 2017, 2016 and 2015, respectively, and are included in "Selling and administrative expenses" in our consolidated statements of income.
Research and Development
We charge research and development expenditures to earnings as incurred. These expenditures amounted to $23 million, $24 million and $23 million for the years ended December 31, 2017, 2016 and 2015, respectively, and are included in "Cost of products sold" and "Selling and administrative expenses" in our consolidated statements of income.
Legal Costs
We expense legal costs as incurred.
Income Taxes
We record income tax expense (benefit) under the asset and liability method. Under this method, deferred tax assets and liabilities are recognized based on temporary differences between the financial statement carrying values of existing assets and liabilities and their respective tax bases. Deferred tax assets and liabilities are measured using enacted tax rates expected to apply in the years in which the temporary differences are expected to be recovered or paid. The effect on deferred tax assets and liabilities of a change in tax rates is recognized in earnings in the period when the change is enacted. Valuation allowances are recorded to reduce deferred tax assets when it is more likely than not that a tax benefit will not be realized.
A reduction of the carrying values of deferred tax assets by a valuation allowance is required if, based on all available evidence, it is more likely than not that such assets will not be realized. The need to establish valuation allowances for deferred tax assets is assessed at each reporting date. In assessing the requirement for, and amount of, a valuation allowance in accordance with the more-likely-than-not standard, we give appropriate consideration to all positive and negative evidence related to the realization of the deferred tax assets. This assessment considers, among other matters, the nature, frequency and severity of current and cumulative losses, forecasts of future profitability, the duration of statutory carryforward periods, our experience with operating loss and tax credit carryforwards not expiring unused and tax planning strategies.
A history of cumulative losses for a certain threshold period is a significant form of negative evidence used in the assessment, and we are required to have a policy regarding the duration of the threshold period. We believe the historical cyclical nature of our operations show economic cycles ranging from 7 to 10 years with demand troughs historically showing recovery over four years. Accordingly, we have a policy of four years as our threshold period for cumulative losses.
Inventory Valuation
All of our inventories are stated at the lower of cost or net realizable value and are valued under the average cost method. Our inventories include materials, labor and applicable factory overhead costs. Depreciation associated with manufacturing assets is excluded from inventory cost but is included in cost of products sold.
Earnings per Share
Basic earnings per share is based on the weighted average number of common shares outstanding. Diluted earnings per share is based on the weighted average number of common shares outstanding plus the dilutive effect, if any, of market share units, or MSUs, restricted stock units, or RSUs, performance shares, stock options and the deferred shares associated with our deferred compensation program for non-employee directors. The shares that were not included in the computation of diluted earnings per share for those periods because their inclusion would be anti-dilutive were as follows:
(millions, common shares) | 2017 | 2016 | 2015 | |||||
Stock options, RSUs, MSUs and performance shares | 0.7 | 1.5 | 1.9 | |||||
Deferred shares associated with a deferred compensation program for non-employee directors | 0.2 | 0.2 | — | |||||
50
Business Combinations
Business combinations are accounted for using the acquisition method of accounting. The purchase price of the acquisition is allocated to the tangible and intangible assets acquired and liabilities assumed based on their fair values at the acquisition date. The calculation of fair value of the identified intangible assets are determined using cash flow models following the income approach or a discounted market-based methodology approach. Significant inputs include projected revenues, gross margins, operating expenses, estimated attrition rate and discount rates. The excess of fair value of the purchase price over the fair values of the tangible and identifiable intangible assets acquired and liabilities assumed is recorded as goodwill. During the measurement period, which may be up to one year from the acquisition date, we may record adjustments to the net assets with the corresponding offset to goodwill. The results of operations of the acquired business are included in our consolidated results of operations beginning on the date of the acquisition. Acquisition-related expenses, including legal costs, due diligence costs and business valuation costs, are expensed as incurred.
Cash and Cash Equivalents
Cash and cash equivalents include highly liquid investments, primarily money market funds, with maturities of three months or less at the time of purchase.
Marketable Securities
Marketable securities are classified as available-for-sale securities and reported at fair value, with unrealized gains and losses excluded from earnings and reported in accumulated other comprehensive income (loss), or AOCI. If it is deemed that marketable securities have unrealized losses that are other than temporary, these losses will be recorded in earnings immediately. Situations in which losses may be considered other than temporary include when we have decided to sell a security or when it is more likely than not that we will be required to sell the security before we recover its amortized cost basis. Cost basis for securities sold are determined on a first-in-first-out basis.
Receivables
Receivables are recorded at net realizable value, which includes allowances for cash discounts and doubtful accounts. We review the collectability of receivables on an ongoing basis and reserve for receivables determined to be uncollectible. This determination is based on the delinquency of the account, the financial condition of the customer and our collection experience.
We include short-term financing receivables in "Receivables" and long-term financing and loan receivables in "Other assets" on our consolidated balance sheets. Financing and loan receivables are recorded at net realizable value which includes an allowance for credit losses. We review the collectability of financing and loan receivables on an ongoing basis and reserve for financing and loan receivables determined to be uncollectible. This determination is based on the delinquency of the account and the financial condition of the other party. As of December 31, 2017, the allowance for credit losses was immaterial.
Investments in Unconsolidated Joint Ventures
The equity method of accounting is used for investments in joint ventures that we do not consolidate, but over which we have the ability to exercise significant influence. These investments are initially recorded at cost and subsequently adjusted for our share of the net income or loss and cash contributions and distributions to or from these entities. If the underlying net assets in our investments are denominated in a foreign currency, we adjust the value of our investment for translation gains or losses with a corresponding adjustment to our AOCI.
We are required to pay Boral, our UBBP joint venture partner, an earnout of $50 million in 2019 if certain financial metrics are met. At least quarterly, we review the probability of this earnout payment to Boral. At December 31, 2017, we concluded that it is currently not probable that the earnout target will be achieved. If our conclusion on the probability of achievement were to change, we will record a liability representing the present value of the second earnout payment with a corresponding increase to our investment.
Losses in the value of an equity method investment that are other than temporary are recognized when the current fair value of the investment is less than its carrying value. We review our investments in equity method investments for impairment whenever factors indicate an other than temporary loss in value. If we conclude a loss in value is other than temporary, an impairment charge is recognized for the difference between the investment’s carrying value and its estimated fair value.
Property, Plant and Equipment
Property, plant and equipment is recorded at cost. We record depreciation of property, plant and equipment on a straight-line basis over the expected useful lives of the assets. We have determined estimated useful lives to be 50 years for buildings and improvements, a range of 10 to 25 years for machinery and equipment, and a range of 5 to 7 years for computer software and systems development costs. Leasehold improvements are capitalized and amortized over the shorter of the remaining lease term
51
or remaining economic useful life. We compute depletion on a basis calculated to spread the cost of gypsum and other applicable resources over the estimated quantities of material recoverable.
We capitalize interest during the active construction period of major capital projects. Capitalized interest is added to the cost of the underlying assets and is depreciated over the useful lives of those assets. We recorded capitalized interest of $3 million, $1 million and $3 million for the years ended December 31, 2017, 2016 and 2015, respectively. Facility start-up costs that cannot be capitalized are expensed as incurred and recorded in cost of products sold.
Property, plant and equipment is reviewed for impairment when indicators of a potential impairment are present by comparing the carrying values of the assets with their estimated future undiscounted cash flows. If we determine an impairment exists, the asset is written down to fair value.
Intangible Assets
We perform impairment tests for intangible assets with indefinite useful lives once a year, or more frequently if events occur or circumstances change that would more likely than not reduce the fair value of an intangible asset below its carrying value. The impairment test for assets with indefinite lives consists of a comparison of the fair value of the asset with its carrying value. If the carrying value of an intangible asset exceeds its fair value, an impairment loss is recognized in an amount equal to that excess. Intangible assets determined to have indefinite useful lives, primarily composed of trade names, are not amortized. An income approach is used for valuing trade names. Assumptions used in the income approach include projected revenues and assumed royalty, long-term growth and discount rates. As of December 31, 2017 and 2016, our indefinite lived intangibles, which are included in "Goodwill and intangible assets" on our consolidated balance sheets, totaled $19 million and $8 million, respectively.
We perform impairment tests on definite lived intangible assets upon identification of events or circumstances that may indicate the carrying value of the assets might be unrecoverable by comparing their undiscounted cash flows with their carrying value. If we determine impairment exists, the assets are written down to estimated fair value. As of December 31, 2017 and 2016, our definite lived intangibles, which are included in "Goodwill and intangible assets" on our consolidated balance sheets, totaled $8 million and $0 million, respectively.
Goodwill
We perform an impairment test on goodwill as of October 1, or more frequently if events occur or circumstances change that would more likely than not reduce the fair value below its carrying value. In testing goodwill for impairment, we have the option to first assess qualitative factors to determine whether the existence of events or circumstances leads to a determination that it is more likely than not that the estimated fair value of a reporting unit is less than its carrying value. If we elect to perform a qualitative assessment and determine that an impairment is more likely than not, we are then required to perform a quantitative impairment test, otherwise no further analysis is required. We also may elect not to perform the qualitative assessment and, instead, proceed directly to the quantitative impairment test. We perform a quantitative analysis which involves comparing the current fair value of each reporting unit to its carrying value, including goodwill. If the carrying value of a reporting unit exceeds its fair value, we recognize an impairment loss equal to the difference between the carrying value and the estimated fair value of the reporting unit. As of December 31, 2017 and 2016, goodwill totaled $16 million and $0 million, respectively, and is included in "Goodwill and intangible assets" on our consolidated balance sheets.
Asset Retirement Obligations
Our asset retirement obligations include reclamation requirements as regulated by government authorities related principally to assets such as our mines, quarries, landfills, ponds and wells. The accounting for asset retirement obligations requires estimates by management about the timing of asset retirements, the cost of retirement obligations, discount and inflation rates used in determining fair values and the methods of remediation associated with our asset retirement obligations. We generally use assumptions and estimates that reflect the most likely remediation method on a site-by-site basis. Our estimated liability for asset retirement obligations is revised annually, and whenever events or changes in circumstances indicate that a revision to the estimate is necessary.
In instances where a decrease in the asset retirement obligation is in excess of the related remaining net book value of the asset retirement costs, the excess is recorded to the consolidated statement of income as a reduction in "Cost of products sold." Asset retirement obligations are included in "Other liabilities" on the consolidated balance sheets.
Share-Based Compensation
We award share-based compensation to employees in the form of MSUs, performance shares and RSUs and to non-employee directors in the form of shares of our common stock. All grants under share-based payment programs are accounted for at fair value at the date of grant. We recognize expense on all share-based awards to employees expected to vest over the service
52
period, which is the shorter of the period until the employees’ retirement eligibility dates or the service period of the award. We record forfeitures as they occur.
Derivative Instruments
We use derivative instruments to manage selected commodity price and foreign currency exposures. We do not use derivative instruments for speculative trading purposes, and we typically do not hedge beyond six years. All derivative instruments are recorded on the balance sheet at fair value. For derivatives designated as cash flow hedges, the effective portion of changes in the fair value of the derivative is recorded to AOCI, and is reclassified to earnings when the underlying forecasted transaction affects earnings. The ineffective portion of changes in the fair value of the derivative is reported in cost of products sold in the current period. For contracts designated as cash flow hedges, we reassess the probability of the underlying forecasted transactions occurring on a quarterly basis. For derivatives designated as net investment hedges, we record changes in fair value to AOCI. For derivatives not designated as hedging instruments, all changes in fair value are recorded to earnings in the current period. Cash flows from derivative instruments are included in operating activities in our consolidated statements of cash flows.
We use swaps to hedge a significant portion of our anticipated purchases of natural gas to be used in our manufacturing operations. Generally, we hedge the cost of a majority of our anticipated purchases of natural gas over the next 12 months. However, we review our positions regularly and make adjustments as market conditions warrant. The majority of contracts currently in place are designated as cash flow hedges and the remainder are not designated as hedging instruments.
We have operations outside of the United States and use forward contracts to hedge the risk of changes in cash flows resulting from selected forecasted intercompany and third-party sales or purchases, as well as intercompany loans, denominated in non-U.S. currencies, or to hedge the risk of selected changes in our net investment in foreign subsidiaries. These contracts are designated as either cash flow or net investment hedges or are not designated as hedging instruments.
Foreign Currency Translation
We translate foreign-currency-denominated assets and liabilities into U.S. Dollars at the exchange rates existing as of the respective balance sheet dates. We translate income and expense items at the average exchange rates during the respective periods. We record translation adjustments resulting from fluctuations in exchange rates to AOCI on our consolidated balance sheets.
We record transaction gains and losses to earnings. We recorded a total transaction loss of $4 million in 2017, a gain of $3 million in 2016 and a loss of $7 million in 2015. Transaction gains and losses are included in "Other (expense) income, net" in our consolidated statements of income.
Fair Value Measurements
Certain assets and liabilities are required to be recorded at fair value. The estimated fair values of those assets and liabilities have been determined using market information and valuation methodologies. Changes in assumptions or estimation methods could affect the fair value estimates. However, we do not believe any such changes would have a material impact on our financial condition, results of operations or cash flows. There are three levels of inputs that may be used to measure fair value:
• | Level 1 – Quoted prices for identical assets and liabilities in active markets; |
• | Level 2 – Quoted prices for similar assets and liabilities in active markets; quoted prices for identical or similar assets and liabilities in markets that are not active; and model-derived valuations in which all significant inputs and significant value drivers are observable in active markets; and |
• | Level 3 – Valuations derived from valuation techniques in which one or more significant inputs or significant value drivers are unobservable. |
Certain assets and liabilities are measured at fair value on a nonrecurring basis rather than on an ongoing basis, but are subject to fair value adjustments in certain circumstances, such as an acquisition, when evidence of impairment or when a new liability is being established that requires fair value measurement.
53
2. | Recent Accounting Pronouncements |
Recently Adopted Accounting Pronouncements
We adopted Accounting Standards Update, or ASU 2017-04, "Intangibles - Goodwill and Other (Topic 350): Simplifying the Test for Goodwill Impairment," on November 30, 2017 in connection with our acquisition of Ceilings Plus, which eliminates Step 2 from the goodwill impairment test. Under the new standard, an impairment charge would be recognized for the amount by which the carrying value exceeds the reporting unit’s fair value; however, the loss recognized should not exceed the total amount of goodwill allocated to that reporting unit. The adoption did not have an impact on our consolidated financial statements.
We adopted ASU 2016-09, “Compensation - Stock Compensation (Topic 718): Improvements to Employee Share-Based Payment Accounting,” on January 1, 2017. This ASU simplifies certain aspects of accounting for employee share-based payments. Upon adoption, we recorded to retained earnings a $25 million cumulative-effect adjustment for previously unrecognized excess tax benefits and an immaterial cumulative-effect adjustment for the reversal of cumulative forfeiture estimates to record forfeitures as they occur.
Recently Issued Accounting Pronouncements
In August 2017, the Financial Accounting Standards Board, or FASB, issued ASU 2017-12, “Derivatives and Hedging (Topic 815): Targeted Improvements to Accounting for Hedging Activities,” which expands and refines hedge accounting for both non-financial and financial risk components and aligns the recognition and presentation of the effects of the hedging instrument and the hedged item in the financial statements. The new standard will be effective for us on January 1, 2019. We do not expect the adoption of ASU 2017-12 to have a significant impact to our consolidated financial statements or disclosures.
In March 2017, the FASB issued ASU 2017-07, “Compensation - Retirement Benefits (Topic 715): Improving the Presentation of Net Periodic Pension Cost and Net Periodic Postretirement Benefit Cost,” which will require us to disaggregate and present current service cost along with other current compensation costs for employees while presenting other net benefit cost components below operating profit. In addition, only the service cost component of net benefit cost is eligible for capitalization in our inventory and fixed assets. We will retrospectively adopt the standard on January 1, 2018 for the presentation of service cost using the practical expedient and prospectively adopt the capitalization of only service cost into inventory and fixed assets. Select line items from our consolidated statements of income for the years ended December 31, 2017 and 2016 which reflect the changes in presentation of net benefit costs are as follows:
(millions) | Year ended December 31, 2017 | Year ended December 31, 2016 | |||||||||||||
After Adoption | As Reported | After Adoption | As Reported | ||||||||||||
Gross profit | $ | 656 | $ | 665 | $ | 700 | $ | 705 | |||||||
Operating profit | 353 | 367 | 396 | 394 | |||||||||||
Other net periodic postretirement benefit (costs) | 14 | — | (2 | ) | — | ||||||||||
Net income | 88 | 88 | 510 | 510 | |||||||||||
We do not expect the adoption of ASU 2017-07 to have a significant impact on our other financial statements.
In January 2017, the FASB issued ASU 2017-01, "Business Combinations (Topic 805): Clarifying the Definition of a Business," which clarifies the definition of a business in order to assist in the evaluation of whether transactions should be accounted for as acquisitions or disposals of assets or businesses. We will prospectively adopt the standard on January 1, 2018. The impact of our adoption of ASU 2017-01 will be dependent on the nature of future acquisitions or dispositions, if any.
In November 2016, the FASB issued ASU 2016-18, “Statement of Cash Flows (Topic 230): Restricted Cash,” which requires amounts generally described as restricted cash and restricted cash equivalents to be included with cash and cash equivalents when reconciling beginning-of-period and end-of-period total amounts shown on the statement of cash flows. We will adopt the standard on January 1, 2018 using the retrospective approach. The adoption will result in a $9 million reduction of our net cash provided by investing activities on our consolidated statement of cash flows for the year ended December 31, 2016.
In February 2016, the FASB issued ASU 2016-02, “Leases (Topic 842),” which supersedes existing lease guidance to require lessees to recognize assets and liabilities on the balance sheet for the rights and obligations created by long-term leases and to disclose additional quantitative and qualitative information about leasing arrangements. We will adopt the new standard on January 1, 2019 using the modified retrospective approach. As a result of the new standard, we will implement a new lease accounting system, new processes and accounting policies. Further, we anticipate the adoption of ASU 2016-02 will have a
54
significant impact to our consolidated balance sheets and disclosures. We are currently finalizing our accounting policies and analyzing our lease population and, thus, we are unable to quantify the financial statement impact at this time.
In May 2014, the FASB issued ASU 2014-09, “Revenue from Contracts with Customers (Topic 606),” which supersedes the revenue recognition requirements in “Revenue Recognition (Topic 605),” and requires entities to recognize revenue to depict the transfer of promised goods or services to customers in an amount that reflects the consideration to which the entity expects to be entitled in exchange for those goods or services. Subsequently, the FASB has issued various ASUs to provide further clarification around certain aspects of Topic 606. We will adopt, via the modified retrospective approach, the standard on January 1, 2018 using practical expedients. With our adoption of the new revenue guidance, we will modify the point in time at which we record revenue to be upon shipment for most of our customers and will record an adjustment to opening retained earnings of $2 million. The adoption will not have a significant impact to our consolidated financial statements. However, we will expand our disclosures to include disaggregation of revenue and discussion on the satisfaction of our performance obligations.
3. Acquisitions and Dispositions
Acquisition of Ceilings Plus
On November 30, 2017, we completed our acquisition of Ceilings Plus for $52 million with an expected working capital adjustment to be measured and recorded in 2018. The addition of Ceilings Plus to our U.S. Ceilings segment expands our operations in the specialty ceilings markets. The preliminary fair value of tangible assets acquired, less liabilities assumed, in connection with the Ceilings Plus acquisition was $16 million. The preliminary fair value of intangible assets acquired, which included customer relationships and trade names, totaled $20 million. The resulting preliminary goodwill recorded was $16 million and all is expected to be deductible for tax purposes. The goodwill resulting from this acquisition consists largely of the company’s expected future product sales and synergies with the existing U.S. Ceilings product offerings. No impairments were recorded in 2017. The acquisition is immaterial to our consolidated statement of income for the year end December 31, 2017.
Discontinued Operations
On October 31, 2016, we completed the sale of our L&W distribution business to ABC Supply for total cash consideration of $675 million inclusive of the final working capital adjustment and recorded a gain on the sale of $279 million.
For the year ended December 31, 2016, L&W met the criteria to be classified as held for sale and to be presented as a discontinued operation. Accordingly, we reclassified the results of operations and the cash flows of L&W to discontinued operations in our consolidated statements of income and consolidated statements of cash flows for all periods presented.
The summarized financial information related to L&W that has been excluded from continuing operations and reported as a discontinued operation is as follows:
(millions) | For the year ended December 31, | ||||||
2016(a) | 2015 | ||||||
Net sales | $ | 1,252 | $ | 1,428 | |||
Cost of products sold | 1,196 | 1,387 | |||||
Gross profit | 56 | 41 | |||||
Selling and administrative expenses (b) | 22 | 15 | |||||
Operating profit | 34 | 26 | |||||
Income tax expense | 12 | 11 | |||||
Net income from discontinued operations (c) | $ | 22 | $ | 15 | |||
Gain on sale of discontinued operations | $ | 279 | $ | — | |||
(a) | Operating results for 2016 are presented for the ten months ended October 31, 2016. |
(b) | The ten month period ended October 31, 2016 included transaction costs of $8 million. |
(c) | The year ended December 31, 2016 included $2 million of net loss from discontinued operations from our European business, which were sold in 2012. |
55
For the twelve months ended December 31, 2017, we recorded a net loss of $9 million to "(Loss) income from discontinued operations," which reflected a $8 million loss for L&W primarily due to a pension settlement and a loss of $1 million for our European operations which were sold in December 2012.
Additionally, upon the close of the sale, we entered into a supply agreement with L&W. For the year ended December 31, 2017, we recorded sales of $510 million and cash inflows related to payments on trade receivables of $489 million. For the years ended December 31, 2016 and 2015, the sales that were sold by L&W to third party customers were $568 million and $531 million, respectively. For the two months in 2016 after the sale of L&W, we recorded a cash inflow of $102 million related to payments on trade receivables.
4. Equity Method Investments
Equity method investments were as follows:
December 31, 2017 | December 31, 2016 | |||||||||||
(millions) | Carrying Value | Ownership Percentage | Carrying Value | Ownership Percentage | ||||||||
USG Boral Building Products | $ | 679 | 50% | $ | 621 | 50% | ||||||
Other equity method investments | 7 | 33% - 50% | $ | 7 | 33% - 50% | |||||||
Total equity method investments | $ | 686 | $ | 628 | ||||||||
Investments in USG Boral Building Products (UBBP)
During 2017, UBBP paid cash dividends on earnings through September 2017 of which our 50% share totaled $42 million. As of December 31, 2017, the amount of our consolidated retained earnings which represents undistributed earnings from UBBP is $60 million.
In the event certain U.S. Dollar denominated performance targets are satisfied by UBBP, we are obligated to pay Boral an earnout payment of up to $50 million based on performance through 2019. We have not recorded a liability for this earnout payment as we have concluded that it is currently not probable that the five years performance target will be achieved. In the second quarter of 2016, we reversed a liability with a corresponding reduction to our investment for an earn-out payment that was based on a three years performance target.
Translation gains and losses recorded in other comprehensive income were as follows:
(millions) | 2017 | 2016 | 2015 | ||||||||
Translation gain (loss) | $ | 40 | $ | (30 | ) | $ | (23 | ) | |||
Transactions with UBBP
Our U.S. Wallboard and Surfaces and U.S. Performance Materials segments sell products to UBBP. Total sales to UBBP for each of the years ended December 31, 2017, 2016 and 2015 were immaterial.
In 2014, in connection with the formation of UBBP, we contributed our ownership interest in a joint venture in China to UBBP but retained our loan receivable from this joint venture. As of December 31, 2017 and 2016, the loan receivable, including interest, totaled $13 million and $15 million, respectively, and is included in "Other assets" on our consolidated balance sheets.
Investment in Knauf-USG Joint Venture
In 2015, we sold our 50% interest in Knauf/USG Verwaltungs GmbH and Knauf/USG Systems GmbH & Co. KG, or collectively the Knauf-USG joint venture, to our joint venture partner, Knauf Aquapanel GmbH, a subsidiary of Gebr. Knauf Verwaltungsgesellschaft KG (Knauf) for €48 million in cash, or approximately $52 million. The Knauf-USG joint venture manufactured and distributed Aquapanel® brand cement-based panels in Europe (excluding Turkey) and all countries that were part of the former Soviet Union. Affiliates of Knauf are the beneficial owners of approximately 10% of USG's outstanding shares of common stock.
We recorded a gain of approximately $6 million, which is net of $5 million for income taxes payable on the sale. The gross gain and our equity method income in the Knauf-USG joint venture was $13 million for the year ended December 31,
56
2015 and is recorded in "Income and gain from the sale of equity method investment to related party" in our consolidated statement of income.
Summarized Financial Information
Summarized financial information for our equity method investments is as follows:
Statements of Income
For the year ended December 31, | |||||||||||
(millions) | 2017 | 2016 | 2015 | ||||||||
USG Boral Building Products: | |||||||||||
Net sales | $ | 1,200 | $ | 1,052 | $ | 1,003 | |||||
Gross profit (a) | 369 | 337 | 278 | ||||||||
Operating profit | 160 | 133 | 124 | ||||||||
Net income before taxes | 174 | 142 | 132 | ||||||||
Net income | 121 | 95 | 101 | ||||||||
Net income attributable to USG Boral Building Products | 117 | 99 | 96 | ||||||||
USG share of income from USG Boral Building Products(b) | 59 | 49 | 48 | ||||||||
Other equity method investments(c): | |||||||||||
USG share of income from other investments accounted for using the equity method | — | — | 2 | ||||||||
Total income from equity method investments | 59 | 49 | 50 | ||||||||
(a) | Year ended December 31, 2016 includes long-lived asset impairment charges of $8 million for China and of $14 million for Oman. |
(b) | Year ended December 31, 2016 includes long-lived asset impairment charges of $4 million for China and of $4 million for Oman. |
(c) | Amounts represent our share of income or loss from all equity method investments, other than UBBP. |
Balance Sheets
(millions) | December 31, 2017 | December 31, 2016 | |||||
USG Boral Building Products: | |||||||
Current assets | $ | 438 | $ | 389 | |||
Non-current assets | 981 | 903 | |||||
Current liabilities(a) | 255 | 211 | |||||
Long-term debt | 10 | 37 | |||||
Other non-current liabilities | 12 | 17 | |||||
Shareholders' equity(b) | 1,142 | 1,027 | |||||
(a) | Includes the current portion of long-term debt of $16 million and $15 million as of December 31, 2017 and 2016, respectively. |
(b) | Shareholders' equity includes $66 million and $50 million related to non-controlling interests as of December 31, 2017 and 2016, respectively. |
5. Marketable Securities
Our investments in marketable securities as of December 31, 2017 and 2016 consisted of the following:
2017 | 2016 | ||||||||||||||
(millions) | Amortized Cost | Fair Value | Amortized Cost | Fair Value | |||||||||||
Corporate debt securities | $ | 68 | $ | 68 | $ | 69 | $ | 69 | |||||||
U.S. government and agency debt securities | 6 | 6 | 14 | 14 | |||||||||||
Asset-backed debt securities | 11 | 11 | 2 | 2 | |||||||||||
Certificates of deposit | 13 | 13 | 6 | 6 | |||||||||||
Municipal debt securities | 1 | 1 | — | — | |||||||||||
Total marketable securities | $ | 99 | $ | 99 | $ | 91 | $ | 91 | |||||||
57
The realized and unrealized gains and losses as of and for the years ended December 31, 2017, 2016 and 2015 were immaterial.
Contractual maturities of marketable securities as of December 31, 2017 were as follows:
(millions) | Amortized Cost | Fair Value | |||||
Due in 1 year or less | $ | 62 | $ | 62 | |||
Due in 1-5 years | 37 | 37 | |||||
Total marketable securities | $ | 99 | $ | 99 | |||
Actual maturities may differ from the contractual maturities because issuers of the securities may have the right to prepay them.
6. Debt
Total debt as of December 31 consisted of the following:
(millions) | 2017 | 2016 | |||||
4.875% senior notes due 2027 | $ | 500 | $ | — | |||
5.5% senior notes due 2025 | 350 | 350 | |||||
7.75% senior notes due 2018 | — | 500 | |||||
Industrial revenue bonds (due 2028 through 2034) | 239 | 239 | |||||
Total | $ | 1,089 | $ | 1,089 | |||
Less: Unamortized debt issuance costs | 11 | 6 | |||||
Total | $ | 1,078 | $ | 1,083 | |||
Issuance of Senior Notes
During 2017, we issued $500 million of 4.875% senior notes due 2027, referred to as our 4.875% Notes. The net proceeds from the issuance of these notes and cash on hand were used to fund the repurchase of our 7.75% senior notes due 2018, referred to as our 7.75% Notes, and all related costs and expenses. We deferred $7 million of debt issuance costs that are being amortized to interest expense over the term of the 4.875% Notes.
In 2015, we issued $350 million of 5.5% senior notes due 2025, referred to as our 5.5% Notes. The net proceeds from the issuance of these notes and cash on hand were used to fund the repurchase of our 8.375% senior notes due 2018, referred to as our 8.375% Notes, and all related costs and expenses. We deferred approximately $6 million of debt issuance costs that are being amortized to interest expense over the term of the notes.
Repurchases and Redemptions of Senior Notes
During 2017, we repurchased $500 million of our 7.75% Notes through a cash tender offer and subsequent redemption for aggregate consideration of $536 million, including premiums of $20 million and accrued interest of $16 million. For the year ended December 31, 2017, we recorded a pre-tax loss on the early extinguishment of debt of $21 million.
During 2016, we repaid $500 million of our 6.3% senior notes due 2016, referred to as the 6.3% Notes, $250 million of our 7.875% senior notes due 2020, referred to as the 7.875% Notes, and $350 million of our 5.875% senior notes due 2021, referred to as the 5.875% Notes. The retirement of the 6.3% Notes, the 7.875% Notes and the 5.875% Notes included premiums of $30 million and accrued interest of $9 million. As a result of these transactions, we recorded a loss on the early extinguishment of debt, before tax, of $37 million including premiums, write-off of deferred financing fees, debt discount and broker fees.
During 2015, we repurchased $350 million of our 8.375% Notes, through a cash tender offer and subsequent redemption for aggregate consideration, including tender offer premium and accrued and unpaid interest, of $377 million. As a result of the repurchases, we recorded a loss on the early extinguishment of debt of $19 million including the write-off of unamortized debt issuance costs.
58
Senior Notes
Our senior notes are senior unsecured obligations, rank equally with all of our other existing and future unsecured senior indebtedness and are guaranteed by certain of our domestic subsidiaries. The indentures governing the notes contain events of default, covenants and restrictions that are customary for similar securities, including a limitation on our ability and the ability of certain of our subsidiaries to create or incur secured indebtedness.
Interest rate | 5.5% | 4.875% |
Principal net of discount (in millions) (a) | $350 | $500 |
Maturity | March 1, 2025 | June 1, 2027 |
Call date (b) | March 1, 2020 | June 1, 2022 |
Mandatory redemption offer | at 101% plus accrued and unpaid interest in the event of a change in control | at 101% plus accrued and unpaid interest in the event of a change in control |
(a) | Principal amounts exclude unamortized debt issuance costs. |
(b) | Callable at any time, in whole or in part, prior to the call date at a redemption price equal to 100% of the principal plus a premium (as outlined in the respective indentures), plus any accrued and unpaid interest on the principal amount being called. Callable after the call date at stated redemption prices (as outlined in the applicable indenture), plus any accrued and unpaid interest on the principal amount being called. |
Credit Facility
In 2017, we amended and restated our credit facility agreement to, among other things, increase the maximum borrowing limit from $180 million to $220 million. As a result, we recorded a pre-tax loss on extinguishment of debt of $1 million for the year ended December 31, 2017 and incurred $1 million of debt issuance costs. Our amended and restated agreement requires us to maintain a minimum fixed charge coverage ratio in the event excess availability falls below a minimum threshold. Because our excess borrowing availability as of December 31, 2017 of $155 million exceeds this threshold, the requirement to maintain the minimum fixed charge coverage ratio is not applicable. As of December 31, 2017, we were in compliance with the covenants contained in our credit facility.
As of December 31, 2017 and during the year then ended, there were no borrowings under the facility. Outstanding letters of credit as of December 31, 2017 totaled $29 million.
Industrial Revenue Bonds
Our $239 million of industrial revenue bonds have fixed interest rates ranging from 5.5% to 6.4%. The weighted average rate of interest on our industrial revenue bonds is 5.875%. These bonds mature during the years 2028 through 2034.
OTHER INFORMATION
(millions) | December 31, 2017 | December 31, 2016 | |||||
Fair value of debt | $ | 1,134 | $ | 1,129 | |||
Accrued interest | 12 | 31 | |||||
The fair value of our debt was determined using the fair value hierarchy of inputs described in Note 1. The fair values were determined utilizing prices from independent pricing services. The vendors’ methodologies utilize various forms of market data, including but not limited to, trade data, yield, spreads, bids and offers. We review the values provided by the independent pricing service for reasonableness by comparing the valuations received from the independent pricing service to valuations from at least one other observable source. We have not adjusted the prices obtained from the independent pricing service. As a result, the fair values are classified as Level 2. See Note 8 for further discussion on fair value measurements.
As of December 31, 2017, the amounts of total debt outstanding maturing in each of the next five years and beyond were as follows:
(millions) | 2018 through 2022 | After 2022 | ||||||
Debt maturities (principal amounts) | $ | — | $ | 1,089 | ||||
59
7. Derivative Instruments
We use derivative instruments to manage selected commodity price and foreign currency exposures as described below.
Derivative Instruments | Type | Hedged Item | Aggregate Notional Amount | Contracts Maturing Through |
Commodity | Natural gas swaps | Purchases of natural gas | 38 million mmBTUs* | December 31, 2022 |
Foreign Exchange | Forward contracts | Purchases of products and services denominated in a foreign currency | $95 million | December 31, 2018 |
* - millions of British Thermal Units
During 2015, we entered into foreign exchange forward contracts with a notional amount of $35 million to hedge a portion of our net investment in our Knauf-USG joint venture. These forward contracts were designated as net investment hedges and no ineffectiveness was recorded. On December 22, 2015, we completed the sale of our Knauf-USG joint venture and, as a result, we terminated the outstanding foreign exchange forward contracts and reclassified a $1 million net gain realized for these contracts from AOCI to earnings which increased the gain on the sale of the equity method investment. See Note 4 for further discussion on the sale.
COUNTERPARTY RISK, MASTER NETTING ARRANGEMENTS AND BALANCE SHEET OFFSETTING
We are exposed to credit losses in the event of nonperformance by the counterparties to our derivative instruments. As of December 31, 2017, our derivatives were in a $15 million net liability position. All of our counterparties have investment grade credit ratings; accordingly, we anticipate that they will be able to fully satisfy their obligations under the contracts.
All of our derivative contracts are governed by master netting agreements negotiated between us and the counterparties that reduce our counterparty credit exposure. The agreements outline the conditions (such as credit ratings and net derivative fair values) upon which we, or the counterparties, are required to post collateral. As required by certain of our agreements, we had $13 million of collateral posted with our counterparties related to our derivatives as of December 31, 2017. Amounts paid as cash collateral are included in "Receivables" on our consolidated balance sheets.
We have not adopted an accounting policy to offset fair value amounts related to derivative contracts under our master netting arrangements; therefore, individual derivative contracts are reflected on a gross basis, as either assets or liabilities, on our consolidated balance sheets, based on their fair value as of the balance sheet date.
FINANCIAL STATEMENT INFORMATION
The following are the pre-tax effects of derivative instruments on our consolidated statements of income and our consolidated statements of comprehensive income for the years ended December 31, 2017, 2016 and 2015:
Amount of Gain or (Loss) Recognized in Other Comprehensive Income (Loss) on Derivatives (Effective Portion) | Location of Gain or (Loss) Reclassified from AOCI into Income (Effective Portion) | Amount of Gain or (Loss) Reclassified from AOCI into Income (Effective Portion) | |||||||||||||||||||||||
(millions) | 2017 | 2016 | 2015 | 2017 | 2016 | 2015 | |||||||||||||||||||
Derivatives Designated as Hedging Instruments | |||||||||||||||||||||||||
Commodity contracts | $ | (19 | ) | $ | 6 | $ | (14 | ) | Cost of products sold | $ | (4 | ) | $ | (15 | ) | $ | (15 | ) | |||||||
Foreign exchange contracts | (5 | ) | (3 | ) | 12 | Cost of products sold | (2 | ) | 5 | 7 | |||||||||||||||
Foreign exchange contracts | — | — | 1 | Income and gain from the sale of equity method investment to related party | — | — | 1 | ||||||||||||||||||
Total | $ | (24 | ) | $ | 3 | $ | (1 | ) | $ | (6 | ) | $ | (10 | ) | $ | (7 | ) | ||||||||
Location of Gain or (Loss) Recognized in Income on Derivatives | Amount of Gain or (Loss) Recognized in Income on Derivatives | |||||||||||||
(millions) | 2017 | 2016 | 2015 | |||||||||||
Derivatives Not Designated as Hedging Instruments | ||||||||||||||
Commodity contracts | Cost of products sold | $ | (1 | ) | $ | 1 | $ | (3 | ) | |||||
Foreign exchange contracts | Other (income) expense, net | — | — | 2 | ||||||||||
Total | $ | (1 | ) | $ | 1 | $ | (1 | ) | ||||||
60
For both commodity contracts and foreign exchange contracts, no ineffectiveness was recorded in 2017, 2016 or 2015.
The fair values of derivative instruments on the consolidated balance sheets are as follows:
Balance Sheet Location | Fair Value | Balance Sheet Location | Fair Value | ||||||||||||||
(millions) | 12/31/17 | 12/31/16 | 12/31/17 | 12/31/16 | |||||||||||||
Derivatives Designated as Hedging Instruments | |||||||||||||||||
Commodity contracts | Other current assets | $ | 1 | $ | 8 | Accrued expenses | $ | 6 | $ | 4 | |||||||
Commodity contracts | Other assets | 1 | 3 | Other liabilities | 8 | 5 | |||||||||||
Foreign exchange contracts | Other current assets | — | 1 | Accrued expenses | 3 | 1 | |||||||||||
Total derivatives in hedging relationships | $ | 2 | $ | 12 | $ | 17 | $ | 10 | |||||||||
Derivatives Not Designated as Hedging Instruments | |||||||||||||||||
Commodity contracts | Other current assets | $ | — | $ | 1 | Accrued expenses | $ | — | $ | — | |||||||
Commodity contracts | Other assets | — | — | Other liabilities | — | — | |||||||||||
Total derivatives not designated as hedging instruments | $ | — | $ | 1 | $ | — | $ | — | |||||||||
Total derivatives | Total assets | $ | 2 | $ | 13 | Total liabilities | $ | 17 | $ | 10 | |||||||
As of December 31, 2017, we had no derivatives designated as net investment or fair value hedges.
8. | Fair Value Measurements |
Certain assets and liabilities are required to be recorded at fair value. The fair values of our cash equivalents, equity mutual funds, marketable securities and derivatives were determined using the fair value hierarchy of inputs described in Note 1.
Level | USG Valuation Method |
Level 1 | Cash equivalents and equity mutual funds consist of money market funds that are valued based on quoted prices in active markets. |
Level 2 | Marketable securities, including certain cash equivalents, are valued using a "market value" approach. Values are based on quoted prices and other observable market inputs received from data providers. |
Derivatives are valued using the "income" approach such as discounted-cash-flow models and readily observable market data. The inputs for the valuation models are obtained from data providers and include end-of-period spot and forward natural gas prices, foreign currency exchange rates, natural gas price volatility and LIBOR and swap rates for discounting the cash flows implied from the derivative contracts. | |
Level 3 | No level 3 investments. |
Our assets and liabilities measured at fair value on a recurring basis were as follows:
Quoted Prices in Active Markets for Identical Assets (Level 1) | Significant Other Observable Inputs (Level 2) | Significant Unobservable Inputs (Level 3) | Total | ||||||||||||||||||||||||||||
(millions) | 12/31/17 | 12/31/16 | 12/31/17 | 12/31/16 | 12/31/17 | 12/31/16 | 12/31/17 | 12/31/16 | |||||||||||||||||||||||
Cash equivalents | $ | 124 | $ | 38 | $ | 24 | $ | 34 | $ | — | $ | — | $ | 148 | $ | 72 | |||||||||||||||
Equity mutual funds | 6 | 5 | — | — | — | — | 6 | 5 | |||||||||||||||||||||||
Marketable securities: | |||||||||||||||||||||||||||||||
Corporate debt securities | — | — | 68 | 69 | — | — | 68 | 69 | |||||||||||||||||||||||
U.S. government and agency debt securities | — | — | 6 | 14 | — | — | 6 | 14 | |||||||||||||||||||||||
Asset-backed debt securities | — | — | 11 | 2 | — | — | 11 | 2 | |||||||||||||||||||||||
Certificates of deposit | — | — | 13 | 6 | — | — | 13 | 6 | |||||||||||||||||||||||
Municipal debt securities | — | — | 1 | — | — | — | 1 | — | |||||||||||||||||||||||
Derivative assets | — | — | 2 | 13 | — | — | 2 | 13 | |||||||||||||||||||||||
Derivative liabilities | — | — | (17 | ) | (10 | ) | — | — | (17 | ) | (10 | ) | |||||||||||||||||||
61
9. Employee Retirement Plans
We maintain defined benefit pension plans for most of our employees. Most of these plans require employee contributions in order to accrue benefits. Benefits payable under the plans are based on employees’ years of service and compensation during specified years of employment. Effective December 31, 2010, we amended the USG Corporation defined benefit pension plan to replace the final average pay formula with a cash balance formula for employees hired after that date. In November 2016, we amended the U.S. pension plan to allow retirees and all terminated vested employees to take a lump-sum at all times without restriction.
We also maintain plans that provide postretirement benefits (retiree health care and life insurance) for eligible employees. Employees hired before January 1, 2002 generally become eligible for the postretirement benefit plans when they meet minimum retirement age and service requirements. The cost of providing most postretirement benefits is shared with retirees.
Upon the sale of L&W, we retained responsibility for the benefits payable to employees of L&W for the benefits accrued while employed by USG under the USG pension and postretirement plans. All L&W employees had the option to receive a lump sum benefit payment from the USG Corporation pension plan upon termination of their employment from USG. The total of the lump sum distributions made by the USG Corporation pension plan to both L&W employees and USG retirees or terminated vested employees during both 2017 and 2016 exceeded the settlement threshold and, as a result, we incurred settlement expense of $25 million and $26 million, respectively. The benefits payable to employees of L&W who did not take lump sum distributions in connection with their termination or retirement from USG are included in our benefit obligation as of December 31, 2017.
The location of the settlement expense within our consolidated statements of income and the group of employees for which it is related is as follows:
(millions) | 2017 | 2016 | ||||||||
Cost of products sold | USG retirees or terminated vested employees | $ | 10 | $ | 7 | |||||
Selling and administrative expenses | USG retirees or terminated vested employees | 2 | 4 | |||||||
(Loss) income from discontinued operations | Terminated employees of L&W | 13 | — | |||||||
Gain on sale of discontinued operations | Terminated employees of L&W | — | 15 | |||||||
Total | $ | 25 | $ | 26 | ||||||
Additionally, as a result of the sale of L&W, we recorded a curtailment gain of $20 million for the year ended December 31, 2016 for our postretirement plan to "Gain on sale of discontinued operations" in our consolidated statement of income, for those benefits no longer accruable to the employees of L&W who were not retirement eligible or did not elect retirement upon employment termination from USG.
In 2011 and 2014, we amended our U.S. postretirement benefit plan to require retiree medical plan participants to begin purchasing individual coverage in the Affordable Insurance Exchanges or individual Medicare marketplace beginning January 1, 2016 using a company-funded subsidy. The subsidy is determined based upon years of service at retirement and Medicare eligibility. As a result of the amendments, the measurement of the accumulated postretirement benefit obligation, or APBO, was reduced and a credit to unrecognized prior service cost is being amortized into the statement of income over the average remaining service of active plan participants to retirement eligibility. This is reflected in net amortization of postretirement benefits in the table below. The subsidy provided to retirees eligible for Medicare will end December 31, 2019 at which time there will be no remaining credit to be amortized to the income statement for the unrecognized prior service cost.
62
The components of net pension and postretirement benefit costs are summarized in the following table:
(millions) | 2017 | 2016 | 2015 | ||||||||
Pension Benefits: | |||||||||||
Service cost of benefits earned | $ | 44 | $ | 45 | $ | 49 | |||||
Interest cost on projected benefit obligation | 61 | 66 | 66 | ||||||||
Expected return on plan assets | (93 | ) | (89 | ) | (83 | ) | |||||
Settlement (a) | 25 | 35 | 1 | ||||||||
Net amortization | 22 | 22 | 39 | ||||||||
Net pension cost (b) | $ | 59 | $ | 79 | $ | 72 | |||||
Postretirement Benefits: | |||||||||||
Service cost of benefits earned | $ | 2 | $ | 2 | $ | 2 | |||||
Interest cost on projected benefit obligation | 5 | 6 | 6 | ||||||||
Curtailment | — | (20 | ) | — | |||||||
Net amortization | (23 | ) | (27 | ) | (31 | ) | |||||
Net postretirement benefit (c) | $ | (16 | ) | $ | (39 | ) | $ | (23 | ) | ||
(a) | In 2016, $26 million of the settlement charge reflects the increase in lump sum benefits paid largely driven by the sale of L&W and $9 million reflected payments from our supplemental plan. |
(b) Net pension costs, excluding settlement costs, includes amounts allocated to (loss) income from discontinued operations for L&W totaling a benefit of $1 million for 2017 and expense of $7 million for 2016 and $12 million for 2015.
(c) Net postretirement benefit, excluding curtailment gain, includes a net benefit allocated to (loss) income from discontinued operations for L&W of $1 million for 2017, $3 million for 2016 and $3 million for 2015.
We use a December 31 measurement date for our plans. The accumulated benefit obligation, or ABO, for the defined benefit pension plans was $1.506 billion as of December 31, 2017 and $1.396 billion as of December 31, 2016.
As of December 31, | |||||||
(millions) | 2017 | 2016 | |||||
Selected information for pension plans with accumulated benefit obligations in excess of plan assets: | |||||||
Accumulated benefit obligation | $ | (35 | ) | $ | (39 | ) | |
Fair value of plan assets | 3 | 2 | |||||
Selected information for pension plans with benefit obligations in excess of plan assets: | |||||||
Benefit obligation | $ | (1,769 | ) | $ | (1,384 | ) | |
Fair value of plan assets | 1,576 | 1,205 | |||||
63
The following table summarizes projected benefit obligations, plan assets and funded status as of December 31:
Pension | Postretirement | ||||||||||||||
(millions) | 2017 | 2016 | 2017 | 2016 | |||||||||||
Change in Benefit Obligation: | |||||||||||||||
Benefit obligation as of January 1 | $ | 1,610 | $ | 1,564 | $ | 135 | $ | 144 | |||||||
Service cost | 44 | 45 | 2 | 2 | |||||||||||
Interest cost | 61 | 66 | 5 | 6 | |||||||||||
Settlements | (121 | ) | (123 | ) | — | — | |||||||||
Curtailments | — | (37 | ) | — | (7 | ) | |||||||||
Participant contributions | 9 | 11 | — | — | |||||||||||
Benefits paid | (51 | ) | (33 | ) | (6 | ) | (7 | ) | |||||||
Actuarial (gain) loss | 202 | 112 | 10 | (5 | ) | ||||||||||
Foreign currency translation | 16 | 5 | 4 | 2 | |||||||||||
Benefit obligation as of December 31 | $ | 1,770 | $ | 1,610 | $ | 150 | $ | 135 | |||||||
Change in Plan Assets: | |||||||||||||||
Fair value as of January 1 | $ | 1,435 | $ | 1,301 | $ | — | $ | — | |||||||
Actual return on plan assets | 217 | 107 | — | — | |||||||||||
Employer contributions | 71 | 167 | 6 | 7 | |||||||||||
Participant contributions | 9 | 11 | — | — | |||||||||||
Benefits paid | (51 | ) | (33 | ) | (6 | ) | (7 | ) | |||||||
Settlements | (121 | ) | (123 | ) | — | — | |||||||||
Foreign currency translation | 17 | 5 | — | — | |||||||||||
Fair value as of December 31 | $ | 1,577 | $ | 1,435 | $ | — | $ | — | |||||||
Funded status | $ | (193 | ) | $ | (175 | ) | $ | (150 | ) | $ | (135 | ) | |||
Components on the Consolidated Balance Sheets: | |||||||||||||||
Noncurrent assets | $ | — | $ | 4 | $ | — | $ | — | |||||||
Current liabilities | (8 | ) | (16 | ) | (9 | ) | (8 | ) | |||||||
Noncurrent liabilities | (185 | ) | (163 | ) | (141 | ) | (127 | ) | |||||||
Net liability as of December 31 | $ | (193 | ) | $ | (175 | ) | $ | (150 | ) | $ | (135 | ) | |||
Pretax Components in AOCI: | |||||||||||||||
Net actuarial loss | $ | 421 | $ | 388 | $ | 11 | $ | — | |||||||
Prior service credit | — | (1 | ) | (42 | ) | (65 | ) | ||||||||
Total as of December 31 | $ | 421 | $ | 387 | $ | (31 | ) | $ | (65 | ) | |||||
For our defined benefit pension plans, the 2017 actuarial loss of $202 million was primarily due to a decrease in the discount rates partially offset by the adoption of the new mortality tables used to determine the benefit obligation.
For the defined benefit pension plans, we estimate that during 2018 we will amortize from AOCI into net pension cost a net actuarial loss of $31 million and no prior service cost. For the postretirement benefit plans, we estimate that during 2018 we will amortize from AOCI into net postretirement cost a net actuarial loss of $1 million and a prior service credit of $23 million.
64
ASSUMPTIONS
The following tables reflect the assumptions used in the accounting for our plans:
Pension | Postretirement | ||||||||||
2017 | 2016 | 2017 | 2016 | ||||||||
Weighted average assumptions used to determine benefit obligations as of December 31: | |||||||||||
Discount rate | 3.55 | % | 4.02 | % | 3.42 | % | 3.90 | % | |||
Compensation increase rate | 3.54 | % | 3.55 | % | N/A | N/A | |||||
Weighted average assumptions used to determine net cost for years ended December 31: | |||||||||||
Discount rate | 4.02 | % | 4.43 | % | 3.90 | % | 4.24 | % | |||
Expected return on plan assets | 6.54 | % | 6.66 | % | N/A | N/A | |||||
Compensation increase rate | 3.55 | % | 3.55 | % | N/A | N/A | |||||
We no longer have significant exposure to health care cost trend rates due to the modifications we made to our U.S. postretirement health care plan to limit the increase in the annual amount we pay for retiree health care coverage for certain current and future retirees to 3% and to require retiree medical plan participants to begin purchasing individual coverage in the Affordable Insurance Exchanges or individual Medicare marketplace beginning January 1, 2016 using a company-funded subsidy based upon years of service at retirement.
For the measurement of the APBO at December 31, 2017 for our Canadian postretirement health care plan, the assumed health care cost trend rates start with a 5.95% increase in 2018, followed by a gradual decline in increases to 4% for 2046. For the measurement of the APBO at December 31, 2016, the assumed health care cost trend rates started with a 7.75% increase in 2017, followed by a gradual decline in increases to 4% for 2032 and beyond.
A one percentage point change in the assumed health care cost trend rates would have the following effects on our Canadian plans:
(millions) | One-Percentage- Point Increase | One-Percentage- Point Decrease | |||||
Effect on total service and interest cost | $ | 1 | $ | — | |||
Effect on postretirement benefit obligation | 13 | (10 | ) | ||||
RETIREMENT PLAN ASSETS
Investment Policies and Strategies: We have established investment policies and strategies for the defined benefit pension plans’ assets with a long-term objective of maintaining the plans’ assets at a level equal to or greater than that of their liabilities (as measured by a funded ratio of 100% or more of the ABO) and maximizing returns on the plans’ assets consistent with our moderate tolerance for risk. Contributions are made to the plans periodically as needed to meet funding targets or requirements. Factors influencing our determination to accept a moderate degree of risk include the timing of plan participants’ retirements and the resulting disbursement of retirement benefits, the liquidity requirements of the plans and our financial condition.
Our overall long-term objective is to achieve a 6.5% rate of return on plan assets with a moderate level of risk as indicated by the volatility of investment returns. This rate of return target was established using a “building block” approach. In this approach, ranges of long-term expected returns for the various asset classes in which the plans invest are estimated. The estimated ranges are primarily based on observations of historical asset returns and their historical volatility. In determining the expected returns, we also consider consensus forecasts of certain market and economic factors that influence returns, such as inflation, gross domestic product trends and dividend yields. We then calculate an overall range of likely expected rates of return by applying the expected asset returns to the plans’ target asset allocation. The most likely rate of return is then determined and is adjusted to account for investment management fees.
Our investment strategy is to invest in a diversified mix of asset classes in accordance with an asset allocation that we believe is likely to achieve our long-term target return while prudently considering risk. In order to manage risk, the plans’ pension and investment committees periodically rebalance the asset allocations as outlined by our investment policy statements. Our investment policy statements include glide paths which outline how our asset allocation would increase the portion of liability-hedging assets, such as fixed income, as our funded status improves in the future. This liability-driven investing approach is carried out by professional investment managers who help the committees in this process. The committees also monitor the investment performance of the individual investment managers compared to their benchmark returns and investment guidelines on an ongoing basis, in part through the use of quarterly investment portfolio reviews and compliance reporting by investment managers. The pension and investment committees also evaluate risk by periodically conducting asset/
65
liability studies to assess the correlation of the plans’ assets and liabilities and the degree of risk in the target asset allocations. The plans limit the use of leverage to select investment strategies where leverage is typically employed, such as private equity and real estate. Certain investment managers utilize derivatives, such as swaps, bond futures, and options, as part of their investment strategies. This is done primarily to gain a desired market exposure or manage factors such as interest rate risk or duration of a bond portfolio.
The following table shows the aggregate target asset allocation on a weighted average basis for all the plans and the acceptable ranges around the targets as of December 31, 2017.
Investment Policy | ||||||
Asset Categories | Asset Category Description | Target | Range | |||
Equity | Institutional commingled/pooled equity funds, equity mutual funds and direct holdings of the common stock of U.S. and non-U.S. companies; equity funds and direct holdings are invested in companies with a range of market capitalizations | 36% | 32%-40% | |||
Fixed income | U.S. Treasury securities, non-U.S. government debt securities such as Canadian federal bonds, corporate bonds of companies from diversified industries and mortgage-backed securities | 54% | 45%-63% | |||
Limited partnerships | Investments in funds that follow any of several different strategies, including investing in distressed debt, energy development, infrastructure, and hedge funds. These investments use strategies with returns normally expected to have a reduced correlation to the return of equities as compared to other asset classes and often provide a current income component that is a meaningful portion of the investment’s total return. | 5% | 1%-8% | |||
Other real assets | Primarily investments in large core, private real estate funds that directly own a diverse portfolio of properties located in the United States. It also includes an allocation to funds investing in equities of real estate and infrastructure companies | 5% | 2%-9% | |||
Cash equivalents and short-term investments | Primarily held in short-term investment funds or registered money market funds with daily liquidity | —% | 0%-5% | |||
Total | 100% | |||||
Fair Values of Plan Assets: Pension assets are classified based on the valuation methodologies and inputs used to determine the fair value as described in Note 1.
Level 1 investments include direct investments in common stocks of U.S. and non-U.S. companies that trade on liquid exchanges. These investments are valued based on the closing price on these exchanges.
Level 2 investments include primarily fixed income securities such as corporate, or government debentures, mortgage- and asset-backed securities. They are valued primarily using income and market approaches, such as pricing based on recent market transactions, and values are based on quoted prices or other observable market inputs received from data providers. Commingled funds not traded on an exchange, even though their underlying investments are common stocks traded on liquid exchanges, are also included in the Level 2 category. The net asset value of commingled funds investing in either stocks or fixed income securities is calculated by subtracting the value of any liabilities from the market value of all securities owned by a fund.
Level 3 investments include real estate, infrastructure, or direct energy investments as well as distressed securities or hedge funds. These are valued using income approach methodologies such as discounted cash flows, or market approach methodologies such as relative value (specific to equity securities), direct capitalization and comparable sales (specific to real estate investments). Some of the key inputs used to value these securities include discount rate, EBITDA multiple, yield-to-worst, yield-to-maturity, and cap rate (specific to real estate investments).
66
The fair values by hierarchy of inputs as of December 31 were as follows:
Quoted Prices in Active Markets for Identical Assets (Level 1) | Significant Other Observable Inputs (Level 2) | Significant Unobservable Inputs (Level 3) | Total | ||||||||||||||||||||||||||||
(millions) | 2017 | 2016 | 2017 | 2016 | 2017 | 2016 | 2017 | 2016 | |||||||||||||||||||||||
Asset Categories: | |||||||||||||||||||||||||||||||
Equity: | |||||||||||||||||||||||||||||||
Common and preferred stock | $ | 92 | $ | 66 | $ | — | $ | — | $ | — | $ | — | $ | 92 | $ | 66 | |||||||||||||||
Commingled/pooled/mutual funds (a) | — | — | 553 | 490 | — | — | 553 | 490 | |||||||||||||||||||||||
Total equity | 92 | 66 | 553 | 490 | — | — | 645 | 556 | |||||||||||||||||||||||
Fixed income: | |||||||||||||||||||||||||||||||
U.S. government and agency debt securities | — | — | 8 | 194 | — | — | 8 | 194 | |||||||||||||||||||||||
Non-U.S. government and agency debt securities | — | — | 68 | 54 | — | — | 68 | 54 | |||||||||||||||||||||||
Investment-grade debt securities | — | — | 334 | 197 | — | — | 334 | 197 | |||||||||||||||||||||||
High-yield debt securities | — | — | 42 | 53 | — | — | 42 | 53 | |||||||||||||||||||||||
Commingled/pooled funds (a) | — | — | 305 | 165 | — | — | 305 | 165 | |||||||||||||||||||||||
Mortgaged backed securities | — | — | 1 | 3 | — | — | 1 | 3 | |||||||||||||||||||||||
Other | — | — | 13 | 10 | 1 | 1 | 14 | 11 | |||||||||||||||||||||||
Total fixed income | — | — | 771 | 676 | 1 | 1 | 772 | 677 | |||||||||||||||||||||||
Limited partnerships | — | — | — | — | 91 | 103 | 91 | 103 | |||||||||||||||||||||||
Other real estate assets | — | — | 18 | 16 | 39 | 38 | 57 | 54 | |||||||||||||||||||||||
Cash equivalents and short-term investments | — | — | 14 | 11 | — | — | 14 | 11 | |||||||||||||||||||||||
Total | $ | 92 | $ | 66 | $ | 1,356 | $ | 1,193 | $ | 131 | $ | 142 | $ | 1,579 | $ | 1,401 | |||||||||||||||
Cash on hand | — | — | |||||||||||||||||||||||||||||
Receivables | 2 | 35 | |||||||||||||||||||||||||||||
Accounts payable | (4 | ) | (1 | ) | |||||||||||||||||||||||||||
Total | $ | 1,577 | $ | 1,435 | |||||||||||||||||||||||||||
(a) | Certain investments in commingled/pooled equity funds have been classified as Level 2 because observable quoted prices for these institutional funds are not available. |
A reconciliation of the change in the fair value measurement of the defined benefit plans’ consolidated assets using significant unobservable inputs (Level 3) between January 1, 2016 and December 31, 2017 is as follows:
(millions) | Fixed Income | Other Real Estate Assets | Limited Partnerships | Total | |||||||||||
Balance as of January 1, 2016 | $ | 1 | $ | 37 | $ | 106 | $ | 144 | |||||||
Realized losses | — | 1 | 5 | 6 | |||||||||||
Unrealized gains | — | 2 | (3 | ) | (1 | ) | |||||||||
Purchases, sales and settlements: | |||||||||||||||
Purchases | — | — | 1 | 1 | |||||||||||
Sales | — | (2 | ) | (6 | ) | (8 | ) | ||||||||
Settlements | — | — | — | — | |||||||||||
Net transfers into (out of) Level 3 | — | — | — | — | |||||||||||
Balance as of December 31, 2016 | $ | 1 | $ | 38 | $ | 103 | $ | 142 | |||||||
Realized gains | — | 1 | 15 | 16 | |||||||||||
Unrealized gains (losses) | — | 2 | (1 | ) | 1 | ||||||||||
Purchases, sales and settlements: | |||||||||||||||
Purchases | — | — | 9 | 9 | |||||||||||
Sales | — | (2 | ) | (35 | ) | (37 | ) | ||||||||
Settlements | — | — | — | — | |||||||||||
Net transfers into (out of) Level 3 | — | — | — | — | |||||||||||
Balance as of December 31, 2017 | $ | 1 | $ | 39 | $ | 91 | $ | 131 | |||||||
67
CASH FLOWS
We are evaluating our level of funding for pension plans and currently estimate that we will contribute approximately $63 million to our pension plans in 2018. Our cash payments for postretirement plans are estimated to be $9 million in 2018.
Total benefit payments we expect to make to participants, which include payments funded from USG’s assets as well as payments from our pension plans' assets, are as follows (in millions):
Years ended December 31 | Pension Benefits | Postretirement Benefits | |||||
2018 | $ | 120 | $ | 9 | |||
2019 | 125 | 9 | |||||
2020 | 137 | 8 | |||||
2021 | 134 | 8 | |||||
2022 | 141 | 8 | |||||
2023 - 2027 | 634 | 42 | |||||
DEFINED CONTRIBUTION PLANS
Total charges for our defined contribution plans amounted to approximately $8 million, $5 million and $6 million for the years ended December 31, 2017, 2016 and 2015, respectively. USG’s contributions are charged to cost of products sold and selling and administrative expenses.
10. | Share-Based Compensation |
We grant share-based compensation to eligible participants under our 2016 Long-Term Incentive Plan, or New LTIP, which was approved by our Board of Directors and stockholders in 2016, and prior thereto under our Long-Term Incentive Plan, which, together with the New LTIP, is referred to as the LTIP. As of December 31, 2017, a total of 7 million shares of common stock were reserved for future grants under the New LTIP. The New LTIP authorizes the Board’s Compensation and Organization Committee to provide equity-based compensation in the form of stock options, stock appreciation rights, or SARs, restricted stock, restricted stock units, or RSUs, market share units, or MSUs, performance shares and units, and other cash incentive and share-based awards for the purpose of providing our employees, officers and non-employee directors incentives and rewards for performance. We may issue shares of our common stock upon option exercises and upon the vesting or grant of other awards under the LTIP from our authorized but unissued shares or from treasury shares.
Our expense in continuing operations for share-based arrangements was $18 million in 2017, $18 million in 2016 and $14 million in 2015 and is included in "Selling and administrative expenses" in our consolidated statements of income. No net income tax effects were recognized for share-based arrangements in the consolidated statements of income in 2017, 2016 and 2015.
Certain employees of L&W previously received grants of MSUs, performance shares and RSUs. On October 31, 2016, any unvested awards were forfeited upon the sale of L&W and are included as forfeited in the respective tables below. The expense associated with these awards was $1 million for 2016 and 2015 and is included in "(Loss) income from discontinued operations" in our consolidated statements of income.
MARKET SHARE UNITS
We granted MSUs with the following weighted average grant date fair values:
2017 | 2016 | 2015 | |||||||||||
Weighted average grant date fair values | $ | 35.79 | $ | 19.59 | $ | 30.06 | |||||||
MSUs generally vest after a three-year period based on our actual stock price performance during such period. The number of MSUs earned will vary from 0% to 150% of the number of MSUs awarded depending on the actual performance of our stock price. In the case of termination of employment due to death, disability or retirement during the performance period, vesting will be pro-rated based on the number of full months employed in the grant year. Awards earned will be issued at the end of the three-year period. MSUs may vest earlier in the case of a change in control in most circumstances only if there is also a related loss of employment or diminution of duties. Each MSU earned will be settled in shares of our common stock.
We estimated the fair value of each MSU granted on the date of grant using a Monte Carlo simulation that used the assumptions noted in the following table. Volatility was based on stock price history immediately prior to grant for a period
68
commensurate with the expected term. The risk-free rate was based on zero-coupon U.S. government issues at the time of grant. The expected term represents the period from the valuation date to the end of the performance period.
Assumptions: | 2017 | 2016 | 2015 | |||||
Expected volatility | 32.10 | % | 34.02 | % | 42.70 | % | ||
Risk-free rate | 1.39 | % | 0.86 | % | 1.09 | % | ||
Expected term (in years) | 2.96 | 2.95 | 2.95 | |||||
Expected dividends | — | — | — | |||||
Nonvested MSUs outstanding as of December 31, 2017 and MSU activity during 2017 were as follows:
Number of MSUs (000) | Weighted Average Grant Date Fair Value | |||||
Nonvested at January 1, 2017 | 1,157 | $ | 23.39 | |||
Granted | 371 | 35.79 | ||||
Vested | (417 | ) | 30.06 | |||
Forfeited | (14 | ) | 26.20 | |||
Nonvested at December 31, 2017 | 1,097 | 25.01 | ||||
With respect to the MSUs granted in 2015, for which the three-year period ended December 31, 2017, 417,001 vested for approximately 554,624 shares of common stock based on the actual performance of our stock price.
Total unrecognized compensation cost related to nonvested share-based compensation awards represented by MSUs granted under the LTIP was $5 million as of December 31, 2017. We expect that cost to be recognized over a weighted average period of 1.7 years.
PERFORMANCE SHARES
We granted performance shares with the following weighted average grant date fair values:
2017 | 2016 | 2015 | |||||||||||
Weighted average grant date fair values | $ | 39.42 | $ | 21.10 | $ | 30.63 | |||||||
The performance shares generally vest after a three-year period based on our total stockholder return relative to the performance of the Dow Jones U.S. Construction and Materials Index, with adjustments to that index in certain circumstances, for the three-year period. The number of performance shares earned will vary from 0% to 200% of the number of performance shares awarded depending on that relative performance. Vesting will be pro-rated based on the number of full months employed during the performance period in the case of death, disability, retirement or a change in control, and pro-rated awards earned will be settled in common stock at the end of the three-year period.
We estimated the fair value of each performance share granted on the date of grant using a Monte Carlo simulation that uses the assumptions noted in the following table. Volatility was based on stock price history immediately prior to grant for a period commensurate with the expected term. The risk-free rate was based on zero-coupon U.S. government issues at the time of grant. The expected term represents the period from the grant date to the end of the three-year performance period.
Assumptions: | 2017 | 2016 | 2015 | |||||
Expected volatility | 32.10 | % | 34.02 | % | 42.70 | % | ||
Risk-free rate | 1.39 | % | 0.86 | % | 1.09 | % | ||
Expected term (in years) | 2.96 | 2.95 | 2.95 | |||||
Expected dividends | — | — | — | |||||
69
Nonvested performance shares outstanding as of December 31, 2017 and performance share activity during 2017 were as follows:
Number of Performance Shares (000) | Weighted Average Grant Date Fair Value | |||||
Nonvested at January 1, 2017 | 246 | $ | 24.98 | |||
Granted | 113 | 39.42 | ||||
Vested | (99 | ) | 30.63 | |||
Forfeited | (4 | ) | 26.75 | |||
Nonvested at December 31, 2017 | 256 | 29.14 | ||||
With respect to the performance shares granted in 2015, for which the three-year performance period ended December 31, 2017, 99,238 of the performance awards vested for no common shares.
Total unrecognized compensation cost related to nonvested share-based compensation awards represented by performance shares granted under the LTIP was $4 million as of December 31, 2017. We expect that cost to be recognized over a weighted average period of 1.8 years.
RESTRICTED STOCK UNITS
We granted RSUs with the following weighted average grant date fair values:
2017 | 2016 | 2015 | |||||||||||
Weighted average grant date fair values | $ | 31.57 | $ | 23.94 | $ | 28.56 | |||||||
RSUs granted as special retention awards, including those granted in 2017, generally vest after a specified number of years from the date of grant or at a specified date and RSUs granted with performance goals vest if those goals are attained. RSUs may vest earlier in the case of death, disability, retirement or a change in control. Each RSU is settled in a share of our common stock after the vesting period. The fair value of each RSU granted is equal to the closing market price of our common stock on the date of grant. The RSUs granted in 2017 were special retention awards that generally vest in three years from the date of grant.
RSUs outstanding as of December 31, 2017 and RSU activity during the year then ended were as follows:
Number of RSUs (000) | Weighted Average Grant Date Fair Value | |||||
Nonvested at January 1, 2017 | 228 | $ | 27.31 | |||
Granted | 133 | 31.57 | ||||
Vested | (54 | ) | 31.38 | |||
Forfeited | (3 | ) | 29.83 | |||
Nonvested at December 31, 2017 | 304 | 14.67 | ||||
As of December 31, 2017, there was $5 million of total unrecognized compensation cost related to nonvested share-based compensation awards represented by RSUs granted under the LTIP. We expect that cost to be recognized over a weighted average period of 2.2 years. The total fair value of RSUs that vested was $2 million during 2017, $2 million during 2016 and $4 million during 2015.
STOCK OPTIONS
We last granted stock options in 2012. All outstanding stock options are exercisable. The stock options generally expire ten years from the date of grant, or earlier in the event of death, disability or retirement.
70
A summary of stock options outstanding as of December 31, 2017 and of stock option activity during the year then ended is presented below:
Number of Options (000) | Weighted Average Exercise Price | Weighted Average Remaining Contractual Term (years) | Aggregate Intrinsic Value (millions) | |||||||||
Outstanding at January 1, 2017 | 2,174 | $ | 22.55 | 2.78 | $ | 22 | ||||||
Exercised | (590 | ) | 23.88 | |||||||||
Canceled | (323 | ) | 46.80 | |||||||||
Outstanding at December 31, 2017 | 1,261 | $ | 15.72 | 2.48 | $ | 28 | ||||||
Exercisable at December 31, 2017 | 1,261 | $ | 15.72 | 2.48 | $ | 28 | ||||||
Vested at December 31, 2017 | 1,261 | $ | 15.72 | 2.48 | $ | 28 | ||||||
(millions) | 2017 | 2016 | 2015 | ||||||||||
Intrinsic value of stock options exercised | $ | 7 | $ | 4 | $ | 6 | |||||||
Cash received from stock options exercised | $ | 14 | $ | 4 | $ | 6 | |||||||
Fair value of stock options vested | $ | — | $ | 1 | $ | 1 | |||||||
Intrinsic value for stock options is defined as the difference between the current market value of our common stock and the exercise price of the stock options.
NON-EMPLOYEE DIRECTOR DEFERRED STOCK UNITS
Our non-employee directors may elect to receive a portion of their compensation as deferred stock units. In August 2017, we amended this program to remove the election to receive cash or shares of USG common stock upon termination of board service and, as a result, all deferred stock units granted after August 2017 will be paid in shares of USG common stock. Also in August 2017, four of our non-employee directors elected to receive shares of stock for previously granted deferred stock units, and as a result, in 2017, we recorded a reclassification from a liability to equity of $6 million for these previously deferred awards.
11. Supplemental Balance Sheet Information
INVENTORIES
Inventories as of December 31 consisted of the following:
(millions) | 2017 | 2016 | |||||
Finished goods | $ | 140 | $ | 132 | |||
Work in progress | 39 | 37 | |||||
Raw materials | 73 | 67 | |||||
Total | $ | 252 | $ | 236 | |||
PROPERTY, PLANT AND EQUIPMENT
Property, plant and equipment as of December 31 consisted of the following:
(millions) | 2017 | 2016 | |||||
Land and mineral deposits | $ | 120 | $ | 116 | |||
Buildings and improvements | 1,100 | 1,078 | |||||
Machinery and equipment | 2,595 | 2,473 | |||||
3,815 | 3,667 | ||||||
Reserves for depreciation and depletion | (2,053 | ) | (1,960 | ) | |||
Total | $ | 1,762 | $ | 1,707 | |||
Annual depreciation and depletion expense | $ | 129 | $ | 129 | |||
71
ACCRUED EXPENSES
Accrued expenses as of December 31 consisted of the following:
(millions) | 2017 | 2016 | |||||
Self-insurance reserves | $ | 12 | $ | 12 | |||
Employee compensation | 17 | 35 | |||||
Interest | 12 | 31 | |||||
Derivatives | 9 | 5 | |||||
Pension and other postretirement benefits | 17 | 24 | |||||
Environmental | 17 | 18 | |||||
Other | 51 | 50 | |||||
Total | $ | 135 | $ | 175 | |||
ASSET RETIREMENT OBLIGATIONS
Changes in our liability for asset retirement obligations consisted of the following:
(millions) | 2017 | 2016 | |||||
Balance as of January 1 | $ | 113 | $ | 119 | |||
Accretion expense | 7 | 7 | |||||
Liabilities incurred | 3 | 2 | |||||
Changes in estimated cash flows (a) | (4 | ) | (12 | ) | |||
Liabilities settled | (3 | ) | (4 | ) | |||
Foreign currency translation | 2 | 1 | |||||
Balance as of December 31 | $ | 118 | $ | 113 | |||
(a) | Changes in estimated cash flows for the year ended December 31, 2016 includes a $8 million reduction related to one of our quarries. |
ACCUMULATED OTHER COMPREHENSIVE INCOME (LOSS)
Changes in the balances of each component of accumulated other comprehensive income (loss), or AOCI, are summarized in the following table:
(millions) | Derivatives | Pension and Other Postretirement Benefit Plans | Foreign Currency Translation | Total AOCI | |||||||||||
Balance as of January 1, 2015 | $ | 16 | $ | (302 | ) | $ | (52 | ) | $ | (338 | ) | ||||
Other comprehensive income (loss) before reclassifications, net of tax | (5 | ) | 74 | (67 | ) | 2 | |||||||||
Less: Amounts reclassified from AOCI, net of tax | (9 | ) | (7 | ) | (6 | ) | (22 | ) | |||||||
Other comprehensive income (loss), net of tax | 4 | 81 | (61 | ) | 24 | ||||||||||
Balance as of December 31, 2015 | $ | 20 | $ | (221 | ) | $ | (113 | ) | $ | (314 | ) | ||||
Other comprehensive income (loss) before reclassifications, net of tax | 1 | (34 | ) | (53 | ) | (86 | ) | ||||||||
Less: Amounts reclassified from AOCI, net of tax | (6 | ) | (9 | ) | — | (15 | ) | ||||||||
Other comprehensive income (loss), net of tax | 7 | (25 | ) | (53 | ) | (71 | ) | ||||||||
Balance as of December 31, 2016 | $ | 27 | $ | (246 | ) | $ | (166 | ) | $ | (385 | ) | ||||
Other comprehensive income (loss) before reclassifications, net of tax | (14 | ) | (65 | ) | 58 | (21 | ) | ||||||||
Less: Amounts reclassified from AOCI, net of tax | (3 | ) | (14 | ) | — | (17 | ) | ||||||||
Other comprehensive income (loss), net of tax | (11 | ) | (51 | ) | 58 | (4 | ) | ||||||||
Balance as of December 31, 2017 | $ | 16 | $ | (297 | ) | $ | (108 | ) | $ | (389 | ) | ||||
72
Amounts reclassified from AOCI, net of tax, for the years ended December 31, 2017, 2016 and 2015 were as follows:
(millions) | 2017 | 2016 | 2015 | ||||||||
Derivatives | |||||||||||
Net reclassification from AOCI for cash flow hedges included in cost of products sold | $ | (6 | ) | $ | (10 | ) | $ | (8 | ) | ||
Net reclassification from AOCI for cash flow hedges included in income and gain from the sale of equity method investment to related party | — | — | 1 | ||||||||
Less: Income tax (benefit) expense on reclassification from AOCI included in income tax expense | (3 | ) | (4 | ) | 2 | ||||||
Net amount reclassified from AOCI | $ | (3 | ) | $ | (6 | ) | $ | (9 | ) | ||
Pension and postretirement benefits | |||||||||||
Net reclassification from AOCI for amortization of prior service (benefit) cost included in cost of products sold | $ | (8 | ) | $ | (1 | ) | $ | 1 | |||
Net reclassification from AOCI for amortization of prior service benefit included in selling and administrative expenses | (5 | ) | (12 | ) | (5 | ) | |||||
Net reclassification from AOCI for amortization of prior service benefit included in (loss) income from and gain on sale of discontinued operations | (11 | ) | (3 | ) | (4 | ) | |||||
Less: Income tax expense on reclassification from AOCI included in income tax expense | (10 | ) | (7 | ) | (1 | ) | |||||
Net amount reclassified from AOCI | $ | (14 | ) | $ | (9 | ) | $ | (7 | ) | ||
Foreign Currency Translation | |||||||||||
Net reclassification from AOCI for translation loss realized upon the sale of foreign entities | $ | — | $ | — | $ | (6 | ) | ||||
Net amount reclassified from AOCI | $ | — | $ | — | $ | (6 | ) | ||||
We estimate that we will reclassify a net $6 million after-tax loss on derivatives from AOCI to earnings within the next 12 months.
12. Long-Lived Asset Impairment Charges
In 2016, we indefinitely idled our mining operations in Little Narrows, Nova Scotia, Canada after completing a review of our gypsum sourcing needs. At such time, we assessed the property, plant and equipment for potential impairment. We compared the carrying values of those assets with their future undiscounted cash flows for their remaining useful lives. We measured the fair value of the machinery, equipment and buildings using measurements classified as Level 3, as a result we recorded long-lived asset impairment charges of $10 million, which are included in our consolidated statements of income in "Long-lived asset impairment charges". We also recorded severance and other charges of $2 million for the termination of employees at the Little Narrows location, which are included in "Costs of products sold" on our consolidated statements of income. Both the impairment and severance charges are included in Other.
13. Gypsum Transportation Limited
In the second quarter of 2015, we sold our two self-unloading ocean vessels previously owned by Gypsum Transportation Limited, or GTL, for $42 million and recorded a gain of $7 million on the disposition and incurred charges of $6 million to exit our shipping operations. The net impact of the gain on the sale of the vessels and charges incurred to exit the shipping operations of $1 million is recorded in “Gain on disposal of shipping operations, net” on the consolidated statement of income.
In November 2015, we entered into a release and debt settlement agreement to recover a portion of our loss incurred when our former trading partner ceased performing under the contract. We recorded a recovery of $6 million in 2015 and it is presented within the "Recovery of receivable" on our consolidated statements of income. We received an additional $8 million for the recovery in 2016, of which $3 million is recorded within "Recovery of receivable," $1 million is recorded within "Interest income" and $4 million is recorded within "Other (expense) income, net" on our consolidated statements of income.
GTL recorded operating profit of $0 million, $3 million and $7 million in 2017, 2016 and 2015, respectively, which is reflected within Other.
73
14. Segments
During the fourth quarter of 2017, as part of the realignment of our operating structure, we changed the composition of our reportable segments, effective for the quarter ended December 31, 2017. See Note 1, Significant Accounting Policies, for additional information regarding the changes to our reportable segments. The results of our five reportable segments are as follows:
CONSOLIDATED SEGMENTS
For the year ended December 31, | |||||||||||
(millions) | 2017 | 2016 | 2015 | ||||||||
Net Sales: | |||||||||||
U.S. Wallboard and Surfaces | $ | 1,916 | $ | 1,778 | $ | 1,720 | |||||
U.S. Performance Materials | 373 | 357 | 321 | ||||||||
U.S. Ceilings | 477 | 467 | 464 | ||||||||
Canada | 405 | 389 | 372 | ||||||||
Other | 245 | 220 | 239 | ||||||||
Eliminations | (212 | ) | (194 | ) | (203 | ) | |||||
Total | $ | 3,204 | $ | 3,017 | $ | 2,913 | |||||
Operating Profit (Loss): | |||||||||||
U.S. Wallboard and Surfaces | $ | 314 | $ | 334 | $ | 298 | |||||
U.S. Performance Materials | 26 | 41 | 31 | ||||||||
U.S. Ceilings | 95 | 101 | 80 | ||||||||
Canada | 12 | 26 | 10 | ||||||||
Other | 11 | (4 | ) | 30 | |||||||
Corporate | (90 | ) | (104 | ) | (94 | ) | |||||
Eliminations | (1 | ) | — | — | |||||||
Total | $ | 367 | $ | 394 | $ | 355 | |||||
Depreciation, Depletion and Amortization: | |||||||||||
U.S. Wallboard and Surfaces | $ | 91 | $ | 87 | $ | 85 | |||||
U.S. Performance Materials | 9 | 9 | 8 | ||||||||
U.S. Ceilings | 15 | 15 | 15 | ||||||||
Canada | 6 | 6 | 6 | ||||||||
Other | 5 | 7 | 8 | ||||||||
Corporate | 6 | 10 | 9 | ||||||||
Total | $ | 132 | $ | 134 | $ | 131 | |||||
Capital Expenditures: | |||||||||||
U.S. Wallboard and Surfaces | $ | 104 | $ | 60 | $ | 73 | |||||
U.S. Performance Materials | 31 | 11 | 4 | ||||||||
U.S. Ceilings | 17 | 4 | 3 | ||||||||
Canada | 10 | 4 | 4 | ||||||||
Other | 5 | 3 | 3 | ||||||||
Corporate | 1 | 1 | — | ||||||||
Total | $ | 168 | $ | 83 | $ | 87 | |||||
74
As of December 31, | |||||||||||
Assets: | 2017 | 2016 | 2015 | ||||||||
U.S. Wallboard and Surfaces | $ | 1,574 | $ | 1,540 | $ | 1,590 | |||||
U.S. Performance Materials | 172 | 154 | 147 | ||||||||
U.S. Ceilings | 307 | 225 | 267 | ||||||||
Canada | 134 | 124 | 126 | ||||||||
Other | 144 | 135 | 160 | ||||||||
Corporate | 856 | 1,080 | 1,483 | ||||||||
Equity method investments | 686 | 628 | 682 | ||||||||
Assets related to discontinued operations | — | — | 357 | ||||||||
Eliminations | (22 | ) | (17 | ) | (76 | ) | |||||
Total | $ | 3,851 | $ | 3,869 | $ | 4,736 | |||||
CONSOLIDATED PRODUCT SALES INFORMATION
For the year ended December 31, | |||||||||||
(millions) | 2017 | 2016 | 2015 | ||||||||
Net Sales: | |||||||||||
Gypsum | $ | 2,331 | $ | 2,169 | $ | 2,105 | |||||
Performance Materials | 373 | 357 | 321 | ||||||||
Ceilings | 509 | 500 | 496 | ||||||||
Elimination | (9 | ) | (9 | ) | (9 | ) | |||||
Total | $ | 3,204 | $ | 3,017 | $ | 2,913 | |||||
CONSOLIDATED GEOGRAPHIC INFORMATION
For the year ended December 31, | |||||||||||
(millions) | 2017 | 2016 | 2015 | ||||||||
Net Sales: | |||||||||||
United States | $ | 2,787 | $ | 2,625 | $ | 2,524 | |||||
Canada | 406 | 389 | 379 | ||||||||
Other Foreign | 204 | 189 | 196 | ||||||||
Geographic transfers | (193 | ) | (186 | ) | (186 | ) | |||||
Total | $ | 3,204 | $ | 3,017 | $ | 2,913 | |||||
Consolidated long-lived assets, consisting of property, plant and equipment, net, by geographic location were as follows: | |||||||||||
As of December 31, | |||||||||||
(millions) | 2017 | 2016 | 2015 | ||||||||
Long-Lived Assets: | |||||||||||
United States | $ | 1,604 | $ | 1,563 | $ | 1,605 | |||||
Canada | 90 | 80 | 90 | ||||||||
Other Foreign | 68 | 64 | 76 | ||||||||
Total | $ | 1,762 | $ | 1,707 | $ | 1,771 | |||||
75
UBBP | For the year ended December 31, | ||||||||||
(millions) | 2017 | 2016 | 2015 | ||||||||
Net sales | $ | 1,200 | $ | 1,052 | $ | 1,003 | |||||
Operating profit | 160 | 133 | 124 | ||||||||
Net income attributable to UBBP | 117 | 99 | 96 | ||||||||
Depreciation, depletion, and amortization | 45 | 43 | 43 | ||||||||
Capital expenditures | 49 | 45 | 49 | ||||||||
As of December 31, | |||||||||||
2017 | 2016 | 2015 | |||||||||
Assets | $ | 1,419 | $ | 1,292 | $ | 1,303 | |||||
UBBP GEOGRAPHIC INFORMATION | For the year ended December 31, | ||||||||||
(millions) | 2017 | 2016 | 2015 | ||||||||
Net Sales: | |||||||||||
Australia | $ | 431 | $ | 381 | $ | 345 | |||||
South Korea | 287 | 223 | 200 | ||||||||
Thailand | 150 | 141 | 145 | ||||||||
China | 119 | 103 | 120 | ||||||||
Other | 271 | 255 | 234 | ||||||||
Geographic Transfers | (58 | ) | (51 | ) | (41 | ) | |||||
Total | $ | 1,200 | $ | 1,052 | $ | 1,003 | |||||
Long-lived assets, consisting of property, plant and equipment, net, by geographic location for UBBP were as follows: | |||||||||||
As of December 31, | |||||||||||
(millions) | 2017 | 2016 | 2015 | ||||||||
Long-Lived Assets: | |||||||||||
Australia | $ | 229 | $ | 217 | $ | 216 | |||||
South Korea | 123 | 107 | 106 | ||||||||
China | 101 | 97 | 116 | ||||||||
Oman | 85 | 86 | 103 | ||||||||
Thailand | 86 | 75 | 72 | ||||||||
Other | 86 | 71 | 67 | ||||||||
Total | $ | 710 | $ | 653 | $ | 680 | |||||
OTHER SEGMENT INFORMATION
Segment operating profit (loss) includes all costs and expenses directly related to the segment involved and an allocation of expenses that benefit more than one segment.
Revenues are attributed to geographic areas based on the location of the assets producing the revenues. Transactions between reportable segments and geographic areas are accounted for at transfer prices that are approximately equal to market value. Geographic transfers largely reflect intercompany sales from our domestic segments of U.S. Wallboard and Surfaces, U.S. Performance Materials and U.S. Ceilings to Canada and Mexico.
Sales to our significant customers were as follows:
Significant Customer | Segment with Sales to Significant Customer | 2017 | 2016 | 2015 | |||||||
The Home Depot | U.S. Wallboard and Surfaces, U.S. Performance Materials, U.S. Ceilings, and Canada | 23 | % | 23 | % | 23 | % | ||||
L&W | U.S. Wallboard and Surfaces, U.S. Performance Materials and U.S. Ceilings | 16 | % | 19 | % | 18 | % | ||||
76
15. Income Taxes
On December 22, 2017, the President of the United States signed into law the Tax Cuts and Jobs Act, or the 2017 Tax Act. The 2017 Tax Act amends the Internal Revenue Code to reduce tax rates and modify policies, credits and deductions. For businesses, the 2017 Tax Act reduces the corporate federal tax rate from a maximum of 35% to a flat 21%. The provisional effect on deferred tax assets and liabilities of the change in tax rates was recognized in earnings in the period ended December 31, 2017, which was when the change was enacted. As part of the 2017 Tax Act's change to a quasi-territorial system, a transition tax was imposed on our accumulated foreign earnings, partially offset by foreign tax credits, which was also recognized in the period ending December 31, 2017. The 2017 Tax Act made significant changes to how foreign tax credits may be realized to offset future tax liabilities. Further clarity may change our anticipated realization of our foreign tax credits. In addition, we may make an election to forgo the use of net operating losses, or NOLs, to offset the impact of the transition tax as allowed under the 2017 Tax Act.
Due to the timing of the enactment and the complexity involved in applying the provisions of the 2017 Tax Act, we have made reasonable estimates of the effects and recorded provisional amounts in our financial statements as of December 31, 2017. As we collect and prepare necessary data, and interpret the 2017 Tax Act and any additional guidance issued by the U.S. Treasury Department, the IRS, and other standard-setting bodies, we may make adjustments to the provisional amounts.
The 2017 Tax Act also repealed the corporate alternative minimum tax, or AMT, for tax years beginning January 1, 2018, and provides that existing AMT credit carryovers are refundable beginning in 2018. We have approximately $32 million of AMT credit carryovers, net of our estimate of anticipated sequestration reduction, that are expected to be refunded by 2022. As of December 31, 2017, we recorded a $12 million receivable, which is included in "Income taxes receivable" on our consolidated balance sheet.
Income from continuing operations before income taxes consisted of the following:
(millions) | 2017 | 2016 | 2015 | ||||||||
U.S. | $ | 272 | $ | 201 | $ | 152 | |||||
Foreign | 63 | 73 | 84 | ||||||||
Total | $ | 335 | $ | 274 | $ | 236 | |||||
Income tax expense (benefit) on continuing operations consisted of the following:
(millions) | 2017 | 2016 | 2015 | ||||||||
Current: | |||||||||||
Federal | $ | (21 | ) | $ | — | $ | — | ||||
Foreign | 2 | 5 | 12 | ||||||||
State | 2 | 1 | 1 | ||||||||
Total current | $ | (17 | ) | $ | 6 | $ | 13 | ||||
Deferred: | |||||||||||
Federal | $ | 243 | $ | 41 | $ | (631 | ) | ||||
Foreign | — | 2 | (4 | ) | |||||||
State | 12 | 14 | (118 | ) | |||||||
Total deferred | $ | 255 | $ | 57 | $ | (753 | ) | ||||
Total | $ | 238 | $ | 63 | $ | (740 | ) | ||||
77
For our continuing operations, differences between actual provisions for income taxes and provisions for income taxes at the U.S. federal statutory rate (35%), prior to changes under the 2017 Tax Act, were as follows:
(millions) | 2017 | 2016 | 2015 | ||||||||
Taxes on income from continuing operations at U.S. federal statutory rate | $ | 117 | $ | 96 | $ | 82 | |||||
Foreign earnings subject to different tax rates (a) | 3 | (3 | ) | (3 | ) | ||||||
State income tax, net of federal benefit | 9 | 10 | 8 | ||||||||
Change in valuation allowance | — | — | (827 | ) | |||||||
Income from equity method investments (b) | (21 | ) | (17 | ) | (16 | ) | |||||
Law changes (c) | 145 | — | — | ||||||||
Prior year return adjustments | (7 | ) | — | — | |||||||
Benefits from unrecognized tax positions | — | — | (6 | ) | |||||||
Foreign tax credits | — | (21 | ) | — | |||||||
Tax expense on distribution of foreign earnings | — | — | 20 | ||||||||
Other, net | (8 | ) | (2 | ) | 2 | ||||||
Provision for income tax expense (benefit) | $ | 238 | $ | 63 | $ | (740 | ) | ||||
Effective income tax rate | 71.0 | % | 22.9 | % | (313.6 | )% | |||||
(a) | Foreign earnings subject to different tax rates includes amounts related to impairments and other charges associated with our former shipping operations. |
(b) | Included in income from equity method investments are taxes associated with that income in the respective jurisdictions. These taxes, which are predominately foreign statutory rates, are at rates that are lower than the U.S. federal statutory rate. |
(c) | The impact of the 2017 Tax Act included the transition tax on deferred foreign earnings, net of foreign tax credits, of $9 million, an increase in the valuation allowance related to foreign tax credits of $106 million, an increase in the valuation allowance of our state NOLs due to the change in federal benefit related to those assets of $18 million, anticipated sequestration of our AMT credits of $3 million and the impact of the corporate rate change on deferred tax assets and liabilities of $9 million. |
Significant components of deferred tax assets and liabilities were as follows:
As of December 31, | |||||||
(millions) | 2017 | 2016 | |||||
Deferred Tax Assets: | |||||||
Net operating loss and tax credit carryforwards | $ | 477 | $ | 599 | |||
Pension and postretirement benefits | 86 | 112 | |||||
Reserves not deductible until paid | 14 | 20 | |||||
Self insurance | 2 | 2 | |||||
Capitalized interest | 7 | 13 | |||||
Inventories | 4 | 6 | |||||
Share-based compensation | 14 | 28 | |||||
Other | 7 | 4 | |||||
Deferred tax assets before valuation allowance | 611 | 784 | |||||
Valuation allowance | (175 | ) | (51 | ) | |||
Total deferred tax assets | $ | 436 | $ | 733 | |||
Deferred Tax Liabilities: | |||||||
Property, plant and equipment | 153 | 245 | |||||
Other | — | — | |||||
Total deferred tax liabilities | $ | 153 | $ | 245 | |||
Net deferred tax assets | $ | 283 | $ | 488 | |||
During 2017, we recorded an increase in the valuation allowance against our deferred tax assets of $124 million. The increase was primarily related to law changes under the 2017 Tax Act, including the federal rate change, from 35% to 21%, and the ability to realize foreign tax credits.
As of December 31, 2017, we had net deferred tax assets of $283 million, which included a valuation allowance of $175 million. The components of the valuation allowance relate to certain state NOL carryforwards and foreign tax credit carryforwards that we anticipate will not be used prior to their expiration. Our ability to realize our deferred tax assets, including our foreign tax credit carryforwards, is subject to further clarification of the 2017 Tax Act. As a result, the actual
78
impact on the realizability of our net deferred tax assets may vary from the estimated amount due to uncertainties in our preliminary assessment and estimate.
As of December 31, 2017, we had federal NOL carryforwards of approximately $477 million that are available to offset future federal taxable income and will expire in the years 2030 through 2032. In addition, as of that date, we had federal AMT credit carryforwards of approximately $20 million that are available to reduce future regular federal income taxes with the full benefit being realized by 2022 as described in the 2017 Tax Act. We have foreign tax credit carryforwards of $223 million that are available to offset future federal taxable income and expire in the years 2022 through 2027. The foreign tax credits are attributable to tax planning strategies to optimize foreign tax credit utilization and management’s intention to amend its tax returns for the tax years 2012-2013 in order to claim credits for previously deducted foreign tax. In 2017, additional foreign tax credits were attributed to the transition tax as enacted by the 2017 Tax Act. The calculation of the foreign tax credit carryforwards and our ability to use them in the future is based on currently available information and is subject to revaluation as further clarification on the new law is available. In order to fully realize the U.S. federal net deferred tax assets, taxable income of approximately $1.663 billion would need to be generated during the period before their expiration based on our current interpretation of the 2017 Tax Act.
As of December 31, 2017, we had a deferred tax asset of $169 million related to state NOLs and tax credit carryforwards. The NOLs will expire if unused in years 2018 through 2036. To the extent that we do not generate sufficient state taxable income within the statutory carryforward periods to utilize the NOL and tax credit carryforwards in these states, they will expire unused.
In 2016, we recorded a decrease in the valuation allowance against our deferred tax assets of $19 million which was related to the expiration of state Net Operating Loss (NOL) carryforwards.
In 2015, we reversed $731 million of our valuation allowance. We considered all positive and negative evidence and gave more weight to evidence that was objective in nature as compared to subjective evidence. Significant weight was given to evidence that directly relates to our current financial performance. As of December 31, 2015, we emerged from a four-year cumulative pre-tax loss and had five consecutive quarters of domestic pre-tax earnings. The recent domestic pre-tax operating earnings was a significant, principal piece of positive evidence, which was weighed with the underlying momentum in the business, and generally improved market and economic conditions. Other evidence included strategic actions taken by management to lower costs and our expected utilization of deferred tax assets. All of this positive evidence lead to the determination that December 31, 2015 was the appropriate time to reverse a significant portion of the valuation allowance.
The Internal Revenue Code imposes limitations on a corporation’s ability to utilize NOLs if it experiences an “ownership change,” which can result from transactions increasing the ownership of certain stockholders in the stock of a corporation by more than 50 percentage points over a three-year period. If we were to experience an ownership change, utilization of our NOLs would be subject to an annual limitation that may be carried over to later years within the allowed NOL carryforward period. Over the entire carryforward period, we may not be able to use all our NOLs due to the aforementioned annual limitation. If an ownership change had occurred as of December 31, 2017, our annual U.S. federal NOL utilization would have been limited to approximately $107 million per year.
A reconciliation of the beginning and ending amount of unrecognized tax benefits is as follows:
(millions) | 2017 | 2016 | 2015 | ||||||||
Balance as of January 1 | $ | 15 | $ | 18 | $ | 22 | |||||
Tax positions related to the current period: | |||||||||||
Gross increase | — | — | 4 | ||||||||
Gross decrease | — | — | — | ||||||||
Tax positions related to prior periods: | |||||||||||
Gross increase | — | — | — | ||||||||
Gross decrease | (1 | ) | (3 | ) | (1 | ) | |||||
Settlements | — | — | (6 | ) | |||||||
Lapse of statutes of limitations | (2 | ) | — | (1 | ) | ||||||
Balance as of December 31 | $ | 12 | $ | 15 | $ | 18 | |||||
We classify interest expense and penalties related to unrecognized tax benefits and interest income on tax overpayments as components of income taxes (benefit). We do not have amounts related to interest expense and penalties recognized on our consolidated balance sheets as of December 31, 2017 and had $2 million as of December 31, 2016. We recorded no interest and penalties in our consolidated statements of income in each of the three years ended December 31, 2017, 2016 and 2015. The
79
total amounts of unrecognized tax benefit that, if recognized, would affect our effective tax rate were $12 million, $14 million and $17 million for 2017, 2016 and 2015, respectively.
Our federal income tax return for 2014 is currently under examination by the Internal Revenue Service, or IRS. Our federal income tax returns for 2008 and prior years have been examined by the IRS. The U.S. federal statute of limitations remains open for 2006-2012 and 2014 to the present. We are under examination in various U.S. state and foreign jurisdictions. We do not believe our gross unrecognized tax benefits will change as a result of the conclusion of these examinations. There are statutes, however, that are expiring within the next 12 months that could result in recognition of approximately $2 million of tax benefit. Foreign and U.S. state jurisdictions have statutes of limitations generally ranging from three to five years.
We do not provide for U.S. income taxes on the portion of undistributed earnings of foreign subsidiaries that is intended to be permanently reinvested. It is not practical to calculate the residual income tax which would result if basis differences reversed due to the complexities of the tax law impacted by the 2017 Tax Act and the hypothetical nature of the calculations. Our reevaluation of our permanently reinvested assertion is subject to further clarification of the 2017 Tax Act, the impact of which cannot be estimated at this time.
16. Stockholder Rights Plan
NOL Protective Provisions of our Rights Plan
We have a stockholder rights plan that is intended to protect our substantial NOL carryforwards and related tax benefits. See Note 15 for a description of our NOL carryforwards. Under federal tax laws, we generally can use our NOLs and certain related tax credits to reduce ordinary income tax paid in our prior two tax years or on our future taxable income for up to 20 years, when they “expire” for such purposes.
Our ability to use our NOLs could be substantially limited if we experience an “ownership change,” as defined under Section 382 of the Internal Revenue Code of 1986, as amended (the "Code"), and the rights plan has been designed to help prevent such an “ownership change.” Under Section 382 of the Code, an “ownership change” occurs if, over a rolling three-year period, there has been an aggregate increase of 50 percentage points or more in the percentage of our common stock owned by one or more of our “5-percent stockholders” (as determined under Section 382 of the Code).
The rights plan provides that if any person becomes the beneficial owner (as defined in the Code) of 4.9% or more of our common stock, stockholders other than the triggering stockholder will have the right to purchase additional shares of our common stock at half the market price, thereby diluting the triggering stockholder; provided that stockholders whose beneficial ownership, as defined in Section 382 of the Code, exceeded 4.9% of our common stock outstanding on February 11, 2015 will not be deemed to have triggered the rights plan, so long as they do not thereafter acquire beneficial ownership of additional common stock other than in certain specified exempt transactions.
The rights will expire at the close of business on May 31, 2019, unless earlier redeemed or exchanged. Our Board of Directors has the power to accelerate or extend the expiration date of the rights. The NOL protective provisions of the rights plan described above will be effective until the earliest of the close of business on (i) May 31, 2019, (ii) the date on which our Board of Directors determines that these provisions are no longer necessary for the protection of certain tax benefits because of the repeal of Section 382 of the Code, (iii) the first day of a taxable year as to which our Board of Directors determines that no tax benefits may be carried forward, or (iv) such other date as our Board of Directors determines that these provisions are no longer necessary for the preservation of tax benefits (the "Special Period"). After the end of the Special Period, the triggering threshold for the rights issued pursuant to the rights plan will revert to 15% of our outstanding common stock and the definition of “beneficial owner” will revert to definitions that do not track Section 382 of the Code. At our 2016 annual meeting our stockholders ratified, on an advisory basis, the extension of the term of the rights plan and the NOL protective provisions described above.
A board committee composed solely of independent directors reviews the rights plan at least once every three years to determine whether to modify the rights plan in light of all relevant factors. This review was most recently conducted in November 2015. The next review is required by the end of 2018.
Restated Certificate of Incorporation
Our Restated Certificate of Incorporation also restricts certain transfers of our common stock and includes provisions intended to further protect the tax benefits of our NOL carryforwards. Subject to certain limited exceptions, these transfer restrictions restrict any person from transferring our common stock (or any interest in our common stock) if the transfer would result in a stockholder (or several stockholders, in the aggregate, who hold their stock as a “group” under Section 382 of the Code) owning 4.9% or more of our common stock. Any direct or indirect transfer attempted in violation of these transfer restrictions
80
would be void as of the date of the prohibited transfer as to the purported transferee, and the purported transferee would not be recognized as the owner of the shares attempted to be owned in violation of the transfer restrictions for any purpose, including for purposes of voting and receiving dividends or other distributions in respect of that common stock, or in the case of options, receiving our common stock in respect of their exercise. These restrictions are effective until the earliest of (i) the close of business on May 31, 2019, (ii) the repeal of Section 382 of the Code if our Board of Directors determines that the restrictions are no longer necessary or desirable for the preservation of tax benefits, (iii) the close of business on the first day of a taxable year as to which our Board of Directors determines that no tax benefits may be carried forward, or (iv) such other date as determined by our Board of Directors pursuant to the provisions described above.
Treatment of Berkshire Hathaway under Rights Plan and Restated Certificate of Incorporation
Pursuant to a Shareholder’s Agreement reached in 2006, Berkshire Hathaway and certain of its affiliates may acquire beneficial ownership of up to 50% of our voting stock on a fully-diluted basis without triggering the ownership thresholds in our Restated Certificate of Incorporation or the rights plan, and may acquire beneficial ownership of more than 50% of our voting stock on a fully-diluted basis without triggering the ownership thresholds in our Restated Certificate of Incorporation or the rights plan through an offer to purchase all of our common stock that remains open for at least 60 days, in each case subject to specified exceptions.
17. Lease Commitments
We lease some of our offices, buildings, machinery and equipment, and autos under noncancelable operating leases. These leases have various escalation terms and renewal options. Lease expense amounted to $38 million in 2017, $37 million in 2016 and $36 million in 2015. Future minimum lease payments required under operating leases with initial or remaining noncancelable terms in excess of one year as of December 31, 2017 were as follows:
(millions) | 2018 | 2019 | 2020 | 2021 | 2022 | After 2022 | |||||||||||||||||
Future minimum lease payments | $ | 36 | $ | 31 | $ | 25 | $ | 19 | $ | 10 | $ | 9 | |||||||||||
18. Litigation
WALLBOARD PRICING CLASS ACTION LAWSUITS
In 2015, USG, our subsidiary United States Gypsum Company, our former subsidiary L&W Supply Corporation, and seven other wallboard manufacturers were named as defendants in a lawsuit filed in federal court in California by twelve homebuilders alleging that since at least September 2011, U.S. wallboard manufacturers conspired to fix and raise the price of gypsum wallboard sold in the United States and to effectuate the alleged conspiracy by ending the practice of providing job quotes on wallboard. The lawsuit was transferred to the United States District Court for the Eastern District of Pennsylvania under the title In re: Domestic Drywall Antitrust Litigation, MDL No. 2437. In the second quarter of 2016, the Court dismissed with prejudice the portions of the homebuilders’ complaint alleging a conspiracy in 2014 and 2015, ruling that there were insufficient factual allegations to allow such a claim to go forward. The homebuilders' claims alleging a conspiracy prior to 2014 have not been dismissed, and the case proceeds as to those claims. USG has agreed to defend and indemnify L&W Supply Corporation with regard to this matter.
Beginning in the third quarter of 2013, class action lawsuits making similar allegations with regard to Canada were filed in Quebec, Ontario and British Columbia courts on behalf of purchasers of wallboard in Canada and naming USG, United States Gypsum Company, CGC Inc., and other wallboard manufacturers as defendants.
We believe that the cost, if any, of resolving the homebuilders’ lawsuit and Canadian class action litigation will not have a material effect on our results of operations, financial position or cash flows.
ENVIRONMENTAL LITIGATION
We are involved in environmental cleanups of property that we own or have owned. In addition, we have been notified by state and federal environmental protection agencies of possible involvement as one of numerous “potentially responsible parties” in certain Superfund sites in the United States to pay for some part of the cleanup of hazardous waste. In most of these sites, our involvement is expected to be minimal. As of December 31, 2017 and December 31, 2016, we had an accrual of $17 million and $18 million, respectively, for our probable and reasonably estimable liability in connection with these matters. Our accruals take into account all known or estimated undiscounted costs associated with these sites, including site investigations and feasibility costs, site cleanup and remediation, certain legal costs, and fines and penalties, if any. However, we continue to review these accruals as additional information becomes available and revise them as appropriate. Based on the information
81
known to us, we believe these environmental matters will not have a material effect on our results of operations, financial position or cash flows.
OTHER LITIGATION
We are named as defendants in other claims and lawsuits arising from our operations, including lawsuits or claims arising from commercial disputes, product performance, product liabilities and worksite or vehicular accidents. We believe that we have properly accrued for our probable liability in connection with these claims and suits, taking into account the probability of liability, whether our exposure can be reasonably estimated and, if so, our estimate of our liability or the range of our liability. We do not expect these or any other litigation matters involving USG to have a material effect on our results of operations, financial position or cash flows.
19. Quarterly Financial Data (unaudited)
Quarter | |||||||||||||||
(millions, except per-share data) | First | Second | Third | Fourth | |||||||||||
2017 | |||||||||||||||
Net sales | $ | 767 | $ | 811 | $ | 795 | $ | 831 | |||||||
Gross profit | 164 | 168 | 163 | 170 | |||||||||||
Operating profit | 91 | 96 | 93 | 87 | |||||||||||
Income (loss) from continuing operations (b) | 55 | 46 | 66 | (70 | ) | ||||||||||
(Loss) income from discontinued operations, net of tax | — | (10 | ) | — | 1 | ||||||||||
Net income (loss) (b) | 55 | 36 | 66 | (69 | ) | ||||||||||
Income per average common share: | |||||||||||||||
Basic (a) | $ | 0.38 | $ | 0.25 | $ | 0.47 | $ | (0.49 | ) | ||||||
Diluted (a) | 0.37 | 0.24 | 0.46 | (0.49 | ) | ||||||||||
2016 | |||||||||||||||
Net sales | $ | 747 | $ | 769 | $ | 767 | $ | 734 | |||||||
Gross profit | 181 | 193 | 181 | 150 | |||||||||||
Operating profit | 116 | 122 | 97 | 59 | |||||||||||
Income from continuing operations (c) | 60 | 67 | 56 | 28 | |||||||||||
Gain on sale of discontinued operations, net of tax | — | — | — | 279 | |||||||||||
Income from discontinued operations, net of tax | 7 | 7 | 6 | — | |||||||||||
Net income (c) | 67 | 74 | 62 | 307 | |||||||||||
Income per average common share: | |||||||||||||||
Basic (a) | $ | 0.46 | $ | 0.50 | $ | 0.43 | $ | 2.10 | |||||||
Diluted (a) | 0.46 | 0.50 | 0.42 | 2.07 | |||||||||||
(a) | The sum of the four quarters is not necessarily the same as the total for the year. |
(b) | Income from continuing operations and net income included a loss on extinguishment of debt of $22 million for the second quarter of 2017 and income tax expense of $145 million related to the 2017 Tax Act for the fourth quarter of 2017. See Notes 6 and 15, respectively. |
(c) | Income from continuing operations and net income included a loss on extinguishment of debt of $32 million for the fourth quarter of 2016. See Note 6. |
20. Subsequent Event
On February 1, 2018, we announced that our Board of Directors approved a $250 million increase to our stock repurchase program, bringing the total authorization to $500 million. Under the program, we may repurchase shares from time to time in open market transactions or in privately-negotiated transactions in accordance with applicable securities laws. We may discontinue the program at any time. The timing and the amount of any repurchases will be determined based on market conditions and other factors. We expect that stock repurchases will be funded with available cash on hand. During 2017, we repurchased $184 million of our common stock, leaving $316 million of authorization remaining.
82
REPORT OF INDEPENDENT REGISTERED PUBLIC ACCOUNTING FIRM
To the Board of Directors and Stockholders of USG Corporation:
Opinion on the Financial Statements
We have audited the accompanying consolidated balance sheets of USG Corporation and subsidiaries (the "Corporation") as of December 31, 2017 and 2016, the related consolidated statements of income, comprehensive income, stockholders' equity, and cash flows, for each of the three years in the period ended December 31, 2017, and the related notes and the schedule listed in the Index at Item 8 (collectively referred to as the "financial statements"). In our opinion, the financial statements present fairly, in all material respects, the financial position of the Corporation as of December 31, 2017 and 2016, and the results of its operations and its cash flows for each of the three years in the period ended December 31, 2017, in conformity with accounting principles generally accepted in the United States of America.
We have also audited, in accordance with the standards of the Public Company Accounting Oversight Board (United States) (PCAOB), the Corporation's internal control over financial reporting as of December 31, 2017, based on criteria established in Internal Control - Integrated Framework (2013) issued by the Committee of Sponsoring Organizations of the Treadway Commission and our report dated February 14, 2018, expressed an unqualified opinion on the Corporation's internal control over financial reporting.
Basis for Opinion
These financial statements are the responsibility of the Corporation's management. Our responsibility is to express an opinion on the Corporation's financial statements based on our audits. We are a public accounting firm registered with the PCAOB and are required to be independent with respect to the Corporation in accordance with the U.S. federal securities laws and the applicable rules and regulations of the Securities and Exchange Commission and the PCAOB.
We conducted our audits in accordance with the standards of the PCAOB. Those standards require that we plan and perform the audit to obtain reasonable assurance about whether the financial statements are free of material misstatement, whether due to error or fraud. Our audits included performing procedures to assess the risks of material misstatement of the financial statements, whether due to error or fraud, and performing procedures that respond to those risks. Such procedures included examining, on a test basis, evidence regarding the amounts and disclosures in the financial statements. Our audits also included evaluating the accounting principles used and significant estimates made by management, as well as evaluating the overall presentation of the financial statements. We believe that our audits provide a reasonable basis for our opinion.
/s/ DELOITTE & TOUCHE LLP
Chicago, Illinois
February 14, 2018
We have served as the Corporation's auditor since 2002.
83
USG CORPORATION
SCHEDULE II - VALUATION AND QUALIFYING ACCOUNTS
Additions | |||||||||||||||||||
(millions) | Balance at beginning of period | Charged to costs and expenses | Charged to other accounts | Deductions (a) | Balance at end of period | ||||||||||||||
Year ended December 31, 2017: | |||||||||||||||||||
Doubtful accounts | $ | 5 | $ | 2 | $ | — | $ | (1 | ) | $ | 6 | ||||||||
Cash discounts | 3 | 34 | — | (34 | ) | 3 | |||||||||||||
Income tax valuation allowance | 51 | 124 | — | — | 175 | ||||||||||||||
Year ended December 31, 2016: | |||||||||||||||||||
Doubtful accounts | 7 | 1 | — | (3 | ) | 5 | |||||||||||||
Cash discounts | 2 | 34 | — | (33 | ) | 3 | |||||||||||||
Income tax valuation allowance | 70 | — | — | (19 | ) | 51 | |||||||||||||
Year ended December 31, 2015: | |||||||||||||||||||
Doubtful accounts | 14 | (6 | ) | — | (1 | ) | 7 | ||||||||||||
Cash discounts | 1 | 37 | — | (36 | ) | 2 | |||||||||||||
Income tax valuation allowance | 1,023 | — | — | (953 | ) | 70 | |||||||||||||
(a) | Reflects receivables written off as related to doubtful accounts, discounts allowed as related to cash discounts and reductions in the income tax valuation allowance. |
84
Item 9. | CHANGES IN AND DISAGREEMENTS WITH ACCOUNTANTS ON ACCOUNTING AND FINANCIAL DISCLOSURE |
None
Item 9A. | CONTROLS AND PROCEDURES |
Evaluation of Disclosure Controls and Procedures
Our Chief Executive Officer and Chief Financial Officer, after evaluating the effectiveness of our “disclosure controls and procedures” (as defined in Rule 13a-15(e) promulgated under the Securities Exchange Act of 1934, or the Exchange Act), have concluded that, as of the end of the fiscal year covered by this report, our disclosure controls and procedures were effective to provide reasonable assurance that information required to be disclosed by us in the reports that we file or submit under the Exchange Act is recorded, processed, summarized and reported within the time periods specified in the Securities and Exchange Commission’s rules and forms. Disclosure controls and procedures include, without limitation, controls and procedures designed to ensure that information required to be disclosed by an issuer in the reports that it files or submits under the Exchange Act is accumulated and communicated to the issuer’s management, including its principal executive officer or officers and principal financial officer or officers, or persons performing similar functions, as appropriate to allow timely decisions regarding required disclosure.
Management Report on Internal Control over Financial Reporting
Our management is responsible for establishing and maintaining adequate internal control over financial reporting. Our internal control system was designed to provide reasonable assurance to management and our Board of Directors regarding the preparation and fair presentation of published financial statements.
All internal control systems, no matter how well designed, have inherent limitations. Therefore, even those systems determined to be effective can provide only reasonable assurance with respect to financial statement preparation and presentation.
Management assessed the effectiveness of our internal control over financial reporting as of December 31, 2017. In making this assessment, management used the criteria established in Internal Control - Integrated Framework (2013) issued by the Committee of Sponsoring Organizations of the Treadway Commission. Based on its assessment, management believes that, as of December 31, 2017, our internal control over financial reporting is effective based on those criteria.
Our independent registered public accounting firm has issued an attestation report on our internal control over financial reporting. This report appears below.
Changes in Internal Control over Financial Reporting
There were no changes in our “internal control over financial reporting” (as defined in Rule 13a-15(f) promulgated under the Exchange Act) identified in connection with the evaluation required by Rule 13a-15(d) promulgated under the Exchange Act that occurred during the fiscal quarter ended December 31, 2017 that have materially affected, or are reasonably likely to materially affect, our internal control over financial reporting.
85
REPORT OF INDEPENDENT REGISTERED PUBLIC ACCOUNTING FIRM
To the Board of Directors and Stockholders of USG Corporation:
Opinion on Internal Control over Financial Reporting
We have audited the internal control over financial reporting of USG Corporation and subsidiaries (the “Corporation”) as of December 31, 2017, based on criteria established in Internal Control - Integrated Framework (2013) issued by the Committee of Sponsoring Organizations of the Treadway Commission (COSO). In our opinion, the Corporation maintained, in all material respects, effective internal control over financial reporting as of December 31, 2017, based on criteria established in Internal Control - Integrated Framework (2013) issued by COSO.
We have also audited, in accordance with the standards of the Public Company Accounting Oversight Board (United States) (PCAOB), the consolidated financial statements and financial statement schedule as of and for the year ended December 31, 2017, of the Corporation and our report dated February 14, 2018, expressed an unqualified opinion on those financial statements and financial statement schedule.
Basis for Opinion
The Corporation’s management is responsible for maintaining effective internal control over financial reporting and for its assessment of the effectiveness of internal control over financial reporting, included in the accompanying Management Report on Internal Control over Financial Reporting. Our responsibility is to express an opinion on the Corporation’s internal control over financial reporting based on our audit. We are a public accounting firm registered with the PCAOB and are required to be independent with respect to the Corporation in accordance with the U.S. federal securities laws and the applicable rules and regulations of the Securities and Exchange Commission and the PCAOB.
We conducted our audit in accordance with the standards of the PCAOB. Those standards require that we plan and perform the audit to obtain reasonable assurance about whether effective internal control over financial reporting was maintained in all material respects. Our audit included obtaining an understanding of internal control over financial reporting, assessing the risk that a material weakness exists, testing and evaluating the design and operating effectiveness of internal control based on the assessed risk, and performing such other procedures as we considered necessary in the circumstances. We believe that our audit provides a reasonable basis for our opinion.
Definition and Limitations of Internal Control over Financial Reporting
A company’s internal control over financial reporting is a process designed to provide reasonable assurance regarding the reliability of financial reporting and the preparation of financial statements for external purposes in accordance with generally accepted accounting principles. A company’s internal control over financial reporting includes those policies and procedures that (1) pertain to the maintenance of records that, in reasonable detail, accurately and fairly reflect the transactions and dispositions of the assets of the company; (2) provide reasonable assurance that transactions are recorded as necessary to permit preparation of financial statements in accordance with generally accepted accounting principles, and that receipts and expenditures of the company are being made only in accordance with authorizations of management and directors of the company; and (3) provide reasonable assurance regarding prevention or timely detection of unauthorized acquisition, use, or disposition of the company’s assets that could have a material effect on the financial statements.
Because of its inherent limitations, internal control over financial reporting may not prevent or detect misstatements. Also, projections of any evaluation of effectiveness to future periods are subject to the risk that controls may become inadequate because of changes in conditions, or that the degree of compliance with the policies or procedures may deteriorate.
/s/ DELOITTE & TOUCHE LLP
Chicago, Illinois
February 14, 2018
Item 9B. | OTHER INFORMATION |
On February 14, 2018, our Board of Directors approved our 2018 Annual Management Incentive Program (the "2018 Program"), upon the recommendation of the Compensation and Organization Committee of our Board. Under the 2018 Program, 50% of the target incentive award for each of USG’s named executive officers is based on a formula related to adjusted consolidated net earnings and 50% is based on specified operating and financial targets. Our Board also approved the following operating and financial targets for USG’s named executive officers under the 2018 Program: Adjusted operating margin, UBBP adjusted EBIT and growth initiatives revenue.
86
PART III
Item 10. | DIRECTORS, EXECUTIVE OFFICERS AND CORPORATE GOVERNANCE |
Executive Officers of the Registrant (as of February 14, 2018):
Name | Age | Position | ||
Jennifer F. Scanlon | 51 | President and Chief Executive Officer | ||
Matthew F. Hilzinger | 54 | Executive Vice President and Chief Financial Officer | ||
Brian J. Cook | 60 | Executive Vice President and Chief Administrative Officer | ||
Dominic A. Dannessa | 61 | Executive Vice President and Chief Customer and Innovation Officer | ||
Joseph W. Holmes | 56 | Senior Vice President, Manufacturing, Technology and Global Operations | ||
Christopher D. Macey | 46 | Senior Vice President and President, Ceilings | ||
John M. Reale | 56 | Senior Vice President and President, Performance Materials | ||
Gregory D. Salah | 55 | Senior Vice President and President, Gypsum | ||
Michelle M. Warner | 51 | Senior Vice President, General Counsel and Corporate Secretary | ||
Business Experience During the Last Five Years:
Jennifer F. Scanlon has served as a Director since September 2016 and President and Chief Executive Officer since November 2016. Prior thereto Ms. Scanlon held a variety of positions at USG, including Executive Vice President beginning in March 2016 and President, International beginning in September 2010. Ms. Scanlon also served as President of L&W Supply Corporation from July 2015 to October 2016 and as the chairman of the board of UBBP from its inception in February 2014 until October 2016.
Matthew F. Hilzinger has served as Executive Vice President since April 2012 and Chief Financial Officer since May 2012. Prior to joining USG, he held various positions at Exelon Corporation, a utility services holding company engaged in the energy generation and delivery businesses, including serving as Executive Vice President and Chief Integration Officer in March 2012 and Senior Vice President and Chief Financial Officer prior thereto.
Brian J. Cook has served as Executive Vice President since March 2016 and Chief Administrative Officer since September 2015. He previously held a variety of human resources and labor relations positions at USG, including Senior Vice President, Human Resources and Communications from May 2013 to August 2015 and Senior Vice President, Human Resources prior thereto.
Dominic A. Dannessa has served as Executive Vice President and Chief Customer and Innovation Officer since November 2017. He also oversees USG’s Corporate Innovation Center in Libertyville, IL. Mr. Dannessa previously served as Executive Vice President, Chief Operations and Innovation Officer from March 2016 until November 2017, Senior Vice President, Operations and Chief Technology Officer from September 2015 until February 2016 and prior thereto as Senior Vice President and Chief Technology Officer.
Joseph W. Holmes has served as Senior Vice President, Manufacturing, Technology and Global Operations and as an executive officer since November 2017. Prior thereto he served as Chief Operating Officer of UBBP from its inception in February 2014 until October 2017. He previously held various roles at USG beginning more than five years ago, including Vice President, Enterprise Technology, Vice President, L&W and General Manager, USG Zawawi until the inception of UBBP in February 2014.
Christopher D. Macey has served as Senior Vice President and President, Ceilings since October 2017 and became an executive officer in November 2017. He previously held a variety of roles with USG and CGC Inc., USG’s Canadian subsidiary, including General Manager, North American Ceilings from June 2015 to September 2017 and Vice President and prior thereto General Manager, CGC beginning in 2007.
John M. Reale has served as Senior Vice President and President, Performance Materials since October 2017 and became an executive officer in November 2017. Previously he served as General Manager, North American Substrates from January 2013 until September 2017 and in a variety of roles at USG prior thereto. Mr. Reale, before he was an executive officer of USG, filed a personal voluntary bankruptcy petition under Chapter 7 in the U.S. Bankruptcy Court in 2012 as a result of an unsuccessful personal business venture, which petition has since been discharged.
87
Gregory D. Salah has served as Senior Vice President and President, Gypsum since November 2017. Previously he served in various roles at USG, including Senior Vice President and President, North America from March 2016 to October 2017, Vice President and General Manager, North America from August 2015 to February 2016, Senior Vice President & General Manager, North American Wallboard & Surfaces, United States Gypsum Company, from December 2014 to July 2015, General Manager, US Wallboard & Surfaces from January 2013 to November 2014 and Senior Vice President, Sales and Marketing, Building Systems prior thereto.
Michelle M. Warner joined USG as Senior Vice President, General Counsel and Corporate Secretary in January 2016. Prior to joining USG, she served in various roles at Motorola Solutions, Inc., a provider of communication infrastructure, devices, accessories, software and services, including Corporate Vice President, Deputy General Counsel and Secretary from June 2013 to December 2015 and Corporate Vice President, Law, Corporate, Securities and Transactions prior thereto.
Committee Charters and Code of Business Conduct
We have adopted a code of ethics, our Code of Business Conduct, that applies to all of our directors, officers and employees. Our Code of Business Conduct, our Corporate Governance Guidelines and the charters of the committees of our Board of Directors, including the Audit Committee, Governance Committee and Compensation and Organization Committee, are available through the “Investor Relations” and “Corporate Governance” links in the “Company Information” section of our Web site at www.usg.com. We will post any amendments to the Code of Business Conduct, and any waivers that are required to be disclosed by the rules of the Securities and Exchange Commission, the NYSE or the Chicago Stock Exchange, on our Web site.
Other information required by this Item 10 is included under the headings “Nominees for Election to the Board of Directors,” “Directors Continuing in Office,” “Committees of the Board of Directors,” “Audit Committee” and “Section 16(a) Beneficial Ownership Reporting Compliance” in the definitive Proxy Statement for our annual meeting of stockholders scheduled to be held on May 9, 2018, which information is incorporated herein by reference.
Item 11. | EXECUTIVE COMPENSATION |
Information required by this Item 11 is included under the headings “Compensation of Executive Officers” and “Director Compensation” in the definitive Proxy Statement for our annual meeting of stockholders scheduled to be held on May 9, 2018, which information is incorporated herein by reference.
88
Item 12. | SECURITY OWNERSHIP OF CERTAIN BENEFICIAL OWNERS AND MANAGEMENT AND RELATED STOCKHOLDER MATTERS |
The following table sets forth information as of December 31, 2017 about equity securities that may be issued upon exercise of options under our LTIP, which was approved by our stockholders, and deferred stock units issued under our Non-Employee Director Compensation Program. The features of these plans are discussed further in Part II, Item 8, Financial Statements and Supplementary Data, Note 10, Share-Based Compensation.
Plan Category | Number of securities to be issued upon exercise of outstanding options and rights (a) | Weighted average exercise price of outstanding options and rights (b) | Number of securities remaining available for future issuance under equity compensation plans (excluding securities reported in column one) | ||||||
Equity compensation plans approved by stockholders | 1,261,140 | $ | 15.72 | 6,990,836 | |||||
Equity compensation plans not approved by stockholders | 234,428 | — | — | ||||||
Total | 1,495,568 | $ | 15.72 | 6,990,836 | |||||
(a) | Equity compensation plans not approved by stockholders includes an aggregate of 210,480 fully vested deferred stock units granted to our non-employee directors that are payable in shares of common stock and 23,948 fully vested deferred stock units granted to our non-employee directors that are payable in cash or shares of common stock, at such director’s option. The deferred stock units increase or decrease in value in direct proportion to the market value of our common stock and will be paid following termination of service as a director. Amount does not include an aggregate of 611 fully vested deferred stock units granted to our non-employee directors that must be settled in cash. |
(b) | Weighted-average exercise price calculation for equity compensation plans not approved by stockholders does not reflect the inclusion of fully-vested deferred stock units granted to our non-employee directors because that type of award does not have an exercise feature. |
Other information required by this Item 12 is included under the heading “Securities Ownership” in the definitive Proxy Statement for our annual meeting of stockholders scheduled to be held on May 9, 2018, which information is incorporated herein by reference.
Item 13. | CERTAIN RELATIONSHIPS AND RELATED TRANSACTIONS, AND DIRECTOR INDEPENDENCE |
Information required by this Item 13 is included under the headings “Transactions with Related Persons” and “Director Independence” in the definitive Proxy Statement for our annual meeting of stockholders scheduled to be held on May 9, 2018, which information is incorporated herein by reference.
Item 14. | PRINCIPAL ACCOUNTING FEES AND SERVICES |
Information required by this Item 14 is included under the heading “Independent Registered Public Accounting Firm Fees and Services” in the definitive Proxy Statement for our annual meeting of stockholders scheduled to be held on May 9, 2018, which information is incorporated herein by reference.
89
PART IV
Item 15. | EXHIBITS AND FINANCIAL STATEMENT SCHEDULES |
(a) | 1 and 2. See Part II, Item 8, Financial Statements and Supplementary Data, for an index of our consolidated financial statements and supplementary data schedule. |
3. The information in the Exhibit Index of this Annual Report on Form 10-K is incorporated into this Item 15(a)3 by reference.
(b) | The information in the Exhibit Index of this Annual Report on Form 10-K is incorporated into this Item 15(b) by reference. |
Item 16. | FORM 10-K SUMMARY |
None
90
EXHIBIT INDEX
Exhibit Number | Exhibit | ||
Share Sale and Subscription Agreement, dated as of October 17, 2013, by and among USG Corporation, USG Netherlands Global Holdings B.V., Boral Limited, Boral International Pty Limited, and Boral Gypsum Asia Sdn Bhd (incorporated by reference to Exhibit 2.1 to USG Corporation's Current Report on Form 8-K (File No. 001-08864) dated October 16, 2013, or the October 2013 8-K) † | |||
Share Sale and Subscription Agreement, dated as of October 17, 2013, by and among USG Corporation, USG Foreign Investments, Ltd., USG Netherlands Global Holdings B.V., Boral Limited, Boral Building Materials Pty Limited, and Boral Australian Gypsum Limited (incorporated by reference to Exhibit 2.2 to the October 2013 8-K) † | |||
Sale and Purchase Agreement, by and between USG Corporation and American Builders & Contractors Supply Co., Inc., dated August 27, 2016 (incorporated by reference to Exhibit 2.1 to USG Corporation's Amendment No. 1 to Current Report on Form 8-K (File No. 001-08864) dated August 29, 2016) † | |||
Restated Certificate of Incorporation of USG Corporation (incorporated by reference to Exhibit 3.1 to USG Corporation’s Current Report on Form 8-K (File No. 001-08864) dated November 14, 2017, or the November 2017 8-K) | |||
Amended and Restated By-Laws of USG Corporation, dated as of November 9, 2017 (incorporated by reference to Exhibit 3.2 to the November 2017 8-K) | |||
Form of Common Stock certificate (incorporated by reference to Exhibit 4.1 to USG Corporation’s Current Report on Form 8-K (File No. 001-08864) dated May 12, 2016) | |||
Rights Agreement, dated as of December 21, 2006, by and between USG Corporation and Computershare Investor Services, LLC, as rights agent (incorporated by reference to Exhibit 4.1 to USG Corporation’s Registration Statement on Form 8-A (File No. 001-08864) dated December 21, 2006) | |||
Amendment No. 1 to Rights Agreement, dated as of December 5, 2008, by and between USG Corporation and Computershare Investor Services, LLC, as rights agent (incorporated by reference to Exhibit 4.1 to USG Corporation’s Amendment No. 1 to Form 8-A (File No. 001-08864) dated December 5, 2008) | |||
Amendment No. 2 to Rights Agreement, dated as of March 22, 2013, by and between USG Corporation and Computershare Trust Company, N.A., as rights agent (successor-in-interest to Computershare Investor Services LLC) (incorporated by reference to Exhibit 4.1 to USG Corporation’s Amendment No. 2 to Form 8-A (File No. 001-08864) dated March 22, 2013) | |||
Amendment No. 3 to Rights Agreement, dated as of February 11, 2015, by and between USG Corporation and Computershare Trust Company, N.A., as rights agent (successor-in-interest to Computershare Investor Services LLC) (incorporated by reference to Exhibit 4.1 to USG Corporation’s Amendment No. 3 to Form 8-A (File No. 001-08864) dated February 11, 2015) | |||
Amendment No. 4 to Rights Agreement, dated as of November 16, 2015, by and between USG Corporation and Computershare Trust Company, N.A., as rights agent (successor-in-interest to Computershare Investor Services LLC) (incorporated by reference to Exhibit 4.1 to USG Corporation’s Amendment No. 4 to Form 8-A (File No. 001-08864) dated November 16, 2015) | |||
Indenture, dated as of November 1, 2006, by and between USG Corporation and Wells Fargo Bank, National Association, as trustee (incorporated by reference to Exhibit 4.01 to USG Corporation’s Current Report on Form 8-K (File No. 001-08864) dated November 20, 2006) | |||
Agreement of Resignation, Appointment and Acceptance, dated as of October 18, 2011, by and among USG Corporation, U.S. Bank National Association and HSBC Bank USA, National Association (incorporated by reference to Exhibit 4.1 to USG Corporation’s Quarterly Report on Form 10-Q (File No. 001-08864) dated October 31, 2011) | |||
Supplemental Indenture No. 6, dated as of February 24, 2015, by and among USG Corporation, each of United States Gypsum Company, L&W Supply Corporation, USG Foreign Investments, Ltd. and USG Interiors, LLC, as guarantors, and U.S. Bank National Association, as trustee (incorporated by reference to Exhibit 4.1 to USG Corporation’s Current Report on Form 8-K (File No. 001-08864) dated February 24, 2015) | |||
Supplemental Indenture No. 7, dated as of May 15, 2017, by and among USG Corporation, each of United States Gypsum Company, USG Foreign Investments, Ltd. and USG Interiors, LLC, as guarantors, and U.S. Bank National Association, as trustee (incorporated by reference to Exhibit 4.1 to USG Corporation's Current Report on Form 8-K (File No. 001-08864) dated May 15, 2017) | |||
91
USG Corporation and certain of its consolidated subsidiaries are parties to other long-term debt instruments under which the total amount of securities authorized does not exceed 10% of the total assets of USG Corporation and its subsidiaries on a consolidated basis. Pursuant to paragraph (b)(4)(iii)(A) of Item 601 of Regulation S-K, USG Corporation agrees to furnish a copy of such instruments to the Securities and Exchange Commission upon request. | |||
Shareholder’s Agreement, dated as of January 30, 2006, by and between USG Corporation and Berkshire Hathaway Inc. (incorporated by reference to Exhibit 10.3 to USG Corporation's Current Report on Form 8-K (File No. 001-08864) dated January 30, 2006) | |||
Amended and Restated Registration Rights Agreement, dated as of November 26, 2008, by and between USG Corporation and Berkshire Hathaway Inc. (incorporated by reference to Exhibit 10.1 to USG Corporation's Current Report on Form 8-K (File No. 001-08864) dated November 26, 2008) | |||
Shareholders Agreement, dated as of February 28, 2014, by and among USG Corporation, Boral International Pty Limited, Boral Building Materials Pty Limited, USG Netherlands Global Holdings B.V., USG Boral Building Products Pte Limited, USG Boral Building Products Pty Limited, and Boral Limited (incorporated by reference to Exhibit 10.1 to USG Corporation's Current Report on Form 8-K (File No. 001-08864) dated February 28, 2014) (Note: Portions of this document have been omitted pursuant to a Request for Confidential Treatment filed with the Securities and Exchange Commission) | |||
Fifth Amendment and Restatement Agreement, dated as of May 1, 2017, among USG Corporation, certain of its wholly-owned domestic and Canadian subsidiaries, JPMorgan Chase Bank, N.A., as administrative agent and as an issuing bank, JPMorgan Chase Bank, N.A., Toronto Branch, as Canadian agent, and the lenders and issuing banks party thereto (incorporated by reference to Exhibit 10.1 to USG Corporation's Current Report on Form 8-K (File No. 001-08864) dated May 1, 2017, or the May 2017 8-K) | |||
Fifth Amended and Restated Credit Agreement, dated as of May 1, 2017, among USG Corporation, as the “U.S. Borrower,” CGC Inc., a New Brunswick corporation and wholly-owned indirect subsidiary of USG Corporation, as the “Canadian Borrower,” JPMorgan Chase Bank, N.A., as administrative agent, JPMorgan Chase Bank, N.A., Toronto Branch, as Canadian agent, the lenders and issuing banks party thereto and Bank of America, N.A. and Wells Fargo Bank, National Association, as co-syndication agents (incorporated by reference to Exhibit 10.2 to the May 2017 8-K) | |||
Amended and Restated Guarantee Agreement, dated as of October 22, 2014, among USG Corporation, CGC Inc., the subsidiary guarantors party thereto and JP Morgan Chase Bank, N.A., as administrative agent (incorporated by reference to Exhibit 10.20 to USG Corporation's Annual Report on Form 10-K (File No. 001-08864) dated February 12, 2015, or the 2014 10-K) | |||
U.S. Pledge and Security Agreement, dated as of January 7, 2009, among USG Corporation, the other grantors party thereto and JPMorgan Chase Bank, N.A., as administrative agent (incorporated by reference to Exhibit 10.21 to the 2014 10-K) | |||
Canadian Pledge and Security Agreement, dated as of October 22, 2014, among CGC Inc., the other grantors party thereto and JPMorgan Chase Bank, N.A., as administrative agent (incorporated by reference to Exhibit 10.22 to the 2014 10-K) | |||
Canadian Amendment and Reaffirmation Agreement, dated as of May 1, 2017, by and between CGC Inc. and JPMorgan Chase Bank, N.A. (incorporated by reference to Exhibit 10.3 to the May 2017 8-K) | |||
Interest and Share Purchase Agreement, dated as of September 15, 2015, by and among USG Corporation, USG Ventures-Europe GmbH, Knauf Aquapanel GmbH, Knauf/USG Verwaltungs GmbH and Knauf/USG Systems GmbH & Co. KG (incorporated by reference to Exhibit 10.2 to USG Corporation's Quarterly Report on Form 10-Q (File No. 001-08864) dated October 22, 2015, or the third quarter 2015 10-Q) | |||
Direct Purchaser Settlement Agreement, dated February 11, 2015 (incorporated by reference to Exhibit 10.1 to USG Corporation’s Current Report on Form 8-K (File No. 001-08864) dated February 13, 2015, or the February 2015 8-K) | |||
Indirect Purchaser Settlement Agreement, dated February 11, 2015 (incorporated by reference to Exhibit 10.2 to the February 2015 8-K) | |||
Supply Agreement, by and among United States Gypsum Company and USG Interiors, LLC and USG Corporation, as guarantor, and L&W Supply Corporation and American Builders & Contractors Supply Co., Inc., as guarantor, dated October 31, 2016 (incorporated by reference to Exhibit 10.1 to USG Corporation’s Current Report on Form 8-K (File No. 001-08864) dated November 1, 2016) (Note: Portions of this exhibit have been omitted pursuant to a Request for Confidential Treatment filed with the Securities and Exchange Commission) | |||
Form of Employment Agreement (incorporated by reference to Exhibit 10.1 to USG Corporation’s Current Report on Form 8-K (File No. 001-08864) dated October 2, 2008, or the October 2008 8-K)* | |||
92
Employment Agreement, effective as of April 16, 2012, between USG Corporation and Matthew Hilzinger (incorporated by reference to Exhibit 10.1 to USG Corporation's Current Report on Form 8-K (File No. 001-08864) dated March 26, 2012, or the March 2012 8-K)* | |||
Form of Employment Agreement (form used since January 1, 2015) (incorporated by reference to Exhibit 10.3 to USG Corporation's Quarterly Report on Form 10-Q (File No. 001-08864) dated July 23, 2015)* | |||
Form of Change in Control Severance Agreement (Tier 1 Benefits) (incorporated by reference to Exhibit 10.2 to the October 2008 8-K)* | |||
Form of Change in Control Severance Agreement (Tier 2 Benefits) (incorporated by reference to Exhibit 10.3 to the October 2008 8-K)* | |||
Change in Control Severance Agreement, dated as of April 16, 2012, by and between USG Corporation and Matthew Hilzinger (incorporated by reference to Exhibit 10.2 to the March 2012 8-K)* | |||
Form of Change in Control Severance Agreement (form used since August 1, 2015) (incorporated by reference to Exhibit 10.1 to the third quarter 2015 10-Q)* | |||
Form of Indemnification Agreement (incorporated by reference to Exhibit 10.14 to USG Corporation’s Annual Report on Form 10-K (File No. 001-08864) dated February 15, 2008, or the 2007 10-K)* | |||
USG Corporation Supplemental Retirement Plan (As Amended and Restated Effective as of January 1, 2007), dated December 10, 2008 (incorporated by reference to Exhibit 10.1 to USG Corporation’s Annual Report on Form 10-K (File No. 001-08864) dated February 20, 2009, or the 2008 10-K)* | |||
USG Corporation Deferred Compensation Plan (Effective as of April 1, 2007) (incorporated by reference to Exhibit 10.31 to USG Corporation's Annual Report on Form 10-K (File No. 001-08864) dated February 16, 2007)* | |||
First Amendment of USG Corporation Deferred Compensation Plan, dated December 10, 2008 (incorporated by reference to Exhibit 10.25 to the 2008 10-K)* | |||
Second Amendment of USG Corporation Deferred Compensation Plan, dated September 5, 2012 (incorporated by reference to Exhibit 10.1 to USG Corporation's Quarterly Report on Form 10-Q (File No. 001-08864) dated October 23, 2014)* | |||
Third Amendment of USG Corporation Deferred Compensation Plan, dated November 21, 2014 (incorporated by reference to Exhibit 10.28 to the 2014 10-K)* | |||
USG Corporation Management Incentive Plan (as amended and restated effective May 13, 2015) (incorporated by reference to Annex B to the Proxy Statement for the Annual Meeting of Stockholders of USG Corporation held on May 13, 2015 filed with the Securities and Exchange Commission on April 2, 2015 (File No. 001-08864), or the 2015 Proxy Statement)* | |||
2017 Annual Management Incentive Program of USG Corporation (Executive Officers Only) (incorporated by reference to Exhibit 10.30 to USG Corporation's Annual Report on Form 10-K (File No. 001-08864) dated February 8, 2017, or the 2016 10-K)* | |||
2018 Annual Management Incentive Program of USG Corporation (Executive Officers Only)* ** | |||
USG Corporation Long-Term Incentive Plan (as amended effective May 13, 2015) (incorporated by reference to Annex C to the 2015 Proxy Statement)* | |||
Form of USG Corporation Nonqualified Stock Option Agreement (incorporated by reference to Exhibit 10.36 to the 2008 10-K)* | |||
Form of USG Corporation Restricted Stock Units Agreement (incorporated by reference to Exhibit 10.37 to the 2008 10-K)* | |||
Form of USG Corporation Nonqualified Stock Option Agreement (incorporated by reference to Exhibit 10.30 to USG Corporation’s Annual Report on Form 10-K (File No. 001-08864) dated February 12, 2010)* | |||
Form of USG Corporation Restricted Stock Units Agreement (incorporated by reference to Exhibit 10.1 to USG Corporation's Quarterly Report on Form 10-Q (File No. 001-08864) dated July 24, 2014)* | |||
Form of USG Corporation Market Share Units Agreement (incorporated by reference to Exhibit 10.46 to the 2014 10-K)* | |||
Form of USG Corporation Performance Shares Agreement (incorporated by reference to Exhibit 10.47 to the 2014 10-K)* | |||
93
USG Corporation 2016 Long-Term Incentive Plan (incorporated by reference to Annex A to the Proxy Statement for the Annual Meeting of Stockholders of USG Corporation held on May 11, 2016 filed with the Securities and Exchange Commission on March 31, 2016 (File No. 001-08864))* | |||
Form of USG Corporation Restricted Stock Units Agreement under the USG Corporation 2016 Long-Term Incentive Plan (incorporated by reference to Exhibit 10.42 to the 2016 10-K)* | |||
Form of USG Corporation Market Share Units Agreement under the USG Corporation 2016 Long-Term Incentive Plan (incorporated by reference to Exhibit 10.43 to the 2016 10-K)* | |||
Form of USG Corporation Performance Shares Agreement under the USG Corporation 2016 Long-Term Incentive Plan (incorporated by reference to Exhibit 10.44 to the 2016 10-K)* | |||
USG Corporation Stock Compensation Program for Non-Employee Directors (as Amended and Restated Effective as of January 1, 2005) (incorporated by reference to Exhibit 10.2 to USG Corporation’s Current Report on Form 8-K (File No. 001-08864) dated November 14, 2005)* | |||
Amendment No. 1 to the USG Corporation Stock Compensation Program for Non-Employee Directors (incorporated by reference to Exhibit 10.1 to USG Corporation’s Quarterly Report on Form 10-Q (File No. 001-08864) dated August 3, 2006)* | |||
Amendment No. 2 to the USG Corporation Stock Compensation Program for Non-Employee Directors (incorporated by reference to Exhibit 10.8 to USG Corporation’s Quarterly Report on Form 10-Q (File No. 001-08864) dated April 30, 2007)* | |||
USG Corporation Non-Employee Director Compensation Program (Amended and Restated February 13, 2008) (incorporated by reference to Exhibit 10.18 to the 2007 10-K)* | |||
Amendment No. 1 to USG Corporation Non-Employee Director Compensation Program, dated November 12, 2010 (incorporated by reference to Exhibit 10.10 to USG Corporation’s Annual Report on Form 10-K (File No. 001-08864) dated February 11, 2011)* | |||
Amendment No. 2 to USG Corporation Non-Employee Director Compensation Program, dated November 10, 2011(incorporated by reference to Exhibit 10.11 to USG Corporation's Annual Report on Form 10-K (File No. 001-08864) dated February 14, 2012)* | |||
Amendment No. 3 to USG Corporation Non-Employee Director Compensation Program, dated November 14, 2013 (incorporated by reference to Exhibit 10.14 to USG Corporation’s Annual Report on Form 10-K (File No. 001-08864) dated March 3, 2014)* | |||
Amendment No. 4 to USG Corporation Non-Employee Director Compensation Program, dated November 13, 2014 (incorporated by reference to Exhibit 10.16 to the 2014 10-K)* | |||
Amendment No. 5 to USG Corporation Non-Employee Director Compensation Program, dated November 10, 2016 (incorporated by reference to Exhibit 10.53 to the 2016 10-K)* | |||
USG Corporation Deferred Compensation Program for Non-Employee Directors (as Amended and Restated effective December 31, 2008) (incorporated by reference to Exhibit 10.10 to the 2008 10-K)* | |||
First Amendment to USG Corporation Deferred Compensation Program for Non-Employee Directors (incorporated by reference to Exhibit 10.1 to USG Corporation’s Quarterly Report on Form 10-Q (File No. 001-08864) dated October 26, 2017)* | |||
Other: | |||
Subsidiaries ** | |||
Consent of Independent Registered Public Accounting Firm, Deloitte & Touche LLP ** | |||
Power of Attorney ** | |||
Rule 13a - 14(a) Certifications of USG Corporation’s Chief Executive Officer ** | |||
Rule 13a - 14(a) Certifications of USG Corporation’s Chief Financial Officer ** | |||
Section 1350 Certifications of USG Corporation’s Chief Executive Officer ** | |||
Section 1350 Certifications of USG Corporation’s Chief Financial Officer ** | |||
Mine Safety Disclosures ** | |||
94
101 | The following financial information from USG Corporation’s Annual Report on Form 10-K for the year ended December 31, 2017, formatted in XBRL (Extensible Business Reporting Language): (1) the consolidated statements of income for the years ended December 31, 2017, 2016 and 2015, (2) the consolidated statements of other comprehensive income (loss) for the years ended December 31, 2017, 2016 and 2015, (3) the consolidated balance sheets as of December 31, 2017 and 2016, (4) the consolidated statements of cash flows for the years ended December 31, 2017, 2016 and 2015, (5) the consolidated statements of stockholders’ equity for the years ended December 31, 2017, 2016 and 2015 and (6) notes to the consolidated financial statements. ** | ||
* | Management contract or compensatory plan or arrangement |
** | Filed or furnished herewith |
† | Schedules and other similar attachments have been omitted pursuant to Item 601(b)(2) of Regulation S-K. The registrant hereby undertakes to furnish supplementally copies of any of the omitted schedules and other similar attachments upon request by the Securities and Exchange Commission, provided that the registrant may request confidential treatment for any schedule or other similar attachment so furnished. |
95
SIGNATURES
Pursuant to the requirements of Section 13 or 15(d) of the Securities Exchange Act of 1934, the Registrant has duly caused this report to be signed on its behalf by the undersigned, thereunto duly authorized.
USG CORPORATION | ||
February 14, 2018 | ||
By: | /s/ Matthew F. Hilzinger | |
Matthew F. Hilzinger | ||
Executive Vice President and | ||
Chief Financial Officer | ||
Pursuant to the requirements of the Securities Exchange Act of 1934, this report has been signed below by the following persons on behalf of the Registrant and in the capacities and on the date indicated.
/s/ Jennifer F. Scanlon | February 14, 2018 | |
JENNIFER F. SCANLON | ||
Director, President and Chief Executive Officer | ||
(Principal Executive Officer) | ||
/s/ Matthew F. Hilzinger | February 14, 2018 | |
MATTHEW F. HILZINGER | ||
Executive Vice President and | ||
Chief Financial Officer | ||
(Principal Financial Officer) | ||
/s/ Jeanette A. Press | February 14, 2018 | |
JEANETTE A. PRESS | ||
Vice President and Controller | ||
(Principal Accounting Officer) | ||
JOSE ARMARIO, THOMAS A. BURKE, | By: | /s/ Matthew F. Hilzinger |
MATTHEW CARTER, JR., | Matthew F. Hilzinger | |
GRETCHEN R. HAGGERTY, | Attorney-in-fact | |
WILLIAM H. HERNANDEZ, BRIAN A. KENNEY, | February 14, 2018 | |
RICHARD P. LAVIN, STEVEN F. LEER | ||
Directors | ||
96