Attached files
| file | filename |
|---|---|
| EX-31.1 - RULE 13A - 14(A) CERTIFICATION OF USG CORPORATION'S CHIEF EXECUTIVE OFFICER - USG CORP | usg_ex311x0331201810-q.htm |
| EX-95 - MINE SAFETY DISCLOSURES - USG CORP | usg_ex95x0331201810-q.htm |
| EX-32.2 - SECTION 1350 CERTIFICATION OF USG CORPORATION'S CHIEF FINANCIAL OFFICER - USG CORP | usg_ex322x0331201810-q.htm |
| EX-32.1 - SECTION 1350 CERTIFICATION OF USG CORPORATION'S CHIEF EXECUTIVE OFFICER - USG CORP | usg_ex321x0331201810-q.htm |
| EX-31.2 - RULE 13A - 14(A) CERTIFICATION OF USG CORPORATION'S CHIEF FINANCIAL OFFICER - USG CORP | usg_ex312x0331201810-q.htm |
UNITED STATES
SECURITIES AND EXCHANGE COMMISSION
Washington, D.C. 20549
FORM 10-Q
(Mark One)
þ | QUARTERLY REPORT PURSUANT TO SECTION 13 OR 15(d) OF THE SECURITIES EXCHANGE ACT OF 1934 | |
For the quarterly period ended March 31, 2018
OR
¨ | TRANSITION REPORT PURSUANT TO SECTION 13 OR 15(d) OF THE SECURITIES EXCHANGE ACT OF 1934 | |
For the transition period from to
Commission File Number 1-8864
USG CORPORATION |
(Exact name of registrant as specified in its charter)
Delaware | 36-3329400 | |
(State or other jurisdiction of | (I.R.S. Employer | |
incorporation or organization) | Identification No.) | |
550 West Adams Street, Chicago, Illinois | 60661-3676 | |
(Address of principal executive offices) | (Zip code) | |
Registrant’s telephone number, including area code (312) 436-4000
Indicate by check mark whether the registrant (1) has filed all reports required to be filed by section 13 or 15(d) of the Securities Exchange Act of 1934 during the preceding 12 months (or for such shorter period that the registrant was required to file such reports), and (2) has been subject to such filing requirements for the past 90 days. Yes þ No ¨
Indicate by check mark whether the registrant has submitted electronically and posted on its corporate Web site, if any, every Interactive Data File required to be submitted and posted pursuant to Rule 405 of Regulation S-T during the preceding 12 months (or for such shorter period that the registrant was required to submit and post such files). Yes þ No ¨
Indicate by check mark whether the registrant is a large accelerated filer, an accelerated filer, a non-accelerated filer, a smaller reporting company, or an emerging growth company. See the definitions of large accelerated filer, accelerated filer, smaller reporting company, and emerging growth company in Rule 12b-2 of the Exchange Act.
Large accelerated filer | þ | Accelerated filer | ¨ |
Non-accelerated filer | ¨ | (Do not check if a smaller reporting company) | |
Smaller reporting company | ¨ | ||
Emerging growth company | ¨ | ||
If an emerging growth company, indicate by check mark if the registrant has elected not to use the extended transition period for complying with any new or revised financial accounting standards provided pursuant to Section 13(a) of the Exchange Act. ¨
Indicate by check mark whether the registrant is a shell company (as defined in Rule 12b-2 of the Exchange Act). Yes o No þ
The number of shares of the registrant’s common stock outstanding as of March 31, 2018 was 139,652,659.
Table of Contents
Page | ||
2
PART I. FINANCIAL INFORMATION
ITEM 1. FINANCIAL STATEMENTS
USG CORPORATION
CONDENSED CONSOLIDATED STATEMENTS OF INCOME
(Unaudited)
(millions, except per-share and share data) | Three months ended March 31, | |||||||
2018 | 2017 | |||||||
Net sales | $ | 786 | $ | 767 | ||||
Cost of products sold | 647 | 608 | ||||||
Gross profit | 139 | 159 | ||||||
Selling and administrative expenses | 93 | 75 | ||||||
Operating profit | 46 | 84 | ||||||
Income from equity method investments | 9 | 13 | ||||||
Interest expense | (14 | ) | (20 | ) | ||||
Interest income | 1 | 1 | ||||||
Other income, net | 3 | 6 | ||||||
Income from continuing operations before income taxes | 45 | 84 | ||||||
Income tax expense | (9 | ) | (29 | ) | ||||
Income from continuing operations | 36 | 55 | ||||||
Income from discontinued operations, net of tax | 1 | — | ||||||
Net income | $ | 37 | $ | 55 | ||||
Basic earnings per average common share | $ | 0.26 | $ | 0.38 | ||||
Diluted earnings per average common share | $ | 0.25 | $ | 0.37 | ||||
Average common shares | 141,105,228 | 146,309,994 | ||||||
Dilutive awards under long-term incentive plan | 2,703,126 | 2,420,360 | ||||||
Average diluted common shares | 143,808,354 | 148,730,354 | ||||||
See accompanying Notes to Condensed Consolidated Financial Statements.
3
USG CORPORATION
CONDENSED CONSOLIDATED STATEMENTS OF COMPREHENSIVE INCOME
(Unaudited)
Three months ended March 31, | ||||||||
(millions) | ||||||||
2018 | 2017 | |||||||
Net income | $ | 37 | $ | 55 | ||||
Other comprehensive income (loss), net of tax: | ||||||||
Derivatives qualifying as cash flow hedges: | ||||||||
Income (loss) on derivatives qualifying as cash flow hedges, net of tax of $0 and $3, respectively | — | (6 | ) | |||||
Less: Reclassification adjustment for income (loss) on derivatives included in net income, net of tax of $0 in all periods | — | — | ||||||
Net derivatives qualifying as cash flow hedges | — | (6 | ) | |||||
Pension and postretirement benefits: | ||||||||
Changes in pension and postretirement benefits, net of tax of $0 in all periods | 2 | (1 | ) | |||||
Less: Amortization of prior service cost included in net periodic pension cost, net of tax (benefit) of ($1) and $0, respectively | (1 | ) | — | |||||
Net pension and postretirement benefits | 3 | (1 | ) | |||||
Foreign currency translation: | ||||||||
Changes in foreign currency translation, net of tax of $0 in all periods | 12 | 40 | ||||||
Other comprehensive income, net of tax | $ | 15 | $ | 33 | ||||
Comprehensive income | $ | 52 | $ | 88 | ||||
See accompanying Notes to Condensed Consolidated Financial Statements.
4
USG CORPORATION
CONDENSED CONSOLIDATED BALANCE SHEETS
(Unaudited)
(millions, except share data) | March 31, 2018 | December 31, 2017 | |||||
Assets | |||||||
Cash and cash equivalents | $ | 261 | $ | 394 | |||
Short-term marketable securities | 62 | 62 | |||||
Receivables (net of reserves 2018 - $10 and 2017 - $9) | 332 | 233 | |||||
Inventories | 255 | 252 | |||||
Income taxes receivable | 16 | 15 | |||||
Other current assets | 30 | 35 | |||||
Total current assets | 956 | 991 | |||||
Long-term marketable securities | 33 | 37 | |||||
Property, plant and equipment (net of accumulated depreciation and depletion - 2018 - $2,082 and 2017 - $2,053) | 1,778 | 1,762 | |||||
Deferred income taxes | 280 | 287 | |||||
Equity method investments | 699 | 686 | |||||
Goodwill and intangible assets | 39 | 43 | |||||
Other assets | 46 | 45 | |||||
Total assets | $ | 3,831 | $ | 3,851 | |||
Liabilities and Stockholders’ Equity | |||||||
Accounts payable | $ | 269 | $ | 280 | |||
Accrued expenses | 131 | 135 | |||||
Total current liabilities | 400 | 415 | |||||
Long-term debt | 1,078 | 1,078 | |||||
Deferred income taxes | 5 | 4 | |||||
Pension and other postretirement benefits | 326 | 326 | |||||
Other liabilities | 183 | 183 | |||||
Total liabilities | 1,992 | 2,006 | |||||
Stockholders' Equity: | |||||||
Preferred stock | — | — | |||||
Common stock | 15 | 15 | |||||
Treasury stock at cost | (212 | ) | (169 | ) | |||
Additional paid-in capital | 3,040 | 3,057 | |||||
Accumulated other comprehensive loss | (374 | ) | (389 | ) | |||
Retained earnings (accumulated deficit) | (630 | ) | (669 | ) | |||
Total stockholders’ equity | 1,839 | 1,845 | |||||
Total liabilities and stockholders’ equity | $ | 3,831 | $ | 3,851 | |||
See accompanying Notes to Condensed Consolidated Financial Statements.
5
(millions) | Three months ended March 31, | ||||||
2018 | 2017 | ||||||
Operating Activities | |||||||
Net income | $ | 37 | $ | 55 | |||
Less: Income from discontinued operations, net of tax | 1 | — | |||||
Income from continuing operations | 36 | 55 | |||||
Adjustments to reconcile net income from continuing operations to net cash: | |||||||
Depreciation, depletion and amortization | 36 | 33 | |||||
Share-based compensation expense | 4 | 4 | |||||
Deferred income taxes | 7 | 29 | |||||
Income from equity method investments | (9 | ) | (13 | ) | |||
Change in operating assets and liabilities | (99 | ) | (138 | ) | |||
Other, net | 9 | 1 | |||||
Net cash used for operating activities of continuing operations | (16 | ) | (29 | ) | |||
Net cash provided by (used for) operating activities of discontinued operations | 1 | (1 | ) | ||||
Net cash used for operating activities | (15 | ) | (30 | ) | |||
Investing Activities | |||||||
Purchases of marketable securities | (26 | ) | (24 | ) | |||
Sales or maturities of marketable securities | 28 | 22 | |||||
Capital expenditures | (52 | ) | (39 | ) | |||
Working capital adjustment from acquisition of business | 2 | — | |||||
Net cash used for investing activities of continuing operations | (48 | ) | (41 | ) | |||
Net cash provided by investing activities of discontinued operations | — | 6 | |||||
Net cash used for investing activities | (48 | ) | (35 | ) | |||
Financing Activities | |||||||
Issuance of common stock | 4 | 3 | |||||
Repurchase of common stock | (62 | ) | (25 | ) | |||
Repurchases of common stock to satisfy employee tax withholding obligations | (7 | ) | (3 | ) | |||
Net cash used for financing activities of continuing operations | (65 | ) | (25 | ) | |||
Effect of exchange rate changes on cash from continuing operations | (5 | ) | 4 | ||||
Net decrease in cash and cash equivalents from continuing operations | (134 | ) | (91 | ) | |||
Net increase in cash and cash equivalents from discontinued operations | 1 | 5 | |||||
Net decrease in cash and cash equivalents | (133 | ) | (86 | ) | |||
Cash and cash equivalents at beginning of period | 394 | 427 | |||||
Cash and cash equivalents at end of period | $ | 261 | $ | 341 | |||
Supplemental Cash Flow Disclosures: | |||||||
Interest paid, net of capitalized interest | $ | 12 | $ | 35 | |||
Income taxes paid, net of refunds received | 2 | 2 | |||||
Noncash Investing and Financing Activities: | |||||||
Amount in accounts payable for capital expenditures | 13 | 9 | |||||
6
USG CORPORATION
NOTES TO CONDENSED CONSOLIDATED FINANCIAL STATEMENTS
(Unaudited)
In the following Notes to Condensed Consolidated Financial Statements, “USG,” “we,” “our” and “us” refer to USG Corporation, a Delaware corporation, and its subsidiaries included in the condensed consolidated financial statements, except as otherwise indicated or as the context otherwise requires.
1. | Organization, Consolidation and Presentation of Financial Statements |
PREPARATION OF FINANCIAL STATEMENTS
We prepared the accompanying unaudited condensed consolidated financial statements of USG Corporation in accordance with applicable United States Securities and Exchange Commission, or SEC, guidelines pertaining to interim financial information. The preparation of financial statements in conformity with accounting principles generally accepted in the United States of America requires management to make estimates and assumptions that affect the reported amounts of assets, liabilities, revenues and expenses. Actual results could differ materially from those estimates. In the opinion of our management, the financial statements reflect all adjustments, which are of a normal recurring nature, necessary for a fair presentation of our financial results for the interim periods. The results of operations for the three months ended March 31, 2018 are not necessarily indicative of the results of operations to be expected for the entire year.
SEGMENTS
Our reportable segments are determined considering both qualitative and quantitative metrics for aggregation of the product type within geographies for which discrete financial information is available. We have five reportable segments: U.S. Wallboard and Surfaces, U.S. Performance Materials, U.S. Ceilings, Canada, and USG Boral Building Products, or UBBP. Our U.S. Wallboard and Surfaces, U.S. Performance Materials and U.S. Ceilings reportable segments are identified based on products manufactured and marketed. Our Canada segment is a separately reportable segment, as while it has similar qualitative factors to U.S. operations, it has different quantitative metrics and, therefore, cannot be aggregated. Our operating segments in Mexico and Latin America are included in Other as reconciling items to our consolidated segments. This segment structure was effective for the quarter ended December 31, 2017. Our prior period results have been recast to reflect these changes and present comparative year over year information by segment. See Note 4, Segments.
These condensed consolidated financial statements and notes are to be read in conjunction with the financial statements and notes included in USG’s Annual Report on Form 10-K for the fiscal year ended December 31, 2017, which we filed with the SEC on February 14, 2018.
RECENTLY ADOPTED ACCOUNTING PRONOUNCEMENTS
We adopted Accounting Standard Update, or ASU, 2018-02, "Income Statement - Reporting Comprehensive Income (Topic 220): Reclassification of Certain Tax Effects from Accumulated Other Comprehensive Income," in the first quarter of 2018. The ASU allows for the reclassification of stranded tax effects on items resulting from the Tax Cuts and Jobs Act, or the 2017 Tax Act, from accumulated other comprehensive income, or AOCI, to retained earnings. Tax effects unrelated to the 2017 Tax Act are released from AOCI using either the specific identification approach or the portfolio approach based on the nature of the underlying item. We elected not to reclassify the income tax effects of the 2017 Tax Act.
We adopted ASU 2017-07, “Compensation - Retirement Benefits (Topic 715): Improving the Presentation of Net Periodic Pension Cost and Net Periodic Postretirement Benefit Cost,” on January 1, 2018 using the practical expedient. This ASU required us to disaggregate and present current service cost along with other current compensation costs for employees while presenting other net benefit cost components below operating profit. In addition, only the service cost component of net benefit cost is eligible for capitalization in our inventory and fixed assets. We retrospectively adopted the presentation of service cost and prospectively adopted the capitalization of only service cost into inventory and fixed assets.
7
The effect of the adoption of ASU 2017-07 on our condensed consolidated statements of income for the three months ended March 31, 2017 was as follows.
(millions) | Three months ended March 31, 2017 | ||||||||||
As Restated | Adjustment for Adoption of ASU 2017-07 | As Previously Reported | |||||||||
Gross profit | $ | 159 | $ | (5 | ) | $ | 164 | ||||
Operating profit | 84 | (7 | ) | 91 | |||||||
Other income, net | 6 | 7 | (1 | ) | |||||||
Net income | 55 | — | 55 | ||||||||
We adopted ASU 2014-09, “Revenue from Contracts with Customers (Topic 606),” and all related amendments on January 1, 2018 using the modified retrospective method using practical expedients. Topic 606 supersedes the revenue recognition requirements in "Revenue Recognition (Topic 605)" and requires entities to recognize revenue to depict the transfer of promised goods or services to customers in an amount that reflects the consideration to which the entity expects to be entitled in exchange for those goods or services.
Upon adoption, we recorded an increase of $2 million to our opening balance of retained earnings for the cumulative effect of adopting Topic 606. The adjustment related to a change to the point in time at which we record revenue for most customers. Prior period amounts have not been restated and continue to be reported under the legacy accounting guidance of Topic 605. As of and for the three months ended March 31, 2018, the impact of applying Topic 606 as compared to applying Topic 605 is immaterial to our financial statements.
In addition to our cumulative effect adjustment, our adoption of Topic 606 resulted in additional quantitative disclosure of revenue by product and in the modification of certain significant accounting policies. See Note 4, Segments, for our revenue disaggregated by product and the revised polices below.
Revenue Recognition
We recognize revenue upon transfer of control of our products to the customer which generally occurs upon shipment. We enter into agreements with customers to offer rebates, generally based on achievement of specified sales levels and various marketing allowances that are common industry practice. Reductions to revenue for customer programs and incentive offerings, including promotions and other volume-based incentives, are estimated using the most likely amount method and recorded in the period in which the sale occurs. Provisions for early payment discounts are accrued in the same period in which the sale occurs. We do not have any material payment terms as payment is received shortly after the point of sale. We pay commissions to third parties to obtain contracts. As these contracts are less than one year, these costs are expensed as incurred.
Shipping and Handling Costs
We include shipping and handling costs billed to customers in net sales. We account for related costs as fulfillment activities and present the costs in cost of products sold when control of our products transfers to the customer.
RECENTLY ISSUED ACCOUNTING PRONOUNCEMENTS
In February 2016, the FASB issued ASU 2016-02, “Leases (Topic 842),” which supersedes existing lease guidance to require lessees to recognize assets and liabilities on the balance sheet for the rights and obligations created by long-term leases and to disclose additional quantitative and qualitative information about leasing arrangements. Subsequently, the FASB has issued various ASUs to provide further clarification around certain aspects of Topic 842. We will adopt the new standard on January 1, 2019 using the modified retrospective approach. As a result of the new standard, we will implement a new lease accounting system, new processes and accounting policies. Further, we anticipate the adoption of ASU 2016-02 will have a significant impact to our condensed consolidated balance sheets and disclosures. We are currently finalizing our accounting policies and verifying the completeness of our lease population and, thus, we are unable to quantify the financial statement impact at this time.
8
2. Acquisitions and Dispositions
Acquisition of Ceilings Plus
On November 30, 2017, we completed our acquisition of Ceilings Plus for $50 million, net of a working capital adjustment received in the first quarter of 2018. The addition of Ceilings Plus to our U.S. Ceilings segment expands our operations in the specialty ceilings markets. The preliminary fair value of tangible assets acquired, less liabilities assumed, in connection with the Ceilings Plus acquisition was $18 million. The preliminary fair value of intangible assets acquired, which included customer relationships and trade names, totaled $20 million. The resulting preliminary goodwill recorded was $12 million and all is expected to be deductible for tax purposes. The goodwill resulting from this acquisition consists largely of the company’s expected future product sales and synergies with the existing U.S. Ceilings product offerings. The primary area of the preliminary purchase price allocation remaining to be valued is the fair value of acquired contracts. We will complete the fair value assessment within the one year measurement period.
Discontinued Operations
On October 31, 2016, we completed the sale of our L&W Supply, or L&W, distribution business to ABC Supply. Upon the close of the sale, we entered into a supply agreement with L&W, and for the three months ended March 31, 2018 and 2017, we recorded sales of $95 million and $131 million, respectively, and cash inflows related to payments on trade receivables during those same periods of $104 million and $109 million, respectively.
3. Equity Method Investments
Equity method investments as of March 31, 2018 and December 31, 2017, were as follows:
March 31, 2018 | December 31, 2017 | |||||||||||
(dollars in millions) | Carrying Value | Ownership Percentage | Carrying Value | Ownership Percentage | ||||||||
USG Boral Building Products | $ | 692 | 50% | $ | 679 | 50% | ||||||
Other equity method investments | 7 | 33% - 50% | 7 | 33% - 50% | ||||||||
Total equity method investments | $ | 699 | $ | 686 | ||||||||
Investment in USG Boral Building Products
UBBP is our 50/50 joint ventures with Boral Limited, or Boral. We account for our investment in UBBP using the equity method of accounting. As of March 31, 2018, the amount of our consolidated retained earnings which represents undistributed earnings from UBBP is $70 million.
In the event certain U.S. Dollar denominated performance targets are satisfied by UBBP, we will be obligated to pay Boral an earnout payment of up to $50 million based on performance through 2019. We have not recorded a liability for this earnout payment as we have concluded that it is currently not probable that the five-year performance target will be achieved. If our conclusion on the probability of achievement changes, we will record a liability representing the present value of the earnout payment with a corresponding increase to our investment.
Our underlying net assets in our investments are denominated in a foreign currency, and translation gains or losses will impact the recorded value of our investments. Translation gains or losses recorded in other comprehensive income were as follows:
Three months ended March 31, | ||||||||
(millions) | 2018 | 2017 | ||||||
Translation gain | $ | 3 | $ | 24 | ||||
9
Summarized financial information for UBBP is as follows:
Three months ended March 31, | ||||||||
(millions) | 2018 | 2017 | ||||||
USG Boral Building Products | ||||||||
Net sales | $ | 287 | $ | 276 | ||||
Gross profit | 79 | 86 | ||||||
Operating profit | 28 | 35 | ||||||
Income from continuing operations before income taxes | 32 | 38 | ||||||
Net income | 20 | 26 | ||||||
Net income attributable to USG Boral Building Products | 19 | 25 | ||||||
USG share of income from investment accounted for using the equity method | 9 | 13 | ||||||
TRANSACTIONS WITH UBBP
Our U.S. Wallboard and Surfaces and U.S. Performance Materials segments sell products to UBBP. Total sales to UBBP for the three months ended March 31, 2018 and 2017 were immaterial.
In 2014, in connection with the formation of UBBP, we contributed our ownership interest in a joint venture in China to UBBP, but retained our loan receivable from this joint venture. As of March 31, 2018 and December 31, 2017, the loan receivable, including interest, totaled $13 million and is included in "Other assets" on our accompanying condensed consolidated balance sheets.
4. Segments
During the fourth quarter of 2017, as part of the realignment of our operating structure, we changed the composition of our reportable segments, effective for the quarter ended December 31, 2017. See Note 1, Organization, Consolidation and Presentation of Financial Statements, for additional information regarding our five reportable segments. See Note 3 for segment results for UBBP. Segment results for our U.S. Wallboard and Surfaces, U.S. Performance Materials, U.S. Ceilings and Canada segments were as follows:
Three months ended March 31, | ||||||||
(millions) | 2018 | 2017 | ||||||
Net Sales: | ||||||||
U.S. Wallboard and Surfaces | $ | 441 | $ | 469 | ||||
U.S. Performance Materials | 92 | 86 | ||||||
U.S. Ceilings | 138 | 112 | ||||||
Canada | 111 | 96 | ||||||
Other | 60 | 56 | ||||||
Eliminations | (56 | ) | (52 | ) | ||||
Total | $ | 786 | $ | 767 | ||||
Operating Profit (Loss): | ||||||||
U.S. Wallboard and Surfaces | $ | 49 | $ | 79 | ||||
U.S. Performance Materials | 1 | 6 | ||||||
U.S. Ceilings | 19 | 20 | ||||||
Canada | 2 | 2 | ||||||
Other | 4 | 1 | ||||||
Corporate | (29 | ) | (24 | ) | ||||
Total | $ | 46 | $ | 84 | ||||
10
Net sales disaggregated by product type were as follows:
Three months ended March 31, 2018 | |||||||||||||||||||||||
(millions) | U.S. Wallboard and Surfaces | U.S. Performance Materials | U.S. Ceilings | Canada | Other | Total | |||||||||||||||||
Wallboard | $ | 220 | $ | — | $ | — | $ | 63 | $ | 18 | $ | 301 | |||||||||||
Surfaces and industrial products | 145 | — | — | 23 | 7 | 175 | |||||||||||||||||
Underlayment | — | 65 | — | 2 | 9 | 76 | |||||||||||||||||
Building envelope and structural | — | 18 | — | — | — | 18 | |||||||||||||||||
Ceiling tile and grid | — | — | 116 | 12 | 9 | 137 | |||||||||||||||||
Specialty ceilings | — | — | 16 | 2 | — | 18 | |||||||||||||||||
Other products | 24 | — | — | 3 | 16 | 43 | |||||||||||||||||
Total product sales | 389 | 83 | 132 | 105 | 59 | 768 | |||||||||||||||||
Other miscellaneous sales (a) | 52 | 9 | 6 | 6 | 1 | 74 | |||||||||||||||||
Total sales before eliminations | 441 | 92 | 138 | 111 | 60 | 842 | |||||||||||||||||
Eliminations | (31 | ) | (6 | ) | (12 | ) | (7 | ) | — | (56 | ) | ||||||||||||
Total net sales | $ | 410 | $ | 86 | $ | 126 | $ | 104 | $ | 60 | $ | 786 | |||||||||||
(a) | Other miscellaneous sales primarily includes shipping and handling costs billed to customers. |
5. | Marketable Securities |
Marketable securities are classified as available-for-sale securities and reported at fair value, with unrealized gains and losses excluded from earnings and reported in AOCI on our accompanying condensed consolidated balance sheets.
Our investments in marketable securities consisted of the following:
As of March 31, 2018 | As of December 31, 2017 | ||||||||||||||
(millions) | Amortized Cost | Fair Value | Amortized Cost | Fair Value | |||||||||||
Corporate debt securities | $ | 67 | $ | 67 | $ | 68 | $ | 68 | |||||||
U.S. government and agency debt securities | 4 | 4 | 6 | 6 | |||||||||||
Asset-backed debt securities | 13 | 13 | 11 | 11 | |||||||||||
Certificates of deposit | 11 | 11 | 13 | 13 | |||||||||||
Municipal debt securities | — | — | 1 | 1 | |||||||||||
Total marketable securities | $ | 95 | $ | 95 | $ | 99 | $ | 99 | |||||||
The realized and unrealized gains and losses for the three months ended March 31, 2018 and 2017 were immaterial. Cost basis for securities sold are determined on a first-in-first-out basis.
Contractual maturities of marketable securities as of March 31, 2018 were as follows:
(millions) | Amortized Cost | Fair Value | |||||
Due in 1 year or less | $ | 62 | $ | 62 | |||
Due in 1-5 years | 33 | 33 | |||||
Total marketable securities | $ | 95 | $ | 95 | |||
Actual maturities may differ from the contractual maturities because issuers of the securities may have the right to prepay them.
11
6. Debt
Total debt consisted of the following:
(millions) | March 31, 2018 | December 31, 2017 | |||||
4.875% senior notes due 2027 | $ | 500 | $ | 500 | |||
5.5% senior notes due 2025 | 350 | 350 | |||||
Industrial revenue bonds (due 2028 through 2034) | 239 | 239 | |||||
Total | 1,089 | 1,089 | |||||
Less: Unamortized debt issuance costs | 11 | 11 | |||||
Total | $ | 1,078 | $ | 1,078 | |||
CREDIT FACILITY
Our credit facility agreement has a maximum borrowing limit of $220 million and requires us to maintain a minimum fixed charge coverage ratio in the event excess availability falls below a minimum threshold. Our excess borrowing availability as of March 31, 2018 of $192 million exceeds this threshold, thus the requirement to maintain the minimum fixed charge coverage ratio is not applicable. As of March 31, 2018, we were in compliance with the covenants contained in our credit facility.
As of March 31, 2018 and during the quarter then-ended, there were no borrowings under the facility. Outstanding letters of credit totaled $28 million as of March 31, 2018.
OTHER INFORMATION
(millions) | March 31, 2018 | December 31, 2017 | |||||
Fair value of debt | $ | 1,111 | $ | 1,134 | |||
Accrued interest | 13 | 12 | |||||
The fair values of our debt were determined utilizing unadjusted prices from independent pricing services and are classified as Level 2. See Note 8, Fair Value Measurements, for further discussion on fair value measurements. The vendors’ methodologies utilize various forms of market data, including but not limited to, trade data, yield, spreads, bids and offers. We review the values provided by the independent pricing service for reasonableness by comparing the valuations received from the independent pricing service to valuations from at least one other observable source.
12
7. | Derivative Instruments |
We use derivative instruments to manage selected commodity price and foreign currency exposures as described below. We do not use derivative instruments for speculative trading purposes, and we typically do not hedge beyond five years. Cash flows from derivative instruments are included in operating activities in our condensed consolidated statements of cash flows. Gains and losses on contracts designated as cash flow hedges are reclassified into earnings when the underlying forecasted transactions affect earnings. For contracts designated as cash flow hedges, we reassess the probability of the underlying forecasted transactions occurring on a quarterly basis.
Derivative Instruments | Type | Hedged Item | Aggregate Notional Amount | Contracts Maturing Through |
Commodity | Natural gas swaps | Purchases of natural gas | 40 million mmBTUs* | December 31, 2022 |
Foreign Exchange | Forward contracts | Purchases of products and services denominated in a foreign currency | $107 million | December 31, 2019 |
Foreign Exchange | Forward contracts | Intercompany Loan | $16 million | April 27, 2018 |
* - millions of British Thermal Units
COUNTERPARTY RISK, MASTER NETTING ARRANGEMENTS AND BALANCE SHEET OFFSETTING
We are exposed to credit losses in the event of nonperformance by the counterparties to our derivative instruments. As of March 31, 2018, our derivatives were in a $15 million net liability position. All of our counterparties have investment grade credit ratings; accordingly, we anticipate that they will be able to fully satisfy their obligations under the contracts.
All of our derivative contracts are governed by master netting agreements negotiated between us and the counterparties that reduce our counterparty credit exposure. The agreements outline the conditions (such as credit ratings and net derivative fair values) upon which we, or the counterparties, are required to post collateral. As required by certain of our agreements, we had $14 million of collateral posted with our counterparties related to our derivatives as of March 31, 2018. Amounts paid as cash collateral are included in "Receivables" on our accompanying condensed consolidated balance sheets.
We have not adopted an accounting policy to offset fair value amounts related to derivative contracts under our master netting arrangements; therefore, individual derivative contracts are reflected on a gross basis, as either assets or liabilities, on our accompanying condensed consolidated balance sheets, based on their fair value as of the balance sheet date.
FINANCIAL STATEMENT INFORMATION
The following are the pre-tax effects of derivative instruments on the condensed consolidated statements of income and condensed consolidated statements of comprehensive income for the three months ended March 31, 2018 and 2017.
Amount of Gain or (Loss) Recognized in Other Comprehensive Income on Derivatives (Effective Portion) | Location of Gain or (Loss) Reclassified from AOCI into Income (Effective Portion) | Amount of Gain or (Loss) Reclassified from AOCI into Income (Effective Portion) | |||||||||||||||
(millions) | 2018 | 2017 | 2018 | 2017 | |||||||||||||
Derivatives in Cash Flow Hedging Relationships | |||||||||||||||||
Commodity contracts | $ | (3 | ) | $ | (9 | ) | Cost of products sold | $ | — | $ | — | ||||||
Foreign exchange contracts | 3 | — | Cost of products sold | — | — | ||||||||||||
Total | $ | — | $ | (9 | ) | $ | — | $ | — | ||||||||
Location of Gain or (Loss) Recognized in Income on Derivatives | Amount of Gain or (Loss) Recognized in Income on Derivatives | |||||||||
(millions) | 2018 | 2017 | ||||||||
Derivatives Not Designated as Hedging Instruments | ||||||||||
Commodity contracts | Cost of products sold | $ | — | $ | (1 | ) | ||||
Total | $ | — | $ | (1 | ) | |||||
For both commodity contracts and foreign exchange contracts, no ineffectiveness was recorded in the three months ended March 31, 2018 and 2017.
13
The following are the fair values of derivative instruments and the location on our accompanying condensed consolidated balance sheets and our condensed consolidated statements of comprehensive income as of March 31, 2018 and December 31, 2017.
Balance Sheet Location | Fair Value | Balance Sheet Location | Fair Value | ||||||||||||||
(millions) | 3/31/18 | 12/31/17 | 3/31/18 | 12/31/17 | |||||||||||||
Derivatives in Cash Flow Hedging Relationships | |||||||||||||||||
Commodity contracts | Other current assets | $ | 1 | $ | 1 | Accrued expenses | $ | 7 | $ | 6 | |||||||
Commodity contracts | Other assets | 1 | 1 | Other liabilities | 11 | 8 | |||||||||||
Foreign exchange contracts | Other current assets | 1 | — | Accrued expenses | 1 | 3 | |||||||||||
Foreign exchange contracts | Other assets | 1 | — | Other liabilities | — | — | |||||||||||
Total derivatives in cash flow hedging relationships | $ | 4 | $ | 2 | $ | 19 | $ | 17 | |||||||||
Derivatives Not Designated as Hedging Instruments | |||||||||||||||||
Commodity contracts | Other current assets | $ | — | $ | — | Accrued expenses | $ | — | $ | — | |||||||
Total derivatives not designated as hedging instruments | $ | — | $ | — | $ | — | $ | — | |||||||||
Total derivatives | Total assets | $ | 4 | $ | 2 | Total liabilities | $ | 19 | $ | 17 | |||||||
As of March 31, 2018, we had no derivatives designated as fair value hedges or net investment hedges.
8. Fair Value Measurements
Certain assets and liabilities are required to be recorded at fair value. There are three levels of inputs that may be used to measure fair value which are described below along with how USG derives fair value.
Level | Definition | USG Valuation Method |
Level 1 | Quoted prices for identical assets and liabilities in active markets | Cash equivalents and equity mutual funds consist of money market funds that are valued based on quoted prices in active markets. |
Level 2 | Quoted prices for similar assets and liabilities in active markets; quoted prices for identical or similar assets and liabilities in markets that are not active; and model-derived valuations in which all significant inputs and significant value drivers are observable in active markets | Marketable securities, including certain cash equivalents, are valued using a "market value" approach. Values are based on quoted prices and other observable market inputs received from data providers. |
Derivatives are valued using the "income" approach such as discounted-cash-flow models and readily observable market data. The inputs for the valuation models are obtained from data providers and include end-of-period spot and forward natural gas prices, foreign currency exchange rates, natural gas price volatility and LIBOR and swap rates for discounting the cash flows implied from the derivative contracts. | ||
Level 3 | Valuations derived from valuation techniques in which one or more significant inputs or significant value drivers are unobservable | No level 3 investments. |
Our assets and liabilities measured at fair value on a recurring basis were as follows:
Level 1 | Level 2 | Level 3 | Total | ||||||||||||||||||||||||||||
(millions) | 3/31/18 | 12/31/17 | 3/31/18 | 12/31/17 | 3/31/18 | 12/31/17 | 3/31/18 | 12/31/17 | |||||||||||||||||||||||
Cash equivalents | $ | 3 | $ | 124 | $ | 37 | $ | 24 | $ | — | $ | — | $ | 40 | $ | 148 | |||||||||||||||
Equity mutual funds | 6 | 6 | — | — | — | — | 6 | 6 | |||||||||||||||||||||||
Marketable securities: | |||||||||||||||||||||||||||||||
Corporate debt securities | — | — | 67 | 68 | — | — | 67 | 68 | |||||||||||||||||||||||
U.S. government and agency debt securities | — | — | 4 | 6 | — | — | 4 | 6 | |||||||||||||||||||||||
Asset-backed debt securities | — | — | 13 | 11 | — | — | 13 | 11 | |||||||||||||||||||||||
Certificates of deposit | — | — | 11 | 13 | — | — | 11 | 13 | |||||||||||||||||||||||
Municipal debt securities | — | — | — | 1 | — | — | — | 1 | |||||||||||||||||||||||
Derivative assets | — | — | 4 | 2 | — | — | 4 | 2 | |||||||||||||||||||||||
Derivative liabilities | — | — | (19 | ) | (17 | ) | — | — | (19 | ) | (17 | ) | |||||||||||||||||||
14
9. Employee Retirement Plans
The components of net pension and postretirement benefit costs are summarized in the following table:
Three months ended March 31, | ||||||||
(millions) | 2018 | 2017 | ||||||
Pension: | ||||||||
Service cost of benefits earned | $ | 12 | $ | 10 | ||||
Interest cost on projected benefit obligation | 16 | 16 | ||||||
Expected return on plan assets | (24 | ) | (23 | ) | ||||
Net amortization | 8 | 5 | ||||||
Net pension cost | $ | 12 | $ | 8 | ||||
Postretirement: | ||||||||
Service cost of benefits earned | $ | 1 | $ | 1 | ||||
Interest cost on projected benefit obligation | 1 | 1 | ||||||
Net amortization | (6 | ) | (6 | ) | ||||
Net postretirement benefit | $ | (4 | ) | $ | (4 | ) | ||
Service cost of benefits earned is included in "Costs of products sold" and "Selling and administrative expenses" on our condensed consolidated statements of income. The other components of net pension and postretirement costs are included in "Other income, net".
During the first three months of 2018, we made cash contributions of $1 million to our domestic supplemental pension plan and $1 million to our pension plans in Canada. We expect to make total contributions to our pension plans in 2018 of approximately $60 million.
10. Share-Based Compensation
During the first three months of 2018, we granted share-based compensation in the form of market share units, or MSUs, performance shares, and restricted stock units, or RSUs, to eligible participants under our 2016 Long-Term Incentive Plan. We recognize expense on all share-based grants over the service period, which is the shorter of the period until the employees’ retirement eligibility dates and the service period of the award for awards expected to vest. We record forfeitures as they occur. Awards granted during the first three months of 2018, weighted average fair value, and assumptions used to determine fair value were as follows:
MSUs | Performance Shares | RSUs | |||||||||
Awards granted | 427,664 | 103,819 | 26,000 | ||||||||
Weighted average fair value (a) | $ | 34.22 | $ | 34.21 | $ | 33.88 | |||||
Expected volatility (b) | 32.62 | % | 32.61 | % | N/A | ||||||
Risk-free rate (c) | 2.37 | % | 2.37 | % | N/A | ||||||
Expected term (in years) (d) | 2.95 | 2.95 | N/A | ||||||||
Expected dividends | — | — | N/A | ||||||||
(a) | Fair value of MSUs and Performance Shares is estimated on the date of grant using the Monte Carlo simulation utilizing the assumptions outlined above. Fair value of RSUs is equal to the closing price of our common stock on the date of grant. |
(b) | The expected volatility rate is based on stock price history immediately prior to grant for a period commensurate with the expected term. |
(c) | The risk-free rate is based on zero coupon U.S. government issues at the time of grant. |
(d) | The expected term represents the period from the valuation date to the end of the performance period. |
15
Terms of the awards granted during the first three months of 2018 were as follows:
MSUs | Performance Shares | RSUs | |
Maximum shares/units earned | Varies from 0% to 150% of the number of MSUs awarded depending on the actual performance of our stock price | Varies from 0% to 200% of the number of performance shares awarded depending on the performance of our total stockholder return relative to the performance of the Dow Jones U.S. Construction and Materials Index (a) | 100% |
Vesting Provisions | Three-year performance period | Three-year performance period | Specified number of years from the grant date |
Vesting in the case of termination of employment due to death, disability, retirement or change in control during performance period (b) | Pro-rated based on the number of full months employed in 2018 with awards issued at the end of the three-year period | Pro-rated based on the number of full months employed during the performance period with awards issued at the end of the three-year period | Varies |
Settlement | Settled in common stock at the end of the performance or vesting period | ||
(a) | Adjustments to the performance of the Dow Jones U.S. Construction and Materials Index may be made to reflect changes in the companies included in the index during the performance period. |
(b) | Early vesting for MSUs, performance shares and RSUs in situations where there is a change in control also requires a related loss of employment or diminution of duties in certain circumstances. |
OTHER
MSUs, performance shares, RSUs, and stock options that were not included in the computation of diluted earnings per share for those periods because their inclusion would be anti-dilutive were as follows:
Three months ended March 31, | ||||||
(millions) | 2018 | 2017 | ||||
MSUs, performance shares, RSUs and stock options | — | 1.0 | ||||
11. Supplemental Balance Sheet Information
INVENTORIES
Total inventories consisted of the following:
(millions) | March 31, 2018 | December 31, 2017 | |||||
Finished goods | $ | 145 | $ | 140 | |||
Work in progress | 40 | 39 | |||||
Raw materials | 70 | 73 | |||||
Total | $ | 255 | $ | 252 | |||
ACCRUED EXPENSES
Accrued expenses consisted of the following:
(millions) | March 31, 2018 | December 31, 2017 | |||||
Self-insurance reserves | $ | 14 | $ | 12 | |||
Employee compensation | 13 | 17 | |||||
Interest | 13 | 12 | |||||
Derivatives | 8 | 9 | |||||
Pension and other postretirement benefits | 17 | 17 | |||||
Environmental | 16 | 17 | |||||
Other | 50 | 51 | |||||
Total | $ | 131 | $ | 135 | |||
16
ASSET RETIREMENT OBLIGATIONS
Changes in the liability for asset retirement obligations, which are included in "Other liabilities" on our condensed consolidated balance sheets, consisted of the following:
Three months ended March 31, | |||||||
(millions) | 2018 | 2017 | |||||
Balance as of January 1 | $ | 118 | $ | 113 | |||
Accretion expense | 2 | 1 | |||||
Foreign currency translation | (1 | ) | — | ||||
Balance as of March 31 | $ | 119 | $ | 114 | |||
12. Stockholders' Equity
TREASURY STOCK
Changes in treasury stock for the three months ended March 31, 2018 and 2017 were as follows:
2018 | 2017 | ||||||||||||
(millions, except share data) | Treasury Shares (000) | Treasury Stock | Treasury Shares (000) | Treasury Stock | |||||||||
Balance as of January 1 | (5,571 | ) | $ | (169 | ) | — | $ | — | |||||
Repurchase of common stock for tax withholdings related to stock-based compensation | (204 | ) | (7 | ) | (107 | ) | (3 | ) | |||||
Repurchase of common stock under share repurchase program | (1,812 | ) | (62 | ) | (764 | ) | (25 | ) | |||||
Stock reissuances | 740 | 26 | 150 | 4 | |||||||||
Balance as of March 31 | (6,847 | ) | $ | (212 | ) | (721 | ) | $ | (24 | ) | |||
ACCUMULATED OTHER COMPREHENSIVE INCOME (LOSS)
Changes in the balances of each component of AOCI for the three months ended March 31, 2018 and 2017 were as follows:
Derivatives | Defined Benefit Plans | Foreign Currency Translation | AOCI | ||||||||||||||||||||||||||||
(millions) | 2018 | 2017 | 2018 | 2017 | 2018 | 2017 | 2018 | 2017 | |||||||||||||||||||||||
Balance as of January 1 | $ | 16 | $ | 27 | $ | (297 | ) | $ | (246 | ) | $ | (108 | ) | $ | (166 | ) | $ | (389 | ) | $ | (385 | ) | |||||||||
Other comprehensive income (loss) before reclassifications, net of tax | — | (6 | ) | 2 | (1 | ) | 12 | 40 | 14 | 33 | |||||||||||||||||||||
Less: Amounts reclassified from AOCI, net of tax | — | — | (1 | ) | — | — | — | (1 | ) | — | |||||||||||||||||||||
Net other comprehensive income (loss) | — | (6 | ) | 3 | (1 | ) | 12 | 40 | 15 | 33 | |||||||||||||||||||||
Balance as of March 31 | $ | 16 | $ | 21 | $ | (294 | ) | $ | (247 | ) | $ | (96 | ) | $ | (126 | ) | $ | (374 | ) | $ | (352 | ) | |||||||||
Amounts reclassified from AOCI, net of tax, for the three months ended March 31, 2018 and 2017, were as follows:
Three months ended March 31, | ||||||||
(millions) | 2018 | 2017 | ||||||
Derivatives | ||||||||
Net reclassification from AOCI for cash flow hedges included in cost of products sold | $ | — | $ | — | ||||
Less: Income tax benefit on reclassification from AOCI included in income tax expense | — | — | ||||||
Net amount reclassified from AOCI | $ | — | $ | — | ||||
Defined Benefit Plans | ||||||||
Net reclassification in AOCI for amortization of prior service cost included in other income, net | (2 | ) | — | |||||
Less: Income tax benefit on reclassification from AOCI included in income tax expense | (1 | ) | — | |||||
Net amount reclassified from AOCI | $ | (1 | ) | $ | — | |||
We estimate that we will reclassify a net $4 million after-tax loss on derivatives from AOCI to earnings within the next 12 months.
17
13. Income Taxes
Due to the timing of the enactment and the complexity involved in applying the provisions of the 2017 Tax Act, we made reasonable estimates of the effects and recorded provisional amounts in our financial statements as of December 31, 2017. The provisional effect on deferred tax assets and liabilities of the change in tax rates was recognized in earnings in the period ended December 31, 2017, which was when the change was enacted. As part of the 2017 Tax Act's change to a quasi-territorial system, a transition tax was imposed on our accumulated foreign earnings, partially offset by foreign tax credits, which was also recognized in the period ended December 31, 2017. The 2017 Tax Act made significant changes to how foreign tax credits may be realized to offset future tax liabilities. Further clarity may change our anticipated realization of our foreign tax credits. In addition, we may make an election to forgo the use of net operating losses, or NOLs, to offset the impact of the transition tax as allowed under the 2017 Tax Act.
The estimate recorded as of December 31, 2017 continues to be our best estimate as of March 31, 2018. As we collect and prepare necessary data and interpret the 2017 Tax Act and any additional guidance issued by the U.S. Treasury Department, the IRS, and other standard-setting bodies, we may make adjustments to the provisional amounts.
Our income tax expense and effective tax rate for the three months ended March 31 were as follows:
Three months ended March 31, | ||||||||
(dollars in millions) | 2018 | 2017 | ||||||
Income tax expense | $ | 9 | $ | 29 | ||||
Effective tax rate | 20.0 | % | 34.5 | % | ||||
The income tax expense for all periods presented reflects taxes from federal, foreign, state and local jurisdictions. Our effective tax rates were lower than the U.S. statutory rate primarily because of earnings realized in countries that had lower statutory tax rates and our equity method income, which is presented net of tax. Our effective tax rate in the future will depend on, among other things, the portion of our profits earned within and outside the United States.
As of March 31, 2018, we had federal NOL carryforwards of approximately $458 million that are available to offset future federal taxable income and will expire in the years 2030 through 2032, none of which are currently subject to Internal Revenue Code limitations under Section 382. In addition, as of that date, we had federal alternative minimum tax credit carryforwards of approximately $19 million that are available to reduce future regular federal income taxes with the full benefit being realized by 2022 as described in the 2017 Tax Act. We have foreign tax credit carryforwards of $224 million that are available to offset future federal taxable income and expire in the years 2022 through 2027. In order to fully realize these U.S. federal net deferred tax assets, taxable income of approximately $1.617 billion would need to be generated during the period before their expiration based on our interpretation of the 2017 Tax Act.
As of March 31, 2018, we had a deferred tax asset of $169 million related to our state NOLs and tax credit carryforwards. The NOLs will expire if unused in years 2018 through 2034. To the extent that we do not generate sufficient state taxable income within the statutory carryforward periods to utilize the NOL and tax credit carryforwards in these states, they will expire unused.
As of March 31, 2018, the valuation allowance against our deferred tax assets was $175 million, which was unchanged from December 31, 2017.
The Internal Revenue Code imposes limitations on a corporation’s ability to utilize NOLs if it experiences an “ownership change” which can result from transactions increasing the ownership of certain stockholders in the stock of a corporation by more than 50 percentage points over a three-year period. If we were to experience an ownership change, utilization of our NOLs would be subject to an annual limitation that may be carried over to later years within the allowed NOL carryforward period. Over the entire carryforward period, we may not be able to use all our NOLs due to the aforementioned annual limitation. If an ownership change had occurred as of March 31, 2018, our annual U.S. federal NOL utilization would have been limited to approximately $123 million per year.
18
14. Litigation
WALLBOARD PRICING LAWSUITS
In 2015, USG, our subsidiary United States Gypsum Company, our former subsidiary L&W Supply Corporation, and seven other wallboard manufacturers were named as defendants in a lawsuit filed in federal court in California by twelve homebuilders alleging that since at least September 2011, U.S. wallboard manufacturers conspired to fix and raise the price of gypsum wallboard sold in the United States and to effectuate the alleged conspiracy by ending the practice of providing job quotes on wallboard. The lawsuit was transferred to the United States District Court for the Eastern District of Pennsylvania under the title In re: Domestic Drywall Antitrust Litigation, MDL No. 2437. In the second quarter of 2016, the Court dismissed with prejudice the portions of the homebuilders’ complaint alleging a conspiracy in 2014 and 2015, ruling that there were insufficient factual allegations to allow such a claim to go forward. The homebuilders' claims alleging a conspiracy prior to 2014 have not been dismissed, and the case proceeds as to those claims. USG has agreed to defend and indemnify L&W Supply Corporation with regard to this matter.
Beginning in the third quarter of 2013, class action lawsuits making similar allegations with regard to Canada were filed in Quebec, Ontario and British Columbia courts on behalf of purchasers of wallboard in Canada and naming USG, United States Gypsum Company, our Canadian subsidiary CGC Inc., or CGC, and other wallboard manufacturers as defendants.
We believe that the cost, if any, of resolving the homebuilders’ lawsuit and Canadian class action litigation will not have a material effect on our results of operations, financial position or cash flows.
ENVIRONMENTAL LITIGATION
We are involved in environmental cleanups of property that we own or have owned. In addition, we have previously been notified by state and federal environmental protection agencies of possible involvement as one of numerous “potentially responsible parties” in certain Superfund sites in the United States to pay for some part of the cleanup of hazardous waste. In most of these sites, our involvement is expected to be minimal. As of March 31, 2018 and December 31, 2017, we had accruals of $16 million and $17 million, respectively, for our probable and reasonably estimable liability in connection with these matters. Our accruals take into account all known or estimated undiscounted costs associated with these sites, including site investigations and feasibility costs, site cleanup and remediation, certain legal costs, and fines and penalties, if any. However, we continue to review these accruals as additional information becomes available and revise them as appropriate. Based on the information known to us, we believe these environmental matters will not have a material effect on our results of operations, financial position or cash flows.
15. Subsequent Events
In April 2018, we completed the sale of a surplus property with a gain of $13 million, or $9 million net of tax. The pre-tax gain will be recorded within our U.S. Wallboard and Surfaces segment. Additionally in April 2018, we entered into a definitive agreement to sell our 33% interest in a joint venture in South Africa for approximately $3 million. We will record a loss, net of tax, of $5 million on the sale. The loss is driven primarily by foreign currency losses included in equity that will be recognized upon disposition of the entity and will be recorded within Other in Note 4, Segments.
19
ITEM 2. MANAGEMENT’S DISCUSSION AND ANALYSIS OF FINANCIAL CONDITION AND RESULTS OF OPERATIONS
In the following Management’s Discussion and Analysis of Financial Condition and Results of Operations, “USG,” “we,” “our” and “us” refer to USG Corporation, a Delaware corporation, and its subsidiaries included in the condensed consolidated financial statements, except as otherwise indicated or as the context otherwise requires.
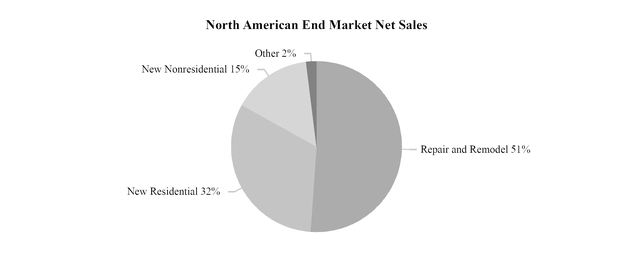
Overview
We are a leading manufacturer of building products and innovative building solutions. We produce a wide range of products for use in new residential, new nonresidential, and residential and nonresidential repair and remodel construction as well as products used in certain industrial processes. The following chart reflects our estimation of our North American net sales during the first three months of 2018.
SEGMENTS
During the fourth quarter of 2017, we realigned our organizational structure to reflect three divisions, in addition to UBBP: Gypsum, Performance Materials and Ceilings. As a result of our realigned operating structure, we changed the composition of our reportable segments effective for the quarter ended December 31, 2017 to align with how we manage our businesses, review operating performance and allocate resources considering the discrete information available for the geographies within those divisions. We now have five reportable segments: U.S. Wallboard and Surfaces, U.S. Performance Materials, U.S. Ceilings, Canada, and UBBP.
Gypsum: Our Gypsum division manufactures and markets gypsum wallboard and related products in the United States, Canada and Mexico. It is composed of our U.S. Wallboard and Surfaces segment, the gypsum operations of our Canada segment and our gypsum operations in Mexico, which are included in Other. Gypsum’s products are used in a variety of building applications to construct walls and ceilings of residential, nonresidential and institutional buildings, as well as in certain industrial applications. The major product lines within the Gypsum division are:
WALLBOARD | |
USG Sheetrock® brand gypsum wallboard and Securock® brand glass mat sheathing portfolios | Gypsum panels that provide aesthetic as well as sound-dampening, fire-retarding, abuse-resistance and moisture-control value |
SURFACES | |
USG Sheetrock® brand joint compound portfolio, as well as corner bead, joint tape, and plaster | Used for finishing wallboard joints |
Construction plaster products, sold under the brand names Red Top®, Imperial®, Diamond® and Supremo™ and industrial gypsum | Used to provide a custom finish for residential and nonresidential interiors and provide aesthetic, sound-dampening, fire-retarding and abuse-resistance value |
Performance Materials: Our Performance Materials division manufactures and markets a series of innovative products in the United States that provide solutions to our customers to help close the skilled labor gap and increase job site efficiency. It consists solely of our U.S. Performance Materials segment. Performance Materials products are used in a variety of interior and
20
exterior building applications of residential and nonresidential buildings throughout North America, as well as in certain industrial applications. These products can be grouped under three product categories of underlayment, building envelope and structural. The major products within these three categories are as follows:
UNDERLAYMENT | |
USG Durock® brand cement board | Provides water and fire-resistant assemblies for both interior and exterior applications |
Fiberock® brand backerboard | Includes abuse-resistant interior wall panels, tile backer boards, and flooring underlayments |
USG Durock™ brand shower systems | A fully bonded waterproofing system for tiled shower installations |
Levelrock® brand systems of poured gypsum flooring | Provides surface leveling, enhanced sound-dampening and fire-resistant performance for residential and nonresidential flooring applications |
BUILDING ENVELOPE | |
Securock® ExoAir® 430 air barrier system | Integrated gypsum sheathing panels with pre-applied fluid air barrier membrane that provides structural performance and moisture, mold and air control |
Securock® brand roof board portfolios | Roof boards for use in low-slope nonresidential roofing systems that provides moisture, mold and fire resistant value |
STRUCTURAL | |
USG Structural Panels | High-strength, reinforced factory made concrete panels for use in subfloor, roof deck, foundation walls and other noncombustible applications |
Ceilings: Our Ceilings division manufactures and markets interior ceilings systems products in the United States, Canada, and Mexico. It consists of our U.S. Ceilings segment, the ceilings operations of our Canada segment, and our ceilings operations in Mexico, which are included in Other. Ceilings products include ceiling tile, ceiling grid, and specialty ceilings used primarily in nonresidential applications. In the fourth quarter of 2017, we acquired Ceilings Plus, a leader in the specialty ceilings market. The major product lines within the Ceilings division are:
CEILING TILE | |
Radar™, Eclipse™, Mars™ and Halcyon™ | Provides qualities such as sound absorption, fire retardation and convenient access to the space above the ceiling for electrical and mechanical systems, air distribution and maintenance |
CEILING GRID | |
Donn®, DX®, Fineline®, Centricitee™ and Identitee® DXI™ | Provides qualities such as fire retardation and convenient access to the space above the ceiling for electrical and mechanical systems, air distribution and maintenance |
SPECIALTY CEILINGS | |
Curvatura™, Compasso®, Radians®, Illusions™, Multiples™, Runways™, Barz™, Planx™, Mirra™, Corniche™,Wallforms™ and Parti™ | Provides qualities such as aesthetics, sound absorption, fire retardation and convenient access to the space above the ceiling for electrical and mechanical systems, air distribution and maintenance |
ENSEMBLETM | |
Ensemble™ Ceilings System | Provides a monolithic drywall look with acoustical performance |
USG Boral Building Products: Our 50/50 joint ventures with Boral Limited, or Boral, are referred to as USG Boral Building Products, or UBBP. UBBP manufactures, distributes and sells certain building products, mines raw gypsum and sells natural and synthetic gypsum throughout Asia, Australasia and the Middle East. UBBP manufactures and distributes products for wall, ceiling, floor lining and exterior systems that utilize gypsum wallboard, referred to as plasterboard in the region in which UBBP operates, mineral fiber ceiling tiles, steel grid and joint compound.
21
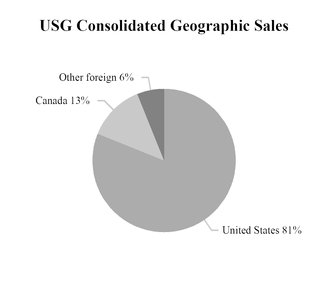
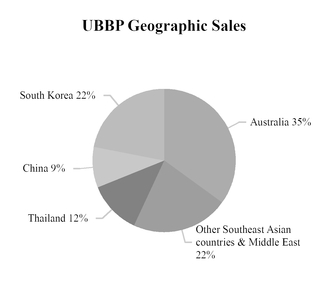
Geographic Information: For the first three months of 2018, we recorded $786 million of net sales in our condensed consolidated statements of income, and net sales for UBBP, which are not included in our condensed consolidated statements of income, were $287 million. The following charts reflect the geographic breakdown of net sales during the first three months of 2018.
MARKET CONDITIONS AND OUTLOOK
Our businesses are cyclical in nature and sensitive to changes in general economic conditions, including, in particular, conditions in the housing and construction-based markets in North America. Our business in the markets of Asia, Australasia, and the Middle East also significantly exposes us to the economic conditions in those areas. However, the UBBP joint ventures have helped diversify USG's overall exposure to changes in the North American economic conditions.
The following table summarizes the current market conditions and outlook for our primary end markets in North America.
End Market | Lead time | Metric | Source | Market Condition/Outlook |
New Residential | Installation of gypsum products(a) into a single family home typically follows a housing start by 90-120 days | Housing starts (seasonally adjusted) | U.S. Census Bureau | 3/31/2018 - 1.319 million Actual 2017 - 1.203 million |
Industry forecast (Blue Chip Economic Indicators) | 2018 - 1.25 million to 1.34 million (b) | |||
USG forecast | 2018 estimated - 1.25 million (c) | |||
New Nonresidential | Installation of gypsum(a) and ceilings products typically follows signing of construction contracts by about 12 to 18 months | Change in floor space for which contracts are signed | Dodge Data & Analytics | 2017 - 2% increase |
Industry forecast (Dodge Data & Analytics) (d) | 2018 - 3% increase | |||
USG forecast | 2018 estimated to increase by low to mid single digits | |||
Repair and Remodel (e) | Remodels typically begin within two years from purchase | Sales of existing homes (seasonally adjusted) | National Association of Realtors | 3/31/2018 - 5.60 million 3/31/2017 - 5.67 million Actual 2017 - 5.51 million |
Overall repair and remodel spending for gypsum products | USG forecast | 2018 spending estimated to increase by low to mid single digits | ||
(a) | Gypsum products include products manufactured and marketed by our U.S. Wallboard and Surfaces segment and Fiberock® brand gypsum fiber panels manufactured and marketed by our U.S. Performance Materials segment. |
(b) | Forecast based on the average of the bottom ten and top ten forecasts included in the report, respectively. |
(c) | USG estimate is based on the seasonally adjusted annual rate of housing starts. |
(d) | Dodge Data & Analytics' forecast includes several building types which do not generate significant demand for our products. |
(e) | The repair and remodel market includes renovation of both residential and nonresidential buildings. |
As indicated in the table above, we expect modest improvement in the U.S. construction markets over the next twelve months. However, while sales of our products in our U.S. Wallboard and Surfaces and U.S. Performance Materials segments have generally improved with the modest recovery in residential building, the segments continue to be adversely affected by the low level of residential and other construction activity compared to historical averages. The results of our U.S. Ceilings
22
segment, which primarily serves the nonresidential market, have shown some improvement over the longer term. However, the results also continue to be adversely affected by the low levels of new nonresidential construction activity as compared to historical averages. Our U.S. Ceilings segment is also adversely affected by changing construction preferences, such as the shift to open plenum and specialty ceilings. We acquired Ceilings Plus in 2017 to help address this trend.
We also expect modest improvement in the construction industry in Canada. Other international markets, including those that are within the UBBP territory, provide opportunities for our operations to serve the demand in these regions. Australia is expected to experience a decline in housing starts; however, these housing starts are expected to remain above the long-term average. The construction industry in South Korea has slowed, driven by increased government regulations. The construction industry in Thailand is showing slight improvement due to growth in the government infrastructure market. Several emerging markets which are within the UBBP territory are forecasted to experience growth. The international markets within the UBBP territory are beginning to adopt Western building practices, which provide more opportunities for our products. We anticipate that the performance of the UBBP joint ventures will partially offset some of the potential cyclicality in our North American businesses.
The following table summarizes the industry information on wallboard shipments and capacity.
U.S. Industry Information | Metric | Source | Market Condition/Outlook |
U.S. industry shipments of gypsum board (a) | Billion of square feet (bsf) | Gypsum Association | First three months 2018 - 5.8 bsf First three months 2017 - 6.0 bsf |
USG forecast | 2018 expected to increase low single digits from 25.7 bsf in 2017 | ||
U.S. wallboard capacity | Billion of square feet (bsf) | USG estimate | 1/1/2018 - 34.0 bsf |
U.S. industry capacity utilization rate | Annualized shipments as a percentage of industry capacity | USG estimate | First three months 2018 - 67% First three months 2017 - 71% |
(a) | Gypsum board include products manufactured and marketed by our U.S. Wallboard and Surfaces segment and Fiberock® brand gypsum fiber panels manufactured and marketed by our U.S. Performance Materials segment. |
Based on current industry trends and forecasts, demand for gypsum wallboard is expected to increase in 2018, but the magnitude of any increase will depend on the levels of housing starts and repair and remodel activity, among other factors. We project that the industry capacity utilization rate will increase modestly in 2018 compared to 2017.
We could experience pressure on gypsum wallboard selling prices and our gross margins at these levels of capacity utilization. Our U.S. Wallboard and Surfaces segment implemented a price increase for wallboard effective in January 2018. However, it is uncertain that we will be able to maintain the increase or obtain additional price increases in our selling prices. If we are unable to maintain our wallboard selling prices or implement additional price increases, our net sales, operating results and cash flows may be materially and adversely impacted.
CURRENCY IMPACT
Currency impact on consolidated and segment results has been derived by translating current period results at the quarter-to-date average foreign currency rates for the quarter ended March 31, 2017.
23
Consolidated Results of Operations
(dollars in millions, except per-share data) | 2018 | 2017 | $ Favorable (Unfavorable) | % Favorable (Unfavorable) | ||||||||||
Three months ended March 31: | ||||||||||||||
Net sales | $ | 786 | $ | 767 | $ | 19 | 2 | % | ||||||
Cost of products sold | 647 | 608 | (39 | ) | (6 | )% | ||||||||
Gross profit | 139 | 159 | (20 | ) | (13 | )% | ||||||||
Selling and administrative expenses | 93 | 75 | (18 | ) | (24 | )% | ||||||||
Operating profit | 46 | 84 | (38 | ) | (45 | )% | ||||||||
Income from equity method investments | 9 | 13 | (4 | ) | (31 | )% | ||||||||
Interest expense | (14 | ) | (20 | ) | 6 | 30 | % | |||||||
Interest income | 1 | 1 | — | — | % | |||||||||
Other income, net | 3 | 6 | (3 | ) | * | |||||||||
Income before continuing operations before income taxes | 45 | 84 | (39 | ) | (46 | )% | ||||||||
Income tax expense | (9 | ) | (29 | ) | 20 | 69 | % | |||||||
Income from continuing operations | 36 | 55 | (19 | ) | (35 | )% | ||||||||
Income from discontinued operations, net of tax | 1 | — | 1 | * | ||||||||||
Net income | $ | 37 | $ | 55 | $ | (18 | ) | (33 | )% | |||||
Diluted earnings per share - net income | $ | 0.25 | $ | 0.37 | $ | (0.12 | ) | (32 | )% | |||||
*not meaningful | ||||||||||||||
NET SALES
Consolidated net sales for the first quarter of 2018 increased $19 million, or 2%, compared with the first quarter of 2017, due to higher net sales for our U.S. Performance Materials, U.S. Ceilings and Canada segments driven by increased shipments and higher average selling prices, offset by lower net sales for our U.S. Wallboard and Surfaces segment as a result of lower volumes. On a consolidated basis for the comparative periods, we estimate that our net sales were impacted by a favorable foreign currency translation of $7 million.
GROSS PROFIT
Gross profit for the first quarter of 2018 decreased $20 million, or 13%, compared with the first quarter of 2017. Gross profit as a percentage of net sales was 17.7% for the first quarter of 2018, compared with 20.7% for the first quarter of 2017. The lower gross margin was driven primarily by increased costs per unit of products in our U.S. Wallboard and Surfaces, U.S. Performance Materials and U.S. Ceilings segments. Also contributing to the decrease in gross profit were costs incurred for the expansion of our Jacksonville and Delavan facilities offset by $3 million in savings driven by our Advanced Manufacturing initiatives.
SELLING AND ADMINISTRATIVE EXPENSES
Selling and administrative expenses totaled $93 million in the first quarter of 2018 compared to $75 million in the first quarter of 2017. As a percentage of net sales, selling and administrative expenses increased to 11.8% for the first quarter of 2018 from 9.8% for the first quarter of 2017. The increase reflected a $5 million charge for a legal judgment on a contract dispute from 2004, $4 million in costs associated with the integration of Ceilings Plus and our business unit realignment, and increased marketing and compensation expenses in support of our strategy.
INCOME FROM EQUITY METHOD INVESTMENTS
Income from equity method investments, primarily UBBP, in the first quarter of 2018 was $9 million, a decrease of $4 million, or 31%, from the first quarter of 2017. This reflected a decrease in income recorded by UBBP, due to lower margins in South Korea, Thailand and Indonesia partially offset by higher margins in Australia and China and higher selling and administrative expenses.
INTEREST EXPENSE
Interest expense was $14 million in the first quarter of 2018, down $6 million, or 30%, from the first quarter of 2017 reflecting lower interest rates on outstanding debt.
24
OTHER INCOME, NET
Other income, net, which consists primarily of the non-service cost components of our pension and postretirement plan benefits, was $3 million in the first quarter of 2018 as compared to $6 million for the first quarter of 2017. The decrease of $3 million primarily reflected an increase in the net amortization of unrecognized costs, which includes a credit related to our U.S. postretirement plan as a result of a subsidy provided to retirees eligible for Medicare. The subsidy will end December 31, 2019 at which time there will be no remaining credit to be amortized to the income statement.
INCOME TAX EXPENSE
We recorded income tax expense of $9 million in the first quarter of 2018 from federal, foreign, state and local jurisdictions reflecting an effective tax rate of 20%, compared to income tax expense of $29 million in the first quarter of 2017, reflecting an effective tax rate of 34.5%. The decline in the effective tax rate was primarily due to the federal rate reduction from 35% to 21% as part of the 2017 Tax Act.
Segment Results of Operations
Net sales and operating profit (loss) for our consolidated reportable segments were as follows:
Three months ended March 31, | ||||||||||||||
Favorable (Unfavorable) | ||||||||||||||
(millions) | 2018 | 2017 | $ | % | ||||||||||
Net sales | ||||||||||||||
U.S. Wallboard and Surfaces | $ | 441 | $ | 469 | $ | (28 | ) | (6 | )% | |||||
U.S. Performance Materials | 92 | 86 | 6 | 7 | % | |||||||||
U.S. Ceilings | 138 | 112 | 26 | 23 | % | |||||||||
Canada | 111 | 96 | 15 | 16 | % | |||||||||
Other | 60 | 56 | 4 | 7 | % | |||||||||
Eliminations | (56 | ) | (52 | ) | (4 | ) | (8 | )% | ||||||
Total | $ | 786 | $ | 767 | $ | 19 | 2 | % | ||||||
Operating profit (loss) | ||||||||||||||
U.S. Wallboard and Surfaces | $ | 49 | $ | 79 | $ | (30 | ) | (38 | )% | |||||
U.S. Performance Materials | 1 | 6 | (5 | ) | (83 | )% | ||||||||
U.S. Ceilings | 19 | 20 | (1 | ) | (5 | )% | ||||||||
Canada | 2 | 2 | — | — | % | |||||||||
Other | 4 | 1 | 3 | 300 | % | |||||||||
Corporate | (29 | ) | (24 | ) | (5 | ) | (21 | )% | ||||||
Total | $ | 46 | $ | 84 | $ | (38 | ) | (45 | )% | |||||
* Not meaningful | ||||||||||||||
U.S. Wallboard and Surfaces: Net sales in the first quarter of 2018 were $441 million, a decrease of $28 million, or 6%, compared with the first quarter of 2017. The decrease in net sales was due to the following:
Sales | Volume | Price | |||||||||||||||
(millions) | $ | % | $ | % | $ | % | |||||||||||
Change to Q1 2018 from Q1 2017 | |||||||||||||||||
USG Sheetrock® brand gypsum wallboard | $ | (29 | ) | (11 | )% | $ | (31 | ) | (12 | )% | $ | 2 | 1 | % | |||
USG Sheetrock® brand joint compound | (2 | ) | (2 | )% | (4 | ) | (4 | )% | 2 | 2 | % | ||||||
Other | 3 | ||||||||||||||||
Total decrease in net sales | $ | (28 | ) | ||||||||||||||
Sales for USG Sheetrock® brand gypsum wallboard decreased $29 million in the first quarter of 2018 compared to the first quarter of 2017 due to lower shipments partially offset by higher average selling price. The decreased volumes in the first quarter of 2018 primarily reflected higher volumes in the fourth quarter of 2017 in anticipation of the early January 2018 price increase, which was announced in the fourth quarter of 2017. In comparison, in the first quarter of 2017, sales reflected higher
25
volumes in early January 2017 in anticipation of the price increase in late January 2017. The increase in the average selling price in the first quarter of 2018 was driven by the January 2018 price increase.
Sales of USG Sheetrock® brand joint compound decreased $2 million on lower volumes offset by higher average selling price. The lower volume reflected delayed customer jobs due to unfavorable weather, primarily in the northeast. We also recorded higher royalties and sales of other products including glass-mat panels, paper and joint compound accessory products offset by lower freight due to lower sales.
Operating profit of $49 million was recorded in the first quarter of 2018 compared to $79 million recorded in the first quarter of 2017. The decrease of $30 million in operating profit reflected the following:
Operating Profit | Volume | Price | Cost | ||||||||||||
(millions) | $ | $ | $ | $ | |||||||||||
Change to Q1 2018 from Q1 2017 | |||||||||||||||
USG Sheetrock® brand gypsum wallboard | $ | (25 | ) | $ | (13 | ) | $ | 2 | $ | (14 | ) | ||||
USG Sheetrock® brand joint compound | (3 | ) | (1 | ) | 2 | (4 | ) | ||||||||
Other | (2 | ) | |||||||||||||
Total decrease in operating profit | $ | (30 | ) | ||||||||||||
The decrease in operating profit reflected lower gross profit for USG Sheetrock® brand gypsum wallboard and USG Sheetrock® brand joint compound. The decrease in gross profit for USG Sheetrock® brand gypsum wallboard reflected higher cost per unit and lower volumes slightly offset by higher average selling price. The higher per unit cost primarily reflected an increase in costs per unit of 29% for fixed costs and 11% for conversion costs driven by increased labor costs as a result of the decision to maintain staffing levels consistent with the fourth quarter despite lower volumes in order to be properly staffed throughout the remainder of 2018. The lower gross profit for USG Sheetrock® brand joint compound reflected a higher per unit cost and lower volumes offset by higher average selling price. The higher cost per unit for joint treatment reflected increased cost per unit for raw materials, primarily resin used for containers.
Further contributing to the decrease in operating profit are increased costs for the expansion of our Jacksonville facility of $3 million and higher selling and administrative costs of $1 million offset by savings attributable to our Advanced Manufacturing initiatives of $2 million.
U.S. Performance Materials: Net sales in the first quarter of 2018 were $92 million, up $6 million, or 7%, compared with the first quarter of 2017. The increase in net sales was due to the following:
Sales | Volume | Price | |||||||||||||||
(millions) | $ | % | $ | % | $ | % | |||||||||||
Change to Q1 2018 from Q1 2017 | |||||||||||||||||
USG Durock® brand cement board | $ | 1 | 3 | % | $ | — | — | % | $ | 1 | 3 | % | |||||
Levelrock® brand gypsum underlayment | 3 | 24 | % | 3 | 24 | % | — | — | % | ||||||||
Securock® brand roof boards | 2 | 20 | % | 1 | 9 | % | 1 | 11 | % | ||||||||
Total increase in net sales | $ | 6 | |||||||||||||||
The increase in net sales was driven by higher average selling price of USG Durock® brand cement board and Securock® brand roof boards, which reflect timing of price increases, and increased volumes of Levelrock® brand gypsum underlayment and Securock® brand roof boards. The increased shipments of Levelrock® brand gypsum underlayment reflected growth in the nonresidential markets.
26
Operating profit of $1 million was recorded in the first quarter of 2018 compared to $6 million recorded in the first quarter of 2017. The decrease of $5 million in operating profit reflected the following:
Operating Profit | Volume | Price | Cost | ||||||||||||
(millions) | $ | $ | $ | $ | |||||||||||
Change to Q1 2018 from Q1 2017 | |||||||||||||||
USG Durock® brand cement board | $ | — | $ | — | $ | 1 | $ | (1 | ) | ||||||
Levelrock® brand gypsum underlayment | — | 3 | — | (3 | ) | ||||||||||
Securock® brand roof boards | 1 | — | 1 | — | |||||||||||
Other | (6 | ) | |||||||||||||
Total decrease in operating profit | $ | (5 | ) | ||||||||||||
The decrease in operating profit reflected higher cost per unit of USG Durock® brand cement board and Levelrock® brand gypsum underlayment and offset by a higher average selling price of Securock® brand roof boards. The increased cost per unit of USG Durock® brand cement board reflected higher transportation costs and Levelrock® brand gypsum underlayment reflected higher labor and transportation costs.
Also driving a decrease in operating profit was decreased gross profit on other performance materials products, including Fiberock® brand tile backerboard and underlayment, increased others costs, including for the expansion of our Jacksonville and Delavan facilities, and higher selling and administrative expenses of $4 million. The increased selling and administrative expenses reflected increased marketing and compensation costs in support of our strategy.
U.S. Ceilings: Net sales for our ceilings business in the first quarter of 2018 were $138 million, an increase of $26 million, or 23%, from the first quarter of 2017. The increase reflected the following:
Sales | Volume | Price | |||||||||||||||
(millions) | $ | % | $ | % | $ | % | |||||||||||
Change to Q1 2018 from Q1 2017 | |||||||||||||||||
Ceiling grid | $ | 5 | 12 | % | $ | 3 | 8 | % | $ | 2 | 4 | % | |||||
Ceiling tile | 6 | 9 | % | 5 | 7 | % | 1 | 2 | % | ||||||||
Other | 15 | ||||||||||||||||
Total increase in net sales | $ | 26 | |||||||||||||||
Sales of ceiling grid and ceiling tile increased driven by both volume and average selling price. The increase in sales of ceiling grid reflected higher shipments to our retail customers and specialty dealers and higher average selling price resulting from price increases in the second and fourth quarter of 2017. The higher sales of ceiling tile were driven by increased shipments to all channels and improved pricing as a result of product mix. Further driving the increase in sales are $13 million of sales from USG Ceilings Plus for specialty ceilings and higher freight due to increased sales.
Operating profit was $19 million for the first quarter of 2018, a decrease of $1 million, or 5%, from the first quarter of 2017. The decrease reflected the following:
Operating Profit | Volume | Price | Cost | ||||||||||||
(millions) | $ | $ | $ | $ | |||||||||||
Change to Q1 2018 from Q1 2017 | |||||||||||||||
Ceiling grid | $ | 2 | $ | 1 | $ | 2 | $ | (1 | ) | ||||||
Ceiling tile | 1 | 1 | 1 | (1 | ) | ||||||||||
Other | (4 | ) | |||||||||||||
Total decrease in operating profit | $ | (1 | ) | ||||||||||||
The decrease in operating profit reflected increased selling and administrative costs offset by increased gross profit for both ceiling grid and ceiling tile, gross profit from USG Ceilings Plus and $1 million in savings from our Advanced Manufacturing initiatives. The higher gross profit for ceiling grid and ceiling tile was due to higher volumes and higher average
27
selling price offset by higher costs per unit. The higher cost per unit for ceiling grid was driven primarily by an increase in raw material costs, particularly steel. The increased cost per unit for ceiling tile was due to increased cost for raw materials and labor offset by lower costs for energy. Additionally, we recorded a $1 million adjustment to ceiling tile inventory in the first quarter of 2018.
These increased gross profits are offset by higher selling and administrative expenses of $7 million, inclusive of USG Ceilings Plus. The increase in selling and administrative expenses was driven by increased sales and marketing expenses. Selling and administrative expenses attributable to USG Ceilings Plus totaled $4 million, which included $2 million of transaction and integration costs.
Canada: Net sales for our Canada segment in the first quarter of 2018 were $111 million, an increase of $15 million from $96 million in the first quarter of 2017. Sales of gypsum wallboard increased $6 million due to an increase of 13% in volume offset by a decrease of 1% in average selling price. The increase in volumes reflect sales to new customers. Also impacting sales was higher freight of $2 million, increased sales of other products of $2 million and a favorable impact of currency translation of $5 million.
Operating profit in the first quarter of 2018 was flat compared to the first quarter of 2017. Gross profit of gypsum wallboard increased $2 million due to higher sales offset by lower average selling price and higher per unit cost. This is offset by an increase in miscellaneous costs of $2 million. Selling and administrative expenses remained consistent period over period.
USG Boral Building Products: The following reflects the net sales and operating profit as recorded by UBBP and the equity income recorded by USG.
Three months ended March 31: | ||||||||||||||
Favorable (Unfavorable) | ||||||||||||||
(millions) | 2018 | 2017 | $ | % | ||||||||||
Net sales | $ | 287 | $ | 276 | $ | 11 | 4 | % | ||||||
Operating profit | 28 | 35 | (7 | ) | (20 | )% | ||||||||
Income from equity method investments - UBBP | 9 | 13 | (4 | ) | (31 | )% | ||||||||
Net sales for UBBP were $287 million in the first quarter of 2018 compared to $276 million for the first quarter of 2017. The increase of $11 million reflected increased plasterboard shipments in Thailand, China, Oman and Australia offset by lower shipments in South Korea and Singapore. Total plasterboard shipments decreased to 1.10 billion square feet for the first quarter of 2018 from 1.13 billion square feet for the first quarter of 2017. Shipments of certain adjacent products, including gypsum ceiling tiles and plasters, increased in the first quarter of 2018 from the first quarter of 2017 offset by lower volumes of metal studs and powder compounds. Currency translation drove a favorable impact of $12 million.
Operating profit was $28 million in the first quarter of 2018 as compared to $35 million in the first quarter of 2017. Operating profit in 2018 reflected lower margins in South Korea, Thailand and Indonesia offset by improved margins in Australia and China. Lower margins were reflective of higher input costs, including energy and raw materials of waste paper, steel, and gypsum. UBBP quarterly results also included higher selling and administrative expenses offset by a favorable currency impact of $2 million.
Our share of net income of UBBP decreased $4 million in the first quarter of 2018 as compared to the first quarter of 2017. The decrease reflected lower net income recorded by UBBP.
Corporate: The operating loss for Corporate increased to $29 million in the first quarter of 2018 compared with $24 million in the first quarter of 2017. The increase reflected a charge recorded for legal judgment on a contract dispute from 2004 of $5 million and transaction costs of $2 million, including those associated with business unit realignment, offset by lower pension and postretirement costs.
28
Liquidity and Capital Resources
As of March 31, 2018, we had $356 million of cash and cash equivalents and marketable securities compared with $493 million as of December 31, 2017. See discussion below under Cash Flows for explanation of this change. Our total liquidity as of March 31, 2018 was $548 million compared to $648 million as of December 31, 2017 (including $192 million and $155 million, respectively, of borrowing availability under our credit facility). The decrease in liquidity reflected payments for our share repurchase program and for incentives and the redemption of customer rebates.
We invest in cash equivalents and marketable securities pursuant to an investment policy that has preservation of principal as its primary objective. The policy includes provisions regarding diversification, credit quality and maturity profile that are designed to minimize the overall risk profile of our investment portfolio. The securities in the portfolio are subject to normal market fluctuations. See Note 5 to the condensed consolidated financial statements for additional information regarding our investments in marketable securities.
Total debt, consisting of senior notes and industrial revenue bonds, amounted to $1.078 billion ($1.089 billion in aggregate principal amount less $11 million of debt issuance costs) as of March 31, 2018 and $1.078 billion ($1.089 billion in aggregate principal amount less $11 million of debt issuance costs) as of December 31, 2017. During the three months ended March 31, 2018, there were no borrowings under our revolving credit facility and no borrowings outstanding at period-end.
We maintain a credit facility with a maximum borrowing limit of $220 million (including a $50 million borrowing sublimit for CGC) that is available to fund working capital needs and other general corporate purposes and matures on May 1, 2022. The facility is guaranteed by certain of our significant subsidiaries and secured by such parties' eligible trade receivables and inventory. The maximum borrowing limit under the credit agreement may be increased up to $450 million at our request and with our lenders’ approval. The credit agreement contains other covenants and events of default that are customary for similar agreements and may limit our ability to take various actions including our ability to pay a dividend or repurchase our stock. The credit agreement specifies that the maximum principal that may be borrowed is impacted by any outstanding borrowings and letters of credit under the credit agreement, by a borrowing base (comprised of eligible trade receivables and inventory), and the minimum excess availability that may be required due to the Covenant Trigger Threshold, described below, being applicable. As of March 31, 2018, the maximum principal we could borrow after taking into account the foregoing factors was approximately $192 million.
The credit agreement contains a covenant that would require us to maintain a minimum fixed charge coverage ratio of not less than 1.0-to-1.0 in the event that excess availability falls below the Covenant Trigger Threshold equal to 10% of the lesser of (a) the aggregate revolving commitment and (b) the aggregate of the USG and CGC borrowing base. As of March 31, 2018, our fixed charge coverage ratio was 1.02-to-1.0; and therefore, we are not required to maintain minimum excess availability of no less than the Covenant Trigger Threshold so that the financial covenant will remain inapplicable.
CASH FLOWS
The following table presents a summary of our cash flows:
Three months ended March 31, | |||||||
(millions) | 2018 | 2017 | |||||
Net cash provided by (used for): | |||||||
Operating activities from continuing operations | $ | (16 | ) | $ | (29 | ) | |
Investing activities from continuing operations | (48 | ) | (41 | ) | |||
Financing activities from continuing operations | (65 | ) | (25 | ) | |||
Discontinued operations | 1 | 5 | |||||
Effect of exchange rate changes on cash | (5 | ) | 4 | ||||
Net (decrease) increase in cash and cash equivalents | $ | (133 | ) | $ | (86 | ) | |
Operating Activities: Net cash used by operating activities was lower for the first three months of 2018 compared to the first three months of 2017 due to lower operating profit, offset by a lower net cash outflow for working capital of $104 million for the first three months of 2018 as compared to the net cash outflow of $140 million for the first three months of 2017. The decrease in the cash outflows primarily reflected a decrease in accrued expenses of $47 million due to lower payments for incentive plans and interest offset by an increase in receivables of $5 million due to higher sales in the current quarter, an increase in inventories of $2 million and an increase in accounts payable of $4 million.
29
As of March 31, 2018, working capital (current assets less current liabilities) amounted to $556 million, and the ratio of current assets to current liabilities was 2.39-to-1. As of December 31, 2017, working capital amounted to $576 million, and the ratio of current assets to current liabilities was 2.39-to-1.
Investing Activities: Net cash used for investing activities was $48 million for the first three months of 2018 compared to $41 million for the first three months of 2017. The increase in the use of cash reflected higher cash outflows for capital expenditures offset by higher cash inflows for marketable securities and a working capital true up for our acquisition of Ceilings Plus. The net activity of purchases and sales or maturities of marketable securities was a cash inflow of $2 million for the three months ended March 31, 2018 as compared to a cash outflow of $2 million for the three months ended March 31, 2017.
The increase in capital expenditures to $52 million in the first three months of 2018 from $39 million in the first three months of 2017 reflected expenditures for the replacement, modernization and expansion of operations, including Advanced Manufacturing initiatives. Approved capital expenditures totaled $205 million as of March 31, 2018 compared with $172 million as of December 31, 2017.
Financing Activities: Net cash used for financing activities for the first three months of 2018 was $65 million compared to $25 million for the first three months of 2017. The increase reflected higher purchases of our common stock under the approved share repurchase program.
Discontinued Operations: Net cash provided by discontinued operations for the first three months of 2018 was $1 million compared to $5 million for the first three months of 2017. The net cash inflow in 2017 primarily reflected a working capital adjustment associated with the sale of L&W.
DEFINED BENEFIT PLANS
During the first three months of 2018, we made cash contributions of $1 million to our domestic supplemental pension plan and $1 million to our pension plan in Canada. We expect to make total contributions to our pension and postretirement plans in 2018 of approximately $60 million.
LIQUIDITY OUTLOOK
In the first three months of 2018, our investing cash outflows included $52 million of capital expenditures. In total for 2018, we plan to spend approximately $250 million on capital expenditures, which includes $90 million for advanced manufacturing projects to standardize and automate production across our businesses, approximately $95 million for growth investments and approximately $65 million for maintenance, while reducing manufacturing costs and increasing efficiency, across our Gypsum and Ceilings businesses.
We also plan to incur approximately $370 million in selling and administrative expenses in 2018, including $31 million on strategic investments to support and grow our businesses and $15 million on integration and divisional realignment costs. Interest payments, based on our current level of outstanding debt, are expected to decrease to $57 million in 2018 compared with $85 million in 2017 which is primarily driven by lower interest rates due to the refinancing of our 7.75% senior notes due 2018 to our 4.875% senior notes due 2027.
We expect to make tax payments of approximately $8 million for foreign jurisdictions. Our utilization of our NOL carryforwards will limit our cash payments for U.S. income taxes.
The 2017 Tax Act significantly changes U.S. corporate income tax laws by, among other things, reducing the U.S. corporate income tax rate to 21% and creating a quasi-territorial tax system with a one-time mandatory tax on previously deferred foreign earnings. Excluding the impact of any discrete items, the provisions of the 2017 Tax Act are expected to reduce our effective tax rate in 2018 by approximately 10 to 13 percentage points compared to what the rate would have otherwise been in the absence of the 2017 Tax Act. Amounts adjusted in the measurement period under SEC Staff Accounting Bulletin No. 118, "Income Tax Accounting Implications of the Tax Cuts and Jobs Act," which has been codified as ASU 2018-05, "Income Taxes (Topic 740): Amendments to SEC Paragraphs Pursuant to SEC Staff Accounting Bulletin No. 118 (SEC Update)," will be recorded as discrete items in the period in which the accounting for these items is complete. Our estimate of our effective tax rate does not include an estimate for the resolution of items which we identified as provisional. In addition, the ultimate impact on our effective tax rate will vary based upon the percentage of pretax earnings that we generate in the United States as compared to the rest of the world. See Note 13 to our condensed consolidated financial statements for additional information regarding those items and our NOL carryforwards. We do not anticipate that resolution of such item will result in a material change to our estimate of the effective tax rate or the impact on cash paid for taxes.
We expect to fund our capital expenditures, our selling and administrative expenses and our interest and tax payments with cash from operations or cash on hand.
30
On February 1, 2018, we announced that our Board of Directors approved a $250 million increase to our stock repurchase program, bringing the total authorization to $500 million. As of March 31, 2018, we have repurchased $246 million, leaving $254 million of authorization remaining. The timing and the amount of any additional repurchases will be determined based on market conditions and other factors. We expect that stock repurchases, if any, will be executed within 18 months and funded with available cash on hand. See Part II, Item 2 for additional information.
Since formation, UBBP was funded from its net cash flows from operations and third-party financing, and it is our intent that as an ongoing operation, UBBP will continue to self-fund. UBBP targets the distribution of 50% of combined after tax profits to USG and Boral; however, this dividend may be adjusted by the UBBP board with unanimous resolution.
In the event certain performance targets are satisfied by UBBP, we will be obligated to pay Boral an earnout payment in an amount up to $50 million in 2019, based on UBBP performance during the first five years. We have not recorded a liability for this earnout payment as we have concluded that it is currently not probable that the five-year performance target will be achieved.
We believe that cash on hand, cash equivalents, marketable securities, cash available from future operations and our credit facility will provide sufficient liquidity to fund our operations for at least the next 12 months. Cash requirements include, among other things, capital expenditures, working capital needs, employee retirement plans funding, interest payments and other contractual obligations.
Recently Issued Accounting Pronouncements
See Part 1, Item 1, Note 1 to the condensed consolidated financial statements for information related to new accounting standards.
Legal Contingencies
We are named as defendants in litigation arising from our operations, including lawsuits or claims arising from commercial disputes, product performance or warranties, products liability, and worksite or vehicular accidents.
In 2015, USG, our subsidiary United States Gypsum Company, our former subsidiary L&W Supply Corporation, and seven other wallboard manufacturers were named as defendants in a lawsuit filed by twelve homebuilders alleging that the defendants conspired to fix the price of wallboard sold in the United States. Earlier, in 2013, class action lawsuits making similar allegations were filed in Canada on behalf of a class of purchasers of wallboard in Canada. We believe that the cost, if any, of resolving the homebuilders’ lawsuit and Canadian class action litigation will not have a material effect on our results of operations, financial position or cash flows.
In 2015, United States Gypsum Company was served with a federal grand jury subpoena requesting the production of company records in connection with a federal investigation of the gypsum drywall industry. Two former employees of USG were also served with subpoenas. We believe the investigation, although a separate proceeding, is related to the same events at issue in the litigation discussed above. We have fully cooperated with the grand jury investigation. We believe we acted in full compliance with the law, and we do not expect the resolution of this matter to result in any material effect on our business, financial position, liquidity or results of operations; however, we can provide no assurances as to the scope, timing, or outcome of any such investigation.
See Note 14 to the condensed consolidated financial statements for further information regarding the foregoing lawsuits and other legal matters.
Critical Accounting Policies
The preparation of our financial statements requires us to make estimates, judgments and assumptions that affect the reported amounts of assets, liabilities, revenues and expenses during the periods presented. Our Annual Report on Form 10-K for the fiscal year ended December 31, 2017, which we filed with the Securities and Exchange Commission on February 14, 2018, includes a summary of the critical accounting policies we believe are the most important to aid in understanding our financial results. There have been no changes to those critical accounting policies that have had a material impact on our reported amounts of assets, liabilities, revenues or expenses during the first three months of 2018.
31
Forward-Looking Statements
This report contains forward-looking statements within the meaning of the Private Securities Litigation Reform Act of 1995 related to management’s expectations about future conditions. Any forward-looking statements represent our views only as of the date of this report and should not be relied upon as representing our views as of any subsequent date, and we undertake no obligation to update any forward-looking statement. Forward-looking statements include, but are not limited to, statements under the following headings: (1) “Management’s Discussion and Analysis” about (a) market conditions and outlook, including anticipated growth in new residential and nonresidential construction, repair and remodel spending, and the construction industries in the U.S. and Canada, anticipated growth or decline in countries within the UBBP territory, UBBP's effect on the cyclicality of our North American businesses, U.S. industry shipments of gypsum board, demand for gypsum wallboard and industry capacity utilization rate, and our selling prices and margins; (b) expected contributions to our pension and postretirement plans; (c) our liquidity outlook, including our capital expenditures, selling and administrative expenses, and interest and tax payments, and the funding thereof, our estimate of our effective tax rate and the impact on cash paid for taxes, the timing and funding of our stock repurchase program, UBBP’s dividend policy and its ability to self-fund, and cash requirements and adequacy of resources to fund them; and (d) the outcome and effect of ongoing and future legal and governmental proceedings; and (2) “Legal Proceedings” about the outcome and effect of ongoing and future legal and governmental proceedings.
Some of the risk factors that affect our business and financial results are discussed under “Risk Factors” in our most recent Annual Report on Form 10-K. We wish to caution the reader that actual business, market or other conditions, including the “Risk Factors” discussed in our most recent Annual Report on Form 10-K or in our other Securities and Exchange Commission filings, could cause our actual results to differ materially from those stated in the forward-looking statements.
ITEM 3. QUANTITATIVE AND QUALITATIVE DISCLOSURES ABOUT MARKET RISK
There have been no significant changes to our market risk since December 31, 2017.
ITEM 4. CONTROLS AND PROCEDURES
(a) | Evaluation of disclosure controls and procedures. |
Our Chief Executive Officer and Chief Financial Officer, after evaluating the effectiveness of our “disclosure controls and procedures” (as defined in Rule 13a-15(e) promulgated under the Securities Exchange Act of 1934, or the Act), have concluded that, as of the end of the quarter covered by this report, our disclosure controls and procedures were effective to provide reasonable assurance that information required to be disclosed by us in the reports that we file or submit under the Act is recorded, processed, summarized and reported within the time periods specified in the Securities and Exchange Commission’s rules and forms. Disclosure controls and procedures include, without limitation, controls and procedures designed to ensure that information required to be disclosed by an issuer in the reports that it files or submits under the Act is accumulated and communicated to the issuer’s management, including its principal executive and financial officers, or persons performing similar functions, as appropriate to allow timely decisions regarding required disclosure.
(b) | Changes in internal control over financial reporting. |
There were no changes in our “internal control over financial reporting” (as defined in Rule 13a-15(f) promulgated under the Act) identified in connection with the evaluation required by Rule 13a-15(d) promulgated under the Act that occurred during the quarter ended March 31, 2018 that have materially affected, or are reasonably likely to materially affect, our internal control over financial reporting.
32
PART II. OTHER INFORMATION
ITEM 1. LEGAL PROCEEDINGS
See Part I, Item 1, Note 14 to the condensed consolidated financial statements and Part I, Item 2, Legal Contingencies for additional information regarding legal proceedings.
ITEM 1A. RISK FACTORS
There is no material change in the information reported under "Part I-Item 1A-Risk Factors" contained in our Annual Report on Form 10-K for the fiscal year ended December 31, 2017.
ITEM 2. UNREGISTERED SALES OF EQUITY SECURITIES AND USE OF PROCEEDS
(a) Pursuant to our Deferred Compensation Program for Non-Employee Directors, two of our non-employee directors deferred all or a portion of their quarterly retainers for service as a director that they were entitled to receive on March 31, 2018 under our Non-Employee Director Compensation Program into an aggregate total of approximately 649 deferred stock units. These units will increase or decrease in value in direct proportion to the market value of our common stock and will be paid in shares of common stock following termination of service as a director. The issuance of these deferred stock units was effected through a private placement under Section 4(a)(2) of the Securities Act of 1933, as amended, and was exempt from registration under Section 5 of that Act.
(b) Not applicable
(c) On February 1, 2017, we announced that our Board of Directors approved a stock repurchase program of $250 million, and on February 1, 2018 we announced an increase in this stock repurchase program, bringing the total size of the program to $500 million. Under the program, we may repurchase shares from time to time in open market transactions or in privately negotiated transactions in accordance with applicable securities laws, including under plans complying with Rule 10b5-1 under the Exchange Act. We may discontinue the program at any time, and the program has no set expiration date. The timing and amount of any repurchase of shares is determined by our management, based on its evaluation of market conditions, cash on hand, applicable legal requirements and other factors. The following table provides information about purchases of our common stock we made during the three months ended March 31, 2018:
Issuer Purchases of Equity Securities | ||||||||||||||
Period | Total number of shares purchased | Average price paid per share | Total number of shares repurchased as part of publicly announced plans or programs | Approximate dollar value of shares that may yet be purchased under the plans or programs (millions) | ||||||||||
January 1, 2018 to January 31, 2018 | 8,662 | $ | 37.80 | 8,662 | $ | 316 | ||||||||
February 1, 2018 to February 28, 2018 | 998,215 | $ | 34.00 | 998,215 | $ | 282 | ||||||||
March 1, 2018 to March 31, 2018 | 805,602 | $ | 34.67 | 805,602 | $ | 254 | ||||||||
Total | 1,812,479 | 1,812,479 | ||||||||||||
ITEM 4. MINE SAFETY DISCLOSURES
The information concerning mine safety violations or regulatory matters required by Section 1503(a) of the Dodd-Frank Wall Street Reform and Consumer Protection Act and Item 104 of Regulation S-K promulgated by the SEC is included in Exhibit 95 to this report.
33
ITEM 6. EXHIBITS
Exhibit Number | Exhibit |
Rule 13a-14(a) Certifications of USG Corporation’s Chief Executive Officer * | |
Rule 13a-14(a) Certifications of USG Corporation’s Chief Financial Officer * | |
Section 1350 Certifications of USG Corporation’s Chief Executive Officer * | |
Section 1350 Certifications of USG Corporation’s Chief Financial Officer * | |
Mine Safety Disclosures * | |
101 | The following financial information from USG Corporation’s Quarterly Report on Form 10-Q for the three months ended March 31, 2018, formatted in XBRL (Extensible Business Reporting Language): (1) the condensed consolidated statements of income for the three months ended March 31, 2018 and 2017, (2) the condensed consolidated statements of comprehensive income for the three months ended March 31, 2018 and 2017, (3) the condensed consolidated balance sheets as of March 31, 2018 and December 31, 2017, (4) the condensed consolidated statements of cash flows for the three months ended March 31, 2018 and 2017 and (5) notes to the condensed consolidated financial statements. * |
* | Filed or furnished herewith | |
34
SIGNATURES
Pursuant to the requirements of the Securities Exchange Act of 1934, the registrant has duly caused this report to be signed on its behalf by the undersigned thereunto duly authorized.
USG CORPORATION | ||||
By | /s/ Jennifer F. Scanlon | |||
Jennifer F. Scanlon, | ||||
Director, President and Chief Executive Officer | ||||
By | /s/ Matthew F. Hilzinger | |||
Matthew F. Hilzinger, | ||||
Executive Vice President and Chief Financial Officer | ||||
By | /s/ Jeanette A. Press | |||
Jeanette A. Press, | ||||
Vice President, Controller and Principal Accounting Officer | ||||
April 25, 2018 | ||||
35