Attached files
| file | filename |
|---|---|
| 8-K - FORM 8-K - INSIGHT ENTERPRISES INC | d539030d8k.htm |
| EX-99.1 - EXHIBIT 99.1 - INSIGHT ENTERPRISES INC | d539030dex991.htm |

Insight Enteprises, Inc. Fourth Quarter and Full Year 2017 Earnings Conference Call and Webcast Exhibit 99.2
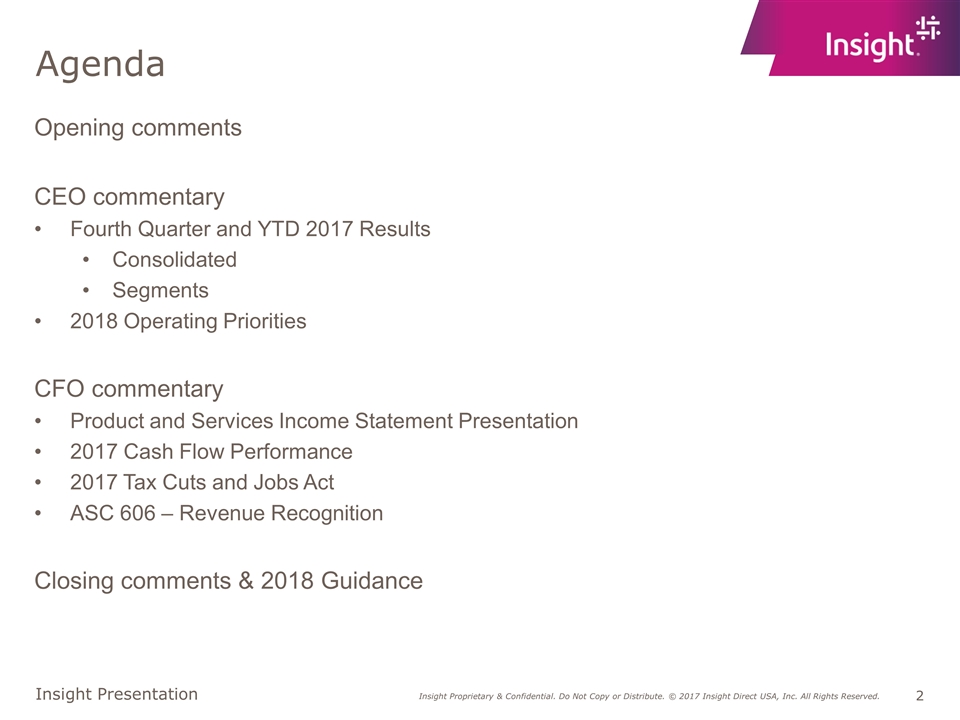
Agenda Opening comments CEO commentary Fourth Quarter and YTD 2017 Results Consolidated Segments 2018 Operating Priorities CFO commentary Product and Services Income Statement Presentation 2017 Cash Flow Performance 2017 Tax Cuts and Jobs Act ASC 606 – Revenue Recognition Closing comments & 2018 Guidance
Disclosures Safe harbor statement This presentation includes “forward-looking statements” within the meaning of the Private Securities Litigation Reform Act of 1995 related to Insight’s plans and expectations. Statements that are not historical facts, including statements about future trends in the IT market and our opportunities for growth, are forward-looking statements. These forward-looking statements are subject to assumptions, risks and uncertainties which could cause actual results or facts to differ materially from such statements. The Company undertakes no obligation to update publicly or revise any of the forward-looking statements, except as otherwise required by law. More detailed information about risk factors are discussed in the Company’s Annual Report on Form 10-K for the year ended December 31, 2016. Non-GAAP measures This presentation will reference certain non-GAAP financial information as ‘Adjusted Measures’. For a reconciliation of non-GAAP measures presented in this document, see the press release issued today which you may also find on the Investor Relations section of our website at investor.insight.com.
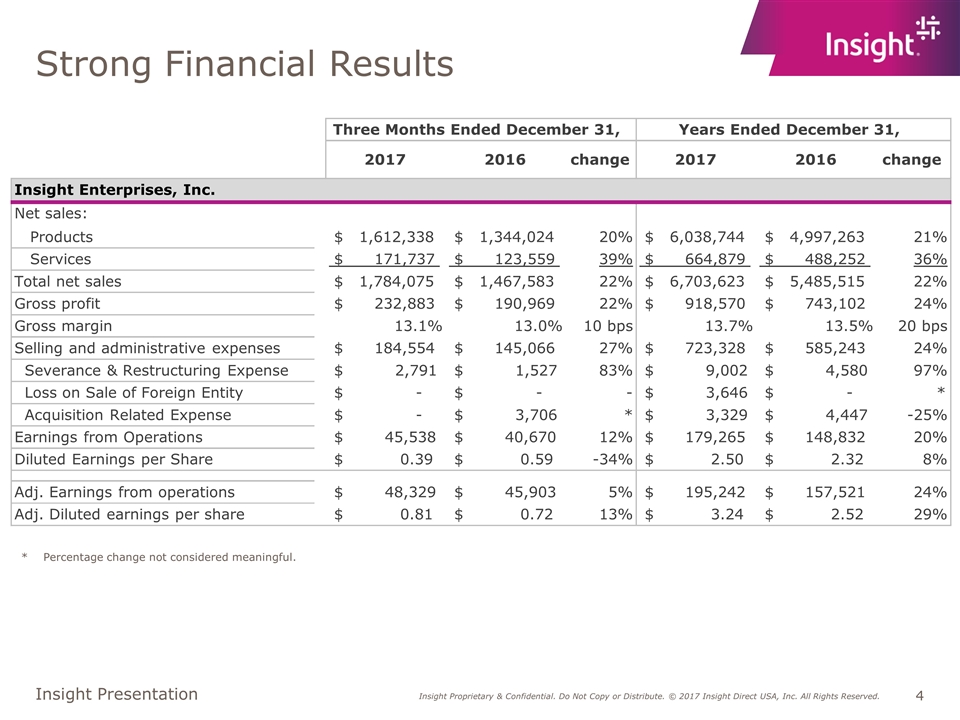
Strong Financial Results * Percentage change not considered meaningful. 2017 2016 change 2017 2016 change Products $ 1,612,338 $ 1,344,024 20% $ 6,038,744 $ 4,997,263 21% Services $ 171,737 $ 123,559 39% $ 664,879 $ 488,252 36% Total net sales $ 1,784,075 $ 1,467,583 22% $ 6,703,623 $ 5,485,515 22% Gross profit $ 232,883 $ 190,969 22% $ 918,570 $ 743,102 24% Gross margin 13.1% 13.0% 10 bps 13.7% 13.5% 20 bps Selling and administrative expenses $ 184,554 $ 145,066 27% $ 723,328 $ 585,243 24% Severance & Restructuring Expense $ 2,791 $ 1,527 83% $ 9,002 $ 4,580 97% Loss on Sale of Foreign Entity $ - $ - - $ 3,646 $ - * Acquisition Related Expense $ - $ 3,706 * $ 3,329 $ 4,447 -25% Earnings from Operations $ 45,538 $ 40,670 12% $ 179,265 $ 148,832 20% Diluted Earnings per Share $ 0.39 $ 0.59 -34% $ 2.50 $ 2.32 8% Adj. Earnings from operations $ 48,329 $ 45,903 5% $ 195,242 $ 157,521 24% Adj. Diluted earnings per share $ 0.81 $ 0.72 13% $ 3.24 $ 2.52 29% Net sales: Three Months Ended December 31, Years Ended December 31, Insight Enterprises, Inc.
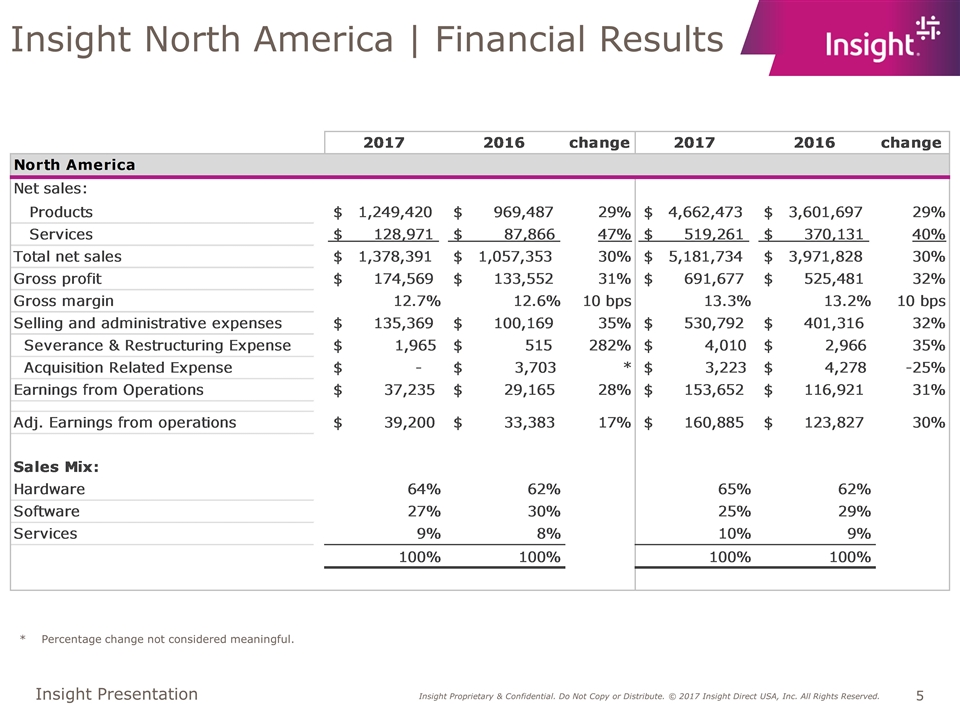
Insight North America | Financial Results * Percentage change not considered meaningful.
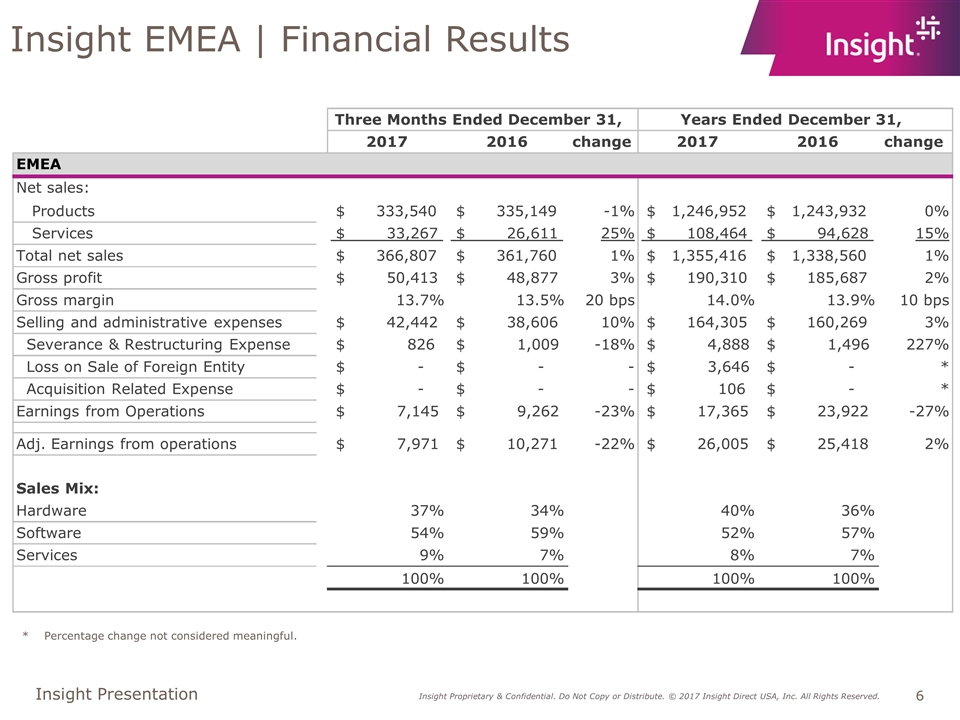
Insight EMEA | Financial Results * Percentage change not considered meaningful. 2017 2016 change 2017 2016 change Products $ 333,540 $ 335,149 -1% $ 1,246,952 $ 1,243,932 0% Services $ 33,267 $ 26,611 25% $ 108,464 $ 94,628 15% Total net sales $ 366,807 $ 361,760 1% $ 1,355,416 $ 1,338,560 1% Gross profit $ 50,413 $ 48,877 3% $ 190,310 $ 185,687 2% Gross margin 13.7% 13.5% 20 bps 14.0% 13.9% 10 bps Selling and administrative expenses $ 42,442 $ 38,606 10% $ 164,305 $ 160,269 3% Severance & Restructuring Expense $ 826 $ 1,009 -18% $ 4,888 $ 1,496 227% Loss on Sale of Foreign Entity $ - $ - - $ 3,646 $ - * Acquisition Related Expense $ - $ - - $ 106 $ - * Earnings from Operations $ 7,145 $ 9,262 -23% $ 17,365 $ 23,922 -27% Adj. Earnings from operations $ 7,971 $ 10,271 -22% $ 26,005 $ 25,418 2% Hardware 37% 34% 40% 36% Software 54% 59% 52% 57% Services 9% 7% 8% 7% 100% 100% 100% 100% Three Months Ended December 31, Years Ended December 31, EMEA Net sales: Sales Mix:
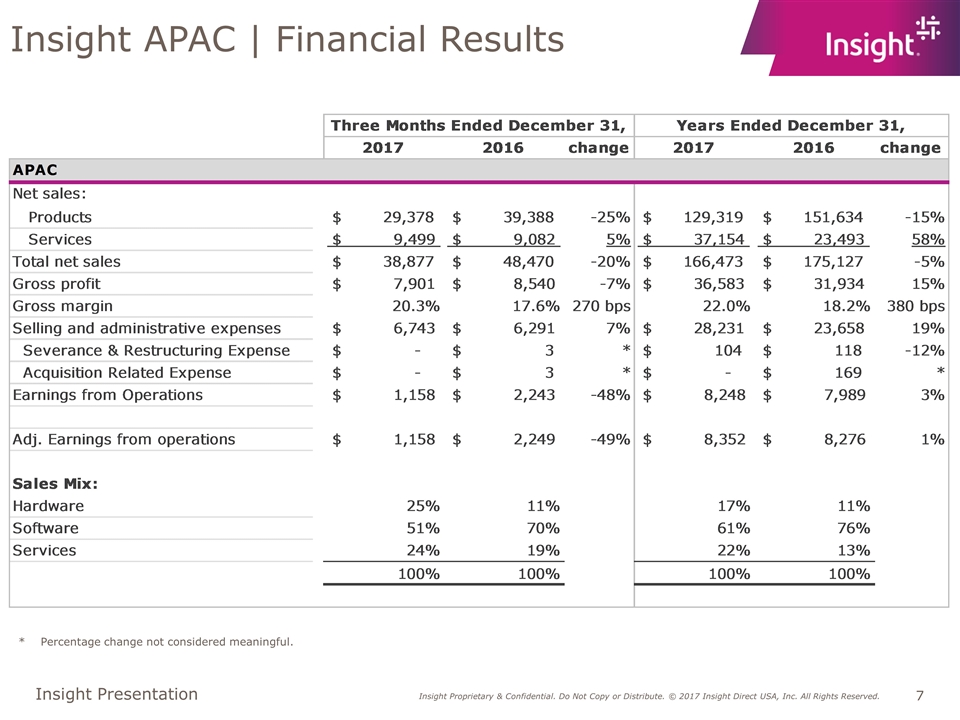
Insight APAC | Financial Results * Percentage change not considered meaningful.
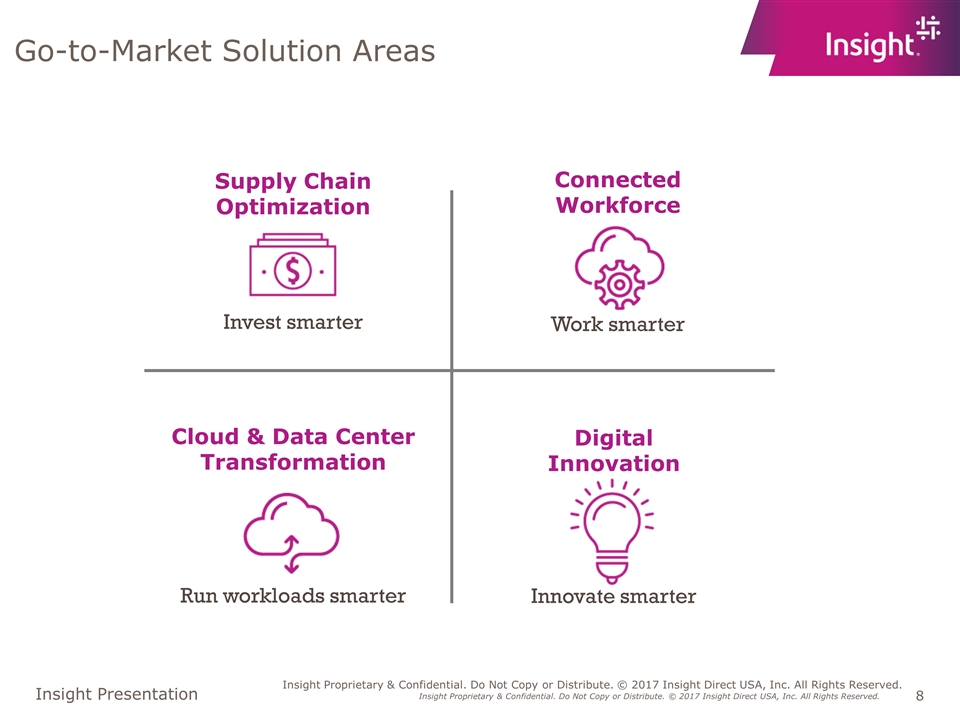
Go-to-Market Solution Areas Cloud & Data Center Transformation Run workloads smarter Connected Workforce Work smarter Digital Innovation Innovate smarter Supply Chain Optimization Invest smarter
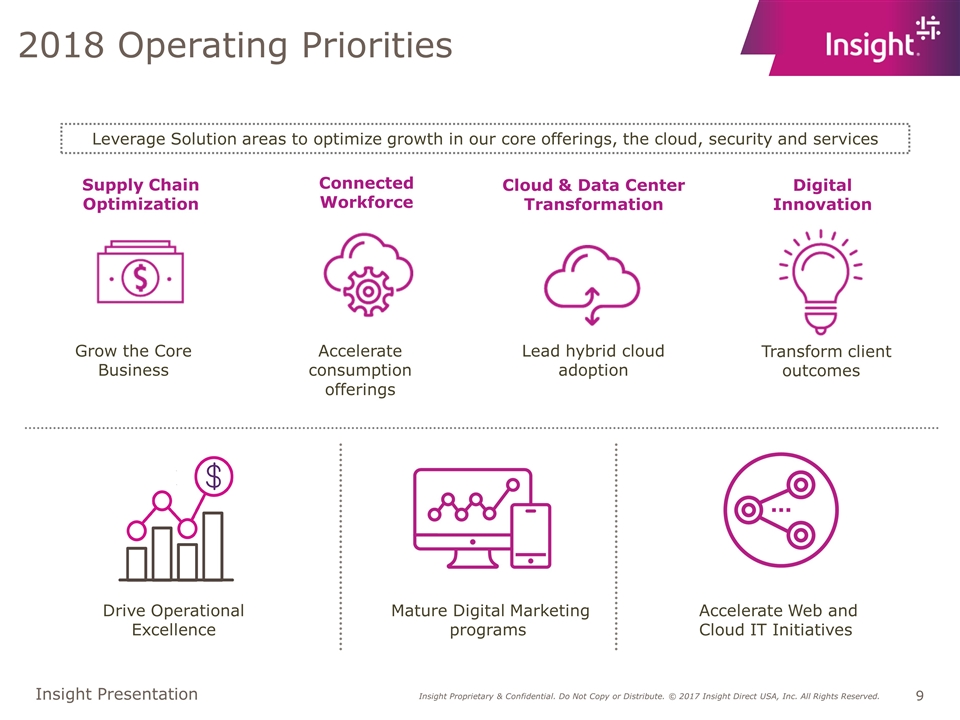
2018 Operating Priorities Grow the Core Business Cloud & Data Center Transformation Connected Workforce Digital Innovation Supply Chain Optimization Accelerate consumption offerings Lead hybrid cloud adoption Transform client outcomes Drive Operational Excellence Mature Digital Marketing programs Leverage Solution areas to optimize growth in our core offerings, the cloud, security and services Accelerate Web and Cloud IT Initiatives
Agenda CFO commentary Product and Services Income Statement Presentation 2017 Cash Flow Performance 2017 Tax Cuts and Jobs Act ASC 606 – Revenue Recognition
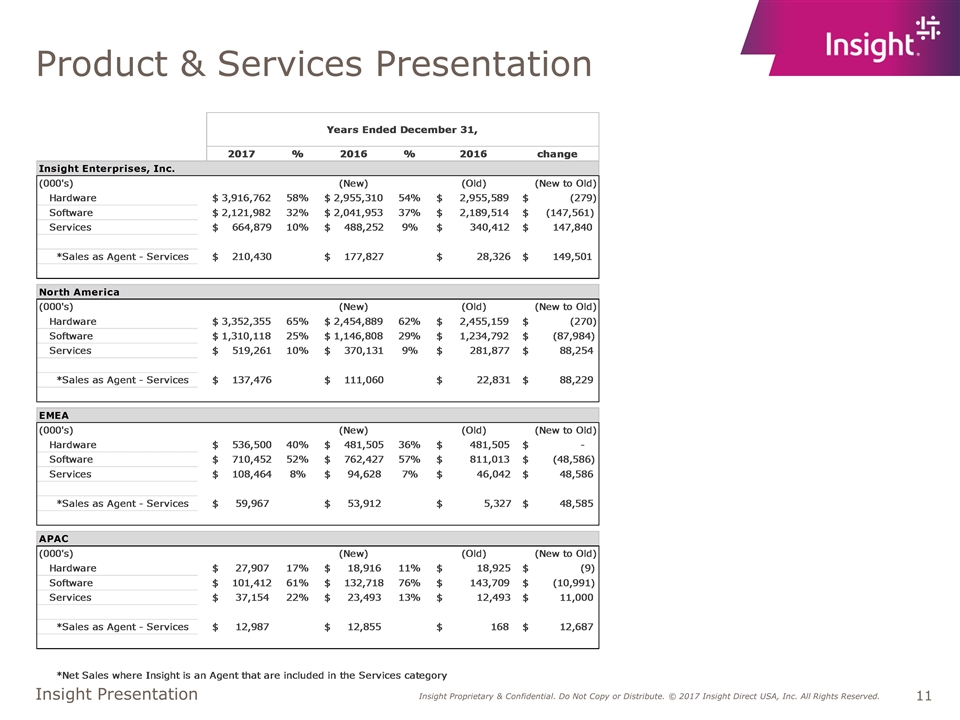
Product & Services Presentation
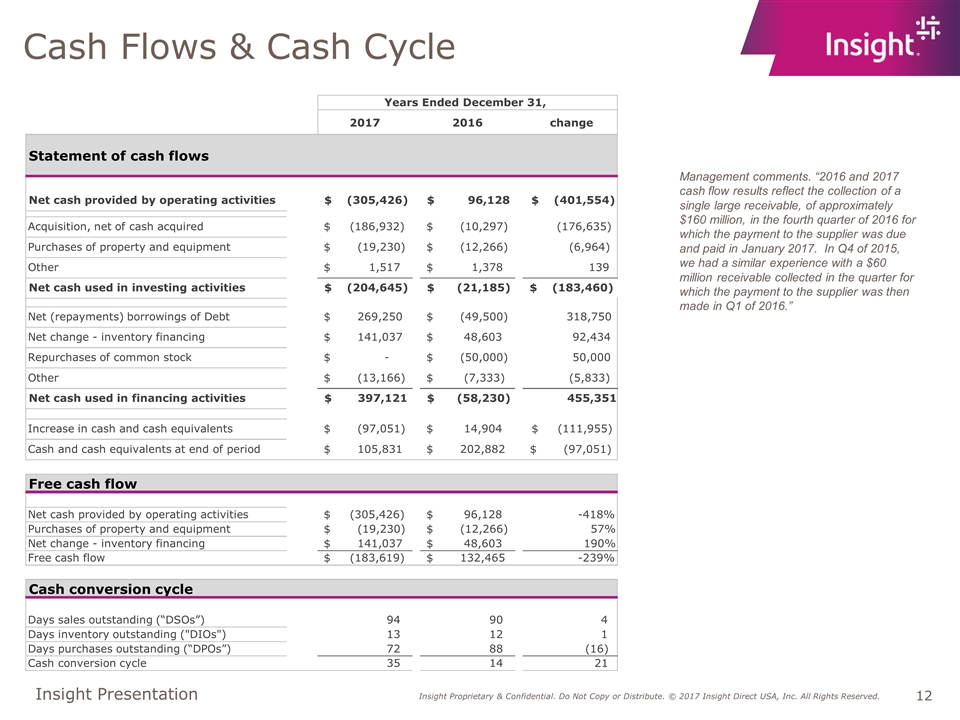
Cash Flows & Cash Cycle Management comments. “2016 and 2017 cash flow results reflect the collection of a single large receivable, of approximately $160 million, in the fourth quarter of 2016 for which the payment to the supplier was due and paid in January 2017. In Q4 of 2015, we had a similar experience with a $60 million receivable collected in the quarter for which the payment to the supplier was then made in Q1 of 2016.” 2017 2016 change Net cash provided by operating activities $ (305,426) $ 96,128 $ (401,554) Acquisition, net of cash acquired $ (186,932) $ (10,297) (176,635) Purchases of property and equipment $ (19,230) $ (12,266) (6,964) Other $ 1,517 $ 1,378 139 Net cash used in investing activities $ (204,645) $ (21,185) $ (183,460) Net (repayments) borrowings of Debt $ 269,250 $ (49,500) 318,750 Net change - inventory financing $ 141,037 $ 48,603 92,434 Repurchases of common stock $ - $ (50,000) 50,000 Other $ (13,166) $ (7,333) (5,833) Net cash used in financing activities $ 397,121 $ (58,230) 455,351 Increase in cash and cash equivalents $ (97,051) $ 14,904 $ (111,955) Cash and cash equivalents at end of period $ 105,831 $ 202,882 $ (97,051) Free cash flow Net cash provided by operating activities $ (305,426) $ 96,128 -418% Purchases of property and equipment $ (19,230) $ (12,266) 57% Net change - inventory financing $ 141,037 $ 48,603 190% Free cash flow $ (183,619) $ 132,465 -239% Days sales outstanding (“DSOs”) 94 90 4 Days inventory outstanding ("DIOs") 13 12 1 Days purchases outstanding (“DPOs”) 72 88 (16) Cash conversion cycle 35 14 21 Cash conversion cycle Years Ended December 31, Statement of cash flows
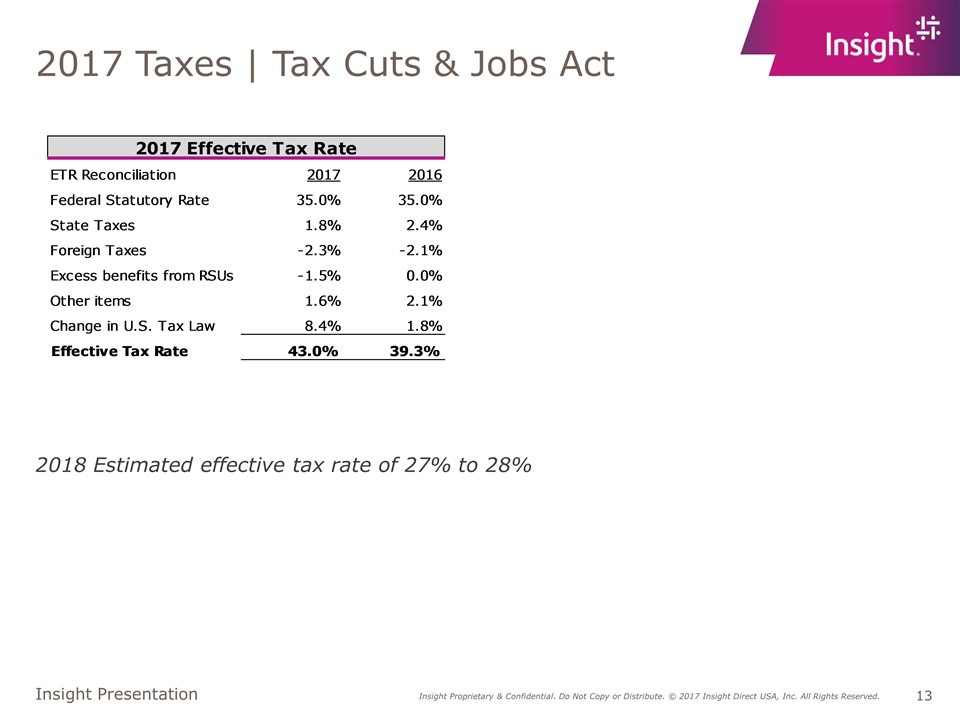
2017 Taxes | Tax Cuts & Jobs Act 2018 Estimated effective tax rate of 27% to 28%
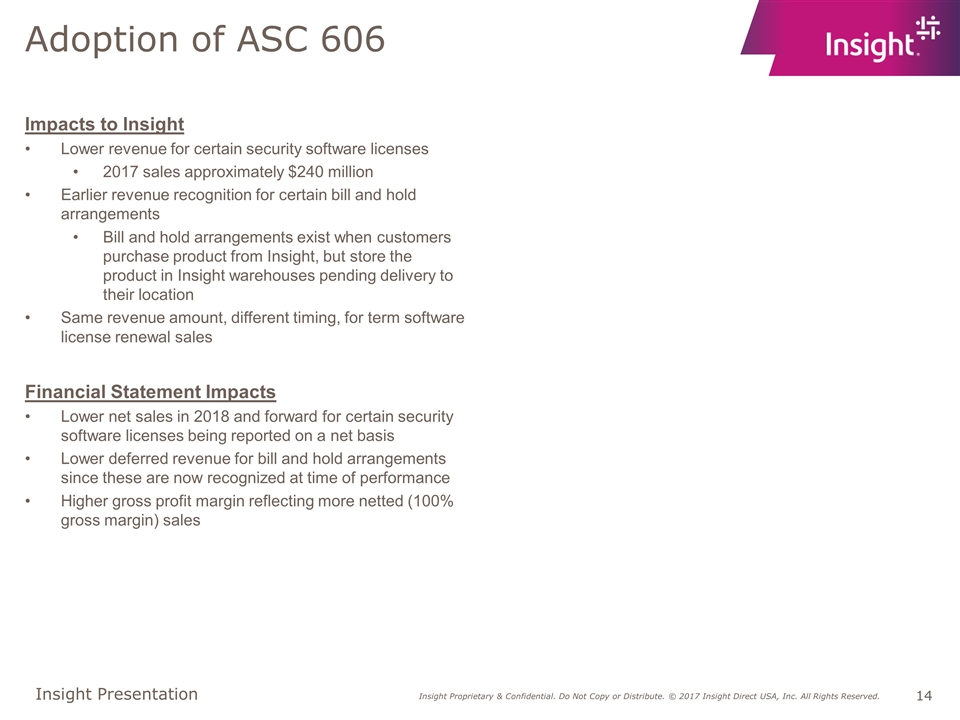
Adoption of ASC 606 Impacts to Insight Lower revenue for certain security software licenses 2017 sales approximately $240 million Earlier revenue recognition for certain bill and hold arrangements Bill and hold arrangements exist when customers purchase product from Insight, but store the product in Insight warehouses pending delivery to their location Same revenue amount, different timing, for term software license renewal sales Financial Statement Impacts Lower net sales in 2018 and forward for certain security software licenses being reported on a net basis Lower deferred revenue for bill and hold arrangements since these are now recognized at time of performance Higher gross profit margin reflecting more netted (100% gross margin) sales
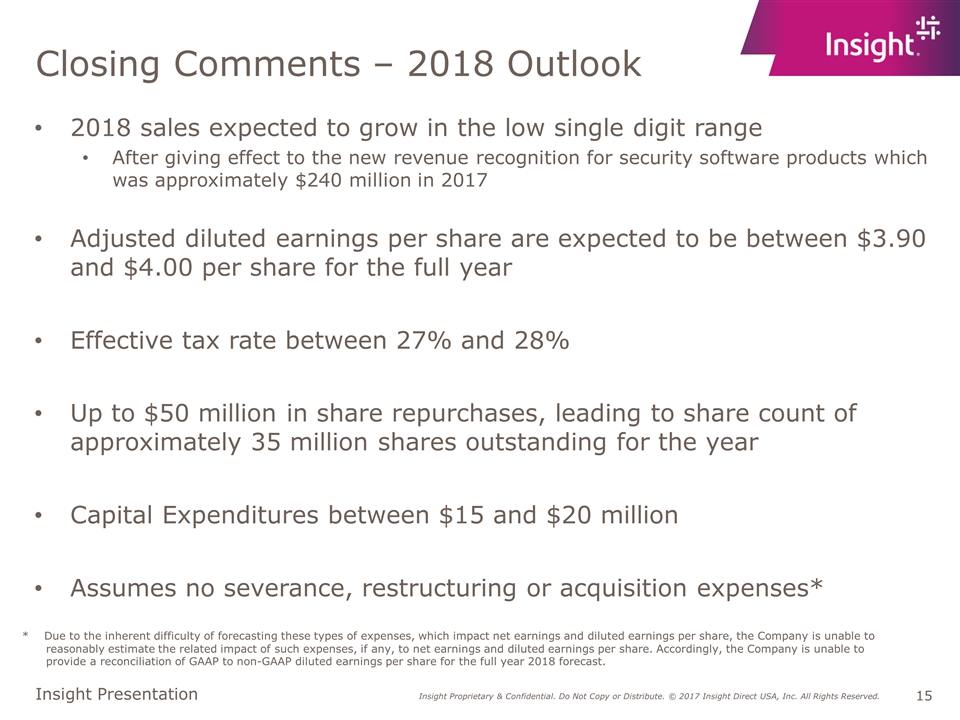
Closing Comments – 2018 Outlook 2018 sales expected to grow in the low single digit range After giving effect to the new revenue recognition for security software products which was approximately $240 million in 2017 Adjusted diluted earnings per share are expected to be between $3.90 and $4.00 per share for the full year Effective tax rate between 27% and 28% Up to $50 million in share repurchases, leading to share count of approximately 35 million shares outstanding for the year Capital Expenditures between $15 and $20 million Assumes no severance, restructuring or acquisition expenses* * Due to the inherent difficulty of forecasting these types of expenses, which impact net earnings and diluted earnings per share, the Company is unable to reasonably estimate the related impact of such expenses, if any, to net earnings and diluted earnings per share. Accordingly, the Company is unable to provide a reconciliation of GAAP to non-GAAP diluted earnings per share for the full year 2018 forecast.
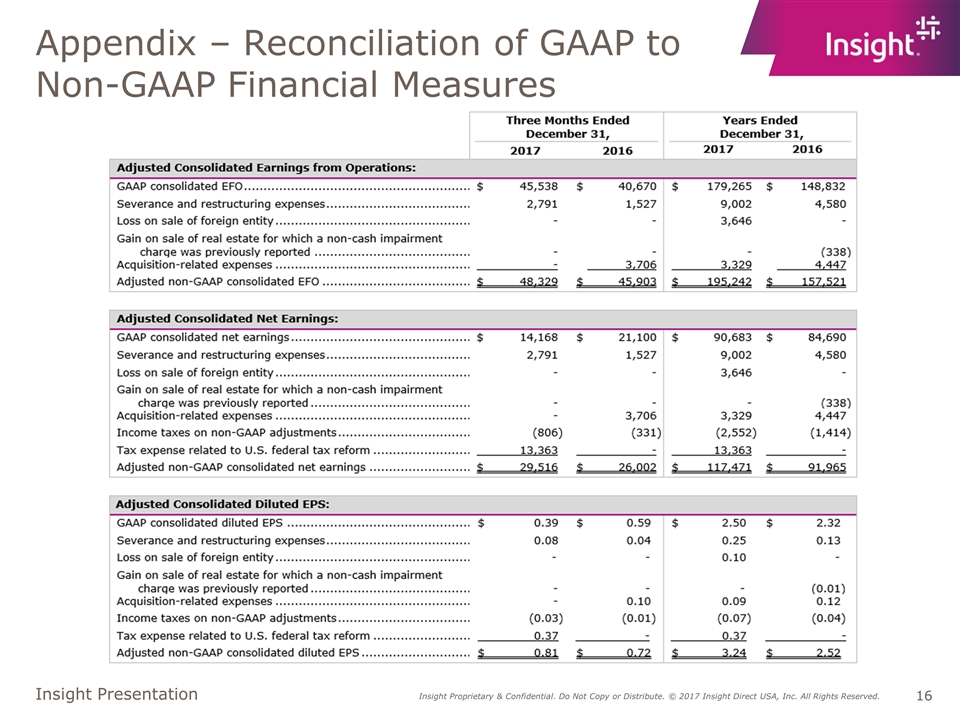
Appendix – Reconciliation of GAAP to Non-GAAP Financial Measures
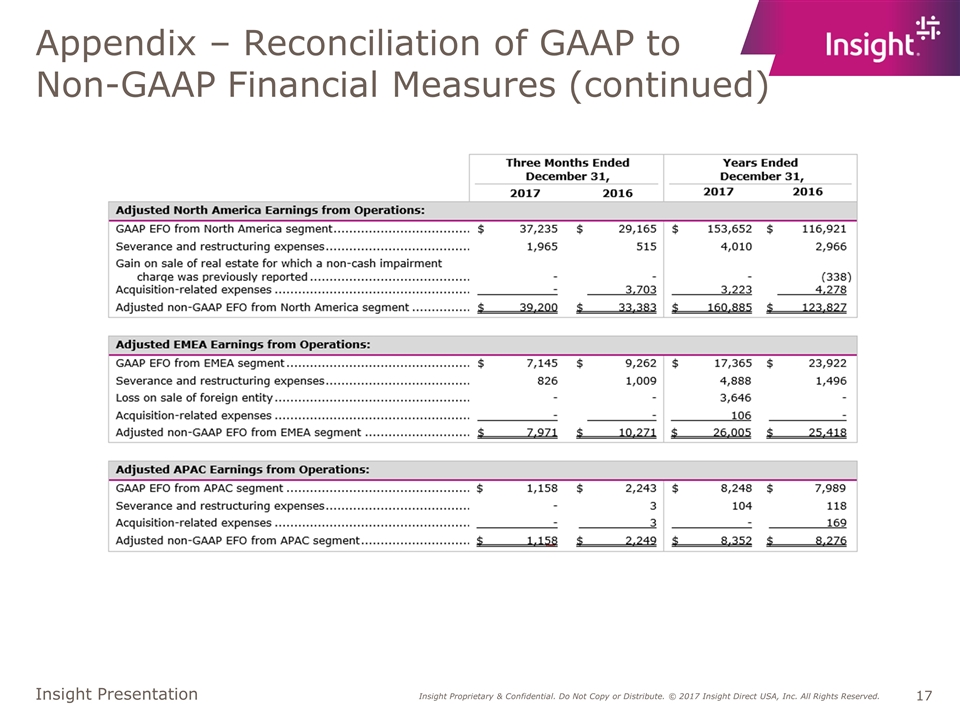
Appendix – Reconciliation of GAAP to Non-GAAP Financial Measures (continued)
