Attached files
| file | filename |
|---|---|
| EX-99.1 - EX-99.1 - Paycom Software, Inc. | d444593dex991.htm |
| 8-K - FORM 8-K - Paycom Software, Inc. | d444593d8k.htm |

ASC 606 Transition Exhibit 99.2
To supplement our financial information presented in accordance with generally accepted accounting principles in the United States (“GAAP”), we consider and have included certain non-GAAP financial measures in this presentation, including Adjusted EBITDA and non-GAAP net income. Management uses Adjusted EBITDA and non-GAAP net income as supplemental measures to review and assess the performance of our core business operations and for planning purposes. We define (i) Adjusted EBITDA as net income plus interest expense, taxes, depreciation and amortization, non-cash stock-based compensation expense, loss on early repayment of debt, certain transaction expenses that are not core to our operations and the change in fair value of our interest rate swap and (ii) non-GAAP net income as net income plus non-cash stock-based compensation expense, certain transaction expenses that are not core to our operations, loss on early repayment of debt and the change in the value of our interest rate swap, all of which are adjusted for the effect of income taxes. Adjusted EBITDA and non-GAAP net income are metrics that provide investors with greater transparency to the information used by management in its financial and operational decision-making. We believe these metrics are useful to investors because they facilitate comparisons of our core business operations across periods on a consistent basis, as well as comparisons with the results of peer companies, many of which use similar non-GAAP financial measures to supplement results under GAAP. In addition, Adjusted EBITDA is a measure that provides useful information to management about the amount of cash available for reinvestment in our business, repurchasing common stock and other purposes. Management believes that the non-GAAP measures presented in this presentation, when viewed in combination with our results prepared in accordance with GAAP, provide a more complete understanding of the factors and trends affecting our business and performance. Adjusted EBITDA and non-GAAP net income are not measures of financial performance under GAAP and should not be considered a substitute for net income, which we consider to be the most directly comparable GAAP measure. Adjusted EBITDA and non-GAAP net income have limitations as analytical tools, and when assessing our operating performance, you should not consider Adjusted EBITDA or non-GAAP net income in isolation, or as a substitute for net income or other consolidated statements of income data prepared in accordance with GAAP. Adjusted EBITDA and non-GAAP net income may not be comparable to similar titled measures of other companies and other companies may not calculate such measures in the same manner as we do. Use of Non-GAAP Financial Information
Table of Contents I. Summary 4 II. Financial Impact of ASC 606 Transition 6 III. Recast Financial Statements and Non-GAAP Reconciliations 15

Summary
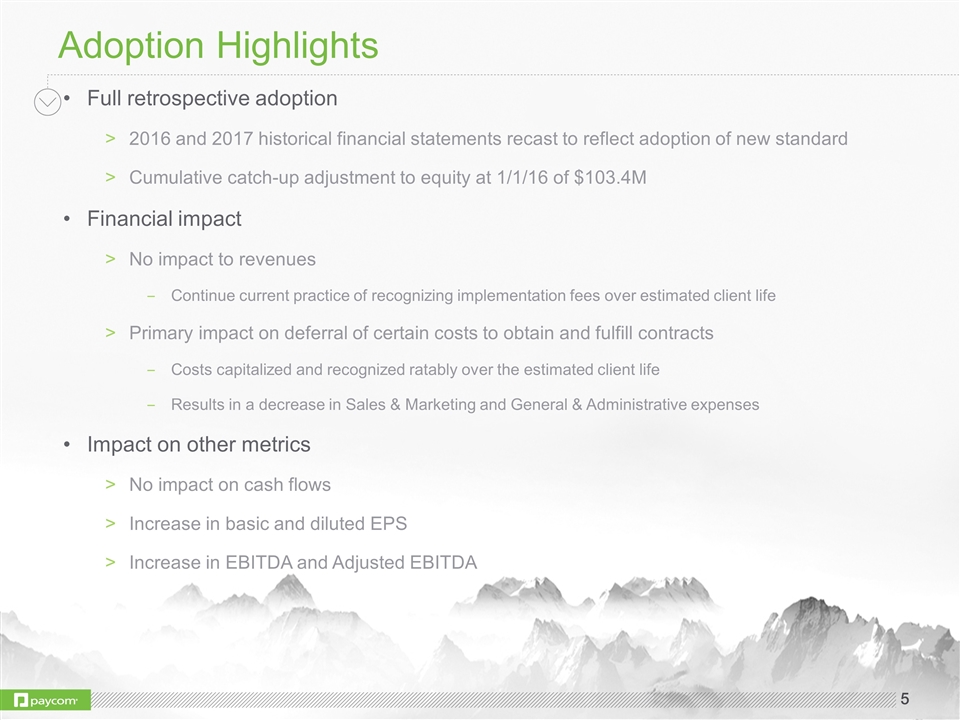
Adoption Highlights Full retrospective adoption 2016 and 2017 historical financial statements recast to reflect adoption of new standard Cumulative catch-up adjustment to equity at 1/1/16 of $103.4M Financial impact No impact to revenues Continue current practice of recognizing implementation fees over estimated client life Primary impact on deferral of certain costs to obtain and fulfill contracts Costs capitalized and recognized ratably over the estimated client life Results in a decrease in Sales & Marketing and General & Administrative expenses Impact on other metrics No impact on cash flows Increase in basic and diluted EPS Increase in EBITDA and Adjusted EBITDA

Financial Impact of ASC 606 Transition
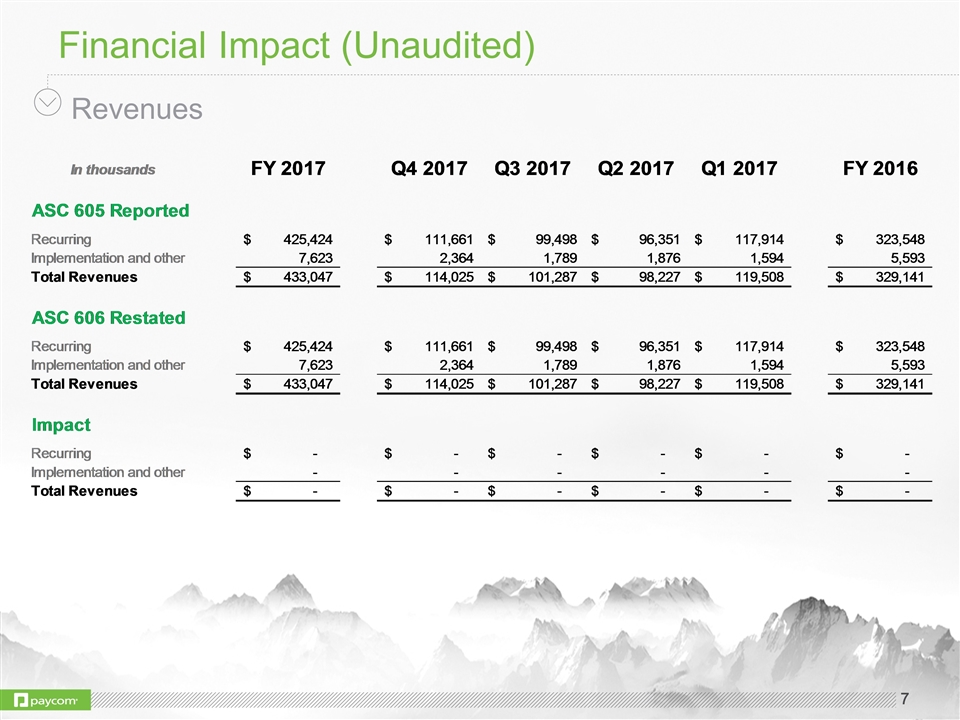
Financial Impact (Unaudited) Revenues
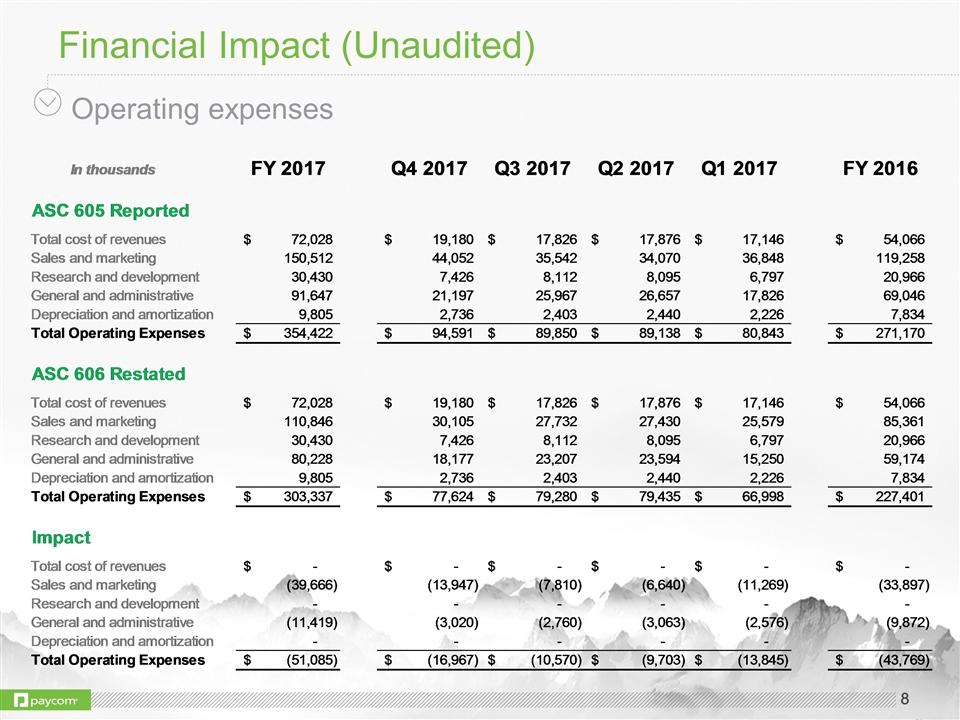
Financial Impact (Unaudited) Operating expenses
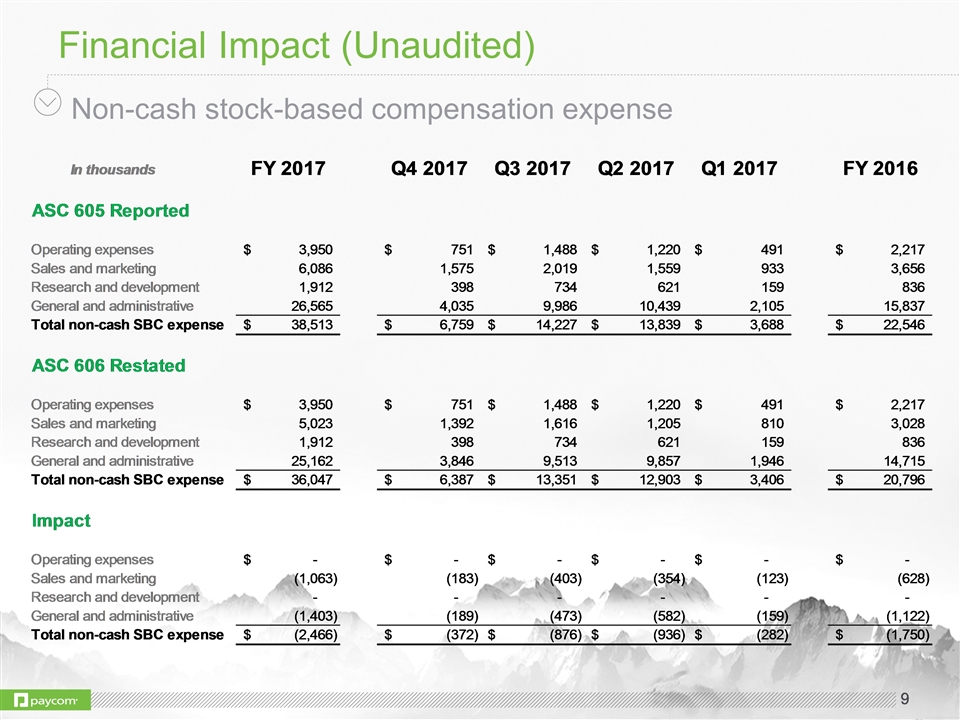
Financial Impact (Unaudited) Non-cash stock-based compensation expense
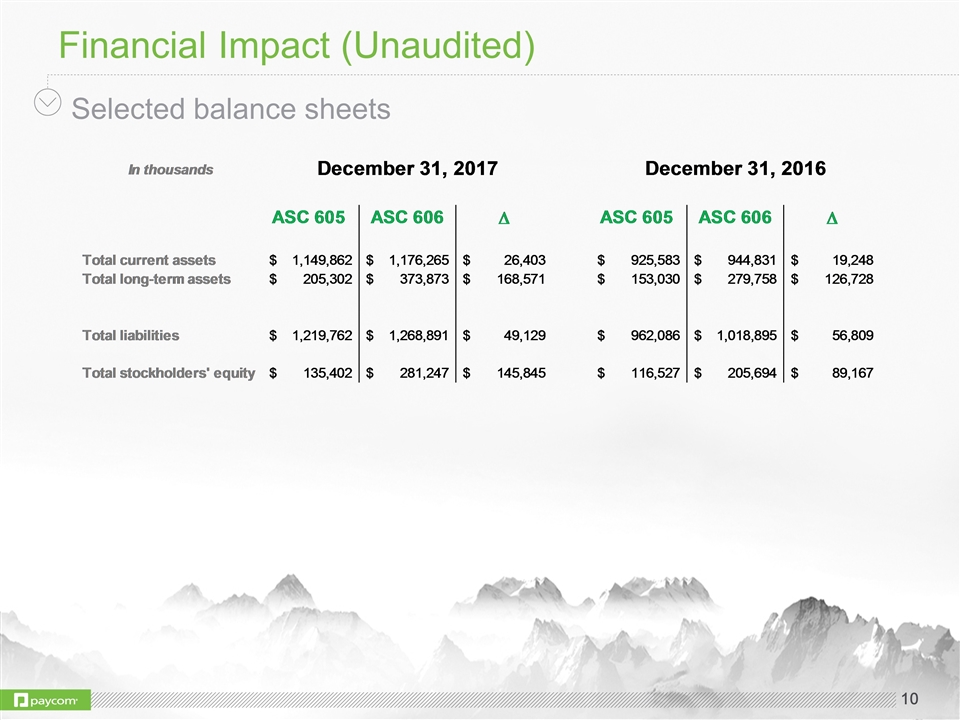
Financial Impact (Unaudited) Selected balance sheets
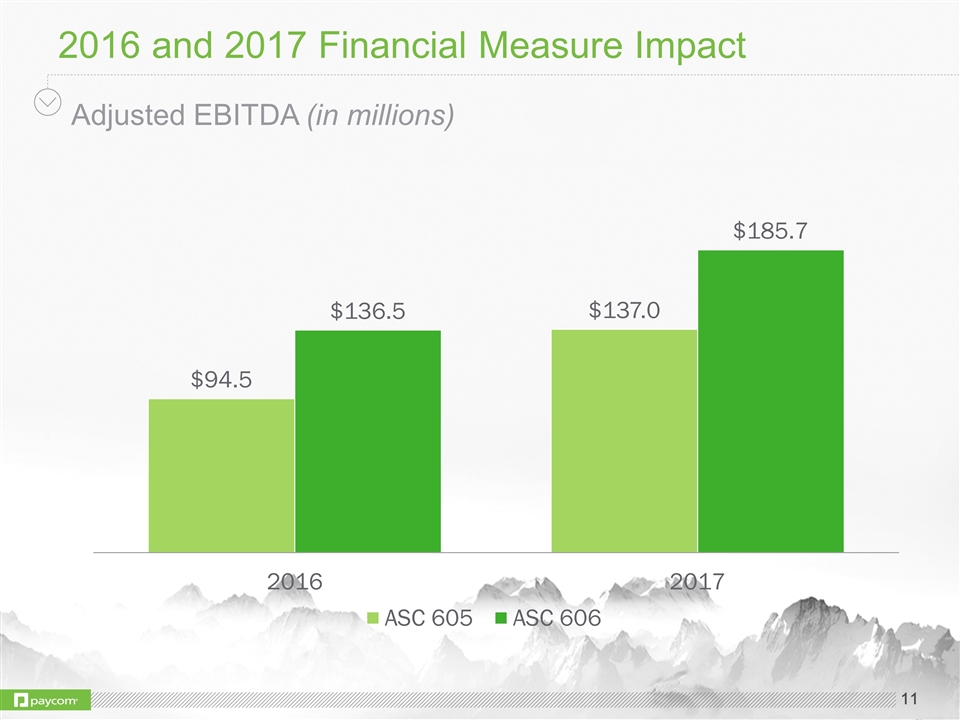
2016 and 2017 Financial Measure Impact Adjusted EBITDA (in millions)
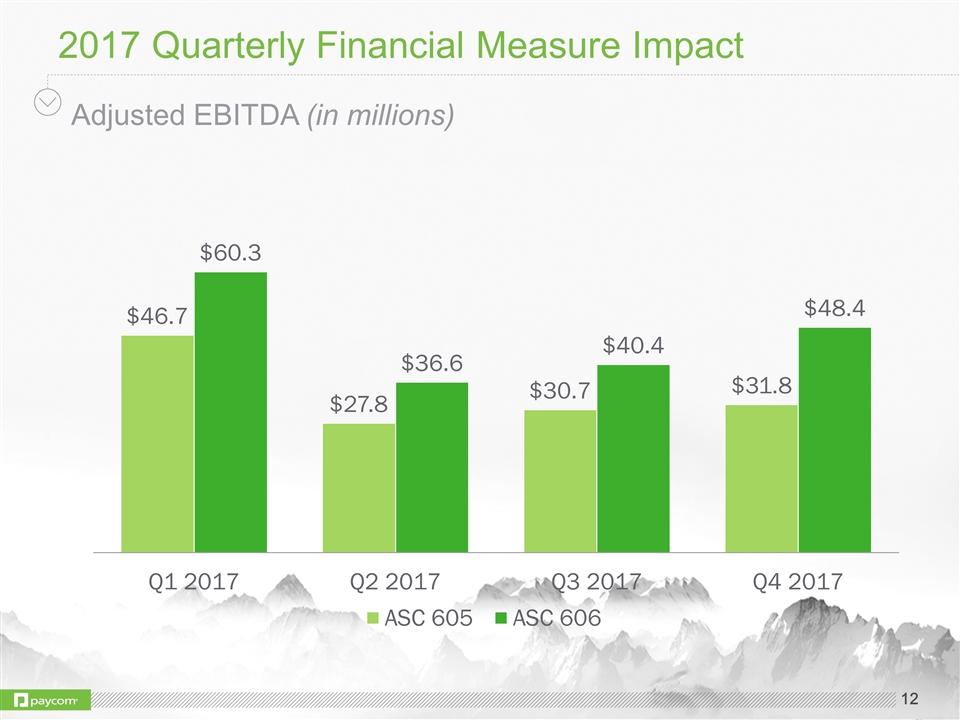
2017 Quarterly Financial Measure Impact Adjusted EBITDA (in millions)
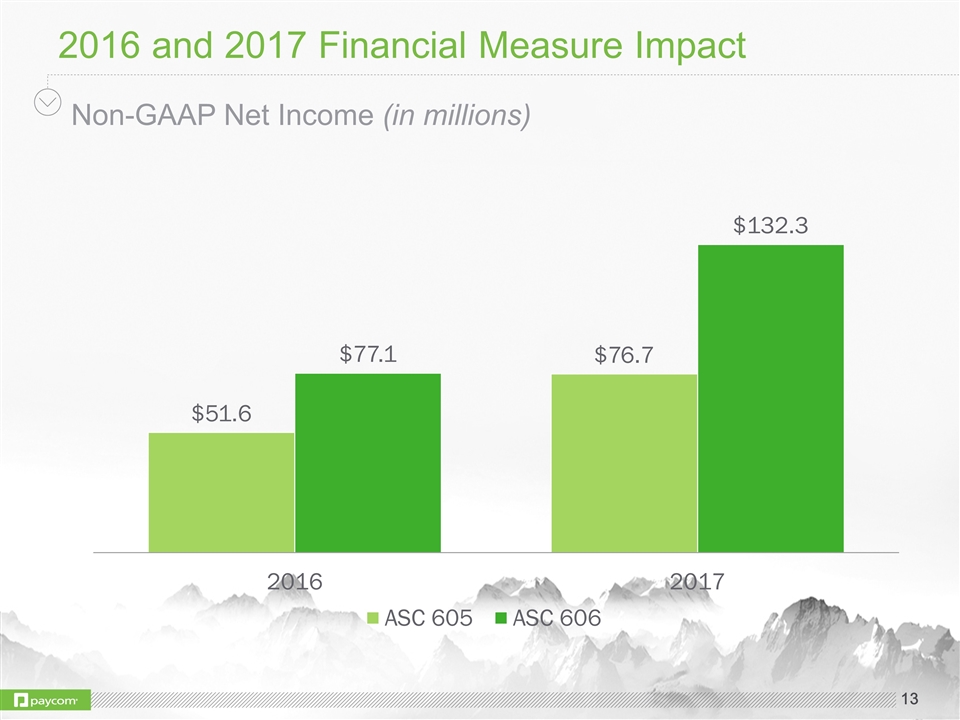
2016 and 2017 Financial Measure Impact Non-GAAP Net Income (in millions)
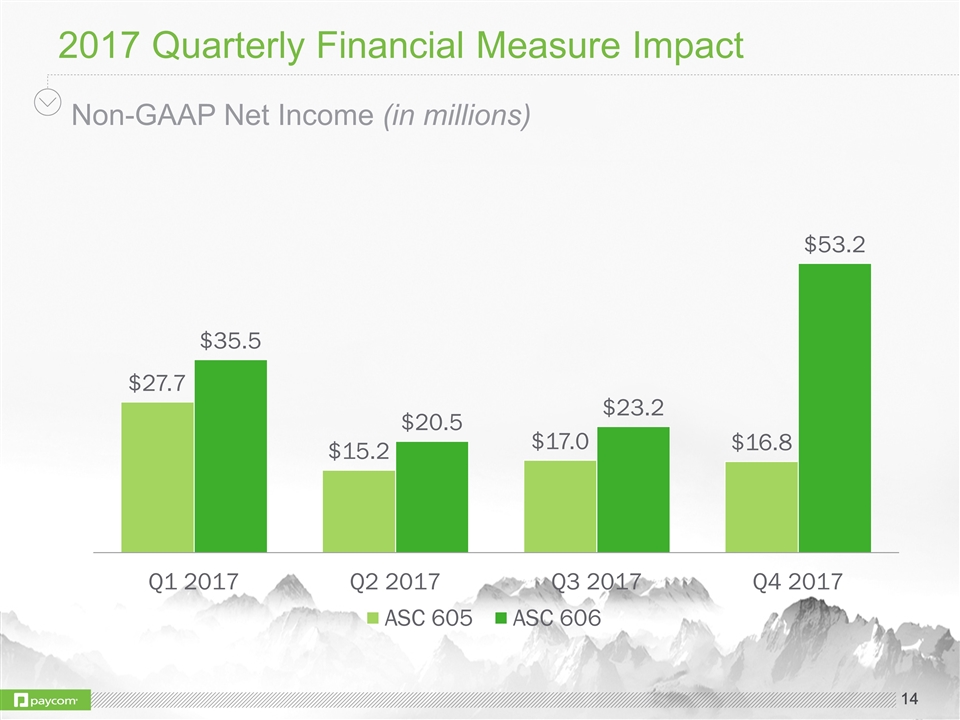
2017 Quarterly Financial Measure Impact Non-GAAP Net Income (in millions)

Recast Financial Statements and Non-GAAP Reconciliations
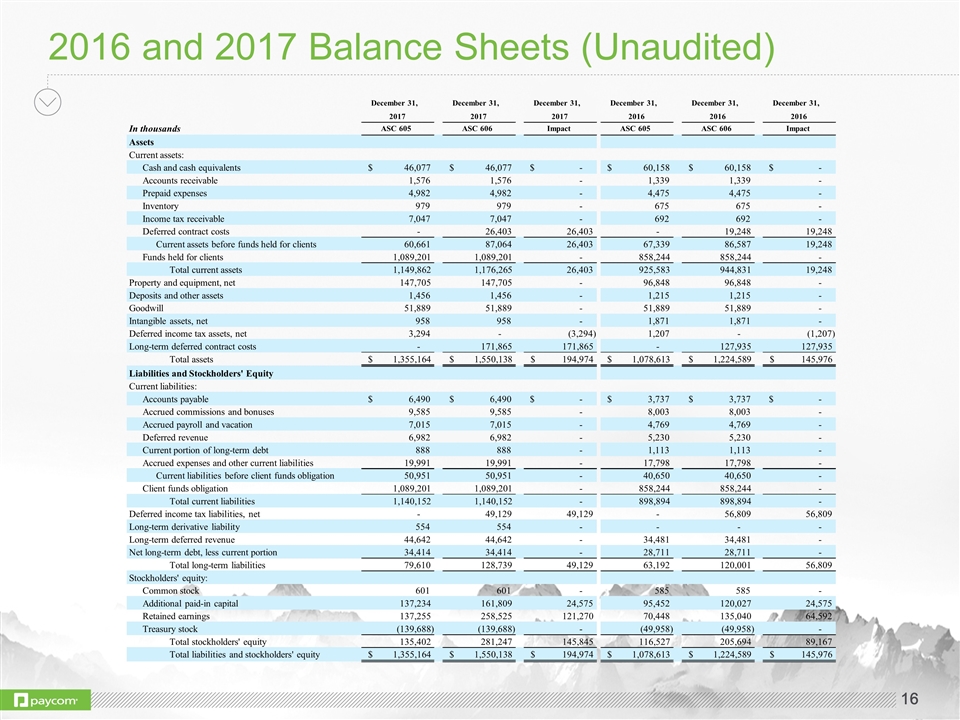
2016 and 2017 Balance Sheets (Unaudited) December 31, December 31, December 31, December 31, December 31, December 31, 2017 2017 2017 2016 2016 2016 In thousands ASC 605 ASC 606 Impact ASC 605 ASC 606 Impact Assets Current assets: Cash and cash equivalents 46,077 $ 46,077 $ - $ 60,158 $ 60,158 $ - $ Accounts receivable 1,576 1,576 - 1,339 1,339 - Prepaid expenses 4,982 4,982 - 4,475 4,475 - Inventory 979 979 - 675 675 - Income tax receivable 7,047 7,047 - 692 692 - Deferred contract costs - 26,403 26,403 - 19,248 19,248 Current assets before funds held for clients 60,661 87,064 26,403 67,339 86,587 19,248 Funds held for clients 1,089,201 1,089,201 - 858,244 858,244 - Total current assets 1,149,862 1,176,265 26,403 925,583 944,831 19,248 Property and equipment, net 147,705 147,705 - 96,848 96,848 - Deposits and other assets 1,456 1,456 - 1,215 1,215 - Goodwill 51,889 51,889 - 51,889 51,889 - Intangible assets, net 958 958 - 1,871 1,871 - Deferred income tax assets, net 3,294 - (3,294) 1,207 - (1,207) Long-term deferred contract costs - 171,865 171,865 - 127,935 127,935 Total assets 1,355,164 $ 1,550,138 $ 194,974 $ 1,078,613 $ 1,224,589 $ 145,976 $ Liabilities and Stockholders' Equity Current liabilities: Accounts payable 6,490 $ 6,490 $ - $ 3,737 $ 3,737 $ - $ Accrued commissions and bonuses 9,585 9,585 - 8,003 8,003 - Accrued payroll and vacation 7,015 7,015 - 4,769 4,769 - Deferred revenue 6,982 6,982 - 5,230 5,230 - Current portion of long-term debt 888 888 - 1,113 1,113 - Accrued expenses and other current liabilities 19,991 19,991 - 17,798 17,798 - Current liabilities before client funds obligation 50,951 50,951 - 40,650 40,650 - Client funds obligation 1,089,201 1,089,201 - 858,244 858,244 - Total current liabilities 1,140,152 1,140,152 - 898,894 898,894 - Deferred income tax liabilities, net - 49,129 49,129 - 56,809 56,809 Long-term derivative liability 554 554 - - - - Long-term deferred revenue 44,642 44,642 - 34,481 34,481 - Net long-term debt, less current portion 34,414 34,414 - 28,711 28,711 - Total long-term liabilities 79,610 128,739 49,129 63,192 120,001 56,809 Stockholders' equity: Common stock 601 601 - 585 585 - Additional paid-in capital 137,234 161,809 24,575 95,452 120,027 24,575 Retained earnings 137,255 258,525 121,270 70,448 135,040 64,592 Treasury stock (139,688) (139,688) - (49,958) (49,958) - Total stockholders' equity 135,402 281,247 145,845 116,527 205,694 89,167 Total liabilities and stockholders' equity 1,355,164 $ 1,550,138 $ 194,974 $ 1,078,613 $ 1,224,589 $ 145,976 $
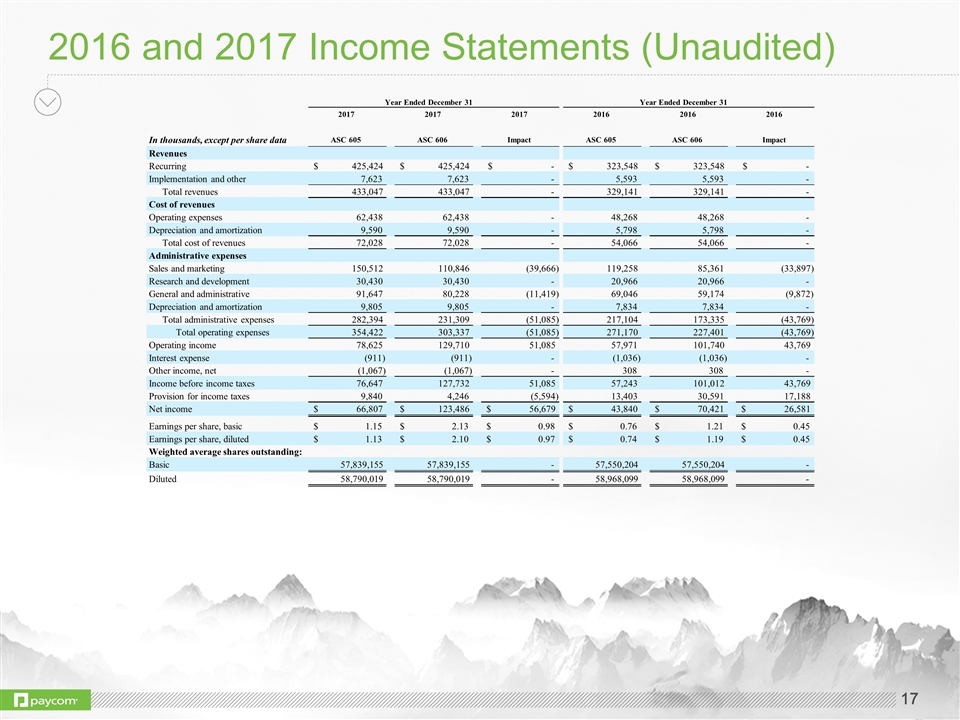
2016 and 2017 Income Statements (Unaudited) 2017 2017 2017 2016 2016 2016 In thousands, except per share data ASC 605 ASC 606 Impact ASC 605 ASC 606 Impact Revenues Recurring 425,424 $ 425,424 $ - $ 323,548 $ 323,548 $ - $ Implementation and other 7,623 7,623 - 5,593 5,593 - Total revenues 433,047 433,047 - 329,141 329,141 - Cost of revenues Operating expenses 62,438 62,438 - 48,268 48,268 - Depreciation and amortization 9,590 9,590 - 5,798 5,798 - Total cost of revenues 72,028 72,028 - 54,066 54,066 - Administrative expenses Sales and marketing 150,512 110,846 (39,666) 119,258 85,361 (33,897) Research and development 30,430 30,430 - 20,966 20,966 - General and administrative 91,647 80,228 (11,419) 69,046 59,174 (9,872) Depreciation and amortization 9,805 9,805 - 7,834 7,834 - Total administrative expenses 282,394 231,309 (51,085) 217,104 173,335 (43,769) Total operating expenses 354,422 303,337 (51,085) 271,170 227,401 (43,769) Operating income 78,625 129,710 51,085 57,971 101,740 43,769 Interest expense (911) (911) - (1,036) (1,036) - Other income, net (1,067) (1,067) - 308 308 - Income before income taxes 76,647 127,732 51,085 57,243 101,012 43,769 Provision for income taxes 9,840 4,246 (5,594) 13,403 30,591 17,188 Net income 66,807 $ 123,486 $ 56,679 $ 43,840 $ 70,421 $ 26,581 $ Earnings per share, basic 1.15 $ 2.13 $ 0.98 $ 0.76 $ 1.21 $ 0.45 $ Earnings per share, diluted 1.13 $ 2.10 $ 0.97 $ 0.74 $ 1.19 $ 0.45 $ Weighted average shares outstanding: Basic 57,839,155 57,839,155 - 57,550,204 57,550,204 - Diluted 58,790,019 58,790,019 - 58,968,099 58,968,099 - Year Ended December 31 Year Ended December 31
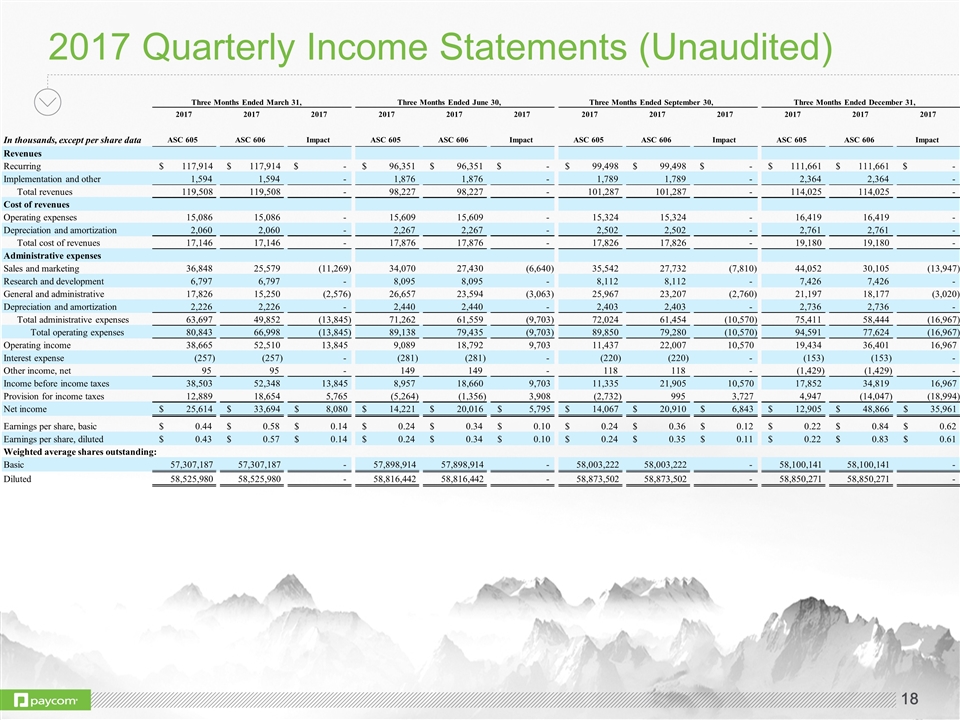
2017 Quarterly Income Statements (Unaudited) 2017 2017 2017 2017 2017 2017 2017 2017 2017 2017 2017 2017 In thousands, except per share data ASC 605 ASC 606 Impact ASC 605 ASC 606 Impact ASC 605 ASC 606 Impact ASC 605 ASC 606 Impact Revenues Recurring 117,914 $ 117,914 $ - $ 96,351 $ 96,351 $ - $ 99,498 $ 99,498 $ - $ 111,661 $ 111,661 $ - $ Implementation and other 1,594 1,594 - 1,876 1,876 - 1,789 1,789 - 2,364 2,364 - Total revenues 119,508 119,508 - 98,227 98,227 - 101,287 101,287 - 114,025 114,025 - Cost of revenues Operating expenses 15,086 15,086 - 15,609 15,609 - 15,324 15,324 - 16,419 16,419 - Depreciation and amortization 2,060 2,060 - 2,267 2,267 - 2,502 2,502 - 2,761 2,761 - Total cost of revenues 17,146 17,146 - 17,876 17,876 - 17,826 17,826 - 19,180 19,180 - Administrative expenses Sales and marketing 36,848 25,579 (11,269) 34,070 27,430 (6,640) 35,542 27,732 (7,810) 44,052 30,105 (13,947) Research and development 6,797 6,797 - 8,095 8,095 - 8,112 8,112 - 7,426 7,426 - General and administrative 17,826 15,250 (2,576) 26,657 23,594 (3,063) 25,967 23,207 (2,760) 21,197 18,177 (3,020) Depreciation and amortization 2,226 2,226 - 2,440 2,440 - 2,403 2,403 - 2,736 2,736 - Total administrative expenses 63,697 49,852 (13,845) 71,262 61,559 (9,703) 72,024 61,454 (10,570) 75,411 58,444 (16,967) Total operating expenses 80,843 66,998 (13,845) 89,138 79,435 (9,703) 89,850 79,280 (10,570) 94,591 77,624 (16,967) Operating income 38,665 52,510 13,845 9,089 18,792 9,703 11,437 22,007 10,570 19,434 36,401 16,967 Interest expense (257) (257) - (281) (281) - (220) (220) - (153) (153) - Other income, net 95 95 - 149 149 - 118 118 - (1,429) (1,429) - Income before income taxes 38,503 52,348 13,845 8,957 18,660 9,703 11,335 21,905 10,570 17,852 34,819 16,967 Provision for income taxes 12,889 18,654 5,765 (5,264) (1,356) 3,908 (2,732) 995 3,727 4,947 (14,047) (18,994) Net income 25,614 $ 33,694 $ 8,080 $ 14,221 $ 20,016 $ 5,795 $ 14,067 $ 20,910 $ 6,843 $ 12,905 $ 48,866 $ 35,961 $ Earnings per share, basic 0.44 $ 0.58 $ 0.14 $ 0.24 $ 0.34 $ 0.10 $ 0.24 $ 0.36 $ 0.12 $ 0.22 $ 0.84 $ 0.62 $ Earnings per share, diluted 0.43 $ 0.57 $ 0.14 $ 0.24 $ 0.34 $ 0.10 $ 0.24 $ 0.35 $ 0.11 $ 0.22 $ 0.83 $ 0.61 $ Weighted average shares outstanding: Basic 57,307,187 57,307,187 - 57,898,914 57,898,914 - 58,003,222 58,003,222 - 58,100,141 58,100,141 - Diluted 58,525,980 58,525,980 - 58,816,442 58,816,442 - 58,873,502 58,873,502 - 58,850,271 58,850,271 - Three Months Ended December 31, Three Months Ended March 31, Three Months Ended June 30, Three Months Ended September 30,
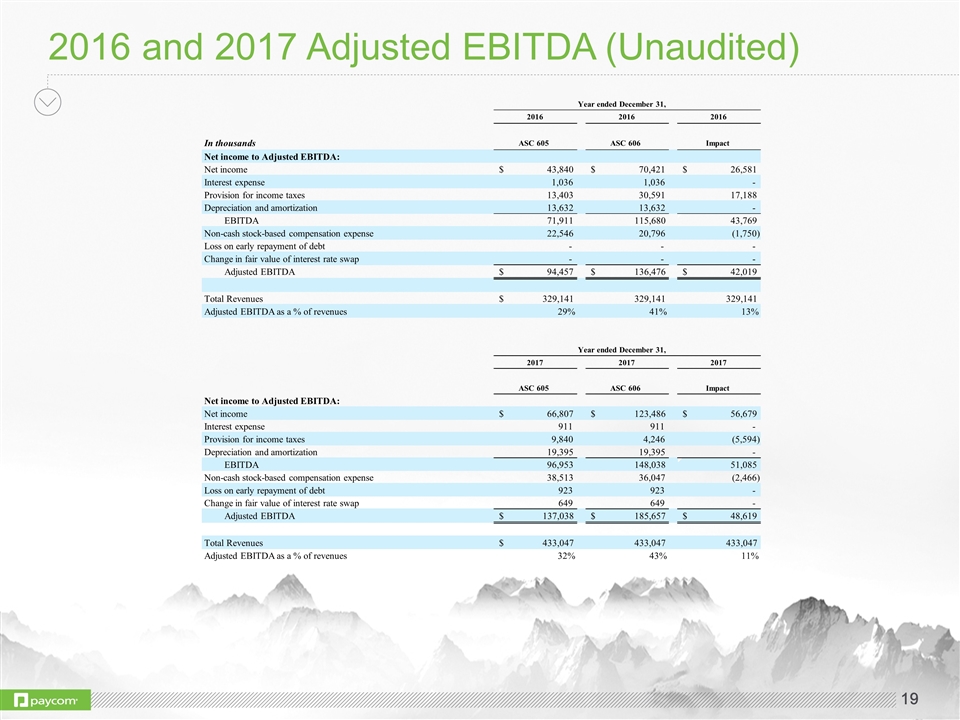
2016 and 2017 Adjusted EBITDA (Unaudited) 2016 2016 2016 In thousands ASC 605 ASC 606 Impact Net income to Adjusted EBITDA: Net income 43,840 $ 70,421 $ 26,581 $ Interest expense 1,036 1,036 - Provision for income taxes 13,403 30,591 17,188 Depreciation and amortization 13,632 13,632 - EBITDA 71,911 115,680 43,769 Non-cash stock-based compensation expense 22,546 20,796 (1,750) Loss on early repayment of debt - - - Change in fair value of interest rate swap - - - Adjusted EBITDA 94,457 $ 136,476 $ 42,019 $ Total Revenues 329,141 $ 329,141 329,141 Adjusted EBITDA as a % of revenues 29% 41% 13% 2017 2017 2017 ASC 605 ASC 606 Impact Net income to Adjusted EBITDA: Net income 66,807 $ 123,486 $ 56,679 $ Interest expense 911 911 - Provision for income taxes 9,840 4,246 (5,594) Depreciation and amortization 19,395 19,395 - EBITDA 96,953 148,038 51,085 Non-cash stock-based compensation expense 38,513 36,047 (2,466) Loss on early repayment of debt 923 923 - Change in fair value of interest rate swap 649 649 - Adjusted EBITDA 137,038 $ 185,657 $ 48,619 $ Total Revenues 433,047 $ 433,047 433,047 Adjusted EBITDA as a % of revenues 32% 43% 11% Year ended December 31, Year ended December 31,
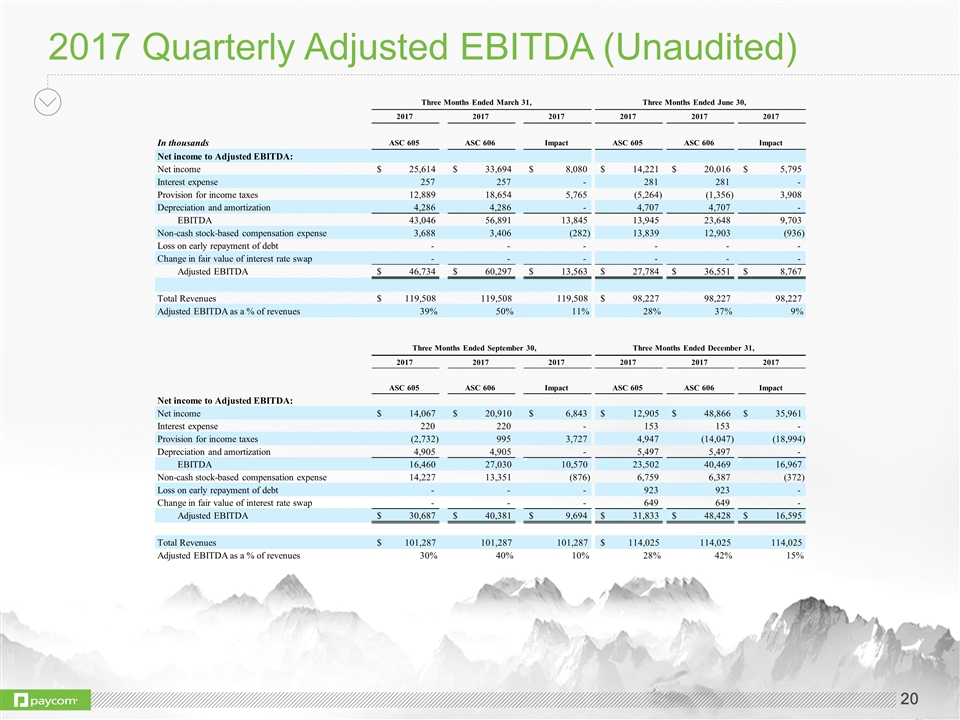
2017 Quarterly Adjusted EBITDA (Unaudited) 2017 2017 2017 2017 2017 2017 In thousands ASC 605 ASC 606 Impact ASC 605 ASC 606 Impact Net income to Adjusted EBITDA: Net income 25,614 $ 33,694 $ 8,080 $ 14,221 $ 20,016 $ 5,795 $ Interest expense 257 257 - 281 281 - Provision for income taxes 12,889 18,654 5,765 (5,264) (1,356) 3,908 Depreciation and amortization 4,286 4,286 - 4,707 4,707 - EBITDA 43,046 56,891 13,845 13,945 23,648 9,703 Non-cash stock-based compensation expense 3,688 3,406 (282) 13,839 12,903 (936) Loss on early repayment of debt - - - - - - Change in fair value of interest rate swap - - - - - - Adjusted EBITDA 46,734 $ 60,297 $ 13,563 $ 27,784 $ 36,551 $ 8,767 $ Total Revenues 119,508 $ 119,508 119,508 98,227 $ 98,227 98,227 Adjusted EBITDA as a % of revenues 39% 50% 11% 28% 37% 9% 2017 2017 2017 2017 2017 2017 ASC 605 ASC 606 Impact ASC 605 ASC 606 Impact Net income to Adjusted EBITDA: Net income 14,067 $ 20,910 $ 6,843 $ 12,905 $ 48,866 $ 35,961 $ Interest expense 220 220 - 153 153 - Provision for income taxes (2,732) 995 3,727 4,947 (14,047) (18,994) Depreciation and amortization 4,905 4,905 - 5,497 5,497 - EBITDA 16,460 27,030 10,570 23,502 40,469 16,967 Non-cash stock-based compensation expense 14,227 13,351 (876) 6,759 6,387 (372) Loss on early repayment of debt - - - 923 923 - Change in fair value of interest rate swap - - - 649 649 - Adjusted EBITDA 30,687 $ 40,381 $ 9,694 $ 31,833 $ 48,428 $ 16,595 $ Total Revenues 101,287 $ 101,287 101,287 114,025 $ 114,025 114,025 Adjusted EBITDA as a % of revenues 30% 40% 10% 28% 42% 15% Three Months Ended March 31, Three Months Ended June 30, Three Months Ended September 30, Three Months Ended December 31,
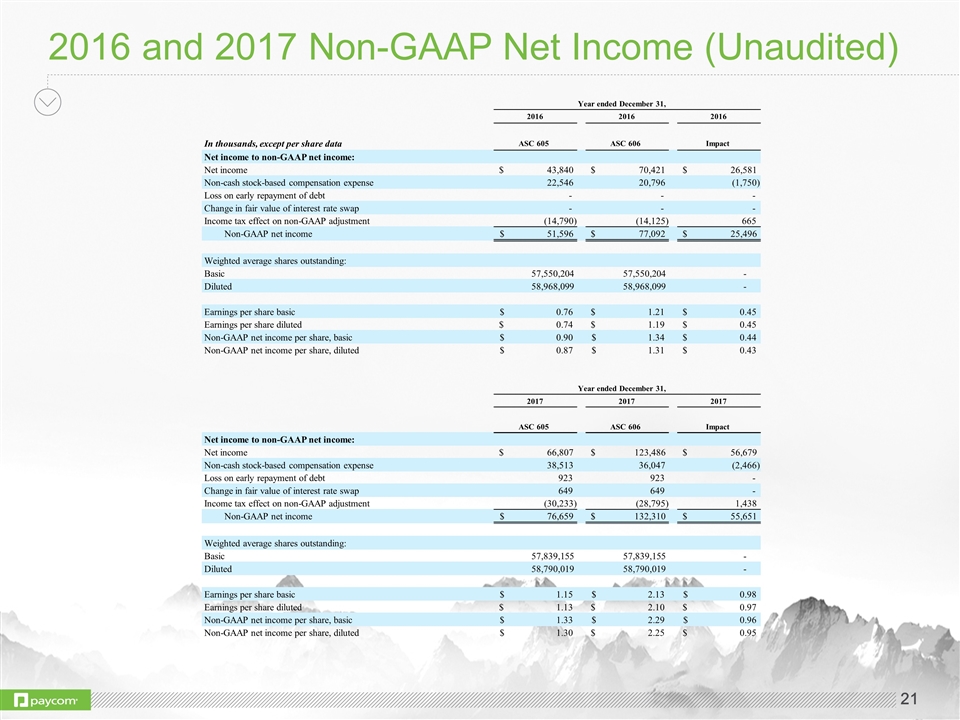
2016 and 2017 Non-GAAP Net Income (Unaudited) 2016 2016 2016 In thousands, except per share data ASC 605 ASC 606 Impact Net income to non-GAAP net income: Net income 43,840 $ 70,421 $ 26,581 $ Non-cash stock-based compensation expense 22,546 20,796 (1,750) Loss on early repayment of debt - - - Change in fair value of interest rate swap - - - Income tax effect on non-GAAP adjustment (14,790) (14,125) 665 Non-GAAP net income 51,596 $ 77,092 $ 25,496 $ Weighted average shares outstanding: Basic 57,550,204 57,550,204 - Diluted 58,968,099 58,968,099 - Earnings per share basic 0.76 $ 1.21 $ 0.45 $ Earnings per share diluted 0.74 $ 1.19 $ 0.45 $ Non-GAAP net income per share, basic 0.90 $ 1.34 $ 0.44 $ Non-GAAP net income per share, diluted 0.87 $ 1.31 $ 0.43 $ 2017 2017 2017 ASC 605 ASC 606 Impact Net income to non-GAAP net income: Net income 66,807 $ 123,486 $ 56,679 $ Non-cash stock-based compensation expense 38,513 36,047 (2,466) Loss on early repayment of debt 923 923 - Change in fair value of interest rate swap 649 649 - Income tax effect on non-GAAP adjustment (30,233) (28,795) 1,438 Non-GAAP net income 76,659 $ 132,310 $ 55,651 $ Weighted average shares outstanding: Basic 57,839,155 57,839,155 - Diluted 58,790,019 58,790,019 - Earnings per share basic 1.15 $ 2.13 $ 0.98 $ Earnings per share diluted 1.13 $ 2.10 $ 0.97 $ Non-GAAP net income per share, basic 1.33 $ 2.29 $ 0.96 $ Non-GAAP net income per share, diluted 1.30 $ 2.25 $ 0.95 $ Year ended December 31, Year ended December 31,
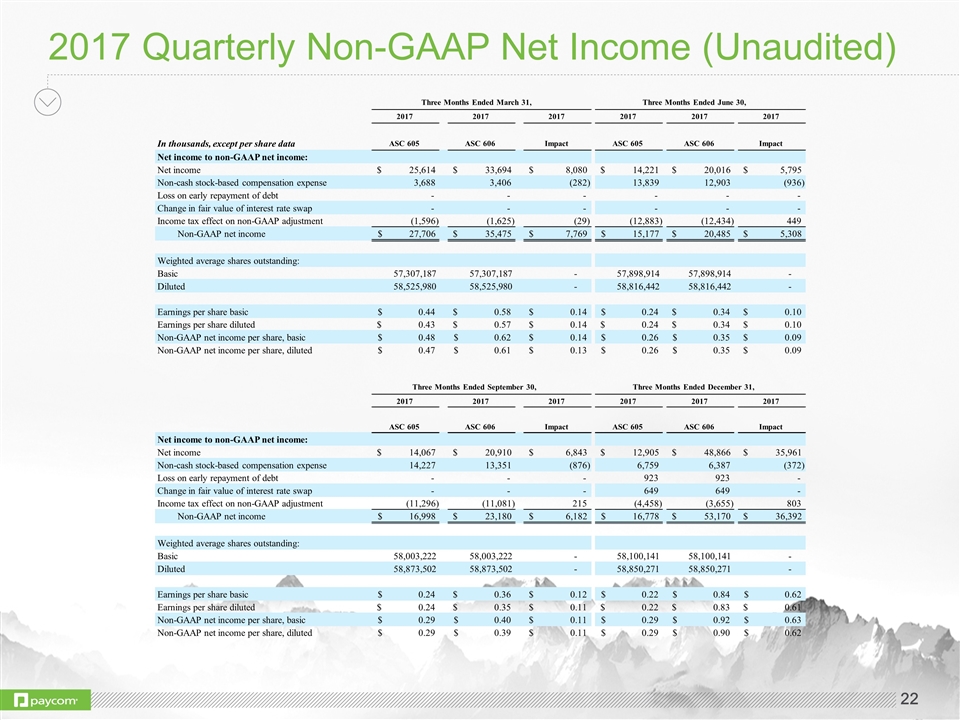
2017 Quarterly Non-GAAP Net Income (Unaudited) 2017 2017 2017 2017 2017 2017 In thousands, except per share data ASC 605 ASC 606 Impact ASC 605 ASC 606 Impact Net income to non-GAAP net income: Net income 25,614 $ 33,694 $ 8,080 $ 14,221 $ 20,016 $ 5,795 $ Non-cash stock-based compensation expense 3,688 3,406 (282) 13,839 12,903 (936) Loss on early repayment of debt - - - - - - Change in fair value of interest rate swap - - - - - - Income tax effect on non-GAAP adjustment (1,596) (1,625) (29) (12,883) (12,434) 449 Non-GAAP net income 27,706 $ 35,475 $ 7,769 $ 15,177 $ 20,485 $ 5,308 $ Weighted average shares outstanding: Basic 57,307,187 57,307,187 - 57,898,914 57,898,914 - Diluted 58,525,980 58,525,980 - 58,816,442 58,816,442 - Earnings per share basic 0.44 $ 0.58 $ 0.14 $ 0.24 $ 0.34 $ 0.10 $ Earnings per share diluted 0.43 $ 0.57 $ 0.14 $ 0.24 $ 0.34 $ 0.10 $ Non-GAAP net income per share, basic 0.48 $ 0.62 $ 0.14 $ 0.26 $ 0.35 $ 0.09 $ Non-GAAP net income per share, diluted 0.47 $ 0.61 $ 0.13 $ 0.26 $ 0.35 $ 0.09 $ 2017 2017 2017 2017 2017 2017 ASC 605 ASC 606 Impact ASC 605 ASC 606 Impact Net income to non-GAAP net income: Net income 14,067 $ 20,910 $ 6,843 $ 12,905 $ 48,866 $ 35,961 $ Non-cash stock-based compensation expense 14,227 13,351 (876) 6,759 6,387 (372) Loss on early repayment of debt - - - 923 923 - Change in fair value of interest rate swap - - - 649 649 - Income tax effect on non-GAAP adjustment (11,296) (11,081) 215 (4,458) (3,655) 803 Non-GAAP net income 16,998 $ 23,180 $ 6,182 $ 16,778 $ 53,170 $ 36,392 $ Weighted average shares outstanding: Basic 58,003,222 58,003,222 - 58,100,141 58,100,141 - Diluted 58,873,502 58,873,502 - 58,850,271 58,850,271 - Earnings per share basic 0.24 $ 0.36 $ 0.12 $ 0.22 $ 0.84 $ 0.62 $ Earnings per share diluted 0.24 $ 0.35 $ 0.11 $ 0.22 $ 0.83 $ 0.61 $ Non-GAAP net income per share, basic 0.29 $ 0.40 $ 0.11 $ 0.29 $ 0.92 $ 0.63 $ Non-GAAP net income per share, diluted 0.29 $ 0.39 $ 0.11 $ 0.29 $ 0.90 $ 0.62 $ Three Months Ended March 31, Three Months Ended June 30, Three Months Ended September 30, Three Months Ended December 31,
