Attached files
| file | filename |
|---|---|
| EX-21.1 - EX-21.1 - Paycom Software, Inc. | payc-ex211_7.htm |
| EX-31.2 - EX-31.2 - Paycom Software, Inc. | payc-ex312_9.htm |
| EX-31.1 - EX-31.1 - Paycom Software, Inc. | payc-ex311_8.htm |
| EX-32.1 - EX-32.1 - Paycom Software, Inc. | payc-ex321_10.htm |
| EX-4.18 - EX-4.18 - Paycom Software, Inc. | payc-ex418_608.htm |
| EX-4.17 - EX-4.17 - Paycom Software, Inc. | payc-ex417_607.htm |
| EX-23.1 - EX-23.1 - Paycom Software, Inc. | payc-ex231_1149.htm |
UNITED STATES
SECURITIES AND EXCHANGE COMMISSION
Washington, D.C. 20549
FORM 10-K
(Mark One)
|
x |
ANNUAL REPORT PURSUANT TO SECTION 13 OR 15(d) OF THE SECURITIES EXCHANGE ACT OF 1934 |
For the fiscal year ended December 31, 2015
or
|
¨ |
TRANSITION REPORT PURSUANT TO SECTION 13 OR 15(d) OF THE SECURITIES EXCHANGE ACT OF 1934 |
For the transition period from to
Commission file number: 001-36393
Paycom Software, Inc.
(Exact name of registrant as specified in its charter)
|
|
|
|
|
Delaware |
|
80-0957485 |
|
(State or other jurisdiction of incorporation or organization) |
|
(I.R.S. Employer Identification Number) |
7501 W. Memorial Road
Oklahoma City, Oklahoma 73142
(Address of registrant’s principal executive offices)
Registrant’s telephone number, including area code: (405) 722-6900
Securities registered pursuant to Section 12(b) of the Act:
|
Title of each class |
|
Name of each exchange on which registered |
|
Common Stock, $0.01 par value |
|
New York Stock Exchange |
Securities registered pursuant to Section 12(g) of the Act:
None
Indicate by check mark if the registrant is a well-known seasoned issuer, as defined in Rule 405 of the Securities Act. Yes x No ¨
Indicate by check mark if the registrant is not required to file reports pursuant to Section 13 or Section 15(d) of the Act. Yes ¨ No x
Indicate by check mark whether the registrant: (1) has filed all reports required to be filed by Section 13 or 15(d) of the Securities Exchange Act of 1934 during the preceding 12 months (or for such shorter period that the registrant was required to file such reports), and (2) has been subject to such filing requirements for the past 90 days. Yes x No ¨
Indicate by check mark whether the registrant has submitted electronically and posted on its corporate Web site, if any, every Interactive Data File required to be submitted and posted pursuant to Rule 405 of Regulation S-T (§232.405 of this chapter) during the preceding 12 months (or for such shorter period that the registrant was required to submit and post such files). Yes x No ¨
Indicate by a check mark if disclosure of delinquent filers pursuant to Item 405 of Regulation S-K (§229.405 of this chapter) is not contained herein, and will not be contained, to the best of registrant’s knowledge, in definitive proxy or information statements incorporated by reference in Part III of this Form 10-K or any amendment to this Form 10-K. ¨
Indicate by check mark whether the registrant is a large accelerated filer, an accelerated filer, a non-accelerated filer, or a smaller reporting company. See the definitions of “large accelerated filer,” “accelerated filer” and “smaller reporting company” in Rule 12b-2 of the Exchange Act. (Check one):
|
Large accelerated filer |
|
x |
|
Accelerated filer |
|
¨ |
|
Non-accelerated filer |
|
¨ (Do not check if a smaller reporting company) |
|
Smaller reporting company |
|
¨ |
Indicate by check mark whether the registrant is a shell company (as defined in Rule 12b-2 of the Exchange Act). Yes ¨ No x
As of February 1, 2016, 59,096,925 shares of the registrant’s common stock, $0.01 par value per share, were outstanding, including 1,961,738 shares of restricted stock. The aggregate market value of voting stock held by non-affiliates of the registrant, as of June 30, 2015, the last day of registrant’s most recently completed second fiscal quarter, was approximately $1.0 billion (based on the closing price for shares of the registrant’s common stock as reported by the New York Stock Exchange on that date).
DOCUMENTS INCORPORATED BY REFERENCE
Portions of the registrant’s Definitive Proxy Statement on Schedule 14A to be furnished to stockholders in connection with its 2016 Annual Meeting of Stockholders are incorporated by reference in Part III, Items 10-14 of this Annual Report on Form 10-K.
2015 ANNUAL REPORT ON FORM 10-K
TABLE OF CONTENTS
|
|
|
|
|
Page No. |
|
|
PART I |
|||||
|
|
|
|
|
|
|
|
Item 1. |
|
|
1 |
||
|
|
|
|
|
|
|
|
Item 1A. |
|
|
13 |
||
|
|
|
|
|
|
|
|
Item 1B. |
|
|
28 |
||
|
|
|
|
|
|
|
|
Item 2. |
|
|
28 |
||
|
|
|
|
|
|
|
|
Item 3. |
|
|
28 |
||
|
|
|
|
|
|
|
|
Item 4. |
|
|
28 |
||
|
|
|
|
|
|
|
|
PART II |
|||||
|
|
|
|
|
|
|
|
Item 5. |
|
|
29 |
||
|
|
|
|
|
|
|
|
Item 6. |
|
|
31 |
||
|
|
|
|
|
|
|
|
Item 7. |
|
Management’s Discussion and Analysis of Financial Condition and Results of Operations |
|
33 |
|
|
|
|
|
|
|
|
|
Item 7A. |
|
|
50 |
||
|
|
|
|
|
|
|
|
Item 8. |
|
|
52 |
||
|
|
|
|
|
|
|
|
Item 9. |
|
Changes in and Disagreements with Accountants on Accounting and Financial Disclosure |
|
76 |
|
|
|
|
|
|
|
|
|
Item 9A. |
|
|
76 |
||
|
|
|
|
|
|
|
|
Item 9B. |
|
|
77 |
||
|
|
|
|
|
|
|
|
PART III |
|||||
|
|
|
|
|
|
|
|
Item 10. |
|
|
77 |
||
|
|
|
|
|
|
|
|
Item 11. |
|
|
78 |
||
|
|
|
|
|
|
|
|
Item 12. |
|
Security Ownership of Certain Beneficial Owners and Management and Related Stockholder Matters |
|
78 |
|
|
|
|
|
|
|
|
|
Item 13. |
|
Certain Relationships and Related Transactions, and Director Independence |
|
78 |
|
|
|
|
|
|
|
|
|
Item 14. |
|
|
78 |
||
|
|
|
|
|
|
|
|
PART IV |
|||||
|
|
|
|
|
|
|
|
Item 15. |
|
|
78 |
||
|
|
|
|
|
|
|
|
|
|
|
83 |
||
SPECIAL NOTE REGARDING FORWARD-LOOKING STATEMENTS
This Annual Report on Form 10-K contains forward-looking statements within the meaning of Section 27A of the Securities Act of 1933, as amended (the “Securities Act”) and Section 21E of the Securities Exchange Act of 1934, as amended (the “Exchange Act”). Forward-looking statements are any statements that look to future events and include, but are not limited to, statements regarding our business strategy; anticipated future operating results and operating expenses, cash flows, capital resources, dividends and liquidity; trends, opportunities and risks affecting our business, industry and financial results; future expansion or growth plans and potential for future growth; our ability to attract new clients to purchase our solution; our ability to retain clients and induce them to purchase additional applications; our ability to accurately forecast future revenues and appropriately plan our expenses; market acceptance of our solution and applications; our expectations regarding future revenue generated by certain applications, including Enhanced ACA; alternative ways of addressing human capital management (“HCM”) needs or new technologies generally by us and our competitors; continued acceptance of Software–as-a-Service (“SaaS”) as an effective method for delivering HCM solutions and other business management applications; the attraction and retention of qualified employees and key personnel; future regulatory, judicial and legislative changes in our industry; how certain factors affecting our performance correlate to improvement or deterioration in the labor market; our plan to open additional sales offices and our ability to effectively execute such plan; the sufficiency of our existing cash and cash equivalents to meet our working capital and capital expenditure needs over the next 12 months; our ability to create additional jobs at our corporate headquarters; our ability to expand our corporate headquarters within an expected timeframe; our expectation of increasing our capital expenditures and investment activity as our business grows; and our ability to comply with New York Stock Exchange (“NYSE”) corporate governance standards within prescribed phase-in periods following loss of “controlled company” status. In addition, forward-looking statements also consist of statements involving trend analyses and statements including such words as “may,” “believe,” “could,” “anticipate,” “would,” “might,” “plan,” “expect,” and similar expressions or the negative of such terms or other comparable terminology. These forward-looking statements speak only as of the date of this Annual Report on Form 10-K and are subject to business and economic risks. As such, our actual results could differ materially from those set forth in the forward-looking statements as a result of the factors set forth below in Part I, Item 1A, “Risk Factors,” and in our other reports filed with the Securities and Exchange Commission (the “SEC”). We do not undertake any obligation to update or revise the forward-looking statements to reflect events that occur or circumstances that exist after the date on which such statements were made, except to the extent required by law.
Unless we state otherwise or the context otherwise requires, the terms “Paycom,” “we,” “us,” “our” and the “Company” refer, prior to the 2014 Reorganization discussed in Part II, Item 7, “Management’s Discussion and Analysis of Financial Condition and Results of Operations—The 2014 Reorganization,” to Paycom Payroll Holdings, LLC (“Holdings”), Holdings’ consolidated subsidiaries and solely with respect to the financial statements and related notes thereto, WCAS Paycom Holdings, Inc. (“WCAS Holdings”), and, as of and after the 2014 Reorganization, to Paycom Software, Inc. (“Software”), a Delaware corporation formed in anticipation of our initial public offering, and Software’s consolidated subsidiaries, including Holdings. Accordingly, all financial and other information herein relating to periods prior to the 2014 Reorganization is that of, or derived from, Holdings. For additional information concerning the 2014 Reorganization, see Part II, Item 7, “Management’s Discussion and Analysis of Financial Condition and Results of Operations—The 2014 Reorganization,” which description is hereby incorporated by reference.
Overview
We are a leading provider of a comprehensive, cloud-based HCM software solution delivered as SaaS. We provide functionality and data analytics that businesses need to manage the complete employment life cycle from recruitment to retirement. Our solution requires virtually no customization and is based on a core system of record maintained in a single database for all HCM functions, including talent acquisition, time and labor management, payroll, talent management and human resources (“HR”) management applications. Our user-friendly software allows for easy adoption of our solution by employees, enabling self-management of their HCM activities in the cloud, which reduces the administrative burden on employers and increases employee productivity.
Organizations need sophisticated, flexible and intuitive applications that can quickly adapt to their evolving HCM requirements, streamline their HR processes and systems and enable them to control costs. We believe that the HCM needs of most organizations are currently served either by multiple providers that partner in an attempt to replicate a comprehensive product or by legacy providers offering outdated on-premise products. These approaches often result in challenges with system integration, low scalability, high costs, extended delivery times and large up-front capital requirements.
1
Because our solution was developed in-house and is based on a single platform, there is no need to integrate, update or access multiple databases, which are common issues with competitor offerings that use multiple third-party systems in order to link together their HCM offerings. Additionally, our solution maintains data integrity for accurate, actionable and real-time analytics and business intelligence and helps clients minimize the risk of compliance errors due to inaccurate or missing information. We deliver feature-rich applications while maintaining excellence in information security and quality management standards as evidenced by our International Organization for Standardization (“ISO”) certifications.
We sell our solution directly through our internally trained, client-focused and highly skilled sales force based in offices across the United States. As a part of our client retention effort, a specialist within a dedicated team is assigned to each client to provide industry-leading, personalized service. We have over 15,000 clients, none of which constituted more than one-half of one percent of our revenues for the year ended December 31, 2015. We believe that as a result of our focus on client retention, we enjoy high client satisfaction as evidenced by an average annual revenue retention rate of 91% from existing clients for the three years ended December 31, 2015. We believe our revenue retention rate understates our client loyalty because this rate also includes former clients that were acquired or otherwise ceased operations.
We were founded in 1998. Since our founding, we have focused on providing an innovative SaaS HCM solution. As of December 31, 2015, we had 1,461 employees across the United States. For the years ended December 31, 2015, 2014 and 2013, our revenues were $224.7 million, $150.9 million and $107.6 million, respectively, representing year-over-year growth in revenues of approximately 49% and 40%, respectively. We currently derive the majority of our revenues from payroll processing. We are able to determine revenues from payroll processing because all of our clients are required to utilize our payroll application in order to access our other applications. We generally do not separately track our revenues across our other applications because we often sell applications in various groupings and configurations for a single price. We realized net income of $20.9 million, $5.7 million and $0.6 million for the years ended December 31, 2015, 2014 and 2013, respectively.
Industry Background
Large Market Opportunity for HCM Technologies
According to the International Data Corporation (“IDC”), the U.S. market for HCM applications is comprised of software that automates business processes covering the entire span of an employee’s relationship with his or her employer. IDC estimates that the U.S. market for HCM applications (excluding payroll services) will total $7.8 billion in 2016. These applications include maintenance of HR records, recruiting applications, performance management, time and labor management tracking, compliance, compensation management and other HR functions. According to IDC, the U.S. market for payroll services will be an estimated $17.2 billion in 2016. The payroll services market includes transactional activities associated with paying employees, maintaining accounting records and administrating payroll taxes while payroll accounting applications offer the functionality to effectively track these various payments and transfers.
Economic and Technological Trends Are Driving Demand for HCM Solutions
Organizations operating in today’s global economy are continually under pressure to reduce operating costs in order to maintain or improve their competitive positions. One tactic used by organizations is to utilize information technology (“IT”) provided by external resources in order to automate internal processes, reduce internal administrative burdens and more effectively manage capital expenditures and labor costs. As a result, businesses are increasingly making the strategic decision to leverage HCM technologies in order to improve the effectiveness and efficiency of their internal HR and accounting functions and capture opportunities for cost savings.
Organizations are also managing internal costs and administrative burdens by transitioning technological assets from on-premise to the cloud. By shifting HR systems to the cloud, businesses seek to avoid the difficulties associated with maintaining software and security updates, and storage needs as well as other maintenance issues. The rise of cloud computing has supported the SaaS delivery model. According to IDC, the global SaaS market is projected to grow from $42.9 billion in 2014 to $90.2 billion in 2019, at a compound annual growth rate (“CAGR”) of 16%.
We believe that businesses increasingly view data concerning their human capital as a critical strategic resource that can result in more informed decision-making concerning employee recruitment, retention and compensation. This revolution in data analytics and its extension to HR functions has increased the number of employees within an organization that can benefit from, and who regularly interface with, information technologies. As a result, organizations seek intuitive technologies that do not require extensive technological credentials to be effectively utilized. The user experience of business applications is changing to emulate the consumer experience as HR buyers increasingly seek applications that are intuitive and available anywhere on any web-enabled device.
2
Incumbent HCM Products Struggle To Meet the Needs of Businesses
We believe that a majority of businesses and organizations in the United States are using multiple HCM systems from more than one vendor, thereby impeding their ability to share data across these systems. Several incumbent payroll and HCM vendors offer product sets that consist of separate systems that require integration. In certain cases, this disparate product offering across several vendors is the result of several acquisitions which often leads to a loosely coupled product set that is marked by significant architectural differences and weak data integration. We believe that this type of offering increases the risk of user or system error and reduces overall effectiveness.
A comprehensive HCM solution leverages the same data, process and workflow management, security model, reporting and analytics tools, and user portals to provide a uniform user experience. We believe that significant analytical power remains trapped within the data that organizations are accessing across multiple applications and databases but are unable to analyze in a unified context.
We believe that vendors who pursue market segmentation strategies based on organization size or industry create difficulties for clients who grow, either in size or industry scope, beyond the confines of those vendors’ offerings. A scalable HCM solution based on a core system of record allows for an organization to grow in size and scope without transitioning to a new user interface or back-end database.
The Paycom Solution
We offer an end-to-end SaaS HCM solution that provides our clients and their employees with immediate access to accurate and secure information and analytics 24 hours a day, seven days a week from any location. We believe that our solution delivers the following benefits:
Comprehensive HCM Solution
Our solution offers functionality that manages the entire employment life cycle for employers and employees, from recruitment to retirement. Our user-friendly applications streamline client processes and provide clients and their employees with the ability to directly access and manage administrative processes, including applications that identify candidates, onboard employees, manage time and labor, administer payroll deductions and benefits, manage performance, off board employees and administer post-termination health benefits such as COBRA. The widespread employee usage of our applications helps further integrate our solution into the administrative processes of our clients. Our solution also has the advantage of being built in-house by our highly trained and skilled team of software developers, thereby minimizing data integrity issues across applications.
Core System of Record
Our solution is based on a core system of record that contains payroll and HR information in one convenient database, thereby reducing costs and eliminating the need for multiple software products and vendors and the maintenance of employee data in numerous databases. This core system of record enables our clients to input employee data one time and enjoy seamless functionality across our applications. When a revision is made to the file of an employee, all appropriate personnel have access to the change in real time. In addition, our core system of record helps clients minimize the risk of compliance errors due to inaccurate or missing information that results from maintaining multiple databases. Through accurate tracking and management of employee payroll and other HR data, such information can be compiled for comprehensive and consistent reporting for our clients.
Data Analytics
Our solution allows clients to analyze accurate employee information to make business decisions based upon actionable, real-time, point-and-click analytics provided through our client dashboard. This functionality helps our clients operate with a more complete and accurate picture of their organization as our solution’s embedded analytics capture the content and context of everyday business events, facilitating fast and informed decision-making from any location. The employees of our clients also benefit from our analytics platform as they are able to model in real-time the impact of their HCM decisions on their compensation, benefits and rewards.
3
Personalized Support Provided by Trained Personnel
Our applications are supported by one-on-one personal assistance from trained specialists. Services specialists are assigned to specific clients and are trained across all of our applications, ensuring they provide comprehensive, expert-level service. Our client service is ISO 9001:2008 certified on the basis of its quality and consistency. We strive to provide our clients with high levels of service and support to ensure their continued use of our solution for all of their HCM needs. We have maintained high client satisfaction, as evidenced by an average annual revenue retention rate of 91% from existing clients for the three years ended December 31, 2015.
Software-as-a-Service Delivery Model
Our SaaS delivery model allows clients with geographically dispersed and mobile workforces to operate more efficiently, and allows these clients to implement, access and use our client-oriented Internet solution on demand and remotely through standard web browsers, smart phones, tablets and other web-enabled devices. Our SaaS solution reduces the time, risk, headcount and costs associated with installing and maintaining applications for on premise products within the IT infrastructure of our clients.
Secure Cloud-Based Architecture
Our cloud-based architecture allows our solution to be implemented remotely with minimal client interaction. Updates such as software enhancements and newly developed applications can be deployed without client interaction, disruption or involvement, allowing our clients to make a smaller investment in hardware, personnel, implementation time and consulting. Additionally, we own and maintain all of the infrastructure technology to host our solution and to maximize system availability for clients. Our focus and investment in technology and data security has been recognized with ISO/IEC 27001:2013 certified security standards that provide our clients with a “best-in-class” level of data security.
Scalability to Grow with our Clients
Our solution is highly scalable. We serve a diversified client base ranging in size from one to approximately 8,000 employees. We calculate the number of clients’ employees based on parent company grouping. Our clients are able to use the same solution while their businesses grow by deploying applications as-needed in real-time. Pricing is determined by employee headcount and the number of applications utilized, enabling our clients to align HCM spending with their evolving HCM needs as compared to traditional HCM products that require clients to migrate to new software as they grow but retain fixed costs even if the client shrinks in size.
Efficient and Productive Research and Development
We believe that we benefit from a competitive advantage with our research and development investments, people and processes. Early investments in our proprietary, cloud-based architecture enable us to develop and deploy applications in a timely and cost-effective manner. We have also chosen to base our research and development team in Oklahoma and Texas, which we believe provides us with high-quality talent at a lower cost compared to other locations in the United States with a need for technology talent. These strategic decisions have enabled us to have a highly productive research and development function while our research and development expenses grew 99%, 102% and 31% from the comparable year period, for 2015, 2014 and 2013, respectively.
Our Strategy for Growth
Our strategy is to continue to establish our solution as the HCM industry standard. To accomplish this, we intend to:
Increase Our Presence in Existing Markets
Although we have clients in all 50 states, we believe a significant opportunity exists to expand our presence within markets where we currently have a sales office. We have a sales office in 32 of the 50 largest metropolitan statistical areas (“MSAs”) in the United States based on July 2014 U.S. Census Bureau estimates, five of which are served by multiple sales teams. We believe that the 50 largest MSAs in the United States could collectively support at least 90 additional sales teams. Each sales office is typically staffed with one sales team, with each team comprised of a sales manager and approximately six to nine other sales professionals. We plan to increase our presence in existing markets by adding sales offices and increasing the number of our sales teams to further penetrate and effectively capture these markets.
4
Expand Into Additional Markets
We plan to continue expanding our sales capability by opening sales offices in certain metropolitan areas where we currently have no sales teams. Since September 2012, we have opened new sales offices in Baltimore, Brooklyn, Chicago, Cincinnati, Cleveland, Detroit, Indianapolis, Kansas City, Minneapolis, Nashville, New York, Pasadena, Philadelphia, Pittsburgh, Portland, Sacramento, San Antonio, San Francisco, San Jose, Seattle, and Stamford. We intend to open 10 to 14 additional sales offices over the next two years, as well as potentially expand over the longer term into international markets.
We have historically selected new locations based on potential client and employee demographics as well as business density. Our property management team handles the non-personnel aspects of new office openings, from securing an office lease through establishing information security infrastructure and procedures for the prospective office location. When opening a new sales office, we typically relocate a proven sales manager from an existing territory who then recruits a team of high performing sales representatives. It typically takes a new sales office 24 months to reach maturity.
Enlarge our Existing Client Relationships
We dedicate our resources to helping our clients facilitate their goals, whether through helping them execute better hiring decisions, manage compensation more effectively or simply operate more efficiently. We believe a significant growth opportunity exists in selling additional applications to our current clients. Many clients have subsequently deployed additional applications as they recognize the benefits of our comprehensive solution. As we extend and enhance the functionality of our solution, we will continue to invest in initiatives to increase the adoption of our solution and maintain our high levels of client satisfaction.
Target Larger Clients
The average size of our clients has grown significantly as we have organically grown our operations and increased the number of applications we offer. Based on our total revenues, we have grown at an approximately 41% CAGR from January 1, 2011 through December 31, 2015. Our solution requires no adjustment to serve larger clients. We believe larger employers represent a substantial opportunity to increase the number of clients and to increase our revenue per client, with limited incremental cost to us. To further capitalize on this opportunity, we intend to target larger businesses opportunistically where our current sales model is effective.
Maintain Our Leadership in Innovation by Strengthening and Extending our Solution
Our ability to develop and deploy new applications and updates rapidly and cost-effectively has been integral to the results that we have achieved to date. We intend to continue extending the functionality and range of our solution in the future. Our development efforts are performed exclusively in-house and are heavily based upon proactive research and client input. In the near-term, we intend to focus our investments on further developing applications within our higher margin HR and talent management applications. Over the long term, we intend to increase our investment in the development of new applications that are responsive to the needs of our clients, which are garnered through ongoing client interaction and collaboration.
Our Applications
Our HCM solution offers a full suite of applications that generally fall within the following categories: talent acquisition, time and labor management, payroll, talent management and HR management.
Talent Acquisition
|
|
|
Applicant Tracking. Our applicant tracking application simplifies the recruiting processes needed to hire the most qualified employees. By using our all-in-one system, our clients can move candidates from the application process through new employee on-boarding without re-keying data. |
|
|
|
|
|
|
|
Candidate Tracker. Our candidate tracker application enables recruiters to track and stay connected to potential talent through an online database of top candidates. This application helps clients fill future positions faster without the cost of professional recruiting firms. |
|
|
|
|
|
|
|
Background Checks. Our background check application helps to ensure that prospective new hires are qualified candidates. We provide clients with the tools for authorizing background checks, creating pre-adverse and adverse action letters and securely storing results as required by the Fair Credit Reporting Act. |
|
|
|
|


5
|
|
On-Boarding. Our on-boarding application streamlines the hiring and termination processes for employees of our clients by creating online checklists of tasks to be assigned to an employee or group of employees. |
|
|
|
|
|
|
|
|
E-Verify ®. Our E-Verify ® application automates employment verification and reduces our clients’ exposure to audits and penalties that could result from I-9 violations. |
|
|
|
|
|
|
|
Tax Credit Services. Our tax credit services application helps employers process and calculate the available federal tax credits associated with hiring employees who meet various qualifications. |


Time and Labor Management
|
|
|
Time and Attendance. Our time and attendance application allows our clients to accurately and efficiently manage when, where and how employees report their hours worked. Clients can apply customized rules, use batch editing and use timecard management tools to manage complex time and attendance needs. Our web time clocks feature allows employees to clock in and out online, which automatically updates the payroll application when approved, eliminating the need to manually calculate timesheets and rekey information into payroll systems. We also offer several different types of hardware terminals that are ideal for single or multi-clock environments. |
|
|
|
|
|
|
|
Scheduling/Schedule Exchange. Our scheduling application helps managers with employee scheduling through automated functionality that provides for a seamless workflow with the payroll and time and attendance applications. Our schedule exchange application allows employees and managers access to their schedules at any time and employees can approve, decline or swap their schedules and see what shifts are available for pickup. |
|
|
|
|
|
|
|
|
|
|
|
Time-Off Requests. Our time-off requests application automates and standardizes the time off request procedure and helps employers remain effectively staffed. Managers can view an online time-off calendar to easily monitor and approve or deny time-off requests. Our employee self-service tool allows employees to view the time-off they have available, submit requests and view blackout dates, the status of requests and any manager comments. |
|
|
|
|
|
|
|
Labor Allocation. Our labor allocation application simplifies the process of setting up and tracking employee hours based on the job the employee is working. |
|
|
|
|
|
|
|
Labor Management Reports/Push Reporting. Our labor management reports application helps clients get up-to-the-minute reports on the information they need to better manage their labor force, such as overtime and labor distribution. Our push reporting application also gives clients the ability to set up recurring reports and to schedule them to be run automatically and sent to users on either a daily, weekly, monthly, quarterly or yearly basis. |
|
|
|
|
|
|
|
Geofencing/Geotracking. Enhancing our time-and-attendance solution, Paycom’s geofencing and geotracking location-based technology assist our clients in managing the whereabouts of employees while on the job. Geofencing allows employers to establish geographical boundaries within which their employees are authorized to clock in and out when using Paycom’s Web Time Clock on smartphones, tablets or other electronic devices. Once enabled, this time-theft-combatting tool supersedes IP address restrictions, meaning the system first checks for authorized geographical locations, rather than authorized IP addresses. In addition, the geotracking tool empowers clients to track employees’ geographical locations upon clocking in and out. The coordinates collected by the application can be entered into and viewed on a Google® display map. |


6
|
|
|
|
|
|
|
Payroll and Tax Management. Our payroll application is the foundation of our solution and all of our clients are required to utilize this application in order to access our other applications. Our payroll application is automatically updated with changes in employee information and offers other time saving functionality such as batch editing and effective dating. The application can be accessed at any time to make changes, run payroll and generate custom reports. We also help our clients by handling their payroll taxes and deposits, regulatory correspondence, amendments, and penalty and interest disputes. |
|
|
|
|
|
|
|
Paycom Pay. Our Paycom Pay application eliminates the tedious job of check reconciliation by issuing checks to our clients’ employees that clear from a Paycom bank account, which helps clients eliminate potential liability and simplifies the reconciliation process. |
|
|
|
|
|
|
|
Expense Management. Our expense management application eliminates the manual, paper-based processes associated with employee expense reimbursement and allows employers to control and monitor expenses by setting clearly defined rules and parameters for employee reimbursement. Employees can upload receipts when submitting their expenses and access an expense dashboard where they can view the status of their submitted expenses. |
|
|
|
|
|
|
|
Garnishment Management. Our garnishment management application allows us to handle communications with garnishment payees and agencies and to calculate and track garnishment payments. |
|
|
|
|
|
|
|
GL Concierge. Our GL Concierge application offers organizations more control and transparency into their payroll general ledger and gives finance professionals intuitive reporting, enriched audit trails, customizable file layouts and real-time alerts. Clients of all sizes can utilize a wide variety of general ledger maps along with an action-item alert system that improves the dynamics of their daily operations. |


Talent Management
|
|
|
Employee Self-Service. Our employee self-service application improves employee engagement by empowering our clients’ employees to self-manage certain transactions, obtain quick answers to frequent payroll and HR questions, access their pay history and view performance goals and reviews and total compensation reports to review their compensation and benefits package. Benefits information and paid time off accruals also give employees the ability to make informed decisions regarding their benefit selections and time-off requests. |
|
|
|
|
|
|
|
Compensation Budgeting. Our compensation budgeting application provides compensation and performance information in one system, giving clients with valuable workforce insight to help manage and formulate salary budgets and helping establish merit-based compensation increases. |
|
|
|
|
|
|
|
|
|
|
|
Performance Management. Our performance management application allows for standardized positions across a company with set pay grades and performance goals. It also helps streamline the performance review process with online facilitation of the review process. |
|
|
|
|
|
|
|
Executive Dashboard. Our executive dashboard offers powerful workforce insight for executives to access information on demand in a variety of report formats. Because we offer an all-in-one solution in a single database, the comprehensive report data provides the workforce intelligence needed to drive human capital decisions at an executive level. |
|
|
|
|
|
|
|
Paycom Learning. Our learning management application formalizes and standardizes our clients’ training processes. Employers can create customized content utilizing videos, presentations, quizzes and surveys. It provides our clients’ employees “anytime, anywhere” access to a central knowledge base where the employee can access content, share expertise and measure his or her professional development progress. Our clients can track the activity and success of their training programs with pre-defined reports and an analytics dashboard. |


7
|
|
|
Document and Task Management. Our document and task management application manages employee files, including the ability to have employees digitally sign and view company documents. We securely store client records to meet retention requirements and protect documents from unauthorized access and other disasters that can threaten businesses. In addition, clients can assign checklists to employees for the completion of certain tasks associated with processes such as on-boarding and off-boarding. |
|
|
|
|
|
|
|
Government and Compliance. Our government and compliance application helps clients reduce exposure to violations, audits and penalties with respect to the employment laws impacting their business, such as the Family Medical Leave Act, Equal Employment Opportunity Commission and other state and federal regulations. A single database keeps our clients’ employee data consistent and enhances reporting capabilities by providing better accuracy and real-time insight. |
|
|
|
|
|
|
|
Benefits Administration/Benefits to Carrier. Our benefits administration application allows clients to customize benefit plan setup, deduction amounts, enrollment dates and new-hire waiting periods. Employers are provided census and reconciliation reports to ensure they do not overpay for benefits, can update deduction amounts for all employees or groups of employees at once and automatically updates all insurance carriers for any changes. This application also provides employees with online enrollment and helps educate them and drive informed enrollment decisions for greater employee satisfaction. |
|
|
|
|
|
|
|
COBRA Administration. Our COBRA administration application protects employers from COBRA violations and their associated fines and penalties by automatically initiating compliance measures with the entry of qualifying events into the application. This application also tracks important dates, collects and remits premiums and reports on all COBRA activity. |
|
|
|
|
|
|
|
Personnel Action Forms. Our personnel action forms application helps our clients reduce the amount of time and paperwork required with employee changes such as pay rate, position and title changes by allowing managers to complete and approve online personnel action forms. |
|
|
|
|
|
|
|
Surveys. Our surveys application allows clients to create employee surveys to help identify and resolve workplace matters that otherwise may remain undisclosed. Clients can analyze results by the demographics of the workforce and compare how results change over time. |
|
|
|
|
|
|
|
Enhanced ACA. Our Affordable Care Act (“ACA”) application provides clients with continued access to an ACA dashboard that tracks employee count, employee status, health care plan affordability and ACA periods all from one convenient location and enables Paycom to file IRS Forms 1094/1095-B or –C. Clients utilizing this application also have access to additional real-time compliance reports and alerts. |


Our Clients
We serve a diverse client base in terms of size and industry. We have over 15,000 clients, or approximately 9,000 clients based on parent company grouping, none of which constituted more than one-half of one percent of our revenues for the year ended December 31, 2015. We stored data for more than 2.1 million persons employed by our clients during the year ended December 31, 2015.
Many of our clients that are small to mid-sized companies can typically make the decision to adopt our solution more quickly than larger companies, which we believe results in a shorter sales cycle and more closely corresponds to our target sales cycle of 30 to 90 days. As a result of the nature and size of our clientele, we maintain a diversified client base and very low revenue concentration among our clients. We believe, however, that larger employers represent a substantial opportunity to increase the number of clients and to increase our revenue per client with limited incremental cost. As we attract clients at the higher end of our target client size range, we may face longer sales cycles and less predictability in completing some of our sales.
Competition
The market for HCM solutions is rapidly evolving, highly competitive and subject to changing technology, shifting client needs and frequent introduction of new products and services. Our competitors range from small, regional firms to large, well-established international firms with multiple product offerings.
8
We compete with firms that provide HCM solutions by various means. Many providers continue to deliver legacy enterprise software, but as demand for greater flexibility and access to information grows, we believe there will be increased competition in the delivery of HCM cloud-based solutions by other SaaS providers. Our competitors offer HCM solutions that may overlap with one, several or all categories of applications offered by our solution. Our talent acquisition and talent management applications compete primarily with Cornerstone OnDemand, Inc., Oracle Corporation, SAP SE and Workday, Inc. Our payroll applications, including payroll processing, compete primarily with Automatic Data Processing, Inc. (“ADP”), Ceridian HCM, Inc. (“Ceridian”), Concur Technologies, Inc., Intuit Inc., Paychex, Inc., Paylocity Holding Corporation and The Ultimate Software Group, Inc. Our HR management applications compete primarily with ADP, Ceridian, Oracle Corporation, Paychex, Inc., Paylocity Holding Corporation, SAP SE, and Workday, Inc. Our time and labor management applications compete primarily with ADP, Ceridian, Paylocity Holding Corporation and The Ultimate Software Group, Inc. Our larger competitors compete with us across multiple segments. In addition, our HCM solution continues to face competition from in-house payroll and HR systems and departments as well as HR systems and software sold by third-party vendors.
Competition in the HCM solutions market is primarily based on service responsiveness, product quality and reputation, breadth of service and application offering and price. The importance of these factors depends on the size of the business. Price tends to be the most important factor of competition for smaller businesses with fewer employees while the scope of features and customization is more important to larger businesses. We believe that our SaaS delivery model allows us to be most competitive in the HCM solutions market across this spectrum.
Sales and Marketing
We sell our solution exclusively through our captive sales force, substantially all of whom have a four-year college degree. We typically recruit sales candidates who have sales experience in non-HCM industries or, with respect to candidates recruited directly from colleges and universities, who have demonstrated an aptitude for sales. Our sales force is comprised of inside sales and field sales personnel, who are organized geographically, and client relations representatives (“CRRs”), who sell additional applications to existing clients. We have 42 sales teams located in 24 states and plan to open additional sales offices to further expand our presence in the U.S. market.
We provide our sales force with an intensive four-week training course that includes at least one week of training at our headquarters in Oklahoma City. Our unique training program includes instruction in accounting, business metrics, application features and tax matters relevant to our target market and we believe it fosters loyalty and helps maintain our corporate culture. Our training continues for our sales force through weekly in-office strategy sessions and leadership development training. Executive sales representatives are also required to attend in-person quarterly conferences to share best practices and receive legal and business updates.
When a new client processes with us for an entire month, our sales representative receives a commission based upon annualized new recurring revenues. This commission is only paid once per new customer. Executive sales representatives receive a higher commission rate and base salary based upon both current year and life-to-date realized sales, respectively.
We generate client leads, accelerate sales opportunities and build brand awareness through our marketing programs that target senior finance and HR executives, technology professionals and senior business leaders of companies that perform HCM functions in-house or outsource these functions to one of our competitors. Our marketing programs include:
|
|
· |
Direct mail campaigns, email campaigns, personalized URLs, industry-specific print advertising and tradeshow exhibiting; |
|
|
· |
Search engine marketing methods that include site optimization and pay-per-click searches; and |
|
|
· |
Webinars, white papers and infographics. |
Our CRRs are focused on expanding the number of applications our clients purchase from us by introducing them to additional applications. Our CRRs call upon select clients periodically and are paid a non-recurring commission on any additional sales they generate.
Technology, Operations and Security
Technology
Our multi-tenant architecture enables us to deliver our solution across our client base with a single instance of our solution, while securely partitioning access to our clients’ respective application data. Because a single version of our solution is developed,
9
supported and deployed across all of our clients, updates are delivered to all of our clients at the same time, making it easier to scale our solution as the number of our clients and their employee headcount increases.
We maintain diverse load-balanced Internet lines serviced by multiple networks to provide our clients continuous access to our solution and their stored data. We back up our client data at regular intervals utilizing live replication, snapshots and cold archive methods of backup and manually monitor backup success and failure regularly. Our server cluster and database servers have redundant “hot swappable” disks to ensure continuous service in the event of a disk failure.
Operations
We physically host our solution for our clients in two secure data center facilities located in Oklahoma and Texas. All of our critical systems are fully redundant and backed-up in real-time to these facilities. Physical security includes ID-oriented access control, alarm systems and manned 24 hour a day camera monitoring by our security guards. Server facilities also have environmental monitoring and extensive environmental controls such as heat and fire protection, moisture, temperature, and humidity sensors, backup power supply and exterior reinforced concrete walls.
Security
We maintain a formal and comprehensive security program designed to ensure the confidentiality, integrity and availability of our clients’ data. During the regular course of business, we receive client data through our online system that we in turn process, record and store following ISO/IEC 270001:2013 certified controls and procedures. All communications with our servers that might contain sensitive information are encrypted before they leave the network and our servers are configured to only allow high-grade encryption algorithms.
We strictly regulate and limit all access to servers and networks at each of our facilities. Local network access is restricted by our authenticated server, using access control lists and remote network access is restricted by a firewall, which provides no accessible route from external networks to systems within our local network. We also employ network and host intrusion detection and prevention sensors throughout our infrastructure, systems that monitor and alert on insecure installations of third-party applications, a full system for managing and installing patches for those applications and highly restricted access to the Internet for anyone who has access to client data. Our information security department regularly performs penetration testing and we retain a third-party penetration testing company to conduct penetration tests and periodic audits to identify and remediate any issues.
Our applications are secured using multiple libraries and secure coding practices. Our IT infrastructure is secured and monitored using a number of best practices and tools at multiple layers of the physical and logical network. This security is also continually monitored by our information security department. All of our operations employees work in either our Oklahoma or Texas locations and are not permitted to work remotely.
Software Development
Our application development team works closely with our clients to improve and enhance our application offerings and develop new applications. Our application development process consists of a focused innovation and development timeframe in order to deliver well-developed applications and enhancements desired by our clients. A key element of our development process is the one-on-one personal interaction between clients and our CRRs through which our clients suggest new applications and features.
We develop our solution from the “ground up” with our internal development and engineering teams. Our development and engineering teams and our employees conceive of new applications and enhancements, review requests, schedule development in order of priority and subsequently develop the applications or enhancements. Our new applications and enhancements are independently reviewed by the quality assurance team, in accordance with our software development process, before being fully implemented. Any enhancements to our applications are released on a monthly scheduled release date to coordinate the communication and release to our clients.
Capitalized development expenses, which include compensation for employees directly associated with development projects, were $4.3 million, $2.2 million and $1.2 million for the years ended December 31, 2015, 2014 and 2013, respectively.
Client Service
We are committed to providing industry-leading, client-centered service. For this reason, we assign each client a specialist within a dedicated team. This one-on-one service is a key part of our client service model and helps to ensure that we are delivering an
10
industry-leading solution and maintaining high client satisfaction. The primary elements of our client service model include the following:
Streamlined Setup and Onboarding
After a client elects to deploy our solution, that client goes through our onboarding process with assistance from a team of new client setup specialists and the sales professional responsible for obtaining the client’s business. This team works closely with the client until the client is capable of managing our solution independently, at which time it is transferred to our dedicated services specialists.
Dedicated Service Specialists
After completing the onboarding process, each client is assigned to a services specialist within a dedicated team. Clients can then contact their dedicated services specialist or a team member if any issues or questions arise. These specialists provide personalized service with actual knowledge of the clients’ business needs. When appropriate, client questions can be elevated to the specialists with the appropriate application, regulatory or tax expertise. In addition, our CRRs proactively contact our clients to ensure satisfaction with our solution and introduce additional applications.
Expert Level Service
Our client specialists are trained across all of our applications to ensure that they can provide comprehensive, expert-level service. Our client service is ISO 9001:2008 certified and helps support a high client retention rate.
Regulatory and Certifications
We are subject to varying degrees of regulations in each of the jurisdictions in which we provide services. Local laws and regulations, and their interpretation and enforcement, differ significantly among those jurisdictions. These regulations and laws cover, among others, information disclosure.
Personal privacy has become a significant issue in the United States and in other countries. The regulatory framework for privacy issues worldwide is rapidly evolving and is likely to remain uncertain for the foreseeable future. Many federal, state and foreign government bodies and agencies have adopted or are considering adopting laws and regulations affecting or regarding the collection, use and disclosure of personal information. In the United States, these include, for example, rules and regulations promulgated under the authority of the Federal Trade Commission, the Health Insurance Portability and Accountability Act of 1996, the Family Medical Leave Act of 1993, the ACA and state breach notification laws.
We voluntarily obtain third party security examinations relating to security and data privacy in accordance with Statement on Standards for Attestation Engagements (“SSAE”), No. 16, Reporting on Controls at a Service Organization. Our SSAE examination is conducted every six months by an independent third party auditor, and addresses, among other areas, our physical and environmental safeguards for production data centers, data availability and integrity procedures, change management procedures and logical security procedures.
In January 2014, we renewed a certification based on ISO/IEC 27001:2013 criteria, a security standard for Information Security Management Systems published by ISO covering our production, quality assurance and implementation environments. This independent assessment of our conformity to the ISO 27001 standard includes assessing security risks, designing and implementing comprehensive security controls and adopting an information security management process to meet security needs on an ongoing basis. The certification is valid until February 2017, with continuing assessments taking place annually.
In March 2014, we renewed a certification based on ISO/IEC 9001:2008 criteria, a standard for the implementation of quality management processes published by ISO, covering our activities required to create and deliver our solution. This independent assessment of our conformity to the ISO 9001 standard includes assessing the design and implementation of quality objectives to meet delivery standards on an ongoing basis. The certification is valid until April 2017, with continuing assessments taking place annually.
Intellectual Property
We rely on a combination of copyrights, trademarks, service marks, trade secret laws and contractual restrictions to establish and protect our intellectual property rights. We also have a number of registered and unregistered trademarks and will continue to evaluate the registration of additional trademarks as appropriate. We do not have any patents or patent applications pending.
11
Our revenues are seasonal in nature. Recurring revenues include revenues relating to the annual processing of payroll forms, such as Form W-2 and Form 1099, and revenues from processing unscheduled payroll runs (such as bonuses) for our clients. Because payroll forms are typically processed in the first quarter of the year, first quarter revenue and margins are generally higher than in subsequent quarters. We anticipate that, commencing in 2016, first quarter revenues will also exhibit a stronger seasonal pattern as a result of the enactment of the ACA, which requires clients to file Forms 1094 and 1095 in the first quarter. In addition, we often experience increased revenue during the fourth quarter due to unscheduled payroll runs for our clients that occur before the end of the year. We believe this seasonality is driven by several factors, most notably the number of our clients that use our payroll application, as compared to the other applications that we offer.
Employees
Our ability to recruit and retain qualified employees is critical to our continued success. We invest heavily in our training and leadership development programs to encourage the development and promotion of our employees. As of December 31, 2015, we employed 1,461 people. None of our employees were covered by collective bargaining agreements.
Facilities
Our corporate headquarters is located in Oklahoma City, Oklahoma on a 170,000 square foot corporate campus that includes a disaster recovery site located in Oklahoma City. We own over 30 acres in Oklahoma City upon which our facilities are located. We also operate fully redundant data centers located at our corporate headquarters in Oklahoma and at an 18,727 square foot operations center that we lease in Dallas, Texas.
We also lease offices in Arizona, California, Colorado, Connecticut, Florida, Georgia, Illinois, Indiana, Maryland, Massachusetts, Michigan, Minnesota, Missouri, New Jersey, New York, North Carolina, Ohio, Oklahoma, Oregon, Pennsylvania, Tennessee, Texas, Virginia and Washington. We believe that these facilities are suitable for our current operations and upon the expiration of the terms of the leases we believe we could renew these leases or find suitable space elsewhere on acceptable terms.
Segment Information
We operate in a single operating segment and a single reporting segment. Operating segments are defined as components of an enterprise about which separate financial information is regularly evaluated by the chief operating decision maker function (which is fulfilled by our chief executive officer) in deciding how to allocate resources and in assessing performance. Our chief executive officer allocates resources and assesses performance based upon financial information at the consolidated level. Since we operate in one operating segment, all required financial segment information is presented in the consolidated financial statements.
Available Information
Our Internet address is www.paycom.com and our investor relations website is located at investors.paycom.com. Our Annual Report on Form 10-K, Quarterly Reports on Form 10-Q, Current Reports on Form 8-K and amendments to those reports can be found on our Investor Relations website, free of charge. These reports are also electronically filed with (or furnished to) the SEC. Information contained on our websites is not incorporated by reference into this Annual Report on Form 10-K. The SEC maintains a public website, www.sec.gov, which includes information about and the filings of issuers that file electronically with the SEC.
Additionally, the information that we file with the SEC may be read at the SEC’s Public Reference Room at 100 F Street NE, Washington, DC 20549. Information about the SEC’s Public Reference Room may be obtained by calling the SEC at 1-800-SEC-0330.
12
The risk factors noted in this section and other factors noted throughout this Annual Report on Form 10-K, including those risks identified in Part II, Item 7, “Management’s Discussion and Analysis of Financial Condition and Results of Operations,” describe examples of risks, uncertainties and events that may cause our actual results to differ materially from those contained in any forward-looking statement. If one or more of these risks or uncertainties materialize, or if underlying assumptions prove incorrect, actual outcomes may vary materially from those included in this Annual Report on Form 10-K.
Risks Related to Our Business and Industry
Our business depends substantially on our clients’ continued use of our applications, their purchases of additional applications from us and our ability to add new clients. Any decline in our clients’ continued use of our applications or purchases of additional applications could adversely affect our business, operating results or financial condition.
In order for us to maintain or improve our operating results, it is important that our current clients continue to use our applications and purchase additional applications from us, and that we add new clients. Our clients have no obligation to continue to use our applications, and may choose not to continue to use our applications at the same or higher level of service, if at all. In the past, some of our clients have elected not to continue to use our applications. Moreover, our clients generally have the right to cancel their agreements with us for any or no reason by providing 30 days’ prior written notice.
Our client retention rates may fluctuate as a result of a number of factors, including the level of client satisfaction with our applications, pricing, the prices of competing products or services, mergers and acquisitions affecting our client base, reduced hiring by our clients or reductions in our clients’ spending levels. If our clients do not continue to use our applications, renew on less favorable terms or fail to purchase additional applications, or if we fail to add new clients, our revenues may decline and our business, operating results or financial condition could be adversely affected.
The market in which we participate is highly competitive, and if we do not compete effectively, our business, operating results or financial condition could be adversely affected.
The market for HCM software is highly competitive, rapidly evolving and fragmented. We expect competition to intensify in the future with the introduction of new technologies and market entrants. Many of our current and potential competitors are larger and have greater brand name recognition, longer operating histories, more established relationships in the industry and significantly greater financial, technical and marketing resources than we do. As a result, some of these competitors may be able to:
|
|
· |
adapt more rapidly to new or emerging technologies and changes in client requirements; |
|
|
· |
develop superior products or services, gain greater market acceptance and expand their product and service offerings more efficiently or rapidly; |
|
|
· |
bundle products and services that we may not offer or in a manner that provides our competitors with a price advantage; |
|
|
· |
take advantage of acquisition and other opportunities for expansion more readily; |
|
|
· |
maintain a lower cost basis; |
|
|
· |
adopt more aggressive pricing policies and devote greater resources to the promotion, marketing and sales of their products and services; and |
|
|
· |
devote greater resources to the research and development of their products and services. |
Some of our principal competitors offer their products or services at a lower price, which has resulted in pricing pressures. Similarly, some competitors offer different billing terms, which has resulted in pressures on our billing terms. If we are unable to maintain our pricing levels and our billing terms, our operating results would be negatively impacted. In addition, pricing pressures and increased competition generally could result in reduced sales, reduced margins, losses or the failure of our solution to maintain widespread market acceptance, any of which could adversely affect our business, operating results or financial condition.
We compete with firms that provide HCM solutions by various means. Many providers continue to deliver legacy enterprise software, but as demand for greater flexibility and access to information grows, we believe there will be increased competition in the delivery of HCM cloud-based solutions by other SaaS providers. Our competitors offer HCM solutions that overlap with one, several or all categories of applications that we offer. Our talent acquisition and talent management applications compete primarily with Cornerstone OnDemand, Inc., Oracle Corporation, SAP SE and Workday, Inc. Our payroll applications, including payroll processing, compete primarily with ADP, Ceridian, Concur Technologies, Inc., Intuit Inc., Paychex, Inc., Paylocity Holding Corporation and The Ultimate Software Group, Inc. Our HR management applications compete primarily with ADP, Ceridian, Oracle Corporation,
13
Paychex, Inc., Paylocity Holding Corporation, SAP SE, and Workday, Inc. Our time and labor management applications compete primarily with ADP, Ceridian, Paylocity Holding Corporation and The Ultimate Software Group, Inc. Most of our larger competitors compete with us across multiple application categories. In addition, our HCM solution continues to face competition from in-house payroll and HR systems and departments as well as HR systems and software sold by third-party vendors.
Competition in the HCM solutions market is primarily based on service responsiveness, application quality and reputation, breadth of service and product offering and price. Many of our competitors have established marketing relationships, access to larger client bases and major distribution agreements with consultants, software vendors and distributors. In addition, some competitors may offer software that addresses one or a limited number of HCM functions at a lower price point or with greater depth than our solution. Further, some potential clients, particularly large enterprises, may elect to develop their own internal solutions. If we are unable to compete effectively, our business, operating results or financial condition could be adversely affected.
We have historically derived a majority of our revenues from payroll processing and our efforts to increase the use of our other HCM applications may not be successful and may reduce our revenue growth rate.
To date, we have derived a majority of our revenues from payroll processing. Compared to payroll processing, our participation in other HCM applications markets is relatively new, and it is uncertain whether our revenue from other HCM applications will continue to grow. The relatively limited extent to which our other HCM applications have been adopted by our clients, and the uncertainty regarding the adoption of any new applications beyond our existing applications, may make it difficult to evaluate our business because the potential market for such applications remains uncertain. Our HCM solution may not achieve and sustain the high level of market acceptance that is critical for the success of our business. The failure to increase the use of our HCM applications and any new applications developed by us may reduce our revenue growth rate, which could adversely affect our business, operating results or financial condition.
If our security measures are breached, or unauthorized access to our clients’ or their employees’ sensitive data is otherwise obtained, our solution may not be perceived as being secure, clients may reduce the use of or stop using our solution, our ability to attract new clients may be harmed and we may incur significant liabilities.
Our solution involves the collection, storage and transmission of clients’ and their employees’ confidential and proprietary information, including personal or identifying information, as well as financial and payroll data. HCM software is increasingly being targeted in cyber-attacks, including computer viruses, worms, phishing attacks, malicious software programs and other information security breaches, which could result in the unauthorized release, gathering, monitoring, misuse, loss or destruction of our clients’ sensitive data or otherwise disrupt our clients’ or other third parties’ business operations. If cybercriminals are able to circumvent our security measures, or if we are unable to detect an intrusion into our systems and contain such intrusion in a reasonable amount of time, our clients’ sensitive data may be compromised.
Certain of our employees have access to sensitive information about our clients’ employees. While we conduct background checks of our employees and limit access to systems and data, it is possible that one or more of these individuals may circumvent these controls, resulting in a security breach.
Although we have security measures in place to protect client information and prevent data loss and other security breaches, these measures could be breached as a result of third-party action, employee error, malfeasance or otherwise. Because the techniques used to obtain unauthorized access or to sabotage systems change frequently, we may not be able to anticipate these techniques and implement adequate preventative or protective measures. While we currently maintain a cyber liability insurance policy, cyber liability insurance may be inadequate or may not be available in the future on acceptable terms, or at all. In addition, our cyber liability insurance policy may not cover all claims made against us, and defending a suit, regardless of its merit, could be costly and divert management’s attention.
Any actual or perceived breach of our security could damage our reputation, cause existing clients to discontinue the use of our solution, prevent us from attracting new clients, or subject us to third-party lawsuits, regulatory fines or other actions or liabilities, which could adversely affect our business, operating results or financial condition.
If the SaaS market develops more slowly than we expect or declines, our growth may slow or stall, and our business could be adversely affected.
The SaaS market is not as mature as the market for on premise enterprise software, and it is uncertain whether SaaS will achieve and sustain high levels of demand and market acceptance. Our success depends not only on strong demand for HCM services in general, but also to a substantial extent on the widespread adoption of SaaS. Many companies have invested substantial personnel and financial resources to integrate traditional enterprise software into their businesses, and therefore may be reluctant or unwilling to
14
migrate to SaaS. It is difficult to predict client adoption rates and demand for our solution, the future growth rate and size of the SaaS market or the entry of competitive products. The expansion of the SaaS market depends on a number of factors, including the cost, performance and perceived value associated with SaaS, as well as the ability of SaaS providers to address security and privacy concerns. If other SaaS providers experience security incidents, loss of client data, disruptions in delivery or other problems, the market for SaaS applications as a whole, including our solution, may be negatively affected. If there is a reduction in demand for SaaS caused by a lack of client acceptance, technological challenges, weakening economic conditions, security or privacy concerns, competing technologies and products, decreases in corporate spending or otherwise, our growth may slow or stall, and our business could be adversely affected.
Any interruption or failure of our data centers could impair our ability to effectively provide our solution and adversely affect our business.
We serve all of our clients from our two data centers located in Oklahoma and Texas. These locations are vulnerable to damage or interruption from severe weather, tornados, terrorist attacks, earthquakes, floods, fires, power loss, telecommunications failures, computer viruses or cyber-attacks. They are also subject to break-ins, sabotage, intentional acts of vandalism and other misconduct. Our solution depends on the continuing operation of our data centers and any damage to or failure of our data centers could result in interruptions in our services. Any interruption in our service, including adverse changes in service levels at our data centers, could damage our reputation and, consequently, our ability to attract new clients, cause our clients to terminate their use of our solution and prevent us from gaining new or additional business from current clients, which could have an adverse effect on our business, operating results or financial condition.
Any significant disruption in our SaaS network infrastructure could harm our reputation and expose us to significant costs.
Our SaaS network infrastructure is a critical part of our business operations. Our clients access our solution through standard web browsers, smart phones, tablets and other web-enabled devices, and depend on us for fast and reliable access to our solution. In the future, we may experience disruptions in our computing and communications infrastructure. Factors that may cause such disruptions include:
|
|
· |
human error; |
|
|
· |
security breaches; |
|
|
· |
telecommunications failures or outages from third-party providers; |
|
|
· |
computer viruses or cyber-attacks; |
|
|
· |
acts of terrorism, sabotage or other intentional acts of vandalism; |
|
|
· |
unforeseen interruption or damages; |
|
|
· |
tornados, fires, earthquakes, floods and other natural disasters; and |
|
|
· |
power loss. |
If our SaaS network infrastructure or our clients’ ability to access our solution is interrupted, client and employee data from recent transactions may be permanently lost and we could be exposed to significant claims by clients, particularly if the access interruption is associated with problems in the timely delivery of funds due to employees. Any significant instances of system downtime could negatively affect our reputation and ability to retain clients and sell our solution, which would adversely impact our revenues.
We have also experienced significant growth in the number of clients and transactions and the amount of client and employee data that our network infrastructure supports. We seek to maintain sufficient excess capacity in our network infrastructure to meet the needs of all of our clients and their employees and to facilitate the rapid provision of new client deployments and the expansion of existing client deployments. Any errors, defects, disruptions or other performance problems with our network infrastructure could adversely affect our reputation and may result in lengthy interruptions in the availability of our solution. Any interruptions in the availability of our solution might reduce our revenues, cause us to issue refunds to clients or adversely affect our retention of existing clients, which could have a negative impact on our business or financial condition.
15
If our solution fails to perform properly, our reputation could be adversely affected and our market share could decline.
Our solution is inherently complex and may in the future contain, or develop, undetected defects or errors. Any defects in our applications could adversely affect our reputation, impair our ability to sell our applications in the future and result in significant costs to us. The costs incurred in correcting any application defects may be substantial and could adversely affect our business, operating results or financial condition. Any defects in functionality or that cause interruptions in the availability of our applications could result in:
|
|
· |
loss or delayed market acceptance and sales of our applications; |
|
|
· |
termination of service agreements or loss of clients; |
|
|
· |
credits or refunds to clients, including reimbursements for any fees or penalties assessed by regulatory agencies; |
|
|
· |
breach of contract, breach of warranty or indemnification claims against us, which may result in litigation; |
|
|
· |
diversion of development and service resources; and |
|
|
· |
injury to our reputation. |
Because of the large amount of data that we collect and manage, it is possible that hardware failures or errors in our systems could result in data loss or corruption, or cause the information that we collect to be incomplete or contain inaccuracies that our clients regard as significant. Our clients might assert claims against us in the future alleging that they suffered damages due to a defect, error, or other failure of our solution. Our errors and omissions insurance may be inadequate or may not be available in the future on acceptable terms, or at all. In addition, our policy may not cover all claims made against us, and defending a suit, regardless of its merit, could be costly and divert management’s attention. Any failures in the performance of our solution could harm our reputation and our ability to retain existing clients and attract new clients, which would have an adverse impact on our business, operating results or financial condition.
If we do not effectively expand and train our sales force and our support teams, we may be unable to add new clients and retain existing clients.
We need to continue to expand our sales force and support team members in order to grow our client base and increase our revenues. To continue to execute our growth strategy, we must also attract and retain qualified sales, marketing and operational personnel capable of supporting a larger and more diverse client base. Identifying and recruiting qualified personnel and training them in the use of our applications requires significant time, expense and attention and it can take a substantial amount of time before our sales representatives and support team members are fully-trained and productive. We may be unable to hire or retain sufficient numbers of qualified individuals in the markets where we currently, or intend in the future to do business, and our recent hires and planned hires may not achieve desired productivity levels in a reasonable period of time or become as productive as we expect. If our expansion efforts are unsuccessful or do not generate a corresponding increase in revenues, our business, operating results or financial condition could be adversely affected.
If we are not able to develop enhancements and new applications, keep pace with technological developments or respond to future disruptive technologies, we might not remain competitive and our business could be adversely affected.
Our future success will depend on our ability to adapt and innovate. To attract new clients and increase revenues from existing clients, we need to enhance, add new features to and improve our existing applications and introduce new applications. The success of any enhancements or new features and applications depends on several factors, including timely completion, introduction and market acceptance. We may expend significant time and resources developing and pursuing sales of a particular enhancement or application that may not result in revenues in the anticipated time frame or at all, or may not result in revenue growth sufficient to offset increased expenses. If we are unable to successfully develop enhancements, new features or new applications to meet client needs, our business and operating results could be adversely affected.
In addition, because our applications are designed to operate on a variety of network, hardware and software platforms using Internet tools and protocols, we will need to continuously modify and enhance our applications to keep pace with changes in Internet-related hardware, software, communication, browser and database technologies. If we are unable to respond in a timely and cost-effective manner to these rapid technological developments, our current and future applications may become less marketable and less competitive or even obsolete.
Our success is also subject to the risk of future disruptive technologies. If new technologies emerge that are able to deliver HCM solutions at lower prices, more efficiently or more conveniently, such technologies could adversely impact our ability to compete.
16
The market for our solution among large companies may be limited if these companies demand customized features and functions that we do not offer.
Prospective clients, especially larger companies, may require customized features and functions unique to their business processes that we do not offer. In order to ensure we meet these requirements, we may devote a significant amount of support and services resources to larger prospective clients, increasing the cost and time required to complete sales with no guarantee that these prospective clients will adopt our solution. Further, we may not be successful in implementing any customized features or functions. If prospective clients require customized features or functions that we do not offer, or that would be difficult for them to deploy themselves, the market for our solution will be more limited and our business could be adversely affected.
Our business and operations are experiencing rapid growth and organizational change. If we fail to manage such growth and change effectively, we may be unable to execute our business plan, maintain high levels of service or adequately address competitive challenges.
We have experienced, and may continue to experience, rapid growth in our headcount and operations, which has placed, and may continue to place, significant demands on our management, operational and financial resources. For example, our headcount has grown from 523 employees as of December 31, 2011 to 1,461 employees as of December 31, 2015 and we have expanded from 20 sales teams as of December 31, 2011 to 42 sales teams as of January 31, 2016. We have also experienced significant growth in the number of clients and transactions and the amount of client and employee data that our infrastructure supports. Finally, our organizational structure and recording systems and procedures are becoming more complex as we improve our operational, financial and management controls. Our success will depend in part on our ability to manage this growth and organizational change effectively. To manage the expected growth of our headcount and operations, we will need to continue to improve our operational, financial and management controls and our reporting systems and procedures. Our ability to add additional offices may be constrained by the willingness and availability of qualified personnel to help staff and manage any new offices. The failure to effectively manage growth could result in difficulties or delays in obtaining clients, selling additional applications to our clients, declines in quality or client satisfaction of our applications, increases in costs, and difficulties in introducing new applications or other operational difficulties, any of which could adversely affect our business by impairing our ability to retain and attract clients or sell additional applications to our existing clients.
We may encounter long sales cycles with larger prospective clients, which could adversely affect our operating results in a given period.
We believe larger employers represent a substantial opportunity to increase the number of clients we serve and to increase our revenue per client. To further capitalize on this opportunity, we intend to pursue larger businesses opportunistically within our target client size range where our current sales model is effective. As we target our sales efforts at larger clients, we will face longer sales cycles and less predictability in completing some of our sales. In the large enterprise market, the clients’ decision to use our applications may be an enterprise-wide decision and, therefore, these types of sales will require us to provide greater levels of education regarding the use and benefits of our applications. In addition, our target clients may prefer to purchase applications that are critical to their business from one of our larger, more established competitors. Our typical sales cycles are 30 to 90 days and we expect that this sales cycle may continue or increase as we pursue larger clients. Longer sales cycles could cause our operating and financial results to suffer in a given period.
Our business, operating results or financial condition could be adversely affected if our clients are not satisfied with our deployment or technical support services.
Our business depends on our ability to satisfy our clients, both with respect to our applications and the technical support provided to help clients use the applications that address the needs of their businesses. We use our in-house deployment personnel to implement and configure our solution and provide support to our clients. If a client is not satisfied with the quality of our solution or the applications delivered or the support provided, we could incur additional costs to address the situation, our profitability might be negatively affected, and the client’s dissatisfaction with our deployment service could damage our ability to sell additional applications to that client. In addition, our sales process is highly dependent on the reputation of our solution and applications and on positive recommendations from our existing clients. Any failure to maintain high-quality technical support, or a market perception that we do not maintain high-quality technical support, could adversely affect our reputation, our ability to sell our applications to existing and prospective clients, and, as a result, our business, operating results or financial condition.
17
If we fail to retain key employees and recruit qualified personnel, our business could be adversely affected.
We believe that our success depends on the continued services of our senior management and other key employees, including Chad Richison, Craig E. Boelte, Jeffrey D. York, William X. Kerber III and Stacey Pezold. In addition, because our future success is dependent on our ability to continue to enhance and introduce new applications, we are heavily dependent on our ability to attract and retain qualified software developers and IT personnel with the requisite education, background and industry experience. The loss of the services of a significant number of our developers could be disruptive to our development efforts or business relationships. In addition, if any of our key employees joins a competitor or decides to otherwise compete with us, we may experience a material disruption of our operations and development plans, which may adversely affect our business by causing us to lose clients, increase operating expenses or divert management’s attention to recruit replacements for the departed key employees.
Our financial results may fluctuate due to many factors, some of which may be beyond our control.
Our results of operations, including the levels of our revenues, costs of revenues, administrative expenses, operating income, cash flow and deferred revenue, may vary significantly in the future and the results of any one period should not be relied upon as an indication of future performance. Fluctuations in our financial results may negatively impact the value of our common stock. Our financial results may fluctuate as a result of a variety of factors, many of which are outside of our control, and as a result, may not fully reflect the underlying performance of our business. Factors that may cause our financial results to fluctuate from period to period include, without limitation:
|
|
· |
our ability to attract new clients or sell additional applications to our existing clients; |
|
|
· |
the number of new clients and their employees, as compared to the number of existing clients and their employees in a particular period; |
|
|
· |
the mix of clients between small, mid-sized and large organizations; |
|
|
· |
the extent to which we retain existing clients and the expansion or contraction of our relationships with them; |
|
|
· |
the mix of applications sold during a period; |
|
|
· |
changes in our pricing policies or those of our competitors; |
|
|
· |
seasonal factors affecting payroll processing, demand for our applications or potential clients’ purchasing decisions; |
|
|
· |
the amount and timing of operating expenses, including those related to the maintenance and expansion of our business, operations and infrastructure; |
|
|
· |
the timing and success of new applications introduced by us and the timing of expenses related to the development of new applications and technologies; |
|
|
· |
the timing and success of current and new competitive products and services by our competitors; |
|
|
· |
economic conditions affecting our clients, including their ability to outsource HCM solutions and hire employees; |
|
|
· |
other changes in the competitive dynamics of our industry, including consolidation among competitors or clients; |
|
|
· |
our ability to manage our existing business and future growth, including expenses related to our data centers and the expansion of such data centers and the addition of new offices; |
|
|
· |
the effects and expenses of acquisition of third-party technologies or businesses and any potential future charges for impairment of goodwill resulting from those acquisitions; |
|
|
· |
network outages or security breaches; and |
|
|
· |
general economic, industry and market conditions. |
Certain of our operating results and financial metrics are difficult to predict as a result of seasonality.
We have historically experienced seasonality in our revenues because a significant portion of our recurring revenues relate to the annual processing of payroll forms such as Form W-2 and Form 1099. Because these forms are typically processed in the first quarter of the year, first quarter revenues are generally higher than subsequent quarters. We also anticipate that ACA-related filings, which will generally be due in the first quarter of the year, will amplify the seasonal nature of our revenues. We expect this seasonality to continue in the future, which may cause fluctuations in certain of our operating results and financial metrics, and thus make such results and metrics difficult to predict.
18
If we fail to adequately protect our proprietary rights, our competitive advantage could be impaired and we may lose valuable assets, generate reduced revenue or incur costly litigation to protect our rights.
Our success is dependent in part upon our intellectual property. We rely on a combination of copyrights, trademarks, service marks, trade secret laws and contractual restrictions to establish and to protect our intellectual property rights. However, the steps we take to protect our intellectual property may be inadequate. We will not be able to protect our intellectual property if we are unable to enforce our rights or if we do not detect unauthorized use of our intellectual property. Despite our precautions, it may be possible for unauthorized third parties to copy our applications and use information that we regard as proprietary to create products or services that compete with ours.
We may be required to spend significant resources to monitor and protect our intellectual property. We have been involved in litigation in the past and litigation may be necessary in the future to protect and enforce our intellectual property rights and to protect our trade secrets. Such litigation could be costly, time-consuming and distracting to management and could result in the impairment or loss of portions of our intellectual property. Furthermore, our efforts to enforce our intellectual property rights may be met with defenses, counterclaims and countersuits attacking the validity and enforceability of our intellectual property rights. We may not be able to secure, protect and enforce our intellectual property rights or control access to, and the distribution of, our solution and proprietary information, which could affect our business.
We may be sued by third parties for alleged infringement of their proprietary rights.
Considerable intellectual property development activity exists in our industry, and we expect that software developers will increasingly be subject to infringement claims as the number of applications and competitors grows and the functionality of applications in different industry segments overlaps. Our competitors, as well as a number of other entities and individuals, may own or claim to own intellectual property in technology areas relating to our solution or applications. In addition, we may increasingly be subject to trademark infringement claims as our presence grows in the marketplace. From time to time, third parties have asserted and may in the future assert that we are infringing on their intellectual property rights, and we may be found to be infringing upon such rights. A claim of infringement may also be made relating to technology that we acquire or license from third parties. However, we may be unaware of the intellectual property rights of others that may cover, or may be alleged to cover, some or all of our solution, applications or brands.
The outcome of litigation is inherently unpredictable and, as a result, any future litigation or claim of infringement could (i) cause us to enter into an unfavorable royalty or license agreement, pay ongoing royalties or require that we comply with other unfavorable terms, (ii) require us to discontinue the sale of our solution or applications, (iii) require us to indemnify our clients or third-party service providers or (iv) require us to expend additional development resources to redesign our solution or applications. Any of these outcomes could harm our business. Even if we were to prevail, any litigation regarding our intellectual property could be costly and time consuming and divert the attention of our management and key personnel from our business and operations.
We employ third-party licensed software for use in our applications and the inability to maintain these licenses or errors in the software we license could result in increased costs or reduced service levels, which could adversely affect our business.
Our applications incorporate certain third-party software obtained under licenses from other companies. We anticipate that we will continue to rely on such third-party software and development tools from third parties in the future. Although we believe that there are commercially reasonable alternatives to the third-party software we currently license, this may not always be the case, or it may be difficult or costly to replace. In addition, integration of the software used in our applications with new third-party software may require significant work and substantial investment of our time and resources. Also, to the extent that our applications depend upon the successful operation of third-party software in conjunction with our software, any undetected errors or defects in this third-party software could prevent the deployment or impair the functionality of our applications, delay new application introductions, result in a failure of our applications and harm our reputation.
The use of open source software in our applications may expose us to additional risks and harm our intellectual property rights.
Some of our applications use software covered by open source licenses. From time to time, there have been claims challenging the ownership of open source software against companies that incorporate such software into their products or applications. As a result, we could be subject to suits by parties claiming ownership of what we believe to be open source software. Litigation could be costly for us to defend, have a negative effect on our operating results and financial condition or require us to devote additional development resources to change our applications. In addition, if we were to combine our applications with open source software in a certain manner, we could, under certain of the open source licenses, be required to release the source code of our applications. If we inappropriately use open source software, we may be required to redesign our applications, discontinue the sale of our applications or take other remedial actions, which could adversely impact our business, operating results or financial condition.
19
We may not receive significant revenues from our current research and development activities for several years, if at all.
Developing SaaS-based applications is expensive and the investment in the development of these applications often involves a long return on our investment cycle. We have made and expect to continue to make significant investments in research and development activities. Accelerated application introductions and short software life cycles require increased levels of research and development expenditures that could adversely affect our operating results if not offset by increased revenues. We believe that we must continue to dedicate a significant amount of resources to our research and development activities to maintain our competitive position. We may not receive significant revenues from these investments however, for several years, if at all.
The failure to develop our brand cost-effectively could have an adverse effect on our business.
We believe that developing and maintaining widespread awareness of our brand in a cost-effective manner is critical to achieving the widespread acceptance of our solution and is an important element in attracting new clients and retaining existing clients. Successful promotion of our brand depends largely on the effectiveness of our marketing efforts and on our ability to provide reliable and useful applications at competitive prices. Brand promotion activities may not yield increased revenues, and even if they do, any increased revenues may not offset the expenses incurred in building our brand. If we fail to successfully promote and maintain our brand, or incur substantial expenses in an unsuccessful attempt to promote and maintain our brand, we may fail to attract enough new clients or retain our existing clients to the extent necessary to realize a sufficient return on our brand-building efforts, which could have an adverse effect on our business.
We might require additional capital to support business growth, and this capital might not be available on acceptable terms, if at all.
We have funded our operations since inception through cash flows generated from operations, cash from the sale of debt and equity securities and borrowings under consolidated loans. In the future, we may require additional capital to support our growth and respond to operational challenges, including the need to develop new features and applications or enhance our existing applications, improve our infrastructure or acquire complementary businesses and technologies. Accordingly, we may need to engage in equity or debt financings to secure additional funds. If we raise additional funds through issuances of equity or convertible debt securities, our existing stockholders could suffer significant dilution, and any new equity securities we issue could have rights, preferences and privileges superior to those of holders of our common stock. Any debt financing we secure in the future could involve restrictive covenants relating to our capital raising activities and other financial and operational matters, which may make it more difficult for us to obtain additional capital and to pursue business opportunities, including potential acquisitions. In addition, we may not be able to obtain additional financing on terms favorable to us, if at all. If we are unable to obtain adequate financing or financing on terms satisfactory to us, when we require it, our ability to continue to support our growth and respond to challenges could be significantly limited.
Our outstanding indebtedness is subject to certain operating and financial covenants that may restrict our business and financing activities and may adversely affect our cash flow and our ability to operate our business.
As of December 31, 2015, we had a term note under the 2021 Consolidated Loan with an outstanding principal amount of $25.9 million due to Kirkpatrick Bank that matures on May 30, 2021 (the “2021 Consolidated Loan”). The 2021 Consolidated Loan is secured by a mortgage covering our headquarters buildings and certain personal property relating to our headquarters buildings. On May 13, 2015, we entered into an additional loan agreement (the “Construction Loan”) with Kirkpatrick Bank to finance the expansion of our corporate headquarters. As of December 31, 2015, we did not have any outstanding borrowings under the Construction Loan. Pursuant to the terms of the 2021 Consolidated Loan, we may not, subject to certain exceptions, until amounts under the 2021 Consolidated Loan are repaid:
|
|
· |
create any mortgages or liens; |
|
|
· |
make any loans, advances or extensions of credit to certain affiliates or enter into any other transaction with certain affiliates; |
|
|
· |
lease any mortgaged property; |
|
|
· |
make any distributions as long as an event of default exists; |
|
|
· |
make any material change in methods of accounting; |
|
|
· |
enter into any sale and leaseback arrangement; |
|
|
· |
amend, modify, restate, cancel or terminate our organizational documents; |
|
|
· |
sell, transfer or convey any mortgaged property; or |
|
|
· |
incur funded outside debt. |
20
To the extent we borrow under the Construction Loan, the foregoing covenants will also apply until all such amounts are repaid. In addition, under the 2021 Consolidated Loan and the Construction Loan (together, the “Loan Agreements”) we are required to maintain a fixed charge coverage ratio of earnings before interest, taxes, depreciation and amortization (“EBITDA”) to fixed charges (defined as current maturities of long-term debt, interest expense, rent expense and distributions) of greater than 1.2 to 1.0, which is measured on a quarterly basis. The operating and financial covenants in the Loan Agreements, as well as any future financing agreements that we may enter into, may restrict our ability to finance our operations, engage in business activities or expand or fully pursue our business strategies. We may also be required to use a substantial portion of our cash flows to pay principal and interest on our debt, which would reduce the amount of money we have for operations, working capital, expansion, or other general corporate purposes.
Our ability to meet our expenses and debt obligations and comply with the operating and financial covenants may be affected by financial, business, economic, regulatory and other factors beyond our control. We may be unable to control many of these factors and comply with these covenants. A breach of any of the covenants under the Loan Agreements could result in an event of default, which could cause all of the outstanding indebtedness under the Loan Agreements to become immediately due and payable.
We may acquire other businesses, applications or technologies, which could divert our management’s attention, result in additional dilution to our stockholders and otherwise disrupt our operations and harm our operating results.
In the future, we may seek to acquire or invest in businesses, applications or technologies that we believe complement or expand our applications, enhance our technical capabilities or otherwise offer growth opportunities. The pursuit of potential acquisitions may divert the attention of management and cause us to incur expenses in identifying, investigating and pursuing suitable acquisitions, whether or not they are ultimately consummated.
We do not have any experience in acquiring other businesses. If we acquire additional businesses, we may not be able to integrate the acquired personnel, operations and technologies successfully or to effectively manage the combined business following the acquisition. We also may not achieve the anticipated benefits from the acquired business due to a number of factors, including:
|
|
· |
the inability to integrate or benefit from acquired applications or services in a profitable manner; |
|
|
· |
unanticipated costs or liabilities associated with the acquisition; |
|
|
· |
the incurrence of acquisition-related costs; |
|
|
· |
difficulty integrating the accounting systems, operations and personnel of the acquired business; |
|
|
· |
difficulty and additional expenses associated with supporting legacy products and hosting infrastructure of the acquired business; |
|
|
· |
difficulty converting the clients of the acquired business onto our solution, including disparities in the revenues, licensing, support or services of the acquired company; |
|
|
· |
diversion of management’s attention from other business concerns; |
|
|
· |
harm to our existing relationships with clients as a result of the acquisition; |
|
|
· |
the potential loss of key employees; |
|
|
· |
the use of resources that are needed in other parts of our business; and |
|
|
· |
the use of substantial portions of our available cash to consummate the acquisition. |
In addition, a significant portion of the purchase price of any companies we acquire may be allocated to acquired goodwill and other intangible assets, which must be assessed for impairment at least annually. In the future, if our acquisitions do not yield expected returns, we may be required to take charges to our operating results based on this impairment assessment process, which could harm our results of operations. Acquisitions could also result in issuances of equity securities or the incurrence of debt, which would result in dilution to our stockholders.
Our growth depends in part on the success of our relationships with third parties.
We rely on third-party financial and accounting processing systems, as well as various financial institutions, to perform financial services in connection with our applications, such as providing automated clearing house (“ACH”), and wire transfers as part of our payroll and expense reimbursement services and to provide technology and content support, manufacture time clocks and process background checks. We anticipate that we will continue to depend on various third-party relationships in order to grow our business,
21
provide technology and content support, manufacture time clocks and process background checks. Identifying, negotiating and documenting relationships with these third parties and integrating third-party content and technology requires significant time and resources. Our agreements with third parties typically are non-exclusive and do not prohibit them from working with our competitors. In addition, these third parties may not perform as expected under our agreements, and we may have disagreements or disputes with such third parties, which could negatively affect our brand and reputation. A global economic slowdown could also adversely affect the businesses of our third party providers, particularly those financial institutions that process transactions through the ACH network, and it is possible that they may not be able to devote the resources we expect to our relationship.
If we are unsuccessful in establishing or maintaining our relationships with these third parties, our ability to compete in the marketplace or to grow our revenues could be impaired and our business, operating results or financial condition could be adversely affected. Even if we are successful, these relationships may not result in improved operating results.
Adverse economic conditions could affect our business, operating results or financial condition.
Our business depends on the overall demand for HCM applications and on the economic health of our current and prospective clients. If economic conditions in the United States or in global markets remain uncertain or deteriorate, clients may cease their operations, delay or reduce their spending on HCM and other outsourcing services or attempt to renegotiate their contracts with us. This could result in reductions in sales of our applications, longer sales cycles, slower adoption of new technologies and increased price competition, any of which could adversely affect our business, operating results or financial condition. In addition, HCM spending levels may not increase following any recovery.
If our goodwill or other intangible assets become impaired, we may be required to record a significant charge to earnings.
We are required to test goodwill for impairment at least annually or earlier if events or changes in circumstances indicate the carrying value may not be recoverable. As of December 31, 2015, we had recorded a total of $51.9 million of goodwill and $3.5 million of other intangible assets. An adverse change in domestic or global market conditions, particularly if such change has the effect of changing one of our critical assumptions or estimates made in connection with the impairment testing of goodwill or intangible assets, could result in a change to the estimation of fair value that could result in an impairment charge to our goodwill or other intangible assets. Any such material charges may have a negative impact our operating results.
We typically pay employees and may pay taxing authorities amounts due for a payroll period before a client’s electronic funds transfers are finally settled to our account. If client payments are rejected by banking institutions or otherwise fail to clear into our accounts, we may require additional sources of short-term liquidity and our operating results could be adversely affected.
Our payroll processing application moves significant funds from the account of a client to employees and relevant taxing authorities. For larger funding amounts, we require clients to transfer the funds to us via fed wire. For smaller funding amounts, we debit a client’s account prior to any disbursement on its behalf, and due to ACH banking regulations, funds previously credited could be reversed under certain circumstances and time frames after our payment of amounts due to employees and taxing and other regulatory authorities. There is therefore a risk that the employer’s funds will be insufficient to cover the amounts we have already paid on its behalf. While such shortage and accompanying financial exposure has only occurred in very limited circumstances in the past, should clients default on their payment obligations in the future, we might be required to advance substantial funds to cover such obligations. In such an event, we may be required to seek additional sources of short-term liquidity, which may not be available on reasonable terms, if at all, and our operating results and our liquidity could be adversely affected and our banking relationships could be harmed.
Because our long term success depends, in part, on our ability to expand the sales of our solution to clients located outside of the United States, our business will be subject to risks associated with international operations.
An element of our growth strategy is to expand our operations and client base. To date, we have not engaged in any operations outside of the United States. If we decide to expand our operations into international markets, it will require significant resources and management attention and will subject us to regulatory, economic and political risks that are different from those in the United States. Because of our lack of experience with international operations, we cannot ensure that our international expansion efforts will be successful, and the impact of such expansion efforts may adversely affect our business, operating results or financial condition.
22
Risks Related to Legislation or Regulation
Privacy concerns and laws or other domestic regulations may reduce the effectiveness of our applications.
Our applications require the storage and transmission of proprietary and confidential information of our clients and their employees, including personal or identifying information, as well as their financial and payroll data. Our applications are subject to various complex government laws and regulations on the federal, state and local levels, including those governing personal privacy, which has become a significant issue in the United States. The regulatory framework for privacy issues is rapidly evolving and is likely to remain uncertain for the foreseeable future. Many federal, state and foreign government bodies and agencies have adopted or are considering adopting laws and regulations regarding the collection, use and disclosure of personal information. In the United States, these include rules and regulations promulgated under the authority of the Federal Trade Commission, the Health Insurance Portability and Accountability Act of 1996, the Family Medical Leave Act of 1993, the ACA, federal and state labor and employment laws and state data breach notification laws. Failure to comply with such laws and regulations could result in the imposition of consent orders or civil and criminal penalties, including fines, which could damage our reputation and have an adverse effect on our results of operations or financial condition.
In addition to government regulation, privacy advocates and industry groups may propose new and different self-regulatory standards. Because the interpretation and application of privacy and data protection laws are still uncertain, it is possible that these laws may be interpreted and applied in a manner that is inconsistent with our existing data management practices or the features of our solution. Any failure to comply with government regulations that apply to our applications, including privacy and data protection laws, could subject us to liability. In addition to the possibility of fines, lawsuits and other claims, we could be required to fundamentally change our business activities and practices or modify our solution, which could have an adverse effect on our business, operating results or financial condition. Any inability to adequately address privacy concerns, even if unfounded, or comply with applicable privacy or data protection laws, regulations and policies, could result in additional cost and liability to us, damage our reputation, inhibit sales and adversely affect our business, operating results or financial condition.
Furthermore, privacy concerns may cause our clients’ employees to resist providing the personal data necessary to allow our clients and their employees to use our applications effectively. Even the perception of privacy concerns, whether or not valid, may inhibit market adoption of our applications in certain industries. All of these legislative and regulatory initiatives may adversely affect the ability of our clients to process, handle, store, use and transmit demographic and personal information from their employees, which could reduce demand for our applications.
Our solution may be adversely impacted by changes in laws, government regulations and policies.
Many of our applications are designed to assist clients’ compliance with government regulations that continually change. Changes in regulations could affect the extent and type of benefits employers are required, or may choose, to provide employees or the amount and type of taxes employers and employees are required to pay. Such changes could reduce or eliminate the need for certain of our applications and substantially decrease our revenue. Additional regulatory or licensing requirements could also increase our cost of doing business. In addition, any failure to educate and assist our clients with respect to new or revised legislation that impacts them could have an adverse effect on our reputation. Further, any failure to modify our applications in a timely fashion in response to regulatory changes could have an adverse effect on our business and results of operations.
For example, healthcare industry reforms under the ACA, related state laws, and the regulations adopted or to be adopted thereunder, have the potential to impact substantially the way that employers provide health insurance to employees and, consequently, the health insurance market for our current and prospective clients. Many provisions of the ACA require the issuance of additional guidance from the U.S. Departments of Labor and Health & Human Services, the Internal Revenue Service (the “IRS”), and the states. We are unable to determine the ultimate impact that healthcare reform will have on our HCM business and our ability to attract and retain HCM clients.
Congress recently passed legislation that would repeal key tax and coverage aspects of the ACA, which was vetoed by President Obama. If, following the November 2016 presidential election, such legislation were passed and signed into law by the newly elected President, or the newly elected President or his or her administration takes action to suspend all or portions of the ACA, the need for our ACA application may be diminished or eliminated, which could have an adverse effect on our operating results.
23
Changes in laws and regulations related to the Internet or changes in the Internet infrastructure itself may diminish the demand for our applications, and could have a negative impact on our business.
The future success of our business depends upon the continued use of the Internet as a primary medium for commerce, communication and business. Federal, state and foreign government bodies or agencies have in the past adopted, and may in the future adopt, laws or regulations affecting the use of the Internet as a commercial medium. Changes in these laws or regulations could require us to modify our applications in order to comply with these changes. In addition, government agencies or private organizations may impose taxes, fees or other charges for accessing the Internet or commerce conducted via the Internet. These laws or charges could limit the growth of Internet-related commerce or communications generally, or result in reductions in the demand for Internet-based applications such as ours.
In addition, the use of the Internet as a means of conducting business could be adversely affected due to delays in the development or adoption of new standards and protocols to handle increased demands of Internet activity, security, reliability, cost, ease of use, accessibility, and quality of service. The performance of the Internet has been adversely affected by “viruses,” “worms” and similar malicious programs and the Internet has experienced a variety of outages and other delays as a result of damage to portions of its infrastructure. If the use of the Internet is adversely affected by these issues, demand for our applications could suffer, which could adversely affect our business.
If we are unable to implement and maintain effective internal control over financial reporting in the future, investors may lose confidence in the accuracy and completeness of our financial reports and the market price of our common stock may be negatively affected.
Pursuant to Section 404 of the Sarbanes-Oxley Act of 2002, as amended (the “Sarbanes-Oxley Act”), we are required to furnish a report by management on, among other things, the effectiveness of our internal control over financial reporting for the fiscal year ending December 31, 2015 and in each year thereafter. Our auditors will also need to attest to the effectiveness of our internal control over financial reporting.
If we have a material weakness in our internal control over financial reporting, we may not detect errors on a timely basis and our financial statements may be materially misstated. We are in the process of designing and implementing internal control over financial reporting to comply with this obligation, which process will be time consuming, costly and complicated. If we identify material weaknesses in our internal control over financial reporting, if we are unable to comply with the requirements of Section 404 in a timely manner, if we are unable to assert that our internal control over financial reporting is effective, or if our independent registered public accounting firm is unable to express an opinion as to the effectiveness of our internal control over financial reporting, investors may lose confidence in the accuracy and completeness of our financial reports we could become subject to investigations by the NYSE, the SEC, or other regulatory authorities and the market price of our common stock could be negatively affected.
We have incurred and will continue to incur increased costs and demands upon management as a result of complying with the laws and regulations affecting public companies.
As a public company, we have incurred since our initial public offering and expect to continue to incur significant legal, accounting and other expenses that we did not incur as a private company, including costs associated with public company reporting and corporate governance requirements. For example, we are subject to the reporting requirements of the Exchange Act, and are required to comply with the applicable requirements of the Sarbanes-Oxley Act, as well as rules and regulations subsequently implemented by the SEC and the NYSE, including the establishment and maintenance of effective disclosure controls and procedures and internal control over financial reporting and changes in corporate governance practices.
We expect that complying with these rules and regulations will increase our legal and financial compliance costs and make some activities more time-consuming and costly. In particular, we have incurred and expect to incur significant expenses and devote substantial management effort toward ensuring compliance with the requirements of Section 404 of the Sarbanes-Oxley Act, which have increased in 2016 because we are no longer an emerging growth company, as defined in the Jumpstart Our Business Startups Act (the “JOBS Act”).
The costs associated with operating as a public company may decrease our net income or result in a net loss and may require us to reduce costs in other areas of our business or increase the prices of our solution. Additionally, if these requirements divert management’s attention from other business concerns, they could have an adverse effect on our business, operating results or financial condition.
24
As of January 1, 2016, we are no longer an “emerging growth company” as defined in the JOBS Act, and the reduced disclosure requirements applicable to emerging growth companies no longer apply to us.
Because the market value of our common stock held by non-affiliates exceeded $700 million as of June 30, 2015, we were deemed a large accelerated filer as of January 1, 2016 and, accordingly, we no longer qualify as an emerging growth company. As a large accelerated filer, we are now subject to certain disclosure requirements that apply to other public companies but did not previously apply to us due to our status as an emerging growth company. These requirements include:
|
|
· |
compliance with the auditor attestation requirements in the assessment of our internal control over financial reporting; |
|
|
· |
compliance with any requirement that may be adopted by the Public Company Accounting Oversight Board regarding mandatory audit firm rotation or a supplement to the auditor’s report providing additional information about the audit and the financial statements; |
|
|
· |
full disclosure obligations regarding executive compensation; and |
|
|
· |
compliance with the requirements of holding a nonbinding advisory vote on executive compensation and stockholder approval of any golden parachute payments not previously approved. |
Failure to comply with these requirements could subject us to enforcement actions by the SEC, which could divert management’s attention, damage our reputation and adversely affect our business, operating results or financial condition.
Adverse tax laws or regulations could be enacted or existing laws could be applied to us or our clients, which could increase the costs of our solution and applications and could adversely affect our business, operating results or financial condition.
The application of federal, state and local tax laws to services provided electronically is evolving. New income, sales, use or other tax laws, statutes, rules, regulations or ordinances could be enacted at any time (possibly with retroactive effect), and could be applied solely or disproportionately to services and applications provided over the Internet. These enactments could adversely affect our sales activity, due to the inherent cost increase the taxes would represent and ultimately could adversely affect our business, operating results or financial condition.
Each state has different rules and regulations governing sales and use taxes, and these rules and regulations are subject to varying interpretations that change over time. We review these rules and regulations periodically and, when we believe we are subject to sales and use taxes in a particular state, we may voluntarily engage state tax authorities in order to determine how to comply with that state’s rules and regulations. We cannot ensure that we will not be subject to sales and use taxes or related penalties for past sales in states where we currently believe no such taxes are required.
In addition, existing tax laws, statutes, rules, regulations or ordinances could be interpreted, changed, modified or applied adversely to us (possibly with retroactive effect), which could require us or our clients to pay additional tax amounts, as well as require us or our clients to pay fines or penalties and interest for past amounts. If we are unsuccessful in collecting such taxes from our clients, we could be held liable for such costs, thereby adversely affecting our business, operating results or financial condition.
Risks Related to Ownership of our Common Stock
Our actual operating results may differ significantly from our guidance.
From time to time, we have released, and may continue to release, guidance in our earnings conference calls, earnings releases, or otherwise, regarding our future performance, which represents our estimates as of the date of release. This guidance, which includes forward-looking statements, has been and will be based on projections prepared by our management. These projections are not prepared with a view toward compliance with published guidelines of the American Institute of Certified Public Accountants, and neither our registered public accountants nor any other independent expert or outside party compiles or examines the projections. Accordingly, no such person expresses any opinion or any other form of assurance with respect to the projections.
Projections are based upon a number of assumptions and estimates that, while presented with numerical specificity, are inherently subject to significant business, economic, and competitive uncertainties and contingencies, many of which are beyond our control. Projections are also based upon specific assumptions with respect to future business decisions, some of which will change. The principal reason that we release guidance is to provide a basis for our management to discuss our business outlook with analysts and investors. We do not accept any responsibility for any projections or reports published by any third parties.
Guidance is necessarily speculative in nature, and it can be expected that some or all of the assumptions underlying the guidance furnished by us will vary significantly from actual results. Accordingly, our guidance is only an estimate of what management
25
believes is realizable as of the date of release. Actual results may vary from our guidance and the variations may be material. In light of the foregoing, investors are urged not to rely upon our guidance in making an investment decision regarding our common stock.
Any failure to successfully implement our operating strategy or the occurrence of any of the events or circumstances set forth in this “Risk Factors” section in this Annual Report on Form 10-K could result in the actual operating results being different from our guidance, and the differences may be adverse and material.
As of September 21, 2015, we ceased to be a “controlled company” as defined in the NYSE Listed Company Manual and, as a result, we no longer qualify for exemptions from certain corporate governance requirements. If we are unable to comply with applicable corporate governance requirements, we may become subject to enforcement actions by the NYSE.
Prior to September 21, 2015, the parties to the Amended and Restated Stockholders Agreement dated March 10, 2014 (and, as previously disclosed, terminated as of December 29, 2015), which included WCAS X, WCAS Capital IV, WCAS Management Corporation, Chad Richison, Shannon Rowe, William X. Kerber, III, Jeffrey D. York, Robert J. Levenson, the Estate of Richard Aiello and certain of their affiliates or related entities (collectively, the “Former Stockholders Agreement Parties”), held more than 50% of the voting power for the election of our directors. Accordingly, we relied upon the “controlled company” exception with respect to certain NYSE corporate governance requirements. Pursuant to this exception, we were exempt from the rules that would have otherwise required that our Board of Directors consist of a majority of independent directors and that our compensation committee and nominating and corporate governance committee be composed entirely of independent directors.
Following the closing of a registered secondary offering on September 21, 2015, the Former Stockholders Agreement Parties no longer held more than 50% of the voting power for the election of directors and, as a result, we are no longer a “controlled company” as defined in the NYSE Listed Company Manual. By September 21, 2016, our nominating and corporate governance committee and compensation committee must consist solely of independent directors and our Board of Directors must consist of a majority of independent directors. During this phase-in period, our stockholders will not have the same protections afforded to stockholders of companies that have committees of their boards of directors that consist solely of independent directors and boards of directors that consist of a majority of independent directors. Further, if, within the phase-in period, we are not able to recruit additional directors who qualify as independent, or we are not able to otherwise comply with the NYSE listing requirements, we may be subject to enforcement actions by the NYSE.
The price of our common stock has been and may continue to be volatile or may decline regardless of our operating performance, and you may not be able to resell your shares at or above the current market price.
The market price of our common stock has been, and is likely to continue to be, volatile for the foreseeable future. If an active trading market for our common stock is not sustained, you may have difficulty selling any shares of our common stock that you purchased, and the value of such shares may be materially impaired. The market price of our common stock may fluctuate significantly in response to numerous factors, many of which are beyond our control, including:
|
|
· |
our operating performance and the performance of other similar companies; |
|
|
· |
the overall performance of the equity markets; |
|
|
· |
announcements by us or our competitors of new applications or enhancements, acquisitions, services, strategic alliances, commercial relationships, joint ventures or capital commitments; |
|
|
· |
disruptions in our services due to hardware, software or network problems; |
|
|
· |
recruitment or departure of key personnel; |
|
|
· |
publication of unfavorable research reports about us or our industry or withdrawal of research coverage by securities analysts; |
|
|
· |
trading activity by a limited number of stockholders who together beneficially own a majority of our outstanding common stock; |
|
|
· |
the size of our public float; |
|
|
· |
the economy as a whole, market conditions in our industry and the industries of our clients; and |
|
|
· |
economic, legal and regulatory factors unrelated to our performance. |
In addition, the stock markets have experienced extreme price and volume fluctuations that have affected and continue to affect the market prices of equity securities of many technology companies. Stock prices of many technology companies have fluctuated in a manner unrelated or disproportionate to the operating performance of those companies. In the past, stockholders have filed securities
26
class actions following periods of market volatility. If we were to become involved in securities litigation, it could subject us to substantial costs, divert resources and the attention of management from our business, and adversely affect our business, operating results or financial condition.
If securities or industry analysts do not publish research or publish misleading or unfavorable research about our business, our stock price and trading volume could decline.
The trading market for our common stock depends in part on the research and reports that securities or industry analysts publish about us or our business. If no or few securities or industry analysts cover our company, the trading price for our common stock would be negatively impacted. If one or more of the analysts who covers us downgrades our stock or publishes incorrect or unfavorable research about our business, our common stock price would likely decline. If one or more of these analysts ceases coverage of our company or fails to publish reports on us regularly, demand for our common stock could decrease, which could cause our common stock price or trading volume to decline.
Future sales of shares of our common stock by existing stockholders could depress the market price of our common stock.
We completed four secondary offerings in 2015, which involved the registration and sale of a substantial number of shares of our common stock that were not freely tradable on the NYSE prior to the completion of these offerings. The resulting increase in the number of shares of our common stock eligible to be traded on the NYSE could depress the market price of our common stock.
We have also registered shares of common stock that we have issued and may issue under our equity plans. These shares can be freely sold in the public market upon issuance, subject in some cases to volume and other restrictions under Rules 144 and 701 under the Securities Act. If any of these additional shares are sold, or if it is perceived that they will be sold, in the public market, the trading price of our common stock could decline.
The issuance of additional stock in connection with acquisitions, our stock incentive plans, warrants or otherwise will dilute all other stockholders.
Our certificate of incorporation authorizes us to issue up to one hundred million shares of common stock and up to ten million shares of preferred stock with such rights and preferences as may be determined by our board of directors. Subject to compliance with applicable rules and regulations, we may issue all of these shares that are not already outstanding without any action or approval by our stockholders. We intend to continue to evaluate strategic acquisitions in the future. We may pay for such acquisitions, partly or in full, through the issuance of additional equity securities.
Any issuance of shares in connection with an acquisition, the exercise of stock options or warrants, the award of shares of restricted stock or otherwise would dilute the percentage ownership held by our existing stockholders.
We do not intend to pay regular dividends for the foreseeable future.
We currently intend to retain any future earnings to finance the operation and expansion of our business, and we do not expect to declare or pay any regular dividends in the foreseeable future. Consequently, stockholders must rely on sales of their common stock after price appreciation, which may never occur, as the only way to realize any future gains on their investment.
Anti-takeover provisions in our charter documents and Delaware law may delay or prevent an acquisition of our company.
Our certificate of incorporation, bylaws and Delaware law contain provisions that may have the effect of delaying or preventing a change in control of us or changes in our management. These provisions, alone or together, could delay or prevent hostile takeovers and changes in control or changes in our management.
Any provision of our certificate of incorporation, bylaws or Delaware law that has the effect of delaying or deterring a change in control could limit the opportunity for our stockholders to receive a premium for their shares of our common stock, and could affect the price that some investors are willing to pay for our common stock.
Our reported financial results may be adversely affected by changes in accounting principles generally accepted in the United States.
Generally accepted accounting principles in the United States are subject to interpretation by the Financial Accounting Standards Board (“FASB”), the SEC and various bodies formed to promulgate and interpret appropriate accounting principles. A
27
change in these principles or interpretations could have a significant effect on our reported financial results, and could affect the reporting of transactions completed before the announcement of a change.
None.
Our corporate headquarters is located in Oklahoma City, Oklahoma on a 170,000 square foot corporate campus that includes a disaster recovery site located in Oklahoma City. We own over 30 acres in Oklahoma City upon which our facilities are located. We also own and operate fully redundant data centers located at our corporate headquarters in Oklahoma and at an 18,727 square foot operations center that we lease in Dallas, Texas.
We also lease offices in Arizona, California, Colorado, Connecticut, Florida, Georgia, Illinois, Indiana, Maryland, Massachusetts, Michigan, Minnesota, Missouri, New Jersey, New York, North Carolina, Ohio, Oklahoma, Oregon, Pennsylvania, Texas, Tennessee, Virginia and Washington. We believe that these facilities are suitable for our current operations and upon the expiration of the terms of the leases we believe we could renew these leases or find suitable space elsewhere on acceptable terms.
On September 23, 2014, National Financial Partners Corp. (“NFP”) filed a complaint against us in the United States District Court for the Northern District of Illinois (the “District Court”) (Civil Action No. 1:14-cv-07424). The complaint alleged trademark infringement, unfair competition, deceptive trade practices, consumer fraud and deceptive business practices related to the adoption and use of our logo and sought preliminary and permanent injunctions prohibiting us from using our logo as well as money damages, including an accounting for sales and profits, attorneys’ fees and disgorgement of profits. On June 25, 2015, we filed an offer of judgment seeking to resolve all pending claims between the parties and terminate the action with the payment of $20,000 by Paycom Payroll, LLC and an agreement to change our logo within 60 days. Our offer of judgment was accepted by NFP and the District Court entered a judgment pursuant to the offer of judgment on July 6, 2015, terminating the District Court action.
We are involved in various other legal proceedings in the ordinary course of business. Although we cannot predict the outcome of these proceedings, legal matters are subject to inherent uncertainties and there exists the possibility that the ultimate resolution of these matters could have a material adverse effect on our business, financial condition, results of operations or cash flows.
None.
28
|
Item 5. |
Market for Registrants Common Equity, Related Stockholder Matters and Issuer Purchases of Equity Securities |
Price Range of Common Stock
Our common stock is traded on the NYSE under the symbol “PAYC.” Our initial public offering was priced at $15.00 per share on April 14, 2014. The following table sets forth for the periods indicated the high and low intra-day sale prices per share of our common stock as reported on the NYSE:
|
|
|
High |
|
|
Low |
|
||
|
Fiscal Year 2014: |
|
|
|
|
|
|
|
|
|
Second Quarter (from April 15, 2014) |
|
$ |
17.92 |
|
|
$ |
13.01 |
|
|
Third Quarter |
|
$ |
19.24 |
|
|
$ |
12.28 |
|
|
Fourth Quarter |
|
$ |
29.42 |
|
|
$ |
14.32 |
|
|
Fiscal Year 2015: |
|
|
|
|
|
|
|
|
|
First Quarter |
|
$ |
35.86 |
|
|
$ |
22.58 |
|
|
Second Quarter |
|
$ |
39.75 |
|
|
$ |
29.36 |
|
|
Third Quarter |
|
$ |
41.58 |
|
|
$ |
29.80 |
|
|
Fourth Quarter |
|
$ |
46.35 |
|
|
$ |
34.85 |
|
On February 1, 2016, the last reported sale price of our common stock on the NYSE was $31.34 per share. As of February 1, 2016, we had 321 holders of record of our common stock. The actual number of stockholders is greater than this number of record holders, and includes stockholders who are beneficial owners, but whose shares are held in street name by brokers and other nominees. This number of holders of record also does not include stockholders whose shares may be held in trust by other entities.
Dividends
We did not pay any cash dividends on our common stock in 2015 or 2014 and we do not currently plan to pay a regular dividend on our common stock. The declaration, amount and payment of any future dividends on shares of common stock will be at the sole discretion of our board of directors and we may reduce or discontinue entirely the payment of such dividends at any time. Our board of directors may take into account general and economic conditions, our financial condition and operating results, our available cash and current and anticipated cash needs, capital requirements, contractual, legal, tax and regulatory restrictions and implications of the payment of dividends by us to our stockholders or by our subsidiaries to us, and such other factors as our board of directors may deem relevant. While there are no restrictions that currently apply under our existing loan agreements, such agreements prohibit the payment of dividends if an event of default exists. In addition, any financing arrangements that we enter into in the future may include restrictive covenants that limit our or our subsidiaries’ ability to pay dividends.
We are a holding company that has no material assets other than our ownership of all of the outstanding Series B Preferred Units of Holdings and the outstanding capital stock of WCAS Holdings and WCAS CP IV Blocker, Inc. In the event that we decide to pay dividends in the future, we intend to cause Holdings to make distributions to us in an amount sufficient to cover cash dividends, if any, declared by us.
29
Notwithstanding any statement to the contrary in any of our filings with the SEC, the following performance graph shall not be deemed “filed” with the SEC for purposes of Section 18 of the Exchange Act or “soliciting material” under the Exchange Act and shall not be incorporated by reference into any such filings irrespective of any general incorporation language contained in such filing.
The following graph compares the total cumulative stockholder return on our common stock with the total cumulative return of the S&P 500 Index and the S&P 1500 Application Software Index during the period commencing on April 15, 2014, the initial trading day of our common stock, and ending on December 31, 2015. The graph assumes that $100 was invested at the beginning of the period in our common stock and in each of the comparative indices, and assumes the reinvestment of any dividends. Historical stock price performance should not be relied upon as an indication of future stock price performance.
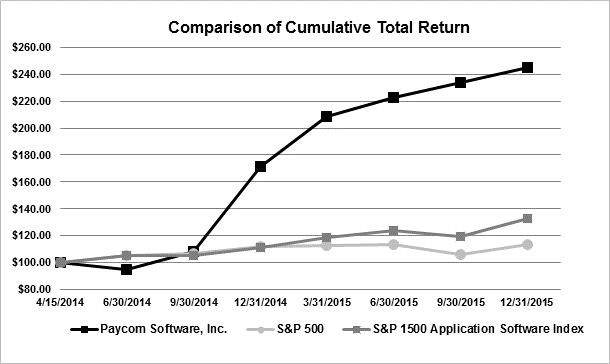
|
|
|
Base |
|
|
|
|
|
|
|
|
|
|
|
|
|
|
|
|
|
|
|
|
|
|
|
|
|
|
|
|
|
|
|
|
|
Period |
|
|
|
|
|
|
|
|
|
|
|
|
|
|
|
|
|
|
|
|
|
|
|
|
|
|
|
|
|
|
|
Company/Index |
|
4/15/2014 |
|
|
6/30/2014 |
|
|
9/30/2014 |
|
|
12/31/2014 |
|
|
3/31/2015 |
|
|
6/30/2015 |
|
|
9/30/2015 |
|
|
12/31/2015 |
|
||||||||
|
Paycom Software, Inc. |
|
$ |
100 |
|
|
$ |
95.05 |
|
|
$ |
107.88 |
|
|
$ |
171.53 |
|
|
$ |
208.86 |
|
|
$ |
222.48 |
|
|
$ |
233.94 |
|
|
$ |
245.15 |
|
|
S&P 500 |
|
$ |
100 |
|
|
$ |
105.23 |
|
|
$ |
106.42 |
|
|
$ |
111.67 |
|
|
$ |
112.73 |
|
|
$ |
113.05 |
|
|
$ |
105.77 |
|
|
$ |
113.22 |
|
|
S&P 1500 Application Software |
|
$ |
100 |
|
|
$ |
104.92 |
|
|
$ |
105.17 |
|
|
$ |
111.27 |
|
|
$ |
118.45 |
|
|
$ |
123.92 |
|
|
$ |
119.31 |
|
|
$ |
132.88 |
|
30
Item 6.Selected Financial Data
Our selected consolidated financial data set forth below should be read together with Part II, Item 7, “Management’s Discussion and Analysis of Financial Condition and Results of Operations” and our consolidated financial statements and the related notes thereto, which are included elsewhere in this Annual Report on Form 10-K.
|
|
|
Year Ended December 31, |
|
|||||||||||||||||
|
|
|
2015 |
|
|
2014 |
|
|
2013 |
|
|
2012 |
|
|
2011 |
|
|||||
|
|
|
(dollars in thousands, except share and per share data) |
|
|||||||||||||||||
|
Consolidated statements of income data: |
|
|
|
|
|
|
|
|
|
|
|
|
|
|
|
|
|
|
|
|
|
Revenues |
|
|
|
|
|
|
|
|
|
|
|
|
|
|
|
|
|
|
|
|
|
Recurring |
|
$ |
219,987 |
|
|
$ |
148,207 |
|
|
$ |
105,560 |
|
|
$ |
75,420 |
|
|
$ |
56,382 |
|
|
Implementation and other |
|
|
4,666 |
|
|
|
2,722 |
|
|
|
2,041 |
|
|
|
1,390 |
|
|
|
824 |
|
|
Total revenues |
|
|
224,653 |
|
|
|
150,929 |
|
|
|
107,601 |
|
|
|
76,810 |
|
|
|
57,206 |
|
|
Cost of revenues (1) |
|
|
|
|
|
|
|
|
|
|
|
|
|
|
|
|
|
|
|
|
|
Operating expenses |
|
|
31,790 |
|
|
|
24,694 |
|
|
|
19,070 |
|
|
|
14,895 |
|
|
|
12,287 |
|
|
Depreciation and amortization |
|
|
3,683 |
|
|
|
2,624 |
|
|
|
1,821 |
|
|
|
1,431 |
|
|
|
987 |
|
|
Total cost of revenues |
|
|
35,473 |
|
|
|
27,318 |
|
|
|
20,891 |
|
|
|
16,326 |
|
|
|
13,274 |
|
|
Administrative expenses (1) |
|
|
|
|
|
|
|
|
|
|
|
|
|
|
|
|
|
|
|
|
|
Sales and marketing |
|
|
92,554 |
|
|
|
63,547 |
|
|
|
42,681 |
|
|
|
29,255 |
|
|
|
22,244 |
|
|
Research and development |
|
|
8,627 |
|
|
|
4,325 |
|
|
|
2,146 |
|
|
|
1,632 |
|
|
|
1,225 |
|
|
General and administrative |
|
|
47,826 |
|
|
|
35,501 |
|
|
|
28,729 |
|
|
|
19,372 |
|
|
|
14,650 |
|
|
Depreciation and amortization |
|
|
5,738 |
|
|
|
4,538 |
|
|
|
3,682 |
|
|
|
4,092 |
|
|
|
4,300 |
|
|
Total administrative expenses |
|
|
154,745 |
|
|
|
107,911 |
|
|
|
77,238 |
|
|
|
54,351 |
|
|
|
42,419 |
|
|
Total operating expenses |
|
|
190,218 |
|
|
|
135,229 |
|
|
|
98,129 |
|
|
|
70,677 |
|
|
|
55,693 |
|
|
Operating income |
|
|
34,435 |
|
|
|
15,700 |
|
|
|
9,472 |
|
|
|
6,133 |
|
|
|
1,513 |
|
|
Interest expense |
|
|
(1,427 |
) |
|
|
(3,421 |
) |
|
|
(9,272 |
) |
|
|
(6,977 |
) |
|
|
(134 |
) |
|
Net loss on early repayment of debt |
|
|
— |
|
|
|
(4,044 |
) |
|
|
— |
|
|
|
— |
|
|
|
— |
|
|
Other income, net |
|
|
517 |
|
|
|
1,421 |
|
|
|
1,199 |
|
|
|
354 |
|
|
|
108 |
|
|
Income (loss) before income taxes |
|
|
33,525 |
|
|
|
9,656 |
|
|
|
1,399 |
|
|
|
(490 |
) |
|
|
1,487 |
|
|
Provision (benefit) for income taxes |
|
|
12,580 |
|
|
|
3,993 |
|
|
|
792 |
|
|
|
(84 |
) |
|
|
601 |
|
|
Net income (loss) |
|
|
20,945 |
|
|
|
5,663 |
|
|
|
607 |
|
|
|
(406 |
) |
|
|
886 |
|
|
Net income (loss) attributable to the noncontrolling interest |
|
|
— |
|
|
|
— |
|
|
|
6 |
|
|
|
(3 |
) |
|
|
— |
|
|
Net income (loss) attributable to the Company |
|
$ |
20,945 |
|
|
$ |
5,663 |
|
|
$ |
601 |
|
|
$ |
(403 |
) |
|
$ |
886 |
|
|
Unaudited pro forma additional income tax expense (benefit) |
|
|
— |
|
|
|
— |
|
|
|
(137 |
) |
|
|
(14 |
) |
|
|
35 |
|
|
Unaudited pro forma net income (loss) |
|
$ |
20,945 |
|
|
$ |
5,663 |
|
|
$ |
738 |
|
|
$ |
(389 |
) |
|
$ |
851 |
|
|
Net income (loss) per share, basic |
|
$ |
0.37 |
|
|
$ |
0.11 |
|
|
$ |
0.01 |
|
|
$ |
(0.01 |
) |
|
$ |
0.02 |
|
|
Net income (loss) per share, diluted |
|
$ |
0.36 |
|
|
$ |
0.11 |
|
|
$ |
0.01 |
|
|
$ |
(0.01 |
) |
|
$ |
0.02 |
|
|
Unaudited pro forma net income (loss) per share, basic |
|
$ |
0.37 |
|
|
$ |
0.11 |
|
|
$ |
0.02 |
|
|
$ |
(0.01 |
) |
|
$ |
0.02 |
|
|
Unaudited pro forma net income (loss) per share, diluted |
|
$ |
0.36 |
|
|
$ |
0.11 |
|
|
$ |
0.02 |
|
|
$ |
(0.01 |
) |
|
$ |
0.02 |
|
|
Weighted average shares outstanding: |
|
|
|
|
|
|
|
|
|
|
|
|
|
|
|
|
|
|
|
|
|
Basic |
|
|
56,495,170 |
|
|
|
49,784,154 |
|
|
|
45,476,895 |
|
|
|
44,771,559 |
|
|
|
44,560,053 |
|
|
Diluted |
|
|
57,919,700 |
|
|
|
51,857,309 |
|
|
|
48,062,075 |
|
|
|
44,771,559 |
|
|
|
45,411,371 |
|
|
Unaudited pro forma weighted average shares outstanding: |
|
|
|
|
|
|
|
|
|
|
|
|
|
|
|
|
|
|
|
|
|
Basic |
|
|
56,495,170 |
|
|
|
49,784,154 |
|
|
|
45,476,895 |
|
|
|
44,771,559 |
|
|
|
44,560,053 |
|
|
Diluted |
|
|
57,919,700 |
|
|
|
51,857,309 |
|
|
|
48,062,075 |
|
|
|
44,771,559 |
|
|
|
45,411,371 |
|
|
|
|
|
|
|
|
|
|
|
|
|
|
|
|
|
|
|
|
|
|
|
|
Other financial data: |
|
|
|
|
|
|
|
|
|
|
|
|
|
|
|
|
|
|
|
|
|
EBITDA (2) |
|
$ |
44,373 |
|
|
$ |
20,239 |
|
|
$ |
16,174 |
|
|
$ |
12,010 |
|
|
$ |
6,908 |
|
|
Adjusted EBITDA (2) |
|
$ |
48,068 |
|
|
$ |
26,999 |
|
|
$ |
19,855 |
|
|
$ |
12,829 |
|
|
$ |
7,073 |
|
|
Non-GAAP net income (2) |
|
$ |
23,449 |
|
|
$ |
9,628 |
|
|
$ |
2,689 |
|
|
$ |
266 |
|
|
$ |
945 |
|
31
|
|
|
As of December 31, |
|
|||||||||||||
|
|
|
2015 |
|
|
2014 |
|
|
2013 |
|
|
2012 |
|
||||
|
Consolidated balance sheets data: |
|
(in thousands) |
|
|||||||||||||
|
Cash and cash equivalents |
|
$ |
50,714 |
|
|
$ |
25,144 |
|
|
$ |
13,362 |
|
|
$ |
13,435 |
|
|
Restricted cash |
|
|
— |
|
|
|
371 |
|
|
|
369 |
|
|
|
368 |
|
|
Working capital (deficit) (3) |
|
|
37,330 |
|
|
|
15,340 |
|
|
|
(7,694 |
) |
|
|
5,099 |
|
|
Property and equipment, net |
|
|
58,858 |
|
|
|
47,919 |
|
|
|
38,671 |
|
|
|
25,139 |
|
|
Total assets |
|
|
876,773 |
|
|
|
797,497 |
|
|
|
575,478 |
|
|
|
430,041 |
|
|
Deferred revenue |
|
|
29,036 |
|
|
|
19,337 |
|
|
|
12,572 |
|
|
|
8,392 |
|
|
Long-term debt, less current portion |
|
|
24,974 |
|
|
|
26,123 |
|
|
|
11,545 |
|
|
|
11,959 |
|
|
Long-term debt to related parties |
|
|
— |
|
|
|
— |
|
|
|
60,875 |
|
|
|
60,633 |
|
|
Additional paid in capital |
|
|
71,135 |
|
|
|
67,937 |
|
|
|
33,978 |
|
|
|
23,577 |
|
|
Retained earnings (accumulated deficit) |
|
|
26,608 |
|
|
|
5,663 |
|
|
|
(29,349 |
) |
|
|
(14,249 |
) |
|
Total stockholder's equity |
|
|
98,314 |
|
|
|
74,138 |
|
|
|
5,083 |
|
|
|
9,776 |
|
|
|
(1) |
Stock-based compensation included in the consolidated statements of income data for the years ended December 31, 2015, 2014, 2013, 2012 and 2011 as follows (in thousands): |
|
|
|
Year Ended December 31, |
|
|||||||||||||||||
|
|
|
2015 |
|
|
2014 |
|
|
2013 |
|
|
2012 |
|
|
2011 |
|
|||||
|
Stock-based compensation expense: |
|
|
|
|
|
|
|
|
|
|
|
|
|
|
|
|
|
|
|
|
|
Operating expenses |
|
$ |
235 |
|
|
$ |
32 |
|
|
$ |
222 |
|
|
$ |
87 |
|
|
$ |
36 |
|
|
Sales and marketing |
|
|
559 |
|
|
|
166 |
|
|
|
114 |
|
|
|
83 |
|
|
|
57 |
|
|
Research and development |
|
|
104 |
|
|
|
16 |
|
|
|
345 |
|
|
|
100 |
|
|
|
25 |
|
|
General and administrative |
|
|
2,112 |
|
|
|
498 |
|
|
|
253 |
|
|
|
233 |
|
|
|
47 |
|
|
Total stock-based compensation expense |
|
$ |
3,010 |
|
|
$ |
712 |
|
|
$ |
934 |
|
|
$ |
503 |
|
|
$ |
165 |
|
|
|
(2) |
We use EBITDA, Adjusted EBITDA and non-GAAP net income as supplemental measures to review and assess our performance and for planning purposes. We define: (i) EBITDA as net income (loss), plus interest expense, taxes and depreciation and amortization, (ii) Adjusted EBITDA as net income (loss), plus interest expense, taxes, depreciation and amortization, stock-based compensation expense, net loss on early repayment of debt and certain transaction expenses that are not core to our operations and (iii) non-GAAP net income as pro forma net income (loss), plus tax adjusted stock-based compensation expense, tax adjusted net loss on early repayment of debt and certain tax adjusted transaction expenses that are not core to our operations. EBITDA, Adjusted EBITDA and non-GAAP net income are metrics that we believe are useful to investors in evaluating our performance and facilitating comparison with other peer companies, many of which use similar non-GAAP financial measures to supplement results under accounting principles generally accepted in the United States of America (“U.S. GAAP”). |
EBITDA, Adjusted EBITDA and non-GAAP net income are not measures of financial performance under U.S. GAAP, and should not be considered a substitute for net income (loss) or pro forma net income (loss), which we consider to be the most directly comparable U.S. GAAP measures. EBITDA, Adjusted EBITDA and non-GAAP net income have limitations as analytical tools, and when assessing our operating performance, you should not consider EBITDA, Adjusted EBITDA or non-GAAP net income in isolation, or as a substitute for net income (loss), pro forma net income (loss) or other consolidated statements of income data prepared in accordance with U.S. GAAP. EBITDA, Adjusted EBITDA and non-GAAP net income may not be comparable to similar titled measures of other companies and other companies may not calculate such measures in the same manner as we do.
|
|
(3) |
Working capital (deficit) is defined as current assets, excluding restricted cash, less current liabilities, excluding current portion of deferred revenue. For December 31, 2014, 2013 and 2012, our working capital includes the effects of the adoption of ASU No. 2015-17, Balance Sheet Classification of Deferred Taxes, requiring all deferred tax assets and liabilities to be classified as noncurrent on our consolidated balance sheets. |
32
You should read the following discussion and analysis of our financial condition and results of operations in conjunction with the audited and unaudited consolidated financial statements and related notes included elsewhere in this Annual Report on Form 10-K. The following discussion contains forward-looking statements that are subject to risks and uncertainties. See Part I “Special Note Regarding Forward-Looking Statements” for a discussion of the uncertainties, risks, and assumptions associated with those statements. Actual results could differ materially from those discussed in or implied by forward- looking statements as a result of various factors, including those discussed below and elsewhere in this Annual Report on Form 10-K, particularly in the section entitled “Risk Factors.” Unless we state otherwise or the context otherwise requires, the terms “we,” “us,” “our” and the “Company” refer, prior to the 2014 Reorganization (as defined below), to Paycom Payroll Holdings, LLC and its consolidated subsidiaries (“Holdings”) and WCAS Paycom Holdings, Inc. (“WCAS Holdings”) collectively, and, after the 2014 Reorganization, to Paycom Software, Inc. (“Software”) and its consolidated subsidiaries.
Overview
We are a leading provider of comprehensive, cloud-based human capital management (“HCM”) software delivered as Software-as-a-Service. We provide functionality and data analytics that businesses need to manage the complete employment life cycle from recruitment to retirement. Our solution requires virtually no customization and is based on a core system of record maintained in a single database for all HCM functions, including talent acquisition, time and labor management, payroll, talent management and human resources (“HR”) management applications. Our user-friendly software allows for easy adoption of our solution by employees, enabling self-management of their HCM activities in the cloud, which reduces the administrative burden on employers and increases employee productivity.
We serve a diverse client base in terms of size and industry. We have over 15,000 clients, none of which constituted more than one-half of one percent of our revenues for the year ended December 31, 2015. We stored data for more than 2.1 million persons employed by our clients during the year ended December 31, 2015.
Our revenues are primarily generated through our sales force that solicits new clients and our client relations representatives who sell new applications to existing clients. We have 42 sales teams located in 24 states and plan to open additional sales offices to further expand our presence in the U.S. market. During the year ended December 31, 2015, we opened five new sales offices, with one sales office located in each of Brooklyn, Cincinnati, Kansas City, Nashville and Pittsburgh, and in January 2016, we opened an additional six new sales offices, with one new sales office located in each of Chicago, Cleveland, Pasadena, Sacramento, San Antonio and Stamford. Our continued growth depends on attracting new clients through geographic expansion, further penetration of our existing markets and the introduction of new applications to our existing client base. We also expect that changes in certain factors affecting our performance will correlate with improvement or deterioration in the labor market. Our principal marketing programs include telemarketing and email campaigns, search engine marketing methods and tradeshows.
During the last three years, we have developed several new applications. We believe our ability to continue to develop new applications and to improve existing applications will enable us to increase revenues in the future, and the number of our new applications adopted by our clients has been a significant factor in our revenue growth over the last three years.
Recent Developments
Registered Block Trade Transactions
On November 18, 2015, we closed an underwritten secondary offering of 4,500,000 shares of our common stock by Welsh, Carson, Anderson & Stowe X, L.P. (“WCAS X”), WCAS Capital Partners IV, L.P. (“WCAS Capital IV”), each of our executive officers and certain other selling stockholders at a public offering price of $42.15 per share. On November 19, 2015, the underwriter exercised its overallotment option and subsequently purchased an additional 585,697 shares from WCAS X and WCAS Capital IV. We did not receive any proceeds from the sales of these shares.
On September 15, 2015, we closed an underwritten secondary offering of 4,500,000 shares of our common stock by WCAS X, WCAS Capital Partners IV, each of our executive officers and certain other selling stockholders at a public offering price of $37.95 per share. On September 23, 2015, the underwriter exercised its option to purchase an additional 675,000 shares from WCAS X and WCAS Capital IV. We did not receive any proceeds from the sales of these shares.
On May 20, 2015, we closed an underwritten secondary offering of 8,000,000 shares of our common stock by WCAS X, WCAS Capital IV, each of our executive officers and certain other selling stockholders at a public offering price of $36.25 per share. We did not receive any proceeds from the sale of these shares.
33
On January 21, 2015, we closed a follow-on public offering of 6,422,750 shares of our common stock by certain selling stockholders at a public offering price of $22.50 per share. We did not receive any proceeds from the sale of these shares.
The 2014 Reorganization
Software and its wholly owned subsidiary, Payroll Software Merger Sub, LLC (“Merger Sub”) were formed as Delaware entities on October 31, 2013 and December 23, 2013, respectively, in anticipation of an initial public offering and were wholly owned subsidiaries of Holdings prior to December 31, 2013.
On January 1, 2014, we consummated a reorganization pursuant to which (i) WCAS X and WCAS Capital IV contributed WCAS Holdings and WCAS CP IV Blocker, Inc. (“CP IV Blocker”), which together owned all of the Series A Preferred Units of Holdings, to Software in exchange for shares of common stock of Software, and (ii) the owners of outstanding Series B Preferred Units of Holdings contributed their Series B Preferred Units of Holdings to Software in exchange for shares of common stock of Software. Immediately after these contributions, Merger Sub merged with and into Holdings with Holdings surviving the merger. Upon consummation of the merger, the remaining holders of outstanding common and incentive units of Holdings received shares of common and restricted stock of Software for their common and incentive units by operation of Delaware law, and Holdings’ ownership interest in Software was cancelled. Outstanding common units, Series B Preferred Units and WCAS Holdings and CP IV Blocker were contributed to Software in exchange for, or converted into, an aggregate of 45,708,573 shares of common stock and 8,121,101 shares of restricted stock of Software. Prior to the reorganization, WCAS Holdings held $46.2 million of Series C Preferred Units of Holdings, and WCAS Holdings had a 14% note due April 3, 2017 in the amount of $46.2 million, which was payable to WCAS X (the “2017 Note”). Following the exchange of the Series A Preferred Units and Series B Preferred Units for shares of common stock of Software, all outstanding Series C Preferred Units of Holdings were eliminated in an intercompany transaction between Holdings and WCAS Holdings, we assumed the 2017 Note and Software became a holding company with its principal assets being the Series B Preferred Units of Holdings and the outstanding capital stock of WCAS Holdings and CP IV Blocker. The foregoing transactions are referred to collectively as the “2014 Reorganization”.
Software’s acquisition of WCAS Holdings and Holdings in the 2014 Reorganization represented transactions under common control and were required to be retrospectively applied to the financial statements for all prior periods when the financial statements were issued for a period that included the date the transactions occurred. This includes a retrospective presentation for all equity related disclosures, including share, per share, and restricted stock disclosures, which have been revised to reflect the effects of the 2014 Reorganization. Therefore, our consolidated financial statements are presented as if WCAS Holdings and Holdings were our wholly owned subsidiaries in periods prior to the 2014 Reorganization. The acquisition of CP IV Blocker was not deemed to be a reorganization under common control and therefore our historical consolidated financial statements include the ownership of a minority equity interest in CP IV Blocker, which was eliminated upon the acquisition of CP IV Blocker in the 2014 Reorganization on January 1, 2014.
Trends and Opportunities
Our payroll application is the foundation of our solution and all of our clients are required to utilize this application in order to access our other applications. As a result of our evolving revenue mix, coupled with the unique client benefits that our solution provides (e.g., enabling our clients to scale the number of HCM applications that they use on an as-needed basis), we are presented with a variety of opportunities and challenges.
We generate revenues from (i) fixed amounts charged per billing period plus a fee per employee or transaction processed or (ii) fixed amounts charged per billing period. We do not require clients to enter into long-term contractual commitments with us. Our billing period varies by client based on when they pay their employees, which is either weekly, bi-weekly, semi-monthly or monthly.
For the years ended December 31, 2015, 2014 and 2013, our gross margins were approximately 84%, 82% and 81%, respectively. Historically, our total gross margin gradually improved over time as (i) our gross margin for our other HCM applications was higher than our gross margin for payroll processing, (ii) we added additional clients, (iii) our existing clients deployed additional HCM applications and (iv) we reduced our cost of revenues as a percentage of total revenues. We do not expect our gross margins to continue to grow at the same rate as they did between 2014 and 2015, but rather to remain relatively consistent.
34
Growing our business has also resulted in, and will continue to result in, substantial investment in sales professionals, operating expenses, systems development and programming costs and general and administrative expenses, which has and will continue to increase our expenses. We intend to obtain new clients by (i) continuing to expand our presence in metropolitan areas where we currently have an existing sales office through adding sales teams or offices and increasing the number of our sales professionals and (ii) opening sales offices in new metropolitan areas. Our ability to increase revenues and improve operating results depends on our ability to add new clients.
The average size of our clients has grown significantly as we have organically grown our operations and increased the number of applications we offer. Based on our total revenues, we have grown at an approximately 41% CAGR from January 1, 2011 through December 31, 2015. Because we charge our clients on a per employee basis for certain services we provide, any increase or decrease in the number of employees that our clients have will have a positive or negative impact on our results of operations. Our solution requires no adjustment to serve larger clients. We believe larger employers represent a substantial opportunity to increase the number of potential clients and to increase our revenue per client, with limited incremental cost to us.
We believe the challenges of managing the ever-changing complexity of payroll and human resources will continue to drive companies to turn to outsourced providers for help with their HCM needs. The HCM industry historically has been driven, in part, by legislation and regulatory action, including COBRA, changes to the minimum wage laws or overtime rules, and legislation from federal, state or municipal taxation authorities. The implementation of the Affordable Care Act (the “ACA”) is the most recent example of legislation that has created demand in the HCM industry. For the year ended December 31, 2015, ACA revenue represented less than 2% of total revenues and we estimate that revenues from Enhanced ACA will only represent approximately 5% of revenues for the year ending December 31, 2016. We have extended until March 18, 2016 the ability of clients and prospective clients to, subject to certain conditions, implement Enhanced ACA for purposes of filing their Forms 1094 and 1095 for the 2015 fiscal year.
Throughout our history, we have built strong relationships with our clients. As the HCM needs of our clients evolve, we believe that we are well-positioned to gain additional share of the HCM spending of our clients, and we believe this opportunity is significant. To be successful, we must continue to demonstrate the operational and economic benefits of our solution, as well as effectively hire, train, motivate and retain qualified personnel and executive officers.
Key Metrics
In addition to the accounting principles generally accepted in the United States (“U.S. GAAP”) metrics that we regularly monitor, we also monitor the following metrics to evaluate our business, measure our performance and identify trends affecting our business:
|
|
|
Year Ended December 31, |
|
|||||||||
|
|
|
2015 |
|
|
2014 |
|
|
2013 |
|
|||
|
|
|
(dollars in thousands) |
|
|||||||||
|
Key performance indicators: |
|
|
|
|
|
|
|
|
|
|
|
|
|
Clients |
|
|
15,004 |
|
|
|
12,775 |
|
|
|
10,792 |
|
|
Clients (based on parent company grouping) |
|
|
8,906 |
|
|
|
7,945 |
|
|
|
6,788 |
|
|
Sales teams |
|
|
36 |
|
|
|
31 |
|
|
|
26 |
|
|
Annualized New Recurring Revenue |
|
$ |
108,967 |
|
|
$ |
59,629 |
|
|
$ |
42,063 |
|
|
Revenue retention rate |
|
|
91 |
% |
|
|
91 |
% |
|
|
91 |
% |
|
· |
Clients. When we calculate the number of clients at period end, we treat client accounts with separate taxpayer identification numbers as separate clients, which often separates client accounts that are affiliated with the same parent organization. We track the number of our clients to provide an accurate gauge of the size of our business. Unless we state otherwise or the context otherwise requires, references to clients throughout this Annual Report on Form 10-K refer to this metric. |
|
· |
Clients (based on parent company grouping). When we calculate the number of clients based on parent company grouping at period end, we combine client accounts that have identified the same person(s) as their decision-maker regardless of whether the client accounts have separate taxpayer identification numbers, which often combines client accounts that are affiliated with the same parent organization. We track the number of our clients based on parent company grouping to provide an alternate measure of the size of our business and clients. |
|
· |
Sales Teams. We monitor our sales professionals by the number of sales teams at period end. Each team consists of approximately six to nine sales professionals. Certain larger metropolitan areas can support more than one sales team. We believe that the number of sales teams is an indicator of potential revenues for future periods. |
35
|
· |
Revenue Retention Rate. Our average annual revenue retention rate tracks the percentage of revenue that we retain from our existing clients. We monitor this metric because it is an indicator of client satisfaction and revenues for future periods. |
Components of Results of Operations
Sources of Revenues
Revenues are comprised of recurring revenues, and implementation and other revenues. We expect our revenues to increase as we introduce new applications, expand our client base and renew and expand relationships with existing clients. As a percentage of total revenues, we expect our mix of recurring revenues, and implementation and other revenues to remain relatively constant.
Recurring. Recurring revenues include fees for our talent acquisition, time and labor management, payroll, talent management and HR management applications as well as fees charged for delivery of client payroll checks and reports. These revenues are derived from (i) fixed amounts charged per billing period plus a fee per employee or transaction processed or (ii) fixed amounts charged per billing period. Because recurring revenues are based in part on fees for use of our applications and the delivery of checks and reports that are levied on a per-employee basis, our recurring revenues increase as our clients hire more employees. Recurring revenues are recognized in the period services are rendered.
Implementation and Other. Implementation and other revenues are comprised of implementation fees for the deployment of our solution and other revenue from sales of time clocks as part of our time and attendance services. Non-refundable implementation fees which are charged to new clients are generated at inception for a new client and upon the addition of certain incremental applications for existing clients. These fees range from 10% to 30% of the annualized value of the transaction. Implementation revenues are recorded as deferred revenues and recognized over the life of the client, which is estimated to be 10 years, and other revenues are recognized upon shipment of time clocks. Implementation and other revenues comprised approximately 2.1% of our total revenues for the year ended December 31, 2015.
Expenses
Cost of Revenues. Cost of revenues consists of expenses related to hosting and supporting our applications, hardware costs, systems support and technology and depreciation of certain owned computer equipment. These costs include employee-related expenses for client support personnel, bank charges for processing ACH transactions, certain implementation expenses, along with delivery charges and paper costs. They also include our cost for time clocks sold and ongoing technology and support costs related to our systems. Depreciation of owned computer equipment is allocated based upon an estimate of assets used to host and support our applications.
Administrative Expenses. Administrative expenses consist of sales and marketing, research and development, general and administrative and depreciation and amortization. Sales and marketing expenses consist primarily of employee-related expenses for our direct sales and marketing staff, commissions, bonuses, marketing expenses and other related costs. Research and development expenses consist primarily of employee-related expenses for our development staff, net of capitalized software costs for internally developed software. We expect to grow our research and development efforts as we continue to broaden our payroll and HR solution offerings and extend our technological solutions by investing in the development of new applications and introducing them to new and existing clients. General and administrative expenses include employee-related expenses for finance and accounting, legal, human resources and management information systems personnel, legal costs, professional fees and other corporate expenses. Depreciation and amortization expenses include depreciation of certain owned computer equipment allocated based upon an estimate of assets used to support the selling, general and administrative functions, as well as amortization of intangible assets. We expect our administrative expenses to increase in absolute dollars due to additional costs associated with accounting, compliance, investor relations, and other costs associated with being a public company, although our administrative expenses may fluctuate as a percentage of total revenues.
Loss on Repayment of Debt
During 2014, we wrote off $4.1 million related to the discount associated with the repayment of certain related party debt.
36
Interest expense includes interest on debt related to our corporate headquarters and related party debt.
Other Income, net
Other income, net includes interest earned on funds held for clients that is earned primarily on funds that are collected in advance of either the applicable due date for payroll tax submissions or the applicable disbursement date for employee payment services and the gain or loss on the sale of fixed assets. We typically invest funds held for clients in money market accounts and certificates of deposit until they are paid to the applicable tax or regulatory agencies or to client employees. These collections from clients are typically disbursed from one to 30 days after receipt, with some funds being held for up to 120 days. We expect that interest earned on funds held for clients in other income will increase as we increase our cash and cash equivalents and increase our funds held from clients as we introduce new applications, expand our client base and renew and expand relationships with existing clients.
Provision for Income Taxes
For the three months ended December 31, 2015, based on pre-tax income, we had income tax expense of $1.1 million as compared to $2.0 million for the three months ended December 31, 2014. The decrease in income tax expense of $0.9 million was primarily due to benefits of $0.6 million related to research and development activities and $1.2 million related to domestic production activities. The income tax benefits were partially offset by increased pre-tax income.
Results of Operations
Years ended December 31, 2015, 2014 and 2013
The following tables set forth selected consolidated statements of income data and such data as a percentage of total revenues for each of the periods indicated:
|
|
|
Year Ended December 31, |
|
|||||||||
|
|
|
2015 |
|
|
2014 |
|
|
2013 |
|
|||
|
|
|
(in thousands) |
|
|||||||||
|
Consolidated statements of income data: |
|
|
|
|
|
|
|
|
|
|
|
|
|
Revenues |
|
|
|
|
|
|
|
|
|
|
|
|
|
Recurring |
|
$ |
219,987 |
|
|
$ |
148,207 |
|
|
$ |
105,560 |
|
|
Implementation and other |
|
|
4,666 |
|
|
|
2,722 |
|
|
|
2,041 |
|
|
Total revenues |
|
|
224,653 |
|
|
|
150,929 |
|
|
|
107,601 |
|
|
Cost of revenues |
|
|
|
|
|
|
|
|
|
|
|
|
|
Operating expenses |
|
|
31,790 |
|
|
|
24,694 |
|
|
|
19,070 |
|
|
Depreciation and amortization |
|
|
3,683 |
|
|
|
2,624 |
|
|
|
1,821 |
|
|
Total cost of revenues |
|
|
35,473 |
|
|
|
27,318 |
|
|
|
20,891 |
|
|
Administrative expenses |
|
|
|
|
|
|
|
|
|
|
|
|
|
Sales and marketing |
|
|
92,554 |
|
|
|
63,547 |
|
|
|
42,681 |
|
|
Research and development |
|
|
8,627 |
|
|
|
4,325 |
|
|
|
2,146 |
|
|
General and administrative |
|
|
47,826 |
|
|
|
35,501 |
|
|
|
28,729 |
|
|
Depreciation and amortization |
|
|
5,738 |
|
|
|
4,538 |
|
|
|
3,682 |
|
|
Total administrative expenses |
|
|
154,745 |
|
|
|
107,911 |
|
|
|
77,238 |
|
|
Total operating expenses |
|
|
190,218 |
|
|
|
135,229 |
|
|
|
98,129 |
|
|
Operating income |
|
|
34,435 |
|
|
|
15,700 |
|
|
|
9,472 |
|
|
Interest expense |
|
|
(1,427 |
) |
|
|
(3,421 |
) |
|
|
(9,272 |
) |
|
Net loss on early repayment of debt |
|
|
— |
|
|
|
(4,044 |
) |
|
|
— |
|
|
Other income, net |
|
|
517 |
|
|
|
1,421 |
|
|
|
1,199 |
|
|
Income before income taxes |
|
|
33,525 |
|
|
|
9,656 |
|
|
|
1,399 |
|
|
Provision for income taxes |
|
|
12,580 |
|
|
|
3,993 |
|
|
|
792 |
|
|
Net income |
|
|
20,945 |
|
|
|
5,663 |
|
|
|
607 |
|
37
Consolidated Statements of Income Data as a Percentage of Revenues
|
|
|
Year Ended December 31, |
|
|
|||||||||
|
|
|
2015 |
|
|
2014 |
|
|
|
2013 |
|
|
||
|
Revenues |
|
|
|
|
|
|
|
|
|
|
|
|
|
|
Recurring |
|
|
97.9 |
% |
|
|
98.2 |
% |
|
|
98.1 |
% |
|
|
Implementation and other |
|
|
2.1 |
% |
|
|
1.8 |
% |
|
|
1.9 |
% |
|
|
Total revenues |
|
|
100.0 |
% |
|
|
100.0 |
% |
|
|
100.0 |
% |
|
|
Cost of revenues |
|
|
|
|
|
|
|
|
|
|
|
|
|
|
Operating expenses |
|
|
14.2 |
% |
|
|
16.4 |
% |
|
|
17.7 |
% |
|
|
Depreciation and amortization |
|
|
1.6 |
% |
|
|
1.7 |
% |
|
|
1.7 |
% |
|
|
Total cost of revenues |
|
|
15.8 |
% |
|
|
18.1 |
% |
|
|
19.4 |
% |
|
|
Administrative expenses |
|
|
|
|
|
|
|
|
|
|
|
|
|
|
Sales and marketing |
|
|
41.2 |
% |
|
|
42.1 |
% |
|
|
39.7 |
% |
|
|
Research and development |
|
|
3.8 |
% |
|
|
2.9 |
% |
|
|
2.0 |
% |
|
|
General and administrative |
|
|
21.3 |
% |
|
|
23.5 |
% |
|
|
26.7 |
% |
|
|
Depreciation and amortization |
|
|
2.6 |
% |
|
|
3.0 |
% |
|
|
3.4 |
% |
|
|
Total administrative expenses |
|
|
68.9 |
% |
|
|
71.5 |
% |
|
|
71.8 |
% |
|
|
Total operating expenses |
|
|
84.7 |
% |
|
|
89.6 |
% |
|
|
91.2 |
% |
|
|
Operating income |
|
|
15.3 |
% |
|
|
10.4 |
% |
|
|
8.8 |
% |
|
|
Interest expense |
|
|
(0.6 |
%) |
|
|
(2.3 |
%) |
|
|
(8.6 |
%) |
|
|
Loss on early repayment of debt |
|
|
0.0 |
% |
|
|
(2.7 |
%) |
|
|
0.0 |
% |
|
|
Other income, net |
|
|
0.2 |
% |
|
|
1.0 |
% |
|
|
1.1 |
% |
|
|
Income before income taxes |
|
|
14.9 |
% |
|
|
6.4 |
% |
|
|
1.3 |
% |
|
|
Provision for income taxes |
|
|
5.6 |
% |
|
|
2.6 |
% |
|
|
0.7 |
% |
|
|
Net income |
|
|
9.3 |
% |
|
|
3.8 |
% |
|
|
0.6 |
% |
|
Year ended December 31, 2015 compared to the year ended December 31, 2014 and the year ended December 31, 2014 compared to the year ended December 31, 2013
Revenues
|
|
|
Year Ended December 31, |
|
|
% Change |
|
||||||||||||||
|
|
|
2015 |
|
|
2014 |
|
|
2013 |
|
|
2015 vs 2014 |
|
|
2014 vs 2013 |
|
|||||
|
|
|
(in thousands) |
|
|
|
|
|
|
|
|
|
|||||||||
|
Recurring |
|
$ |
219,987 |
|
|
$ |
148,207 |
|
|
$ |
105,560 |
|
|
|
48% |
|
|
|
40% |
|
|
Implementation and other |
|
|
4,666 |
|
|
|
2,722 |
|
|
|
2,041 |
|
|
|
71% |
|
|
|
33% |
|
|
Total revenues |
|
$ |
224,653 |
|
|
$ |
150,929 |
|
|
$ |
107,601 |
|
|
|
49% |
|
|
|
40% |
|
Total revenues were $224.7 million for the year ended December 31, 2015, compared to $150.9 million for the year ended December 31, 2014, representing an increase of $73.8 million, or 49%. The increase in total revenues was due to several factors, including (i) the addition of clients in mature sales offices, which are offices that have been open for at least 24 months, as well as contributions from sales offices that are reaching maturity, (ii) the addition of new clients in more recently opened sales offices, (iii) the introduction and sale of additional applications to our existing clients, (iv) growth in the number of employees of our clients, (v) an increase in average revenue per client as we continued to sell our applications to larger clients, (vi) additional revenues in the first quarter attributable to the strong performance of our tax form filing business and (vii) additional revenues in the fourth quarter resulting from clients seeking to accelerate implementation of our Enhanced ACA application that we believe would have typically deferred implementation until after year-end. As a result of increased sales, implementation and other revenues, a component of total revenues, increased to $4.7 million for the year ended December 31, 2015 from $2.7 million for the year ended December 31, 2014, representing an increase of $2.0 million, or 71%.
38
Total revenues were $150.9 million for the year ended December 31, 2014, compared to $107.6 million for the year ended December 31, 2013, an increase of $43.3 million, or 40%. The increase in revenues was due to a combination of factors, including (i) the addition of clients in mature sales offices as well as contributions from offices that are reaching maturity, (ii) the addition of new clients in more recently opened sales offices, (iii) the introduction and sale of additional applications to our existing clients and (iv) growth in the number of employees of our clients. As a result of increased sales, implementation and other revenues increased to $2.7 million for the year ended December 31, 2014 from $2.0 million for the year ended December 31, 2013, representing an increase of $0.7 million, or 33%.
Expenses
Cost of Revenues
|
|
|
Year Ended December 31, |
|
|
% Change |
|
||||||||||||||
|
|
|
2015 |
|
|
2014 |
|
|
2013 |
|
|
2015 vs 2014 |
|
|
2014 vs 2013 |
|
|||||
|
|
|
(in thousands) |
|
|
|
|
|
|
|
|
|
|||||||||
|
Operating expenses |
|
$ |
31,790 |
|
|
$ |
24,694 |
|
|
$ |
19,070 |
|
|
|
29% |
|
|
|
29% |
|
|
Depreciation and amortization |
|
|
3,683 |
|
|
|
2,624 |
|
|
|
1,821 |
|
|
|
40% |
|
|
|
44% |
|
|
Total cost of revenues |
|
$ |
35,473 |
|
|
$ |
27,318 |
|
|
$ |
20,891 |
|
|
|
30% |
|
|
|
31% |
|
Cost of revenues was $35.5 million for the year ended December 31, 2015, compared to $27.3 million for the year ended December 31, 2014, representing an increase of $8.2 million, or 30%. The increase in cost of revenues was primarily due to a $5.4 million increase in employee costs related to additional operating personnel, a $0.7 million increase in shipping fees and a $0.3 million increase in ACH expenses, all of which were related to increased sales. In addition, depreciation and amortization expense increased $1.1 million, or 40%, primarily due to technology developed and other additional assets purchased.
Cost of revenues was $27.3 million for the year ended December 31, 2014, compared to $20.9 million for the year ended December 31, 2013, representing an increase of $6.4 million, or 31%. The increase in cost of revenues was primarily due to a $3.8 million increase in employee costs related to additional operating personnel and a $1.0 million increase in shipping fees and paper costs related to increased client count. Depreciation and amortization expense increased $0.8 million, primarily due to additional assets purchased.
Administrative Expenses
|
|
|
Year Ended December 31, |
|
|
% Change |
|
||||||||||||||
|
|
|
2015 |
|
|
2014 |
|
|
2013 |
|
|
2015 vs 2014 |
|
|
2014 vs 2013 |
|
|||||
|
|
|
(in thousands) |
|
|
|
|
|
|
|
|
|
|||||||||
|
Sales and marketing |
|
$ |
92,554 |
|
|
$ |
63,547 |
|
|
$ |
42,681 |
|
|
|
46% |
|
|
|
49% |
|
|
Research and development |
|
|
8,627 |
|
|
|
4,325 |
|
|
|
2,146 |
|
|
|
99% |
|
|
|
102% |
|
|
General and administrative |
|
|
47,826 |
|
|
|
35,501 |
|
|
|
28,729 |
|
|
|
35% |
|
|
|
24% |
|
|
Depreciation and amortization |
|
|
5,738 |
|
|
|
4,538 |
|
|
|
3,682 |
|
|
|
26% |
|
|
|
23% |
|
|
Total administrative costs |
|
$ |
154,745 |
|
|
$ |
107,911 |
|
|
$ |
77,238 |
|
|
|
43% |
|
|
|
40% |
|
Total administrative expenses were $154.7 million for the year ended December 31, 2015, compared to $107.9 million for the year ended December 31, 2014, representing an increase of $46.8 million, or 43%. Sales and marketing expenses increased $29.0 million primarily due to a $14.9 million increase in commission and bonuses and a $9.9 million increase in employee-related expenses, in each case resulting from increased sales, and a $0.8 million increase in recruiting and training expenses related to an increase in the number of sales personnel. Research and development expenses increased by $4.3 million primarily due to an increase in the number of research and development personnel. We anticipate a gradual increase in research and development expense over time as we continue to increase the number of research and development personnel. General and administrative expenses increased by $12.3 million primarily due to a $6.8 million increase in employee-related expenses, a $1.8 million increase in accounting, compliance, legal and insurance expense, an increase of $0.6 million in employee travel expenses and an increase of $0.5 million in telecommunications expenses related to expansion of our company headquarters. Depreciation and amortization increased by $1.2 million primarily due to assets purchased and additional technology developed.
39
Total administrative expenses were $107.9 million for the year ended December 31, 2014, compared to $77.2 million for the year ended December 31, 2013, representing an increase of $30.7 million, or 40%. Sales and marketing expenses increased $20.9 million primarily due to a $9.4 million increase in employee-related expenses, resulting from a 31% increase in the number of personnel, a $6.7 million increase in commission and bonuses, resulting from increased sales, a $1.7 million increase in rent and building expenses due to the opening of five new offices as well as an increase in the number of personnel at existing offices, a $0.8 million increase in sales travel expense due to the increase in personnel and a $0.8 million increase in marketing expense primarily due to increased print advertising. Research and development expenses increased by $2.2 million primarily due to a 60% increase in the number of research and development personnel, along with related bonus expense. General and administrative expenses increased by $6.8 million primarily due to a $4.5 million increase in employee-related expenses, resulting from a 16% increase in the number of personnel, and $2.0 million of expenses related to the initial public offering. Depreciation and amortization increased by $0.9 million primarily due to the completion of our second building at our corporate headquarters in Oklahoma City in June 2014 and purchases of additional assets.
Expenditures for software developed or obtained for internal use are capitalized and amortized over a three-year period on a straight-line basis. The table below sets forth the amounts of capitalized and expensed research and development expenses for the years ended December 31, 2015, 2014 and 2013.
|
|
|
Year Ended December 31, |
|
|
% Change |
|
||||||||||||||
|
|
|
2015 |
|
|
2014 |
|
|
2013 |
|
|
2015 vs 2014 |
|
|
2014 vs 2013 |
|
|||||
|
|
|
(in thousands) |
|
|
|
|
|
|
|
|
|
|||||||||
|
Capitalized portion of research and development |
|
$ |
4,317 |
|
|
$ |
2,204 |
|
|
$ |
1,238 |
|
|
|
96% |
|
|
|
78% |
|
|
Expensed portion of research and development |
|
|
8,627 |
|
|
|
4,325 |
|
|
|
2,146 |
|
|
|
99% |
|
|
|
102% |
|
|
Total research and development |
|
$ |
12,944 |
|
|
$ |
6,529 |
|
|
$ |
3,384 |
|
|
|
98% |
|
|
|
93% |
|
Quarterly Results of Operations
The following table sets forth selected unaudited quarterly consolidated statements of income data for each of the 12 quarters within the three-year period ended December 31, 2015. The information for each of these quarters has been prepared on the same basis as the audited annual consolidated financial statements included elsewhere in this Annual Report on Form 10-K and, in the opinion of management, includes all adjustments, which includes only normal recurring adjustments, necessary for the fair presentation of the results of operations for these periods in accordance with U.S. GAAP. This data should be read in conjunction with our audited consolidated financial statements and related notes included elsewhere in this Annual Report on Form 10-K. These quarterly operating results are not necessarily indicative of our operating results for a full year or any future period (in thousands).
|
|
|
Three Months Ended |
|
|||||||||||||||||||||||||||||||||||||||||||||
|
|
|
Dec 31, 2015 |
|
|
Sep 30, 2015 |
|
|
Jun 30, 2015 |
|
|
Mar 31, 2015 |
|
|
Dec 31, 2014 |
|
|
Sep 30, 2014 |
|
|
Jun 30, 2014 |
|
|
Mar 31, 2014 |
|
|
Dec 31, 2013 |
|
|
Sep 30, 2013 |
|
|
Jun 30, 2013 |
|
|
Mar 31, 2013 |
|
||||||||||||
|
|
|
|
|
|
|
|
|
|
|
|
|
|
|
|
|
|
|
|
|
|
|
|
|
|
|
|
|
|
|
|
|
|
|
|
|
|
|
|
|
|
|
|
|
|
|
|
|
|
|
Revenues |
|
|
|
|
|
|
|
|
|
|
|
|
|
|
|
|
|
|
|
|
|
|
|
|
|
|
|
|
|
|
|
|
|
|
|
|
|
|
|
|
|
|
|
|
|
|
|
|
|
Recurring |
|
$ |
63,583 |
|
|
$ |
54,233 |
|
|
$ |
47,820 |
|
|
$ |
54,351 |
|
|
$ |
43,177 |
|
|
$ |
35,910 |
|
|
$ |
32,666 |
|
|
$ |
36,454 |
|
|
$ |
29,752 |
|
|
$ |
25,210 |
|
|
$ |
23,394 |
|
|
$ |
27,204 |
|
|
Implementation and other |
|
|
1,535 |
|
|
|
1,107 |
|
|
|
1,153 |
|
|
|
871 |
|
|
|
863 |
|
|
|
688 |
|
|
|
640 |
|
|
|
531 |
|
|
|
528 |
|
|
|
620 |
|
|
|
520 |
|
|
|
373 |
|
|
Total revenues |
|
|
65,118 |
|
|
|
55,340 |
|
|
|
48,973 |
|
|
|
55,222 |
|
|
|
44,040 |
|
|
|
36,598 |
|
|
|
33,306 |
|
|
|
36,985 |
|
|
|
30,280 |
|
|
|
25,830 |
|
|
|
23,914 |
|
|
|
27,577 |
|
|
Cost of revenues |
|
|
|
|
|
|
|
|
|
|
|
|
|
|
|
|
|
|
|
|
|
|
|
|
|
|
|
|
|
|
|
|
|
|
|
|
|
|
|
|
|
|
|
|
|
|
|
|
|
Operating expenses |
|
|
9,221 |
|
|
|
7,964 |
|
|
|
7,134 |
|
|
|
7,471 |
|
|
|
6,847 |
|
|
|
5,798 |
|
|
|
5,757 |
|
|
|
6,292 |
|
|
|
5,437 |
|
|
|
4,846 |
|
|
|
4,353 |
|
|
|
4,434 |
|
|
Depreciation and amortization |
|
|
1,041 |
|
|
|
945 |
|
|
|
887 |
|
|
|
810 |
|
|
|
748 |
|
|
|
638 |
|
|
|
608 |
|
|
|
630 |
|
|
|
501 |
|
|
|
494 |
|
|
|
415 |
|
|
|
411 |
|
|
Total cost of revenues |
|
|
10,262 |
|
|
|
8,909 |
|
|
|
8,021 |
|
|
|
8,281 |
|
|
|
7,595 |
|
|
|
6,436 |
|
|
|
6,365 |
|
|
|
6,922 |
|
|
|
5,938 |
|
|
|
5,340 |
|
|
|
4,768 |
|
|
|
4,845 |
|
|
Administrative expenses |
|
|
|
|
|
|
|
|
|
|
|
|
|
|
|
|
|
|
|
|
|
|
|
|
|
|
|
|
|
|
|
|
|
|
|
|
|
|
|
|
|
|
|
|
|
|
|
|
|
Sales and marketing |
|
|
30,810 |
|
|
|
23,774 |
|
|
|
16,741 |
|
|
|
21,229 |
|
|
|
19,310 |
|
|
|
14,856 |
|
|
|
13,700 |
|
|
|
15,681 |
|
|
|
13,768 |
|
|
|
10,339 |
|
|
|
8,716 |
|
|
|
9,858 |
|
|
Research and development |
|
|
2,504 |
|
|
|
2,349 |
|
|
|
1,907 |
|
|
|
1,867 |
|
|
|
1,447 |
|
|
|
1,059 |
|
|
|
937 |
|
|
|
882 |
|
|
|
829 |
|
|
|
538 |
|
|
|
324 |
|
|
|
455 |
|
|
General and administrative |
|
|
13,750 |
|
|
|
11,996 |
|
|
|
10,096 |
|
|
|
11,984 |
|
|
|
9,685 |
|
|
|
8,410 |
|
|
|
8,138 |
|
|
|
9,268 |
|
|
|
9,878 |
|
|
|
6,815 |
|
|
|
6,040 |
|
|
|
5,996 |
|
|
Depreciation and amortization |
|
|
1,558 |
|
|
|
1,457 |
|
|
|
1,400 |
|
|
|
1,323 |
|
|
|
1,216 |
|
|
|
1,159 |
|
|
|
1,072 |
|
|
|
1,091 |
|
|
|
966 |
|
|
|
959 |
|
|
|
873 |
|
|
|
884 |
|
|
Total administrative expenses |
|
|
48,622 |
|
|
|
39,576 |
|
|
|
30,144 |
|
|
|
36,403 |
|
|
|
31,658 |
|
|
|
25,484 |
|
|
|
23,847 |
|
|
|
26,922 |
|
|
|
25,441 |
|
|
|
18,651 |
|
|
|
15,953 |
|
|
|
17,193 |
|
|
Total operating expenses |
|
|
58,884 |
|
|
|
48,485 |
|
|
|
38,165 |
|
|
|
44,684 |
|
|
|
39,253 |
|
|
|
31,920 |
|
|
|
30,212 |
|
|
|
33,844 |
|
|
|
31,379 |
|
|
|
23,991 |
|
|
|
20,721 |
|
|
|
22,038 |
|
|
Operating income (loss) |
|
|
6,234 |
|
|
|
6,855 |
|
|
|
10,808 |
|
|
|
10,538 |
|
|
|
4,787 |
|
|
|
4,678 |
|
|
|
3,094 |
|
|
|
3,141 |
|
|
|
(1,099 |
) |
|
|
1,839 |
|
|
|
3,193 |
|
|
|
5,539 |
|
|
Interest expense |
|
|
(360 |
) |
|
|
(343 |
) |
|
|
(392 |
) |
|
|
(332 |
) |
|
|
(342 |
) |
|
|
(338 |
) |
|
|
(674 |
) |
|
|
(2,067 |
) |
|
|
(2,343 |
) |
|
|
(2,329 |
) |
|
|
(2,326 |
) |
|
|
(2,274 |
) |
|
Net loss on early repayment of debt |
|
|
— |
|
|
|
— |
|
|
|
— |
|
|
|
— |
|
|
|
— |
|
|
|
— |
|
|
|
(4,044 |
) |
|
|
— |
|
|
|
— |
|
|
|
— |
|
|
|
— |
|
|
|
— |
|
|
Other income (expense), net |
|
|
367 |
|
|
|
98 |
|
|
|
19 |
|
|
|
33 |
|
|
|
26 |
|
|
|
39 |
|
|
|
587 |
|
|
|
769 |
|
|
|
1,059 |
|
|
|
(133 |
) |
|
|
(338 |
) |
|
|
611 |
|
|
Income (loss) before income taxes |
|
|
6,241 |
|
|
|
6,610 |
|
|
|
10,435 |
|
|
|
10,239 |
|
|
|
4,471 |
|
|
|
4,379 |
|
|
|
(1,037 |
) |
|
|
1,843 |
|
|
|
(2,383 |
) |
|
|
(623 |
) |
|
|
529 |
|
|
|
3,876 |
|
|
Provision (benefit) for income taxes |
|
|
1,084 |
|
|
|
2,763 |
|
|
|
4,489 |
|
|
|
4,244 |
|
|
|
1,965 |
|
|
|
1,689 |
|
|
|
(444 |
) |
|
|
783 |
|
|
|
(419 |
) |
|
|
(199 |
) |
|
|
169 |
|
|
|
1,241 |
|
|
Net income (loss) |
|
$ |
5,157 |
|
|
$ |
3,847 |
|
|
$ |
5,946 |
|
|
$ |
5,995 |
|
|
$ |
2,506 |
|
|
$ |
2,690 |
|
|
$ |
(593 |
) |
|
$ |
1,060 |
|
|
$ |
(1,964 |
) |
|
$ |
(424 |
) |
|
$ |
360 |
|
|
$ |
2,635 |
|
40
Excluding changes in quarterly revenues due to seasonal factors, our quarterly revenues generally increased sequentially for the periods presented due to a combination of factors, including the addition of clients in mature sales offices (those offices that have been open for at least 24 months), the addition of new clients in more recently opened sales offices, the introduction and sale of additional applications to our existing clients and the growth in the number of employees of our clients. We anticipate that, commencing in 2016, first quarter revenues will also exhibit a stronger seasonal pattern as a result of the enactment of the ACA, which requires clients to file Forms 1094 and 1095 in the first quarter.
There are also seasonal factors that affect our revenues. Recurring revenues include revenues relating to the annual processing of payroll forms such as Form W-2 and Form 1099, or payroll form revenues. Because these forms are typically processed in the first quarter of the year, first quarter revenue and margins are generally higher than subsequent quarters.
Quarterly Expenses Trends
Selling, general and administrative expenses are generally higher in the fourth and first quarters as sales representatives achieve sales goals throughout the year, resulting in higher commission rates. These sales goals reset annually on February 1.
Liquidity and Capital Resources
Our principal sources of liquidity are cash and cash equivalents which totaled $50.7 million and $25.1 million as of December 31, 2015 and 2014, respectively. Our cash and cash equivalents are comprised primarily of deposit accounts and money market funds. We believe our existing cash and cash equivalents will be sufficient to meet our working capital and capital expenditure needs over at least the next 12 months.
We have historically financed our operations from cash flows generated from operations, cash from the sale of debt and equity securities and borrowings under our consolidated loans. Since inception, we have raised $125.1 million of equity capital, $64.3 million of which was the net proceeds raised in our initial public offering that closed in April 2014. We incurred related party debt as part of corporate reorganizations that occurred in April 2012 and January 2014. Such debt has since been repaid. We have also incurred indebtedness to finance the expansion of our corporate headquarters in Oklahoma City. The first expansion of our corporate headquarters was completed in June 2014 and we are currently constructing an approximately $13.6 million new corporate building adjacent to our corporate headquarters, which we expect to be completed by mid- to late-2016. In connection with the expansion currently in progress, we entered into a loan agreement with Kirkpatrick Bank on May 13, 2015 (the “Construction Loan”). We are also negotiating a local incentive package with the Oklahoma City Economic Development Trust worth up to approximately $1.2 million, depending on the number of new jobs we create for local employees over the next two years and the average annual salary level for such local employees.
2021 Consolidated Loan. As of December 31, 2015, we had a term note under the 2021 Consolidated Loan with an outstanding principal amount of $25.9 million due to Kirkpatrick Bank that matures on May 30, 2021. Under the 2021 Consolidated Loan, interest is payable monthly and accrues at a fixed rate of 4.75% per annum. The 2021 Consolidated Loan is secured by a mortgage covering our headquarters and certain personal property relating to our headquarters.
We are required to comply with certain financial and non-financial covenants under the 2021 Consolidated Loan, including maintaining a fixed charge coverage ratio of EBITDA to fixed charges (defined as current maturities of long-term debt, interest expense, rent expense and distributions) greater than 1.2 to 1.0, which is measured on a quarterly basis. As of December 31, 2015, we were in compliance with all of the covenants under the 2021 Consolidated Loan.
Pursuant to the terms of the 2021 Consolidated Loan, until amounts under the 2021 Consolidated Loan are repaid, we may not, subject to certain exceptions, (i) create any mortgages or liens, (ii) make any loans, advances or extensions of credit with any affiliate or enter into any other transaction with any affiliate, (iii) lease any mortgaged property, (iv) make any distributions as long as an event of default exists, (v) make any material change in methods of accounting, (vi) enter into any sale and leaseback arrangement, (vii) amend, modify, restate, cancel or terminate our organizational documents, (viii) sell, transfer or convey any mortgaged property or (ix) incur funded outside debt.
An event of default under the 2021 Consolidated Loan includes, among other events, (i) failure to pay principal or interest when due, (ii) breaches of certain covenants, (iii) any failure to meet the required financial covenants and (iv) an institution of a bankruptcy, reorganization, liquidation or receivership.
41
Construction Loan. On May 13, 2015, we entered into the Construction Loan with Kirkpatrick Bank to finance the expansion of our headquarters. The Construction Loan allows for the borrowing of a maximum aggregate principal amount equal to the lesser of (i) $11.0 million or (ii) 80% of the appraised value of the constructed property. We did not have any outstanding borrowings under the Construction Loan as of December 31, 2015. To the extent we borrow under the Construction Loan, until such amounts are repaid, we will be subject to certain covenants similar to those described above with respect to the 2021 Consolidated Loan. The Construction Loan matures on the earlier of the completion of construction or November 13, 2016, with variable interest accruing at the greater of (i) the prime rate, plus 50 basis points or (ii) 4.0%.
At maturity, the outstanding principal balance of the Construction Loan, if any, will be automatically converted into a 78-month term loan. The term loan will accrue fixed interest at the prevailing 7/20 London Interbank Offered Rate swap interest rate that is in effect as of the commencement date, plus 225 basis points.
Cash Flow Analysis
Our cash flows from operating activities have historically been significantly impacted by profitability, implementation revenue received but deferred, research and development, and our investment in sales and marketing to drive growth. Our ability to meet future liquidity needs will be driven by our operating performance and the extent of continued investment in our operations. Failure to generate sufficient revenue and related cash flows or to raise additional capital could have a material adverse effect on our ability to meet our liquidity needs and achieve our business objectives.
As part of our payroll and payroll tax filing services, we collect funds from our clients for federal, state and local employment taxes, which we remit to the appropriate tax agencies. We invest these funds in short-term certificates of deposit and money market funds from which we earn interest income during the period between their receipt and disbursement.
As our business grows, we expect our capital expenditures and our investment activity to continue to increase. Depending on certain growth opportunities, we may choose to accelerate investments in sales and marketing, acquisitions, technology and services. Actual future capital requirements will depend on many factors, including our future revenues, cash from operating activities and the level of expenditures in all areas of our business.
Year ended December 31, 2015 compared to the year ended December 31, 2014 and the year ended December 31, 2014 compared to the year ended December 31, 2013
The following table summarizes the consolidated statements of cash flows for the years ended December 31, 2015, 2014 and 2013:
|
|
|
Year Ended December 31, |
|
|
% Change |
|
||||||||||||||
|
|
|
2015 |
|
|
2014 |
|
|
2013 |
|
|
2015 vs 2014 |
|
|
2014 vs 2013 |
|
|||||
|
Net cash provided by (used in): |
|
(in thousands) |
|
|
|
|
|
|
|
|
|
|||||||||
|
Operating activities |
|
$ |
42,972 |
|
|
$ |
22,337 |
|
|
$ |
16,984 |
|
|
|
92 |
% |
|
|
32 |
% |
|
Investing activities |
|
|
(52,324 |
) |
|
|
(219,050 |
) |
|
|
(148,432 |
) |
|
|
(76 |
%) |
|
|
(48 |
%) |
|
Financing activities |
|
|
34,922 |
|
|
|
208,495 |
|
|
|
131,375 |
|
|
|
(83 |
%) |
|
|
59 |
% |
|
Change in cash and cash equivalents |
|
$ |
25,570 |
|
|
$ |
11,782 |
|
|
$ |
(73 |
) |
|
|
117 |
% |
|
|
16,240 |
% |
Operating Activities
For the year ended December 31, 2015, net cash provided by operating activities was $43.0 million. The net cash provided by operating activities resulted primarily from net income of $20.9 million, an increase in deferred revenue of $9.7 million, an adjustment for depreciation and amortization of $9.4 million, an increase in accrued expenses and other current liabilities of $4.0 million, an increase in accrued commissions and bonuses of $3.6 million and stock-based compensation expense of $3.0 million, partially offset by an increase in income taxes, net of $5.8 million, an increase in prepaid expenses of $1.6 million and a decrease in deferred income taxes, net of $1.0 million.
For the year ended December 31, 2014, net cash provided by operating activities was $22.3 million. The net cash provided by operating activities resulted primarily from net income of $5.7 million, an adjustment for depreciation and amortization of $7.2 million, an increase in deferred revenue of $6.8 million related to increased implementation fees, and the write off of the debt discount costs of $4.1 million.
42
For the year ended December 31, 2013, net cash provided by operating activities was $17.0 million. The net cash provided by operating activities resulted primarily from net income of $0.6 million, an adjustment for depreciation and amortization of $5.5 million, an increase in deferred revenue of $4.2 million related to increased implementation fees, an increase in accounts payable of $2.7 million and an increase in accrued expenses and other current liabilities of $2.4 million.
Investing Activities
For the year ended December 31, 2015, net cash used in investing activities was $52.3 million. The net cash used in investing activities resulted primarily from a $36.1 million increase in funds held for clients related to collection of client taxes and $16.5 million of capital expenditures related to investments in property and equipment, offset by a decrease of $0.4 million in restricted cash.
For the year ended December 31, 2014, net cash used in investing activities was $219.1 million. The net cash used in investing activities resulted primarily from a $204.8 million increase in funds held for clients related to collection of client taxes and $14.3 million of capital expenditures related to investments in real property, software and development and facilities and equipment.
For the year ended December 31, 2013, net cash used in investing activities was $148.4 million. The net cash used in investing activities resulted primarily from an increase of $131.5 million in funds held for clients related to collection of client taxes and $17.2 million of capital expenditures related to investments in real property, software and development and facilities and equipment.
Financing Activities
For the year ended December 31, 2015, net cash provided by financing activities was $34.9 million. The net cash provided by financing activities primarily resulted from an increase of $36.1 million in client funds obligation related to collection of client taxes, offset by $1.1 million of principal payments on long-term debt and $0.1 million of payment for debt issuance costs.
For the year ended December 31, 2014, net cash provided by financing activities was $208.5 million. The net cash provided by financing activities resulted primarily from an increase in client funds obligation of $204.8 million related to collection of client taxes, gross proceeds from our initial public offering of $62.8 million and proceeds from the issuance of long-term debt of $6.5 million, which were partially offset by payments on long-term debt of $65.7 million.
For the year ended December 31, 2013, net cash provided by financing activities was $131.4 million. The net cash provided by financing activities primarily resulted from an increase of $131.5 million in client funds obligation related to collection of client taxes and $7.0 million in proceeds from the issuance of long-term debt, which were partially offset by $5.4 million in distributions paid to stockholders.
Contractual Obligations
Our principal commitments primarily consist of long-term debt and leases for office space. We disclose our long-term debt in Note 5 and our commitments and contingencies in Note 11 to our audited consolidated financial statements included elsewhere in this Annual Report on Form 10-K.
As of December 31, 2015, the future non-cancelable minimum payments under these commitments were as follows (in thousands):
|
|
|
|
|
|
|
Payments Due by Period |
|
|||||||||||||
|
|
|
|
|
|
|
|
|
|
|
|
|
|
|
|
|
|
|
|
|
|
|
|
|
|
|
|
|
Less |
|
|
|
|
|
|
|
|
|
|
More |
|
||
|
|
|
|
|
|
|
than |
|
|
1-3 |
|
|
3-5 |
|
|
than |
|
||||
|
|
|
Total |
|
|
1 Year |
|
|
Years |
|
|
Years |
|
|
5 Years |
|
|||||
|
|
|
|
|
|
|
|
|
|
|
|
|
|
|
|
|
|
|
|
|
|
|
Long-term debt obligations: |
|
|
|
|
|
|
|
|
|
|
|
|
|
|
|
|
|
|
|
|
|
2021 Consolidated Loan |
|
$ |
25,860 |
|
|
$ |
886 |
|
|
$ |
1,912 |
|
|
$ |
2,102 |
|
|
$ |
20,960 |
|
|
Interest on 2021 Consolidated Loan |
|
|
6,175 |
|
|
|
1,230 |
|
|
|
2,320 |
|
|
|
2,130 |
|
|
|
495 |
|
|
|
|
|
|
|
|
|
|
|
|
|
|
|
|
|
|
|
|
|
|
|
|
Operating lease obligations: |
|
|
|
|
|
|
|
|
|
|
|
|
|
|
|
|
|
|
|
|
|
Facilities space |
|
|
20,313 |
|
|
|
5,278 |
|
|
|
9,630 |
|
|
|
5,131 |
|
|
|
274 |
|
|
Total |
|
$ |
52,348 |
|
|
$ |
7,394 |
|
|
$ |
13,862 |
|
|
$ |
9,363 |
|
|
$ |
21,729 |
|
43
We may continue to lease additional office space to support our growth. In addition, many of our existing lease agreements provide us with the option to renew. Our future operating lease obligations include payments due during any renewal period provided for in the lease where the lease imposes a penalty for failure to renew.
The contractual commitment amounts in the table above are associated with agreements that are enforceable and legally binding and that specify all significant terms, including fixed or minimum services to be used, fixed minimum or variable price provisions, and the approximate timing of the transaction. Obligations under contracts that we can cancel without a significant penalty are not included in the table above.
Off-Balance Sheet Arrangements
As of December 31, 2015, we did not have any off-balance sheet arrangements.
Critical Accounting Policies and Estimates
Our consolidated financial statements and accompanying notes have been prepared in accordance with U.S. GAAP. The preparation of these consolidated financial statements requires us to make estimates, judgments and assumptions that affect the reported amounts of assets, liabilities, revenues, costs and expenses, and related disclosures. On an ongoing basis, we continually evaluate our estimates and assumptions believed to be reasonable under current facts and circumstances. Actual amounts and results may materially differ from these estimates made by management under different assumptions and conditions.
Certain accounting policies that require significant management estimates, and are deemed critical to our results of operations or financial position, are described below. Accordingly, these are the policies we believe are the most critical to aid in fully understanding and evaluating our consolidated financial condition and results of operations.
Adoption of New Pronouncement
We elected to early adopt on a retrospective basis the recently issued guidance by the FASB Accounting Standards Update No. 2015-17, “Income Taxes (Topic 740): Balance Sheet Classification of Deferred Taxes” (“ASU 2015-17”). ASU 2015-17 requires companies to classify all deferred tax assets and liabilities as noncurrent on the balance sheet instead of separating deferred taxes into current and noncurrent amounts. Adoption resulted in a reclassification which decreased current deferred income tax assets by $1.4 million and decreased noncurrent deferred income tax liabilities, net by $1.4 million on our consolidated balance sheets as of December 31, 2014. Adoption had no impact on our stockholders’ equity or the results of our operations.
Revenue Recognition
Our total revenues are comprised of recurring revenues, and implementation and other revenues. We recognize revenue in accordance with accounting standards for software and service companies when all of the following criteria have been met:
|
|
· |
There is persuasive evidence of an arrangement; |
|
|
· |
The service has been or is being provided to the customer; |
|
|
· |
Collection of the fees is reasonably assured; and |
|
|
· |
The amount of fees to be paid by the customer is fixed or determinable. |
Recurring revenues are derived primarily from our talent acquisition, time and labor management, payroll, talent management and HR management applications. These services are rendered during each client’s payroll period with the agreed-upon fee being charged and collected as part of the client’s payroll. Revenues are recognized at time of billing of each client’s payroll period. Collectability is reasonably assured as the fees are collected through ACH as part of the client’s payroll cycle or through direct wire transfer, which minimizes the default risk. Our implementation and other revenues represent non- refundable conversion fees which are charged to new clients to offset the expense of new client set-up and revenues from sale of time clocks as part of our employee time and attendance services. Because these conversion fees and sale of time clocks relate to our recurring revenues, we have evaluated such arrangements under the accounting guidance that governs multiple element arrangements.
For arrangements with multiple elements, we evaluate whether each element represents a separate unit of accounting. In order to treat deliverables in a multiple element arrangement as separate units of accounting, the deliverables must have standalone value upon
44
delivery. If the deliverables have standalone value upon delivery, we account for each deliverable separately and revenue is recognized for the respective deliverables as they are delivered. If one or more of the deliverables does not have standalone value upon delivery, the deliverables that do not have standalone value are generally combined with the final deliverable within the arrangement and treated as a single unit of accounting.
For the years ended December 31, 2015, 2014 and 2013, we determined that there was no standalone value associated with the upfront conversion fees as they did not have value to our clients on a standalone basis nor were they offered as an individual service; therefore, the conversion fees were deferred and are recognized ratably over the estimated life of our clients, based on our historical client attrition rate, which we estimate to be ten years. Revenues from the sale of time clocks are recognized when they are delivered.
Goodwill and Other Intangible Assets
Goodwill is not amortized, but we are required to test the carrying value of goodwill for impairment at least annually, or earlier if, at the reporting unit level, an indicator of impairment arises. The estimates and assumptions about future results of operations and cash flows made in connection with the impairment testing could differ from future actual results of operations and cash flows. If impairment exists, a write-down to fair value is recorded. Our business is largely homogeneous and, as a result, goodwill is associated with one reporting unit. We have selected June 30 as our annual goodwill impairment testing date and determined there was no impairment as of June 30, 2015. For the years ended December 31, 2015, 2014 and 2013, there were no indicators of impairment. Intangible assets with finite lives are amortized on a straight-line basis over their estimated useful lives.
Impairment of Long-Lived Assets
Long-lived assets, including intangible assets with finite lives, are reviewed for impairment when events or changes in circumstances indicate that the carrying amount of an asset may not be recoverable. Recoverability of assets to be held and used is measured by a comparison of the carrying amount of an asset to estimated undiscounted future cash flows expected to be generated by the asset. If the carrying amount of an asset exceeds its estimated future cash flows, an impairment charge is recognized for the amount by which the carrying amount of the asset exceeds the estimated fair value of the asset. We have determined that there is no impairment of long-lived assets for the years ended December 31, 2015, 2014 and 2013.
Restricted Stock and Incentive Units
Given the absence of a public trading market for our common stock and incentive units prior to our initial public offering, and in accordance with the American Institute of Certified Public Accountants (the “AICPA”), Audit and Accounting Practice Aid Series: Valuation of Privately Held Company Equity Securities Issued as Compensation (the “AICPA Practice Guide”), our board of directors exercised reasonable judgment and considered numerous factors to determine the best estimate of the fair value of our restricted stock and incentive units, including:
|
|
· |
Valuation analyses performed by an unrelated third party specialist (including the application of appropriate valuation techniques and inputs); |
|
|
· |
Characteristics and specific terms of the shares as noted in the equity grant agreements; |
|
|
· |
Value of the shares as determined by the absence of a liquidation value on the date of grant, the ability to participate in our future profits, growth and appreciation and the lack of an exercise price for the shares; |
|
|
· |
Lack of marketability of our common stock; |
|
|
· |
Our actual operating and financial performance; |
|
|
· |
Our state of development; |
|
|
· |
Revenue and expense projection; |
|
|
· |
Likelihood of achieving a liquidating event; |
|
|
· |
Market performance of comparable publicly traded companies; and |
|
|
· |
Overall U.S. and global economic and capital market conditions. |
45
Our simulation model requires various subjective assumptions as inputs, including expected life, volatility, risk-free interest rates, and the expected dividend yield. The assumptions used in the simulation model represent our best estimates, which involve inherent uncertainties and the application of our judgment as follows:
|
|
· |
Risk-free interest rate — We base the risk-free interest rate used in the Monte Carlo simulation model on the implied yield available on 5 year U.S. Treasury securities for shares issued prior to 2015 and for the shares issued in 2015 an implied yield available on 10 year U.S. Treasury Securities with a remaining term equivalent to that of the restricted stock or incentive units as of the valuation date. |
|
|
· |
Volatility — We determine the volatility factor based on the historical volatilities of comparable guideline companies. To determine the comparable guideline companies, we consider cloud-based application providers and select those that are similar to us in nature of services provided. We intend to continue to consistently apply this process using the same or similar public companies until information regarding the volatility of our own pricing changes, or unless circumstances change such that the identified companies are no longer similar to us, in which case, more suitable companies whose share prices are publicly available would be utilized in the calculation. |
|
|
· |
Expected life —The expected life represents the period that our restricted stock or incentive units are expected to be outstanding. We determined the expected life assumption based on the vesting terms and contractual terms of the restricted stock. |
|
|
· |
Expected dividend yield —We have not paid and do not expect to pay dividends in the future and therefore an expected dividend yield of 0% was applied. Our directors will determine if and when dividends will be declared and paid in the future based on our financial position at the relevant time. |
The following tables present a summary of the grant-date fair values and related assumptions with respect to shares of restricted stock granted under the Paycom Software, Inc. 2014 Long-Term Incentive Plan (the “LTIP”) during the years ended December 31, 2015 (“2015 Restricted Stock”) and 2014 (“2014 Restricted Stock”). The grant-date fair values were determined based on the Monte Carlo Simulation model. As discussed below, the 2014 Restricted Stock was issued upon conversion of incentive units in connection with the 2014 Reorganization. We did not issue any shares of restricted stock during the year ended December 31, 2013.
|
|
|
Year Ended December 31, 2015 |
|
|
|
Grant-date fair value of 2015 Restricted Stock |
|
$21.76 - $33.33 |
|
|
|
Risk-free interest rate |
|
|
2.20% |
|
|
Volatility factor |
|
|
26.0% |
|
|
Expected life (in years) |
|
3.6 |
|
|
|
|
|
Year Ended December 31, 2014 |
|
|
|
Grant-date fair value of 2014 Restricted Stock |
|
$5.76 - $36.03 |
|
|
|
Risk-free interest rate |
|
|
1.02% |
|
|
Volatility factor |
|
|
30.0% |
|
|
Expected life (in years) |
|
3.5 |
|
|
The following table presents a summary of the grant-date fair values and related assumptions with respect to management incentive units (“Management Incentive Units”) granted during the year ended December 31, 2013. The grant-date fair values were determined based on the Monte Carlo simulation model:
|
|
|
Year Ended December 31, 2013 |
|
|
|
Grant-date fair value |
|
|
|
|
|
Management Incentive Units |
|
$4.67 - $37.39 |
|
|
|
Risk-free interest rate |
|
0.71% - 1.41% |
|
|
|
Volatility factor |
|
|
50.0% |
|
|
Expected life (in years) |
|
5.0 |
|
|
In addition to assumptions used in the simulation model, we are required to estimate forfeitures and only record compensation costs for those awards that are expected to vest. Our forfeiture estimate is based on an analysis of our actual forfeitures. We will continue to evaluate the appropriateness of the forfeiture rate based on actual forfeiture experience, analysis of employee turnover, and other factors.
46
The following table presents information about the 2015 Restricted Stock:
|
|
|
Number of |
|
|
|
|
|
|
|
|
|
shares of restricted |
|
|
Fair value |
|
||
|
|
|
stock granted |
|
|
per share (1) |
|
||
|
Grant Date |
|
|
|
|
|
|
|
|
|
July 8, 2015 |
|
|
741,931 |
|
|
$ |
27.65 |
|
|
|
(1) |
Represents the weighted average fair value per share, incorporating both time-based and market-based vesting conditions. |
We granted the following Management Incentive Units during 2013:
|
|
|
|
|
|
|
|
|
|
|
|
|
|
|
|
|
|
|
|
|
|
|
Number of incentive units granted |
|
|
Fair value per unit (1)(2) |
|
||
|
Grant Date |
|
|
|
|
|
|
|
|
|
January 7, 2013 |
|
|
610 |
|
|
$ |
7.92 |
|
|
January 17, 2013 |
|
|
3,000 |
|
|
$ |
8.08 |
|
|
March 28, 2013 |
|
|
700 |
|
|
$ |
14.04 |
|
|
April 17, 2013 |
|
|
3,000 |
|
|
$ |
14.13 |
|
|
October 14, 2013 |
|
|
18,493 |
|
|
$ |
16.46 |
|
|
December 3, 2013 |
|
|
150 |
|
|
$ |
17.08 |
|
(1) Represents the weighted average fair value per unit, incorporating both time-based and market-based vesting conditions.
|
|
(2) |
Because the Management Incentive Units did not have an exercise price, the intrinsic value of each unit equaled the fair value. |
During 2013, Management Incentive Units were issued with a strike price that was based on a $400.0 million and $550.0 million company enterprise value. These strike prices are a vesting condition, by which the underlying incentive units did not vest unless the value of our company met or exceeded the specified level. The Management Incentive Units did not have an exercise price. There were no other equity instruments granted during the period from January 1, 2013 to the date of the 2014 Reorganization.
We believe that there is no single event that caused the change in the fair value of our incentive units between the grant dates, but rather a combination of factors described below for the significant difference noted in between certain grants as follow:
|
|
· |
Increase in value between the value at the grant date and the value at the initial public offering as a result of improved operating results; and |
|
|
· |
Increase in the probability assumption of an initial public offering scenario as we approached the estimated initial public offering date. |
In connection with the 2014 Reorganization, the incentive units we issued as part of the 2009 Incentive Units Plan (the “2009 Incentive Units”), were converted into shares of restricted stock. Upon the sale of common stock in the initial public offering, approximately 217,378 shares of restricted common stock that were granted to replace the 2009 Incentive Units automatically vested.
In connection with the 2014 Reorganization, incentive units of Holdings, including the Management Incentive Units granted in 2013, were converted into shares of common stock and/or restricted stock of Software. Vested incentive units were converted to shares of common stock and restricted stock at various conversion ratios that ranged from approximately 1:0.2 to 1:24. Unvested incentive units were converted to shares of restricted stock at various conversion ratios that ranged from 1:24 to 1:47. The conversion to shares of common stock or restricted stock was determined based on the underlying conditions of the pre-conversion incentive units and reflected any pre-existing vesting conditions. This conversion resulted in the issuance of 1,148,520 and 8,121,101 shares of common stock and restricted stock, respectively, on January 1, 2014. The shares of restricted stock are subject to either time-based or market-based vesting conditions. The FASB Accounting Standards Codification (“ASC”), Section 718-20-53-3 indicates that if the terms and conditions of an existing equity incentive compensation plan are to be modified, then an entity should record additional compensation cost for any incremental value associated with the modification. The incremental compensation cost is measured as the excess of the fair value of the modified awards over the fair value of the original awards immediately before its terms are modified. Based on the terms of restricted stock, we concluded that there was a modification of the existing equity incentive units. Based upon a valuation by an independent third party, management determined there was no additional compensation cost created in the conversion,
47
as the value of the incentive units given up was less than the value of the restricted stock received. As such, there was no additional compensation recorded.
Shares of 2014 Restricted Stock that were subject to time-based vesting conditions retained substantially the same time-based vesting conditions as the respective tranche of incentive units from which they were converted. The following tables show the vesting schedule for the outstanding shares of 2014 Restricted Stock subject to time-based vesting conditions:
|
|
|
Number of Shares of |
|
|
|
Year Ending December 31, |
|
Restricted Stock to Vest |
|
|
|
2016 |
|
|
573,150 |
|
|
2017 |
|
|
573,019 |
|
|
2018 |
|
|
99,545 |
|
|
Total |
|
|
1,245,714 |
|
The following table shows the vesting schedule for outstanding shares of 2015 Restricted Stock subject to time-based vesting conditions:
|
|
|
Number of Shares of |
|
|
|
Year Ending December 31, |
|
Restricted Stock to Vest |
|
|
|
2016 |
|
|
38,107 |
|
|
2017 |
|
|
38,104 |
|
|
2018 |
|
|
79,589 |
|
|
2019 |
|
|
51,613 |
|
|
2020 |
|
|
51,613 |
|
|
Total |
|
|
259,026 |
|
Shares of 2014 Restricted Stock that were subject to market-based vesting conditions vested 50% upon the Company reaching a total enterprise value of $1.4 billion on December 1, 2014. The remaining 50% vested upon the Company reaching a total enterprise value of $1.8 billion on March 2, 2015.
The following table shows the outstanding shares of 2015 Restricted Stock subject to market-based vesting conditions:
|
|
|
|
|
Number of Shares of |
|
|
|
Total Enterprise Value |
|
|
Restricted Stock to Vest |
|
||
|
$ |
2,650,000,000 |
|
|
|
237,550 |
|
|
$ |
3,500,000,000 |
|
|
|
237,550 |
|
Derivative Instruments
In April 2012, we entered into a 10% Senior Note due 2022 with WCAS Capital IV, a related party. The note contained certain prepayment features related to mandatory redemption upon a liquidation event. As of December 31, 2012, we had identified the prepayment feature of the note as a derivative instrument which is required to be bifurcated and separately accounted for at fair value with changes in fair value recorded in earnings. Refer to Note 7 of our audited consolidated financial statements for further discussion. The following are the significant inputs used to value the derivative instrument as of December 31, 2013:
|
|
|
2013 |
|
Probability of exit |
|
90% |
|
Remaining term |
|
0.8 year - 8.3 years |
|
Yield Volatility |
|
21.4% - 31.1% |
|
Credit Spread |
|
8.9% |
|
Risk-free rate |
|
0.13% - 2.45% |
There were no derivative instruments outstanding as of either December 31, 2015 or 2014.
48
Recent Accounting Pronouncements
In May 2014, the Financial Accounting Standards Board (“FASB”) issued authoritative guidance which included a comprehensive new revenue recognition model that requires revenue to be recognized in a manner to depict the transfer of goods or services to a customer at an amount that reflects the consideration expected to be received in exchange for those goods or services. This guidance is effective for fiscal years, and interim periods within those years, beginning after December 15, 2016, and early adoption is not permitted. In April 2015, the FASB proposed a one year deferral of the effective date of the new revenue recognition standard for public and non-public entities reporting under U.S. GAAP and on July 9, 2015, the FASB approved the one year deferral. The effective date of the amended standard will begin in periods beginning after December 15, 2017. We are currently evaluating the impact that the standard will have on our consolidated financial statements.
In June 2014, the FASB issued authoritative guidance for share-based payments which requires that a performance target that affects vesting, and that could be achieved after the requisite service period, be treated as a performance condition. As such, the performance target should not be reflected in estimating the grant date fair value of the award. This update further clarifies that compensation cost should be recognized in the period in which it becomes probable that the performance target will be achieved and should represent the compensation cost attributable to the period(s) for which the requisite service has already been rendered. The new guidance is effective for fiscal years, and interim periods within those years, beginning after December 15, 2015. Accordingly, the standard is effective for us on January 1, 2016. We do not anticipate that the adoption of this standard will have a material impact on our consolidated financial statements.
In April 2015, the FASB issued authoritative guidance for intangibles related to internally developed software. The new guidance will assist entities in evaluating the accounting for fees paid by a customer in a cloud computing arrangement. The new guidance is effective for fiscal years, and interim periods within those years, beginning after December 15, 2015. Accordingly, the standard is effective for us on January 1, 2016. We do not anticipate that the adoption of this standard will have a material impact on our consolidated financial statements.
In April 2015, the FASB issued authoritative guidance which simplifies the presentation of debt issuance costs. Under the new guidance, debt issuance costs related to a recognized debt liability will be presented in the consolidated balance sheets as a direct deduction from the carrying amount of the debt liability. The new guidance is effective for public entities for fiscal years, and interim periods within those years, beginning after December 15, 2015. Accordingly, the standard is effective for us on January 1, 2016. We do not anticipate that the adoption of this standard will have a material impact on our consolidated financial statements. Debt issuance costs are currently included on our consolidated balance sheets as an asset.
In July 2015, the FASB issued authoritative guidance which simplifies the measurement of inventory. Under the new guidance, an entity should measure inventory (as defined within the scope of the guidance) at the lower of cost or net realizable value. The new guidance applies to all inventory except inventory measured using last-in, first-out (LIFO) or the retail inventory method. Net realizable value is defined as the estimated selling price in the ordinary course of business, less reasonably predicable costs of completion, disposal and transportation. The new guidance is effective for public companies for fiscal years beginning after December 15, 2016, including interim periods within those fiscal years. Accordingly, the standard is effective for us on January 1, 2017. We do not anticipate that the adoption of this standard will have a material impact on our consolidated financial statements.
In January 2016, the FASB issued authoritative guidance for the accounting for financial instruments. The amendments in this guidance require all equity investments to be measured at fair value with changes in the fair value recognized through net income (other than those accounted for under equity method of accounting or those that result in consolidation of the investee). The amendments in this guidance also require an entity to present separately in other comprehensive income the portion of the total change in the fair value of a liability resulting from a change in the instrument-specific credit risk when the entity has elected to measure the liability at fair value in accordance with the fair value option for financial instruments. In addition the amendments in this guidance eliminate the requirement to disclose the method(s) and significant assumptions used to estimate the fair value that is required to be disclosed for financial instruments measured at amortized cost on the balance sheet for public business entities. The new guidance is effective for us for fiscal years, and interim periods within those years, beginning after December 15, 2017 and early adoption is permitted. We are currently evaluating the impact that the standard will have on our consolidated financial statements.
Non-GAAP Financial Measures
We use EBITDA, Adjusted EBITDA and non-GAAP net income, as supplemental measures to review and assess our performance and planning purposes. We define: (i) EBITDA as net income (loss), plus interest expense, taxes and depreciation and amortization, (ii) Adjusted EBITDA as net income (loss), plus interest expense, taxes, depreciation and amortization, stock-based compensation expense, net loss on early repayment of debt and certain transaction expenses that are not core to our operations and (iii) non-GAAP net income as unaudited pro forma net income (loss) plus tax adjusted stock-based compensation expense, tax
49
adjusted net loss on early repayment of debt and certain tax adjusted transaction expenses that are not core to our operations. EBITDA, Adjusted EBITDA and non-GAAP net income are metrics that we believe are useful to investors in evaluating our performance and facilitating comparison with other peer companies, many of which use similar non-GAAP financial measures to supplement results under U.S. GAAP.
EBITDA, Adjusted EBITDA and non-GAAP net income are not measures of financial performance under U.S. GAAP, and should not be considered a substitute for net income (loss) or pro forma net income (loss), as applicable, which we consider to be the most directly comparable U.S. GAAP measures. EBITDA, Adjusted EBITDA and non-GAAP net income have limitations as analytical tools, and when assessing our operating performance, you should not consider EBITDA, Adjusted EBITDA or non-GAAP net income in isolation, or as a substitute for net income, unaudited pro forma net income (loss) or other consolidated statements of income data prepared in accordance with U.S. GAAP. EBITDA, Adjusted EBITDA and non-GAAP net income may not be comparable to similar titled measures of other companies and other companies may not calculate such measures in the same manner as we do.
The following tables reconcile net income to EBITDA and Adjusted EBITDA and unaudited pro forma net income to non-GAAP net income (dollars in thousands except share and per share amounts):
|
|
|
Year Ended December 31, |
|
|||||||||
|
|
|
2015 |
|
|
2014 |
|
|
2013 |
|
|||
|
Net Income to Adjusted EBITDA: |
|
|
|
|
|
|
|
|
|
|
|
|
|
Net income |
|
$ |
20,945 |
|
|
$ |
5,663 |
|
|
$ |
607 |
|
|
Interest expense |
|
|
1,427 |
|
|
|
3,421 |
|
|
|
9,272 |
|
|
Provision for income taxes |
|
|
12,580 |
|
|
|
3,993 |
|
|
|
792 |
|
|
Depreciation and amortization |
|
|
9,421 |
|
|
|
7,162 |
|
|
|
5,503 |
|
|
EBITDA |
|
|
44,373 |
|
|
|
20,239 |
|
|
|
16,174 |
|
|
Stock-based compensation expense |
|
|
3,010 |
|
|
|
712 |
|
|
|
934 |
|
|
Transaction expenses |
|
|
685 |
|
|
|
2,004 |
|
|
|
2,747 |
|
|
Net loss on early repayment of debt |
|
|
— |
|
|
|
4,044 |
|
|
|
— |
|
|
Adjusted EBITDA |
|
$ |
48,068 |
|
|
$ |
26,999 |
|
|
$ |
19,855 |
|
|
|
|
Year Ended December 31, |
|
|||||||||
|
|
|
2015 |
|
|
2014 |
|
|
2013 |
|
|||
|
Net Income to non-GAAP net income: |
|
|
|
|
|
|
|
|
|
|
|
|
|
Unaudited pro forma net income |
|
$ |
20,945 |
|
|
$ |
5,663 |
|
|
$ |
738 |
|
|
Tax adjusted stock-based compensation expense(1) |
|
|
1,881 |
|
|
|
418 |
|
|
|
495 |
|
|
Tax adjusted transaction expenses(1) |
|
|
623 |
|
|
|
1,175 |
|
|
|
1,456 |
|
|
Tax adjusted net loss on early repayment of debt(1) |
|
|
— |
|
|
|
2,372 |
|
|
|
— |
|
|
Non-GAAP net income |
|
$ |
23,449 |
|
|
$ |
9,628 |
|
|
$ |
2,689 |
|
|
|
|
|
|
|
|
|
|
|
|
|
|
|
|
Non-GAAP net income per share, basic |
|
$ |
0.42 |
|
|
$ |
0.19 |
|
|
$ |
0.06 |
|
|
Non-GAAP net income per share, diluted |
|
$ |
0.40 |
|
|
$ |
0.19 |
|
|
$ |
0.06 |
|
|
|
|
|
|
|
|
|
|
|
|
|
|
|
|
Unaudited pro forma weighted average shares outstanding: |
|
|
|
|
|
|
|
|
|
|
|
|
|
Basic |
|
|
56,495,170 |
|
|
|
49,784,154 |
|
|
|
45,476,895 |
|
|
Diluted |
|
|
57,919,700 |
|
|
|
51,857,309 |
|
|
|
48,062,075 |
|
|
|
(1) |
Beginning in 2015, we use an individual non-GAAP tax rate for each tax adjusted non-GAAP item to determine the amount of non-GAAP net income. Prior to 2015, we used an overall effective tax rate for each tax adjusted non-GAAP item to determine the amount of non-GAAP net income. |
Interest rate sensitivity
We had cash and cash equivalents totaling $50.7 million as of December 31, 2015. We consider all highly liquid debt instruments purchased with a maturity of three months or less and money market mutual funds to be cash equivalents. These amounts
50
are invested primarily in deposit accounts and money market funds. The cash and cash equivalents are held for working capital purposes. Our investments are made for capital preservation purposes. We do not enter into investments for trading or speculative purposes.
Our cash equivalents are subject to market risk due to changes in interest rates. Fixed rate securities may have their market value adversely affected due to a rise in interest rates, while floating rate securities may produce less income than expected if interest rates fall. Due in part to these factors, our future investment income may fall short of expectation due to changes in interest rates, or we may suffer losses in principal if we are forced to sell securities that decline in market value due to changes in interest rates.
We do not believe that an increase or decrease in interest rates of 100-basis points would have a material effect on our operating results or financial condition with respect to our cash equivalents.
51
INDEX TO CONSOLIDATED FINANCIAL STATEMENTS
|
|
Page |
|
Paycom Software, Inc. |
|
|
Consolidated Annual Financial Statements |
|
|
53 |
|
|
Consolidated Balance Sheets as of December 31, 2015 and 2014 |
54 |
|
Consolidated Statements of Income, Years Ended December 31, 2015, 2014 and 2013 |
55 |
|
Consolidated Statements of Stockholders’ Equity, Years Ended December 31, 2015, 2014 and 2013 |
56 |
|
Consolidated Statements of Cash Flows, Years Ended December 31, 2015, 2014 and 2013 |
57 |
|
58 |
52
REPORT OF INDEPENDENT REGISTERED PUBLIC ACCOUNTING FIRM
Board of Directors and Stockholders
Paycom Software, Inc.
We have audited the accompanying consolidated balance sheets of Paycom Software, Inc. (a Delaware corporation) and subsidiaries (the “Company”) as of December 31, 2015 and 2014, and the related consolidated statements of income, stockholders’ equity, and cash flows for each of the three years in the period ended December 31, 2015. These financial statements are the responsibility of the Company’s management. Our responsibility is to express an opinion on these financial statements based on our audits.
We conducted our audits in accordance with the standards of the Public Company Accounting Oversight Board (United States). Those standards require that we plan and perform the audit to obtain reasonable assurance about whether the financial statements are free of material misstatement. An audit includes examining, on a test basis, evidence supporting the amounts and disclosures in the financial statements. An audit also includes assessing the accounting principles used and significant estimates made by management, as well as evaluating the overall financial statement presentation. We believe that our audits provide a reasonable basis for our opinion.
In our opinion, the consolidated financial statements referred to above present fairly, in all material respects, the financial position of Paycom Software, Inc. and subsidiaries as of December 31, 2015 and 2014, and the results of their operations and their cash flows for each of the three years in the period ended December 31, 2015 in conformity with accounting principles generally accepted in the United States of America.
As discussed in Note 2 to the consolidated financial statements, the Company adopted new accounting guidance in 2015 and 2014 related to the presentation of deferred income taxes.
We also have audited, in accordance with the standards of the Public Company Accounting Oversight Board (United States), the Company’s internal control over financial reporting as of December 31, 2015, based on criteria established in the 2013 Internal Control—Integrated Framework issued by the Committee of Sponsoring Organizations of the Treadway Commission (COSO), and our report dated February 22, 2016 expressed an unqualified opinion.
/s/ GRANT THORNTON LLP
Oklahoma City, Oklahoma
February 22, 2016
53
(in thousands, except share amounts)
|
|
|
December 31, |
|
|||||
|
|
|
2015 |
|
|
2014 |
|
||
|
Assets |
|
|
|
|
|
|
|
|
|
Current assets: |
|
|
|
|
|
|
|
|
|
Cash and cash equivalents |
|
$ |
50,714 |
|
|
$ |
25,144 |
|
|
Restricted cash |
|
|
— |
|
|
|
371 |
|
|
Accounts receivable |
|
|
2,354 |
|
|
|
2,794 |
|
|
Prepaid expenses |
|
|
3,531 |
|
|
|
1,952 |
|
|
Inventory |
|
|
1,093 |
|
|
|
195 |
|
|
Income tax receivable |
|
|
6,743 |
|
|
|
935 |
|
|
Current assets before funds held for clients |
|
|
64,435 |
|
|
|
31,391 |
|
|
Funds held for clients |
|
|
696,703 |
|
|
|
660,557 |
|
|
Total current assets |
|
|
761,138 |
|
|
|
691,948 |
|
|
Property and equipment, net |
|
|
58,858 |
|
|
|
47,919 |
|
|
Deposits and other assets |
|
|
1,404 |
|
|
|
645 |
|
|
Goodwill |
|
|
51,889 |
|
|
|
51,889 |
|
|
Intangible assets, net |
|
|
3,484 |
|
|
|
5,096 |
|
|
Total assets |
|
$ |
876,773 |
|
|
$ |
797,497 |
|
|
Liabilities and Stockholders' Equity |
|
|
|
|
|
|
|
|
|
Current liabilities: |
|
|
|
|
|
|
|
|
|
Accounts payable |
|
$ |
4,899 |
|
|
$ |
3,042 |
|
|
Accrued commissions and bonuses |
|
|
8,687 |
|
|
|
5,080 |
|
|
Accrued payroll and vacation |
|
|
2,898 |
|
|
|
1,582 |
|
|
Deferred revenue |
|
|
3,726 |
|
|
|
2,535 |
|
|
Current portion of long-term debt |
|
|
886 |
|
|
|
855 |
|
|
Accrued expenses and other current liabilities |
|
|
9,735 |
|
|
|
5,121 |
|
|
Current liabilities before client funds obligation |
|
|
30,831 |
|
|
|
18,215 |
|
|
Client funds obligation |
|
|
696,703 |
|
|
|
660,557 |
|
|
Total current liabilities |
|
|
727,534 |
|
|
|
678,772 |
|
|
Deferred income tax liabilities, net |
|
|
641 |
|
|
|
1,662 |
|
|
Long-term deferred revenue |
|
|
25,310 |
|
|
|
16,802 |
|
|
Long-term debt, less current portion |
|
|
24,974 |
|
|
|
26,123 |
|
|
Total long-term liabilities |
|
|
50,925 |
|
|
|
44,587 |
|
|
Commitments and contingencies |
|
|
|
|
|
|
|
|
|
Stockholders' equity: |
|
|
|
|
|
|
|
|
|
Common stock, $0.01 par value (100,000,000 shares authorized, 57,119,873 and 53,832,782 shares issued and outstanding at December 31, 2015 and 2014, respectively) |
|
|
571 |
|
|
|
538 |
|
|
Additional paid in capital |
|
|
71,135 |
|
|
|
67,937 |
|
|
Retained earnings |
|
|
26,608 |
|
|
|
5,663 |
|
|
Total stockholders' equity |
|
|
98,314 |
|
|
|
74,138 |
|
|
Total liabilities and stockholders' equity |
|
$ |
876,773 |
|
|
$ |
797,497 |
|
See accompanying notes to the consolidated financial statements.
54
Consolidated Statements of Income
(in thousands, except share amounts)
|
|
|
Year Ended December 31, |
|
|||||||||
|
|
|
|
2015 |
|
|
|
2014 |
|
|
|
2013 |
|
|
Revenues |
|
|
|
|
|
|
|
|
|
|
|
|
|
Recurring |
|
$ |
219,987 |
|
|
$ |
148,207 |
|
|
$ |
105,560 |
|
|
Implementation and other |
|
|
4,666 |
|
|
|
2,722 |
|
|
|
2,041 |
|
|
Total revenues |
|
|
224,653 |
|
|
|
150,929 |
|
|
|
107,601 |
|
|
Cost of revenues |
|
|
|
|
|
|
|
|
|
|
|
|
|
Operating expenses |
|
|
31,790 |
|
|
|
24,694 |
|
|
|
19,070 |
|
|
Depreciation and amortization |
|
|
3,683 |
|
|
|
2,624 |
|
|
|
1,821 |
|
|
Total cost of revenues |
|
|
35,473 |
|
|
|
27,318 |
|
|
|
20,891 |
|
|
Administrative expenses |
|
|
|
|
|
|
|
|
|
|
|
|
|
Sales and marketing |
|
|
92,554 |
|
|
|
63,547 |
|
|
|
42,681 |
|
|
Research and development |
|
|
8,627 |
|
|
|
4,325 |
|
|
|
2,146 |
|
|
General and administrative |
|
|
47,826 |
|
|
|
35,501 |
|
|
|
28,729 |
|
|
Depreciation and amortization |
|
|
5,738 |
|
|
|
4,538 |
|
|
|
3,682 |
|
|
Total administrative expenses |
|
|
154,745 |
|
|
|
107,911 |
|
|
|
77,238 |
|
|
Total operating expenses |
|
|
190,218 |
|
|
|
135,229 |
|
|
|
98,129 |
|
|
Operating income |
|
|
34,435 |
|
|
|
15,700 |
|
|
|
9,472 |
|
|
Interest expense |
|
|
(1,427 |
) |
|
|
(3,421 |
) |
|
|
(9,272 |
) |
|
Loss on early repayment of debt |
|
|
— |
|
|
|
(4,044 |
) |
|
|
— |
|
|
Other income, net |
|
|
517 |
|
|
|
1,421 |
|
|
|
1,199 |
|
|
Income before income taxes |
|
|
33,525 |
|
|
|
9,656 |
|
|
|
1,399 |
|
|
Provision for income taxes |
|
|
12,580 |
|
|
|
3,993 |
|
|
|
792 |
|
|
Net income |
|
|
20,945 |
|
|
|
5,663 |
|
|
|
607 |
|
|
Net income attributable to the noncontrolling interest |
|
|
— |
|
|
|
— |
|
|
|
6 |
|
|
Net income attributable to the Company |
|
$ |
20,945 |
|
|
$ |
5,663 |
|
|
$ |
601 |
|
|
Unaudited pro forma additional income tax benefit |
|
|
— |
|
|
|
— |
|
|
|
(137 |
) |
|
Unaudited pro forma net income |
|
$ |
20,945 |
|
|
$ |
5,663 |
|
|
$ |
738 |
|
|
|
|
|
|
|
|
|
|
|
|
|
|
|
|
Net income per share, basic |
|
$ |
0.37 |
|
|
$ |
0.11 |
|
|
$ |
0.01 |
|
|
Net income per share, diluted |
|
$ |
0.36 |
|
|
$ |
0.11 |
|
|
$ |
0.01 |
|
|
|
|
|
|
|
|
|
|
|
|
|
|
|
|
Unaudited pro forma net income per share, basic |
|
$ |
0.37 |
|
|
$ |
0.11 |
|
|
$ |
0.02 |
|
|
Unaudited pro forma net income per share, diluted |
|
$ |
0.36 |
|
|
$ |
0.11 |
|
|
$ |
0.02 |
|
|
Weighted average shares outstanding: |
|
|
|
|
|
|
|
|
|
|
|
|
|
Basic |
|
|
56,495,170 |
|
|
|
49,784,154 |
|
|
|
45,476,895 |
|
|
Diluted |
|
|
57,919,700 |
|
|
|
51,857,309 |
|
|
|
48,062,075 |
|
|
Unaudited pro forma weighted average shares outstanding: |
|
|
|
|
|
|
|
|
|
|
|
|
|
Basic |
|
|
56,495,170 |
|
|
|
49,784,154 |
|
|
|
45,476,895 |
|
|
Diluted |
|
|
57,919,700 |
|
|
|
51,857,309 |
|
|
|
48,062,075 |
|
See accompanying notes to the consolidated financial statements.
55
Consolidated Statements of Stockholders’ Equity
(in thousands, except share amounts)
|
|
|
Common Stock |
|
|
Additional |
|
|
(Accumulated Deficit)/ |
|
|
Non-controlling |
|
|
Total |
|
|||||||||
|
|
|
Shares |
|
|
Amount |
|
|
Paid in Capital |
|
|
Retained Earnings |
|
|
Interest |
|
|
Stockholders' Equity |
|
||||||
|
|
|
|
|
|
|
|
|
|
|
|
|
|
|
|
|
|
|
|
|
|
|
|
|
|
|
Balances at December 31, 2012 |
|
|
44,560,048 |
|
|
$ |
445 |
|
|
$ |
23,577 |
|
|
$ |
(14,249 |
) |
|
$ |
3 |
|
|
$ |
9,776 |
|
|
Common stock redeemed |
|
|
— |
|
|
|
— |
|
|
|
(1,061 |
) |
|
|
— |
|
|
|
— |
|
|
|
(1,061 |
) |
|
Stock-based compensation |
|
|
— |
|
|
|
— |
|
|
|
1,164 |
|
|
|
— |
|
|
|
— |
|
|
|
1,164 |
|
|
Issuance of common stock |
|
|
1,148,525 |
|
|
|
12 |
|
|
|
— |
|
|
|
— |
|
|
|
— |
|
|
|
12 |
|
|
Distributions to stockholders |
|
|
— |
|
|
|
— |
|
|
|
10,298 |
|
|
|
(15,707 |
) |
|
|
— |
|
|
|
(5,409 |
) |
|
Net income |
|
|
— |
|
|
|
— |
|
|
|
— |
|
|
|
607 |
|
|
|
(6 |
) |
|
|
601 |
|
|
Balances at December 31, 2013 |
|
|
45,708,573 |
|
|
$ |
457 |
|
|
$ |
33,978 |
|
|
$ |
(29,349 |
) |
|
$ |
(3 |
) |
|
$ |
5,083 |
|
|
Acquisition of CP IV Blocker under the 2014 Reorganization |
|
|
— |
|
|
|
— |
|
|
|
— |
|
|
|
— |
|
|
|
3 |
|
|
|
3 |
|
|
Reclassification of accumulated deficit to additional paid in capital under 2014 Reorganization |
|
|
— |
|
|
|
— |
|
|
|
(29,349 |
) |
|
|
29,349 |
|
|
|
— |
|
|
|
— |
|
|
Incentive units converted to common and restricted stock |
|
|
3,517,327 |
|
|
|
35 |
|
|
|
(35 |
) |
|
|
— |
|
|
|
— |
|
|
|
— |
|
|
Initial public offering, net |
|
|
4,606,882 |
|
|
|
46 |
|
|
|
62,810 |
|
|
|
— |
|
|
|
— |
|
|
|
62,856 |
|
|
Stock-based compensation |
|
|
— |
|
|
|
— |
|
|
|
716 |
|
|
|
— |
|
|
|
— |
|
|
|
716 |
|
|
Capital impact of the 2014 Reorganization |
|
|
— |
|
|
|
— |
|
|
|
(183 |
) |
|
|
— |
|
|
|
— |
|
|
|
(183 |
) |
|
Net income |
|
|
— |
|
|
|
— |
|
|
|
— |
|
|
|
5,663 |
|
|
|
— |
|
|
|
5,663 |
|
|
Balances at December 31, 2014 |
|
|
53,832,782 |
|
|
$ |
538 |
|
|
$ |
67,937 |
|
|
$ |
5,663 |
|
|
$ |
0 |
|
|
$ |
74,138 |
|
|
Vesting of restricted stock |
|
|
3,287,091 |
|
|
|
33 |
|
|
|
(33 |
) |
|
|
— |
|
|
|
— |
|
|
|
— |
|
|
Stock-based compensation |
|
|
— |
|
|
|
— |
|
|
|
3,231 |
|
|
|
— |
|
|
|
— |
|
|
|
3,231 |
|
|
Net income |
|
|
— |
|
|
|
— |
|
|
|
— |
|
|
|
20,945 |
|
|
|
— |
|
|
|
20,945 |
|
|
Balances at December 31, 2015 |
|
|
57,119,873 |
|
|
$ |
571 |
|
|
$ |
71,135 |
|
|
$ |
26,608 |
|
|
$ |
0 |
|
|
$ |
98,314 |
|
|
|
|
|
|
|
|
|
|
|
|
|
|
|
|
|
|
|
|
|
|
|
|
|
|
|
|
|
|
|
|
|
|
|
|
|
|
|
|
|
|
|
|
|
|
|
|
|
|
|
|
|
|
|
|
|
|
|
|
|
|
|
|
|
|
|
|
|
|
|
|
|
|
|
|
|
|
|
See accompanying notes to the consolidated financial statements
56
Consolidated Statements of Cash Flows
(in thousands)
|
|
|
Year Ended December 31, |
|
|||||||||
|
|
|
2015 |
|
|
2014 |
|
|
2013 |
|
|||
|
Cash flows from operating activities: |
|
|
|
|
|
|
|
|
|
|
|
|
|
Net income |
|
$ |
20,945 |
|
|
$ |
5,663 |
|
|
$ |
607 |
|
|
Adjustments to reconcile net income to net cash provided by operating activities: |
|
|
|
|
|
|
|
|
|
|
|
|
|
Depreciation and amortization |
|
|
9,421 |
|
|
|
7,162 |
|
|
|
5,486 |
|
|
(Gain)/loss on disposition of property and equipment |
|
|
15 |
|
|
|
— |
|
|
|
(248 |
) |
|
Amortization of debt discount and debt issuance costs |
|
|
157 |
|
|
|
133 |
|
|
|
258 |
|
|
Write off of debt issuance costs |
|
|
— |
|
|
|
4,051 |
|
|
|
— |
|
|
Stock-based compensation expense |
|
|
3,010 |
|
|
|
712 |
|
|
|
934 |
|
|
Employee stock purchase plan compensation expense |
|
|
209 |
|
|
|
— |
|
|
|
— |
|
|
Net change in derivative liability |
|
|
— |
|
|
|
(1,107 |
) |
|
|
(660 |
) |
|
Deferred income taxes, net |
|
|
(1,021 |
) |
|
|
2,259 |
|
|
|
517 |
|
|
Changes in operating assets and liabilities: |
|
|
|
|
|
|
|
|
|
|
|
|
|
Accounts receivable |
|
|
440 |
|
|
|
(1,089 |
) |
|
|
(1,083 |
) |
|
Prepaid expenses |
|
|
(1,579 |
) |
|
|
(465 |
) |
|
|
(800 |
) |
|
Inventory |
|
|
(224 |
) |
|
|
267 |
|
|
|
136 |
|
|
Deposits and other assets |
|
|
(810 |
) |
|
|
(232 |
) |
|
|
(44 |
) |
|
Accounts payable |
|
|
(431 |
) |
|
|
(2,386 |
) |
|
|
2,667 |
|
|
Income taxes, net |
|
|
(5,808 |
) |
|
|
(122 |
) |
|
|
(150 |
) |
|
Accrued commissions and bonuses |
|
|
3,607 |
|
|
|
1,482 |
|
|
|
1,645 |
|
|
Accrued payroll and vacation |
|
|
1,316 |
|
|
|
(1,505 |
) |
|
|
1,162 |
|
|
Deferred revenue |
|
|
9,699 |
|
|
|
6,765 |
|
|
|
4,163 |
|
|
Accrued expenses and other current liabilities |
|
|
4,026 |
|
|
|
749 |
|
|
|
2,394 |
|
|
Net cash provided by operating activities |
|
|
42,972 |
|
|
|
22,337 |
|
|
|
16,984 |
|
|
Cash flows from investing activities: |
|
|
|
|
|
|
|
|
|
|
|
|
|
Increase in funds held for clients |
|
|
(36,146 |
) |
|
|
(204,778 |
) |
|
|
(131,513 |
) |
|
Decrease (increase) in restricted cash |
|
|
371 |
|
|
|
(2 |
) |
|
|
(1 |
) |
|
Purchases of property and equipment |
|
|
(16,549 |
) |
|
|
(14,270 |
) |
|
|
(17,176 |
) |
|
Proceeds from sale of property and equipment |
|
|
— |
|
|
|
— |
|
|
|
258 |
|
|
Net cash used in investing activities |
|
|
(52,324 |
) |
|
|
(219,050 |
) |
|
|
(148,432 |
) |
|
Cash flows from financing activities: |
|
|
|
|
|
|
|
|
|
|
|
|
|
Proceeds from issuance of long-term debt |
|
|
— |
|
|
|
6,538 |
|
|
|
6,979 |
|
|
Principal payments on long-term debt |
|
|
(1,118 |
) |
|
|
(65,650 |
) |
|
|
— |
|
|
Increase in client funds obligation |
|
|
36,146 |
|
|
|
204,778 |
|
|
|
131,513 |
|
|
Proceeds from initial public offering, net of offering costs |
|
|
— |
|
|
|
62,840 |
|
|
|
— |
|
|
Incentive units redeemed |
|
|
— |
|
|
|
— |
|
|
|
(1,061 |
) |
|
Payments of deferred offering costs |
|
|
— |
|
|
|
— |
|
|
|
(647 |
) |
|
Distributions paid to stockholders |
|
|
— |
|
|
|
— |
|
|
|
(5,409 |
) |
|
Payment of debt issuance costs |
|
|
(106 |
) |
|
|
(11 |
) |
|
|
— |
|
|
Net cash provided by financing activities |
|
|
34,922 |
|
|
|
208,495 |
|
|
|
131,375 |
|
|
Change in cash and cash equivalents |
|
|
25,570 |
|
|
|
11,782 |
|
|
|
(73 |
) |
|
Cash and cash equivalents |
|
|
|
|
|
|
|
|
|
|
|
|
|
Beginning of year |
|
|
25,144 |
|
|
|
13,362 |
|
|
|
13,435 |
|
|
End of year |
|
$ |
50,714 |
|
|
$ |
25,144 |
|
|
$ |
13,362 |
|
|
Supplemental disclosures of cash flow information: |
|
|
|
|
|
|
|
|
|
|
|
|
|
Cash paid for interest, net of amounts capitalized |
|
$ |
1,271 |
|
|
$ |
3,482 |
|
|
$ |
9,298 |
|
|
Cash paid for income taxes |
|
|
19,205 |
|
|
|
2,013 |
|
|
|
378 |
|
|
Noncash investing and financing activities: |
|
|
|
|
|
|
|
|
|
|
|
|
|
Purchases of property and equipment, accrued but not paid |
|
$ |
1,613 |
|
|
$ |
408 |
|
|
$ |
368 |
|
|
Stock based compensation for capitalized software |
|
|
220 |
|
|
|
4 |
|
|
|
229 |
|
See accompanying notes to the consolidated financial statements.
57
Notes to the Consolidated Financial Statements
|
1. |
ORGANIZATION AND DESCRIPTION OF BUSINESS |
Description of Business
Paycom Software, Inc. (“Software”) and its wholly owned subsidiaries (collectively, the “Company”) is a leading provider of comprehensive, cloud-based human capital management (“HCM”) software delivered as Software-as-a-Service. Unless we state otherwise or the context otherwise requires, the terms “we”, “our”, “us” and the “Company” refer to Software and its consolidated subsidiaries.
We provide functionality and data analytics that businesses need to manage the complete employment life cycle from recruitment to retirement. Our solution requires virtually no customization and is based on a core system of record maintained in a single database for all HCM functions, including talent acquisition, time and labor management, payroll, talent management and human resources (“HR”) management applications.
The Reorganization
Software and its wholly owned subsidiary, Payroll Software Merger Sub, LLC (“Merger Sub”) were formed as Delaware entities on October 31, 2013 and December 23, 2013, respectively, in anticipation of an initial public offering (“IPO”) and were wholly owned subsidiaries of Paycom Payroll Holdings, LLC (“Holdings”) prior to December 31, 2013.
On January 1, 2014, we consummated a reorganization pursuant to which (i) affiliates of Welsh, Carson, Anderson & Stowe, L.P. contributed WCAS Paycom Holdings, Inc. (“WCAS Holdings”) and WCAS CP IV Blocker, Inc. (“CP IV Blocker”), which together owned all of the Series A Preferred Units of Holdings, to Software in exchange for shares of common stock of Software, and (ii) the owners of outstanding Series B Preferred Units of Holdings contributed their Series B Preferred Units of Holdings to Software in exchange for shares of common stock of Software. Immediately after these contributions, Merger Sub merged with and into Holdings with Holdings surviving the merger. Upon consummation of the merger, the remaining holders of outstanding common and incentive units of Holdings received shares of common and restricted stock of Software for their common and incentive units by operation of Delaware law, and Holdings’ ownership interest in Software was cancelled. Outstanding common units, Series B Preferred Units and WCAS Holdings and CP IV Blocker were contributed to Software in exchange for, or converted into, an aggregate of 45,708,573 shares of common stock and 8,121,101 shares of restricted stock of Software. Prior to the reorganization, WCAS Holdings held Series C Preferred Units of Holdings in the amount of $46.2 million and WCAS Holdings had a 14% note due April 3, 2017 in the amount of $46.2 million (the “2017 Note”), which was payable to Welsh, Carson, Anderson & Stowe X, L.P. (“WCAS X”). Following the exchange of the Series A Preferred Units and Series B Preferred Units for shares of common stock of Software, all outstanding Series C Preferred Units of Holdings were eliminated in an intercompany transaction between Holdings and WCAS Holdings, we assumed the 2017 Note and Software became a holding company with its principal assets being the Series B Preferred Units of Holdings and the outstanding capital stock of WCAS Holdings and CP IV Blocker. The foregoing transactions are referred to collectively as the “2014 Reorganization”.
Software’s acquisition of WCAS Holdings and Holdings in the 2014 Reorganization represented transactions under common control and were required to be retrospectively applied to the financial statements for all prior periods when the financial statements were issued for a period that included the date the transactions occurred. This includes a retrospective presentation for all equity related disclosures, including share, per share, and restricted stock disclosures, which have been revised to reflect the effects of the 2014 Reorganization. Therefore, our consolidated financial statements are presented as if WCAS Holdings and Holdings were Software’s wholly owned subsidiaries in periods prior to the 2014 Reorganization. The acquisition of CP IV Blocker was not deemed to be a reorganization under common control and therefore our historical consolidated financial statements include the ownership of a minority equity interest in CP IV Blocker, which was eliminated upon the acquisition of CP IV Blocker in the 2014 Reorganization on January 1, 2014.
58
On April 21, 2014, we completed our IPO whereby an aggregate of 7,641,750 shares of our common stock were sold to the public (including 4,606,882 shares of common stock issued and sold by us and 3,034,868 shares of common stock sold by certain selling stockholders) at a public offering price of $15.00 per share. We did not receive any proceeds from the sale of shares by the selling stockholders. The total gross proceeds we received from the offering were $69.1 million. After deducting underwriting discounts and commissions and offering expenses payable by us, the aggregate net proceeds we received totaled approximately $62.8 million. We used all of the net proceeds from the offering, together with approximately $3.3 million from existing cash, for the repayment in full of the 2017 Note and the 10% Senior Note due 2022 (the “2022 Note”) payable to WCAS Capital Partners IV, L.P. “WCAS Capital IV”).
Follow-On Public Offering
On January 21, 2015, we closed our follow-on public offering, whereby 6,422,750 shares of our common stock were sold to the public by certain selling stockholders at a public offering price of $22.50 per share. We did not receive any proceeds from the sale of these shares.
Registered Block Trade Transactions
On May 20, 2015, we closed an underwritten secondary offering of 8,000,000 shares of our common stock by WCAS X, WCAS Capital IV, each of our executive officers and certain other selling stockholders at a public offering price of $36.25 per share. We did not receive any proceeds from the sale of these shares.
On September 15, 2015, we closed an underwritten secondary offering of 4,500,000 shares of our common stock by WCAS X, WCAS Capital IV, each of our executive officers and certain other selling stockholders at a public offering price of $37.95 per share. On September 23, 2015, the underwriter exercised its option to purchase an additional 675,000 shares from WCAS X and WCAS Capital IV. We did not receive any proceeds from the sales of these shares.
On November 18, 2015, we closed an underwritten secondary offering of 4,500,000 shares of our common stock by WCAS X, WCAS Capital IV, each of our executive officers and certain other selling stockholders at a public offering price of $42.15 per share. On November 19, 2015, the underwriter exercised its overallotment option and subsequently purchased an additional 585,697 shares from WCAS X and WCAS Capital IV. We did not receive any proceeds from the sales of these shares.
|
2. |
SUMMARY OF SIGNIFICANT ACCOUNTING POLICIES |
Basis of Presentation and Principles of Consolidation
Our consolidated financial statements include the financial results of Software and its wholly owned subsidiaries and have been prepared in accordance with accounting principles generally accepted in the United States of America (“US GAAP”) and applicable rules and regulations of the Securities and Exchange Commission (“SEC”). Intercompany balances and transactions have been eliminated in consolidation.
Adoption of New Pronouncement
We elected to early adopt on a retrospective basis the recently issued guidance by the FASB Accounting Standards Update No. 2015-17, “Income Taxes (Topic 740): Balance Sheet Classification of Deferred Taxes” (“ASU 2015-17”). ASU 2015-17 requires companies to classify all deferred tax assets and liabilities as noncurrent on the balance sheet instead of separating deferred taxes into current and noncurrent amounts. Adoption resulted in a reclassification which decreased current deferred income tax assets by $1.4 million and increased noncurrent deferred income tax liabilities, net by $1.4 million on our consolidated balance sheets as of December 31, 2014. Adoption had no impact on our stockholders’ equity or the results of our operations.
Use of Estimates
The preparation of financial statements in conformity with US GAAP requires management to make estimates and assumptions that affect the amounts reported in the financial statements and accompanying notes. Significant estimates include income taxes, loss contingencies, the useful life for long-lived and intangible assets, the life of our client relationships, the fair market value of our equity incentive awards and the fair value of our financial instruments. These estimates are based on historical experience where applicable and other assumptions that management believes are reasonable under circumstances. As such, actual results could materially differ from these estimates.
59
We operate in a single operating segment and a single reporting segment. Operating segments are defined as components of an enterprise about which separate financial information is evaluated regularly by the chief operating decision maker, who is also the chief executive officer in deciding how to allocate resources and assessing performance. Our chief executive officer allocates resources and assesses performance based upon financial information at the consolidated level. Since we operate in one operating segment, all required financial segment information is presented in the consolidated financial statements.
Cash Equivalents
We consider all highly liquid debt instruments purchased with a maturity of three months or less and money market mutual funds to be cash equivalents. We maintain cash and cash equivalents in bank deposit accounts and money market funds, which may not be federally insured. The fair value of our cash and cash equivalents approximates carrying value. As of December 31, 2015 and 2014, all amounts were held in deposit on demand. We have not experienced any losses in such accounts and do not believe there is exposure to any significant credit risk on such accounts.
Restricted Cash
Restricted cash in our consolidated balance sheets primarily consists of cash held in restricted accounts due to requirements under an office building lease. We had no restricted cash as of December 31, 2015. As of December 31, 2014, we had restricted cash of $0.4 million.
Accounts Receivable
We generally collect revenue from our clients through an automatic deduction from the clients’ bank accounts at the time payroll processing occurs. Accounts receivable on our consolidated balance sheets consists primarily of revenue fees related to the last day of the year, which are collected on the following business day. As accounts receivable are collected via automatic deduction on the following business day, the Company has not recorded an allowance for doubtful accounts.
Deferred offering costs
Deferred offering costs represent legal, accounting and other direct costs related to our efforts to raise capital through an IPO. $2.1 million of costs related to IPO activities were deferred until the completion of our IPO on April 21, 2014, at which time these costs were offset against the IPO proceeds.
Inventory
Our inventory consists of two types of time clocks, and related clock attachments, sold to clients as part of our time and attendance services and are stated at the lower of cost or market. Cost is determined using the first-in first-out (FIFO) cost method.
Time clocks are purchased as finished goods from a third party and as such we do not have any inventory classified as raw materials or work in process inventory. Rental clocks are issued to clients under month-to-month operating leases and are classified as property and equipment. We retain inventory in certain lines primarily as replacements for those clients who use the various clocks and have determined that no write-down for obsolete items was required based on inventory turnover and our historical experience during the years ended December 31, 2015, 2014 and 2013.
Property and Equipment
Property and equipment is stated at cost, net of accumulated depreciation. Depreciation is determined using the straight line method over the estimated useful lives of the assets as follows:
|
Office equipment and furniture & fixtures |
|
5 years |
|
Computer equipment and software |
|
3 years |
|
Buildings |
|
30 years |
|
Leasehold improvements |
|
3 years |
|
Rental clocks |
|
5 years |
|
Vehicles |
|
3 years |
60
Our leasehold improvements are depreciated over the shorter of their estimated useful lives or the related lease terms. Costs incurred during construction of long-lived assets are recorded as construction in progress and are not depreciated until the asset is placed in service.
We capitalize interest incurred related to construction in progress. For the years ended December 31, 2015, 2014 and 2013, we incurred interest expenses of $1.3 million, $3.7 million and $9.0 million, respectively. For the years ended December 31, 2015, 2014 and 2013, interest expense of less than $0.1 million, $0.4 million and $0.1 million, respectively, was capitalized.
Internal Use Software
Expenditures for software purchases and software developed or obtained for internal use are capitalized and amortized over a three-year period on a straight-line basis. Capitalized costs include external direct costs of materials and services associated with developing or obtaining internal use computer software and certain payroll and payroll-related costs for employees who are directly associated with internal use computer software projects. The amount of payroll costs that are capitalized with respect to these employees is limited to the time directly spent on such projects. Costs associated with preliminary project stage activities, training, maintenance and all other post-implementation stage activities are expensed as incurred. We also expense internal costs related to minor upgrades and enhancements, as it is impractical to separate these costs from normal maintenance activities.
The total capitalized payroll costs related to internal use computer software projects was $4.3 million and $2.2 million as of December 31, 2015 and 2014, respectively, which have been included in property and equipment. Amortization expense related to capitalized software costs of $1.8 million, $0.9 million and $0.6 million was charged to expense for the years ended December 31, 2015, 2014 and 2013, respectively.
Goodwill and Other Intangible Assets
Goodwill is not amortized, but is instead tested for impairment annually, or earlier if, at the reporting unit level, an indicator of impairment arises. The estimates and assumptions about future results of operations and cash flows made in connection with the impairment testing could differ from future actual results of operations and cash flows. If impairment exists, a write-down to fair value is recorded. Our business is largely homogeneous and, as a result, goodwill is associated with one reporting unit. We have selected June 30 as our annual goodwill impairment testing date and determined there was no impairment as of June 30, 2015. For the years ended December 31, 2015, 2014 and 2013, there were no indicators of impairment. Intangible assets with finite lives are amortized on a straight-line basis over their estimated useful lives.
Impairment of Long-Lived Assets
Long-lived assets, including intangible assets with finite lives, are reviewed for impairment when events or changes in circumstances indicate that the carrying amount of an asset may not be recoverable. Recoverability of assets to be held and used is measured by a comparison of the carrying amount of an asset to estimated undiscounted future cash flows expected to be generated by the asset. If the carrying amount of an asset exceeds its estimated future cash flows, an impairment charge is recognized for the amount by which the carrying amount of the asset exceeds the estimated fair value of the asset. We have determined that there was no impairment of long-lived assets including intangible assets with finite lives, for the years ended December 31, 2015, 2014 and 2013.
Funds Held for Clients and Client Funds Obligation
As part of our payroll and tax filing application, we collect funds for federal, state and local employment taxes from clients, handle applicable regulatory tax filings, correspondence and amendments, remit the funds to appropriate tax agencies, and handle other employer-related services. Amounts collected by us from clients for their federal, state and local employment taxes earn interest during the interval between receipt and disbursement, as we invest these funds in demand deposits, money market funds and certificates of deposit. The interest earned from these investments is included in the consolidated statements of income as other income, net. These investments are shown in the consolidated balance sheets as funds held for clients, and the offsetting liability for the tax filings is shown as client funds obligation. The liability is recorded in the accompanying balance sheets at the time we obtain the funds from clients. The client funds obligation represents liabilities that will be repaid within one year of the balance sheet date.
As of December 31, 2015 and 2014, the funds held for clients were invested in demand deposits, short-term certificates of deposit and money market funds and classified as a current asset in the accompanying balance sheets as these funds are held solely to satisfy the client funds obligation.
61
Our total revenue is comprised of recurring revenues and implementation and other revenues. We recognize revenue in accordance with accounting standards for software and service companies when all of the following criteria have been met:
|
|
· |
There is persuasive evidence of an arrangement; |
|
|
· |
The service has been or is being provided to the client; |
|
|
· |
Collection of the fees is reasonably assured; and |
|
|
· |
The amount of fees to be paid by the client is fixed or determinable. |
Recurring
Recurring revenues are derived primarily from our talent acquisition, time and labor management, payroll, talent management and HR management applications as well as fees charged for delivery of client payroll checks and reports. Talent acquisition includes applicant tracking, candidate tracker, background checks, on-boarding, e-verify and tax credit services. Time and labor management includes time and attendance, scheduling/schedule exchange, time-off requests, labor allocation, labor management reports/push reporting and geofencing/geotracking. Payroll includes payroll and tax management, Paycom pay, expense management, garnishment management and GL Concierge. Talent management includes employee self-service, compensation budgeting, performance management, executive dashboard and Paycom learning. HR management includes document and task management, government and compliance, benefits administration, COBRA administration, personnel action forms, surveys and Enhanced ACA.
The services related to recurring revenues are rendered during each client’s payroll period, with the agreed-upon fee being charged and collected as part of our processing of the client’s payroll. Recurring revenues are recognized at the conclusion of processing of each client’s payroll-period, when each respective payroll client is billed. Collectability is reasonably assured as the fees are collected through an Automated Clearing House (“ACH”) as part of the client’s payroll cycle or through direct wire transfer, which minimizes the default risk.
Implementation and other
Implementation and other revenues represent non-refundable conversion fees which are charged to new clients to offset the expense of new client set-up and revenue from the sale of time clocks as part of our employee time and attendance services. Because these conversion fees and sale of time clocks relate to our recurring revenues, we have evaluated such arrangements under the accounting guidance that governs multiple element arrangements.
For arrangements with multiple elements, we evaluate whether each element represents a separate unit of accounting. In order to treat deliverables in a multiple element arrangement as separate units of accounting, the deliverables must have standalone value upon delivery. If the deliverables have stand-alone value upon delivery, we account for each deliverable separately and revenue is recognized for the respective deliverables as they are delivered. If one or more of the deliverables does not have stand-alone value upon delivery, the deliverables that do not have stand-alone value are generally combined with the final deliverable within the arrangement and treated as a single unit of accounting.
When multiple deliverables included in an arrangement are separable into different units of accounting, the arrangement consideration is allocated to the identified separate units of accounting based on their relative selling price. Multiple deliverable arrangements accounting guidance provides a hierarchy to use when determining the relative selling price for each unit of accounting. Vendor-specific objective evidence (“VSOE”) of selling price, based on the price at which the item is regularly sold by the vendor on a stand-alone basis, should be used if it exists. If VSOE of selling price is not available, third-party evidence (“TPE”) of selling price is used to establish the selling price if it exists, and if not it would be based on our best estimate of selling price.
For the years ended December 31, 2015, 2014 and 2013, we have determined that there is no stand-alone value associated with the upfront conversion fees as they do not have value to our clients on a stand-alone basis nor are they offered as an individual service; therefore, the conversion fees are deferred and recognized ratably over the estimated life of our clients, which we have estimated to be ten years.
For the years ended December 31, 2015, 2014, and 2013, we have determined that the revenues from the employee time and attendance services, and the revenues from the sale of time clocks as part of our time and attendance services, have VSOE of selling price as they are sold on a stand-alone basis. Revenue is therefore recognized for the respective deliverables as they are delivered.
62
Our costs and expenses applicable to total revenues represent total operating expenses and systems support and technology costs, including labor and related expenses, bank fees, shipping fees and costs of paper stock, envelopes, etc. In addition, costs included to derive gross margins are comprised of support labor and related expenses, related hardware costs and applicable depreciation and amortization costs.
Advertising Costs
Advertising costs are expensed the first time that advertising takes place. Advertising costs for the years ended December 31, 2015, 2014 and 2013 were $3.6 million, $4.2 million and $3.4 million, respectively.
Sales Taxes
We collect and remit sales tax on sales of time and attendance clocks and on payroll services in certain states. These taxes are shown on a net basis, and as such, excluded from revenue. For the years ended December 31, 2015, 2014 and 2013, sales taxes collected and remitted were $3.7 million, $3.0 million and $2.2 million, respectively.
Employee Stock-Based Compensation
Time-based stock compensation awards to employees are recognized pro rata over the applicable vesting period as compensation costs in the consolidated statements of income based on their fair values measured as of the date of grant. Market-based stock compensation awards to employees are recognized pro rata over the applicable estimated vesting period as compensation costs in the consolidated statements of income based on their fair value as of the date of the grant unless vesting occurs sooner at which time the remaining respective unrecognized compensation cost would be recognized.
Employee Stock Purchase Plan
An award issued under the Paycom Software, Inc. Employee Stock Purchase Plan (the “ESPP”) is classified as a share based liability and recorded at the fair value of the award. Expense is recognized, net of estimated forfeitures, on a straight line basis over the requisite service period.
Income Taxes
Our consolidated financial statements include a provision for income taxes incurred for the anticipated tax consequences of the reported results of operations using the asset and liability method. Under this method, we recognize deferred tax assets and liabilities for the expected future tax consequences of temporary differences between the financial reporting and tax basis of assets and liabilities, as well as for operating loss and tax credit carryforwards. Deferred tax assets and liabilities are measured using the tax rates that are expected to apply to taxable income for the years in which those tax assets and liabilities are expected to be realized or settled. We record a valuation allowance to reduce our deferred tax assets to the net amount that we believe is more likely than not to be realized.
Prior to the 2014 Reorganization, we operated under Holdings as a limited liability company (“LLC”) that was taxed as a partnership. Business income passed through the business to the LLC members, who reported their share of profits or losses on their respective income tax returns. As a result of the 2014 Reorganization, we are treated as a Subchapter C Corporation and, therefore, subject to both federal and state income taxes. Holdings continues to be recognized as a wholly owned partnership for income tax purposes. Accordingly, we recorded a one-time non-cash charge to equity of $0.2 million during the year ended December 31, 2014 for the amount of the deferred tax liability amount resulting from the exchange of common units, incentive units and Series B Preferred Units of Holdings for shares of common stock of Software as part of the 2014 Reorganization.
A portion of the transaction costs incurred in connection with our 2014 IPO were charged to equity. We recorded a one-time non-cash charge to equity of $0.7 million during the year ended December 31, 2014 for the amount of tax benefit resulting from such transaction costs.
63
We file income tax returns in the United States and various state jurisdictions. We evaluate tax positions taken or expected to be taken in the course of preparing our tax returns and disallow the recognition of tax positions not deemed to meet a “more-likely-than-not” threshold of being sustained by the applicable tax authority. We do not believe there are any tax positions taken within the consolidated financial statements that would not meet this threshold. Our policy is to record interest and penalties, if any, related to uncertain tax positions as a component of general and administrative expenses. We are not aware of any ongoing or potential examinations as of December 31, 2015. However, the tax years 2011 through 2015 remain open to examination for federal income tax purposes and by the other major taxing jurisdictions.
Recent Accounting Pronouncements
In May 2014, the Financial Accounting Standards Board (“FASB”) issued authoritative guidance which included a comprehensive new revenue recognition model that requires revenue to be recognized in a manner to depict the transfer of goods or services to a customer at an amount that reflects the consideration expected to be received in exchange for those goods or services. This guidance is effective for fiscal years, and interim periods within those years, beginning after December 15, 2016, and early adoption is not permitted. In April 2015, the FASB proposed a one year deferral of the effective date of the new revenue recognition standard for public and non-public entities reporting under U.S. GAAP and on July 9, 2015, the FASB approved the one year deferral. The effective date of the amended standard will begin in periods beginning after December 15, 2017. We are currently evaluating the impact that the standard will have on our consolidated financial statements.
In June 2014, the FASB issued authoritative guidance for share-based payments which requires that a performance target that affects vesting, and that could be achieved after the requisite service period, be treated as a performance condition. As such, the performance target should not be reflected in estimating the grant date fair value of the award. This update further clarifies that compensation cost should be recognized in the period in which it becomes probable that the performance target will be achieved and should represent the compensation cost attributable to the period(s) for which the requisite service has already been rendered. The new guidance is effective for fiscal years, and interim periods within those years, beginning after December 15, 2015. Accordingly, the standard is effective for us on January 1, 2016. We do not anticipate that the adoption of this standard will have a material impact on our consolidated financial statements.
In April 2015, the FASB issued authoritative guidance for intangibles related to internally developed software. The new guidance will assist entities in evaluating the accounting for fees paid by a customer in a cloud computing arrangement. The new guidance is effective for fiscal years, and interim periods within those years, beginning after December 15, 2015. Accordingly, the standard is effective for us on January 1, 2016. We do not anticipate that the adoption of this standard will have a material impact on our consolidated financial statements.
In April 2015, the FASB issued authoritative guidance which simplifies the presentation of debt issuance costs. Under the new guidance, debt issuance costs related to a recognized debt liability will be presented in the consolidated balance sheets as a direct deduction from the carrying amount of the debt liability. The new guidance is effective for public entities for fiscal years, and interim periods within those years, beginning after December 15, 2015. Accordingly, the standard is effective for us on January 1, 2016. We do not anticipate that the adoption of this standard will have a material impact on our consolidated financial statements. Debt issuance costs are currently included on the consolidated balance sheets as an asset.
In July 2015, the FASB issued authoritative guidance which simplifies the measurement of inventory. Under the new guidance, an entity should measure inventory (as defined within the scope of the guidance) at the lower of cost or net realizable value. The new guidance applies to all inventory except inventory measured using last-in, first-out (LIFO) or the retail inventory method. Net realizable value is defined as the estimated selling price in the ordinary course of business, less reasonably predicable costs of completion, disposal and transportation. The new guidance is effective for public companies for fiscal years beginning after December 15, 2016, including interim periods within those fiscal years. Accordingly, the standard is effective for us on January 1, 2017. We do not anticipate that the adoption of this standard will have a material impact on our consolidated financial statements.
In January 2016, the FASB issued authoritative guidance for the accounting for financial instruments. The amendments in this guidance require all equity investments to be measured at fair value with changes in the fair value recognized through net income (other than those accounted for under equity method of accounting or those that result in consolidation of the investee). The amendments in this guidance also require an entity to present separately in other comprehensive income the portion of the total change in the fair value of a liability resulting from a change in the instrument-specific credit risk when the entity has elected to measure the liability at fair value in accordance with the fair value option for financial instruments. In addition the amendments in this guidance eliminate the requirement to disclose the method(s) and significant assumptions used to estimate the fair value that is required to be disclosed for financial instruments measured at amortized cost on the balance sheet for public business entities. The new guidance is effective for us for fiscal years, and interim periods within those years, beginning after December 15, 2017 and early adoption is permitted. We are currently evaluating the impact that the standard will have on our consolidated financial statements.
64
|
3. |
PROPERTY AND EQUIPMENT |
Property and equipment and accumulated depreciation and amortization were as follows (dollars in thousands):
|
|
|
Year Ended December 31, |
|
|||||
|
|
|
2015 |
|
|
2014 |
|
||
|
Property and equipment |
|
|
|
|
|
|
|
|
|
Buildings |
|
$ |
28,154 |
|
|
$ |
28,154 |
|
|
Software and capitalized software costs |
|
|
13,959 |
|
|
|
8,671 |
|
|
Computer equipment |
|
|
11,346 |
|
|
|
7,638 |
|
|
Rental clocks |
|
|
8,750 |
|
|
|
6,596 |
|
|
Furniture, fixtures and equipment |
|
|
5,464 |
|
|
|
4,361 |
|
|
Vehicles |
|
|
421 |
|
|
|
421 |
|
|
Leasehold improvements |
|
|
358 |
|
|
|
174 |
|
|
|
|
|
68,452 |
|
|
|
56,015 |
|
|
Less: accumulated depreciation and amortization |
|
|
(24,894 |
) |
|
|
(17,089 |
) |
|
|
|
|
43,558 |
|
|
|
38,926 |
|
|
Land |
|
|
8,993 |
|
|
|
8,993 |
|
|
Construction in progress |
|
|
6,307 |
|
|
|
— |
|
|
Property and equipment, net |
|
$ |
58,858 |
|
|
$ |
47,919 |
|
Rental clocks included in property and equipment, net represent time clocks issued to clients under month-to-month operating leases. As such, these items are transferred from inventory to property and equipment and depreciated over their useful estimated lives.
Depreciation and amortization expense for property and equipment, net was $7.8 million, $5.5 million and $3.9 million for the years ended December 31, 2015, 2014 and 2013, respectively.
In 2015, we began the construction of a third building/processing center and additional parking at our headquarters. Included in the construction in progress balance at December 31, 2015, is $0.4 million in retainage.
|
4. |
GOODWILL AND INTANGIBLE ASSETS, NET |
We had goodwill of $51.9 million as of December 31, 2015 and 2014. We performed the required impairment tests of goodwill as of June 30 for the years ended December 31, 2015, 2014 and 2013 including an assessment of whether or not indicators of impairment were present and determined there was no impairment for each of those years then ended.
All of the intangible assets other than goodwill are considered to have finite lives and, as such, are subject to amortization. The components of intangible assets are as follows (dollars in thousands):
|
|
|
December 31, 2015 |
|
|||||||||||||
|
|
|
Weighted Average Remaining |
|
|
|
|
|
|
Accumulated |
|
|
|
|
|
||
|
|
|
Useful Life |
|
|
Gross |
|
|
Amortization |
|
|
Net |
|
||||
|
|
|
(Years) |
|
|
|
|
|
|
|
|
|
|
|
|
|
|
|
Intangibles: |
|
|
|
|
|
|
|
|
|
|
|
|
|
|
|
|
|
Customer relationships |
|
|
1.5 |
|
|
$ |
13,997 |
|
|
$ |
(11,897 |
) |
|
$ |
2,100 |
|
|
Trade name |
|
|
6.5 |
|
|
|
3,194 |
|
|
|
(1,810 |
) |
|
|
1,384 |
|
|
Total |
|
|
|
|
|
$ |
17,191 |
|
|
$ |
(13,707 |
) |
|
$ |
3,484 |
|
65
|
|
|
December 31, 2014 |
|
|||||||||||
|
|
|
Weighted Average Remaining |
|
|
|
|
|
Accumulated |
|
|
|
|
|
|
|
|
|
Useful Life |
|
Gross |
|
|
Amortization |
|
|
Net |
|
|||
|
|
|
(Years) |
|
|
|
|
|
|
|
|
|
|
|
|
|
Intangibles: |
|
|
|
|
|
|
|
|
|
|
|
|
|
|
|
Customer relationships |
|
2.5 |
|
$ |
13,997 |
|
|
$ |
(10,498 |
) |
|
$ |
3,499 |
|
|
Trade name |
|
7.5 |
|
|
3,194 |
|
|
|
(1,597 |
) |
|
|
1,597 |
|
|
Total |
|
|
|
$ |
17,191 |
|
|
$ |
(12,095 |
) |
|
$ |
5,096 |
|
The weighted average remaining useful life of the intangible assets was 3.5 years as of December 31, 2015. Amortization of intangible assets for each of the years ended December 31, 2015, 2014 and 2013 totaled $1.6 million.
Estimated amortization expense for our existing intangible assets for the next five years and thereafter is as follows (dollars in thousands):
|
Year Ending December 31, |
|
Amortization |
|
|
|
2016 |
|
$ |
1,613 |
|
|
2017 |
|
|
913 |
|
|
2018 |
|
|
213 |
|
|
2019 |
|
|
213 |
|
|
2020 |
|
|
213 |
|
|
Thereafter |
|
|
319 |
|
|
|
|
$ |
3,484 |
|
|
5. |
LONG-TERM DEBT |
Our long-term debt consisted of the following (dollars in thousands):
|
|
|
Year Ended December 31, |
|
|||||
|
|
|
2015 |
|
|
2014 |
|
||
|
Term note to bank due May 30, 2021 |
|
$ |
25,860 |
|
|
$ |
26,978 |
|
|
Total long-term debt (including current portion) |
|
|
25,860 |
|
|
|
26,978 |
|
|
Less: Current portion |
|
|
(886 |
) |
|
|
(855 |
) |
|
Total long-term debt |
|
$ |
24,974 |
|
|
$ |
26,123 |
|
As of December 31, 2015, our outstanding indebtedness consisted of a term note under the 2021 Consolidated Loan due to Kirkpatrick Bank (the “2021 Consolidated Loan”) with an outstanding principal balance of $25.9 million and $27.0 million as of December 31, 2015 and 2014, respectively. The 2021 Consolidated Loan matures on May 30, 2021. Under the 2021 Consolidated Loan, interest is payable monthly and accrues at a fixed rate of 4.75% per annum. The 2021 Consolidated Loan is secured by a mortgage covering our headquarters and certain personal property relating to our headquarters.
The 2021 Consolidated Loan includes certain financial covenants, including maintaining a fixed charge coverage ratio of earnings before interest, taxes and depreciation (“EBITDA”) to fixed charges (defined as current maturities of long-term debt, interest expense, rent expense and distributions), of greater than 1.2 to 1.0, which is measured on a quarterly basis. We were in compliance with all of the covenants as of December 31, 2015.
On May 13, 2015, we entered into a loan agreement with Kirkpatrick Bank to finance the expansion of our headquarters (the “Construction Loan”). The Construction Loan allows for the borrowing of a maximum aggregate principal amount equal to the lesser of (i) $11.0 million or (ii) 80% of the appraised value of the constructed property. We did not have any outstanding borrowings under the Construction Loan as of December 31, 2015. The Construction Loan matures on the earlier of the completion of construction or November 13, 2016, with variable interest accruing at the greater of (i) the prime rate, plus 50 basis points or (ii) 4.0%. At maturity, the outstanding principal balance of the Construction Loan, if any, will be automatically converted to a 78-month term loan. The term loan will accrue fixed interest at the prevailing 7/20 London Interbank Offered Rate swap interest rate that is in effect as of the commencement date, plus 225 basis points.
66
As of December 31, 2015, the carrying value of our total long-term debt, including current portion, was $25.9 million, which approximated its fair value. As of December 31, 2014, the carrying value of our total long-term debt, including current portion, was $27.0 million, which approximated its fair value. The fair value of fixed rate long-term debt is estimated based on the borrowing rates currently available to us for bank loans with similar terms and maturities.
During 2014, upon the payoff of the 10% Senior Note due to WCAS Capital IV (the “2022 Note”), we also wrote off the associated derivative liability and unamortized discount. The fair value of the derivative liability was $0.5 million and the unamortized discount was $4.1 million at the time of the repayment.
Aggregate future maturities of long-term debt for the next five years and thereafter (including current portion) as of December 31, 2015 are as follows (dollars in thousands):
|
Year Ending December 31, |
|
|
|
|
|
2016 |
|
$ |
886 |
|
|
2017 |
|
|
933 |
|
|
2018 |
|
|
979 |
|
|
2019 |
|
|
1,027 |
|
|
2020 |
|
|
1,075 |
|
|
Thereafter |
|
|
20,960 |
|
|
|
|
$ |
25,860 |
|
|
6. |
EMPLOYEE SAVINGS PLAN AND EMPLOYEE STOCK PURCHASE PLAN |
Our employees that are over the age of 21 and have completed ninety (90) days of service are eligible to participate in our 401(k) plan. We have made a Qualified Automatic Contribution Arrangement (“QACA”) election, whereby we make a matching contribution for our employees equal to 100% of the first 1% of salary deferrals and 50% of salary deferrals between 2% and 6%, up to a maximum matching contribution of 3.5% of salary each plan year. We are allowed to make additional discretionary matching contributions and discretionary profit sharing contributions. Employees are 100% vested in amounts attributable to salary deferrals and rollover contributions. The QACA matching contributions will be 100% vested after two years of employment from the date of hire. If an employee terminates service prior to completing two years of employment, the employee will not be vested in these QACA matching contributions. The discretionary contributions vest 100% after two years of employment from the date of hire. Matching contributions amounted to $2.4 million, $1.7 million and $1.2 million for the years ended December 31, 2015, 2014 and 2013, respectively.
On May 5, 2015, our stockholders approved the Paycom Software, Inc. Employee Stock Purchase Plan (the “ESPP”). The ESPP allows, at the beginning of each offering period, eligible employees to elect to contribute, through payroll deductions, up to 10% of their compensation, subject to an annual per employee maximum, to purchase shares of the Company’s common stock at a price of 85% of the fair market value of the shares on the exercise date. Each offering period of the ESPP lasts six months and the maximum number of shares that may be acquired by a participant during each offering period is 2,000 shares. The shares reserved for purposes of the ESPP are shares we purchase in the open market. The maximum number of shares of the Company’s common stock that may be acquired by participants under the ESPP is 2,000,000 shares. During the year ended December 31, 2015, eligible employees purchased 44,034 shares of the Company’s common stock under the ESPP. Compensation expense related to the ESPP is recognized on a straight-line basis over the requisite service period. Our compensation expense related to the ESPP was $0.4 million for the year ended December 31, 2015. There was no compensation expense related to the ESPP for the years ended December 31, 2014 and 2013.
|
7. |
FAIR VALUE OF FINANCIAL INSTRUMENTS |
Our financial instruments consist primarily of cash and cash equivalents, accounts receivable, accounts payable, funds held for clients, client funds obligation and long-term debt. The carrying amount of cash and cash equivalents, accounts receivable, accounts payable, funds held for clients and client fund obligation approximates fair value because of the short-term nature of the instruments.
We measure certain financial assets and liabilities at fair value at each reporting period. Fair value is a market-based measurement that should be determined based on assumptions that market participants would use in pricing an asset or liability. A financial instrument’s classification within the fair value hierarchy is based upon the lowest level of input that is significant to the fair value measurement. Three levels of inputs may be used to measure fair value are as follow:
Level 1—Unadjusted observable inputs that reflect quoted prices in active markets
67
Level 2—Input other than quoted prices in active markets that are directly or indirectly observable
Level 3—Unobservable inputs that are supported by little or no market activity
We use observable data, when available. During the years ended December 31, 2014 and 2013, we did not have any transfers between level 1, 2 or 3 in the three-tier fair value hierarchy.
The derivative liability related to long-term debt to related parties was classified as a Level 3 derivative due to valuation based upon significant unobservable inputs.
The key inputs used to calculate the fair value of the embedded derivative are: probability of exit, remaining term, yield volatility, credit spread, and risk-free rate. In general, increases in the probability of exit, credit spread, and risk-free rate would increase the value of the embedded derivative. Conversely, increases in the remaining term and yield volatility would decrease the value of the embedded derivative.
We did not have any financial instruments that are measured on a recurring basis for the years ended December 31, 2015 or 2014. Quantitative information regarding significant unobservable inputs used for recurring Level 3 fair value measurements of financial instruments as of December 31, 2013 were as follows:
|
|
|
|
|
December 31, 2013 |
|
|
|
|
|
|
|
Valuation Technique |
|
Key Inputs |
|
Range |
|
|
|
Derivative Liability |
|
Lattice Model |
|
Probability of exit |
|
|
90% |
|
|
|
|
|
|
Remaining term |
|
0.8 years - 8.3 years |
|
|
|
|
|
|
|
Yield Volatility |
|
21.4% - 31.1% |
|
|
|
|
|
|
|
Credit Spread |
|
|
8.90% |
|
|
|
|
|
|
Risk-free rate |
|
0.13% - 2.45% |
|
|
The following table summarizes the change in fair value of our Level 3 financial instruments for the years ended December 31, 2015, 2014 and 2013 (dollars in thousands).
|
|
|
2015 |
|
|
2014 |
|
|
2013 |
|
|||
|
Balance, beginning of year |
|
$ |
— |
|
|
$ |
1,107 |
|
|
$ |
1,767 |
|
|
Issuances |
|
|
— |
|
|
|
— |
|
|
|
— |
|
|
Change in fair value of derivative liability |
|
|
— |
|
|
|
(635 |
) |
|
|
(660 |
) |
|
Gain on the extinguishment of derivative liability |
|
|
— |
|
|
|
(472 |
) |
|
|
— |
|
|
Balance, end of year |
|
$ |
— |
|
|
$ |
— |
|
|
$ |
1,107 |
|
Total change of the derivative liability recognized as other income, net in the consolidated statements of income was $1.1 million and $0.7 million for the years ended December 31, 2014 and 2013, respectively.
|
8. |
EARNINGS PER SHARE |
Basic earnings per share (“EPS”) is based on the weighted average number of shares of common stock outstanding for the period. Diluted EPS is computed in a similar manner to basic EPS after assuming the issuance of shares of common stock for all potentially dilutive shares of restricted stock whether or not they are vested.
In accordance with ASC Topic 260 “Earnings Per Share”, the two-class method determines earnings for each class of common stock and participating securities according to an earnings allocation formula that adjusts the income available to common stockholders for dividends or dividend equivalents and participation rights in undistributed earnings. Unvested share-based payment awards that contain non-forfeitable rights to dividends or dividend equivalents are participating securities and, therefore, are included in computing earnings per share pursuant to the two-class method. The outstanding restricted shares of stock that were issued on July 8, 2015, are considered participating securities.
Under the 2014 Reorganization, all the outstanding common units, Series B Preferred Units and incentive units of Holdings were exchanged for, or converted into, an aggregate of 45,708,573 shares of our common stock and 8,121,101 shares of our restricted stock as of January 1, 2014.
68
The following is a reconciliation of net income and the shares of common stock used in the computation of basic and diluted net earnings per share (dollars in thousands, except share amounts):
|
|
|
Year Ended December 31, |
|
|||||||||
|
|
|
2015 |
|
|
2014 |
|
|
2013 |
|
|||
|
Numerator: |
|
|
|
|
|
|
|
|
|
|
|
|
|
Net income |
|
$ |
20,945 |
|
|
$ |
5,663 |
|
|
$ |
607 |
|
|
Less: net loss attributable to the noncontrolling interest |
|
|
— |
|
|
|
— |
|
|
|
(6 |
) |
|
Less: income allocable to participating securities |
|
|
(270 |
) |
|
|
— |
|
|
|
— |
|
|
Income allocable to common shares |
|
$ |
20,675 |
|
|
$ |
5,663 |
|
|
$ |
601 |
|
|
Add back: undistributed earnings allocable to participating securities |
|
|
270 |
|
|
|
— |
|
|
|
— |
|
|
Less: undistributed earnings reallocated to participating securities |
|
|
(264 |
) |
|
|
— |
|
|
|
— |
|
|
Numerator for diluted earnings per share |
|
$ |
20,681 |
|
|
$ |
5,663 |
|
|
$ |
601 |
|
|
Denominator: |
|
|
|
|
|
|
|
|
|
|
|
|
|
Weighted average common shares outstanding |
|
|
50,315,455 |
|
|
|
49,002,809 |
|
|
|
44,560,053 |
|
|
Adjustment for vested restricted stock |
|
|
6,179,715 |
|
|
|
781,345 |
|
|
|
916,842 |
|
|
Shares for calculating basic EPS |
|
|
56,495,170 |
|
|
|
49,784,154 |
|
|
|
45,476,895 |
|
|
Dilutive effect of unvested restricted stock |
|
|
1,424,530 |
|
|
|
2,073,155 |
|
|
|
2,585,180 |
|
|
Shares for calculating diluted EPS |
|
|
57,919,700 |
|
|
|
51,857,309 |
|
|
|
48,062,075 |
|
|
Net income per share: |
|
|
|
|
|
|
|
|
|
|
|
|
|
Basic |
|
$ |
0.37 |
|
|
$ |
0.11 |
|
|
$ |
0.01 |
|
|
Diluted |
|
$ |
0.36 |
|
|
$ |
0.11 |
|
|
$ |
0.01 |
|
Pro forma net income per share (UNAUDITED)
In connection with the 2014 Reorganization, we became subject to taxation as a Subchapter C Corporation, effective January 1, 2014. The pro forma net income applied in computing the pro forma EPS for the year ended December 31, 2013 was based on (i) our historical net income as adjusted to reflect our conversion to a Subchapter C Corporation as if it had occurred as of January 1, 2012 and (ii) the pro forma tax expense associated with CP IV Blocker. The pro forma net income includes an adjustment to income tax expense, the amount of which was determined at an effective tax rate of 47% which resulted in an incremental pro forma income tax benefit of $0.1 million for the year ended December 31, 2013. See Note 12 for more information about pro forma income taxes.
There was no pro forma tax expense (benefit) for the years ended December 31, 2015 or 2014. The following is a reconciliation of pro forma net income for the year ended December 31, 2013 and the shares of stock used in the computation of pro forma basic and diluted net income per share (dollars in thousands, except share amounts).
|
|
|
|
|
|
|
|
|
Year Ended December 31, 2013 |
|
|
|
|
|
|
|
|
|
Unaudited pro forma numerator: |
|
|
|
|
|
Net income attributable to the Company |
|
$ |
601 |
|
|
Unaudited pro forma additional income tax benefit |
|
|
(137 |
) |
|
Unaudited pro forma net income attributable to the Company |
|
$ |
738 |
|
|
Unaudited pro forma denominator: |
|
|
|
|
|
Unaudited pro forma weighted average shares outstanding |
|
|
44,560,053 |
|
|
Adjustment for vested restricted stock |
|
|
916,842 |
|
|
Pro forma shares for calculating basic EPS |
|
|
45,476,895 |
|
|
Unaudited pro forma weighted average shares outstanding |
|
|
44,560,053 |
|
|
Adjustment for vested restricted stock |
|
|
916,842 |
|
|
Effect of dilutive restricted stock |
|
|
2,585,180 |
|
|
Pro forma shares for calculating diluted EPS |
|
|
48,062,075 |
|
|
Unaudited pro forma net income per share: |
|
|
|
|
|
Basic |
|
$ |
0.02 |
|
|
Diluted |
|
$ |
0.02 |
|
69
|
9. |
STOCKHOLDERS’ EQUITY AND STOCK-BASED COMPENSATION |
On January 1, 2014, we consummated the 2014 Reorganization, pursuant to which (i) affiliates of WCAS contributed WCAS Holdings and CP IV Blocker, which collectively owned all of the Series A Preferred Units of Holdings, to Software in exchange for shares of common stock of Software and (ii) the owners of outstanding Series B Preferred Units of Holdings contributed their Series B Preferred Units of Holdings to Software in exchange for shares of common stock of Software. Immediately after these contributions, Merger Sub merged with and into Holdings with Holdings surviving the merger. Upon consummation of the merger, the remaining holders of outstanding common and incentive units of Holdings received shares of common and restricted stock of Software for their common and incentive units by operation of Delaware law and Holdings’ ownership interest in Software was cancelled. Outstanding common units, Series B Preferred Units and WCAS Holdings and CP IV Blocker were contributed to Software in exchange for, or converted into, an aggregate of 45,708,573 shares of common stock and 8,121,101 shares of restricted stock of Software.
Following these transactions, all outstanding Series C Preferred Units were eliminated in an intercompany transaction between Holdings and WCAS Holdings, and we assumed the 2017 Note. As a result of the 2014 Reorganization, we recorded a one-time reclassification of $29.3 million of accumulated deficit to additional paid in capital on January 1, 2014. Following the 2014 Reorganization, Software became a holding company with its principal assets being the Series B Preferred Units of Holdings and the outstanding capital stock of WCAS Holdings and CP IV Blocker.
In conjunction with the 2014 Reorganization, unvested incentive units of Holdings were converted to shares of restricted stock of Software at various conversion ratios that ranged from 1:24 to 1:47. The conversion to restricted stock was determined based on the underlying conditions of the pre-conversion incentive units. The conversion to the grant-date fair values of restricted stock granted was determined by applying the applicable conversion ratio to the respective original grant-date fair value of incentive units granted. The following table presents a summary of the pre-conversion grant-date fair values of incentive units granted during 2013 and the related assumptions:
|
|
|
Year Ended December 31, 2013 |
|
|
|
Grant-date fair value |
|
|
|
|
|
Incentive units (converted to restricted stock as of January 1, 2014) |
|
$0.11 - $0.92 |
|
|
|
Risk-free interest rates (based on 5 year U.S. Treasury Securities) |
|
0.71% - 1.41% |
|
|
|
Estimated volatility |
|
|
50.0% |
|
|
Expected life (in years) |
|
|
5.0 |
|
|
Dividend yield |
|
0% |
|
|
Other than the shares of restricted stock issued in exchange for incentive units in connection with the 2014 Reorganization (“2014 Restricted Stock”), there were no new grants made during the year ended December 31, 2014. We did not receive any cash proceeds from the issuance of our restricted stock upon conversion of incentive units.
The shares of 2014 Restricted Stock were issued under the Paycom Software, Inc. 2014 Long-Term Incentive Plan (the “LTIP”) and were subject to either time-based vesting conditions or market-based vesting conditions. The market-based vesting conditions were based on our total enterprise value exceeding certain specified thresholds. Compensation expense related to the issuance of 2014 Restricted Stock with time-based vesting conditions was measured based on the fair value of the award on the grant date and recognized over the requisite service period on a straight-line basis. Compensation expense relating to the issuance of 2014 Restricted Stock with market-based vesting conditions was measured based upon the fair value of the award on the grant date and recognized on a straight-line basis over the vesting period based upon the probability that the vesting conditions would be met. For 2014 Restricted Stock with market-based vesting conditions, 50% of the restricted stock vested upon reaching a total enterprise value of $1.4 billion on December 1, 2014 and the associated compensation expense, net of actual forfeitures, was $0.3 million. Total net compensation expense for the year ended December 31, 2014 was $0.7 million. The remaining 50% of the market-based restricted stock vested upon reaching a total enterprise value of $1.8 billion on March 2, 2015. Compensation expense, net of actual forfeitures, was $0.2 million for the year ended December 31, 2015 for the vesting of the 2014 Restricted Stock with market-based vesting conditions on March 2, 2015. The total net compensation expense for the vesting of 2014 Restricted Stock was $0.4 million for the year ended December 31, 2015.
With respect to 2014 Restricted Stock, there was $0.3 million and $0.7 million of total unrecognized compensation cost related to unvested time-based restricted stock outstanding as of December 31, 2015 and 2014, respectively. The unrecognized compensation cost is expected to be recognized over a weighted average period of 1.9 years as of December 31, 2015.
On July 8, 2015, we issued an aggregate of 741,931 shares of restricted stock to each of our executive officers and certain non-executive employees (“2015 Restricted Stock”) under the LTIP, of which 477,200 shares are subject to market-based vesting
70
conditions and 264,731 shares are subject to time-based vesting conditions. The fair value of each share of 2015 Restricted Stock with market-based vesting conditions is estimated on the grant date using a Monte Carlo simulation model. This model considers a range of assumptions related to volatility, risk-free interest rate, expected life and expected dividend yield. Expected volatilities used in the model are based on historical volatilities of comparable guideline companies until a sufficient trading history in our common stock exists. We are required to estimate forfeitures and only record compensation costs for those awards that are expected to vest. The following table presents a summary of the grant-date fair values of 2015 Restricted Stock granted during the year ended December 31, 2015 and the related assumptions:
|
Years Ended December 31, |
|
2015 |
|
|
|
Grant-date fair value |
|
|
|
|
|
Restricted stock |
|
$21.76 - $33.33 |
|
|
|
Risk-free interest rate (based on 10 year U.S. Treasury Securities) |
|
|
2% |
|
|
Estimated volatility |
|
|
26.0% |
|
|
Expected life (in years) |
|
|
3.6 |
|
|
Dividend yield |
|
0% |
|
|
Shares of 2015 Restricted Stock with market-based vesting conditions will vest 50% when we reach a total enterprise value of $2.65 billion and 50% when we reach a total enterprise value of $3.5 billion. Shares of 2015 Restricted Stock with time-based vesting conditions will vest over periods of three or five years. Compensation expense for 2015 Restricted Stock awards with time-based vesting conditions was measured based on the fair value of the underlying shares of restricted stock on the grant date (which was equal to the closing price of our common stock of $33.33 on the grant date) and will be recognized over the requisite service periods on a straight-line basis. Compensation expense for 2015 Restricted Stock awards with market-based vesting conditions was measured based on the fair value of the underlying shares of restricted stock on the grant date, which was $21.76 or $27.24 depending on the enterprise value target. Compensation expense for 2015 Restricted Stock with market-based vesting conditions will be recognized on a straight-line basis over the requisite service period of 2.3 to 4.2 years. Our compensation expense related to 2015 Restricted Stock was $2.6 million for the year ended December 31, 2015. With respect to 2015 Restricted Stock, there was $16.1 million of unrecognized compensation cost, net of estimated forfeitures, related to unvested restricted stock outstanding as of December 31, 2015. The unrecognized compensation cost is expected to be recognized over a weighted average period of 2.1 years as of December 31, 2015. At December 31, 2015, there were 2,566,623 shares authorized for future issuance under the LTIP.
The capitalized stock-based compensation expense related to software developed for internal use of $0.2 million and $4 thousand for the years ended December 31, 2015 and 2014, respectively, was included in software and capitalized software costs in “Property and equipment, net” in our consolidated balance sheets as of December 31, 2015 and 2014.
The following table presents stock-based compensation expense resulting from employee incentive stock arrangements and is presented in the following line items in the accompanying consolidated statements of income for the years ended December 31, 2015, 2014 and 2013 (in thousands):
|
Years Ended December 31, |
|
2015 |
|
|
2014 |
|
|
2013 |
|
|||
|
Operating expense |
|
$ |
235 |
|
|
$ |
32 |
|
|
$ |
222 |
|
|
Sales and marketing |
|
|
559 |
|
|
166 |
|
|
114 |
|
||
|
Research and development |
|
|
104 |
|
|
16 |
|
|
345 |
|
||
|
General and administrative |
|
|
2,112 |
|
|
498 |
|
|
253 |
|
||
|
Total stock-based compensation expense |
|
$ |
3,010 |
|
|
$ |
712 |
|
|
$ |
934 |
|
The following table presents a summary of the activity related to restricted stock for the year ended December 31, 2015:
|
Year ended December 31, 2015 |
|
|
|
Number of shares |
|
|
Weighted average grant- date fair value (in dollars) |
|
||
|
Restricted stock outstanding at January 1, 2015 |
|
|
|
|
4,540,020 |
|
|
$ |
0.24 |
|
|
2015 Restricted Stock granted |
|
|
|
|
741,931 |
|
|
|
27.65 |
|
|
2014 Restricted Stock vested |
|
|
|
|
(3,287,091 |
) |
|
|
0.20 |
|
|
2014 Restricted Stock forfeited |
|
|
|
|
(7,215 |
) |
|
|
0.48 |
|
|
2015 Restricted Stock forfeited |
|
|
|
|
(7,805 |
) |
|
|
30.95 |
|
|
Restricted stock outstanding at December 31, 2015 |
|
|
|
|
1,979,840 |
|
|
|
10.45 |
|
71
|
10. |
RELATED-PARTY TRANSACTIONS |
We paid rent on our Dallas office space in the amounts of $0.4 million, $0.3 million and $0.3 million for the years ended December 31, 2015, 2014 and 2013, respectively. The Dallas office building is owned by 417 Oakbend, LP, a Texas limited partnership. Our Chief Sales Officer owns a .01% general partnership interest and a 10.49% limited partnership interest in 417 Oakbend, LP.
We incurred $1.4 million of registration and legal fees in connection with the underwritten secondary offerings in 2015 (excluding the follow-on offering conducted in January 2015), which were charged to general and administrative expense. The payment of such fees included expenses on behalf of related parties and was approved by the Company’s Audit Committee.
In November 2013 and December 2012, we purchased approximately 18.3 acres and 17.6 acres of land, respectively, for future expansion at our corporate headquarters. The land was purchased from Kilpatrick Partners, L.L.C., for a total cost of $4.8 million and $2.3 million, respectively. The manager of Kilpatrick Partners, L.L.C. is our President and Chief Executive Officer.
In connection with the April 2012 Corporate Reorganization, we entered into the 2022 Note with WCAS Capital IV, a related party. The 2022 Note was due on April 3, 2022 and interest was payable at an annual rate of 10%, payable semiannually in arrears on December 31 and June 30 of each year. The balance of the note was repaid with proceeds from our IPO and existing cash.
In April 2014, we paid off the balance of the 2017 Note that was issued by WCAS Holdings and was payable to WCAS X, a related party, with proceeds from our IPO and from existing cash.
We entered into a Limited Liability Company Unit Redemption Agreement, effective as of January 26, 2013, pursuant to which we purchased 2,605 incentive units from John Kerber at a purchase price of $260.21 per unit, which price was based on a third party appraisal and an internal appraisal. The incentive units were purchased from John Kerber for an aggregate purchase price of approximately $0.7 million. John Kerber is one of our former employees and the brother of William X. Kerber III, our Chief Information Officer.
|
11. |
COMMITMENTS AND CONTINGENCIES |
Employment Agreements
We have employment agreements with certain of our executive officers. The agreements allow for annual compensation, participation in executive benefit plans, and performance-based cash bonuses.
Incentive Plan
On May 5, 2015, our stockholders approved the Paycom Software, Inc. Annual Incentive Plan (the “Incentive Plan”). The Incentive Plan provides for payment of incentive compensation that is not subject to certain federal income tax deduction limitations. Participation in the Incentive Plan is limited to certain of our employees designated by the Compensation Committee of the Board of Directors.
Funding Agreement
In March 2010, we entered into a funding agreement with the Oklahoma City Economic Development Trust (the “Trust”) and the city of Oklahoma City. The Trust provided $2.0 million worth of certain public infrastructure improvements related to our newly constructed principal executive offices in northwest Oklahoma City. In exchange for the infrastructure improvements provided, we agreed to create at least 492 jobs over a five year period, with an average first year salary in excess of $37,000 and make a minimum capital investment in the project of at least $15 million. We further agreed that we would be responsible for repayment of any amount that was not offset by earned job creation payments. As of December 31, 2014, we had fulfilled our obligation for the job creation payments.
Legal Proceedings
On September 23, 2014, National Financial Partners Corp. (“NFP”) filed a complaint against us in the United States District Court for the Northern District of Illinois (the “District Court”) (Civil Action No. 1:14-cv-07424). The complaint alleged trademark infringement, unfair competition, deceptive trade practices, consumer fraud and deceptive business practices related to the adoption and use of our logo and sought preliminary and permanent injunctions prohibiting us from using our logo as well as money damages, including an accounting for sales and profits, attorneys’ fees and disgorgement of profits. On June 25, 2015, we filed an offer of
72
judgment seeking to resolve all pending claims between the parties and terminate the action with the payment of $20,000 by Paycom Payroll, LLC and an agreement to change our logo within 60 days. Our offer of judgment was accepted by NFP and the District Court entered a judgment pursuant to the offer of judgment on July 6, 2015, terminating the District Court action.
We are involved in various other legal proceedings in the ordinary course of business. Although we cannot predict the outcome of these proceedings, legal matters are subject to inherent uncertainties and there exists the possibility that the ultimate resolution of these matters could have a material adverse effect on our business, financial condition, results of operations and cash flows.
Operating Leases and Deferred Rent
We lease office space under several noncancellable operating leases with contractual terms expiring from 2016 to 2021. Minimum rent expenses are recognized over the lease term. The lease term is defined as the fixed noncancellable term of the lease plus all periods, if any, for which failure to renew the lease imposes a penalty on us in an amount that a renewal appears, at the inception of the lease, to be reasonably assured. When a lease contains a predetermined fixed escalation of the minimum rent, we recognize the related rent expense on a straight-line basis and record the difference between the recognized rent expense and the amount payable under the lease as a liability. As of December 31, 2015 and 2014, we had $0.8 million recorded as a liability for deferred rent.
Future annual minimum lease payments under noncancellable operating leases with initial or remaining terms of one year or more as of December 31, 2015 were as follows (in thousands):
|
Year Ending December 31, |
|
|
|
|
|
2016 |
|
$ |
5,278 |
|
|
2017 |
|
|
5,097 |
|
|
2018 |
|
|
4,533 |
|
|
2019 |
|
|
3,586 |
|
|
2020 |
|
|
1,545 |
|
|
Thereafter |
|
|
274 |
|
|
Total minimum lease payments |
|
$ |
20,313 |
|
Rent expense under operating leases for the years ended December 31, 2015, 2014 and 2013 was $4.4 million, $3.4 million and $2.0 million, respectively.
|
12. |
INCOME TAXES |
The items comprising income tax expense are as follows (in thousands):
|
|
|
Year Ended December 31, |
|
|||||||||
|
|
|
2015 |
|
|
2014 |
|
|
2013 |
|
|||
|
Provision for current income taxes |
|
|
|
|
|
|
|
|
|
|
|
|
|
Federal |
|
$ |
11,308 |
|
|
$ |
1,330 |
|
|
$ |
— |
|
|
State |
|
|
2,292 |
|
|
|
388 |
|
|
|
275 |
|
|
Total provision for current income taxes |
|
|
13,600 |
|
|
|
1,718 |
|
|
|
275 |
|
|
Provision for deferred income taxes, net |
|
|
|
|
|
|
|
|
|
|
|
|
|
Federal |
|
|
(1,109 |
) |
|
|
2,114 |
|
|
|
347 |
|
|
State |
|
|
89 |
|
|
|
161 |
|
|
|
170 |
|
|
Total provision for deferred income taxes, net |
|
|
(1,020 |
) |
|
|
2,275 |
|
|
|
517 |
|
|
Total provision for income taxes |
|
$ |
12,580 |
|
|
$ |
3,993 |
|
|
$ |
792 |
|
73
The following schedule reconciles the statutory Federal tax rate to the effective income tax rate:
|
|
|
Year Ended December 31, |
|
|||||||||
|
|
|
2015 |
|
|
2014 |
|
|
2013 |
|
|||
|
Federal statutory tax rate |
|
|
35 |
% |
|
|
34 |
% |
|
|
34 |
% |
|
Increase(decrease) resulting from: |
|
|
|
|
|
|
|
|
|
|
|
|
|
Earnings excluded from Federal tax |
|
|
0 |
% |
|
0 |
% |
|
|
(14 |
%) |
|
|
State income taxes, net of Federal income tax benefit |
|
|
4 |
% |
|
|
4 |
% |
|
|
29 |
% |
|
Nondeductible expenses |
|
|
3 |
% |
|
|
4 |
% |
|
|
4 |
% |
|
Research credit, Federal benefit |
|
|
(1 |
%) |
|
|
0 |
% |
|
|
0 |
% |
|
Section 199 - Qualified production activities |
|
|
(3 |
%) |
|
|
0 |
% |
|
|
0 |
% |
|
Other |
|
|
0 |
% |
|
|
(1 |
%) |
|
|
3 |
% |
|
Effective income tax rate |
|
|
38 |
% |
|
|
41 |
% |
|
|
56 |
% |
Deferred income taxes reflect the net tax effects of temporary differences between the carrying amounts of assets and liabilities for financial reporting purposes and the amounts used for income tax purposes. The significant components of our deferred tax assets and liabilities were as follows (dollars in thousands):
|
|
|
Year Ended December 31, |
|
|||||
|
|
|
2015 |
|
|
2014 |
|
||
|
Deferred income tax assets (liabilities): |
|
|
|
|
|
|
|
|
|
Net operating losses |
|
$ |
— |
|
|
$ |
1,381 |
|
|
Federal tax credits |
|
|
— |
|
|
|
64 |
|
|
Stock-based compensation |
|
|
1,035 |
|
|
|
— |
|
|
Investment in Paycom Payroll Holdings, LLC |
|
|
(1,676 |
) |
|
|
(3,107 |
) |
|
Noncurrent deferred income tax liabilities, net |
|
$ |
(641 |
) |
|
$ |
(1,662 |
) |
In November 2015, the FASB issued ASU 2015-17 which we elected to early adopt on a retrospective basis. Previous to the issuance of ASU 2015-17, GAAP required an entity to separate deferred income tax assets and liabilities into current and noncurrent amounts. To simplify the presentation of deferred income taxes, this guidance requires that deferred tax assets and liabilities be classified as noncurrent.
At December 31, 2015, we had no net operating loss carryforwards.
At December 31, 2015 and 2014, we had no material unrecognized tax benefits related to uncertain tax positions.
We file income tax returns with the United States federal government and various state jurisdictions. With few exceptions, we are no longer subject to U.S federal tax examinations by tax authorities for years prior to 2012 or state and local examinations by tax authorities for years prior to 2011.
Pro Forma Income Tax Expense
In connection with the 2014 Reorganization, we became subject to taxation as a Subchapter C Corporation, effective January 1, 2014. As we were a Subchapter C Corporation during both 2015 and 2014, there is no pro forma income tax expense associated with the years ended December 31, 2015 or 2014. The pro forma net income applied in computing the pro forma EPS for the year ended December 31, 2013 was based on our historical net income as adjusted to reflect (i) our conversion to a Subchapter C Corporation as if it had occurred as of January 1, 2011 and (ii) the pro forma tax associated with CP IV Blocker. The pro forma net income includes an adjustment to income tax expense, the amount of which was determined at an effective income tax rate of 47% for the year ended December 31, 2013. This resulted in an incremental pro forma income tax benefit of $(0.1) million for the year ended December 31, 2013.
74
The following tables set forth selected quarterly statements of income data for the periods indicated (dollars in thousands, except share and per share amounts):
|
|
|
Quarter Ended |
|
|||||||||||||
|
|
|
December 31, 2015 |
|
|
September 30, 2015 |
|
|
June 30, 2015 |
|
|
March 31, 2015 |
|
||||
|
Revenues |
|
$ |
65,118 |
|
|
$ |
55,340 |
|
|
$ |
48,973 |
|
|
$ |
55,222 |
|
|
Operating income |
|
|
6,234 |
|
|
|
6,855 |
|
|
|
10,808 |
|
|
|
10,538 |
|
|
Net income |
|
|
5,157 |
|
|
|
3,847 |
|
|
|
5,946 |
|
|
|
5,995 |
|
|
Net income per share, basic |
|
$ |
0.09 |
|
|
$ |
0.07 |
|
|
$ |
0.10 |
|
|
$ |
0.11 |
|
|
Net income per share, diluted |
|
$ |
0.09 |
|
|
$ |
0.07 |
|
|
$ |
0.10 |
|
|
$ |
0.11 |
|
|
Weighted average shares outstanding: |
|
|
|
|
|
|
|
|
|
|
|
|
|
|
|
|
|
Basic |
|
|
57,109,987 |
|
|
|
57,050,684 |
|
|
|
57,038,021 |
|
|
|
54,749,951 |
|
|
Diluted |
|
|
58,365,587 |
|
|
|
58,367,830 |
|
|
|
58,369,083 |
|
|
|
56,562,661 |
|
|
|
|
Quarter Ended |
|
|||||||||||||
|
|
|
December 31, 2014 |
|
|
September 30, 2014 |
|
|
June 30, 2014 |
|
|
March 31, 2014 |
|
||||
|
Revenues |
|
$ |
44,040 |
|
|
$ |
36,598 |
|
|
$ |
33,306 |
|
|
$ |
36,985 |
|
|
Operating income |
|
|
4,787 |
|
|
|
4,678 |
|
|
|
3,094 |
|
|
|
3,141 |
|
|
Net income (loss) |
|
|
2,506 |
|
|
|
2,690 |
|
|
|
(593 |
) |
|
|
1,060 |
|
|
Net income (loss) per share, basic |
|
$ |
0.05 |
|
|
$ |
0.05 |
|
|
$ |
(0.01 |
) |
|
$ |
0.02 |
|
|
Net income (loss) per share, diluted |
|
$ |
0.05 |
|
|
$ |
0.05 |
|
|
$ |
(0.01 |
) |
|
$ |
0.02 |
|
|
Weighted average shares outstanding: |
|
|
|
|
|
|
|
|
|
|
|
|
|
|
|
|
|
Basic |
|
|
52,018,730 |
|
|
|
51,056,462 |
|
|
|
50,284,362 |
|
|
|
45,721,584 |
|
|
Diluted |
|
|
53,855,629 |
|
|
|
52,978,051 |
|
|
|
50,284,362 |
|
|
|
48,371,169 |
|
75
None.
Evaluation of Controls and Procedures
The term “disclosure controls and procedures,” as defined in Rules 13a-15(e) and 15d-15(e) under the Exchange Act, refers to controls and procedures that are designed to ensure that information required to be disclosed by a company in the reports that it files or submits under the Exchange Act is recorded, processed, summarized and reported, within the time periods specified in the SEC’s rules and forms. Disclosure controls and procedures include, without limitation, controls and procedures designed to ensure that such information is accumulated and communicated to a company’s management, including its principal executive and principal financial officers, as appropriate to allow timely decisions regarding required disclosure. We believe, however, that any controls and procedures, no matter how well designed and operated, can only provide reasonable assurance of achieving desired control objectives, and no evaluation of controls can provide absolute assurance that all control issues and instances of fraud or error within a company, if any, have been detected.
Our management, with the participation of our chief executive officer and chief financial officer, has evaluated the effectiveness of our disclosure controls and procedures as of December 31, 2015, the end of the period covered by this Annual Report on Form 10-K. Based upon such evaluation, our chief executive officer and chief financial officer have concluded that our disclosure controls and procedures were effective as of such date
Management’s Report on Internal Control Over Financial Reporting
Our management is responsible for establishing and maintaining adequate internal control over financial reporting. Our management, under the supervision and with the participation of our chief executive officer and chief financial officer, assessed the effectiveness of our internal control over financial reporting based on criteria established in the 2013 Internal Control—Integrated Framework issued by the Committee of Sponsoring Organizations of the Treadway Commission (COSO). Based on this evaluation, management concluded that our internal control over financial reporting was effective as of December 31, 2015.
The effectiveness of our internal control over financial reporting as of December 31, 2015 has been audited by Grant Thornton LLP, an independent registered public accounting firm, as stated in its report included below.
Changes in Internal Control Over Financial Reporting
As of January 1, 2016, we were no longer an “emerging growth company.” Accordingly, this Annual Report on Form 10-K includes management’s first report on internal control over financial reporting pursuant to Section 404 of the Sarbanes-Oxley Act (“Section 404”) as well as an attestation report of our independent registered public accounting firm with respect to the effectiveness of our internal control over financial reporting. We conducted an extensive evaluation of our internal control over financial reporting in preparing to satisfy our obligations under Section 404.
There have been no changes in our internal control over financial reporting that occurred during the quarter ended December 31, 2015 that have materially affected, or are reasonably likely to materially affect, our internal control over financial reporting.
76
Independent Registered Public Accounting Firm’s Report on Internal Control over Financial Reporting
|
REPORT OF INDEPENDENT REGISTERED PUBLIC ACCOUNTING FIRM |
|
|
Board of Directors and Stockholders
Paycom Software, Inc.
We have audited the internal control over financial reporting of Paycom Software, Inc. (a Delaware corporation) and subsidiaries (the “Company”) as of December 31, 2015, based on criteria established in the 2013 Internal Control—Integrated Framework issued by the Committee of Sponsoring Organizations of the Treadway Commission (COSO). The Company’s management is responsible for maintaining effective internal control over financial reporting and for its assessment of the effectiveness of internal control over financial reporting, included in the accompanying Management’s Report on Internal Control Over Financial Reporting. Our responsibility is to express an opinion on the Company’s internal control over financial reporting based on our audit.
We conducted our audit in accordance with the standards of the Public Company Accounting Oversight Board (United States). Those standards require that we plan and perform the audit to obtain reasonable assurance about whether effective internal control over financial reporting was maintained in all material respects. Our audit included obtaining an understanding of internal control over financial reporting, assessing the risk that a material weakness exists, testing and evaluating the design and operating effectiveness of internal control based on the assessed risk, and performing such other procedures as we considered necessary in the circumstances. We believe that our audit provides a reasonable basis for our opinion.
A company’s internal control over financial reporting is a process designed to provide reasonable assurance regarding the reliability of financial reporting and the preparation of financial statements for external purposes in accordance with generally accepted accounting principles. A company’s internal control over financial reporting includes those policies and procedures that (1) pertain to the maintenance of records that, in reasonable detail, accurately and fairly reflect the transactions and dispositions of the assets of the company; (2) provide reasonable assurance that transactions are recorded as necessary to permit preparation of financial statements in accordance with generally accepted accounting principles, and that receipts and expenditures of the company are being made only in accordance with authorizations of management and directors of the company; and (3) provide reasonable assurance regarding prevention or timely detection of unauthorized acquisition, use, or disposition of the company’s assets that could have a material effect on the financial statements.
Because of its inherent limitations, internal control over financial reporting may not prevent or detect misstatements. Also, projections of any evaluation of effectiveness to future periods are subject to the risk that controls may become inadequate because of changes in conditions, or that the degree of compliance with the policies or procedures may deteriorate.
In our opinion, the Company maintained, in all material respects, effective internal control over financial reporting as of December 31, 2015, based on criteria established in the 2013 Internal Control—Integrated Framework issued by COSO.
We also have audited, in accordance with the standards of the Public Company Accounting Oversight Board (United States), the consolidated financial statements of the Company as of and for the year ended December 31, 2015, and our report dated February 22, 2016 expressed an unqualified opinion on those financial statements.
/s/ GRANT THORNTON LLP
Oklahoma City, Oklahoma
February 22, 2016
None.
The information required in response to this Item 10 is incorporated herein by reference to our Definitive Proxy Statement to be filed with the SEC pursuant to Regulation 14A of the Exchange Act not later than 120 days after the end of the fiscal year covered by this Annual Report on Form 10-K.
77
The information required in response to this Item 11 is incorporated herein by reference to our Definitive Proxy Statement to be filed with the SEC pursuant to Regulation 14A of the Exchange Act not later than 120 days after the end of the fiscal year covered by this Annual Report on Form 10-K.
|
Item 12. |
Security Ownership of Certain Beneficial Owners and Management and Related Stockholder Matters |
The information required in response to this Item 12 is incorporated herein by reference to our Definitive Proxy Statement to be filed with the SEC pursuant to Regulation 14A of the Exchange Act not later than 120 days after the end of the fiscal year covered by this Annual Report on Form 10-K.
The information required in response to this Item 13 is incorporated herein by reference to our Definitive Proxy Statement to be filed with the SEC pursuant to Regulation 14A of the Exchange Act not later than 120 days after the end of the fiscal year covered by this Annual Report on Form 10-K.
The information required in response to this Item 14 is incorporated herein by reference to our Definitive Proxy Statement to be filed with the SEC pursuant to Regulation 14A of the Exchange Act not later than 120 days after the end of the fiscal year covered by this Annual Report on Form 10-K.
|
(a) |
Documents filed as part of this Form 10-K |
|
|
(1) |
Consolidated Financial Statements: The following consolidated financial statements of Paycom Software, Inc., together with the report thereon, of Grant Thornton LLP, our Independent Registered Public Accounting Firm, are included in Part II, Item 8 of this Form 10-K: |
Consolidated Balance Sheets as of December 31, 2015 and 2014
Consolidated Statements of Income, Years Ended December 31, 2015, 2014 and 2013
Consolidated Statements of Stockholders’ Equity, Years Ended December 31, 2015, 2014 and 2013
Consolidated Statements of Cash Flows, Years Ended December 31, 2015, 2014 and 2013
Notes to Consolidated Financial Statements
|
|
(2) |
Financial Statement Schedules: Financial statement schedules have been omitted as information required is inapplicable or the information is presented in the consolidated financial statements and the related notes. |
|
|
(3) |
Exhibits: |
The following exhibits are included herein or incorporated herein by reference:
|
Exhibit No. |
|
Description |
|
|
|
|
|
2.1 |
|
Merger Agreement, by and among Paycom Software, Inc., Paycom Payroll Holdings, LLC, Paycom Payroll, LLC and Paycom Merger Sub, LLC, dated December 30, 2013 (incorporated by reference to Exhibit 2.4 to the Company’s Registration Statement on Form S-1 dated March 10, 2014, filed with the SEC on March 10, 2014). |
|
|
|
|
|
2.2 |
|
Contribution Agreement, by and between WCAS Capital Partners, IV L.P. and Paycom Software, Inc., dated December 30, 2013 (incorporated by reference to Exhibit 2.5 to the Company’s Registration Statement on Form S-1 dated March 10, 2014, filed with the SEC on March 10, 2014). |
|
|
|
|
|
2.3 |
|
Contribution Agreement, by and among Welsh, Carson, Anderson & Stowe X, L.P., WCAS Management Corporation and Paycom Software, Inc., dated December 30, 2013 (incorporated by reference to Exhibit 2.6 to the Company’s Registration Statement on Form S-1 dated March 10, 2014, filed with the SEC on March 10, 2014). |
|
|
|
|
78
79
80
81
|
Exhibit No. |
|
Description |
|
|
|
|
|
|
XBRL Instance Document. |
|
|
|
|
|
|
101.SCH* |
|
XBRL Taxonomy Extension Schema Document |
|
|
|
|
|
101.CAL* |
|
XBRL Taxonomy Extension Calculation Linkbase Document |
|
|
|
|
|
101.DEF* |
|
XBRL Taxonomy Extension Definition Linkbase Document |
|
|
|
|
|
101.LAB* |
|
XBRL Taxonomy Extension Label Linkbase Document |
|
|
|
|
|
101.PRE* |
|
XBRL Taxonomy Extension Presentation Linkbase Document |
* Filed herewith.
** The certifications attached as Exhibit 32.1 are not deemed “filed” with the SEC and are not to be incorporated by reference into any filing of Paycom Software, Inc. under the Securities Act or the Exchange Act, whether made before or after the date of this Annual Report on Form 10-K, irrespective of any general incorporation language contained in such filing.
82
Pursuant to the requirements of the Securities Exchange Act of 1934, the registrant has duly caused this report to be signed on its behalf by the undersigned thereunto duly authorized.
Date: February 22, 2016
|
PAYCOM SOFTWARE, INC. |
||
|
|
|
|
|
By: |
|
/s/ Chad Richison |
|
|
|
Chad Richison |
|
|
|
Chief Executive Officer and Director |
Pursuant to the requirements of the Securities Exchange Act of 1934, this report has been signed below by the following persons on behalf of the registrant and in the capacities and on the date indicated.
Date: February 22, 2016
|
/s/ Chad Richison |
|
|
|
Chad Richison |
|
|
|
Chief Executive Officer and Director (Principal Executive Officer) |
|
|
|
|
|
|
|
/s/ Craig E. Boelte |
|
|
|
Craig E. Boelte |
|
|
|
Chief Financial Officer (Principal Accounting and Financial Officer) |
|
|
|
|
|
|
|
/s/ Jason D. Clark |
|
|
|
Jason D. Clark Director |
|
|
|
|
|
|
|
/s/ Robert J. Levenson |
|
|
|
Robert J. Levenson Director |
|
|
|
|
|
|
|
/s/ Rob Minicucci |
|
|
|
Rob Minicucci Chairman of the Board |
|
|
|
|
|
|
|
/s/ Conner Mulvee |
|
|
|
Conner Mulvee Director |
|
|
|
|
|
|
|
/s/ Frederick C. Peters II |
|
|
|
Frederick C. Peters II Director |
|
|
|
|
|
|
|
/s/ Sanjay Swani |
|
|
|
Sanjay Swani Director |
|
|
83