Attached files
| file | filename |
|---|---|
| EX-99.1 - EXHIBIT 99.1 - MIDSOUTH BANCORP INC | mslq412312017er-8kex991.htm |
| 8-K - MIDSOUTH BANCORP FORM 8-K - MIDSOUTH BANCORP INC | form8-kxxjanuary302018.htm |
4Q17 Update
4Q17 Financial Update
Quarterly loss of $11.3 million, $0.69 per diluted share
Loan loss provision of $10.6 million, or $0.42 per share
Operating loss was $0.15 per share excluding pre-tax loss on transfer of loans to
held for sale of $6.0 million, a $3.6 million charge for the write-down of net
deferred tax assets as a result of the Tax Cuts and Jobs Act, pre-tax regulatory
remediation costs of $1.8 million, pre-tax write-down of assets held for sale of
$789,000, pre-tax gain on sale of branches of $744,000 and pre-tax severance and
retention accruals of $171,000
Announced the closure in 1Q18 of 6 branches, resulting in additional
operating efficiencies
Tangible Common Equity/Tangible Assets was 9.12% at 12/31/17
Classified assets to capital ratio for MidSouth Bank declined to 56.1%,
down from 66.8% at 9/30/17
2
4Q17 Financial Update (cont’d)
Other key operating metrics
Loans declined $52.5 million
Payoff/paydown of $25.8 million of classified relationships
Charge-offs of $8.1 million of loans rated as classified at September
30, 2017.
Continued paydown of energy portfolio – decline of $18.1 million
Core Deposits remain stable at 88% of deposit mix with low
funding cost of 0.34%
4Q17 Pre-Tax, Pre-Provision earnings, operating $7.6 million vs.
$8.0 million for 3Q17
3
4Q17 Asset Quality Summary
Loan loss reserve/loans 2.27% at 12/31/17 vs. 2.03% at 9/30/17
4Q17 Loan Loss Provision of $10.6 million
Total net charge-offs for quarter $8.8 million
Includes $5.7 million of charge-offs on six collateral dependent loans on non-
accrual
Charge-offs on collateral dependent loans – more aggressive approach
consistent with regulatory guidance
Non-performing assets $57.3 million at 12/31/17 vs. $53.9 million at
9/30/17
Includes $5.1 million of nonperforming loans held for sale
Classified/Capital (Bank Level) was 56.1% vs. 66.8% at 9/30/17
Energy loans decreased $18.1 million to 15.2% of loans, down from
16.0% at 9/30/17
4
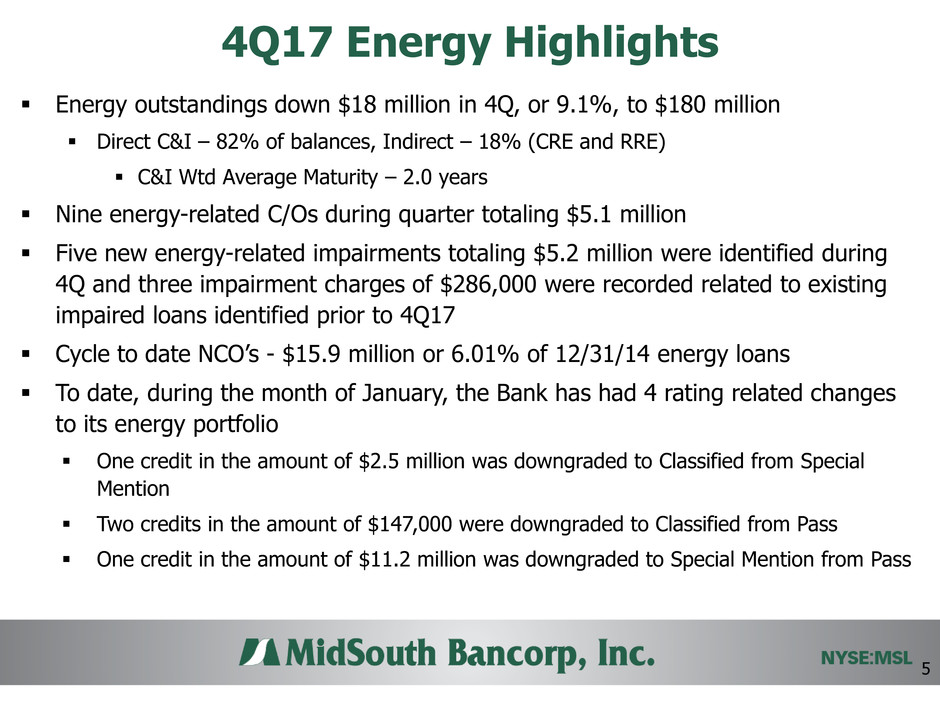
4Q17 Energy Highlights
Energy outstandings down $18 million in 4Q, or 9.1%, to $180 million
Direct C&I – 82% of balances, Indirect – 18% (CRE and RRE)
C&I Wtd Average Maturity – 2.0 years
Nine energy-related C/Os during quarter totaling $5.1 million
Five new energy-related impairments totaling $5.2 million were identified during
4Q and three impairment charges of $286,000 were recorded related to existing
impaired loans identified prior to 4Q17
Cycle to date NCO’s - $15.9 million or 6.01% of 12/31/14 energy loans
To date, during the month of January, the Bank has had 4 rating related changes
to its energy portfolio
One credit in the amount of $2.5 million was downgraded to Classified from Special
Mention
Two credits in the amount of $147,000 were downgraded to Classified from Pass
One credit in the amount of $11.2 million was downgraded to Special Mention from Pass
5
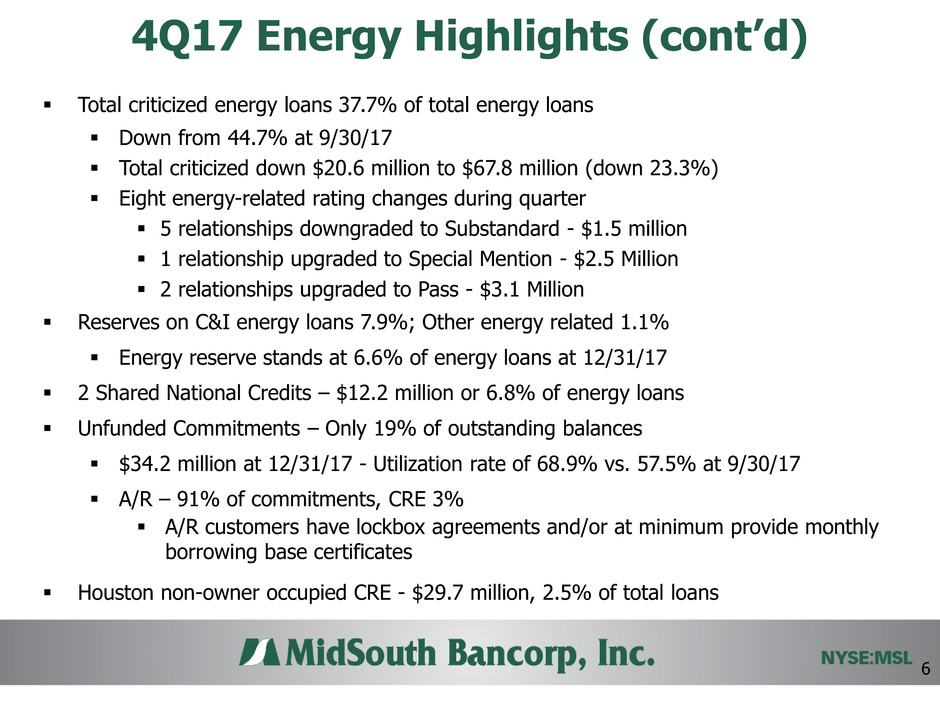
4Q17 Energy Highlights (cont’d)
Total criticized energy loans 37.7% of total energy loans
Down from 44.7% at 9/30/17
Total criticized down $20.6 million to $67.8 million (down 23.3%)
Eight energy-related rating changes during quarter
5 relationships downgraded to Substandard - $1.5 million
1 relationship upgraded to Special Mention - $2.5 Million
2 relationships upgraded to Pass - $3.1 Million
Reserves on C&I energy loans 7.9%; Other energy related 1.1%
Energy reserve stands at 6.6% of energy loans at 12/31/17
2 Shared National Credits – $12.2 million or 6.8% of energy loans
Unfunded Commitments – Only 19% of outstanding balances
$34.2 million at 12/31/17 - Utilization rate of 68.9% vs. 57.5% at 9/30/17
A/R – 91% of commitments, CRE 3%
A/R customers have lockbox agreements and/or at minimum provide monthly
borrowing base certificates
Houston non-owner occupied CRE - $29.7 million, 2.5% of total loans
6
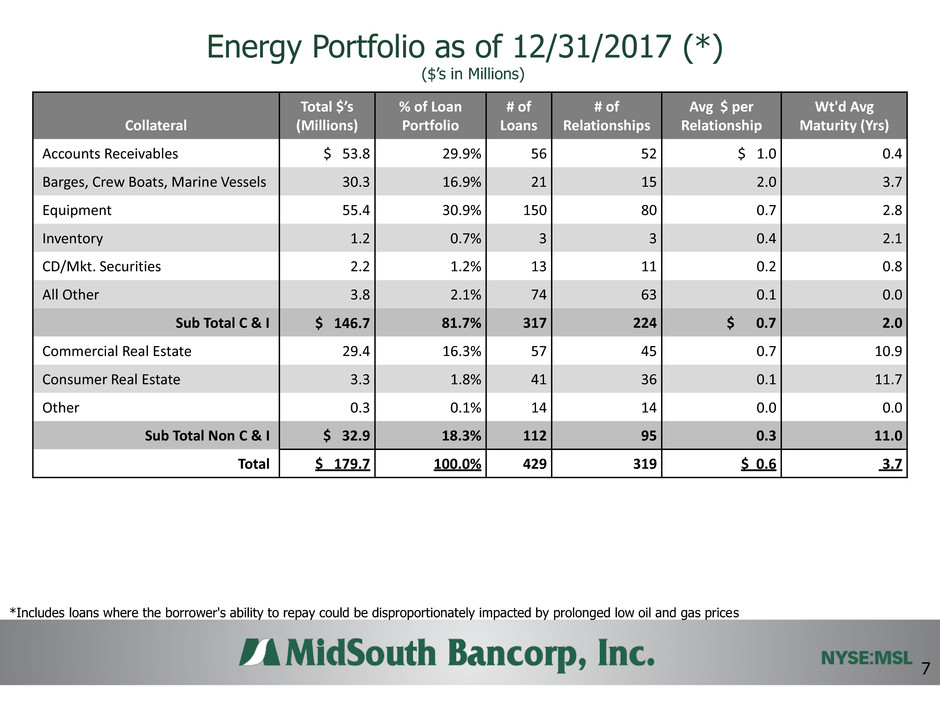
Energy Portfolio as of 12/31/2017 (*)
*Includes loans where the borrower's ability to repay could be disproportionately impacted by prolonged low oil and gas prices
($’s in Millions)
7
Collateral
Total $’s
(Millions)
% of Loan
Portfolio
# of
Loans
# of
Relationships
Avg $ per
Relationship
Wt'd Avg
Maturity (Yrs)
Accounts Receivables $ 53.8 29.9% 56 52 $ 1.0 0.4
Barges, Crew Boats, Marine Vessels 30.3 16.9% 21 15 2.0 3.7
Equipment 55.4 30.9% 150 80 0.7 2.8
Inventory 1.2 0.7% 3 3 0.4 2.1
CD/Mkt. Securities 2.2 1.2% 13 11 0.2 0.8
All Other 3.8 2.1% 74 63 0.1 0.0
Sub Total C & I $ 146.7 81.7% 317 224 $ 0.7 2.0
Commercial Real Estate 29.4 16.3% 57 45 0.7 10.9
Consumer Real Estate 3.3 1.8% 41 36 0.1 11.7
Other 0.3 0.1% 14 14 0.0 0.0
Sub Total Non C & I $ 32.9 18.3% 112 95 0.3 11.0
Total $ 179.7 100.0% 429 319 $ 0.6 3.7
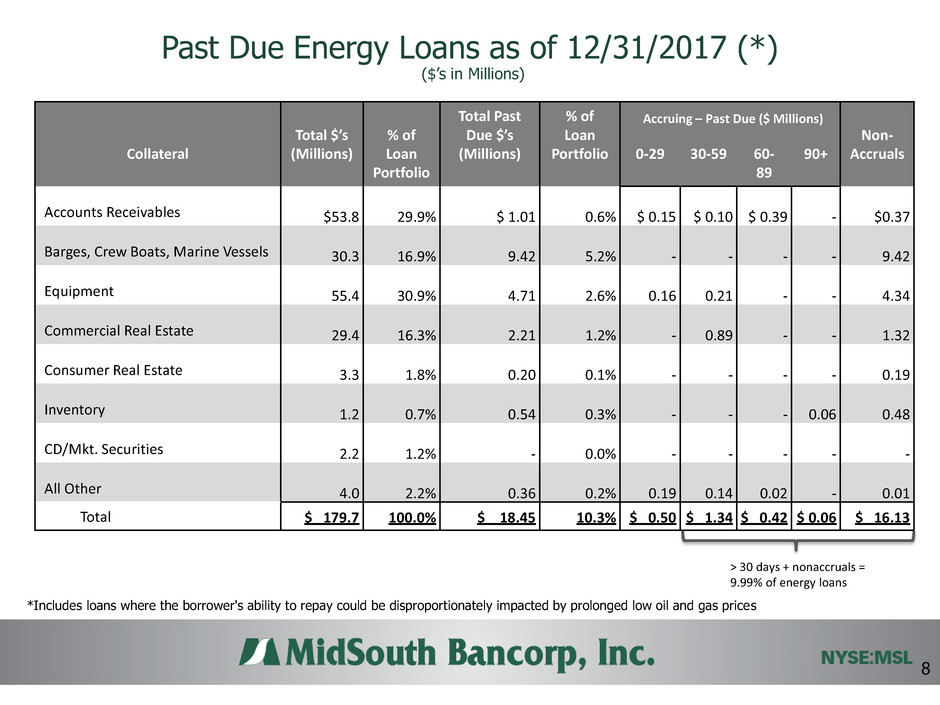
Past Due Energy Loans as of 12/31/2017 (*)
*Includes loans where the borrower's ability to repay could be disproportionately impacted by prolonged low oil and gas prices
> 30 days + nonaccruals =
9.99% of energy loans
($’s in Millions)
8
Collateral
Total $’s
(Millions)
% of
Loan
Portfolio
Total Past
Due $’s
(Millions)
% of
Loan
Portfolio
0-29
30-59
60-
89
90+
Non-
Accruals
Accounts Receivables $53.8 29.9% $ 1.01 0.6%
$ 0.15
$ 0.10
$ 0.39
- $0.37
Barges, Crew Boats, Marine Vessels 30.3 16.9% 9.42 5.2%
-
-
-
- 9.42
Equipment 55.4 30.9% 4.71 2.6%
0.16
0.21
-
- 4.34
Commercial Real Estate 29.4 16.3% 2.21 1.2% -
0.89
-
- 1.32
Consumer Real Estate 3.3 1.8% 0.20 0.1% - -
-
- 0.19
Inventory 1.2 0.7% 0.54 0.3% -
-
-
0.06 0.48
CD/Mkt. Securities 2.2 1.2% - 0.0% -
-
-
- -
All Other 4.0 2.2% 0.36 0.2%
0.19
0.14
0.02
- 0.01
Total $ 179.7 100.0% $ 18.45 10.3% $ 0.50 $ 1.34 $ 0.42 $ 0.06 $ 16.13
Accruing – Past Due ($ Millions)
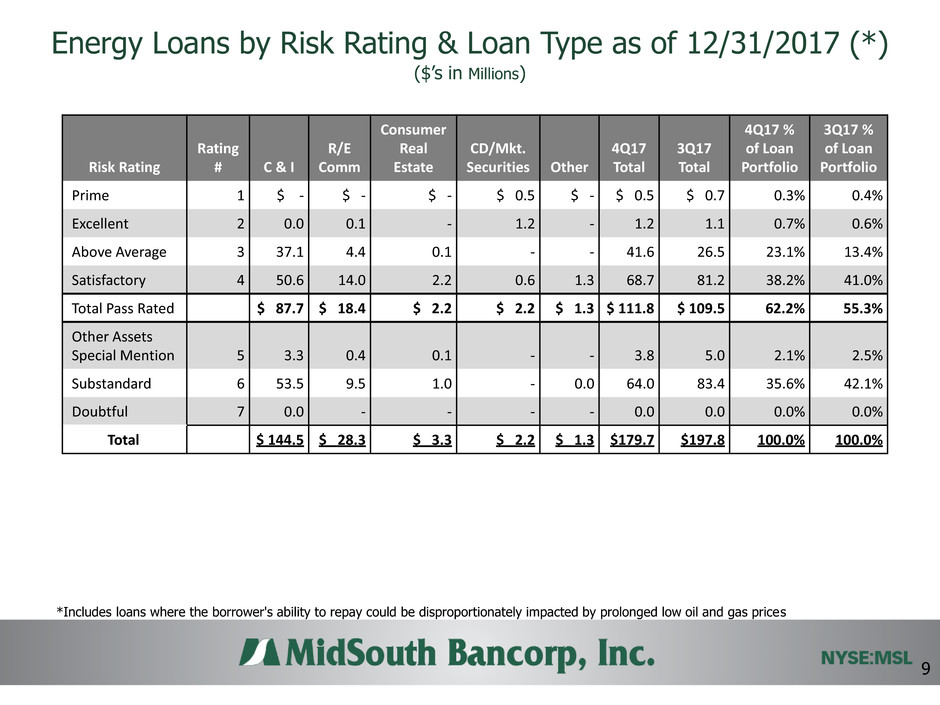
Energy Loans by Risk Rating & Loan Type as of 12/31/2017 (*)
($’s in Millions)
*Includes loans where the borrower's ability to repay could be disproportionately impacted by prolonged low oil and gas prices
9
Risk Rating
Rating
# C & I
R/E
Comm
Consumer
Real
Estate
CD/Mkt.
Securities Other
4Q17
Total
3Q17
Total
4Q17 %
of Loan
Portfolio
3Q17 %
of Loan
Portfolio
Prime 1 $ - $ - $ - $ 0.5 $ - $ 0.5 $ 0.7 0.3% 0.4%
Excellent 2 0.0 0.1 - 1.2 - 1.2 1.1 0.7% 0.6%
Above Average 3 37.1 4.4 0.1 - - 41.6 26.5 23.1% 13.4%
Satisfactory 4 50.6 14.0 2.2 0.6 1.3 68.7 81.2 38.2% 41.0%
Total Pass Rated $ 87.7 $ 18.4 $ 2.2 $ 2.2 $ 1.3 $ 111.8 $ 109.5 62.2% 55.3%
Other Assets
Special Mention 5 3.3 0.4 0.1 - - 3.8 5.0 2.1% 2.5%
Substandard 6 53.5 9.5 1.0 - 0.0 64.0 83.4 35.6% 42.1%
Doubtful 7 0.0 - - - - 0.0 0.0 0.0% 0.0%
Total $ 144.5 $ 28.3 $ 3.3 $ 2.2 $ 1.3 $179.7 $197.8 100.0% 100.0%
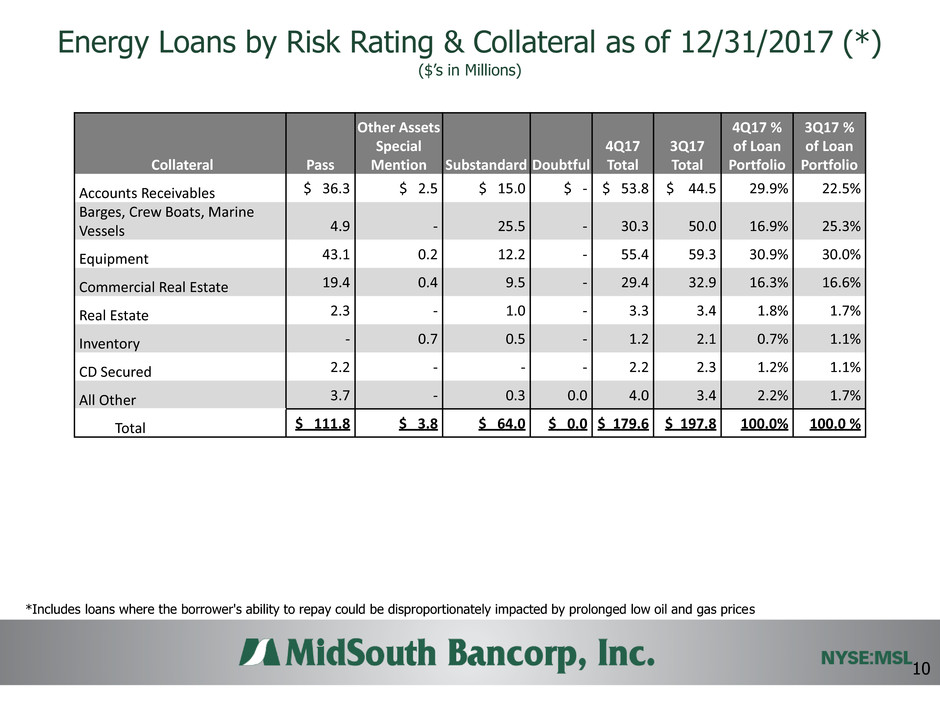
Energy Loans by Risk Rating & Collateral as of 12/31/2017 (*)
($’s in Millions)
*Includes loans where the borrower's ability to repay could be disproportionately impacted by prolonged low oil and gas prices
10
Collateral
Pass
Other Assets
Special
Mention
Substandard
Doubtful
4Q17
Total
3Q17
Total
4Q17 %
of Loan
Portfolio
3Q17 %
of Loan
Portfolio
Accounts Receivables $ 36.3 $ 2.5 $ 15.0 $ - $ 53.8 $ 44.5 29.9% 22.5%
Barges, Crew Boats, Marine
Vessels 4.9 - 25.5 - 30.3 50.0 16.9% 25.3%
Equipment 43.1 0.2 12.2 - 55.4 59.3 30.9% 30.0%
Commercial Real Estate 19.4 0.4 9.5 - 29.4 32.9 16.3% 16.6%
Real Estate 2.3 - 1.0 - 3.3 3.4 1.8% 1.7%
Inventory - 0.7 0.5 - 1.2 2.1 0.7% 1.1%
CD Secured 2.2 - - - 2.2 2.3 1.2% 1.1%
All Other 3.7 - 0.3 0.0 4.0 3.4 2.2% 1.7%
Total $ 111.8 $ 3.8 $ 64.0 $ 0.0 $ 179.6 $ 197.8 100.0% 100.0 %
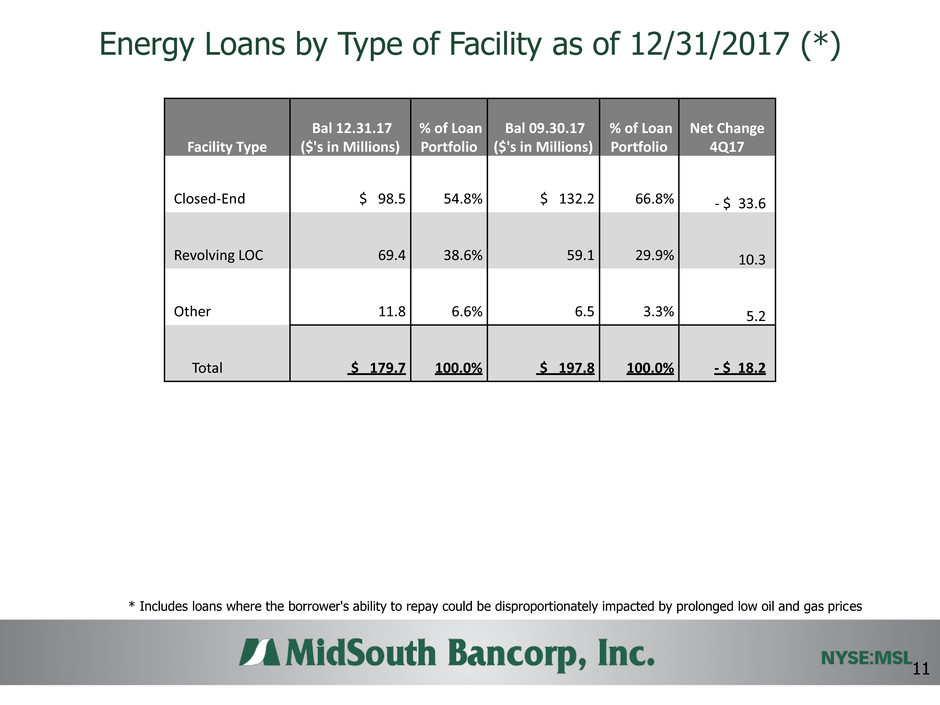
Energy Loans by Type of Facility as of 12/31/2017 (*)
* Includes loans where the borrower's ability to repay could be disproportionately impacted by prolonged low oil and gas prices
11
Facility Type
Bal 12.31.17
($'s in Millions)
% of Loan
Portfolio
Bal 09.30.17
($'s in Millions)
% of Loan
Portfolio
Net Change
4Q17
Closed-End $ 98.5 54.8% $ 132.2 66.8% - $ 33.6
Revolving LOC 69.4 38.6%
59.1 29.9% 10.3
Other 11.8 6.6% 6.5 3.3% 5.2
Total $ 179.7 100.0% $ 197.8 100.0% - $ 18.2
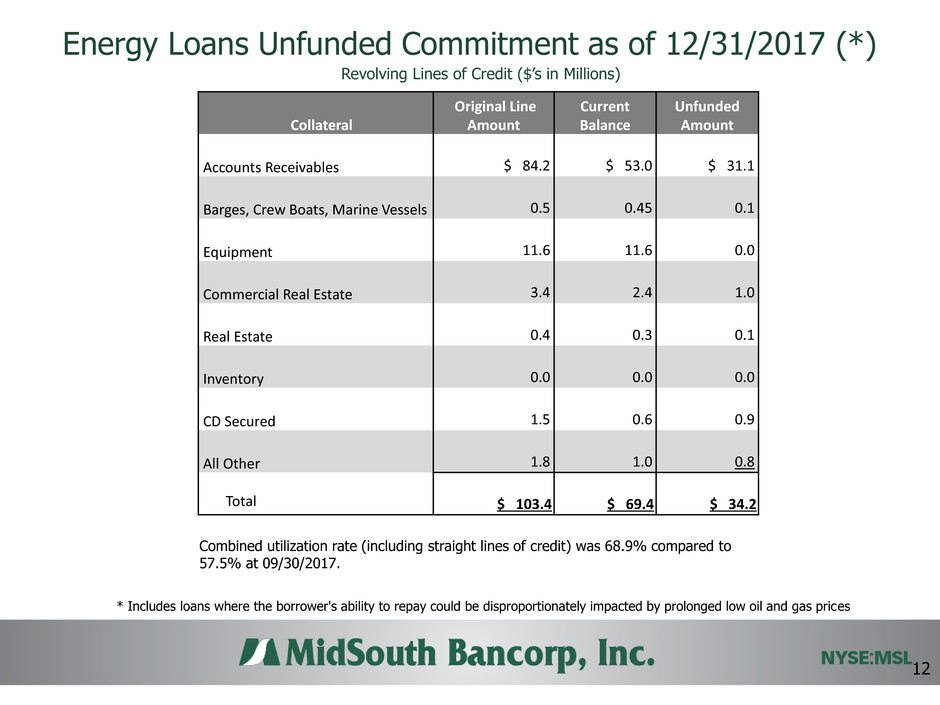
Energy Loans Unfunded Commitment as of 12/31/2017 (*)
* Includes loans where the borrower's ability to repay could be disproportionately impacted by prolonged low oil and gas prices
Combined utilization rate (including straight lines of credit) was 68.9% compared to
57.5% at 09/30/2017.
Revolving Lines of Credit ($’s in Millions)
12
Collateral
Original Line
Amount
Current
Balance
Unfunded
Amount
Accounts Receivables $ 84.2 $ 53.0 $ 31.1
Barges, Crew Boats, Marine Vessels 0.5 0.45 0.1
Equipment 11.6 11.6 0.0
Commercial Real Estate 3.4 2.4 1.0
Real Estate 0.4 0.3 0.1
Inventory 0.0 0.0 0.0
CD Secured 1.5 0.6 0.9
All Other 1.8 1.0 0.8
Total $ 103.4 $ 69.4 $ 34.2
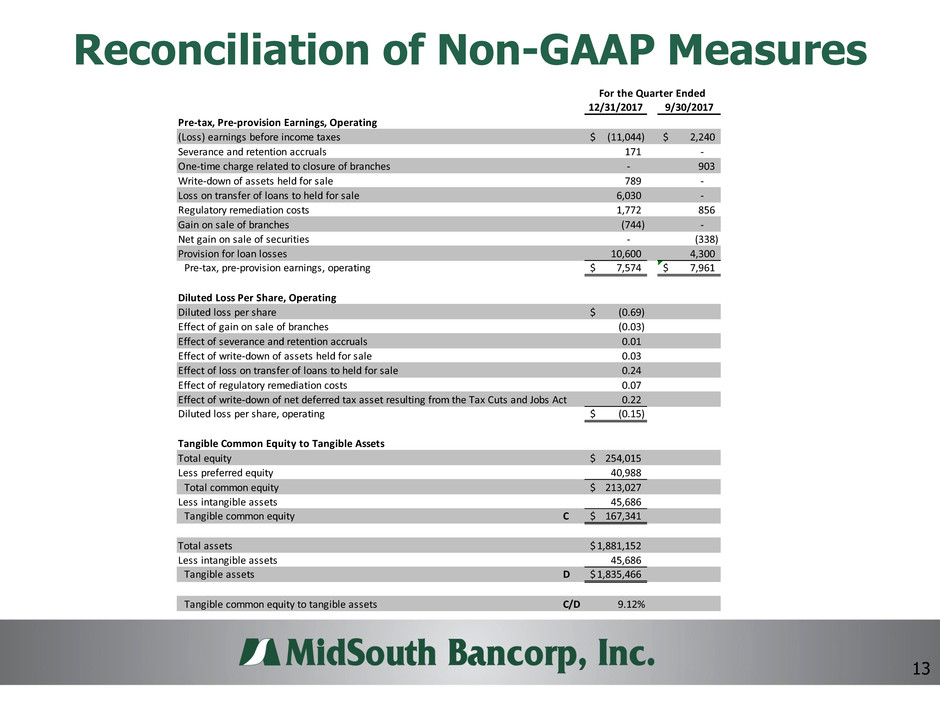
Reconciliation of Non-GAAP Measures
13
12/31/2017 9/30/2017
Pre-tax, Pre-provision Earnings, Operating
(Loss) earnings before income taxes (11,044)$ 2,240$
Severance and retention accruals 171 -
One-time charge related to closure of branches - 903
Write-down of assets held for sale 789 -
Loss on transfer of loans to held for sale 6,030 -
Regulatory remediation costs 1,772 856
Gain on sale of branches (744) -
Net gain on sale of securities - (338)
Provision for loan losses 10,600 4,300
Pre-tax, pre-provision earnings, operating 7,574$ 7,961$
Diluted Loss Per Share, Operating
Diluted loss per share (0.69)$
Effect of gain on sale of branches (0.03)
Effect of severance and retention accruals 0.01
Effect of write-down of assets held for sale 0.03
Effect of loss on transfer of loans to held for sale 0.24
Effect of regulatory remediation costs 0.07
Effect of write-down of net deferred tax asset resulting from the Tax Cuts and Jobs Act 0.22
Diluted loss per share, operating (0.15)$
Tangible Common Equity to Tangible Assets
Total equity 254,015$
Less preferred equity 40,988
Total common equity 213,027$
Less intangible assets 45,686
Tangible common equity C 167,341$
Total assets 1,881,152$
Less intangible assets 45,686
Tangible assets D 1,835,466$
Tangible common equity to tangible assets C/D 9.12%
For the Quarter Ended
