Attached files
| file | filename |
|---|---|
| EX-21 - EXHIBIT 21 - MIDSOUTH BANCORP INC | ex21.htm |
| EX-31.1 - EXHIBIT 31.1 - MIDSOUTH BANCORP INC | ex31_1.htm |
| EX-23.1 - EXHIBIT 23_1 - MIDSOUTH BANCORP INC | ex23_1.htm |
| EX-32.1 - EXHIBIT 32_1 - MIDSOUTH BANCORP INC | ex32_1.htm |
| EX-10.8 - EXHIBIT 10.8 - MIDSOUTH BANCORP INC | ex10_8.htm |
| EX-10.9 - EXHIBIT 10.9 - MIDSOUTH BANCORP INC | ex10_9.htm |
| EX-32.2 - EXHIBIT 32.2 - MIDSOUTH BANCORP INC | ex32_2.htm |
| EX-31.2 - EXHIBIT 31.2 - MIDSOUTH BANCORP INC | ex31_2.htm |
| EXCEL - IDEA: XBRL DOCUMENT - MIDSOUTH BANCORP INC | Financial_Report.xls |
UNITED STATES SECURITIES AND EXCHANGE COMMISSION
Washington, D.C. 20549
FORM 10-K
ANNUAL REPORT PURSUANT TO SECTION 13 OR 15(d) OF THE
SECURITIES EXCHANGE ACT OF 1934
For the fiscal year ended December 31, 2014
Commission File number 1-11826

MIDSOUTH BANCORP, INC.
(Exact name of registrant as specified in its charter)
|
Louisiana
|
72-1020809
|
|
|
(State of Incorporation)
|
(I.R.S. EIN Number)
|
102 Versailles Boulevard, Lafayette, Louisiana 70501
(Address of principal executive offices)
Registrant's telephone number, including area code: (337) 237-8343
Securities registered pursuant to Section 12(b) of the Act:
|
Title of each class
|
Name of each exchange on which registered
|
|
|
Common Stock, $.10 par value
|
New York Stock Exchange
|
Securities registered pursuant to Section 12(g) of the Act: none
Indicate by check mark if the registrant is a well-known seasoned issuer, as defined in Rule 405 of the Securities Act.
Yes ☐ No ☑
Indicate by check mark if the registrant is not required to file reports pursuant to Section 13 or 15(d) of the Act.
Yes ☐ No ☑
Indicate by check mark whether the registrant (1) has filed all reports required to be filed by Section 13 or 15(d) of the Securities Exchange Act of 1934 during the preceding 12 months (or for such shorter period that the registrant was required to file such reports), and (2) has been subject to such filing requirements for the past 90 days. Yes ☑ No ☐
Indicate by check mark whether the registrant has submitted electronically and posted on its corporate Web site, if any, every Interactive Data File required to be submitted and posted pursuant to Rule 405 of Regulation S-T during the preceding 12 months (or for such shorter period that the registrant was required to submit and post such files).
Yes ☑ No ☐
Indicate by check mark if disclosure of delinquent filers in response to Item 405 of Regulation S-K is not contained herein, and will not be contained, to the best of registrant's knowledge, in definitive proxy or information statements incorporated by reference in Part III of this Form 10-K or any amendment to this Form 10-K ☐
Indicate by check mark whether the registrant is a large accelerated filer, an accelerated filer, a nonaccelerated filer, or a smaller reporting company. A large accelerated filer ☐ An accelerated filer ☑ A nonaccelerated filer ☐ A smaller reporting company ☐
Indicate by check mark whether the registrant is a shell company (as defined in Rule 12b-2 of the Act.)
Yes ☐ No ☑
The aggregate market value of the voting and nonvoting common equity held by nonaffiliates of the registrant at June 30, 2014 was approximately $162,712,194 based upon the closing market price per share of the registrant’s common stock as reported on The New York Stock Exchange, Inc. as of such date. As of March 13, 2015 there were 11,349,081 outstanding shares of MidSouth Bancorp, Inc. common stock.
DOCUMENTS INCORPORATED BY REFERENCE
Portions of the Company’s Proxy Statement for its 2015 Annual Meeting of Stockholders are incorporated by reference into Part III of this Form 10-K.
|
MIDSOUTH BANCORP, INC.
|
|
2014 Annual Report on Form 10-K
|
|
6
|
||
|
6
|
||
|
6
|
||
|
6
|
||
|
6
|
||
|
7
|
||
|
7
|
||
|
7
|
||
|
7
|
||
|
15
|
||
|
16
|
||
|
23
|
||
|
25
|
||
|
25
|
||
|
25
|
||
|
25
|
||
|
27
|
||
|
27
|
||
|
29
|
||
|
30
|
||
|
30
|
||
|
30
|
||
|
32
|
||
|
33
|
||
|
37
|
||
|
49
|
||
|
49
|
||
|
50
|
||
|
56
|
||
|
1.
|
56
|
|
|
2.
|
61
|
|
|
3.
|
65
|
|
|
4.
|
73
|
|
|
5.
|
74
|
|
|
6.
|
74
|
|
|
7.
|
75
|
|
|
8.
|
75
|
|
|
9.
|
75
|
|
|
10.
|
76
|
|
|
11.
|
76
|
|
|
12.
|
77
|
|
|
13.
|
78
|
|
|
14.
|
78
|
|
|
15.
|
80
|
|
|
16.
|
81
|
|
|
17.
|
82
|
|
|
18.
|
82
|
|
|
19.
|
83
|
|
|
20.
|
84
|
|
|
21.
|
88
|
|
|
22.
|
88
|
|
|
23.
|
89
|
|
|
94
|
||
|
94
|
||
|
94
|
||
|
95
|
||
|
95
|
||
|
95
|
||
|
95
|
||
|
95
|
||
|
96
|
||
|
96
|
||
|
96
|
||
CAUTIONARY NOTE REGARDING FORWARD-LOOKING STATEMENTS
Certain statements included in this Report and the documents incorporated by reference herein, other than statements of historical fact, are forward-looking statements (as such term is defined in Section 27A of the Securities Act of 1933, as amended, and Section 21E of the Securities Exchange Act of 1934, as amended, and the regulations thereunder), which are intended to be covered by the safe harbors created thereby. Forward-looking statements include, but are not limited to certain statements under the captions “Business,” “Risk Factors” and “Management’s Discussion and Analysis of Financial Condition and Results of Operations.”
The words “anticipate,” “believe,” “estimate,” “expect,” “intend,” “may,” “plan,” “will,” “would,” “could,” “should,” “guidance,” “potential,” “continue,” “project,” “forecast,” “confident,” and similar expressions are typically used to identify forward-looking statements. These statements are based on assumptions and assessments made by management in light of their experience and their perception of historical trends, current conditions, expected future developments and other factors they believe to be appropriate. Any forward-looking statements are not guarantees of our future performance and are subject to risks and uncertainties and may be affected by various factors that may cause actual results, developments and business decisions to differ materially from those in the forward-looking statements. Some of the factors that may cause actual results, developments and business decisions to differ materially from those contemplated by such forward-looking statements include the factors discussed under the caption “Risk Factors” and “Management’s Discussion and Analysis of Financial Condition and Results of Operations” in this Report and the following:
| · | changes in interest rates and market prices that could affect the net interest margin, asset valuation, and expense levels; |
| · | changes in local economic and business conditions, including, without limitation, changes related to the oil and gas industries, that could adversely affect customers and their ability to repay borrowings under agreed upon terms, adversely affect the value of the underlying collateral related to their borrowings, and reduce demand for loans; |
| · | increased competition for deposits and loans which could affect compositions, rates and terms; |
| · | changes in the levels of prepayments received on loans and investment securities that adversely affect the yield and value of the earning assets; |
| · | a deviation in actual experience from the underlying assumptions used to determine and establish our allowance for loan losses (“ALLL”), which could result in greater than expected loan losses; |
| · | changes in the availability of funds resulting from reduced liquidity or increased costs; |
| · | the timing and impact of future acquisitions, the success or failure of integrating acquired operations, and the ability to capitalize on growth opportunities upon entering new markets; |
| · | the ability to acquire, operate, and maintain effective and efficient operating systems; |
| · | increased asset levels and changes in the composition of assets that would impact capital levels and regulatory capital ratios; |
| · | loss of critical personnel and the challenge of hiring qualified personnel at reasonable compensation levels; |
| · | legislative and regulatory changes, including the impact of regulations under the Dodd-Frank Wall Street Reform and Consumer Protection Act of 2010 (the “Dodd-Frank Act”) and other changes in banking, securities and tax laws and regulations and their application by our regulators, changes in the scope and cost of Federal Deposit Insurance Corporation (“FDIC”) insurance and other coverage; |
| · | regulations and restrictions resulting from our participation in government sponsored programs such as the U.S. Treasury’s Small Business Lending Fund, including potential retroactive changes in such programs; |
| · | changes in accounting principles, policies, and guidelines applicable to financial holding companies and banking; |
| · | acts of war, terrorism, cyber intrusion, weather, or other catastrophic events beyond our control; and |
| · | the ability to manage the risks involved in the foregoing. |
We can give no assurance that any of the events anticipated by the forward-looking statements will occur or, if any of them does, what impact they will have on our results of operations and financial condition. We disclaim any intent or obligation to publicly update or revise any forward-looking statements, regardless of whether new information becomes available, future developments occur or otherwise.
The Company was incorporated in 1984 as a Louisiana corporation and is a registered financial holding company headquartered in Lafayette, Louisiana. Its operations have been conducted primarily through its wholly owned bank subsidiary MidSouth Bank, N.A. The Bank, a national banking association, was chartered and commenced operations in 1985. On December 28, 2012, we completed a merger with PSB Financial Corporation (“PSB”), the holding company of Many, Louisiana based The Peoples State Bank. This transaction continued our strategic growth and enhanced the connection between Louisiana and Texas by expanding MidSouth Bank’s presence into central and northwest Louisiana and east Texas. As of December 31, 2014, the Bank operated through a network of 58 offices located in Louisiana and Texas.
Unless otherwise indicated or unless the context requires otherwise, all references in this report to “the Company,” “we,” “us,” “our,” or similar references, mean MidSouth Bancorp, Inc. and our subsidiaries, including our banking subsidiary, MidSouth Bank, N.A., on a consolidated basis. References to “MidSouth Bank” or the “Bank” mean our wholly owned banking subsidiary, MidSouth Bank, N.A.
The Bank is community oriented and focuses primarily on offering commercial and consumer loan and deposit services to small and middle market businesses, their owners and employees, and other individuals in our markets. Our community banking philosophy emphasizes personalized service and building broad customer relationships. Deposit products and services offered by the Bank include interest-bearing and noninterest-bearing checking accounts, investment accounts, cash management services, and electronic banking services, including remote deposit capturing services, internet banking, and debit and credit cards. Most of the Bank’s deposit accounts are FDIC-insured up to the maximum allowed, and the Bank customers have access to a world-wide ATM network of more than 55,000 surcharge-free ATMs.
Loans offered by the Bank include commercial and industrial loans, commercial real estate loans (both owner-occupied and non-owner occupied), other loans secured by real estate and consumer loans. We commenced operations during a severe economic downturn in Louisiana more than 30 years ago. Our survival and growth in the ensuing years has instilled in us a conservative operating philosophy. Our conservative attitude impacts our credit and funding decisions, including underwriting loans primarily based on the cash flows of the borrower (rather than just relying on collateral valuations) and focusing lending efforts on working capital and equipment loans to small and mid-sized businesses along with owner-occupied properties.
Our conservative operating philosophy extends to managing the various risks we face. We maintain a separate risk management group to help identify and manage these various risks. This group, which reports directly to the Chairman of our Audit Committee, not to other members of the senior management team, includes our audit, collections, compliance, in-house legal counsel, loan review and security functions and is staffed with experienced accounting and legal professionals.
We are committed to an exceptional level of customer care. We maintain our own in-house call center so that customers enjoy live interaction with employees of the Bank rather than an automated telephone system. Additionally, we provide our employees with the training and technological tools to improve customer care. We also conduct focus groups within the communities we serve and strive to create a two-way dialog to ensure that we are offering the banking products and services that our customers and communities need.
We operate in Louisiana and central and east Texas along the Interstate 10, Interstate 49, Highway 90, Interstate 45, Interstate 20 and Interstate 35 corridors. As of December 31, 2014, our market area in Louisiana included 42 offices and is bound by Lafourche Parish to the south, East Baton Rouge Parish to the east, Caddo Parish to the north and Calcasieu Parish to the west. Our market areas in Texas include 16 offices located in the Beaumont, Houston, Conroe, Magnolia, College Station, Dallas-Fort Worth, Tyler, and Texarkana areas. For additional information regarding our properties, see Item 2 – Properties of this Report.
Oil and gas is the key industry within our markets. However, medical, technology and research companies continue to develop within these markets thereby diversifying the economy. Additionally, numerous major universities located within our market areas, including Louisiana State University, University of Houston, Rice University, Texas A&M University and University of Louisiana at Lafayette, provide a substantial number of jobs and help to contribute to the educated work force within our markets.
We believe our financial condition, coupled with our scalable operational capabilities, will facilitate future growth, both organically and through acquisition, including potential growth in new market areas.
We face strong competition in our market areas from both traditional and nontraditional financial services providers, such as commercial banks; savings banks; credit unions; finance companies; mortgage, leasing, and insurance companies; money market mutual funds; brokerage houses; and branches that provide credit facilities. Several of the financial services competitors in our market areas are substantially larger and have far greater resources; however, we have effectively competed by building long-term customer relationships. Customer loyalty has been built through our continued focus on quality customer care enhanced by technology and effective delivery systems.
Other factors, including economic, legislative, and technological changes, also impact our competitive environment. Management continually evaluates competitive challenges in the financial services industry and develops appropriate responses consistent with our overall market strategy.
As of December 31, 2014, the Bank employed approximately 549 full-time equivalent employees. The Company had no employees who are not also employees of the Bank. Through the Bank, employees receive customary employee benefits, which include an employee stock ownership plan; a 401(K) plan; and life, health and disability insurance plans. Our directors, officers, and employees are important to the success of the Company and play a key role in business development by actively participating in the communities served by the Company. The Company considers the relationship of the Bank with its employees as a whole to be good.
More information on the Company and the Bank is available on the Bank’s website at www.midsouthbank.com. The Company is not incorporating by reference into this Report the information contained on its website; therefore, the content of the website is not a part of this Report. Copies of this Report and other reports filed or furnished by the Company pursuant to Section 13(a) or 15(d) of the Exchange Act, including exhibits, are available free of charge on the Company’s website under the “Investor Relations” link as soon as reasonably practicable after they have been filed or furnished electronically to the Securities and Exchange Commission (“SEC”). Copies of these filings may also be obtained free of charge on the SEC’s website at www.sec.gov.
Under Federal Reserve policy, we are expected to act as a source of financial strength for, and to commit resources to support, the Bank. This support may be required at times when, absent such Federal Reserve policy, we may not be inclined to provide such support. In addition, any capital loans by a financial holding company to any of its banking subsidiaries are subordinate in right of payment to deposits and to certain other indebtedness of such subsidiary banks. In the event of a financial holding company's bankruptcy, any commitment by a financial holding company to a federal bank regulatory agency to maintain the capital of a banking subsidiary will be assumed by the bankruptcy trustee and entitled to a priority of payment.
Regulatory Reform
The financial crisis of 2008, including the downturn of global economic, financial and money markets and the threat of collapse of numerous financial institutions, and other recent events have led to the adoption of numerous new laws and regulations that apply to, and focus on, financial institutions. The most significant of these new laws is the Dodd-Frank Wall Street Reform and Consumer Protection Act (the “Dodd-Frank Act”), which was adopted on July 21, 2010 and, in part, is intended to implement significant structural reforms to the financial services industry. The Dodd-Frank Act is discussed in more detail below.
Bank Holding Companies and Financial Holding Companies
Historically, the activities of bank holding companies were limited to the business of banking and activities closely related or incidental to banking. Bank holding companies were generally prohibited from acquiring control of any company that was not a bank and from engaging in any business other than the business of banking or managing and controlling banks. The Gramm-Leach-Bliley Act, which took effect on March 12, 2000, dismantled many Depression-era restrictions against affiliation between banking, securities and insurance firms by permitting bank holding companies to engage in a broader range of financial activities, so long as certain safeguards are observed. Specifically, bank holding companies may elect to become “financial holding companies” that may affiliate with securities firms and insurance companies and engage in other activities that are financial in nature or incidental to a financial activity. Thus, with the enactment of the Gramm-Leach-Bliley Act, banks, security firms and insurance companies find it easier to acquire or affiliate with each other and cross-sell financial products. The Gramm-Leach-Bliley Act permits a single financial services organization to offer a more complete array of financial products and services than historically was permitted.
A financial holding company is essentially a bank holding company with significantly expanded powers. Under the Gramm-Leach-Bliley Act, in addition to traditional lending activities, the following activities are among those that are deemed “financial in nature” for financial holding companies: securities underwriting, dealing in or making a market in securities, sponsoring mutual funds and investment companies, insurance underwriting and agency activities, activities which the Federal Reserve Board determines to be closely related to banking, and certain merchant banking activities.
We elected to become a financial holding company in November 2012. As a financial holding company, we have very broad discretion to affiliate with securities firms and insurance companies, make merchant banking investments, and engage in other activities that the Federal Reserve Board has deemed financial in nature. In order to continue as a financial holding company, we must continue to be well-capitalized, well-managed and maintain compliance with the Community Reinvestment Act (the “CRA”). Depending on the types of financial activities that we may elect to engage in, under the Gramm-Leach-Bliley Act’s functional regulation principles, we may become subject to supervision by additional government agencies. The election to be treated as a financial holding company increases our ability to offer financial products and services that historically we were either unable to provide or were only able to provide on a limited basis. As a result, we will face increased competition in the markets for any new financial products and services that we may offer. Likewise, an increased amount of consolidation among banks and securities firms or banks and insurance firms could result in a growing number of large financial institutions that could compete aggressively with us.
Dodd-Frank Act
In July 2010, the Dodd-Frank Act was signed into law. The Dodd-Frank Act implements far-reaching changes across the financial regulatory landscape, including changes that will affect all bank holding companies, financial holding companies and banks, including us and the Bank, including the following provisions:
| · | Insurance of Deposit Accounts. The Dodd-Frank Act changed the assessment base for federal deposit insurance from the amount of insured deposits to consolidated assets less tangible capital. The Dodd-Frank Act also made permanent the $250,000 limit for federal deposit insurance and increased the cash limit of Securities Investor Protection Corporation protection from $100,000 to $250,000. |
| · | Payment of Interest on Demand Deposits. The Dodd-Frank Act repealed the federal prohibitions on the payment of interest and demand deposits, thereby permitting depository institutions to pay interest on business transaction and other accounts. |
| · | Creation of the Consumer Financial Protection Bureau. The Dodd-Frank Act centralized significant aspects of consumer financial protection by creating a new agency, the Consumer Financial Protection Bureau (the “CFPB”), which is discussed in more detail below. |
| · | Debit Card Interchange Fees. The Dodd-Frank Act amended the Electronic Fund Transfer Act to, among other things, require that debit card interchange fees be reasonable and proportional to the actual cost incurred by the issuer with respect to the transaction. In June 2011, the Federal Reserve Board adopted regulations setting the maximum permissible interchange fee as the sum of 21 cents per transaction and 5 basis points multiplied by the value of the transaction, with an additional adjustment of up to one cent per transaction if the issuer implements additional fraud-prevention standards. Although issuers that have assets of less than $10 billion are exempt from the Federal Reserve Board’s regulations that set maximum interchange fees, these regulations could significantly impact the interchange fees that financial institutions with less than $10 billion in assets, such as the Bank, are able to collect. |
In addition, the Dodd-Frank Act implements other far-reaching changes to the financial regulatory landscape, including provisions that:
| · | Restrict the preemption of state law by federal law and disallow subsidiaries and affiliates of national banks from availing themselves of such preemption. |
| · | Impose comprehensive regulation of the over-the-counter derivatives market, subject to significant rulemaking processes, which would include certain provisions that would effectively prohibit insured depository institutions from conducting certain derivatives businesses in the institution itself. |
| · | Require depository institutions with total consolidated assets of more than $10 billion to conduct regular stress tests and require large, publicly traded bank holding companies and financial holding companies to create a risk committee responsible for the oversight of enterprise risk management. |
| · | Require loan originators to retain 5% of any loan sold or securitized, unless it is a “qualified residential mortgage,” subject to certain exceptions. |
| · | Prohibit banks and their affiliates from engaging in proprietary trading and investing in and sponsoring certain unregistered investment companies (the Volcker Rule). |
| · | Implement corporate governance revisions that apply to all public companies not just financial institutions. |
Capital Requirements
We are subject to various regulatory capital requirements administered by the Federal Reserve and the Office of the Comptroller of the Currency (the “OCC”). Failure to meet minimum capital requirements could result in certain mandatory and possible additional discretionary actions by regulators that, if undertaken, could have a direct material effect on our financial statements. Under capital adequacy guidelines and the regulatory framework for prompt corrective action (described below), we must meet specific capital guidelines that involve quantitative measures of our assets, liabilities, and certain off-balance sheet items as calculated under regulatory accounting policies. Our capital amounts and classification are also subject to judgments by the regulators regarding qualitative components, risk weightings, and other factors. For further detail on capital and capital ratios see discussion under Part II, Item 7, “Management’s Discussion and Analysis of Financial Condition and Results of Operations.”
Regulatory Capital Requirement in Effect as of December 31, 2014
Under the risk-based capital requirements for bank holding companies and financial holding companies in effect as of December 31, 2014, the minimum requirement for the ratio of total capital to risk-weighted assets (including certain off-balance sheet activities, such as standby letters of credit) was 8%. At least half of the total capital (as defined below) was to be composed of common stockholders’ equity, retained earnings, qualifying perpetual preferred stock (in a limited amount in the case of cumulative preferred stock), minority interests in the equity accounts of consolidated subsidiaries, and qualifying trust preferred securities, less goodwill and certain intangibles (“Tier 1 Capital”). The remainder of total capital could consist of qualifying subordinated debt and redeemable preferred stock, qualifying cumulative perpetual preferred stock and allowance for loan losses (“Tier 2 Capital”, and together with Tier 1 Capital, “Total Capital”). At December 31, 2014, our Tier 1 Capital ratio was 12.90% and Total Capital ratio was 13.73%. Since our total consolidated assets are below $15 billion our $21.5 million aggregate principal amount of trust preferred securities issued prior to May 19, 2011 are included in our Tier 1 and Total Capital calculations.
The Federal Reserve has established minimum leverage ratio guidelines for bank holding companies and financial holding companies. As of December 31, 2014, these requirements provided for a minimum leverage ratio of Tier 1 Capital to adjusted average quarterly assets (“Leverage Ratio”) equal to 3% for bank holding companies and financial holding companies that meet specified criteria, including having the highest regulatory rating. All other bank holding companies and financial holding companies were generally required to maintain a leverage ratio of at least 4%. Our Leverage Ratio at December 31, 2014 was 9.52%. The capital guidelines also provided that bank holding companies and financial holding companies experiencing internal growth or making acquisitions would be expected to maintain strong capital positions substantially above the minimum supervisory levels without significant reliance on intangible assets. Furthermore, the guidelines provided that the Federal Reserve would continue to consider a “tangible tier 1 leverage ratio” (deducting all intangibles) in evaluating proposals for expansion or to engage in new activity.
The Bank is subject to similar capital requirements adopted by the OCC. The risk-based capital requirements identify concentrations of credit risk and certain risks arising from non-traditional activities, and the management of those risks, as important factors to consider in assessing an institution’s overall capital adequacy. Other factors taken into consideration by federal regulators include: interest rate exposure; liquidity, funding and market risk; the quality and level of earnings; the quality of loans and investments; the effectiveness of loan and investment policies; and management’s overall ability to monitor and control financial and operational risks, including the risks presented by concentrations of credit and non-traditional activities.
Basel III Capital Framework Effective January 1, 2015
In July 2013, the Federal Reserve and the OCC issued final rules establishing a new comprehensive capital framework for U.S. banking organizations that implement the Basel III capital framework and certain provisions of the Dodd-Frank Act. The final rules seek to strengthen the components of regulatory capital, increase risk-based capital requirements, and make selected changes to the calculation of risk-weighted assets. The final rules, among other things:
| · | revise minimum capital requirements and adjust prompt corrective action thresholds; |
| · | revise the components of regulatory capital and create a new capital measure called “Common Equity Tier 1,” which must constitute at least 4.5% of risk-weighted assets; |
| · | specify that Tier 1 capital consists only of Common Equity Tier 1 and certain “Additional Tier 1 Capital” instruments meeting specified requirements; |
| · | apply most deductions/adjustments to regulatory capital measures to Common Equity Tier 1 and not to other components of capital, potentially requiring higher levels of Common Equity Tier 1 in order to meet minimum ratio requirements; |
| · | increase the minimum Tier 1 capital ratio requirement from 4% to 6%; |
| · | retain the existing risk-based capital treatment for 1-4 family residential mortgage exposures; |
| · | permit most banking organizations, including the Company, to retain, through a one-time permanent election, the existing capital treatment for accumulated other comprehensive income; |
| · | implement a new capital conservation buffer of Common Equity Tier 1 capital equal to 2.5% of risk-weighted assets, which will be in addition to the 4.5% Common Equity Tier 1 capital ratio and be phased in over a three year period beginning January 1, 2016 which buffer is generally required to make capital distributions and pay executive bonuses; |
| · | increase capital requirements for past-due loans, high volatility commercial real estate exposures, and certain short-term loan commitments; |
| · | require the deduction of mortgage servicing assets and deferred tax assets that exceed 10% of Common Equity Tier 1 capital in each category and 15% of Common Equity Tier 1 capital in the aggregate; and |
| · | remove references to credit ratings consistent with the Dodd-Frank Act and establish due diligence requirements for securitization exposures. |
The final rules became effective as of January 1, 2015, for most banking organizations including the Company and the Bank, subject to a transition period for several aspects of the final rules, including the new minimum capital ratio requirements, the capital conservation buffer, and the regulatory capital adjustments and deductions. Requirements to maintain higher levels of capital could adversely impact our return on equity. We believe we will continue to exceed all estimated well-capitalized regulatory requirements under these new rules on a fully phased-in basis.
The Volcker Rule
The Dodd-Frank Act required the federal bank regulatory agencies to adopt rules that prohibit banks and their affiliates from engaging in proprietary trading and investing in and sponsoring certain unregistered investment companies (defined as hedge funds and private equity funds). The statutory provision is commonly called the “Volcker Rule”. On December 10, 2013, the Federal Reserve and other federal agencies issued final rules to implement the Volcker Rule. In relevant part, these final rules would have prohibited banking entities from owning collateralized debt obligations (CDOs) backed by trust preferred securities (TruPS), effective July 21, 2015. However, subsequent to these final rules the U.S. financial regulatory agencies issued an interim rule to exempt CDOs backed by TruPS from the Volker Rule and the final rule, provided that (a) the CDO was established prior to May 19, 2010, (b) the banking entity reasonably believes that the CDO’s offering proceeds were used to invest primarily in TruPS issued by banks with less than $15 billion in assets, and (iii) the banking entity acquired the CDO investment on or before December 10, 2013. At December 31, 2014, we had $266,000 of exempt CDOs with a fair market value of $1,218,000.
The Durbin Amendment
The Dodd-Frank Act included provisions which restrict interchange fees to those which are “reasonable and proportionate” for certain debit card issuers and limits the ability of networks and issuers to restrict debit card transaction routing. This statutory provision is known as the “Durbin Amendment”. The Federal Reserve issued final rules implementing the Durbin Amendment on June 29, 2011. In the final rules, interchange fees for debit card transactions were capped at $0.21 plus five basis points in order to be eligible for a safe harbor such that the fee is conclusively determined to be reasonable and proportionate. Another related rule also permits an additional $0.01 per transaction “fraud prevention adjustment” to the interchange fee if certain Federal Reserve standards are implemented, including an annual review of fraud prevention policies and procedures. With respect to network exclusivity and merchant routing restrictions, it is now required that all debit cards participate in at least two unaffiliated networks so that the transactions initiated using those debit cards will have at least two independent routing channels. While the interchange fee restrictions contained in the Durbin Amendment, and the rules promulgated thereunder, only apply to debit card issuers with $10 billion or more in total consolidated assets, these regulations could significantly affect the interchange fees that financial institutions with less than $10 billion in assets, including the Bank, are able to collect.
Prompt Corrective Action
The Federal Deposit Insurance Corporation Improvement Act of 1991 (“FDICIA”) established a system of prompt corrective action to resolve the problems of undercapitalized institutions. Under this system, the federal banking regulators have established five capital categories (well capitalized, adequately capitalized, undercapitalized, significantly undercapitalized and critically undercapitalized), and are required to take certain mandatory supervisory actions, and are authorized to take other discretionary actions, with respect to institutions in the three undercapitalized categories. The severity of the action will depend upon the capital category in which the institution is placed. Generally, subject to a narrow exception, the banking regulator must appoint a receiver or conservator for an institution that is critically undercapitalized. The federal banking agencies have set the relevant capital level for each category.
An institution that is categorized as undercapitalized, significantly undercapitalized, or critically undercapitalized is required to submit an acceptable capital restoration plan to its appropriate federal regulatory agency. A bank holding company and financial holding company must guarantee that a subsidiary depository institution meets its capital restoration plan, subject to certain limitations. The controlling holding company's obligation to fund a capital restoration plan is limited to the lesser of 5.0% of an undercapitalized subsidiary's assets or the amount required to meet regulatory capital requirements. An undercapitalized institution is also generally prohibited from increasing its average total assets, making acquisitions, establishing any branches or engaging in any new line of business, except under an accepted capital restoration plan or with FDIC approval. In addition, the appropriate federal regulatory agency may treat an undercapitalized institution in the same manner as it treats a significantly undercapitalized institution if it determines that those actions are necessary.
At December 31, 2014, the Bank had the requisite capital level to qualify as “well capitalized” under the regulatory framework for prompt corrective action.
Insurance of Accounts and FDIC Insurance Assessments
The Bank’s deposits are insured by the Deposit Insurance Fund (the “DIF”) of the FDIC up to the standard maximum insurance amount for each deposit insurance ownership category. As of January 1, 2013, the basic limit on FDIC deposit insurance coverage is $250,000 per depositor. Under the FDIA, the FDIC may terminate deposit insurance upon a finding that the institution has engaged in unsafe and unsound practices, is in an unsafe or unsound condition to continue operations, or has violated any applicable law, regulation, rule, order or condition imposed by the FDIC, subject to administrative and potential judicial hearing and review processes.
The DIF is funded by assessments on banks and other depository institutions. As required by the Dodd-Frank Act, in February 2011, the FDIC approved a final rule that changed the assessment base for DIF assessments from domestic deposits to average consolidated total assets minus average tangible equity (defined as Tier 1 capital). In addition, as also required by the Dodd-Frank Act, the FDIC has adopted a new large-bank pricing assessment scheme, set a current target “designated reserve ratio” (described in more detail below) of 2% for the DIF, and established a lower assessment rate schedule when the reserve ratio reaches 1.15% and, in lieu of dividends, provides for a lower assessment rate schedule when the reserve ratio reaches 2% and 2.5%.
An institution’s assessment rate depends upon the institution’s assigned risk category, which is based on supervisory evaluations, regulatory capital levels and certain other factors. Initial base assessment rates ranged from 2.5 to 45 basis points. The FDIC may make the following further adjustments to an institution’s initial base assessment rates: decreases for long-term unsecured debt, including most senior unsecured debt and subordinated debt; increases for holding long-term unsecured debt or subordinated debt issued by other insured depository institutions; and increases for broker deposits in excess of 10% of domestic deposits for insurances not well rated and well capitalized. As of December 31, 2014, our risk category required a quarterly payment of approximately 5.47 basis points per $100 of assessable deposits.
The Dodd-Frank Act transferred to the FDIC increased discretion with regard to managing the required amount of reserves for the DIF, or the “designated reserve ratio.” Among other changes, the Dodd-Frank Act (i) raised the minimum designated reserve ratio to 1.35% and removed the upper limit on the designated reserve ratio, (ii) requires that the designated reserve ratio reach 1.35% by September 2020, and (iii) requires the FDIC to offset the effect on institutions with total consolidated assets of less than $10 billion of increasing of raising the designated reserve ratio from 1.15% to 1.35%. The FDIA requires that the FDIC consider the appropriate level for the designated reserve ratio on at least an annual basis. In October 2010, the FDIC adopted a new DIF restoration plan to ensure that the fund reserve ratio reaches 1.35% by September 30, 2020, as required by the Dodd-Frank Act.
Allowance for Loan and Lease Losses
The Allowance for Loan and Lease Losses (the “ALLL”) represents one of the most significant estimates in the Bank’s financial statements and regulatory reports. Because of its significance, the Bank has established a system by which it develops, maintains, and documents a comprehensive, systematic, and consistently applied process for determining the amounts of the ALLL and the provision for loan and lease losses. The Interagency Policy Statement on the ALLL encourages all banks and federal savings institutions to ensure controls are in place to consistently determine the ALLL in accordance with generally accepted accounting principles in the United States, the federal savings association’s stated policies and procedures, management’s best judgment and relevant supervisory guidance. The Bank’s estimate of credit losses reflects consideration of significant factors that affect the collectability of the portfolio as of the evaluation date.
Safety and Soundness Standards
The Federal Deposit Insurance Act, as amended by the FDICIA and the Riegle Community Development and Regulatory Improvement Act of 1994, requires the federal bank regulatory agencies to prescribe standards, by regulations or guidelines, relating to internal controls, information systems and internal audit systems, loan documentation, credit underwriting, interest rate risk exposure, asset growth, asset quality, earnings, stock valuation and compensation, fees and benefits, and such other operational and managerial standards as the agencies deem appropriate. The federal bank regulatory agencies have adopted a set of guidelines prescribing safety and soundness standards pursuant to FDICIA, as amended. The guidelines establish general standards relating to internal controls and information systems, internal audit systems, loan documentation, credit underwriting, interest rate exposure, asset growth and compensation and fees and benefits. In general, the guidelines require, among other things, appropriate systems and practices to identify and manage the risks and exposures specified in the guidelines. The guidelines prohibit excessive compensation as an unsafe and unsound practice and describe compensation as excessive when the amounts paid are unreasonable or disproportionate to the services performed by an executive officer, employee, director, or principal shareholder. In addition, the agencies adopted regulations that authorize, but do not require, an agency to order an institution that has been given notice by an agency that it is not satisfying any of such safety and soundness standards to submit a compliance plan. If, after being so notified, an institution fails to submit an acceptable compliance plan or fails in any material respect to implement an acceptable compliance plan, the agency must issue an order directing action to correct the deficiency and may issue an order directing other actions of the types to which an undercapitalized institution is subject under the “prompt corrective action” provisions of FDICIA. See “Prompt Corrective Action” above. If an institution fails to comply with such an order, the agency may seek to enforce such order in judicial proceedings and to impose civil money penalties. The federal regulatory agencies also proposed guidelines for asset quality and earnings standards.
Interagency Appraisal and Evaluation Guidelines
In December 2010, the federal banking agencies issued the Interagency Appraisal and Evaluation Guidelines. This guidance, which updated guidance originally issued in 1994, sets forth the minimum regulatory standards for appraisals. It incorporates previous regulatory issuances affecting appraisals, addresses advances in information technology used in collateral evaluation, and clarifies standards for use of analytical methods and technological tools in developing evaluations. This guidance also requires institutions to utilize strong internal controls to ensure reliable appraisals and evaluations and to monitor and periodically update valuations of collateral for existing real estate loans and transactions.
Community Reinvestment Act
Under the CRA, the Bank has an obligation to help meet the credit needs of the entire community, including low- and moderate-income neighborhoods, consistent with safe and sound banking practices. The CRA requires the appropriate federal regulator, in connection with its examination of an insured institution, to assess the institution's record of meeting the credit needs of its community and to take such record into account in its evaluation of certain applications, such as applications for a merger or the establishment of a branch. An unsatisfactory rating may be used as the basis for the denial of an application by the federal banking regulator. The Bank received a satisfactory rating in its most recent CRA examination.
Restrictions on Transactions with Affiliates
We are subject to the provisions of Section 23A of the Federal Reserve Act. Section 23A places limits on: the amount of a bank’s loans or extensions of credit to affiliates; a bank’s investment in affiliates; assets a bank may purchase from affiliates, except for real and personal property exempted by the Federal Reserve; the amount of loans or extensions of credit to third parties collateralized by the securities or obligations of affiliates; and a bank’s guarantee, acceptance or letter of credit issued on behalf of an affiliate.
The total amount of the above transactions is limited in amount, as to any one affiliate, to 10.0% of a bank’s capital and surplus and, as to all affiliates combined, to 20.0% of a bank’s capital and surplus. In addition to the limitation on the amount of these transactions, each of the above transactions must also meet specified collateral requirements. The Bank must also comply with other provisions designed to avoid the taking of low-quality assets.
We are also subject to the provisions of Section 23B of the Federal Reserve Act which, among other things, prohibit an institution from engaging in the above transactions with affiliates unless the transactions are on terms substantially the same, or at least as favorable to the institution or its subsidiaries, as those prevailing at the time for comparable transactions with nonaffiliated companies.
The Dodd-Frank Act changed the definition of “covered transaction” in Sections 23A and 23B and limitations on asset purchases from insiders. With respect to the definition of “covered transaction,” the Dodd-Frank Act defines that term to include the acceptance of debt obligations issued by an affiliate as collateral for a bank’s loan or extension of credit to another person or company. In addition, a “derivative transaction” with an affiliate is now deemed to be a “covered transaction” to the extent that such a transaction causes a bank or its subsidiary to have a credit exposure to the affiliate. In addition, the Dodd-Frank Act provides that the Bank may not “purchase an asset from, or sell an asset to” a Bank insider (or their related interests) unless (1) the transaction is conducted on market terms, and (2) if the proposed transaction represents more than 10% of the capital stock and surplus of the Bank, it has been approved in advance by a majority of the Bank’s non-interested directors.
The Bank is also subject to restrictions on extensions of credit to its executive officers, directors, principal stockholders and their related interests. These extensions of credit must be made on substantially the same terms, including interest rates and collateral, as those prevailing at the time for comparable transactions with third parties, and must not involve more than the normal risk of repayment or present other unfavorable features.
Incentive Compensation
The Federal Reserve, the OCC and the FDIC have issued regulatory guidance (the “Incentive Compensation Guidance”) intended to ensure that the incentive compensation policies of banking organizations do not undermine the safety and soundness of such organizations by encouraging excessive risk-taking. The Federal Reserve reviews, as part of the regular, risk-focused examination process, the incentive compensation arrangements of banking organizations, such as the Company, that are not “large, complex banking organizations.” The findings are included in reports of examination, and deficiencies are incorporated into the organization’s supervisory ratings. Enforcement actions may be taken against a banking organization if its incentive compensation arrangements, or related risk-management control or governance processes, pose a risk to the organization's safety and soundness and the organization is not taking prompt and effective measures to correct the deficiencies.
The Dodd-Frank Act requires the SEC and the federal bank regulatory agencies to establish joint regulations or guidelines that require financial institutions with assets of at least $1 billion to disclose the structure of their incentive compensation practices and prohibit such institutions from maintaining compensation arrangements that encourage inappropriate risk-taking by providing excessive compensation or that could lead to material financial loss to the financial institution. The SEC and the federal bank regulatory agencies proposed such regulations and the comment period expired in May 2011. Although final rules have not been adopted as of February 2015, officials from the Federal Reserve have recently indicated that the U.S. banking regulators are in the process of preparing for public comment a new rule on incentive compensation. If these or other regulations are adopted in a form similar to that initially proposed, they will impose limitations on the manner in which we may structure compensation for our executives. These proposed regulations incorporate the three principles discussed in the Incentive Compensation Guidance.
USA Patriot Act of 2001
In October 2001, the USA Patriot Act of 2001 (the “Patriot Act”) was enacted in response to the terrorist attacks in New York, Pennsylvania, and Washington, D.C. that occurred on September 11, 2001. The Patriot Act impacts financial institutions in particular through its anti-money laundering and financial transparency laws. The Patriot Act amended the Bank Secrecy Act and the rules and regulations of the Office of Foreign Assets Control to establish regulations which, among others, set standards for identifying customers who open an account and promoting cooperation with law enforcement agencies and regulators in order to effectively identify parties that may be associated with, or involved in, terrorist activities or money laundering.
Privacy
Financial institutions are required to disclose their policies for collecting and protecting confidential information. Customers generally may prevent financial institutions from sharing personal financial information with nonaffiliated third parties except for third parties that market the institutions’ own products and services.
Additionally, financial institutions generally may not disclose consumer account numbers to any nonaffiliated third party for use in telemarketing, direct mail marketing or other marketing through electronic mail to consumers. The Bank has established policies and procedures designed to safeguard its customers’ personal financial information and to ensure compliance with applicable privacy laws.
Consumer Protection
The Dodd-Frank Act created the CFPB, a federal regulatory agency that is responsible for implementing, examining and enforcing compliance with federal consumer financial laws for institutions with more than $10 billion of assets and, to a lesser extent, smaller institutions. The Dodd-Frank Act gives the CFPB authority to supervise and regulate providers of consumer financial products and services, and establishes the CFPB’s power to act against unfair, deceptive or abusive practices, and gives the CFPB rulemaking authority in connection with numerous federal consumer financial protection laws (for example, but not limited to, the Truth-in-Lending Act and the Real Estate Settlement Procedures Act).
As a smaller institution (i.e., with assets of $10 billion or less), most consumer protection aspects of the Dodd-Frank Act will continue to be applied to the Company by the Federal Reserve and to the Bank by the OCC. However, the CFPB may include its own examiners in regulatory examinations by a smaller institution’s prudential regulators and may require smaller institutions to comply with certain CFPB reporting requirements. In addition, regulatory positions taken by the CFPB and administrative and legal precedents established by CFPB enforcement activities, including in connection with supervision of larger bank holding companies and financial holding companies, could influence how the Federal Reserve and OCC apply consumer protection laws and regulations to financial institutions that are not directly supervised by the CFPB. The precise impact of the CFPB’s consumer protection activities cannot be forecast.
Stress Testing
As required by the Dodd-Frank Act, the federal banking agencies have implemented stress testing requirements for certain financial institutions, including bank holding companies, financial holding companies and state chartered banks, with more than $10 billion in total consolidated assets. Although these requirements do not apply to institutions with less than $10 billion in total consolidated assets, the federal banking agencies emphasize that all banking organizations, regardless of size, should have the capacity to analyze the potential impact of adverse market conditions or outcomes on the organization’s financial condition. Based on existing regulatory guidance, the Company and the Bank will be expected to consider the institution’s interest rate risk management, commercial real estate concentrations and other credit-related information, and funding and liquidity management during this analysis of adverse outcomes.
Other Regulations
Interest and other charges collected or contracted for by the Bank are subject to federal laws concerning interest rates. The Bank’s loan operations are also subject to federal laws applicable to credit transactions, such as the:
| · | Federal Truth-In-Lending Act, governing disclosures of credit terms to consumer borrowers; |
| · | Home Mortgage Disclosure Act of 1975, requiring financial institutions to provide information to enable the public and public officials to determine whether a financial institution is fulfilling its obligation to help meet the housing needs of the community it serves; |
| · | Equal Credit Opportunity Act, prohibiting discrimination on the basis of race, creed, or other prohibited factors in extending credit; |
| · | Fair Credit Reporting Act of 1978, governing the use and provision of information to credit reporting agencies; and |
| · | rules and regulations of the various federal agencies charged with the responsibility of implementing these federal laws. |
The deposit operations of the Bank are subject to the following:
| · | the Right to Financial Privacy Act, which imposes a duty to maintain confidentiality of consumer financial records and prescribes procedures for complying with administrative subpoenas of financial records; |
| · | the Electronic Funds Transfer Act and Regulation E issued by the Federal Reserve to implement that act, which govern automatic deposits to and withdrawals from deposit accounts and customers’ rights and liabilities arising from the use of automated teller machines and other electronic banking services; and |
| · | the Truth in Savings Act, which requires disclosure of yields and costs of deposits and deposit accounts. |
Effect of Governmental Monetary Policies
Our earnings are affected by the monetary and fiscal policies of the United States government and its agencies, as well as general domestic economic conditions. The Federal Reserve’s power to implement national monetary policy has had, and is likely to continue to have, an important impact on the operating results of financial institutions. The Federal Reserve affects the levels of bank loans, investments, and deposits through its control over the issuance of U.S. government securities and through its regulation of the discount rate on borrowings of member banks and the reserve requirements against member bank deposits. It is difficult to predict the nature, timing or impact of future changes in monetary and fiscal policies.
An investment in our stock involves a number of risks. Investors should carefully consider the following risks as well as the other information in this Report and the documents incorporated by reference before making an investment decision. The realization of any of the risks described below could have a material adverse effect on the Company and the price of our common stock.
Our industry and business may be adversely affected by conditions in the financial markets and economic conditions generally.
In recent years, we have faced a challenging and uncertain economic environment, including a major recession in the U.S. economy from which it is continuing to recover. A return of recessionary conditions and/or further deterioration of national economic conditions could adversely affect the financial condition and operating performance of financial institutions. Specifically, declines in real estate values and sales volumes and increased unemployment levels may result in higher than expected loan delinquencies, increases in levels of non-performing and classified assets and a decline in demand for products and services offered by financial institutions. While economic conditions in the markets in which we operate, the U.S. and worldwide have improved since the recession, there can be no assurance that this improvement will continue. Uncertainty regarding continuing economic improvement may result in changes in consumer and business spending, borrowing and savings habits, which could cause us to incur losses and may adversely affect our results of operations and financial condition.
Our market areas are heavily dependent on, and we have significant credit exposure to, the oil and gas industry.
The economy in a large portion of our market areas is heavily dependent on the oil and gas industry. Many of our customers provide transportation and other services and products that support oil and gas exploration and production activities. As of December 31, 2014, we had approximately $265.0 million in loans to borrowers in the oil and gas industry, representing approximately 20.6% of our total loans outstanding as of that date. The average loan size is approximately $417,000, and the average loan size per relationship is roughly $714,000. The oil and gas industry, especially in Louisiana and Texas, has been subject to significant volatility, including the “oil bust” of the 1980s that severely impacted the economies of many of our market areas. Recent decisions by certain members of the Organization of Petroleum Exporting Countries to maintain higher crude oil production levels have led to increased global oil supplies, which when coupled with the continued exporting restrictions on the US oil and gas industry has resulted in significant declines in domestic market oil prices. Decreased market oil prices have compressed margins for many U.S.-based oil producers, particularly those that utilize higher-cost production technologies such as hydraulic fracking and horizontal drilling, as well as oilfield service providers, energy equipment manufacturers and transportation suppliers, among others. As of December 31, 2014, the price per barrel of crude oil was approximately $53 compared to approximately $98 as of December 31, 2013. If oil prices remain at these low levels for an extended period, the Bank could experience weaker oil and gas related loan demand and increased losses within its oil and gas loan portfolio. Furthermore, a prolonged period of low oil prices could also have a negative impact on the U.S. economy and, in particular, the economies of energy-dominant states such as Louisiana and Texas. Accordingly, if there is a significant downturn in the oil and gas industry it could have a material adverse effect on our business, prospects, financial condition and results of operations.
We may suffer losses in our loan portfolio in excess of our allowance for loan losses.
We have experienced increases in the levels of our non-performing assets and loan charge-offs in recent periods. Our total non-performing assets amounted to $15.1 million, or 0.78% of our total assets, at December 31, 2014 and we had $3.2 million of net loan charge-offs and a $5.6 million provision for loan losses for the year ended December 31, 2014. At December 31, 2014, the ratios of our ALLL to non-performing loans and to total loans outstanding were 103.10% and 0.87%, respectively. Additional increases in our non-performing assets or loan charge-offs could have a material adverse effect on our financial condition and results of operations.
We seek to mitigate the risks inherent in our loan portfolio by adhering to specific underwriting practices. These practices include analysis of a borrower’s prior credit history, financial statements, tax returns and cash flow projections, valuation of collateral based on reports of independent appraisers and verification of liquid assets. Although we believe that our underwriting criteria are appropriate for the various kinds of loans we make, we still may incur losses on loans that meet our underwriting criteria, and these losses may exceed the amounts set aside as reserves in our ALLL. We create an ALLL in our accounting records, based on, among other considerations, the following:
| · | industry historical losses as reported by the FDIC; |
| · | historical experience with our loans; |
| · | evaluation of economic conditions; |
| · | regular reviews of the quality mix, including our distribution of loans by risk grade within our portfolio, and size of our overall loan portfolio; |
| · | regular reviews of delinquencies; and |
| · | the quality of the collateral underlying our loans. |
Although we maintain an ALLL at a level that we believe is adequate to absorb losses inherent in our loan portfolio, changes in economic, operating and other conditions, including conditions which are beyond our control such as a sharp decline in real estate values and changes in interest rates, may cause our actual loan losses to exceed our current allowance estimates. Additions to the ALLL could result in a decrease in net earnings and capital and could hinder our ability to grow. Further, if our actual loan losses exceed the amount reserved, it could have a material adverse effect on our financial condition and results of operations.
We cannot predict the effect of recent or future legislative and regulatory initiatives.
Financial institutions have been the subject of substantial legislative and regulatory changes and may be the subject of further legislation or regulation in the future, including: (i) changes in banking, securities and tax laws and regulations and their application by our regulators, including pursuant to the Dodd-Frank Act, as discussed above in Item 1 under the heading “Business – Supervision and Regulation”; and (ii) changes in the scope and cost of FDIC insurance and other coverage, none of which is within our control. Significant new laws or regulations or changes in, or repeals of, existing laws or regulations may cause our results of operations to differ materially from those we currently anticipate. In addition, the cost and burden of compliance with applicable laws and regulations have significantly increased and could adversely affect our ability to operate profitably. Further, federal monetary policy significantly affects credit conditions for us, as well as for our borrowers, particularly as implemented by the Federal Reserve Board, primarily through open market operations in U.S. government securities, the discount rate for bank borrowings and reserve requirements. A material change in any of these conditions could have a material impact on us or our borrowers, and therefore on our business, prospects, financial condition and results of operations.
We expect to continue to face increased regulation and supervision of our industry as a result of the continuing economic instability, and there may be additional requirements and conditions imposed on us as a result of our participation in the Small Business Lending Fund. Such additional regulation and supervision may increase our costs and limit our ability to pursue business opportunities. The effects of such recently enacted, and proposed, legislation and regulatory programs on us cannot reliably be determined at this time.
The short-term and long-term impact of the changing regulatory capital requirements is uncertain.
Effective January 1, 2015, the Basel III Capital Rules that substantially changed the regulatory risk-based capital rules applicable to the Company and the Bank began to phase in. The Basel III Capital Rules include new minimum risk-based capital and leverage ratios and modify the capital and asset definitions for purposes of calculating those ratios. Among other things, as of January 1, 2015, the Basel III Capital Rules established a new common equity Tier 1 minimum capital requirement of 4.5%, a higher minimum Tier 1capital to risk-weighted assets requirement of 6.0% and a higher total capital to risk-weighted assets of 8.0%. In addition, the Basel III Capital Rules provide, to be considered “well-capitalized”, a new common equity Tier 1 capital requirement of 6.5% and a higher Tier 1 capital to risk-weighted assets requirement of 8.0% that are effective as of January 1, 2015. Moreover, the Basel III Capital Rules limit a banking organization’s capital distributions and certain discretionary bonus payments if the banking organization does not hold a “capital conservation buffer” consisting of an additional 2.5% of common equity Tier 1 capital in addition to the 4.5% minimum common equity Tier 1 requirement and the other amounts necessary to the minimum risk-based capital requirements that will be phased in and fully effective in 2019.
The application of the more stringent capital requirements described above could, among other things, result in lower returns on invested capital, require the raising of additional capital, and result in additional regulatory actions if we were to be unable to comply with such requirements. Furthermore, the imposition of liquidity requirements under the Basel III Capital Rules could result in our having to lengthen the term of our funding, restructure our business models, and/or increase our holdings of liquid assets. Implementation of changes to asset risk weightings for risk based capital calculations, items included or deducted in calculating regulatory capital and/or additional capital conservation buffers could result in us modifying our business strategy and could limit our ability to pay dividends.
The CFPB may reshape the consumer financial laws through rulemaking and enforcement of the prohibitions against unfair, deceptive and abusive business practices, which may directly impact the business operations of depository institutions offering consumer financial products or services, including the Bank.
The CFPB has broad rulemaking authority to administer and carry out the provisions of the Dodd-Frank Act with respect to financial institutions that offer to consumers covered financial products and services. The CFPB has also been directed to write rules identifying practices or acts that are unfair, deceptive or abusive in connection with any transaction with a consumer for a consumer financial product or service, or the offering of a consumer financial product or service. The concept of what may be considered to be an “abusive” practice is new under the law. While the Bank will not be supervised by the CFPB, it will still be subject to the regulations and policies promulgated by the CFPB and may be examined by the OCC for compliance therewith. The costs and limitations related to complying with any new regulations established by the CFPB have yet to be fully determined and could be material. Further, the limitations and restrictions that will be placed upon the Bank with respect to its consumer product offering and services may also produce significant, material effects on the Bank’s (and our) profitability.
We have a concentration of exposure to a number of individual borrowers. Given the size of these loan relationships relative to capital levels and earnings, a significant loss on any one of these loans could materially and adversely affect us.
We have a concentration of exposure to a number of individual borrowers. Our largest exposure to one borrowing relationship as of December 31, 2014, was approximately $16.4 million, which is 7.9% of our total capital. In addition, as of December 31, 2014, the aggregate exposure to the ten largest borrowing relationships was approximately $111.9 million, which was 8.7% of loans and 53.5% of total capital. As a result of this concentration, a change in the financial condition of one or more of these borrowers could result in significant loan losses and have a material adverse effect on our financial condition and results of operations.
A significant percentage of our deposits are attributable to a relatively small number of customers. The loss of all or some of these customers or a significant decline in their deposit balances may have a material adverse effect on our liquidity and results of operations.
As of December 31, 2014, our 20 largest depositors accounted for approximately 15.1% of total deposits, of which our top five depositors accounted for approximately 9.3% of total deposits. The ability to attract these types of deposits has a positive effect on our net interest margin as they provide a relatively low cost of funds to the Bank. While we believe we have strong, long-term relationships with each of these customers, the loss of one or more of our 20 largest deposit customers, or a significant decline in the deposit balances would adversely affect our liquidity and require us to attract new deposits, purchase federal funds or borrow funds on a short term basis to replace such deposits, possibly at interest rates higher than those currently paid on these deposits. This could increase our total cost of funds and could result in a decrease in our net interest income and net earnings. If we were unable to develop alternative funding sources, we may have difficulty funding loans or meeting other deposit withdrawal requirements.
We occasionally purchase non-recourse loan participations from other banks based in part on information provided by the selling bank.
From time to time, we purchase loan participations from other banks in the ordinary course of business, usually without recourse to the selling bank. As of December 31, 2014, we had approximately $34.7 million in purchased loan participations, or approximately 2.7% of our total loan portfolio. When we purchase loan participations, we apply the same underwriting standards as we would to loans that we directly originate and seek to purchase only loans that would satisfy these standards. However, we are not as familiar with the borrower and may rely on information provided to us by the selling bank and typically must rely on the selling bank’s administration of the loan relationship. We therefore have less control over, and may incur more risk with respect to, loan participations that we purchase from selling banks as compared to loans that we originate.
Our focus on lending to small to mid-sized community-based businesses may increase our credit risk.
Most of our commercial business and commercial real estate loans are made to small business or middle market customers. These businesses generally have fewer financial resources in terms of capital or borrowing capacity than larger entities and have a heightened vulnerability to economic conditions. If general economic conditions in the markets in which we operate negatively impact this important customer sector, our results of operations and financial condition and the value of our common stock may be adversely affected. Moreover, a portion of these loans have been made by us in recent years and the borrowers may not have experienced a complete business or economic cycle. Furthermore, the deterioration of our borrowers’ businesses may hinder their ability to repay their loans with us, which could have a material adverse effect on our financial condition and results of operations.
Our loan portfolio includes a substantial percentage of commercial and industrial loans, which may be subject to greater risks than those related to residential loans.
Our loan portfolio includes a substantial percentage of commercial and industrial loans. Commercial and industrial loans generally carry larger loan balances and historically have involved a greater degree of financial and credit risks than residential first mortgage loans. Repayment of our commercial and industrial loans is often dependent on cash flow of the borrower, which may be unpredictable, and collateral securing these loans may fluctuate in value. Our commercial and industrial loans are primarily made based on the cash flow of the borrower and secondarily on the underlying collateral provided by the borrower. Most often, this collateral is accounts receivable, inventory, equipment, or real estate. In the case of loans secured by accounts receivable, the availability of funds for the repayment of these loans may be substantially dependent on the ability of the borrower to collect amounts due from its customers. Other collateral securing loans may depreciate over time, may be difficult to appraise and may fluctuate in value based on the success of the business. At December 31, 2014, commercial and industrial loans totaled approximately 36.4% of our total loan portfolio. Adverse changes in local economic conditions impacting our business borrowers could have a material adverse effect on our business, prospects, financial condition and results of operations.
We have a high concentration of loans secured by real estate, and an adverse change in the real estate market could have a material effect on our financial condition and results of operations.
A significant portion of our loan portfolio is dependent on real estate. At December 31, 2014, approximately 53.8% of our loans had real estate as a primary or secondary component of collateral. The collateral in each case provides an alternate source of repayment if the borrower defaults and may deteriorate in value during the time the credit is extended. An adverse change in the economy affecting values of real estate in our primary markets could significantly impair the value of real estate collateral and the ability to sell real estate collateral upon foreclosure. Furthermore, it is likely that we would be required to increase the provision for loan losses. A related risk in connection with loans secured by real estate is the effect of unknown or unexpected environmental contamination, which could make the real estate effectively unmarketable or otherwise significantly reduce its value as collateral. If we were required to liquidate real estate collateral securing a loan to satisfy the debt during a period of reduced real estate values or to increase the allowance for loan losses, it could have a material adverse effect on our financial condition and results of operations.
We may face risks with respect to future expansion and acquisition opportunities.
We have expanded our business in part through acquisitions and will continue to look at future acquisitions as a way to further increase our growth. However, we cannot assure you that we will be successful in completing any future acquisitions. Further, failure to realize the potential expected revenue increases, cost savings, increases in geographic or product presence, and/or other projected benefits from an acquisition could have a material adverse effect on our business, prospects, financial condition and results of operations.
We may seek merger or acquisition partners that are culturally similar and have experienced management and possess either significant market presence or have potential for improved profitability through financial management, economies of scale or expanded services. We cannot say with any certainty that we will be able to consummate, or if consummated, successfully integrate future acquisitions or that we will not incur disruptions or unexpected expenses in integrating such acquisitions. In attempting to make such acquisitions, we anticipate competing with other financial institutions, many of which have greater financial and operational resources. Acquiring other banks, businesses, or branches involves various risks commonly associated with acquisitions, including, among other things:
| · | potential exposure to unknown or contingent liabilities of the target company; |
| · | expansion into new markets that may have different characteristics than our current markets and may otherwise present management challenges; |
| · | exposure to potential asset quality issues of the target company; |
| · | difficulty and expense of integrating the operations and personnel of the target company; |
| · | potential disruption to our business; |
| · | potential diversion of management’s time and attention; |
| · | the possible loss of key employees and customers of the target institution; |
| · | difficulty in estimating the value of the target company; and |
| · | potential changes in banking, accounting or tax laws or regulations that may affect the target institution. |
We are subject to environmental liability risk associated with our lending activities.
A significant portion of the Bank’s loan portfolio is secured by real property. During the ordinary course of business, the Bank may foreclose on and take title to properties securing certain loans. In doing so, there is a risk that hazardous or toxic substances could be found on these properties. If hazardous or toxic substances are found, we may be liable for remediation costs, as well as for personal injury and property damage. Environmental laws may require us to incur substantial expenses and may materially reduce the affected property’s value or limit the Bank’s ability to use or sell the affected property. In addition, future laws or more stringent interpretations or enforcement policies with respect to existing laws may increase our exposure to environmental liability. The remediation costs and any other financial liabilities associated with an environmental hazard could have a material adverse effect on our financial condition and results of operations.
Our future earnings could be adversely affected by non-cash charges for goodwill impairment, if a future test of goodwill indicates that goodwill has been impaired.
As prescribed by Accounting Standards Codification (“ASC”) Topic 350, “Intangibles — Goodwill and Other,” we undertake an annual review of the goodwill asset balance reflected in our financial statements. We conduct an annual review in the fourth quarter of each year, unless there has been a triggering event prescribed by applicable accounting rules that warrants an earlier interim testing for possible goodwill impairment. After our most recent annual review in the fourth quarter of 2014, we concluded there was no goodwill impairment as of such date. As of December 31, 2014, we had $42.2 million in goodwill. Future goodwill impairment tests may result in future non-cash charges, which could adversely affect our earnings for any such future period.
Changes in the fair value of our securities may reduce our stockholders’ equity and net income.
At December 31, 2014, $277.0 million of our securities (at fair value) were classified as available-for-sale. At such date, the aggregate net unrealized gain on our available-for-sale securities was $4.4 million. We increase or decrease stockholders’ equity by the amount of change from the unrealized gain or loss (the difference between the estimated fair value and the amortized cost) of our available-for-sale securities portfolio, net of the related tax, under the category of accumulated other comprehensive income/loss. Therefore, a decline in the estimated fair value of this portfolio will result in a decline in reported stockholders’ equity, as well as book value per common share and tangible book value per common share. This decrease will occur even though the securities are not sold. In the case of debt securities, if these securities are never sold and there are no credit impairments, the decrease will be recovered over the life of the securities. In the case of equity securities which have no stated maturity, the declines in fair value may or may not be recovered over time.
We monitor the fair value of our entire securities portfolio as part of our ongoing other than temporary impairment (“OTTI”) evaluation process. No assurance can be given that we will not need to recognize OTTI charges related to securities in the future. In addition, as a condition to membership in the Federal Home Loan Bank of Dallas (“FHLB-Dallas”), we are required to purchase and hold a certain amount of FHLB-Dallas stock. Our stock purchase requirement is based, in part, upon the outstanding principal balance of advances from the FHLB-Dallas. At December 31, 2014, we had stock in the FHLB-Dallas totaling approximately $3.2 million. The FHLB-Dallas stock held by us is carried at cost and is subject to recoverability testing under applicable accounting standards. For the year ended December 31, 2014, we did not recognize an impairment charge related to our FHLB-Dallas stock holdings. There can be no assurance, however, that future negative changes to the financial condition of the FHLB-Dallas may not require us to recognize an impairment charge with respect to such holdings.
Loss of key officers or employees may disrupt relationships with certain customers.
As a community bank, our business is primarily relationship-driven in that many of our key employees have extensive customer relationships. In addition, our success has been and will continue to be greatly influenced by the ability to retain existing senior management and, with expansion, to attract and retain qualified additional senior and middle management. We do not have employment agreements with any of our executive officers. Loss of a key employee with such customer relationships may lead to the loss of business if the customers were to follow that employee to a competitor. While we believe our relationship with our key personnel is good, we cannot guarantee that all of our key personnel will remain with our organization. Loss of such key personnel, should they enter into an employment relationship with one of our competitors, could result in the loss of some of our customers.
A natural disaster, especially one affecting one of our market areas, could adversely affect us.
Since most of our business is conducted in Louisiana and Texas, most of our credit exposure is in those states. Historically, Louisiana and Texas have been vulnerable to natural disasters. Therefore, we are susceptible to the risks of natural disasters, such as hurricanes, floods and tornadoes. Natural disasters could harm our operations directly through interference with communications, including the interruption or loss of our websites, which would prevent us from gathering deposits, originating loans and processing and controlling our flow of business, as well as through the destruction of facilities and our operational, financial and management information systems. A natural disaster or recurring power outages may also impair the value of our largest class of assets, our loan portfolio, as uninsured or underinsured losses, including losses from business disruption, may reduce borrowers’ ability to repay their loans. Disasters may also reduce the value of the real estate securing our loans, impairing our ability to recover on defaulted loans through foreclosure and making it more likely that we would suffer losses on defaulted loans. Although we have implemented several back-up systems and protections (and maintain business interruption insurance), these measures may not protect us fully from the effects of a natural disaster. The occurrence of natural disasters in our market areas could have a material adverse effect on our business, prospects, financial condition and results of operations.
Our profitability is vulnerable to interest rate fluctuations.
Our profitability is dependent to a large extent on net interest income, which is the difference between our interest income on interest-earning assets, such as loans and investment securities, and interest expense on interest-bearing liabilities, such as deposits and borrowings. When interest-bearing liabilities mature or reprice more quickly than interest-earning assets in a given period, a significant increase in market rates of interest could adversely affect net interest income. Conversely, when interest-earning assets mature or reprice more quickly than interest-bearing liabilities, falling interest rates could result in a decrease in net interest income. For example, as loans in our portfolio have matured, they have been replaced by loans with lower yields across all loan categories versus year ago levels. We expect this trend to continue during 2015. Furthermore, some of our variable interest rate loans have minimum fixed interest rates (“floors”) that are currently above the contractual variable interest rate. If interest rates rise, the interest income from our variable interest rate loans with floors may not increase as quickly as interest expense on our liabilities, which would negatively impact our net interest income.
The ability to shift earning assets from lower margin securities to higher margin loans has offset some of the negative impact to our net interest margins from the prolonged low interest rate environment. However, we do not expect this trend to continue in 2015 given liquidity constraints.
In periods of increasing interest rates, loan originations may decline, depending on the performance of the overall economy, which may adversely affect income from lending activities. Also, increases in interest rates could adversely affect the market value of fixed income assets. In addition, an increase in the general level of interest rates may affect the ability of certain borrowers to pay the interest and principal on their obligations.
Non-performing assets take significant time to resolve and adversely affect our results of operations and financial condition.
Non-performing assets adversely affect our net earnings in various ways. Until economic and market conditions improve, we expect to incur provisions for loan losses relating to an increase in non-performing assets. We generally do not record interest income on non-performing loans or other real estate owned, thereby adversely affecting our earnings, and increasing our loan administration costs. When we take collateral in foreclosures and similar proceedings, we mark the related asset to the then fair market value of the collateral less estimated selling costs, which may result in a loss. An increase in the level of non-performing assets increases our risk profile and may impact the capital levels our regulators believe are appropriate in light of the ensuing risk profile. While we reduce problem assets through loan sales, workouts, restructurings and otherwise, decreases in the value of the underlying collateral, or in these borrowers’ performance or financial condition, whether or not due to economic and market conditions beyond our control, could adversely affect our business, results of operations and financial condition. In addition, the resolution of non-performing assets requires significant commitments of time from management and our directors, which can be detrimental to the performance of their other responsibilities. There can be no assurance that we will not experience future increases in non-performing assets.
The soundness of other financial institutions could adversely affect us.
Financial services institutions are interrelated as a result of trading, clearing, counterparty, or other relationships. We have exposure to many different industries and counterparties, and we routinely execute transactions with counterparties in the financial services industry, including commercial banks, brokers and dealers, investment banks and other institutional clients. Many of these transactions expose us to credit risk in the event of a default by a counterparty or client. In addition, our credit risk may be exacerbated when the collateral held by us cannot be realized or is liquidated at prices not sufficient to recover the full amount of the credit or derivative exposure due to us. Any such losses could have a material adverse effect on our business, prospects, financial condition and results of operations.
We operate within a highly regulated environment and our business and results are affected by the regulations to which we are subject.
We operate within a highly regulated environment. The regulations to which we are subject will continue to have an impact on our operations and the degree to which we can grow and be profitable. Certain regulators, to which we are subject, have significant power in reviewing our operations and approving our business practices. In recent years the Bank, as well as other financial institutions, has experienced increased regulation and regulatory scrutiny, often requiring additional resources. In addition, investigations or proceedings brought by regulatory agencies may result in judgments, settlements, fines, penalties, or other results adverse to us. There is no assurance that any change to the regulatory requirements to which we are subject, or the way in which such regulatory requirements are interpreted or enforced, will not have a negative effect on our ability to conduct our business and our results of operations.
We rely heavily on technology and computer systems. The negative effects of computer system failures and unethical individuals with the technological ability to cause disruption of service could adversely affect our reputation and our ability to generate deposits.
Our ability to compete depends on our ability to continue to adapt and deliver technology on a timely and cost-effective basis to meet customers’ demands for financial services. We provide our customers the ability to bank online and many customers now remotely submit deposits to us through remote-capture systems. The secure transmission of confidential information over the Internet is a critical element of these services. Our network could be vulnerable to unauthorized access, computer viruses, phishing schemes and other security problems. We may be required to spend significant capital and other resources to protect against the threat of security breaches and computer viruses, or to alleviate problems caused by security breaches or viruses. To the extent that our activities or the activities of our customers involve the storage and transmission of confidential information, security breaches and viruses could expose us to claims, litigation and other possible liabilities. Any inability to prevent security breaches or computer viruses could also cause existing customers to lose confidence in our systems and could adversely affect our reputation and our ability to generate deposits.
We rely on third parties to provide key components of our business infrastructure.
Third parties provide key components of our business operations such as data processing, recording and monitoring transactions, online banking interfaces and services, Internet connections and network access. While we have selected these third party vendors carefully, we do not control their actions. Any problems caused by these third parties, including those resulting from disruptions in communication services provided by a vendor, failure of a vendor to handle current or higher volumes, cyber-attacks and security breaches at a vendor, failure of a vendor to provide services for any reason or poor performance of services, could adversely affect our ability to deliver products and services to our customers and otherwise conduct our business. Financial or operational difficulties of a third party vendor could also hurt our operations if those difficulties interfere with the vendor’s ability to serve us. Furthermore, our vendors could also be sources of operational and information security risk to us, including from breakdowns or failures of their own systems or capacity constraints. Replacing these third party vendors could also create significant delay and expense. Accordingly, use of such third parties creates an unavoidable inherent risk to our business operations.
Consumers may decide not to use banks to complete their financial transactions.
Technology and other changes are allowing parties to complete financial transactions through alternative methods that historically have involved banks. For example, consumers can now maintain funds that would have historically been held as bank deposits in brokerage accounts, mutual funds or general-purpose reloadable prepaid cards. Consumers can also complete transactions such as paying bills and/or transferring funds directly without the assistance of banks. The process of eliminating banks as intermediaries, known as “disintermediation,” could result in the loss of fee income, as well as the loss of customer deposits and the related income generated from those deposits. The loss of these revenue streams and the lower cost of deposits as a source of funds could have a material adverse effect on our financial condition and results of operations.
Share ownership may be diluted by the issuance of additional shares of common stock in the future.
Our stock incentive plan provides for the granting of stock incentives to directors, officers, and employees. As of December 31, 2014, there were 358,073 shares issued under options. Likewise, approximately 457,500 shares, including shares issuable under currently outstanding options, may be issued in the future to directors, officers, and employees under our existing equity incentive plans. In addition, in 2009, as part of our participation in the Treasury’s Capital Purchase Program (“CPP”), we also issued a stock purchase warrant that currently entitles the holder to purchase 104,384 shares of our common stock at an exercise price of $14.37 per share. It is probable that options and/or warrants will be exercised during their respective terms if the stock price exceeds the exercise price of the particular option or warrant. The incentive plan also provides that all issued options automatically and fully vest upon a change in control. If the options are exercised, share ownership will be diluted.
Additionally, share ownership of our common stock will be diluted from shares issued upon conversion of the Series C Preferred Stock issued in the PSB acquisition. As of December 31, 2014, there were 93,680 shares of Series C Preferred Stock issued and outstanding. Holders may convert the Series C Preferred Stock at any time into shares of the Company’s common stock at a conversion price of $18.00 per share, subject to customary antidilution adjustments. In addition, on or after the fifth anniversary of the closing date, the Company will have the option to require conversion of the Series C Preferred Stock if the closing price of the Company’s common stock for 20 trading days within any period of 30 consecutive trading days, exceeds 130% of the conversion price.
In addition, our articles of incorporation authorize the issuance of up to 30,000,000 shares of common stock and 5,000,000 shares of preferred stock, but do not provide for preemptive rights to the stockholders; therefore, stockholders will not automatically have the right to subscribe for additional shares. As a result, if we issue additional shares to raise additional capital or for other corporate purposes, you may be unable to maintain your pro rata ownership in the Company.
The holders of our preferred stock and trust preferred securities have rights that are senior to those of stockholders and that may impact our ability to pay dividends on our common stock and net income available to our common stockholders.
At December 31, 2014, we had outstanding $22.2 million of trust preferred securities. These securities are senior to shares of common stock. As a result, we must make payments on our trust preferred securities before any dividends can be paid on our common stock; moreover, in the event of our bankruptcy, dissolution, or liquidation, the obligations outstanding with respect to our trust preferred securities must be satisfied before any distributions can be made to our stockholders. While we have the right to defer dividends on the trust preferred securities for a period of up to five years, if any such election is made, no dividends may be paid to our common or preferred stockholders during that time.
In addition, with respect to the $32.0 million in Series B Preferred Stock outstanding that was issued to the Treasury in the SBLF Transaction, we are required to pay cumulative dividends on the Series B Preferred Stock at an annual rate. The dividend rate was set at 1.00% for the fourth quarter of 2013 due to attaining the target 10% growth rate in qualified small business loans during the second quarter of 2013. Beginning February 25, 2016, the dividend rate will increase to 9% per annum. The $10.0 million in Series C Preferred Stock that was issued in connection with the PSB acquisition, calls for the non-cumulative payment of dividends at an annual rate of 4.0%. Dividends paid on our Series B Preferred Stock or Series C Preferred Stock will also reduce the net income available to our common stockholders and our earnings per common share. We may not declare or pay dividends on our common stock or repurchase shares of our common stock without first having paid all accrued preferred dividends that are due.
Only a limited trading market exists for our common stock, which could lead to price volatility.
Our common stock is listed for trading on the NYSE under the trading symbol “MSL,” but there is low trading volume in our common stock. The limited trading market for our common stock may cause fluctuations in the market value of our common stock to be exaggerated, leading to price volatility in excess of that which might occur in a more active trading market of our common stock. Future sales of substantial amounts of common stock in the public market, or the perception that such sales may occur, could adversely affect the prevailing market price of our common stock. In addition, even if a more active market in our common stock develops, we cannot assure you that such a market will continue.
Our directors and executive management own a significant number of shares of stock, allowing further control over business and corporate affairs.
Our directors and executive officers beneficially own approximately 2.1 million shares, or 18.7%, of our outstanding common stock as of December 31, 2014. As a result, in addition to their day-to-day management roles, they will be able to exercise significant influence on our business as stockholders, including influence over election of the Board and the authorization of other corporate actions requiring shareholder approval. In deciding on how to vote on certain proposals, our stockholders should be aware that our directors and executive officers may have interests that are different from, or in addition to, the interests of our stockholders generally.
Provisions of our articles of incorporation and by-laws, Louisiana law, and state and federal banking regulations, could delay or prevent a takeover by a third party.
Our articles of incorporation and by-laws could delay, defer, or prevent a third party takeover, despite possible benefit to the stockholders, or otherwise adversely affect the price of our common stock. Our governing documents:
| · | permit directors to be removed by stockholders only for cause and only upon an 80% vote; |
| · | require 80% of the voting power for stockholders to amend the by-laws, call a special meeting, or amend the articles of incorporation, in each case if the proposed action was not approved by the Board; |
| · | authorize a class of preferred stock that may be issued in series with terms, including voting rights, established by the Board without stockholder approval; |
| · | authorize approximately 30 million shares of common stock and 5 million shares of preferred stock that may be issued by the Board without shareholder approval; |
| · | classify our Board with staggered three year terms, preventing a change in a majority of the Board at any annual meeting; |
| · | require advance notice of proposed nominations for election to the Board and business to be conducted at a shareholder meeting; and |
| · | require 80% of the voting power for stockholders to approve business combinations not approved by the Board. |
These provisions would likely preclude a third party from removing incumbent directors and simultaneously gaining control of the Board by filling the vacancies thus created with its own nominees. Under the classified Board provisions, it would take at least two elections of directors for any individual or group to gain control of the Board. Accordingly, these provisions could discourage a third party from initiating a proxy contest, making a tender offer or otherwise attempting to gain control. These provisions may have the effect of delaying consideration of a shareholder proposal until the next annual meeting unless a special meeting is called by the Board or the chairman of the Board. Moreover, even in the absence of an attempted takeover, the provisions make it difficult for stockholders dissatisfied with the Board to effect a change in the Board’s composition, even at annual meetings.
Also, we are subject to the provisions of the Louisiana Business Corporation Law (“LBCL”), which provides that we may not engage in certain business combinations with an “interested shareholder” (generally defined as the holder of 10.0% or more of the voting shares) unless (1) the transaction was approved by the Board before the interested shareholder became an interested shareholder or (2) the transaction was approved by at least two-thirds of the outstanding voting shares not beneficially owned by the interested shareholder and 80% of the total voting power or (3) certain conditions relating to the price to be paid to the stockholders are met.
The LBCL also addresses certain transactions involving “control shares,” which are shares that would have voting power with respect to the Company within certain ranges of voting power. Control shares acquired in a control share acquisition have voting rights only to the extent granted by a resolution approved by our stockholders. If control shares are accorded full voting rights and the acquiring person has acquired control shares with a majority or more of all voting power, stockholders of the issuing public corporation have dissenters’ rights as provided by the LBCL.
Our future ability to pay dividends and repurchase stock is subject to restrictions.
Since we are a holding company with no significant assets other than the Bank, we have no material source of income other than dividends received from the Bank. Therefore, our ability to pay dividends to our stockholders will depend on the Bank’s ability to pay dividends to us. Moreover, banks and financial holding companies are both subject to certain federal and state regulatory restrictions on cash dividends. We are also restricted from paying dividends if we have deferred payments of the interest on, or an event of default has occurred with respect to, our trust preferred securities, Series B Preferred Stock or Series C Preferred Stock. Additionally, terms and conditions of our outstanding shares of preferred stock place certain restrictions and limitations on our common stock dividends and repurchases of our common stock.
A shareholder’s investment is not an insured deposit.
An investment in our common stock is not a bank deposit and is not insured or guaranteed by the FDIC or any other government agency. Your investment in our common stock will be subject to investment risk and you may lose all or part of your investment.
None.
We lease our principal executive and administrative offices and principal facility in Lafayette, Louisiana under a lease expiring July 31, 2021. In addition to our principal facility, we also have eight other branches located in Lafayette, Louisiana, three in New Iberia, Louisiana, four in Baton Rouge, Louisiana, three in Natchitoches, Louisiana, two in Many, Louisiana, two in Alexandria, Louisiana, two in Lake Charles, Louisiana, two in Houma, Louisiana, and one branch in each of the following Louisiana cities: Breaux Bridge, Cecilia, St. Martinville, Larose, Jeanerette, Opelousas, Morgan City, Jennings, Sulphur, Thibodaux, Robeline, Greenwood, Zwolle and Mansfield. We also have an operations office in Breaux Bridge, Louisiana. Thirty-one of these offices are owned and eleven are leased.
Additionally, in our Texas market area we have two full service branches located in each of the following Texas cities: Beaumont and Houston. Our additional full service branches in the Texas market area are located in Vidor, Conroe, Magnolia, College Station, Dallas, Fort Worth, Mesquite, Rockwall, Greenville, White Rock, Tyler and Texarkana. Of these offices, ten are owned and six are leased.
The Bank has been named as a defendant in various other legal actions arising from normal business activities in which damages of various amounts are claimed. While the amount, if any, of ultimate liability with respect to such matters cannot be currently determined, management believes, after consulting with legal counsel, that any such liability will not have a material adverse effect on the Company’s consolidated financial position, results of operations, or cash flows. However, in the event of unexpected future developments in these matters, if the ultimate resolution of any such matter is unfavorable, the result may be material to the Company’s consolidated financial position, consolidated results of operations or consolidated cash flows.
Not applicable.
Executive Officers of the Registrant
The names, ages as of December 31, 2014, and positions of our current executive officers are listed below along with their business experience during the past five years.
C. R. Cloutier, 67 – President, Chief Executive Officer and Director of the Company and the Bank since 1984.
Troy Cloutier, 41 – Senior Executive Vice President and Chief Banking Officer of the Company and the Bank since February 2011. Prior to his appointment as Chief Banking Officer, Mr. Cloutier had been with MidSouth Bank for 18 years and most recently served as Senior Vice President and Regional President for the South and East Louisiana Regions in addition to managing due diligence for the Bank’s mergers and acquisitions team. Troy Cloutier is the son of C. R. Cloutier.
James R. McLemore, 55 – Senior Executive Vice President and Chief Financial Officer of the Company and the Bank since July 2009.
Jeffery L. Blum, 46 – Senior Executive Vice President and Chief Credit Officer of the Company and the Bank since August 2014. Prior to joining the Company and the Bank, Mr. Blum worked for Whitney Bank since 1993, having most recently served as Morgan City area president.
All executive officers are appointed for one year terms expiring at the first meeting of the Board of Directors after the annual stockholders meeting next succeeding his or her election and until his or her successor is elected and qualified.
Item 5 - Market for Registrant's Common Equity, Related Shareholder Matters, and Issuer Purchases of Equity Securities
As of February 28, 2015, there were 918 common stockholders of record. The Company’s common stock trades on the NYSE under the symbol “MSL.” Prior to September 23, 2013, our common stock traded on the NYSE MKT under the symbol “MSL.” The high and low sales price for the past eight quarters has been provided in the Selected Quarterly Financial Data tables that are included with this filing under Item 8 and is incorporated herein by reference.
Cash dividends totaling $4.0 million were declared to common stockholders during 2014. The regular quarterly dividend of $0.08 per share was paid for the first quarter of 2014. The regular quarterly dividend was increased to $0.09 per share for the second, third and fourth quarters of 2014, for a total of $0.35 per share for the year. Cash dividends totaling $3.5 million were declared to common stockholders during 2013. The regular quarterly dividend of $0.07 per share was paid for the first quarter of 2013. The regular quarterly dividend was increased to $0.08 per share for the second, third and fourth quarters of 2013, for a total of $0.31 per share for the year.
Under the Louisiana law, we may not pay a dividend if (i) we are insolvent or would thereby be made insolvent, or (ii) the declaration or payment thereof would be contrary to any restrictions contained in our articles of incorporation. Our primary source of funds for dividends is the dividends we receive from the Bank; therefore, our ability to declare dividends is highly dependent upon future earnings, financial condition, and results of operation of the Bank as well as applicable legal restrictions on the Bank’s ability to pay dividends and other relevant factors. The Bank currently has the ability to declare dividends to us without prior approval of our primary regulators. However, the Bank’s ability to pay dividends to us will be prohibited if the result would cause the Bank’s regulatory capital to fall below minimum requirements. Additionally, dividends to us cannot exceed a total of the Bank’s current year and prior two years’ earnings, net of dividends paid to us in those years.
Pursuant to the terms of our Series B Preferred Stock, Series C Preferred Stock, and the terms of our trust preferred securities, we are prohibited from paying dividends on our common stock during any period in which we have deferred interest payments on either the Series B Preferred Stock, Series C Preferred Stock or the trust preferred securities.
The following graph compares the cumulative total return on our common stock over a period beginning December 31, 2009 with (1) the cumulative total return on the stocks included in the Russell 3000 and (2) the cumulative total return on the stocks included in the SNL Securities, LC (“SNL”) $1B - $5B Bank Index. The comparison assumes an investment in our common stock on the indices of $100 at December 31, 2009 and assumes that all dividends were reinvested during the applicable period.
MidSouth Bancorp, Inc.
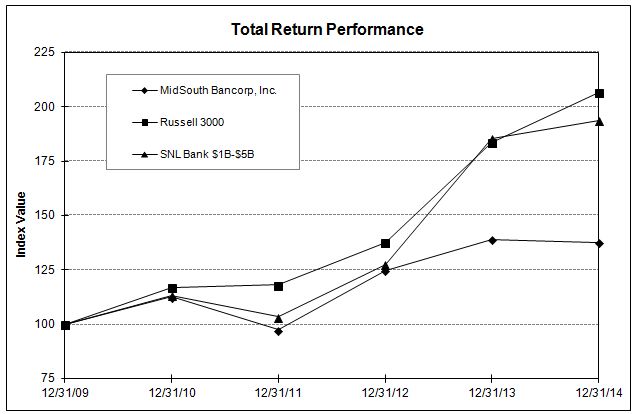
|
Period Ending
|
||||||||||||||||||||||||
|
Index
|
12/31/09
|
12/31/10
|
12/31/11
|
12/31/12
|
12/31/13
|
12/31/14
|
||||||||||||||||||
|
MidSouth Bancorp, Inc.
|
100.00
|
112.64
|
97.44
|
124.90
|
139.13
|
137.70
|
||||||||||||||||||
|
Russell 3000
|
100.00
|
116.93
|
118.13
|
137.52
|
183.66
|
206.72
|
||||||||||||||||||
|
SNL Bank $1B-$5B
|
100.00
|
113.35
|
103.38
|
127.47
|
185.36
|
193.81
|
||||||||||||||||||
The stock price information shown above is based on historical data and should not be considered indicative of future price performance.
|
At and For the Year Ended December 31,
|
||||||||||||||||||||
|
2014
|
2013
|
2012
|
2011
|
2010
|
||||||||||||||||
|
(dollars in thousands, except per share data)
|
||||||||||||||||||||
|
Interest income
|
$
|
83,487
|
$
|
83,203
|
$
|
61,022
|
$
|
51,007
|
$
|
48,124
|
||||||||||
|
Interest expense
|
(5,807
|
)
|
(6,539
|
)
|
(5,840
|
)
|
(5,802
|
)
|
(7,395
|
)
|
||||||||||
|
Net interest income
|
77,680
|
76,664
|
55,182
|
45,205
|
40,729
|
|||||||||||||||
|
Provision for loan losses
|
(5,625
|
)
|
(3,050
|
)
|
(2,050
|
)
|
(3,925
|
)
|
(5,020
|
)
|
||||||||||
|
Noninterest income
|
24,422
|
19,319
|
14,944
|
13,061
|
14,857
|
|||||||||||||||
|
Noninterest expenses
|
(70,009
|
)
|
(72,606
|
)
|
(54,655
|
)
|
(49,304
|
)
|
(43,818
|
)
|
||||||||||
|
Earnings before income taxes
|
26,468
|
20,327
|
13,421
|
5,037
|
6,748
|
|||||||||||||||
|
Income tax expense
|
(7,358
|
)
|
(6,151
|
)
|
(3,779
|
)
|
(564
|
)
|
(968
|
)
|
||||||||||
|
Net earnings
|
$
|
19,110
|
$
|
14,176
|
$
|
9,642
|
$
|
4,473
|
$
|
5,780
|
||||||||||
|
Preferred dividend requirement
|
(698
|
)
|
(1,332
|
)
|
(1,547
|
)
|
(1,802
|
)
|
(1,198
|
)
|
||||||||||
|
Net earnings available to common stockholders
|
$
|
18,412
|
$
|
12,844
|
$
|
8,095
|
$
|
2,671
|
$
|
4,582
|
||||||||||
|
Basic earnings per common share
|
$
|
1.63
|
$
|
1.14
|
$
|
0.77
|
$
|
0.27
|
$
|
0.47
|
||||||||||
|
Diluted earnings per common share
|
$
|
1.58
|
$
|
1.12
|
$
|
0.77
|
$
|
0.27
|
$
|
0.47
|
||||||||||
|
Dividends per common share
|
$
|
0.35
|
$
|
0.31
|
$
|
0.28
|
$
|
0.28
|
$
|
0.28
|
||||||||||
|
Total loans
|
$
|
1,284,431
|
$
|
1,137,554
|
$
|
1,046,940
|
$
|
746,305
|
$
|
580,812
|
||||||||||
|
Total assets
|
1,936,740
|
1,851,160
|
1,851,728
|
1,396,756
|
1,002,339
|
|||||||||||||||
|
Total deposits
|
1,585,234
|
1,518,803
|
1,551,904
|
1,164,806
|
800,772
|
|||||||||||||||
|
Long-term obligations
|
48,444
|
57,087
|
58,512
|
15,465
|
15,465
|
|||||||||||||||
|
Selected ratios:
|
||||||||||||||||||||
|
Loans to assets
|
66.32
|
%
|
61.45
|
%
|
56.54
|
%
|
53.43
|
%
|
58.00
|
%
|
||||||||||
|
Loans to deposits
|
81.02
|
%
|
74.90
|
%
|
67.46
|
%
|
64.07
|
%
|
72.53
|
%
|
||||||||||
|
Deposits to assets
|
81.85
|
%
|
82.05
|
%
|
83.81
|
%
|
83.39
|
%
|
79.89
|
%
|
||||||||||
|
Return on average assets
|
0.97
|
%
|
0.69
|
%
|
0.58
|
%
|
0.24
|
%
|
0.47
|
%
|
||||||||||
|
Return on average common equity
|
11.43
|
%
|
8.64
|
%
|
6.05
|
%
|
2.22
|
%
|
3.92
|
%
|
||||||||||
The purpose of this discussion and analysis is to highlight changes in the financial condition of the Company and on its results of operations during 2014, 2013 and 2012. This discussion and analysis is intended to highlight and supplement information presented elsewhere in this annual report on Form 10-K, particularly the consolidated financial statements and related notes appearing in Item 8.
We are a financial holding company, headquartered in Lafayette, Louisiana, that through our community banking subsidiary, MidSouth Bank, N.A., operates 58 offices in Louisiana and Texas. We had approximately $1.9 billion in consolidated assets as of December 31, 2014. We derive the majority of our income from interest received on our loans and investments. Our primary source of funds for making these loans and investments is our deposits, on which we pay interest. Approximately 75.3% of our total deposits are interest-bearing. Consequently, one of the key measures of our success is our amount of net interest income, or the difference between the income on our interest-earning assets, such as loans and investments, and the expense on our interest-bearing liabilities, such as deposits and borrowings. The resulting ratio of that difference as a percentage of our average earning assets represents our net interest margin. Another key measure is the spread between the yield we earn on these interest-earning assets and the rate we pay on our interest-bearing liabilities, which is called our net interest spread. In addition to earning interest on our loans and investments, we earn income through fees and other charges to our customers. We have also included a discussion of the various components of this noninterest income, as well as of our noninterest expense.
There are risks inherent in all loans, so we maintain an allowance for loan losses to absorb probable losses on existing loans that may become uncollectible. We maintain this allowance by charging a provision for loan losses against our operating earnings for each period. We have included a detailed discussion of this process, as well as several tables describing our allowance for loan losses.
Our financial results for the years ended December 31, 2012, 2013 and 2014 were impacted by disruptions in the national economy and the resulting financial uncertainty that continues to have an effect on the banking industry. While we believe high energy prices and an active oil and gas industry insulated our markets from the full impact of the national recession, the economic uncertainty and difficult real estate markets had an impact on our loan losses, loan demand and our net interest margin. With the recent sharp decline in oil prices, we are closely monitoring our oil and gas loan portfolio. If oil prices remain at these low levels for an extended period, we could experience weaker oil and gas related loan demand and increased losses within the oil and gas loan portfolio.
In December 2012, we grew the MidSouth franchise through a merger with PSB Financial Corporation (“PSB”), the holding company of Many, Louisiana based The Peoples State Bank. This transaction continued our strategic growth and enhanced the connection between Louisiana and Texas by expanding the Bank’s presence into central and northeast Louisiana and east Texas. We acquired approximately $465.0 million in assets at fair value from PSB and added 15 banking centers with approximately $260.1 million in loans and approximately $400.6 million in deposits. The systems conversion for PSB was completed in March 2013.
We plan to continue to grow both organically and through acquisitions, including potential expansion into new market areas. We believe our current financial condition, coupled with our scalable operational capabilities will allow us to act upon growth opportunities in the current banking environment.
The following discussion and analysis also identifies significant factors that have affected our financial position and operating results during the periods included in the financial statements accompanying or incorporated by reference in this report. We encourage you to read this discussion and analysis in conjunction with our consolidated financial statements and the notes thereto and other statistical information included and incorporated by reference in this annual report on Form 10-K.
Certain critical accounting policies affect the more significant judgments and estimates used in the preparation of the consolidated financial statements. Our significant accounting policies are described in the notes to the consolidated financial statements included in this report. The accounting principles we follow and the methods of applying these principles conform to accounting principles generally accepted in the United States of America (“GAAP”) and general banking practices. Our most critical accounting policy relates to the determination of the allowance for loan losses, which reflects the estimated losses resulting from the inability of its borrowers to make loan payments. The determination of the adequacy of the allowance involves significant judgment and complexity and is based on many factors. If the financial condition of our borrowers were to deteriorate, resulting in an impairment of their ability to make payments, the estimates would be updated and additional provisions for loan losses may be required. See Asset Quality – Allowance for Loan Losses and Note 1 and Note 3 of the notes to the consolidated financial statements.
Another of our critical accounting policies relates to the valuation of goodwill, intangible assets and other purchase accounting adjustments. We account for acquisitions in accordance with ASC Topic No. 805, which requires the use of the purchase method of accounting. Under this method, we are required to record assets acquired and liabilities assumed at their fair value, including intangible assets. Determination of fair value involves estimates based on internal valuations of discounted cash flow analyses performed, third party valuations, or other valuation techniques that involve subjective assumptions. Additionally, the term of the useful lives and appropriate amortization periods of intangible assets is subjective. Resulting goodwill from an acquisition under the purchase method of accounting represents the excess of the purchase price over the fair value of net assets acquired. Goodwill is not amortized, but is evaluated for impairment annually or more frequently if deemed necessary. If the fair value of an asset exceeds the carrying amount of the asset, no charge to goodwill is made. If the carrying amount exceeds the fair value of the asset, goodwill will be adjusted through a charge to earnings. In evaluating the goodwill on our consolidated balance sheet for impairment at December 31, 2014, we first assessed qualitative factors to determine whether it is more likely than not that the fair value of our acquired assets is less than the carrying amount of the acquired assets, as allowed under ASU 2011-08, Intangibles- Goodwill and Other (Topic 350): Testing Goodwill for Impairment. After making the assessment based on several factors, which included but was not limited to the current economic environment, the economic outlook in our markets, our financial performance and common stock value as compared to our peers, we determined it is more likely than not that the fair value of our acquired assets is greater than the carrying amount and, accordingly, no impairment of goodwill was recorded for the year ended December 31, 2014.
Given the instability of the economic environment, it is reasonably possible that the methodology of the assessment of potential loan losses and goodwill impairment could change in the near-term or could result in impairment going forward.
Another of our critical accounting policies relates to deferred tax assets and liabilities. We record deferred tax assets and deferred tax liabilities for future tax consequences attributable to differences between the financial statement carrying amounts of existing assets and liabilities and their respective tax bases. Future tax benefits, such as net operating loss carry forwards, are recognized to the extent that realization of such benefits is more likely than not. Deferred tax assets and liabilities are measured using enacted tax rates expected to apply to taxable income in the years in which the assets and liabilities are expected to be recovered or settled. The effect on deferred tax assets and liabilities of a change in tax rates is recognized in income tax expense in the period that includes the enactment date. In the event the future tax consequences of differences between the financial reporting bases and the tax bases of our assets and liabilities results in deferred tax assets, an evaluation of the probability of being able to realize the future benefits indicated by such assets is required. A valuation allowance is provided when it is more likely than not that a portion or the full amount of the deferred tax asset will not be realized. In assessing the ability to realize the deferred tax assets, management considers the scheduled reversals of deferred tax liabilities, projected future taxable income, and tax planning strategies. A deferred tax liability is not recognized for portions of the allowance for loan losses for income tax purposes in excess of the financial statement balance. Such a deferred tax liability will only be recognized when it becomes apparent that those temporary differences will reverse in the foreseeable future. A tax position is recognized as a benefit only if it is “more likely than not” that the tax position would be sustained in a tax examination, with a tax examination being presumed to occur. The amount recognized is the largest amount of tax benefit that is greater than 50 percent more likely of being realized on examination. For tax positions not meeting the “more likely than not” test, no tax benefit is recorded.
Net income available to common stockholders for the year ended December 31, 2014 totaled $18.4 million compared to $12.8 million for the year ended December 31, 2013, or an increase of $5.6 million. Diluted earnings per share were $1.58 for the year ended December 31, 2014, compared to $1.12 for 2013. The $5.6 million increase in net earnings included $3.0 million of executive life insurance proceeds and a $1.1 million gain on sale of ORE recorded in noninterest income for the year ended December 31, 2014. Excluding these non-operating income items and non-operating expenses of $394,000 in losses on disposal of fixed assets, a $258,000 loss on redemption of Trust Preferred Securities, $516,000 in efficiency consultant expenses, and $189,000 of expenses related to the loss of an executive officer, operating earnings totaled $15.6 million at December 31, 2014. Net of $214,000 of net merger and conversion related expenses associated with the PSB acquisition in the first quarter of 2013, operating earnings totaled $13.0 million at December 31, 2013. The net increase of $2.6 million in operating earnings in year-over-year comparison resulted primarily from a $3.7 million decrease in noninterest expense and a $1.0 million increase in noninterest income. Net interest income also increased $1.0 million which included a $732,000 decrease in interest expense. Dividends on preferred stock decreased $634,000 due primarily to a reduction in the rate on the Series B Preferred Stock to 1.00% beginning in the fourth quarter of 2013. The increase in revenues was partially offset by a $2.6 million increase in the provision for loan losses and a $1.2 million increase in income tax expense.
Total consolidated assets remained constant at $1.9 billion for the years ended December 31, 2014 and December 31, 2013. Deposits totaled $1.6 billion at December 31, 2014, compared to $1.5 billion at December 31, 2013. Our stable core deposit base, which excludes time deposits, grew $55.5 million and accounted for 84.1% of deposits at December 31, 2014 compared to 84.2% of deposits at year end 2013. Time deposits grew $10.9 million for the year ended December 31, 2014. Net loans totaled $1.3 billion at December 31, 2014, compared to $1.1 billion at December 31, 2013. Net loans grew $144.4 million, or 12.8%, for the year ended December 31, 2014.
Our Tier 1 leverage capital ratio increased to 9.52% at December 31, 2014 compared to 9.35% at December 31, 2013. Tier 1 risk-weighted capital and total risk-weighted capital ratios were 12.90% and 13.73% at December 31, 2014, compared to 13.47% and 14.19% at December 31, 2013, respectively. The Tier 1 common equity ratio at December 31, 2014 was 8.36%. Return on average common equity was 11.43% for 2014 compared to 8.64% for 2013. Return on average assets was 0.97% compared to 0.69% for the same periods, respectively.
Nonperforming assets totaled $15.1 million at December 31, 2014, an increase of $3.1 million over the $12.0 million reported for year-end 2013. The increase resulted primarily from a $5.6 million increase in nonperforming loans, which was partially offset by a $2.5 million decrease in other real estate owned. Nonaccrual loans totaled $10.7 million at December 31, 2014, compared to $5.1 million at December 31, 2013. Loans past due 90 days or more and still accruing interest totaled $187,000 at December 31, 2014, compared to $178,000 at December 31, 2013. Total nonperforming assets to total assets were 0.78% at December 31, 2014, compared to 0.65% at December 31, 2013. Loans classified as troubled debt restructurings (“TDRs”) totaled $410,000 at December 31, 2014, compared to $412,000 at December 31, 2013.
Allowance coverage for nonperforming loans was 103.10% at December 31, 2014, compared to 166.36% at December 31, 2013. Year-to-date net charge-offs were 0.26% of average total loans as of December 31, 2014 compared to 0.15% as of December 31, 2013. The ALL/total loans ratio increased to 0.87% for the year ended December 31, 2014, compared to 0.77% at December 31, 2013.
|
Table 1
|
||||||||||||
|
Summary of Return on Equity and Assets
|
||||||||||||
|
2014
|
2013
|
2012
|
||||||||||
|
Return on average assets
|
0.97
|
%
|
0.69
|
%
|
0.58
|
%
|
||||||
|
Return on average common equity
|
11.43
|
%
|
8.64
|
%
|
6.05
|
%
|
||||||
|
Dividend payout ratio on common stock
|
22.15
|
%
|
27.68
|
%
|
36.36
|
%
|
||||||
|
Average equity to average assets
|
10.71
|
%
|
10.27
|
%
|
11.88
|
%
|
||||||
NOTE: 2014 return on average assets and return on average common equity were impacted by $3.0 million of executive life insurance proceeds, a $1.1 million gain on sale of ORE, a $394,000 in losses on disposal of fixed assets, a $258,000 loss on redemption of Trust Preferred Securities, $516,000 in efficiency consultant expenses, and $189,000 of expenses related to the loss of an executive officer. Excluding these non-operating items, return on average assets for the year ended December 31, 2014 was 0.83% and return on average common equity for the year ended December 31, 2014 was 9.70%. 2012 return on average assets and return on average common equity were impacted by approximately $1.2 million of merger costs due to the PSB merger. Excluding these merger costs, return on average assets for the year ended December 31, 2012 was 0.64% and return on average common equity for the year ended December 31, 2012 was 6.64%.
Net Interest Income
Our primary source of earnings is net interest income, which is the difference between interest earned on loans and investments and interest paid on deposits and other interest-bearing liabilities. Changes in the volume and mix of earning assets and interest-bearing liabilities combined with changes in market rates of interest greatly affect net interest income. Our net interest margin on a taxable equivalent basis, which is net interest income as a percentage of average earning assets, was 4.63%, 4.71%, and 4.45% for the years ended December 31, 2014, 2013, and 2012, respectively. Tables 2 and 3 analyze the changes in net interest income for the years ended December 31, 2014, 2013, and 2012.
|
Table 2
|
||||||||||||||||||||||||||||||||||||
|
Consolidated Average Balances, Interest, and Rates
(in thousands)
|
||||||||||||||||||||||||||||||||||||
|
Year Ended December 31,
|
||||||||||||||||||||||||||||||||||||
|
2014
|
2013
|
2012
|
||||||||||||||||||||||||||||||||||
|
Average
Volume
|
Interest
|
Average
Yield/ Rate
|
Average
Volume
|
Interest
|
Average
Yield/ Rate
|
Average
Volume
|
Interest
|
Average Yield/ Rate
|
||||||||||||||||||||||||||||
|
Assets
|
||||||||||||||||||||||||||||||||||||
|
Investment securities1
|
||||||||||||||||||||||||||||||||||||
|
Taxable
|
$
|
366,786
|
$
|
8,100
|
2.21
|
%
|
$
|
422,264
|
$
|
8,609
|
2.04
|
%
|
$
|
373,277
|
$
|
8,083
|
2.17
|
%
|
||||||||||||||||||
|
Tax exempt2
|
87,449
|
4,028
|
4.61
|
%
|
102,873
|
4,932
|
4.79
|
%
|
80,590
|
4,120
|
5.11
|
%
|
||||||||||||||||||||||||
|
Total investment securities
|
454,235
|
12,128
|
2.67
|
%
|
525,137
|
13,541
|
2.58
|
%
|
453,867
|
12,203
|
2.69
|
%
|
||||||||||||||||||||||||
|
Federal funds sold
|
3,032
|
6
|
0.20
|
%
|
3,563
|
7
|
0.19
|
%
|
3,482
|
7
|
0.20
|
%
|
||||||||||||||||||||||||
|
Time and interest bearing deposits in other banks
|
27,649
|
70
|
0.25
|
%
|
29,422
|
79
|
0.26
|
%
|
34,087
|
92
|
0.27
|
%
|
||||||||||||||||||||||||
|
Other investments
|
11,590
|
347
|
2.99
|
%
|
10,403
|
308
|
2.96
|
%
|
5,758
|
184
|
3.20
|
%
|
||||||||||||||||||||||||
|
Loans
|
||||||||||||||||||||||||||||||||||||
|
Commercial and real estate
|
1,111,702
|
65,498
|
5.89
|
%
|
1,008,940
|
64,748
|
6.42
|
%
|
661,759
|
42,217
|
6.36
|
%
|
||||||||||||||||||||||||
|
Installment
|
100,960
|
6,829
|
6.76
|
%
|
88,648
|
6,268
|
7.07
|
%
|
104,259
|
7,559
|
7.23
|
%
|
||||||||||||||||||||||||
|
Total loans3
|
1,212,662
|
72,327
|
5.96
|
%
|
1,097,588
|
71,016
|
6.47
|
%
|
766,018
|
49,776
|
6.48
|
%
|
||||||||||||||||||||||||
|
Total earning assets
|
1,709,168
|
84,878
|
4.97
|
%
|
1,666,113
|
84,951
|
5.10
|
%
|
1,263,212
|
62,262
|
4.92
|
%
|
||||||||||||||||||||||||
|
Allowance for loan losses
|
(8,850
|
)
|
(7,928
|
)
|
(7,182
|
)
|
||||||||||||||||||||||||||||||
|
Nonearning assets
|
191,761
|
197,980
|
140,085
|
|||||||||||||||||||||||||||||||||
|
Total assets
|
$
|
1,892,079
|
$
|
1,856,165
|
$
|
1,396,115
|
||||||||||||||||||||||||||||||
|
Liabilities and stockholders’ equity
|
||||||||||||||||||||||||||||||||||||
|
NOW, money market, and savings
|
$
|
921,631
|
$
|
2,147
|
0.23
|
%
|
$
|
874,890
|
$
|
2,362
|
0.27
|
%
|
$
|
605,869
|
$
|
1,816
|
0.30
|
%
|
||||||||||||||||||
|
Time deposits
|
228,856
|
1,368
|
0.60
|
%
|
260,650
|
1,599
|
0.61
|
%
|
273,932
|
2,284
|
0.83
|
%
|
||||||||||||||||||||||||
|
Total interest-bearing deposits
|
1,150,487
|
3,515
|
0.31
|
%
|
1,135,540
|
3,961
|
0.35
|
%
|
879,801
|
4,100
|
0.46
|
%
|
||||||||||||||||||||||||
|
Securities sold under agreements to repurchase
|
62,844
|
795
|
1.27
|
%
|
56,233
|
772
|
1.37
|
%
|
50,776
|
756
|
1.48
|
%
|
||||||||||||||||||||||||
|
Federal funds purchased
|
228
|
2
|
0.87
|
%
|
643
|
4
|
0.61
|
%
|
21
|
-
|
-
|
|||||||||||||||||||||||||
|
Short-term FHLB advances
|
26,946
|
43
|
0.16
|
%
|
12,608
|
20
|
0.16
|
%
|
-
|
-
|
-
|
|||||||||||||||||||||||||
|
Other borrowings
|
-
|
-
|
-
|
616
|
18
|
3.05
|
%
|
11
|
-
|
-
|
||||||||||||||||||||||||||
|
Notes payable
|
26,936
|
378
|
1.38
|
%
|
28,448
|
418
|
1.46
|
%
|
-
|
-
|
-
|
|||||||||||||||||||||||||
|
Junior subordinated debentures
|
26,774
|
1,074
|
3.96
|
%
|
29,384
|
1,346
|
4.52
|
%
|
15,503
|
984
|
6.24
|
%
|
||||||||||||||||||||||||
|
Total interest-bearing liabilities
|
1,294,215
|
5,807
|
0.45
|
%
|
1,263,472
|
6,539
|
0.52
|
%
|
946,112
|
5,840
|
0.62
|
%
|
||||||||||||||||||||||||
|
Demand deposits
|
386,664
|
393,831
|
274,369
|
|||||||||||||||||||||||||||||||||
|
Other liabilities
|
8,569
|
8,238
|
9,721
|
|||||||||||||||||||||||||||||||||
|
Stockholders’ equity
|
202,631
|
190,624
|
165,913
|
|||||||||||||||||||||||||||||||||
|
Total liabilities and stockholders’ equity
|
$
|
1,892,079
|
$
|
1,856,165
|
$
|
1,396,115
|
||||||||||||||||||||||||||||||
|
Net interest income and net interest spread4
|
$
|
79,071
|
4.52
|
%
|
$
|
78,412
|
4.58
|
%
|
$
|
56,422
|
4.30
|
%
|
||||||||||||||||||||||||
|
Net yield on interest-earning assets
|
4.63
|
%
|
4.71
|
%
|
4.45
|
%
|
||||||||||||||||||||||||||||||
1 Securities classified as available-for-sale are included in average balances and interest income figures and reflect interest earned on such securities.
2 Interest income of $1,391,000 for 2014, $1,748,000 for 2013, and $1,240,000 for 2012 is added to interest earned on tax-exempt obligations to reflect tax-equivalent yields using a tax rate of 35%.
3 Interest income includes loan fees of $5,888,000 for 2014, $5,508,000 for 2013, and $3,474,000 for 2012. Nonaccrual loans are included in average balances and income on such loans is recognized on a cash basis.
4 Net interest income includes accretion income of $3,647,000 for 2014, $6,975,000 for 2013, and $2,829,000 for 2012.
|
Table 3
|
||||||||||||||||||||||||
|
Changes in Taxable-Equivalent Net Interest Income
(in thousands)
|
||||||||||||||||||||||||
|
2014 Compared to 2013
|
2013 Compared to 2012
|
|||||||||||||||||||||||
|
Total
Increase
|
Change
Attributable to
|
Total
Increase
|
Change
Attributable to
|
|||||||||||||||||||||
|
(Decrease)
|
Volume
|
Rates
|
(Decrease)
|
Volume
|
Rates
|
|||||||||||||||||||
|
Taxable-equivalent interest earned on:
|
||||||||||||||||||||||||
|
Investment securities
|
||||||||||||||||||||||||
|
Taxable
|
$
|
(509
|
)
|
$
|
(1,188
|
)
|
$
|
679
|
$
|
526
|
$
|
1,018
|
$
|
(492
|
)
|
|||||||||
|
Tax-exempt
|
(904
|
)
|
(716
|
)
|
(188
|
)
|
812
|
1,081
|
(269
|
)
|
||||||||||||||
|
Federal funds sold
|
(1
|
)
|
(1
|
)
|
-
|
-
|
-
|
-
|
||||||||||||||||
|
Time and interest-bearing deposits in other banks
|
(9
|
)
|
(4
|
)
|
(5
|
)
|
(13
|
)
|
(11
|
)
|
(2
|
)
|
||||||||||||
|
Other investments
|
39
|
36
|
3
|
124
|
139
|
(15
|
)
|
|||||||||||||||||
|
Loans, including fees
|
1,311
|
7,114
|
(5,803
|
)
|
21,240
|
21,453
|
(213
|
)
|
||||||||||||||||
|
Total
|
(73
|
)
|
5,241
|
(5,314
|
)
|
22,689
|
23,680
|
(991
|
)
|
|||||||||||||||
|
Interest paid on:
|
||||||||||||||||||||||||
|
Interest-bearing deposits
|
(446
|
)
|
51
|
(497
|
)
|
(139
|
)
|
1,029
|
(1,168
|
)
|
||||||||||||||
|
Securities sold under agreements to repurchase
|
23
|
87
|
(64
|
)
|
16
|
78
|
(62
|
)
|
||||||||||||||||
|
Federal funds purchased
|
(2
|
)
|
(4
|
)
|
2
|
4
|
4
|
-
|
||||||||||||||||
|
Short-term FHLB advances
|
23
|
23
|
-
|
20
|
20
|
-
|
||||||||||||||||||
|
Other borrowings
|
(18
|
)
|
(18
|
)
|
-
|
18
|
18
|
-
|
||||||||||||||||
|
Notes payable
|
(40
|
)
|
(20
|
)
|
(20
|
)
|
417
|
417
|
-
|
|||||||||||||||
|
Junior subordinated debentures
|
(272
|
)
|
(107
|
)
|
(165
|
)
|
362
|
701
|
(339
|
)
|
||||||||||||||
|
Total
|
(732
|
)
|
12
|
(744
|
)
|
698
|
2,267
|
(1,569
|
)
|
|||||||||||||||
|
Taxable-equivalent net interest income
|
$
|
659
|
$
|
5,229
|
$
|
(4,570
|
)
|
$
|
21,991
|
$
|
21,413
|
$
|
578
|
|||||||||||
NOTE: Changes due to both volume and rate have generally been allocated to volume and rate changes in proportion to the relationship of the absolute dollar amounts to the changes in each.
Net interest income on a fully taxable-equivalent (“FTE”) basis increased $659,000 for 2014 over 2013, primarily due to a $732,000 decrease in interest expense. Interest income remained relatively flat in year-over-year comparison, as a $1.4 million decrease in FTE interest income on investments was offset by a $1.3 million increase in interest income on loans. Interest income on loans increased $1.3 million despite a $2.9 million reduction in purchase accounting adjustments on acquired loans. The average volume of loans increased $115.1 million in year-over-year comparison, and the average yield on loans decreased 51 basis points, from 6.47% to 5.96%. The average yield on earning assets decreased in year-over-year comparison, from 5.10% at December 31, 2013 to 4.97% at December 31, 2014. The purchase accounting adjustments added 60 basis points to the average yield on loans for the year ended December 31, 2013 and 28 basis points for the year ended December 31, 2014. Net of purchase accounting adjustments, the average yield on earning assets increased 6 basis points, from 4.71% at December 31, 2013 to 4.77% at December 31, 2014. Interest expense decreased $732,000 in year-over-year comparison primarily due to a 7 basis point decrease in the average rate paid on interest-bearing liabilities, from 0.52% at December 31, 2013 to 0.45% at December 31, 2014. Net of purchase accounting adjustments, the average rate paid on interest-bearing liabilities decreased 10 basis points, from 0.60% at December 31, 2013 to 0.50% at December 31, 2014. The FTE net interest margin decreased 8 basis points, from 4.71% for the year ended December 31, 2013 to 4.63% for the year ended December 31, 2014. Net of purchase accounting adjustments, the FTE net interest margin increased 13 basis points, from 4.26% to 4.39% for the years ended December 31, 2013 and 2014, respectively, due to a favorable shift in earning assets from investment securities to loans.
Net interest income on a fully taxable-equivalent (“FTE”) basis increased $22.0 million for 2013 over 2012, the result of a $22.7 million increase in FTE interest income and a $698,000 increase in interest expense. The increase in interest income on earning assets resulted primarily from the combination of a $402.9 million increase in the volume of average earnings assets primarily as a result of the PSB acquisition, combined with an 18 basis point increase in the average yield on earning assets, from 4.92% at December 31, 2012 to 5.10% at December 31, 2013. Additionally, interest income on investment securities for 2013 increased as a $71.3 million increase in the average volume of investment securities offset the impact of an 11 basis point reduction in the average FTE yield earned on investment securities. Interest expense increased $698,000 in year-over-year comparison as the impact of a $317.4 million increase in the average volume of interest-bearing liabilities was partially offset by a 10 basis point reduction in the average rate paid on interest-bearing liabilities, from 0.62% for the year ended December 31, 2012 to 0.52% for the year ended December 31, 2013. As a result, the FTE net interest margin increased 26 basis points, from 4.45% for the year ended December 31, 2012 to 4.71% for the year ended December 31, 2013. Net of purchase accounting adjustments, the FTE net interest margin increased 4 basis points for 2013 over 2012, from 4.22% to 4.26% for the years ended December 31, 2012 and 2013, respectively.
Noninterest Income
Noninterest income totaled $24.4 million at December 31, 2014, compared to $19.3 million at December 31, 2013 and $14.9 million at December 31, 2012. Service charges and fees on deposit accounts represent the primary source of noninterest income for us. Income from service charges and fees on deposit accounts, including insufficient funds fees (“NSF” fees), increased $555,000 in 2014 compared to a $1.8 million increase in 2013. The increase in 2013 was primarily due to a higher volume of transaction accounts as a result of the PSB acquisition. Income on ATM and debit card transactions increased $809,000 in 2014 and $1.8 million in 2013 as the result of an increase in electronic transactions processed. Noninterest income for the year ended December 31, 2014 also included executive officer life insurance proceeds of $3.0 million and a $1.1 million gain on sale of ORE. Excluding these non-operating income items, other noninterest income decreased $338,000 in 2014 and increased $785,000 in 2013, including net gains on sales of securities. The $338,000 decrease in 2014 primarily consisted of decreases of $162,000 in third party investment advisory income and $106,000 in gains on sales of securities. The $785,000 increase in 2013 included increases of $219,000 in third party investment advisory income, $162,000 in fees earned from credit-related products and $74,000 in VISA merchant and annual fees.
Noninterest Expense
Total noninterest expense decreased 3.6%, or $2.6 million, from 2013 to 2014 and increased 32.8%, or $18.0 million, from 2012 to 2013. Non-operating expenses in 2014 consisted of $394,000 in losses on disposal of fixed assets, a $258,000 loss on redemption of Trust Preferred Securities, $516,000 in efficiency consultant expenses, and $189,000 of expenses related to the loss of an executive officer. Non-operating expenses in 2013 consisted of $214,000 of net merger and conversion related expenses associated with the PSB acquisition. Non-operating expenses in 2012 consisted of $1.2 million of merger related expenses associated with the PSB acquisition. Excluding these non-operating expenses, total noninterest expense decreased $3.7 million from 2013 to 2014 and increased $19.0 million from 2012 to 2013. The decrease in 2014 resulted from efficiency efforts begun in the fourth quarter of 2013. The $19.0 million increase in 2013 resulted from the addition of 15 branches through the PSB acquisition and 6 new branches opened in late 2012 and early 2013.
Excluding non-operating expenses, salaries and employee benefits decreased $474,000, or 1.4%, in 2014 and increased $9.6 million, or 38.9%, in 2013. Through attrition and efficiency efforts, we reduced the number of employees on a full-time equivalent basis by 55 during 2014, from 604 at year end 2013 to 549 at year end 2014. In 2014, an $882,000 decrease in salaries costs was partially offset by a $598,000 increase in group health costs.
Approximately $4.4 million of the $9.6 million increase in 2013 resulted from salary costs in the new Timber Region and new branches added late in 2012 and early 2013. Also contributing to the increase in salaries and employee benefits expense was a $959,000 increase in group health costs and a $413,000 increase in the cost of stock-based benefit plans. The increase in the cost of stock-based benefit plans was the result of stock options granted to employees during 2012 and 2013.
Excluding non-operating expenses, occupancy expenses decreased $38,000 in 2014 and increased $3.8 million in 2013. The increase in occupancy expense in 2013 resulted primarily from the PSB acquisition and included additional depreciation expense and property tax expense. Excluding operating expenses on the Timber Region and the six new branches opened in late 2012 and 2013, occupancy expense increased $1.7 million in 2013. Premises and equipment additions and leasehold improvements totaled approximately $5.6 million, $14.3 million and $22.7 million for the years 2014, 2013, and 2012, respectively.
Excluding non-operating expenses, ATM and debit card processing fees increased $510,000 in 2014 and increased $820,000 in 2013 primarily due to an increased volume of electronic transactions processed. Additionally, losses on electronic transactions increased $102,000 in 2014 and $30,000 in 2013.
Excluding non-operating expenses, data processing costs, included in other non-interest expense, increased $105,000 in 2014 and $427,000 in 2013. The increase in 2013 resulted primarily from expenses related to the cost of adding the acquired and new branches into our information technology network.
Excluding non-operating expenses, other noninterest expense decreased $3.8 million in 2014 and included decreases of $666,000 in marketing costs, $440,000 in legal and professional fees, $316,000 in printing and supplies, $510,000 in expenses on ORE and other repossessed assets and $397,000 in courier expense. Several other noninterest expense categories decreased as a result of efficiency efforts.
Other noninterest expense increased $4.4 million in 2013 and included increases of $811,000 in marketing costs, $517,000 in corporate development expense (including business travel), $335,000 in printing and supplies, and $181,000 in FDIC and other regulatory fees. Several other noninterest expense categories increased as a result of the PSB merger and new branches added during the year.
Income Taxes
Income tax expense increased $1.2 million in 2014 and $2.4 million in 2013 and approximated 28%, 30%, and 28% of income before taxes in 2014, 2013 and 2012, respectively. In 2012, the Company exceeded $10.0 million in pre-tax income which increased the statutory tax rate from 34% to 35%. The impact of nontaxable municipal interest income and other tax considerations resulted in lower effective tax rates for each of the three years presented in the Consolidated Statement of Earnings included in Item 8 of this filing. For the year ended December 31, 2014, executive officer life insurance proceeds of $3.0 million further lowered the effective tax rate. The notes to the consolidated financial statements provide additional information regarding income tax considerations.
Investment Securities
Total investment securities decreased $79.0 million in 2014, from $497.2 million in 2013 to $418.2 million at December 31, 2014. The decrease in investment securities partially funded a $146.9 million increase in loans during 2014. The decrease resulted primarily from $62.8 million in maturities and calls of securities and $22.2 million in sales of securities. Average duration of the portfolio was approximately 3.2 years as of December 31, 2014 and the average taxable-equivalent yield was 2.67%. For the year ended December 31, 2013, average duration of the portfolio was 4.2 years and the average taxable-equivalent yield was 2.58%. Unrealized net gains before tax effect in the securities available-for-sale portfolio were $4.4 million at December 31, 2014, compared to unrealized net losses before tax effect of $163,000 at December 31, 2013. These amounts resulted from interest rate fluctuations.
At December 31, 2014, approximately $194.5 million, or 70.2%, of the securities available-for-sale portfolio represented mortgage-backed securities and CMOs. All of the mortgage-backed securities and CMOs are government agency sponsored with the exception of three privately issued CMOs with a current market value of $44,000. Risk due to changes in interest rates on mortgage-backed pools is monitored by monthly reviews of prepayment speeds, duration, and purchase yields as compared to current market yields on each security. CMOs totaled $85.4 million and represented pools that each had a book value of less than 10% of stockholders' equity at December 31, 2014. Other asset-backed securities totaled $24.3 million at December 31, 2014. These securities are collateralized by student loans issued under the Federal Family Education Loan Program. Under the program, the loans are re-insured by the Department of Education for amounts generally ranging from 97% - 100%. The collateralized debt obligation in the securities available-for-sale portfolio was acquired through the PSB merger and is a debt security comprised of a pool of financial institutions’ trust preferred securities. The fair value of the security at December 31, 2014 totaled $1.2 million. The mutual fund in the securities available-for-sale portfolio is a CRA Qualified Investment Fund comprised of a mix of high credit quality bonds. The fair value of the security at December 31, 2014 totaled $2.1 million. An additional 3.7% of the available-for-sale portfolio consisted of short-term U.S. Government sponsored enterprises securities, while municipal securities represented 16.1%. At December 31, 2014, approximately $95.3 million, or 67.5%, of the held-to-maturity portfolio represented mortgage-backed securities and CMOs. The remainder of the held-to-maturity portfolio, approximately $45.9 million, consisted of municipal securities.
Additional information on our investment securities portfolio is provided in Note 3 of the notes to consolidated financial statements.
|
Table 4
Composition of Investment Securities
December 31
(in thousands)
|
||||||||||||||||||||
|
2014
|
2013
|
2012
|
2011
|
2010
|
||||||||||||||||
|
Available-for-sale securities
|
||||||||||||||||||||
|
U. S. Government sponsored enterprises
|
$
|
10,227
|
$
|
11,265
|
$
|
13,424
|
$
|
94,999
|
$
|
117,698
|
||||||||||
|
Obligations of state and political subdivisions
|
44,605
|
59,978
|
87,421
|
96,149
|
108,852
|
|||||||||||||||
|
GSE mortgage-backed securities
|
109,103
|
145,965
|
178,819
|
109,487
|
11,472
|
|||||||||||||||
|
Collateralized mortgage obligations: residential
|
60,839
|
70,887
|
101,986
|
41,468
|
22,688
|
|||||||||||||||
|
Collateralized mortgage obligations: commercial
|
24,545
|
27,346
|
29,761
|
25,138
|
3,099
|
|||||||||||||||
|
Other asset-backed securities
|
24,343
|
25,489
|
12,742
|
-
|
-
|
|||||||||||||||
|
Collateralized debt obligation
|
1,218
|
735
|
464
|
-
|
-
|
|||||||||||||||
|
Mutual funds
|
2,104
|
-
|
-
|
-
|
-
|
|||||||||||||||
|
Total available-for-sale securities
|
$
|
276,984
|
$
|
341,665
|
$
|
424,617
|
$
|
367,241
|
$
|
263,809
|
||||||||||
|
Held-to-maturity securities
|
||||||||||||||||||||
|
Obligations of state and political subdivisions
|
$
|
45,914
|
$
|
47,377
|
$
|
42,900
|
$
|
340
|
$
|
1,588
|
||||||||||
|
GSE mortgage-backed securities
|
67,268
|
78,272
|
89,383
|
82,497
|
-
|
|||||||||||||||
|
Collateralized mortgage obligations: residential
|
12,709
|
14,189
|
5,009
|
-
|
-
|
|||||||||||||||
|
Collateralized mortgage obligations: commercial
|
15,310
|
15,685
|
16,232
|
17,635
|
-
|
|||||||||||||||
|
Total held-to-maturity securities
|
$
|
141,201
|
$
|
155,523
|
$
|
153,524
|
$
|
100,472
|
$
|
1,588
|
||||||||||
|
Total investment securities
|
$
|
418,185
|
$
|
497,188
|
$
|
578,141
|
$
|
467,713
|
$
|
265,397
|
||||||||||
|
Table 5
Investment Securities Portfolio
Maturities and Average Taxable-Equivalent Yields
For the Year Ended December 31, 2014
(dollars in thousands)
|
||||||||||||||||||||||||||||||||||||
|
Within 1 Year
|
After 1 but
Within 5 Years
|
After 5 but
Within 10 Years
|
After 10 Years
|
|||||||||||||||||||||||||||||||||
|
Amount
|
Yield
|
Amount
|
Yield
|
Amount
|
Yield
|
Amount
|
Yield
|
Total
|
||||||||||||||||||||||||||||
|
Securities available-for-sale:
|
||||||||||||||||||||||||||||||||||||
|
U.S. Government sponsored enterprises
|
$
|
-
|
-
|
$
|
10,227
|
0.78
|
%
|
$
|
-
|
-
|
$
|
-
|
-
|
$
|
10,227
|
|||||||||||||||||||||
|
Obligations of state and political subdivisions1
|
8,312
|
5.36
|
%
|
20,713
|
5.75
|
%
|
13,658
|
5.32
|
%
|
1,922
|
5.82
|
%
|
44,605
|
|||||||||||||||||||||||
|
GSE mortgage-backs and CMOs: residential
|
168
|
4.54
|
%
|
149,176
|
2.90
|
%
|
20,515
|
2.72
|
%
|
83
|
2.10
|
%
|
169,942
|
|||||||||||||||||||||||
|
GSE mortgage-backs and CMOs: commercial
|
-
|
-
|
24,545
|
2.64
|
%
|
-
|
-
|
-
|
-
|
24,545
|
||||||||||||||||||||||||||
|
Other asset-backed securities
|
-
|
-
|
23,796
|
1.11
|
%
|
547
|
1.21
|
%
|
-
|
-
|
24,343
|
|||||||||||||||||||||||||
|
Collateralized debt obligation
|
-
|
-
|
-
|
-
|
-
|
-
|
1,218
|
4.88
|
%
|
1,218
|
||||||||||||||||||||||||||
|
Mutual funds
|
2,104
|
1.15
|
%
|
-
|
-
|
-
|
-
|
-
|
2,104
|
|||||||||||||||||||||||||||
|
Total fair value
|
$
|
10,584
|
$
|
228,457
|
$
|
34,720
|
$
|
3,223
|
$
|
276,984
|
||||||||||||||||||||||||||
|
Within 1 Year
|
After 1 but
Within 5 Years
|
After 5 but
Within 10 Years
|
After 10 Years
|
|||||||||||||||||||||||||||||||||
|
Held-to-Maturity:
|
Amount
|
Yield
|
Amount
|
Yield
|
Amount
|
Yield
|
Amount
|
Yield
|
Total
|
|||||||||||||||||||||||||||
|
Obligations of state and political subdivisions1
|
$
|
105
|
4.26
|
%
|
$
|
3,097
|
2.83
|
%
|
$
|
11,308
|
3.23
|
%
|
$
|
31,404
|
3.34
|
%
|
$
|
45,914
|
||||||||||||||||||
|
GSE mortgage-backs and CMOs: residential
|
-
|
-
|
79,977
|
2.43
|
%
|
-
|
-
|
-
|
-
|
79,977
|
||||||||||||||||||||||||||
|
GSE mortgage-backs and CMOs: commercial
|
-
|
-
|
15,310
|
2.36
|
%
|
-
|
-
|
-
|
-
|
15,310
|
||||||||||||||||||||||||||
|
Total cost
|
$
|
105
|
$
|
98,384
|
$
|
11,308
|
$
|
31,404
|
$
|
141,201
|
||||||||||||||||||||||||||
1 Tax exempt yields are expressed on a fully taxable equivalent basis.
Loan Portfolio
The loan portfolio totaled $1.3 billion at December 31, 2014, up 12.9%, or $146.9 million, from $1.1 billion at December 31, 2013 as a result of improved loan demand and funding activity within our markets. Of the $146.9 million, $70.0 million and $63.2 million were in the commercial real estate (“CRE”) and commercial, financial, and agricultural (“C&I”) portfolios, respectively.
Our loan portfolio is diversified throughout our Louisiana and Texas markets, with a focus on C&I and CRE loans. Our C&I and CRE loans are primarily underwritten on cash flow analyses versus collateral valuations. The C&I portfolio consists primarily of term loans or revolving lines of credit which are generally structured with annual maturity. The term loans are generally structured with fixed rates and three to five year maturities. The CRE portfolio consists primarily of credits that have fifteen to twenty year amortization terms with rates fixed primarily for three years, but up to five years. We believe the shorter term structure of our C&I and CRE credits allows greater flexibility in controlling interest rate risk.
The loan portfolio at December 31, 2014 consisted of approximately 42.8% in fixed rate loans, with the majority maturing within five years. Approximately 57.2% of the portfolio earns a variable rate of interest, the greater majority of which adjusts simultaneous with changes in the Prime rate and a smaller portion that adjusts on a scheduled repricing date. The mix of variable and fixed rate loans provides some protection from changes in market rates of interest. Additionally, we have established rate floors, primarily for our commercial loans, that provided some protection to our net interest margin during the current sustained low interest rate environment.
|
Table 6
Composition of Loans
|
||||||||||||||||||||
|
December 31
(in thousands)
|
||||||||||||||||||||
|
2014
|
2013
|
2012
|
2011
|
2010
|
||||||||||||||||
|
Commercial, financial, and agricultural
|
$
|
467,147
|
$
|
403,976
|
$
|
315,655
|
$
|
223,283
|
$
|
177,598
|
||||||||||
|
Real estate – construction
|
68,577
|
82,691
|
75,334
|
52,712
|
54,164
|
|||||||||||||||
|
Real estate – commercial
|
467,172
|
397,135
|
414,384
|
280,798
|
208,764
|
|||||||||||||||
|
Real estate – residential
|
154,602
|
146,841
|
142,858
|
113,582
|
72,460
|
|||||||||||||||
|
Installment loans to individuals
|
119,328
|
97,459
|
90,561
|
69,980
|
62,272
|
|||||||||||||||
|
Lease financing receivable
|
4,857
|
5,542
|
5,769
|
4,276
|
4,748
|
|||||||||||||||
|
Other
|
2,748
|
3,910
|
2,379
|
1,674
|
806
|
|||||||||||||||
|
Total loans
|
$
|
1,284,431
|
$
|
1,137,554
|
$
|
1,046,940
|
$
|
746,305
|
$
|
580,812
|
||||||||||
|
Table 7
|
||||||||||||||||||||||||||||
|
Loan Maturities and Sensitivity to Interest Rates
For the Year Ended December 31, 2014
(in thousands)
|
||||||||||||||||||||||||||||
|
Fixed and Variable Rate Loans at Stated Maturities
|
Amounts Over One Year With
|
|||||||||||||||||||||||||||
|
1 Year or
Less
|
1 Year –
5 Years
|
Over 5
years
|
Total
|
Predetermined
Rates
|
Floating
Rates
|
Total
|
||||||||||||||||||||||
|
Commercial, financial, and agricultural
|
$
|
206,389
|
$
|
167,187
|
$
|
93,571
|
$
|
467,147
|
$
|
146,301
|
$
|
114,457
|
$
|
260,758
|
||||||||||||||
|
Real estate – construction
|
29,978
|
12,937
|
25,662
|
68,577
|
10,280
|
28,319
|
38,599
|
|||||||||||||||||||||
|
Real estate – commercial
|
40,295
|
133,730
|
293,147
|
467,172
|
115,062
|
311,815
|
426,877
|
|||||||||||||||||||||
|
Real estate – residential
|
12,928
|
33,302
|
108,372
|
154,602
|
82,920
|
58,754
|
141,674
|
|||||||||||||||||||||
|
Installment loans to individuals
|
24,550
|
68,391
|
26,387
|
119,328
|
85,127
|
9,651
|
94,778
|
|||||||||||||||||||||
|
Lease financing receivable
|
541
|
4,263
|
53
|
4,857
|
4,316
|
-
|
4,316
|
|||||||||||||||||||||
|
Other
|
1,024
|
902
|
822
|
2,748
|
902
|
822
|
1,724
|
|||||||||||||||||||||
|
Total
|
$
|
315,705
|
$
|
420,712
|
$
|
548,014
|
$
|
1,284,431
|
$
|
444,908
|
$
|
523,818
|
$
|
968,726
|
||||||||||||||
Asset Quality
Credit Risk Management
We manage credit risk by observing written, board approved policies that govern all underwriting activities. Our Chief Credit Officer (“CCO”) is responsible for credit underwriting and loan operations for the Bank. The role of CCO includes on-going review and development of lending policies, commercial credit analysis, centralized consumer underwriting, loan operations documentation and funding, and overall credit risk management procedures. The current risk management process requires that each individual loan officer review his or her portfolio on a quarterly basis and assign recommended credit ratings on each loan. These efforts are supplemented by independent reviews performed by the loan review officer and other validations performed by the internal audit department. The results of the reviews are reported directly to the Audit Committee of the Board of Directors. We believe the conservative nature of our underwriting practices has resulted in strong credit quality in our loan portfolio. Completed loan applications, credit bureau reports, financial statements, and a committee approval process remain a part of credit decisions. Documentation of the loan decision process is required on each credit application, whether approved or denied, to ensure thorough and consistent procedures. Additionally, we have historically recognized and disclosed significant problem loans quickly and taken prompt action to address material weaknesses in those credits.
Our loan review process also includes monitoring and reporting of loan concentrations whereby individual customer and aggregate industry leverage, profitability, risk rating distributions, and liquidity are evaluated for each major standard industry classification segment. At December 31, 2014, one industry segment concentration, the oil and gas industry, aggregated more than 10% of our loan portfolio. Our exposure in the oil and gas industry, including related service and manufacturing industries, totaled approximately $265.0 million, or 20.6% of total loans. The average loan size is approximately $417,000 and the average loan size per relationship is roughly $714,000. While we believe high energy prices and an active oil and gas industry insulated our markets from the full impact of the national recession, we are closely monitoring the effects of the recent sharp decline in oil prices. MidSouth Bank began as an energy lender during the oil downturn of the 80’s and we have a strong thirty year track record of lending to this industry. We continue to communicate with our customers who provide valuable insight on the present energy cycle. We have not yet identified any specific loan impairments resulting from the downturn in oil prices. However, in light of recent developments, we established a special reserve in the fourth quarter of 2014 for potential future energy loan losses that have not yet been identified. We felt it was a prudent risk management strategy to establish a reserve of $650,000, or approximately 25 basis points of energy related loans.
We also monitor our exposure to loans secured by commercial real estate. At December 31, 2014, loans secured by commercial real estate (including commercial construction and multifamily loans) totaled approximately $510.7 million. Of the $510.7 million, $467.2 million represent CRE loans, 56% of which are secured by owner-occupied commercial properties. A total of $6.5 million, or 1.3%, in loans secured by commercial real estate was on nonaccrual status at December 31, 2014.
Nonperforming Assets
Table 8 contains information about nonperforming assets, including loans past due 90 days or greater (“90 days or >”) and still accruing.
|
Table 8
Asset Quality Information
December 31
(dollars in thousands)
|
||||||||||||||||||||
|
2014
|
2013
|
2012
|
2011
|
2010
|
||||||||||||||||
|
Loans on nonaccrual
|
$
|
10,701
|
$
|
5,099
|
$
|
8,276
|
$
|
6,229
|
$
|
19,603
|
||||||||||
|
Loans past due 90 days or > and still accruing
|
187
|
178
|
1,986
|
231
|
66
|
|||||||||||||||
|
Total nonperforming loans
|
10,888
|
5,277
|
10,262
|
6,460
|
19,669
|
|||||||||||||||
|
Other real estate owned
|
4,234
|
6,687
|
7,496
|
7,369
|
1,206
|
|||||||||||||||
|
Other assets repossessed
|
-
|
20
|
151
|
326
|
36
|
|||||||||||||||
|
Total nonperforming assets
|
$
|
15,122
|
$
|
11,984
|
$
|
17,909
|
$
|
14,155
|
$
|
20,911
|
||||||||||
|
Troubled debt restructurings
|
$
|
410
|
$
|
412
|
$
|
4,137
|
$
|
456
|
$
|
653
|
||||||||||
|
Nonperforming loans to total loans + ORE + other foreclosed assets
|
1.17
|
%
|
1.05
|
%
|
1.70
|
%
|
1.88
|
%
|
3.59
|
%
|
||||||||||
|
Nonperforming assets to total assets
|
0.78
|
%
|
0.65
|
%
|
0.97
|
%
|
1.01
|
%
|
2.09
|
%
|
||||||||||
|
ALLL to nonperforming loans
|
103.10
|
%
|
166.36
|
%
|
71.82
|
%
|
112.63
|
%
|
44.81
|
%
|
||||||||||
|
ALLL to total loans
|
0.87
|
%
|
0.77
|
%
|
0.70
|
%
|
0.97
|
%
|
1.52
|
%
|
||||||||||
Nonperforming assets totaled $15.1 million at December 31, 2014, an increase of $3.1 million over the $12.0 million reported for year-end 2013. The increase resulted from a $5.6 million increase in nonaccrual loans, which was partially offset by a $2.5 million decrease in other real estate owned. The $5.6 million increase in nonaccrual loans during 2014 resulted primarily from the addition of a $3.2 million CRE loan unrelated to energy that was placed on nonaccrual status during the fourth quarter. A $5.6 million increase in nonperforming loans resulted in a decrease in the allowance coverage for nonperforming loans, from 166.36% at December 31, 2013 to 103.10% at December 31, 2014. Classified assets, including ORE, increased $2.7 million or 8.7%, from $30.9 million at December 31, 2013 to $33.6 million at December 31, 2014. Year-to-date net charge-offs were 0.26% of average total loans as of December 31, 2014 compared to 0.15% as of December 31, 2013. The ALL/total loans ratio improved by 10 basis points to 0.87% at December 31, 2014 compared to 0.77% at December 31, 2013.
Loans classified as TDRs totaled $410,000 at December 31, 2014 compared to $412,000 at December 31, 2013. Additional information regarding impaired loans and TDRs is included in the notes to the consolidated financial statements.
Consumer and commercial loans are placed on nonaccrual status when principal or interest is 90 days past due, or sooner if the full collectability of principal or interest is doubtful, except if the underlying collateral fully supports both the principal and accrued interest and the loan is in the process of collection. Our policy provides that retail (consumer) loans that become 120 days delinquent be routinely charged off. Loans classified for regulatory purposes but not included in Table 8 do not represent material amounts that we have serious doubts as to the ability of the borrower to comply with loan repayment terms. Further information regarding loan policy is provided in the notes to the consolidated financial statements.
Allowance for Loan Losses
Provisions totaling $5.6 million, $3.1 million, and $2.1 million, for the years 2014, 2013, and 2012, respectively, were considered necessary to bring the allowance for loan losses to a level we believe sufficient to cover probable losses in the loan portfolio. In light of the recent downturn in oil prices, we established a special reserve in the fourth quarter of 2014 for potential future energy loan losses that have not yet been identified. We established a reserve of $650,000, or approximately 25 basis points of energy related loans. In accordance with generally accepted accounting principles, PSB’s loans were purchased at fair value and accordingly the PSB allowance for loan losses was not brought forward on the consolidated balance sheet. Table 9 analyzes activity in the allowance for 2014, 2013, 2012, 2011, and 2010.
|
Table 9
|
||||||||||||||||||||
|
Summary of Loan Loss Experience
(dollars in thousands)
|
||||||||||||||||||||
|
2014
|
2013
|
2012
|
2011
|
2010
|
||||||||||||||||
|
Balance at beginning of year
|
$
|
8,779
|
$
|
7,370
|
$
|
7,276
|
$
|
8,813
|
$
|
7,995
|
||||||||||
|
Charge-offs:
|
||||||||||||||||||||
|
Commercial, financial, and agricultural
|
2,843
|
935
|
1,054
|
1,109
|
1,333
|
|||||||||||||||
|
Real estate – construction
|
1
|
-
|
-
|
2,444
|
1,478
|
|||||||||||||||
|
Real estate – commercial
|
93
|
18
|
550
|
1,246
|
130
|
|||||||||||||||
|
Real estate – residential
|
273
|
129
|
126
|
283
|
146
|
|||||||||||||||
|
Installment loans to individuals
|
706
|
824
|
526
|
671
|
1,368
|
|||||||||||||||
|
Lease financing receivable
|
-
|
-
|
-
|
19
|
1
|
|||||||||||||||
|
Other
|
-
|
-
|
-
|
-
|
-
|
|||||||||||||||
|
Total charge-offs
|
3,916
|
1,906
|
2,256
|
5,772
|
4,456
|
|||||||||||||||
|
Recoveries:
|
||||||||||||||||||||
|
Commercial, financial, and agricultural
|
164
|
80
|
181
|
152
|
50
|
|||||||||||||||
|
Real estate – construction
|
-
|
8
|
18
|
14
|
1
|
|||||||||||||||
|
Real estate – commercial
|
407
|
29
|
1
|
1
|
1
|
|||||||||||||||
|
Real estate – residential
|
47
|
39
|
2
|
4
|
60
|
|||||||||||||||
|
Installment loans to individuals
|
120
|
109
|
98
|
138
|
141
|
|||||||||||||||
|
Lease financing receivable
|
-
|
-
|
-
|
1
|
1
|
|||||||||||||||
|
Other
|
-
|
-
|
-
|
-
|
-
|
|||||||||||||||
|
Total recoveries
|
738
|
265
|
300
|
310
|
254
|
|||||||||||||||
|
Net charge-offs
|
3,178
|
1,641
|
1,956
|
5,462
|
4,202
|
|||||||||||||||
|
Additions to allowance charged to operating expenses
|
5,625
|
3,050
|
2,050
|
3,925
|
5,020
|
|||||||||||||||
|
Balance at end of year
|
$
|
11,226
|
$
|
8,779
|
$
|
7,370
|
$
|
7,276
|
$
|
8,813
|
||||||||||
|
Net charge-offs to average loans
|
0.26
|
%
|
0.15
|
%
|
0.26
|
%
|
0.87
|
%
|
0.72
|
%
|
||||||||||
|
Year-end allowance to year-end loans
|
0.87
|
%
|
0.77
|
%
|
0.70
|
%
|
0.97
|
%
|
1.52
|
%
|
||||||||||
|
Table 10
Allocation of Loan Loss by Category
(dollars in thousands)
|
||||||||||||||||||||||||||||||||||||||||
|
2014
|
2013
|
2012
|
2011
|
2010
|
||||||||||||||||||||||||||||||||||||
|
Amount
|
% of loans to total loans
|
Amount
|
% of loans to total loans
|
Amount
|
% of loans to total loans
|
Amount
|
% of loans to total loans
|
Amount
|
% of loans to total loans
|
|||||||||||||||||||||||||||||||
|
Commercial, financial, and agricultural
|
$
|
5,729
|
37.0
|
$
|
3,906
|
35.0
|
$
|
1,535
|
30.0
|
$
|
1,734
|
30.0
|
$
|
1,664
|
31.0
|
|||||||||||||||||||||||||
|
Real estate - construction
|
954
|
5.0
|
1,046
|
7.0
|
2,147
|
7.0
|
1,661
|
7.0
|
2,963
|
9.0
|
||||||||||||||||||||||||||||||
|
Real estate - commercial
|
2,402
|
36.0
|
1,389
|
35.0
|
2,166
|
40.0
|
2,215
|
38.0
|
2,565
|
36.0
|
||||||||||||||||||||||||||||||
|
Real estate - residential
|
810
|
12.0
|
1,141
|
13.0
|
936
|
14.0
|
936
|
15.0
|
862
|
12.0
|
||||||||||||||||||||||||||||||
|
Installment loans to individuals
|
1,311
|
9.0
|
1,273
|
9.0
|
543
|
9.0
|
710
|
9.0
|
730
|
11.0
|
||||||||||||||||||||||||||||||
|
Lease financing receivable
|
16
|
1.0
|
21
|
1.0
|
41
|
-
|
19
|
1.0
|
29
|
1.0
|
||||||||||||||||||||||||||||||
|
Other
|
4
|
-
|
3
|
-
|
2
|
-
|
1
|
-
|
-
|
-
|
||||||||||||||||||||||||||||||
|
$
|
11,226
|
100.0
|
$
|
8,779
|
100.0
|
$
|
7,370
|
100.0
|
$
|
7,276
|
100.0
|
$
|
8,813
|
100.0
|
||||||||||||||||||||||||||
Quarterly evaluations of the allowance for loan losses are performed in accordance with GAAP and regulatory guidelines. The allowance is comprised of specific reserves assigned to each impaired loan for which probable loss has been identified as well as general reserves to maintain the allowance at an acceptable level for other loans in the portfolio where historical loss experience is available that indicates certain probable losses may exist. Factors considered in determining provisions include estimated losses in significant credits; known deterioration in concentrations of credit; historical loss experience; trends in nonperforming assets; volume, maturity and composition of the loan portfolio; off-balance sheet credit risk; lending policies and control systems; national and local economic conditions; the experience, ability and depth of lending management; and the results of examinations of the loan portfolio by regulatory agencies and others. The processes by which we determine the appropriate level of the allowance, and the corresponding provision for probable credit losses, involves considerable judgment; therefore, no assurance can be given that future losses will not vary from current estimates. Additional information regarding the allowance for loan losses is included in the notes to the consolidated financial statements.
Funding Sources
Deposits
As of December 31, 2014, total deposits increased $66.4 million, or 4.4%, to $1.6 billion following a decrease of $33.1 million in 2013. Noninterest-bearing deposits increased $7.6 million to $390.9 million and represented 24.7% of total deposits at December 31, 2014, compared to 25.2% at December 31, 2013 and 24.5% at December 31, 2012. Interest-bearing deposits in money market and savings accounts increased $7.5 million and NOW account deposits increased $40.3 million. Time deposits, which are comprised mostly of certificates of deposits (“CDs”), increased $10.9 million in 2014. The decrease in total deposits during 2013 resulted primarily from the run-off of acquired higher-cost CDs. Core deposits, defined as all deposits other than time deposits, remained strong at 84.1% of total deposits in 2014 compared to 84.2% of total deposits at year-end 2013. Core deposits totaled 79.9% of total deposits at year-end 2012. To manage the net interest margin and core deposit balances, we typically offer low- to mid-market rates on CDs. Additional information on deposits appears in the tables below and in the notes to the consolidated financial statements.
|
Table 11
|
||||||||||||||||||||||||
|
Summary of Average Deposits
(in thousands)
|
||||||||||||||||||||||||
|
2014
|
2013
|
2012
|
||||||||||||||||||||||
|
Average Amount
|
Average Yield
|
Average Amount
|
Average Yield
|
Average Amount
|
Average Yield
|
|||||||||||||||||||
|
Noninterest-bearing demand deposits
|
$
|
386,664
|
-
|
$
|
393,831
|
-
|
$
|
274,369
|
-
|
|||||||||||||||
|
Interest-bearing deposits:
|
||||||||||||||||||||||||
|
Savings, NOW, and money market
|
921,631
|
0.23
|
%
|
874,890
|
0.27
|
%
|
605,869
|
0.30
|
%
|
|||||||||||||||
|
Time deposits
|
228,856
|
0.60
|
%
|
260,650
|
0.61
|
%
|
273,932
|
0.83
|
%
|
|||||||||||||||
|
Total
|
$
|
1,537,151
|
0.23
|
%
|
$
|
1,529,371
|
0.26
|
%
|
$
|
1,154,170
|
0.36
|
%
|
||||||||||||
|
Table 12
Maturity Schedule Time Deposits of $250,000 or More
(in thousands)
|
||||||||||||
|
2014
|
2013
|
2012
|
||||||||||
|
3 months or less
|
$
|
11,795
|
$
|
14,088
|
$
|
14,848
|
||||||
|
Over 3 months through 6 months
|
9,098
|
7,112
|
10,012
|
|||||||||
|
Over 6 months through 12 months
|
59,642
|
16,935
|
24,684
|
|||||||||
|
Over 12 months
|
4,534
|
9,551
|
10,127
|
|||||||||
|
Total
|
$
|
85,069
|
$
|
47,686
|
$
|
59,671
|
||||||
Borrowed Funds
As of December 31, 2014, we had securities sold under repurchase agreements totaling $62.1 million and no federal funds purchased. At December 31, 2013, we had $53.9 million in securities sold under repurchase agreements and no federal funds purchased. Retail repurchase agreements, included in securities sold under agreements to repurchase, increased $8.2 million, from $41.4 million at December 31, 2013 to $49.6 million at December 31, 2014. Also included in securities sold under agreements to repurchase is a $12.5 million reverse repurchase agreement we entered into with Citigroup Markets, Inc. (“CGMI”) in July of 2007 to meet liquidity demands. Under the terms of the agreement, interest is payable at a fixed rate of 4.57% for the remainder of the term. The repurchase date is scheduled for August 9, 2017; however, the agreement is subject to call by CGMI quarterly.
Long-term FHLB-Dallas advances totaled $26.3 million at December 31, 2014, a decrease of $426,000 from $26.7 million at December 31, 2013. The long-term advances are fixed rate advances with rates ranging from 1.99% to 5.06% and have a range of maturities from January 2015 to January 2019. The short-term FHLB-Dallas advance totaled $25.0 million at December 31, 2014 and December 31, 2013. The rate on these advances at December 31, 2014 was 0.13%, and they mature in March 2015. The FHLB advances are collateralized by a blanket lien on first mortgages and other qualifying loans.
A description of the junior subordinated debentures outstanding as of December 31, 2014 is as follows:
|
Table 13
|
||||||||||
|
Junior Subordinated Debentures
(dollars in thousands)
|
||||||||||
|
Date Issued
|
Maturity Date
|
Interest Rate
|
Callable After
|
Amount
|
||||||
|
July 31, 2001
|
July 9, 2031
|
3 month LIBOR plus 3.30%
|
July 31, 2006
|
$
|
5,671
|
|||||
|
September 20, 2004
|
September 20, 2034
|
3 month LIBOR plus 2.50%
|
September 20, 2009
|
8,248
|
||||||
|
October 12, 2006
|
October 12, 2036
|
3 month LIBOR plus 1.85%
|
June 26, 2011
|
5,155
|
||||||
|
June 21, 2007
|
June 21, 2037
|
3 month LIBOR plus 1.70%
|
June 15, 2012
|
3,093
|
||||||
|
$
|
22,167
|
|||||||||
During 2014, we paid off the $7.2 million junior subordinated debenture that was issued in February 2001. The early redemption of the 10.20% fixed rate junior subordinated debentures resulted in an after-tax charge of $168,000 in the third quarter of 2014.
Our outstanding debentures currently qualify as Tier 1 capital and are presented in the Consolidated Balance Sheets as junior subordinated debentures. Additional information regarding long-term debt is provided in the notes to the consolidated financial statements.
Regulations adopted as a result of the Dodd-Frank Act have resulted in changes to the regulatory capital treatment of securities similar to our debentures. However, because of the issue date of our debentures and our asset size, we may continue to include the debentures in our Tier 1 capital.
In 2014, 2013, and 2012, we did not have an average balance in any category of short-term borrowings including retail repurchase agreements, reverse repurchase agreements, federal funds purchased, or FRB discount window that exceeded 30% of our stockholders’ equity for such year.
Capital
As described under “Business - Supervision and Regulation,” we are required to maintain certain minimum capital levels for the Company and the Bank. Risk-based capital requirements are intended to make regulatory capital more sensitive to the risk profile of an institution's assets. In July 2013, the Federal Reserve and the OCC issued final rules establishing a new comprehensive capital framework for U.S. banking organizations that implement the Basel III capital framework and certain provisions of the Dodd-Frank Act. The final rules seek to strengthen the components of regulatory capital, increase risk-based capital requirements, and make selected changes to the calculation of risk-weighted assets. Details regarding the final rule and changes to capital requirements and prompt corrective action thresholds are included under Part I, Item 1 – Business, Supervision and Regulation. The final rules became effective as of January 1, 2015, for most banking organizations including the Company and the Bank, subject to a transition period for several aspects of the final rules, including the new minimum capital ratio requirements, the capital conservation buffer, and the regulatory capital adjustments and deductions. Requirements to maintain higher levels of capital could adversely impact our return on equity. We believe we will continue to exceed all estimated well-capitalized regulatory requirements under these new rules on a fully phased-in basis.
At December 31, 2014, the Company and the Bank were in compliance with statutory minimum capital requirements. Minimum capital requirements include a total risk-based capital ratio of 8.0%, with Tier 1 capital not less than 4.0%, and a leverage ratio (Tier 1 capital to total average adjusted assets) of 4.0% based upon the regulators latest composite rating of the institution. As of December 31, 2014, the Company’s leverage ratio was 9.52% as compared to 9.35% at December 31, 2013. Tier 1 capital to risk weighted assets was 12.90% and 13.47% for 2014 and 2013, respectively. Total capital to risk weighted assets was 13.73% and 14.19%, respectively, for the same periods. For regulatory purposes, Tier 1 Capital includes $21.5 million of the junior subordinated debentures issued by the Company and assumed in the PSB acquisition. For financial reporting purposes, these funds are included as a liability under GAAP. The Bank’s leverage ratio was 8.95% and 8.91% at December 31, 2014 and 2013, respectively.
The FDIC Improvement Act of 1991 established a capital-based supervisory system for all insured depository institutions that imposes increasing restrictions on the institution as its capital deteriorates. The Bank was classified as “well capitalized” as of December 31, 2014. No significant restrictions are placed on the Bank as a result of this classification.
As discussed under the heading Balance Sheet Analysis - Securities, $4.4 million in unrealized gains on securities available-for-sale, less a deferred tax liability of $1.5 million, was recorded as a reduction to stockholders’ equity as of December 31, 2014. As of December 31, 2013, $163,000 in unrealized losses on securities available-for-sale, less a deferred tax asset of $57,000, was recorded as a reduction to stockholders’ equity. While the net unrealized gain or loss on securities available-for-sale is required to be reported as a separate component of stockholders' equity, it does not affect operating results or regulatory capital ratios. The net unrealized gains and losses reported for December 31, 2014 and 2013, however, did affect the equity-to-assets ratio for financial reporting purposes. The ratio of equity-to-assets was 10.79% at December 31, 2014 and 10.30% at December 31, 2013.
Asset/Liability Management and Interest Rate Sensitivity
Interest rate sensitivity is the sensitivity of net interest income and economic value of equity to changes in market rates of interest. The primary objective of our asset and liability management process is to evaluate interest rate sensitivity inherent in our balance sheet components and establish guidelines to manage that risk within acceptable performance levels. Management and our Board of Directors are responsible for determining the appropriate level of acceptable risk based on our strategic focus, regulatory requirements for capital and liquidity, and the market environment. Our Board of Directors established an Asset/Liability management committee (“ALCO”), comprised of certain executive and senior officers of the Bank, to measure and monitor interest rate risk within defined parameters. During the first half of 2014, ALCO utilized an internal model of asset and liability management to measure interest rate risk using net interest income simulation and economic value of equity sensitivity analysis. During the second half of 2014, ALCO transitioned to an external model for asset and liability management from our core processor. The model captures data directly from our operating system along with additional information regarding rates and prepayment characteristics to construct an analysis that presents differences in repricing, cash flows and the maturity characteristics of earning assets and interest-bearing liabilities for selected time periods.
This data, combined with additional assumptions including repricing rates and payment characteristics, were used to perform instantaneous parallel rate shift and alternate rate shift simulations. Instantaneous parallel rate shifts are known as “rate shocks” because all rates are modeled to change instantaneously by the indicated shock amount. Alternate rate shifts include floor rates that generally provide more realistic projections of changes in net interest income and market risk. Results of the simulations were compared to a base case scenario that provided projected net interest income over the next 12 months with no change in the balance sheet. The estimated percentage changes in projected net interest income due to changes in interest rates of alternate down 100 basis points, parallel up 200, and up 300 basis points as determined through the simulations are detailed below. At December 31, 2014, the interest rate risk model results were within policy guidelines and indicated that our balance sheet is slightly asset sensitive. The results of the interest rate risk modeling are reviewed by ALCO and discussed quarterly at Funds Management committee meetings of our Board of Directors.
|
Net Interest Income at Risk in Year 1
|
||||
|
Changes in Interest Rates
|
Estimated Increase /Decrease
in NII at December 31, 2014
|
|||
|
Shock Up 300 basis points
|
4.08%
|
|
||
|
Shock Up 200 basis points
|
2.72%
|
|
||
|
Alternate Down 100 basis points
|
(5.00)%
|
|
||
In January 2011, we revised our asset/liability and funds management policy to allow for the use of interest rate derivatives. During 2012, we entered into two loan level interest rate swaps with customers that had current notional balances totaling $2.3 million as of December 31, 2014. These agreements effectively converted both fixed rate loans originated into floating rates that are tied to the one month LIBOR. Concurrently, we entered into interest rate swap agreements with a third party brokerage firm that effectively offset the interest rate risk associated with the customers’ interest rate swaps. As a result, these swap agreements have no impact on our earnings.
Liquidity
Bank Liquidity
Liquidity is the availability of funds to meet maturing contractual obligations and to fund operations. The Bank’s primary liquidity needs involve its ability to accommodate customers’ demands for deposit withdrawals as well as customers’ requests for credit. Liquidity is deemed adequate when sufficient cash to meet these needs can be promptly raised at a reasonable cost to the Bank.
Liquidity is provided primarily by three sources: a stable base of funding sources, an adequate level of assets that can be readily converted into cash, and borrowing lines with correspondent banks. Our core deposits are our most stable and important source of funding. Cash deposits at other banks, federal funds sold, and principal payments received on loans and mortgage-backed securities provide additional primary sources of liquidity. Approximately $63.4 million in projected cash flows from securities repayments during 2015 provides an additional source of liquidity.
The Bank also has significant borrowing capacity with the FRB-Atlanta and with the FHLB–Dallas. As of December 31, 2014, we had no borrowings with the FRB-Atlanta. Long-term FHLB-Dallas advances totaled $26.3 million at December 31, 2014 and are fixed rate advances with rates ranging from 1.99% to 5.06% and have a range of maturities from January 2015 to January 2019. A short-term FHLB-Dallas advance totaled $25.0 million at December 31, 2014. The rate on the advance at December 31, 2014 was 0.13%, and it matures in March 2015. The Bank has the ability to post additional collateral of approximately $135.1 million if necessary to meet liquidity needs. Additionally, $233.6 million in loan collateral is pledged under a Borrower-in-Custody line with the FRB-Atlanta. Under existing agreements with the FHLB-Dallas, our borrowing capacity totaled $314.2 million at December 31, 2014. Additional unsecured borrowing lines totaling $33.5 million are available through correspondent banks. We utilize these contingency funding alternatives to meet deposit volatility, which is more likely in the current environment, given unusual competitive offerings within our markets.
Company Liquidity
In August 2011, the Company repaid $20.0 million in Series A Preferred Stock issued in 2009 to the Treasury under the CPP with funds from the Treasury’s SBLF program authorized by Congress under the Small Business Jobs Act of 2010. As a result of the repurchase of the Series A Preferred Stock, all of the TARP limitations affecting the Company were removed. In connection with the SBLF transaction, the Company issued $32.0 million in Series B Preferred Stock to the Treasury. Net of $20.0 million used to repay the Series A Preferred Stock, the remaining $12.0 million was injected into the Bank as additional common equity capital. The dividend rate was set at 1.00% for the fourth quarter of 2013 due to attaining the target 10% growth rate in qualified small business loans during the second quarter of 2013. As a result of qualified small business loan growth as of September 30, 2013, the dividend rate was set at 1.00% for the period from January 1, 2014 through February 25, 2016. After February 25, 2016, the dividend rate will increase to 9% per annum.
At the Company level, cash is needed primarily to meet interest payments on the junior subordinated debentures, dividend payments on the Series B and Series C Preferred Stock and dividends on the common stock. We issued $8,248,000 in unsecured junior subordinated debentures in September 2004 and $7,217,000 in February 2001. In August 2014, we paid off the $7.2 million junior subordinated debenture. In December 2012, we acquired $13.9 million in unsecured junior subordinated debentures from PSB. The terms of the junior subordinated debentures are described in the notes to the consolidated financial statements. Dividends from the Bank totaling $15,500,000 provided additional liquidity for the Company to meet interest and dividend payments in 2014 and to begin building cash reserves to repay the Series B Preferred Stock prior to February 2016. Dividends totaling $11,000,000 were paid by the Bank to the Company in 2013. As of January 1, 2015, the Bank had the ability to pay dividends to the Company of approximately $21.0 million without prior approval from the OCC. At December 31, 2014, the parent company had approximately $9.5 million cash available for general corporate purposes, including injecting capital into the Bank. As a publicly traded company, the Company also has the ability, subject to market conditions, to issue additional shares of common stock, preferred stock and other securities to provide funds as needed for operations and future growth of the Company and the Bank.
Dividends
The primary source of cash dividends on the Company's common stock is dividends from the Bank. The Bank has the ability to declare dividends to the Company of up to $21.0 million as of December 31, 2014 without prior approval of the OCC. However, the Bank’s ability to pay dividends would be prohibited if the result would cause the Bank’s regulatory capital to fall below minimum requirements.
Cash dividends totaling $4.0 million and $3.5 million were declared to common stockholders during 2014 and 2013, respectively.
Off Balance Sheet Arrangements and Other Contractual Obligations
In the normal course of business we use various financial instruments with off-balance sheet risk to meet the financing needs of customers and to reduce exposure to fluctuations in interest rates. These financial instruments include commitments to extend credit and letters of credit. Those instruments involve, to varying degrees, elements of credit and interest rate risk in excess of the amounts recognized in the financial statements. We did not have an average balance in any category of short-term borrowings detailed below in 2014, 2013, or 2012 that exceeded 30% of our stockholders’ equity for such year. Additional information regarding contractual obligations appears in the notes to the consolidated financial statements. The following table presents significant contractual obligations as of December 31, 2014.
|
Table 14
|
||||||||||||||||||||
|
Contractual Obligations
(in thousands)
|
||||||||||||||||||||
|
Payment due by period
|
||||||||||||||||||||
|
1 year
|
> 1-3
|
> 3-5
|
More than
|
|||||||||||||||||
|
Total
|
or less
|
years
|
years
|
5 years
|
||||||||||||||||
|
Time deposits
|
$
|
251,454
|
$
|
212,032
|
$
|
32,149
|
$
|
7,271
|
$
|
2
|
||||||||||
|
Short-term FHLB advances
|
25,000
|
25,000
|
-
|
-
|
-
|
|||||||||||||||
|
Long-term debt obligations
|
48,444
|
426
|
15,830
|
10,021
|
22,167
|
|||||||||||||||
|
Retail Repurchase Agreements
|
49,598
|
49,598
|
-
|
-
|
-
|
|||||||||||||||
|
Reverse Repurchase Agreements
|
12,500
|
-
|
12,500
|
-
|
-
|
|||||||||||||||
|
Operating lease obligations
|
17,081
|
2,080
|
3,263
|
3,166
|
8,572
|
|||||||||||||||
|
Total
|
$
|
404,077
|
$
|
289,136
|
$
|
63,742
|
$
|
20,458
|
$
|
30,741
|
||||||||||
The consolidated financial statements and notes thereto, presented herein, have been prepared in accordance with GAAP, which generally require the measurement of financial position and operating results in terms of historical dollars without considering the change in the relative purchasing power of money over time and due to inflation. The impact of inflation is reflected in the increased cost of operations. Unlike most industrial companies, nearly all of our assets and liabilities are financial in nature. As a result, interest rates generally have a greater impact on our performance than do the effects of general levels of inflation. For additional information, see “Funding Sources – Asset Liability Management and Interest Rate Sensitivity.”
Information regarding market risk appears under the heading “Funding Sources – Asset Liability Management and Interest Rate Sensitivity” under Item 7 – Management’s Discussion and Analysis of Financial Position and Results of Operations included in this filing.
|
Consolidated Balance Sheets
|
||||||||
|
December 31, 2014 and 2013
|
||||||||
|
(dollars in thousands, except share data)
|
||||||||
|
2014
|
2013
|
|||||||
|
Assets
|
||||||||
|
Cash and due from banks, including required reserves of $10,019 and $9,542, respectively
|
$
|
45,142
|
$
|
43,488
|
||||
|
Interest-bearing deposits in banks
|
39,031
|
13,993
|
||||||
|
Federal funds sold
|
2,699
|
2,250
|
||||||
|
Securities available-for-sale, at fair value (cost of $272,588 at December 31, 2014 and $341,828 at December 31, 2013)
|
276,984
|
341,665
|
||||||
|
Securities held-to-maturity (estimated fair value of $141,593 at December 31, 2014 and $151,168 at December 31, 2013)
|
141,201
|
155,523
|
||||||
|
Other investments
|
9,990
|
11,526
|
||||||
|
Loans
|
1,284,431
|
1,137,554
|
||||||
|
Allowance for loan losses
|
(11,226
|
)
|
(8,779
|
)
|
||||
|
Loans, net
|
1,273,205
|
1,128,775
|
||||||
|
Bank premises and equipment, net
|
69,958
|
72,343
|
||||||
|
Accrued interest receivable
|
6,635
|
6,692
|
||||||
|
Goodwill
|
42,171
|
42,171
|
||||||
|
Intangibles
|
6,834
|
7,941
|
||||||
|
Cash surrender value of life insurance
|
13,659
|
13,450
|
||||||
|
Other real estate
|
4,234
|
6,687
|
||||||
|
Other assets
|
4,997
|
4,656
|
||||||
|
Total assets
|
$
|
1,936,740
|
$
|
1,851,160
|
||||
|
Liabilities and Stockholders’ Equity
|
||||||||
|
Liabilities:
|
||||||||
|
Deposits:
|
||||||||
|
Noninterest-bearing
|
$
|
390,863
|
$
|
383,257
|
||||
|
Interest-bearing
|
1,194,371
|
1,135,546
|
||||||
|
Total deposits
|
1,585,234
|
1,518,803
|
||||||
|
Securities sold under agreements to repurchase
|
62,098
|
53,916
|
||||||
|
Short-term Federal Home Loan Bank advances
|
25,000
|
25,000
|
||||||
|
Notes payable
|
26,277
|
27,703
|
||||||
|
Junior subordinated debentures
|
22,167
|
29,384
|
||||||
|
Other liabilities
|
6,952
|
5,605
|
||||||
|
Total liabilities
|
1,727,728
|
1,660,411
|
||||||
|
Commitments and contingencies
|
||||||||
|
Stockholders’ equity:
|
||||||||
|
Series B Preferred stock, no par value; 5,000,000 shares authorized, 32,000 shares issued and outstanding at December 31, 2014 and 2013
|
32,000
|
32,000
|
||||||
|
Series C Preferred stock, no par value; 100,000 shares authorized, 93,680 shares issued and outstanding at December 31, 2014 and 99,971 shares issued and outstanding at December 31, 2013
|
9,368
|
9,997
|
||||||
|
Common stock, $0.10 par value; 30,000,000 shares authorized, 11,491,703 and 11,407,196 issued and 11,340,736 and 11,256,712 outstanding at December 31, 2014 and December 31, 2013, respectively
|
1,149
|
1,141
|
||||||
|
Additional paid-in capital
|
112,744
|
111,017
|
||||||
|
Unearned ESOP shares
|
(250
|
)
|
-
|
|||||
|
Accumulated other comprehensive income (loss)
|
2,857
|
(106
|
)
|
|||||
|
Treasury stock- 150,967 and 150,484 shares at December 31, 2014 and 2013, respectively, at cost
|
(3,295
|
)
|
(3,286
|
)
|
||||
|
Retained earnings
|
54,439
|
39,986
|
||||||
|
Total stockholders’ equity
|
209,012
|
190,749
|
||||||
|
Total liabilities and stockholders’ equity
|
$
|
1,936,740
|
$
|
1,851,160
|
||||
See notes to consolidated financial statements.
|
Consolidated Statements of Earnings
|
||||||||||||
|
Years Ended December 31, 2014, 2013 and 2012
|
||||||||||||
|
(in thousands, except per share data)
|
||||||||||||
|
2014
|
2013
|
2012
|
||||||||||
|
Interest income:
|
||||||||||||
|
Loans, including fees
|
$
|
72,327
|
$
|
71,016
|
$
|
49,776
|
||||||
|
Investment securities:
|
||||||||||||
|
Taxable
|
8,100
|
8,609
|
8,083
|
|||||||||
|
Nontaxable
|
2,637
|
3,184
|
2,880
|
|||||||||
|
Other interest income
|
423
|
394
|
283
|
|||||||||
|
Total interest income
|
83,487
|
83,203
|
61,022
|
|||||||||
|
Interest expense:
|
||||||||||||
|
Deposits
|
3,515
|
3,961
|
4,100
|
|||||||||
|
Short-term borrowings
|
840
|
816
|
756
|
|||||||||
|
Long-term borrowings
|
378
|
416
|
-
|
|||||||||
|
Junior subordinated debentures
|
1,074
|
1,346
|
984
|
|||||||||
|
Total interest expense
|
5,807
|
6,539
|
5,840
|
|||||||||
|
Net interest income
|
77,680
|
76,664
|
55,182
|
|||||||||
|
Provision for loan losses
|
5,625
|
3,050
|
2,050
|
|||||||||
|
Net interest income after provision for loan losses
|
72,055
|
73,614
|
53,132
|
|||||||||
|
Noninterest income:
|
||||||||||||
|
Service charges on deposit accounts
|
9,780
|
9,225
|
7,430
|
|||||||||
|
ATM and debit card income
|
7,209
|
6,400
|
4,605
|
|||||||||
|
Gain on securities, net
|
128
|
234
|
204
|
|||||||||
|
Executive officer life insurance proceeds
|
3,000
|
-
|
-
|
|||||||||
|
Other charges and fees
|
4,305
|
3,460
|
2,705
|
|||||||||
|
Total noninterest income
|
24,422
|
19,319
|
14,944
|
|||||||||
|
Noninterest expenses:
|
||||||||||||
|
Salaries and employee benefits
|
33,847
|
34,182
|
24,713
|
|||||||||
|
Occupancy expense
|
15,064
|
15,112
|
11,320
|
|||||||||
|
ATM and debit card expense
|
2,889
|
2,399
|
1,559
|
|||||||||
|
Other
|
18,209
|
20,913
|
17,063
|
|||||||||
|
Total noninterest expense
|
70,009
|
72,606
|
54,655
|
|||||||||
|
Income before income taxes
|
26,468
|
20,327
|
13,421
|
|||||||||
|
Income tax expense
|
7,358
|
6,151
|
3,779
|
|||||||||
|
Net earnings
|
19,110
|
14,176
|
9,642
|
|||||||||
|
Dividends on preferred stock
|
698
|
1,332
|
1,547
|
|||||||||
|
Net earnings available to common stockholders
|
$
|
18,412
|
$
|
12,844
|
$
|
8,095
|
||||||
|
Earnings per common share:
|
||||||||||||
|
Basic
|
$
|
1.63
|
$
|
1.14
|
$
|
0.77
|
||||||
|
Diluted
|
$
|
1.58
|
$
|
1.12
|
$
|
0.77
|
||||||
See notes to consolidated financial statements.
|
Consolidated Statements of Comprehensive Income
|
||||||||||||
|
Years Ended December 31, 2014, 2013 and 2012
|
||||||||||||
|
(in thousands)
|
||||||||||||
|
2014
|
2013
|
2012
|
||||||||||
|
Net earnings
|
$
|
19,110
|
$
|
14,176
|
$
|
9,642
|
||||||
|
Other comprehensive income (loss), net of tax:
|
||||||||||||
|
Unrealized gains (losses) on securities available-for-sale:
|
||||||||||||
|
Unrealized holding gains (losses) arising during the year
|
4,687
|
(12,481
|
)
|
831
|
||||||||
|
Less: reclassification adjustment for net gains on sales of securities available-for-sale
|
(128
|
)
|
(234
|
)
|
(204
|
)
|
||||||
|
Total other comprehensive income (loss), before tax
|
4,559
|
(12,715
|
)
|
627
|
||||||||
|
Income tax effect related to items of other comprehensive income
|
(1,596
|
)
|
4,450
|
(220
|
)
|
|||||||
|
Total other comprehensive income (loss), net of tax
|
2,963
|
(8,265
|
)
|
407
|
||||||||
|
Total comprehensive income
|
$
|
22,073
|
$
|
5,911
|
$
|
10,049
|
||||||
See notes to consolidated financial statements.
|
Consolidated Statements of Stockholders’ Equity
|
||||||||||||||||||||||||||||||||||||||||
|
Years Ended December 31, 2014, 2013 and 2012
|
||||||||||||||||||||||||||||||||||||||||
|
(in thousands, except share and per share data)
|
||||||||||||||||||||||||||||||||||||||||
|
Preferred Stock
|
Common Stock
|
Surplus
|
Unearned ESOP Shares
|
Accumulated Other Comprehensive
Income
|
Treasury Stock
|
Retained Earnings
|
Total
|
|||||||||||||||||||||||||||||||||
|
Shares
|
Amount
|
Shares
|
Amount
|
|||||||||||||||||||||||||||||||||||||
|
Balance December 31, 2011
|
32,000
|
$
|
32,000
|
10,615,983
|
$
|
1,062
|
$
|
98,842
|
$
|
-
|
$
|
7,752
|
$
|
(3,286
|
)
|
$
|
25,467
|
$
|
161,837
|
|||||||||||||||||||||
|
Net earnings
|
-
|
-
|
-
|
-
|
-
|
-
|
-
|
-
|
9,642
|
9,642
|
||||||||||||||||||||||||||||||
|
Issuance of common stock for acquisitions
|
-
|
-
|
756,511
|
76
|
11,454
|
-
|
-
|
-
|
-
|
11,530
|
||||||||||||||||||||||||||||||
|
Issuance of Series C preferred stock for acquisitions
|
99,971
|
9,997
|
-
|
-
|
-
|
-
|
-
|
-
|
-
|
9,997
|
||||||||||||||||||||||||||||||
|
Dividends on Series B preferred stock
|
-
|
-
|
-
|
-
|
-
|
-
|
-
|
-
|
(1,547
|
)
|
(1,547
|
)
|
||||||||||||||||||||||||||||
|
Dividends on common stock - $0.28 per share
|
-
|
-
|
-
|
-
|
-
|
-
|
-
|
-
|
(2,933
|
)
|
(2,933
|
)
|
||||||||||||||||||||||||||||
|
Exercise of stock options
|
-
|
-
|
14,117
|
1
|
99
|
-
|
-
|
-
|
-
|
100
|
||||||||||||||||||||||||||||||
|
Tax benefit resulting from exercise of stock options, net adjustment
|
-
|
-
|
-
|
-
|
1
|
-
|
-
|
-
|
-
|
1
|
||||||||||||||||||||||||||||||
|
Stock option and restricted stock compensation expense
|
-
|
-
|
-
|
-
|
207
|
-
|
-
|
-
|
-
|
207
|
||||||||||||||||||||||||||||||
|
Change in accumulated other comprehensive income
|
-
|
-
|
-
|
-
|
-
|
-
|
407
|
-
|
-
|
407
|
||||||||||||||||||||||||||||||
|
Balance December 31, 2012
|
131,971
|
41,997
|
11,386,611
|
1,139
|
110,603
|
-
|
8,159
|
(3,286
|
)
|
30,629
|
189,241
|
|||||||||||||||||||||||||||||
|
Net earnings
|
-
|
-
|
-
|
-
|
-
|
-
|
-
|
-
|
14,176
|
14,176
|
||||||||||||||||||||||||||||||
|
Dividends on Series B preferred stock
|
-
|
-
|
-
|
-
|
-
|
-
|
-
|
-
|
(931
|
)
|
(931
|
)
|
||||||||||||||||||||||||||||
|
Dividends on Series C preferred stock
|
-
|
-
|
-
|
-
|
-
|
-
|
-
|
-
|
(400
|
)
|
(400
|
)
|
||||||||||||||||||||||||||||
|
Dividends on common stock - $0.31 per share
|
-
|
-
|
-
|
-
|
-
|
-
|
-
|
-
|
(3,488
|
)
|
(3,488
|
)
|
||||||||||||||||||||||||||||
|
Exercise of stock options
|
-
|
-
|
6,155
|
1
|
68
|
-
|
-
|
-
|
-
|
69
|
||||||||||||||||||||||||||||||
|
Tax benefit resulting from exercise of stock options, net adjustment
|
-
|
-
|
-
|
-
|
4
|
-
|
-
|
-
|
-
|
4
|
||||||||||||||||||||||||||||||
|
Vested restricted stock
|
-
|
-
|
14,430
|
1
|
(1
|
)
|
-
|
-
|
-
|
-
|
-
|
|||||||||||||||||||||||||||||
|
Tax benefit resulting from issuance of restricted stock
|
-
|
-
|
-
|
-
|
14
|
-
|
-
|
-
|
-
|
14
|
||||||||||||||||||||||||||||||
|
Stock option and restricted stock compensation expense
|
-
|
-
|
-
|
-
|
329
|
-
|
-
|
-
|
-
|
329
|
||||||||||||||||||||||||||||||
|
Change in accumulated other comprehensive income
|
-
|
-
|
-
|
-
|
-
|
-
|
(8,265
|
)
|
-
|
-
|
(8,265
|
)
|
||||||||||||||||||||||||||||
|
Balance December 31, 2013
|
131,971
|
41,997
|
11,407,196
|
1,141
|
111,017
|
-
|
(106
|
)
|
(3,286
|
)
|
39,986
|
190,749
|
||||||||||||||||||||||||||||
|
Net earnings
|
-
|
-
|
-
|
-
|
-
|
-
|
-
|
-
|
19,110
|
19,110
|
||||||||||||||||||||||||||||||
|
Dividends on Series B preferred stock
|
-
|
-
|
-
|
-
|
-
|
-
|
-
|
-
|
(320
|
)
|
(320
|
)
|
||||||||||||||||||||||||||||
|
Dividends on Series C preferred stock
|
-
|
-
|
-
|
-
|
-
|
-
|
-
|
-
|
(378
|
)
|
(378
|
)
|
||||||||||||||||||||||||||||
|
Dividends on common stock - $0.35 per share
|
-
|
-
|
-
|
-
|
-
|
-
|
-
|
-
|
(3,959
|
)
|
(3,959
|
)
|
||||||||||||||||||||||||||||
|
Conversion of Series C preferred stock to common stock
|
(6,291
|
)
|
(629
|
)
|
34,947
|
3
|
626
|
-
|
-
|
-
|
||||||||||||||||||||||||||||||
|
Treasury stock acquired at cost
|
-
|
-
|
-
|
-
|
-
|
-
|
-
|
(9
|
)
|
-
|
(9
|
)
|
||||||||||||||||||||||||||||
|
Exercise of stock options
|
-
|
-
|
49,560
|
5
|
638
|
-
|
-
|
-
|
-
|
643
|
||||||||||||||||||||||||||||||
|
Tax benefit resulting from exercise of stock options, net adjustment
|
-
|
-
|
-
|
-
|
21
|
-
|
-
|
-
|
-
|
21
|
||||||||||||||||||||||||||||||
|
Increase in ESOP obligation, net of repayments
|
-
|
-
|
-
|
-
|
-
|
(250
|
)
|
-
|
-
|
-
|
(250
|
)
|
||||||||||||||||||||||||||||
|
Stock option expense
|
-
|
-
|
-
|
-
|
442
|
-
|
-
|
-
|
-
|
442
|
||||||||||||||||||||||||||||||
|
Change in accumulated other comprehensive income
|
-
|
-
|
-
|
-
|
-
|
-
|
2,963
|
-
|
-
|
2,963
|
||||||||||||||||||||||||||||||
|
Balance December 31, 2014
|
125,680
|
$
|
41,368
|
11,491,703
|
$
|
1,149
|
$
|
112,744
|
$
|
(250
|
)
|
$
|
2,857
|
$
|
(3,295
|
)
|
$
|
54,439
|
$
|
209,012
|
||||||||||||||||||||
|
Consolidated Statements of Cash Flows
|
||||||||||||
|
Years Ended December 31, 2014, 2013 and 2012
|
||||||||||||
|
(in thousands)
|
||||||||||||
|
2014
|
2013
|
2012
|
||||||||||
|
Cash flows from operating activities:
|
||||||||||||
|
Net earnings
|
$
|
19,110
|
$
|
14,176
|
$
|
9,642
|
||||||
|
Adjustments to reconcile net earnings to net cash provided by operating activities:
|
||||||||||||
|
Depreciation
|
6,062
|
5,568
|
3,799
|
|||||||||
|
Accretion of purchase accounting adjustments
|
(2,540
|
)
|
(5,869
|
)
|
(2,067
|
)
|
||||||
|
Provision for loan losses
|
5,625
|
3,050
|
2,050
|
|||||||||
|
Deferred tax (benefit) expense
|
(1,489
|
)
|
2,828
|
1,651
|
||||||||
|
Amortization of premiums on securities, net
|
3,047
|
4,473
|
1,878
|
|||||||||
|
Amortization of other investments
|
3
|
13
|
15
|
|||||||||
|
Net (gain) loss on sale of other real estate
|
(1,061
|
)
|
190
|
163
|
||||||||
|
Net write down of other real estate owned
|
91
|
457
|
582
|
|||||||||
|
Net loss on sale/disposal of premises and equipment
|
182
|
96
|
6
|
|||||||||
|
Stock compensation expense
|
442
|
308
|
150
|
|||||||||
|
Restricted stock expense
|
-
|
21
|
57
|
|||||||||
|
Gain on sale and liquidation of securities available-for-sale
|
(128
|
)
|
(234
|
)
|
(204
|
)
|
||||||
|
Change in accrued interest receivable
|
57
|
(1
|
)
|
745
|
||||||||
|
Change in accrued interest payable
|
(234
|
)
|
(201
|
)
|
(181
|
)
|
||||||
|
Change in other assets and liabilities, net
|
591
|
1,009
|
(339
|
)
|
||||||||
|
Net cash provided by operating activities
|
29,758
|
25,884
|
17,947
|
|||||||||
|
Cash flows from investing activities, net of effect of purchase acquisitions in 2012:
|
||||||||||||
|
Net change in time deposits in other banks
|
-
|
881
|
1
|
|||||||||
|
Proceeds from maturities and calls of securities available-for-sale
|
48,464
|
72,728
|
146,019
|
|||||||||
|
Proceeds from maturities and calls of securities held-to-maturity
|
14,344
|
22,946
|
24,340
|
|||||||||
|
Proceeds from sale of securities available-for-sale
|
22,153
|
55,879
|
6,558
|
|||||||||
|
Purchases of securities available-for-sale
|
(1,250
|
)
|
(68,043
|
)
|
(100,384
|
)
|
||||||
|
Purchases of securities held-to-maturity
|
(1,104
|
)
|
(26,382
|
)
|
(38,160
|
)
|
||||||
|
Proceeds from redemption of other investments
|
150
|
1,600
|
500
|
|||||||||
|
Purchases of other investments
|
(580
|
)
|
(3,220
|
)
|
(189
|
)
|
||||||
|
Redemption of Capital Securities related to MidSouth Statutory Trust I
|
217
|
-
|
-
|
|||||||||
|
Net change in loans
|
(147,642
|
)
|
(82,340
|
)
|
(41,335
|
)
|
||||||
|
Purchases of premises and equipment
|
(5,588
|
)
|
(14,264
|
)
|
(10,245
|
)
|
||||||
|
Proceeds from sale of premises and equipment
|
1,729
|
69
|
-
|
|||||||||
|
Net cash associated with Peoples State Bank acquisition
|
-
|
-
|
7,044
|
|||||||||
|
Proceeds from sale of other real estate owned
|
3,794
|
1,215
|
555
|
|||||||||
|
Net cash used in investing activities
|
(65,313
|
)
|
(38,931
|
)
|
(5,296
|
)
|
||||||
|
Cash flows from financing activities, net of effect of purchase acquisitions in 2012:
|
||||||||||||
|
Change in deposits
|
66,679
|
(32,455
|
)
|
(12,432
|
)
|
|||||||
|
Change in securities sold under agreements to repurchase
|
8,182
|
12,469
|
(5,539
|
)
|
||||||||
|
Borrowings on Federal Home Loan Bank advances
|
120,000
|
25,000
|
-
|
|||||||||
|
Repayments of Federal Home Loan Bank advances
|
(120,061
|
)
|
(57
|
)
|
-
|
|||||||
|
Repayments of notes payable
|
(1,000
|
)
|
(1,000
|
)
|
-
|
|||||||
|
Redemption of MidSouth Statutory Trust I
|
(7,217
|
)
|
-
|
-
|
||||||||
|
Proceeds from exercise of stock options
|
643
|
69
|
100
|
|||||||||
|
Tax benefit from exercise of stock options
|
21
|
4
|
1
|
|||||||||
|
Tax benefit from vested restricted stock
|
-
|
14
|
-
|
|||||||||
|
Purchase of treasury stock
|
(9
|
)
|
-
|
-
|
||||||||
|
Payment of dividends on preferred stock
|
(704
|
)
|
(1,519
|
)
|
(1,579
|
)
|
||||||
|
Payment of dividends on common stock
|
(3,838
|
)
|
(3,320
|
)
|
(2,932
|
)
|
||||||
|
Net cash provided by (used in) financing activities
|
62,696
|
(795
|
)
|
(22,381
|
)
|
|||||||
|
Net increase (decrease) in cash and cash equivalents
|
27,141
|
(13,842
|
)
|
(9,730
|
)
|
|||||||
|
Cash and cash equivalents, beginning of year
|
59,731
|
73,573
|
83,303
|
|||||||||
|
Cash and cash equivalents, end of year
|
$
|
86,872
|
$
|
59,731
|
$
|
73,573
|
||||||
See notes to consolidated financial statements.
|
Consolidated Statements of Cash Flows (continued)
|
||||||||||||
|
Years Ended December 31, 2014, 2013 and 2012
|
||||||||||||
|
(in thousands)
|
||||||||||||
|
2014
|
2013
|
2012
|
||||||||||
|
Supplemental cash flow information:
|
||||||||||||
|
Interest paid
|
$
|
6,041
|
$
|
6,534
|
$
|
5,978
|
||||||
|
Income taxes paid
|
8,065
|
3,500
|
2,785
|
|||||||||
|
Noncash investing and financing activities:
|
||||||||||||
|
Common stock issued in acquisition
|
-
|
-
|
11,530
|
|||||||||
|
Change in accrued common stock dividends
|
121
|
167
|
1
|
|||||||||
|
Change in accrued preferred stock dividends
|
(6
|
)
|
(188
|
)
|
(32
|
)
|
||||||
|
Net change in loan to ESOP
|
(250
|
)
|
-
|
-
|
||||||||
|
Change in unrealized gains/losses on securities available-for-sale, net of tax
|
2,963
|
(8,265
|
)
|
407
|
||||||||
|
Transfer of loans to other real estate
|
447
|
1,053
|
879
|
|||||||||
|
Financed portion of sales of other real estate
|
84
|
-
|
290
|
|||||||||
See notes to consolidated financial statements
December 31, 2014, 2013 and 2012
Basis of Presentation—The consolidated financial statements include the accounts of MidSouth Bancorp, Inc. (the “Company”) and its wholly owned subsidiaries MidSouth Bank, N.A. (the “Bank”), Financial Services of the South, Inc. (the “Finance Company”), which has liquidated its loan portfolio, and Peoples General Agency (“PGA”). All significant intercompany accounts and transactions have been eliminated in consolidation. We are subject to regulation under the Bank Holding Company Act of 1956. The Bank is primarily regulated by the Office of the Comptroller of the Currency (“OCC”) and the Federal Deposit Insurance Corporation (“FDIC”).
We are a financial holding company headquartered in Lafayette, Louisiana operating principally in the community banking business by providing banking services to commercial and retail customers through the Bank. The Bank is community oriented and focuses primarily on offering competitive commercial and consumer loan and deposit services to individuals and small to middle market businesses in Louisiana and central and east Texas.
The accounting principles we follow and the methods of applying these principles conform with accounting principles generally accepted in the United States of America (“GAAP”) and with general practices within the banking industry. In preparing the financial statements in conformity with GAAP, management is required to make estimates and assumptions that affect the reported amounts in the financial statements. Actual results could differ significantly from those estimates. Material estimates common to the banking industry that are particularly susceptible to significant change in the near term include, but are not limited to, the determination of the allowance for loan losses, the valuation of real estate acquired in connection with or in lieu of foreclosure on loans, the assessment of goodwill for impairment, and valuation allowances associated with the realization of deferred tax assets which are based on future taxable income. Given the current instability of the economic environment, it is reasonably possible that the methodology of the assessment of potential loan losses, losses on other real estate owned, goodwill impairment, and other fair value measurements could change in the near term or could result in impairment going forward.
A summary of significant accounting policies follows:
Cash and cash equivalents—Cash and cash equivalents include cash on hand, amounts due from banks, interest-bearing deposits in other banks with original maturities of less than 90 days, and federal funds sold.
Investment Securities—We determine the appropriate classification of debt securities at the time of purchase and reassesses this classification periodically. Trading account securities are held for resale in anticipation of short‑term market movements. Debt securities are classified as held‑to‑maturity when we have the positive intent and ability to hold the securities to maturity. Securities not classified as held‑to‑maturity or trading are classified as available‑for‑sale. We had no trading account securities during the three years ended December 31, 2014. Held‑to‑maturity securities are stated at amortized cost. Available‑for‑sale securities are stated at fair value, with unrealized gains and losses, net of deferred taxes, reported as a separate component of stockholders’ equity.
The amortized cost of debt securities classified as held‑to‑maturity or available‑for‑sale is adjusted for amortization of premiums and accretion of discounts to maturity or, in the case of mortgage‑backed securities, over the estimated life of the security. Amortization, accretion, and accrued interest are included in interest income on securities. Realized gains and losses on the sale of securities available‑for‑sale are included in earnings and are determined using the specific‑identification method.
Management evaluates investment securities for other than temporary impairment on a quarterly basis. A decline in the fair value of available-for-sale and held-to-maturity securities below cost that is deemed other than temporary is charged to earnings for a decline in value deemed to be credit related and a new cost basis for the security is established. The decline in value attributed to non-credit related factors is recognized in other comprehensive income.
Other Investments—Other investments include Federal Reserve Bank and Federal Home Loan Bank stock, as well as other correspondent bank stocks and our CRA investment which have no readily determined market value and are carried at cost. Due to the redemption provisions of the investments, the fair value equals cost and no impairment exists.
Loans—Loans that we have the intent and ability to hold for the foreseeable future or until maturity are reported at the principal amount outstanding, net of the allowance for loan losses and any deferred fees or costs on originated loans. Interest income on commercial and real estate mortgage loans is calculated by using the simple interest method on the daily balance of the principal amount outstanding. Unearned income on installment loans is credited to operations based on a method which approximates the interest method. In-house legal counsel and the collections department are responsible for validating loans past due for reporting purposes. Once loans are determined to be past due, the collections department actively works with customers to bring loans back to current status.
We consider a loan to be impaired when, based upon current information and events, we believe it is probable that we will be unable to collect all amounts due according to the contractual terms of the loan agreement. All loans classified as special mention, substandard, or doubtful, based on credit risk rating factors, are reviewed for impairment. Our impaired loans include troubled debt restructurings and performing and nonperforming major loans in which full payment of principal or interest is not expected. Although our policy requires that non-major homogenous loans, which include all loans under $250,000, be evaluated on an overall basis, our current volume of impaired loans allows us to evaluate each impaired loan individually. We calculate the allowance required for impaired loans based on the present value of expected future cash flows discounted at the loan’s effective interest rate, or at the loan’s observable market price or the fair value of the collateral if the loan is collateral dependent. A loan may be impaired but not on nonaccrual status when available information suggests that it is probable the Bank may not receive all contractual principal and interest, however, the loan is still current and payments are received in accordance with the terms of the loan. Payments received for impaired loans not on nonaccrual status are applied to principal and interest.
All impaired loans are reviewed, at minimum, on a quarterly basis. Reviews may be performed more frequently if material information is available before the next scheduled quarterly review. Existing valuations are reviewed to determine if additional discounts or new appraisals are required. After this review, when comparing the resulting collateral valuation to the outstanding loan balance, if the discounted collateral value exceeds the loan balance no specific allocation is reserved. All loans included in our impairment analysis are subject to the same procedure and review, with no distinction given to the dollar amount of the loan.
Our Special Assets Committee meets monthly on troubled credits to review loans with adverse classifications. Loan officers, loan review officers, and in-house legal counsel contribute updated information on each credit, reviewing potential declines or improvements in the borrower’s repayment ability and our collateral position. If deterioration in our collateral position is determined, additional discounts may be applied to the impairment analysis before the new appraisal is received. The committee makes a determination of whether the loans reviewed have reached a point of collateral dependency and sufficient doubt exists as to collectability. As a matter of policy, loans are placed on nonaccrual status when, in the judgment of committee members, the probability of collection of interest is deemed insufficient to warrant further accrual. For loans placed on nonaccrual status, the accrual of interest is discontinued and subsequent payments received are applied to the principal balance. Interest income is recorded after principal has been satisfied and as payments are received. Additionally, loans may be placed on nonaccrual status when the loan becomes 90 days past due and any of the following conditions exist: it becomes evident that the borrower will not make payments or will not or cannot meet the Bank’s terms for the renewal of a matured loan, full repayment of principal and interest is not expected, the loan has a credit quality of substandard, the borrower files bankruptcy and an approved plan of reorganization or liquidation is not anticipated in the near future, or foreclosure action is initiated. When a loan is placed on nonaccrual status, previously accrued but unpaid interest for the current year is deducted from interest income. Prior year unpaid interest is charged to the allowance for loan losses. Some loans may continue accruing after 90 days if the loan is in the process of renewing, being paid off, or the underlying collateral fully supports both the principal and accrued interest and the loan is in the process of collection.
Nonaccrual loans may be returned to accrual status if all principal and interest amounts contractually owed are reasonably assured of repayment within a reasonable period and there is a period of at least six months to one year of repayment performance by the borrower depending on the contractual payment terms. Our Special Assets Committee must approve the return of loans to accrual status as well as exceptions to any requirements of the non-accrual policy.
Generally, commercial, financial, and agricultural loans; construction loans; commercial real estate loans; consumer loans; and finance leases which become 90 days delinquent are either in the process of collection through repossession or foreclosure or are deemed currently uncollectible. The portion of loans deemed currently uncollectible, due to insufficient collateral, are charged‑off against the allowance for loan losses. All loans requested to be charged-off must be specifically authorized by in-house legal counsel and the CEO. Requests may be initiated by collection personnel, bank counsel, loan review, and lending personnel. Charge-offs will be reviewed by in-house legal counsel and the CEO to ensure the propriety and accuracy of charge-off recommendations. Factors considered when determining loan collectability and amount to be charged off for all segments in our loan portfolio include delinquent principal or interest repayment, the ability of borrower to make future payments, collateral value of outstanding debt, and the adequacy of guarantors support. It is the responsibility of in-house legal counsel to report all charge-offs to the Board of Directors or its designated Committee for ratification.
Credit Risk Rating—We manage credit risk by observing written underwriting standards and lending policy established by the Board of Directors and management to govern all lending activities. The risk management program requires that each individual loan officer review his or her portfolio on a quarterly basis and assign recommended credit ratings on each loan. These efforts are supplemented by independent reviews performed by a loan review officer and other validations performed by the internal audit department. The results of the reviews are reported directly to the Audit Committee of the Board of Directors. Additionally, Bank concentrations are monitored and reported quarterly for risk rating distributions, major standard industry classification segments, real estate concentrations, and collateral distributions.
Consumer and residential real estate loans are normally graded at inception, and the grade generally remains the same throughout the life of the loan. Loan grades on commercial, financial, and agricultural; construction; commercial real estate; and finance leases may be changed at any time when circumstances warrant, and are at a minimum reviewed quarterly.
Loans can be classified into the following three risk rating groupings: pass, special mention, and substandard/doubtful. Factors considered in determining a risk rating grade include debt service capacity, capital structure/liquidity, management, collateral quality, industry risk, company trends/operating performance, repayment source, revenue diversification/customer concentration, quality of financial information, and financing alternatives. Pass grade signifies the highest quality of loans to loans with reasonable credit risk, which may include borrowers with marginally adequate financial performance, but have the ability to repay the debt. Special mention loans have potential weaknesses that warrant extra attention from the loan officer and other management personnel, but still have the ability to repay the debt. Substandard classification includes loans with well-defined weaknesses with risk of potential loss. Loans classified as doubtful are considered to have little recovery value and are charged off.
Allowance for Loan Losses—The allowance for loan losses is a valuation account available to absorb probable losses on loans. All losses are charged to the allowance for loan losses when the loss actually occurs or when a determination is made that a loss is likely to occur. Recoveries are credited to the allowance for loan losses at the time of recovery. Quarterly, we estimate the probable level of losses in the existing portfolio through consideration of such factors including, but not limited to, past loan loss experience; estimated losses in significant credits; known deterioration in concentrations of credit; trends in nonperforming assets; volume and composition of the loan portfolio, including percentages of special mention, substandard and past due loans; lending policies and control systems; known inherent risks in the portfolio; adverse situations that may affect the borrower’s ability to repay; the estimated value of any underlying collateral; current national and local economic conditions, including the unemployment rate, the price of oil, and real estate absorption time; the experience, ability and depth of lending management; collections personnel experience; and the results of examinations of the loan portfolio by regulatory agencies and others. Based on these estimates, the allowance for loan losses is increased by charges to earnings and decreased by charge‑offs (net of recoveries).
The allowance is composed of general reserves and specific reserves. General reserves are determined by applying loss percentages to segments of the portfolio. The loss percentages are based on each segment’s historical loss experience, generally over the past twelve to eighteen months, and adjustment factors derived from conditions in the Bank’s internal and external environment. All loans considered to be impaired are evaluated on an individual basis to determine specific reserve allocations in accordance with GAAP. Loans for which specific reserves are provided are excluded from the calculation of general reserves.
We have an internal loan review department that is independent of the lending function to challenge and corroborate the loan grade assigned by the lender and to provide additional analysis in determining the adequacy of the allowance for loan losses.
Management and the Board of Directors believe the allowance for loan losses is appropriate at December 31, 2014. While determination of the allowance for loan losses is based on available information at a given point in time, future additions to the allowance may be necessary based on changes in economic conditions. In addition, various regulatory agencies, as an integral part of their examination process, periodically review our allowance for loan losses. Such agencies may require us to recognize additions or deductions to the allowance based on their judgment and information available to them at the time of their examination.
Interest Rate Swap Agreements—Derivative financial instruments are recognized as assets and liabilities on the consolidated balance sheets and, as required by ASC 815, the Company records all derivatives at fair value. Interest rate swaps are contracts in which a series of interest rate cash flows are exchanged over a prescribed period. The notional balance of interest rate swap agreements held by the Company at December 31, 2014 and 2013 was minimal and not material to the consolidated balance sheets.
Premises and Equipment—Premises and equipment are stated at cost less accumulated depreciation and amortization. Depreciation and amortization are computed using the straight-line method over the estimated useful lives of the assets. The estimated useful lives used to compute depreciation are:
|
Buildings and improvements
|
10 - 40 years
|
|
Furniture, fixtures, and equipment
|
3 - 10 years
|
|
Automobiles
|
3 - 5 years
|
Leasehold improvements are amortized over the estimated useful lives of the improvements or the term of the lease, whichever is shorter.
Other Real Estate Owned—Real estate properties acquired through, or in lieu of, loan foreclosures are initially recorded at the lower of carrying value or fair value less estimated costs to sell based on a current valuation at the time of foreclosure. After foreclosure, valuations are periodically performed by management and the real estate is carried at the lower of carrying amount or fair value less cost to sell. Revenues and expenses from operations and changes in the valuation allowance are charged to earnings.
Goodwill and Other Intangible Assets—Goodwill represents the excess of the purchase price over the fair value of the net identifiable assets acquired in a business combination. Goodwill and other intangible assets deemed to have an indefinite useful life are not amortized but instead are subject to review for impairment annually, or more frequently if deemed necessary. Also, in connection with business combinations involving banks and branch locations, we generally record core deposit intangibles representing the value of the acquired core deposit base. Core deposit intangibles are amortized over the estimated useful life of the deposit base, generally on either a straight-line basis not exceeding 15 years or an accelerated basis over 10 years. The remaining useful lives of core deposit intangibles are evaluated periodically to determine whether events and circumstances warrant revision of the remaining period of amortization.
Cash Surrender Value of Life Insurance—Life insurance contracts represent single premium life insurance contracts on the lives of certain officers of the Company. The Company is the beneficiary of these policies. These contracts are reported at their cash surrender value and changes in the cash surrender value are included in other noninterest income.
Repurchase Agreements—Securities sold under agreements to repurchase are secured borrowings treated as financing activities and are carried at the amounts at which the securities will be subsequently reacquired as specified in the respective agreements.
Deferred Compensation—We record the expense of deferred compensation agreements over the service periods of the persons covered under these agreements.
Income Taxes—Deferred tax assets and liabilities are recorded for future tax consequences attributable to differences between the financial statement carrying amounts of existing assets and liabilities and their respective tax basis. Future tax benefits, such as net operating loss carry forwards, are recognized to the extent that realization of such benefits is more likely than not. Deferred tax assets and liabilities are measured using enacted tax rates expected to apply to taxable income in the years in which the assets and liabilities are expected to be recovered or settled. The effect on deferred tax assets and liabilities of a change in tax rates is recognized in income tax expense in the period that includes the enactment date.
In the event the future tax consequences of differences between the financial reporting bases and the tax bases of our assets and liabilities results in deferred tax assets, an evaluation of the probability of being able to realize the future benefits indicated by such assets is required. A valuation allowance is provided when it is more likely than not that a portion or the full amount of the deferred tax asset will not be realized. In assessing the ability to realize the deferred tax assets, management considers the scheduled reversals of deferred tax liabilities, projected future taxable income, and tax planning strategies. A deferred tax liability is not recognized for portions of the allowance for loan losses for income tax purposes in excess of the financial statement balance. Such a deferred tax liability will only be recognized when it becomes apparent that those temporary differences will reverse in the foreseeable future.
A tax position is recognized as a benefit only if it is “more likely than not” that the tax position would be sustained in a tax examination, with a tax examination being presumed to occur. The amount recognized is the largest amount of tax benefit that is greater than 50 percent more likely of being realized on examination. For tax positions not meeting the “more likely than not” test, no tax benefit is recorded.
The Company recognizes interest and/or penalties related to income tax matters in income tax expense.
Stock-Based Compensation—We expense stock-based compensation based upon the grant date fair value of the related equity award over the requisite service period of the employee.
Basic and Diluted Earnings Per Common Share—Basic earnings per common share (“EPS”) excludes dilution and is computed by dividing net earnings by the weighted‑average number of common shares outstanding for the period. Diluted EPS reflects the potential dilution that could occur if securities or other contracts to issue common stock were exercised or converted into common stock or resulted in the issuance of common stock that then shared in the earnings of the Company. Diluted EPS is computed by dividing net earnings by the total of the weighted-average number of shares outstanding plus the dilutive effect of outstanding options. The amounts of common stock and additional paid-in capital are adjusted to give retroactive effect to large stock dividends. Small stock dividends, or dividends less than 25% of issued shares at the declaration date, are reflected as an increase in common stock and additional paid-in capital and a decrease in retained earnings for the market value of the shares on the date the dividend is declared.
Comprehensive Income—Generally all recognized revenues, expenses, gains and losses are included in net earnings. Although certain changes in assets and liabilities, such as unrealized gains and losses on available-for-sale securities, are reported as a separate component of the equity section of the consolidated balance sheets, such items, along with net earnings, are components of comprehensive income. We present comprehensive income in a separate consolidated statement of comprehensive income.
Statements of Cash Flows—For purposes of reporting cash flows, cash and cash equivalents include cash on hand, amounts due from banks, federal funds sold, and interest-bearing deposits in other banks with original maturities of less than 90 days. Generally, federal funds are sold for one-day periods.
Recent Accounting Pronouncements— ASU 2014-04, Receivables – Troubled Debt Restructurings by Creditors (Subtopic 310-40): Reclassification of Residential Real Estate Collateralized Consumer Mortgage Loans upon Foreclosure (a consensus of the FASB Emerging Issues Task Force) provides guidance on when an in-substance repossession or foreclosure occurs, which requires the mortgage loan to be derecognized and the related real estate be recognized. Creditors must disclose the amount of foreclosed residential real estate held as well as the amount of collateralized loans for which foreclosure is in process. The effective date of this Update is for fiscal years beginning on or after December 15, 2014 and interim periods within those annual periods. Adoption of this Update is not expected to have a material effect on the Company’s consolidated financial statements or the interim notes to the consolidated financial statements.
ASU 2014-14, Receivables – Troubled Debt Restructurings by Creditors (Subtopic 310-40): Classification of Certain Government-Guaranteed Mortgage Loans upon Foreclosure (a consensus of the FASB Emerging Issues Task Force) addresses the diversity in practice regarding the classification and measurement of foreclosed loans which were part of a government-sponsored loan guarantee program. If certain criteria are met, the loan should be derecognized and a separate and other receivable should be recorded upon foreclosure at the amount of the loan balance (principal and interest) expected to be recovered from the guarantor. The effective date of this Update is for fiscal years beginning on or after December 15, 2014 and interim periods within those annual periods. Adoption of this Update is not expected to have a material effect on the Company’s consolidated financial statements or the interim notes to the consolidated financial statements.
Reclassifications—Certain reclassifications have been made to the prior years’ financial statements in order to conform to the classifications adopted for reporting in 2014. The reclassifications had no impact on net income or stockholders’ equity.
The portfolio of securities consisted of the following (in thousands):
|
December 31, 2014
|
||||||||||||||||
|
Amortized
Cost
|
Gross
Unrealized
Gains
|
Gross
Unrealized
Losses
|
Fair Value
|
|||||||||||||
|
Available-for-sale:
|
||||||||||||||||
|
U.S. Government sponsored enterprises
|
$
|
10,339
|
$
|
-
|
$
|
112
|
$
|
10,227
|
||||||||
|
Obligations of state and political subdivisions
|
43,079
|
1,555
|
29
|
44,605
|
||||||||||||
|
GSE mortgage-backed securities
|
106,208
|
3,183
|
288
|
109,103
|
||||||||||||
|
Collateralized mortgage obligations: residential
|
62,093
|
266
|
1,520
|
60,839
|
||||||||||||
|
Collateralized mortgage obligations: commercial
|
24,462
|
190
|
107
|
24,545
|
||||||||||||
|
Other asset-backed securities
|
24,041
|
321
|
19
|
24,343
|
||||||||||||
|
Collateralized debt obligation
|
266
|
952
|
-
|
1,218
|
||||||||||||
|
Mutual funds
|
2,100
|
4
|
-
|
2,104
|
||||||||||||
|
$
|
272,588
|
$
|
6,471
|
$
|
2,075
|
$
|
276,984
|
|||||||||
|
December 31, 2013
|
||||||||||||||||
|
Amortized
Cost
|
Gross
Unrealized
Gains
|
Gross
Unrealized
Losses
|
Fair Value
|
|||||||||||||
|
Available-for-sale:
|
||||||||||||||||
|
U.S. Government sponsored enterprises
|
$
|
11,455
|
$
|
1
|
$
|
191
|
$
|
11,265
|
||||||||
|
Obligations of state and political subdivisions
|
57,925
|
2,296
|
243
|
59,978
|
||||||||||||
|
GSE mortgage-backed securities
|
146,129
|
2,029
|
2,193
|
145,965
|
||||||||||||
|
Collateralized mortgage obligations: residential
|
73,569
|
212
|
2,894
|
70,887
|
||||||||||||
|
Collateralized mortgage obligations: commercial
|
27,082
|
416
|
152
|
27,346
|
||||||||||||
|
Other asset-backed securities
|
25,204
|
351
|
66
|
25,489
|
||||||||||||
|
Collateralized debt obligation
|
464
|
271
|
-
|
735
|
||||||||||||
|
$
|
341,828
|
$
|
5,576
|
$
|
5,739
|
$
|
341,665
|
|||||||||
|
December 31, 2014
|
||||||||||||||||
|
Amortized
Cost
|
Gross
Unrealized
Gains
|
Gross
Unrealized
Losses
|
Fair Value
|
|||||||||||||
|
Held-to-maturity:
|
||||||||||||||||
|
Obligations of state and political subdivisions
|
$
|
45,914
|
$
|
267
|
$
|
192
|
$
|
45,989
|
||||||||
|
GSE mortgage-backed securities
|
67,268
|
1,080
|
164
|
68,184
|
||||||||||||
|
Collateralized mortgage obligations: residential
|
12,709
|
-
|
479
|
12,230
|
||||||||||||
|
Collateralized mortgage obligations: commercial
|
15,310
|
53
|
173
|
15,190
|
||||||||||||
|
$
|
141,201
|
$
|
1,400
|
$
|
1,008
|
$
|
141,593
|
|||||||||
|
December 31, 2013
|
||||||||||||||||
|
Amortized
Cost
|
Gross
Unrealized
Gains
|
Gross
Unrealized
Losses
|
Fair Value
|
|||||||||||||
|
Held-to-maturity:
|
||||||||||||||||
|
Obligations of state and political subdivisions
|
$
|
47,377
|
$
|
38
|
$
|
2,586
|
$
|
44,829
|
||||||||
|
GSE mortgage-backed securities
|
78,272
|
148
|
1,079
|
77,341
|
||||||||||||
|
Collateralized mortgage obligations: residential
|
14,189
|
-
|
979
|
13,210
|
||||||||||||
|
Collateralized mortgage obligations: commercial
|
15,685
|
103
|
-
|
15,788
|
||||||||||||
|
$
|
155,523
|
$
|
289
|
$
|
4,644
|
$
|
151,168
|
|||||||||
With the exception of three private-label collateralized mortgage obligations (“CMOs”) with a combined balance remaining of $44,000 and $59,000 at December 31, 2014 and 2013, respectively, all of the Company’s CMOs are government-sponsored enterprise securities.
The amortized cost and fair value of debt securities at December 31, 2014 by contractual maturity are shown below (in thousands). Except for mortgage backed securities, collateralized mortgage obligations, other assets backed securities, and collateralized debt obligations, expected maturities may differ from contractual maturities because borrowers may have the right to call or prepay obligations with or without call or prepayment penalties.
|
Amortized Cost
|
Fair Value
|
|||||||
|
Available-for-sale:
|
||||||||
|
Due in one year or less
|
$
|
8,218
|
$
|
8,312
|
||||
|
Due after one year through five years
|
30,199
|
30,939
|
||||||
|
Due after five years through ten years
|
13,122
|
13,658
|
||||||
|
Due after ten years
|
1,879
|
1,923
|
||||||
|
Mortgage-backed securities and collateralized mortgage obligations:
|
||||||||
|
Residential
|
168,301
|
169,942
|
||||||
|
Commercial
|
24,462
|
24,545
|
||||||
|
Other asset-backed securities
|
24,041
|
24,343
|
||||||
|
Collateralized debt obligation
|
266
|
1,218
|
||||||
|
Mutual funds
|
2,100
|
2,104
|
||||||
|
$
|
272,588
|
$
|
276,984
|
|||||
|
Amortized Cost
|
Fair Value
|
|||||||
|
Held-to-maturity:
|
||||||||
|
Due in one year or less
|
$
|
105
|
$
|
105
|
||||
|
Due after one year through five years
|
3,097
|
3,110
|
||||||
|
Due after five years through ten years
|
11,308
|
11,291
|
||||||
|
Due after ten years
|
31,404
|
31,483
|
||||||
|
Mortgage-backed securities and collateralized mortgage obligations:
|
||||||||
|
Residential
|
79,977
|
80,414
|
||||||
|
Commercial
|
15,310
|
15,190
|
||||||
|
$
|
141,201
|
$
|
141,593
|
|||||
Details concerning investment securities with unrealized losses are as follows (in thousands):
|
December 31, 2014
|
||||||||||||||||||||||||
|
Securities with losses
under 12 months
|
Securities with losses
over 12 months
|
Total
|
||||||||||||||||||||||
|
Fair
Value
|
Gross
Unrealized
Loss
|
Fair
Value
|
Gross
Unrealized
Loss
|
Fair
Value
|
Gross
Unrealized
Loss
|
|||||||||||||||||||
|
Available-for-sale:
|
||||||||||||||||||||||||
|
U.S. Government sponsored enterprises
|
$
|
4,973
|
$
|
32
|
$
|
5,254
|
$
|
80
|
$
|
10,227
|
$
|
112
|
||||||||||||
|
Obligations of state and political subdivisions
|
2,029
|
29
|
-
|
-
|
2,029
|
29
|
||||||||||||||||||
|
GSE mortgage-backed securities
|
6,668
|
25
|
21,538
|
263
|
28,206
|
288
|
||||||||||||||||||
|
Collateralized mortgage obligations: residential
|
9,366
|
53
|
37,997
|
1,467
|
47,363
|
1,520
|
||||||||||||||||||
|
Collateralized mortgage obligations: commercial
|
-
|
-
|
3,747
|
107
|
3,747
|
107
|
||||||||||||||||||
|
Other asset-backed securities
|
6,401
|
19
|
-
|
-
|
6,401
|
19
|
||||||||||||||||||
|
$
|
29,437
|
$
|
158
|
$
|
68,536
|
$
|
1,917
|
$
|
97,973
|
$
|
2,075
|
|||||||||||||
|
December 31, 2013
|
||||||||||||||||||||||||
|
Securities with losses
under 12 months
|
Securities with losses
over 12 months
|
Total
|
||||||||||||||||||||||
|
Fair
Value
|
Gross
Unrealized
Loss
|
Fair
Value
|
Gross
Unrealized
Loss
|
Fair
Value
|
Gross
Unrealized
Loss
|
|||||||||||||||||||
|
Available-for-sale:
|
||||||||||||||||||||||||
|
U.S. Government sponsored enterprises
|
$
|
10,463
|
$
|
191
|
$
|
-
|
$
|
-
|
$
|
10,463
|
$
|
191
|
||||||||||||
|
Obligations of state and political subdivisions
|
4,256
|
243
|
-
|
-
|
4,256
|
243
|
||||||||||||||||||
|
GSE mortgage-backed securities
|
68,028
|
2,193
|
-
|
-
|
68,028
|
2,193
|
||||||||||||||||||
|
Collateralized mortgage obligations: residential
|
56,975
|
2,563
|
4,371
|
331
|
61,346
|
2,894
|
||||||||||||||||||
|
Collateralized mortgage obligations: commercial
|
4,282
|
152
|
-
|
-
|
4,282
|
152
|
||||||||||||||||||
|
Other asset-backed securities
|
13,099
|
66
|
-
|
-
|
13,099
|
66
|
||||||||||||||||||
|
$
|
157,103
|
$
|
5,408
|
$
|
4,371
|
$
|
331
|
$
|
161,474
|
$
|
5,739
|
|||||||||||||
|
December 31, 2014
|
||||||||||||||||||||||||
|
Securities with losses
under 12 months
|
Securities with losses
over 12 months
|
Total
|
||||||||||||||||||||||
|
Fair
Value
|
Gross
Unrealized
Loss
|
Fair
Value
|
Gross
Unrealized
Loss
|
Fair
Value
|
Gross
Unrealized
Loss
|
|||||||||||||||||||
|
Held-to-maturity:
|
||||||||||||||||||||||||
|
Obligations of state and political subdivisions
|
$
|
11,761
|
$
|
35
|
$
|
13,263
|
$
|
157
|
$
|
25,024
|
$
|
192
|
||||||||||||
|
GSE mortgage-backed securities
|
-
|
-
|
8,142
|
164
|
8,142
|
164
|
||||||||||||||||||
|
Collateralized mortgage obligations: residential
|
-
|
-
|
12,230
|
479
|
12,230
|
479
|
||||||||||||||||||
|
Collateralized mortgage obligations: commercial
|
7,599
|
173
|
-
|
-
|
7,599
|
173
|
||||||||||||||||||
|
$
|
19,360
|
$
|
208
|
$
|
33,635
|
$
|
800
|
$
|
52,995
|
$
|
1,008
|
|||||||||||||
|
December 31, 2013
|
||||||||||||||||||||||||
|
Securities with losses
under 12 months
|
Securities with losses
over 12 months
|
Total
|
||||||||||||||||||||||
|
Fair
Value
|
Gross
Unrealized
Loss
|
Fair
Value
|
Gross
Unrealized
Loss
|
Fair
Value
|
Gross
Unrealized
Loss
|
|||||||||||||||||||
|
Held-to-maturity:
|
||||||||||||||||||||||||
|
Obligations of state and political subdivisions
|
$
|
42,246
|
$
|
2,569
|
$
|
685
|
$
|
17
|
$
|
42,931
|
$
|
2,586
|
||||||||||||
|
GSE mortgage-backed securities
|
31,042
|
1,079
|
-
|
-
|
31,042
|
1,079
|
||||||||||||||||||
|
Collateralized mortgage obligations: residential
|
13,210
|
979
|
-
|
-
|
13,210
|
979
|
||||||||||||||||||
|
$
|
86,498
|
$
|
4,627
|
$
|
685
|
$
|
17
|
$
|
87,183
|
$
|
4,644
|
|||||||||||||
Management evaluates whether unrealized losses on securities represent impairment that is other than temporary on a quarterly basis. For debt securities, the Company considers its intent to sell the securities or if it is more likely than not the Company will be required to sell the securities. If such impairment is identified, based upon the intent to sell or the more likely than not threshold, the carrying amount of the security is reduced to fair value with a charge to earnings. Upon the result of the aforementioned review, management then reviews for potential other than temporary impairment based upon other qualitative factors. In making this evaluation, management considers changes in market rates relative to those available when the security was acquired, changes in market expectations about the timing of cash flows from securities that can be prepaid, performance of the debt security, and changes in the market’s perception of the issuer’s financial health and the security’s credit quality. If determined that a debt security has incurred other than temporary impairment, then the amount of the credit related impairment is determined. If a credit loss is evident, the amount of the credit loss is charged to earnings and the non-credit related impairment is recognized through other comprehensive income.
As of December 31, 2014, 68 securities had unrealized losses totaling 2.00% of the individual securities’ amortized cost basis and 0.75% of the Company’s total amortized cost basis. 44 of the 68 securities had been in an unrealized loss position for over twelve months at December 31, 2014. These 44 securities had an amortized cost basis and unrealized loss of $104.9 million and $2.7 million, respectively. The unrealized losses on debt securities at December 31, 2014 and 2013 resulted from changing market interest rates over the yields available at the time the underlying securities were purchased. Management identified no impairment related to credit quality. At December 31, 2014 and 2013, management had both the intent and ability to hold impaired securities, and no impairment was evaluated as other than temporary. As a result, no impairment losses were recognized on debt securities during the years ended December 31, 2014, 2013, or 2012.
During the year ended December 31, 2014, the Company sold four securities classified as available-for-sale at a gross gain of $128,000. During the year ended December 31, 2013, the Company sold 35 securities classified as available-for-sale at a net gain of $234,000. Of the 35 securities sold, 31 securities were sold with gains totaling $247,000 and four securities were sold at a loss of $13,000.
Securities with an aggregate carrying value of approximately $279.8 million and $259.9 million at December 31, 2014 and 2013, respectively, were pledged to secure public funds on deposit and for other purposes required or permitted by law.
The loan portfolio consisted of the following (in thousands):
|
December 31,
|
||||||||
|
2014
|
2013
|
|||||||
|
Commercial, financial and agricultural
|
$
|
467,147
|
$
|
403,976
|
||||
|
Real estate – construction
|
68,577
|
82,691
|
||||||
|
Real estate – commercial
|
467,172
|
397,135
|
||||||
|
Real estate – residential
|
154,602
|
146,841
|
||||||
|
Installment loans to individuals
|
119,328
|
97,459
|
||||||
|
Lease financing receivable
|
4,857
|
5,542
|
||||||
|
Other
|
2,748
|
3,910
|
||||||
|
1,284,431
|
1,137,554
|
|||||||
|
Less allowance for loan losses
|
(11,226
|
)
|
(8,779
|
)
|
||||
|
$
|
1,273,205
|
$
|
1,128,775
|
|||||
The amounts reported in other loans at December 31, 2014 and 2013 includes the overdrawn demand deposit accounts and loans primarily made to non-profit entities reported for each period.
An analysis of the activity in the allowance for loan losses is as follows (in thousands):
|
December 31,
|
||||||||||||
|
2014
|
2013
|
2012
|
||||||||||
|
Balance, beginning of year
|
$
|
8,779
|
$
|
7,370
|
$
|
7,276
|
||||||
|
Provision for loan losses
|
5,625
|
3,050
|
2,050
|
|||||||||
|
Recoveries
|
738
|
265
|
300
|
|||||||||
|
Loans charged-off
|
(3,916
|
)
|
(1,906
|
)
|
(2,256
|
)
|
||||||
|
Balance, end of year
|
$
|
11,226
|
$
|
8,779
|
$
|
7,370
|
||||||
The Company monitors loan concentrations and evaluates individual customer and aggregate industry leverage, profitability, risk rating distributions, and liquidity for each major standard industry classification segment. At December 31, 2014, one industry segment concentration, the oil and gas industry, aggregate more than 10% of the loan portfolio. The Company’s exposure in the oil and gas industry, including related service and manufacturing industries, totaled approximately $265.0 million, or 20.6% of total loans. Additionally, the Company’s exposure to loans secured by commercial real estate is monitored. At December 31, 2014, loans secured by commercial real estate (including commercial construction and multifamily loans) totaled approximately $510.7 million. Of the $510.7 million, $467.2 million represent CRE loans, 56% of which are secured by owner-occupied commercial properties. Of the $510.7 million in loans secured by commercial real estate, $6.5 million or 1.3% were on nonaccrual status at December 31, 2014.
A rollforward of the activity within the allowance for loan losses by loan type and recorded investment in loans for the years ended December 31, 2014 and 2013 is as follows (in thousands):
|
December 31, 2014
|
||||||||||||||||||||||||||||||||
|
Real Estate
|
||||||||||||||||||||||||||||||||
|
Coml, fin,
and agric
|
Construction
|
Commercial
|
Residential
|
Installment loans to individuals
|
Lease financing receivable
|
Other
|
Total
|
|||||||||||||||||||||||||
|
Allowance for loan losses:
|
||||||||||||||||||||||||||||||||
|
Beginning balance
|
$
|
3,906
|
$
|
1,046
|
$
|
1,389
|
$
|
1,141
|
$
|
1,273
|
$
|
21
|
$
|
3
|
$
|
8,779
|
||||||||||||||||
|
Charge-offs
|
(2,843
|
)
|
(1
|
)
|
(93
|
)
|
(273
|
)
|
(706
|
)
|
-
|
-
|
(3,916
|
)
|
||||||||||||||||||
|
Recoveries
|
164
|
-
|
407
|
47
|
120
|
-
|
-
|
738
|
||||||||||||||||||||||||
|
Provision
|
4,502
|
(91
|
)
|
699
|
(105
|
)
|
624
|
(5
|
)
|
1
|
5,625
|
|||||||||||||||||||||
|
Ending balance
|
$
|
5,729
|
$
|
954
|
$
|
2,402
|
$
|
810
|
$
|
1,311
|
$
|
16
|
$
|
4
|
$
|
11,226
|
||||||||||||||||
|
Ending balance: individually evaluated for impairment
|
$
|
1,010
|
$
|
-
|
$
|
907
|
$
|
68
|
$
|
179
|
$
|
-
|
$
|
-
|
$
|
2,164
|
||||||||||||||||
|
Ending balance: collectively evaluated for impairment
|
$
|
4,719
|
$
|
954
|
$
|
1,495
|
$
|
742
|
$
|
1,132
|
$
|
16
|
$
|
4
|
$
|
9,062
|
||||||||||||||||
|
Loans:
|
||||||||||||||||||||||||||||||||
|
Ending balance
|
$
|
467,147
|
$
|
68,577
|
$
|
467,172
|
$
|
154,602
|
$
|
119,328
|
$
|
4,857
|
$
|
2,748
|
$
|
1,284,431
|
||||||||||||||||
|
Ending balance: individually evaluated for impairment
|
$
|
2,656
|
$
|
54
|
$
|
6,388
|
$
|
1,072
|
$
|
377
|
$
|
-
|
$
|
-
|
$
|
10,547
|
||||||||||||||||
|
Ending balance: collectively evaluated for impairment
|
$
|
464,491
|
$
|
68,523
|
$
|
460,118
|
$
|
153,436
|
$
|
118,951
|
$
|
4,857
|
$
|
2,748
|
$
|
1,273,124
|
||||||||||||||||
|
Ending balance: loans acquired with deteriorated credit quality
|
$
|
-
|
$
|
-
|
$
|
666
|
$
|
94
|
$
|
-
|
$
|
-
|
$
|
-
|
$
|
760
|
||||||||||||||||
|
December 31, 2013
|
||||||||||||||||||||||||||||||||
|
Real Estate
|
||||||||||||||||||||||||||||||||
|
Coml, fin, and agric
|
Construction
|
Commercial
|
Residential
|
Installment loans to individuals
|
Lease financing receivable
|
Other
|
Total
|
|||||||||||||||||||||||||
|
Allowance for loan losses:
|
||||||||||||||||||||||||||||||||
|
Beginning balance
|
$
|
1,535
|
$
|
2,147
|
$
|
2,166
|
$
|
936
|
$
|
543
|
$
|
41
|
$
|
2
|
$
|
7,370
|
||||||||||||||||
|
Charge-offs
|
(935
|
)
|
-
|
(18
|
)
|
(129
|
)
|
(824
|
)
|
-
|
-
|
(1,906
|
)
|
|||||||||||||||||||
|
Recoveries
|
80
|
8
|
29
|
39
|
109
|
-
|
-
|
265
|
||||||||||||||||||||||||
|
Provision
|
3,226
|
(1,109
|
)
|
(788
|
)
|
295
|
1,445
|
(20
|
)
|
1
|
3,050
|
|||||||||||||||||||||
|
Ending balance
|
$
|
3,906
|
$
|
1,046
|
$
|
1,389
|
$
|
1,141
|
$
|
1,273
|
$
|
21
|
$
|
3
|
$
|
8,779
|
||||||||||||||||
|
Ending balance: individually evaluated for impairment
|
$
|
168
|
$
|
3
|
$
|
54
|
$
|
60
|
$
|
120
|
$
|
-
|
$
|
-
|
$
|
405
|
||||||||||||||||
|
Ending balance: collectively evaluated for impairment
|
$
|
3,738
|
$
|
1,043
|
$
|
1,335
|
$
|
1,081
|
$
|
1,153
|
$
|
21
|
$
|
3
|
$
|
8,374
|
||||||||||||||||
|
Loans:
|
||||||||||||||||||||||||||||||||
|
Ending balance
|
$
|
403,976
|
$
|
82,691
|
$
|
397,135
|
$
|
146,841
|
$
|
97,459
|
$
|
5,542
|
$
|
3,910
|
$
|
1,137,554
|
||||||||||||||||
|
Ending balance: individually evaluated for impairment
|
$
|
1,241
|
$
|
100
|
$
|
2,213
|
$
|
900
|
$
|
271
|
$
|
-
|
$
|
-
|
$
|
4,725
|
||||||||||||||||
|
Ending balance: collectively evaluated for impairment
|
$
|
402,735
|
$
|
82,591
|
$
|
394,218
|
$
|
145,773
|
$
|
97,188
|
$
|
5,542
|
$
|
3,910
|
$
|
1,131,957
|
||||||||||||||||
|
Ending balance: loans acquired with deteriorated credit quality
|
$
|
-
|
$
|
-
|
$
|
704
|
$
|
168
|
$
|
-
|
$
|
-
|
$
|
-
|
$
|
872
|
||||||||||||||||
An age analysis of past due loans (including both accruing and non-accruing loans) is as follows (in thousands):
|
December 31, 2014
|
||||||||||||||||||||||||||||
|
30-59 Days Past Due
|
60-89 Days Past Due
|
Greater than 90 Days Past Due
|
Total Past Due
|
Current
|
Total Loans
|
Recorded Investment > 90 days and Accruing
|
||||||||||||||||||||||
|
Commercial, financial, and agricultural
|
$
|
2,179
|
$
|
654
|
$
|
2,556
|
$
|
5,389
|
$
|
461,758
|
$
|
467,147
|
$
|
26
|
||||||||||||||
|
Commercial real estate - construction
|
15
|
-
|
105
|
120
|
43,390
|
43,510
|
97
|
|||||||||||||||||||||
|
Commercial real estate - other
|
4,989
|
270
|
2,464
|
7,723
|
459,449
|
467,172
|
-
|
|||||||||||||||||||||
|
Residential - construction
|
431
|
-
|
-
|
431
|
24,636
|
25,067
|
-
|
|||||||||||||||||||||
|
Residential - prime
|
1,843
|
523
|
704
|
3,070
|
151,532
|
154,602
|
-
|
|||||||||||||||||||||
|
Consumer - credit card
|
5
|
19
|
18
|
42
|
5,970
|
6,012
|
18
|
|||||||||||||||||||||
|
Consumer - other
|
671
|
392
|
107
|
1,170
|
112,146
|
113,316
|
46
|
|||||||||||||||||||||
|
Lease financing receivable
|
-
|
-
|
-
|
-
|
4,857
|
4,857
|
-
|
|||||||||||||||||||||
|
Other loans
|
134
|
-
|
-
|
134
|
2,614
|
2,748
|
-
|
|||||||||||||||||||||
|
$
|
10,267
|
$
|
1,858
|
$
|
5,954
|
$
|
18,079
|
$
|
1,266,352
|
$
|
1,284,431
|
$
|
187
|
|||||||||||||||
|
December 31, 2013
|
||||||||||||||||||||||||||||
|
30-59 Days Past Due
|
60-89 Days Past Due
|
Greater than 90 Days Past Due
|
Total Past Due
|
Current
|
Total Loans
|
Recorded Investment > 90 days and Accruing
|
||||||||||||||||||||||
|
Commercial, financial, and agricultural
|
$
|
4,350
|
$
|
208
|
$
|
1,256
|
$
|
5,814
|
$
|
398,162
|
$
|
403,976
|
$
|
26
|
||||||||||||||
|
Commercial real estate - construction
|
36
|
-
|
63
|
99
|
64,794
|
64,893
|
-
|
|||||||||||||||||||||
|
Commercial real estate - other
|
1,230
|
1,447
|
2,395
|
5,072
|
392,063
|
397,135
|
141
|
|||||||||||||||||||||
|
Residential - construction
|
149
|
-
|
-
|
149
|
17,649
|
17,798
|
-
|
|||||||||||||||||||||
|
Residential - prime
|
2,984
|
870
|
307
|
4,161
|
142,680
|
146,841
|
-
|
|||||||||||||||||||||
|
Consumer - credit card
|
36
|
-
|
7
|
43
|
6,163
|
6,206
|
7
|
|||||||||||||||||||||
|
Consumer - other
|
767
|
102
|
269
|
1,138
|
90,115
|
91,253
|
4
|
|||||||||||||||||||||
|
Lease financing receivable
|
-
|
-
|
-
|
-
|
5,542
|
5,542
|
-
|
|||||||||||||||||||||
|
Other loans
|
125
|
-
|
-
|
125
|
3,785
|
3,910
|
-
|
|||||||||||||||||||||
|
$
|
9,677
|
$
|
2,627
|
$
|
4,297
|
$
|
16,601
|
$
|
1,120,953
|
$
|
1,137,554
|
$
|
178
|
|||||||||||||||
Non-accrual loans are as follows (in thousands):
|
December 31,
|
||||||||
|
2014
|
2013
|
|||||||
|
Commercial, financial and agricultural
|
$
|
2,642
|
$
|
1,272
|
||||
|
Commercial real estate – construction
|
54
|
100
|
||||||
|
Commercial real estate – other
|
6,429
|
2,290
|
||||||
|
Residential - construction
|
-
|
-
|
||||||
|
Residential - prime
|
1,194
|
1,153
|
||||||
|
Consumer – credit card
|
-
|
-
|
||||||
|
Consumer - other
|
382
|
284
|
||||||
|
Lease financing receivable
|
-
|
-
|
||||||
|
Other
|
-
|
-
|
||||||
|
$
|
10,701
|
$
|
5,099
|
|||||
The amount of interest that would have been recorded on nonaccrual loans, had the loans not been classified as nonaccrual, totaled approximately $594,000, $518,000, and $582,000 for the years ended December 31, 2014, 2013, and 2012. Interest actually received on nonaccrual loans at December 31, 2014, 2013, and 2012 was $105,000, $312,000, and $70,000 respectively.
Loans that are individually evaluated for impairment are as follows (in thousands):
|
December 31, 2014
|
||||||||||||||||||||
|
Recorded Investment
|
Unpaid Principal Balance
|
Related Allowance
|
Average Recorded Investment
|
Interest Income Recognized
|
||||||||||||||||
|
With no related allowance recorded:
|
||||||||||||||||||||
|
Commercial, financial, and agricultural
|
$
|
438
|
$
|
521
|
$
|
-
|
$
|
554
|
$
|
-
|
||||||||||
|
Commercial real estate – construction
|
54
|
54
|
-
|
58
|
-
|
|||||||||||||||
|
Commercial real estate – other
|
1,921
|
1,921
|
-
|
1,885
|
17
|
|||||||||||||||
|
Residential – prime
|
543
|
543
|
-
|
534
|
15
|
|||||||||||||||
|
Consumer – other
|
78
|
78
|
-
|
72
|
-
|
|||||||||||||||
|
Subtotal:
|
3,034
|
3,117
|
-
|
3,103
|
32
|
|||||||||||||||
|
With an allowance recorded:
|
||||||||||||||||||||
|
Commercial, financial, and agricultural
|
2,218
|
2,333
|
1,010
|
1,394
|
35
|
|||||||||||||||
|
Commercial real estate – construction
|
-
|
-
|
-
|
19
|
-
|
|||||||||||||||
|
Commercial real estate – other
|
4,467
|
4,467
|
907
|
2,416
|
220
|
|||||||||||||||
|
Residential – prime
|
529
|
548
|
68
|
452
|
3
|
|||||||||||||||
|
Consumer – other
|
299
|
313
|
179
|
252
|
4
|
|||||||||||||||
|
Subtotal:
|
7,513
|
7,661
|
2,164
|
4,533
|
262
|
|||||||||||||||
|
Totals:
|
||||||||||||||||||||
|
Commercial
|
9,098
|
9,296
|
1,917
|
6,326
|
272
|
|||||||||||||||
|
Residential
|
1,072
|
1,091
|
68
|
986
|
18
|
|||||||||||||||
|
Consumer
|
377
|
391
|
179
|
324
|
4
|
|||||||||||||||
|
Grand total:
|
$
|
10,547
|
$
|
10,778
|
$
|
2,164
|
$
|
7,636
|
$
|
294
|
||||||||||
|
December 31, 2013
|
||||||||||||||||||||
|
Recorded Investment
|
Unpaid Principal Balance
|
Related Allowance
|
Average Recorded Investment
|
Interest Income Recognized
|
||||||||||||||||
|
With no related allowance recorded:
|
||||||||||||||||||||
|
Commercial, financial, and agricultural
|
$
|
671
|
$
|
1,107
|
$
|
-
|
$
|
617
|
$
|
3
|
||||||||||
|
Commercial real estate – construction
|
61
|
61
|
-
|
416
|
-
|
|||||||||||||||
|
Commercial real estate – other
|
1,850
|
2,324
|
-
|
2,190
|
8
|
|||||||||||||||
|
Residential – prime
|
525
|
525
|
-
|
1,050
|
14
|
|||||||||||||||
|
Consumer – other
|
66
|
66
|
-
|
90
|
1
|
|||||||||||||||
|
Subtotal:
|
3,173
|
4,083
|
-
|
4,363
|
26
|
|||||||||||||||
|
With an allowance recorded:
|
||||||||||||||||||||
|
Commercial, financial, and agricultural
|
570
|
570
|
168
|
821
|
3
|
|||||||||||||||
|
Commercial real estate – construction
|
39
|
39
|
3
|
102
|
1
|
|||||||||||||||
|
Commercial real estate – other
|
363
|
363
|
54
|
372
|
11
|
|||||||||||||||
|
Residential – prime
|
375
|
395
|
60
|
214
|
4
|
|||||||||||||||
|
Consumer – other
|
205
|
205
|
120
|
211
|
2
|
|||||||||||||||
|
Subtotal:
|
1,552
|
1,572
|
405
|
1,720
|
21
|
|||||||||||||||
|
Totals:
|
||||||||||||||||||||
|
Commercial
|
3,554
|
4,464
|
225
|
4,518
|
26
|
|||||||||||||||
|
Residential
|
900
|
920
|
60
|
1,264
|
18
|
|||||||||||||||
|
Consumer
|
271
|
271
|
120
|
301
|
3
|
|||||||||||||||
|
Grand total:
|
$
|
4,725
|
$
|
5,655
|
$
|
405
|
$
|
6,083
|
$
|
47
|
||||||||||
The following tables present the classes of loans by risk rating (in thousands):
|
|
December 31, 2014
|
|
||||||||||||||||||
|
Commercial Credit Exposure
|
||||||||||||||||||||
|
Credit Risk Profile by Creditworthiness Category
|
||||||||||||||||||||
|
|
Commercial, financial, and agricultural
|
Commercial real estate –construction
|
Commercial real estate – other
|
Percentage of Total
|
||||||||||||||||
|
Pass
|
|
|
$
|
456,221
|
$
|
43,320
|
$
|
440,281
|
96.11
|
%
|
||||||||||
|
Special mention
|
4,861
|
132
|
7,120
|
1.24
|
%
|
|||||||||||||||
|
Substandard
|
5,541
|
58
|
19,771
|
2.60
|
%
|
|||||||||||||||
|
Doubtful
|
524
|
-
|
-
|
0.05
|
%
|
|||||||||||||||
|
|
$
|
467,147
|
$
|
43,510
|
$
|
467,172
|
100.00
|
%
|
||||||||||||
|
Consumer Credit Exposure
|
||||||||||||||||
|
Credit Risk Profile by Creditworthiness Category
|
||||||||||||||||
|
Residential – construction
|
Residential – prime
|
Residential – subprime
|
Percentage of Total
|
|||||||||||||
|
Pass
|
$
|
25,067
|
$
|
150,664
|
$
|
-
|
97.81
|
%
|
||||||||
|
Special mention
|
-
|
1,184
|
-
|
0.66
|
%
|
|||||||||||
|
Substandard
|
-
|
2,754
|
-
|
1.53
|
%
|
|||||||||||
|
$
|
25,067
|
$
|
154,602
|
$
|
-
|
100.00
|
%
|
|||||||||
|
Consumer and Commercial Credit Exposure
|
||||||||||||||||||||
|
Credit Risk Profile Based on Payment Activity
|
||||||||||||||||||||
|
Consumer - credit card
|
Consumer –other
|
Lease financing receivable
|
Other
|
Percentage of Total
|
||||||||||||||||
|
Performing
|
$
|
5,995
|
$
|
112,893
|
$
|
4,857
|
$
|
2,748
|
99.65
|
%
|
||||||||||
|
Nonperforming
|
17
|
423
|
-
|
-
|
0.35
|
%
|
||||||||||||||
|
$
|
6,012
|
$
|
113,316
|
$
|
4,857
|
$
|
2,748
|
100.00
|
%
|
|||||||||||
|
|
December 31, 2013
|
|||||||||||||||||||
|
Commercial Credit Exposure
|
||||||||||||||||||||
|
Credit Risk Profile by Creditworthiness Category
|
||||||||||||||||||||
|
|
Commercial, financial, and agricultural
|
Commercial real estate –construction
|
Commercial real estate – other
|
Percentage of Total
|
||||||||||||||||
|
Pass
|
|
|
$
|
397,513
|
$
|
63,577
|
$
|
371,618
|
96.15
|
%
|
||||||||||
|
Special mention
|
2,962
|
49
|
8,781
|
1.36
|
%
|
|||||||||||||||
|
Substandard
|
3,272
|
1,267
|
16,736
|
2.46
|
%
|
|||||||||||||||
|
Doubtful
|
229
|
-
|
-
|
0.03
|
%
|
|||||||||||||||
|
|
$
|
403,976
|
$
|
64,893
|
$
|
397,135
|
100.00
|
%
|
||||||||||||
|
Consumer Credit Exposure
|
||||||||||||||||
|
Credit Risk Profile by Creditworthiness Category
|
||||||||||||||||
|
Residential – construction
|
Residential – prime
|
Residential – subprime
|
Percentage of Total
|
|||||||||||||
|
Pass
|
$
|
17,798
|
$
|
143,790
|
$
|
-
|
98.15
|
%
|
||||||||
|
Special mention
|
-
|
548
|
-
|
0.33
|
%
|
|||||||||||
|
Substandard
|
-
|
2,503
|
-
|
1.52
|
%
|
|||||||||||
|
$
|
17,798
|
$
|
146,841
|
$
|
-
|
100.00
|
%
|
|||||||||
|
Consumer and Commercial Credit Exposure
|
||||||||||||||||||||
|
Credit Risk Profile Based on Payment Activity
|
||||||||||||||||||||
|
Consumer - credit card
|
Consumer –other
|
Lease financing receivable
|
Other
|
Percentage of Total
|
||||||||||||||||
|
Performing
|
$
|
6,196
|
$
|
90,978
|
$
|
5,542
|
$
|
3,910
|
99.73
|
%
|
||||||||||
|
Nonperforming
|
10
|
275
|
-
|
-
|
0.27
|
%
|
||||||||||||||
|
$
|
6,206
|
$
|
91,253
|
$
|
5,542
|
$
|
3,910
|
100.00
|
%
|
|||||||||||
Troubled Debt Restructurings
A troubled debt restructuring (“TDR”) is a restructuring of a debt made by the Company to a debtor for economic or legal reasons related to the debtor’s financial difficulties that it would not otherwise consider. The Company grants the concession in an attempt to protect as much of its investment as possible.
Information about the Company’s TDRs is as follows (in thousands):
|
December 31, 2014
|
||||||||||||||||
|
Current
|
Past Due Greater Than 30 Days
|
Nonaccrual TDRs
|
Total TDRs
|
|||||||||||||
|
Commercial, financial and agricultural
|
$
|
21
|
$
|
-
|
$
|
234
|
$
|
255
|
||||||||
|
Real estate - commercial
|
155
|
-
|
-
|
155
|
||||||||||||
|
$
|
176
|
$
|
-
|
$
|
234
|
$
|
410
|
|||||||||
|
December 31, 2013
|
||||||||||||||||
|
Current
|
Past Due Greater Than 30 Days
|
Nonaccrual TDRs
|
Total TDRs
|
|||||||||||||
|
Commercial, financial and agricultural
|
$
|
-
|
$
|
23
|
$
|
233
|
$
|
256
|
||||||||
|
Real estate - commercial
|
156
|
-
|
-
|
156
|
||||||||||||
|
$
|
156
|
$
|
23
|
$
|
233
|
$
|
412
|
|||||||||
During the year ended December 31, 2014, there was one loan relationship with a pre-modification balance of $1.2 million identified as a TDR through a modification of the original loan terms. The loan was paid off during the second quarter of 2014 and, therefore, is not reflected in the balance of TDRs at December 31, 2014. During the year ended December 31, 2014, there were no defaults on any loans that were modified as TDRs during the preceding twelve months. During the year ended December 31, 2013, one loan with a pre-modification balance of $27,000 was identified as a TDR through modification of the original loan terms, and there were no defaults on any loans that were modified as TDRs during the preceding twelve months. For purposes of the determination of an allowance for loan losses on these TDRs, as an identified TDR, the Company considers a loss probable on the loan and, as a result is reviewed for specific impairment in accordance with the Company’s allowance for loan loss methodology. If it is determined losses are probable on such TDRs, either because of delinquency or other credit quality indicator, the Company establishes specific reserves for these loans. As of December 31, 2014, there were no commitments to lend additional funds to debtors owing sums to the Company whose terms have been modified in TDRs.
In the opinion of management, all transactions entered into between the Company and such related parties have been and are made in the ordinary course of business, on substantially the same terms and conditions, including interest rates and collateral, as similar transactions with unaffiliated persons and do not involve more than the normal risk of collection.
An analysis of the 2014 activity with respect to these related party loans and commitments to extend credit is as follows (in thousands):
|
Balance, beginning of year
|
$
|
3,114
|
||
|
New loans
|
407
|
|||
|
Repayments and adjustments
|
(544
|
)
|
||
|
Balance, end of year
|
$
|
2,977
|
Premises and equipment consisted of the following (in thousands):
|
December 31,
|
||||||||
|
2014
|
2013
|
|||||||
|
Land
|
$
|
16,078
|
$
|
16,771
|
||||
|
Buildings and improvements
|
50,731
|
46,091
|
||||||
|
Furniture, fixtures, and equipment
|
27,121
|
26,244
|
||||||
|
Automobiles
|
1,512
|
1,299
|
||||||
|
Leasehold improvements
|
10,178
|
10,146
|
||||||
|
Construction-in-process
|
2,088
|
4,489
|
||||||
|
107,708
|
105,040
|
|||||||
|
Less accumulated depreciation and amortization
|
(37,750
|
)
|
(32,697
|
)
|
||||
|
$
|
69,958
|
$
|
72,343
|
|||||
Depreciation expense totaled approximately $6.1 million, $5.6 million, and $3.8 million for the years ended December 31, 2014, 2013, and 2012, respectively.
Changes to the carrying amount of goodwill for the years ended December 31, 2014 and 2013 are provided in the following table (in thousands):
|
2014
|
2013
|
|||||||
|
Beginning balance
|
$
|
42,171
|
$
|
42,781
|
||||
|
Adjustment to goodwill
|
-
|
(610
|
)
|
|||||
|
Ending balance
|
$
|
42,171
|
$
|
42,171
|
||||
The adjustments to goodwill made during the year ended December 31, 2013 included reductions resulting from reclassification of a $415,000 liability assumed, a $351,000 increase in the value of fixed assets acquired and a $190,000 increase in the amount of income tax receivable recorded from the PSB acquisition. Additionally, the amount of increases in goodwill recorded in the PSB acquisition included a $254,000 market value adjustment on two bonds held in the investment portfolio and a $36,000 increase to the amount of income tax payable recorded from the PSB acquisition. The adjustments were made as additional information existing at the time of the acquisition was reviewed. Net of deferred taxes, the adjustments resulted in a $610,000 reduction to goodwill recorded in the PSB acquisition. The adjustments to goodwill had no impact on net earnings or stockholders’ equity.
A summary of core deposit intangible assets as of December 31, 2014 and 2013 is as follows (in thousands):
|
2014
|
2013
|
|||||||
|
Gross carrying amount
|
$
|
11,674
|
$
|
11,674
|
||||
|
Less accumulated amortization
|
(4,840
|
)
|
(3,733
|
)
|
||||
|
Net carrying amount
|
$
|
6,834
|
$
|
7,941
|
||||
Amortization expense on the core deposit intangible assets totaled approximately $1.1 million in 2014, $1.1 million in 2013, and $762,000 in 2012.
The estimated amortization expense on the core deposit intangible assets for the five succeeding years and thereafter is as follows (in thousands):
|
2015
|
$
|
1,106
|
||
|
2016
|
1,106
|
|||
|
2017
|
1,106
|
|||
|
2018
|
1,106
|
|||
|
2019
|
1,107
|
|||
|
Thereafter
|
1,303
|
|||
|
$
|
6,834
|
Deposits consisted of the following (in thousands):
|
December 31,
|
||||||||
|
2014
|
2013
|
|||||||
|
Noninterest-bearing
|
$
|
390,863
|
$
|
383,257
|
||||
|
Savings and money market
|
473,290
|
465,748
|
||||||
|
NOW accounts
|
469,627
|
429,279
|
||||||
|
Time deposits less than $250
|
166,385
|
192,833
|
||||||
|
Time deposits $250 or more
|
85,069
|
47,686
|
||||||
|
$
|
1,585,234
|
$
|
1,518,803
|
|||||
Time deposits held consist primarily of certificates of deposits. The maturities for these deposits at December 31, 2014 are as follows (in thousands):
|
2015
|
$
|
212,032
|
||
|
2016
|
23,182
|
|||
|
2017
|
8,967
|
|||
|
2018
|
4,239
|
|||
|
2019
|
3,032
|
|||
|
Thereafter
|
2
|
|||
|
$
|
251,454
|
Deposits from related parties totaled approximately $9.6 million and $16.4 million at December 31, 2014 and 2013, respectively.
Securities sold under agreements to repurchase totaled $62.1 million and $53.9 million at December 31, 2014 and 2013, respectively.
At December 31, 2014 and 2013, retail repurchase agreements, defined as securities sold under agreements to repurchase from our customers, totaled $49.6 million and $41.4 million, respectively. These retail repurchase agreements are secured overnight borrowings from customers, which may be drawn on demand. The agreements bear interest at a rate determined by us. The average rate of the outstanding agreements was 0.43% at December 31, 2014 and 2013. The Company had pledged securities with an approximate market value of $60.9 million and $51.8 million as collateral at December 31, 2014 and 2013, respectively.
Also included in securities sold under agreements to repurchase is a $12.5 million repurchase agreement the Company entered into with CitiGroup Global Markets, Inc. (“CGMI”) effective August 9, 2007. Under the terms of the repurchase agreement, interest is payable quarterly based on a floating rate equal to the 3-month LIBOR for the first 12 months of the agreement and a fixed rate of 4.57% for the remainder of the term. The rate at December 31, 2014 was 4.57%. The repurchase date is scheduled for August 9, 2017; however, the agreement may be called by CGMI quarterly. The Company had pledged securities with a market value $15.7 million as collateral at December 31, 2014 and 2013.
In 2014, 2013, and 2012, the Company did not have an average balance in any category of short-term borrowings including retail repurchase agreements, reverse repurchase agreements, federal funds purchased, or short-term FHLB advances that exceeded 30% of our stockholders’ equity for such year.
Short-term FHLB advances totaled $25.0 million at December 31, 2014 and 2013. The short-term FHLB advances at December 31, 2014 consisted of one FHLB advance with a maturity of 87 days at a fixed interest rate of 0.13%. The short-term FHLB advances at December 31, 2013 consisted of one FHLB advance with a maturity of 87 days at a fixed interest rate of 0.15%.
The short-term and long-term FHLB advances at December 31, 2014 and 2013 are collateralized by a blanket lien on first mortgages and other qualifying loans totaling $364.4 million and $180.6 million, respectively.
As of December 31, 2014 and 2013, the Company had $314.2 million and $130.4 million, respectively, of additional FHLB advances available.
Notes payable at December 31, 2014 and 2013 is summarized as follows (in thousands):
|
December 31,
|
||||||||
|
2014
|
2013
|
|||||||
|
Long-term Federal Home Loan Bank advances
|
$
|
26,277
|
$
|
26,703
|
||||
|
Notes payable – First National Bankers Bank
|
-
|
1,000
|
||||||
|
$
|
26,277
|
$
|
27,703
|
|||||
The scheduled maturities of long-term FHLB advances at December 31, 2014 are summarized as follows (in thousands):
|
Amount
|
Weighted Average Rate
|
|||||||
|
2015
|
$
|
426
|
5.057
|
%
|
||||
|
2016
|
427
|
5.057
|
%
|
|||||
|
2017
|
15,403
|
3.412
|
%
|
|||||
|
2019
|
10,021
|
1.985
|
%
|
|||||
|
Total FHLB advances
|
$
|
26,277
|
||||||
A description of the junior subordinated debentures outstanding is as follows (in thousands):
|
December 31,
|
|||||||||||||||
|
Date Issued
|
Maturity Date
|
Interest Rate
|
Callable After
|
2014
|
2013
|
||||||||||
|
February 22, 2001
|
February 22, 2031
|
10.20%
|
February 22, 2011
|
$
|
-
|
$
|
7,217
|
||||||||
|
July 31, 2001
|
July 9, 2031
|
3 month LIBOR plus 3.30%
|
July 31, 2006
|
5,671
|
5,671
|
||||||||||
|
September 20, 2004
|
September 20, 2034
|
3 month LIBOR plus 2.50%
|
September 20, 2009
|
8,248
|
8,248
|
||||||||||
|
October 12, 2006
|
October 12, 2036
|
3 month LIBOR plus 1.85%
|
June 26, 2011
|
5,155
|
5,155
|
||||||||||
|
June 21, 2007
|
June 21, 2037
|
3 month LIBOR plus 1.70%
|
June 15, 2012
|
3,093
|
3,093
|
||||||||||
|
$
|
22,167
|
$
|
29,384
|
||||||||||||
The trusts are considered variable-interest entities (“VIE”). The Trusts are not consolidated with the Company since the Company is not the primary beneficiary of the VIE. Accordingly, the Company does not report the securities issued by the Trusts as liabilities, and instead reports as liabilities the junior subordinated debentures issued by the Company and held by the Trusts, as these are not eliminated in the consolidation. The Trust Preferred Securities are recorded as junior subordinated debentures on the balance sheets, but subject to certain limitations qualify for Tier 1 capital for regulatory capital purposes.
During 2014, the Company redeemed $7.2 million of its Statutory Trust 1 and Capital Securities. The early redemption of the 10.20% fixed rate junior subordinated debentures resulted in an after-tax charge of $168,000 in the third quarter of 2014.
At December 31, 2014, future annual minimum rental payments due under non-cancellable operating leases are as follows (in thousands):
|
2015
|
$
|
2,080
|
||
|
2016
|
1,713
|
|||
|
2017
|
1,550
|
|||
|
2018
|
1,580
|
|||
|
2019
|
1,586
|
|||
|
Thereafter
|
8,572
|
|||
|
$
|
17,081
|
Rental expense under operating leases for 2014, 2013, and 2012 was approximately $2.5 million, $2.6 million, and $2.5 million, respectively.
The Company is party to various legal proceedings arising in the ordinary course of business. In management’s opinion, the ultimate resolution of these legal proceedings will not have a material adverse effect on the Company’s financial position, results of operations, or cash flows.
At December 31, 2014, the Company had borrowing lines available through the Bank with the FHLB of Dallas and other correspondent banks. The Bank had approximately $314.2 million available, subject to available collateral, under a secured line of credit with the FHLB of Dallas. Additional federal funds lines of credit were available through correspondent banks with approximately $33.5 million available for overnight borrowing at December 31, 2014. Additionally, $233.6 million in loan collateral is pledged under a Borrower-in-Custody line with the FRB-Atlanta. As of December 31, 2014, the Company had no borrowings with the FRB-Atlanta.
Deferred income taxes reflect the net tax effects of temporary differences between the carrying amounts of assets and liabilities for financial reporting purposes and the amounts used for income tax purposes. Significant components of our deferred tax assets and liabilities as of December 31, 2014 and 2013 are as follows (in thousands):
|
2014
|
2013
|
|||||||
|
Deferred tax assets:
|
||||||||
|
Allowance for loan losses
|
$
|
5,593
|
$
|
5,359
|
||||
|
Alternative minimum tax credit
|
388
|
-
|
||||||
|
Unrealized loss on securities
|
-
|
57
|
||||||
|
Other
|
1,914
|
2,193
|
||||||
|
Total deferred tax assets
|
7,895
|
7,609
|
||||||
|
Deferred tax liabilities:
|
||||||||
|
Premises and equipment
|
4,336
|
5,153
|
||||||
|
FHLB stock dividends
|
65
|
59
|
||||||
|
Unrealized gains on securities
|
1,538
|
-
|
||||||
|
Other
|
2,833
|
3,168
|
||||||
|
Total deferred tax liabilities
|
8,772
|
8,380
|
||||||
|
Net deferred tax liability
|
$
|
877
|
$
|
771
|
||||
Based upon the level of historical taxable income and projections for future taxable income over the periods in which the deferred tax assets are deductible, the Company believes that it is more likely than not that it will realize the benefits of these deductible differences existing at December 31, 2014. Therefore, no valuation allowance is necessary at this time. The net deferred tax liability is included in other liabilities on the consolidated balance sheets.
Components of income tax expense are as follows (in thousands):
|
2014
|
2013
|
2012
|
||||||||||
|
Current
|
$
|
8,847
|
$
|
3,323
|
$
|
2,128
|
||||||
|
Deferred (benefit) expense
|
(1,489
|
)
|
2,828
|
1,651
|
||||||||
|
Total income tax expense
|
$
|
7,358
|
$
|
6,151
|
$
|
3,779
|
||||||
The provision for federal income taxes differs from the amount computed by applying the U.S. Federal income tax statutory rate of 35% on pre-tax income as follows (in thousands):
|
December 31,
|
||||||||||||
|
2014
|
2013
|
2012
|
||||||||||
|
Taxes calculated at statutory rate
|
$
|
9,264
|
$
|
7,114
|
$
|
4,697
|
||||||
|
Increase (decrease) resulting from:
|
||||||||||||
|
Tax-exempt interest, net
|
(923
|
)
|
(1,095
|
)
|
(988
|
)
|
||||||
|
Executive officer life insurance proceeds
|
(1,050
|
)
|
-
|
-
|
||||||||
|
Other
|
67
|
132
|
70
|
|||||||||
|
$
|
7,358
|
$
|
6,151
|
$
|
3,779
|
|||||||
The Company’s federal income tax returns are open and subject to examination from the 2011 tax return year and forward. The various state income and franchise tax returns are generally open from the 2011 and later tax return years based on individual state statutes of limitation. We are not currently under examination by federal or state tax authorities for the 2011, 2012, or 2013 tax years.
The Company sponsors a leveraged employee stock ownership plan (“ESOP”) that covers all employees who meet minimum age and service requirements. The Company makes annual contributions to the ESOP in amounts as determined by the Board of Directors. These contributions are used to pay debt service and purchase additional shares. In past years, certain ESOP shares were pledged as collateral for debt. As the debt was repaid, shares were released from collateral and allocated to active employees, based on the proportion of debt service paid in the year. On May 2, 2014, the ESOP borrowed $283,000 payable to MidSouth Bank, N.A for the purpose of purchasing additional shares of MidSouth Bancorp, Inc.’s common stock. A total of 5,300 shares at $17.16 per share, 4,700 shares at $18.00 per share and 6,000 shares at $17.98 per share were purchased with the loan proceeds on May 2, 2014, May 5, 2014 and May 7, 2014, respectively. The balance of the notes payable of the ESOP was $250,000 at December 31, 2014.
Because the source of the loan payments are contributions received by the ESOP from the Company, the related notes receivable is shown as a reduction of stockholders’ equity. In accordance with GAAP, compensation costs relating to shares purchased are based on the fair value of shares committed to be released. The unreleased shares are not considered outstanding in the computation of earnings per common share. Dividends received on ESOP shares are allocated based on shares held for the benefit of each participant and used to purchase additional shares of stock for each participant. ESOP compensation expense consisting of both cash contributions and shares committed to be released for 2014 was approximately $720,000. ESOP compensation expense consisting of cash contributions for 2013 and 2012 was approximately $720,000 and $428,000, respectively. The cost basis of the shares released for 2014 was $17.71 per share. ESOP shares as of December 31, 2014 and 2013 were as follows:
|
2014
|
2013
|
|||||||
|
Allocated shares
|
554,741
|
537,373
|
||||||
|
Shares released for allocation
|
1,892
|
-
|
||||||
|
Unreleased shares
|
14,108
|
-
|
||||||
|
Total ESOP shares
|
570,741
|
537,373
|
||||||
|
Fair value of unreleased shares at December 31
|
$
|
245,000
|
$
|
-
|
||||
The Company has deferred compensation arrangements with certain officers, which will provide them with a fixed benefit after retirement. The Company recorded a liability of approximately $1.3 million at December 31, 2014 and $1.2 million at December 31, 2013 in connection with these agreements. Deferred compensation expense recognized in 2014, 2013, and 2012 was approximately $80,000, $74,000, and $68,000, respectively.
The Company sponsors defined contribution post-retirement benefit agreements to provide death benefits for the designated beneficiaries of certain of the Company's executive officers. Under the agreements, split-dollar whole life insurance contracts were purchased on certain executive officers. The increase in the cash surrender value of the contracts, less the Bank's cost of funds, constitutes the Company's contribution to the agreements each year. In the event the insurance contracts fail to produce positive returns, the Company has no obligation to contribute to the agreements. During 2014, 2013, and 2012, the Company incurred expenses of $7,000, $12,000 and $39,000, respectively, related to the agreements.
The Company has a 401(k) retirement plan covering substantially all employees who have been employed for 90 days and meet certain other requirements. Under this plan, employees can contribute a portion of their salary within the limits provided by the Internal Revenue Code into the plan. The Company made contributions to the plan totaling $60,000, $60,000 and $33,000 in 2014, 2013 and 2012, respectively.
In May of 2007, our stockholders approved the 2007 Omnibus Incentive Compensation Plan to provide incentives and awards for directors, officers, and employees. “Awards” as defined in the Plan includes, with limitations, stock options (including restricted stock options), restricted stock awards, stock appreciation rights, performance shares, stock awards and cash awards, all on a stand-alone, combination, or tandem basis. The 2007 Omnibus Incentive Compensation Plan replaces the 1997 Stock Incentive Plan, which expired February of 2007. A total of 525,000 of our common shares outstanding were reserved for issuance under the Plan, of which 105,476 were available to be granted as of December 31, 2014.
Stock Options – Of the 358,073 options outstanding at December 31, 2014, 6,042 were issued under the 1997 Stock Incentive Plan and 352,031 were issued under the 2007 Omnibus Incentive Compensation Plan. All options outstanding at December 31, 2014 are incentive stock options with a term of ten years, 315,571 of which vest 20% each year on the anniversary date of the grant and 42,502 of which vest 16.67% each year. The following table summarizes activity relating to stock options:
|
Options
|
Weighted Average Exercise Price
|
Weighted Average Remaining Contractual Term
|
Aggregate Intrinsic Value
|
|||||||||||||
|
Outstanding at December 31, 2011
|
35,100
|
$
|
14.07
|
|||||||||||||
|
Granted
|
294,803
|
12.97
|
||||||||||||||
|
Exercised
|
(14,117
|
)
|
7.15
|
|||||||||||||
|
Forfeited or expired
|
(7,941
|
)
|
12.97
|
|||||||||||||
|
Outstanding at December 31, 2012
|
307,845
|
$
|
13.36
|
|||||||||||||
|
Granted
|
131,280
|
15.82
|
||||||||||||||
|
Exercised
|
(6,155
|
)
|
11.10
|
|||||||||||||
|
Forfeited or expired
|
(328
|
)
|
20.88
|
|||||||||||||
|
Outstanding at December 31, 2013
|
432,642
|
$
|
14.13
|
|||||||||||||
|
Granted
|
17,500
|
18.99
|
||||||||||||||
|
Exercised
|
(49,560
|
)
|
12.97
|
|||||||||||||
|
Forfeited or expired
|
(42,509
|
)
|
16.24
|
|||||||||||||
|
Outstanding at December 31, 2014
|
358,073
|
$
|
14.28
|
7.81
|
$
|
1,094,000
|
||||||||||
|
Exercisable at December 31, 2012
|
20,983
|
$
|
18.72
|
|||||||||||||
|
Exercisable at December 31, 2013
|
70,457
|
14.81
|
||||||||||||||
|
Exercisable at December 31, 2014
|
109,691
|
13.98
|
7.33
|
$
|
368,000
|
|||||||||||
A summary of changes in unvested options for the period ended December 31, 2014 is as follows:
|
Number
of
Options
|
Weighted Average
Grant Date
Fair Value
|
|||||||
|
Unvested options outstanding, beginning of year
|
362,185
|
$
|
4.84
|
|||||
|
Granted
|
17,500
|
5.77
|
||||||
|
Vested
|
(100,755
|
)
|
4.67
|
|||||
|
Forfeited
|
(30,548
|
)
|
5.19
|
|||||
|
Unvested options outstanding, end of year
|
248,382
|
$
|
4.93
|
|||||
As of December 31, 2014 there was a total of $1.0 million in unrecognized compensation cost related to nonvested share-based compensation arrangements. The total amount of options expensed during the years ended December 31, 2014, 2013 and 2012 was $442,000, $308,000 and $150,000, respectively.
The fair value of each option granted is estimated on the grant date using the Black-Scholes Option Pricing Model. This model requires management to make certain assumptions, including the expected life of the option, the risk free rate of interest, the expected volatility, and the expected dividend yield. The risk free rate of interest is based on the yield of a U.S. Treasury security with a similar term. The expected volatility is based on historic volatility over a term similar to the expected life of the options. The dividend yield is based on the current yield at the date of grant. The following weighted average assumptions were made in estimating the fair value of the options granted in 2014 and 2013:
|
2014
|
2013
|
|||||||
|
Risk free rate of interest
|
1.7
|
%
|
1.3
|
%
|
||||
|
Expected volatility
|
39.2
|
%
|
47.4
|
%
|
||||
|
Dividend yield
|
1.9
|
%
|
2.1
|
%
|
||||
|
Average expected life (in years)
|
5
|
5
|
||||||
|
Weighted-average grant-date fair value
|
$
|
5.77
|
$
|
5.59
|
||||
The total intrinsic value of the options exercised was $217,000, $41,000, and $130,000 for the years ended December 31, 2014, 2013, and 2012, respectively.
Restricted Stock Awards – On June 30, 2010, the Compensation Committee (formerly the Personnel Committee) of the Board of Directors of the Company made grants of 22,047 shares of restricted stock under the Company’s 2007 Omnibus Incentive Compensation Plan to certain officers and employees of the Company. The restricted shares of stock, which are subject to the terms of a Restricted Stock Grant Agreement between the Company and each recipient, fully vested on June 30, 2013. Prior to vesting, the recipient was entitled to vote the shares and received the dividends as declared by the Company with respect to its common stock. Compensation expense for restricted stock was based on the fair value of the restricted stock awards at the time of the grant, which was equal to the market value of the Company’s common stock on the date of grant. The value of the restricted stock grants was amortized monthly into compensation expense over the three year vesting period.
The restricted shares had a fair value of $12.77 per share on the date of issuance. For the year ended December 31, 2013 and 2012, compensation expense of $21,000 and $57,000, respectively, was recognized related to non-vested restricted stock awards.
The payment of dividends by the Bank to the Company is restricted by various regulatory and statutory limitations. At December 31, 2014, the Bank had approximately $21.0 million available to pay dividends to the parent company without regulatory approval.
On January 9, 2009 the Company issued 20,000 shares of Series A Preferred Stock associated with its participation in the Treasury’s Capital Purchase Plan (“CPP”) under the Troubled Asset Relief Program. The proceeds from this sale of $20,000,000 less direct costs to issue were allocated to preferred stock. As part of the CPP transaction, the Company issued the Treasury a warrant to purchase 208,768 shares of our common stock at an exercise price of $14.37 per share. However, as a result of the completion of our public offering in December 2009, the number of shares subject to the warrants held by the Treasury was reduced to 104,384 shares. In late 2011, the Treasury sold this warrant to an unrelated third party. The Company did not receive any proceeds from such sale.
The Series A preferred stock qualified as Tier 1 capital and paid cumulative dividends at a rate of 5% per annum. In August 2011, the Company redeemed all 20,000 outstanding shares of Series A preferred stock at its stated value of $1,000 per share with funds from our issuance of 32,000 shares of Series B preferred stock in connection with the Company’s participation under the U.S. Treasury’s Small Business Lending Fund (“SBLF”). The remaining $12.0 million of net proceeds from the issuance was provided to the Bank as additional capital. The dividend rate on the Series B preferred stock was set at 1.00% for the fourth quarter of 2013 due to attaining the target 10% growth rate in qualified small business loans during the second quarter of 2013. Beginning March 2016, the dividend rate will increase to 9% per annum. The Series B preferred stock is nonvoting except for class voting rights on matters that would adversely affect the rights of the holders of the Series B preferred stock.
On December 28, 2012, the Company issued 756,511 shares of common stock and 99,971 shares of Series C Preferred Stock in connection with the PSB acquisition. The Series C Preferred Stock is entitled to the payment of noncumulative dividends, if and when declared by the Company’s Board of Directors, at the rate of 4.00% per annum, payable quarterly in arrears on January 15, April 15, July 15 and October 15 of each year, beginning on April 15, 2013. The Series C Preferred Stock ranks pari passu with the existing Senior Non-Cumulative Perpetual Preferred Stock, Series B, issued in connection with the Company’s participation under the U. S. Treasury’s SBLF and senior to the Company’s common stock. The Company may redeem the Series C Preferred Stock, subject to regulatory approval, beginning on or after the fifth anniversary of the closing date of the Merger, at a redemption price equal to the liquidation value of the Series C Preferred Stock, plus declared but unpaid dividends, if any. The Company may also redeem the Series C Preferred Stock, subject to regulatory approval, at the same redemption price prior to the fifth anniversary of the closing date in the event the Series C Preferred Stock no longer qualifies for ‘Tier 1 Capital” treatment by the applicable federal banking regulators. Holders may convert the Series C Preferred Stock at any time into shares of the Company’s common stock at a conversion price of $18.00 per share, subject to customary anti-dilution adjustments. In addition, on or after the fifth anniversary of the closing date, the Company will have the option to require conversion of the Series C Preferred Stock if the closing price of the Company’s common stock for 20 trading days within any period of 30 consecutive trading days, exceeds 130% of the conversion price.
The following is a summary of the tax effects allocated to each component of other comprehensive (loss) income (in thousands):
|
December 31,
|
||||||||||||||||||||||||||||||||||||
|
2014
|
2013
|
2012
|
||||||||||||||||||||||||||||||||||
|
Before Tax Amount
|
Tax
Effect
|
Net of Tax Amount
|
Before Tax Amount
|
Tax
Effect
|
Net of Tax Amount
|
Before Tax Amount
|
Tax
Effect
|
Net of Tax Amount
|
||||||||||||||||||||||||||||
|
Other comprehensive income (loss):
|
||||||||||||||||||||||||||||||||||||
|
Securities available-for-sale:
|
||||||||||||||||||||||||||||||||||||
|
Change in unrealized gain/loss during period
|
$
|
4,687
|
$
|
(1,641
|
)
|
$
|
3,046
|
$
|
(12,481
|
)
|
$
|
4,368
|
$
|
(8,113
|
)
|
$
|
831
|
$
|
(291
|
)
|
$
|
540
|
||||||||||||||
|
Reclassification adjustment for gains included in net income
|
(128
|
)
|
45
|
(83
|
)
|
(234
|
)
|
82
|
(152
|
)
|
(204
|
)
|
71
|
(133
|
)
|
|||||||||||||||||||||
|
Total other comprehensive income (loss)
|
$
|
4,559
|
$
|
(1,596
|
)
|
$
|
2,963
|
$
|
(12,715
|
)
|
$
|
4,450
|
$
|
(8,265
|
)
|
$
|
627
|
$
|
(220
|
)
|
$
|
407
|
||||||||||||||
The reclassifications out of accumulated other comprehensive income into net earnings are presented below (in thousands):
|
December 31,
|
|||||||||||||||
|
2014
|
2013
|
2012
|
|||||||||||||
|
Details about Accumulated Other Comprehensive Income Components
|
Reclassifications Out of Accumulated Other Comprehensive Income
|
Statement of
Earnings Line
Item
|
Reclassifications Out of Accumulated Other Comprehensive Income
|
Statement of
Earnings Line
Item
|
Reclassifications Out of Accumulated Other Comprehensive Income
|
Statement of
Earnings Line
Item
|
|||||||||
|
Unrealized gains and losses on securities available-for-sale:
|
|||||||||||||||
|
$
|
(128
|
)
|
Gain on securities, net
|
$
|
(234
|
)
|
Gain on securities, net
|
$
|
(204
|
)
|
Gain on securities, net
|
||||
|
45
|
Income tax expense
|
82
|
Income tax expense
|
71
|
Income tax expense
|
||||||||||
|
$
|
(83
|
)
|
Net of tax
|
$
|
(152
|
)
|
Net of tax
|
$
|
(133
|
)
|
Net of tax
|
||||
Following is a summary of the information used in the computation of earnings per common share (in thousands):
|
December 31,
|
||||||||||||
|
2014
|
2013
|
2012
|
||||||||||
|
Net earnings available to common stockholders
|
$
|
18,412
|
$
|
12,844
|
$
|
8,095
|
||||||
|
Dividends on Series C preferred stock
|
378
|
400
|
-
|
|||||||||
|
Adjusted net earnings available to common stockholders
|
$
|
18,790
|
$
|
13,244
|
$
|
8,095
|
||||||
|
Weighted average number of common shares outstanding used in computation of basic earnings per common share
|
11,282
|
11,247
|
10,482
|
|||||||||
|
Effect of dilutive securities:
|
||||||||||||
|
Stock options
|
77
|
50
|
24
|
|||||||||
|
Restricted stock
|
-
|
-
|
12
|
|||||||||
|
Preferred stock
|
542
|
564
|
6
|
|||||||||
|
Weighted average number of common shares outstanding plus effect of dilutive securities used in computation of diluted earnings per common share
|
11,901
|
11,861
|
10,524
|
|||||||||
Options to acquire 24,855, 134,611 and 18,331 shares of common stock were not included in computing diluted earnings per share for the years ended December 31, 2014, 2013 and 2012, respectively, because the effect of these shares was anti-dilutive. The remaining 104,384 shares subject to the outstanding warrant issued in connection with the CPP transaction were anti-dilutive and not included in the computation of diluted earnings per share for the year ended December 31, 2012.
The Bank is party to various financial instruments with off-balance sheet risk in the normal course of business to meet the financing needs of its customers and to reduce its own exposure to fluctuations in interest rates. These financial instruments include commitments to extend credit and standby letters of credit. Those instruments involve, to varying degrees, elements of credit and interest rate risk in excess of the amounts recognized in the statements of financial condition. The contract or notional amounts of those instruments reflect the extent of the Bank’s involvement in particular classes of financial instruments.
The Bank’s exposure to loan loss in the event of nonperformance by the other party to the financial instrument for commitments to extend credit, standby letters of credit, and financial guarantees is represented by the contractual amount of those instruments. The Bank uses the same credit policies, including considerations of collateral requirements, in making these commitments and conditional obligations as it does for on-balance sheet instruments.
|
Contract or Notional Amount
|
||||||||
|
2014
|
2013
|
|||||||
|
Financial instruments whose contract amounts represent credit risk:
(in thousands)
|
||||||||
|
Commitments to extend credit
|
$
|
269,672
|
$
|
264,346
|
||||
|
Letters of credit
|
6,524
|
9,505
|
||||||
Commitments to extend credit are agreements to lend to a customer as long as there is no violation of any condition established in the contract. Commitments generally have fixed expiration dates or other termination clauses and may require payment of a fee. Since many of the commitments are expected to expire without being fully drawn upon, the total commitment amounts disclosed above do not necessarily represent future cash requirements. Substantially all of these commitments are at variable rates.
Commercial letters of credit and financial guarantees are conditional commitments issued by the Bank to guarantee the performance of a customer to a third party. The credit risk involved in issuing letters of credit is essentially the same as that involved in extending loan facilities to its customers. Approximately 83% and 86% of these letters of credit were secured by marketable securities, cash on deposit, or other assets at December 31, 2014 and 2013, respectively.
The Company and the Bank are subject to various regulatory capital requirements administered by the federal banking agencies. Failure to meet minimum capital requirements can initiate certain mandatory and possibly additional discretionary actions by regulators that, if undertaken, could have a direct material effect on the financial statements. Under capital adequacy guidelines, the Company and the Bank must meet specific capital guidelines that involve quantitative measures of assets, liabilities, and certain off-balance sheet items as calculated under regulatory accounting practices. The capital amounts and classification are also subject to qualitative judgments by the regulators about components, risk weightings, and other factors.
Quantitative measures established by regulation to ensure capital adequacy require the Company and the Bank to maintain minimum amounts and ratios (set forth in the table below) of total and Tier 1 capital (as defined in the regulations) to risk-weighted assets (as defined) and to average assets (as defined).
As of December 31, 2014, the most recent notifications from the Federal Deposit Insurance Corporation categorized the Bank as well capitalized under the regulatory framework for prompt corrective action. To be categorized as well capitalized the Bank must maintain minimum total risk‑based, Tier I risk‑based, and Tier I leverage capital ratios as set forth in the table (in thousands). There are no conditions or events since those notifications that management believes has changed the Bank’s category.
The Company’s and the Bank’s actual capital amounts and ratios are presented in the table below (in thousands):
|
Actual
|
Required for Minimum Capital Adequacy Purposes
|
To be Well Capitalized Under Prompt Corrective Action Provisions
|
||||||||||||||||||||||
|
Amount
|
Ratio
|
Amount
|
Ratio
|
Amount
|
Ratio
|
|||||||||||||||||||
|
As of December 31, 2014:
|
||||||||||||||||||||||||
|
Total capital to risk-weighted assets:
|
||||||||||||||||||||||||
|
Company
|
$
|
190,060
|
13.73
|
%
|
$
|
110,758
|
8.00
|
%
|
N/A
|
|
N/A
|
|
||||||||||||
|
Bank
|
$
|
179,225
|
12.94
|
%
|
$
|
110,842
|
8.00
|
%
|
$
|
138,552
|
10.00
|
%
|
||||||||||||
|
Tier I capital to risk-weighted assets:
|
||||||||||||||||||||||||
|
Company
|
$
|
178,649
|
12.90
|
%
|
$
|
55,379
|
4.00
|
%
|
N/A
|
|
N/A
|
|
||||||||||||
|
Bank
|
$
|
167,814
|
12.11
|
%
|
$
|
55,421
|
4.00
|
%
|
$
|
83,131
|
6.00
|
%
|
||||||||||||
|
Tier I capital to average assets:
|
||||||||||||||||||||||||
|
Company
|
$
|
178,649
|
9.52
|
%
|
$
|
75,029
|
4.00
|
%
|
N/A
|
|
N/A
|
|
||||||||||||
|
Bank
|
$
|
167,814
|
8.95
|
%
|
$
|
74,994
|
4.00
|
%
|
$
|
112,492
|
5.00
|
%
|
||||||||||||
|
Actual
|
Required for Minimum Capital Adequacy Purposes
|
To be Well Capitalized Under Prompt Corrective Action Provisions
|
||||||||||||||||||||||
|
Amount
|
Ratio
|
Amount
|
Ratio
|
Amount
|
Ratio
|
|||||||||||||||||||
|
As of December 31, 2013:
|
||||||||||||||||||||||||
|
Total capital to risk-weighted assets:
|
||||||||||||||||||||||||
|
Company
|
$
|
178,343
|
14.19
|
%
|
$
|
100,536
|
8.00
|
%
|
N/A
|
|
N/A
|
|
||||||||||||
|
Bank
|
$
|
170,262
|
13.56
|
%
|
$
|
100,466
|
8.00
|
%
|
$
|
125,582
|
10.00
|
%
|
||||||||||||
|
Tier I capital to risk-weighted assets:
|
||||||||||||||||||||||||
|
Company
|
$
|
169,242
|
13.47
|
%
|
$
|
50,268
|
4.00
|
%
|
N/A
|
|
N/A
|
|
||||||||||||
|
Bank
|
$
|
161,283
|
12.84
|
%
|
$
|
50,233
|
4.00
|
%
|
$
|
75,349
|
6.00
|
%
|
||||||||||||
|
Tier I capital to average assets:
|
||||||||||||||||||||||||
|
Company
|
$
|
169,242
|
9.35
|
%
|
$
|
72,405
|
4.00
|
%
|
N/A
|
|
N/A
|
|
||||||||||||
|
Bank
|
$
|
161,283
|
8.91
|
%
|
$
|
72,384
|
4.00
|
%
|
$
|
108,576
|
5.00
|
%
|
||||||||||||
In July 2013, the Federal bank regulatory agencies issued a final rule that will revise their risk-based capital requirements and the method for calculating components of capital and of computing risk-weighted assets to make them consistent with agreements that were reached by the Basel Committee on Banking Supervision and certain provisions of the Dodd-Frank Act. The final rule applies to all depository institutions, top-tier bank holding companies with total consolidated assets of $500 million or more and top-tier savings and loan holding companies. The rule establishes a new common equity Tier 1 minimum capital requirement, increases the minimum capital ratios and assigns a higher risk weight to certain assets based on the risk associated with these assets. The final rule includes transition periods that generally implement the new regulations over a five year period. These changes will be phased in beginning in January 2015, and while management continues to evaluate this final rule and its potential impact, preliminary assessments indicate that the Bank and the Company will continue to exceed all regulatory capital requirements under the new rule.
The Company utilizes fair value measurements to record fair value adjustments to certain assets and liabilities and to determine fair value disclosures. Securities available-for-sale are recorded at fair value on a recurring basis. Additionally, from time to time, the Company may be required to record at fair value other assets on a nonrecurring basis, such as impaired loans and other real estate. These nonrecurring fair value adjustments typically involve the application of the lower of cost or market accounting or write-downs of individual assets. Additionally, the Company is required to disclose, but not record, the fair value of other financial instruments.
Fair Value Hierarchy
The Company groups assets and liabilities at fair value in three levels, based on the markets in which the assets and liabilities are traded and the reliability of the assumptions used to determine fair value. These levels are:
Level 1 – Valuation is based upon quoted prices for identical instruments traded in active markets.
Level 2 – Valuation is based upon quoted prices for similar instruments in active markets, quoted prices for identical or similar instruments in markets that are not active, and model-based valuation techniques for which all significant assumptions are observable in the market.
Level 3 – Valuation is generated from model-based techniques that use at least one significant assumption not observable in the market. These unobservable assumptions reflect estimates of assumptions that market participants would use in pricing the asset or liability. Valuation techniques include use of option pricing models, discounted cash flow models and similar techniques.
Following is a description of valuation methodologies used for assets and liabilities which are either recorded or disclosed at fair value.
Cash and cash equivalents—The carrying value of cash and cash equivalents is a reasonable estimate of fair value.
Time Deposits in Other Banks—Fair values for fixed-rate time deposits are estimated using a discounted cash flow analysis that applies interest rates currently being offered on time deposits of similar terms of maturity.
Securities Available-for-Sale—Securities available-for-sale are recorded at fair value on a recurring basis. Fair value measurement is based upon quoted prices, if available. If quoted prices are not available, fair values are measured using independent pricing models or other model-based valuation techniques such as the present value of future cash flows, adjusted for the security’s credit rating, prepayment assumptions and other factors such as credit loss assumptions. Level 1 securities include those traded on an active exchange, such as the New York Stock Exchange and U.S. Treasury securities that are traded by dealers or brokers in active over-the-counter market funds. Securities are classified as Level 2 within the valuation hierarchy when the Company obtains fair value measurements from an independent pricing service. The fair value measurements consider observable data that may include dealer quotes, market spreads, cash flows, the U.S. Treasury yield curve, live trading levels, trade execution data, market consensus prepayment speeds, credit information, and the bond’s terms and conditions, among other things. Level 2 inputs are used to value U.S. Agency securities, mortgage-backed securities, municipal securities, single issue trust preferred securities, certain pooled trust preferred securities, and certain equity securities that are not actively traded.
Securities Held-to-Maturity—The fair value of securities held-to-maturity is estimated using the same measurement techniques as securities available-for-sale.
Other investments—The carrying value of other investments is a reasonable estimate of fair value.
Loans—For disclosure purposes, the fair value of fixed rate loans is estimated by discounting the future cash flows using the current rates at which similar loans would be made to borrowers with similar credit ratings. For variable rate loans, the carrying amount is a reasonable estimate of fair value. The Company does not record loans at fair value on a recurring basis. No adjustment to fair value is taken related to illiquidity discounts. However, from time to time, a loan is considered impaired and an allowance for loan losses is established. Loans for which it is probable that payment of interest and principal will not be made in accordance with the contractual terms of the loan agreement are considered impaired. Once a loan is identified as individually impaired, management uses one of three methods to measure impairment, which, include collateral value, market value of similar debt, and discounted cash flows. Those impaired loans not requiring an allowance represent loans for which the fair value of the expected repayments or collateral exceed the recorded investments in such loans. Impaired loans where an allowance is established based on the fair value of collateral or where the loan balance has been charged down to fair value require classification in the fair value hierarchy. When the fair value of the collateral is based on an observable market price or a current appraised value, the Company records the impaired loan as nonrecurring Level 2. When an appraised value is not available or management determines the fair value of the collateral is further impaired below the appraised value and adjusts the appraisal value by taking an additional discount for market conditions and there is no observable market price, the Company records the impaired loan as nonrecurring Level 3.
For non-performing loans, collateral valuations currently in file are reviewed for acceptability in terms of timeliness and applicability. Although each determination is made based on the facts and circumstances of each credit, generally valuations are no longer considered acceptable when there has been physical deterioration of the property from when it was last appraised, or there has been a significant change in the underlying assumptions of the appraisal. If the valuation is deemed to be unacceptable, a new appraisal is ordered. New appraisals are typically received within 4-6 weeks. While awaiting new appraisals, the valuation in file is utilized, net of discounts. Discounts are derived from available relevant market data, selling costs, taxes, and insurance. Any perceived collateral deficiency utilizing the discounted value is specifically reserved (as required by ASC Topic 310) until the new appraisal is received or charged off. Thus, provisions or charge-offs are recognized in the period the credit is identified as non-performing.
The following sources are utilized to set appropriate discounts: market real estate agents, current local sales data, bank history for devaluation of similar property, Sheriff’s valuations and buy/sell contracts. If a real estate agent is used to market and sell the property, values are discounted 6% for selling costs and an additional 4% for taxes, insurance and maintenance costs. Additional discounts may be applied if research from the above sources indicates a discount is appropriate given devaluation of similar property from the time of the initial valuation.
Other Real Estate—Other real estate properties are adjusted to fair value upon transfer of the loans to other real estate, and annually thereafter to insure other real estate assets are carried at the lower of carrying value or fair value. Exceptions to obtaining initial appraisals are properties where a buy/sell agreement exists for the loan value or greater, or where we have received a Sheriff’s valuation for properties liquidated through a Sheriff sale. Fair value is based upon independent market prices, appraised values of the collateral or management’s estimation of the value of the collateral. When the fair value of the collateral is based on an observable market price or a current appraised value, the Company records the other real estate as nonrecurring Level 2. When an appraised value is not available or management determines the fair value of the collateral is further impaired below the appraised value and adjusts the appraisal value by taking an additional discount for market conditions and there is no observable market prices, the Company records the other real estate asset as nonrecurring Level 3.
Cash Surrender Value of Life Insurance Policies—Fair value for life insurance cash surrender value is based on cash surrender values indicated by the insurance companies.
Deposits—The fair value of demand deposits, savings accounts, NOW accounts, and money market deposits is the amount payable on demand at the reporting date. The fair value of fixed maturity certificates of deposit is estimated by discounting the future cash flows using the rates currently offered for deposits of similar remaining maturities. The estimated fair value does not include customer related intangibles.
Securities Sold Under Agreements to Repurchase—The fair value approximates the carrying value of repurchase agreements due to their short-term nature.
Short-term Federal Home Loan Bank advances—The fair value approximates the carrying value of short-term FHLB advances due to their short-term nature.
Notes Payable—The fair value of notes payable is estimated using a discounted cash flow analysis that applies interest rates currently being offered on similar types of borrowings with similar terms.
Junior Subordinated Debentures—For junior subordinated debentures that bear interest on a floating basis, the carrying amount approximates fair value. For junior subordinated debentures that bear interest on a fixed rate basis, the fair value is estimated using a discounted cash flow analysis that applies interest rates currently being offered on similar types of borrowings.
Commitments to Extend Credit, Standby Letters of Credit and Credit Card Guarantees—Because commitments to extend credit and standby letters of credit are generally short-term and made using variable rates, the carrying value and estimated fair value associated with these instruments are immaterial.
Assets Recorded at Fair Value
Below is a table that presents information about certain assets and liabilities measured at fair value on a recurring basis (in thousands):
|
Assets / Liabilities
Measured at Fair Value
|
Fair Value Measurements
at December 31, 2014
|
|||||||||||||||
|
Description
|
at December 31, 2014
|
Level 1
|
Level 2
|
Level 3
|
||||||||||||
|
Available-for-sale securities:
|
||||||||||||||||
|
U.S. Government sponsored enterprises
|
$
|
10,227
|
$
|
-
|
$
|
10,227
|
$
|
-
|
||||||||
|
Obligations of state and political subdivisions
|
44,605
|
-
|
44,605
|
-
|
||||||||||||
|
GSE mortgage-backed securities
|
109,103
|
-
|
109,103
|
-
|
||||||||||||
|
Collateralized mortgage obligations: residential
|
60,839
|
-
|
60,839
|
-
|
||||||||||||
|
Collateralized mortgage obligations: commercial
|
24,545
|
-
|
24,545
|
-
|
||||||||||||
|
Other asset-backed securities
|
24,343
|
-
|
24,343
|
-
|
||||||||||||
|
Collateralized debt obligation
|
1,218
|
-
|
1,218
|
-
|
||||||||||||
|
Mutual funds
|
2,104
|
2,104
|
-
|
-
|
||||||||||||
|
Assets / Liabilities
Measured at Fair Value
|
Fair Value Measurements
at December 31, 2013
|
|||||||||||||||
|
Description
|
at December 31, 2013
|
Level 1
|
Level 2
|
Level 3
|
||||||||||||
|
Available-for-sale securities:
|
||||||||||||||||
|
U.S. Government sponsored enterprises
|
$
|
11,265
|
$
|
-
|
$
|
11,265
|
$
|
-
|
||||||||
|
Obligations of state and political subdivisions
|
59,978
|
-
|
59,978
|
-
|
||||||||||||
|
GSE mortgage-backed securities
|
145,965
|
-
|
145,965
|
-
|
||||||||||||
|
Collateralized mortgage obligations: residential
|
70,887
|
-
|
70,887
|
-
|
||||||||||||
|
Collateralized mortgage obligations: commercial
|
27,346
|
-
|
27,346
|
-
|
||||||||||||
|
Other asset-backed securities
|
25,489
|
-
|
25,489
|
-
|
||||||||||||
|
Collateralized debt obligation
|
735
|
-
|
735
|
-
|
||||||||||||
Certain assets and liabilities are measured at fair value on a nonrecurring basis and therefore are not included in the table above. Impaired loans are level 2 assets measured using appraisals from external parties of the collateral less any prior liens. Other real estate owned are also level 2 assets measured using appraisals from external parties.
Assets measured at fair value on a nonrecurring basis are as follows (in thousands):
|
Assets / Liabilities
Measured at Fair Value
|
Fair Value Measurements
at December 31, 2014
|
|||||||||||||||
|
Description
|
at December 31, 2014
|
Level 1
|
Level 2
|
Level 3
|
||||||||||||
|
Impaired loans
|
$
|
5,051
|
$
|
-
|
$
|
5,051
|
$
|
-
|
||||||||
|
Other real estate
|
4,234
|
-
|
4,234
|
-
|
||||||||||||
|
Assets / Liabilities
Measured at Fair Value
|
Fair Value Measurements
at December 31, 2013
|
|||||||||||||||
|
Description
|
at December 31, 2013
|
Level 1
|
Level 2
|
Level 3
|
||||||||||||
|
Impaired loans
|
$
|
1,973
|
$
|
-
|
$
|
1,973
|
$
|
-
|
||||||||
|
Other real estate
|
6,687
|
-
|
6,687
|
-
|
||||||||||||
Limitations
Fair value estimates are made at a specific point in time, based on relevant market information and information about the financial instrument. These estimates do not reflect any premium or discount that could result from offering for sale at one time the Company’s entire holdings of a particular financial instrument. Because no market exists for a significant portion of the Company’s financial instruments, fair value estimates are based on many judgments. These estimates are subjective in nature and involve uncertainties and matters of significant judgment and therefore cannot be determined with precision. Changes in assumptions could significantly affect the estimates.
Fair value estimates are based on existing on and off-balance sheet financial instruments without attempting to estimate the value of anticipated future business and the value of assets and liabilities that are not considered financial instruments. Significant assets and liabilities that are not considered financial instruments include deferred income taxes and premises and equipment. In addition, the tax ramifications related to the realization of the unrealized gains and losses can have a significant effect on fair value estimates and have not been considered in the estimates.
The estimated fair values of our financial instruments are as follows at December 31, 2014 and 2013 (in thousands):
|
Fair Value Measurements at
December 31, 2014 Using:
|
||||||||||||||||
|
Carrying
Value
|
Level 1
|
Level 2
|
Level 3
|
|||||||||||||
|
Financial assets:
|
||||||||||||||||
|
Cash and cash equivalents
|
$
|
86,872
|
$
|
86,872
|
$
|
-
|
$
|
-
|
||||||||
|
Securities available-for-sale
|
276,984
|
2,104
|
274,880
|
-
|
||||||||||||
|
Securities held-to-maturity
|
141,201
|
-
|
141,593
|
-
|
||||||||||||
|
Other investments
|
9,990
|
9,990
|
-
|
-
|
||||||||||||
|
Loans, net
|
1,273,205
|
-
|
5,051
|
1,277,882
|
||||||||||||
|
Cash surrender value of life insurance policies
|
13,659
|
-
|
13,659
|
-
|
||||||||||||
|
Financial liabilities:
|
||||||||||||||||
|
Non-interest-bearing deposits
|
390,863
|
-
|
390,863
|
-
|
||||||||||||
|
Interest-bearing deposits
|
1,194,371
|
-
|
943,255
|
251,291
|
||||||||||||
|
Securities sold under agreements to repurchase
|
62,098
|
62,098
|
-
|
-
|
||||||||||||
|
Short-term Federal Home Loan Bank advances
|
25,000
|
-
|
25,000
|
-
|
||||||||||||
|
Notes payable
|
26,277
|
-
|
-
|
27,193
|
||||||||||||
|
Junior subordinated debentures
|
22,167
|
-
|
22,167
|
-
|
||||||||||||
|
Fair Value Measurements at
December 31, 2013 Using:
|
||||||||||||||||
|
Carrying
Value
|
Level 1
|
Level 2
|
Level 3
|
|||||||||||||
|
Financial assets:
|
||||||||||||||||
|
Cash and cash equivalents
|
$
|
59,731
|
$
|
59,731
|
$
|
-
|
$
|
-
|
||||||||
|
Securities available-for-sale
|
341,665
|
-
|
341,665
|
-
|
||||||||||||
|
Securities held-to-maturity
|
155,523
|
-
|
151,168
|
-
|
||||||||||||
|
Other investments
|
11,526
|
11,526
|
-
|
-
|
||||||||||||
|
Loans, net
|
1,128,775
|
-
|
1,973
|
1,137,767
|
||||||||||||
|
Cash surrender value of life insurance policies
|
13,450
|
-
|
13,450
|
-
|
||||||||||||
|
Financial liabilities:
|
||||||||||||||||
|
Non-interest-bearing deposits
|
383,257
|
-
|
383,257
|
-
|
||||||||||||
|
Interest-bearing deposits
|
1,135,546
|
-
|
895,346
|
241,359
|
||||||||||||
|
Securities sold under agreements to repurchase
|
53,916
|
53,916
|
-
|
-
|
||||||||||||
|
Short-term Federal Home Loan Bank advances
|
25,000
|
-
|
25,000
|
-
|
||||||||||||
|
Notes payable
|
27,703
|
-
|
-
|
28,813
|
||||||||||||
|
Junior subordinated debentures
|
29,384
|
-
|
22,167
|
7,776
|
||||||||||||
For the years ended December 31, 2014, 2013, and 2012, none of the components of other noninterest income were greater than 1% of interest income and noninterest income.
Components of other noninterest expense greater than 1% of interest income and noninterest income consisted of the following for the years ended December 31, 2014, 2013, and 2012 (in thousands):
|
2014
|
2013
|
2012
|
||||||||||
|
Professional fees
|
$
|
1,802
|
$
|
1,709
|
$
|
2,022
|
||||||
|
FDIC fees
|
1,050
|
1,136
|
930
|
|||||||||
|
Marketing expenses
|
1,658
|
2,340
|
1,648
|
|||||||||
|
Corporate development expense
|
1,420
|
1,507
|
1,022
|
|||||||||
|
Data processing
|
1,940
|
1,955
|
1,689
|
|||||||||
|
Printing and supplies
|
1,114
|
1,494
|
1,105
|
|||||||||
|
Expenses on other real estate owned and other assets repossessed
|
691
|
1,201
|
1,767
|
|||||||||
|
Amortization of intangibles
|
1,106
|
1,106
|
762
|
|||||||||
The Company has evaluated all subsequent events and transactions that occurred after December 31, 2014 up through the date of filing this Annual Report on Form 10-K. No events or changes in circumstances were identified that would have an adverse impact on the financial statements.
Summarized financial information for MidSouth Bancorp, Inc. (parent company only) follows:
|
Balance Sheets
|
||||||||
|
December 31, 2014 and 2013
|
||||||||
|
(in thousands)
|
||||||||
|
2014
|
2013
|
|||||||
|
Assets
|
||||||||
|
Cash and interest-bearing deposits in banks
|
$
|
9,452
|
$
|
7,879
|
||||
|
Securities available-for-sale
|
1,218
|
735
|
||||||
|
Other assets
|
4,486
|
2,642
|
||||||
|
Investment in and advances to subsidiaries
|
219,216
|
211,494
|
||||||
|
Total assets
|
$
|
234,372
|
$
|
222,750
|
||||
|
Liabilities and Stockholders’ Equity
|
||||||||
|
Liabilities:
|
||||||||
|
Dividends payable
|
$
|
1,208
|
$
|
1,093
|
||||
|
Notes payable
|
-
|
1,000
|
||||||
|
Junior subordinated debentures
|
22,167
|
29,384
|
||||||
|
ESOP obligation
|
250
|
-
|
||||||
|
Other
|
1,735
|
524
|
||||||
|
Total liabilities
|
25,360
|
32,001
|
||||||
|
Stockholders’ equity
|
209,012
|
190,749
|
||||||
|
Total liabilities and stockholders’ equity
|
$
|
234,372
|
$
|
222,750
|
||||
|
Statements of Earnings
|
||||||||||||
|
For the Years Ended December 31, 2014, 2013, and 2012
|
||||||||||||
|
(in thousands)
|
||||||||||||
|
2014
|
2013
|
2012
|
||||||||||
|
Revenue:
|
||||||||||||
|
Dividends from Bank and nonbank subsidiaries
|
$
|
15,500
|
$
|
11,000
|
$
|
-
|
||||||
|
Rental and other income
|
87
|
125
|
102
|
|||||||||
|
15,587
|
11,125
|
102
|
||||||||||
|
Expenses:
|
||||||||||||
|
Interest on short- and long-term debt
|
1,087
|
1,415
|
984
|
|||||||||
|
Professional fees
|
217
|
345
|
804
|
|||||||||
|
Other expenses
|
844
|
547
|
1,126
|
|||||||||
|
2,148
|
2,307
|
2,914
|
||||||||||
|
Income (loss) before equity in undistributed earnings of subsidiaries and income taxes
|
13,439
|
8,818
|
(2,812
|
)
|
||||||||
|
Equity in undistributed earnings of subsidiaries
|
4,955
|
4,600
|
11,477
|
|||||||||
|
Income tax benefit
|
716
|
758
|
977
|
|||||||||
|
Net earnings
|
$
|
19,110
|
$
|
14,176
|
$
|
9,642
|
||||||
|
Statements of Cash Flows
|
||||||||||||
|
For the Years Ended December 31, 2014, 2013, and 2012
|
||||||||||||
|
(in thousands)
|
||||||||||||
|
2014
|
2013
|
2012
|
||||||||||
|
Cash flows from operating activities:
|
||||||||||||
|
Net earnings
|
$
|
19,110
|
$
|
14,176
|
$
|
9,642
|
||||||
|
Adjustments to reconcile net earnings to net cash provided by operating activities:
|
||||||||||||
|
Undistributed earnings of subsidiaries
|
(4,955
|
)
|
(4,600
|
)
|
(11,477
|
)
|
||||||
|
Other, net
|
(872
|
)
|
(668
|
)
|
(2,306
|
)
|
||||||
|
Net cash provided by (used in) operating activities
|
13,283
|
8,908
|
(4,141
|
)
|
||||||||
|
Cash flows from investing activities:
|
||||||||||||
|
Purchase of securities available-for-sale
|
-
|
(464
|
)
|
-
|
||||||||
|
Proceeds from prepayments of securities available-for-sale
|
198
|
-
|
-
|
|||||||||
|
Outlays for business acquisition, net of cash acquired
|
-
|
-
|
(14,360
|
)
|
||||||||
|
Other, net
|
217
|
223
|
-
|
|||||||||
|
Net cash provided by (used in) investing activities
|
415
|
(241
|
)
|
(14,360
|
)
|
|||||||
|
Cash flows from financing activities:
|
||||||||||||
|
Proceeds from exercise of stock options
|
643
|
69
|
100
|
|||||||||
|
Payment of preferred dividends
|
(704
|
)
|
(1,519
|
)
|
(1,579
|
)
|
||||||
|
Payment of common dividends
|
(3,838
|
)
|
(3,320
|
)
|
(2,932
|
)
|
||||||
|
Purchase of treasury stock
|
(9
|
)
|
-
|
-
|
||||||||
|
Repayment of long-term debt
|
(8,217
|
)
|
(1,000
|
)
|
-
|
|||||||
|
Net cash used in financing activities
|
(12,125
|
)
|
(5,770
|
)
|
(4,411
|
)
|
||||||
|
Net change in cash and cash equivalents
|
1,573
|
2,897
|
(22,912
|
)
|
||||||||
|
Cash and cash equivalents at beginning of year
|
7,879
|
4,982
|
27,894
|
|||||||||
|
Cash and cash equivalents at end of year
|
$
|
9,452
|
$
|
7,879
|
$
|
4,982
|
||||||

REPORT OF INDEPENDENT REGISTERED PUBLIC ACCOUNTING FIRM
Stockholders and Board of Directors
MidSouth Bancorp, Inc. and Subsidiaries
Lafayette, Louisiana
We have audited the accompanying consolidated balance sheets of MidSouth Bancorp, Inc. and subsidiaries (the “Company”) as of December 31, 2014 and 2013, and the related consolidated statements of earnings, comprehensive income, stockholders' equity, and cash flows for each of the three years in the period ended December 31, 2014. We also have audited the Company’s internal control over financial reporting as of December 31, 2014, based on criteria established in Internal Control — Integrated Framework issued by the Committee of Sponsoring Organizations of the Treadway Commission in 2013. The Company’s management is responsible for these financial statements, for maintaining effective internal control over financial reporting, and for its assessment of the effectiveness of internal control over financial reporting included in the accompanying Management’s Report on Internal Control Over Financial Reporting. Our responsibility is to express an opinion on these financial statements and an opinion on the Company's internal control over financial reporting based on our audits.
We conducted our audits in accordance with the standards of the Public Company Accounting Oversight Board (United States). Those standards require that we plan and perform the audits to obtain reasonable assurance about whether the financial statements are free of material misstatement and whether effective internal control over financial reporting was maintained in all material respects. Our audits of the financial statements included examining, on a test basis, evidence supporting the amounts and disclosures in the financial statements, assessing the accounting principles used and significant estimates made by management, and evaluating the overall financial statement presentation. Our audit of internal control over financial reporting included obtaining an understanding of internal control over financial reporting, assessing the risk that a material weakness exists, and testing and evaluating the design and operating effectiveness of internal control based on the assessed risk. Our audits also included performing such other procedures as we considered necessary in the circumstances. We believe that our audits provide a reasonable basis for our opinions.
A company's internal control over financial reporting is a process designed to provide reasonable assurance regarding the reliability of financial reporting and the preparation of financial statements for external purposes in accordance with generally accepted accounting principles. A company's internal control over financial reporting includes those policies and procedures that (a) pertain to the maintenance of records that, in reasonable detail, accurately and fairly reflect the transactions and dispositions of the assets of the company; (b) provide reasonable assurance that transactions are recorded as necessary to permit preparation of financial statements in accordance with generally accepted accounting principles, and that receipts and expenditures of the company are being made only in accordance with authorizations of management and directors of the company; and (c) provide reasonable assurance regarding prevention or timely detection of unauthorized acquisition, use, or disposition of the company's assets that could have a material effect on the financial statements.
Because of its inherent limitations, internal control over financial reporting may not prevent or detect misstatements. Also, projections of any evaluation of effectiveness to future periods are subject to the risk that controls may become inadequate because of changes in conditions, or that the degree of compliance with the policies or procedures may deteriorate
|
235 Peachtree Street NE
|
Suite 1800
|
Atlanta, Georgia 30303
|
Phone 404.588.4200
|
Fax 404.588.4222
|
In our opinion, the consolidated financial statements referred to above present fairly, in all material respects, the financial position of the Company as of December 31, 2014 and 2013, and the results of their operations and their cash flows for each of the years in the three-year period ended December 31, 2014, in conformity with accounting principles generally accepted in the United States of America. Also in our opinion, the Company maintained, in all material respects, effective internal control over financial reporting as of December 31, 2014, based on criteria established in Internal Control — Integrated Framework issued by the Committee of Sponsoring Organizations of the Treadway Commission in 2013.

Atlanta, Georgia
March 13, 2015
|
Selected Quarterly Financial Data (unaudited)
|
||||||||||||||||
|
(Dollars in thousands, except per share data)
|
||||||||||||||||
|
2014
|
||||||||||||||||
|
IV
|
III
|
II
|
I |
|
||||||||||||
|
Interest income
|
$
|
21,477
|
$
|
21,016
|
$
|
20,595
|
$
|
20,399
|
||||||||
|
Interest expense
|
1,317
|
1,504
|
1,482
|
1,504
|
||||||||||||
|
Net interest income
|
20,160
|
19,512
|
19,113
|
18,895
|
||||||||||||
|
Provision for loan losses
|
2,700
|
1,175
|
1,200
|
550
|
||||||||||||
|
Net interest income after provision for loan losses
|
17,460
|
18,337
|
17,913
|
18,345
|
||||||||||||
|
Gain on sale of investments, net
|
-
|
-
|
128
|
-
|
||||||||||||
|
Other noninterest income
|
5,050
|
6,194
|
5,133
|
7,917
|
||||||||||||
|
Noninterest expense
|
17,327
|
17,857
|
17,123
|
17,702
|
||||||||||||
|
Earnings before income taxes
|
5,183
|
6,674
|
6,051
|
8,560
|
||||||||||||
|
Income tax expense
|
1,519
|
2,202
|
1,935
|
1,702
|
||||||||||||
|
Net earnings
|
3,664
|
4,472
|
4,116
|
6,858
|
||||||||||||
|
Dividends on preferred stock
|
174
|
174
|
170
|
180
|
||||||||||||
|
Net earnings available to common stockholders
|
$
|
3,490
|
$
|
4,298
|
$
|
3,946
|
$
|
6,678
|
||||||||
|
Earnings per common share - basic
|
$
|
0.31
|
$
|
0.38
|
$
|
0.35
|
$
|
0.59
|
||||||||
|
Earnings per common share - diluted
|
$
|
0.30
|
$
|
0.37
|
$
|
0.34
|
$
|
0.57
|
||||||||
|
Market price of common stock
|
||||||||||||||||
|
High
|
$
|
19.45
|
$
|
20.34
|
$
|
19.90
|
$
|
18.56
|
||||||||
|
Low
|
$
|
16.11
|
$
|
18.18
|
$
|
16.52
|
$
|
15.41
|
||||||||
|
Close
|
$
|
17.34
|
$
|
18.60
|
$
|
19.69
|
$
|
16.58
|
||||||||
|
Average shares outstanding - basic
|
11,314,690
|
11,313,879
|
11,288,045
|
11,258,374
|
||||||||||||
|
Average shares outstanding - diluted
|
11,933,387
|
11,954,811
|
11,922,525
|
11,878,660
|
||||||||||||
|
2013
|
||||||||||||||||
|
IV
|
III
|
II
|
I
|
|
||||||||||||
|
Interest income
|
$
|
21,014
|
$
|
20,704
|
$
|
21,356
|
$
|
20,129
|
||||||||
|
Interest expense
|
1,575
|
1,633
|
1,614
|
1,717
|
||||||||||||
|
Net interest income
|
19,439
|
19,071
|
19,742
|
18,412
|
||||||||||||
|
Provision for loan losses
|
800
|
450
|
1,250
|
550
|
||||||||||||
|
Net interest income after provision for loan losses
|
18,639
|
18,621
|
18,492
|
17,862
|
||||||||||||
|
Gain on sale of investments, net
|
5
|
25
|
-
|
204
|
||||||||||||
|
Other noninterest income
|
4,891
|
4,963
|
5,004
|
4,227
|
||||||||||||
|
Noninterest expense
|
18,427
|
18,481
|
18,267
|
17,431
|
||||||||||||
|
Earnings before income taxes
|
5,108
|
5,128
|
5,229
|
4,862
|
||||||||||||
|
Income tax expense
|
1,563
|
1,588
|
1,566
|
1,434
|
||||||||||||
|
Net earnings
|
3,545
|
3,540
|
3,663
|
3,428
|
||||||||||||
|
Dividends on preferred stock
|
180
|
468
|
392
|
292
|
||||||||||||
|
Net earnings available to common stockholders
|
$
|
3,365
|
$
|
3,072
|
$
|
3,271
|
$
|
3,136
|
||||||||
|
Earnings per common share - basic
|
$
|
0.30
|
$
|
0.27
|
$
|
0.29
|
$
|
0.28
|
||||||||
|
Earnings per common share - diluted
|
$
|
0.29
|
$
|
0.27
|
$
|
0.29
|
$
|
0.27
|
||||||||
|
Market price of common stock
|
||||||||||||||||
|
High
|
$
|
18.17
|
$
|
17.26
|
$
|
16.43
|
$
|
17.44
|
||||||||
|
Low
|
$
|
14.75
|
$
|
14.85
|
$
|
14.01
|
$
|
14.46
|
||||||||
|
Close
|
$
|
17.86
|
$
|
15.43
|
$
|
15.38
|
$
|
16.02
|
||||||||
|
Average shares outstanding - basic
|
11,255,670
|
11,253,216
|
11,238,945
|
11,237,916
|
||||||||||||
|
Average shares outstanding - diluted
|
11,886,433
|
11,868,851
|
11,838,701
|
11,866,126
|
||||||||||||
Not applicable.
The Company’s Chief Executive Officer and Chief Financial Officer have evaluated the effectiveness of the disclosure controls and procedures (as such term is defined in Rules 13a-15(e) and 15d-15(e) under the Securities Exchange Act of 1934, as amended (the “Exchange Act”). As of the end of the period covered by this Annual Report on Form 10-K, the Chief Executive Officer and Chief Financial Officer have concluded that such disclosure controls and procedures are effective to ensure that information required to be disclosed by the Company in reports that it submits under the Exchange Act is recorded, processed, summarized, and reported within the time periods specified in the Securities and Exchange Commission rules and forms.
During the fourth quarter of 2014, there were no significant changes in the Company’s internal controls over financial reporting that has materially affected, or is reasonably likely to affect, the Company’s internal control over financial reporting.
Management’s Report on Internal Control Over Financial Reporting
The management of MidSouth Bancorp, Inc. is responsible for establishing and maintaining adequate internal control over financial reporting. The Company’s internal control over financial reporting is a process designed under the supervision of the Company’s Chief Executive Officer and the Chief Financial Officer to provide reasonable assurance regarding the reliability of financial reporting and the preparation of the Company’s financial statements for external purposes in accordance with the accounting principles generally accepted in the United States of America. Internal control over financial reporting is defined in Rules 13a-15(f) and 15d-15(f) promulgated under the Securities Exchange Act of 1934, as amended.
The Company’s internal control systems are designed to ensure that transactions are properly authorized and recorded in the financial records and to safeguard assets from material loss or misuse. Such assurance cannot be absolute because of inherent limitations in any internal control system.
Management assessed the effectiveness of the Company’s internal control over financial reporting as of December 31, 2014 based on the criteria for effective internal control established in Internal Control – Integrated Framework issued by the Committee of Sponsoring Organizations of the Treadway Commission in 2013. Based on the assessment, management determined that the Company maintained effective internal control over financial reporting as of December 31, 2014.
Our independent registered public accountants have issued an audit report on the Company’s internal control over financial reporting. Their report is included on pages 92-93 in this Annual Report on Form 10-K.
Not applicable.
The information set forth under the heading “Executive Officers of the Registrant” in Part I of this Annual Report on Form 10-K, is incorporated herein by reference.
The information set forth under the headings “Item 1. Election of Directors,” “Corporate Governance – Section 16(a) Beneficial Ownership Reporting Compliance,” “Corporate Governance – Code of Ethics,” and “Corporate Governance – Standing Board Committees” in the Company’s Proxy Statement for the 2015 Annual Meeting of Stockholders is incorporated herein by reference.
The Company has adopted a code of ethics that applies to its principal executive officer, principal financial officer and principal accounting officer. This code of ethics (which is entitled “Code of Ethics”) and the Company’s corporate governance principles are posted on the Investor Relations page of Company’s website at http://www.midsouthbank.com. The Company intends to satisfy disclosure requirements regarding amendments to or waivers from its code of ethics by posting such information on this website. The charters of the Audit Committee, Compensation Committee, Executive Committee and the Corporate Governance and Nominating Committee of the Company’s Board of Directors are available on the Company’s website as well. This information is also available in print free of charge to any person who requests it.
The information set forth under the headings “Compensation Discussion and Analysis,” “Summary Compensation Table,” “Grants of Plan-Based Awards,” “Outstanding Equity Awards at Fiscal Year-End,” “Options Exercised and Stock Vested,” “Pension Benefits,” “Nonqualified Deferred Compensation,” “Potential Payments Upon Termination or Change of Control,” “Outside Director Compensation,” “Corporate Governance – Compensation Committee Interlocks and Insider Participation,” and “Compensation Committee Report” in the Company’s Proxy Statement for the 2015 Annual Meeting of Stockholders is incorporated herein by reference.
Item 12 - Security Ownership of Certain Beneficial Owners and Management and Related Shareholder Matters
The information set forth under the headings “Securities Authorized for Issuance under Equity Compensation Plans” in this Annual Report on Form 10-K, is incorporated by reference to the sections entitled “Security Ownership of Management and Certain Beneficial Owners – Security Ownership of Management” and “Security Ownership of Management and Certain Beneficial Owners – Security Ownership of Certain Beneficial Owners” in the Company’s Proxy Statement for the 2015 Annual Meeting of Stockholders is incorporated herein by reference.
As of December 31, 2014, the Company had outstanding stock options and restricted stock granted under our incentive compensation plans, which were approved by the Company’s stockholders. Provided below is information regarding the Company’s equity compensation plans under which the Company’s equity securities are authorized for issuance as of December 31, 2014, subject to the Company’s available authorized shares.
|
Plan Category
|
Number of securities to
be issued upon exercise
of outstanding options,
warrants, and rights
(a)
|
Weighted-average
exercise price of
outstanding options,
warrants, and rights
(b)
|
Number of securities
remaining available for
future issuance under
equity compensation
plans (excluding
securities reflected in
column (a))
(c)
|
|||||||||
|
Equity compensation plans approved by security holders
|
358,073
|
$
|
14.28
|
105,476
|
||||||||
|
Equity compensation plans not approved by security holders
|
-
|
-
|
-
|
|||||||||
|
Total
|
358,073
|
$
|
14.28
|
105,476
|
||||||||
The information set forth under the headings “Certain Relationships and Related Transactions” and “Corporate Governance – Board Independence” in the Company’s Proxy Statement for the 2015 Annual Meeting of Stockholders is incorporated herein by reference.
The information set forth under the heading “Relationship with Independent Registered Public Accountants” in the Company’s Proxy Statement for the 2015 Annual Meeting of Stockholders is incorporated herein by reference.
The following documents are filed as a part of this report:
(a)(1) The following consolidated financial statements and supplementary data of the Company are included in Part II of this Form 10-K:
|
Consolidated Balance Sheets – December 31, 2014 and 2013
|
|
|
Consolidated Statements of Earnings – Years ended December 31, 2014, 2013, and 2012
|
|
|
Consolidated Statements of Changes in Stockholders’ Equity – Years ended December 31, 2014, 2013, and 2012
|
|
|
Consolidated Statements of Cash Flows – Years ended December 31, 2014, 2013, and 2012
|
|
|
Notes to Consolidated Financial Statements
|
|
|
Report of Independent Registered Public Accounting Firm
|
|
|
Selected Quarterly Financial Data
|
(a)(2) All schedules have been outlined because the information required is included in the financial statements or notes or have been omitted because they are not applicable or not required.
Exhibits
|
Exhibit No.
|
Description
|
|
|
3.1
|
Amended and Restated Articles of Incorporation of MidSouth Bancorp, Inc. (restated solely for purposes of Item 601(b)(3) of Regulation S-K) (filed as Exhibit 3.1 to the Company's annual report on Form 10-K for the Year Ended December 31, 2012, and incorporated herein by reference)
|
|
|
3.2
|
Amended and Restated By-laws of MidSouth Bancorp, Inc. effective as of September 26, 2012 (restated solely for purposes of Item 601(b)(3) of Regulation S-K) (filed as Exhibit 3.3 to MidSouth’s Quarterly Report on Form 10-Q for the quarter ended September 30, 2012 and incorporated herein by reference).
|
|
|
4.1
|
Specimen Common Stock Certificate. (filed as Exhibit 4.1 to MidSouth’s Registration Statement (No. 333-163361) on Form S-1 filed November 25, 2009 and incorporated herein by reference).
|
|
|
4.2
|
Warrant to Purchase Shares of Common Stock of MidSouth Bancorp, Inc. (filed as Exhibit 3.2 to Form 8-K filed January 14, 2009 and incorporated herein by reference).
|
|
|
10.1
|
MidSouth National Bank Lease Agreement with Southwest Bank Building Limited Partnership (filed as Exhibit 10.7 to the Company's annual report on Form 10-K for the Year Ended December 31, 1992, and incorporated herein by reference).
|
|
|
10.2
|
First Amendment to Lease between MBL Life Assurance Corporation, successor in interest to Southwest Bank Building Limited Partnership in Commendam, and MidSouth National Bank (filed as Exhibit 10.1 to the Company's annual report on Form 10-KSB for the year ended December 31, 1994, and incorporated herein by reference).
|
|
|
10.3+
|
Amended and Restated Deferred Compensation Plan and Trust effective dated December 17, 2008 (filed as Exhibit 10.3 to MidSouth’s Annual Report on Form 10-K for the year ended December 31, 2008 and incorporated herein by reference).
|
|
|
10.4+
|
MidSouth Bancorp, Inc. 2007 Omnibus Incentive Compensation Plan, as amended and restated effective May 23, 2012 (filed as Exhibit 10.1 to Form 8-K filed May 25, 2012 and incorporated herein by reference).
|
|
|
10.5+
|
Form of Incentive Stock Option Agreement under the 2007 Omnibus Incentive Compensation Plan (filed as Exhibit 10.2 to Form 8-K filed May 25, 2012 and incorporated herein by reference).
|
|
|
10.6+
|
Form of Restricted Stock Award Agreement (filed as Exhibit 10.1 to the Form 8-K filed July 6, 2010 and incorporated herein by reference).
|
|
|
10.7
|
Small Business Lending Fund Securities Purchase Agreement, dated August 25, 2011, between MidSouth Bancorp, Inc. and the Secretary of the Treasury (filed as Exhibit 10.1 to the Form 8-K filed on August 29, 2011 and incorporated herein by reference).
|
|
| 10.8+ | MidSouth Bancorp, Inc. 2014 Annual Incentive Compensation Plan* | |
| 10.9+ |
Executive Indexed Salary Continuation Agreement between MidSouth Bancorp, Inc. and C.R. Cloutier*
|
|
Subsidiaries of the Registrant*
|
||
|
Consent of Porter Keadle Moore, LLC*
|
||
|
Certification of Chief Executive Officer pursuant to Rule 13a-14(a) and Rule 15d-14(a) of the Securities Exchange Act, as amended *
|
||
|
Certification of Chief Financial Officer pursuant to Rule 13a-14(a) and Rule 15d-14(a) of the Securities Exchange Act, as amended *
|
||
|
Certification by the Company’s Chief Executive Officer pursuant to 18 U.S.C. Section 1350, as adopted pursuant to Section 906 of the Sarbanes-Oxley Act of 2002*
|
||
|
Certification by the Company’s Chief Financial Officer pursuant to 18 U.S.C. Section 1350, as adopted pursuant to Section 906 of the Sarbanes-Oxley Act of 2002*
|
||
|
101
|
The following financial information from the Registrant’s Annual Report on Form 10-K for the fiscal year ended December 31, 2014, formatted in Extensible Business Reporting Language (“XBRL”): (i) Consolidated Statements of Operations, (ii) Consolidated Balance Sheets, (iii) Consolidated Statements of Stockholders’ Equity, (iv) Consolidated Statements of Cash Flows and (v) Notes to Consolidated Financial Statements.
|
| + | Management contract or compensatory plan or arrangement |
|
*
|
Included herewith
|
Agreements with respect to certain of the Company’s long-term debt are not filed as Exhibits hereto inasmuch as the debt authorized under any such agreement does not exceed 10% of the Company’s total assets. The Company agrees to furnish a copy of each such agreement to the Securities & Exchange Commission upon request.
SIGNATURES
Pursuant to the requirements of Section 13 or 15(d) of the Securities Exchange Act of 1934, the Registrant has duly caused this report to be signed on its behalf by the undersigned, thereunto duly authorized.
|
MIDSOUTH BANCORP, INC.
|
|||
|
Registrant
|
|||
|
By:
|
/s/ C. R. Cloutier
|
||
|
C. R. Cloutier
|
|||
|
President and Chief Executive Officer
|
|||
|
Date:
|
March 13, 2015
|
||
|
Signatures
|
Title
|
Date
|
|
/s/ C.R. Cloutier
|
Principal Executive Officer,
|
March 13, 2015
|
|
C.R. Cloutier
|
President, and Director
|
|
|
/s/ James R. McLemore
|
Principal Financial Officer and
|
March 13, 2015
|
|
James R. McLemore
|
Senior Executive Vice President
|
|
|
/s/ Teri S. Stelly
|
Principal Accounting Officer and
|
March 13, 2015
|
|
Teri S. Stelly
|
Controller
|
|
|
/s/ William M. Simmons
|
Director
|
March 13, 2015
|
|
William M. Simmons
|
||
|
/s/ Will Charbonnet, Sr.
|
Director
|
March 13, 2015
|
|
Will Charbonnet, Sr.
|
||
|
/s/ Clayton Paul Hillard
|
Director
|
March 13, 2015
|
|
Clayton Paul Hillard
|
||
|
/s/ James R. Davis, Jr.
|
Director
|
March 13, 2015
|
|
James R. Davis, Jr.
|
||
|
/s/ Timothy J. Lemoine
|
Director
|
March 13, 2015
|
|
Timothy J. Lemoine
|
||
|
/s/ Joseph V. Tortorice, Jr.
|
Director
|
March 13, 2015
|
|
Joseph V. Tortorice, Jr.
|
||
|
/s/ Milton B. Kidd, III
|
Director
|
March 13, 2015
|
|
Milton B. Kidd, III
|
||
|
/s/ R. Glenn Pumpelly
|
Director
|
March 13, 2015
|
|
R. Glenn Pumpelly
|
||
|
/s/ Leonard Q. Abington
|
Director
|
March 13, 2015
|
|
Leonard Q. Abington
|
- 100 -