Attached files
| file | filename |
|---|---|
| EX-99.2 - EX-99.2 - SPIRIT REALTY CAPITAL, INC. | d521684dex992.htm |
| 8-K - FORM 8-K - SPIRIT REALTY CAPITAL, INC. | d521684d8k.htm |

Path Forward III
January
2018
SPIRIT
REALTY
MASTER TRUST
Forward-Looking Statements and Risk Factors This document contains forward-looking statements within the meaning of the Private Securities Litigation Reform Act of 1995 and other federal securities laws. These forward-looking statements can be identified by the use of words such as “expect,” “plan,” “will,” “estimate,” “project,” “intend,” “believe,” “guidance,” and other similar expressions that do not relate to historical matters. These forward-looking statements are subject to known and unknown risks and uncertainties that can cause actual results to differ materially from those currently anticipated due to a number of factors, which include, but are not limited to, Spirit’s continued ability to source new investments, risks associated with using debt and equity financing to fund Spirit’s business activities (including refinancing and interest rate risks, changes in interest rates and/or credit spreads, changes in the price of our common stock, and conditions of the equity and debt capital markets, generally), unknown liabilities acquired in connection with acquired properties or interests in real-estate related entities, general risks affecting the real estate industry and local real estate markets (including, without limitation, the market value of our properties, the inability to enter into or renew leases at favorable rates, portfolio occupancy varying from our expectations, dependence on tenants’ financial condition and operating performance, and competition from other developers, owners and operators of real estate), the financial performance of our retail tenants and the demand for retail space, particularly with respect to challenges being experienced by general merchandise retailers, potential fluctuations in the consumer price index, risks associated with our failure to maintain our status as a REIT under the Internal Revenue Code of 1986, as amended, risks and uncertainties related to the completion and timing of Spirit’s proposed spin-off of certain properties leased to Shopko, the assets that collateralize Master Trust 2014 and potentially other assets, and the impact of the spin-off on Spirit’s business, and other additional risks discussed in Spirit’s most recent filings with the Securities and Exchange Commission, including its Annual Report on Form 10-K for the year ended December 31, 2016, and Quarterly Report on Form 10-Q for the quarters ended March 31, 2017, June 30, 2017 and September 30, 2017. Spirit expressly disclaims any responsibility to update or revise forward-looking statements, whether as a result of new information, future events or otherwise, except as required by law. This presentation shall not constitute an offer to sell or the solicitation of an offer to buy securities nor shall there be any sale of any securities in any state in which such solicitation or sale would be unlawful prior to registration or qualification of these securities under the laws of any such state. This presentation includes updated guidance and financial information as of and for the three months and year ended December 31, 2017. Such guidance and financial information do not reflect our actual financial condition or results of operations and are subject to completion of our financial statements as of and for the year ended December 31, 2017. Our consolidated financial statements as of and for the year ended December 31, 2017 are subject to audit by our independent registered accounting firm, and our audited balance sheet and results of operations may differ significantly from our guidance. Certain information contained herein is preliminary and subject to change and may be superseded in its entirety by further updated materials. The future performance of Spirit and its subsidiaries and their respective assets may differ significantly from the past performance of Spirit and its subsidiaries. Neither Spirit nor any of its subsidiaries make any representation as to the accuracy or completeness of the information contained herein. The information provided may not reflect all information known to professionals in every business area of Spirit or its subsidiaries. Certain data set forth herein has been obtained from third parties. Neither Spirit and its subsidiaries, nor any of their respective affiliates have independently verified the accuracy of such data. This information is not intended to provide and should not be relied upon for accounting, legal or tax advice or investment recommendations. You should consult your own counsel, tax, accountant, regulatory and other advisors as to such matters.
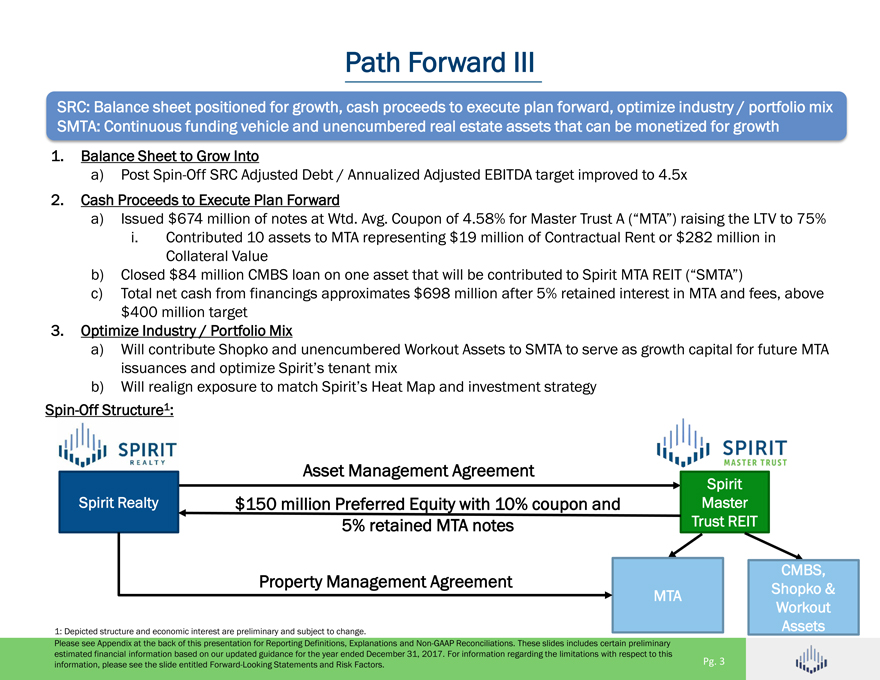
Path Forward III SRC: Balance sheet positioned for growth, cash proceeds to execute plan forward, optimize industry / portfolio mix SMTA: Continuous funding vehicle and unencumbered real estate assets that can be monetized for growth 1. Balance Sheet to Grow Into a) Post Spin-Off SRC Adjusted Debt / Annualized Adjusted EBITDA target improved to 4.5x 2. Cash Proceeds to Execute Plan Forward a) Issued $674 million of notes at Wtd. Avg. Coupon of 4.58% for Master Trust A (“MTA”) raising the LTV to 75% i. Contributed 10 assets to MTA representing $19 million of Contractual Rent or $282 million in Collateral Value b) Closed $84 million CMBS loan on one asset that will be contributed to Spirit MTA REIT (“SMTA”) c) Total net cash from financings approximates $698 million after 5% retained interest in MTA and fees, above $400 million target 3. Optimize Industry / Portfolio Mix a) Will contribute Shopko and unencumbered Workout Assets to SMTA to serve as growth capital for future MTA issuances and optimize Spirit’s tenant mix b) Will realign exposure to match Spirit’s Heat Map and investment strategy Spin-Off Structure1: Asset Management Agreement Spirit Spirit Realty $150 million Preferred Equity with 10% coupon and Master 5% retained MTA notes Trust REIT CMBS, Property Management Agreement Shopko & MTA Workout 1: Depicted structure and economic interest are preliminary and subject to change. Assets Please see Appendix at the back of this presentation for Reporting Definitions, Explanations and Non-GAAP Reconciliations. These slides includes certain preliminary estimated financial information based on our updated guidance for the year ended December 31, 2017. For information regarding the limitations with respect to this information, please see the slide entitled Forward-Looking Statements and Risk Factors. Pg. 3
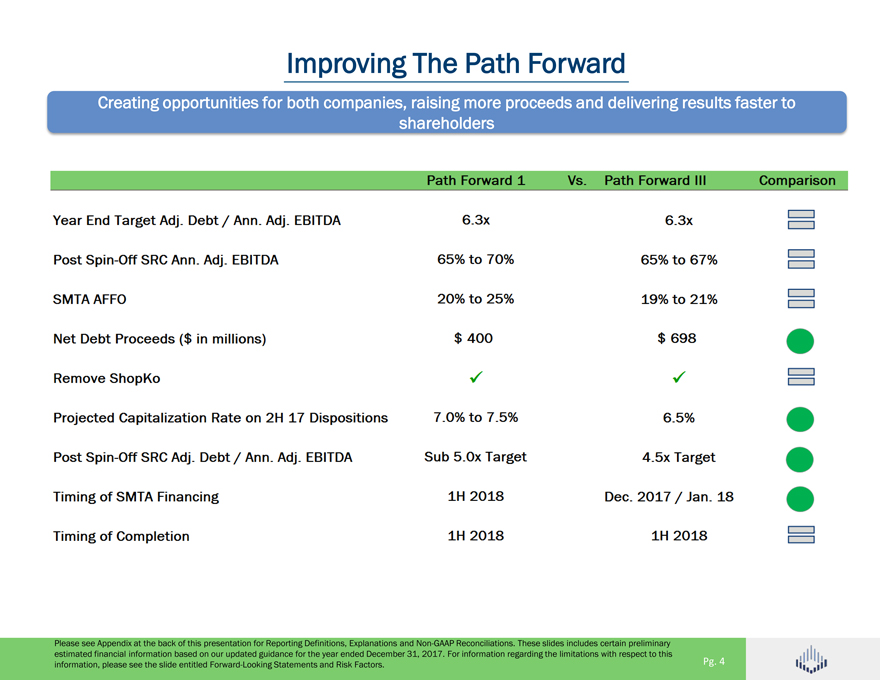
Improving The Path Forward Creating opportunities for both companies, raising more proceeds and delivering results faster to shareholders Path Forward 1 Vs. Path Forward III Comparison Year End Target Adj. Debt / Ann. Adj. EBITDA 6.3x 6.3x Post Spin-Off SRC Ann. Adj. EBITDA 65% to 70% 65% to 67% SMTA AFFO 20% to 25% 19% to 21% Net Debt Proceeds ($in millions) $ 400 $ 698 Remove ShopKo Projected Capitalization Rate on 2H 17 Dispositions 7.0% to 7.5% 6.5% Post Spin-Off SRC Adj. Debt / Ann. Adj. EBITDA Sub 5.0x Target 4.5x Target Timing of Financing 1H 2018 Dec. 2017 / Jan. 18 Timing of Completion 1H 2018 1H 2018 Please see Appendix at the back of this presentation for Reporting Definitions, Explanations and Non-GAAP Reconciliations. These slides includes certain preliminary estimated financial information based on our updated guidance for the year ended December 31, 2017. For information regarding the limitations with respect to this information, please see the slide entitled Forward-Looking Statements and Risk Factors. Pg. 4 Improving The Path Forward Creating opportunities for both companies, raising more proceeds and delivering results faster to shareholders Path Forward 1 Vs. Path Forward III Comparison Year End Target Adj. Debt / Ann. Adj. EBITDA 6.3x 6.3x Post Spin-Off SRC Ann. Adj. EBITDA 65% to 70% 65% to 67% SMTA AFFO 20% to 25% 19% to 21% Net Debt Proceeds ($in millions) $ 400 $ 698 Remove ShopKo Projected Capitalization Rate on 2H 17 Dispositions 7.0% to 7.5% 6.5% Post Spin-Off SRC Adj. Debt / Ann. Adj. EBITDA Sub 5.0x 4.5x Timing of Financing 1H 2018 Dec. 2017 / Jan. 18 Timing of Completion 1H 2018 1H 2018 Please see Appendix at the back of this presentation for Reporting Definitions, Explanations and Non-GAAP Reconciliations. These slides includes certain preliminary estimated financial information based on our updated guidance for the year ended December 31, 2017. For information regarding the limitations with respect to this information, please see the slide entitled Forward-Looking Statements and Risk Factors. Pg. 4
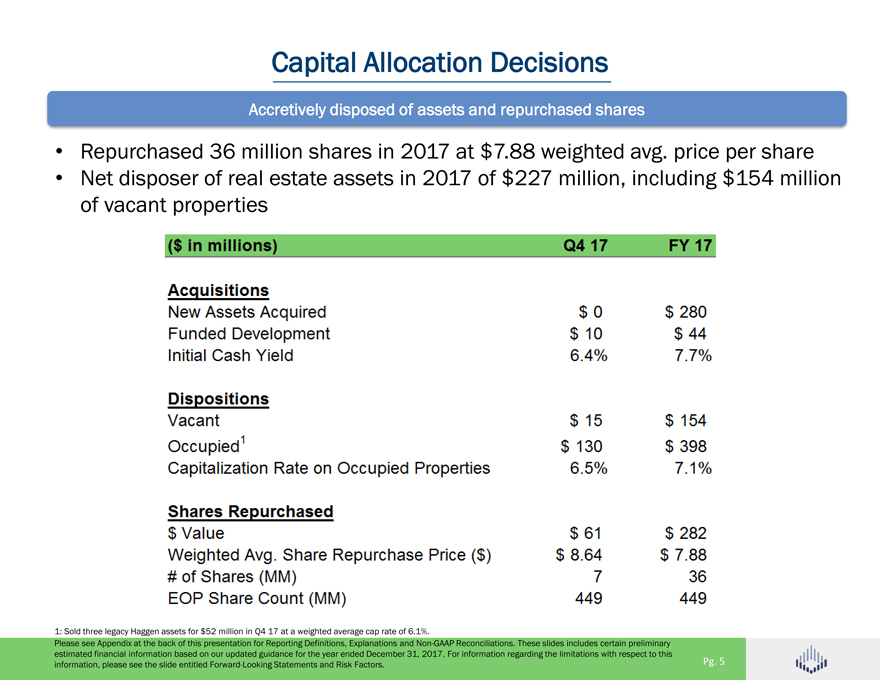
Capital Allocation Decisions Accretively disposed of assets and repurchased shares • Repurchased 36 million shares in 2017 at $7.88 weighted avg. price per share • Net disposer of real estate assets in 2017 of $228 million, including $154 million of vacant properties ($ in millions) Q4 17 FY 17 Acquisitions New Assets Acquired $ 0 $ 280 Funded Development $ 10 $ 44 Initial Cash Yield 6.4% 7.7% Dispositions Vacant $ 15 $ 154 Occupied1 $ 130 $ 398 Capitalization Rate on Occupied Properties 6.5% 7.1% Shares Repurchased $ Value $ 61 $ 282 Weighted Avg. Share Repurchase Price ($) $ 8.64 $ 7.88 # of Shares (MM) 7 36 EOP Share Count (MM) 449 449 1: Sold three legacy Haggen assets for $52 million in Q4 17 at a weighted average cap rate of 6.1%. Please see Appendix at the back of this presentation for Reporting Definitions, Explanations and Non-GAAP Reconciliations. These slides includes certain preliminary estimated financial information based on our updated guidance for the year ended December 31, 2017. For information regarding the limitations with respect to this information, please see the slide entitled Forward-Looking Statements and Risk Factors. Pg. 5
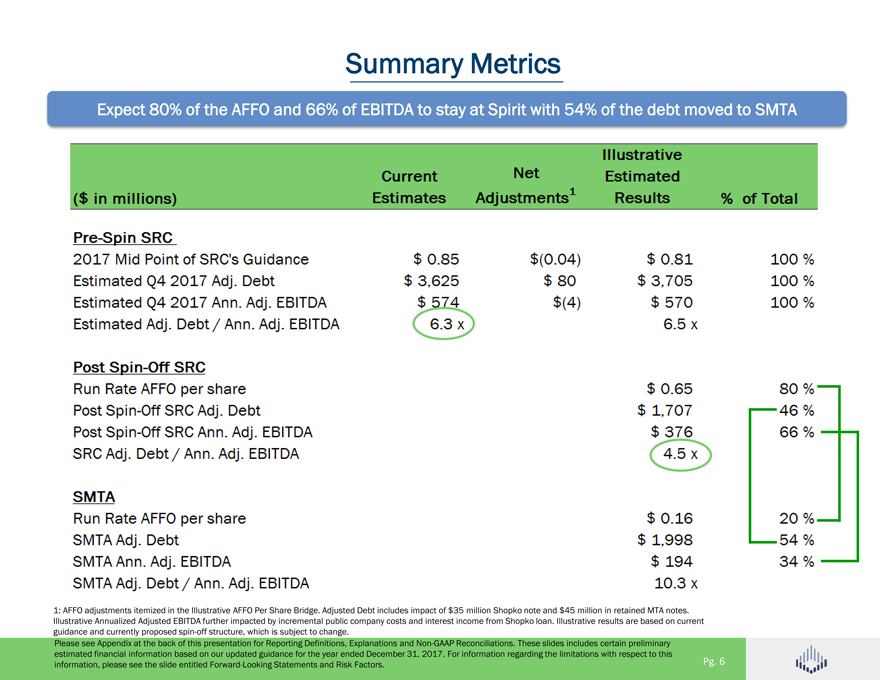
Summary Metrics Expect 80% of the AFFO and 66% of EBITDA to stay at Spirit with 54% of the debt moved to SMTA ($ in millions) Current Estimates Net Adjustments 1 Illustrative Estimated Results % of Total Pre-Spin SRC 2017 Mid Point of SRC’s Guidance $0.85 $(0.04) $0.81 100% Estimated Q4 2017 Adj. Debt 3,625 80 3,705 100% Estimated Q4 2017 Ann. Adj. EBITDA 574 (4) 570 100% Estimated Adj. Debt / Ann. Adj. Ebitda 6.3x 6.5x Post Spin-Off SRC Run Rate AFFO per share $0.65 80% Post Spin-Off SRC Adj. Debt 1,707 46% Post Spin-Off SRC Ann. Adj. EBITDA 376 66% SRC Adj. Debt / Ann. Adj. EBITDA 4.5x SMITA Run Rate AFFO per share $0.16 20% SMTA Adj. Debt 1,998 54% SMTA Ann. Adj. EBITDA 194 34% SMTA Adj. Debt / Ann. Adj. EBITDA 10.3x 1: AFFO adjustments itemized in the Illustrative AFFO Per Share Bridge. Adjusted Debt includes impact of $35 million Shopko note and $45 million in retained MTA notes. Illustrative Annualized Adjusted EBITDA further impacted by incremental public company costs and interest income from Shopko loan. Illustrative results are based on current guidance and currently proposed spin-off structure, which is subject to change. Please see Appendix at the back of this presentation for Reporting Definitions, Explanations and Non-GAAP Reconciliations. These slides includes certain preliminary estimated financial information based on our updated guidance for the year ended December 31, 2017. For information regarding the limitations with respect to this information, please see the slide entitled Forward-Looking Statements and Risk Factors. Pg. 6
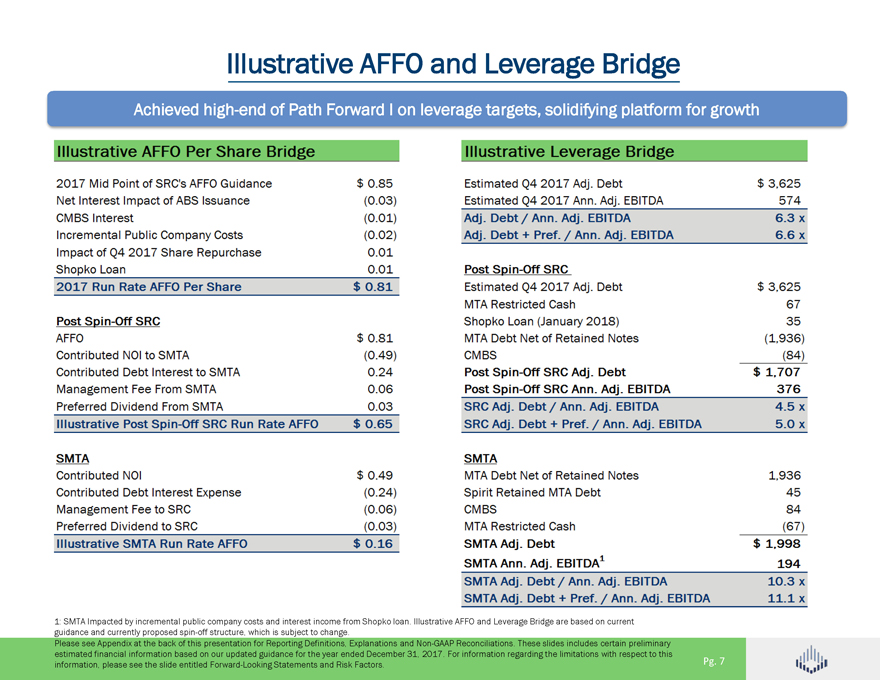
Illustrative AFFO and Leverage Bridge Achieved high-end of Path Forward I on leverage targets, solidifying platform for growth 2017 Mid Point of SRC’s AFFO Guidance Net Interest Impact of ABS Issuance CMBS Interest Incremental Public Company Costs Impact of Q4 2017 Share Repurchase Shopko Loan $ 0.85 (0.03) (0.01) (0.02) 0.01 0.01 Estimated Q4 2017 Adj. Debt Estimated Q4 2017 Ann. Adj. EBITDA Adj. Debt / Ann. Adj. EBITDA Adj. Debt + Pref./ Ann. Adj. EBITDA Post Spin-Off SRC $3,625 574 6.3 X 6.6 X 2017 Run Rate AFFO Per Share $0.81 Post Spin-Off SRC Estimated Q4 2017 Adj. Debt MTA Restricted Cash Shopko Loan (January 2018) $3,625 67 35 AFFO Contributed NOI to SMTA Contributed Debt Interest to SMTA Management Fee From SMTA Preferred Dividend From SMTA $ 0.81 (0.49) 0.24 0.06 0.03 MTA Debt Net of Retained Notes CMBS Post Spin-Off SRC Adj. Debt Post Spin-Off SRC Ann. Adj. EBITDA SRC Adj. Debt / Ann. Adj. EBITDA (1,936) (84) 376 4.5 X Illustrative Post Spin-Off SRC Run Rate AFFO $0.65 SRC Adj. Debt + Pref./ Ann. Adj. EBITDA 5.0 X SMTA Contributed NOI Contributed Debt Interest Expense Management Fee to SRC Preferred Dividend to SRC $ 0.49 (0.24) (0.06) (0.03) SMTA MTA Debt Net of Retained Notes Spirit Retained MTA Debt CMBS MTA Restricted Cash 1 ,936 45 84 (67) Illustrative SMTA Run Rate AFFO $0.16 SMTA Adj. Debt SMTA Ann. Adj. EBITDA 1 SMTA Adj. Debt / Ann. Adj. EBITDA SMTA Adj. Debt+ Pref./ Ann. Adj. EBITDA $ 1.998 194 10.3 X 11.1x 1: SMTA Impacted by incremental public company costs and interest income from Shopko loan. Illustrative AFFO and Leverage Bridge are based on current guidance and currently proposed spin-off structure, which is subject to change. Please see Appendix at the back of this presentation for Reporting Definitions, Explanations and Non-GAAP Reconciliations. These slides includes certain preliminary estimated financial information based on our updated guidance for the year ended December 31, 2017. For information regarding the limitations with respect to this information, please see the slide entitled Forward-Looking Statements and Risk Factors. Pg. 7
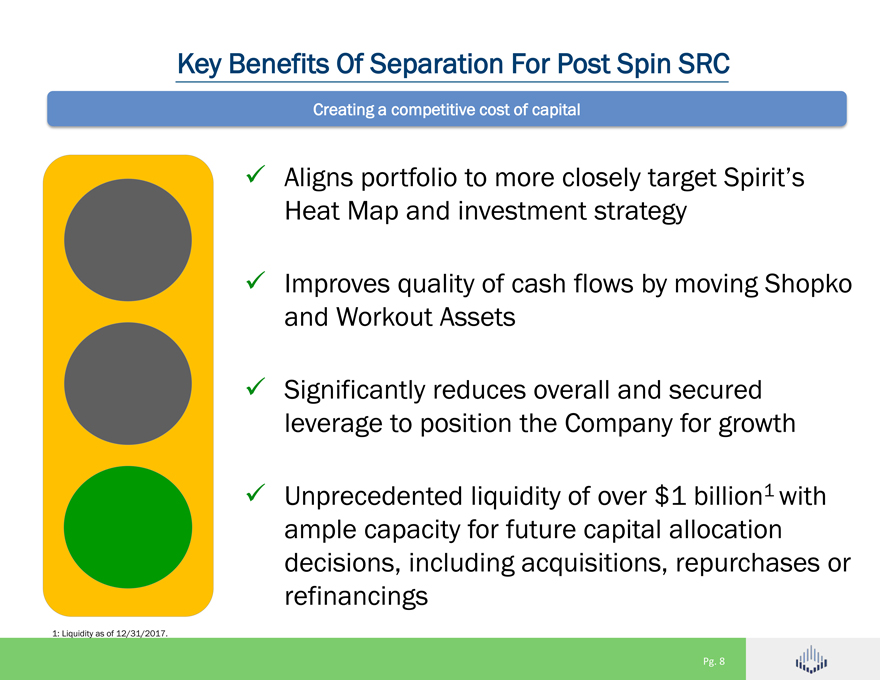
Key Benefits Of Separation For Post Spin SRC Creating a competitive cost of capital Aligns portfolio to more closely target Spirit’s Heat Map and investment strategy Improves quality of cash flows by moving Shopko and Workout Assets Significantly reduces overall and secured leverage to position the Company for growth Unprecedented liquidity of over $1 billion1 with ample capacity for future capital allocation decisions, including acquisitions, repurchases or refinancings Pg. 8 1: Liquidity as of 12/31/2017.

SMTA Update January, 2018
SMTA Mission Statement Reinforce Master Trust A into a best in class portfolio by aggressively pursuing: (a) monetization and capital recycling of Shopko owned stores, (b) select Shopko redevelopments, and (c) select Shopko outparcel QSRs and casual dining development in the first 24 months post spin Master Trust A will provide long term financing for assets redeployed by Shopko proceeds consistent with our Heat Map and Property Rankings What are we solving for? Trust to execute its mission statement in first 24 months post transaction -Strong operational results and continued sponsorship of ABS program -Optimal execution of Shopko disposition strategy and reinvestment strategy -Provide Spirit Master Trust optionality to consider alternatives Pg. 10
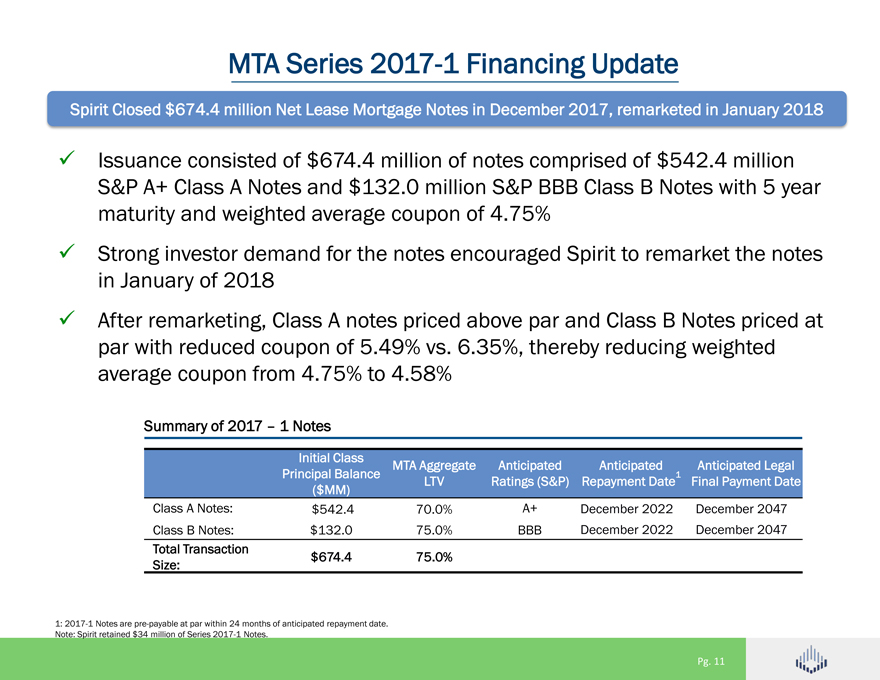
MTA Series 2017-1 Financing Update Spirit Closed $674.4 million Net Lease Mortgage Notes in December 2017, remarketed in January 2018 Issuance consisted of $674.4 million of notes comprised of $542.4 million S&P A+ Class A Notes and $132.0 million S&P BBB Class B Notes with 5 year maturity and weighted average coupon of 4.75% Strong investor demand for the notes encouraged Spirit to remarket the notes in January of 2018 After remarketing, Class A notes priced above par and Class B Notes priced at par with reduced coupon of 5.49% vs. 6.35%, thereby reducing weighted average coupon from 4.75% to 4.58% Summary of 2017 – 1 Notes Initial Class MTA Aggregate Anticipated Anticipated Anticipated Legal Principal Balance LTV Ratings (S&P) Repayment Date1 Final Payment Date ($MM) Class A Notes: $542.4 70.0% A+ December 2022 December 2047 Class B Notes: $132.0 75.0% BBB December 2022 December 2047 Total Transaction $674.4 75.0% Size: 1: 2017-1 Notes are pre-payable at par within 24 months of anticipated repayment date. Note: Spirit retained $34 million of Series 2017-1 Notes. Pg. 11
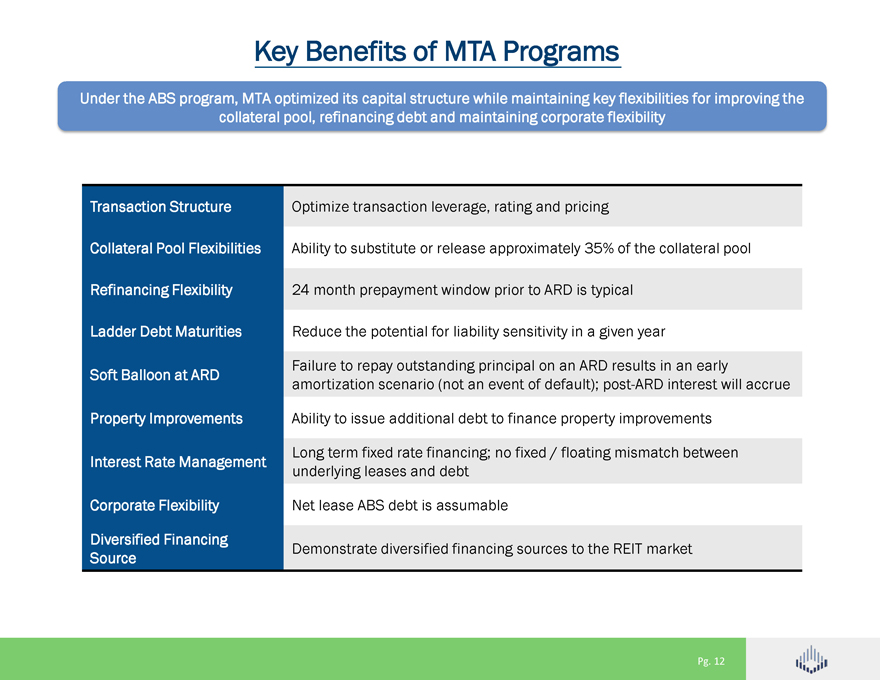
Key Benefits of MTA Programs Under the ABS program, MTA optimized its capital structure while maintaining key flexibilities for improving the collateral pool, refinancing debt and maintaining corporate flexibility Transaction Structure Optimize transaction leverage, rating and pricing Collateral Pool Flexibilities Ability to substitute or release approximately 35% of the collateral pool Refinancing Flexibility 24 month prepayment window prior to ARD is typical Ladder Debt Maturities Reduce the potential for liability sensitivity in a given year Failure to repay outstanding principal on an ARD results in an early Soft Balloon at ARD amortization scenario (not an event of default); post-ARD interest will accrue Property Improvements Ability to issue additional debt to finance property improvements Long term fixed rate financing; no fixed / floating mismatch between Interest Rate Management underlying leases and debt Corporate Flexibility Net lease ABS debt is assumable Diversified Financing Demonstrate diversified financing sources to the REIT market Source Pg. 12
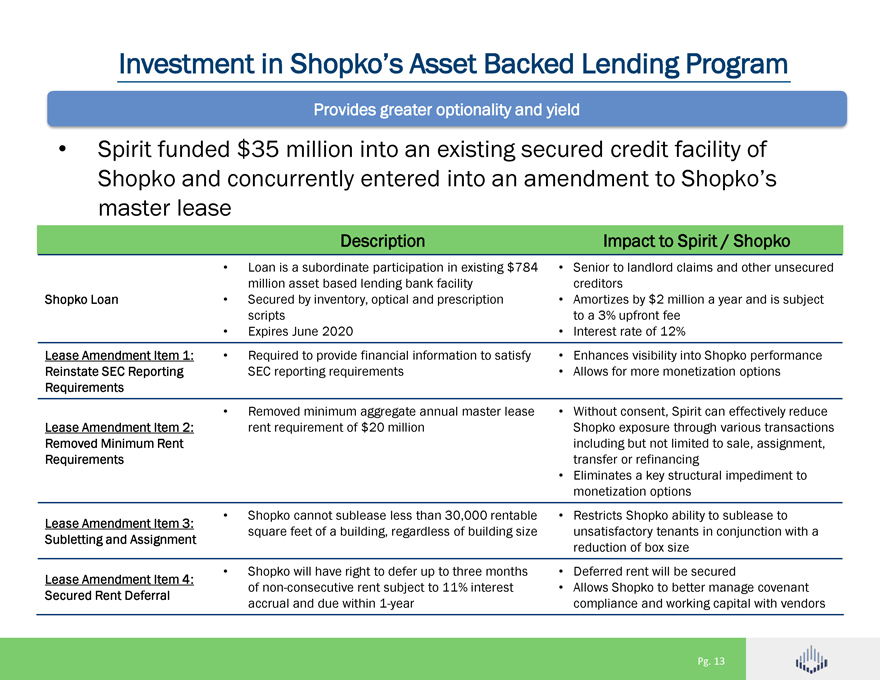
Investment in Shopko’s Asset Backed Lending Program Provides greater optionality and yield • Spirit funded $35 million into an existing secured credit facility of Shopko and concurrently entered into an amendment to Shopko’s master lease Description Impact to Spirit / Shopko • Loan is a subordinate participation in existing $784 • Senior to landlord claims and other unsecured million asset based lending bank facility creditors Shopko Loan • Secured by inventory, optical and prescription • Amortizes by $2 million a year and is subject scripts to a 3% upfront fee • Expires June 2020 • Interest rate of 12% Lease Amendment Item 1: • Required to provide financial information to satisfy • Enhances visibility into Shopko performance Reinstate SEC Reporting SEC reporting requirements • Allows for more monetization options Requirements • Removed minimum aggregate annual master lease • Without consent, Spirit can effectively reduce Lease Amendment Item 2: rent requirement of $20 million Shopko exposure through various transactions Removed Minimum Rent including but not limited to sale, assignment, Requirements transfer or refinancing • Eliminates a key structural impediment to monetization options • Shopko cannot sublease less than 30,000 rentable • Restricts Shopko ability to sublease to Lease Amendment Item 3: square feet of a building, regardless of building size unsatisfactory tenants in conjunction with a Subletting and Assignment reduction of box size • Shopko will have right to defer up to three months • Deferred rent will be secured Lease Amendment Item 4: of non-consecutive rent subject to 11% interest • Allows Shopko to better manage covenant Secured Rent Deferral accrual and due within 1-year compliance and working capital with vendors
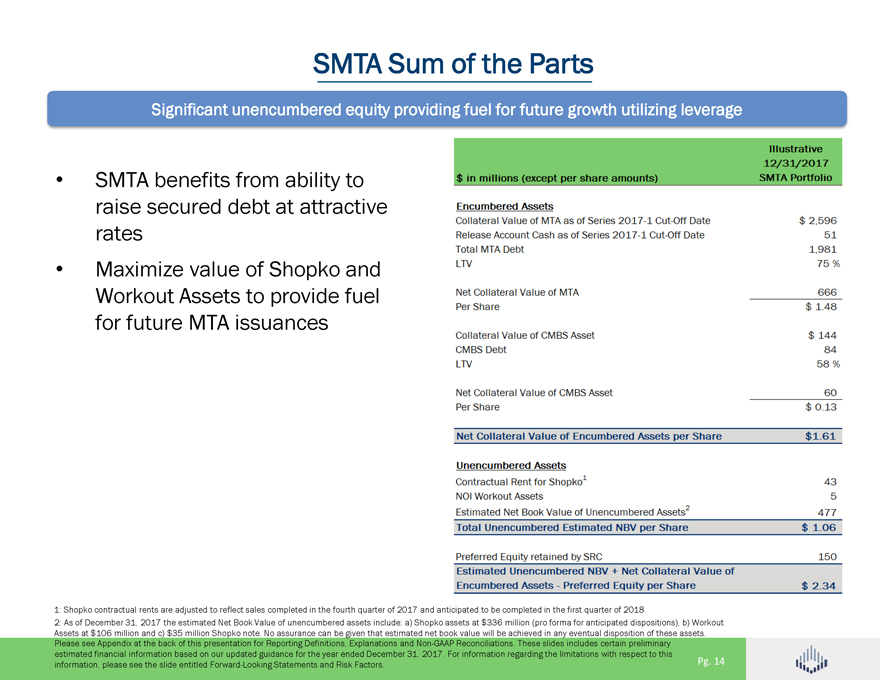
SMTA Sum of the Parts Significant unencumbered equity providing fuel for future growth utilizing leverage •SMTA benefits from ability to raise secured debt at attractive rates •Maximize value of Shopko and Workout Assets to provide fuel for future MTA issuances $ in millions (except per share amounts) illustrative 12/31/2017 SMTA Portfolio Encumbered Assets Collateral value of MTA as of Series 2017-1 Cut-Off Date $2,596 Release Account Cash as of Series 2017-1 Cut-Ofee Date 51 Total MTA Debt 1,981 LTV 75% Net Collateral value of MTA 666 Per Share $1.48 Collateral Value of CMBS Asset $144 CMBS Debt 84 LTV 58% Net Collateral Value of CMBS Asset 60 Per Share $0.13 New Collateral Value of Encumbered Assets per share $1.61 Unencumbered Assets Contractual Rent for Shopko 1 43 NOI Workout Assets 5 Estimated Net Book Value of Unencumbered Assets2 477 Total Unencumbered Estimated NBV Per share $1.06 Preferred Equity retained by SRC 150 Estimated Unencumbered NBV = Net Collateral Value of Encumbered Assets – Preferred Equity per share 477 $1.06 Preferred Equity retained by SRC 150 Estimated Unencumbered NBV = Net Collateral value of Encumbered Assets – Preferred Equity per share $2.34 1: Shopko contractual rents are adjusted to reflect sales completed in the fourth quarter of 2017 and anticipated to be completed in the first quarter of 2018. 2: As of December 31, 2017 the estimated Net Book Value of unencumbered assets include: a) Shopko assets at $336 million (pro forma for anticipated dispositions), b) Workout Assets at $106 million and c) $35 million Shopko note. No assurance can be given that estimated net book value will be achieved in any eventual disposition of these assets. Please see Appendix at the back of this presentation for Reporting Definitions, Explanations and Non-GAAP Reconciliations. These slides includes certain preliminary estimated financial information based on our updated guidance for the year ended December 31, 2017. For information regarding the limitations with respect to this information, please see the slide entitled Forward-Looking Statements and Risk Factors.Pg. 14
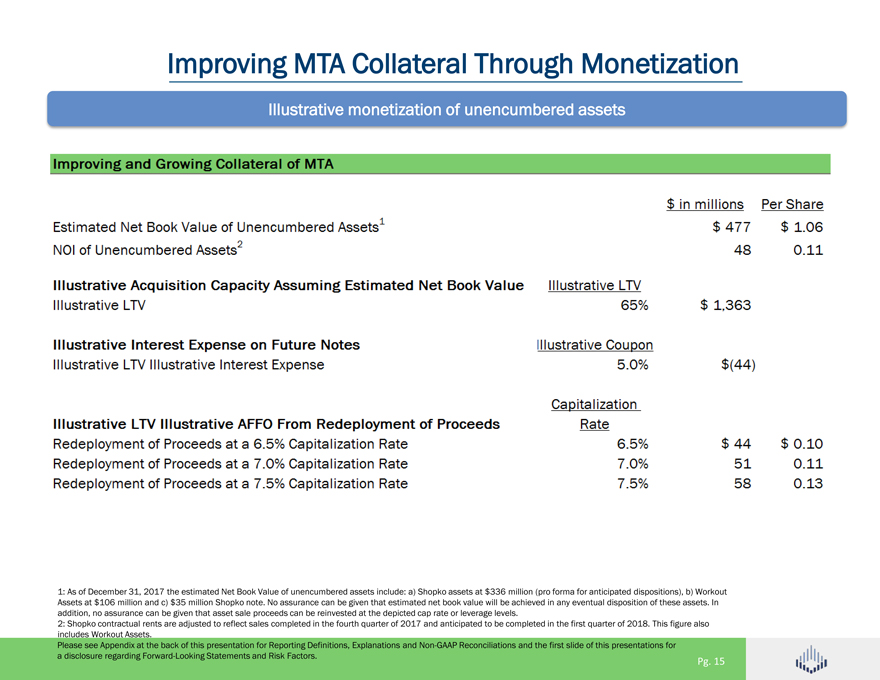
Improving MTA Collateral Through Monetization Illustrative monetization of unencumbered assets Improving and Growing Collateral of MTA $ in millions Per Share Estimated Net Book Value of Unencumbered Assets1 NOI of Unencumbered Assets2 $477 48 $1.06 0.11 Illustrative Acquisition Capacity Assuming Estimated Net Book Value I llustrative LTV Illustrative LTV 65% $ 1,363 Illustrative Interest Expense on Future Notes Illustrative Coupon Illustrative LTV Illustrative Interest Expense 5.0%$(44) Illustrative LTV Illustrative AFFO From Redeployment of Proceeds Redeployment of Proceeds at a 6.5% Capitalization Rate Redeployment of Proceeds at a 7.0% Capitalization Rate Redeployment of Proceeds at a 7.5% Capitalization Rate Capitalization Rate 6.5% 7.0% 7.5% $ 44 51 58 $0.10 0.11 0.13 1: As of December 31, 2017 the estimated Net Book Value of unencumbered assets include: a) Shopko assets at $336 million (pro forma for anticipated dispositions), b) Workout Assets at $106 million and c) $35 million Shopko note. No assurance can be given that estimated net book value will be achieved in any eventual disposition of these assets. In addition, no assurance can be given that asset sale proceeds can be reinvested at the depicted cap rate or leverage levels. 2: Shopko contractual rents are adjusted to reflect sales completed in the fourth quarter of 2017 and anticipated to be completed in the first quarter of 2018. This figure also includes Workout Assets. Please see Appendix at the back of this presentation for Reporting Definitions, Explanations and Non-GAAP Reconciliations and the first slide of this presentations for a disclosure regarding Forward-Looking Statements and Risk Factors. Pg. 15
Key Benefits For SMTA Improve collateral and enhance MTA by monetizing proceeds of unencumbered assets Over 12 years of history issuing investment grade notes High-quality, operationally essential real estate with attractive lease characteristics and rent coverage supports Collateral Value Utilizes Spirit systems and expertise to manage properties and maximize value of unencumbered assets, fueling MTA growth potential MTA will continue to issue notes as Collateral Value increases Agreement with Spirit provides optionality to consider alternatives Pg. 16
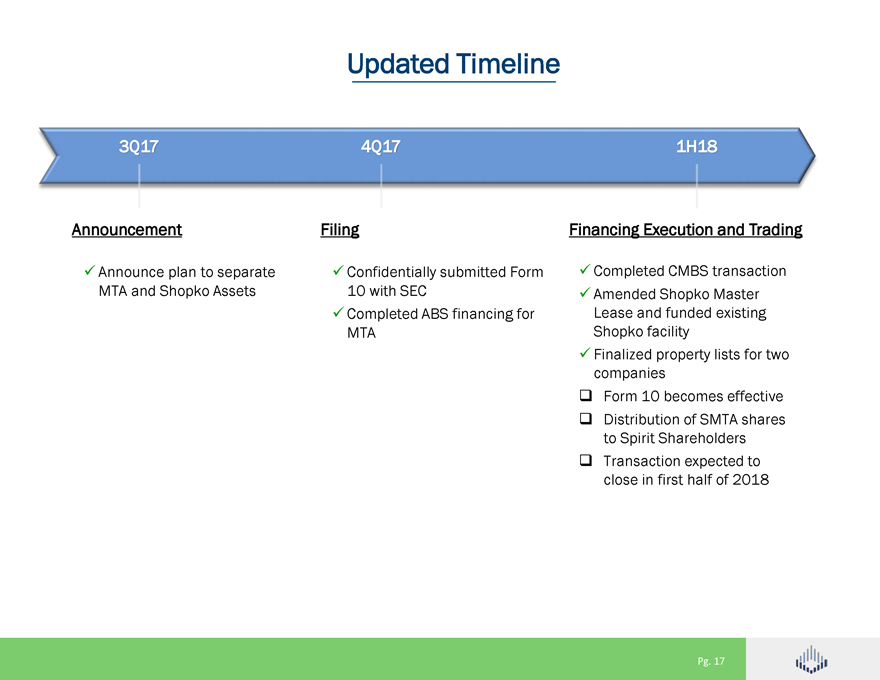
Updated Timeline 3Q17 4Q17 1H18 Announcement Filing Financing Execution and Trading Announce plan to separate Confidentially submitted Form Completed CMBS transaction MTA and Shopko Assets 10 with SEC Amended Shopko Master Completed ABS financing for Lease and funded existing MTA Shopko facility Finalized property lists for two companiesï± Form 10 becomes effectiveï± Distribution of SMTA shares to Spirit Shareholdersï± Transaction expected to close in first half of 2018 Pg. 17
Appendix Reporting Definitions, Explanations and Non-GAAP Reconciliations
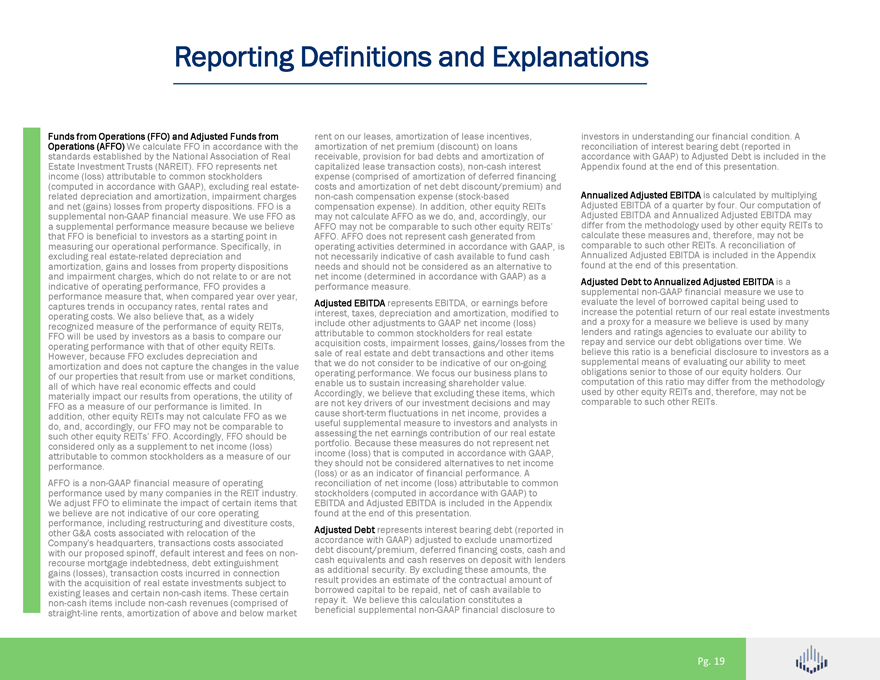
Reporting Definitions and Explanations Operations Funds from (AFFO) Operations We calculate (FFO) and FFO Adjusted in accordance Funds from with the standards Estate Investment established Trusts by (NAREIT) the National . FFO Association represents of net Real (computed income (loss) in accordance attributable with to common GAAP), stockholders excluding real estate-and related net depreciation (gains) losses and from amortization, property dispositions. impairment FFO charges is a a supplemental supplemental non-GAAP performance financial measure measure. because We use we believe FFO as that measuring FFO is our beneficial operational to investors performance. as a starting Specifically, point in in amortization, excluding real gains estate-related and losses depreciation from property and dispositions and indicative impairment of operating charges, performance, which do not FFO relate provides to or a are not performance captures trends measure in occupancy that, when rates, compared rental rates year and over year, operating recognized costs. measure We also of the believe performance that, as of a widely equity REITs, operating FFO will be performance used by investors with that as a of basis other to equity compare REITs. our amortization However, because and does FFO not excludes capture depreciation the changes and in the value of all our of which properties have that real economic result from effects use or and market could conditions, FFO materially as a measure impact our of our results performance from operations, is limited. the In utility of addition, do, and, accordingly, other equity our REITs FFO may may not not calculate be comparable FFO as we to such considered other equity only as REITs’ a supplement FFO. Accordingly, to net income FFO should (loss) be attributable performance. to common stockholders as a measure of our performance AFFO is a non-GAAP used by financial many companies measure of in operating the REIT industry. We we believe adjust FFO are not to eliminate indicative the of impact our core of operating certain items that other performance, G&A costs including associated restructuring with relocation and divestiture of the costs, with Company’s our proposed headquarters, spinoff, transactions default interest costs and associated fees on non- gains recourse (losses), mortgage transaction indebtedness, costs incurred debt extinguishment in connection with existing the leases acquisition and certain of real estate non-cash investments items. These subject certain to straight-line non-cash items rents, include amortization non-cash of revenues above and (comprised below market of rent amortization on our leases, of net amortization premium (discount) of lease on incentives, loans receivable, capitalized lease provision transaction for bad debts costs), and non-cash amortization interest of costs expense and (comprised amortization of amortization of net debt discount/premium) of deferred financing and compensation non-cash compensation expense). expense In addition, (stock-based other equity REITs may AFFO not may calculate not be comparable AFFO as we to do, such and, other accordingly, equity REITs’ our AFFO. operating AFFO activities does not determined represent cash in accordance generated with from GAAP, is needs not necessarily and should indicative not be considered of cash available as an alternative to fund cash to net performance income (determined measure. in accordance with GAAP) as a Adjusted interest, taxes, EBITDA depreciation represents and EBITDA, amortization, or earnings modified before to include attributable other to adjustments common stockholders to GAAP net for income real estate (loss) sale acquisition of real costs, estate impairment and debt transactions losses, gains/losses and other from items the operating that we do performance. not consider to We be focus indicative our business of our on-going plans to Accordingly, enable us to we sustain believe increasing that excluding shareholder these value. items, which are cause not short-term key drivers fluctuations of our investment in net income, decisions provides and may a assessing useful supplemental the net earnings measure contribution to investors of our and real analysts estate in income portfolio. (loss) Because that is these computed measures in accordance do not represent with GAAP, net they (loss) should or as an not indicator be considered of financial alternatives performance. to net income A reconciliation stockholders (computed of net income in accordance (loss) attributable with GAAP) to common to found EBITDA at and the Adjusted end of this EBITDA presentation. is included in the Appendix accordance Adjusted Debt with represents GAAP) adjusted interest to bearing exclude debt unamortized (reported in cash debt discount/premium, equivalents and cash deferred reserves financing on deposit costs, with cash lenders and result as additional provides security. an estimate By excluding of the contractual these amounts, amount the of borrowed repay it. We capital believe to be this repaid, calculation net of constitutes cash available a to beneficial supplemental non-GAAP financial disclosure to investors reconciliation in understanding of interest bearing our financial debt (reported condition. in A Appendix accordance found with at GAAP) the end to Adjusted of this presentation. Debt is included in the Adjusted Annualized EBITDA Adjusted of a EBITDA quarter is by calculated four. Our computation by multiplying of differ Adjusted from EBITDA the methodology and Annualized used Adjusted by other EBITDA equity REITs may to calculate comparable these to such measures other REITs. and, therefore, A reconciliation may not of be found Annualized at the Adjusted end of this EBITDA presentation. is included in the Appendix Adjusted supplemental Debt non-GAAP to Annualized financial Adjusted measure EBITDA we is use a to evaluate increase the the potential level of borrowed return of capital our real being estate used investments to and lenders a proxy and for ratings a measure agencies we to believe evaluate is used our ability by many to believe repay and this service ratio is our a beneficial debt obligations disclosure over to time. investors We as a obligations supplemental senior means to those of evaluating of our equity our ability holders. to meet Our used computation by other of equity this ratio REITs may and, differ therefore, from the may methodology not be comparable to such other REITs. Pg. 19
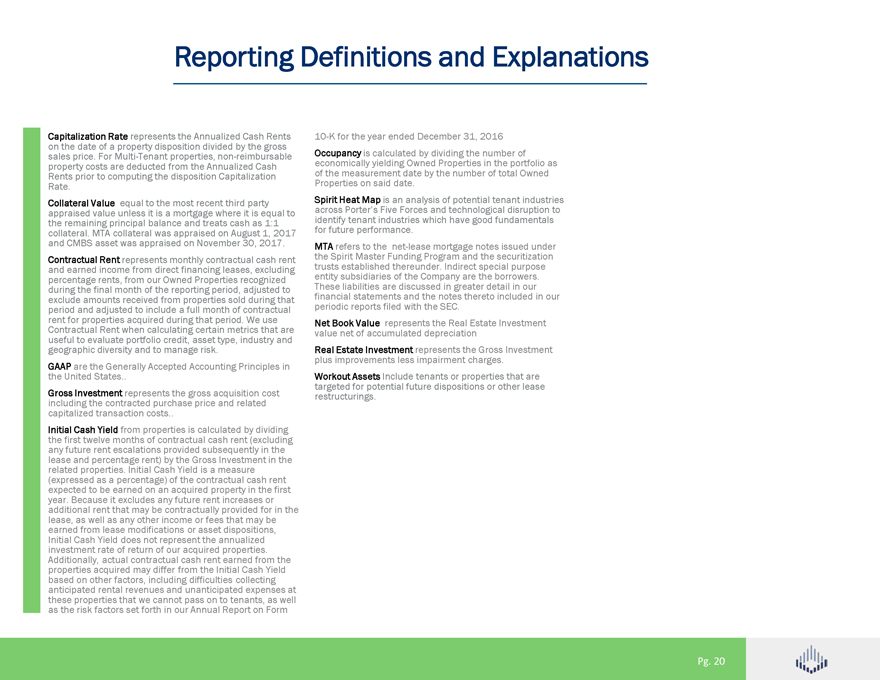
Reporting Definitions and Explanations Capitalization on the date of Rate a property represents disposition the Annualized divided by Cash the gross Rents 10-K for the year ended December 31, 2016 sales price. For Multi-Tenant properties, non-reimbursable Occupancy economically is yielding calculated Owned by dividing Properties the number in the portfolio of as property costs are deducted from the Annualized Cash Rents prior to computing the disposition Capitalization of Properties the measurement on said date. date by the number of total Owned Rate. Collateral Value equal to the most recent third party Spirit across Heat Porter’s Map Five is an Forces analysis and of technological potential tenant disruption industries to appraised value unless it is a mortgage where it is equal to the remaining principal balance and treats cash as 1:1 identify for future tenant performance. industries which have good fundamentals collateral. and CMBS MTA asset collateral was appraised was appraised on November on August 30, 2017. 1, 2017 the MTA Spirit refers Master to the Funding net-lease Program mortgage and notes the securitization issued under Contractual Rent represents monthly contractual cash rent and earned income from direct financing leases, excluding entity trusts subsidiaries established thereunder. of the Company Indirect are the special borrowers. purpose percentage rents, from our Owned Properties recognized during the final month of the reporting period, adjusted to These financial liabilities statements are discussed and the notes in greater thereto detail included in our in our exclude amounts received from properties sold during that period and adjusted to include a full month of contractual periodic reports filed with the SEC. Contractual rent for properties Rent when acquired calculating during certain that period. metrics We that use are Net Book Value represents the Real Estate Investment value net of accumulated depreciation geographic useful to evaluate diversity portfolio and to credit, manage asset risk. type, industry and Real Estate Investment represents the Gross Investment plus improvements less impairment charges. the GAAP United are the States Generally Accepted Accounting Principles in Workout Assets Include tenants or properties that are targeted for potential future dispositions or other lease including Gross Investment the contracted represents purchase the gross price acquisition and related cost restructurings. capitalized transaction costs Initial the first Cash twelve Yield months from properties of contractual is calculated cash rent by (excluding dividing lease any future and percentage rent escalations rent) provided by the Gross subsequently Investment in in the the (expressed related properties. as a percentage) Initial Cash of Yield the contractual is a measure cash rent year. expected Because to be it earned excludes on any an acquired future rent property increases in the or first lease, additional as well rent as that any may other be income contractually or fees provided that may for be in the Initial earned Cash from Yield lease does modifications not represent or asset the annualized dispositions, investment Additionally, rate actual of return contractual of our cash acquired rent properties. earned from the properties based on other acquired factors, may including differ from difficulties the Initial collecting Cash Yield these anticipated properties rental that revenues we cannot and pass unanticipated on to tenants, expenses as well at as the risk factors set forth in our Annual Report on Form Pg. 20
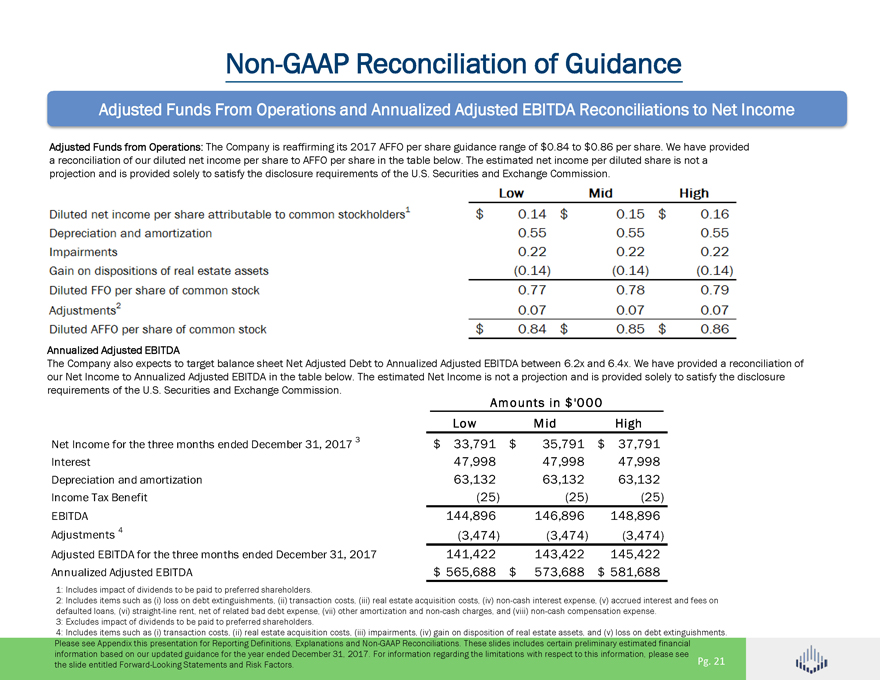
Non-GAAP Reconciliation of Guidance Adjusted Funds From Operations and Annualized Adjusted EBITDA Reconciliations to Net Income Adjusted Funds from Operations: The Company is reaffirming its 2017 AFFO per share guidance range of $0.84 to $0.86 per share. We have provided a reconciliation of our diluted net income per share to AFFO per share in the table below. The estimated net income per diluted share is not a projection and is provided solely to satisfy the disclosure requirements of the U.S. Securities and Exchange Commission. Low Mid High Diluted net income per share attributable to common stockholders1 $0.14 $0.15 $0.16 Depreciation and amortization 0.55 0.55 0.55 Impairments 0.22 0.22 0.22 Gain on Dispositions of real estate assets (0.14) (0.14) (0.14) Diluted FFO per share of common stock 0.77 0.78 0.79 Adjustments2 0.07 0.07 0.07 Diluted AFo Annualized Adjusted EBITDA The Company also expects to target balance sheet Net Adjusted Debt to Annualized Adjusted EBITDA between 6.2x and 6.4x. We have provided a reconciliation of our Net Income to Annualized Adjusted EBITDA in the table below. The estimated Net Income is not a projection and is provided solely to satisfy the disclosure requirements of the U.S. Securities and Exchange Commission. Amounts in $‘000 Low Mid High Net Income for the three months ended December 31, 2017 3 $ 33,791 $ 35,791 $ 37,791 Interest 47,998 47,998 47,998 Depreciation and amortization 63,132 63,132 63,132 Income Tax Benefit (25) (25) (25) EBITDA 144,896 146,896 148,896 Adjustments 4 (3,474) (3,474) (3,474) Adjusted EBITDA for the three months ended December 31, 2017 141,422 143,422 145,422 Annualized Adjusted EBITDA $ 565,688 $ 573,688 $ 581,688 1: Includes impact of dividends to be paid to preferred shareholders. 2: Includes items such as (i) loss on debt extinguishments, (ii) transaction costs, (iii) real estate acquisition costs, (iv) non-cash interest expense, (v) accrued interest and fees on defaulted loans, (vi) straight-line rent, net of related bad debt expense, (vii) other amortization and non-cash charges, and (viii) non-cash compensation expense. 3: Excludes impact of dividends to be paid to preferred shareholders. 4: Includes items such as (i) transaction costs, (ii) real estate acquisition costs, (iii) impairments, (iv) gain on disposition of real estate assets, and (v) loss on debt extinguishments. Please see Appendix this presentation for Reporting Definitions, Explanations and Non-GAAP Reconciliations. These slides includes certain preliminary estimated financial information based on our updated guidance for the year ended December 31, 2017. For information regarding the limitations with respect to this information, please see the slide entitled Forward-Looking Statements and Risk Factors. Pg. 21