Attached files
| file | filename |
|---|---|
| EX-99.1 - HANCOCK WHITNEY CORP | hbhc-2018117ex991.htm |
| 8-K - HANCOCK WHITNEY CORP | hbhc-2018117x8k.htm |

1/18/2018 Fourth Quarter 2017Earnings Conference Call
1
Important Cautionary Statement About Forward-Looking Statements This presentation contains forward-looking statements within the meaning of section 27A of the Securities Act of 1933, as amended, and section 21E of the Securities Exchange Act of 1934, as amended. Forward looking statements that we may make include statements regarding balance sheet and revenue growth, the provision for loans losses, loan growth expectations, management’s predictions about charge-offs for loans, including energy-related credits, the impact of changes in oil and gas prices on our energy portfolio, and the downstream impact on businesses that support the energy sector, especially in the Gulf Coast region, the impact of the transactions with First NBC and Capital One on our performance and financial condition, including our ability to successfully integrate the businesses, deposit trends, credit quality trends, net interest margin trends, future expense levels, success of revenue-generating initiatives, projected tax rates, future profitability, improvements in expense to revenue (efficiency) ratio, purchase accounting impacts such as accretion levels, and the financial impact of regulatory requirements and tax reform legislation. Also, any statement that does not describe historical or current facts is a forward-looking statement. These statements often include the words “believes,” “expects,” “anticipates,” “estimates,” “intends,” “plans,” “forecast,” “goals,” “targets,” “initiatives,” “focus,” “potentially,” “probably,” “projects,” “outlook” or similar expressions or future conditional verbs such as “may,” “will,” “should,” “would,” and “could.” Forward-looking statements are based upon the current beliefs and expectations of management and on information currently available to management. Our statements speak as of the date hereof, and we do not assume any obligation to update these statements or to update the reasons why actual results could differ from those contained in such statements in light of new information or future events. Forward-looking statements are subject to significant risks and uncertainties. Any forward-looking statement made in this release is subject to the safe harbor protections set forth in the Private Securities Litigation Reform Act of 1995. Investors are cautioned against placing undue reliance on such statements. Actual results may differ materially from those set forth in the forward looking statements. Additional factors that could cause actual results to differ materially from those described in the forward-looking statements can be found in Part I, “Item 1A. Risk Factors” in our Annual Report on Form 10-K for the year ended December 31, 2016 and in other periodic reports that we file with the SEC.
2
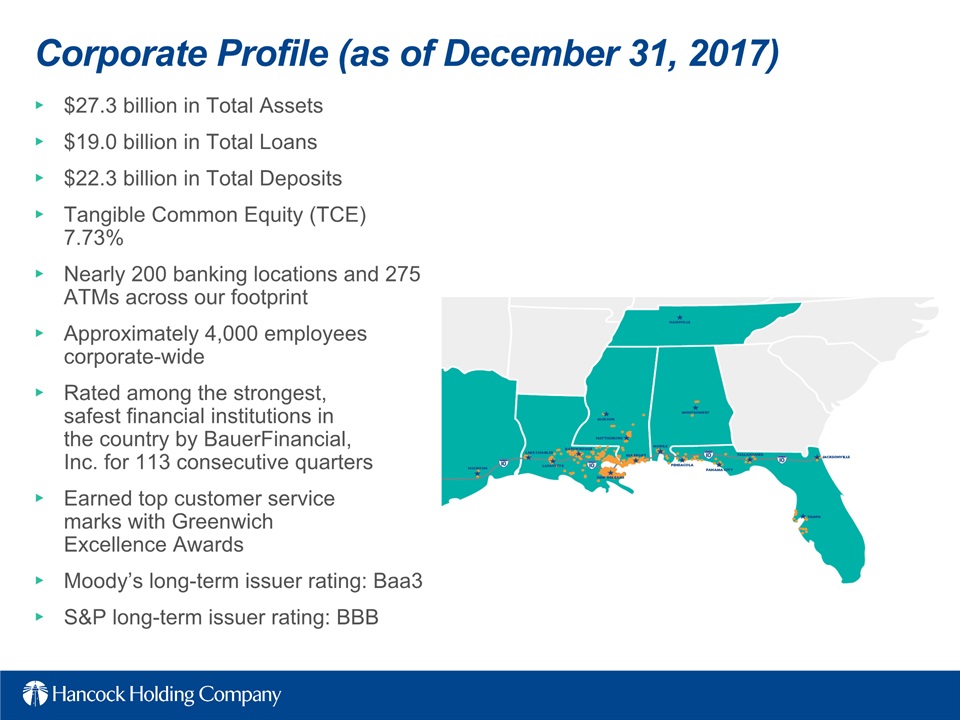
Corporate Profile (as of December 31, 2017) $27.3 billion in Total Assets$19.0 billion in Total Loans$22.3 billion in Total DepositsTangible Common Equity (TCE) 7.73%Nearly 200 banking locations and 275 ATMs across our footprintApproximately 4,000 employees corporate-wideRated among the strongest,safest financial institutions in the country by BauerFinancial,Inc. for 113 consecutive quartersEarned top customer servicemarks with Greenwich Excellence AwardsMoody’s long-term issuer rating: Baa3S&P long-term issuer rating: BBB
3
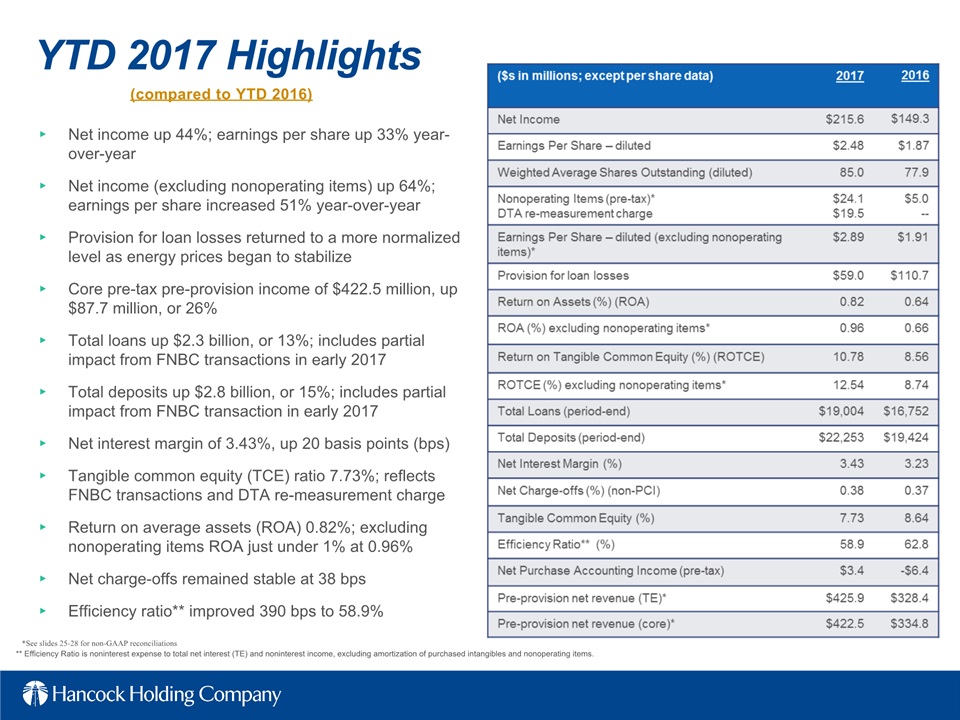
(compared to YTD 2016) YTD 2017 Highlights Net income up 44%; earnings per share up 33% year-over-yearNet income (excluding nonoperating items) up 64%; earnings per share increased 51% year-over-yearProvision for loan losses returned to a more normalized level as energy prices began to stabilizeCore pre-tax pre-provision income of $422.5 million, up $87.7 million, or 26%Total loans up $2.3 billion, or 13%; includes partial impact from FNBC transactions in early 2017Total deposits up $2.8 billion, or 15%; includes partial impact from FNBC transaction in early 2017Net interest margin of 3.43%, up 20 basis points (bps)Tangible common equity (TCE) ratio 7.73%; reflects FNBC transactions and DTA re-measurement chargeReturn on average assets (ROA) 0.82%; excluding nonoperating items ROA just under 1% at 0.96%Net charge-offs remained stable at 38 bpsEfficiency ratio** improved 390 bps to 58.9% ** Efficiency Ratio is noninterest expense to total net interest (TE) and noninterest income, excluding amortization of purchased intangibles and nonoperating items. *See slides 25-28 for non-GAAP reconciliations
4
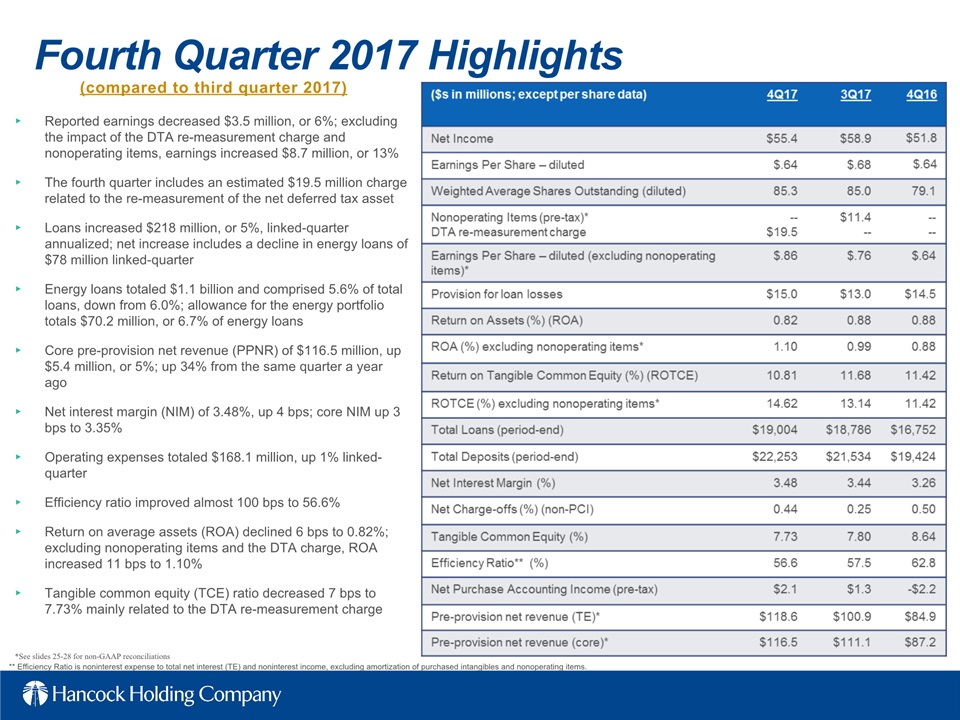
(compared to third quarter 2017) Fourth Quarter 2017 Highlights Reported earnings decreased $3.5 million, or 6%; excluding the impact of the DTA re-measurement charge and nonoperating items, earnings increased $8.7 million, or 13%The fourth quarter includes an estimated $19.5 million charge related to the re-measurement of the net deferred tax assetLoans increased $218 million, or 5%, linked-quarter annualized; net increase includes a decline in energy loans of $78 million linked-quarterEnergy loans totaled $1.1 billion and comprised 5.6% of total loans, down from 6.0%; allowance for the energy portfolio totals $70.2 million, or 6.7% of energy loans Core pre-provision net revenue (PPNR) of $116.5 million, up $5.4 million, or 5%; up 34% from the same quarter a year ago Net interest margin (NIM) of 3.48%, up 4 bps; core NIM up 3 bps to 3.35%Operating expenses totaled $168.1 million, up 1% linked-quarterEfficiency ratio improved almost 100 bps to 56.6%Return on average assets (ROA) declined 6 bps to 0.82%; excluding nonoperating items and the DTA charge, ROA increased 11 bps to 1.10%Tangible common equity (TCE) ratio decreased 7 bps to 7.73% mainly related to the DTA re-measurement charge ** Efficiency Ratio is noninterest expense to total net interest (TE) and noninterest income, excluding amortization of purchased intangibles and nonoperating items. *See slides 25-28 for non-GAAP reconciliations
5
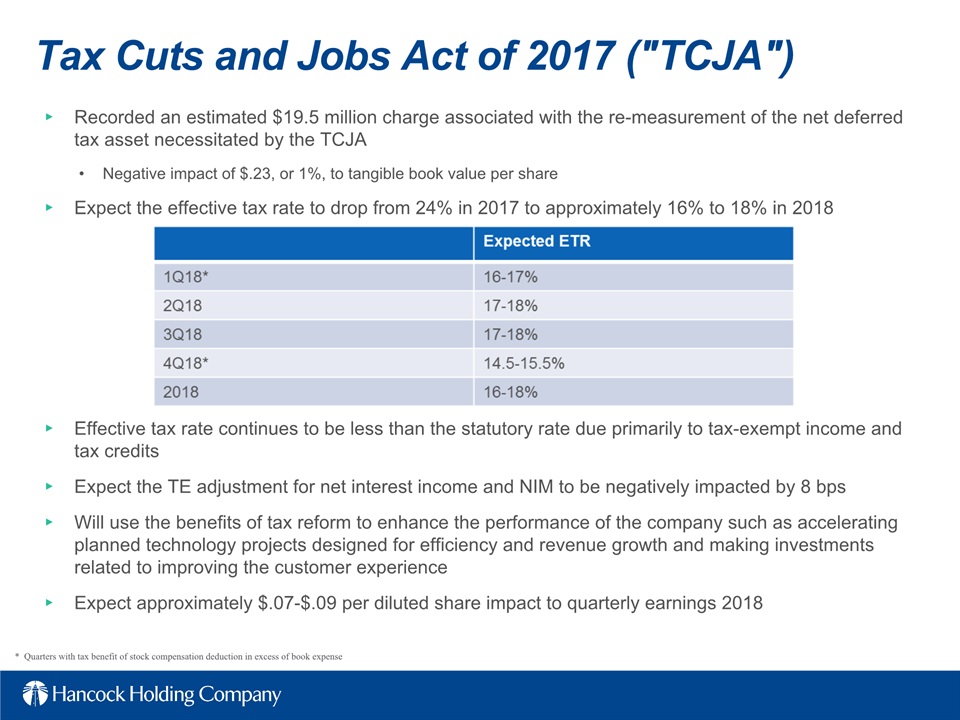
Tax Cuts and Jobs Act of 2017 ("TCJA") Recorded an estimated $19.5 million charge associated with the re-measurement of the net deferred tax asset necessitated by the TCJANegative impact of $.23, or 1%, to tangible book value per shareExpect the effective tax rate to drop from 24% in 2017 to approximately 16% to 18% in 2018 * Quarters with tax benefit of stock compensation deduction in excess of book expense Effective tax rate continues to be less than the statutory rate due primarily to tax-exempt income and tax creditsExpect the TE adjustment for net interest income and NIM to be negatively impacted by 8 bpsWill use the benefits of tax reform to enhance the performance of the company such as accelerating planned technology projects designed for efficiency and revenue growth and making investments related to improving the customer experienceExpect approximately $.07-$.09 per diluted share impact to quarterly earnings 2018
6
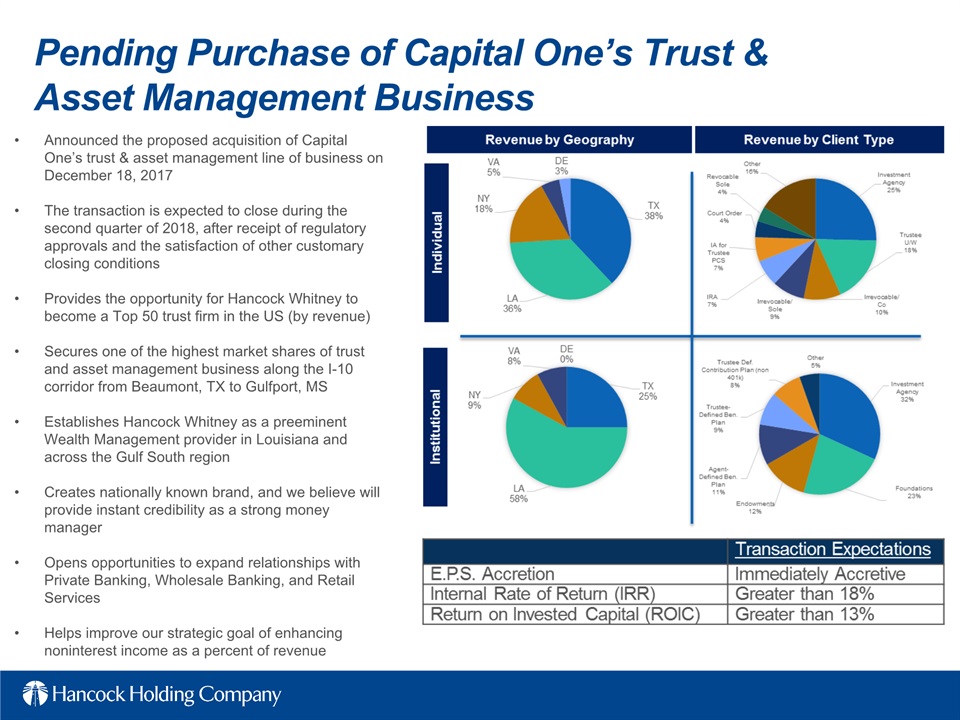
Pending Purchase of Capital One’s Trust & Asset Management Business Announced the proposed acquisition of Capital One’s trust & asset management line of business on December 18, 2017The transaction is expected to close during the second quarter of 2018, after receipt of regulatory approvals and the satisfaction of other customary closing conditionsProvides the opportunity for Hancock Whitney to become a Top 50 trust firm in the US (by revenue)Secures one of the highest market shares of trust and asset management business along the I-10 corridor from Beaumont, TX to Gulfport, MSEstablishes Hancock Whitney as a preeminent Wealth Management provider in Louisiana and across the Gulf South regionCreates nationally known brand, and we believe will provide instant credibility as a strong money managerOpens opportunities to expand relationships with Private Banking, Wholesale Banking, and Retail ServicesHelps improve our strategic goal of enhancing noninterest income as a percent of revenue
7
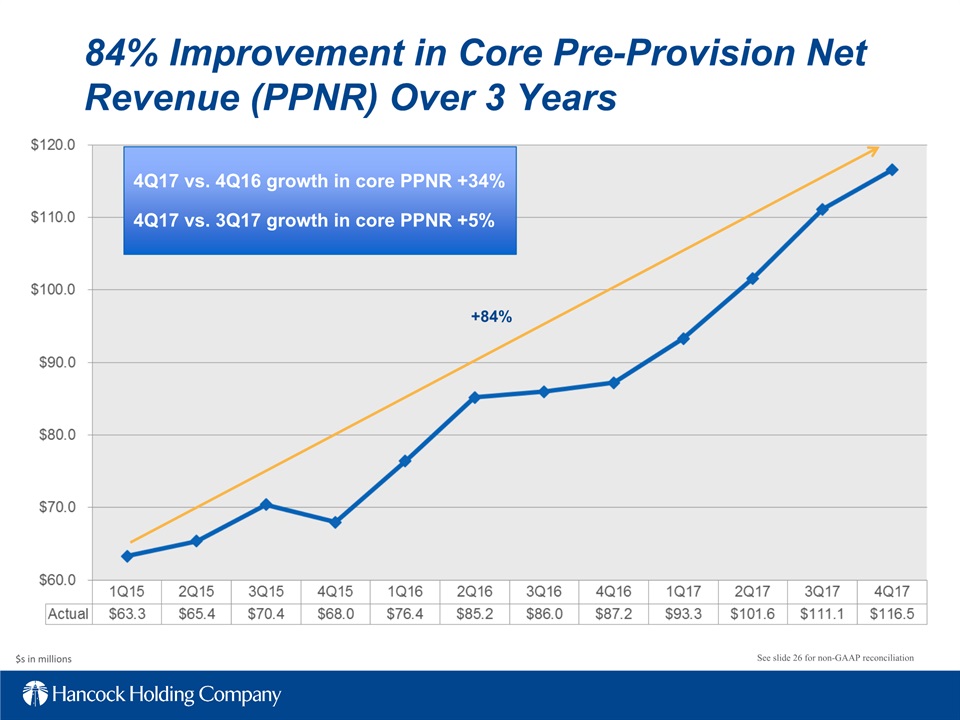
$s in millions 84% Improvement in Core Pre-Provision Net Revenue (PPNR) Over 3 Years See slide 26 for non-GAAP reconciliation 4Q17 vs. 4Q16 growth in core PPNR +34% 4Q17 vs. 3Q17 growth in core PPNR +5% +84%
8
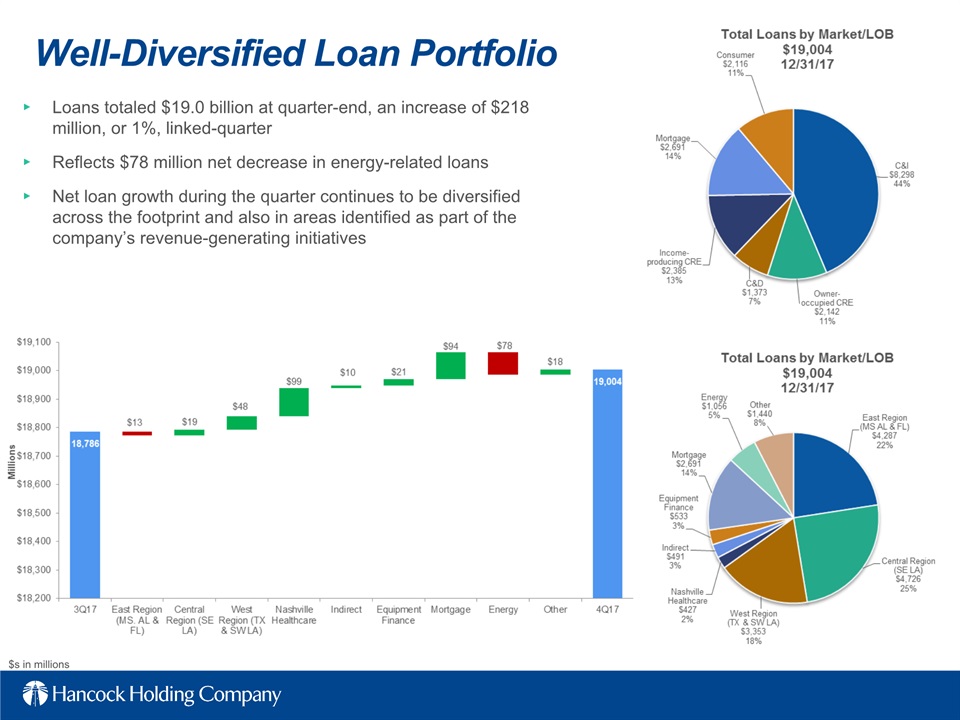
Well-Diversified Loan Portfolio Loans totaled $19.0 billion at quarter-end, an increase of $218 million, or 1%, linked-quarterReflects $78 million net decrease in energy-related loansNet loan growth during the quarter continues to be diversified across the footprint and also in areas identified as part of the company’s revenue-generating initiatives $s in millions
9
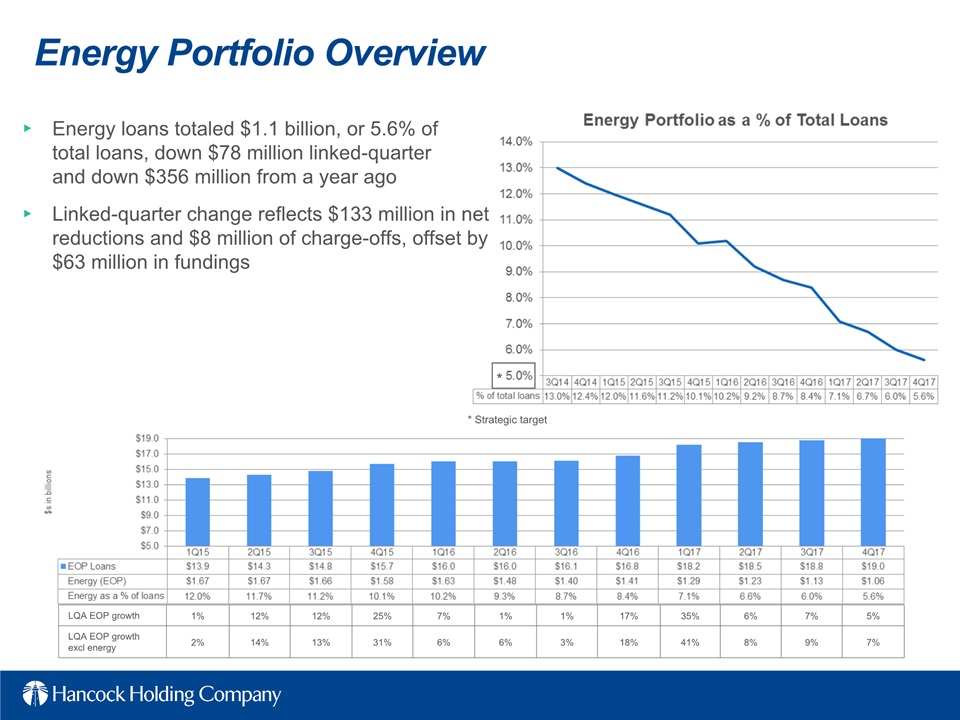
Energy Portfolio Overview Energy loans totaled $1.1 billion, or 5.6% of total loans, down $78 million linked-quarter and down $356 million from a year agoLinked-quarter change reflects $133 million in net reductions and $8 million of charge-offs, offset by $63 million in fundings LQA EOP growth 1% 12% 12% 25% 7% 1% 1% 17% 35% 6% 7% 5% LQA EOP growth excl energy 2% 14% 13% 31% 6% 6% 3% 18% 41% 8% 9% 7% * * Strategic target
10
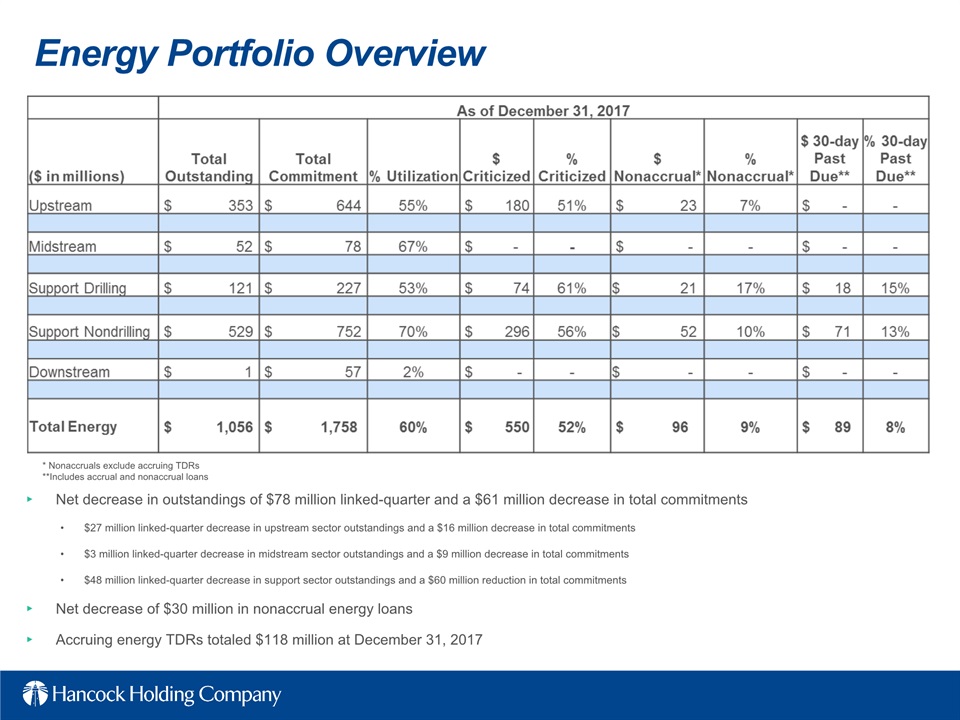
Energy Portfolio Overview Net decrease in outstandings of $78 million linked-quarter and a $61 million decrease in total commitments$27 million linked-quarter decrease in upstream sector outstandings and a $16 million decrease in total commitments $3 million linked-quarter decrease in midstream sector outstandings and a $9 million decrease in total commitments$48 million linked-quarter decrease in support sector outstandings and a $60 million reduction in total commitmentsNet decrease of $30 million in nonaccrual energy loansAccruing energy TDRs totaled $118 million at December 31, 2017 * Nonaccruals exclude accruing TDRs**Includes accrual and nonaccrual loans
11
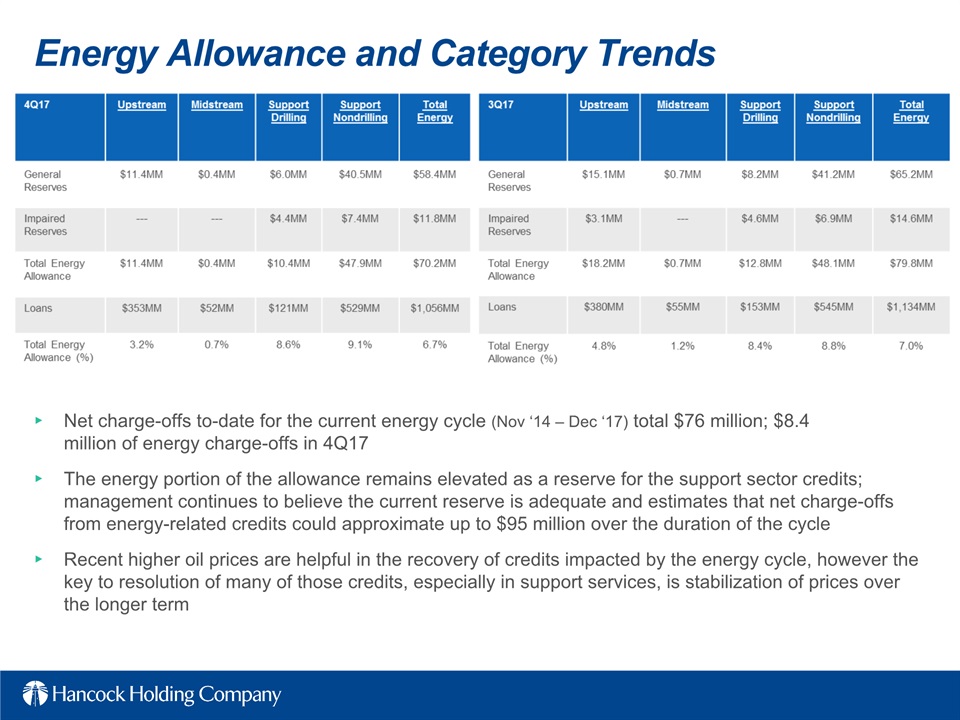
Energy Allowance and Category Trends Net charge-offs to-date for the current energy cycle (Nov ‘14 – Dec ‘17) total $76 million; $8.4million of energy charge-offs in 4Q17 The energy portion of the allowance remains elevated as a reserve for the support sector credits; management continues to believe the current reserve is adequate and estimates that net charge-offs from energy-related credits could approximate up to $95 million over the duration of the cycleRecent higher oil prices are helpful in the recovery of credits impacted by the energy cycle, however the key to resolution of many of those credits, especially in support services, is stabilization of prices over the longer term
12
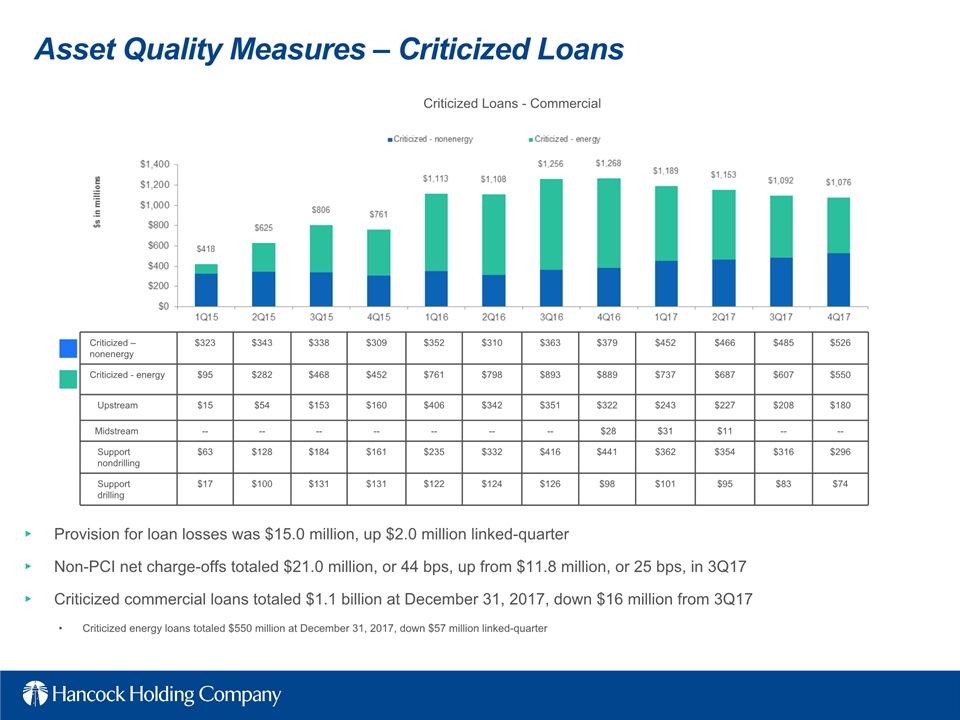
Asset Quality Measures – Criticized Loans Provision for loan losses was $15.0 million, up $2.0 million linked-quarterNon-PCI net charge-offs totaled $21.0 million, or 44 bps, up from $11.8 million, or 25 bps, in 3Q17Criticized commercial loans totaled $1.1 billion at December 31, 2017, down $16 million from 3Q17Criticized energy loans totaled $550 million at December 31, 2017, down $57 million linked-quarter Criticized – nonenergy $323 $343 $338 $309 $352 $310 $363 $379 $452 $466 $485 $526 Criticized - energy $95 $282 $468 $452 $761 $798 $893 $889 $737 $687 $607 $550 Upstream $15 $54 $153 $160 $406 $342 $351 $322 $243 $227 $208 $180 Midstream -- -- -- -- -- -- -- $28 $31 $11 -- -- Support nondrilling $63 $128 $184 $161 $235 $332 $416 $441 $362 $354 $316 $296 Support drilling $17 $100 $131 $131 $122 $124 $126 $98 $101 $95 $83 $74 Criticized Loans - Commercial
13
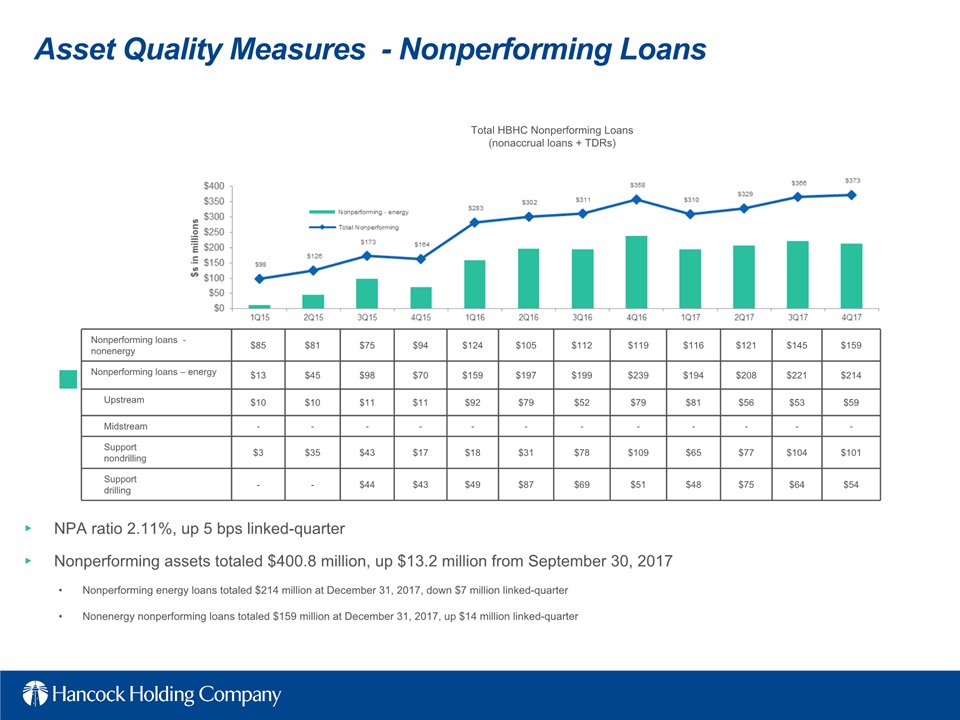
Nonperforming loans - nonenergy $85 $81 $75 $94 $124 $105 $112 $119 $116 $121 $145 $159 Nonperforming loans – energy $13 $45 $98 $70 $159 $197 $199 $239 $194 $208 $221 $214 Upstream $10 $10 $11 $11 $92 $79 $52 $79 $81 $56 $53 $59 Midstream - - - - - - - - - - - - Support nondrilling $3 $35 $43 $17 $18 $31 $78 $109 $65 $77 $104 $101 Support drilling - - $44 $43 $49 $87 $69 $51 $48 $75 $64 $54 Asset Quality Measures - Nonperforming Loans NPA ratio 2.11%, up 5 bps linked-quarter Nonperforming assets totaled $400.8 million, up $13.2 million from September 30, 2017Nonperforming energy loans totaled $214 million at December 31, 2017, down $7 million linked-quarterNonenergy nonperforming loans totaled $159 million at December 31, 2017, up $14 million linked-quarter Total HBHC Nonperforming Loans(nonaccrual loans + TDRs)
14

Adequate Reserve Coverage The allowance for loan losses (ALLL) was $217.3 million (1.14%) down $5.8 million from $223.1 million (1.19%) linked-quarterALLL for energy credits was $70.2 million, or 6.7%, at December 31, 2017, compared to $79.8 million, or 7.0%, at September 30, 2017 The nonenergy ALLL was $147.1 million, or 0.82%, of the nonenergy loan portfolio as of December 31, 2017, up from $143.3 million, or 0.81%, at September 30, 2017
15
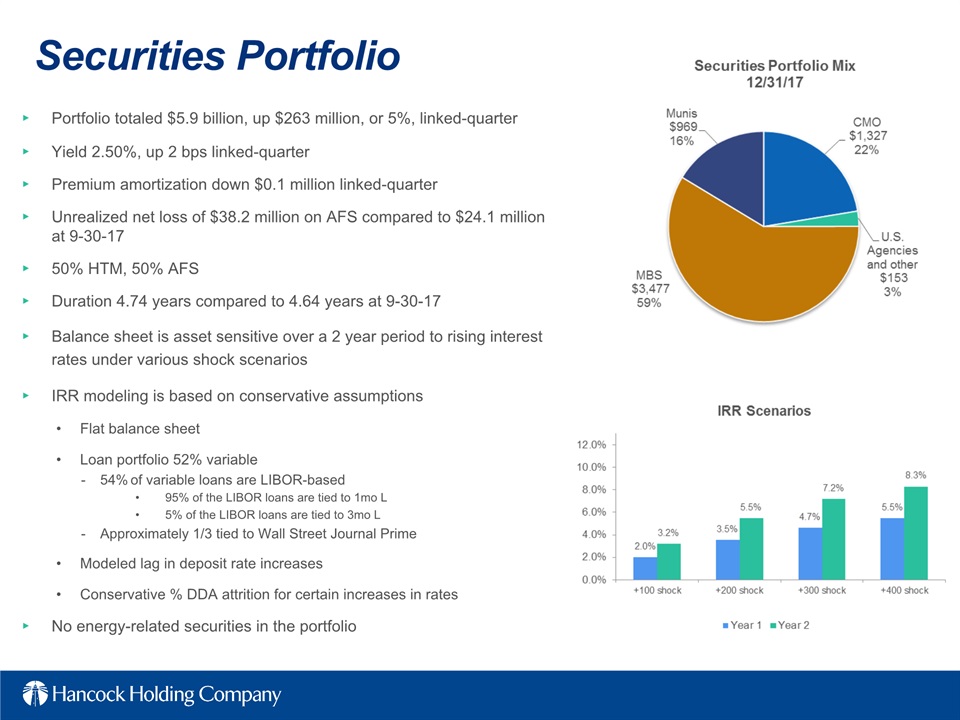
Securities Portfolio Portfolio totaled $5.9 billion, up $263 million, or 5%, linked-quarterYield 2.50%, up 2 bps linked-quarterPremium amortization down $0.1 million linked-quarterUnrealized net loss of $38.2 million on AFS compared to $24.1 million at 9-30-1750% HTM, 50% AFSDuration 4.74 years compared to 4.64 years at 9-30-17Balance sheet is asset sensitive over a 2 year period to rising interest rates under various shock scenariosIRR modeling is based on conservative assumptionsFlat balance sheetLoan portfolio 52% variable54% of variable loans are LIBOR-based 95% of the LIBOR loans are tied to 1mo L5% of the LIBOR loans are tied to 3mo LApproximately 1/3 tied to Wall Street Journal PrimeModeled lag in deposit rate increasesConservative % DDA attrition for certain increases in ratesNo energy-related securities in the portfolio
16

Solid Levels Of Core Deposit Funding Total deposits $22.3 billion, up $719 million, or 3%, linked-quarterNoninterest-bearing demand deposits (DDA) increased $411 million Includes approximately $143 million in seasonal public fund depositsInterest-bearing transaction and savings deposits increased $288 millionTime deposits decreased $258 million Interest-bearing public fund deposits increased $278 million; reflects annual year-end seasonality Total public fund deposits increased $421 million during the quarter (includes DDA)Funding mix remained strongDDA comprised 37% of total period-end depositsCost of funds up 2 bps to 50 bps
17

Continued NIM Expansion Reported net interest margin (NIM) of 3.48%, up 4 bps linked-quarter Loan yield up 7 bpsReflects better yields on commercial and mortgage loansYield on securities portfolio up 2 bpsReflects change in mix to higher yielding securities and impact of the increase in the 10-year treasury yieldCost of funds up 2 bpsReflects increased rates on time deposits and public fund CDsCore NIM of 3.35%, up 3 bps linked-quarterExpect the TCJA TE adjustment to negatively impact NIM by 8bps See slide 28 for non-GAAP reconciliation
18
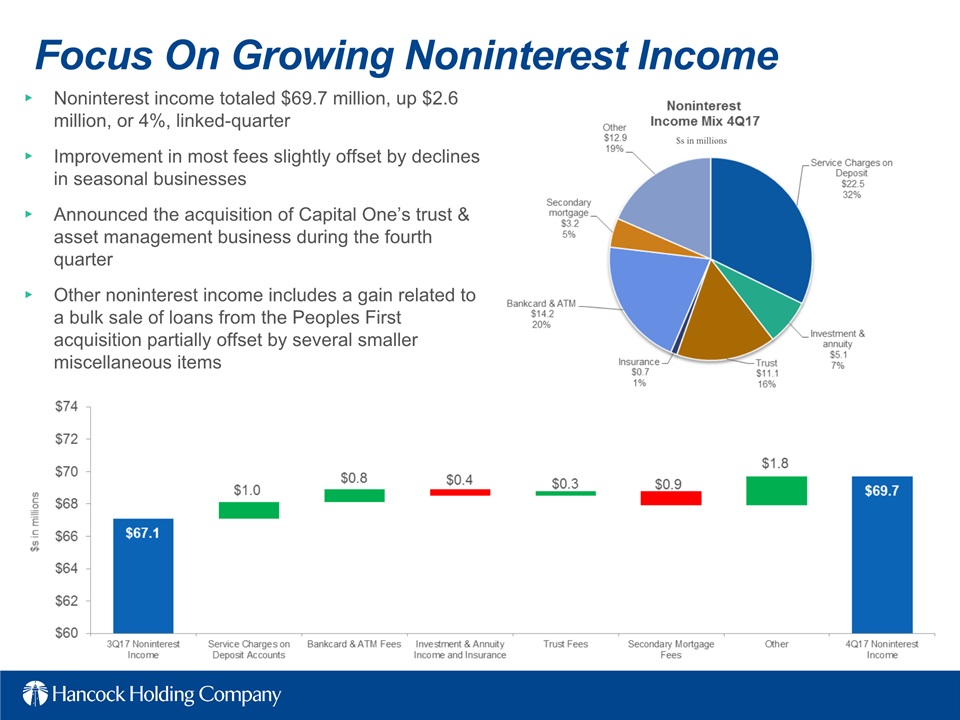
Focus On Growing Noninterest Income Noninterest income totaled $69.7 million, up $2.6 million, or 4%, linked-quarterImprovement in most fees slightly offset by declines in seasonal businessesAnnounced the acquisition of Capital One’s trust & asset management business during the fourth quarterOther noninterest income includes a gain related to a bulk sale of loans from the Peoples First acquisition partially offset by several smaller miscellaneous items $s in millions
19
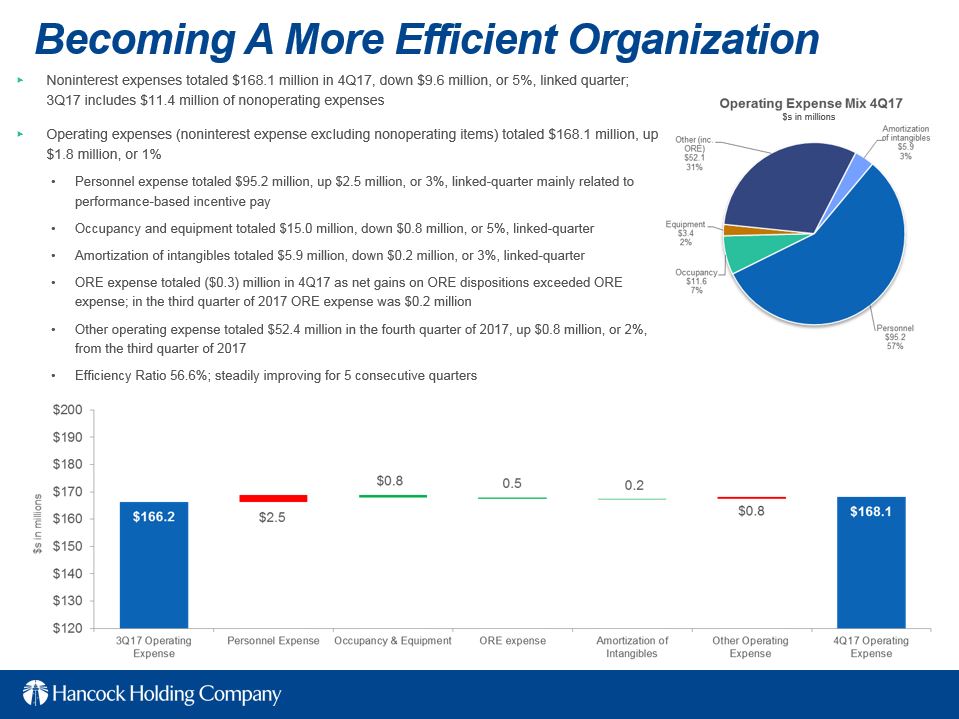
Becoming A More Efficient Organization Noninterest expenses totaled $168.1 million in 4Q17, down $9.6 million, or 5%, linked quarter; 3Q17 includes $11.4 million of nonoperating expensesOperating expenses (noninterest expense excluding nonoperating items) totaled $168.1 million, up $1.8 million, or 1%Personnel expense totaled $95.2 million, up $2.5 million, or 3%, linked-quarter mainly related to performance-based incentive payOccupancy and equipment totaled $15.0 million, down $0.8 million, or 5%, linked-quarterAmortization of intangibles totaled $5.9 million, down $0.2 million, or 3%, linked-quarter ORE expense totaled ($0.3) million in 4Q17 as net gains on ORE dispositions exceeded ORE expense; in the third quarter of 2017 ORE expense was $0.2 million Other operating expense totaled $52.4 million in the fourth quarter of 2017, up $0.8 million, or 2%, from the third quarter of 2017Efficiency Ratio 56.6%; steadily improving for 5 consecutive quarters $s in millions
20
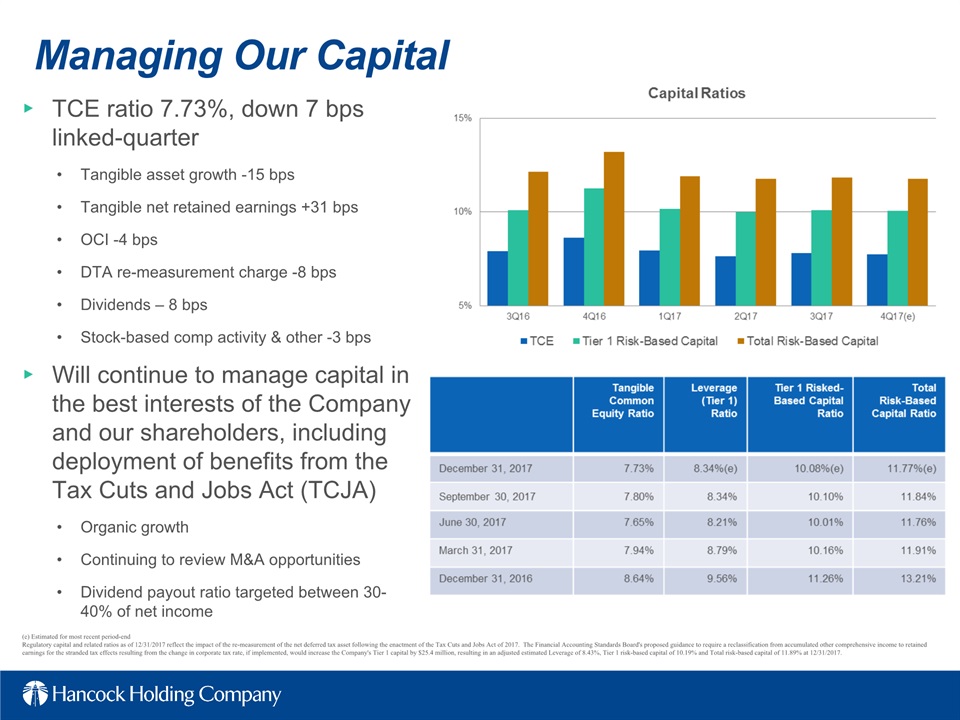
TCE ratio 7.73%, down 7 bps linked-quarterTangible asset growth -15 bpsTangible net retained earnings +31 bpsOCI -4 bpsDTA re-measurement charge -8 bpsDividends – 8 bpsStock-based comp activity & other -3 bpsWill continue to manage capital in the best interests of the Company and our shareholders, including deployment of benefits from the Tax Cuts and Jobs Act (TCJA)Organic growthContinuing to review M&A opportunitiesDividend payout ratio targeted between 30-40% of net income Managing Our Capital (e) Estimated for most recent period-endRegulatory capital and related ratios as of 12/31/2017 reflect the impact of the re-measurement of the net deferred tax asset following the enactment of the Tax Cuts and Jobs Act of 2017. The Financial Accounting Standards Board's proposed guidance to require a reclassification from accumulated other comprehensive income to retained earnings for the stranded tax effects resulting from the change in corporate tax rate, if implemented, would increase the Company's Tier 1 capital by $25.4 million, resulting in an adjusted estimated Leverage of 8.43%, Tier 1 risk-based capital of 10.19% and Total risk-based capital of 11.89% at 12/31/2017.
21
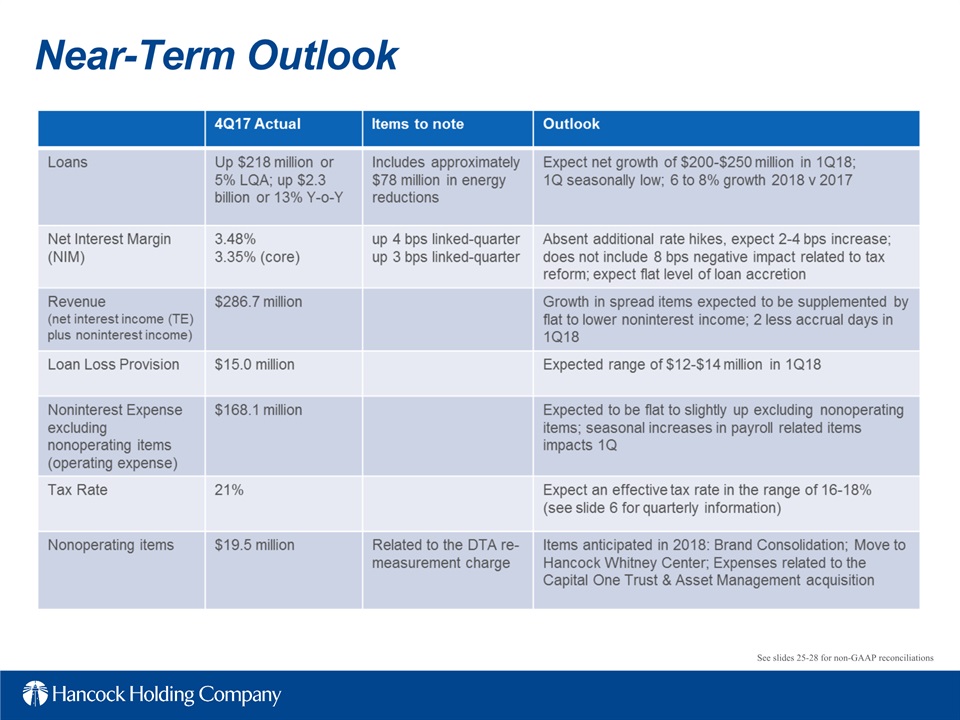
Near-Term Outlook See slides 25-28 for non-GAAP reconciliations
22
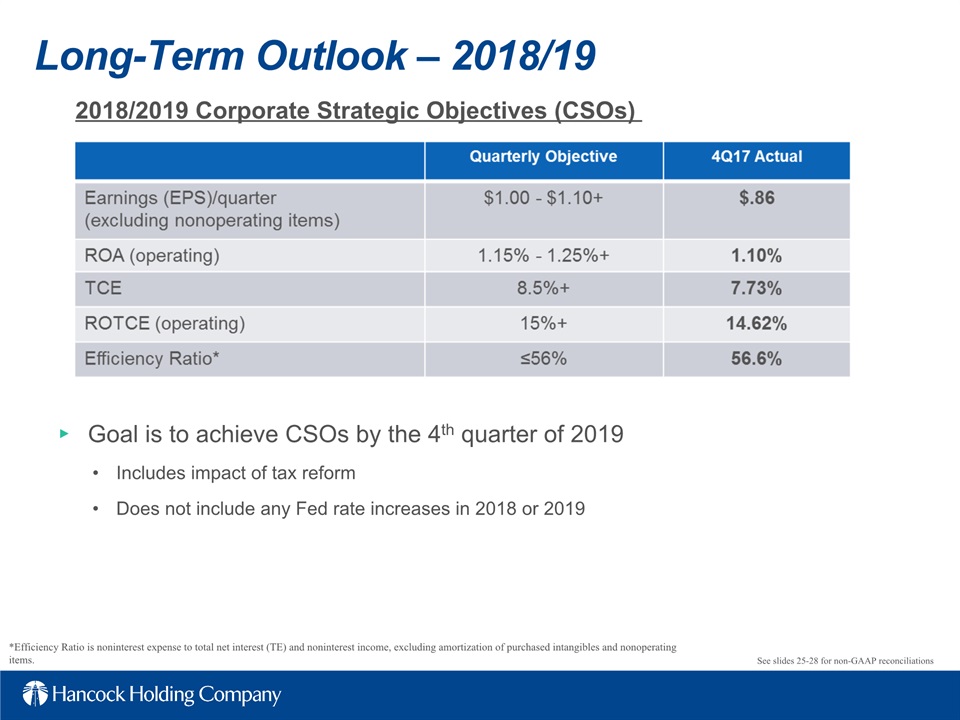
Long-Term Outlook – 2018/19 Goal is to achieve CSOs by the 4th quarter of 2019Includes impact of tax reform Does not include any Fed rate increases in 2018 or 2019 2018/2019 Corporate Strategic Objectives (CSOs) *Efficiency Ratio is noninterest expense to total net interest (TE) and noninterest income, excluding amortization of purchased intangibles and nonoperating items. See slides 25-28 for non-GAAP reconciliations
23
Non-GAAP Reconciliations
24

EPS Calculation and Non-GAAP Reconciliations See Note 13 in the most recent 10K for more details on the two-class method for EPS calculation.
25
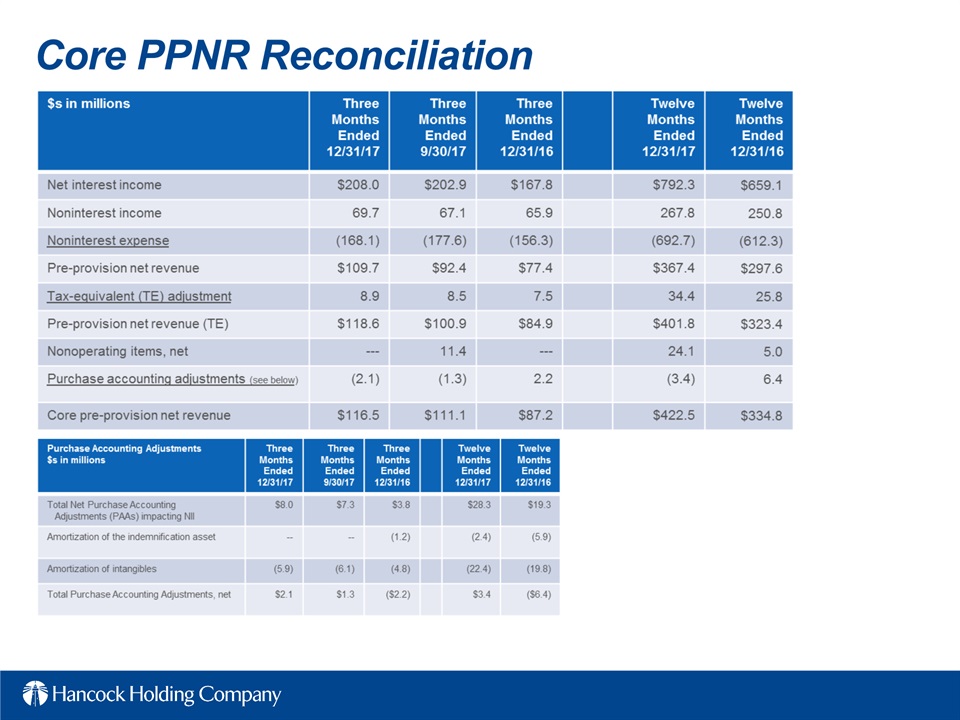
Core PPNR Reconciliation
26
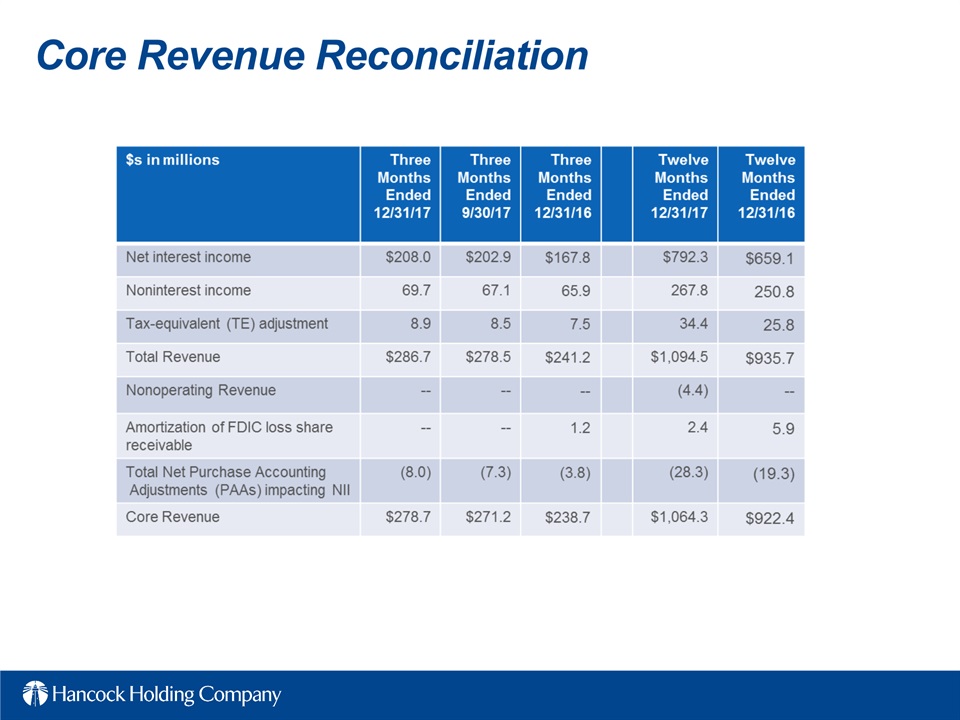
Core Revenue Reconciliation
27
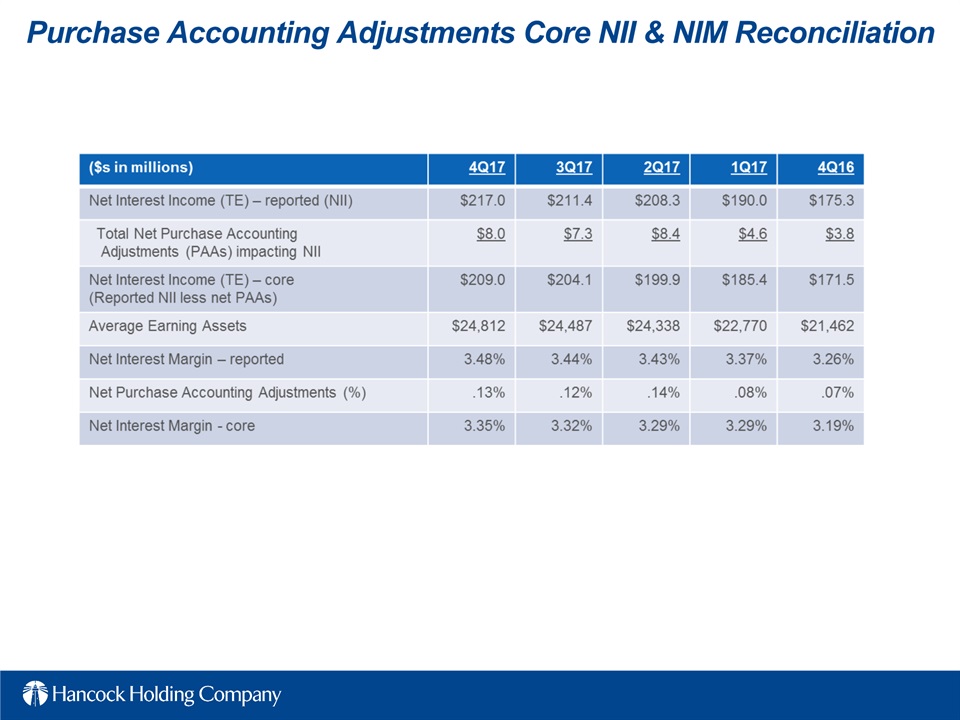
Purchase Accounting Adjustments Core NII & NIM Reconciliation
28

Appendix
29
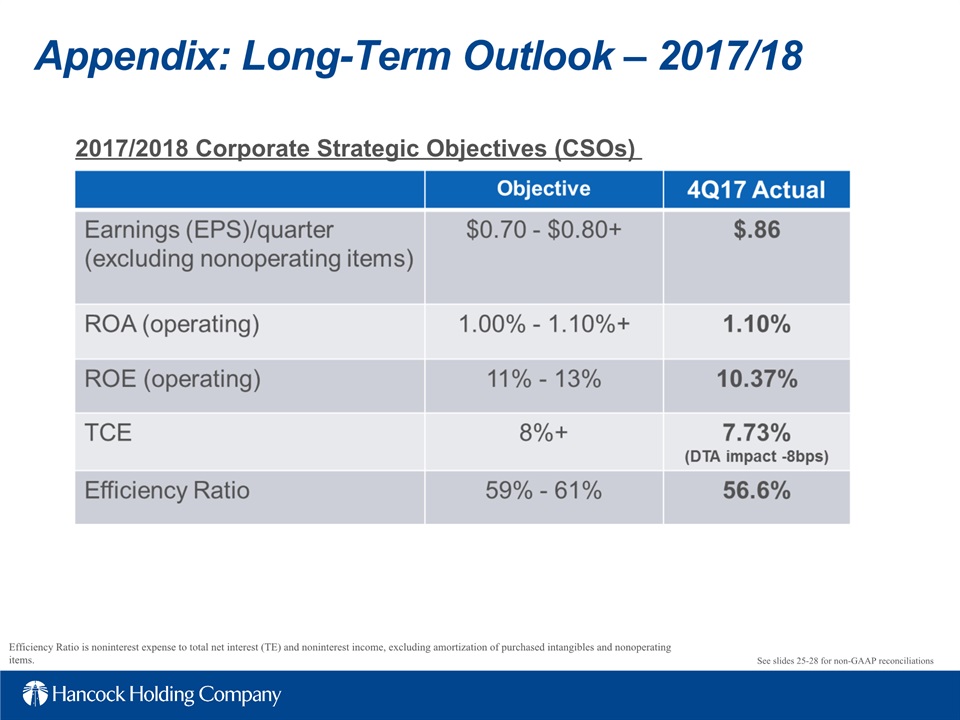
Appendix: Long-Term Outlook – 2017/18 2017/2018 Corporate Strategic Objectives (CSOs) Efficiency Ratio is noninterest expense to total net interest (TE) and noninterest income, excluding amortization of purchased intangibles and nonoperating items. See slides 25-28 for non-GAAP reconciliations
30
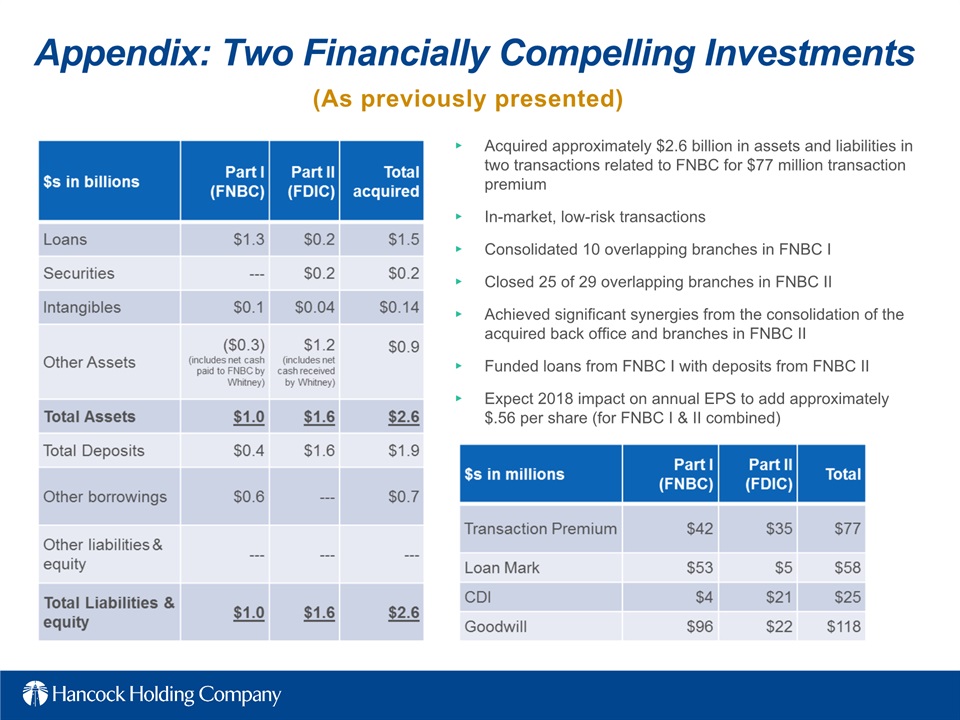
Acquired approximately $2.6 billion in assets and liabilities in two transactions related to FNBC for $77 million transaction premium In-market, low-risk transactionsConsolidated 10 overlapping branches in FNBC IClosed 25 of 29 overlapping branches in FNBC IIAchieved significant synergies from the consolidation of the acquired back office and branches in FNBC IIFunded loans from FNBC I with deposits from FNBC IIExpect 2018 impact on annual EPS to add approximately $.56 per share (for FNBC I & II combined) (As previously presented) Appendix: Two Financially Compelling Investments
31
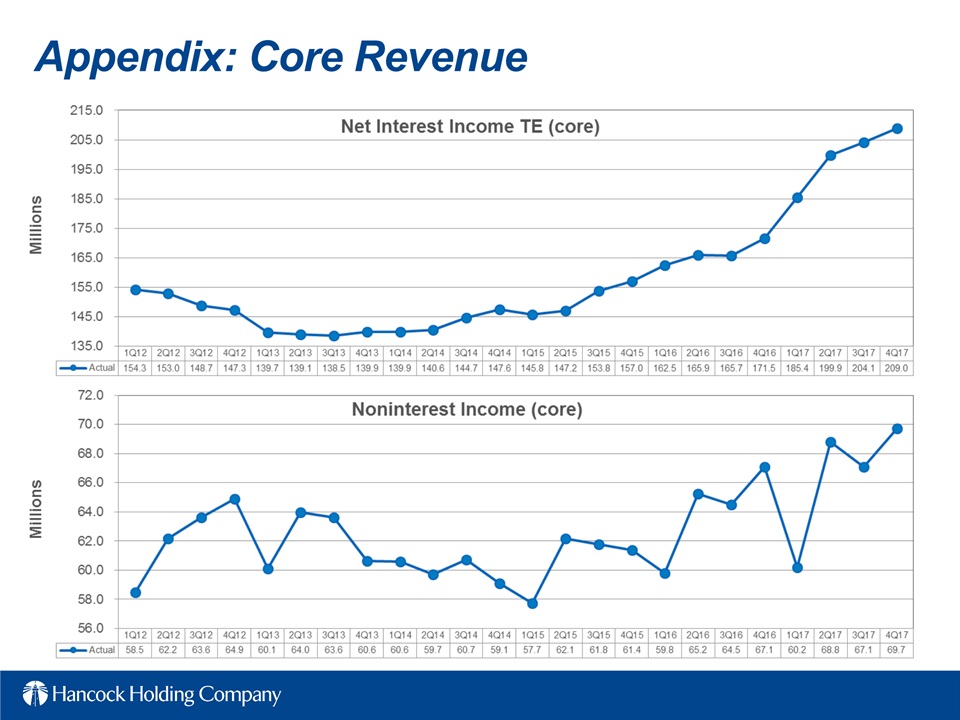
Appendix: Core Revenue
32
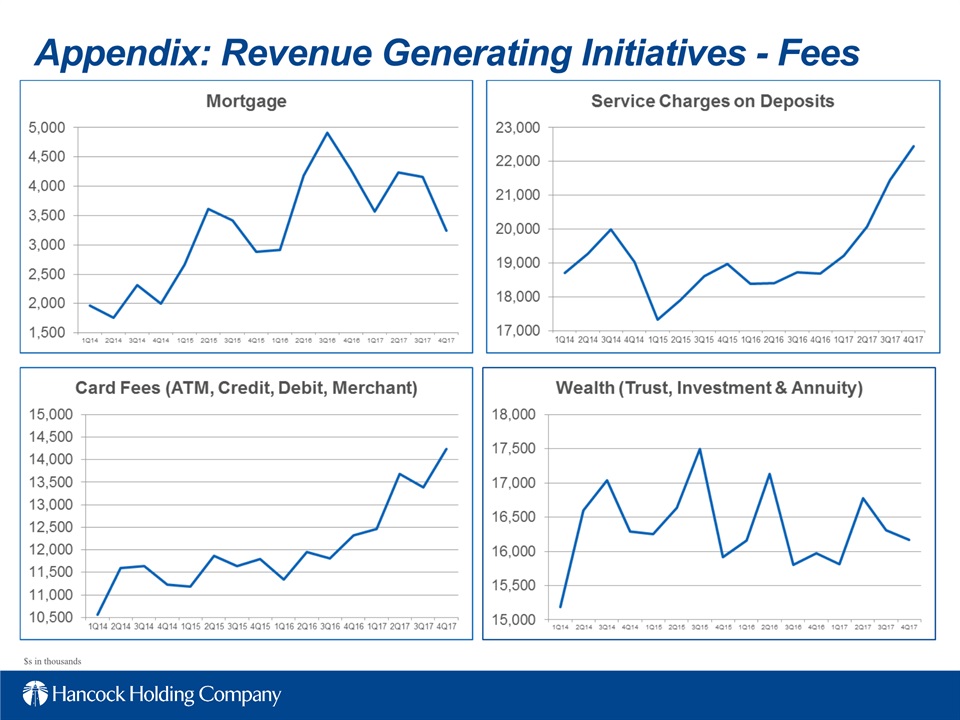
Appendix: Revenue Generating Initiatives - Fees $s in thousands
33
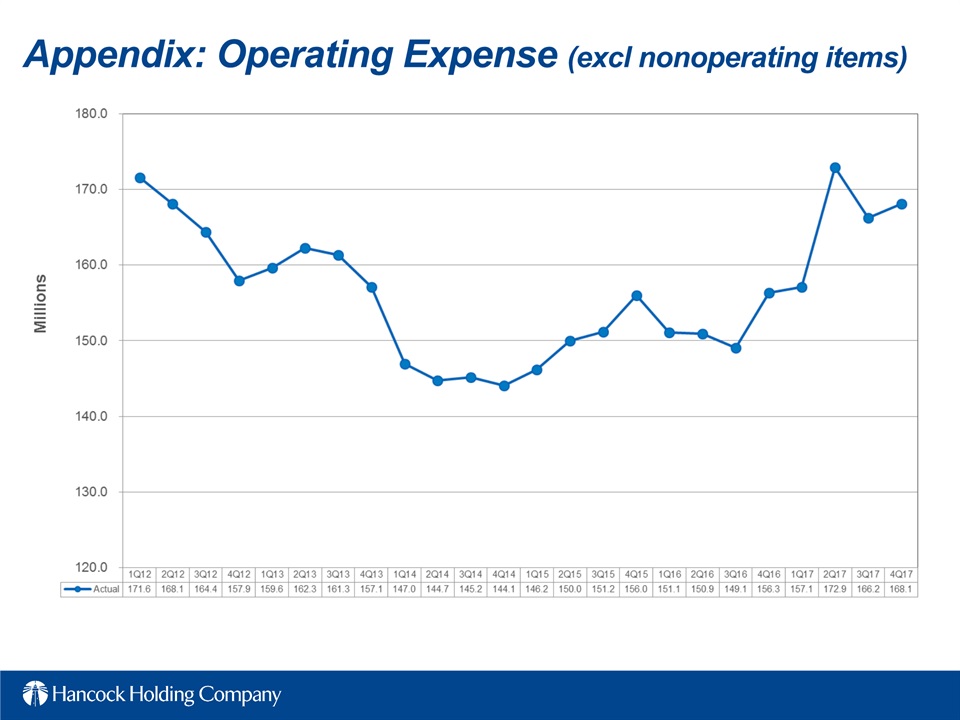
Appendix: Operating Expense (excl nonoperating items)
34
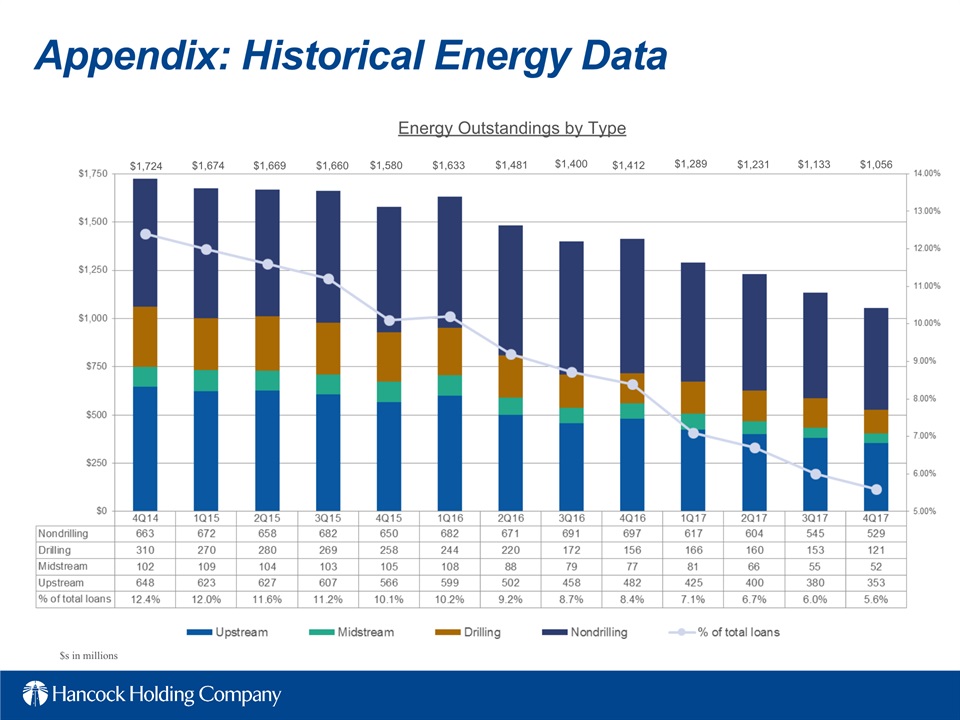
Appendix: Historical Energy Data $s in millions Energy Outstandings by Type $1,724 $1,674 $1,669 $1,660 $1,580 $1,633 $1,231 $1,400 $1,412 $1,481 $1,289 $1,133 $1,056
35
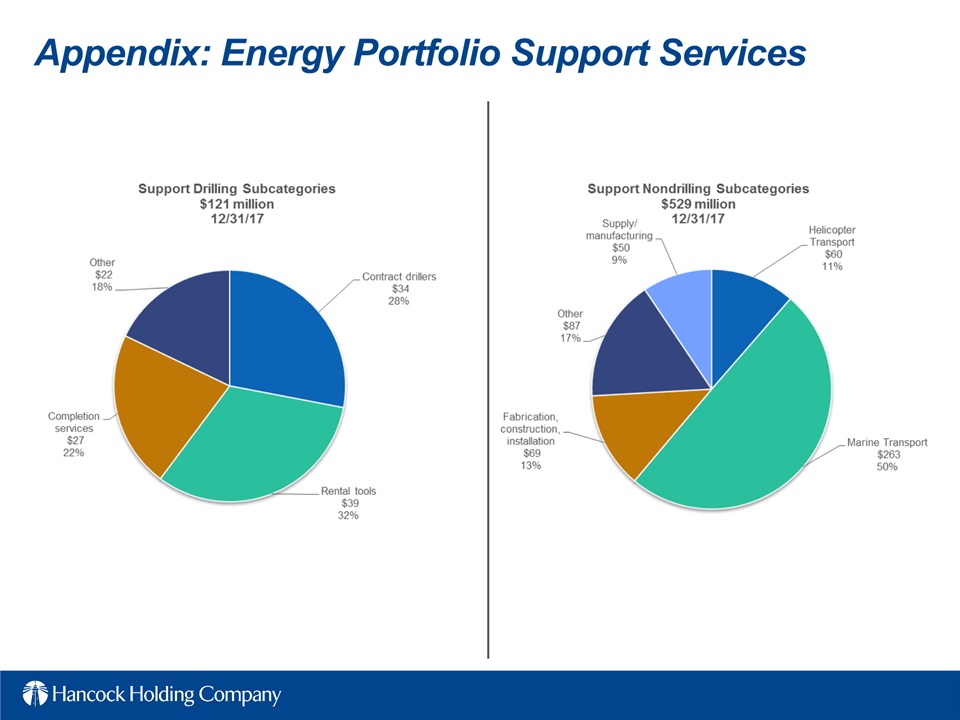
Appendix: Energy Portfolio Support Services
36

Appendix: Glossary of Terms Linked-quarter – current quarter compared to previous quarterLoan Mark – Fair value discount on loans acquired in a business combinationLOB – Line of BusinessLPO – Loan production officeLQA – Linked-quarter annualizedM&A – Mergers and acquisitionsNII – Net interest income NIM – Net interest marginNPA – Nonperforming assetsO&G – Oil and gasOperating – Net income excluding nonoperating itemsORE – Other real estatePAA – Purchase accounting adjustments from business combinations; including loan accretion, offset by any amortization of a bond portfolio premium, amortization of an indemnification asset and amortization of intangiblesPCI – Purchased credit impairedPPNR – Pre-provision net revenueRBL – Reserve-based lendingROA – Return on average assetsRR – Risk ratingSBIC – Small Business Investment CompanySNC – Shared National CreditTCE – Tangible common equity ratio (common shareholders’ equity less intangible assets divided by total assets less intangible assets)TCJA – Tax Cuts and Jobs ActTDR – Troubled Debt Restructuring TE – Taxable equivalent (calculated using a federal income tax rate of 35%)Y-o-Y – Year over year 1Q17 – First Quarter of 20172H17 – Second Half of 2017 (3rd and 4th quarters)2Q17 – Second Quarter of 20173Q17 – Third Quarter of 20174Q17 – Fourth Quarter of 20174Q18 – Fourth Quarter of 2018AFS – Available for sale securitiesALLL – Allowance for loan and lease lossesAnnualized – Calculated to reflect a rate based on a full yearCDI – Core Deposit IntangibleCore – Excluding purchase accounting items and nonoperating itemsCore NIM – Reported net interest income (TE) excluding total net purchase accounting adjustments, annualized, as a percent of average earning assetsCore Revenue – Net interest income (TE) plus noninterest income excluding purchase accounting adjustments and nonoperating items for both categoriesCSO – Corporate strategic objectiveCurrent Energy Cycle – Refers to the energy cycle beginning in November of 2014 through the most recent quarter endDDA – Noninterest-bearing demands deposit accountsDTA – Deferred Tax AssetE&P – Exploration and Production (Oil & Gas)Efficiency ratio – noninterest expense to total net interest (TE) and noninterest income, excluding amortization of purchased intangibles and nonoperating itemsEOP – End of periodEPS – Earnings per shareFNBC I – Acquired selected assets & liabilities from FNBC (see slide 31)FNBC II – Acquired selected assets & liabilities of FNBC from FDIC (see slide 31)HTM – Held to maturity securitiesIRR – Interest rate risk
37
1/18/2018 Fourth Quarter 2017Earnings Conference Call
38