Attached files
| file | filename |
|---|---|
| EX-21 - SUBSIDIARIES OF HANCOCK HOLDING COMPANY - HANCOCK WHITNEY CORP | d281615dex21.htm |
| EX-23.1 - CONSENT OF PRICEWATERHOUSECOOPERS, LLP. - HANCOCK WHITNEY CORP | d281615dex231.htm |
| EX-99.1 - CEO CERTIFICATION - IFR SECTION 30.15 - HANCOCK WHITNEY CORP | d281615dex991.htm |
| EX-31.1 - CERTIFICATION OF CEO SECTION 302 - HANCOCK WHITNEY CORP | d281615dex311.htm |
| EX-32.1 - CERTIFICATION OF CEO SECTION 906 - HANCOCK WHITNEY CORP | d281615dex321.htm |
| EX-99.2 - CFO CERTIFICATION - IFR SECTION 30.15 - HANCOCK WHITNEY CORP | d281615dex992.htm |
| EX-32.2 - CERTIFICATION OF CFO SECTION 906 - HANCOCK WHITNEY CORP | d281615dex322.htm |
| EX-31.2 - CERTIFICATION OF CFO SECTION 302 - HANCOCK WHITNEY CORP | d281615dex312.htm |
| EX-10.14 - RETENTION AGREEMENT DATED MARCH 31, 2011 - HANCOCK WHITNEY CORP | d281615dex1014.htm |
| EX-10.12 - FORM OF CHANGE IN CONTROL EMPLOYMENT AGREEMENT - HANCOCK WHITNEY CORP | d281615dex1012.htm |
| EX-10.13 - RETENTION AGREEMENT DATED MARCH 1, 2011 - HANCOCK WHITNEY CORP | d281615dex1013.htm |
Table of Contents
UNITED STATES
SECURITIES AND EXCHANGE COMMISSION
WASHINGTON, D. C. 20549
FORM 10-K
| x | ANNUAL REPORT PURSUANT TO SECTION 13 OR 15(d) OF THE SECURITIES EXCHANGE ACT OF 1934 |
For the fiscal year ended December 31, 2011.
OR
| ¨ | TRANSITION REPORT PURSUANT TO SECTION 13 OR 15(d) OF THE SECURITIES EXCHANGE ACT OF 1934 |
Commission file number 0-13089
Hancock Holding Company
(Exact name of registrant as specified in its charter)
| Mississippi | 64-0693170 | |
| (State or other jurisdiction of incorporation or organization) |
(I.R.S. Employer Identification Number) | |
| One Hancock Plaza, Gulfport, Mississippi | 39501 | |
| (Address of principal executive offices) | (Zip Code) | |
(228) 868-4727
Registrant’s telephone number, including area code
Securities registered pursuant to Section 12(b) of the Act:
| (Title of Class) |
(Name of Exchange on Which Registered) | |
| COMMON STOCK, $3.33 PAR VALUE | The NASDAQ Stock Market, LLC |
Securities registered pursuant to Section 12(g) of the Act:
NONE
Indicate by check mark if the registrant is a well-known seasoned issuer, as defined in Rule 405 of the Securities Act. Yes x No ¨
Indicate by check mark if the registrant is not required to file reports pursuant to Section 13 or Section 15(d) of the Act. Yes ¨ No x
Indicate by check mark whether the registrant (1) has filed all reports required to be filed by Section 13 or 15(d) of the Securities Exchange Act of 1934 during the preceding 12 months (or for such shorter period that the registrant was required to file such reports) and (2) has been subject to such filing requirements for the past 90 days. Yes x No ¨
Indicate by check mark whether the registrant has submitted electronically and posted on its corporate Web site, if any, every Interactive Data File required to be submitted and posted pursuant to Rule 405 of Regulation S-T during the preceding 12 months (or for such shorter period that the registrant was required to submit and post such files). Yes x No ¨
Indicate by check mark if disclosure of delinquent filers pursuant to Item 405 of Regulation S-K is not contained herein, and will not be contained, to the best of registrant’s knowledge, in definitive proxy or information statements incorporated by reference in Part III of this Form 10-K or any amendment to this Form 10-K. Yes x No ¨
Indicate by check mark whether the registrant is a large accelerated filer, an accelerated filer, or a non-accelerated filer. See definition of “accelerated filer and large accelerated filer” in Rule 12b-2 of the Exchange Act. (Check One):
| Large accelerated filer |
x |
Accelerated filer |
¨ | |||
| Non-accelerated filer |
¨ |
Smaller reporting company |
¨ | |||
Indicate by check mark whether the registrant is a shell company (as defined in Rule 12b-2 of the Act). Yes ¨ No x
The aggregate market value of the voting stock held by nonaffiliates of the registrant as of December 31, 2011 was $2.6 billion based upon the closing market price on NASDAQ on June 30, 2011. For purposes of this calculation only, shares held by nonaffiliates are deemed to consist of (a) shares held by all shareholders other than directors and executive officers of the registrant plus (b) shares held by directors and officers as to which beneficial ownership has been disclaimed.
On February 1, 2012, the registrant had outstanding 84,749,038 shares of common stock for financial statement purposes.
DOCUMENTS INCORPORATED BY REFERENCE
Portions of the definitive Proxy Statement for the Registrant’s Annual Meeting of Shareholders to be filed with the Securities and Exchange Commission are incorporated by reference into Part III of this report.
Table of Contents
Form 10-K
Index
| ITEM 1. |
1 | |||||
| ITEM 1A. |
13 | |||||
| ITEM 1B. |
20 | |||||
| ITEM 2. |
20 | |||||
| ITEM 3. |
21 | |||||
| ITEM 4. |
21 | |||||
| ITEM 5. |
22 | |||||
| ITEM 6. |
24 | |||||
| ITEM 7. |
MANAGEMENT’S DISCUSSION AND ANALYSIS OF FINANCIAL CONDITION AND RESULTS OF OPERATIONS |
28 | ||||
| ITEM 7A. |
54 | |||||
| ITEM 8. |
55 | |||||
| ITEM 9. |
CHANGES IN AND DISAGREEMENTS WITH ACCOUNTANTS ON ACCOUNTING AND FINANCIAL DISCLOSURE |
|||||
| ITEM 9A. |
123 | |||||
| ITEM 9B. |
123 | |||||
| ITEM 10. |
124 | |||||
| ITEM 11. |
124 | |||||
| ITEM 12. |
SECURITY OWNERSHIP OF CERTAIN BENEFICIAL OWNERS AND MANAGEMENT AND RELATED STOCKHOLDER MATTERS |
124 | ||||
| ITEM 13. |
CERTAIN RELATIONSHIPS AND RELATED TRANSACTIONS, AND DIRECTOR INDEPENDENCE |
124 | ||||
| ITEM 14. |
124 | |||||
| ITEM 15. |
124 | |||||
Table of Contents
| ITEM 1. | BUSINESS |
ORGANIZATION AND RECENT DEVELOPMENTS
Hancock Holding Company (“Hancock or the Company”) was organized in 1984 as a bank holding company registered under the Bank Holding Company Act of 1956, as amended, and is headquartered in Gulfport, Mississippi. In 2002, the Company qualified as a financial holding company giving it broader powers.
Prior to a series of smaller acquisitions begun in 1985, growth was primarily internal and was accomplished by branch expansions in areas of population growth where no dominant financial institution previously served the market area. More recently the Company has acquired two sizeable institutions which have changed the dynamics of the overall organization.
On December 18, 2009, the Company acquired the assets and assumed the liabilities of Panama City, Florida, based Peoples First Community Bank (Peoples First) in a FDIC transaction. This acquisition added approximately $2 billion in assets.
On June 4, 2011, Hancock acquired all of the outstanding common stock of Whitney Holding Corporation (Whitney), a bank holding company based in New Orleans, Louisiana, in a stock and cash transaction. The impact of the acquisition is reflected in the Company’s financial information from the acquisition date. Whitney’s bank subsidiary, Whitney National Bank, was merged into Hancock Bank of Louisiana and renamed Whitney Bank. The acquisition added $11.7 billion in assets, $6.5 billion in loans, and $9.2 billion in deposits. As part of the merger, Hancock Bank of Alabama was merged into Whitney Bank. The assets and liabilities of the former Hancock Bank of Alabama were then transferred to Hancock Bank.
On September 16, 2011, seven Whitney Bank branches located on the Mississippi Gulf Coast and one branch located in Bogalusa, Louisiana with approximately $47 million in loans and $180 million in deposits were divested in order to resolve branch concentration concerns of the U.S. Department of Justice relating to the merger.
The integration of Whitney into Hancock continues to progress as scheduled. Professional consulting groups have been assisting Hancock with the integration and accounting matters related to the transaction, and there are a group of bankers from both Whitney and Hancock dedicated to this process. Customer and employee retention remains a priority. To-date, the Company has not lost any major customer relationships as a result of the transaction and it has been able to retain key employees throughout the organization.
NATURE OF BUSINESS AND MARKETS
With $20 billion in assets, Hancock is the parent company of two wholly-owned bank subsidiaries, Hancock Bank, headquartered in Gulfport, Mississippi and Whitney Bank, headquartered in New Orleans, Louisiana.
Hancock Bank and Whitney Bank are referred to collectively as the “Banks” and they operate a combined total of nearly 300 full-service bank branches and almost 400 ATMs across a Gulf south corridor comprising South Mississippi; southern and central Alabama; southern Louisiana; the northern, central, and Panhandle regions of Florida; and Houston, Texas. Given the strong brand recognition of both Banks in their respective hometown markets, the Company will operate as Hancock Bank in Mississippi, Alabama and Florida, and Whitney Bank in Louisiana and Texas post systems conversion (currently scheduled for March 2012).
Hancock’s family of financial services companies also includes Hancock Investment Services, Inc., Hancock Insurance Agency and Whitney Insurance Agency, Inc., Harrison Finance Company, and corporate trust offices in Gulfport and Jackson, Miss., New Orleans and Baton Rouge, La., and Orlando, Fla.
1
Table of Contents
The Company’s operating strategy is to provide customers with the financial sophistication and breadth of products of a regional bank, while successfully retaining the local appeal and level of service of a community bank. The Banks offer a broad range of community banking services to commercial, small business and retail customers, providing a variety of transaction and savings deposit products, treasury management services, investment brokerage services, secured and unsecured loan products, including revolving credit facilities, and letters of credit and similar financial guarantees. The Banks also provide trust and investment management services to retirement plans, corporations and individuals. Through its subsidiaries, the Banks also offer personal and business lines of insurance and annuity products to its customers.
The main industries along the Gulf Coast are energy and related service industries, military and government-related facilities, educational and medical complexes, petrochemical industries, port facility activities and transportation and related industries, tourism and related service industries, and the gaming industry.
The Company will evaluate future acquisition transactions that can add value for its shareholders once the Whitney integration is completed. The first priority would be in-market expansion. However, the Company would also consider strategic opportunities in new markets such as Texas locations outside the Houston area and northern Alabama.
Recent acquisitions and internal growth have diversified revenue streams and enhanced core deposit funding. The Company’s size and scale has helped it attract and retain high quality associates. From a financial perspective, the recent Whitney acquisition is expected to be accretive from 2012 onward as cost savings are fully phased in. The Company is also focused on maintaining two hallmarks of its past culture -— strong capital and excellent credit quality.
At December 31, 2011, the Company had total assets of $19.8 billion and 4,745 employees on a full-time equivalent basis.
Additional information is available at www.hancockbank.com and www.whitneybank.com.
Loan Production and Credit Review
The Banks’ primary lending focus is to provide commercial, consumer, commercial leasing and real estate loans to consumers, to small and middle market businesses, and to corporate clients in their respective market areas. The Banks have no significant concentrations of loans to particular borrowers or industries or to any foreign entities. Designated relationship managers have approved loan authorities that can be utilized to approve credit commitments for a single borrowing relationship. The amount of designated authority is based upon the experience, skill, and training of the relationship manager. Certain types of loans are submitted for consideration by one of the Banks’ centralized underwriting units. Loans are underwritten to meet the credit underwriting standards and loan policies of the Banks and are subject to review by an internal quality assurance function.
Securities Portfolio
The Banks maintain portfolios of securities designed to provide a source of liquidity to fund loan demand and deposit outflows while maximizing interest income within pre-defined risk parameters. Therefore, the Banks invest only in high quality securities of investment grade quality and with a target effective duration, for the overall portfolio, generally between two to five years.
The Banks’ policies limit investments to securities having a rating of no less than “Baa”, or its equivalent by a Nationally Recognized Statistical Rating Agency, except for certain obligations of counties, parishes and municipalities in Mississippi, Louisiana, Florida or Alabama.
2
Table of Contents
Deposits
The Banks have several programs designed to attract depository accounts offered to consumers and to small and middle market businesses at interest rates generally consistent with market conditions. Additionally, the Banks operate approximately 400 ATMs at the Company’s banking offices and at other locations. As members of regional and international ATM networks such as “STAR”, “PLUS” and “CIRRUS”, the Banks offer customers access to their depository accounts from regional, national and international ATM facilities. Deposit flows are controlled by the Banks primarily through pricing, and to a certain extent, through promotional activities. Management believes that the rates it offers, which are posted weekly on deposit accounts, are generally competitive with other financial institutions in the Banks’ respective market areas.
Trust Services
The Banks, through their respective Trust Departments, offer a full range of trust services on a fee basis. In their trust capacities, the Banks provide investment management services on an agency basis and act as trustee for pension plans, profit sharing plans, corporate and municipal bond issues, living trusts, life insurance trusts and various other types of trusts created by or for individuals, businesses, charitable and religious organizations. As of December 31, 2011, the Trust Departments of the Banks had approximately $12.5 billion of assets under administration compared to $8.3 billion as of December 31, 2010. As of December 31, 2011, $9.3 billion of administered assets were corporate trust accounts and the remaining balances were personal, employee benefit, estate and other trust accounts.
COMPETITION
The deregulation of the financial services industry, the elimination of many previous distinctions between commercial banks and other financial institutions as well as legislation enacted in Mississippi, Louisiana and other states allowing state-wide branching, multi-bank holding companies and regional interstate banking have all served to foster a highly competitive environment for commercial banking in our market area. The principal competitive factors in the markets for deposits and loans are interest rates and fee structures associated with the various products offered. We also compete through the efficiency, quality, and range of services and products we provide, as well as the convenience provided by an extensive network of customer access channels including local branch offices, ATMs, online banking, and telebanking centers. In attracting deposits and in our lending activities, we generally compete with other commercial banks, savings associations, credit unions, mortgage banking firms, consumer finance companies, securities brokerage firms, mutual funds and insurance companies, and other financial institutions.
3
Table of Contents
SUPERVISION AND REGULATION
Bank Holding Company Regulation
General
The Company is subject to extensive regulation by the Board of Governors of the Federal Reserve System (the Federal Reserve) pursuant to the Bank Holding Company Act of 1956, as amended (the Bank Holding Company Act). On January 26, 2002 the Company qualified as a financial holding company, giving it broader powers as discussed below. The Company also is required to file certain reports with, and otherwise complies with the rules and regulations of, the Securities and Exchange Commission (the Commission) under federal securities laws.
Federal Regulation
The Bank Holding Company Act generally prohibits a corporation owning a bank from engaging in activities other than banking, managing or controlling banks or other permissible subsidiaries. Acquiring or obtaining control of more than 5% of the voting shares of any company engaged in activities other than those activities determined by the Federal Reserve to be so closely related to banking, managing or controlling banks as to be proper incident thereto is also prohibited. In determining whether a particular activity is permissible, the Federal Reserve considers whether the performance of the activity can reasonably be expected to produce benefits to the public that outweigh possible adverse effects. For example: making, acquiring or servicing loans; leasing personal property; providing certain investment or financial advice; performing certain data processing services; acting as agent or broker in selling credit life insurance, and performing certain insurance underwriting activities have all been determined by regulations of the Federal Reserve to be permissible activities. The Bank Holding Company Act does not place territorial limitations on permissible bank-related activities of bank holding companies. Despite prior approval, however, the Federal Reserve has the power to order a holding company or its subsidiaries to terminate any activity or its control of any subsidiary when it has reasonable cause to believe that continuation of such activity or control of such subsidiary constitutes a serious risk to the financial safety, soundness or stability of any bank subsidiary of that holding company.
The Bank Holding Company Act requires every bank holding company to obtain the prior approval of the Federal Reserve: (1) before it may acquire ownership or control of any voting shares of any bank if, after such acquisition, such bank holding company will own or control more than 5% of the voting shares of such bank, (2) before it or any of its subsidiaries other than a bank may acquire all of the assets of a bank, (3) before it may merge with any other bank holding company, or (4) before it may engage in permissible non-banking activities. In reviewing a proposed acquisition, the Federal Reserve considers financial, managerial and competitive aspects. The future prospects of the companies and banks concerned and the convenience and needs of the community to be served must also be considered. The Federal Reserve also reviews the indebtedness to be incurred by a bank holding company in connection with the proposed acquisition to ensure that the holding company can service such indebtedness without adversely affecting the capital requirements of the holding company or its subsidiaries. The Bank Holding Company Act further requires that consummation of approved bank holding company or bank acquisitions or mergers must be delayed for a period of not less than 15 or more than 30 days following the date of approval. During such 15 to 30-day period, complaining parties may obtain a review of the Federal Reserve’s order granting its approval by filing a petition in the appropriate United States Court of Appeals petitioning that the order be set aside.
On November 12, 1999, President Clinton signed into law the Gramm-Leach-Bliley Act of 1999 (the “Financial Services Modernization Act”). The Financial Services Modernization Act repealed the two affiliation provisions of the Glass-Steagall Act: Section 20, which restricted the affiliation of Federal Reserve Member Banks with firms “engaged principally” in specified securities activities; and Section 32, which restricts officer, director, or employee interlocks between a member bank and any company or person “primarily engaged” in specified securities activities. In addition, the Financial Services Modernization Act also contained provisions that expressly preempt any state law restricting the establishment of financial affiliations, primarily related to insurance. The general effect of the law was to establish a comprehensive framework to permit affiliations among qualified bank holding companies, commercial banks, insurance companies, securities firms, and other financial service providers by revising and expanding the Bank Holding Company Act framework to permit a holding company system to engage in a full range of financial activities through a new entity known as a Financial Holding Company.
4
Table of Contents
The Financial Services Modernization Act requires that each bank subsidiary of a financial holding company be well capitalized and well managed as determined by the subsidiary bank’s principal regulator. To be considered well managed, the bank must have received at least a satisfactory composite rating and a satisfactory management rating at its last examination. To be well capitalized, the bank must have a leverage capital ratio of 5%, a Tier 1 risk-based capital ratio of 6% and a total risk-based capital ratio of 10%. These ratios are discussed further below. In the event a financial holding company becomes aware that a subsidiary bank ceases to be well capitalized or well managed, it must notify the Federal Reserve and enter into an agreement to cure such condition. The consequences of a failure to cure such condition are that the Federal Reserve Board may order divestiture of the bank. Alternatively, a financial holding company may comply with such order by ceasing to engage in the financial holding company activities that are unrelated to banking or otherwise impermissible for a bank holding company.
The Federal Reserve has adopted capital adequacy guidelines for use in its examination and regulation of bank holding companies and financial holding companies. The regulatory capital of a bank holding company or financial holding company under applicable federal capital adequacy guidelines is particularly important in the Federal Reserve’s evaluation of a holding company and any applications by the bank holding company to the Federal Reserve. If regulatory capital falls below minimum guideline levels, a financial holding company may lose its status as a financial holding company and a bank holding company or bank may be denied approval to acquire or establish additional banks or non-bank businesses or to open additional facilities. In addition, a financial institution’s failure to meet minimum regulatory capital standards can lead to other penalties, including termination of deposit insurance or appointment of a conservator or receiver for the financial institution. There are two measures of regulatory capital presently applicable to bank holding companies: (1) risk-based capital and (2) leverage capital ratios.
The Federal Reserve rates bank holding companies by a component and composite 1-5 rating system that is confidential. This system is designed to help identify institutions, which require special attention. Financial institutions are assigned ratings based on evaluation and rating of their financial condition and operations. Components reviewed include capital adequacy, asset quality, management capability, the quality and level of earnings, the adequacy of liquidity and sensitivity to interest rate fluctuations.
The leverage ratios adopted by the Federal Reserve require all but the most highly rated bank holding companies to maintain Tier 1 Capital at 4% of total assets. Certain bank holding companies having a composite 1 rating and not experiencing or anticipating significant growth may satisfy the Federal Reserve guidelines by maintaining Tier 1 Capital of at least 3% of total assets reduced by deductions from Tier 1 capital discussed below. Tier 1 Capital for bank holding companies generally includes: common equity, retained earnings, non-controlling interest in equity accounts of consolidated subsidiaries and a limited amount of qualifying perpetual preferred stock. In addition, Tier 1 Capital excludes goodwill and other disallowed intangibles and disallowed deferred tax assets and certain other assets. The Company’s leverage capital ratio at December 31, 2011 was 8.17%.
The risk-based capital guidelines are designed to make regulatory capital requirements more sensitive to differences in risk profiles among banks and bank holding companies, to account for off-balance sheet exposure and to minimize disincentives for holding liquid assets. Under the risk-based capital guidelines, assets are assigned to one of four risk categories: 0%, 20% 50% and 100%. As an example, U.S. Treasury securities are assigned to the 0% risk category while most categories of loans are assigned to the 100% risk category. A two-step process determines the risk weight of off-balance sheet items such as standby letters of credit. First, the amount of the off-balance sheet item is multiplied by a credit conversion factor of either 0%, 20%, 50% or 100%. The result is then assigned to one of the four risk categories.
The primary component of risk-based capital is Tier 1 Capital, which was described above. Tier 2 Capital, which consists primarily of perpetual preferred stock not qualifying for Tier 1 Capital, mandatory convertible securities, certain types of subordinated debt and a limited amount of the allowances for loan losses, is a secondary component of risk-based capital. The risk-weighted asset base is equal to the sum of the aggregate dollar values of assets and off-balance sheet items in each risk category, multiplied by the weight assigned to that category. A ratio of Tier 1 Capital to risk-weighted assets of at least 4% and a ratio of Total Capital (Tier 1 and Tier 2) to risk-weighted assets of at least 8% must be maintained by bank holding companies. At December 31, 2011, the Company’s Tier 1 and Total Capital ratios were 11.48% and 13.59%, respectively.
5
Table of Contents
The prior approval of the Federal Reserve must be obtained before the Company may acquire substantially all the assets of any bank, or ownership or control of any voting shares of any bank, if, after such acquisition, it would own or control, directly or indirectly, more than 5% of the voting shares of such bank. In no case, however, may the Federal Reserve approve an acquisition of any bank located outside Mississippi unless such acquisition is specifically authorized by the laws of the state in which the bank to be acquired is located. The banking laws of Mississippi presently permit out-of-state banking organizations to acquire Mississippi banking organizations, provided the Mississippi banking organization has been operating for at least five years. In addition, Mississippi banking organizations were granted similar powers to acquire certain out-of-state financial institutions pursuant to the Interstate Bank Branching Act, which was adopted in 1994.
With the passage of The Interstate Banking and Branching Efficiency Act of 1994, adequately capitalized and managed bank holding companies are permitted to acquire control of banks in any state, subject to federal regulatory approval, without regard to whether such a transaction is prohibited by the laws of any state. Beginning June 1, 1997, federal banking regulators may approve merger transactions involving banks located in different states, without regard to laws of any state prohibiting such transactions; except that mergers may not be approved with respect to banks located in states that, before June 1, 1997, enacted legislation prohibiting mergers by banks located in such state with out-of-state institutions. Federal banking regulators may permit an out-of-state bank to open new branches in another state if such state has enacted legislation permitting interstate branching. The legislation further provides that a bank holding company may not, following an interstate acquisition, control more than 10% of nationwide insured deposits or 30% of deposits in the relevant state. States have the right to adopt legislation to lower the 30% limit. Additional provisions require that interstate activities conform to the Community Reinvestment Act.
The Company is required to give the Federal Reserve prior written notice of any purchase or redemption of its outstanding equity securities if the gross consideration for the purchase or redemption, when combined with the net consideration paid for all such purchases or redemptions during the preceding 12 months, is equal to 10% or more of the Company’s consolidated net worth. The Federal Reserve may disapprove such a transaction if it determines that the proposal constitutes an unsafe or unsound practice, would violate any law, regulation, Federal Reserve order or directive or any condition imposed by, or written agreement with, the Federal Reserve.
In November 1985, the Federal Reserve adopted its Policy Statement on Cash Dividends Not Fully Covered by Earnings (the Policy Statement). The Policy Statement sets forth various guidelines that the Federal Reserve believes that a bank holding company should follow in establishing its dividend policy. In general, the Federal Reserve stated that bank holding companies should pay dividends only out of current earnings. It also stated that dividends should not be paid unless the prospective rate of earnings retention by the holding company appears consistent with its capital needs, asset quality and overall financial condition.
The Company is a legal entity separate and distinct from the Banks. There are various restrictions that limit the ability of the Banks to finance, pay dividends or otherwise supply funds to the Company or other affiliates. In addition, subsidiary banks of holding companies are subject to certain restrictions on any extension of credit to the bank holding company or any of its subsidiaries, on investments in the stock or other securities thereof and on the taking of such stock or securities as collateral for loans to any borrower. Further, a bank holding company and its subsidiaries are prohibited from engaging in certain tie-in arrangements in connection with extensions of credit, or leases or sales of property or furnishing of services.
Bank Regulation
The operations of the Banks are subject to state and federal statutes applicable to state banks and the regulations of the Federal Reserve and the FDIC. The operation of the Banks may also be subject to applicable OCC regulation, to the extent states banks are granted parity with national banks. Such statutes and regulations relate to, among other things, required reserves, investments, loans, mergers and consolidations, issuance of securities, payment of dividends, establishment of branches and other aspects of the Banks’ operations.
6
Table of Contents
Hancock Bank is subject to regulation and periodic examinations by the FDIC and the State of Mississippi Department of Banking and Consumer Finance. Whitney Bank is subject to regulation and periodic examinations by the FDIC and the Office of Financial Institutions, State of Louisiana. These regulatory authorities examine such areas as reserves, loan and investment quality, management policies, procedures and practices and other aspects of operations. These examinations are designed for the protection of the Banks’ depositors, rather than their stockholders. In addition to these regular examinations, the Company and the Banks must furnish periodic reports to their respective regulatory authorities containing a full and accurate statement of their affairs.
The Company is required to file annual reports with the Federal Reserve Board, and such additional information as the Federal Reserve Board may require pursuant to the Bank Holding Company Act. The Federal Reserve Board may examine a bank holding company or any of its subsidiaries, and charge the company for the cost of such examination.
The Dodd-Frank Wall Street Reform and Consumer Protection Act (Dodd-Frank Act) has removed many limitations on the Federal Reserve Board’s authority to make examinations of banks that are subsidiaries of bank holding companies. Under the Dodd-Frank Act, the Federal Reserve Board will generally be permitted to examine bank holding companies and their subsidiaries, provided that the Federal Reserve Board must rely on reports submitted directly by the institution and examination reports of the appropriate regulators (such as the FDIC and the Banking Department) to the fullest extent possible; must provide reasonable notice to, and consult with, the appropriate regulators before commencing an examination of a bank holding company subsidiary; and, to the fullest extent possible, must avoid duplication of examination activities, reporting requirements, and requests for information.
As a result of the enactment of the Financial Institutions Reform, Recovery, and Enforcement Act of 1989 (FIRREA), a financial institution insured by the FDIC can be held liable for any losses incurred by, or reasonably expected to be incurred by, the FDIC in connection with (1) the default of a commonly controlled FDIC-insured financial institution or (2) any assistance provided by the FDIC to a commonly controlled financial institution in danger of default.
The Banks are members of the FDIC, and their deposits are insured as provided by law by the Deposit Insurance Fund, or the DIF. The deposits of the Banks are insured up to applicable limits and the Banks are subject to deposit insurance assessments to maintain the DIF. The FDIC utilizes a risk-based assessment system that imposes insurance premiums based upon a risk matrix that takes into account a bank’s capital level and supervisory rating.
Effective January 1, 2007, the FDIC began imposing deposit assessment rates based on the risk category of the bank, with Risk Category I being the lowest risk category and Risk Category IV being the highest risk category. Because of favorable loss experience and a healthy reserve ratio in the Bank Insurance Fund, or the BIF, of the FDIC, well-capitalized and well-managed banks, have in recent years paid minimal premiums for FDIC insurance.
The Dodd-Frank Act changed the method of calculation for FDIC insurance assessments. Under the previous system, the assessment base was domestic deposits minus a few allowable exclusions, such as pass-through reserve balances. Under the Dodd-Frank Act, assessments are to be calculated based on the depository institution’s average consolidated total assets, less its average amount of tangible equity. In addition to providing for the required change in assessment base, the FDIC’s final deposit insurance regulations implementing the Dodd-Frank provisions eliminated the assessment adjustments based on unsecured debt, secured liabilities, and brokered deposits; added a new adjustment for holding unsecured debt issued by another insured depository institution; and lowered the initial base assessment rate schedule in order to collect approximately the same amount of revenue under the new base as under the old base, among other changes.
Beginning April 1, 2011, the base assessment rates ranged from 5 to 35 basis points, with the initial assessment rates subject to adjustments which could increase or decrease the total base assessment rates. The adjustments included (1) a decrease for long-term unsecured debt, including most senior and subordinated debt and, for small institutions, a portion of Tier 1 capital; and (2) for non-Risk Category I institutions, an increase for brokered deposits above a threshold amount.
7
Table of Contents
The enactment of the Emergency Economic Stabilization Act of 2008 temporarily raised the basic limit on federal deposit insurance coverage from $100,000 to $250,000 per depositor. However, with the passage of the Dodd-Frank Act, this increase in the basic coverage limit has been made permanent.
On October 14, 2008, the FDIC announced the Temporary Liquidity Guarantee Program (“TLGP”). The final rule was adopted on November 21, 2008. The FDIC stated that its purpose was to strengthen confidence and encourage liquidity in the banking system by guaranteeing newly issued senior unsecured debt of 31 days or greater of banks, thrifts, and certain holding companies (the “Debt Guarantee Program”), and by providing full coverage of non-interest-bearing transaction accounts, as well as certain low-interest NOW accounts and IOLTA accounts, regardless of dollar amount (the “Transaction Account Guarantee Program”). Inclusion in the program was voluntary. Institutions participating in the Debt Guarantee Program are assessed fees based on a sliding scale, depending on length of maturity. Shorter-term debt has a lower fee structure and longer-term debt has a higher fee structure. The fee ranged from 50 basis points on debt of 180 days or less to a maximum of 100 basis points for debt with maturities of one year or longer, on an annualized basis. For institutions participating in the Transaction Account Guarantee Program, a 10-basis point surcharge was added to the institution’s current insurance assessment in order to fully cover all transaction accounts. The Banks did not elect to participate in the Debt Guaranty Program but did elect to participate in the Transaction Account Guarantee Program.
The Transaction Account Guarantee Program was set to expire on December 31, 2010. However, with the passage of the Dodd-Frank Act, the insurance coverage provided under the Transaction Account Guarantee Program has in effect been extended until December 31, 2012, with some changes. Perhaps the most significant differences between the current version of the Transaction Account Guarantee Program and the Dodd-Frank extension of the program are (i) that all banks are required to participate in the new coverage, with no opt-out available, (ii) that interest-bearing NOW accounts no longer benefit from the unlimited insurance coverage effective January 1, 2011 (although IOLTA accounts continue to benefit from the unlimited coverage) and (iii) that the surcharge was eliminated.
In addition, since the first quarter of 2000, all institutions with deposits insured by the FDIC have been required to pay assessments to fund interest payments on bonds issued by the Financing Corporation (“FICO”), a mixed-ownership government corporation established to recapitalize a predecessor to the Deposit Insurance Fund. The FICO assessment rate is adjusted quarterly to reflect changes in the assessment bases of the fund based on quarterly Call Report and Thrift Financial Report submissions. The current annualized assessment rate is 1.020 basis points, or approximately 0.255 basis points per quarter. These assessments will continue until the FICO bonds mature in 2017 through 2019.
The Federal Deposit Insurance Corporation Improvement Act of 1991 (FDICIA) subjects banks and bank holding companies to increased regulation and supervision, including a new regulatory emphasis linking supervision to bank capital levels. Also, federal banking regulators are required to take prompt regulatory action with respect to depository institutions that fall below specified capital levels and to draft non-capital regulatory measures to assure bank safety.
FDICIA contains a “prompt corrective action” section intended to resolve problem institutions at the least possible long-term cost to the deposit insurance funds. Pursuant to this section, the federal banking agencies are required to prescribe a leverage limit and a risk-based capital requirement indicating levels at which institutions will be deemed to be “well capitalized,” “adequately capitalized,” “undercapitalized,” “significantly undercapitalized” and “critically undercapitalized.” In the case of a depository institution that is “critically undercapitalized” (a term defined to include institutions which still have positive net worth); the federal banking regulators are generally required to appoint a conservator or receiver.
FDICIA further requires regulators to perform annual on-site bank examinations, places limits on real estate lending and tightens audit requirements. The new legislation eliminated the “too big to fail” doctrine, which protects uninsured deposits of large banks, and restricts the ability of undercapitalized banks to obtain extended loans from the Federal Reserve Board discount window. FDICIA also imposes new disclosure requirements relating to fees charged and interest paid on checking and deposit accounts. Most of the significant changes brought about by FDICIA required new regulations.
8
Table of Contents
In addition to regulating capital, the FDIC has broad authority to prevent the development or continuance of unsafe or unsound banking practices. Pursuant to this authority, the FDIC has adopted regulations that restrict preferential loans and loan amounts to “affiliates” and “insiders” of banks, require banks to keep information on loans to major stockholders and executive officers and bar certain director and officer interlocks between financial institutions. The FDIC is also authorized to approve mergers, consolidations and assumption of deposit liability transactions between insured banks and between insured banks and uninsured banks or institutions to prevent capital or surplus diminution in such transactions where the resulting, continuing or assumed bank is an insured nonmember state bank, like Hancock Bank and Whitney Bank.
Although Hancock Bank and Whitney Bank are not members of the Federal Reserve System, they are subject to Federal Reserve regulations that require the Banks to maintain reserves against transaction accounts (primarily checking accounts). Because reserves generally must be maintained in cash or in noninterest-bearing accounts, the effect of the reserve requirements is to increase the cost of funds for the Banks. The Federal Reserve regulations currently require that reserves be maintained against net transaction accounts in the amount of 3% of the aggregate of such accounts up to $71 million, or, if the aggregate of such accounts exceeds $71 million, 10% of the total in excess of $71 million. This regulation is subject to an exemption from reserve requirements on $11.5 million of an institution’s transaction accounts.
The Financial Services Modernization Act also permits national banks, and through state parity statutes, state banks, to engage in expanded activities through the formation of financial subsidiaries. A state bank may have a subsidiary engaged in any activity authorized for state banks directly or any financial activity, except for insurance underwriting, insurance investments, real estate investment or development, or merchant banking, each of which activity may only be conducted through a subsidiary of a Financial Holding Company. Financial activities include all activities permitted under new sections of the Bank Holding Company Act or permitted by regulation.
A state bank seeking to have a financial subsidiary, and each of its depository institution affiliates, must be “well-capitalized” and “well-managed.” The total assets of all financial subsidiaries may not exceed the lesser of 45% of a bank’s total assets, or $50 billion. A state bank must exclude from its assets and equity all equity investments, including retained earnings, in a financial subsidiary. The assets of the subsidiary may not be consolidated with the bank’s assets. The bank must also have policies and procedures to assess financial subsidiary risk and protect the bank from such risks and potential liabilities.
The Financial Services Modernization Act also includes a new section of the Federal Deposit Insurance Act governing subsidiaries of state banks that engage in “activities as principal that would only be permissible” for a national bank to conduct in a financial subsidiary. It expressly preserves the ability of a state bank to retain all existing subsidiaries. Because Mississippi permits commercial banks chartered by the state to engage in any activity permissible for national banks, the Bank will be permitted to form subsidiaries to engage in the activities authorized by the Financial Services Modernization Act. In order to form a financial subsidiary, a state bank must be well-capitalized, and the state bank would be subject to the same capital deduction, risk management and affiliate transaction rules as applicable to national banks.
In 2001, the USA Patriot Act was signed into law. The USA Patriot Act broadened the application of anti-money laundering regulations to apply to additional types of financial institutions, such as broker-dealers, and strengthened the ability of the U.S. Government to detect and prosecute international money laundering and the financing of terrorism. The principal provisions of Title III of the USA Patriot Act require that regulated financial institutions, including state member banks: (i) establish an anti-money laundering program that includes training and audit components; (ii) comply with regulations regarding the verification of the identity of any person seeking to open an account; (iii) take additional required precautions with non-U.S. owned accounts; and (iv) perform certain verification and certification of money laundering risk for their foreign correspondent banking relationships. The USA Patriot Act also expanded the conditions under which funds in a U.S. interbank account may be subject to forfeiture and increased the penalties for violation of anti-money laundering regulations. Failure of a financial institution to comply with the USA Patriot Act’s requirements could have serious legal and reputational consequences for the institution. The Bank has adopted policies, procedures and controls to address compliance with the requirements of the USA Patriot Act under the existing regulations and will continue to revise and update its policies, procedures and controls to reflect changes required by the USA Patriot Act and implementing regulations.
9
Table of Contents
In July 2002, Congress enacted the Sarbanes-Oxley Act of 2002, which addresses, among other issues, corporate governance, auditing and accounting, executive compensation, and enhanced and timely disclosure of corporate information. Section 404 of the Sarbanes-Oxley Act requires the Company to include in its Annual Report, a report stating management’s responsibility to establish and maintain adequate internal control over financial reporting and management’s conclusion on the effectiveness of the internal controls at year end. Additionally, the Company’s independent registered public accounting firm is required to attest to and report on management’s evaluation of internal control over financial reporting.
In October 2008, the Emergency Economic Stabilization Act of 2008 (“EESA”) was enacted. The EESA authorized the Treasury Department to purchase from financial institutions and their holding companies up to $700 billion in mortgage loans, mortgage-related securities and certain other financial instruments, including debt and equity securities issued by financial institutions and their holding companies in a troubled asset relief program (“TARP”). The purpose of TARP is to restore confidence and stability to the U.S. banking system and to encourage financial institutions to increase their lending to customers and to each other. The Treasury Department has allocated $250 billion towards the TARP Capital Purchase Program (“CPP”). Under the CPP, Treasury purchases debt or equity securities from participating institutions. The TARP also may include direct purchases or guarantees of troubled assets of financial institutions. Participants in the CPP are subject to executive compensation limits and are encouraged to expand their lending and mortgage loan modifications. On November 13, 2008, following a thorough evaluation and analysis, the Company announced it would decline the Treasury’s invitation to participate in the CPP. Whitney participated in the TARP program, but the preferred stock issued to Treasury was subsequently purchased and retired by Hancock in conjunction with the acquisition.
It is not clear at this time what impact the EESA, the TARP Capital Purchase Program, the Temporary Liquidity Guarantee Program, other liquidity and funding initiatives of the Federal Reserve and other agencies that have been previously announced, and any additional programs that may be initiated in the future, will have on the Company or the U.S. and global financial markets.
Recent Developments
The Congress, Treasury Department and the federal banking regulators, including the FDIC, have taken broad action since early September, 2008 to address volatility in the U.S. banking system, including the passage of EESA (discussed above), the provision of other direct and indirect assistance to financial institutions, assistance by the banking authorities in arranging acquisitions of weakened banks and broker-dealers, implementation of programs by the Federal Reserve Board to provide liquidity to the commercial paper markets and expansion of deposit insurance coverage. The new administration and Congress have pursued additional initiatives in an effort to stimulate the economy and stabilize the financial markets, including the enactment of the American Recovery and Reinvestment Act of 2010, and have altered the terms of some previously announced policies.
The enactment of the Dodd-Frank Act will likely result in increased regulation of the financial services industry. Provisions likely to affect the activities of the Company and the Banks include, without limitation, the following:
| • | Asset-based deposit insurance assessments. FDIC deposit insurance premium assessments will be based on bank assets rather than domestic deposits. |
| • | Deposit insurance limit increase. The deposit insurance coverage limit has been permanently increased from $100,000 to $250,000. |
| • | Extension of Transaction Account Guarantee Program. Unlimited deposit insurance coverage is extended for non-interest-bearing transaction accounts and certain other accounts for two years. This applies to all banks; there is no opt-in or opt-out requirement. |
10
Table of Contents
| • | Establishment of the Consumer Financial Protection Bureau (CFPB). The CFPB will be housed within the Federal Reserve and, in consultation with the Federal banking agencies, will make rules relating to consumer protection. The CFPB has the authority, should it wish to do so, to rewrite virtually all of the consumer protection regulations governing banks, including those implementing the Truth in Lending Act, the Real Estate Settlement Procedures Act (or RESPA), the Truth in Savings Act, the Electronic Funds Transfer Act, the Equal Credit Opportunity Act, the Home Mortgage Disclosure Act, the S.A.F.E. Mortgage Licensing Act, the Fair Credit Reporting Act (except Sections 615(e) and 628), the Fair Debt Collection Practices Act, and the Gramm-Leach-Bliley Act (sections 502 through 509 relating to privacy), among others. On January 4, 2012 President Obama named the first Director of the CFPB by way of recess appointment. |
| • | Risk-retention rule. Banks originating loans for sale on the secondary market or securitization must retain 5% of any loan they sell or securitize, except for mortgages that meet low-risk standards to be developed by regulators. |
| • | Limitation on federal preemption. Limitations have been imposed on the ability of national bank regulators to preempt state law. Formerly, the national bank and federal thrift regulators possessed preemption powers with regard to transactions, operating subsidiaries and attorney general civil enforcement authority. These preemption requirements have been limited by the Dodd-Frank Act, which will likely impact state banks by affecting activities previously permitted through parity with national banks. |
| • | Changes to regulation of bank holding companies. Under Dodd-Frank, bank holding companies must be well-capitalized and well-managed to engage in interstate transactions. In the past, only the subsidiary banks were required to meet those standards. The Federal Reserve Board’s “source of strength doctrine” has now been codified, mandating that bank holding companies such as the Company serve as a source of strength for their subsidiary banks, meaning that the bank holding company must be able to provide financial assistance in the event the subsidiary bank experiences financial distress. |
| • | Executive compensation limitations. The Dodd-Frank Act codified executive compensation limitations similar to those previously imposed on TARP recipients. |
The Dodd-Frank Act contains 16 different titles, is over 800 pages long, and calls for the completion of dozens of studies and reports and hundreds of new regulations. The information provided herein regarding the effect of the Dodd-Frank Act is intended merely for illustration and is not exhaustive, as the full impact of the legislation on banks and bank holding companies is still being studied and in any event cannot be fully known until the completion of new federal agency rulemakings over the next few years. Interested shareholders should refer directly to the Dodd-Frank Act itself for additional information.
The Dodd-Frank Act is one of a number of legislative initiatives that have been proposed in recent years due to the national and global financial crisis. It is not possible to predict whether any other similar legislation may be adopted that would significantly affect the operations and performance of the Company and the Banks.
Regulation E
On November 12, 2009, the Federal Reserve issued amendments to Regulation E which implements the Electronic Fund Transfer Act. The rules became effective on July 1, 2010 for new bank customers and August 16, 2010 for existing customers. These amendments prohibit banks from charging an overdraft fee for non-recurring debit card transactions (specifically, point-of-sale and ATM transactions) that overdraw a consumer’s account unless the consumer affirmatively consents, or “opts-in,” to the bank’s payment of overdrafts for those transactions. The Bank does not pay such transactions unless the consumer affirmatively elects, or “opts-in,” to have the Bank do so.
11
Table of Contents
Debit Interchange Fees
Effective June 29, 2011, the Federal Reserve issued a final rule to implement the “Durbin Amendment” to the Dodd-Frank Act of 2010. The rule included standards for assessing whether debit card interchange fees received by debit card issuers are reasonable and proportional to the costs incurred by issuers for electronic debit transactions. Interchange fees, or “swipe” fees, are charges that merchants pay to credit card companies and card-issuing banks like us for processing electronic payment transactions. Under the final rule, the maximum permissible interchange fee that an issuer may receive for an electronic debit transaction is the sum of 21 cents per transaction and 5 basis points multiplied by the value of the transaction. The rule further allows for an upward adjustment of 1 cent to the interchange fee if an issuer certifies that it has implemented policies and procedures reasonably designed to achieve the fraud-prevention standards set forth by the Federal Reserve.
In addition, the legislation prohibits card issuers and networks from entering into exclusive arrangements requiring that debit card transactions be processed on a single network or only two affiliated networks, and allows merchants to determine transaction routing. The limits that the Dodd-Frank Act and Federal Reserve rules place on debit interchange fees will significantly reduce our debit card interchange revenues. The rule became effective October 1, 2011. The initial phase of implementation reduced Hancock’s revenue by approximately $2.5 million in the fourth quarter of 2011. Hancock projects that, when fully implemented in 2012, the rule will cause a further revenue reduction of approximately $2.0 million per quarter.
Summary
The foregoing is a brief summary of certain statutes, rules and regulations affecting the Company and the Banks. It is not intended to be an exhaustive discussion of all the statutes and regulations having an impact on the operations of such entities.
It is not known whether the above acts and regulations will have any material effect on the Company’s operations. However, increased regulation will generally result in increased legal and compliance expense.
Finally, additional bills may be introduced in the future in the United States Congress and state legislatures to alter the structure, regulation and competitive relationships of financial institutions. It cannot be predicted whether and what form any of these proposals will be adopted or the extent to which the business of the Company and the Banks may be affected thereby.
Effect of Governmental Policies
The difference between the interest rate paid on deposits and other borrowings and the interest rate received on loans and securities comprise most of a bank’s earnings. In order to mitigate the interest rate risk inherent in the industry, the banking business is becoming increasingly dependent on the generation of fee and service charge revenue.
The earnings and growth of a bank will be affected by both general economic conditions and the monetary and fiscal policy of the United States Government and its agencies, particularly the Federal Reserve. The Federal Reserve sets national monetary policy such as seeking to curb inflation and combat recession. This is accomplished by its open-market operations in United States government securities, adjustments in the amount of reserves that financial institutions are required to maintain and adjustments to the discount rates on borrowings and target rates for federal funds transactions. The actions of the Federal Reserve in these areas influence the growth of bank loans, investments and deposits and also affect interest rates on loans and deposits. The nature and timing of any future changes in monetary policies and their potential impact on the Company cannot be predicted.
12
Table of Contents
| ITEM 1A. | RISK FACTORS |
We face a number of significant risks and uncertainties in connection with our operations. Our business, results of operations and financial condition could be materially adversely affected by the factors described below.
While we describe each risk separately, some of these risks are interrelated and certain risks could trigger the applicability of other risks described below. Also, the risks and uncertainties described below are not the only ones that we may face. Additional risks and uncertainties not presently known to us, or that we currently do not consider significant, could also potentially impair, and have a material adverse effect on, our business, results of operations and financial condition.
We may be vulnerable to certain sectors of the economy.
A substantial portion of our loan portfolio is secured by real estate. If the economy deteriorated and depressed real estate values beyond a certain point, the collateral value of the portfolio and the revenue stream from those loans could come under stress and possibly require additional provision to the allowance for loan losses. Our ability to dispose of foreclosed real estate at prices above the respective carrying values could also be impinged, causing additional losses.
Difficult market conditions have adversely affected the industry in which we operate.
The capital and credit markets have been experiencing volatility and disruption. Dramatic declines in the housing market, with falling home prices and increasing foreclosures, unemployment and under-employment, have negatively impacted the credit performance of mortgage loans and resulted in significant write-downs of asset values by financial institutions, including government-sponsored entities as well as major commercial and investment banks. These write-downs have caused many financial institutions to seek additional capital, to merge with larger and stronger institutions and, in some cases, to fail. Reflecting concern about the stability of the financial markets generally and the strength of counterparties, many lenders and institutional investors have reduced or ceased providing funding to borrowers, including to other financial institutions. This market turmoil and tightening of credit have led to an increased level of commercial and consumer delinquencies, lack of consumer confidence, increased market volatility and widespread reduction of business activity generally. A worsening of these conditions would likely exacerbate the adverse effects of these difficult market conditions on us and others in the financial institution industry. In particular, we may face the following risks in connection with these events:
| • | We may expect to face increased regulation of our industry, including as a result of the Emergency Economic Stabilization Act of 2008 (EESA) and the Dodd-Frank Act. Compliance with such regulation may increase our costs and limit our ability to pursue business opportunities. |
| • | Market developments and the resulting economic pressure on consumers may affect consumer confidence levels and may cause increases in delinquencies and default rates, which, among other effects, could affect our charge-offs and provision for loan losses. |
| • | Competition in the industry could intensify as a result of the increasing consolidation of financial services companies in connection with current market conditions. |
| • | The current market disruptions make valuation even more difficult and subjective, and our ability to measure the fair value of our assets could be adversely affected. If we determine that a significant portion of our assets have values that are significantly below their recorded carrying value, we could recognize a material charge to earnings in the quarter during which such determination was made, our capital ratios would be adversely affected and a rating agency might downgrade our credit rating or put us on credit watch. |
13
Table of Contents
There can be no assurance that the Emergency Economic Stabilization Act of 2008 will help stabilize the U.S. Financial System.
On October 3, 2008, the Emergency Economic Stabilization Act of 2008 (EESA) was signed into law in response to the current crisis in the financial sector. The U.S. Department of the Treasury and banking regulators implemented a number of programs under this legislation to address capital and liquidity issues in the banking system. There can be no assurance, however, as to the actual impact that the EESA will have on the financial markets, including the levels of volatility and limited credit availability currently being experienced. The failure of the EESA to help stabilize the financial markets and a continuation or worsening of current financial market conditions could materially and adversely affect our business, financial condition, results of operations, access to credit or the trading price of our common stock.
We are subject to a risk of rapid and significant changes in market interest rates.
Our assets and liabilities are primarily monetary in nature, and as a result, we are subject to significant risks tied to changes in interest rates. Our ability to operate profitably is largely dependent upon net interest income. In 2011, net interest income made up 72% of our revenue. Unexpected movement in interest rates markedly changing the slope of the current yield curve could cause our net interest margins to decrease, subsequently decreasing net interest income. In addition, such changes could adversely affect the valuation of our assets and liabilities.
At present, our one-year interest rate sensitivity position is asset sensitive, such that a gradual increase in interest rates during the next twelve months should have a positive impact on net interest income during that period. However, as with most financial institutions, our results of operations are affected by changes in interest rates and our ability to manage this risk. The difference between interest rates charged on interest-earning assets and interest rates paid on interest-bearing liabilities may be affected by changes in market interest rates, changes in relationships between interest rate indices, and/or changes in the relationships between long-term and short-term market interest rates. A change in this difference might result in an increase in interest expense relative to interest income, or a decrease in our interest rate spread.
Certain changes in interest rates, inflation, deflation, or the financial markets could affect demand for our products and our ability to deliver products efficiently.
Loan originations, and potentially loan revenues, could be adversely impacted by sharply rising interest rates. Conversely, sharply falling rates could increase prepayments within our securities portfolio lowering interest earnings from those investments. An underperforming stock market could reduce brokerage transactions, therefore reducing investment brokerage revenues; in addition, wealth management fees associated with managed securities portfolios could also be adversely affected. An unanticipated increase in inflation could cause our operating costs related to salaries and benefits, technology, and supplies to increase at a faster pace than revenues.
The fair market value of our securities portfolio and the investment income from these securities also fluctuate depending on general economic and market conditions. In addition, actual net investment income and/or cash flows from investments that carry prepayment risk, such as mortgage-backed and other asset-backed securities, may differ from those anticipated at the time of investment as a result of interest rate fluctuations.
Changes in the policies of monetary authorities and other government action could adversely affect our profitability.
The results of operations are affected by credit policies of monetary authorities, particularly the Federal Reserve Board. The instruments of monetary policy employed by the Federal Reserve Board include open market operations in U.S. government securities, changes in the discount rate or the federal funds rate on bank borrowings and changes in reserve requirements against bank deposits. In view of changing conditions in the national economy and in the money markets, we cannot predict the potential impact of future changes in interest rates, deposit levels, loan demand on our business and earnings. Furthermore, the actions of the United States government and other governments may result in currency fluctuations, exchange controls, market disruption and other adverse effects.
14
Table of Contents
Natural disasters could affect our ability to operate.
Our market areas are susceptible to hurricanes. Natural disasters, such as hurricanes, can disrupt our operations, result in damage to properties and negatively affect the local economies in which we operate.
We cannot predict whether or to what extent damage caused by future hurricanes will affect our operations or the economies in our market areas, but such weather events could cause a decline in loan originations, a decline in the value or destruction of properties securing the loans and an increase in the risk of delinquencies, foreclosures or loan losses.
Greater loan losses than expected may adversely affect our earnings.
We, as lenders, are exposed to the risk that our customers will be unable to repay their loans in accordance with their terms and that any collateral securing the payment of their loans may not be sufficient to assure repayment. Credit losses are inherent in the business of making loans and could have a material adverse effect on our operating results. Our credit risk with respect to our real estate and construction loan portfolio will relate principally to the creditworthiness of corporations and the value of the real estate serving as security for the repayment of loans. Our credit risk with respect to our commercial and consumer loan portfolio will relate principally to the general creditworthiness of businesses and individuals within our local markets.
We make various assumptions and judgments about the collectability of our loan portfolio and provide an allowance for estimated loan losses based on a number of factors. We believe that our current allowance for loan losses is adequate. However, if our assumptions or judgments prove to be incorrect, the allowance for loan losses may not be sufficient to cover actual loan losses. We may have to increase our allowance in the future in response to the request of one of our primary banking regulators, to adjust for changing conditions and assumptions, or as a result of any deterioration in the quality of our loan portfolio. The actual amount of future provisions for loan losses cannot be determined at this time and may vary from the amounts of past provisions.
The projected benefit obligations of our pension plan exceed the fair value of the Plan’s assets.
Investments in the portfolio of our pension plan may not provide adequate returns to fully fund benefits as they come due, thus causing higher annual plan expenses and requiring additional contributions by us.
We may need to rely on the financial markets to provide needed capital.
Our stock is listed and traded on the NASDAQ Global Select. Although we anticipate that our capital resources will be adequate for the foreseeable future to meet our capital requirements, at times we may depend on the liquidity of the NASDAQ market to raise equity capital. If the market should fail to operate, or if conditions in the capital markets are adverse, we may be constrained in raising capital. We maintain a consistent analyst following; therefore, downgrades in our prospects by an analyst(s) may cause our stock price to fall and significantly limit our ability to access the markets for additional capital requirements. Should these risks materialize, our ability to further expand our operations through internal growth may be limited.
Sales of a significant number of shares of our Common Stock in the public markets, or the perception of such sales, could depress the market price of our Common Stock.
Sales of a substantial number of shares of our Common Stock in the public markets and the availability of those shares for sale could adversely affect the market price of our Common Stock. In addition, future issuances of equity securities, including pursuant to outstanding options, could dilute the interests of our existing stockholders, including you, and could cause the market price of our Common Stock to decline. We may issue such additional equity or convertible securities to raise additional capital. The issuance of any additional shares of common or preferred stock could be substantially dilutive to shareholders of our Common Stock. Moreover, to the extent that we issue restricted stock units, phantom shares, stock appreciation rights, options or warrants to purchase our Common Stock in the future and those stock appreciation rights, options or warrants are exercised or as the restricted stock units vest, our shareholders may experience further dilution.
15
Table of Contents
Holders of our shares of Common Stock have no preemptive rights that entitle holders to purchase their pro rata share of any offering of shares of any class or series and, therefore, such sales or offerings could result in increased dilution to our shareholders. We cannot predict the effect that future sales of our Common Stock would have on the market price of our Common Stock.
We may invest or spend the proceeds in stock offerings in ways with which you may not agree and in ways that may not earn a profit.
We intend to use the proceeds of offerings for general corporate purposes, including for possible acquisition opportunities that may become available or to establish de novo branches. There can be no assurances that suitable acquisition opportunities may become available, or that we will be able to successfully complete any such acquisitions. We may use the proceeds only to focus on sustaining our organic, or internal, growth, or for other purposes. In addition, we may choose to use all or a portion of the proceeds to support our capital. We retain broad discretion over the use of the proceeds from offerings and may use them for purposes other than those contemplated at the time of this offering. You may not agree with the ways we decide to use proceeds, and our use of the proceeds may not yield any profits.
We engage in acquisitions of other businesses from time to time, including FDIC-assisted acquisitions. These acquisitions may not produce revenue or earnings enhancements or cost savings at levels or within timeframes originally anticipated and may result in unforeseen integration difficulties.
On occasion, we will engage in acquisitions of other businesses, such as the acquisition of Whitney Holding Corporation completed on June 4, 2011. Difficulty in integrating an acquired business or company may cause us not to realize expected revenue increases, cost savings, increases in geographic or product presence, or other anticipated benefits from any acquisition. The integration could result in higher than expected deposit attrition (run-off), loss of key employees, disruption of our business or the business of the acquired company, or otherwise adversely affect our ability to maintain relationships with customers and employees or achieve the anticipated benefits of the acquisition. We are likely to need to make additional investment in equipment and personnel to manage higher asset levels and loan balances as a result of any significant acquisition, which may adversely impact our earnings. Also, the negative effect of any divestitures required by regulatory authorities in acquisitions or business combinations may be greater than expected.
In evaluating potential acquisition opportunities we may seek to acquire failed banks through FDIC-assisted transactions. While the FDIC may, in such transactions, provide assistance to mitigate certain risks, such as sharing in exposure to loan losses, and providing indemnification against certain liabilities, of the failed institution, we may not be able to accurately estimate our potential exposure to loan losses and other potential liabilities, or the difficulty of integration, in acquiring such institution.
Depending on the condition of any institution that we may acquire, any acquisition may, at least in the near term, adversely affect our capital earnings and, if not successfully integrated following the acquisition, may continue to have such effects.
We may fail to realize the anticipated cost savings and other financial benefits of the Hancock/Whitney merger on the anticipated schedule, if at all.
We may face significant challenges in integrating Whitney Holding Corporation operations in our operations in a timely and efficient manner and in retaining Whitney personnel. Achieving the anticipated cost savings and financial benefits of the merger will depend on part on whether we integrate Whitney’s businesses in an efficient and effective manner. We may not be able to accomplish this integration process smoothly or successfully. In addition, the integration of certain operations will require the dedication of significant management resources, which may temporarily distract management’s attention from the day-to-day business of the combined company. Any inability to realize the full extent of, or any of, the anticipated cost savings and financial benefits of the merger, as well as any delays encountered in the integration process, could have an adverse effect on the business and results of operations of the combined company, which may affect the market price of Hancock common stock.
16
Table of Contents
Our growth and financial performance may be negatively impacted if we are unable to successfully execute our growth plans.
There can be no assurances that we will be successful in continuing our organic, or internal, growth, which depends upon economic conditions, our ability to identify appropriate markets for expansion, our ability to recruit and retain qualified personnel, our ability to fund growth at a reasonable cost, sufficient capital to support our growth initiatives, competitive factors, banking laws, and other factors.
We may seek to supplement our internal growth through acquisitions. We cannot predict the number, size or timing of acquisitions, or whether any such acquisition will occur at all. Our acquisition efforts have traditionally focused on targeted banking or insurance entities in markets in which we currently operate and markets in which we believe we can compete effectively. However, as consolidation of the financial services industry continues, the competition for suitable acquisition candidates may increase. We may compete with other financial services companies for acquisition opportunities, and many of these competitors have greater financial resources than we do and may be able to pay more for an acquisition than we are able or willing to pay. We also may need additional debt or equity financing in the future to fund acquisitions. We may not be able to obtain additional financing or, if available, it may not be in amounts and on terms acceptable to us. If we are unable to locate suitable acquisition candidates willing to sell on terms acceptable to us, or we are otherwise unable to obtain additional debt or equity financing necessary for us to continue making acquisitions, we would be required to find other methods to grow our business and we may not grow at the same rate we have in the past, or at all.
We must generally receive federal regulatory approval before we can acquire a bank or bank holding company. In determining whether to approve a proposed bank acquisition, federal bank regulators will consider, among other factors, the effect of the acquisition on the competition, financial condition, and future prospects. The regulators also review current and projected capital ratios and levels, the competence, experience, and integrity of management and its record of compliance with laws and regulations, the convenience and needs of the communities to be served (including the acquiring institution’s record of compliance under the Community Reinvestment Act) and the effectiveness of the acquiring institution in combating money laundering activities. We cannot be certain when or if, or on what terms and conditions, any required regulatory approvals will be granted. We may also be required to sell banks or branches as a condition to receiving regulatory approval, which condition may not be acceptable to us or, if acceptable to us, may reduce the benefit of any acquisition.
In addition to the acquisition of existing financial institutions, as opportunities arise we plan to continue de novo branching as a part of our internal growth strategy and possibly entry into new markets through de novo branching. De novo branching and any acquisition carries with it numerous risks, including the following:
| • | the inability to obtain all required regulatory approvals; |
| • | significant costs and anticipated operating losses associated with establishing a de novo branch or a new bank; |
| • | the inability to secure the services of qualified senior management; |
| • | the local market may not accept the services of a new bank owned and managed by a bank holding company headquartered outside of the market area of the new bank; |
| • | economic downturns in the new market; |
| • | the inability to obtain attractive locations within a new market at a reasonable cost; and |
| • | the additional strain on management resources and internal systems and controls. |
We have experienced to some extent many of these risks with our de novo branching to date.
17
Table of Contents
We are subject to regulation by various Federal and State entities.
We are subject to the regulations of the Securities and Exchange Commission (“SEC”), the Federal Reserve Board, the Federal Deposit Insurance Corporation, the Mississippi Department of Banking and Consumer Finance, the Louisiana Office of Financial Institutions and the Mississippi Department of Insurance. New regulations issued by these agencies may adversely affect our ability to carry on our business activities. We are subject to various Federal and State laws and certain changes in these laws and regulations may adversely affect our operations. Noncompliance with certain of these regulations may impact our business plans, including ability to branch, offer certain products, or execute existing or planned business strategies.
We are also subject to the accounting rules and regulations of the SEC and the Financial Accounting Standards Board. Changes in accounting rules could adversely affect the reported financial statements or our results of operations and may also require extraordinary efforts or additional costs to implement. Any of these laws or regulations may be modified or changed from time to time, and we cannot be assured that such modifications or changes will not adversely affect us.
We are subject to industry competition which may have an impact upon our success.
Our profitability depends on our ability to compete successfully. We operate in a highly competitive financial services environment. Certain competitors are larger and may have more resources than we do. We face competition in our regional market areas from other commercial banks, savings and loan associations, credit unions, internet banks, finance companies, mutual funds, insurance companies, brokerage and investment banking firms, and other financial intermediaries that offer similar services. Some of our nonbank competitors are not subject to the same extensive regulations that govern us or the Bank and may have greater flexibility in competing for business.
Another competitive factor is that the financial services market, including banking services, is undergoing rapid changes with frequent introductions of new technology-driven products and services. Our future success may depend, in part, on our ability to use technology competitively to provide products and services that provide convenience to customers and create additional efficiencies in our operations.
We may issue debt and equity securities or securities convertible into equity securities, any of which may be senior to our Common Stock as to distributions and in liquidation, which could negatively affect the value of our Common Stock.
In the future, we may attempt to increase our capital resources by entering into debt or debt-like financing that is unsecured or secured by all or up to all of our assets, or by issuing additional debt or equity securities, which could include issuances of secured or unsecured commercial paper, medium-term notes, senior notes, subordinated notes, preferred stock or securities convertible into or exchangeable for equity securities. In the event of our liquidation, our lenders and holders of our debt and preferred securities would receive a distribution of our available assets before distributions to the holders of our Common Stock. Because our decision to incur debt and issue securities in our future offerings will depend on market conditions and other factors beyond our control, we cannot predict or estimate the amount, timing or nature of our future offerings and debt financings. Further, market conditions could require us to accept less favorable terms for the issuance of our securities in the future.
Our ability to deliver and pay dividends depends primarily upon the results of operations of our subsidiaries.
We are a bank holding company that conducts substantially all of our operations through our subsidiary Banks. As a result, our ability to make dividend payments on our Common Stock will depend primarily upon the receipt of dividends and other distributions from our subsidiaries.
The ability of the Banks to pay dividends or make other payments to us is limited by their obligations to maintain sufficient capital and by other general regulatory restrictions on their dividends. If these requirements are not satisfied, we will be unable to pay dividends on our Common Stock.
18
Table of Contents
Cash available to pay dividends to our shareholders is derived primarily, if not entirely, from dividends paid to us from the Banks. The ability of our subsidiary banks to pay dividends to us as well as our ability to pay dividends to our shareholders is limited by regulatory and legal restrictions and the need to maintain sufficient consolidated capital. We may also decide to limit the payment of dividends even when we have the legal ability to pay them in order to retain earnings for use in our business. There can be no assurance of whether or when we may pay dividends in the future.
We and/or the holders of our securities could be adversely affected by unfavorable rating actions from rating agencies.
Our ability to access the capital markets is important to our overall funding profile. This access is affected by the ratings assigned by rating agencies to us, certain of our affiliates and particular classes of securities that we and our affiliates issue. The interest rates that we pay on our securities are also influenced by, among other things, the credit ratings that we, our affiliates and/or our securities receive from recognized rating agencies. A downgrade to us, our affiliates or our securities could create obligations or liabilities to us under the terms of our outstanding securities that could increase our costs or otherwise have a negative effect on our results of operations or financial condition. Additionally, a downgrade of the credit rating of any particular security issued by us or our affiliates could negatively affect the ability of the holders of that security to sell the securities and the prices at which any such securities may be sold.
Anti-takeover provisions in our amended articles of incorporation and bylaws, Mississippi law, and our Shareholder Rights Plan could make a third party acquisition of us difficult and may adversely affect share value.
Our amended articles of incorporation and bylaws contain provisions that make it more difficult for a third party to acquire us (even if doing so might be beneficial to our stockholders) and for holders of our securities to receive any related takeover premium for their securities. In addition, under our Shareholder Rights Plan, “rights” are issued to all Hancock common shareholders that, if activated upon an attempted unfriendly acquisition, would allow our shareholders to buy our common stock at a reduced price, thereby minimizing the risk of any potential hostile takeover.
We are also subject to certain provisions of state and federal law and our articles of incorporation may make it more difficult for someone to acquire control of us. Under federal law, subject to certain exemptions, a person, entity, or group must notify the federal banking agencies before acquiring 10% or more of the outstanding voting stock of a bank holding company, including our shares. Banking agencies review the acquisition to determine if it will result in a change of control. The banking agencies have 60 days to act on the notice, and take into account several factors, including the resources of the acquirer and the antitrust effects of the acquisition. There also are Mississippi statutory provisions and provisions in our articles of incorporation that may be used to delay or block a takeover attempt. As a result, these statutory provisions and provisions in our articles of incorporation could result in our being less attractive to a potential acquirer and limit the price that investors might be willing to pay in the future for shares of our common stock.
Governmental responses to recent market disruptions may be inadequate and may have unintended consequences.
In response to recent market disruptions, legislators and financial regulators have taken a number of steps to stabilize the financial markets. These steps include the enactment and partial implementation of the Emergency Economic Stabilization Act of 2008, the provision of other direct and indirect assistance to financial institutions, assistance by the banking authorities in arranging acquisitions of weakened banks and broker-dealers, implementation of programs by the Federal Reserve Board to provide liquidity to the commercial paper markets and expansion of deposit insurance coverage. The administration and Congress have pursued additional initiatives in an effort to stimulate the economy and stabilize the financial markets, including the enactment of the American Recovery and Reinvestment Act of 2010, and have altered the terms of some previously announced policies.
19
Table of Contents
President Obama signed into law the Dodd-Frank Act, which provides for sweeping changes to financial sector regulation and oversight, including new substantive authorities and practices in government regulation and supervision, and a restructuring of the regulatory system, including the creation of new federal agencies, offices, and councils. See “Recent Developments” under “SUPERVISION AND REGULATION” above.
The overall effects of these and other legislative and regulatory efforts on the financial markets are uncertain. Should these or other legislative or regulatory initiatives fail to stabilize the financial markets, the Company’s business, financial condition, results of operations, and prospects could be materially and adversely affected. Moreover, the implementation of the Dodd-Frank Act will likely result in significant changes to the banking industry as a whole which, depending on how its provisions are implemented by the agencies, could adversely affect the Company’s business.
In addition, the Company competes with a number of financial services companies that are not subject to the same degree of regulatory oversight to which the Company is subject. The impact of the existing regulatory framework and any future changes to it could negatively affect the Company’s ability to compete with these institutions, which could have a material and adverse effect on the Company’s results of operations and prospects.
The FDIC has increased insurance premiums to rebuild and maintain the Federal Deposit Insurance Fund.
In December 2008 the FDIC adopted a restoration plan designed to replenish the Deposit Insurance Fund over a period of five years and to increase the deposit insurance reserve ratio, which had decreased to 1.01% of insured deposits on June 30, 2008, to the statutory minimum of 1.15% of insured deposits by December 31, 2013. In order to implement the restoration plan, the FDIC changed both its risk-based assessment system and its base assessment rates.
The Dodd-Frank Act changed the method of calculation for FDIC insurance assessments. Under the previous system, the assessment base was domestic deposits minus a few allowable exclusions, such as pass-through reserve balances. Under the Dodd-Frank Act, assessments are to be calculated based on the depository institution’s average consolidated total assets, less its average amount of tangible equity. For more information regarding the implementation of the Dodd-Frank Act provisions, see the section on “Bank Regulation” in the earlier discussion of “Supervision and Regulation” in Item 1.
| ITEM 1B. | UNRESOLVED STAFF COMMENTS |
None.
| ITEM 2. | PROPERTIES |
The Company’s main office, which is the holding company and Hancock Bank headquarters, is located at One Hancock Plaza, in Gulfport, Mississippi. The Whitney Bank main office is located in downtown New Orleans, Louisiana. The Banks make portions of its main office facilities and certain other facilities available for lease to third parties, although such incidental leasing activity is not material to the Company’s overall operations.
The Company operates over 300 full service banking and financial services offices and almost 400 automated teller machines across south Mississippi, Louisiana, South Alabama, Florida and Texas. The Company owns approximately 41% of these facilities, and the remaining banking facilities are subject to leases, each of which management considers reasonable and appropriate for its location. Management ensures that all properties, whether owned or leased, are maintained in suitable condition. Management also evaluates its banking facilities on an ongoing basis to identify possible under-utilization and to determine the need for functional improvements, relocations, or possible sales.
The Banks and subsidiaries of the Banks hold a variety of property interests acquired through the years in settlement of loans.
20
Table of Contents
| ITEM 3. | LEGAL PROCEEDINGS |
On January 7, 2011, a shareholder of Whitney filed a lawsuit in the Civil District Court for the Parish of Orleans of the State of Louisiana captioned De LaPouyade v. Whitney Holding Corporation, et al., No. 11-189, naming Whitney and members of Whitney’s board of directors as defendants. This lawsuit is purportedly brought on behalf of a putative class of Whitney’s common shareholders and seeks a declaration that it is properly maintainable as a class action. The lawsuit alleges that Whitney’s directors breached their fiduciary duties and/or violated Louisiana state law and that Whitney aided and abetted those alleged breaches of fiduciary duty by, among other things, (a) agreeing to consideration that undervalues Whitney, (b) agreeing to deal protection devices that preclude a fair sales process, (c) engaging in self-dealing, and (d) failing to protect against conflicts of interest. Among other relief, the plaintiff sought to enjoin the merger. The parties have reached a settlement in principle.
On February 17, 2011, a complaint in intervention was filed by the Louisiana Municipal Police Employees Retirement System (“MPERS”) in the De LaPouyade case. The MPERS complaint is substantially identical to and seeks to join in the De LaPouyade complaint. The parties have reached a settlement in principle.
On February 7, 2011, another putative shareholder class action lawsuit, Realistic Partners v. Whitney Holding Corporation, et al., Case No. 2:11-cv-00256, was filed in the United States District Court for the Eastern District of Louisiana against Whitney, members of Whitney’s board of directors, and Hancock asserting violations of Section 14(a) of the Securities Exchange Act of 1934, breach of fiduciary duty under Louisiana state law, and aiding and abetting breach of fiduciary duty by, among other things, (a) making material misstatements or omissions in the proxy statement, (b) agreeing to consideration that undervalues Whitney, (c) agreeing to deal protection devices that preclude a fair sales process, (d) engaging in self-dealing, and (e) failing to protect against conflicts of interest. Among other relief, the plaintiff sought to enjoin the merger. On February 24, 2011, the plaintiff moved for class certification. The parties have reached a settlement in principle.
On April 11, 2011, another putative shareholder class action lawsuit, Jane Doe v. Whitney Holding Corporation, et al., Case No. 2:11-cv-00794-ILRL-JCW, was filed in the United States District Court for the Eastern District of Louisiana against Whitney, members of Whitney’s board of directors, and the defendants’ insurance carrier asserting breach of fiduciary duty under Louisiana state law by, among other things, (a) agreeing to consideration that undervalues Whitney, (b) agreeing to deal protection devices that preclude a fair sales process, (c) engaging in self-dealing, and (d) failing to protect against conflicts of interest. Among other relief, the plaintiff sought to enjoin the merger. On April 20, 2011, this case was consolidated with the Realistic Partners case. The parties have reached a settlement in principle.
Whitney Bank is a defendant in a class action lawsuit (Angelique LaCour v. Whitney Bank, D. (M.D. Fla.)) alleging that it improperly assessed overdraft fees on consumer and business deposit accounts owned by persons and entities that maintained those accounts, within the class period, at Whitney National Bank, or any of the entities that it acquired during the class period before its merger with Hancock Bank of Louisiana, due to the order in which it posted or processed debit card transactions against such deposit accounts. Plaintiff alleges that these posting practices resulted in excessive overdraft fees being imposed by the Company. While the Company admits no wrong doing, in order to fully and finally resolve the litigation and avoid the significant costs and expenses that would be involved in defending the case as well as the distraction caused by the litigation, Whitney Bank has entered into an agreement in principal whereby Whitney would pay the sum of $6.8 million in exchange for a full and complete release of all claims brought in the pending action. The proposed settlement is contingent on several factors, including final court approval and sufficient class participation. The Company establishes a liability for contingent litigation losses for any legal matter when payments associated with the claims become probable and the costs can be reasonably estimated. The Company accrued for the proposed settlement in the 4th quarter of 2011.
The Company is party to various other legal proceedings arising in the ordinary course of business. Based on current knowledge, management does not believe that loss contingencies, if any, arising from other pending litigation and regulatory matters, including the litigation matters described above, will have a material adverse effect on the consolidated financial position or liquidity of the Company.
| ITEM 4. | MINE SAFETY DISCLOSURES |
Not applicable.
21
Table of Contents
| ITEM 5. | MARKET FOR THE REGISTRANT’S COMMON EQUITY, RELATED STOCKHOLDER MATTERS AND ISSUER PURCHASES OF EQUITY SECURITIES |
Market Information
The Company’s common stock trades on the NASDAQ Global Select Market under the ticker symbol “HBHC”. The following table sets forth the high and low sale prices of the Company’s common stock as reported on the NASDAQ Global Select Market. These prices do not reflect retail mark-ups, mark-downs or commissions.
| High Sale |
Low Sale |
Cash Dividends Paid |
||||||||||
| 2011 |
||||||||||||
| 4th quarter |
$ | 33.72 | $ | 25.38 | $ | 0.24 | ||||||
| 3rd quarter |
33.25 | 25.61 | 0.24 | |||||||||
| 2nd quarter |
34.57 | 30.04 | 0.24 | |||||||||
| 1st quarter |
35.68 | 30.67 | 0.24 | |||||||||
| 2010 |
||||||||||||
| 4th quarter |
$ | 37.26 | $ | 28.88 | $ | 0.24 | ||||||
| 3rd quarter |
35.40 | 26.82 | 0.24 | |||||||||
| 2nd quarter |
43.90 | 33.27 | 0.24 | |||||||||
| 1st quarter |
45.86 | 38.23 | 0.24 | |||||||||
There were 10,814 registered shareholders and approximately 42,000 beneficial holders of the Company’s common stock at February 1, 2012 and 84,749,038 shares outstanding. On February 1, 2012, the high and low sale prices of the Company’s common stock as reported on the NASDAQ Global Select Market were $34.22 and $33.33, respectively.
The principal source of funds to the Company to pay cash dividends is the dividends received from Hancock Bank, Gulfport, Mississippi, and Whitney Bank, New Orleans, Louisiana. Consequently, dividends are dependent upon earnings, capital needs, regulatory policies and statutory limitations affecting the banks. Federal and state banking laws and regulations restrict the amount of dividends and loans a bank may make to its parent company. Dividends paid to the Company by Hancock Bank are subject to approval by the Commissioner of Banking and Consumer Finance of the State of Mississippi and those paid by Whitney Bank are subject to approval by the Commissioner for Financial Institutions of the State of Louisiana. The Company’s management does not expect regulatory restrictions to affect its policy of paying cash dividends. Although no assurance can be given that Hancock Holding Company will continue to declare and pay regular quarterly cash dividends on its common stock, the Company has paid regular cash dividends since 1937.
22
Table of Contents
Stock Performance Graph
The following performance graph and related information shall not be deemed “soliciting material” or to be “filed” with the SEC, nor shall such information be incorporated by reference into any future filings under the Securities Act of 1933 or the Securities Exchange Act of 1934, each as amended, except to the extent the Company specifically incorporates it by reference into such filing.
The performance graph compares the cumulative five-year shareholder return on the Company’s common stock, assuming an investment of $100 on December 31, 2006 and the reinvestment of dividends thereafter, to that of the common stocks of United States companies reported in the Nasdaq Total Return Index and the common stocks of the KBW Regional Banks Total Return Index. The KBW Regional Banks Total Return Index is a proprietary stock index of Keefe, Bruyette & Woods, Inc., that tracks the returns of 50 regional banking companies throughout the United States.
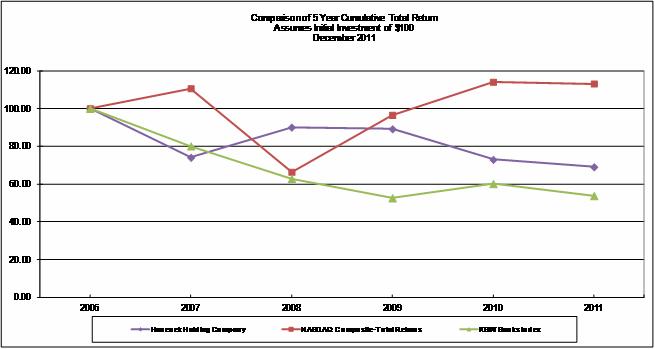
Issuer Purchases of Equity Securities
There are a maximum of 2,982,700 shares that may be purchased under the buy-back program approved in 2007. No shares were purchased by the issuer or any affiliated purchaser in 2011.
Equity Compensation Plan Information
| Plan Category |
Number of securities
to be issued upon exercise of outstanding options, warrants and rights (a) |
Weighted-average exercise price of outstanding options, warrants and rights (b) |
Number of securities
remaining available for future issuance under equity compensation plans (excluding securities reflected in column (a)) (c) |
|||||||||
| Equity compensation plans approved by security holders |
1,059,436 | $ | 37.93 | 4,384,108 | ||||||||
| Equity compensation plans not approved by security holders |
— | — | — | |||||||||
| Total |
1,059,436 | $ | 37.93 | 4,384,108 | ||||||||
| (1) | The total shown in column (a) does not include securities to be issued upon the exercise of options that were assumed by the Company in the acquisition of Whitney Holding Corporation. At December 31, 2011, 403,319 Whitney options were outstanding with a weighted-average exercise price of $61.83. |
23
Table of Contents
| ITEM 6. | SELECTED FINANCIAL DATA |
The following tables set forth certain selected historical consolidated financial data and should be read in conjunction with “Item 7. Management’s Discussion and Analysis of Financial Condition and Results of Operations” and the consolidated Financial Statements and Notes thereto included elsewhere herein. The following information may not be deemed indicative of our future operating results.
| At and For the Years Ended December 31, | ||||||||||||||||||||
| 2011 | 2010 | 2009 | 2008 | 2007 | ||||||||||||||||
| (in thousands) | ||||||||||||||||||||
| Period-End Balance Sheet Data: |
||||||||||||||||||||
| Loans, net of unearned income |
$ | 11,177,026 | $ | 4,957,164 | $ | 5,114,175 | $ | 4,249,290 | $ | 3,596,557 | ||||||||||
| Loans held for sale |
72,378 | 21,866 | 36,112 | 22,290 | 18,957 | |||||||||||||||
| Securities |
4,496,900 | 1,488,885 | 1,611,327 | 1,680,096 | 1,668,583 | |||||||||||||||
| Short-term investments |
1,184,419 | 639,164 | 797,262 | 549,416 | 126,281 | |||||||||||||||
|
|
|
|
|
|
|
|
|
|
|
|||||||||||
| Total earning assets |
16,930,723 | 7,107,079 | 7,558,876 | 6,501,092 | 5,410,378 | |||||||||||||||
|
|
|
|
|
|
|
|
|
|
|
|||||||||||
| Allowance for loan losses |
124,881 | 81,997 | 66,050 | 61,725 | 47,123 | |||||||||||||||
| Other assets |
2,968,254 | 1,113,245 | 1,204,257 | 727,887 | 692,724 | |||||||||||||||
|
|
|
|
|
|
|
|
|
|
|
|||||||||||
| Total assets |
19,774,096 | 8,138,327 | 8,697,083 | 7,167,254 | 6,055,979 | |||||||||||||||
|
|
|
|
|
|
|
|
|
|
|
|||||||||||
| Noninterest bearing deposits |
5,516,336 | 1,127,246 | 1,073,341 | 962,886 | 907,874 | |||||||||||||||
| Interest bearing deposits |
10,197,243 | 5,648,473 | 6,122,471 | 4,968,051 | 4,101,660 | |||||||||||||||
|
|
|
|
|
|
|
|
|
|
|
|||||||||||
| Total deposits |
15,713,579 | 6,775,719 | 7,195,812 | 5,930,937 | 5,009,534 | |||||||||||||||
| Other borrowed funds |
1,415,694 | 388,352 | 516,183 | 506,570 | 376,497 | |||||||||||||||
| Other liabilities |
277,660 | 117,708 | 147,425 | 120,248 | 115,761 | |||||||||||||||
| Common stockholders’ equity |
2,367,163 | 856,548 | 837,663 | 609,499 | 554,187 | |||||||||||||||
|
|
|
|
|
|
|
|
|
|
|
|||||||||||
| Total liabilities & common stockholders’ equity |
$ | 19,774,096 | $ | 8,138,327 | $ | 8,697,083 | $ | 7,167,254 | $ | 6,055,979 | ||||||||||
|
|
|
|
|
|
|
|
|
|
|
|||||||||||
| Average Balance Sheet Data: |
||||||||||||||||||||
| Loans, net of unearned income |
$ | 8,514,021 | $ | 5,005,753 | $ | 4,310,120 | $ | 3,873,908 | $ | 3,428,009 | ||||||||||
| Securities |
3,074,373 | 1,559,019 | 1,559,570 | 1,742,130 | 1,725,895 | |||||||||||||||
| Short-term investments |
955,325 | 698,042 | 497,048 | 175,891 | 117,158 | |||||||||||||||
|
|
|
|
|
|
|
|
|
|
|
|||||||||||
| Total earning assets |
12,543,719 | 7,262,814 | 6,366,738 | 5,791,929 | 5,271,062 | |||||||||||||||
| Allowance for loan losses |
102,784 | 73,190 | 63,450 | 53,354 | 46,443 | |||||||||||||||
| Other assets |
2,281,136 | 1,236,610 | 796,479 | 687,814 | 627,270 | |||||||||||||||
|
|
|
|
|
|
|
|
|
|
|
|||||||||||
| Total assets |
14,722,071 | 8,426,234 | 7,099,767 | 6,426,389 | 5,851,889 | |||||||||||||||
|
|
|
|
|
|
|
|
|
|
|
|||||||||||
| Noninterest bearing deposits |
3,400,064 | 1,076,829 | 935,985 | 876,669 | 927,656 | |||||||||||||||
| Interest bearing deposits |
8,316,489 | 5,840,669 | 4,761,614 | 4,305,738 | 4,001,520 | |||||||||||||||
|
|
|
|
|
|
|
|
|
|
|
|||||||||||
| Total deposits |
11,716,553 | 6,917,498 | 5,697,599 | 5,182,407 | 4,929,176 | |||||||||||||||
| Other borrowed funds |
1,000,998 | 515,626 | 613,523 | 554,898 | 228,010 | |||||||||||||||
| Other liabilities |
203,403 | 127,400 | 114,270 | 104,279 | 132,320 | |||||||||||||||
| Common stockholders’ equity |
1,801,117 | 865,710 | 674,375 | 584,805 | 562,383 | |||||||||||||||
|
|
|
|
|
|
|
|
|
|
|
|||||||||||
| Total liabilities & common stockholders’ equity |
$ | 14,722,071 | $ | 8,426,234 | $ | 7,099,767 | $ | 6,426,389 | $ | 5,851,889 | ||||||||||
|
|
|
|
|
|
|
|
|
|
|
|||||||||||
24
Table of Contents
| At and For the Years Ended December 31, | ||||||||||||||||||||
| 2011 | 2010 | 2009 | 2008 | 2007 | ||||||||||||||||
| (in thousands) | ||||||||||||||||||||
| Performance Ratios: |
||||||||||||||||||||
| Return on average assets |
0.52 | % | 0.62 | % | 1.05 | % | 1.02 | % | 1.26 | % | ||||||||||
| Return on average assets—operating (a) |
0.90 | % | 0.64 | % | 0.79 | % | 0.97 | % | 1.26 | % | ||||||||||
| Return on average common equity |
4.26 | % | 6.03 | % | 11.09 | % | 11.18 | % | 13.14 | % | ||||||||||
| Return on average common equity—operating (a) |
7.40 | % | 6.27 | % | 8.36 | % | 10.64 | % | 13.10 | % | ||||||||||
| Earning asset yield (tax equivalent—te) |
4.83 | % | 5.01 | % | 5.27 | % | 5.97 | % | 6.74 | % | ||||||||||
| Total cost of funds |
0.57 | % | 1.13 | % | 1.50 | % | 2.17 | % | 2.66 | % | ||||||||||
| Net interest margin(te) |
4.25 | % | 3.88 | % | 3.78 | % | 3.80 | % | 4.08 | % | ||||||||||
| Noninterest income excluding bargain purchase gain on acquisition and securities transactions as a percent of total revenue(te) |
27.91 | % | 32.69 | % | 33.95 | % | 35.86 | % | 35.89 | % | ||||||||||
| Efficiency ratio (a) |
66.35 | % | 65.24 | % | 62.71 | % | 61.84 | % | 64.13 | % | ||||||||||
| Average loan/deposit ratio |
72.67 | % | 72.36 | % | 75.65 | % | 74.75 | % | 69.55 | % | ||||||||||
| FTE employees (period-end) |
4,745 | 2,271 | 2,240 | 1,952 | 1,888 | |||||||||||||||
| Capital Ratios: |
||||||||||||||||||||
| Common stockholders’ equity to total assets |
11.97 | % | 10.52 | % | 9.63 | % | 8.50 | % | 9.15 | % | ||||||||||
| Tangible common equity to total assets |
7.96 | % | 9.69 | % | 8.81 | % | 7.62 | % | 8.08 | % | ||||||||||
| Tier 1 leverage (b) |
8.17 | % | 9.65 | % | 10.60 | % | 8.06 | % | 8.51 | % | ||||||||||
| Asset Quality Information: |
||||||||||||||||||||
| Non-accrual loans |
$ | 99,128 | $ | 112,274 | $ | 86,555 | $ | 29,976 | $ | 13,067 | ||||||||||
| Restructured loans (c) |
18,145 | 12,641 | — | — | — | |||||||||||||||
|
|
|
|
|
|
|
|
|
|
|
|||||||||||
| Total non-performing loans |
117,273 | 124,915 | 86,555 | 29,976 | 13,067 | |||||||||||||||
|
|
|
|
|
|
|
|
|
|
|
|||||||||||
| Foreclosed assets |
159,751 | 33,277 | 14,336 | 5,360 | 2,297 | |||||||||||||||
|
|
|
|
|
|
|
|
|
|
|
|||||||||||
| Total non-performing assets |
$ | 277,024 | $ | 158,192 | $ | 100,891 | $ | 35,336 | $ | 15,364 | ||||||||||
|
|
|
|
|
|
|
|
|
|
|
|||||||||||
| Non-performing assets to loans plus other real estate |
2.44 | % | 3.17 | % | 1.97 | % | 0.83 | % | 0.43 | % | ||||||||||
| Accruing loans 90 days past due (d) |
$ | 5,880 | $ | 1,492 | $ | 11,647 | $ | 11,005 | $ | 4,154 | ||||||||||
| Accruing loans 90 days past due as a percent of loans |
0.05 | % | 0.03 | % | 0.23 | % | 0.26 | % | 0.11 | % | ||||||||||
| Non-performing assets + accruing loans 90 days past due to loans and foreclosed assets |
2.50 | % | 3.19 | % | 2.19 | % | 1.09 | % | 0.54 | % | ||||||||||
| Net charge-offs—non-covered |
$ | 33,804 | $ | 50,682 | $ | 50,265 | $ | 22,183 | $ | 7,242 | ||||||||||
| Net charge-offs—covered |
$ | 11,475 | $ | — | $ | — | $ | — | $ | — | ||||||||||
| Net charge-offs—non-covered to average loans |
0.40 | % | 1.01 | % | 1.17 | % | 0.57 | % | 0.21 | % | ||||||||||
| Allowance for loan losses |
$ | 124,881 | $ | 81,997 | $ | 66,050 | $ | 61,725 | $ | 47,123 | ||||||||||
| Allowance for loan losses to period-end loans |
1.12 | % | 1.65 | % | 1.29 | % | 1.45 | % | 1.31 | % | ||||||||||
| Allowance for loan losses to non-performing loans and accruing loans 90 days past due |
101.00 | % | 51.35 | % | 58.69 | % | 133.16 | % | 241.43 | % | ||||||||||
| (a) | Excludes tax-effected merger related expenses, bargain purchase gain on acquisition and securities transactions. The efficiency ratio also excludes amortization of purchased intangibles. |
| (b) | Calculated as Tier 1 capital divided by average total assets. |
| (c) | Included in restructured loans are $4.1 million and $8.7 million of non-accrual loans at December 31, 2011 and December 31, 2010, respectively. |
| (d) | Non-accrual loans and accruing loans past due 90 days or more do not include purchased impaired loans which were written down to their fair value upon acquisition and accrete interest income over the remaining life of the loan. |
25
Table of Contents
| At and For the Years Ended December 31, | ||||||||||||||||||||
| 2011 | 2010 | 2009 | 2008 | 2007 | ||||||||||||||||
| (dollar amounts in thousands) | ||||||||||||||||||||
| Supplemental Asset Quality Information (excluding covered assets and acquired loans) (1) |
||||||||||||||||||||
| Non-accrual loans (2) (3) |
$ | 79,164 | $ | 66,988 | $ | 30,978 | $ | 29,976 | $ | 13,067 | ||||||||||
| Restructured loans |
18,145 | 12,641 | — | — | — | |||||||||||||||
|
|
|
|
|
|
|
|
|
|
|
|||||||||||
| Total non-performing loans |
97,309 | 79,629 | 30,978 | 29,976 | 13,067 | |||||||||||||||
| Foreclosed assets (4) |
115,769 | 17,595 | 14,336 | 5,360 | 2,297 | |||||||||||||||
|
|
|
|
|
|
|
|
|
|
|
|||||||||||
| Total non-performing assets |
$ | 213,078 | $ | 97,224 | $ | 45,314 | $ | 35,336 | $ | 15,364 | ||||||||||
|
|
|
|
|
|
|
|
|
|
|
|||||||||||
| Non-performing assets as a percent of loans and foreclosed assets |
4.26 | % | 2.33 | % | 1.08 | % | 0.83 | % | 0.43 | % | ||||||||||
| Accruing loans 90 days past due |
$ | 4,871 | $ | 1,492 | $ | 11,647 | $ | 11,005 | $ | 4,154 | ||||||||||
| Accruing loans 90 days past due as a percent of loans |
0.10 | % | 0.04 | % | 0.23 | % | 0.26 | % | 0.11 | % | ||||||||||
| Non-performing assets + accruing loans 90 days past due to loans and foreclosed assets |
4.36 | % | 2.37 | % | 1.36 | % | 1.09 | % | 0.54 | % | ||||||||||
| Allowance for loan losses (5) |
$ | 83,246 | $ | 81,325 | $ | 66,050 | $ | 61,725 | $ | 47,123 | ||||||||||
| Allowance for loan losses as a percent of period-end loans |
1.70 | % | 1.96 | % | 1.29 | % | 1.45 | % | 1.31 | % | ||||||||||
| Allowance for loan losses to nonperforming loans + accruing loans 90 days past due |
81.47 | % | 100.25 | % | 154.96 | % | 150.62 | % | 273.64 | % | ||||||||||
| (1) | Covered and acquired loans are considered to be performing due to the application of the accretion method under acquisition accounting. Acquired loans are recorded at fair value with no allowance brought forward in accordance with acquisition accounting. Certain acquired loans and foreclosed assets are also covered under FDIC loss sharing agreements, which provide considerable protection against credit risk. Due to the protection of loss sharing agreements and the impact of acquisition accounting, management has excluded acquired loans and covered assets from this table to provide comparability to prior periods and better perspective into asset quality trends. |
| (2) | Excludes acquired covered loans not accounted for under the accretion method of $18,846, $45,286 and $55,577 for the years 2011, 2010 and 2009. These loans are accounted for under the cost recovery method. There were no acquired covered loans in 2008 or 2007. |
| (3) | Excludes non-covered acquired loans at fair value not accounted for under the accretion method of $1,117 for the year ended December 31, 2011. There were no non-covered acquired loans in earlier periods. |
| (4) | Excludes covered foreclosed assets of $43,982 and $15,682 for 2011 and 2010, respectively. There were no covered foreclosed assets in earlier periods. On June 4, 2011 Hancock acquired $87,895 of foreclosed assets in the Whitney merger. |
| (5) | Excludes impairment recorded on covered acquired loans of $41,634 and $672 in 2011 and 2010. There was no impairment recorded on covered acquired loans in earlier periods. |
26
Table of Contents
| At and For the Years Ended December 31, | ||||||||||||||||||||
| 2011 | 2010 | 2009 | 2008 | 2007 | ||||||||||||||||
| Income Statement: |
||||||||||||||||||||
| Interest income |
$ | 592,204 | $ | 352,558 | $ | 323,727 | $ | 335,437 | $ | 345,697 | ||||||||||
| Interest income (TE) |
604,130 | 364,385 | 335,787 | 345,891 | 355,236 | |||||||||||||||
| Interest expense |
70,971 | 82,345 | 95,300 | 126,002 | 140,236 | |||||||||||||||
|
|
|
|
|
|
|
|
|
|
|
|||||||||||
| Net interest income (TE) |
533,159 | 282,040 | 240,487 | 219,889 | 215,000 | |||||||||||||||
| Provision for loan losses |
38,732 | 65,991 | 54,590 | 36,785 | 7,593 | |||||||||||||||
| Noninterest income excluding securities transactions |
206,426 | 136,949 | 157,258 | 122,953 | 120,378 | |||||||||||||||
| Securities transactions gains/(losses) |
(91 | ) | — | 69 | 4,825 | 308 | ||||||||||||||
| Noninterest expense excluding amortization of intangibles |
577,463 | 276,532 | 232,053 | 212,011 | 215,092 | |||||||||||||||
| Amortization of intangibles |
16,551 | 2,728 | 1,417 | 1,432 | 1,651 | |||||||||||||||
|
|
|
|
|
|
|
|
|
|
|
|||||||||||
| Income before income taxes |
94,823 | 61,911 | 97,694 | 86,985 | 101,811 | |||||||||||||||
| Income tax expense |
18,064 | 9,705 | 22,919 | 21,619 | 27,919 | |||||||||||||||
|
|
|
|
|
|
|
|
|
|
|
|||||||||||
| Net income |
$ | 76,759 | $ | 52,206 | $ | 74,775 | $ | 65,366 | $ | 73,892 | ||||||||||
|
|
|
|
|
|
|
|
|
|
|
|||||||||||
| Bargain purchase gain |
— | — | (33,623 | ) | — | — | ||||||||||||||
| Merger-related expenses |
86,762 | 3,167 | 3,682 | — | — | |||||||||||||||
| Securities transactions gains/(losses) |
(91 | ) | — | 69 | 4,825 | 308 | ||||||||||||||
| Taxes on adjustments |
30,398 | 1,108 | (11,587 | ) | (1,689 | ) | (108 | ) | ||||||||||||
|
|
|
|
|
|
|
|
|
|
|
|||||||||||
| Operating income (a) |
$ | 133,214 | $ | 54,265 | $ | 56,352 | $ | 62,230 | $ | 73,692 | ||||||||||
|
|
|
|
|
|
|
|
|
|
|
|||||||||||
| (a) | Net income less tax-effected merger costs, bargain purchase gain on acquisition and securities gains/losses. Management believes that this a useful financial measure because it enables investors to assess ongoing operations. |
| At and For the Years Ended December 31, | ||||||||||||||||||||
| 2011 | 2010 | 2009 | 2008 | 2007 | ||||||||||||||||
| Per Common Share Data: |
||||||||||||||||||||
| Earnings per share: |
||||||||||||||||||||
| Basic earnings per share |
$ | 1.16 | $ | 1.41 | $ | 2.28 | $ | 2.07 | $ | 2.30 | ||||||||||
| Diluted earnings per share |
1.15 | 1.40 | 2.26 | 2.04 | 2.26 | |||||||||||||||
| Operating earnings per share: (a) |
||||||||||||||||||||
| Basic operating earnings per share |
$ | 2.03 | $ | 1.47 | $ | 1.72 | $ | 1.98 | $ | 2.30 | ||||||||||
| Diluted operating earnings per share |
2.02 | 1.46 | 1.71 | 1.95 | 2.26 | |||||||||||||||
| Cash dividends paid |
0.96 | 0.96 | 0.96 | 0.96 | 0.96 | |||||||||||||||
| Book value (period end) |
27.95 | 23.22 | 22.74 | 19.18 | 17.71 | |||||||||||||||
| Weighted average number of shares outstanding (000s) |
||||||||||||||||||||
| Basic |
65,590 | 36,876 | 32,747 | 31,491 | 32,000 | |||||||||||||||
| Diluted (b) |
66,070 | 37,054 | 32,934 | 31,883 | 32,545 | |||||||||||||||
| Period end number of shares outstanding (000s) |
84,705 | 36,893 | 36,840 | 31,877 | 31,295 | |||||||||||||||
| Market data: |
||||||||||||||||||||
| High sales price |
$ | 35.68 | $ | 45.86 | $ | 45.56 | $ | 68.42 | $ | 54.09 | ||||||||||
| Low sales price |
$ | 25.38 | $ | 26.82 | $ | 22.51 | $ | 33.34 | $ | 32.78 | ||||||||||
| Period-end closing price |
$ | 31.97 | $ | 34.86 | $ | 43.81 | $ | 45.46 | $ | 38.20 | ||||||||||
| Trading volume (000s) ( c) |
137,360 | 50,102 | 66,346 | 73,843 | 48,169 | |||||||||||||||
| (a) | Excludes tax-effected merger related expenses, bargain purchase gain, and securities transactions. |
| (b) | Weighted-average anti-dilutive potential common shares totalled 680,611, for the twelve months ended December 31, 2011. There were no anti-dilutive potential common shares in earlier periods. |
| (c) | Trading volume is based on the total volume as determined by NASDAQ on the last day of the quarter. |
27
Table of Contents
| ITEM 7. | MANAGEMENT’S DISCUSSION AND ANALYSIS OF FINANCIAL CONDITION AND RESULTS OF OPERATIONS |
The purpose of this discussion and analysis is to focus on significant changes and events in the financial condition and results of operations of Hancock Holding Company and our subsidiaries during 2011 and selected prior periods. This discussion and analysis is intended to highlight and supplement data and information presented elsewhere in this report, including the consolidated financial statements and related notes.
FORWARD-LOOKING STATEMENTS
Congress passed the Private Securities Litigation Act of 1995 in an effort to encourage corporations to provide information about a company’s anticipated future financial performance. This act provides a safe harbor for such disclosure, which protects us from unwarranted litigation, if actual results are different from management expectations. This discussion and analysis contains forward-looking statements and reflects management’s current views and estimates of future economic circumstances, industry conditions, company performance and financial results. The words “may,” “should,” “expect,” “anticipate,” “intend,” “plan,” “continue,” “believe,” “seek,” “estimate” and similar expressions are intended to identify forward-looking statements. These forward-looking statements are subject to a number of factors and uncertainties, which could cause our actual results and experience to differ from the anticipated results and expectations, expressed in such forward-looking statements. You are cautioned not to place undue reliance on these forward-looking statements. Hancock does not intend, and undertakes no obligations, to update or revise any forward-looking statements, whether as a result of differences in actual results, changes in assumptions or changes in other factors affecting such statements, except as required by law.
EXECUTIVE OVERVIEW
On June 4, 2011, Hancock acquired all of the outstanding common stock of Whitney Holding Corporation (Whitney), the parent company of Whitney National Bank based in New Orleans, Louisiana, in a stock and cash transaction. Whitney common shareholders received 0.418 shares of Hancock common stock in exchange for each share of Whitney stock, resulting in Hancock issuing 40.8 million common shares at a fair value of $1.3 billion. Whitney’s preferred stock and common stock warrant issued under TARP were purchased by the Company for $307.7 million and retired as part of the merger transaction. In total, the purchase price was approximately $1.6 billion. The fair value of the assets acquired, excluding goodwill, totaled $11.2 billion, including $6.5 billion in loans, $2.4 billion of investment securities, and $224 million of identifiable intangibles. The fair value of the liabilities assumed was $10.1 billion, including $9.2 billion of deposits. In September 2011, seven Whitney Bank branches located on the Mississippi Gulf Coast with approximately $47 million in loans and $180 million in deposits were divested in order to resolve branch concentration concerns of the U.S. Department of Justice relating to the merger.
Net income for the year ended December 31, 2011 was $76.8 million, an increase of $24.6 million, or 47%, from 2010’s net income of $52.2 million. This increase was primarily due to the addition of the Whitney operations since the acquisition date, partially offset by merger-related expenses. Diluted earnings per share for 2011 was $1.15, a $0.25 decrease from 2010’s diluted earnings per share. Diluted earnings per share on operating income, which excludes tax effected merger-related expenses and securities gains and losses, was $2.02 for 2011 compared to $1.46 for 2010. Hancock’s return on average assets (ROA) for 2011 was 0.52% compared to 0.62% for 2010, while the operating ROA increased to 0.90% in 2011 from 0.64% in 2010.
The provision for loan losses was $38.7 million in 2011 compared to a provision of $66.0 million in the prior year. Net charge-offs for 2011 were $45.3 million, or $33.8 million, excluding net charge-offs on loans covered under FDIC loss-sharing agreements. Net charge-offs on non-covered loans was 0.40% percent of average loans. This compares to the net-charge off ratio of 1.01% in 2010. The allowance for loan losses increased to $124.9 million at December 31, 2011 from $82.0 million recorded at December 31, 2010. Substantially all of the $42.9 million increase came from additions to the allowance for covered loans. The determination of allowances for covered loans and other loans acquired with existing credit impairment is discussed in Note 1 to the consolidated financial statements.
28
Table of Contents
With the Whitney acquisition, total assets increased $11.6 billion during 2011 to $19.8 billion at December 31, 2011. This included a $6.2 billion increase in total loans to $11.2 billion at December 31, 2011. In general, loan demand from the Company’s customer base continued to be restrained by economic conditions during 2011, although some improvement was noted toward the end of the year. Loan trends will continue to be impacted as expected by declines in the FDIC-covered portfolio acquired with People’s First at the end of 2009.
Excluding the impact of the Whitney’s deposit base, total deposits at December 31, 2011 were down slightly from December 31, 2010, reflecting in part the anticipated runoff of higher-rate time deposits acquired in the People’s First transaction. Including Whitney, noninterest-bearing demand deposits totaled $5.5 billion, or 35% of total deposits, at December 31, 2011, compared to $1.1 billion, or 17% of deposits, at the end of 2010. The increase reflects both the composition of the acquired Whitney deposit base as well as customers’ response to the continued low market rate environment.
Total stockholders’ equity increased $1.5 billion during 2011 to $2.4 billion at December 31, 2011, reflecting mainly both the value of the stock issued in the Whitney transaction as well as the capital that was raised in the Company’s public stock offering in March 2011. Hancock’s regulatory capital ratios and those of its subsidiary banks remain above levels required to be considered well capitalized for various regulatory purposes.
RESULTS OF OPERATIONS
Net Interest Income
Net interest income (te) is the primary component of our earnings and represents the difference, or spread, between revenue generated from interest-earning assets and the interest expense related to funding those assets. For internal analytical purposes, management adjusts net interest income to a “taxable equivalent” basis using a 35% federal tax rate on tax exempt items (primarily interest on municipal securities and loans).
Net interest income (te) for 2011 totaled $533.2 million, almost double the $282.0 million earned in 2010. Earning assets in 2011 were up 71% over 2010, reflecting mainly the Whitney acquisition, and the net interest margin improved by 37 basis points to 4.25% in 2011. The net interest margin, which is the ratio of net interest income (te) to average earnings assets, is an important metric used by Hancock to manage net interest income.
The overall yield on earning assets decreased 19 basis points to 4.82% in 2011. Loan yields increased 11 basis points to 5.97% in 2011, while the yield on the investment portfolio declined 137 basis points from 2010. Positive adjustments to the yield earned on the acquired Whitney portfolio based on post-merger portfolio performance benefited the overall loan yield in 2011. Both the lower yields available on the reinvestment of repayments and maturities from the Company’s mainly fixed-rate investment portfolio, as well as the market yield on Whitney’s acquired investment portfolio at the acquisition date, contributed to the decrease in investment portfolio yield in 2011. The overall mix of average earning assets was relatively stable between 2011 and 2010, with loans comprising approximately 68% of the total in each year.
The overall cost of funding earning assets decreased 56 basis points to 0.57% in 2011. The overall rate paid on interest-bearing deposits was down 58 basis points from 2010 to 0.67% in 2011, reflecting mainly the impact of the sustained low rate environment on deposit rates and the expected runoff or re-pricing of higher rate time deposits from People’s First. There was a favorable shift in the mix of funding sources during 2011, related mainly to the composition of the acquired Whitney deposit base. Interest-free sources, including non-interest bearing demand deposits, funded 26% of average earnings assets in 2011 compared to 12% in 2010.
The impact of purchase accounting adjustments and the acquired deposit base should favorably affect the net interest margin in 2012. However, various factors could challenge our ability to increase net interest income and net interest margin. For example, continued weak loan demand will make it difficult to grow earning assets and maintain or increase the proportion of loans in the earning asset mix. The rates on many variable rate loans with rate floors currently exceed the underlying indexed market rates. This will limit the benefit to loan yields from any rise in market rates.
29
Table of Contents
Net interest income (te) of $282.0 million in 2010 represented an increase of $41.6 million, or 17.3%, from 2009. Average earning assets increased 14.0% between these years, related mainly to the Peoples First acquisition in December 2009. The net interest margin increased 10 basis points between these periods, as a 36 basis point reduction in the overall cost of funds more than offset a 26 basis decline in the yield on earning assets. The decline in funding costs reflected mainly the impact of the low market rate environment on deposit rates, which declined 52 basis points between these periods. Loan yields were relatively stable in 2010 compared to 2009, but the re-pricing of investment securities in the low rate environment reduced the yield on the investment portfolio by 56 basis points. The mix of earnings assets and funding sources were both relatively stable between 2010 and 2009.
The factors contributing to the changes in net interest income (te) for 2011, 2010, and 2009 are presented in Tables 1 and 2 below. Table 1 shows average balances and related interest and rates. Table 2 details the effects of changes in balances (volume) and rate on net interest income in 2011 and 2010.
30
Table of Contents
TABLE 1. Summary of Average Balance Sheets (w/Net Interest Income (te) & Interest Rates)(a)
| Years Ended December 31, | ||||||||||||||||||||||||||||||||||||
| 2011 | 2010 | 2009 | ||||||||||||||||||||||||||||||||||
| Average Balance |
Interest | Rate | Average Balance |
Interest | Rate | Average Balance |
Interest | Rate | ||||||||||||||||||||||||||||
| (In thousands) | ||||||||||||||||||||||||||||||||||||
| Assets |
||||||||||||||||||||||||||||||||||||
| Interest-Earnings Assets: |
||||||||||||||||||||||||||||||||||||
| Loans (te) (b) |
$ | 8,514,021 | $ | 508,399 | 5.97 | % | $ | 5,005,753 | $ | 293,933 | 5.86 | % | $ | 4,310,120 | $ | 253,732 | 5.89 | % | ||||||||||||||||||
| U.S. Treasury securities |
8,652 | 42 | 0.49 | 11,437 | 72 | 0.63 | 10,986 | 175 | 1.59 | |||||||||||||||||||||||||||
| U.S. agency securities |
277,509 | 5,628 | 2.03 | 152,268 | 3,964 | 2.60 | 165,725 | 6,778 | 4.09 | |||||||||||||||||||||||||||
| CMOs |
742,508 | 18,900 | 2.55 | 284,397 | 10,493 | 3.69 | 162,811 | 8,251 | 5.07 | |||||||||||||||||||||||||||
| Mortgage-backed securities |
1,772,212 | 55,572 | 3.14 | 905,212 | 42,350 | 4.68 | 1,029,860 | 51,553 | 5.01 | |||||||||||||||||||||||||||
| Obligations of states and political subdivisions: taxable |
57,496 | 3,060 | 5.32 | 61,605 | 2,919 | 4.74 | 56,414 | 2,493 | 4.42 | |||||||||||||||||||||||||||
| nontaxable (te) |
191,668 | 9,278 | 4.84 | 127,164 | 8,047 | 6.33 | 110,517 | 7,008 | 6.34 | |||||||||||||||||||||||||||
| Other securities |
24,328 | 1,120 | 4.60 | 16,936 | 856 | 5.05 | 23,257 | 1,323 | 5.33 | |||||||||||||||||||||||||||
|
|
|
|
|
|
|
|
|
|
|
|
|
|
|
|
|
|
|
|||||||||||||||||||
| Total investment in securities |
3,074,373 | 93,600 | 3.04 | 1,559,019 | 68,701 | 4.41 | 1,559,570 | 77,581 | 4.97 | |||||||||||||||||||||||||||
| Federal funds sold and |
955,325 | 2,131 | 0.22 | 698,042 | 1,750 | 0.25 | 497,048 | 4,475 | 0.90 | |||||||||||||||||||||||||||
|
|
|
|
|
|
|
|
|
|
|
|
|
|
|
|
|
|
|
|||||||||||||||||||
| Total interest- |
12,543,719 | 604,130 | 4.82 | % | 7,262,814 | 364,384 | 5.01 | % | 6,366,738 | 335,788 | 5.27 | % | ||||||||||||||||||||||||
|
|
|
|
|
|
|
|
|
|
|
|
|
|
|
|
|
|
|
|||||||||||||||||||
| Non-earning assets: |
||||||||||||||||||||||||||||||||||||
| Other assets |
2,281,136 | 1,236,610 | 796,479 | |||||||||||||||||||||||||||||||||
| Allowance for loan losses |
(102,784 | ) | (73,190 | ) | (63,450 | ) | ||||||||||||||||||||||||||||||
|
|
|
|
|
|
|
|||||||||||||||||||||||||||||||
| Total assets |
$ | 14,722,071 | $ | 8,426,234 | $ | 7,099,767 | ||||||||||||||||||||||||||||||
|
|
|
|
|
|
|
|||||||||||||||||||||||||||||||
| Liabilities and Stockholder’s Equity |
||||||||||||||||||||||||||||||||||||
| Interest-bearing Liabilities: |
||||||||||||||||||||||||||||||||||||
| Interest-bearing transaction deposits |
$ | 4,194,758 | 8,789 | 0.21 | % | $ | 1,940,470 | 9,013 | 0.46 | % | $ | 1,486,438 | 7,264 | 0.49 | % | |||||||||||||||||||||
| Time deposits |
2,807,098 | 41,755 | 1.49 | 2,736,206 | 54,371 | 1.99 | 1,987,059 | 58,252 | 2.93 | |||||||||||||||||||||||||||
| Public funds |
1,314,633 | 5,147 | 0.39 | 1,163,993 | 9,519 | 0.82 | 1,288,117 | 18,797 | 1.46 | |||||||||||||||||||||||||||
|
|
|
|
|
|
|
|
|
|
|
|
|
|
|
|
|
|
|
|||||||||||||||||||
| Total interest-bearing deposits |
8,316,489 | 55,691 | 0.67 | 5,840,669 | 72,903 | 1.25 | 4,761,614 | 84,313 | 1.77 | |||||||||||||||||||||||||||
|
|
|
|
|
|
|
|
|
|
|
|
|
|
|
|
|
|
|
|||||||||||||||||||
| Repurchase agreements |
681,474 | 7,011 | 1.03 | 477,174 | 9,303 | 1.95 | 523,351 | 10,802 | 2.06 | |||||||||||||||||||||||||||
| Other interest-bearing liabilities |
114,571 | 165 | 0.14 | 37,947 | 172 | 0.45 | 89,463 | 167 | 0.19 | |||||||||||||||||||||||||||
| Long-term debt |
204,953 | 8,116 | 3.96 | 505 | 37 | 7.33 | 709 | 39 | 5.50 | |||||||||||||||||||||||||||
| Capitalized Interest |
— | (12 | ) | — | (70 | ) | (20 | ) | ||||||||||||||||||||||||||||
|
|
|
|
|
|
|
|
|
|
|
|||||||||||||||||||||||||||
| Total interest- |
9,317,487 | 70,971 | 0.76 | 6,356,295 | 82,345 | 1.30 | % | 5,375,137 | 95,301 | 1.77 | % | |||||||||||||||||||||||||
|
|
|
|
|
|
|
|
|
|
|
|
|
|
|
|
|
|
|
|||||||||||||||||||
| Non-interest bearing: |
||||||||||||||||||||||||||||||||||||
| Demand deposits |
3,400,064 | 1,076,829 | 935,985 | |||||||||||||||||||||||||||||||||
| Other liabilities |
203,403 | 127,400 | 114,270 | |||||||||||||||||||||||||||||||||
| Stockholders’ equity |
1,801,117 | 865,710 | 674,375 | |||||||||||||||||||||||||||||||||
|
|
|
|
|
|
|
|||||||||||||||||||||||||||||||
| Total liabilities & |
$ | 14,722,071 | $ | 8,426,234 | $ | 7,099,767 | ||||||||||||||||||||||||||||||
|
|
|
|
|
|
|
|||||||||||||||||||||||||||||||
| Net interest income and margin (te) |
$ | 533,159 | 4.25 | % | $ | 282,039 | 3.88 | % | $ | 240,487 | 3.78 | % | ||||||||||||||||||||||||
|
|
|
|
|
|
|
|
|
|
|
|
|
|||||||||||||||||||||||||
| Net earning assets and spread |
$ | 3,226,232 | 4.06 | % | $ | 906,519 | 3.71 | % | $ | 991,601 | |
3.50 |
% | |||||||||||||||||||||||
|
|
|
|
|
|
|
|
|
|
|
|
|
|||||||||||||||||||||||||
| Interest cost of funding earning assets |
0.57 | % | 1.13 | % | 1.50 | % | ||||||||||||||||||||||||||||||
|
|
|
|
|
|
|
|||||||||||||||||||||||||||||||
| (a) | Tax equivalent (te) amounts are calculated using a marginal federal income tax rate of 35%. |
| (b) | Includes nonaccrual loans and loans held for sale. |
31
Table of Contents
TABLE 2. Summary of Changes in Net Interest Income (te)(a)(b)
| 2011 Compared to 2010 | 2010 Compared to 2009 | |||||||||||||||||||||||
| Due to Change in |
Total Increase |
Due to Change in |
Total Increase |
|||||||||||||||||||||
| Volume | Rate | (Decrease) | Volume | Rate | (Decrease) | |||||||||||||||||||
| (In thousands) | ||||||||||||||||||||||||
| Interest Income (te) |
||||||||||||||||||||||||
| Loans(te)(c) |
$ | 209,576 | $ | 4,890 | $ | 214,466 | $ | 39,668 | $ | 533 | $ | 40,201 | ||||||||||||
| U.S. Treasury securities |
(16 | ) | (14 | ) | (30 | ) | 7 | (110 | ) | (103 | ) | |||||||||||||
| U.S. agency securities |
2,763 | (1,099 | ) | 1,664 | (516 | ) | (2,298 | ) | (2,814 | ) | ||||||||||||||
| CMOs |
10,928 | (2,521 | ) | 8,407 | 4,937 | (2,695 | ) | 2,242 | ||||||||||||||||
| Mortgage-backed securities |
32,333 | (19,111 | ) | 13,222 | (5,974 | ) | (3,229 | ) | (9,203 | ) | ||||||||||||||
| Obligations of states and political subdivisions: |
||||||||||||||||||||||||
| Taxable |
(192 | ) | 333 | 141 | 241 | 185 | 426 | |||||||||||||||||
| Nontaxable (te) |
3,221 | (1,990 | ) | 1,231 | 1,053 | (14 | ) | 1,039 | ||||||||||||||||
| FHLB stock and other securities |
370 | (106 | ) | 264 | (331 | ) | (136 | ) | (467 | ) | ||||||||||||||
|
|
|
|
|
|
|
|
|
|
|
|
|
|||||||||||||
| Total investment in securities |
49,407 | (24,508 | ) | 24,899 | (583 | ) | (8,297 | ) | (8,880 | ) | ||||||||||||||
| Federal funds and short-term investments |
541 | (160 | ) | 381 | 1,341 | (4,066 | ) | (2,725 | ) | |||||||||||||||
|
|
|
|
|
|
|
|
|
|
|
|
|
|||||||||||||
| Total interest income (te) |
259,524 | (19,778 | ) | 239,746 | 40,426 | (11,830 | ) | 28,596 | ||||||||||||||||
|
|
|
|
|
|
|
|
|
|
|
|
|
|||||||||||||
| Interest-bearing transaction deposits |
5,401 | (5,625 | ) | (224 | ) | 2,124 | (375 | ) | 1,749 | |||||||||||||||
| Time deposits |
900 | (13,516 | ) | (12,616 | ) | 18,146 | (22,027 | ) | (3,881 | ) | ||||||||||||||
| Public funds |
1,211 | (5,583 | ) | (4,372 | ) | (1,668 | ) | (7,610 | ) | (9,278 | ) | |||||||||||||
|
|
|
|
|
|
|
|
|
|
|
|
|
|||||||||||||
| Total interest-bearing deposits |
7,512 | (24,724 | ) | (17,212 | ) | 18,602 | (30,012 | ) | (11,410 | ) | ||||||||||||||
|
|
|
|
|
|
|
|
|
|
|
|
|
|||||||||||||
| Repurchase agreements |
3,324 | (5,616 | ) | (2,292 | ) | (920 | ) | (579 | ) | (1,499 | ) | |||||||||||||
| Other interest-bearing liabilities |
304 | (253 | ) | 51 | (118 | ) | 72 | (46 | ) | |||||||||||||||
| Long-term debt |
8,114 | (35 | ) | 8,079 | (13 | ) | 12 | (1 | ) | |||||||||||||||
|
|
|
|
|
|
|
|
|
|
|
|
|
|||||||||||||
| Total interest expense |
19,254 | (30,628 | ) | (11,374 | ) | 17,551 | (30,507 | ) | (12,956 | ) | ||||||||||||||
|
|
|
|
|
|
|
|
|
|
|
|
|
|||||||||||||
| Net interest income (te) variance |
$ | 240,270 | $ | 10,850 | $ | 251,120 | $ | 22,875 | $ | 18,677 | $ | 41,552 | ||||||||||||
|
|
|
|
|
|
|
|
|
|
|
|
|
|||||||||||||
| (a) | Tax equivalent (te) amounts are calculated using a marginal federal income tax rate of 35%. |
| (b) | Amounts shown as due to changes in either volume or rate includes an allocation of the amount that reflects the interaction of volume and rate changes. This allocation of the amount that reflects the interaction of volume and rate changes. This allocation is based on the absolute dollar amounts of change due solely to changes in volume or rate. |
| (c) | Includes nonaccrual loans held for sale. |
Provision for Loan Losses
The provision for loan losses was $38.7 million in 2011 compared to a provision of $66.0 million in the prior year. Net charge-offs for 2011 were $45.3 million, or $33.8 million excluding net charge-offs on loans covered under FDIC loss-sharing agreements. Non-covered net charge-offs were $50.7 million in 2010. The loans purchased in the 2009 acquisition of Peoples First Community Bank are covered by two loss share agreements between the FDIC and the Company which afford the Company significant loss protection. Net charge-offs on non-covered loans in 2011 was 0.40% of average loans. This compares to a net-charge off ratio of 1.01% in 2010. The allowance for loan losses increased to $124.9 million at December 31, 2011 from $82.0 million recorded at December 31, 2010. Substantially all of the $42.9 million increase came from additions to the allowance for covered loans, although the impact on provision expense was only $3.0 million net of the related increase in the loss share indemnification asset. The covered loan provision in 2010 was negligible. The determination of allowances for covered loans and other loans acquired with existing credit impairment is discussed in Note 1 to the consolidated financial statements.
The decrease in the provision for loan losses in 2011 was driven by a $16.9 million reduction in net charge offs on originated loans as well as a slowdown in the identification of new problem loans due to the stabilization of the national and local economies. The provision for loan losses reflects management’s assessment of the adequacy of the allowance for loan losses to absorb inherent losses in the loan portfolio. The amount of provision for each period is dependent on many factors, including loan growth, net charge-offs, changes in the composition of the loan portfolio, delinquencies, identified loan impairment, management’s assessment of the loan portfolio quality, the value of collateral, as well as, overall economic factors.
32
Table of Contents
The allowance for loan losses as a percent of period-end loans was 1.12% at December 31, 2011 compared to 1.65% at December 31, 2010. The allowance calculated on the loan portfolio that excludes covered loans and loans acquired at fair value in the Whitney merger totaled $83.2 million, or 1.70% of this portfolio at December 31, 2011. These results compare to $81.3 million and 1.96%, respectively, for December 31, 2010.
The provision for loan losses in 2010 increased $11.4 million, or 21% over 2009. Major drivers of this increase were continued weakness in the local and national economies and increases in nonperforming loans. Net charge-offs were $50.7 million in 2010, up slightly from 2009. The allowance for loan losses as a percent of period-end loans was 1.65% in 2010 compared to 1.29% at December 31, 2009.
Noninterest Income
Noninterest income for 2011 totaled $206.3 million, or 51% higher than in 2010. Excluding the estimated impact of the acquired Whitney operations, noninterest income was up $10.0 million, or 7%. An $11.8 million increase in 2011 on the accretion of the FDIC indemnification asset related to the Peoples First loss sharing agreements was the most significant factor. Changes in accretion on the indemnification asset will occur as projected losses on the related covered loan portfolio are reforecast periodically. Table 3 presents a three-year analysis of the components of noninterest income along with the percentage changes between years for each component.
TABLE 3. Noninterest Income
| 2011 | % Change | 2010 | % Change | 2009 | ||||||||||||||||
| (In thousands) | ||||||||||||||||||||
| Service charges on deposit accounts |
$ | 55,265 | 22 | % | $ | 45,335 | — | % | $ | 45,354 | ||||||||||
| Trust fees |
23,940 | 43 | 16,715 | 10 | 15,127 | |||||||||||||||
| Bank card fees |
28,879 | 93 | 14,941 | 33 | 11,252 | |||||||||||||||
| Insurance commissions and fees |
16,524 | 14 | 14,461 | 1 | 14,355 | |||||||||||||||
| Investment and annuity fees |
15,016 | 47 | 10,181 | 24 | 8,220 | |||||||||||||||
| ATM fees |
14,052 | 48 | 9,486 | 29 | 7,374 | |||||||||||||||
| Secondary mortgage market operations |
10,484 | 18 | 8,915 | 51 | 5,906 | |||||||||||||||
| Income from bank owned life insurance |
9,311 | 78 | 5,219 | (6 | ) | 5,527 | ||||||||||||||
| Letter of credit fees |
4,193 | 189 | 1,451 | 11 | 1,309 | |||||||||||||||
| Safe deposit box rental income |
1,591 | 89 | 841 | 6 | 794 | |||||||||||||||
| Gain on acquisition |
— | n/m | — | (100 | ) | 33,623 | ||||||||||||||
| Accretion of indemnification asset |
16,689 | 241 | 4,890 | n/m | — | |||||||||||||||
| Other income |
10,483 | 132 | 4,514 | (46 | ) | 8,417 | ||||||||||||||
| Securities transactions gains, net |
(91 | ) | n/m | — | (100 | ) | 69 | |||||||||||||
|
|
|
|
|
|
|
|
|
|
|
|||||||||||
| Total noninterest income |
$ | 206,336 | 51 | % | $ | 136,949 | (13 | )% | $ | 157,327 | ||||||||||
|
|
|
|
|
|
|
|
|
|
|
|||||||||||
n/m = Not meaningful
The Dodd-Frank Act that was signed into law in July 2010 represents a significant overhaul of many aspects of the regulation of the financial services industry and includes provisions that have had or likely will have an impact on the nature and pricing of services offered by the Banks and other financial services industry participants. The independent Consumer Financial Protection Bureau that was established under the Dodd-Frank Act has broad rulemaking, supervisory and enforcement authority over consumer financial products, including deposit products, residential mortgages, home-equity loans and credit cards. The Dodd-Frank Act directs applicable regulatory authorities to promulgate a large number of regulations implementing its provisions over time. The discussion of “Supervision and Regulation” located in Item 1 of this annual report on Form 10-K includes more detailed information on the provision of the Dodd-Frank Act.
The following discussion of changes in noninterest income for 2011 compared to 2010 excludes the estimated impact of acquired Whitney operations in 2011.
33
Table of Contents
Income from service charges on deposit accounts was down $6.0 million, or 13%, mainly because of a decrease in overdraft and NSF fees related mainly to new consumer protection regulations implemented during the third quarter of 2010. Service charges include periodic account maintenance fees for both commercial and personal customers, charges for specific transactions or services, such as processing return items or wire transfers, and other revenue associated with deposit accounts, such as commissions on check sales.
Bank card fees were stable between 2011 and 2010. Revenue from increased activity on cards issued under the Hancock name offset the effect of the sale of the People’s First credit card portfolio at year-end 2010. New limits on interchange rates went into effect in the fourth quarter of 2011 as part of the implementation of the Durbin amendment to the Dodd-Frank Act. Because of an exemption for smaller issuers, the new limits applied initially only to transactions on card accounts acquired with Whitney. When the limits are applied to all the Banks card accounts in 2012, the Company expects debit interchange income will decline by approximately $2 million per quarter compared to current levels.
Investment and annuity fees increased $2.5 million, or 24%, in 2011 mainly due to improved financial market conditions. Investment and annuity fees include stock brokerage and annuity sales as well as fixed-income securities transactions for correspondent banks and other commercial and personal customers.
ATM fees were up $2.1 million, or 22%, over 2010 due to increased activity and the full year effect of changes during 2010 to the fee structure for ATM transactions. Fee income generated by our secondary mortgage market operations decreased $2.4 million, or 27%, between 2011 and 2010. Refinancing as a result of the historically low rate environment peaked in 2010.
Excluding the $33.6 million purchase gain recognized on the acquisition of Peoples First in December 2009 and the $4.9 million accretion on the FDIC indemnification asset in 2010, total noninterest income in 2010 increased $8.4 million compared to the prior year. Bank card fees were up $3.7 million, or 33%, compared to 2009, due mainly to activity on Peoples First card accounts. Fee income generated by our secondary mortgage market operations increased $3.0 million, or 51%, reflecting strong refinancing activity in response to the historically low rate environment. Investment and annuity fees increased $2.0 million, or 24%, from 2009 to 2010 mainly due to improved market conditions. ATM fees rose $2.1 million, or 29%, over 2009 due to activity from the Peoples First customers and growth in our Mississippi and Louisiana markets.
Noninterest Expense
Noninterest expense for 2011 increased $314.8 million, or 113%, to $594.0 million, primarily due to the impact of the Whitney acquisition. Excluding merger-related expenses totaling $86.8 million in 2011 and $3.2 million in 2010 and approximately $213 million of expenses added in the Whitney acquisition, noninterest expense increased $17.8 million, or 6%. Table 4 presents an analysis of the components of noninterest expense for the years 2011, 2010, and 2009.
34
Table of Contents
TABLE 4. Noninterest Expense
| 2011 | % Change | 2010 | % Change | 2009 | ||||||||||||||||
| (In thousands) | ||||||||||||||||||||
| Employee compensation |
$ | 220,720 | 96 | % | $ | 112,457 | 20 | % | $ | 93,924 | ||||||||||
| Employee benefits |
51,922 | 76 | 29,558 | 15 | 25,765 | |||||||||||||||
|
|
|
|
|
|
|
|
|
|
|
|||||||||||
| Total personnel expense |
272,642 | 92 | 142,015 | 19 | 119,689 | |||||||||||||||
| Net occupancy expense |
42,890 | 80 | 23,799 | 18 | 20,222 | |||||||||||||||
| Equipment |
16,972 | 61 | 10,512 | 7 | 9,849 | |||||||||||||||
| Data processing expense |
39,906 | 76 | 22,702 | 19 | 19,037 | |||||||||||||||
| Professional services |
29,029 | 91 | 15,184 | 38 | 11,038 | |||||||||||||||
| Postage and communications |
17,617 | 61 | 10,959 | 29 | 8,473 | |||||||||||||||
| Advertising |
11,729 | 54 | 7,600 | 46 | 5,189 | |||||||||||||||
| Deposit insurance and regulatory fees |
12,974 | 14 | 11,401 | (9 | ) | 12,589 | ||||||||||||||
| Amortization of intangible assets |
16,551 | 507 | 2,728 | 93 | 1,417 | |||||||||||||||
| Ad valorem and franchise taxes |
5,330 | 49 | 3,568 | (1 | ) | 3,621 | ||||||||||||||
| Printing and supplies |
5,040 | 131 | 2,186 | 15 | 1,899 | |||||||||||||||
| Other real estate owned expense, net |
6,910 | 54 | 4,475 | 230 | 1,357 | |||||||||||||||
| Insurance expense |
4,313 | 115 | 2,010 | 6 | 1,905 | |||||||||||||||
| Merger-related expenses |
86,762 | n/m | 3,167 | n/m | 3,682 | |||||||||||||||
| Other expense |
25,349 | 50 | 16,954 | 26 | 13,503 | |||||||||||||||
|
|
|
|
|
|
|
|
|
|
|
|||||||||||
| Total noninterest expense |
$ | 594,014 | 113 | % | $ | 279,260 | 20 | % | $ | 233,470 | ||||||||||
|
|
|
|
|
|
|
|
|
|
|
|||||||||||
n/m = not meaningful
The components of merger-related expenses:
| 2011 | 2010 | 2009 | ||||||||||
| Personnel |
$ | 13,960 | $ | 27 | $ | 1,760 | ||||||
| Net occupancy expense |
330 | 4 | 118 | |||||||||
| Equipment |
552 | 57 | — | |||||||||
| Data processing expense |
3,163 | 944 | 6 | |||||||||
| Professional services expense |
40,902 | 1,263 | 1,283 | |||||||||
| Postage and communications |
897 | 60 | 1 | |||||||||
| Advertising |
5,958 | 113 | 408 | |||||||||
| Printing and supplies |
568 | 194 | 12 | |||||||||
| Insurance expense |
3,177 | — | — | |||||||||
| Other expense |
17,255 | 505 | 94 | |||||||||
|
|
|
|
|
|
|
|||||||
| Total merger-related expenses |
$ | 86,762 | $ | 3,167 | $ | 3,682 | ||||||
|
|
|
|
|
|
|
|||||||
The following discussion of noninterest expense for 2011 compared to 2010 excludes the effect of the Whitney acquisition in 2011.
Total personnel expense (excluding $114.3 million of Whitney expenses), increased $16.3 million, or 11%, in 2011 compared to the prior year. Employee compensation increased $13.1 million, or 12%, reflecting normal salary adjustments as well as additional incentive-based compensation and some strategic staff additions appropriate to the Company’s expanded scope of operations following the Whitney acquisition. Employee benefits expense was up $3.2 million, or 11%, including increases in both health and pension benefits. Employee compensation includes base salaries and contract labor costs, compensation earned under sales-based and other employee incentive programs, and compensation expense under management incentive plans. Employee benefits, in addition to payroll taxes, are the cost of providing health benefits for active and retired employees and the cost of providing pension benefits through both the defined-benefit plans and a 401(k) employee savings plan.
Deposit insurance and regulatory fees decreased $3.6 million, or 32%, in 2011. The implementation of a new deposit insurance assessment calculation method in 2011 had a favorable impact on the Banks’ premiums. This new method applies a bank’s risk-based rates to an assessment base defined as average assets less average tangible equity. Insurance expenses were up $2.2 million, mainly due to increases in officer and director liability costs resulting from increased limits associated with the expanded operations after the Whitney acquisition.
35
Table of Contents
Excluding the impact of the Whitney acquisition, no significant trends were identified underlying the changes in other noninterest expense categories between 2011 and 2010.
Merger-related expenses include certain merger transaction costs, costs incurred to integrate operations and systems, personnel costs associated with severance and retention arrangements and various other nonrecurring costs directly attributable to the acquisition.
Total noninterest expense in 2010 increased $45.8 million, or 20%, compared to 2009. Almost all of this increase was related to the Peoples First operations acquired in December 2009.
Income Taxes
Income tax expense was $18.1 million in 2011, $9.7 million in 2010 and $22.9 million in 2009. Our effective income tax rate continues to be less than the statutory rate of 35%, due primarily to tax-exempt interest income and tax credits. The effective tax rates for 2011, 2010 and 2009 were 19%, 15% and 24%, respectively. Note 17 to the consolidated financial statements reconciles reported income tax expense to the amount determined by applying the statutory rate to income before income taxes.
SEGMENT REPORTING
The Company’s primary operating segments are divided into Hancock, Whitney, and Other. The Hancock segment coincides generally with the Company’s Hancock Bank subsidiary and the Whitney segment with its Whitney Bank subsidiary. Each Bank segment offers commercial, consumer and mortgage loans and deposit services. Although the Bank segments offer the same products and services, they are managed separately due to different pricing, product demand, and consumer markets. On June 4, 2011, the Company completed its acquisition of Whitney Holding Corporation, the parent of Whitney National Bank. Whitney National Bank was merged into Hancock Bank of Louisiana, and the combined entity was renamed Whitney Bank. The “Other” segment includes activities of other consolidated subsidiaries that provide investment services, insurance agency services, insurance underwriting and various other services to third parties. Note 19 to the consolidated financial statements provide comparative financial information for the operating segments for 2011, 2010 and 2009. Net income in 2011 for the Hancock segment increased $21.2 million over 2010. Net interest income increased $14.3 million driven mainly by a lower cost of funds associated in part with the run-off or re-pricing of higher-cost time deposits in the Florida deposit base acquired with Peoples First. The provision for loan losses for the Hancock segment declined $20.6 million in 2011, reflecting the improvement in certain credit quality metrics and general economic conditions, as discussed earlier. The addition of Whitney National Bank’s operations drove the significant changes in the Whitney segment’s operating results and financial position in 2011 compared to 2010. After deducting merger-related expenses in excess of $80 million, however, net income for 2011 for the Whitney segment increased only $5.0 million over 2010.
BALANCE SHEET ANALYSIS
Securities Available for Sale
Our investment in securities was $4.5 billion at December 31, 2011, compared to $1.5 billion at December 31, 2010. At December 31, 2011, all securities were classified as available for sale. Average investment securities were $3.1 billion for 2011 and $1.6 for 2010. The increases in both period end and average investment securities were due mainly to the Whitney acquisition.
The vast majority of securities in our portfolio are fixed rate and there were no investments in securities of a single issuer, other than U.S. Treasury and U.S. government agency securities and mortgage-backed securities issued or guaranteed by U.S. government agencies that exceeded 10% of stockholders’ equity. We do not invest in subprime or “Alt A” home mortgage loans. The investments are classified as available for sale and are carried at fair value. Unrealized holding gains are excluded from net income and are recognized, net of tax, in other comprehensive income and in accumulated other comprehensive income, a separate component of stockholders’ equity, until realized. At December 31, 2011, the average maturity of the portfolio was 3.69 years with an effective duration of 2.26 and an average yield of 3.22%.
36
Table of Contents
Our securities portfolio is an important source of liquidity and earnings. A stated objective in managing the securities portfolio is to provide consistent liquidity to support balance sheet growth while providing a safe and consistent stream of earnings.
The amortized costs of securities classified as available for sale at December 31, 2011, 2010 and 2009, were as follows (in thousands):
TABLE 5. Securities by Type
| Years Ended December 31, | ||||||||||||
| Available for sale securities |
2011 | 2010 | 2009 | |||||||||
| U.S. Treasury |
$ | 150 | $ | 10,797 | $ | 11,869 | ||||||
| U.S. government agencies |
248,595 | 106,054 | 131,858 | |||||||||
| Municipal obligations |
294,489 | 181,747 | 188,656 | |||||||||
| Mortgage-backed securities |
2,422,891 | 761,704 | 1,076,708 | |||||||||
| CMOs |
1,426,495 | 367,662 | 140,663 | |||||||||
| Other debt securities |
4,517 | 14,329 | 15,578 | |||||||||
| Equity securities |
4,208 | 3,428 | 1,071 | |||||||||
|
|
|
|
|
|
|
|||||||
| $ | 4,401,345 | $ | 1,445,721 | $ | 1,566,403 | |||||||
|
|
|
|
|
|
|
|||||||
The amortized cost, yield and fair value of debt securities at December 31, 2011, by contractual maturity, were as follows (in thousands):
TABLE 6. Securities Maturities by Type
| Available for sale |
One Year or Less |
Over One Year Through Five Years |
Over Five Years Through Ten Years |
Over Ten Years |
Total | Fair Value |
Weighted Average Yield |
|||||||||||||||||||||
| U.S. Treasury |
$ | — | $ | 150 | $ | — | $ | — | $ | 150 | $ | 164 | 4.65 | % | ||||||||||||||
| U.S. government agencies |
230,083 | 18,512 | — | — | 248,595 | 249,903 | 2.43 | % | ||||||||||||||||||||
| Municipal obligations |
58,563 | 108,055 | 106,984 | 20,887 | 294,489 | 309,665 | 3.79 | % | ||||||||||||||||||||
| Mortgage-backed securities |
3 | 20,231 | 281,997 | 2,120,660 | 2,422,891 | 2,480,345 | 3.65 | % | ||||||||||||||||||||
| CMOs |
— | 768,787 | 16,090 | 641,618 | 1,426,495 | 1,446,076 | 2.52 | % | ||||||||||||||||||||
| Other debt securities |
3,785 | 250 | 217 | 265 | 4,517 | 4,494 | 4.34 | % | ||||||||||||||||||||
|
|
|
|
|
|
|
|
|
|
|
|
|
|||||||||||||||||
| $ | 292,434 | $ | 915,985 | $ | 405,288 | $ | 2,783,430 | $ | 4,397,137 | $ | 4,490,647 | 3.22 | % | |||||||||||||||
|
|
|
|
|
|
|
|
|
|
|
|
|
|||||||||||||||||
| Fair Value |
$ | 293,803 | $ | 934,279 | $ | 421,935 | $ | 2,840,630 | $ | 4,490,647 | ||||||||||||||||||
|
|
|
|
|
|
|
|
|
|
|
|||||||||||||||||||
| Weighted Average Yield |
2.59 | % | 1.83 | % | 4.32 | % | 3.60 | % | 3.22 | % | ||||||||||||||||||
| Other Equity Securities |
$ | 4,208 | $ | 6,253 | N/A | |||||||||||||||||||||||
|
|
|
|
|
|
|
|
|
|
|
|
|
|||||||||||||||||
| Total available for sale securities |
$ | 4,401,345 | $ | 4,496,900 | 3.22 | % | ||||||||||||||||||||||
|
|
|
|
|
|
|
|
|
|
|
|
|
|||||||||||||||||
Loan Portfolio
With the Whitney acquisition, total loans increased $6.2 billion during 2011 to $11.2 billion at December 31, 2011. In general, loan demand from the Company’s customer base continued to be restrained by economic conditions during 2011, although some improvement was noted toward the end of the year. Loan trends will continue to be impacted by expected declines in the FDIC-covered portfolio acquired with People’s First at the end of 2009. The following table sets forth, for the periods indicated, the composition of our loan portfolio distinguished between loans originated, acquired and covered.
37
Table of Contents
The following table sets forth, for the periods indicated, the composition of our loan portfolio:
Table 7. Loans Outstanding by Type
| Years Ended December 31, | ||||||||||||||||||||
| 2011 | 2010 | 2009 | 2008 | 2007 | ||||||||||||||||
| (In thousands) | ||||||||||||||||||||
| Originated loans: |
||||||||||||||||||||
| Commercial |
$ | 1,525,409 | $ | 1,046,431 | $ | 984,057 | $ | 1,011,942 | $ | 727,985 | ||||||||||
| Construction |
540,806 | 495,590 | 535,439 | 585,375 | 571,018 | |||||||||||||||
| Real estate |
1,259,757 | 1,231,414 | 1,162,838 | 1,083,828 | 898,535 | |||||||||||||||
| Residential mortgage loans |
487,147 | 366,183 | 395,946 | 427,545 | 389,684 | |||||||||||||||
| Consumer loans |
1,074,611 | 1,008,395 | 1,084,925 | 1,140,600 | 1,009,335 | |||||||||||||||
|
|
|
|
|
|
|
|
|
|
|
|||||||||||
| Total originated loans |
$ | 4,887,730 | $ | 4,148,013 | $ | 4,163,205 | $ | 4,249,290 | $ | 3,596,557 | ||||||||||
|
|
|
|
|
|
|
|
|
|
|
|||||||||||
| Acquired loans: |
||||||||||||||||||||
| Commercial |
$ | 2,236,758 | $ | — | $ | — | $ | — | $ | — | ||||||||||
| Construction |
603,371 | — | — | — | — | |||||||||||||||
| Real estate |
1,656,515 | — | — | — | — | |||||||||||||||
| Residential mortgage loans |
734,669 | — | — | — | — | |||||||||||||||
| Consumer loans |
386,540 | — | — | — | — | |||||||||||||||
|
|
|
|
|
|
|
|
|
|
|
|||||||||||
| Total acquired loans |
$ | 5,617,853 | $ | — | $ | — | $ | — | $ | — | ||||||||||
|
|
|
|
|
|
|
|
|
|
|
|||||||||||
| Covered loans: |
||||||||||||||||||||
| Commercial |
$ | 38,063 | $ | 35,190 | $ | 661 | $ | — | $ | — | ||||||||||
| Construction |
118,828 | 157,267 | 298,500 | — | — | |||||||||||||||
| Real estate |
82,651 | 181,873 | 179,416 | — | — | |||||||||||||||
| Residential mortgage loans |
285,682 | 293,506 | 343,953 | — | — | |||||||||||||||
| Consumer loans |
146,219 | 141,315 | 128,440 | — | — | |||||||||||||||
|
|
|
|
|
|
|
|
|
|
|
|||||||||||
| Total covered loans |
$ | 671,443 | $ | 809,151 | $ | 950,970 | $ | — | $ | — | ||||||||||
|
|
|
|
|
|
|
|
|
|
|
|||||||||||
| Total loans: |
||||||||||||||||||||
| Commercial |
$ | 3,800,230 | $ | 1,081,621 | $ | 984,718 | $ | 1,011,942 | $ | 727,985 | ||||||||||
| Construction |
1,263,005 | 652,857 | 833,939 | 585,375 | 571,018 | |||||||||||||||
| Real estate |
2,998,923 | 1,413,287 | 1,342,254 | 1,083,828 | 898,535 | |||||||||||||||
| Residential mortgage loans |
1,507,498 | 659,689 | 739,899 | 427,545 | 389,684 | |||||||||||||||
| Consumer loans |
1,607,370 | 1,149,710 | 1,213,365 | 1,140,600 | 1,009,335 | |||||||||||||||
|
|
|
|
|
|
|
|
|
|
|
|||||||||||
| Total loans |
$ | 11,177,026 | $ | 4,957,164 | $ | 5,114,175 | $ | 4,249,290 | $ | 3,596,557 | ||||||||||
|
|
|
|
|
|
|
|
|
|
|
|||||||||||
Originated loans include loans from legacy Hancock and loans newly originated from legacy Whitney locations since the acquisition in 2011. Acquired loans are those purchased in the Whitney acquisition on June 4, 2011, including loans that were performing satisfactorily at the date (acquired performing) and loans acquired with evidence of credit deterioration (acquired impaired). Covered loans are those purchased in the December 2009 acquisition of Peoples First, which are covered by loss share agreements between the FDIC and the Company that afford significant loss protection. Purchased loans acquired in a business combination are recorded at estimated fair value on their purchase date without carryover of any allowance for loan losses. Certain differences in the accounting for originated loans and for acquired performing and acquired impaired loans (which include all Peoples First covered loans) are described in Note 1 to the consolidated financial statements.
Total originated loans increased $739.7 million from December 31, 2010 through year-end 2011 associated mainly with customers of legacy Whitney locations. Originated commercial loans were up $479.0 million, reflecting in part some improvement in overall loan demand across the Company’s market areas toward the end of 2011, seasonal demand from certain Whitney customers and new customer development. The Whitney acquisition brought with it a relatively large base of commercial customers and a team of experienced commercial lending officers.
38
Table of Contents
The Company’s commercial base is diversified over a range of industries, including oil and gas (O&G), wholesale and retail trade in various durable and nondurable products and the manufacture of such products, marine transportation and maritime construction, financial and professional services, and agricultural production. Loans outstanding to O&G industry customers totaled approximately $600 million at December 31, 2011, the majority of which are with customers who provide transportation and other services and products to support exploration and production activities. The Banks lend mainly to middle-market and smaller commercial entities, although they do occasionally participate in larger shared-credit loan facilities with familiar businesses operating in the Company’s market areas. Shared-credits funded at December 31, 2011 totaled $630 million, of which $164 million was with O&G customers.
Originated construction loans, which include land development loans, and originated commercial real estate loans, which include loans on both income-producing and owner-occupied properties, increased a combined $73.6 million in 2011. Although the Banks seek and are funding new loans on construction and commercial real estate projects, the availability of creditworthy projects continues to be limited following the weak economic conditions in recent years and a severe downturn in parts of the real estate market. These conditions and the anticipated payoffs and scheduled payments on existing construction and commercial mortgage loans will limit the rate of growth in these portfolios. Approximately $1.6 billion of the total $3.0 billion in commercial real estate loans at December 31, 2011 is secured by properties used in the borrower’s business.
The $121.0 million increase in originated residential mortgage loans reflected mainly the incremental impact of Whitney lending operations since the acquisition date. The Banks originate both fixed-rate and adjustable-rate home loans, although most fixed-rate production is sold in the secondary mortgage market on a best-efforts basis.
The portfolio of acquired Whitney loans has decreased approximately $840 million since the acquisition date, with $220 million in the commercial category, $440 million in the construction and commercial real estate categories, and $180 million in the residential mortgage and consumer loan categories. The required divestiture of certain Whitney branches included approximately $47 million of loans. There were no significant trends underlying the reduction in the commercial category, although approximately $60 million of commercial relationships with identified credit issues prior to the acquisition date were successfully resolved post-acquisition. Reductions in the acquired construction and commercial real estate categories as well as the residential mortgage and consumer categories reflected mainly normal repayment and refinancing activity. Approximately $140 million of loans with pre-acquisition credit issues were paid off by the end of 2011.
The covered loan portfolio decreased $138 million reflecting normal repayments, charge-offs and foreclosures. The covered portfolio will continue to decline over the terms of the loss share agreements.
The following table shows average loans for each of the prior three years and the effective taxable-equivalent yield earned on each category presented.
Table 8. Average Loans
| Years Ended December 31, | ||||||||||||||||||||||||||||||||||||
| 2011 | 2010 | 2009 | ||||||||||||||||||||||||||||||||||
| (In thousands) | ||||||||||||||||||||||||||||||||||||
| Balance | TE Yield | Mix | Balance | TE Yield | Mix | Balance | TE Yield | Mix | ||||||||||||||||||||||||||||
| Total loans: |
||||||||||||||||||||||||||||||||||||
| Commercial Loans |
$ | 2,590,707 | 4.90 | % | 30.42 | % | $ | 1,012,950 | 5.72 | % | 20.24 | % | $ | 1,007,030 | 5.33 | % | 23.37 | % | ||||||||||||||||||
| Construction loans |
1,022,344 | 6.04 | % | 12.01 | % | 712,818 | 4.21 | % | 14.24 | % | 578,563 | 4.81 | % | 13.42 | % | |||||||||||||||||||||
| Real estate loans |
2,354,944 | 6.01 | % | 27.66 | % | 1,369,077 | 5.54 | % | 27.35 | % | 1,140,300 | 5.67 | % | 26.46 | % | |||||||||||||||||||||
| Residential mortgage loans |
1,137,922 | 6.85 | % | 13.37 | % | 733,996 | 6.14 | % | 14.66 | % | 451,823 | 5.75 | % | 10.48 | % | |||||||||||||||||||||
| Consumer loans |
1,408,104 | 6.98 | % | 16.54 | % | 1,176,912 | 7.21 | % | 23.51 | % | 1,132,404 | 7.14 | % | 26.27 | % | |||||||||||||||||||||
|
|
|
|
|
|
|
|
|
|
|
|
|
|
|
|
|
|
|
|||||||||||||||||||
| Total loans |
$ | 8,514,021 | 5.97 | % | 100.00 | % | $ | 5,005,753 | 5.86 | % | 100.00 | % | $ | 4,310,120 | 5.89 | % | 100.00 | % | ||||||||||||||||||
|
|
|
|
|
|
|
|
|
|
|
|
|
|
|
|
|
|
|
|||||||||||||||||||
The following table sets forth, for the periods indicated, the approximate contractual maturity by type of the loan portfolio:
Table 9. Loans Maturities by Type
| December 31, 2011 Maturity Range |
||||||||||||||||
| Within One Year |
After One Through Five Years |
After Five Years |
Total | |||||||||||||
| Total loans: |
||||||||||||||||
| Commercial Loans: |
||||||||||||||||
| Commercial |
$ | 1,913,917 | $ | 1,304,072 | $ | 582,241 | $ | 3,800,230 | ||||||||
| Construction |
593,579 | 524,262 | 145,164 | 1,263,005 | ||||||||||||
| Real estate |
593,439 | 2,025,110 | 380,374 | 2,998,923 | ||||||||||||
| Residential mortgage loans |
132,316 | 364,392 | 1,010,790 | 1,507,498 | ||||||||||||
| Consumer loans |
340,111 | 636,929 | 630,330 | 1,607,370 | ||||||||||||
|
|
|
|
|
|
|
|
|
|||||||||
| Total loans |
$ | 3,573,362 | $ | 4,854,765 | $ | 2,748,899 | $ | 11,177,026 | ||||||||
|
|
|
|
|
|
|
|
|
|||||||||
39
Table of Contents
The sensitivity to interest rate changes of that portion of our loan portfolio that matures after one year is shown below:
TABLE 10. Loans Sensitivity to Changes in Interest Rates
| December 31, 2011 | ||||||||||||
| Fixed rate | Floating rate | Total | ||||||||||
| (In thousands) | ||||||||||||
| Total loans: |
||||||||||||
| Commercial Loans: |
||||||||||||
| Commercial |
$ | 1,028,458 | $ | 857,855 | $ | 1,886,313 | ||||||
| Construction |
373,844 | 295,582 | 669,426 | |||||||||
| Real estate |
1,548,756 | 856,728 | 2,405,484 | |||||||||
| Residential mortgage loans |
779,556 | 595,626 | 1,375,182 | |||||||||
| Consumer loans |
687,208 | 580,051 | 1,267,259 | |||||||||
|
|
|
|
|
|
|
|||||||
| Total loans |
$ | 4,417,822 | $ | 3,185,842 | $ | 7,603,664 | ||||||
|
|
|
|
|
|
|
|||||||
Non-performing Assets
Non-performing assets consist of loans accounted for on a non-accrual basis, restructured loans and foreclosed assets. Loans are placed on a non-accrual status when (1) payment in full, of principal or interest is not expected or (2) the principal or interest has been in default for a period of 90 days, unless the loan is well secured and in the process of collection. All accrued but uncollected interest related to the loan is deducted from income in the period the loan is assigned a non-accrual status. For such period as a loan is in nonaccrual status, any cash receipts are applied first to principal, second to expenses incurred to cause payment to be made and lastly to the recovery of any reversed interest income and interest that would be due and owing subsequent to the loan being placed on non-accrual status.
The following table sets forth non-performing assets by type for the periods indicated, consisting of non-accrual loans, troubled debt restructurings and real estate owned. Loans past due 90 days or more and still accruing are also disclosed:
40
Table of Contents
TABLE 11. Non-performing Assets
| December 31, | ||||||||||||||||||||
| 2011 | 2010 | 2009 | 2008 | 2007 | ||||||||||||||||
| (In thousands) | ||||||||||||||||||||
| Total loans: |
||||||||||||||||||||
| Loans accounted for on a non-accrual basis: |
||||||||||||||||||||
| Commercial loans |
$ | 69,113 | $ | 83,994 | $ | 46,739 | $ | 25,510 | $ | 11,971 | ||||||||||
| Commercial loans—restructured |
4,142 | 8,302 | — | — | — | |||||||||||||||
|
|
|
|
|
|
|
|
|
|
|
|||||||||||
| Total Commercial loans |
73,255 | 92,296 | 46,739 | 25,510 | 11,971 | |||||||||||||||
| Residential mortgage loans |
25,043 | 21,489 | 32,293 | 4,466 | 1,096 | |||||||||||||||
| Residential mortgage loans—restructured |
— | 409 | — | — | — | |||||||||||||||
|
|
|
|
|
|
|
|
|
|
|
|||||||||||
| Total residential mortgage loans |
25,043 | 21,898 | 32,293 | 4,466 | 1,096 | |||||||||||||||
| Consumer loans |
4,972 | 6,791 | 7,523 | — | — | |||||||||||||||
|
|
|
|
|
|
|
|
|
|
|
|||||||||||
| Total non-accrual loans |
103,270 | 120,985 | 86,555 | 29,976 | 13,067 | |||||||||||||||
|
|
|
|
|
|
|
|
|
|
|
|||||||||||
| Restructured loans: |
||||||||||||||||||||
| Commercial loans—non-accrual |
4,142 | 8,302 | — | — | — | |||||||||||||||
| Residential mortgage loans—non-accrual |
— | 409 | — | — | — | |||||||||||||||
|
|
|
|
|
|
|
|
|
|
|
|||||||||||
| Total restructured loans—non-accrual |
4,142 | 8,711 | — | — | — | |||||||||||||||
|
|
|
|
|
|
|
|
|
|
|
|||||||||||
| Commercial loans—still accruing |
12,812 | 3,301 | — | — | — | |||||||||||||||
| Residential mortgage loans—still accruing |
1,191 | 629 | — | — | — | |||||||||||||||
|
|
|
|
|
|
|
|
|
|
|
|||||||||||
| Total restructured loans—still accruing |
14,003 | 3,930 | — | — | — | |||||||||||||||
|
|
|
|
|
|
|
|
|
|
|
|||||||||||
| Total restructured loans |
18,145 | 12,641 | — | — | — | |||||||||||||||
|
|
|
|
|
|
|
|
|
|
|
|||||||||||
| Foreclosed assets |
159,751 | 33,277 | 14,336 | 5,360 | 2,297 | |||||||||||||||
| Total non-performing assets* |
$ | 277,024 | $ | 158,192 | $ | 100,891 | $ | 35,336 | $ | 15,364 | ||||||||||
|
|
|
|
|
|
|
|
|
|
|
|||||||||||
| Loans 90 days past due still accruing |
$ | 5,880 | $ | 1,492 | $ | 11,647 | $ | 11,005 | $ | 4,154 | ||||||||||
|
|
|
|
|
|
|
|
|
|
|
|||||||||||
| Ratios |
||||||||||||||||||||
| Non-performing assets to loans plus foreclosed assets |
2.44 | % | 3.17 | % | 1.97 | % | 0.83 | % | 0.43 | % | ||||||||||
| Allowance for loan losses to non-performing assets and accruing loans 90 days past due |
44.14 | % | 51.35 | % | 58.69 | % | 133.16 | % | 241.43 | % | ||||||||||
| Loans 90 days past due still accruing to loans |
0.05 | % | 0.03 | % | 0.23 | % | 0.26 | % | 0.11 | % | ||||||||||
| * | Includes total non-accrual loans, total restructured loans—still accruing and total foreclosed assets. |
Total non-performing assets at December 31, 2011 were $277.0 million, an increase of $118.8 million, or 75%, from December 31, 2010. The main factor was an increase in foreclosed assets of $126.5 million, including foreclosures from loans on $95.1 million related to the Whitney acquisition and approximately $28.3 million from loans covered under FDIC loss-sharing agreements.
Non-accrual loans were $103.3 million at December 31, 2011, a decrease of $17.7 million from December 31, 2010. Covered and acquired loans accounted for in accordance with ASC 310-30 are considered to be performing due to the application of the accretion method. These loans are excluded from the above table due to their performing status. Certain covered loans accounted for using the cost recovery method or acquired loans accounted for in accordance with ASC 310-20 are disclosed as non-accrual loans. Covered loans accounted for using the cost recovery method totaled $18.8 million and $45.3 million at December 31, 2011 and 2010, respectively. Non-accrual acquired loans accounted for in accordance with ASC 310-20 totaled $1.1 million at December 31, 2011. Included in non-accrual loans is $4.1 million in restructured commercial loans.
Total troubled debt restructurings for the period were $18.1 million. Loan restructurings occur when a borrower is experiencing, or is expected to experience, financial difficulties in the near-term and, consequently, a modification that would otherwise not be considered is granted to the borrower. The concessions involve paying interest only for a period of 6 to 12 months or extensions of maturity date. We do not typically lower the interest rate or forgive principal or interest as part of the loan modification. There have been no commitments to lend additional funds to any borrowers whose loans have been restructured. Troubled debt restructurings can involve loans remaining on non-accrual, moving to non-accrual, or continuing to accrue, depending on the individual facts and circumstances of the borrower. In accordance with accounting guidance, modified acquired credit-impaired loans are not removed from a pool even if the loans would otherwise be deemed troubled debt restructurings.
41
Table of Contents
The evaluation of the borrower’s financial condition and prospects include consideration of the borrower’s sustained historical repayment performance for a reasonable period prior to the date on which the loan is returned to accrual status. A sustained period of repayment performance generally would be a minimum of six months and would involve payments of cash or cash equivalents. If the borrower’s ability to meet the revised payment schedule is not reasonably assured, the loan remains classified as a non-accrual loan.
The amount of interest that would have been recorded on non-accrual loans had the loans not been classified as “non-accrual” was $4.9 million, $5.7 million, $2.0 million, $1.1 million and $0.05 million for the years ended December 31, 2011, 2010, 2009, 2008 and 2007, respectively. Interest actually received on non-accrual loans at December 31, 2011 and 2010 was $1.1 million and $1.0 million, respectively, and for the years ended December 31, 2009, 2008 and 2007 was not material.
Certain loans that are 90 days or more past due as to interest or principal but are well secured and in the process of collection, are considered still accruing. Loans that are over 90 days past due but still accruing were $5.9 million at December 31, 2011 compared to $1.5 million at December 31, 2010. Acquired loans accounted for in accordance with ASC 310-20 that are 90 days or more past due and still accruing were $1.0 million at December 31, 2011. As mentioned above, non-accrual loans and accruing loans 90 days past due do not include acquired credit-impaired loans which were written down to their fair value at acquisition and accrete interest income over the remaining life of the loan.
Allowance for Loan and Lease Losses
Management, with Audit Committee oversight, is responsible for maintaining an effective loan review system, and internal controls, which include an effective risk rating system that identifies, monitors, and addresses asset quality problems in an accurate and timely manner. The allowance is evaluated for adequacy on at least a quarterly basis. For a discussion of this process, see Note 1 to the consolidated financial statements located in Item 8 of this annual report on Form 10-K. We utilize quantitative methodologies to determine the adequacy of the allowance for loan and lease losses and are of the opinion that the allowance at December 31, 2011 is adequate.
At December 31, 2011, the allowance for loan losses was $124.9 million compared to $82.0 million at December 31, 2010, an increase of $42.9 million. The increase in the allowance for loan losses during 2011 is primarily attributed to a $52.4 million allowance on covered loans. The increase was offset by a $49.4 million increase in the FDIC loss share indemnification asset. The ratio of the allowance for loan losses as a percent of period-end loans was 1.12% at December 31, 2011 compared to 1.65% at December 31, 2010. The decrease in the allowance ratio is related to the addition of Whitney’s loan portfolio. Whitney’s allowance was not carried forward at acquisition. The ratio of the allowance for loan losses as a percent of period-end loans, excluding the acquired and covered portfolios, was 1.70% at December 31, 2011 compared to 1.96% at December 31, 2010. Additional asset quality metrics for the acquired (Whitney), covered (Peoples First) and originated (legacy Hancock plus newly originated) portfolios are included in Selected Financial Data.
Net charge-offs decreased to $45.3 million in 2011, as compared to $50.7 million in 2010. Overall, the allowance for loan losses was 101.0% of non-performing loans and accruing loans 90 days past due at year-end 2011 compared to 51.4% at year-end 2010.
The following table presents average net loans outstanding, both period-end and average, allowance for loan losses, amounts charged-off and recoveries of loans previously charged-off for 2011 and the preceding four years:
42
Table of Contents
TABLE 12. Summary of Activity in the Allowance for Loan Losses
| At and For The Years Ended December 31, | ||||||||||||||||||||
| 2011 | 2010 | 2009 | 2008 | 2007 | ||||||||||||||||
| (In thousands) | ||||||||||||||||||||
| Net loans outstanding at end of period: |
||||||||||||||||||||
| Non-covered |
$ | 10,505,583 | $ | 4,148,013 | $ | 4,163,235 | $ | 4,249,290 | $ | 3,596,557 | ||||||||||
| Covered |
671,443 | 809,151 | 950,940 | — | — | |||||||||||||||
|
|
|
|
|
|
|
|
|
|
|
|||||||||||
| Total net loans outstanding at end of period |
$ | 11,177,026 | $ | 4,957,164 | $ | 5,114,175 | $ | 4,249,290 | $ | 3,596,557 | ||||||||||
|
|
|
|
|
|
|
|
|
|
|
|||||||||||
| Average net loans outstanding: |
||||||||||||||||||||
| Non-covered |
$ | 7,764,584 | $ | 4,138,007 | $ | 4,276,259 | $ | 3,873,908 | $ | 3,428,009 | ||||||||||
| Covered |
749,437 | 867,746 | 33,861 | — | — | |||||||||||||||
|
|
|
|
|
|
|
|
|
|
|
|||||||||||
| Total average net loans outstanding |
$ | 8,514,021 | $ | 5,005,753 | $ | 4,310,120 | $ | 3,873,908 | $ | 3,428,009 | ||||||||||
|
|
|
|
|
|
|
|
|
|
|
|||||||||||
| Balance of allowance for loan losses at beginning of period |
$ | 81,997 | $ | 66,050 | $ | 61,725 | $ | 47,123 | $ | 46,772 | ||||||||||
|
|
|
|
|
|
|
|
|
|
|
|||||||||||
| Loans charged-off: |
||||||||||||||||||||
| Non-covered loans: |
||||||||||||||||||||
| Commercial |
$ | 43,654 | $ | 39,393 | $ | 36,912 | $ | 12,996 | $ | 2,763 | ||||||||||
| Residential mortgages |
2,634 | 4,615 | 3,670 | 1,360 | 530 | |||||||||||||||
| Consumer |
12,500 | 14,258 | 14,333 | 13,051 | 11,159 | |||||||||||||||
|
|
|
|
|
|
|
|
|
|
|
|||||||||||
| Total non-covered charge-offs |
$ | 58,788 | $ | 58,266 | $ | 54,915 | $ | 27,407 | $ | 14,452 | ||||||||||
|
|
|
|
|
|
|
|
|
|
|
|||||||||||
| Covered loans: |
||||||||||||||||||||
| Commercial |
$ | 11,100 | $ | — | $ | — | $ | — | $ | — | ||||||||||
| Consumer |
375 | — | — | — | — | |||||||||||||||
|
|
|
|
|
|
|
|
|
|
|
|||||||||||
| Total covered charge-offs |
11,475 | — | — | — | — | |||||||||||||||
|
|
|
|
|
|
|
|
|
|
|
|||||||||||
| Total charge-offs |
$ | 70,263 | $ | 58,266 | $ | 54,915 | $ | 27,407 | $ | 14,452 | ||||||||||
|
|
|
|
|
|
|
|
|
|
|
|||||||||||
| Recoveries of loans previously charged-off: |
||||||||||||||||||||
| Non-covered loans: |
||||||||||||||||||||
| Commercial |
$ | 20,006 | $ | 3,491 | $ | 767 | $ | 1,036 | $ | 2,817 | ||||||||||
| Residential mortgages |
1,091 | 740 | 241 | 162 | 188 | |||||||||||||||
| Consumer |
3,887 | 3,353 | 3,642 | 4,026 | 4,205 | |||||||||||||||
|
|
|
|
|
|
|
|
|
|
|
|||||||||||
| Total recoveries |
24,984 | 7,584 | 4,650 | 5,224 | 7,210 | |||||||||||||||
|
|
|
|
|
|
|
|
|
|
|
|||||||||||
| Net charge-offs—non-covered |
33,804 | 50,682 | 50,265 | 22,183 | 7,242 | |||||||||||||||
| Net charge-offs—covered |
11,475 | — | — | — | — | |||||||||||||||
|
|
|
|
|
|
|
|
|
|
|
|||||||||||
| Total net charge-offs |
45,279 | 50,682 | 50,265 | 22,183 | 7,242 | |||||||||||||||
| Provision for loan losses, net (a) |
38,732 | 65,991 | 54,590 | 36,785 | 7,593 | |||||||||||||||
| Increase in indemnification asset (a) |
49,431 | 638 | — | — | — | |||||||||||||||
|
|
|
|
|
|
|
|
|
|
|
|||||||||||
| Balance of allowance for loan losses at end of period |
$ | 124,881 | $ | 81,997 | $ | 66,050 | $ | 61,725 | $ | 47,123 | ||||||||||
|
|
|
|
|
|
|
|
|
|
|
|||||||||||
| Ratios: |
||||||||||||||||||||
| Non-covered: |
||||||||||||||||||||
| Gross charge-offs—non-covered to average loans |
0.69 | % | 1.16 | % | 1.27 | % | 0.71 | % | 0.42 | % | ||||||||||
| Recoveries—non-covered to average loans |
0.29 | % | 0.15 | % | 0.11 | % | 0.13 | % | 0.21 | % | ||||||||||
| Net charge-offs—non-covered to average loans |
0.40 | % | 1.01 | % | 1.17 | % | 0.57 | % | 0.21 | % | ||||||||||
| Allowance for loan losses—non-covered to period-end net loans |
0.75 | % | 1.64 | % | 1.29 | % | 1.45 | % | 1.31 | % | ||||||||||
| Net charge-offs—non-covered to period-end net loans |
0.30 | % | 1.02 | % | 0.98 | % | 0.52 | % | 0.20 | % | ||||||||||
| Allowance for loan losses—non-covered to average loans |
0.98 | % | 1.62 | % | 1.53 | % | 1.59 | % | 1.37 | % | ||||||||||
| Net charge-offs to loan loss allowance—non-covered |
40.61 | % | 62.32 | % | 76.10 | % | 35.94 | % | 15.37 | % | ||||||||||
| Covered: |
||||||||||||||||||||
| Gross charge-offs—covered to average loans |
0.13 | % | 0.00 | % | 0.00 | % | 0.00 | % | 0.00 | % | ||||||||||
| Recoveries to average loans |
0.00 | % | 0.00 | % | 0.00 | % | 0.00 | % | 0.00 | % | ||||||||||
| Net charge-offs—covered to average loans |
0.13 | % | 0.00 | % | 0.00 | % | 0.00 | % | 0.00 | % | ||||||||||
| Allowance for loan losses—covered to year end loans |
0.37 | % | 0.08 | % | 0.00 | % | 0.00 | % | 0.00 | % | ||||||||||
| Net charge-offs—covered to period-end net loans |
0.10 | % | 0.00 | % | 0.00 | % | 0.00 | % | 0.00 | % | ||||||||||
| Allowance for loan losses—covered to average loans |
0.49 | % | 0.01 | % | 0.00 | % | 0.00 | % | 0.00 | % | ||||||||||
| Net charge-offs to loan loss allowance—covered |
27.56 | % | 0.00 | % | 0.00 | % | 0.00 | % | 0.00 | % | ||||||||||
| (a) | The provision for loan losses is shown “net” after coverage provided by FDIC loss share agreements on covered loans. This results in an increase in the indemnification asset, which is the difference between the provision for loan losses on covered loans of $52,437, and the impairment ($3,006) on those covered loans at December 31, 2011. |
At December 31, 2010, the increase in the indemnification asset was the difference between the provision for loan losses on covered loans of $672, and the impairment ($34) on those covered loans.
43
Table of Contents
TABLE 12. Summary of Activity in the Allowance for Loan Losses—(continued)
| December 31, 2011 | ||||||||||||
| Originated Loans |
Covered Loans |
Total | ||||||||||
| Beginning Balance |
$ | 81,325 | $ | 672 | $ | 81,997 | ||||||
| Provision for loan losses before FDIC loss share benefit |
35,726 | 52,437 | 88,163 | |||||||||
| Benefit attributable to FDIC loss share agreement |
— | (49,431 | ) | (49,431 | ) | |||||||
|
|
|
|
|
|
|
|||||||
| Net provision for loan losses |
35,726 | 3,006 | 38,732 | |||||||||
|
|
|
|
|
|
|
|||||||
| Increase in indemnification asset |
— | 49,431 | 49,431 | |||||||||
| Charge-offs |
58,788 | 11,475 | 70,263 | |||||||||
| Recoveries |
24,984 | — | 24,984 | |||||||||
|
|
|
|
|
|
|
|||||||
| Net charge-offs |
33,804 | 11,475 | 45,279 | |||||||||
|
|
|
|
|
|
|
|||||||
| Ending Balance |
$ | 83,247 | $ | 41,634 | $ | 124,881 | ||||||
|
|
|
|
|
|
|
|||||||
| December 31, 2010 | ||||||||||||
| Originated Loans |
Covered Loans |
Total | ||||||||||
| Beginning Balance |
$ | 66,050 | $ | — | $ | 66,050 | ||||||
| Provision for loan losses before FDIC loss share benefit |
65,957 | 672 | 66,629 | |||||||||
| Benefit attributable to FDIC loss share agreement |
— | (638 | ) | (638 | ) | |||||||
|
|
|
|
|
|
|
|||||||
| Net provision for loan losses |
65,957 | 34 | 65,991 | |||||||||
|
|
|
|
|
|
|
|||||||
| Increase in indemnification asset |
— | 638 | 638 | |||||||||
| Charge-offs |
58,266 | — | 58,266 | |||||||||
| Recoveries |
7,584 | — | 7,584 | |||||||||
|
|
|
|
|
|
|
|||||||
| Net charge-offs |
50,682 | — | 50,682 | |||||||||
|
|
|
|
|
|
|
|||||||
| Ending Balance |
$ | 81,325 | $ | 672 | $ | 81,997 | ||||||
|
|
|
|
|
|
|
|||||||
An allocation of the loan loss allowance by major loan category is set forth in the following table. There were no relevant variations in loan concentrations, quality or terms. The allocation is not necessarily indicative of the category of incurred losses, and the full allowance at December 31, 2011 is available to absorb losses occurring in any category of loans.
TABLE 13. Allocation of Loan Loss by Category
| For Years Ended December 31, | ||||||||||||||||||||||||||||||||||||||||
| 2011 | 2010 | 2009 | 2008 | 2007 | ||||||||||||||||||||||||||||||||||||
| Allowance for Loan Losses (1) |
% of Loans to Total Loans (2) |
Allowance for Loan Losses (1) |
% of Loans to Total Loans (2) |
Allowance for Loan Losses (1) |
% of Loans to Total Loans (2) |
Allowance for Loan Losses (1) |
% of Loans to Total Loans (2) |
Allowance for Loan Losses (1) |
% of Loans to Total Loans (2) |
|||||||||||||||||||||||||||||||
| (In thousands) | ||||||||||||||||||||||||||||||||||||||||
| Total loans: |
||||||||||||||||||||||||||||||||||||||||
| Commercial |
$ | 78,414 | 71.76 | $ | 56,859 | 63.22 | $ | 42,483 | 61.37 | $ | 37,347 | 62.77 | $ | 29,015 | 60.78 | |||||||||||||||||||||||||
| Residential mortgages |
13,918 | 13.94 | 4,626 | 13.53 | 4,782 | 14.82 | 5,315 | 10.30 | 1,998 | 11.10 | ||||||||||||||||||||||||||||||
| Consumer |
32,549 | 14.30 | 20,512 | 23.25 | 18,785 | 23.81 | 19,063 | 26.93 | 16,110 | 28.12 | ||||||||||||||||||||||||||||||
|
|
|
|
|
|
|
|
|
|
|
|
|
|
|
|
|
|
|
|
|
|||||||||||||||||||||
| $ | 124,881 | 100.00 | $ | 81,997 | 100.00 | $ | 66,050 | 100.00 | $ | 61,725 | 100.00 | $ | 47,123 | 100.00 | ||||||||||||||||||||||||||
|
|
|
|
|
|
|
|
|
|
|
|
|
|
|
|
|
|
|
|
|
|||||||||||||||||||||
| (1) | Loans used in the calculation of “allowance for loan losses” are grouped according to loan purpose. |
| (2) | Loans used in the calculation of “% of loans to total loans” are grouped by collateral type. |
Deposits
Total average deposits increased $4.8 billion, or 69%, to $11.7 billion in 2011 compared to 2010. Whitney’s acquired deposit base added approximately $5.2 billion to total average deposits in 2011, including $2.2 billion of demand deposits, $2.1 billion of interest-bearing transaction accounts, and $0.9 million of time deposits. Foreign branch deposits also came from the Whitney acquisition. Excluding the impact of the Whitney deposit base, total average deposits were down $425.1 million or 6%. Decreases in time deposits and NOW account balances were partially offset by increases in demand deposits and money market accounts. Average time deposits decreased $684.6 million due mainly to the expected runoff of high priced deposits in the Peoples First deposit base. The Banks have also adjusted the pricing of time deposits in light of low market rates, strong liquidity in the deposit base, and weak to moderate loan demand, particularly following the Whitney acquisition. The $185.2 million decline in average NOW balances came largely from public fund customers. Average balances of noninterest bearing demand deposits were up $151.3 million, or 14%, in 2011. Money market account deposits increased by an average of $185.2 million, or 21%, including the movement of some funds from maturing Peoples First time deposits. In the current low rate environment, management continues to expect customers will be motivated to hold funds in no or low-cost transactions accounts until rates begin to rise.
46
Table of Contents
Table 14 shows average deposits for each year in the three-year period ended December 31, 2011 as well as the effective rates paid during the year.
TABLE 14. Average Deposits
| 2011 | 2010 | 2009 | ||||||||||||||||||||||||||||||||||
| Balance | Rate | Mix | Balance | Rate | Mix | Balance | Rate | Mix | ||||||||||||||||||||||||||||
| (Dollars in thousands) | ||||||||||||||||||||||||||||||||||||
| NOW account deposits |
$ | 2,252,605 | 0.27 | % | 19 | % | $ | 1,697,720 | 0.65 | % | 25 | % | $ | 1,616,523 | 1.09 | % | 28 | % | ||||||||||||||||||
| Money market deposits |
2,076,017 | 0.31 | 18 | 864,582 | 0.71 | 12 | 652,572 | 0.95 | 11 | |||||||||||||||||||||||||||
| Savings deposits |
988,645 | 0.07 | 8 | 428,083 | 0.12 | 6 | 372,781 | 0.12 | 7 | |||||||||||||||||||||||||||
| Foreign branch deposits |
94,377 | 0.34 | 1 | — | — | — | — | — | — | |||||||||||||||||||||||||||
| Time deposits (including Public Funds CDs) |
2,904,845 | 1.45 | 25 | 2,850,284 | 1.94 | 41 | 2,119,738 | 2.84 | 38 | |||||||||||||||||||||||||||
|
|
|
|
|
|
|
|
|
|
|
|
|
|
|
|
|
|
|
|||||||||||||||||||
| Total interest-bearing deposits |
8,316,489 | 0.67 | % | 71 | 5,840,669 | 1.25 | % | 84 | 4,761,614 | 1.77 | % | 84 | ||||||||||||||||||||||||
|
|
|
|
|
|
|
|
|
|
|
|
|
|
|
|
|
|
|
|||||||||||||||||||
| Non-interest bearing demand deposits |
3,400,064 | 29 | 1,076,829 | 16 | 935,985 | 16 | ||||||||||||||||||||||||||||||
|
|
|
|
|
|
|
|
|
|
|
|
|
|||||||||||||||||||||||||
| Total deposits |
$ | 11,716,553 | 100 | % | $ | 6,917,498 | 100 | % | $ | 5,697,599 | 100 | % | ||||||||||||||||||||||||
|
|
|
|
|
|
|
|
|
|
|
|
|
|||||||||||||||||||||||||
Time certificates of deposit of $100,000 and greater at December 31, 2011 had maturities as follows:
TABLE 15. Maturity of Time Deposits greater than or equal to $100,000
| December 31 2011 |
||||
| (In thousands) | ||||
| Three months |
$ | 653,285 | ||
| Over three through six months |
285,194 | |||
| Over six months through one year |
321,953 | |||
| Over one year |
309,588 | |||
|
|
|
|||
| Total |
$ | 1,570,020 | ||
|
|
|
|||
Short-Term Borrowings
The following table sets forth certain information concerning our short-term borrowings, which consist of federal funds purchased, securities sold under agreements to repurchase and FHLB borrowings. The additional borrowings under repurchase agreements in 2011 came mainly through the Whitney acquisition and treasury-management services offered to Whitney deposit customers. Customer repurchase agreements are the main source of such borrowings in each year.
45
Table of Contents
TABLE 16. Short-Term Borrowings
| Years Ended December 31, | ||||||||||||
| 2011 | 2010 | 2009 | ||||||||||
| (In thousands) | ||||||||||||
| Federal funds purchased: |
||||||||||||
| Amount outstanding at period-end |
$ | 16,819 | $ | — | $ | 250 | ||||||
| Weighted average interest at period-end |
0.19 | % | 0.00 | % | 0.11 | % | ||||||
| Maximum amount at any month-end during period |
$ | 26,666 | $ | 6,900 | $ | 4,700 | ||||||
| Average amount outstanding during period |
$ | 12,911 | $ | 2,734 | $ | 3,484 | ||||||
| Weighted average interest rate during period |
0.18 | % | 0.13 | % | 0.21 | % | ||||||
| Securities sold under agreements to repurchase: |
||||||||||||
| Amount outstanding at period-end |
$ | 1,027,635 | $ | 364,676 | $ | 484,457 | ||||||
| Weighted average interest at period-end |
0.65 | % | 1.69 | % | 1.99 | % | ||||||
| Maximum amount at any month end during-period |
$ | 1,027,635 | $ | 534,627 | $ | 567,888 | ||||||
| Average amount outstanding during period |
$ | 681,474 | $ | 477,174 | $ | 523,351 | ||||||
| Weighted average interest rate during period |
1.03 | % | 1.95 | % | 2.06 | % | ||||||
| FHLB borrowings: |
||||||||||||
| Amount outstanding at period-end |
$ | — | $ | 10,172 | $ | 30,805 | ||||||
| Weighted average interest at period-end |
0.00 | % | 1.19 | % | 0.38 | % | ||||||
| Maximum amount at any month end during-period |
$ | 10,153 | $ | 30,676 | $ | 156,000 | ||||||
| Average amount outstanding during period |
$ | 81,673 | $ | 22,846 | $ | 75,160 | ||||||
| Weighted average interest rate during period |
0.15 | % | 0.57 | % | 0.17 | % | ||||||
COMMITMENTS AND CONTINGENCIES
Loan Commitments and Letters of Credit
In the normal course of business, the Banks enter into financial instruments, such as commitments to extend credit and letters of credit, to meet the financing needs of their customers. Such instruments are not reflected in the accompanying consolidated financial statements until they are funded, although they expose the Banks to varying degrees of credit risk and interest rate risk in much the same way as funded loans.
Commitments to extend credit include revolving commercial credit lines, nonrevolving loan commitments issued mainly to finance the acquisition and development of construction of real property or equipment, and credit card and personal credit lines. The availability of funds under commercial credit lines and loan commitments generally depends on whether the borrower continues to meet credit standards established in the underlying contract and has not violated other contractual conditions. Loan commitments generally have fixed expiration dates or other termination clauses and may require payment of a fee by the borrower. Credit card and personal credit lines are generally subject to cancellation if the borrower’s credit quality deteriorates. A number of commercial and personal credit lines are used only partially or, in some cases, not at all before they expire, and the total commitment amounts do not necessarily represent future cash requirements of the Company.
46
Table of Contents
A substantial majority of the letters of credit are standby agreements that obligate the Banks to fulfill a customer’s financial commitments to a third party if the customer is unable to perform. The Banks issue standby letters of credit primarily to provide credit enhancement to their customers’ other commercial or public financing arrangements and to help them demonstrate financial capacity to vendors of essential goods and services.
The contract amounts of these instruments reflect the Company’s exposure to credit risk. The Banks undertake the same credit evaluation in making loan commitments and assuming conditional obligations as it does for on-balance sheet instruments and may require collateral or other credit support.
The following table shows the commitments to extend credit and letters of credit at December 31, 2011 and 2010 according to expiration date. Of the commitments to extend credit, approximately $3.8 billion carry variable rates and the remainder fixed rates.
TABLE 17. Commitments and Letters of Credit
| Expiration Date | ||||||||||||||||||||
| Total | Less than 1 year |
1-3 years |
3-5 years |
More than 5 years |
||||||||||||||||
| (In thousands) | ||||||||||||||||||||
| December 31, 2011 |
||||||||||||||||||||
| Commitments to extend credit |
$ | 4,189,421 | $ | 2,948,411 | $ | 556,500 | $ | 420,372 | $ | 264,138 | ||||||||||
| Letters of credit |
441,048 | 286,934 | 140,494 | 13,620 | — | |||||||||||||||
|
|
|
|
|
|
|
|
|
|
|
|||||||||||
| Total |
$ | 4,630,469 | $ | 3,235,345 | $ | 696,994 | $ | 433,992 | $ | 264,138 | ||||||||||
|
|
|
|
|
|
|
|
|
|
|
|||||||||||
| Expiration Date | ||||||||||||||||||||
| Total | Less than 1 year |
1-3 years |
3-5 years |
More than 5 years |
||||||||||||||||
| (In thousands) | ||||||||||||||||||||
| December 31, 2010 |
||||||||||||||||||||
| Commitments to extend credit |
$ | 912,206 | $ | 527,426 | $ | 81,719 | $ | 56,715 | $ | 246,346 | ||||||||||
| Letters of credit |
87,038 | 31,271 | 35,920 | 19,231 | 616 | |||||||||||||||
|
|
|
|
|
|
|
|
|
|
|
|||||||||||
| Total |
$ | 999,244 | $ | 558,697 | $ | 117,639 | $ | 75,946 | $ | 246,962 | ||||||||||
|
|
|
|
|
|
|
|
|
|
|
|||||||||||
Credit Risk
The Banks’ primary lending focus is to provide commercial, consumer, and real estate loans to consumers, to small and middle market businesses, to corporate clients in their respective market areas, and to State, County, and Municipal government entities. Diversification in the loan portfolio is a means of reducing the risks associated with economic fluctuations. The Banks have no significant concentrations of loans to particular borrowers or industries or any foreign entities. The Banks monitor real estate lending concentrations throughout the year, and do not have any commercial real estate concentrations, as defined by interagency guidelines. The Banks have actively decreased their exposure to residential construction/development lending over the course of the last three years. Considering national housing trends, local market demand for housing, price softness in some markets, population migration trends, as well as general economic conditions, the Company will continue to closely monitor this type of lending in the near future.
Third party property valuations are obtained at the time of origination for real estate secured loans. When a determination is made that a loan has deteriorated to the point of becoming a problem loan, updated valuations may be ordered to help determine if there is impairment, leading to a recommendation for partial charge off or appropriate allowance allocation. The impairment on collateral-dependent loans is measured against the property valuation less estimated selling costs. Selling costs are estimated based on the Bank’s actual experience with the disposition of similar properties. Loans that are risk-graded as substandard or doubtful and are $1,000,000 and greater in size are required to have third party valuations performed annually to determine the extent of impairment and the need for loss allowances or charge-offs. Property valuations are ordered through, and reviewed by, the Bank’s Appraisal Department consistent with regulatory requirements. The Bank typically orders an “as is” valuation for collateral property if the loan is in a criticized loan classification.
47
Table of Contents
For loans under $1,000,000 but over $500,000, we use current loss statistics from sales of other real estate to discount prior property valuations as part of the ongoing assessment of the level of impairment in these real estate secured loans. If, in the opinion of management, the value is still in question, it may be necessary to obtain a recertification of the appraisal on hand or obtain an updated or completely new appraisal. New appraisals that indicate impairment are discussed monthly with management and appropriate provisions or charge-offs are recognized promptly.
The Bank maintains an active Loan Review function to help ensure that developing credit problems are captured and recognized in a timely manner. Further, an active Watch List review routine is in place as part of the Bank’s problem loan management strategy and a list of loans 90 days past due and still accruing is reviewed with management, including the Chief Credit Officer, at least monthly. Recommendations flow from all of the above activities to recognize non-performing loans and determine accrual status.
ASSET/LIABILITY MANAGEMENT
Asset liability management consists of quantifying, analyzing and controlling interest rate risk (IRR) to maintain stability in net interest income (NII) under varying interest rate environments. The principal objective of ALM is to maximize net interest income while operating within acceptable risk limits established for interest rate risk and maintaining adequate levels of liquidity. Our net earnings are materially dependent on our net interest income.
IRR on the Company’s balance sheets consists of reprice, option, yield curve, and basis risks. Reprice risk results from differences in the maturity, or repricing, of asset and liability portfolios. Option risk arises from “embedded options” present in many financial instruments such as loan prepayment options, deposit early withdrawal options and interest rate options. These options allow customers opportunities to benefit when market interest rates change, which typically results in higher costs or lower revenue for the Company. Yield Curve risk refers to the risk resulting from unequal changes in the spread between two or more rates for different maturities for the same instrument. Basis risk refers to the potential for changes in the underlying relationship between market rates and indices, which subsequently result in a narrowing of the profit spread on an earning asset or liability. Basis risk is also present in administered rate liabilities, such as savings accounts, negotiable order of withdrawal accounts, and money market accounts where historical pricing relationships to market rates may change due to the level or directional change in market interest rates.
The Asset/Liability Committee (ALCO) manages our IRR exposures through pro-active measurement, monitoring, and management actions. ALCO strives to maintain levels of IRR within limits approved by the Board of Directors through a Risk Management policy that is designed to produce a stable net interest margin (NIM) in periods of interest rate fluctuation. Accordingly, the Company’s interest rate sensitivity and liquidity are monitored on an ongoing basis by its ALCO, which oversees market risk management and establishes risk measures, limits and policy guidelines for managing the amount of interest rate risk and its effect on net interest income and capital. A variety of measures are used to provide for a comprehensive view of the magnitude of interest rate risk, the distribution of risk, the level of risk over time and the exposure to changes in certain interest rate relationships.
48
Table of Contents
The Company utilizes an asset/liability model as the primary quantitative tool in measuring the amount of interest rate risk associated with changing market rates. The model is used to perform net interest income (NII), economic value of equity (EVE), and GAP analysis. The model quantifies the effects of various interest rate scenarios on projected net interest income and net income over the next 12 months and 24 month periods. The model measures the impact on net interest income relative to a base case scenario of hypothetical fluctuations in interest rates over the next 12 months. These simulations incorporate assumptions regarding balance sheet growth and mix, pricing and the repricing and maturity characteristics of the existing and projected balance sheet. The impact of interest rate derivatives, such as interest rate swaps, caps and floors, is also included in the model. Other interest rate-related risks such as prepayment, basis and option risk are also considered.
The Static Gap Report shown in Table 18 measures the net amounts of assets and liabilities that re-price within a given time period over the remaining lives of those instruments. At December 31, 2011, our cumulative re-pricing gap in the one year interval was +10.0%. The asset sensitive position results from a deposit funding mix with significant balances in non-interest bearing and core interest bearing transaction deposits along with a large asset position short-term interest bearing investments and fed funds sold. The earning asset position is strategically managed with a balance in our loan growth (fixed versus floating and duration targets) and securities portfolio cash flows. We believe we are adequately positioned for the current rate environment.
The assumed prepayment of investments and loans was based on our assessment of current market conditions on such dates. Estimates have been made for the re-pricing of savings, NOW and money market accounts. Actual prepayments and deposit withdrawals will differ from the following analysis due to variable economic circumstances and consumer behavior. Although assets and liabilities may have similar maturities or re-pricing periods, reactions will vary as to timing and degree of interest rate change.
TABLE 18. Analysis of Interest Sensitivity
| December 31, 2011 | ||||||||||||||||||||||||||||
| Within 1 month |
1 month to 6 months |
6 months to 1 year |
1 to 3 years |
> 3 years |
Non-Sensitive Balance |
Total | ||||||||||||||||||||||
| (In thousands) | ||||||||||||||||||||||||||||
| Assets |
||||||||||||||||||||||||||||
| Securities |
$ | 106,109 | $ | 659,094 | $ | 403,431 | $ | 1,243,943 | $ | 2,084,323 | $ | — | $ | 4,496,900 | ||||||||||||||
| Federal funds sold & short-term investments |
1,184,419 | — | — | — | — | — | 1,184,419 | |||||||||||||||||||||
| Loans |
5,114,894 | 1,028,648 | 961,649 | 2,332,689 | 882,159 | 929,365 | 11,249,404 | |||||||||||||||||||||
| Other assets |
— | — | — | — | — | 2,843,373 | 2,843,373 | |||||||||||||||||||||
|
|
|
|
|
|
|
|
|
|
|
|
|
|
|
|||||||||||||||
| Total Assets |
$ | 6,405,422 | $ | 1,687,742 | $ | 1,365,080 | $ | 3,576,632 | $ | 2,966,482 | $ | 3,772,738 | $ | 19,774,096 | ||||||||||||||
|
|
|
|
|
|
|
|
|
|
|
|
|
|
|
|||||||||||||||
| Liabilities |
||||||||||||||||||||||||||||
| Interest bearing transaction deposits |
$ | 562,092 | $ | 1,638,962 | $ | 1,171,298 | $ | 1,852,459 | $ | 2,009,717 | $ | — | $ | 7,234,528 | ||||||||||||||
| Time deposits |
373,027 | 1,276,723 | 691,318 | 423,668 | 197,979 | — | 2,962,715 | |||||||||||||||||||||
| Non-interest bearing deposits |
90,503 | 430,730 | 471,996 | 1,482,295 | 3,040,812 | — | 5,516,336 | |||||||||||||||||||||
| Fed funds purchased |
16,819 | — | — | — | — | — | 16,819 | |||||||||||||||||||||
| Borrowings |
816,403 | 183,882 | 25,000 | 85,000 | 271,240 | — | 1,381,525 | |||||||||||||||||||||
| Other liabilities |
— | — | — | — | — | 295,010 | 295,010 | |||||||||||||||||||||
| Stockholders’ equity |
— | — | — | — | — | 2,367,163 | 2,367,163 | |||||||||||||||||||||
|
|
|
|
|
|
|
|
|
|
|
|
|
|
|
|||||||||||||||
| Total Liabilities & Equity |
$ | 1,858,844 | $ | 3,530,297 | $ | 2,359,612 | $ | 3,843,422 | $ | 5,519,748 | $ | 2,662,173 | $ | 19,774,096 | ||||||||||||||
|
|
|
|
|
|
|
|
|
|
|
|
|
|
|
|||||||||||||||
| Interest sensitivity gap |
$ | 4,546,578 | $ | (1,842,555 | ) | $ | (994,532 | ) | $ | (266,790 | ) | $ | (2,553,266 | ) | $ | 1,110,565 | ||||||||||||
| Cumulative interest rate sensitivity gap |
$ | 4,546,578 | $ | 2,704,023 | $ | 1,709,491 | $ | 1,442,701 | $ | (1,110,565 | ) | — | ||||||||||||||||
| Rate sensitive assets to rate sensitive liabilities |
3.45 | 0.48 | 0.58 | 0.93 | 0.54 | |||||||||||||||||||||||
| Cumulative interest rate sensitivity gap as a percentage of total earning assets |
26.9 | % | 16.0 | % | 10.1 | % | 8.5 | % | (6.6 | )% | ||||||||||||||||||
49
Table of Contents
Net Interest Income at Risk
Net interest income at risk measures the risk of a change in earnings due to changes in interest rates. Table 19 presents an analysis of our interest rate risk as measured by the estimated changes in net interest income resulting from an instantaneous and sustained parallel shift in the yield curve at December 31, 2011. Shifts are measured in 100 basis point increments in a range of as much as +/-500 basis points (+ 300 through +100 basis points presented in Table 19) from base case. Base case encompasses key assumptions for asset/liability mix, loan and deposit growth, pricing, prepayment speeds, deposit decay rates, securities portfolio cash flows and reinvestment strategy, and the market value of certain assets under the various interest rate scenarios. The base case scenario assumes that the current interest rate environment is held constant throughout the forecast period; the instantaneous shocks are performed against that yield curve.
TABLE 19. Net Interest Income (te) at Risk
| Change in Interest Rates |
Estimated Increase (Decrease) in NII December 31, 2011 |
|||
| (basis points) |
||||
| Stable |
0.0 | % | ||
| + 100 |
1.7 | % | ||
| + 200 |
4.4 | % | ||
| + 300 |
7.3 | % | ||
Note: Decrease in interest rates discontinued in current rate environment
These scenarios are instantaneous shocks that assume balance sheet management will mirror base case. Should the yield curve begin to rise or fall, management has strategies available to maximize earnings opportunities or offset the negative impact to earnings. For example, in a rising rate environment, deposit pricing strategies could be adjusted to offer more competitive rates on long and medium-term CDs and less competitive rates on short-term CDs. Another opportunity at the start of such a cycle would be reinvesting the securities portfolio cash flows into short-term or floating-rate securities. On the loan side the company can make more floating-rate loans that tie to indices that re-price more frequently, such as LIBOR (London interbank offered rate) and make fewer fixed-rate loans. Finally, there are a number of hedge strategies by which management could use derivatives, including swaps and purchased ceilings, to lock in net interest margin protection.
Even if interest rates change in the designated amounts, there can be no assurance that our assets and liabilities would perform as anticipated. Additionally, a change in the U.S. Treasury rates in the designated amounts accompanied by a change in the shape of the U.S. Treasury yield curve would cause significantly different changes to NII than indicated above. Strategic management of our balance sheet and earnings is fluid and would be adjusted to accommodate these movements. As with any method of measuring interest rate risk, certain shortcomings are inherent in the methods of analysis presented above. For example, although certain assets and liabilities may have similar maturities or periods to re-pricing, they may react in different degrees to changes in market interest rates. Also, the interest rates on certain types of assets and liabilities may fluctuate in advance of changes in market interest rates, while interest rates on other types may lag behind changes in market rates. Certain assets such as adjustable-rate loans have features which restrict changes in interest rates on a short-term basis and over the life of the asset. Also, the ability of many borrowers to service their debt may decrease in the event of an interest rate increase. We consider all of these factors in monitoring exposure to interest rate risk.
50
Table of Contents
LIQUIDITY
Liquidity management encompasses our ability to ensure that funds are available to meet the cash flow requirements of depositors and borrowers, while also ensuring that we have adequate cash flow to meet our various needs, including operating, strategic and capital. Without proper liquidity management, we would not be able to perform the primary function of a financial intermediary and would not be able to meet the needs of the communities in which we have a presence and serve. In addition, the parent holding company’s principal source of liquidity is dividends from its subsidiary banks. Liquidity is required at the parent holding company level for the purpose of paying dividends to stockholders, servicing of any debt we may have, business combinations as well as general corporate expenses.
The asset portion of the balance sheet provides liquidity primarily through loan principal repayments, maturities of investment securities and occasional sales of various assets. Short-term investments such as federal funds sold, securities purchased under agreements to resell and maturing interest-bearing deposits with other banks are additional sources of liquidity funding. As shown in Table 20 below, our liquidity ratios as of December 31, 2011 and 2010 for free securities stood at 31.2% and 15.3%, respectively. Free securities represent unencumbered and unpledged securities assigned to dealer repo agreements that mature within 30 days and securities assigned to the Federal Reserve Bank discount window which are not pledged against current funding and which are available within one day.
TABLE 20. Liquidity Ratios
| 2011 | 2010 | |||||||
| (In thousands) | ||||||||
| Free securities |
31.20 | % | 15.30 | % | ||||
| Free securities-net wholesale funds/core deposits |
0.23 | % | 2.65 | % | ||||
|
|
|
|
|
|||||
| Wholesale funding diversification |
||||||||
| Certificate of deposits > $100,000* |
9.53 | % | 15.55 | % | ||||
| Brokered certificate of deposits |
0.00 | % | 0.00 | % | ||||
| Public fund certificate of deposits |
$ | 111,030 | $ | 114,084 | ||||
|
|
|
|
|
|||||
| Net wholesale funds |
$ | 1,340,299 | $ | 1,001,318 | ||||
| Core deposits |
$ | 14,216,496 | $ | 5,510,460 | ||||
|
|
|
|
|
|||||
*CDs > $100K includes public funds in 2011 and 2010
The liability portion of the balance sheet provides liquidity through various customers’ interest-bearing and non-interest-bearing deposit accounts. Purchases of federal funds, securities sold under agreements to repurchase and other short-term borrowings are additional sources of liquidity. These sources of liquidity are short-term in nature and are used as necessary to fund asset growth and meet short-term liquidity needs. Our short-term borrowing capacity includes an approved line of credit with the Federal Home Loan Bank of $2.73 billion and borrowing capacity at the Federal Reserve’s discount window in excess of $954.6 million. As of December 31, 2011 and 2010, our core deposits were $14.2 billion and $5.5 billion, respectively, and net wholesale funding stood at $1.3 billion and $1.0 billion, respectively. Core deposits represent total deposits less CDs greater than $100,000 and foreign branch deposits.
Cash generated from operations is another important source of funds to meet liquidity needs. The consolidated statements of cash flows provide present operating cash flows and summarize all significant sources and uses of funds for each of the three years in the period ended December 31, 2011.
51
Table of Contents
Contractual Obligations
Table 21 summarizes all significant contractual obligations at December 31, 2011, according to payments due by period. Obligations under deposit contracts and short-term borrowings are not included. The maturities of time deposits are scheduled in Table 15. Purchased obligations represent legal and binding contracts to purchase services and goods that cannot be settled or terminated without paying substantially all of the contractual amounts. Not included are contracts entered into to support ongoing operations that either do not specify fixed or minimum amounts of goods or services or are cancelable on short notice without cause and without significant penalty.
TABLE 21. Contractual Obligations
| Payment due by period | ||||||||||||||||||||
| Total | Less than 1 year |
1-3 years |
3-5 years |
More than 5 years |
||||||||||||||||
| (In thousands) | ||||||||||||||||||||
| Long-term debt obligations |
$ | 415,374 | $ | 13,664 | $ | 162,337 | $ | 53,505 | $ | 185,868 | ||||||||||
| Capital lease obligations |
196 | 71 | 81 | 11 | 33 | |||||||||||||||
| Operating lease obligations |
117,652 | 12,944 | 23,070 | 19,176 | 62,462 | |||||||||||||||
| Purchase obligations |
59,027 | 27,725 | 25,251 | 5,152 | 899 | |||||||||||||||
|
|
|
|
|
|
|
|
|
|
|
|||||||||||
| Total |
$ | 592,249 | $ | 54,404 | $ | 210,739 | $ | 77,844 | $ | 249,262 | ||||||||||
|
|
|
|
|
|
|
|
|
|
|
|||||||||||
CAPITAL RESOURCES
A strong capital position, which is vital to continued profitability, also promotes depositor and investor confidence and provides a solid foundation for future growth. Composite ratings by the respective regulatory authorities of the Company and the Banks establish minimum capital levels. Currently, we are required to maintain minimum Tier 1 leverage ratios of at least 3%, subject to an increase up to 5%, depending on the composite rating. At December 31, 2011, our capital balances and those of the Banks were well in excess of current regulatory minimum requirements as indicated in Table 22 below. The Company and the Banks have been categorized as “well capitalized” in the most recent notice received from our regulators.
As of December 31, 2011, our Leverage (Tier 1) ratio stands at 8.17%, while the tangible equity ratio is 7.96%. Although these and certain other ratios declined from the end of 2010 as a result of the Whitney acquisition, we remain very well capitalized so that we can maintain flexibility for future strategic needs, including additional acquisitions. We may consider raising additional capital at some point in the future.
TABLE 22. Risk-Based Capital and Capital Ratios
| 2011 | 2010 | 2009 | 2008 | 2007 | ||||||||||||||||
| (In thousands) | ||||||||||||||||||||
| Tier 1 regulatory capital |
$ | 1,506,218 | $ | 782,301 | $ | 756,108 | $ | 550,216 | $ | 498,731 | ||||||||||
| Tier 2 regulatory capital |
276,819 | 64,240 | 66,397 | 61,874 | 47,447 | |||||||||||||||
|
|
|
|
|
|
|
|
|
|
|
|||||||||||
| Total regulatory capital |
$ | 1,783,037 | $ | 846,541 | $ | 822,505 | $ | 612,090 | $ | 546,178 | ||||||||||
|
|
|
|
|
|
|
|
|
|
|
|||||||||||
| Risk-weighted assets |
$ | 13,118,693 | $ | 5,099,630 | $ | 6,305,707 | $ | 5,162,676 | $ | 4,523,479 | ||||||||||
|
|
|
|
|
|
|
|
|
|
|
|||||||||||
| Ratios |
||||||||||||||||||||
| Leverage (Tier 1 capital to average assets) |
8.17 | % | 9.65 | % | 10.60 | % | 8.06 | % | 8.51 | % | ||||||||||
| Tier 1 capital to risk-weighted assets |
11.48 | % | 15.34 | % | 11.99 | % | 10.66 | % | 11.03 | % | ||||||||||
| Total capital to risk-weighted assets |
13.59 | % | 16.60 | % | 13.04 | % | 11.86 | % | 12.07 | % | ||||||||||
| Common stockholders’ equity to total assets |
11.97 | % | 10.52 | % | 9.63 | % | 8.50 | % | 9.15 | % | ||||||||||
| Tangible common equity to total assets |
7.96 | % | 9.69 | % | 8.81 | % | 7.62 | % | 8.08 | % | ||||||||||
We made no stock purchases in 2011 or 2010. During 2008, we purchased a total of 6,458 shares of common stock at an aggregate price of $260,000, or $40.26 per share. These shares were purchased under the 2007 Stock Repurchase Plan, authorizing the repurchase of 3,000,000 shares, or approximately 10% of our outstanding common stock. Subject to market conditions, repurchases will be conducted solely through a Rule 10b-1 repurchase plan. Shares repurchased under this plan will be held in treasury and used for general corporate purposes as determined by our board of directors.
52
Table of Contents
FOURTH QUARTER RESULTS
Net income for the fourth quarter of 2011 was $19.0 million, or $0.22 per diluted common share, compared to $30.4 million, or $0.36, and $17.0 million, or $0.46, respectively in the third quarter of 2011 and the fourth quarter of 2010. Tax-effected merger-related expenses reduced diluted earnings per share by $0.31 in the fourth quarter of 2011 and by $0.17 in 2011’s third quarter. Merger-related expenses totaled $40.2 million and $22.8 million, respectively, in the fourth and third quarters of 2011. Merger expenses in the fourth quarter of 2010 were immaterial. The following discussion highlights recent factors impacting Hancock’s results of operations and financial position.
Total loans at December 31, 2011 were $11.2 billion, an increase of $75 million, or 1% from September 301, 2011. The linked-quarter increase reflected growth in the commercial and industrial portfolio and in the residential mortgage and consumer loan portfolios. Linked-quarter declines in both construction and commercial real estate loans reflected in part anticipated payoffs and scheduled payments in excess of new loans funded. After adjusting for the $50 million decline in the FDIC covered Peoples First portfolio during the fourth quarter, total loans increased $125 million.
Total deposits at December 31, 2011 were $15.7 billion, up $421 million, or 3% from September 30, 2011. The linked-quarter increase reflected year-end seasonality of both commercial and public fund customers. Historically, both legacy Hancock and legacy Whitney customers have built deposits at year-end, with some of those deposits leaving in the first quarter, particularly in demand deposits.
Demand deposits comprised 35% of total deposits at year-end 2011 compared to 33% at September 30, 2011. Interest bearing public fund deposits totaled $1.6 billion at year-end 2011, up $258 million, or 19%, from September 30, 2011. The increase was mainly related to seasonal tax collections toward year end. Time deposits decreased $279 million during the fourth quarter of 2011 with approximately $56 million from the anticipated runoff in the Peoples First deposit base. In the current low rate environment management continues to expect customers will be motivated to hold funds in no or low-cost transaction accounts until rates begin to rise.
Hancock recorded a total provision for loan losses for the fourth quarter of 2011 of $11.5 million compared to $9.3 million in the third quarter of 2011. The fourth quarter total provision included $1.3 million, net, related to the Peoples First portfolio which is covered under FDIC loss-sharing agreements, compared to $0.2 million for the third quarter of 2011. Net charge-offs from the non-covered loan portfolio in the fourth quarter of 2011 were $11.3 million, or 0.40% of average total loans on an annualized basis. This compares to net non-covered loan charge-offs of $7.8 million, or 0.28% of average total loans, for the third quarter of 2011. Net charge-offs from previously impaired loan pools in the covered portfolio were $11.1 million for the fourth quarter of 2011.
Net interest income (te) for the fourth quarter of 2011 was $181.3 million, compared to $180.2 million in the third quarter of 2011. Average earning assets declined approximately 1% between these periods, while the net interest margin (te) increased by 7 basis points to 4.39% in the fourth quarter of 2011. The impact of net purchase accounting adjustments drove the increase in the margin. The margin continued to be favorably impacted by a shift in funding sources and a decline in funding costs, offset by a less favorable shift in the mix of earning assets and a decline in investment portfolio yields.
Noninterest income totaled $60.6 million for the fourth quarter of 2011 compared to $65.0 million in the third quarter of 2011. Approximately 60%, or $2.5 million, of the linked-quarter decline in noninterest income reflects the impact of the reduction in debit card interchange rates related to the Durbin amendment. These changes began to be implemented at the beginning of the fourth quarter for certain of the Banks’ card accounts. As discussed earlier, the Company expects an additional loss of revenue of approximately $2 million per quarter when the new rates become effective for all of the Banks’ card accounts in 2012.
Noninterest expense, excluding merger-related expense, was down $5.9 million, or 3%, for the fourth quarter of 2011 compared to the prior quarter in 2011. This decline mainly reflects a $4 million reduction in personnel expense and a $3 million reduction in ORE expense. The efficiency ratio, excluding merger costs, was 65.39% for the fourth quarter of 2011 compared to 66.98% for the third quarter of 2011.
The summary of quarterly financial information appearing in Item 8 of this annual report on Form 10-K provides selected comparative financial information for each of the four quarters on 2011 and 2010.
53
Table of Contents
CRITICAL ACCOUNTING POLICIES AND ESTIMATES
The accounting principles we follow and the methods for applying these principles conform with accounting principles generally accepted in the United States of America and with general practices followed by the banking industry. The significant accounting principles and practices we follow are described in Note 1 to the consolidated financial statements. These principles and practices requires management to make estimates and assumptions about future events that affect the amounts reported in the consolidated financial statements and accompanying notes. We evaluate the estimates and assumptions we make on an ongoing basis to help ensure that the resulting reported amounts reflect management’s best estimates and judgments given current facts and circumstances dictate. The following discusses certain critical accounting policies that involve a higher degree of judgment and complexity in producing estimates that may significantly affect amounts reported in the consolidated financial statements and notes.
Acquisition Accounting
Acquisitions are accounted for under the purchase method of accounting. Purchased assets, including identifiable intangible assets, and assumed liabilities are recorded at their respective acquisition date fair values. Management applies various valuation methodologies to these assets and liabilities which often involve a significant degree of judgment, particularly when liquid markets do not exist for the particular item being valued. Examples of such items include loans, deposits, identifiable intangible assets and certain other assets and liabilities acquired or assumed in business combinations. Management uses significant estimates and assumption to value such items, including, among others, projected cash flows, repayment rates, default rates and losses assuming default, discount rates, and realizable collateral values. The purchase date valuations and any subsequent adjustments also determine the amount of goodwill or bargain purchase gain recognized in connection with the business combination. Certain assumptions and estimates must be updated regularly in connection with the ongoing accounting for purchased loans. Valuation assumptions and estimates may also have to be revisited in connection with periodic assessments of possible value impairment, including impairment of goodwill, intangible assets and certain other long-lived assets. The use of different assumptions could produce significantly different valuation results, which could have material positive or negative effects on the Company’s results of operations.
Allowance for Loan Losses
The allowance for loan losses represents the amount which, in management’s judgment, will be adequate to absorb credit losses inherent in the loan portfolio as of the balance sheet date. In estimating inherent losses, management applies judgment and assumptions to project the amount and timing of future cash flows, collateral values and other factors used to assess the borrowers’ ability to repay their obligations. Historical loss trends are also considered, as are economic conditions, industry trends, portfolio trends and borrower-specific financial information. Although we believe we have identified appropriate factors for review and designed and implemented adequate procedures to support our estimation process, the allowance remains an estimate about the effect of matters that are inherently uncertain. Changes in the circumstances considered when management develops its judgments and assumptions can materially impact the allowance estimate, potentially subjecting the Company to significant earnings volatility.
54
Table of Contents
Accounting for Retirement Benefits
Management makes a variety of assumptions in applying principles that govern the accounting for benefits under the Company’s defined benefit pension plans and other postretirement benefit plans. These assumptions are essential to the actuarial valuation that determines the amounts recognized and certain disclosures it makes in the consolidated financial statements related to the operation of these plans. Two of the more significant assumptions concern the expected long-term rate of return on plan assets and the rate needed to discount projected benefits to their present value. Changes in these assumptions impact the cost of retirement benefits recognized in net income and comprehensive income. Certain assumptions are closely tied to current conditions and are generally revised at each measurement date. For example, the discount rate is reset annually with reference to market yields on high quality fixed-income investments. Other assumptions, such as the rate of return on assets, are determined, in part, with reference to historical and expected conditions over time and are not as susceptible to frequent revision. Holding other factors constant, the cost of retirement benefits will move opposite to changes in either the discount rate or the rate of return on assets. Note 12 to the consolidated financial statements provides further discussion on the accounting for Hancock’s retirement and employee benefit plans and the estimates used in determining the actuarial present value of the benefit obligations and the net periodic benefit expense.
55
Table of Contents
RECENT ACCOUNTING PRONOUNCEMENTS
See Note 1 to our Consolidated Financial Statements that appears in Item 8 of this Form 10-K.
| ITEM 7A. | QUANTITATIVE AND QUALITATIVE DISCLOSURES ABOUT MARKET RISK |
The information required for this item is included in the section entitled “Asset/Liability Management” in “Management’s Discussion and Analysis of Financial Condition and Results of Operations” that appears in Item 7 of this Form 10-K and is incorporated here by reference.
56
Table of Contents
| ITEM 8. | FINANCIAL STATEMENTS AND SUPPLEMENTARY DATA |
The Company’s unaudited quarterly results for 2011 and 2010 are presented below. The operations acquired in the Whitney merger are reflected in 2011 from the June 4, 2011 acquisition date.
Summary of Quarterly Results
(Unaudited)
| 2011 | ||||||||||||||||
| First | Second | Third | Fourth | |||||||||||||
| (In thousands, except per share data) | ||||||||||||||||
| Interest income (te) |
$ | 85,405 | $ | 118,335 | $ | 200,936 | $ | 199,453 | ||||||||
| Interest expense |
(15,769 | ) | (16,418 | ) | (20,653 | ) | (18,131 | ) | ||||||||
|
|
|
|
|
|
|
|
|
|||||||||
| Net interest income (te) |
69,636 | 101,917 | 180,283 | 181,322 | ||||||||||||
| Taxable equivalent adjustment |
(2,872 | ) | (2,858 | ) | (3,241 | ) | (2,953 | ) | ||||||||
|
|
|
|
|
|
|
|
|
|||||||||
| Net interest income |
66,764 | 99,059 | 177,042 | 178,369 | ||||||||||||
| Provision for loan losses |
(8,822 | ) | (9,144 | ) | (9,256 | ) | (11,512 | ) | ||||||||
| Noninterest income |
34,132 | 46,679 | 64,951 | 60,572 | ||||||||||||
| Noninterest expense |
(73,019 | ) | (121,366 | ) | (194,019 | ) | (205,610 | ) | ||||||||
|
|
|
|
|
|
|
|
|
|||||||||
| Income before income taxes |
19,055 | 15,228 | 38,718 | 21,819 | ||||||||||||
| Income tax expense |
(3,727 | ) | (3,140 | ) | (8,342 | ) | (2,854 | ) | ||||||||
|
|
|
|
|
|
|
|
|
|||||||||
| Net income |
$ | 15,328 | $ | 12,088 | $ | 30,376 | $ | 18,965 | ||||||||
|
|
|
|
|
|
|
|
|
|||||||||
| Period end balance sheet data |
||||||||||||||||
| Total assets |
$ | 8,311,034 | $ | 19,757,545 | $ | 19,415,689 | $ | 19,774,096 | ||||||||
| Earning assets |
7,201,598 | 16,867,167 | 16,666,181 | 16,930,723 | ||||||||||||
| Loans |
4,840,975 | 11,249,053 | 11,101,566 | 11,177,026 | ||||||||||||
| Deposits |
6,697,310 | 15,587,909 | 15,292,209 | 15,713,579 | ||||||||||||
| Stockholders’ equity |
1,057,699 | 2,386,313 | 2,426,662 | 2,367,163 | ||||||||||||
| Average balance sheet data |
||||||||||||||||
| Total assets |
$ | 8,237,371 | $ | 11,588,822 | $ | 19,555,684 | $ | 19,331,379 | ||||||||
| Earning assets |
7,075,382 | 9,931,572 | 16,591,314 | 16,429,537 | ||||||||||||
| Loans |
4,887,749 | 6,678,840 | 11,248,728 | 11,142,188 | ||||||||||||
| Deposits |
6,752,470 | 9,211,332 | 15,461,704 | 15,305,563 | ||||||||||||
| Stockholders’ equity |
879,838 | 1,458,552 | 2,419,403 | 2,422,924 | ||||||||||||
| Ratios |
||||||||||||||||
| Return on average assets |
0.75 | % | 0.42 | % | 0.62 | % | 0.39 | % | ||||||||
| Return on average common equity |
7.07 | % | 3.32 | % | 4.98 | % | 3.11 | % | ||||||||
| Net interest margin (te) |
3.97 | % | 4.11 | % | 4.32 | % | 4.39 | % | ||||||||
| Earnings per share |
||||||||||||||||
| Basic |
$ | 0.41 | $ | 0.22 | $ | 0.36 | $ | 0.22 | ||||||||
| Diluted |
$ | 0.41 | $ | 0.22 | $ | 0.36 | $ | 0.22 | ||||||||
| Cash dividends per common share |
$ | 0.24 | $ | 0.24 | $ | 0.24 | $ | 0.24 | ||||||||
| Market data: |
||||||||||||||||
| High sales price |
$ | 35.68 | $ | 34.57 | $ | 33.25 | $ | 33.72 | ||||||||
| Low sales price |
30.67 | 30.04 | 25.61 | 25.38 | ||||||||||||
| Period-end closing price |
32.84 | 30.98 | 26.81 | 31.97 | ||||||||||||
| Trading volume |
25,942 | 32,122 | 38,205 | 41,091 | ||||||||||||
Net interest income (te) is the primary component of earnings and represents the difference, or spread, between revenue generated from interest-earning assets and the interest expense related to funding those assets.
57
Table of Contents
Summary of Quarterly Results (continued)
(Unaudited)
| 2010 | ||||||||||||||||
| First | Second | Third | Fourth | |||||||||||||
| (In thousands, except per share data) | ||||||||||||||||
| Interest income (te) |
$ | 95,396 | $ | 92,788 | $ | 88,284 | $ | 87,917 | ||||||||
| Interest expense |
(25,800 | ) | (21,868 | ) | (18,576 | ) | (16,100 | ) | ||||||||
|
|
|
|
|
|
|
|
|
|||||||||
| Net interest income (te) |
69,596 | 70,920 | 69,708 | 71,817 | ||||||||||||
| Taxable equivalent adjustment |
(3,017 | ) | (3,047 | ) | (2,886 | ) | (2,878 | ) | ||||||||
|
|
|
|
|
|
|
|
|
|||||||||
| Net interest income |
66,579 | 67,873 | 66,822 | 68,939 | ||||||||||||
| Provision for loan losses |
(13,826 | ) | (24,517 | ) | (16,258 | ) | (11,390 | ) | ||||||||
| Noninterest income |
31,381 | 35,293 | 35,208 | 35,067 | ||||||||||||
| Noninterest expense |
(67,823 | ) | (72,122 | ) | (68,060 | ) | (71,257 | ) | ||||||||
|
|
|
|
|
|
|
|
|
|||||||||
| Income before income taxes |
16,311 | 6,527 | 17,712 | 21,359 | ||||||||||||
| Income tax expense |
(2,478 | ) | (27 | ) | (2,859 | ) | (4,339 | ) | ||||||||
|
|
|
|
|
|
|
|
|
|||||||||
| Net income |
$ | 13,833 | $ | 6,500 | $ | 14,853 | $ | 17,020 | ||||||||
|
|
|
|
|
|
|
|
|
|||||||||
| Period end balance sheet data |
||||||||||||||||
| Total assets |
$ | 8,565,480 | $ | 8,500,018 | $ | 8,239,362 | $ | 8,138,327 | ||||||||
| Earning assets |
7,481,886 | 7,421,956 | 7,157,273 | 7,107,078 | ||||||||||||
| Loans |
5,011,690 | 4,972,202 | 4,907,697 | 4,957,164 | ||||||||||||
| Deposits |
7,004,727 | 6,960,571 | 6,708,798 | 6,775,719 | ||||||||||||
| Stockholders’ equity |
850,803 | 861,282 | 865,780 | 856,548 | ||||||||||||
| Average balance sheet data |
||||||||||||||||
| Total assets |
$ | 8,654,396 | $ | 8,511,555 | $ | 8,364,660 | $ | 8,180,211 | ||||||||
| Earning assets |
7,474,544 | 7,343,904 | 7,194,100 | 7,044,192 | ||||||||||||
| Loans |
5,008,539 | 5,008,838 | 4,975,934 | 4,951,533 | ||||||||||||
| Deposits |
7,122,156 | 6,993,017 | 6,836,626 | 6,723,464 | ||||||||||||
| Stockholders’ equity |
853,119 | 861,135 | 872,936 | 875,327 | ||||||||||||
| Ratios |
||||||||||||||||
| Return on average assets |
0.65 | % | 0.31 | % | 0.70 | % | 0.83 | % | ||||||||
| Return on average common equity |
6.58 | % | 3.03 | % | 6.75 | % | 7.71 | % | ||||||||
| Net interest margin (te) |
3.75 | % | 3.87 | % | 3.85 | % | 4.06 | % | ||||||||
| Earnings per share |
||||||||||||||||
| Basic |
$ | 0.37 | $ | 0.17 | $ | 0.40 | $ | 0.46 | ||||||||
| Diluted |
$ | 0.37 | $ | 0.17 | $ | 0.40 | $ | 0.46 | ||||||||
| Cash dividends per common share |
$ | 0.24 | $ | 0.24 | $ | 0.24 | $ | 0.24 | ||||||||
| Market data: |
||||||||||||||||
| High closing price |
$ | 45.86 | $ | 43.90 | $ | 35.40 | $ | 37.26 | ||||||||
| Low closing price |
38.23 | 33.27 | 26.82 | 28.88 | ||||||||||||
| Period-end closing price |
41.81 | 33.36 | 30.07 | 34.86 | ||||||||||||
| Trading volume |
9,612 | 12,443 | 14,318 | 13,701 | ||||||||||||
Net interest income (te) is the primary component of earnings and represents the difference, or spread, between revenue generated from interest-earning assets and the interest expense related to funding those assets.
58
Table of Contents
MANAGEMENT’S REPORT ON INTERNAL CONTROL OVER FINANCIAL REPORTING
The management of Hancock Holding Company has prepared the consolidated financial statements and other information in our Annual Report in accordance with accounting principles generally accepted in the United States of America and is responsible for its accuracy. The financial statements necessarily include amounts that are based on management’s best estimates and judgments.
In meeting its responsibility, management relies on internal accounting and related control systems. The internal control systems are designed to ensure that transactions are properly authorized and recorded in the Company’s financial records and to safeguard the Company’s assets from material loss or misuse. Such assurance cannot be absolute because of inherent limitations in any internal control system.
The Company’s management is responsible for establishing and maintaining adequate internal control over financial reporting, as such term is defined in the Exchange Act Rules 13(a) – 15(f). Under the supervision and with the participation of management, including the Company’s principal executive officers and principal financial officer, the Company conducted an evaluation of the effectiveness of internal control over financial reporting based on the framework in Internal Control – Integrated Framework issued by the Committee of Sponsoring Organizations of the Treadway Commission. Management also conducted an assessment of requirements pertaining to Section 112 of the Federal Deposit Insurance Corporation Improvement Act (FDICIA). This section relates to management’s evaluation of internal control over financial reporting, including controls over the preparation of the schedules equivalent to the basic financial statements and compliance with laws and regulations. Our evaluation included a review of the documentation of controls, evaluations of the design of the internal control system and tests of the effectiveness of internal controls.
The Company’s internal controls over financial reporting as of December 31, 2011 has been audited by PricewaterhouseCoopers, LLP, an independent registered public accounting firm, as stated in their accompany report which expresses an unqualified opinion on the effectiveness of the Company’s internal control over financial reporting as of December 31, 2011.
Based on the Company’s evaluation under the framework in Internal Control – Integrated Framework, management concluded that internal control over financial reporting was effective as of December 31, 2011.
| Carl J. Chaney |
John M. Hairston |
Michael M. Achary | ||
| President & |
Chief Executive Officer & |
Chief Financial Officer | ||
| Chief Executive Officer |
Chief Operating Officer |
February 28, 2012 | ||
| February 28, 2012 |
February 28, 2012 |
59
Table of Contents
Report of Independent Registered Public Accounting Firm
To the Board of Directors and Shareholders
of Hancock Holding Company:
In our opinion, the accompanying consolidated balance sheet and the related consolidated statements of income, stockholders’ equity and cash flows present fairly, in all material respects, the financial position of Hancock Holding Company (the “Company”) and its subsidiaries at December 31, 2011 and December 31, 2010, and the results of its operations and its cash flows for each of the three years in the period ended December 31, 2011 in conformity with accounting principles generally accepted in the United States of America. Also in our opinion, the Company maintained, in all material respects, effective internal control over financial reporting as of December 31, 2011, based on criteria established in Internal Control—Integrated Framework issued by the Committee of Sponsoring Organizations of the Treadway Commission (COSO). The Company’s management is responsible for these financial statements, for maintaining effective internal control over financial reporting and for its assessment of the effectiveness of internal control over financial reporting, included in the accompanying Management’s Report on Internal Control over Financial Reporting. Our responsibility is to express an opinion on these financial statements and on the Company’s internal control over financial reporting based on our integrated audits. We conducted our audits in accordance with the standards of the Public Company Accounting Oversight Board (United States). Those standards require that we plan and perform the audits to obtain reasonable assurance about whether the financial statements are free of material misstatement and whether effective internal control over financial reporting was maintained in all material respects. Our audits of the financial statements included examining, on a test basis, evidence supporting the amounts and disclosures in the financial statements, assessing the accounting principles used and significant estimates made by management, and evaluating the overall financial statement presentation. Our audits of internal control over financial reporting included obtaining an understanding of internal control over financial reporting, assessing the risk that a material weakness exists, and testing and evaluating the design and operating effectiveness of internal control based on the assessed risk. Our audits also included performing such other procedures as we considered necessary in the circumstances. We believe that our audits provide a reasonable basis for our opinion.
A company’s internal control over financial reporting is a process designed to provide reasonable assurance regarding the reliability of financial reporting and the preparation of financial statements for external purposes in accordance with generally accepted accounting principles. Management’s assessment and our audit of the Company’s internal control over financial reporting also included controls over the preparation of financial statements in accordance with the instructions to the Consolidated Financial Statements for Bank Holding Companies (Form FR Y-9C) to comply with the reporting requirements of Section 112 of the Federal Deposit Insurance Corporation Improvement Act (FDICIA). A company’s internal control over financial reporting includes those policies and procedures that (i) pertain to the maintenance of records that, in reasonable detail, accurately and fairly reflect the transactions and dispositions of the assets of the company; (ii) provide reasonable assurance that transactions are recorded as necessary to permit preparation of financial statements in accordance with generally accepted accounting principles, and that receipts and expenditures of the company are being made only in accordance with authorizations of management and directors of the company; and (iii) provide reasonable assurance regarding prevention or timely detection of unauthorized acquisition, use, or disposition of the company’s assets that could have a material effect on the financial statements.
Because of its inherent limitations, internal control over financial reporting may not prevent or detect misstatements. Also, projections of any evaluation of effectiveness to future periods are subject to the risk that controls may become inadequate because of changes in conditions, or that the degree of compliance with the policies or procedures may deteriorate.
/s/PricewaterhouseCoopers LLP
February 28, 2012
New Orleans, Louisiana
60
Table of Contents
Hancock Holding Company and Subsidiaries
Consolidated Balance Sheets
| December 31, | ||||||||
| 2011 | 2010 | |||||||
| (In thousands, except share data) | ||||||||
| Assets: |
||||||||
| Cash and due from banks |
$ | 437,947 | $ | 139,687 | ||||
| Interest-bearing bank deposits |
1,184,222 | 364,066 | ||||||
| Federal funds sold |
197 | 124 | ||||||
| Other short-term investments |
— | 274,974 | ||||||
| Securities available for sale, at fair value (amortized cost of $4,401,345 and $1,445,721) |
4,496,900 | 1,488,885 | ||||||
| Loans held for sale |
72,378 | 21,866 | ||||||
| Loans |
11,191,901 | 4,968,149 | ||||||
| Less: allowance for loan losses |
(124,881 | ) | (81,997 | ) | ||||
| unearned income |
(14,875 | ) | (10,985 | ) | ||||
|
|
|
|
|
|||||
| Loans, net |
11,052,145 | 4,875,167 | ||||||
|
|
|
|
|
|||||
| Property and equipment, net of accumulated depreciation of $148,780 and $125,383 |
505,387 | 209,919 | ||||||
| Prepaid expense |
69,064 | 29,786 | ||||||
| Other real estate, net |
144,367 | 32,520 | ||||||
| Accrued interest receivable |
53,973 | 30,157 | ||||||
| Goodwill |
651,162 | 61,631 | ||||||
| Other intangible assets, net |
211,075 | 13,203 | ||||||
| Life insurance contracts |
355,026 | 159,377 | ||||||
| FDIC loss share receivable |
212,885 | 329,136 | ||||||
| Deferred tax asset, net |
145,760 | 6,541 | ||||||
| Other assets |
181,608 | 101,288 | ||||||
|
|
|
|
|
|||||
| Total assets |
$ | 19,774,096 | $ | 8,138,327 | ||||
|
|
|
|
|
|||||
| Liabilities and Stockholders’ Equity: |
||||||||
| Deposits: |
||||||||
| Non-interest bearing demand |
$ | 5,516,336 | $ | 1,127,246 | ||||
| Interest-bearing savings, NOW, money market and time |
10,197,243 | 5,648,473 | ||||||
|
|
|
|
|
|||||
| Total deposits |
15,713,579 | 6,775,719 | ||||||
|
|
|
|
|
|||||
| Short-term borrowings |
1,044,454 | 364,676 | ||||||
| FHLB borrowings |
— | 10,172 | ||||||
| Long-term debt |
353,890 | 376 | ||||||
| Accrued interest payable |
8,284 | 4,007 | ||||||
| Other liabilities |
286,726 | 126,829 | ||||||
|
|
|
|
|
|||||
| Total liabilities |
17,406,933 | 7,281,779 | ||||||
|
|
|
|
|
|||||
| Stockholders’ equity: |
||||||||
| Common stock-$3.33 par value per share; 350,000,000 shares authorized, 84,705,496 and 36,893,276 issued and outstanding, respectively |
282,069 | 122,855 | ||||||
| Capital surplus |
1,634,634 | 263,484 | ||||||
| Retained earnings |
476,970 | 470,828 | ||||||
| Accumulated other comprehensive income(loss), net |
(26,510 | ) | (619 | ) | ||||
|
|
|
|
|
|||||
| Total stockholders’ equity |
2,367,163 | 856,548 | ||||||
|
|
|
|
|
|||||
| Total liabilities and stockholders' equity |
$ | 19,774,096 | $ | 8,138,327 | ||||
|
|
|
|
|
|||||
See accompanying notes to consolidated financial statements.
61
Table of Contents
Hancock Holding Company and Subsidiaries
Consolidated Statements of Income
| Years Ended December 31, | ||||||||||||
| 2011 | 2010 | 2009 | ||||||||||
| (In thousands, except per share data) | ||||||||||||
| Interest income: |
||||||||||||
| Loans, including fees |
$ | 499,721 | $ | 284,922 | $ | 244,124 | ||||||
| Securities-taxable |
84,321 | 60,653 | 70,573 | |||||||||
| Securities-tax exempt |
6,031 | 5,232 | 4,555 | |||||||||
| Federal funds sold and other short term investments |
2,131 | 1,751 | 4,475 | |||||||||
|
|
|
|
|
|
|
|||||||
| Total interest income |
592,204 | 352,558 | 323,727 | |||||||||
|
|
|
|
|
|
|
|||||||
| Interest expense: |
||||||||||||
| Deposits |
55,691 | 72,903 | 84,313 | |||||||||
| Short-term borrowings |
7,034 | 9,306 | 10,809 | |||||||||
| Long-term debt and other interest expense |
8,246 | 136 | 178 | |||||||||
|
|
|
|
|
|
|
|||||||
| Total interest expense |
70,971 | 82,345 | 95,300 | |||||||||
|
|
|
|
|
|
|
|||||||
| Net interest income |
521,233 | 270,213 | 228,427 | |||||||||
| Provision for loan losses |
38,732 | 65,991 | 54,590 | |||||||||
|
|
|
|
|
|
|
|||||||
| Net interest income after provision for loan losses |
482,501 | 204,222 | 173,837 | |||||||||
|
|
|
|
|
|
|
|||||||
| Noninterest income: |
||||||||||||
| Service charges on deposit accounts |
55,265 | 45,335 | 45,354 | |||||||||
| Bank card fees |
28,879 | 14,941 | 11,252 | |||||||||
| Trust fees |
23,940 | 16,715 | 15,127 | |||||||||
| Insurance commissions and fees |
16,524 | 14,461 | 14,355 | |||||||||
| Investment and annuity fees |
15,016 | 10,181 | 8,220 | |||||||||
| ATM fees |
14,052 | 9,486 | 7,374 | |||||||||
| Secondary mortgage market operations |
10,484 | 8,915 | 5,906 | |||||||||
| Accretion of indemnification asset |
16,689 | 4,890 | — | |||||||||
| Bargain purchase gain on acquisition |
— | — | 33,623 | |||||||||
| Other income |
25,578 | 12,025 | 16,047 | |||||||||
| Securities gains (losses), net |
(91 | ) | — | 69 | ||||||||
|
|
|
|
|
|
|
|||||||
| Total noninterest income |
206,336 | 136,949 | 157,327 | |||||||||
|
|
|
|
|
|
|
|||||||
| Noninterest expense: |
||||||||||||
| Compensation expense |
234,071 | 112,478 | 95,674 | |||||||||
| Employee benefits |
52,531 | 29,564 | 25,775 | |||||||||
|
|
|
|
|
|
|
|||||||
| Salaries and employee benefits |
286,602 | 142,042 | 121,449 | |||||||||
|
|
|
|
|
|
|
|||||||
| Net occupancy expense |
43,220 | 23,803 | 20,340 | |||||||||
| Equipment expense |
17,524 | 10,569 | 9,849 | |||||||||
| Data processing expense |
43,069 | 23,646 | 19,043 | |||||||||
| Professional services expense |
69,931 | 16,447 | 12,321 | |||||||||
| Telecommunications and postage |
18,514 | 11,019 | 8,474 | |||||||||
| Advertising |
17,687 | 7,713 | 5,597 | |||||||||
| Deposit insurance and regulatory fees |
12,980 | 11,401 | 12,589 | |||||||||
| Amortization of intangibles |
16,551 | 2,728 | 1,417 | |||||||||
| Other expense |
67,936 | 29,892 | 22,391 | |||||||||
|
|
|
|
|
|
|
|||||||
| Total noninterest expense |
594,014 | 279,260 | 233,470 | |||||||||
|
|
|
|
|
|
|
|||||||
| Income before income taxes |
94,823 | 61,911 | 97,694 | |||||||||
| Income taxes |
18,064 | 9,705 | 22,919 | |||||||||
|
|
|
|
|
|
|
|||||||
| Net income |
$ | 76,759 | $ | 52,206 | $ | 74,775 | ||||||
|
|
|
|
|
|
|
|||||||
| Basic earnings per common share |
$ | 1.16 | $ | 1.41 | $ | 2.28 | ||||||
|
|
|
|
|
|
|
|||||||
| Diluted earnings per common share |
$ | 1.15 | $ | 1.40 | $ | 2.26 | ||||||
|
|
|
|
|
|
|
|||||||
See accompanying notes to consolidated financial statements.
62
Table of Contents
Hancock Holding Company and Subsidiaries
Consolidated Statements of Changes in Stockholders’ Equity
| Common Stock | Capital Surplus |
Retained Earnings |
Accumulated Other Comprehensive income (loss) |
Total | ||||||||||||||||||||
| Shares | Amount | |||||||||||||||||||||||
| (In thousands, except share and per share data) | ||||||||||||||||||||||||
| Balance, January 1, 2009 |
31,769,679 | $ | 105,793 | $ | 101,210 | $ | 411,579 | $ | (9,083 | ) | $ | 609,499 | ||||||||||||
| Comprehensive income: |
||||||||||||||||||||||||
| Net income |
— | — | — | 74,775 | — | 74,775 | ||||||||||||||||||
| Net change from retirement benefit plans, net of tax |
— | — | — | — | 1,473 | 1,473 | ||||||||||||||||||
| Unrealized net holding gain (or loss) on securities, net of reclassifications and tax |
— | — | — | — | 10,608 | 10,608 | ||||||||||||||||||
|
|
|
|
|
|
|
|
|
|
|
|
|
|||||||||||||
| Comprehensive income |
86,856 | |||||||||||||||||||||||
| Cash dividends declared ($0.96 per common share) |
— | — | — | (32,011 | ) | — | (32,011 | ) | ||||||||||||||||
| Common stock issued |
4,945,000 | 16,467 | 150,905 | — | — | 167,372 | ||||||||||||||||||
| Common stock activity, long-term incentive plan including excess income tax benefit of $480 |
125,774 | 419 | 5,528 | — | — | 5,947 | ||||||||||||||||||
|
|
|
|
|
|
|
|
|
|
|
|
|
|||||||||||||
| Balance, December 31, 2009 |
36,840,453 | 122,679 | 257,643 | 454,343 | 2,998 | 837,663 | ||||||||||||||||||
| Comprehensive income |
||||||||||||||||||||||||
| Net income |
— | — | — | 52,206 | — | 52,206 | ||||||||||||||||||
| Net change from retirement benefit plans, net of tax |
— | — | — | — | (2,463 | ) | (2,463 | ) | ||||||||||||||||
| Unrealized net holding gain (or loss) on securities, net of reclassifications and tax |
— | — | — | — | (1,154 | ) | (1,154 | ) | ||||||||||||||||
|
|
|
|
|
|
|
|
|
|
|
|
|
|||||||||||||
| Comprehensive income |
48,589 | |||||||||||||||||||||||
| Cash dividends declared ($0.96 per common share) |
— | — | — | (35,721 | ) | (35,721 | ) | |||||||||||||||||
| Common stock activity, long-term incentive plan, including excess income tax benefit of $322 |
52,823 | 176 | 5,841 | — | — | 6,017 | ||||||||||||||||||
|
|
|
|
|
|
|
|
|
|
|
|
|
|||||||||||||
| Balance, December 31, 2010 |
36,893,276 | 122,855 | 263,484 | 470,828 | (619 | ) | 856,548 | |||||||||||||||||
| Comprehensive income |
||||||||||||||||||||||||
| Net income |
— | — | — | 76,759 | — | 76,759 | ||||||||||||||||||
| Net change from retirement benefit plans, net of tax |
— | — | — | — | (59,072 | ) | (59,072 | ) | ||||||||||||||||
| Unrealized net holding gain (or loss) on securities, net of reclassifications and tax |
— | — | — | — | 33,246 | 33,246 | ||||||||||||||||||
| Net unrealized gains on derivatives and hedging activites, net of reclassification |
— | — | — | — | (65 | ) | (65 | ) | ||||||||||||||||
|
|
|
|
|
|
|
|
|
|
|
|
|
|||||||||||||
| Comprehensive income |
50,868 | |||||||||||||||||||||||
| Cash dividends declared ($0.96 per common share) |
— | — | — | (70,617 | ) | — | (70,617 | ) | ||||||||||||||||
| Common stock issued in stock offering |
6,958,143 | 23,170 | 190,824 | — | — | 213,994 | ||||||||||||||||||
| Common stock issued in business combination |
40,794,261 | 135,845 | 1,172,199 | — | — | 1,308,044 | ||||||||||||||||||
| Common stock activity, long-term incentive plan, including excess income tax benefit of $104 |
59,816 | 199 | 8,127 | — | — | 8,326 | ||||||||||||||||||
|
|
|
|
|
|
|
|
|
|
|
|
|
|||||||||||||
| Balance, December 31, 2011 |
84,705,496 | $ | 282,069 | $ | 1,634,634 | $ | 476,970 | $ | (26,510 | ) | $ | 2,367,163 | ||||||||||||
|
|
|
|
|
|
|
|
|
|
|
|
|
|||||||||||||
See accompanying notes to consolidated financial statements.
63
Table of Contents
Hancock Holding Company and Subsidiaries
Consolidated Statements of Cash Flows
| Years Ended December 31, | ||||||||||||
| 2011 | 2010 | 2009 | ||||||||||
| (In thousands) | ||||||||||||
| Operating Activities: |
||||||||||||
| Net income |
$ | 76,759 | $ | 52,206 | $ | 74,775 | ||||||
| Adjustments to reconcile net income to net cash provided by operating activities: |
||||||||||||
| Depreciation and amortization |
24,605 | 13,526 | 15,549 | |||||||||
| Provision for loan losses |
38,732 | 65,991 | 54,590 | |||||||||
| Losses (gains) on other real estate owned |
4,922 | (1,960 | ) | 768 | ||||||||
| Deferred tax expense (benefit) |
26,577 | (11,612 | ) | (6,953 | ) | |||||||
| Increase in cash surrender value of life insurance contracts |
(12,169 | ) | (8,022 | ) | (6,396 | ) | ||||||
| Gain on acquisition |
— | — | (20,732 | ) | ||||||||
| Loss (gain) on sales/paydowns of securities available for sale, net |
91 | — | (69 | ) | ||||||||
| (Gain) on disposal of other assets |
(424 | ) | (316 | ) | (1,478 | ) | ||||||
| Net (increase) decrease in loans originated for sale |
(1,560 | ) | 22,032 | (13,822 | ) | |||||||
| Net amortization of securities premium/discount |
29,523 | 7,071 | 917 | |||||||||
| Amortization of intangible assets |
16,551 | 2,728 | 1,417 | |||||||||
| Stock-based compensation expense |
7,196 | 4,077 | 3,254 | |||||||||
| (Decrease) increase in interest payable and other liabilities |
(99,986 | ) | (12,405 | ) | 16,702 | |||||||
| Decrease (increase) in FDIC indemnification asset |
116,251 | (3,530 | ) | — | ||||||||
| Decrease (increase) in other assets |
46,082 | 65,963 | (100,474 | ) | ||||||||
| Other, net |
(104 | ) | (951 | ) | 94 | |||||||
|
|
|
|
|
|
|
|||||||
| Net cash provided by operating activities |
273,046 | 194,798 | 18,142 | |||||||||
|
|
|
|
|
|
|
|||||||
See accompanying notes to consolidated financial statements.
64
Table of Contents
Hancock Holding Company and Subsidiaries
Consolidated Statements of Cash Flows (continued)
| Years Ended December 31, | ||||||||||||
| 2011 | 2010 | 2009 | ||||||||||
| (In thousands) | ||||||||||||
| Investing Activities: |
||||||||||||
| Net (increase) decrease in interest-bearing time deposits |
$ | (104,647 | ) | $ | 218,015 | $ | (558,271 | ) | ||||
| Proceeds from sales of securities available for sale |
342,864 | — | 10,202 | |||||||||
| Proceeds from maturities of securities available for sale |
998,726 | 603,102 | 599,066 | |||||||||
| Purchases of securities available for sale |
(1,732,757 | ) | (489,835 | ) | (509,304 | ) | ||||||
| Net decrease (increase) in federal funds sold and short-term investments |
281,639 | (59,573 | ) | 317,319 | ||||||||
| Net decrease in loans |
86,057 | 40,400 | 17,906 | |||||||||
| Purchases of property and equipment |
(72,975 | ) | (21,899 | ) | (12,305 | ) | ||||||
| Proceeds from sales of property and equipment |
9,326 | 2,220 | 2,700 | |||||||||
| Proceeds from sales of other real estate |
80,125 | 41,945 | 8,015 | |||||||||
| Cash paid for acquisition, net of cash received |
(74,736 | ) | — | 378,367 | ||||||||
| Net cash paid for divestiture of branches |
(114,645 | ) | — | — | ||||||||
|
|
|
|
|
|
|
|||||||
| Net cash (used in) provided by investing activities |
(301,023 | ) | 334,375 | 253,695 | ||||||||
|
|
|
|
|
|
|
|||||||
| Financing Activities: |
||||||||||||
| Net decrease in deposits |
(65,298 | ) | (420,093 | ) | (298,062 | ) | ||||||
| Increase (decrease) in other short-term borrowings |
123,525 | (120,031 | ) | (21,225 | ) | |||||||
| Proceeds from issuance of long-term debt |
150,317 | — | — | |||||||||
| Repayments of long-term notes |
(16,641 | ) | (295 | ) | (166 | ) | ||||||
| Proceeds from issuance of short-term notes |
— | — | 1,609,399 | |||||||||
| Repayments of short-term notes |
(10,172 | ) | (20,000 | ) | (1,694,898 | ) | ||||||
| Dividends paid |
(70,617 | ) | (35,721 | ) | (32,011 | ) | ||||||
| Proceeds from exercise of stock options |
1,025 | 1,618 | 2,213 | |||||||||
| Proceeds from stock offering |
213,994 | — | 167,372 | |||||||||
| Excess tax benefit from stock option exercises |
104 | 322 | 480 | |||||||||
|
|
|
|
|
|
|
|||||||
| Net cash provided by (used in) financing activities |
326,237 | (594,200 | ) | (266,898 | ) | |||||||
|
|
|
|
|
|
|
|||||||
| Increase (decrease) in cash and due from banks |
298,260 | (65,027 | ) | 4,939 | ||||||||
| Cash and due from banks at beginning of year |
139,687 | 204,714 | 199,775 | |||||||||
|
|
|
|
|
|
|
|||||||
| Cash and due from banks at end of year |
$ | 437,947 | $ | 139,687 | $ | 204,714 | ||||||
|
|
|
|
|
|
|
|||||||
| Supplemental Information |
||||||||||||
| Income taxes paid |
$ | 24,529 | $ | 22,878 | $ | 5,810 | ||||||
| Interest paid, including capitalized interest of $12, $70, and $20, respectively |
66,695 | 83,161 | 96,797 | |||||||||
| Supplemental Information for Non-Cash |
||||||||||||
| Investing and Financing Activities |
||||||||||||
| Assets acquired in settlement of loans |
$ | 117,690 | $ | 59,758 | $ | 20,023 | ||||||
| Acquisitions |
||||||||||||
| Fair value of assets acquired |
$ | 11,156,952 | $ | — | $ | 1,715,266 | ||||||
| Fair value of liabilities assumed |
(10,130,706 | ) | — | (1,694,534 | ) | |||||||
|
|
|
|
|
|
|
|||||||
| Net identifiable assets acquired |
$ | 1,026,246 | $ | — | $ | 20,732 | ||||||
|
|
|
|
|
|
|
|||||||
| Common stock issued in connection with acquisition |
1,308,044 | — | — | |||||||||
See accompanying notes to consolidated financial statements.
65
Table of Contents
HANCOCK HOLDING COMPANY AND SUBSIDIARIES
NOTES TO CONSOLIDATED FINANCIAL STATEMENTS
Note 1. Summary of Significant Accounting Policies and Recent Accounting Pronouncements
DESCRIPTION OF BUSINESS
Hancock Holding Company “the Company” or “Hancock” is a financial holding company headquartered in Gulfport, Mississippi and operating in the states of Mississippi, Louisiana, Alabama, Florida and Texas. The Company operates through two wholly-owned bank subsidiaries, Hancock Bank, Gulfport, Mississippi (Hancock Bank) and Whitney Bank, New Orleans, Louisiana (Whitney Bank). Hancock Bank and Whitney Bank are referred to collectively as the “Banks.” The Banks are community oriented and focus primarily on offering commercial, consumer and mortgage loans and deposit services to individuals and small to middle market businesses in their respective market areas. The Company’s operating strategy is to provide its customers with the financial sophistication and breadth of products of a regional bank, while successfully retaining the local appeal and level of service of a community bank. The Banks or their subsidiaries also offer trust services, investment services and insurance agency services. Hancock Bank subsidiaries include Hancock Investment Services, Hancock Insurance Agency, and Harrison Finance Company.
SUMMARY OF SIGNIFICANT ACCOUNTING POLICIES
The consolidated financial statements have been prepared in conformity with U.S. generally accepted accounting principles and those generally practiced within the banking industry. The following is a summary of the more significant accounting policies.
Basis of Presentation
The consolidated financial statements include the accounts of the Company and all other entities in which the Company has a controlling interest. Significant inter-company transactions and balances have been eliminated in consolidation.
Use of Estimates
The accounting principles the Company follows and the methods for applying these principles conform with accounting principles generally accepted in the United States of America and with general practices followed by the banking industry. These accounting principles and practices require management to make estimates and assumptions about future events that affect the amounts reported in the consolidated financial statements and the accompanying notes. Actual results could differ from those estimates.
Fair Value Accounting
Generally accepted accounting principles require the use of fair values in determining the carrying values of certain assets and liabilities in the financial statements, as well as for specific disclosures about certain assets and liabilities.
Accounting guidance established a fair value hierarchy that prioritizes the inputs to these valuation techniques used to measure fair value giving preference to quoted prices in active markets (level 1) and the lowest priority to unobservable inputs such as a reporting entity’s own data (level 3). Level 2 inputs include quoted prices for similar assets or liabilities in active markets, quoted prices for identical assets or liabilities in markets that are not active, observable inputs other than quoted prices, such as interest rates and yield curves, and inputs that are derived principally from or corroborated by observable market data by correlation or other means.
66
Table of Contents
HANCOCK HOLDING COMPANY AND SUBSIDIARIES
NOTES TO CONSOLIDATED FINANCIAL STATEMENTS
Note 1. Summary of Significant Accounting Policies and Recent Accounting Pronouncements (continued)
Acquisition Accounting
Acquisitions are accounted for under the purchase method of accounting. Purchased assets, including identifiable intangibles, and assumed liabilities are recorded at their respective acquisition date fair values. If the fair value of net assets purchased exceeds the consideration given, a “bargain purchase gain” is recognized. If the consideration given exceeds the fair value of the net assets received, goodwill is recognized. Fair values are subject to refinement for up to one year after the closing date of an acquisition as information relative to closing date fair values becomes available. Purchased loans acquired in a business combination are recorded at estimated fair value on their purchase date with no carryover of the related allowance for loan losses. See Acquired Loans section below for accounting policy regarding loans acquired in a business combination.
All identifiable intangible assets that are acquired in a business combination are recognized at fair value on the acquisition date. Identifiable intangible assets are recognized separately if they arise from contractual or other legal rights or if they are separable (i.e., capable of being sold, transferred, licensed, rented, or exchanged separately from the entity).
Securities
Securities are classified as trading, held to maturity or available for sale. Management determines the appropriate classification of debt securities at the time of purchase and re-evaluates this classification periodically as conditions change that could require reclassification. All securities were classified as available for sale at December 31, 2011.
Available for sale securities are stated at fair value. Unrealized holding gains and unrealized holding losses, other than those determined to be other than temporary, are reported net of tax in other comprehensive income and in accumulated other comprehensive income, until realized. Premiums and discounts on securities are amortized and accreted to interest income as an adjustment to the securities’ yields using the interest method.
Realized gains and losses on securities, including declines in value judged to be other than temporary, are included in net securities gains and losses as a component of noninterest income. Gains and losses on the sales of securities available for sale are determined using the specific-identification method.
Loans
Originated loans
Loans originated for investment are reported at the principal balance outstanding net of unearned income. Interest on loans and accretion of unearned income, including deferred loan fees, are computed in a manner that approximates a level yield on recorded principal. Interest on loans is recognized in income as earned.
The accrual of interest on loans is discontinued when, in management’s opinion, it is probable that the borrower will be unable to meet payment obligations as they become due, as well as when required by regulatory provisions. When accrual of interest is discontinued on a loan, all unpaid accrued interest is reversed and payments subsequently received are applied first to recover principal. Interest income is recognized for payments received after contractual principal has been satisfied. Loans are returned to accrual status when all the principal and interest contractually due are brought current and future payment performance is reasonably assured.
67
Table of Contents
HANCOCK HOLDING COMPANY AND SUBSIDIARIES
NOTES TO CONSOLIDATED FINANCIAL STATEMENTS
Note 1. Summary of Significant Accounting Policies and Recent Accounting Pronouncements (continued)
It is the policy of the Company to promptly charge off commercial and mortgage loans, or portions of loans, when available information reasonably confirms that they are wholly or partially uncollectible. Prior to recognizing a loss, asset value is established based on an assessment of the value of the collateral securing the loan, the borrower’s and the guarantor’s ability and willingness to pay and the status of the account in bankruptcy court, if applicable. Consumer loans are generally charged down to the fair value of the collateral, if any, less estimated selling costs when the loan is 90 days past due, unless the loan is clearly both well secured and in the process of collection. Loans are charged off against the allowance for loan losses with subsequent recoveries added back to the allowance.
Acquired loans
Management has defined the loans purchased in the June 2011 Whitney acquisition as acquired loans. Acquired loans are recorded at estimated fair value on their purchase date with no carryover of the related allowance for loan losses. Acquired loans were segregated between those considered to be credit impaired and those deemed performing. To make this determination, management considered such factors as past due status, nonaccrual status and credit risk ratings. The fair value of acquired performing loans was determined by discounting expected cash flows, both principal and interest, for each pool at prevailing market interest rates. The difference between the fair value and principal balances due at acquisition date, the fair value discount, is accreted into income over the estimated life of each loan pool.
Credit impaired acquired loans showed evidence of credit deterioration that makes it probable that all contractually required principal and interest payments will not be collected. Acquired loans were further segregated into pools using common risk characteristics such as loan type, geography and risk rating. Their fair value was initially based on an estimate of cash flows for each pool, both principal and interest, expected to be collected, discounted at prevailing market rates of interest. Management estimated cash flows using key assumptions such as default rates, loss severity rates assuming default, prepayment speeds and estimated collateral values. Each pool is accounted for as a single asset with a single composite interest rate and an aggregate expectation of cash flows. The excess of cash flows expected to be collected from a loan pool over its estimated fair value at acquisition is referred to as the accretable yield and is recognized in interest income using an effective yield method over the remaining life of the loan pool. Subsequent to acquisition, management must update these estimates of cash flows expected to be collected at each reporting date. These updates require the continued use of key assumptions and estimates, similar to those used in the initial estimate of fair value.
Acquired impaired loans with an accretable yield are not classified as nonperforming even though collection of contractual payments may be in doubt because income is accreted on the related loan pool, which is the unit of accounting.
Covered loans and the related loss share receivable
The loans purchased in the 2009 acquisition of Peoples First Community Bank (Peoples First) are covered by two loss share agreements between the FDIC and the Company which afford the Company significant loss protection. These covered loans are accounted for as acquired impaired loans as described above in the section on acquired loans. The loss share indemnification asset is measured separately from the related covered loans as it is not contractually embedded in the loans and is not transferrable should the loans be sold. The fair value of the indemnification asset at acquisition was estimated by discounting projected cash flows related to the loss share agreements based on the expected reimbursements for losses using the applicable loss share percentages, including appropriate consideration of possible true-up payments to the FDIC at the expiration of the loss share agreements. The discounted amount is accreted into non-interest income over the remaining life of the loan pool or the life of the shared loss agreement.
68
Table of Contents
HANCOCK HOLDING COMPANY AND SUBSIDIARIES
NOTES TO CONSOLIDATED FINANCIAL STATEMENTS
Note 1. Summary of Significant Accounting Policies and Recent Accounting Pronouncements (continued)
The indemnification asset is reviewed and updated prospectively as loss estimates related to the covered loans change. Decreases in the expected cash flows on covered loans are recorded as an adjustment to the allowance for loan losses with a corresponding increase to the indemnification asset, and the difference is recorded as a provision for loan losses in the consolidated statement of income. Increases in expected cash flows of these loans first reverse any previously recorded increase in the indemnification asset on the loan pool with the remainder reflected as an adjustment to the indemnification asset’s accretion rate.
Loans Held for Sale
Loans held for sale are stated at the lower of cost or market on the consolidated balance sheets. These loans are originated on a best-efforts basis, whereby a commitment by a third party to purchase the loan has been received concurrent with the Banks’ commitment to the borrower to originate the loan. At times, management may decide to sell loans that were not originated for that purpose. These loans are reclassified as held for sale when that decision is made and are also carried at the lower of cost or market.
Troubled Debt Restructurings
Troubled debt restructurings (TDRs) occur when a borrower is experiencing, or is expected to experience, financial difficulties in the near-term and a modification in loan terms is granted that would otherwise not have been considered.
Troubled debt restructurings can involve loans remaining on nonaccrual, moving to nonaccrual, or continuing to accrue, depending on the individual facts and circumstances of the borrower. All loans whose terms have been modified in a TDR, including both commercial and retail loans, are considered “impaired.” When measuring impairment on a TDR, the present value of expected cash flows is calculated using the effective interest rate of the original loan, i.e., before the restructuring, as the discount rate or at the loan’s observable market price or the fair value of the collateral if the loan is collateral dependent. If the measurement is less than the recorded investment in the loan, the difference is charged-off through the allowance for loan and lease losses. A loan is not considered impaired due to a delay in payment if all amounts due, including interest accrued at the contractual interest rate for the period of delay, is expected to be collected. Modified acquired impaired loans are not removed from their accounting pool and accounted for as a TDR even if those loans would otherwise be deemed TDRs.
Allowance for Loan Losses
Originated loans
The allowance for loan and lease losses “ALLL” is a valuation account available to absorb losses on loans. The ALLL is established and maintained at an amount sufficient to cover the estimated inherent credit losses associated with the loan and lease portfolios of the Company as of the date of the determination. Credit losses arise not only from credit risk, but also from other risks inherent in the lending process including, but not limited to, collateral risk, operational risk, concentration risk, and economic risk. As such, all related risks of lending are considered when assessing the adequacy of the allowance for loan and lease losses. Quarterly, management estimates the inherent losses in the existing loan portfolio based on the Company’s past loan loss and delinquency experience, known and inherent risks in the portfolio, adverse situations that may affect the borrowers’ ability to repay, the estimated value of any underlying collateral and current economic conditions.
The analysis and methodology include three primary elements. These elements include a pool analysis of various retail loans based upon loss history, a pool analysis of commercial and commercial real estate loans based upon loss history by loan type, and a specific reserve analysis for those loans considered impaired. All losses are charged to the allowance for loan and lease losses when the loss actually occurs or when a determination is made that a loss is likely to occur; recoveries are credited to the allowance for loan losses.
69
Table of Contents
HANCOCK HOLDING COMPANY AND SUBSIDIARIES
NOTES TO CONSOLIDATED FINANCIAL STATEMENTS
Note 1. Summary of Significant Accounting Policies and Recent Accounting Pronouncements (continued)
The Company considers a loan to be impaired when, based upon current information and events, it believes it is probable all amounts due according to the contractual terms of the loan agreement will not be collected. Impaired loans include troubled debt restructurings, and performing and non-performing loans. In order to ensure consideration of all possible impairments, management considers all loans that are risk rated substandard or doubtful as impaired. When a loan is determined to be impaired, the amount of impairment is recognized by creating a specific allowance for any shortfall between the loans value and its recorded investment. The loan’s value is measured by either the loan’s observable market price, the fair value of the collateral of the loan (less liquidation costs) if it is collateral dependent, or by the present value of expected future cash flows discounted at the loan’s effective interest rate. Any loans individually analyzed for impairment are not incorporated into the pool analysis to avoid double counting. Beginning in 2011, the Company changed the scope of the specific reserve analysis to include all impaired commercial, commercial real estate and mortgage loans with balances of $500,000 or greater.
Pool analysis is applied for all retail loans. The retail loans are subdivided into three groups, which currently include: mortgage real estate, indirect loans and direct consumer loans. The Company applies pool analysis for commercial and commercial real estate loans by applying a historical loss ratio to all commercial loans, commercial real estate loans and leases grouped by product type for both retail and commercial loans. A historical loss rate is calculated for each group over the twelve prior quarters to determine the three year average loss rate. As circumstances dictate, management will make adjustments to the loss history to reflect significant changes in our loss history. Adjustments will also be made to historical loss rates to cover risks associated with trends in delinquencies, non-accruals, current economic conditions and credit administration/underwriting practices and policies.
Acquired loans
Purchased loans acquired in a business combination are recorded at their estimated fair value on their purchase date and with no carryover of the related allowance for loan losses. Performing acquired loans are subsequently evaluated for any required allowance at each reporting date. An allowance for loan losses is calculated using a methodology similar to that described above for originated loans. The allowance as determined for each loan pool is compared to the remaining fair value discount for that pool. If greater, the excess is recognized as an addition to the allowance through a provision for loan losses. If less than the discount, no additional allowance is recorded. Charge-offs and losses first reduce any remaining fair value discount for the loan pool and once the discount is depleted, losses are applied against the allowance established for that pool.
For impaired acquired loans and covered loans, cash flows expected to be collected are recast at each reporting date for each loan pool. These evaluations require the continued use and updating of key assumptions and estimates such as default rates, loss severity given default and prepayment speed assumptions, similar to those used for the initial fair value estimate. Management judgment must be applied in developing these assumptions. If expected cash flows for a pool decreases, an increase in the allowance for loan losses is made through a charge to the provision for loan losses. If expected cash flows for a pool increase, any previously established allowance for loan losses is reversed and any remaining difference increases the accretable yield which will be taken into income over the remaining life of the loan pool.
Property and Equipment
Property and equipment are recorded at cost, less accumulated depreciation and amortization. Depreciation is charged to expense over the estimated useful lives of the assets, which are up to 39 years for buildings and three to seven years for furniture and equipment. Amortization expense for software is charged over three years. Leasehold improvements are amortized over the terms of the respective leases or the estimated useful lives of the improvements, whichever is shorter. In cases where the Company has the right to renew the lease for additional periods, the lease term for the purpose of calculating amortization of the capitalized cost of the leasehold improvements is extended when the Company is “reasonably assured” that it will renew the lease.
70
Table of Contents
HANCOCK HOLDING COMPANY AND SUBSIDIARIES
NOTES TO CONSOLIDATED FINANCIAL STATEMENTS
Note 1. Summary of Significant Accounting Policies and Recent Accounting Pronouncements (continued)
Depreciation and amortization expenses are computed using a straight-line basis for assets acquired after January 1, 2006 and the double declining balance basis for assets acquired prior to January 1, 2006. Gains and losses related to retirement or disposition of fixed assets are recorded in other income under noninterest income on the consolidated statements of income. The Company continually evaluates whether events and circumstances have occurred that indicate that such long-lived assets have been impaired. Measurement of any impairment of such long-lived assets is based on those assets’ fair values. There were no impairment losses on property and equipment recorded during 2011, 2010, or 2009.
Other Real Estate
Other real estate owned includes real property that has been acquired in satisfaction of loans and property no longer used in the Banks’ business. Generally these assets are recorded at the lower of either cost or estimated fair value less the estimated cost of disposition. Any initial reduction in the carrying amount of a loan to the fair value of the collateral received is charged to the allowance for loan losses. Subsequent losses on the periodic revaluation of the property are charged to current earnings, as are revenues from and costs of operating and maintaining the properties and gains or losses recognized on their disposition. Improvements made to properties are capitalized if the expenditures are expected to be recovered upon the sale of the properties.
Goodwill and Other Intangible Assets
Goodwill, which represents the excess of cost over the fair value of the net assets of an acquired business, is not amortized but tested for impairment on an annual basis, or more often if events or circumstances indicate there may be impairment. Impairment is defined as the amount by which the implied fair value of the goodwill contained in any reporting unit within a company is less than the goodwill’s carrying value. Impairment losses would be charged to operating expense. Management reviews goodwill for impairment based on the Company’s primary reporting segments, the banks. If the reporting unit’s fair value is less than its carrying value, an estimate of the implied fair value of the goodwill is compared to the unit’s carrying value. The Company uses a present value technique to estimate fair value when testing for impairment. The cash flow estimates incorporate assumptions that market participants would use in their estimates of fair value. The cash flow analysis requires assumptions about the economic environment, expected net interest margins, growth rates, and the rate at which cash flows are discounted.
Other identifiable intangible assets with finite lives, such as core deposit intangibles and trade name, are initially recorded at fair value and are generally amortized over the periods benefited and are evaluated for impairment similar to long-lived assets.
Bank-Owned Life Insurance
Bank-owned life insurance (BOLI) is long-term life insurance on the lives of certain current and past employees where the insurance policy benefits and ownership are retained by the employer. Its cash surrender value is an asset that the Company uses to partially offset the future cost of employee benefits. The cash value accumulation on BOLI is permanently tax deferred if the policy is held to the insured person’s death and certain other conditions are met.
71
Table of Contents
HANCOCK HOLDING COMPANY AND SUBSIDIARIES
NOTES TO CONSOLIDATED FINANCIAL STATEMENTS
Note 1. Summary of Significant Accounting Policies and Recent Accounting Pronouncements (continued)
Derivative Instruments and Hedging Activities
Accounting guidance provides the disclosure requirements for derivatives and hedging activities with the intent to provide users of financial statements with an enhanced understanding of: (a) how and why an entity uses derivative instruments, (b) how the entity accounts for derivative instruments and related hedged items, and (c) how derivative instruments and related hedged items affect an entity’s financial position, financial performance, and cash flows. Further, qualitative disclosures are required that explain the Company’s objectives and strategies for using derivatives, as well as quantitative disclosures about the fair value of and gains and losses on derivative instruments, and disclosures about credit-risk-related contingent features in derivative instruments.
The Company records all derivatives on the balance sheet at fair value. The accounting for changes in the fair value of derivatives depends on the intended use of the derivative, whether the Company has elected to designate a derivative in a hedging relationship and apply hedge accounting and whether the hedging relationship has satisfied the criteria necessary to apply hedge accounting. Derivatives designated and qualifying as a hedge of the exposure to changes in the fair value of an asset, liability, or firm commitment attributable to a particular risk, such as interest rate risk, are considered fair value hedges. Derivatives designated and qualifying as a hedge of the exposure to variability in expected future cash flows, or other types of forecasted transactions, are considered cash flow hedges. Hedge accounting generally provides for the matching of the timing of gain or loss recognition on the hedging instrument with the recognition of the changes in the fair value of the hedged asset or liability that are attributable to the hedged risk in a fair value hedge or the earnings effect of the hedged forecasted transactions in a cash flow hedge. The Company may enter into derivative contracts that are intended to economically hedge certain of its risks, even though hedge accounting does not apply or the Company elects not to apply hedge accounting.
Income Taxes
The Company accounts for deferred income taxes using the liability method. Deferred tax assets and liabilities are based on temporary differences between the financial statement carrying amounts and the tax basis of the Company’s assets and liabilities. Deferred tax assets and liabilities are measured using the enacted tax rates expected to apply to taxable income in the years in which those temporary differences are expected to be realized or settled.
Retirement Benefits
Management makes a variety of assumptions in applying principles that govern the accounting for benefits under the Company’s defined benefit pension plans and other postretirement benefit plans. These assumptions are essential to the actuarial valuation that determines the amounts recognized and certain disclosures it makes in the consolidated financial statements related to the operation of these plans. Two of the more significant assumptions concern the expected long-term rate of return on plan assets and the rate needed to discount projected benefits to their present value. Changes in these assumptions impact the cost of retirement benefits recognized in net income and comprehensive income. Certain assumptions are closely tied to current conditions and are generally revised at each measurement date. For example, the discount rate is reset annually with reference to market yields on high quality fixed-income investments. Other assumptions, such as the rate of return on assets, are determined, in part, with reference to historical and expected conditions over time and are not as susceptible to frequent revision. Holding other factors constant, the cost of retirement benefits will move opposite to changes in either the discount rate or the rate of return on assets. The compensation cost of an employee’s pension benefit is recognized on the projected unit credit method over the employee’s approximate service period. The aggregate cost method is utilized for funding purposes. The Company also sponsors two defined benefit postretirement plans, which provide medical benefits and life insurance benefits. The Company has accounted for these plans using the actuarial computations required by guidance regarding employers’ accounting for postretirement benefits other than pensions. The cost of the defined benefit postretirement plan has been recognized on the projected unit credit method over the employee’s approximate service period.
72
Table of Contents
HANCOCK HOLDING COMPANY AND SUBSIDIARIES
NOTES TO CONSOLIDATED FINANCIAL STATEMENTS
Note 1. Summary of Significant Accounting Policies and Recent Accounting Pronouncements (continued)
Stock-Based Payment Arrangements
The grant date fair value of equity instruments awarded to employees and directors establishes the cost of the services received in exchange, and the cost associated with awards that are expected to vest is recognized over the requisite service period.
Revenue Recognition
The largest source of revenue for the Company is interest revenue. Interest revenue is recognized on an accrual basis driven by written contracts, such as loan agreements or securities contracts. Credit-related fees, including letter of credit fees, are recognized in non-interest income when earned. The Company recognizes commission revenue and brokerage, exchange and clearance fees on a trade-date basis. Other types of non-interest revenue such as service charges on deposits and trust revenues, are accrued and recognized into income as services are provided and the amount of fees earned are reasonably determinable.
Earnings Per Share
Basic earnings per common share is computed by dividing income applicable to common shareholders by the weighted-average number of common shares outstanding for the applicable period. Shares outstanding are adjusted for restricted shares issued to employees under the long-term incentive compensation plan and for certain shares that will be issued under the directors’ compensation plan. Diluted earnings per common share is computed using the weighted-average number of common shares outstanding increased by the number of shares in which employees would vest under performance-based restricted stock and stock unit awards based on expected performance factors and by the number of additional shares that would have been issued if potentially dilutive stock options were exercised, each as determined using the treasury stock method.
The Company adopted the FASB’s authoritative guidance regarding the determination of whether instruments granted in share-based payment transactions are participating securities. This guidance provides that unvested share-based payment awards that contain nonforfeitable rights to dividends or dividend equivalents (whether paid or unpaid) are participating securities and should be included in the computation of earnings per share pursuant to the two-class method. This guidance was effective January 1, 2010, and was applied retrospectively.
Statements of Cash Flows
The Company considers only cash on hand, cash items in process of collection and balances due from financial institutions as cash and cash equivalents for purposes of the consolidated statements of cash flows.
Reportable Segment Disclosures
As defined by authoritative guidance, segment disclosures require reporting information about a company’s operating segments using a “management approach.” Reportable segments are identified as those revenue-producing components for which separate financial information is produced internally and which are subject to evaluation by the chief operating decision maker in deciding how to allocate resources to segments. The Company defines reportable segments as the banks.
Other
Assets held by the banks in a fiduciary capacity are not assets of the banks and are not included in the consolidated balance sheets.
73
Table of Contents
HANCOCK HOLDING COMPANY AND SUBSIDIARIES
NOTES TO CONSOLIDATED FINANCIAL STATEMENTS
Note 1. Summary of Significant Accounting Policies and Recent Accounting Pronouncements (continued)
RECENT ACCOUNTING PRONOUNCEMENTS
In December 2011, the FASB issued updated guidance to address the differences between international financial reporting standards (IFRS) and generally accepted accounting principles (GAAP) regarding the offsetting of assets and liabilities. Instead of proposing new criteria for netting assets and liabilities the FASB and International Accounting Standards Board (IASB) jointly issued common disclosure requirements related to offsetting arrangements, irrespective of whether they are offset on the statement of financial position, which require disclosure of both net and gross information for these assets and liabilities. An entity is required to apply the amendments for annual reporting periods beginning on or after January 1, 2013, and interim periods within those annual periods. This guidance impacts only the disclosures in financial statements and will not impact the company’s financial condition or results of operations.
In September 2011, the FASB issued guidance to simplify how entities test goodwill for impairment. The final standard allows an entity to first assess qualitative factors to determine whether is it “more likely than not” that the fair value of a reporting unit is less than its carrying amount as a basis for determining whether it is necessary to perform the two-step goodwill impairment test as described in Accounting Standards Codification (ASC) Topic 350, Intangibles-Goodwill and Other. The more-likely-than-not threshold is defined as having a likelihood of more than 50%. The amendments are effective for fiscal years, and interim periods within those years, beginning after December 15, 2011. Early adoption is permitted, including for annual and interim goodwill impairment tests performed as of a date before September 15, 2011, if an entity’s financial statements for the most recent annual or interim period have not yet been issued. The adoption of this guidance is not expected to have a material impact on the company’s financial condition or results of operations.
In June 2011, the FASB issued updated guidance regarding the presentation of comprehensive income, and subsequently amended this guidance in December 2011, prior to its effective date. The updated guidance eliminates the option to present the components of other comprehensive income as part of the statement of changes to stockholders’ equity, and, requires an entity to present the total of comprehensive income, the components of net income, and the components of other comprehensive income either in a single continuous statement of comprehensive income or in two separate but consecutive statements. This amendment does not change the items that must be reported in other comprehensive income or when an item in other comprehensive income must be reclassified to net income. The amendments are effective for fiscal years, and interim periods within those years, beginning after December 15, 2011, and should be applied retrospectively. The adoption of this guidance will change presentation only and will not have a material impact on the company’s financial condition or results of operations. The FASB is currently re-deliberating whether to present on the face of the financial statements the effects of reclassifications out of accumulated other comprehensive income on the components of net income and other comprehensive income.
In May 2011, the FASB issued updated guidance to achieve common fair value measurement and disclosure requirements in U.S. GAAP and IFRS. Certain provisions clarify the Board’s intent about the application of existing fair value measurement and disclosure requirements, while others change a particular principle or requirement for measuring fair value or for disclosing information about fair value measurements. The guidance is to be applied prospectively and is effective during interim and annual periods beginning after December 15, 2011. The adoption of this guidance is not expected to have a material impact on the company’s financial condition or results of operations.
74
Table of Contents
HANCOCK HOLDING COMPANY AND SUBSIDIARIES
NOTES TO CONSOLIDATED FINANCIAL STATEMENTS
Note 1. Summary of Significant Accounting Policies and Recent Accounting Pronouncements (continued)
In April 2011, FASB issued updated guidance for receivables regarding a creditor’s determination of whether a restructuring is a troubled debt restructuring (TDR). The final standard does not change the long-standing guidance that a restructuring of a debt constitutes a TDR “if the creditor for economic or legal reasons related to the debtor’s financial difficulties grants a concession to the debtor that it would not otherwise consider”. The update clarifies which loan modifications constitute troubled debt restructurings and is intended to assist creditors in determining whether a modification of the terms of a receivable meets the criteria to be considered a troubled debt restructuring, both for purposes of recording an impairment loss and for disclosure of troubled debt restructurings. The new guidance is effective for interim and annual periods beginning on June 15, 2011, and should be applied retrospectively to restructurings occurring on or after the beginning of the fiscal year of adoption. The adoption of this guidance did not have a material impact on the company’s financial condition or results of operations.
In April 2011, FASB issued an update to improve the accounting for repurchase agreements (“repos”) and other agreements that both entitle and obligate a transferor to repurchase or redeem financial assets before their maturity. The guidance modifies the criteria for assessing if a transferor has maintained effective control over the transferred asset in determining when these transactions would be accounted for as financings (secured borrowings/lending agreements) as opposed to sales (purchases) with commitments to repurchase (resell). Specifically, the updated guidance removes the criterion requiring a transferor to have the ability to repurchase or redeem the financial assets on substantially the same terms, even in the event of default by the transferee, as well as the collateral maintenance guidance related to that criterion. The guidance is effective prospectively for new transfers and existing transactions that are modified in the first interim or annual period beginning on or after December 15, 2011. The adoption of this guidance is not expected to have a material impact on the company’s financial condition or results of operations.
Note 2. Acquisitions
Whitney Holding Corporation
On June 4, 2011, Hancock acquired all of the outstanding common stock of Whitney Holding Corporation (Whitney), a bank holding company based in New Orleans, Louisiana, in a stock and cash transaction. Whitney common shareholders received 0.418 shares of Hancock common stock in exchange for each share of Whitney stock, resulting in Hancock issuing 40,794,261 common shares at a fair value of $1.3 billion. Whitney’s preferred stock and common stock warrant issued under TARP were purchased by the Company for $307.7 million and retired as part of the merger transaction. In total, the purchase price was approximately $1.6 billion including the value of the options to purchase common stock assumed in the merger. On September 16, 2011, seven Whitney Bank branches located on the Mississippi Gulf Coast and one branch located in Bogalusa, LA with approximately $47 million in loans and $180 million in deposits were divested in order to resolve branch concentration concerns of the U.S. Department of Justice relating to the merger.
The Whitney transaction was accounted for using the purchase method of accounting and, accordingly, assets acquired, liabilities assumed and consideration exchanged were recorded at estimated fair value on the acquisition date. Fair values are preliminary and subject to refinement for up to one year after the closing date of the acquisition. Assets acquired, excluding goodwill, totaled $11.2 billion, including $6.5 billion in loans, $2.6 billion of investment securities, and $224 million of identifiable intangible assets. Liabilities assumed were $10.1 billion, including $9.2 billion of deposits.
Goodwill of $589 million was calculated as the excess of the consideration exchanged over the net identifiable assets acquired.
75
Table of Contents
HANCOCK HOLDING COMPANY AND SUBSIDIARIES
NOTES TO CONSOLIDATED FINANCIAL STATEMENTS
Note 2. Acquisitions (continued)
The following table provides the assets purchased, the liabilities assumed and the consideration transferred:
|
Preliminary Statement of Net Assets Acquired (at fair value) and Consideration Transferred (in millions except per share) |
||||||||||||
| Fair value of net assets acquired June 4, 2011 |
Subsequent acquisition-date adjustments |
As recorded by HHC December 31, 2011 |
||||||||||
| ASSETS |
||||||||||||
| Cash and cash equivalents |
$ | 957 | $ | — | $ | 957 | ||||||
| Loans held for sale |
57 | — | 57 | |||||||||
| Securities |
2,635 | 1 | 2,636 | |||||||||
| Loans and leases |
6,456 | (9 | ) | 6,447 | ||||||||
| Property and equipment |
284 | (21 | ) | 263 | ||||||||
| Other intangible assets (1) |
266 | (42 | ) | 224 | ||||||||
| Other assets |
580 | (7 | ) | 573 | ||||||||
|
|
|
|
|
|
|
|||||||
| Total identifiable assets |
11,235 | (78 | ) | 11,157 | ||||||||
|
|
|
|
|
|
|
|||||||
| LIABILITIES |
||||||||||||
| Deposits |
9,182 | — | 9,182 | |||||||||
| Borrowings |
776 | — | 776 | |||||||||
| Other liabilities |
175 | (3 | ) | 172 | ||||||||
|
|
|
|
|
|
|
|||||||
| Total liabilities |
10,133 | (3 | ) | 10,130 | ||||||||
|
|
|
|
|
|
|
|||||||
| Net identifiable assets acquired |
1,102 | (75 | ) | 1,027 | ||||||||
| Goodwill (2) |
514 | 75 | 589 | |||||||||
|
|
|
|
|
|
|
|||||||
| Net assets acquired |
$ | 1,616 | — | $ | 1,616 | |||||||
|
|
|
|
|
|
|
|||||||
| CONSIDERATION: |
||||||||||||
| Hancock Holding Company common shares issued |
41 | |||||||||||
| Purchase price per share of the Company’s common stock (3) |
32.04 | |||||||||||
|
|
|
|||||||||||
| Company common stock issued and cash exchanged for fractional shares |
$ | 1,307 | ||||||||||
| Stock options converted |
1 | |||||||||||
| Cash paid for TARP preferred stock and warrants |
308 | |||||||||||
|
|
|
|||||||||||
| Fair value of total consideration transferred |
$ | 1,616 | ||||||||||
|
|
|
|||||||||||
| (1) | Intangible assets consists of core deposit intangible of $189.4 million, trade name of $11.7 million, trust relationships of $11.1 million, and credit card relationships of $11.3 million. |
| The amortization life is 12—20 years for the CDI intangible asset; 15 years for credit card relationships, 12 years for trust and 2.5 years for tradename intangible asset. |
They will be amortized on an accelerated basis.
| (2) | No goodwill is expected to be deductible for federal income tax purposes. The goodwill will be primarily allocated to the Whitney Bank segment. |
| (3) | The value of the shares of common stock exchanged with Whitney shareholders was based upon the closing price of the Company's common stock at June 3, 2011, the last traded day prior to the date of acquisition. |
The following table (in thousands) provides a restatement of interim periods for the more significant subsequent purchase accounting fair value adjustments to the acquisition date valuations:
| June 30, 2011 Prior |
June 30, 2011 Restated |
September 30, 2011 Prior |
September 30, 2011 Restated |
|||||||||||||
| Goodwill |
$ | 513,917 | $ | 589,531 | $ | 513,917 | $ | 589,531 | ||||||||
| Intangible assets |
222,621 | 234,343 | 206,424 | 218,146 | ||||||||||||
The following table (in thousands) provides a reconciliation of goodwill:
| Goodwill balance at December 31, 2010 |
$ | 61,631 | ||
| Additions: |
||||
| Goodwill from Whitney acquistion at acquisition date |
513,917 | |||
| Purchase accounting fair value adjustments subsequent to acquisition date made during the fourth quarter of 2011 |
75,614 | |||
|
|
|
|||
| Goodwill balance at December 31, 2011 |
$ | 651,162 | ||
|
|
|
76
Table of Contents
HANCOCK HOLDING COMPANY AND SUBSIDIARIES
NOTES TO CONSOLIDATED FINANCIAL STATEMENTS
Note 2. Acquisitions (continued)
The operating results of the Company for the year ended December 31, 2011 include the results from the operations acquired in the Whitney transaction since June 4, 2011. Whitney’s operations contributed approximately $232.5 million in revenue, net of interest expense, and an estimated $35.8 million in net income for the period from the acquisition date.
Merger-related charges of $86.8 million associated with the Whitney acquisition are included in noninterest expense for 2011. Such expenses were for professional services and other incremental costs associated with the conversion of systems and integration of operations, costs related to branch and office consolidations, costs related to termination of existing contractual arrangements for various services, marketing and promotion expenses, and retention and severance and incentive compensation costs. The following table provides a breakdown (in thousands) of merger expenses by category:
| Year Ended December 31, 2011 | ||||
| Personnel expense |
$ | 13,960 | ||
| Equipment expense |
552 | |||
| Data processing expense |
3,163 | |||
| Net occupancy expense |
330 | |||
| Postage and communications |
897 | |||
| Professional services expense |
40,902 | |||
| Printing and supplies |
568 | |||
| Advertising |
5,958 | |||
| Insurance expense |
3,177 | |||
| Other expense |
17,255 | |||
|
|
|
|||
| Total merger-related expenses |
$ | 86,762 | ||
|
|
|
|||
The following unaudited pro forma information presents the results of operations for the twelve months ended December 31, 2011 and 2010, as if the acquisition had occurred at the beginning of the earliest period presented. These adjustments include the impact of certain purchase accounting adjustments such as intangible assets amortization, fixed assets depreciation and elimination of Whitney’s provision. In addition, the $86.8 million in merger expenses discussed above are included in each year. Any additional future operating cost savings and other synergies the Company anticipates as a result of the acquisition are not reflected in the pro forma amounts. These unaudited pro forma results are presented for illustrative purposes and are not intended to represent or be indicative of the actual results of operations of the combined company that would have been achieved had the acquisition occurred at the beginning of the earliest period presented, nor are they intended to represent or be indicative of future results of operations.
| Twelve Months Ended | ||||||||
| December 31, 2011 | December 31, 2010 | |||||||
| (In millions) |
||||||||
| Total revenues , net of interest expense |
$ | 979 | $ | 983 | ||||
| Net Income |
$ | 124 | $ | 94 | ||||
In many cases, determining the fair value of the acquired assets and assumed liabilities required the Company to estimate future cash flows associated with those assets and liabilities and to discount those cash flows at appropriate rates of interest. The most significant estimates related to the valuation of acquired loans. For such loans, the excess of cash flows expected to be collected as of the acquisition date over the estimated fair value is recognized as interest income over the remaining lives of the loans. The difference between contractually required payments at acquisition date and the expected cash flows at acquisition reflects the impact of estimated credit losses and other factors, such as prepayments. In accordance with GAAP, there was no carry-over of Whitney’s previously established allowance for credit losses.
77
Table of Contents
HANCOCK HOLDING COMPANY AND SUBSIDIARIES
NOTES TO CONSOLIDATED FINANCIAL STATEMENTS
Note 2. Acquisitions (continued)
The acquired loans were divided into loans with evidence of credit quality deterioration (acquired impaired) and loans that do not meet this criteria (acquired performing). In addition, the loans were further categorized into different loan pools by loan types. The Company determined expected cash flows on the acquired loans based on the best available information at the date of acquisition. If new information is obtained about circumstances as of the acquisition date that impact cash flows, management will revise the related purchase accounting adjustments in accordance with accounting for business combinations.
Loans at the acquisition date of June 4, 2011 are presented in the following table.
| Acquired Impaired |
Acquired Performing |
Total Acquired Loans |
||||||||||
| (In thousands) |
|
|
||||||||||
| Commercial non-real estate |
$ | 128,813 | $ | 2,414,002 | $ | 2,542,815 | ||||||
| Commercial real estate owner-occupied |
91,885 | 856,583 | 948,468 | |||||||||
| Construction and land development |
159,438 | 564,795 | 724,233 | |||||||||
| Commercial real estate non-owner occupied |
86,573 | 839,258 | 925,831 | |||||||||
|
|
|
|
|
|
|
|||||||
| Total commercial/real estate |
466,709 | 4,674,638 | 5,141,347 | |||||||||
|
|
|
|
|
|
|
|||||||
| Residential mortgage |
68,780 | 818,152 | 886,932 | |||||||||
| Consumer |
— | 418,563 | 418,563 | |||||||||
|
|
|
|
|
|
|
|||||||
| Total |
$ | 535,489 | $ | 5,911,353 | $ | 6,446,842 | ||||||
|
|
|
|
|
|
|
|||||||
The following table presents information about the acquired impaired loans at acquisition (in thousands).
| Contractually required principal and interest payments |
$ | 880,612 | ||
| Nonaccretable difference |
212,987 | |||
|
|
|
|||
| Cash flows expected to be collected |
667,625 | |||
| Accretable difference |
132,136 | |||
|
|
|
|||
| Fair value of loans acquired with a deterioration of credit quality |
$ | 535,489 | ||
|
|
|
The fair value of the acquired performing loans at June 4, 2011, was $5.9 billion. The gross contractually required principal and interest payments receivable for acquired performing loans was $6.8 billion.
The fair value of net assets acquired includes certain contingent liabilities that were recorded as of the acquisition date. Whitney has been named as a defendant in various pending legal actions and proceedings arising in connection with its activities as a financial services institution. Some of these legal actions and proceedings include claims for substantial compensatory and/or punitive damages or claims for indeterminate amounts of damages. Whitney is also involved in investigations and/or proceedings by governmental and self-regulatory agencies. Due to the number of variables and assumptions involved in assessing the possible outcome of these legal actions, sufficient information did not exist to reasonably estimate the fair value of these contingent liabilities. As such, these contingences have been measured in accordance with accounting guidance on contingencies which states that a loss is recognized when it is probable of occurring and the loss amount can be reasonably estimated.
In connection with the Whitney acquisition, on June 4, 2011, the Company recorded a liability for contingent payments to certain employees for arrangements that were in existence prior to acquisition. The fair value of this liability was $58.0 million. The Company also recorded a liability with a fair value of $14.0 million for a contractual contingency assumed in connection with Whitney’s obligations under contracts for a systems conversion and replacement initiative. This initiative was suspended in anticipation of the acquisition. Substantially all of these liabilities are expected to be paid within one year from acquisition date.
78
Table of Contents
HANCOCK HOLDING COMPANY AND SUBSIDIARIES
NOTES TO CONSOLIDATED FINANCIAL STATEMENTS
Note 2. Acquisitions (continued)
Peoples First Community Bank
On December 18, 2009, the Company entered into a purchase and assumption agreement with the Federal Deposit Insurance Corporation (FDIC), as receiver for Peoples First Community Bank (Peoples First) based in Panama City, Florida. According to terms of the agreement, the Company acquired substantially all of the assets of Peoples First and all deposits and borrowings. There was no consideration paid for the acquisition. Peoples First operated 29 branches in Florida with assets totaling approximately $1.7 billion and approximately 437 employees.
The loans purchased are covered by loss share agreements between the FDIC and the Company, which affords the Company significant loss protection. Under the loss share agreement, the FDIC will cover 80% of covered loan losses up to $385 million and 95% of losses in excess of that amount. The term for loss sharing on residential real estate loans is ten years. The term for loss sharing on non-residential real estate loans and other loans is five years. The reimbursable losses from the FDIC are based on the book value of the relevant loan as determined by the FDIC at the date of the transaction.
New loans made after the purchase date are not covered by the loss share agreements. The loss sharing agreements are subject to our compliance with servicing procedures specified in the agreements with the FDIC. The Company recorded an estimated receivable from the FDIC at the acquisition date of $325.6 million which represents the fair value of the FDIC’s portion of the losses that are expected to be incurred and reimbursed to the Company. The outstanding receivable balance at December 31, 2011 and 2010 was $212.9 million and $329.1 million, respectively.
The acquisition was accounted for under the purchase method of accounting in accordance with generally accepted accounting principles regarding acquisitions. The purchased assets and assumed liabilities were recorded at their respective acquisition date fair values. A net acquisition bargain purchase gain of $20.7 million ($33.6 million pretax) resulted from the acquisition and is included as a component of noninterest income on the statement of income. The amount of the gain is equal to the amount by which the fair value of assets purchased exceeded the fair value of liabilities assumed.
79
Table of Contents
HANCOCK HOLDING COMPANY AND SUBSIDIARIES
NOTES TO CONSOLIDATED FINANCIAL STATEMENTS
Note 2. Acquisitions (continued)
The statement of net assets acquired as of December 18, 2009 and the resulting gain are presented in the following table.
| As Recorded by Peoples First Community Bank |
Fair Value Adjustments |
As Recorded by Hancock |
||||||||||
| (In thousands) | ||||||||||||
| Assets |
||||||||||||
| Cash |
$ | 98,068 | $ | 302,208 | (a) | $ | 400,276 | |||||
| Securities |
16,149 | — | 16,149 | |||||||||
| Loans |
1,461,541 | (511,111 | ) (b) | 950,430 | ||||||||
| Property and equipment |
8 | — | 8 | |||||||||
| Core deposit intangible |
— | 11,610 | (c) | 11,610 | ||||||||
| FIDC loss share receivable |
— | 325,606 | (d) | 325,606 | ||||||||
| Other assets |
13,000 | (1,813 | ) (e) | 11,187 | ||||||||
|
|
|
|
|
|
|
|||||||
| Total assets acquired |
$ | 1,588,766 | $ | 126,500 | $ | 1,715,266 | ||||||
|
|
|
|
|
|
|
|||||||
| Liabilities |
||||||||||||
| Deposits |
$ | 1,552,454 | $ | 10,483 | (f) | $ | 1,562,937 | |||||
| FHLB advances |
115,500 | 804 | (g) | 116,304 | ||||||||
| Other liabilities |
2,402 | 12,891 | (h) | 15,293 | ||||||||
|
|
|
|
|
|
|
|||||||
| Total liabilitites acquired |
$ | 1,670,356 | $ | 24,178 | $ | 1,694,534 | ||||||
|
|
|
|
|
|
|
|||||||
|
|
|
|||||||||||
| Net assets acquired “bargain purchase” gain |
$ | 20,732 | ||||||||||
|
|
|
|||||||||||
Explanation of Fair Value Adjustments
(a) Adjustment is for cash received from the FDIC for first losses.
(b) This estimated adjustment is necessary as of the acquisition date to write down People's First book value of loans to the estimated fair value as a result of future loan losses.
(c) This fair value adjustment represents the value of the core deposit base assumed in the acquisition based on a study performed by an independent valuation firm. This amount was recorded by the Company as an identifiable asset and will be amortized as an expense on a straight-line basis over the average life of the core deposit base, which is estimated to be 10 years.
(d) This adjustment is the estimated fair value of the amount that the Company will receive from the FDIC under its loss sharing agreement as a result of future loan losses.
(e) These are adjustments made to acquired assets to reflect fair value primarily for a write-down of an investment in a subsidiary and accrued interest receivable for loans that should have been placed on non-accrual prior to the acquisition.
(f) This fair value adjustment was recorded because the weighted average interest rate of People's First time deposits exceeded the cost of similar wholesale funding at the time of the acquisition. This amount will be amortized to reduce interest expense on a declining basis over the average life of the portifolio of approximately 7 months.
(g) The fair value adjustment was recorded because the interest rates of People's fixed rate borrowings exceeded the current interest rates on similar borrowings. This amount will be amortized to interest expense over terms of the borrowings.
(h) This adjustment is for the tax effect of the merger.
80
Table of Contents
HANCOCK HOLDING COMPANY AND SUBSIDIARIES
NOTES TO CONSOLIDATED FINANCIAL STATEMENTS
Note 2. Acquisitions (continued)
The Company expensed merger-related charges of $3.2 million in 2010 and $3.7 million in 2009. These charges represent costs associated with severance and employee related charges, systems integrations, and other merger-related charges.
| Years Ended December 31, | ||||||||
| 2010 | 2009 | |||||||
| Personnel expense |
$ | 27 | $ | 1,760 | ||||
| Equipment expense |
57 | — | ||||||
| Data processing expense |
944 | 6 | ||||||
| Net occupancy expense |
4 | 118 | ||||||
| Postage and communications |
60 | 1 | ||||||
| Professional services expense |
1,263 | 1,283 | ||||||
| Printing and supplies |
194 | 12 | ||||||
| Advertising |
113 | 408 | ||||||
| Insurance expense |
— | — | ||||||
| Other expense |
505 | 94 | ||||||
|
|
|
|
|
|||||
| Total merger-related expenses |
$ | 3,167 | $ | 3,682 | ||||
|
|
|
|
|
|||||
Due primarily to the significant amount of fair value adjustments and the FDIC loss sharing agreements now in place, historical results of Peoples First are not believed to be relevant to the Company’s results, and thus no pro forma information is presented.
Note 3. Long-Term Debt
Long-term debt consisted of the following:
| December 31, 2011 | December 31, 2010 | |||||||
| Subordinated notes payable |
$ | 150,000 | $ | — | ||||
| Term note payable |
140,000 | — | ||||||
| Subordinated debentures |
— | — | ||||||
| Other long-term debt |
63,890 | 376 | ||||||
|
|
|
|
|
|||||
| Total long-term debt |
$ | 353,890 | $ | 376 | ||||
|
|
|
|
|
|||||
As part of the merger with Whitney, the Company assumed Whitney National Bank’s $150 million par value subordinated notes which carry an interest rate of 5.875% and mature April 1, 2017. These notes qualify as capital for the calculation of the regulatory ratio of total capital to risk-weighted assets. Beginning in the second quarter of 2012, the amount qualifying as capital will be reduced by 20% per year as the notes approach maturity.
During the second quarter of 2011, the Company borrowed $140 million under a term loan facility at a variable rate based on LIBOR plus 2.00% per annum. The note matures on June 3, 2013 and is pre-payable at any time. The Company is subject to covenants customary in financings of this nature, and compliance with these covenants is not expected to impact the operations of the Company. The Company must maintain the following financial covenants: maximum ratio of consolidated non-performing assets to consolidated total loans and other real estate excluding covered loans of 4.0% through June 2012 and 3.5% thereafter; an initial minimum consolidated net worth of $2.1 billion increasing each quarter by 50% of consolidated net income, but not decreasing for net losses, and increasing by 100% of any common stock issuance. The Company must also maintain a Tier 1 leverage ratio of at least 7%; a Tier 1 risk based capital ratio of at least 9.5%; and a total risk based capital ratio of at least 11.5%. The Company was in compliance with all covenants as of December 31, 2011.
Substantially all of the other long-term debt consists of borrowings associated with tax credit fund activities. These borrowings mature at various dates beginning in 2015 through 2041.
81
Table of Contents
HANCOCK HOLDING COMPANY AND SUBSIDIARIES
NOTES TO CONSOLIDATED FINANCIAL STATEMENTS
Note 4. Derivatives
Risk Management Objective of Using Derivatives
The Company enters into derivative financial instruments to manage risks related to differences in the amount, timing, and duration of the Company’s known or expected cash receipts and its known or expected cash payments, currently related to our variable rate borrowing and fixed rate loans. The Company has also entered into interest rate derivative agreements as a service to certain qualifying customers. The Company manages a matched book with respect to its customer derivatives in order to minimize its net risk exposure resulting from such agreements.
Fair Values of Derivative Instruments on the Balance Sheet
The table below presents the fair value (in thousands) of the Company’s derivative financial instruments as well as their classification on the consolidated balance sheets as of December 31, 2011 and December 31, 2010.
| Tabular Disclosure of Fair Values of Derivative Instruments | ||||||||||||||||||||||||||||||
| Asset Derivatives | Liability Derivatives | |||||||||||||||||||||||||||||
| As of December 31, 2011 | As of December 31, 2010 | As of December 31, 2011 | As of December 31, 2010 | |||||||||||||||||||||||||||
| Balance Sheet Location |
Fair Value |
Balance Sheet Location |
Fair Value | Balance Sheet Location |
Fair Value | Balance Sheet Location |
Fair Value | |||||||||||||||||||||||
| Derivatives designated as hedging instruments |
||||||||||||||||||||||||||||||
| Interest rate products |
Other assets |
$ | — | Other assets | $ | — | Other liabilities | $ | 107 | Other liabilities | $ | — | ||||||||||||||||||
|
|
|
|
|
|
|
|
|
|||||||||||||||||||||||
| Total derivatives designated as hedging instruments |
$ | — | $ | — | $ | 107 | $ | — | ||||||||||||||||||||||
|
|
|
|
|
|
|
|
|
|||||||||||||||||||||||
| Derivatives not designated as hedging instruments |
||||||||||||||||||||||||||||||
| Interest rate products |
Other assets |
$ | 14,952 | Other assets | $ | 2,952 | Other liabilities | $ | 15,536 | Other liabilities | $ | 2,952 | ||||||||||||||||||
|
|
|
|
|
|
|
|
|
|||||||||||||||||||||||
| Total derivatives not designated as hedging instruments |
$ | 14,952 | $ | 2,952 | $ | 15,536 | $ | 2,952 | ||||||||||||||||||||||
|
|
|
|
|
|
|
|
|
|||||||||||||||||||||||
Cash Flow Hedges of Interest Rate Risk
The Company’s objectives in using interest rate derivatives are to add stability to interest expense and to manage its exposure to interest rate movements. To accomplish this objective, the Company primarily uses interest rate swaps as part of its interest rate risk management strategy. For hedges of the Company’s variable-rate borrowings, interest rate swaps designated as cash flow hedges involve the receipt of variable amounts from a counterparty in exchange for the Company making fixed payments. As of December 31, 2011, the Company had one interest rate swap with an aggregate notional amount of $140.0 million that was designated as a cash flow hedge of the Company’s forecasted variable cash flows under a variable-rate term loan agreement. The Company did not have any cash flow hedges outstanding at December 31, 2010 or during 2010.
The effective portion of changes in the fair value of derivatives designated and qualifying as cash flow hedges is recorded in accumulated other comprehensive income (“AOCI”) and is subsequently reclassified into earnings in the period that the hedged forecasted transaction affects earnings. The impact on AOCI during 2011 was insignificant, and the impact of reclassifications on earnings during 2012 is expected to also be insignificant. The ineffective portion of the change in fair value of derivatives is recognized directly in earnings. No hedge ineffectiveness was recognized during the year ended December 31, 2011.
82
Table of Contents
HANCOCK HOLDING COMPANY AND SUBSIDIARIES
NOTES TO CONSOLIDATED FINANCIAL STATEMENTS
Note 4. Derivatives (continued)
Derivatives Not Designated as Hedges
Derivatives not designated as hedges are not speculative and result from a service the Banks provide to certain customers. The Banks execute interest rate derivatives, primarily rate swaps, with commercial banking customers to facilitate their risk management strategies. The Banks simultaneously enter into offsetting agreements with unrelated financial institutions, thereby minimizing its net risk exposure resulting from such transactions. As the interest rate derivatives associated with this program do not meet the strict hedge accounting requirements, changes in the fair value of both the customer derivatives and the offsetting derivatives are recognized directly in earnings. As of December 31, 2011, the Banks had entered into interest rate derivatives, including both customer and offsetting agreements, with an aggregate notional amount of $541.8 million related to this program.
Effect of Derivative Instruments on the Income Statement
The tables below present the effect of the Company’s derivative financial instruments (in thousands) on the income statement for the years ended December 31, 2011 and December 31, 2010, respectively.
| Derivatives in FASB ASC 815 Cash Flow Hedging Relationships |
Amount of Gain or (Loss) Recognized in OCI on Derivative (Effective Portion) Year Ended |
Gain or
(Loss) Reclassified from Accumulated OCI into Income |
Amount of Gain or (Loss) Reclassified from Accumulated OCI into Income (Effective Portion) Year Ended |
Location of Gain
or (Loss) Recognized in Income on Derivative (Ineffective Portion) |
Amount of Gain or (Loss) Recognized in Income on Derivative (Ineffective Portion) Year Ended |
|||||||||||||||||||||||
| 31-Dec-11 | 31-Dec-10 | 31-Dec-11 | 31-Dec-10 | 31-Dec-11 | 31-Dec-10 | |||||||||||||||||||||||
| Interest Rate Products |
$ | (107 | ) | $ | — | Interest income Other non- interest income |
$ | — | $ | — | Other non-interest income |
$ | — | $ | — | |||||||||||||
|
|
|
|
|
|
|
|
|
|
|
|
|
|||||||||||||||||
| Total |
$ | (107 | ) | $ | — | $ | — | $ | — | $ | — | $ | — | |||||||||||||||
|
|
|
|
|
|
|
|
|
|
|
|
|
|||||||||||||||||
| Derivatives Not Designated as Hedging Instruments |
Location of Gain or (Loss) Recognized in Income on Derivative |
Amount of Gain or (Loss) Recognized in Income on Year Ended |
||||||||
| 31-Dec-11 | 31-Dec-10 | |||||||||
| Interest Rate Products |
Other non-interest income | $ | (315 | ) | $ | — | ||||
|
|
|
|
|
|||||||
| Total |
$ | (315 | ) | $ | — | |||||
|
|
|
|
|
|||||||
Credit Risk-Related Contingent Features
Certain of the Banks’ derivative instruments contain provisions allowing the financial institution counterparty to terminate the contracts in certain circumstances, such as the downgrade of the Banks’ credit ratings below specified levels, a default by the Bank on its indebtedness, or the failure of a Bank to maintain specified minimum regulatory capital ratios or its regulatory status as a well-capitalized institution. These derivative agreements also contain provisions regarding the positing of collateral by each party. The aggregate fair value of derivative instruments with credit-risk-related contingent features that were in a liability position on December 31, 2011 was $12.2 million, for which the Bank’s had posted collateral of $11.6 million.
83
Table of Contents
HANCOCK HOLDING COMPANY AND SUBSIDIARIES
NOTES TO CONSOLIDATED FINANCIAL STATEMENTS
Note 5. Securities
The amortized cost and fair value of securities classified as available for sale follow (in thousands):
| December 31, 2011 | December 31, 2010 | |||||||||||||||||||||||||||||||
| Amortized Cost |
Gross Unrealized Gains |
Gross Unrealized Losses |
Fair Value |
Amortized Cost |
Gross Unrealized Gains |
Gross Unrealized Losses |
Fair Value |
|||||||||||||||||||||||||
| U.S. Treasury |
$ | 150 | $ | 14 | $ | — | 164 | $ | 10,797 | $ | 52 | $ | 5 | 10,844 | ||||||||||||||||||
| U.S. government agencies |
248,595 | 1,308 | — | 249,903 | 106,054 | 971 | 434 | 106,591 | ||||||||||||||||||||||||
| Municipal obligations |
294,489 | 15,218 | 42 | 309,665 | 181,747 | 4,107 | 5,411 | 180,443 | ||||||||||||||||||||||||
| Mortgage-backed securities |
2,422,891 | 58,150 | 696 | 2,480,345 | 761,704 | 38,032 | 50 | 799,686 | ||||||||||||||||||||||||
| CMOs |
1,426,495 | 21,774 | 2,193 | 1,446,076 | 367,662 | 6,880 | 2,491 | 372,051 | ||||||||||||||||||||||||
| Other debt securities |
4,517 | 11 | 34 | 4,494 | 14,329 | 999 | 43 | 15,285 | ||||||||||||||||||||||||
| Other equity securities |
4,208 | 2,086 | 41 | 6,253 | 3,428 | 660 | 103 | 3,985 | ||||||||||||||||||||||||
|
|
|
|
|
|
|
|
|
|
|
|
|
|
|
|
|
|||||||||||||||||
| $ | 4,401,345 | $ | 98,561 | $ | 3,006 | $ | 4,496,900 | $ | 1,445,721 | $ | 51,701 | $ | 8,537 | $ | 1,488,885 | |||||||||||||||||
|
|
|
|
|
|
|
|
|
|
|
|
|
|
|
|
|
|||||||||||||||||
The following table presents the amortized cost and fair value of securities classified as available for sale at December 31, 2011, by contractual maturity (in thousands). Actual maturities will differ from contractual maturities because of rights to call or repay obligations with or without penalties.
| Amortized Cost |
Fair Value | |||||||
| Due in one year or less |
$ | 292,434 | $ | 293,803 | ||||
| Due after one year through five years |
915,985 | 934,279 | ||||||
| Due after five years through ten years |
405,288 | 421,935 | ||||||
| Due after ten years |
2,783,430 | 2,840,630 | ||||||
| Equity securities |
4,208 | 6,253 | ||||||
|
|
|
|
|
|||||
| Total available for sale securities |
$ | 4,401,345 | $ | 4,496,900 | ||||
|
|
|
|
|
|||||
The Company held no securities classified as held to maturity or trading at December 31, 2011 or 2010.
The details concerning securities classified as available for sale with unrealized losses as of December 31, 2011 follow (in thousands):
| Losses < 12 months | Losses 12 months or > | Total | ||||||||||||||||||||||
| Fair Value |
Gross Unrealized Losses |
Fair Value |
Gross Unrealized Losses |
Fair Value |
Gross Unrealized Losses |
|||||||||||||||||||
| U.S. Treasury |
$ | — | $ | — | $ | — | $ | — | $ | — | $ | — | ||||||||||||
| U.S. government agencies |
— | — | — | — | — | — | ||||||||||||||||||
| Municipal obligations |
18,854 | 42 | — | — | 18,854 | 42 | ||||||||||||||||||
| Mortgage-backed securities |
212,900 | 692 | 337 | 4 | 213,237 | 696 | ||||||||||||||||||
| CMOs |
296,860 | 2,193 | — | — | 296,860 | 2,193 | ||||||||||||||||||
| Other debt securities |
398 | 34 | — | — | 398 | 34 | ||||||||||||||||||
| Equity securities |
1,685 | 39 | 2 | 2 | 1,687 | 41 | ||||||||||||||||||
|
|
|
|
|
|
|
|
|
|
|
|
|
|||||||||||||
| $ | 530,697 | $ | 3,000 | $ | 339 | $ | 6 | $ | 531,036 | $ | 3,006 | |||||||||||||
|
|
|
|
|
|
|
|
|
|
|
|
|
|||||||||||||
84
Table of Contents
HANCOCK HOLDING COMPANY AND SUBSIDIARIES
NOTES TO CONSOLIDATED FINANCIAL STATEMENTS
Note 5. Securities (continued)
The details concerning securities classified as available for sale with unrealized losses as of December 31, 2010 were as follows (in thousands):
| Losses < 12 months | Losses 12 months or > | Total | ||||||||||||||||||||||
| Fair Value |
Gross Unrealized Losses |
Fair Value |
Gross Unrealized Losses |
Fair Value |
Gross Unrealized Losses |
|||||||||||||||||||
| U.S Treasury |
$ | 9,980 | $ | 5 | $ | — | $ | — | $ | 9,980 | $ | 5 | ||||||||||||
| U.S. government agencies |
74,566 | 434 | — | — | 74,566 | 434 | ||||||||||||||||||
| Municipal obligations |
57,713 | 3,092 | 19,870 | 2,319 | 77,583 | 5,411 | ||||||||||||||||||
| Mortgage-backed securities |
122 | 1 | 1,340 | 49 | 1,462 | 50 | ||||||||||||||||||
| CMOs |
122,312 | 2,491 | — | — | 122,312 | 2,491 | ||||||||||||||||||
| Other debt securities |
379 | 6 | 459 | 37 | 838 | 43 | ||||||||||||||||||
| Equity securities |
2,552 | 87 | 11 | 16 | 2,563 | 103 | ||||||||||||||||||
|
|
|
|
|
|
|
|
|
|
|
|
|
|||||||||||||
| $ | 267,624 | $ | 6,116 | $ | 21,680 | $ | 2,421 | $ | 289,304 | $ | 8,537 | |||||||||||||
|
|
|
|
|
|
|
|
|
|
|
|
|
|||||||||||||
Substantially all of the unrealized losses relate mainly to changes in market rates on fixed-rate debt securities since the respective purchase date. In all cases, the indicated impairment would be recovered by the security’s maturity date or possibly earlier if the market price for the security increases with a reduction in the yield required by the market. None of the unrealized losses relate to the marketability of the securities or the issuer’s ability to honor redemption of the obligations. The Company has adequate liquidity and, therefore, does not plan to sell and, is more likely than not, will not be required to sell these securities before recovery of the indicated impairment. Accordingly, the unrealized losses on these securities have been determined to be temporary.
Proceeds from sales of available for sale securities were approximately $342.9 million in 2011, $0.3 million in 2010 and $11.7 million in 2009. Realized gross gains and losses were insignificant. Substantially all of the proceeds in 2011 came from the sale of a portion of the portfolio acquired in the Whitney acquisition.
Securities with carrying values totaling approximately $3.0 billion at December 31, 2011 and $1.3 billion at December 31, 2010 were pledged primarily to secure public deposits or sold under agreements to repurchase.
85
Table of Contents
HANCOCK HOLDING COMPANY AND SUBSIDIARIES
NOTES TO CONSOLIDATED FINANCIAL STATEMENTS
Note 6. Loans
Loans, net of unearned income, consisted of the following (in thousands):
| December 31, | ||||||||
| 2011 | 2010 | |||||||
| (In thousands) | ||||||||
| Originated loans: |
||||||||
| Commerical |
$ | 1,525,409 | $ | 1,046,431 | ||||
| Construction |
540,806 | 495,590 | ||||||
| Real estate |
1,259,757 | 1,231,414 | ||||||
| Residential mortgage loans |
487,147 | 366,183 | ||||||
| Consumer loans |
1,074,611 | 1,008,395 | ||||||
|
|
|
|
|
|||||
| Total originated loans |
$ | 4,887,730 | $ | 4,148,013 | ||||
|
|
|
|
|
|||||
| Acquired loans: |
||||||||
| Commerical |
$ | 2,236,758 | $ | — | ||||
| Construction |
603,371 | — | ||||||
| Real estate |
1,656,515 | — | ||||||
| Residential mortgage loans |
734,669 | — | ||||||
| Consumer loans |
386,540 | — | ||||||
|
|
|
|
|
|||||
| Total acquired loans |
5,617,853 | — | ||||||
|
|
|
|
|
|||||
| Covered loans: |
||||||||
| Commerical |
$ | 38,063 | $ | 35,190 | ||||
| Construction |
118,828 | 157,267 | ||||||
| Real estate |
82,651 | 181,873 | ||||||
| Residential mortgage loans |
285,682 | 293,506 | ||||||
| Consumer loans |
146,219 | 141,315 | ||||||
|
|
|
|
|
|||||
| Total covered loans |
$ | 671,443 | $ | 809,151 | ||||
|
|
|
|
|
|||||
| Total loans: |
||||||||
| Commerical |
$ | 3,800,230 | $ | 1,081,621 | ||||
| Construction |
1,263,005 | 652,857 | ||||||
| Real estate |
2,998,923 | 1,413,287 | ||||||
| Residential mortgage loans |
1,507,498 | 659,689 | ||||||
| Consumer loans |
1,607,370 | 1,149,710 | ||||||
|
|
|
|
|
|||||
| Total loans |
$ | 11,177,026 | $ | 4,957,164 | ||||
|
|
|
|
|
|||||
The Company generally makes loans in its market areas of South Mississippi, South Alabama, South and Central Louisiana, the Houston, Texas area and Central and North Florida. Loans are made in the normal course of business to its directors, executive officers and their associates on substantially the same terms, including interest rates and collateral, as those prevailing at the time for comparable transactions with other persons. Such loans did not involve more than normal risk of collectability. Balances of loans to the Company’s directors, executive officers and their affiliates at December 31, 2011 and 2010 were approximately $64.7 million and $40.5 million, respectively. New loans, repayments and net balances from changes in directors and executive officers and their affiliates for 2011 were $28.0 million, $33.1 million and $29.3 million, respectively.
86
Table of Contents
HANCOCK HOLDING COMPANY AND SUBSIDIARIES
NOTES TO CONSOLIDATED FINANCIAL STATEMENTS
Note 6. Loans (continued)
The following schedule shows activity in the allowance for loan losses for 2011 and 2010 by portfolio segment and the related corresponding recorded investment in loans as of December 31, 2011 and December 31, 2010. The information for 2009 is shown in summary form:
| Commercial | Residential mortgages |
Consumer | Total | |||||||||||||
| (In thousands) |
December 31, 2011 | |||||||||||||||
| Allowance for loan losses: |
||||||||||||||||
| Beginning balance |
$ | 56,859 | $ | 4,626 | $ | 20,512 | $ | 81,997 | ||||||||
| Charge-offs |
(54,754 | ) | (2,634 | ) | (12,875 | ) | (70,263 | ) | ||||||||
| Recoveries |
20,006 | 1,091 | 3,887 | 24,984 | ||||||||||||
| Net provision for loan losses (a) |
29,762 | 1,632 | 7,338 | 38,732 | ||||||||||||
| Increase in indemnification asset (a) |
26,541 | 9,203 | 13,687 | 49,431 | ||||||||||||
|
|
|
|
|
|
|
|
|
|||||||||
| Ending balance |
$ | 78,414 | $ | 13,918 | $ | 32,549 | $ | 124,881 | ||||||||
|
|
|
|
|
|
|
|
|
|||||||||
| Ending balance: |
||||||||||||||||
| Individually evaluated for impairment |
$ | 6,988 | $ | 551 | $ | — | $ | 7,539 | ||||||||
| Ending balance: |
||||||||||||||||
| Collectively evaluated for impairment |
$ | 71,426 | $ | 13,367 | $ | 32,549 | $ | 117,342 | ||||||||
| Ending balance: |
||||||||||||||||
| Covered loans with deteriorated credit quality |
$ | 18,203 | $ | 9,024 | $ | 14,408 | $ | 41,635 | ||||||||
| Loans: |
||||||||||||||||
| Ending balance: |
$ | 8,062,158 | $ | 1,507,498 | $ | 1,607,370 | $ | 11,177,026 | ||||||||
| Ending balance: |
||||||||||||||||
| Individually evaluated for impairment |
$ | 28,034 | $ | 4,090 | $ | — | $ | 32,124 | ||||||||
| Ending balance: |
||||||||||||||||
| Collectively evaluated for impairment |
$ | 7,794,582 | $ | 1,217,726 | $ | 1,461,151 | $ | 10,473,459 | ||||||||
| Ending balance: |
||||||||||||||||
| Covered loans |
$ | 239,542 | $ | 285,682 | $ | 146,219 | $ | 671,443 | ||||||||
| Ending balance: |
||||||||||||||||
| Acquired loans (b) |
$ | 4,496,644 | $ | 734,669 | $ | 386,540 | $ | 5,617,853 | ||||||||
(a) The Company increased the allowance by $51.7 million for losses related to impairment on certain pools of covered loans. This provision was mostly offset by a $48.8 million increase in the FDIC indemnification asset.
(b) Acquired loans were recorded at fair value with no allowance brought forward in accordance with acquisition accounting. There has been no allowance since acquisition.
| Commercial | Residential mortgages |
Consumer | Total | Total | ||||||||||||||||
| (In thousands) |
December 31, 2010 | 2009 | ||||||||||||||||||
| Allowance for loan losses: |
||||||||||||||||||||
| Beginning balance |
$ | 42,484 | $ | 4,782 | $ | 18,784 | $ | 66,050 | $ | 61,725 | ||||||||||
| Charge-offs |
(39,393 | ) | (4,615 | ) | (14,258 | ) | (58,266 | ) | (54,915 | ) | ||||||||||
| Recoveries |
3,491 | 740 | 3,353 | 7,584 | 4,650 | |||||||||||||||
| Net provision for loan losses (a) |
50,277 | 3,719 | 11,995 | 65,991 | 54,590 | |||||||||||||||
| Increase in indemnification asset (a) |
— | — | 638 | 638 | — | |||||||||||||||
|
|
|
|
|
|
|
|
|
|
|
|||||||||||
| Ending balance |
$ | 56,859 | $ | 4,626 | $ | 20,512 | $ | 81,997 | $ | 66,050 | ||||||||||
|
|
|
|
|
|
|
|
|
|
|
|||||||||||
| Ending balance: |
||||||||||||||||||||
| Individually evaluated for impairment |
$ | 10,648 | $ | 1,304 | $ | — | $ | 11,952 | $ | 10,972 | ||||||||||
| Ending balance: |
||||||||||||||||||||
| Collectively evaluated for impairment |
$ | 46,211 | $ | 3,322 | $ | 20,512 | $ | 70,045 | $ | 55,078 | ||||||||||
| Ending balance: |
||||||||||||||||||||
| Covered loans with deteriorated credit quality |
$ | — | $ | — | $ | — | $ | — | $ | — | ||||||||||
| Loans: |
||||||||||||||||||||
| Ending balance: |
$ | 3,147,765 | $ | 659,689 | $ | 1,149,710 | $ | 4,957,164 | $ | 5,114,175 | ||||||||||
| Ending balance: |
||||||||||||||||||||
| Individually evaluated for impairment |
$ | 56,836 | $ | 5,618 | $ | — | $ | 62,454 | $ | 78,005 | ||||||||||
| Ending balance: |
||||||||||||||||||||
| Collectively evaluated for impairment |
$ | 2,716,598 | $ | 360,566 | $ | 1,008,395 | $ | 4,085,559 | $ | 4,085,740 | ||||||||||
| Ending balance: |
||||||||||||||||||||
| Covered loans |
$ | 374,331 | $ | 293,505 | $ | 141,315 | $ | 809,151 | $ | 950,430 | ||||||||||
(a) The Company increased the allowance by $0.7 million for losses related to impairment on certain pools of covered loans. This provision was mostly offset by a $0.6 million increase in the FDIC indemnification asset.
87
Table of Contents
HANCOCK HOLDING COMPANY AND SUBSIDIARIES
NOTES TO CONSOLIDATED FINANCIAL STATEMENTS
Note 6. Loans (continued)
The following table shows the composition of non-accrual loans by portfolio segment and class. Covered and acquired loans are considered to be performing due to the application of the accretion method and are excluded from the table. Certain covered loans accounted for using the cost recovery method do not have an accretable yield and are disclosed below as non-accrual loans.
| December 31, 2011 |
December 31, 2010 |
|||||||
| (In thousands) | ||||||||
| Originated loans: |
||||||||
| Commercial loans |
$ | 55,046 | $ | 50,379 | ||||
| Residential mortgage loans |
24,406 | 18,699 | ||||||
| Consumer loans |
3,855 | 6,621 | ||||||
|
|
|
|
|
|||||
| Total originated loans |
$ | 83,307 | $ | 75,699 | ||||
|
|
|
|
|
|||||
| Acquired loans: |
||||||||
| Commercial loans |
$ | — | $ | — | ||||
| Residential mortgage loans |
— | — | ||||||
| Consumer loans |
1,117 | — | ||||||
|
|
|
|
|
|||||
| Total acquired loans |
$ | 1,117 | $ | — | ||||
|
|
|
|
|
|||||
| Covered loans: |
||||||||
| Commercial loans |
$ | 18,209 | $ | 41,917 | ||||
| Residential mortgage loans |
637 | 3,199 | ||||||
| Consumer loans |
— | 170 | ||||||
|
|
|
|
|
|||||
| Total covered loans |
$ | 18,846 | $ | 45,286 | ||||
|
|
|
|
|
|||||
| Total loans: |
||||||||
| Commercial loans |
$ | 73,255 | $ | 92,296 | ||||
| Residential mortgage loans |
25,043 | 21,898 | ||||||
| Consumer loans |
4,972 | 6,791 | ||||||
|
|
|
|
|
|||||
| Total loans |
$ | 103,270 | $ | 120,985 | ||||
|
|
|
|
|
|||||
The amount of interest that would have been recorded on non-accrual loans had the loans not been classified as non-accrual in 2011, 2010 and 2009, was $4.9 million, $5.7 million and $2.0 million, respectively. Interest actually received on non-accrual loans during 2011, 2010 and 2009 was $1.1 million, $1.0 million and $0.3 million, respectively.
Included in non-accrual loans is $4.1 million in restructured commercial loans. Total troubled debt restructurings for the period ending December 31, 2011, were $18.1 million. The Company had $12.6 in loans classified as restructured at December 31, 2010. Non-accrual and restructured loans amounted to approximately 1.05% and 2.52% of total loans at December 31, 2011 and December 31, 2010, respectively. Modified acquired impaired loans are not removed from their accounting pool and accounted for as TDRs, even if those loans would otherwise be deemed TDRs.
88
Table of Contents
HANCOCK HOLDING COMPANY AND SUBSIDIARIES
NOTES TO CONSOLIDATED FINANCIAL STATEMENTS
Note 6. Loans (continued)
The table below details the troubled debt restructurings that occurred during 2011 and 2010 by portfolio segment and troubled debt restructurings that subsequently defaulted within twelve months of modification (dollar amounts in thousands).
| 2011 | 2010 | |||||||||||||||||||||||
| Troubled Debt Restructurings: |
Number of Contracts |
Pre-Modification Outstanding Recorded Investment |
Post-Modification Outstanding Recorded Investment |
Number of Contracts |
Pre-Modification Outstanding Recorded Investment |
Post-Modification Outstanding Recorded Investment |
||||||||||||||||||
| Total loans: |
||||||||||||||||||||||||
| Commercial loans |
24 | $ | 20,040 | $ | 16,954 | 7 | $ | 12,408 | $ | 11,603 | ||||||||||||||
| Residential mortgage loans |
3 | 1,206 | 1,191 | 2 | 1,177 | 1,038 | ||||||||||||||||||
|
|
|
|
|
|
|
|
|
|
|
|
|
|||||||||||||
| Total loans |
27 | $ | 21,246 | $ | 18,145 | 9 | $ | 13,585 | $ | 12,641 | ||||||||||||||
|
|
|
|
|
|
|
|
|
|
|
|
|
|||||||||||||
| 2011 | 2010 | |||||||||||||||
| Troubled Debt Restructurings That Subsequently Defaulted: |
Number of Contracts |
Recorded Investment |
Number of Contracts |
Recorded Investment |
||||||||||||
| Total loans: |
||||||||||||||||
| Commercial loans |
2 | $ | 742 | — | $ | — | ||||||||||
|
|
|
|
|
|
|
|
|
|||||||||
| Total loans |
2 | $ | 742 | — | $ | — | ||||||||||
|
|
|
|
|
|
|
|
|
|||||||||
The table below presents impaired loans disaggregated by class at December 31, 2011 and 2010:
| December 31, 2011 |
Recorded Investment |
Unpaid Principal Balance |
Related Allowance |
Average Recorded Investment |
Interest Income Recognized |
|||||||||||||||
| (In thousands) | ||||||||||||||||||||
| Total loans: |
||||||||||||||||||||
| With no related allowance recorded: |
||||||||||||||||||||
| Commercial |
$ | 28,051 | $ | 46,692 | $ | — | $ | 18,461 | $ | 359 | ||||||||||
| Residential mortgages |
1,582 | 2,802 | — | 2,934 | 58 | |||||||||||||||
| Consumer |
— | — | — | — | — | |||||||||||||||
|
|
|
|
|
|
|
|
|
|
|
|||||||||||
| 29,633 | 49,494 | — | 21,395 | 417 | ||||||||||||||||
| With an allowance recorded: |
||||||||||||||||||||
| Commercial |
28,369 | 33,503 | 6,997 | 59,724 | 254 | |||||||||||||||
| Residential mortgages |
4,298 | 5,588 | 570 | 5,059 | 7 | |||||||||||||||
| Consumer |
— | — | — | — | — | |||||||||||||||
|
|
|
|
|
|
|
|
|
|
|
|||||||||||
| 32,667 | 39,091 | 7,567 | 64,783 | 261 | ||||||||||||||||
| Total: |
||||||||||||||||||||
| Commercial |
56,420 | 80,195 | 6,997 | 78,185 | 613 | |||||||||||||||
| Residential mortgages |
5,880 | 8,390 | 570 | 7,993 | 65 | |||||||||||||||
| Consumer |
— | — | — | — | — | |||||||||||||||
|
|
|
|
|
|
|
|
|
|
|
|||||||||||
| Total loans |
$ | 62,300 | $ | 88,585 | $ | 7,567 | $ | 86,178 | $ | 678 | ||||||||||
|
|
|
|
|
|
|
|
|
|
|
|||||||||||
| December 31, 2010 |
Recorded Investment |
Unpaid Principal Balance |
Related Allowance |
Average Recorded Investment |
Interest Income Recognized |
|||||||||||||||
| (In thousands) | ||||||||||||||||||||
| Total loans: |
||||||||||||||||||||
| With no related allowance recorded: |
||||||||||||||||||||
| Commercial |
$ | 64,558 | $ | 102,144 | $ | — | $ | 75,543 | $ | 224 | ||||||||||
| Residential mortgages |
4,462 | 6,207 | — | 5,232 | 26 | |||||||||||||||
| Consumer |
170 | 170 | — | 184 | — | |||||||||||||||
|
|
|
|
|
|
|
|
|
|
|
|||||||||||
| 69,190 | 108,521 | — | 80,959 | 250 | ||||||||||||||||
| With an allowance recorded: |
||||||||||||||||||||
| Commercial |
34,194 | 40,244 | 10,648 | 36,650 | 523 | |||||||||||||||
| Residential mortgages |
4,355 | 4,873 | 1,304 | 4,358 | 88 | |||||||||||||||
| Consumer |
— | — | — | — | — | |||||||||||||||
|
|
|
|
|
|
|
|
|
|
|
|||||||||||
| 38,549 | 45,117 | 11,952 | 41,008 | 611 | ||||||||||||||||
| Total: |
||||||||||||||||||||
| Commercial |
98,752 | 142,388 | 10,648 | 112,193 | 747 | |||||||||||||||
| Residential mortgages |
8,817 | 11,080 | 1,304 | 9,590 | 114 | |||||||||||||||
| Consumer |
170 | 170 | — | 184 | — | |||||||||||||||
|
|
|
|
|
|
|
|
|
|
|
|||||||||||
| Total loans |
$ | 107,739 | $ | 153,638 | $ | 11,952 | $ | 121,967 | $ | 861 | ||||||||||
|
|
|
|
|
|
|
|
|
|
|
|||||||||||
89
Table of Contents
HANCOCK HOLDING COMPANY AND SUBSIDIARIES
NOTES TO CONSOLIDATED FINANCIAL STATEMENTS
Note 6. Loans (continued)
Covered and acquired loans with an accretable yield are considered to be current in the following delinquency table. Certain covered loans accounted for using the cost recovery method are disclosed according to their contractual payment status below. The following table presents the age analysis of past due loans at December 31, 2011 and 2010:
| December 31, 2011 |
30-89 days past due |
Greater than 90 days past due |
Total past due |
Current | Total Loans |
Recorded investment > 90 days and accruing |
||||||||||||||||||
| (In thousands) | ||||||||||||||||||||||||
| Originated loans: |
||||||||||||||||||||||||
| Commercial loans |
$ | 24,939 | $ | 58,867 | $ | 83,806 | $ | 3,242,166 | $ | 3,325,972 | $ | 3,821 | ||||||||||||
| Residential mortgages loans |
22,248 | 25,400 | 47,648 | 439,499 | 487,147 | 994 | ||||||||||||||||||
| Consumer loans |
4,284 | 3,911 | 8,195 | 1,066,416 | 1,074,611 | 56 | ||||||||||||||||||
|
|
|
|
|
|
|
|
|
|
|
|
|
|||||||||||||
| Total |
$ | 51,471 | $ | 88,178 | $ | 139,649 | $ | 4,748,081 | $ | 4,887,730 | $ | 4,871 | ||||||||||||
|
|
|
|
|
|
|
|
|
|
|
|
|
|||||||||||||
| Acquired loans: |
||||||||||||||||||||||||
| Commercial loans |
$ | — | $ | — | $ | — | $ | 4,496,644 | $ | 4,496,644 | $ | — | ||||||||||||
| Residential mortgages loans |
— | — | — | 734,669 | 734,669 | — | ||||||||||||||||||
| Consumer loans |
2,128 | 2,126 | 4,254 | 382,286 | 386,540 | 1,009 | ||||||||||||||||||
|
|
|
|
|
|
|
|
|
|
|
|
|
|||||||||||||
| Total |
$ | 2,128 | $ | 2,126 | $ | 4,254 | $ | 5,613,599 | $ | 5,617,853 | $ | 1,009 | ||||||||||||
|
|
|
|
|
|
|
|
|
|
|
|
|
|||||||||||||
| Covered loans: |
||||||||||||||||||||||||
| Commercial loans |
$ | — | $ | 18,209 | $ | 18,209 | $ | 221,333 | $ | 239,542 | $ | — | ||||||||||||
| Residential mortgages loans |
— | 637 | 637 | 285,045 | 285,682 | — | ||||||||||||||||||
| Consumer loans |
— | — | — | 146,219 | 146,219 | — | ||||||||||||||||||
|
|
|
|
|
|
|
|
|
|
|
|
|
|||||||||||||
| Total |
$ | — | $ | 18,846 | $ | 18,846 | $ | 652,597 | $ | 671,443 | $ | — | ||||||||||||
|
|
|
|
|
|
|
|
|
|
|
|
|
|||||||||||||
| Total loans: |
||||||||||||||||||||||||
| Commercial loans |
$ | 24,939 | $ | 77,076 | $ | 102,015 | $ | 7,960,143 | $ | 8,062,158 | $ | 3,821 | ||||||||||||
| Residential mortgages loans |
22,248 | 26,037 | 48,285 | 1,459,213 | 1,507,498 | 994 | ||||||||||||||||||
| Consumer loans |
6,412 | 6,037 | 12,449 | 1,594,921 | 1,607,370 | 1,065 | ||||||||||||||||||
|
|
|
|
|
|
|
|
|
|
|
|
|
|||||||||||||
| Total |
$ | 53,599 | $ | 109,150 | $ | 162,749 | $ | 11,014,277 | $ | 11,177,026 | $ | 5,880 | ||||||||||||
|
|
|
|
|
|
|
|
|
|
|
|
|
|||||||||||||
| December 31, 2010 |
30-89 days past due |
Greater than 90 days past due |
Total past due |
Current | Total Loans |
Recorded investment > 90 days and accruing |
||||||||||||||||||
| (In thousands) | ||||||||||||||||||||||||
| Originated loans: |
||||||||||||||||||||||||
| Commercial loans |
$ | 12,463 | $ | 50,679 | $ | 63,142 | $ | 2,710,292 | $ | 2,773,434 | $ | 300 | ||||||||||||
| Residential mortgages loans |
22,109 | 19,573 | 41,682 | 324,502 | 366,184 | 874 | ||||||||||||||||||
| Consumer loans |
6,499 | 6,939 | 13,438 | 994,957 | 1,008,395 | 318 | ||||||||||||||||||
|
|
|
|
|
|
|
|
|
|
|
|
|
|||||||||||||
| Total |
$ | 41,071 | $ | 77,191 | $ | 118,262 | $ | 4,029,751 | $ | 4,148,013 | $ | 1,492 | ||||||||||||
|
|
|
|
|
|
|
|
|
|
|
|
|
|||||||||||||
| Acquired loans: |
||||||||||||||||||||||||
| Commercial loans |
$ | — | $ | — | $ | — | $ | — | $ | — | $ | — | ||||||||||||
| Residential mortgages loans |
— | — | — | — | — | — | ||||||||||||||||||
| Consumer loans |
— | — | — | — | — | — | ||||||||||||||||||
|
|
|
|
|
|
|
|
|
|
|
|
|
|||||||||||||
| Total |
$ | — | $ | — | $ | — | $ | — | $ | — | $ | — | ||||||||||||
|
|
|
|
|
|
|
|
|
|
|
|
|
|||||||||||||
| Covered loans: |
||||||||||||||||||||||||
| Commercial loans |
$ | — | $ | 41,917 | $ | 41,917 | $ | 332,414 | $ | 374,331 | $ | — | ||||||||||||
| Residential mortgages loans |
— | 3,199 | 3,199 | 290,306 | 293,505 | — | ||||||||||||||||||
| Consumer loans |
— | 170 | 170 | 141,145 | 141,315 | — | ||||||||||||||||||
|
|
|
|
|
|
|
|
|
|
|
|
|
|||||||||||||
| Total |
$ | — | $ | 45,286 | $ | 45,286 | $ | 763,865 | $ | 809,151 | $ | — | ||||||||||||
|
|
|
|
|
|
|
|
|
|
|
|
|
|||||||||||||
| Total loans: |
||||||||||||||||||||||||
| Commercial loans |
$ | 12,463 | $ | 92,596 | $ | 105,059 | $ | 3,042,706 | $ | 3,147,765 | $ | 300 | ||||||||||||
| Residential mortgages loans |
22,109 | 22,772 | 44,881 | 614,808 | 659,689 | 874 | ||||||||||||||||||
| Consumer loans |
6,499 | 7,109 | 13,608 | 1,136,102 | 1,149,710 | 318 | ||||||||||||||||||
|
|
|
|
|
|
|
|
|
|
|
|
|
|||||||||||||
| Total |
$ | 41,071 | $ | 122,477 | $ | 163,548 | $ | 4,793,616 | $ | 4,957,164 | $ | 1,492 | ||||||||||||
|
|
|
|
|
|
|
|
|
|
|
|
|
|||||||||||||
90
Table of Contents
HANCOCK HOLDING COMPANY AND SUBSIDIARIES
NOTES TO CONSOLIDATED FINANCIAL STATEMENTS
Note 6. Loans (continued)
The following table presents the credit quality indicators of the Company’s various classes of loans at December 31, 2011 and 2010:
Commercial Credit Exposure
Credit Risk Profile by Internally Assigned Grade
| December 31, 2011 | December 31, 2010 | |||||||||||||||||||||||||||
| Commercial - originated |
Commercial - acquired |
Commercial - covered |
Total commercial |
Commercial - originated |
Commercial - covered |
Total commercial |
||||||||||||||||||||||
| (In thousands) | (In thousands) | |||||||||||||||||||||||||||
| Grade: |
||||||||||||||||||||||||||||
| Pass |
$ | 3,110,746 | $ | 3,882,817 | $ | 16,843 | $ | 7,010,406 | $ | 2,332,952 | $ | 45,609 | $ | 2,378,561 | ||||||||||||||
| Pass-Watch |
76,393 | 60,042 | 13,606 | 150,041 | 138,839 | 35,289 | 174,128 | |||||||||||||||||||||
| Special Mention |
35,155 | 125,852 | 9,368 | 170,375 | 26,216 | 21,031 | 47,247 | |||||||||||||||||||||
| Substandard |
103,254 | 426,003 | 124,371 | 653,628 | 265,180 | 254,033 | 519,213 | |||||||||||||||||||||
| Doubtful |
424 | 1,930 | 75,242 | 77,596 | 10,247 | 18,369 | 28,616 | |||||||||||||||||||||
| Loss |
— | — | 112 | 112 | — | — | — | |||||||||||||||||||||
|
|
|
|
|
|
|
|
|
|
|
|
|
|
|
|||||||||||||||
| Total |
$ | 3,325,972 | $ | 4,496,644 | $ | 239,542 | $ | 8,062,158 | $ | 2,773,434 | $ | 374,331 | $ | 3,147,765 | ||||||||||||||
|
|
|
|
|
|
|
|
|
|
|
|
|
|
|
|||||||||||||||
Residential Mortgage Credit Exposure
Credit Risk Profile by Internally Assigned Grade
| December 31, 2011 | December 31, 2010 | |||||||||||||||||||||||||||
| Residential mortgages - originated |
Residential mortgages - acquired |
Residential mortgages - covered |
Total residential mortgages |
Residential mortgages - originated |
Residential mortgages - covered |
Total residential mortgages |
||||||||||||||||||||||
| (In thousands) | (In thousands) | |||||||||||||||||||||||||||
| Grade: |
||||||||||||||||||||||||||||
| Pass |
$ | 460,261 | $ | 673,751 | $ | 120,180 | $ | 1,254,192 | $ | 284,712 | $ | 159,885 | $ | 444,597 | ||||||||||||||
| Pass-Watch |
7,499 | 1,773 | 18,133 | 27,405 | 7,857 | 29,673 | 37,530 | |||||||||||||||||||||
| Special Mention |
542 | 9,686 | 3,286 | 13,514 | — | 15,220 | 15,220 | |||||||||||||||||||||
| Substandard |
18,845 | 48,581 | 139,643 | 207,069 | 73,615 | 87,636 | 161,251 | |||||||||||||||||||||
| Doubtful |
— | 878 | 4,440 | 5,318 | — | 1,091 | 1,091 | |||||||||||||||||||||
| Loss |
— | — | — | — | — | — | — | |||||||||||||||||||||
|
|
|
|
|
|
|
|
|
|
|
|
|
|
|
|||||||||||||||
| Total |
$ | 487,147 | $ | 734,669 | $ | 285,682 | $ | 1,507,498 | $ | 366,184 | $ | 293,505 | $ | 659,689 | ||||||||||||||
|
|
|
|
|
|
|
|
|
|
|
|
|
|
|
|||||||||||||||
Consumer Credit Exposure
Credit Risk Profile Based on Payment Activity
| December 31, 2011 | December 31, 2010 | |||||||||||||||||||||||||||
| Consumer - originated |
Consumer - acquired |
Consumer - covered |
Total Consumer |
Consumer - originated |
Consumer - covered |
Total Consumer |
||||||||||||||||||||||
| (In thousands) | (In thousands) | |||||||||||||||||||||||||||
| Performing |
$ | 1,070,756 | $ | 385,423 | $ | 146,219 | $ | 1,602,398 | $ | 1,001,774 | $ | 141,145 | $ | 1,142,919 | ||||||||||||||
| Nonperforming |
3,855 | 1,117 | — | 4,972 | 6,621 | 170 | 6,791 | |||||||||||||||||||||
|
|
|
|
|
|
|
|
|
|
|
|
|
|
|
|||||||||||||||
| Total |
$ | 1,074,611 | $ | 386,540 | $ | 146,219 | $ | 1,607,370 | $ | 1,008,395 | $ | 141,315 | $ | 1,149,710 | ||||||||||||||
|
|
|
|
|
|
|
|
|
|
|
|
|
|
|
|||||||||||||||
All loans are reviewed periodically over the course of the year. Each Bank’s portfolio of loan relationships aggregating $500,000 or more is reviewed every 12 to 18 months by the Bank’s Loan Review staff with other loans also periodically reviewed.
Below are the definitions of the Company’s internally assigned grades:
| • | Pass—loans properly approved, documented, collateralized, and performing which do not reflect an abnormal credit risk. |
| • | Pass—Watch—Credits in this category are of sufficient risk to cause concern. This category is reserved for credits that display negative performance trends. The “Watch” grade should be regarded as a transition category. |
91
Table of Contents
HANCOCK HOLDING COMPANY AND SUBSIDIARIES
NOTES TO CONSOLIDATED FINANCIAL STATEMENTS
Note 6. Loans (continued)
| • | Special Mention—These credits exhibit some signs of “Watch”, but to a greater magnitude. These credits constitute an undue and unwarranted credit risk, but not to the point of justifying a classification of “Substandard”. They have weaknesses that, if not checked or corrected, weaken the asset or inadequately protect the bank. |
| • | Substandard—These credits constitute an unacceptable risk to the bank. They have recognized established credit weaknesses that jeopardize the repayment of the debt. Repayment sources are marginal or unclear. |
| • | Doubtful—A Doubtful credit has all of the weaknesses inherent in one classified “Substandard” with the added characteristic that weaknesses make collection in full highly questionable or improbable. |
| • | Loss—Credits classified as Loss are considered uncollectable and should be charged off promptly once so classified. |
| • | Performing—Loans on which payments of principal and interest are less than 90 days past due. |
| • | Non-performing—A non-performing loan is a loan that is in default or close to being in default and there are good reasons to doubt that payments will be made in full. All loans rated as non-accrual are also non-performing. |
The Company held $72.4 million and $21.9 million, respectively, in loans held for sale at December 31, 2011 and 2010. Of the $72.4 million at December 31, 2011, $10.8 million are problem commercial loans held for sale which are carried at estimated fair value. The remaining $61.6 million represents mortgage loans originated for sale, which are carried at the lower of cost or estimated fair value. Residential mortgage loans are originated on a best-efforts basis, whereby a commitment by a third party to purchase the loan has been received concurrent with the Banks’ commitment to the borrower to originate the loan.
Changes during 2011 and 2010 in the carrying amount of covered and non-covered acquired loans and accretable yield are presented in the following table (in thousands):
| 2011 | 2010 | |||||||||||||||||||||||||||||||
| Covered | Non-covered | Covered | Non-covered | |||||||||||||||||||||||||||||
| Carrying Amount of Loans |
Accretable Yield |
Carrying Amount of Loans |
Accretable Yield |
Carrying Amount of Loans |
Accretable Yield |
Carrying Amount of Loans |
Accretable Yield |
|||||||||||||||||||||||||
| (In thousands) | ||||||||||||||||||||||||||||||||
| Balance at beginning of period |
$ | 809,459 | $ | 107,638 | $ | — | $ | — | $ | 913,063 | $ | 159,932 | $ | — | $ | — | ||||||||||||||||
| Additions |
— | — | 535,489 | 132,136 | — | — | — | — | ||||||||||||||||||||||||
| Payments received, net |
(193,432 | ) | — | (206,306 | ) | — | (155,898 | ) | — | — | — | |||||||||||||||||||||
| Accretion |
55,416 | (55,416 | ) | 10,269 | (22,719 | ) | 52,294 | (52,294 | ) | — | — | |||||||||||||||||||||
| Decrease in expected cash flows based on actual cash flow, loan sales and foreclosures assumptions |
— | (18,930 | ) | — | (26,630 | ) | — | — | — | — | ||||||||||||||||||||||
| Net transfers from (to) nonaccretable difference to accretable yield |
— | 119,845 | — | 47,904 | — | — | — | — | ||||||||||||||||||||||||
|
|
|
|
|
|
|
|
|
|
|
|
|
|
|
|
|
|||||||||||||||||
| Balance at end of period |
$ | 671,443 | $ | 153,137 | $ | 339,452 | $ | 130,691 | $ | 809,459 | $ | 107,638 | $ | — | $ | — | ||||||||||||||||
|
|
|
|
|
|
|
|
|
|
|
|
|
|
|
|
|
|||||||||||||||||
92
Table of Contents
HANCOCK HOLDING COMPANY AND SUBSIDIARIES
NOTES TO CONSOLIDATED FINANCIAL STATEMENTS
Note 7. Property and Equipment
Property and equipment stated at cost, less accumulated depreciation and amortization, consisted of the following (in thousands):
| December 31, | ||||||||
| 2011 | 2010 | |||||||
| Land and land improvements |
$ | 130,358 | $ | 39,837 | ||||
| Buildings and leasehold improvements |
372,232 | 185,878 | ||||||
| Furniture, fixtures and equipment |
92,097 | 71,179 | ||||||
| Software |
34,184 | 28,283 | ||||||
| Assets under development |
25,296 | 10,125 | ||||||
|
|
|
|
|
|||||
| 654,167 | 335,302 | |||||||
| Accumulated depreciation and amortization |
(148,780 | ) | (125,383 | ) | ||||
|
|
|
|
|
|||||
| Property and equipment, net |
$ | 505,387 | $ | 209,919 | ||||
|
|
|
|
|
|||||
Depreciation and amortization expense was $24.6 million, $13.5 million and $15.5 million for the years ended December 31, 2011, 2010 and 2009, respectively.
Note 8. Goodwill and Other Intangible Assets
Goodwill represents the excess of the consideration exchanged over the fair value of the net assets acquired in purchase business combinations. The Company tests goodwill for impairment annually and no impairment charges were identified in the most recent test as of September 30, 2011. No goodwill impairment charges were recognized during 2011, 2010, or 2009. The carrying amount of goodwill was $651.2 million and $61.6 million at December 31, 2011 and 2010, respectively. As discussed in Note 2 to the consolidated financial statements, the Company recorded approximately $589 million of goodwill during 2011 in connection with its acquisition of Whitney.
Identifiable intangible assets with finite lives are amortized over the periods benefited and are evaluated for impairment similar to other long-lived assets. The identifiable assets recorded in connection with the Whitney acquisition during 2011 are detailed in Note 2 to the consolidated financial statements.
93
Table of Contents
HANCOCK HOLDING COMPANY AND SUBSIDIARIES
NOTES TO CONSOLIDATED FINANCIAL STATEMENTS
Note 8. Goodwill and Other Intangible Assets (continued)
The carrying value of intangible assets subject to amortization was as follows (in thousands):
| December 31, 2011 | ||||||||||||
| Gross Carrying Amount |
Accumulated Amortization |
Net Carrying Amount |
||||||||||
| Core deposit intangibles |
$ | 206,047 | $ | 27,691 | $ | 178,356 | ||||||
| Credit card and trust relationships |
22,400 | 1,908 | 20,492 | |||||||||
| Value of insurance business acquired |
2,431 | 1,926 | 505 | |||||||||
| Non-compete agreements |
322 | 322 | — | |||||||||
| Trade name |
11,822 | 100 | 11,722 | |||||||||
|
|
|
|
|
|
|
|||||||
| $ | 243,022 | $ | 31,947 | $ | 211,075 | |||||||
|
|
|
|
|
|
|
|||||||
| December 31, 2010 | ||||||||||||
| Gross Carrying Amount |
Accumulated Amortization |
Net Carrying Amount |
||||||||||
| Core deposit intangibles |
$ | 25,747 | $ | 13,218 | $ | 12,529 | ||||||
| Value of insurance business acquired |
2,431 | 1,757 | 674 | |||||||||
| Non-compete agreements |
322 | 322 | — | |||||||||
| Trade name |
100 | 100 | — | |||||||||
|
|
|
|
|
|
|
|||||||
| $ | 28,600 | $ | 15,397 | $ | 13,203 | |||||||
|
|
|
|
|
|
|
|||||||
| Years Ended December 31, | ||||||||||||
| 2011 | 2010 | 2009 | ||||||||||
| Aggregate amortization expense for: |
||||||||||||
| Core deposit intangibles |
$ | 14,474 | $ | 2,491 | $ | 1,114 | ||||||
| Credit card and trust relationships |
1,908 | — | — | |||||||||
| Value of insurance business acquired |
169 | 213 | 255 | |||||||||
| Non-compete agreements |
— | 14 | 28 | |||||||||
| Trade name |
— | 10 | 20 | |||||||||
|
|
|
|
|
|
|
|||||||
| $ | 16,551 | $ | 2,728 | $ | 1,417 | |||||||
|
|
|
|
|
|
|
|||||||
The weighted-average remaining life of core deposit intangibles is 19 years. The weighted-average remaining life of other identifiable intangibles is 9 years.
The following table shows estimated amortization expense of other intangible assets for the five succeeding years and thereafter, calculated based on current amortization schedules (in thousands):
| 2012 |
$ | 31,561 | ||
| 2013 |
29,565 | |||
| 2014 |
24,969 | |||
| 2015 |
20,579 | |||
| 2016 |
18,834 | |||
| Thereafter |
85,567 | |||
|
|
|
|||
| $ | 211,075 | |||
|
|
|
94
Table of Contents
HANCOCK HOLDING COMPANY AND SUBSIDIARIES
NOTES TO CONSOLIDATED FINANCIAL STATEMENTS
Note 9. Deposits
The maturities of interest bearing deposits at December 31, 2011 follow (in thousands):
| 2012 |
$ | 2,395,425 | ||
| 2013 |
327,779 | |||
| 2014 |
85,203 | |||
| 2015 |
154,998 | |||
| 2016 |
65,220 | |||
| Thereafter |
47,622 | |||
|
|
|
|||
| Total time deposits |
3,076,247 | |||
| Interest-bearing deposits with no stated maturity |
7,120,996 | |||
|
|
|
|||
| Total interest-bearing deposits |
$ | 10,197,243 | ||
|
|
|
Time deposits of $100,000 or more totaled approximately $1.6 billion and $1.3 billion at December 31, 2011 and 2010, respectively.
Note 10. Borrowings
Short-Term Borrowings
The following table presents information concerning short-term borrowings (in thousands):
| December 31, | ||||||||
| 2011 | 2010 | |||||||
| Federal funds purchased |
||||||||
| Amount outstanding at period-end |
$ | 16,819 | $ | — | ||||
| Weighted average interest rate at period-end |
0.19% | — | ||||||
| Weighted average interest rate during the year |
0.18% | 0.13% | ||||||
| Average daily balance during the year |
$ | 12,911 | $ | 2,734 | ||||
| Maximum month end balance during the year |
$ | 26,666 | $ | 6,900 | ||||
| Securities sold under agreements to repurchase |
||||||||
| Amount outstanding at period-end |
$ | 1,027,635 | $ | 364,676 | ||||
| Weighted average interest rate at period-end |
0.65% | 1.69% | ||||||
| Weighted average interest rate during the year |
1.03% | 1.95% | ||||||
| Average daily balance during the year |
$ | 681,474 | $ | 477,174 | ||||
| Maximum month end balance during the year |
$ | 1,027,635 | $ | 534,627 | ||||
| FHLB borrowings: |
||||||||
| Amount outstanding at period-end |
$ | — | $ | 10,172 | ||||
| Weighted average interest rate at period-end |
— | 1.19% | ||||||
| Weighted average interest rate during the year |
0.15% | 0.57% | ||||||
| Average daily balance during the year |
$ | 81,673 | $ | 22,846 | ||||
| Maximum month end balance during the year |
$ | 10,153 | $ | 30,676 | ||||
95
Table of Contents
HANCOCK HOLDING COMPANY AND SUBSIDIARIES
NOTES TO CONSOLIDATED FINANCIAL STATEMENTS
Note 10. Borrowings (continued)
The Banks borrow funds on a secured basis by selling securities under agreements to repurchase, mainly in connection with treasury-management services offered to their deposit customers. Customer repurchase agreements generally mature daily. Borrowings under repurchase agreements also include certain term agreements with dealers with various maturities, all of which are callable by the dealer. The Banks have the ability to exercise legal authority over the underlying securities. Federal funds purchased represent unsecured borrowings from other banks, generally on an overnight basis.
Long-Term Borrowings
The Company has a line of credit with the Federal Home Loan Bank (FHLB) of $2.7 billion which is secured by a blanket pledge of certain mortgage loans. At December 31, 2011, the borrowing capacity under the FHLB line of credit was approximately $2.5 billion.
Note 11. Stockholders’ Equity
Common Stock Offering
In April 2011, Hancock completed an underwritten public offering of the Company’s common stock. The underwriters purchased 6,958,143 shares at a public offering price of $32.25 per share. The net proceeds to the Company after deducting offering expenses and underwriting discounts totaled $214 million. The proceeds of the offering were used for general corporate purposes, including the enhancement of the Company’s capital position and the purchase of Whitney Holding Corporation’s TARP preferred stock and warrant in connection with the Whitney acquisition. The number and value of Company common shares exchanged in the Whitney transaction are discussed in Note 2.
Regulatory Capital
Measures of regulatory capital are an important tool used by regulators to monitor the financial health of financial institutions. The primary quantitative measures used to gauge capital adequacy are the ratios of total and Tier 1 regulatory capital to risk-weighted assets (risk-based capital ratios) and the ratio of Tier 1 capital to average total assets (leverage ratio). Both the Company and its bank subsidiaries are required to maintain minimum risk-based capital ratios of 8.0% total regulatory capital and, 4.0% Tier 1 capital. The minimum leverage ratio is 3.0% for bank holding companies and banks that meet certain specified criteria, including having the highest supervisory rating. All others are required to maintain a leverage ratio of at least 4.0%.
To evaluate capital adequacy, regulators compare an institution’s regulatory capital ratios with their agency guidelines, as well as with the guidelines established as part of the uniform regulatory framework for prompt corrective supervisory action toward financial institutions. The framework for prompt corrective action categorizes capital levels into one of five classifications rating from well-capitalized to critically under-capitalized. For an institution to be eligible to be classified as well capitalized its total risk-based capital ratios must be at least 10.0% for total capital and 6.0% for Tier 1 capital, and its leverage ratio must be at least 5.0%. In reaching an overall conclusion on capital adequacy or assigning a classification under the uniform framework, regulators must also consider other subjective and quantitative measures of risk associated with an institution. All of the subsidiary banks were deemed to be well capitalized based upon the most recent notifications from their regulators. There are no conditions or events since those notifications that management believes would change these classifications. At December 31, 2011 and 2010, the Company and the Banks were in compliance with all of their respective minimum regulatory capital requirements.
96
Table of Contents
HANCOCK HOLDING COMPANY AND SUBSIDIARIES
NOTES TO CONSOLIDATED FINANCIAL STATEMENTS
Note 11. Stockholders’ Equity (continued)
Following is a summary of the actual regulatory capital amounts and ratios for the Company and the Banks together with corresponding regulatory capital requirements at December 31, 2011 and 2010 (amounts in thousands):
| Actual | Required for Minimum Capital Adequacy |
To Be Well Capitalized Under Prompt Corrective Action Provisions |
||||||||||||||||||||||
| Amount | Ratio % | Amount | Ratio % | Amount | Ratio % | |||||||||||||||||||
| At December 31, 2011 |
||||||||||||||||||||||||
| Total capital (to risk weighted assets) |
||||||||||||||||||||||||
| Company |
$ | 1,783,037 | 13.59 | $ | 1,049,495 | 8.00 | $ | N/A | N/A | |||||||||||||||
| Hancock Bank |
437,225 | 14.21 | 246,072 | 8.00 | 307,590 | 10.00 | ||||||||||||||||||
| Whitney Bank |
1,277,591 | 12.76 | 801,025 | 8.00 | 1,001,281 | 10.00 | ||||||||||||||||||
| Tier 1 capital (to risk weighted assets) |
||||||||||||||||||||||||
| Company |
$ | 1,506,218 | 11.48 | $ | 524,748 | 4.00 | $ | N/A | N/A | |||||||||||||||
| Hancock Bank |
397,900 | 12.94 | 123,036 | 4.00 | 184,554 | 6.00 | ||||||||||||||||||
| Whitney Bank |
1,091,770 | 10.90 | 400,512 | 4.00 | 600,769 | 6.00 | ||||||||||||||||||
| Tier 1 leverage capital |
||||||||||||||||||||||||
| Company |
$ | 1,506,218 | 8.17 | $ | 553,318 | 3.00 | $ | N/A | N/A | |||||||||||||||
| Hancock Bank |
397,900 | 8.15 | 146,408 | 3.00 | 244,013 | 5.00 | ||||||||||||||||||
| Whitney Bank |
1,091,770 | 8.19 | 399,725 | 3.00 | 666,208 | 5.00 | ||||||||||||||||||
| At December 31, 2010 |
||||||||||||||||||||||||
| Total capital (to risk weighted assets) |
||||||||||||||||||||||||
| Company |
$ | 846,541 | 16.60 | $ | 407,970 | 8.00 | $ | N/A | N/A | |||||||||||||||
| Hancock Bank |
446,894 | 16.46 | 217,206 | 8.00 | 271,507 | 10.00 | ||||||||||||||||||
| Hancock Bank of Louisiana |
344,447 | 15.72 | 175,339 | 8.00 | 219,174 | 10.00 | ||||||||||||||||||
| Hancock Bank of Alabama |
33,543 | 17.39 | 15,432 | 8.00 | 19,290 | 10.00 | ||||||||||||||||||
| Tier 1 capital (to risk weighted assets) |
||||||||||||||||||||||||
| Company |
$ | 782,301 | 15.34 | $ | 203,985 | 4.00 | $ | N/A | N/A | |||||||||||||||
| Hancock Bank |
412,632 | 15.20 | 108,603 | 4.00 | 162,904 | 6.00 | ||||||||||||||||||
| Hancock Bank of Louisiana |
316,905 | 14.46 | 87,670 | 4.00 | 131,504 | 6.00 | ||||||||||||||||||
| Hancock Bank of Alabama |
31,102 | 16.12 | 7,716 | 4.00 | 11,574 | 6.00 | ||||||||||||||||||
| Tier 1 leverage capital |
||||||||||||||||||||||||
| Company |
$ | 782,301 | 9.65 | $ | 243,160 | 3.00 | $ | N/A | N/A | |||||||||||||||
| Hancock Bank |
412,632 | 8.03 | 154,198 | 3.00 | 256,996 | 5.00 | ||||||||||||||||||
| Hancock Bank of Louisiana |
316,905 | 11.33 | 83,878 | 3.00 | 139,797 | 5.00 | ||||||||||||||||||
| Hancock Bank of Alabama |
31,102 | 16.38 | 5,698 | 3.00 | 9,496 | 5.00 | ||||||||||||||||||
97
Table of Contents
HANCOCK HOLDING COMPANY AND SUBSIDIARIES
NOTES TO CONSOLIDATED FINANCIAL STATEMENTS
Note 11. Stockholders’ Equity (continued)
Regulatory Restrictions on Dividends
Regulatory policy statements provide that generally bank holding companies should pay dividends only out of current operating earnings and that the level of dividends must be consistent with current and expected capital requirements. Dividends received from its subsidiary banks have been the primary source of funds available to the Company for the payment of dividends to Hancock’s stockholders. Federal and state banking laws and regulations restrict the amount of dividends the subsidiary banks may distribute to Hancock without prior regulatory approval, as well as the amount of loans they may make to the Company. Dividends paid by Hancock Bank are subject to approval by the Commissioner of Banking and Consumer Finance of the State of Mississippi and those paid by Whitney Bank are subject to approval by the Commissioner of Financial Institutions of the State of Louisiana. At December 31, 2011, the Banks had the capacity to declare and pay approximately $11.1 million in dividends to the Company without prior regulatory approval.
Note 12. Retirement and Employee Benefit Plans
Pension Plans—Defined Benefit
The Company has a noncontributory defined benefit pension plan covering legacy Hancock employees who have been employed by the Company one year and who have worked a minimum of 1,000 hours during the calendar year. The benefits are based upon years of service and the employee’s base or benefit base compensation.
Certain legacy Whitney employees are covered by a noncontributory qualified defined benefit pension plan. The benefits are based on an employee’s total years of service and his or her highest consecutive five-year level of compensation during the final ten years of employment. Certain legacy Whitney employees are also covered by an unfunded nonqualified defined benefit pension plan that provides retirement benefits to designated executive officers. These benefits are calculated using the qualified plan’s formula, but without applying the restrictions imposed on qualified plans by certain provisions of the Internal Revenue Code. Benefits that become payable under the nonqualified plan supplement amounts paid from the qualified plan. The Whitney plans have been closed to new participants since 2008, and benefit accruals have been frozen for all participants other than those who met certain vesting, age and years of service criteria as of December 31, 2008.
The Company makes contributions to the qualified pension plans in amounts sufficient to meet funding requirements set forth in federal employee benefit and tax laws, plus such additional amounts as the Company may determine to be appropriate. Based on currently available information, the Company anticipates making contributions totaling approximately $22.2 million during 2012.
The Company is in the process of reviewing all retirement benefit plans to determine appropriate changes needed to transition legacy Whitney employees into the Company’s benefit plans.
The following tables detail the changes in the benefit obligations and plan assets of each plan for the years ended December 31, 2011 and 2010 as well as the funded status of the plans at each year end and the amounts recognized in the Company’s balance sheets (in thousands). The Company uses a December 31 measurement date for all defined benefit pension plans and other postretirement benefit plans.
98
Table of Contents
HANCOCK HOLDING COMPANY AND SUBSIDIARIES
NOTES TO CONSOLIDATED FINANCIAL STATEMENTS
Note 12. Retirement and Employee Benefit Plans (continued)
Hancock Plan
| 2011 | 2010 | |||||||
| Change in benefit obligation |
||||||||
| Benefit obligation, beginning of year |
$ | 101,746 | $ | 89,720 | ||||
| Service cost |
4,689 | 3,501 | ||||||
| Interest cost |
5,453 | 5,233 | ||||||
| Actuarial loss |
27,429 | 7,155 | ||||||
| Benefits paid |
(4,202 | ) | (3,863 | ) | ||||
|
|
|
|
|
|||||
| Benefit obligation, end of year |
135,115 | 101,746 | ||||||
|
|
|
|
|
|||||
| Change in plan assets |
||||||||
| Fair value of plan assets, beginning of year |
71,640 | 61,313 | ||||||
| Actual return on plan assets |
1,375 | 7,718 | ||||||
| Employer contributions |
34,907 | 6,726 | ||||||
| Benefit payments |
(4,202 | ) | (3,863 | ) | ||||
| Expenses |
(245 | ) | (254 | ) | ||||
|
|
|
|
|
|||||
| Fair value of plan assets, end of year |
103,475 | 71,640 | ||||||
|
|
|
|
|
|||||
| Funded status at end of year—net liability |
$ | (31,640 | ) | $ | (30,106 | ) | ||
|
|
|
|
|
|||||
| Amounts recognized in accumulated other comprehensive loss |
||||||||
| Unrecognized loss at beginning of year |
$ | 38,810 | $ | 36,753 | ||||
| Amount of (loss)/gain recognized during the year |
(2,343 | ) | (2,281 | ) | ||||
| Net actuarial loss/(gain) |
31,789 | 4,338 | ||||||
|
|
|
|
|
|||||
| Unrecognized loss at end of year |
$ | 68,256 | $ | 38,810 | ||||
|
|
|
|
|
|||||
99
Table of Contents
HANCOCK HOLDING COMPANY AND SUBSIDIARIES
NOTES TO CONSOLIDATED FINANCIAL STATEMENTS
Note 12. Retirement and Employee Benefit Plans (continued)
Whitney Plan
| December 31, 2011 | ||||||||
| Qualified | Nonqualified | |||||||
| Change in benefit obligation |
||||||||
| Benefit obligation at acquisition date |
$ | 216,992 | $ | 14,442 | ||||
| Service cost |
3,751 | 27 | ||||||
| Interest cost |
6,664 | 438 | ||||||
| Actuarial loss |
40,542 | 1,597 | ||||||
| Benefits paid |
(3,556 | ) | (570 | ) | ||||
|
|
|
|
|
|||||
| Benefit obligation, end of year |
264,393 | 15,934 | ||||||
|
|
|
|
|
|||||
| Change in plan assets |
||||||||
| Fair value of plan assets at acquisition date |
223,495 | — | ||||||
| Actual return on plan assets |
(5,354 | ) | — | |||||
| Employer contributions |
10,000 | 570 | ||||||
| Benefit payments |
(3,556 | ) | (570 | ) | ||||
| Expenses |
— | — | ||||||
|
|
|
|
|
|||||
| Fair value of plan assets, end of year |
224,585 | — | ||||||
|
|
|
|
|
|||||
| Funded status at end of year—net liability |
$ | (39,808 | ) | $ | (15,934 | ) | ||
|
|
|
|
|
|||||
| Amounts recognized in accumulated other comprehensive loss |
||||||||
| Unrecognized loss at acquistion date |
$ | — | $ | — | ||||
| Amount of (loss)/gain recognized during the year |
— | — | ||||||
| Net actuarial loss/(gain) |
55,524 | 1,597 | ||||||
|
|
|
|
|
|||||
| Unrecognized loss at end of year |
$ | 55,524 | $ | 1,597 | ||||
|
|
|
|
|
|||||
The accumulated benefit obligation was $109.1 million and $83.6 million, respectively, for the Hancock plan at December 31, 2011 and 2010. The accumulated benefit obligations at December 31, 2011 for the Whitney plans were $239.1 million for qualified plan and $15.7 million for the nonqualified plan.
The following tables show net periodic cost included in expense and the changes in the amounts recognized in accumulated other comprehensive income during 2011 and 2010. Hancock expects to recognize $4.6 million of the net actuarial loss included in accumulated other comprehensive income at December 31, 2011 as a component of net pension expense in 2012. The amount expected to be recognized from the Whitney plans totals $3.0 million.
100
Table of Contents
HANCOCK HOLDING COMPANY AND SUBSIDIARIES
NOTES TO CONSOLIDATED FINANCIAL STATEMENTS
Note 12. Retirement and Employee Benefit Plans (continued)
The components of net periodic cost included in expense for each plan follows (in thousands):
Hancock Plan
| Years Ended December 31, | ||||||||||||
| 2011 | 2010 | 2009 | ||||||||||
| Net periodic benefit cost |
||||||||||||
| Service cost |
$ | 4,689 | $ | 3,500 | $ | 3,107 | ||||||
| Interest cost |
5,453 | 5,233 | 4,833 | |||||||||
| Expected return on plan assets |
(5,490 | ) | (4,646 | ) | (3,873 | ) | ||||||
| Recognized net amortization and deferral |
2,343 | 2,281 | 2,648 | |||||||||
|
|
|
|
|
|
|
|||||||
| Net periodic benefit cost |
6,995 | 6,368 | 6,715 | |||||||||
|
|
|
|
|
|
|
|||||||
| Other changes in plan assets and benefit obligations recognized in other comprehensive income, before taxes |
||||||||||||
| Net (loss)/gain recognized during the year |
(2,343 | ) | (2,281 | ) | (2,648 | ) | ||||||
| Net actuarial loss/(gain) |
31,789 | 4,338 | (1,089 | ) | ||||||||
|
|
|
|
|
|
|
|||||||
| Total recognized in other comprehensive income |
29,446 | 2,057 | (3,737 | ) | ||||||||
|
|
|
|
|
|
|
|||||||
| Total recognized in net periodic benefit cost and other comprehensive income |
$ | 36,441 | $ | 8,425 | $ | 2,978 | ||||||
|
|
|
|
|
|
|
|||||||
| Weighted average assumptions as of measurement date |
||||||||||||
| Discount rate for benefit obligations |
4.35 | % | 5.46 | % | 5.95 | % | ||||||
| Discount rate for net periodic benefit cost |
5.46 | % | 5.95 | % | 5.96 | % | ||||||
| Expected long-term return on plan assets |
7.50 | % | 7.50 | % | 7.50 | % | ||||||
| Rate of compensation increase |
4.00 | % | 4.00 | % | 4.00 | % | ||||||
Whitney Plan
| Year Ended | ||||||||
| December 31, 2011 | ||||||||
| Qualified | Nonqualified | |||||||
| Net periodic benefit cost |
||||||||
| Service cost |
$ | 3,751 | $ | 27 | ||||
| Interest cost |
6,664 | 438 | ||||||
| Expected return on plan assets |
(9,628 | ) | — | |||||
| Recognized net amortization and deferral |
— | — | ||||||
|
|
|
|
|
|||||
| Net periodic benefit cost |
787 | 465 | ||||||
|
|
|
|
|
|||||
| Other changes in plan assets and benefit obligations recognized in other comprehensive income, before taxes |
||||||||
| Net (loss)/gain recognized during the year |
— | — | ||||||
| Net actuarial loss/(gain) |
55,524 | 1,597 | ||||||
|
|
|
|
|
|||||
| Total recognized in other comprehensive income |
55,524 | 1,597 | ||||||
|
|
|
|
|
|||||
| Total recognized in net periodic benefit cost and other comprehensive income |
$ | 56,311 | $ | 2,062 | ||||
|
|
|
|
|
|||||
| Weighted average assumptions as of measurement date |
||||||||
| Discount rate for benefit obligations |
4.31 | % | 4.31 | % | ||||
| Discount rate for net periodic benefit cost |
5.35 | % | 5.35 | % | ||||
| Expected long-term return on plan assets |
7.50 | % | — | |||||
| Rate of compensation increase |
3.58 | % | 3.58 | % | ||||
101
Table of Contents
HANCOCK HOLDING COMPANY AND SUBSIDIARIES
NOTES TO CONSOLIDATED FINANCIAL STATEMENTS
Note 12. Retirement and Employee Benefit Plans (continued)
The long term rate of return on plan assets is determined by using the weighted-average of historical real returns for major asset classes based on target asset allocations. At December 31, 2011, the discount rate was calculated by matching expected future cash flows to the Citigroup Pension Discount Curve Liability Index.
The following shows expected pension plan benefit payments over the next ten years (in thousands):
| Hancock | Whitney | |||||||||||||||
| Qualified | Qualified | Nonqualified | Total | |||||||||||||
| 2012 |
$ | 4,273 | $ | 6,993 | $ | 888 | $ | 12,154 | ||||||||
| 2013 |
4,394 | 7,410 | 883 | 12,687 | ||||||||||||
| 2014 |
4,640 | 8,020 | 1,041 | 13,701 | ||||||||||||
| 2015 |
4,971 | 8,735 | 1,134 | 14,840 | ||||||||||||
| 2016 |
5,342 | 9,432 | 1,138 | 15,912 | ||||||||||||
| 2017-2021 |
33,222 | 57,629 | 5,792 | 96,643 | ||||||||||||
|
|
|
|
|
|
|
|
|
|||||||||
| $ | 56,842 | $ | 98,219 | $ | 10,876 | $ | 165,937 | |||||||||
|
|
|
|
|
|
|
|
|
|||||||||
The expected benefit payments are estimated based on the same assumptions used to measure the Company’s benefit obligations at December 31, 2011.
The Hancock plan assets are held in the Company’s family of mutual funds. The fair values of the Hancock pension plan assets at December 31, 2011 and 2010, by asset category, are shown in the following tables (in thousands):
| Fair Value Measurements at December 31, 2011 | ||||||||||||||||
| Asset Category |
Total | Quoted Prices in Active Markets for Identical Assets (Level 1) |
Significant Observable Inputs (Level 2) |
Significant Unobservable Inputs (Level 3) |
||||||||||||
| Hancock Horizon Government Money Market Fund |
$ | 28,081 | $ | 28,081 | $ | — | $ | — | ||||||||
| Hancock Horizon Strategic Income Bond Fund |
29,895 | 29,895 | — | — | ||||||||||||
| Hancock Horizon Quantitative Long/Short Fund |
3,674 | 3,674 | — | — | ||||||||||||
| Hancock Horizon Diversified International Fund |
6,266 | 6,266 | — | — | ||||||||||||
| Hancock Horizon Burkenroad Fund |
2,414 | 2,414 | — | — | ||||||||||||
| Hancock Horizon Growth Fund |
13,403 | 13,403 | — | — | ||||||||||||
| Hancock Horizon Value Fund |
19,742 | 19,742 | — | — | ||||||||||||
|
|
|
|
|
|
|
|
|
|||||||||
| TOTAL |
$ | 103,475 | $ | 103,475 | $ | — | $ | — | ||||||||
|
|
|
|
|
|
|
|
|
|||||||||
102
Table of Contents
HANCOCK HOLDING COMPANY AND SUBSIDIARIES
NOTES TO CONSOLIDATED FINANCIAL STATEMENTS
Note 12. Retirement and Employee Benefit Plans (continued)
| Fair Value Measurements at December 31, 2010 | ||||||||||||||||
| Asset Category |
Total | Quoted Prices in Active Markets for Identical Assets (Level 1) |
Significant Observable Inputs (Level 2) |
Significant Unobservable Inputs (Level 3) |
||||||||||||
| Hancock Horizon Government Money Market Fund |
$ | 2,573 | $ | 2,573 | $ | — | $ | — | ||||||||
| Hancock Horizon Strategic Income Bond Fund |
25,974 | 25,974 | — | — | ||||||||||||
| Hancock Horizon Quantitative Long/Short Fund |
3,525 | 3,525 | — | — | ||||||||||||
| Hancock Horizon Diversified International Fund |
6,277 | 6,277 | — | — | ||||||||||||
| Hancock Horizon Burkenroad Fund |
2,264 | 2,264 | — | — | ||||||||||||
| Hancock Horizon Growth Fund |
12,392 | 12,392 | — | — | ||||||||||||
| Hancock Horizon Value Fund |
18,635 | 18,635 | — | — | ||||||||||||
|
|
|
|
|
|
|
|
|
|||||||||
| TOTAL |
$ | 71,640 | $ | 71,640 | $ | — | $ | — | ||||||||
|
|
|
|
|
|
|
|
|
|||||||||
The Hancock plan’s percentage asset allocations by asset category and corresponding target allocations at December 31, 2011 and 2010 follow:
| Plan Assets at December 31, |
Target Allocation at December 31, |
|||||||||||||||
| Asset category | 2011 | 2010 | 2011 | 2010 | ||||||||||||
| Equity securities |
44 | % | 60 | % | 40-70 | % | 40-70 | % | ||||||||
| Fixed income securities |
29 | % | 36 | % | 30-60 | % | 30-60 | % | ||||||||
| Cash equivalents |
27 | % | 4 | % | 0-10 | % | 0-10 | % | ||||||||
|
|
|
|
|
|||||||||||||
| 100 | % | 100 | % | |||||||||||||
|
|
|
|
|
|||||||||||||
A $25 million contribution to the plan late in 2011 was initially invested in cash equivalents. After these funds were reinvested, the distribution of plan assets was within target allocations.
The investment strategy of the Hancock pension plan is to emphasize a balanced return of current income and growth of principal while accepting a moderate level of risk. The investment goal of the plan is to meet or exceed the return of a balanced market index comprised of 55% of the S&P 500 Index and 45% of the Barclays Intermediate Aggregate Bond Index. The pension plan investment committee meets periodically to review the policy, strategy and performance of the plan.
The fair value of the Whitney pension plan assets at December 31, 2011, are shown in the following table (in thousands):
| Fair Value Measurements at December 31, 2011 | ||||||||||||||||
| Asset Category |
Total | Quoted Prices in Active Markets for Identical Assets (Level 1) |
Significant Observable Inputs (Level 2) |
Significant Unobservable Inputs (Level 3) |
||||||||||||
| Equity securities—large cap |
$ | 72,607 | $ | 72,607 | $ | — | $ | — | ||||||||
| Equity securities—small cap |
44,191 | 44,191 | — | — | ||||||||||||
| Hancock Horizon Diversified International |
18,262 | 18,262 | — | — | ||||||||||||
| Corporate debt |
33,319 | 33,319 | — | |||||||||||||
| U.S. government and agency secutities and other |
44,017 | 15,032 | 28,985 | — | ||||||||||||
| Cash and equivalents |
12,189 | 12,189 | — | — | ||||||||||||
|
|
|
|
|
|
|
|
|
|||||||||
| TOTAL |
$ | 224,585 | $ | 162,281 | $ | 62,304 | $ | — | ||||||||
|
|
|
|
|
|
|
|
|
|||||||||
103
Table of Contents
HANCOCK HOLDING COMPANY AND SUBSIDIARIES
NOTES TO CONSOLIDATED FINANCIAL STATEMENTS
Note 12. Retirement and Employee Benefit Plans (continued)
The Whitney plan’s percentage asset allocations by asset category and corresponding target allocations at December 31, 2011 follow:
| At December 31, 2011 | ||||||||
| Plan | Target | |||||||
| Assets | Allocation | |||||||
| Asset category |
||||||||
| Equity securities |
60 | % | 40-70 | % | ||||
| Fixed income securities |
35 | % | 30-50 | % | ||||
| Cash equivalents |
5 | % | 0-10 | % | ||||
|
|
|
|
|
|||||
| 100 | % | |||||||
|
|
|
|
|
|||||
The assumption regarding the expected long-term return on Whitney plan assets with reference to the plan’s investment policy and practices, including the tolerance for market and credit risk, and historical returns for benchmark indices specified in the policy. The policy communicates risk tolerance in terms of diversification criteria and constraints on investment quality. The plan may not hold debt securities of any single issuer, except the U.S. Treasury and U.S. government agencies, in excess of 10% of plan assets. The policy also calls for diversification of equity holdings across business segments and states a preference for holdings in companies that demonstrate consistent growth in earnings and dividends. No company’s equity securities shall comprise more than 5% of the plan’s total market value. Limited use of derivatives is authorized by the policy, but the investment manager has not employed these instruments.
As of December 31, 2011, the Whitney plan assets included 16,375 shares of Hancock common stock with a value of $.5 million (.23%) of plan assets.
Pension Plans – Defined Contribution
The Company sponsors defined contribution retirement plans under Section 401(k) of the Internal Revenue Code. The Hancock plan covers substantially all legacy Hancock employees who have been employed 90 days and meet certain other requirements, but excluding on call, temporary, and seasonal employees. Under these plans, the Company will match the 50% of the savings of each participant up to 6% of his or her compensation.
Eligible legacy Whitney employees who are employed by the new Whitney Bank after the merger continue to be covered by an employee savings plan under Section 401(k). An employee of the new Whitney Bank who was not a participant at the merger date can become eligible to participate in the savings plan after meeting the eligibility conditions, provided the employee performed services at a legacy Whitney location as of the merger date. Under the savings plan, the Company will match the savings of each participant up to 4% of his or her compensation. Tax law imposes limits on total annual participant savings. Participants are fully vested in their savings and in the matching Company contribution at all times. Under the savings plan, the Company can also make discretionary profit sharing contributions on behalf of participants who are either (a) ineligible to participate in the Whitney qualified defined-benefit plan or (b) subject to the freeze in benefit accruals under the defined-benefit plan. The discretionary profit sharing contribution for a plan year is up to 4% of the participants’ eligible compensation for such year and is allocated only to participants who were employed on the first day of the plan year and at year end. Participants must complete three years of service to become vested in the Company’s contributions subject to earlier vesting in the case of retirement, death or disability. The Whitney board amended the plan shortly prior to the merger to provide that Whitney employees terminated as a result of a force reduction after the closing date of the merger would also be immediately vested.
104
Table of Contents
HANCOCK HOLDING COMPANY AND SUBSIDIARIES
NOTES TO CONSOLIDATED FINANCIAL STATEMENTS
Note 12. Retirement and Employee Benefit Plans (continued)
The expense of the Company’s matching contributions to both the Hancock and legacy Whitney 401(k) plans was $4.5 million in 2011, $2.0 million in 2010 and $1.8 million in 2009. The discretionary profit-sharing contribution under the legacy Whitney plan was $1.3 million in 2011.
Health and Welfare Plans – Defined Benefit
The Company also sponsors defined benefit postretirement plans for both legacy Hancock and legacy Whitney employees. The Hancock plans provide health care and life insurance benefits to retiring employees who participate in medical and/or group life insurance benefit plans for active employees at the time of retirement and have reached 55 years of age with ten years of service or age 65 with five years of service. The postretirement health care plan is contributory, with retiree contributions adjusted annually and subject to certain employer contribution maximums. Neither Hancock plan is available to employees hired on or after January 1, 2000.
The legacy Whitney plans offer health care and life insurance benefit plans for retirees and their eligible dependents. Participant contributions are required under the health plan. All health care benefits are covered under contracts with health maintenance or preferred provider organizations or insurance contracts. The Company funds its obligations under these plans as contractual payments come due to health care organizations and insurance companies. Currently, these plans restrict eligibility for postretirement health benefits to retirees already receiving benefits as of the plan amendments in 2007 and to those active participants who were eligible to receive benefits as of December 31, 2007. Life insurance benefits are currently only available to employees who retired before December 31, 2007.
The following tables detail the changes in the benefit obligation of the Hancock and Whitney plans for the years ended December 31, 2011 and 2010, as well as the funded status of the plans at each year end and the amounts recognized in the Company’s consolidated balance sheets (in thousands). The Company uses a December 31 measurement date for all defined benefit retirement plans. The Company used a 4.25% discount rate for the determination of the projected postretirement benefit obligation as of December 31, 2011 and a 4.10% discount rate for the Whitney plans. A discount rate of 5.30% was used to determine the Hancock plan benefit obligation as of December 31, 2010.
105
Table of Contents
HANCOCK HOLDING COMPANY AND SUBSIDIARIES
NOTES TO CONSOLIDATED FINANCIAL STATEMENTS
Note 12. Retirement and Employee Benefit Plans (continued)
Hancock Plan
| Years Ended December 31, | ||||||||
| 2011 | 2010 | |||||||
| Change in postretirement benefit obligation |
||||||||
| Projected postretirement benefit obligation, beginning of year |
$ | 12,373 | $ | 10,290 | ||||
| Service cost |
137 | 125 | ||||||
| Interest cost |
611 | 556 | ||||||
| Plan participants’ contributions |
346 | 310 | ||||||
| Actuarial loss |
4,294 | 2,098 | ||||||
| Benefit payments |
(1,108 | ) | (1,006 | ) | ||||
|
|
|
|
|
|||||
| Projected postretirement benefit obligation, end of year |
16,653 | 12,373 | ||||||
| Change in plan assets |
||||||||
| Plan assets, beginning of year |
— | — | ||||||
| Employer contributions |
763 | 696 | ||||||
| Plan participants’ contributions |
345 | 310 | ||||||
| Benefit payments |
(1,108 | ) | (1,006 | ) | ||||
|
|
|
|
|
|||||
| Plan assets, end of year |
— | — | ||||||
|
|
|
|
|
|||||
| Funded status at end of year—net liability |
$ | (16,653 | ) | $ | (12,373 | ) | ||
|
|
|
|
|
|||||
| Amounts recognized in accumulated other comprehensive loss |
||||||||
| Unrecognized loss at beginning of year |
$ | 5,546 | $ | 3,701 | ||||
| Amount of (loss)/gain recognized during the year |
(489 | ) | (253 | ) | ||||
| Net actuarial loss/(gain) |
4,294 | 2,098 | ||||||
|
|
|
|
|
|||||
| Unrecognized loss at end of year |
$ | 9,351 | $ | 5,546 | ||||
|
|
|
|
|
|||||
106
Table of Contents
HANCOCK HOLDING COMPANY AND SUBSIDIARIES
NOTES TO CONSOLIDATED FINANCIAL STATEMENTS
Note 12. Retirement and Employee Benefit Plans (continued)
Whitney Plans
| Period Ended December 31 2011 |
||||
| Change in postretirement benefit obligation |
||||
| Projected postretirement benefit obligation, from acquisition date |
$ | 15,949 | ||
| Service cost |
— | |||
| Interest cost |
480 | |||
| Plan participants' contributions |
523 | |||
| Actuarial loss |
1,645 | |||
| Benefit payments |
(1,143 | ) | ||
|
|
|
|||
| Projected postretirement benefit obligation, end of year |
17,454 | |||
|
|
|
|||
| Change in plan assets |
||||
| Plan assets, beginning of year |
— | |||
| Employer contributions |
620 | |||
| Plan participants' contributions |
523 | |||
| Benefit payments |
(1,143 | ) | ||
|
|
|
|||
| Plan assets, end of year |
— | |||
|
|
|
|||
| Funded status at end of year—net liability |
$ | (17,454 | ) | |
|
|
|
|||
| Amounts recognized in accumulated other comprehensive loss |
||||
| Unrecognized loss at beginning of year |
$ | — | ||
| Amount of (loss)/gain recognized during the year |
— | |||
| Net actuarial loss/(gain) |
1,645 | |||
|
|
|
|||
| Unrecognized loss at end of year |
$ | 1,645 | ||
|
|
|
|||
107
Table of Contents
HANCOCK HOLDING COMPANY AND SUBSIDIARIES
NOTES TO CONSOLIDATED FINANCIAL STATEMENTS
Note 12. Retirement and Employee Benefit Plans (continued)
The following tables for the Hancock plans show the composition of net periodic postretirement benefit cost (in thousands):
| Years Ended December 31, | ||||||||||||
| 2011 | 2010 | 2009 | ||||||||||
| Net periodic postretirement benefit cost |
||||||||||||
| Service cost |
$ | 137 | $ | 124 | $ | 114 | ||||||
| Interest costs |
611 | 556 | 565 | |||||||||
| Amortization of net loss |
538 | 302 | 296 | |||||||||
| Amortization of prior service cost |
(48 | ) | (48 | ) | (48 | ) | ||||||
|
|
|
|
|
|
|
|||||||
| Net periodic postretirement benefit cost |
1,238 | 934 | 927 | |||||||||
|
|
|
|
|
|
|
|||||||
| Other changes in plan assets and benefit obligations recognized in other comprehensive income, before taxes |
||||||||||||
| Amount of loss recognized during the year |
(538 | ) | (302 | ) | (296 | ) | ||||||
| Net actuarial (gain)/loss |
4,293 | 2,098 | 1,574 | |||||||||
| Amortization of prior service cost |
48 | 48 | 48 | |||||||||
|
|
|
|
|
|
|
|||||||
| Total recognized in other comprehensive income |
3,803 | 1,844 | 1,326 | |||||||||
| Total recognized in net periodic benefit cost and other comprehensive income |
$ | 5,041 | $ | 2,778 | $ | 2,253 | ||||||
|
|
|
|
|
|
|
|||||||
The Company assumed certain trends in health care costs in the determination of the benefit obligations. At December 31, 2011, the Company assumed a 7.5% increase in the pre- and post-Medicare age health costs for 2012, declining uniformly over 5 years to a 5.0% annual rate of increase for years thereafter. At December 31, 2010, the initial rate of increase was assumed to be 8.0%, declining to an ultimate rate of 5.0% over a 6 year period. The following table illustrates the effect on the annual periodic postretirement benefit costs and postretirement benefit obligation of a 1% increase or 1% decrease in the assumed health care cost trend rates from the rates assumed at December 31, 2011.
| 1% Decrease | Assumed | 1% Increase | ||||||||||
| in Rates | Rates | in Rates | ||||||||||
| Aggregated service and interest cost |
$ | 654 | $ | 748 | $ | 866 | ||||||
| Postretirement benefit obligation |
14,655 | 16,653 | 19,114 | |||||||||
108
Table of Contents
HANCOCK HOLDING COMPANY AND SUBSIDIARIES
NOTES TO CONSOLIDATED FINANCIAL STATEMENTS
Note 12. Retirement and Employee Benefit Plans (continued)
The following tables for the Whitney plans show the composition of net period postretirement benefit cost (in thousands):
| 2011 | ||||
| Net periodic postretirement benefit cost |
||||
| Service cost |
$ | — | ||
| Interest costs |
480 | |||
| Amortization of net loss |
— | |||
| Amortization of prior service cost |
— | |||
|
|
|
|||
| Net periodic postretirement benefit cost |
480 | |||
|
|
|
|||
| Other changes in plan assets and benefit obligations recognized in other comprehensive income, before taxes |
||||
| Amount of loss recognized during the year |
— | |||
| Net actuarial (gain)/loss |
1,645 | |||
| Amortization of prior service cost |
— | |||
|
|
|
|||
| Total recognized in other comprehensive income |
1,645 | |||
|
|
|
|||
| Total recognized in net periodic benefit cost and other |
||||
|
|
|
|||
| comprehensive income |
$ | 2,125 | ||
|
|
|
|||
At December 31, 2011, the Company assumed a 7.75% increase in pre- and post-Medicare age health costs for 2012, declining gradually to a 5.0% annual rate. The following table illustrates the effect on the annual periodic postretirement benefit cost and the postretirement benefit obligation of a 1% increase or 1% decrease in the assumed health care cost trend rates:
| 1% Decrease in Rates |
Assumed Rates |
1% Increase in Rates |
||||||||||
| Aggregated service and interest cost |
$ | 431 | $ | 480 | $ | 538 | ||||||
| Postretirement benefit obligation |
15,620 | 17,454 | 19,631 | |||||||||
Expected benefits to be paid over the next ten years are reflected the following table (in thousands):
| Hancock | Whitney | Total | ||||||||||
| 2012 |
$ | 832 | $ | 1,246 | $ | 2,078 | ||||||
| 2013 |
795 | 1,293 | 2,088 | |||||||||
| 2014 |
838 | 1,244 | 2,082 | |||||||||
| 2015 |
784 | 1,141 | 1,925 | |||||||||
| 2016 |
813 | 1,056 | 1,869 | |||||||||
| 2017-2021 |
4,245 | 4,450 | 8,695 | |||||||||
|
|
|
|
|
|
|
|||||||
| $ | 8,307 | $ | 10,430 | $ | 18,737 | |||||||
|
|
|
|
|
|
|
|||||||
.
109
Table of Contents
HANCOCK HOLDING COMPANY AND SUBSIDIARIES
NOTES TO CONSOLIDATED FINANCIAL STATEMENTS
Note 13. Stock-Based Payment Arrangements
Hancock maintains an incentive compensation plan that incorporates stock-based payment arrangements for employees and directors. The most recent plan was approved by the Company’s stockholders in 2005 (the “Plan”). The Compensation Committee of the Company’s Board of Directors administers the Plan, makes determinations with respect to participation by employees or directors and authorizes stock-based awards under the plan. Under the Plan, participants may be awarded stock options (including incentive stock options for employees), restricted shares, performance stock awards and stock appreciation rights, all on a stand-alone, combination or tandem basis. To date, the Committee has awarded stock options, tenure-based restricted shares and performance stock awards.
The Plan authorizes the issuance of an aggregate of 5,000,000 shares of the Company’s common stock pursuant to awards under the Plan. The Plan limits the number of shares for which awards may be granted during any calendar year to 2% of the outstanding common stock reported at the end of the previous fiscal year, plus any unused portion of the annual limit for the prior year and subject to certain other adjustments. At December 31, 2011 there were 4.4 million shares available for future issuance under equity compensation plans. Whitney options converted at the acquisition date do not count against the number of shares available for future issuance. The awards available for issuance cover outstanding unvested and unexercised awards as well as future awards. The Company may use authorized unissued shares or shares held in treasury to satisfy awards under the Plan.
Restricted stock awards issued under the Plan generally vest at the end of five years of continuous service from the grant date. The fair value of each performance stock award is estimated on the grant date’s prior closing price using the Black-Scholes-Merton valuation model. The performance awards issued during the annual grant have a one year performance measurement period followed by a two year service vesting period. The target shares issued are the maximum potential shares to be awarded.
For the years ended December 31, 2011, 2010 and 2009 total stock-based compensation recognized in income was $7.2 million, $4.1 million and $3.3 million respectively. The total recognized tax benefit related to the stock-based compensation was $1.4 million, $0.7 million and $0.8 million, respectively, for 2011, 2010 and 2009.
A summary of option activity for 2011 is presented below:
| Options |
Number of Shares |
Weighted- Average Exercise Price ($) |
Weighted- Average Remaining Contractual Term (Years) |
Aggregate Intrinsic Value ($000) |
||||||||||||
| Outstanding at January 1, 2011 |
1,129,520 | $ | 35.08 | |||||||||||||
|
|
|
|
|
|
|
|
|
|||||||||
| Whitney options converted at acquisition date |
775,261 | $ | 62.64 | |||||||||||||
| Granted |
200,601 | $ | 29.97 | |||||||||||||
| Exercised |
(21,919 | ) | $ | 18.14 | ||||||||||||
| Forfeited or expired |
(396,556 | ) | $ | 61.83 | ||||||||||||
|
|
|
|
|
|
|
|
|
|||||||||
| Outstanding at December 31, 2011 |
1,686,907 | $ | 41.05 | 5.2 | $ | 1,642 | ||||||||||
|
|
|
|
|
|
|
|
|
|||||||||
| Exercisable at December 31, 2011 |
1,183,667 | $ | 44.25 | 3.6 | $ | 1,241 | ||||||||||
|
|
|
|
|
|
|
|
|
|||||||||
The exercise price is equal to the closing market price on the date immediately preceding the date of grant, except for certain of those granted to major stockholders where the option price is 110% of the market price. Option awards generally vest equally over five years of continuous service and have ten-year contractual terms. The fair value of each option award is estimated using the Black-Scholes-Merton option valuation model.
110
Table of Contents
HANCOCK HOLDING COMPANY AND SUBSIDIARIES
NOTES TO CONSOLIDATED FINANCIAL STATEMENTS
Note 13. Stock-Based Payment Arrangements (continued)
Whitney’s stock options outstanding at the acquisition date were assumed by Hancock, as adjusted for the share exchange ratio specified in the merger agreement. These options will expire at the earlier of (1) their expiration date (which is generally ten years after the grant date), except for grants made in 2005 that expired six months following the merger, or (2) a date following termination of employment, as set forth in the prior grant plan document.
The total intrinsic value of options exercised during 2011, 2010 and 2009 was $0.3 million, $0.8 million, and $1.5 million, respectively.
A summary of the status of the Company’s nonvested shares as of December 31, 2011, and changes during 2011, is presented below:
| Number of Shares |
Weighted- Average Grant-Date Fair Value |
|||||||
| Nonvested at January 1, 2011 |
855,873 | $ | 23.76 | |||||
| Granted |
827,656 | $ | 26.06 | |||||
| Vested |
(194,452 | ) | $ | 18.41 | ||||
| Forfeited |
(28,101 | ) | $ | 27.41 | ||||
|
|
|
|||||||
| Nonvested at December 31, 2011 |
1,460,976 | $ | 25.70 | |||||
|
|
|
|||||||
As of December 31, 2011, there was $27.8 million of total unrecognized compensation related to nonvested restricted shares. This compensation is expected to be recognized in expense over a weighted-average period of 3.4 years. The total fair value of shares which vested during 2011 and 2010 was $6.2 million and $5.9 million, respectively.
The weighted-average grant-date fair values of options awarded during 2011, 2010 and 2009 were $8.64, $10.73, and $14.52, respectively. The fair value of each option award was estimated as of the grant date using the Black-Scholes-Merton option-pricing model. The significant assumptions made in applying the option-pricing model are noted in the following table. Expected volatilities are based on implied volatilities from traded options on the Company’s stock, historical volatility of the Company’s stock and other factors. The expected term of options granted was derived from the output of the option valuation model and represents the period of time that options granted are expected to be outstanding. The risk-free rate for periods within the contractual life of the option was based on the U.S. Treasury yield curve in effect at the time of grant.
| Years Ended December 31, | ||||||
| 2011* | 2010 | 2009* | ||||
| Expected volatility |
38.90% | 40.53% | 40.45% | |||
| Expected dividends |
3.20% | 2.9%-2.99% | 2.49% | |||
| Expected term (in years) |
6.38 | 9.55 | 8.7 | |||
| Risk-free rates |
1.99% | 2.73%-3.33% | 3.28% | |||
| * | During 2011 and 2009, there was only one option award to one class of recipients. |
111
Table of Contents
HANCOCK HOLDING COMPANY AND SUBSIDIARIES
NOTES TO CONSOLIDATED FINANCIAL STATEMENTS
Note 14. Fair Value of Financial Instruments
The FASB defines fair value as the exchange price that would be received to sell an asset or paid to transfer a liability in the principal or most advantageous market for the asset or liability in an orderly transaction between market participants on the measurement date. The FASB’s guidance also established a fair value hierarchy that prioritizes the inputs to these valuation techniques used to measure fair value, giving preference to quoted prices in active markets for identical assets or liabilities (level 1) and the lowest priority to unobservable inputs such as a reporting entity’s own data (level 3). Level 2 inputs include quoted prices for similar assets or liabilities in active markets, quoted prices for identical assets or liabilities in markets that are not active, observable inputs other than quoted prices, such as interest rates and yield curves, and inputs that are derived principally from or corroborated by observable market data by correlation or other means.
Available for sale securities classified as level 1 within the valuation hierarchy include U.S. Treasury securities, obligations of U.S. Government-sponsored agencies, and certain other debt and equity securities. Level 2 classified available for sale securities include mortgage-backed debt securities and collateralized mortgage obligations that are agency securities, and state and municipal bonds. The Company invests only in high quality securities of investment grade quality with a targeted duration, for the overall portfolio, generally between two to five years. Company policies limit investments to securities having a rating of no less than “Baa”, or its equivalent by a nationally recognized statistical rating agency, except for certain non-rated obligations of counties, parishes and municipalities within our markets in Mississippi, Louisiana, Texas, Florida and Alabama. There were no transfers between levels during the periods shown.
The fair value of derivative financial instruments, which are predominantly interest rate swaps, is obtained from a third-party pricing service that uses an industry-standard discounted cash flow model that relies on inputs, such as interest rate futures, observable in the marketplace. To comply with the accounting guidance, credit valuation adjustments are incorporated in the fair values to appropriately reflect nonperformance risk for both the Company and the counterparties. Although the Company has determined that the majority of the inputs used to value the derivative instruments fall within level 2 of the fair value hierarchy, the credit value adjustments utilize level 3 inputs, such as estimates of current credit spreads. The Company has determined that the impact of the credit valuation adjustments is not significant to the overall valuation of these derivatives. As a result, the Company has classified its derivative valuations in their entirety in level 2 of the fair value hierarchy.
Fair Value of Assets Measured on a Recurring Basis
The following table presents for each of the fair-value hierarchy levels the Company’s financial assets and liabilities that are measured at fair value (in thousands) on a recurring basis at December 31, 2011 and 2010.
| As of December 31, 2011 | ||||||||||||
| Level 1 | Level 2 | Total | ||||||||||
| Assets |
||||||||||||
| Available for sale securities: |
||||||||||||
| U.S. Treasury and government agency securities |
$ | 250,067 | $ | — | $ | 250,067 | ||||||
| Debt securities issued by states of the United States and political subdivisions of the states |
— | 309,665 | 309,665 | |||||||||
| Corporate debt securities |
4,494 | — | 4,494 | |||||||||
| Residential mortgage-backed securities |
— | 2,480,345 | 2,480,345 | |||||||||
| Collateralized mortgage obligations |
— | 1,446,076 | 1,446,076 | |||||||||
| Equity securities |
6,253 | — | 6,253 | |||||||||
| Derivative financial instruments—assets |
— | 14,952 | 14,952 | |||||||||
|
|
|
|
|
|
|
|||||||
| Total assets |
$ | 260,814 | $ | 4,251,038 | $ | 4,511,852 | ||||||
|
|
|
|
|
|
|
|||||||
| Liabilities |
||||||||||||
| Derivative financial instruments—liabilities |
— | 15,643 | 15,643 | |||||||||
|
|
|
|
|
|
|
|||||||
| Total Liabilities |
$ | — | $ | 15,643 | $ | 15,643 | ||||||
|
|
|
|
|
|
|
|||||||
112
Table of Contents
HANCOCK HOLDING COMPANY AND SUBSIDIARIES
NOTES TO CONSOLIDATED FINANCIAL STATEMENTS
Note 14. Fair Value of Financial Instruments (continued)
| As of December 31, 2010 | ||||||||||||
| Level 1 | Level 2 | Total | ||||||||||
| Assets |
||||||||||||
| Available for sale securities: |
||||||||||||
| U.S. Treasury and government agency securities |
$ | 117,435 | $ | — | $ | 117,435 | ||||||
| Debt securities issued by states of the United States and political subdivisions of the states |
— | 180,443 | 180,443 | |||||||||
| Corporate debt securities |
15,285 | — | 15,285 | |||||||||
| Residential mortgage-backed securities |
— | 799,686 | 799,686 | |||||||||
| Collateralized mortgage obligations |
— | 372,051 | 372,051 | |||||||||
| Equity securities |
3,985 | — | 3,985 | |||||||||
| Short-term investments |
274,974 | — | 274,974 | |||||||||
| Derivative financial instruments—assets |
— | 2,952 | 2,952 | |||||||||
|
|
|
|
|
|
|
|||||||
| Total assets |
$ | 411,679 | $ | 1,355,132 | $ | 1,766,811 | ||||||
|
|
|
|
|
|
|
|||||||
| Liabilities |
||||||||||||
| Derivative financial instruments—liabilities |
$ | — | $ | 2,952 | $ | 2,952 | ||||||
|
|
|
|
|
|
|
|||||||
| Total Liabilities |
$ | — | $ | 2,952 | $ | 2,952 | ||||||
|
|
|
|
|
|
|
|||||||
Fair Value of Assets Measured on a Nonrecurring Basis
Certain assets and liabilities are measured at fair value on a nonrecurring basis and, therefore, are not included in the above table. Collateral-dependent impaired loans are level 2 assets measured using appraisals from external parties of the collateral less any prior liens or based on recent sales activity for similar assets in the property’s market. Other real estate owned are level 2 assets carried at the balance of the loan or at estimated fair value less estimated selling costs, whichever is less. Fair values are determined by sales agreement or appraisal.
The following table presents for each of the fair value hierarchy levels the Company’s financial assets that are measured at fair value (in thousands) on a nonrecurring basis at December 31, 2011 and 2010.
| As of December 31, 2011 | ||||||||||||
| Level 1 | Level 2 | Total | ||||||||||
| Assets |
||||||||||||
| Impaired loans |
$ | — | $ | 55,252 | $ | 55,252 | ||||||
| Other real estate owned |
— | 144,367 | 144,367 | |||||||||
|
|
|
|
|
|
|
|||||||
| Total assets |
$ | — | $ | 199,619 | $ | 199,619 | ||||||
|
|
|
|
|
|
|
|||||||
| As of December 31, 2010 | ||||||||||||
| Level 1 | Level 2 | Total | ||||||||||
| Assets |
||||||||||||
| Impaired loans |
$ | — | $ | 95,787 | $ | 95,787 | ||||||
| Other real estate owned |
— | 32,520 | 32,520 | |||||||||
|
|
|
|
|
|
|
|||||||
| Total assets |
$ | — | $ | 128,307 | $ | 128,307 | ||||||
|
|
|
|
|
|
|
|||||||
113
Table of Contents
HANCOCK HOLDING COMPANY AND SUBSIDIARIES
NOTES TO CONSOLIDATED FINANCIAL STATEMENTS
Note 14. Fair Value of Financial Instruments (continued)
Accounting guidance from the FASB requires the disclosure of estimated fair value information about certain on- and off-balance sheet financial instruments, including those financial instruments that are not measured and reported at fair value on a recurring basis. The significant methods and assumptions used by the Company to estimate the fair value of financial instruments are discussed below.
Cash, Short-Term Investments and Federal Funds Sold—For those short-term instruments, the carrying amount is a reasonable estimate of fair value.
Securities Available for Sale—The fair value measurement for securities available for sale was discussed earlier.
Loans, Net—The fair value measurement for certain impaired loans was discussed earlier. For the remaining portfolio, fair values were generally estimated by discounting scheduled cash flows using discount rates determined with reference to current market rates at which loans with similar terms would be made to borrowers with similar credit quality.
Accrued Interest Receivable and Accrued Interest Payable—The carrying amounts are a reasonable estimate of fair values.
Deposits—The accounting guidance requires that the fair value of deposits with no stated maturity, such as noninterest-bearing demand deposits, interest-bearing checking and savings accounts, be assigned fair values equal to amounts payable upon demand (carrying amounts). The fair value of fixed-maturity certificates of deposit is estimated using the rates currently offered for deposits of similar remaining maturities.
Securities Sold under Agreements to Repurchase, Federal Funds Purchased, and FHLB Borrowings—For these short-term liabilities, the carrying amount is a reasonable estimate of fair value.
Long-Term Debt—The fair value is estimated by discounting the future contractual cash flows using current market rates at which debt with similar terms could be obtained.
Derivative Financial Instruments – The fair value measurement for derivative financial instruments was discussed earlier.
The estimated fair values of the Company’s financial instruments were as follows (in thousands):
| December 31, | ||||||||||||||||
| 2011 | 2010 | |||||||||||||||
| Carrying | Fair | Carrying | Fair | |||||||||||||
| Amount | Value | Amount | Value | |||||||||||||
| Financial assets: |
||||||||||||||||
| Cash, interest-bearing deposits, federal funds sold, and short-term investments |
$ | 1,622,366 | $ | 1,622,366 | $ | 778,851 | $ | 778,851 | ||||||||
| Securities available for sale |
4,496,900 | 4,496,900 | 1,488,885 | 1,488,885 | ||||||||||||
| Loans, net |
11,052,144 | 11,189,662 | 4,875,167 | 5,085,925 | ||||||||||||
| Loans held for sale |
72,378 | 72,378 | 21,866 | 21,866 | ||||||||||||
| Accrued interest receivable |
53,973 | 53,973 | 30,157 | 30,157 | ||||||||||||
| Derivative financial instruments |
14,952 | 14,952 | 2,952 | 2,952 | ||||||||||||
| Financial liabilities: |
||||||||||||||||
| Deposits |
$ | 15,713,579 | $ | 15,737,667 | $ | 6,775,719 | $ | 6,787,931 | ||||||||
| Federal funds purchased |
16,819 | 16,819 | — | — | ||||||||||||
| Securities sold under agreements to repurchase |
1,027,635 | 1,027,635 | 364,676 | 364,676 | ||||||||||||
| FHLB borrowings |
— | — | 10,172 | 10,172 | ||||||||||||
| Long-term debt |
353,890 | 365,421 | 376 | 376 | ||||||||||||
| Accrued interest payable |
8,284 | 8,284 | 4,007 | 4,007 | ||||||||||||
| Derivative financial instruments |
15,643 | 15,643 | 2,952 | 2,952 | ||||||||||||
114
Table of Contents
HANCOCK HOLDING COMPANY AND SUBSIDIARIES
NOTES TO CONSOLIDATED FINANCIAL STATEMENTS
Note 15. Commitments and Contingencies
Lending Related
In the normal course of business, the Banks enter into financial instruments, such as commitments to extend credit and letters of credit, to meet the financing needs of their customers. Such instruments are not reflected in the accompanying consolidated financial statements until they are funded, although they expose the Banks to varying degrees of credit risk and interest rate risk in much the same way as funded loans.
Commitments to extend credit include revolving commercial credit lines, nonrevolving loan commitments issued mainly to finance the acquisition and development of construction of real property or equipment, and credit card and personal credit lines. The availability of funds under commercial credit lines and loan commitments generally depends on whether the borrower continues to meet credit standards established in the underlying contract and has not violated other contractual conditions. Loan commitments generally have fixed expiration dates or other termination clauses and may require payment of a fee by the borrower. Credit card and personal credit lines are generally subject to cancellation if the borrower’s credit quality deteriorates. A number of commercial and personal credit lines are used only partially or, in some cases, not at all before they expire, and the total commitment amounts do not necessarily represent future cash requirements of the Company.
A substantial majority of the letters of credit are standby agreements that obligate the Banks to fulfill a customer’s financial commitments to a third party if the customer is unable to perform. The Banks issue standby letters of credit primarily to provide credit enhancement to their customers’ other commercial or public financing arrangements and to help them demonstrate financial capacity to vendors of essential goods and services.
The contract amounts of these instruments reflect the Company’s exposure to credit. The Company undertakes the same credit evaluation in making loan commitments and assuming conditional obligations as it does for on-balance sheet instruments and may require collateral or other credit support. These off-balance sheet financial instruments are summarized below (in thousands):
| December 31, | ||||||||
| 2011 | 2010 | |||||||
| Commitments to extend credit |
$ | 4,189,421 | $ | 912,206 | ||||
| Letters of credit |
441,048 | 87,038 | ||||||
Approximately $3.8 billion and $729 million of commitments to extend credit at December 31, 2011 and 2010, respectively, carry variable interest rates and the remainder fixed rates.
Legal Proceedings
On January 7, 2011, a purported shareholder of Whitney filed a lawsuit in the Civil District Court for the Parish of Orleans of the State of Louisiana captioned De LaPouyade v. Whitney Holding Corporation, et al., No. 11-189, naming Whitney and members of Whitney’s board of directors as defendants. This lawsuit is purportedly brought on behalf of a putative class of Whitney’s common shareholders and seeks a declaration that it is properly maintainable as a class action. The lawsuit alleges that Whitney’s directors breached their fiduciary duties and/or violated Louisiana state law and that Whitney aided and abetted those alleged breaches of fiduciary duty by, among other things, (a) agreeing to consideration that undervalues Whitney, (b) agreeing to deal protection devices that preclude a fair sales process, (c) engaging in self-dealing, and (d) failing to protect against conflicts of interest. Among other relief, the plaintiff sought to enjoin the merger. The parties have reached a settlement in principle.
115
Table of Contents
HANCOCK HOLDING COMPANY AND SUBSIDIARIES
NOTES TO CONSOLIDATED FINANCIAL STATEMENTS
Note 15. Commitments and Contingencies (continued)
On February 17, 2011, a complaint in intervention was filed by the Louisiana Municipal Police Employees Retirement System (“MPERS”) in the De LaPouyade case. The MPERS complaint is substantially identical to and seeks to join in the De LaPouyade complaint. The parties have reached a settlement in principle.
On February 7, 2011, another putative shareholder class action lawsuit, Realistic Partners v. Whitney Holding Corporation, et al., Case No. 2:11-cv-00256, was filed in the United States District Court for the Eastern District of Louisiana against Whitney, members of Whitney’s board of directors, and Hancock asserting violations of Section 14(a) of the Securities Exchange Act of 1934, breach of fiduciary duty under Louisiana state law, and aiding and abetting breach of fiduciary duty by, among other things, (a) making material misstatements or omissions in the proxy statement, (b) agreeing to consideration that undervalues Whitney, (c) agreeing to deal protection devices that preclude a fair sales process, (d) engaging in self-dealing, and (e) failing to protect against conflicts of interest. Among other relief, the plaintiff sought to enjoin the merger. On February 24, 2011, the plaintiff moved for class certification. The parties have reached a settlement in principle.
On April 11, 2011, another putative shareholder class action lawsuit, Jane Doe v. Whitney Holding Corporation, et al., Case No. 2:11-cv-00794-ILRL-JCW, was filed in the United States District Court for the Eastern District of Louisiana against Whitney, members of Whitney’s board of directors, and the defendants’ insurance carrier asserting breach of fiduciary duty under Louisiana state law by, among other things, (a) agreeing to consideration that undervalues Whitney, (b) agreeing to deal protection devices that preclude a fair sales process, (c) engaging in self-dealing, and (d) failing to protect against conflicts of interest. Among other relief, the plaintiff sought to enjoin the merger. On April 20, 2011, this case was consolidated with the Realistic Partners case. The parties have reached a settlement in principle.
Like many other banks, Whitney Bank is a defendant in a class action lawsuit (Angelique LaCour v. Whitney Bank, D. (M.D. Fla.)) alleging that it improperly assessed overdraft fees on consumer and business deposit accounts owned by persons and entities that maintained those accounts, within the class period, at Whitney National Bank, or any of the entities that it acquired during the class period before its merger with Hancock Bank of Louisiana, due to the order in which it posted or processed debit card transactions against such deposit accounts. Plaintiff alleges that these posting practices resulted in excessive overdraft fees being imposed by the Company. While the Company admits no wrong doing, in order to fully and finally resolve the litigation and avoid the significant costs and expenses that would be involved in defending the case as well as the distraction caused by the litigation, Whitney Bank has entered into an agreement in principal whereby Whitney would pay the sum of $6.8 million in exchange for a full and complete release of all claims brought in the pending action. The proposed settlement is contingent on several factors, including final court approval and sufficient class participation. The Company establishes a liability for contingent litigation losses for any legal matter when payments associated with the claims become probable and the costs can be reasonably estimated. The Company accrued for the proposed settlement in the 4th quarter of 2011.
The Company accrues a liability for losses associated with litigation and regulatory matters when losses are both probable and estimable. Based on current knowledge, management does not believe that loss contingencies, if any, arising from other pending litigation and regulatory matters, including the litigation matters described above, will have a material adverse effect on the consolidated financial position or liquidity of the Company.
116
Table of Contents
HANCOCK HOLDING COMPANY AND SUBSIDIARIES
NOTES TO CONSOLIDATED FINANCIAL STATEMENTS
Note 15. Commitments and Contingencies (continued)
Lease Commitments
The Company currently is obligated under a number of capital and non-cancelable operating leases for buildings and equipment. Certain of these leases have escalation clauses and renewal options.
Future minimum lease payments for non-cancelable capital and operating leases with initial terms in excess of one year were as follows at December 31, 2011 (in thousands):
| Captial Leases | Operating Leases | |||||||
| 2012 |
$ | 60 | $ | 12,944 | ||||
| 2013 |
65 | 11,840 | ||||||
| 2014 |
9 | 11,230 | ||||||
| 2015 |
7 | 10,031 | ||||||
| 2016 |
1 | 9,145 | ||||||
| Thereafter |
14 | 62,462 | ||||||
|
|
|
|
|
|||||
| Total minimum lease payments |
$ | 156 | $ | 117,652 | ||||
|
|
|
|||||||
| Amounts representing interest |
40 | |||||||
|
|
|
|||||||
| Present value of net minimum lease payments |
$ | 116 | ||||||
|
|
|
|||||||
Rental expense approximated $11.9 million, $7.2 million and $4.5 million for the years ended December 31, 2011, 2010, and 2009, respectively.
Note 16. Other Noninterest Income and Other Noninterest Expense
The components of other noninterest income and other noninterest expense are as follows (in thousands):
| Years Ended December 31, | ||||||||||||
| 2011 | 2010 | 2009 | ||||||||||
| Other noninterest income: |
||||||||||||
| Income from bank owned life insurance |
$ | 9,311 | $ | 5,219 | $ | 5,527 | ||||||
| Safety deposit box income |
1,591 | 841 | 794 | |||||||||
| Appraisal fee income |
1,088 | 714 | 854 | |||||||||
| Letter of credit fees |
4,193 | 1,451 | 1,309 | |||||||||
| Other |
9,395 | 3,800 | 7,563 | |||||||||
|
|
|
|
|
|
|
|||||||
| Total other noninterest income |
$ | 25,578 | $ | 12,025 | $ | 16,047 | ||||||
|
|
|
|
|
|
|
|||||||
| Other noninterest expense: |
||||||||||||
| Ad valorem and franchise taxes |
5,330 | 3,568 | 3,621 | |||||||||
| Printing and supplies |
5,608 | 2,380 | 1,911 | |||||||||
| Other fees |
4,677 | 3,649 | 3,802 | |||||||||
| ORE expense |
6,910 | 4,475 | 1,357 | |||||||||
| Insurance expense |
7,490 | 2,010 | 1,905 | |||||||||
| Travel |
3,590 | 2,137 | 1,152 | |||||||||
| Entertainment and contributions |
3,954 | 1,651 | 1,346 | |||||||||
| Miscellaneous losses |
8,781 | 1,080 | 1,663 | |||||||||
| Tax credit investment amortization |
3,515 | — | — | |||||||||
| Other expense |
18,081 | 8,942 | 5,634 | |||||||||
|
|
|
|
|
|
|
|||||||
| Total other noninterest expense |
$ | 67,936 | $ | 29,892 | $ | 22,391 | ||||||
|
|
|
|
|
|
|
|||||||
117
Table of Contents
HANCOCK HOLDING COMPANY AND SUBSIDIARIES
NOTES TO CONSOLIDATED FINANCIAL STATEMENTS
Note 16. Other Noninterest Income and Other Noninterest Expense (continued)
Included in noninterest expense are merger-related expenses related to the Whitney and People’s First acquisitions. See Note 2 for detail.
Note 17. Income Taxes
Income tax expense included in net income consisted of the following components (in thousands):
| Years Ended December 31, | ||||||||||||
| 2011 | 2010 | 2009 | ||||||||||
| Current federal |
$ | 7,400 | $ | 20,707 | $ | 15,816 | ||||||
| Current state |
1,961 | 600 | (241 | ) | ||||||||
|
|
|
|
|
|
|
|||||||
| Total current provision |
9,361 | 21,307 | 15,575 | |||||||||
|
|
|
|
|
|
|
|||||||
| Deferred federal |
9,735 | (10,676 | ) | 6,753 | ||||||||
| Deferred state |
(1,032 | ) | (926 | ) | 591 | |||||||
|
|
|
|
|
|
|
|||||||
| Total deferred provision |
8,703 | (11,602 | ) | 7,344 | ||||||||
|
|
|
|
|
|
|
|||||||
| Total tax expense |
$ | 18,064 | $ | 9,705 | $ | 22,919 | ||||||
|
|
|
|
|
|
|
|||||||
Temporary differences arise between the tax bases of assets or liabilities and their carrying amounts for financial reporting purposes. The expected tax effects when these differences are resolved are recorded currently as deferred tax assets or liabilities. Significant components of the Company’s deferred tax assets and liabilities were as follows (in thousands):
| December 31, | ||||||||
| 2011 | 2010 | |||||||
| Deferred tax assets: |
||||||||
| Allowance for loan losses |
$ | 85,289 | $ | 30,356 | ||||
| Employee compensation and benefits |
40,013 | 27,086 | ||||||
| Loan purchase accounting adjustments |
241,412 | 126,536 | ||||||
| Demand deposits |
2,308 | 1,218 | ||||||
| Capital loss |
— | 153 | ||||||
| Tax credit carryforward |
25,465 | 663 | ||||||
| Federal net operating loss |
24,524 | 104 | ||||||
| State net operating loss |
2,958 | 1,274 | ||||||
| Other |
23,128 | 1,637 | ||||||
|
|
|
|
|
|||||
| Gross deferred tax assets |
445,097 | 189,027 | ||||||
|
|
|
|
|
|||||
| Federal valuation allowance |
— | (84 | ) | |||||
| State valuation allowance |
(2,415 | ) | (1,274 | ) | ||||
|
|
|
|
|
|||||
| Subtotal valuation allowance |
(2,415 | ) | (1,358 | ) | ||||
|
|
|
|
|
|||||
| Net deferred tax assets |
442,682 | 187,669 | ||||||
|
|
|
|
|
|||||
| Deferred tax liabilities: |
||||||||
| Fixed assets & intangibles |
(135,987 | ) | (31,159 | ) | ||||
| FHLB Stock Dividend |
(1,119 | ) | (3,520 | ) | ||||
| Securities |
(55,642 | ) | (15,932 | ) | ||||
| Deferred gain on acquisition |
(13,232 | ) | (17,907 | ) | ||||
| FDIC Indemnification Asset |
(83,348 | ) | (104,785 | ) | ||||
| Other |
(7,594 | ) | (7,825 | ) | ||||
|
|
|
|
|
|||||
| Gross deferred tax liabilities |
(296,922 | ) | (181,128 | ) | ||||
|
|
|
|
|
|||||
| Net deferred tax asset (liability) |
$ | 145,760 | $ | 6,541 | ||||
|
|
|
|
|
|||||
118
Table of Contents
HANCOCK HOLDING COMPANY AND SUBSIDIARIES
NOTES TO CONSOLIDATED FINANCIAL STATEMENTS
Note 17. Income Taxes (continued)
Reported income tax expense differed from amounts computed by applying the statutory income tax rate of 35% to earnings before income taxes because of the following factors (in thousands):
| Years Ended December 31, | ||||||||||||||||||||||||
| 2011 | 2010 | 2009 | ||||||||||||||||||||||
| Amount | % | Amount | % | Amount | % | |||||||||||||||||||
| Taxes computed at statutory rate |
$ | 33,188 | 35 | % | $ | 21,669 | 35 | % | $ | 34,195 | 35 | % | ||||||||||||
| Increases (decreases) in taxes resulting from: |
||||||||||||||||||||||||
| State income taxes, net of federal income tax benefit |
689 | 1 | % | (410 | ) | -1 | % | 706 | 1 | % | ||||||||||||||
| Tax-exempt interest |
(6,892 | ) | -8 | % | (6,747 | ) | -11 | % | (6,703 | ) | -7 | % | ||||||||||||
| Bank owned life insurance |
(3,352 | ) | -4 | % | (1,918 | ) | -3 | % | (2,097 | ) | -2 | % | ||||||||||||
| Tax credits |
(8,384 | ) | -9 | % | (3,702 | ) | -6 | % | (3,923 | ) | -4 | % | ||||||||||||
| Merger transaction costs |
2,178 | 3 | % | — | 0 | % | — | 0 | % | |||||||||||||||
| Other, net |
637 | 1 | % | 813 | 1 | % | 741 | 1 | % | |||||||||||||||
|
|
|
|
|
|
|
|
|
|
|
|
|
|||||||||||||
| Income tax expense |
$ | 18,064 | 19 | % | $ | 9,705 | 15 | % | $ | 22,919 | 24 | % | ||||||||||||
|
|
|
|
|
|
|
|
|
|
|
|
|
|||||||||||||
As of December 31, 2011, the Company had approximately $68 million in federal net operating loss carryforwards that originated primarily in the 2009 and 2010 tax year. The Company also had approximately $25 million in federal tax credit carryforwards that originated in the tax years from 2008 through 2010. The federal net operating loss carry forwards will begin expiring in 2029, and the federal tax credit carryforwards will begin to expire in 2028. The Company also had approximately $72 million in state net operating loss carryforwards that originated in the tax years 2002 through 2011. A state valuation allowance has been established for approximately $57 million of the state net operating loss carryforwards. The state net operating losses will begin expiring in 2017.
The tax benefit of a position taken or expected to be taken in a tax return should be recognized when it is more likely than not that the position will be sustained on its technical merits. The liability for unrecognized tax benefits was immaterial at December 31, 2011 and 2010. The Company does not expect the liability for unrecognized tax benefits to change significantly during 2012. Hancock recognizes interest and penalties, if any, accrued related to income tax matters in income tax expense, and the amounts recognized during 2011, 2010 and 2009 were insignificant.
The Company and its subsidiaries file a consolidated U.S. federal income tax return, as well as filing various returns in the states where its banking offices are located. The returns for years before 2008 are no longer subject to examination by taxing authorities.
Note 18. Earnings Per Share
Hancock calculates earnings per share using the two-class method. The two-class method allocates net income to each class of common stock and participating security according to common dividends declared and participation rights in undistributed earnings. Participating securities consist of unvested stock-based payment awards that contain nonforfeitable rights to dividends or dividend equivalents.
119
Table of Contents
HANCOCK HOLDING COMPANY AND SUBSIDIARIES
NOTES TO CONSOLIDATED FINANCIAL STATEMENTS
Note 18. Earnings Per Share (continued)
A summary of the information used in the computation of earnings per common share follows (in thousands, except per share data):
| Years Ended December 31, | ||||||||||||
| 2011 | 2010 | 2009 | ||||||||||
| Numerator: | ||||||||||||
| Net income to common shareholders |
$ | 76,759 | $ | 52,206 | $ | 74,775 | ||||||
|
|
|
|
|
|
|
|||||||
| Net income allocated to participating securities — basic and diluted |
866 | 320 | 247 | |||||||||
|
|
|
|
|
|
|
|||||||
| Net income allocated to common shareholders—basic and diluted |
$ | 75,893 | $ | 51,886 | $ | 74,528 | ||||||
|
|
|
|
|
|
|
|||||||
| Denominator: | ||||||||||||
| Weighted-average common shares—basic |
65,590 | 36,876 | 32,747 | |||||||||
| Dilutive potential common shares |
480 | 178 | 187 | |||||||||
|
|
|
|
|
|
|
|||||||
| Weighted average common shares—diluted |
66,070 | 37,054 | 32,934 | |||||||||
|
|
|
|
|
|
|
|||||||
| Earnings per common share: |
||||||||||||
| Basic |
$ | 1.16 | $ | 1.41 | $ | 2.28 | ||||||
| Diluted |
$ | 1.15 | $ | 1.40 | $ | 2.26 | ||||||
| Potential common shares consist of employee and director stock options. These potential common shares do not enter into the calculation of diluted earnings per share if the impact would be anti-dilutive, i.e., increase earnings per share or reduce a loss per share. Weighted-average anti-dilutive potential common shares totalled 680,611, for the twelve months ended December 31, 2011. There were no anti-dilutive potential common shares in 2010 or 2009. |
Note 19. Segment Reporting
The Company’s primary operating segments are divided into Hancock, Whitney, and Other. The Hancock segment coincides generally with the Company’s Hancock Bank subsidiary and the Whitney segment with its Whitney Bank subsidiary. Each bank segment offers commercial, consumer and mortgage loans and deposit services as well as certain other services, such as trust and treasury management services. Although the bank segments offer the same products and services, they are managed separately due to different pricing, product demand, and consumer markets. On June 4, 2011, the Company completed its acquisition of Whitney Holding Corporation, the parent of Whitney National Bank. Whitney National Bank was merged into Hancock Bank of Louisiana and the combined entity was renamed Whitney Bank. Prior to the merger the segment now called Whitney Bank was comprised generally of Hancock Bank Louisiana. As part of the merger, the assets and liabilities of the former Hancock Bank of Alabama were transferred to Hancock Bank. In the following tables, the “Other” segment includes activities of other consolidated subsidiaries that provide investment services, insurance agency services, insurance underwriting and various other services to third parties.
120
Table of Contents
HANCOCK HOLDING COMPANY AND SUBSIDIARIES
NOTES TO CONSOLIDATED FINANCIAL STATEMENTS
Note 19. Segment Reporting (continued)
Following is selected information for the Company’s segments (in thousands):
| Year Ended December 31, 2011 | ||||||||||||||||||||
| Hancock | Whitney | Other | Eliminations | Consolidated | ||||||||||||||||
| Interest income |
$ | 195,230 | $ | 380,072 | $ | 17,892 | $ | (990 | ) | $ | 592,204 | |||||||||
| Interest expense |
(39,056 | ) | (29,538 | ) | (2,905 | ) | 528 | (70,971 | ) | |||||||||||
|
|
|
|
|
|
|
|
|
|
|
|||||||||||
| Net interest income |
156,174 | 350,534 | 14,987 | (462 | ) | 521,233 | ||||||||||||||
|
|
|
|
|
|
|
|
|
|
|
|||||||||||
| Provision for loan losses |
(17,216 | ) | (17,550 | ) | (3,966 | ) | — | (38,732 | ) | |||||||||||
| Noninterest income |
76,846 | 96,349 | 32,761 | 471 | 206,427 | |||||||||||||||
| Depreciation and amortization |
(10,649 | ) | (13,123 | ) | (834 | ) | — | (24,606 | ) | |||||||||||
| Other noninterest expense |
(163,088 | ) | (372,034 | ) | (34,894 | ) | 608 | (569,408 | ) | |||||||||||
| Securities transactions |
(51 | ) | — | (40 | ) | — | (91 | ) | ||||||||||||
|
|
|
|
|
|
|
|
|
|
|
|||||||||||
| Income before income taxes |
42,016 | 44,176 | 8,014 | 617 | 94,823 | |||||||||||||||
| Income tax expense (benefit) |
6,513 | 7,584 | 3,967 | — | 18,064 | |||||||||||||||
|
|
|
|
|
|
|
|
|
|
|
|||||||||||
| Net income (loss) |
$ | 35,503 | $ | 36,592 | $ | 4,047 | $ | 617 | $ | 76,759 | ||||||||||
|
|
|
|
|
|
|
|
|
|
|
|||||||||||
| Goodwill |
$ | 23,386 | $ | 623,294 | $ | 4,482 | $ | — | $ | 651,162 | ||||||||||
| Total assets |
$ | 4,934,003 | $ | 14,792,788 | $ | 2,462,281 | $ | (2,414,976 | ) | $ | 19,774,096 | |||||||||
|
|
|
|
|
|
|
|
|
|
|
|||||||||||
| Total interest income from affiliates |
$ | 3,946 | $ | 480 | $ | — | $ | (4,426 | ) | $ | — | |||||||||
| Total interest income from external customers |
$ | 191,284 | $ | 379,592 | $ | 17,892 | $ | 3,436 | $ | 592,204 | ||||||||||
| Year Ended December 31, 2010 | ||||||||||||||||||||
| Hancock | Whitney | Other | Eliminations | Consolidated | ||||||||||||||||
| Interest income |
$ | 203,222 | $ | 132,205 | $ | 22,122 | $ | (4,991 | ) | $ | 352,558 | |||||||||
| Interest expense |
(61,384 | ) | (21,198 | ) | (4,294 | ) | 4,531 | (82,345 | ) | |||||||||||
|
|
|
|
|
|
|
|
|
|
|
|||||||||||
| Net interest income |
141,838 | 111,007 | 17,828 | (460 | ) | 270,213 | ||||||||||||||
|
|
|
|
|
|
|
|
|
|
|
|||||||||||
| Provision for loan losses |
(37,845 | ) | (22,554 | ) | (5,592 | ) | — | (65,991 | ) | |||||||||||
| Noninterest income |
67,940 | 43,331 | 25,745 | (67 | ) | 136,949 | ||||||||||||||
| Depreciation and amortization |
(9,755 | ) | (3,003 | ) | (767 | ) | — | (13,525 | ) | |||||||||||
| Other noninterest expense |
(152,956 | ) | (81,665 | ) | (31,244 | ) | 130 | (265,735 | ) | |||||||||||
|
|
|
|
|
|
|
|
|
|
|
|||||||||||
| Income before income taxes |
9,222 | 47,116 | 5,970 | (397 | ) | 61,911 | ||||||||||||||
| Income tax expense (benefit) |
(5,101 | ) | 12,373 | 2,433 | — | 9,705 | ||||||||||||||
|
|
|
|
|
|
|
|
|
|
|
|||||||||||
| Net income (loss) |
$ | 14,323 | $ | 34,743 | $ | 3,537 | $ | (397 | ) | $ | 52,206 | |||||||||
|
|
|
|
|
|
|
|
|
|
|
|||||||||||
| Goodwill |
$ | 23,386 | $ | 33,763 | $ | 4,482 | $ | — | $ | 61,631 | ||||||||||
| Total assets |
$ | 5,247,383 | $ | 2,906,365 | $ | 1,093,565 | $ | (1,108,986 | ) | $ | 8,138,327 | |||||||||
|
|
|
|
|
|
|
|
|
|
|
|||||||||||
| Total interest income from affiliates |
$ | 5,017 | $ | — | $ | — | $ | (5,017 | ) | $ | — | |||||||||
| Total interest income from external customers |
$ | 198,205 | $ | 132,205 | $ | 22,122 | $ | 26 | $ | 352,558 | ||||||||||
121
Table of Contents
HANCOCK HOLDING COMPANY AND SUBSIDIARIES
NOTES TO CONSOLIDATED FINANCIAL STATEMENTS
Note 19. Segment Reporting (continued)
| Year Ended December 31, 2009 | ||||||||||||||||||||
| Hancock | Whitney | Other | Eliminations | Consolidated | ||||||||||||||||
| Interest income |
$ | 167,114 | $ | 138,767 | $ | 23,931 | $ | (6,085 | ) | $ | 323,727 | |||||||||
| Interest expense |
(66,210 | ) | (29,772 | ) | (4,942 | ) | 5,624 | (95,300 | ) | |||||||||||
|
|
|
|
|
|
|
|
|
|
|
|||||||||||
| Net interest income |
100,904 | 108,995 | 18,989 | (461 | ) | 228,427 | ||||||||||||||
| Provision for loan losses |
(29,513 | ) | (18,398 | ) | (6,679 | ) | — | (54,590 | ) | |||||||||||
| Noninterest income |
90,109 | 42,321 | 25,177 | (280 | ) | 157,327 | ||||||||||||||
| Depreciation and amortization |
(11,485 | ) | (3,467 | ) | (597 | ) | — | (15,549 | ) | |||||||||||
| Other noninterest expense |
(106,860 | ) | (81,850 | ) | (29,310 | ) | 99 | (217,921 | ) | |||||||||||
|
|
|
|
|
|
|
|
|
|
|
|||||||||||
| Income before income taxes |
43,155 | 47,601 | 7,580 | (642 | ) | 97,694 | ||||||||||||||
| Income tax expense (benefit) |
9,149 | 12,866 | 904 | — | 22,919 | |||||||||||||||
|
|
|
|
|
|
|
|
|
|
|
|||||||||||
| Net income (loss) |
$ | 34,006 | $ | 34,735 | $ | 6,676 | $ | (642 | ) | $ | 74,775 | |||||||||
|
|
|
|
|
|
|
|
|
|
|
|||||||||||
| Goodwill |
$ | 23,386 | $ | 33,763 | $ | 5,128 | $ | — | $ | 62,277 | ||||||||||
| Total assets |
$ | 5,789,737 | $ | 2,890,341 | $ | 1,114,826 | $ | (1,097,821 | ) | $ | 8,697,083 | |||||||||
|
|
|
|
|
|
|
|
|
|
|
|||||||||||
| Total interest income from affiliates |
$ | 6,085 | $ | — | $ | — | $ | (6,085 | ) | $ | — | |||||||||
| Total interest income from external customers |
$ | 161,029 | $ | 138,767 | $ | 23,931 | $ | — | $ | 323,727 | ||||||||||
Consolidated other intangible assets totaled $211.1 million and $13.2 million, respectively, at December 31, 2011 and 2010. The balance at the end of 2011 consisted of core deposit intangibles of $178.4 million and other identifiable intangible assets of $32.7 million. The total was allocated $201.4 million to the Whitney segment, $9.4 million to the Hancock segment, and $0.3 million to the Other segment. Total other intangible assets at the end of 2010 consisted of core deposit intangibles of $13.2 million and other identifiable intangibles assets of $0.3 million. The 2010 total was allocated $1.7 million to Whitney, $11.1 million to Hancock, and $0.7 million to the Other segment. The increase in other intangible assets allocated to Whitney in 2011 was related to the Whitney acquisition as detailed in Note 2.
122
Table of Contents
HANCOCK HOLDING COMPANY AND SUBSIDIARIES
NOTES TO CONSOLIDATED FINANCIAL STATEMENTS
Note 20. Condensed Parent Company Information
The following condensed financial statements reflect the accounts and transactions of Hancock Holding Company only (in thousands):
| Condensed Balance Sheets | ||||||||
| December 31, | ||||||||
| 2011 | 2010 | |||||||
| Assets: |
||||||||
| Cash |
$ | 28,015 | $ | 787 | ||||
| Investment in bank subsidiaries |
2,358,368 | 833,965 | ||||||
| Securities available for sale |
103,788 | — | ||||||
| Investment in non-bank subsidiaries |
10,222 | 20,798 | ||||||
| Due from subsidiaries and other assets |
9,014 | 1,567 | ||||||
|
|
|
|
|
|||||
| $ | 2,509,407 | $ | 857,117 | |||||
|
|
|
|
|
|||||
| Liabilities and Stockholders’ Equity: |
||||||||
| Due to subsidiaries |
$ | 158 | $ | 569 | ||||
| Long term debt |
140,000 | — | ||||||
| Other liabilities |
2,086 | — | ||||||
| Stockholders’ equity |
2,367,163 | 856,548 | ||||||
|
|
|
|
|
|||||
| $ | 2,509,407 | $ | 857,117 | |||||
|
|
|
|
|
|||||
| Condensed Statements of Income | ||||||||||||
| Years Ended December 31, | ||||||||||||
| 2011 | 2010 | 2009 | ||||||||||
| Operating Income |
||||||||||||
| From subsidiaries |
||||||||||||
| Dividends received from bank subsidiaries |
$ | 123,100 | $ | 41,500 | $ | 36,700 | ||||||
| Dividends received from non-bank subsidiaries |
— | — | — | |||||||||
| Equity in earnings of subsidiaries greater than (less than) dividends received |
(43,721 | ) | 10,471 | 38,161 | ||||||||
|
|
|
|
|
|
|
|||||||
| Total operating income |
79,379 | 51,971 | 74,861 | |||||||||
| Other (expense) income |
(2,592 | ) | 342 | (178 | ) | |||||||
| Income tax provision (benefit) |
28 | 107 | (92 | ) | ||||||||
|
|
|
|
|
|
|
|||||||
| Net income |
$ | 76,759 | $ | 52,206 | $ | 74,775 | ||||||
|
|
|
|
|
|
|
|||||||
123
Table of Contents
HANCOCK HOLDING COMPANY AND SUBSIDIARIES
NOTES TO CONSOLIDATED FINANCIAL STATEMENTS
Note 20. Condensed Parent Company Information (continued)
Condensed Statements of Cash Flows
| Years Ended December 31, | ||||||||||||
| 2011 | 2010 | 2009 | ||||||||||
| Cash flows from operating activities—principally dividends received from subsidiaries |
$ | 113,355 | $ | 31,241 | $ | 36,743 | ||||||
|
|
|
|
|
|
|
|||||||
| Net cash (used in) provided by operating activities |
113,355 | 31,241 | 36,743 | |||||||||
|
|
|
|
|
|
|
|||||||
| Cash flows from investing activities—contribution of capital to subsidiary |
(233 | ) | (454 | ) | (181,798 | ) | ||||||
| Purchase of available for sale securities |
(103,432 | ) | — | — | ||||||||
| Proceeds of securities available for sale |
1,396 | — | — | |||||||||
| Cash paid in connection with business combination |
(275,563 | ) | — | — | ||||||||
|
|
|
|
|
|
|
|||||||
| Net cash used by investing activities |
(377,832 | ) | (454 | ) | (181,798 | ) | ||||||
|
|
|
|
|
|
|
|||||||
| Cash flows from financing activities: |
||||||||||||
| Proceeds from issuance of long term debt |
140,000 | — | — | |||||||||
| Dividends paid to stockholders |
(70,617 | ) | (36,182 | ) | (32,011 | ) | ||||||
| Stock transactions, net |
222,322 | 5,876 | 173,319 | |||||||||
|
|
|
|
|
|
|
|||||||
| Net cash used by financing activities |
291,705 | (30,306 | ) | 141,308 | ||||||||
|
|
|
|
|
|
|
|||||||
| Net increase (decrease) in cash |
27,228 | 481 | (3,747 | ) | ||||||||
| Cash, beginning of year |
787 | 306 | 4,053 | |||||||||
|
|
|
|
|
|
|
|||||||
| Cash, end of year |
$ | 28,015 | $ | 787 | $ | 306 | ||||||
|
|
|
|
|
|
|
|||||||
124
Table of Contents
| ITEM 9A. | CONTROLS AND PROCEDURES |
Evaluation of Disclosure Controls and Procedures
As defined by the Securities and Exchange Commission in Exchange Act Rules 13a-14(c) and 15d-14(c), a company’s “disclosure controls and procedures” means controls and other procedures of an issuer that are designed to ensure that information required to be disclosed by the issuer in the reports that it files or submits under the Exchange Act is recorded, processed, summarized and reported, within time periods specified in the Commission’s rules and forms.
As of December 31, 2011, (the “Evaluation Date”), our Chief Executive Officers and Chief Financial Officer have evaluated the effectiveness of our disclosure controls and procedures as defined in the Exchange Act Rules. Based on their evaluation, our Chief Executive Officers and Chief Financial Officer have concluded Hancock’s disclosure controls and procedures are effective to ensure that material information relating to us and required to be disclosed by us in the reports that we file or submit under the Exchange Act is recorded, processed, summarized and reported within the time periods specified in the Commission’s rules and forms.
Internal Control over Financial Reporting
The management of Hancock Holding Company has prepared the consolidated financial statements and other information in our Annual Report in accordance with accounting principles generally accepted in the United States of America and is responsible for its accuracy. The financial statements necessarily include amounts that are based on management’s best estimates and judgments. In meeting its responsibility, management relies on internal accounting and related control systems. The internal control systems are designed to ensure that transactions are properly authorized and recorded in our financial records and to safeguard our assets from material loss or misuse. Such assurance cannot be absolute because of inherent limitations in any internal control system.
Management is responsible for establishing and maintaining adequate internal control over financial reporting, as such term is defined in the Exchange Act Rules 13 – 15(f). Under the supervision and with the participation of management, including our principal executive officers and principal financial officer, we conducted an evaluation of the effectiveness of internal control over financial reporting based on the framework in Internal Control – Integrated Framework issued by the Committee of Sponsoring Organizations of the Treadway Commission. Management also conducted an assessment of requirements pertaining to Section 112 of the Federal Deposit Insurance Corporation Improvement Act (FDICIA). This section relates to management’s evaluation of internal control over financial reporting including controls over the preparation of the schedules equivalent to the basic financial statements and compliance with laws and regulations. Our evaluation included a review of the documentation of controls, evaluations of the design of the internal control system and tests of the effectiveness of internal controls. There were no changes in Hancock’s internal control over financial reporting at December 31, 2011 that materially affected, or were reasonable likely to materially affect Hancock’s internal control over financial reporting.
Based on our evaluation under the framework in Internal Control – Integrated Framework, management concluded that internal control over financial reporting was effective as of December 31, 2011. PricewatershouseCoopers LLP, under Auditing Standard No. 5, does not express an opinion on management’s assessment as occurred under Auditing Standard No. 2. Under Auditing Standard No. 5 management is responsible for maintaining effective internal control over financial reporting and for its assessment of the effectiveness of internal control over financial reporting. PricewatershouseCoopers’ responsibility is to express an opinion on the effectiveness of the Company’s internal control over financial reporting based on their audit.
| ITEM 9B. | OTHER INFORMATION |
None
125
Table of Contents
| ITEM 10. | DIRECTORS, EXECUTIVE OFFICERS AND CORPORATE GOVERNANCE |
Pursuant to General Instruction G (3), information on directors and executive officers of the Registrant will be incorporated by reference from the Company’s Definitive Proxy Statement for the annual meeting to be held on April 5, 2012.
| ITEM 11. | EXECUTIVE COMPENSATION |
Pursuant to General Instructions G (3), information on executive compensation will be incorporated by reference from the Company’s Definitive Proxy Statement for the annual meeting to be held on April 5, 2012.
| ITEM 12. | SECURITY OWNERSHIP OF CERTAIN BENEFICIAL OWNERS AND MANAGEMENT AND RELATED STOCKHOLDER MATTERS |
Pursuant to General Instructions G (3), information on security ownership of certain beneficial owners and management will be incorporated by reference from the Company’s Definitive Proxy Statement for the annual meeting to be held on April 5, 2012.
| ITEM 13. | CERTAIN RELATIONSHIPS AND RELATED TRANSACTIONS, AND DIRECTOR INDEPENDENCE |
Pursuant to General Instructions G (3), information on certain relationships and related transactions will be incorporated by reference from the Company’s Definitive Proxy Statement for the annual meeting to be held on April 5, 2012.
| ITEM 14. | PRINCIPAL ACCOUNTANT FEES AND SERVICES |
Pursuant to General Instructions G (3), information on principal accountant fees and services will be incorporated by reference from the Company’s Definitive Proxy Statement for the annual meeting to be held on April 5, 2012.
| ITEM 15. | EXHIBITS, FINANCIAL STATEMENT SCHEDULES |
| (a) | The following documents are filed as part of this report: |
| 1. | The following consolidated financial statements of Hancock Holding Company and subsidiaries are filed as part of this report under Item 8 – Financial Statements and Supplementary Data: |
Consolidated balance sheets – December 31, 2011 and 2010
Consolidated statements of income – Years ended December 31, 2011, 2010, and 2009
Consolidated statements of changes in stockholders’ equity – Years ended December 31, 2011, 2010, and 2009
Consolidated statements of cash flows –Years ended December 31, 2011, 2010, and 2009
Notes to consolidated financial statements – December 31, 2011 (pages 66 to 124)
| 2. | Financial schedules required to be filed by Item 8 of this form, and by Item 15(d) below: |
The schedules to the consolidated financial statements set forth by Article 9 of Regulation S-X are not required under the related instructions or are inapplicable and therefore have been omitted.
126
Table of Contents
| 3. | Exhibits required to be filed by Item 601 of Regulation S-K, and by Item 15(b) below. |
(b) Exhibits:
All other financial statements and schedules are omitted as the required information is inapplicable or the required information is presented in the consolidated financial statements or related notes.
| (a) | 3. Exhibits: |
| Exhibit Number |
Description | |||
| 2.1 | Agreement and Plan of Merger between Hancock Holding Company and Lamar Capital Corporation dated February 21, 2001 (Appendix C to the Prospectus contained in the S-4 Registration Statement 333-60280 filed on May 4, 2001 and incorporated by reference herein). | |||
| 3.1 | Amended and Restated Articles of Incorporation dated November 8, 1990 (filed as Exhibit 3.1 to the Registrant’s Form 10-K for the year ended December 31, 1990 and incorporated herein by reference). | |||
| 3.2 | Amended and Restated Bylaws of the Company as of July 17, 2007. | |||
| 3.3 | Articles of Amendment to the Articles of Incorporation of Hancock Holding Company, dated October 16, 1991 (filed as Exhibit 4.1 to the Registrant’s Form 10-Q for the quarter ended September 30, 1991). | |||
| 3.4 | Articles of Correction, filed with Mississippi Secretary of State on November 15, 1991 (filed as Exhibit 4.2 to the Registrant’s Form 10-Q for the quarter ended September 30, 1991). | |||
| 3.5 | Articles of Amendment to the Articles of Incorporation of Hancock Holding Company, adopted February 13, 1992 (filed as Exhibit 3.5 to the Registrant’s Form 10-K for the year ended December 31, 1992 and incorporated herein by reference). | |||
| 3.6 | Articles of Correction, filed with Mississippi Secretary of State on March 2, 1992 (filed as Exhibit 3.6 to the Registrant’s Form 10-K for the year ended December 31, 1992 and incorporated herein by reference). | |||
| 3.7 | Articles of Amendment to the Articles of Incorporation adopted February 20, 1997 (filed as Exhibit 3.7 to the Registrant’s Form 10-K for the year ended December 31, 1996 and incorporated herein by reference). | |||
| 4.1 | Specimen stock certificate (reflecting change in par value from $10.00 to $3.33, effective March 6, 1989) (filed as Exhibit 4.1 to the Registrant’s Form 10-Q for the quarter ended March 31, 1989 and incorporated herein by reference). | |||
| 4.2 | By executing this Form 10-K, the Registrant hereby agrees to deliver to the Commission upon request copies of instruments defining the rights of holders of long-term debt of the Registrant or its consolidated subsidiaries or its unconsolidated subsidiaries for which financial statements are required to be filed, where the total amount of such securities authorized thereunder does not exceed 10 percent of the total assets of the Registrant and its subsidiaries on a consolidated basis. | |||
| *10.1 | 1996 Long Term Incentive Plan (filed as Exhibit 10.1 to the Registrant’s Form 10-K for the year ended December 31, 1995, and incorporated herein by reference). | |||
| *10.2 | Description of Hancock Bank Executive Supplemental Reimbursement Plan, as amended (filed as Exhibit 10.2 to the Registrant’s Form 10-K for the year ended December 31, 1996, and incorporated herein by reference). | |||
| *10.3 | Description of Hancock Bank Automobile Plan (filed as Exhibit 10.3 to the Registrant's Form 10-K for the year ended December 31, 1996, and incorporated herein by reference). | |||
127
Table of Contents
| *10.4 | Description of Deferred Compensation Arrangement for Directors (filed as Exhibit 10.4 to the Registrant’s Form 10-K for the year ended December 31, 1996, and incorporated herein by reference). | |||
| 10.5 | Hancock Holding Company 2005 Long-Term Incentive Plan, filed as Appendix “A” to the Company’s Definitive Proxy Statement filed with the Commission on February 28, 2005 and incorporated herein by reference. | |||
| 10.6 | Hancock Holding Company Nonqualified Deferred Compensation Plan, filed as Exhibit 99.1 to the Company’s Current Report on Form 8-K filed with the Commission on December 21, 2005 and incorporated herein by reference. | |||
| 10.7 | Shareholder Rights Agreement dated as of February 21, 1997, between Hancock Holding Company and Hancock Bank, as Rights Agent (as extended by the Company), attached as Exhibit 1 to Form 8-A12G filed with the Commission on February 27, 1997, as extended by Amendment No. 1 filed with the Commission as Exhibit 4.1 to Form 8-K filed with the Commission on February 20, 2007, both of which are incorporated herein by reference. | |||
| 10.8 | Purchase and Assumption Agreement (“Agreement”) with the Federal Deposit Insurance Corporation, Receiver of Peoples First Community Bank, Panama City Florida (“PCFB”) and the Federal Deposit Insurance Corporation acting in its corporate capacity (“FDIC”) incorporated by reference to Exhibit 10.8 to the Registrant’s Annual Report on Form 10-K filed February 17, 2010. | |||
| 10.9 | Agreement and Plan of Merger between Hancock Holding Company and Whitney Holding Corporation dated as of December 21, 2010 (Exhibit 2.1 to the Company’s Current Report on Form 8-K filed with the Commission on December 23, 2010 and incorporated herein by reference.) | |||
| *10.10 | Hancock Holding Company 2010 Employee Stock Purchase Plan, filed as Exhibit 99.1 to the Company’s Current Report on Form 8-K filed with the Commission on January 5, 2011 and incorporated herein by reference. | |||
| 10.11 | Term Loan Agreement among the Company, certain lenders from time to time, and Suntrust Bank filed as Exhibit 10.11 to the Company’s Quarterly Report on Form 10-Q filed with the Commission on August 9, 2011 and incorporated herein by reference. | |||
| *10.12 | Form of Change in Control Employment Agreement between certain bank subsidiaries of the Company and certain Named Executive Officers. | |||
| *10.13 | Retention Agreement dated March 1, 2011 between Hancock Bank of Louisiana (n/k/a Whitney Bank) and Joseph S. Exnicious. | |||
| *10.14 | Retention Agreement dated March 31, 2011 between Hancock Bank of Louisiana (n/k/a Whitney Bank) and Suzanne Thomas. | |||
| 21 | Subsidiaries of Hancock Holding Company. | |||
| 22 | Proxy Statement for the Registrant’s Annual Meeting of Shareholders on March 29, 2007 (deemed “filed for the purposes of this Form 10-K only for those portions which are specifically incorporated herein by reference) | |||
| 23.1 | Consent of PricewaterhouseCoopers, LLP. | |||
Table of Contents
| 31.1 |
Certification of Chief Executive Officers pursuant to Rule 13a-14(a) and Rule 15d-14(a) of the Securities Exchange Act, as amended. | |
| 31.2 |
Certification of Chief Financial Officer pursuant to Rule 13a-14(a) and Rule 15d-14(a) of the Securities Exchange Act, as amended. | |
| 32.1 |
Certification of Chief Executive Officers Pursuant to 18 U.S.C. 1350, as adopted pursuant to Section 906 of the Sarbanes-Oxley Act of 2002. | |
| 32.2 |
Certification of Chief Financial Officer Pursuant to 18 U.S.C. 1350, as adopted pursuant to Section 906 of the Sarbanes-Oxley Act of 2002. | |
| 99.1 |
Chief Executive Officer Certification - IFR Section 30.15 | |
| 99.2 |
Chief Financial Officer Certification - IFR Section 30.15 | |
| 101.INS |
XBRL Instance Document | |
| 101.SCH |
XBRL Schema Document | |
| 101.CAL |
XBRL Calculation Document | |
| 101.LAB |
XBRL Label Link Document | |
| 101.PRE |
XBRL Presenation Linkbase Document | |
| 101.DEF |
XBRL Definition Linkbase Document | |
| * | Compensatory plan or arrangement. |
Table of Contents
SIGNATURES
Pursuant to the requirements of Section 13 or 15(d) of the Securities Exchange Act of 1934, the Registrant has duly caused this report to be signed on its behalf by the undersigned, thereunto duly authorized.
| HANCOCK HOLDING COMPANY | ||||||
| Registrant | ||||||
| Date February 28, 2012 |
By: | /s/ Carl J. Chaney | ||||
| Carl J. Chaney | ||||||
| President & Chief Executive Officer | ||||||
| Director | ||||||
| Date February 28, 2012 |
By: | /s/ John M. Hairston | ||||
| John M. Hairston | ||||||
| Chief Executive Officer & Chief Operating Officer | ||||||
| Director | ||||||
| Date February 28, 2012 |
By: | /s/ Michael M. Achary | ||||
| Michael M. Achary | ||||||
| Chief Financial Officer | ||||||
Pursuant to the requirements of the Securities Exchange Act of 1934, this report has been signed below by the following persons on behalf of the Registrant and in the capacities and on the dates indicated.
| /s/ James B. Estabrook, Jr James B. Estabrook, Jr. |
Chairman of the Board, Director |
February 28, 2012 | ||
| /s/ Alton G. Bankston Alton G. Bankston |
Director |
February 28, 2012 | ||
| /s/ Frank E. Bertucci Frank E. Bertucci |
Director |
February 28, 2012 | ||
| /s/ Don P. Descant Don P. Descant |
Director |
February 28, 2012 | ||
| /s/ Jerry Levens Jerry Levens |
Director |
February 28, 2012 | ||
| /s/ James H. Horne James H. Horne |
Director |
February 28, 2012 | ||
| (signatures continued) |
||||
Table of Contents
| /s/ John H. Pace John H. Pace |
Director |
February 28, 2012 | ||
| /s/ Christine L. Pickering Christine L. Pickering |
Director |
February 28, 2012 | ||
| /s/ Robert W. Roseberry Robert W. Roseberry |
Director |
February 28, 2012 | ||
| /s/ Anthony J. Topazi Anthony J. Topazi |
Director |
February 28, 2012 | ||
| /s/ Randy Hanna Randy Hanna |
Director |
February 28, 2012 | ||
| /s/ Thomas Olinde Thomas Olinde |
Director |
February 28, 2012 | ||
| /s/ Richard B. Crowell Richard B. Crowell |
Director |
February 28, 2012 | ||
| /s/ Hardy B. Fowler Hardy B. Fowler |
Director |
February 28, 2012 | ||
| /s/ Terence E. Hall Terence E. Hall |
Director |
February 28, 2012 | ||
| /s/ R. King Milling R. King Milling |
Director |
February 28, 2012 | ||
| /s/ Eric J. Nickelsen Eric J. Nickelsen |
Director |
February 28, 2012 | ||
Table of Contents
EXHIBIT INDEX
| Exhibit Number |
Description | |||
| 2.1 | Agreement and Plan of Merger between Hancock Holding Company and Lamar Capital Corporation dated February 21, 2001 (Appendix C to the Prospectus contained in the S-4 Registration Statement 333-60280 filed on May 4, 2001 and incorporated by reference herei | |||
| 3.1 | Amended and Restated Articles of Incorporation dated November 8, 1990 (filed as Exhibit 3.1 to the Registrant’s Form 10-K for the year ended December 31, 1990 and incorporated herein by reference). | |||
| 3.2 | Amended and Restated Bylaws of the Company as of July 17, 2007. | |||
| 3.3 | Articles of Amendment to the Articles of Incorporation of Hancock Holding Company, dated October 16, 1991 (filed as Exhibit 4.1 to the Registrant’s Form 10-Q for the quarter ended September 30, 1991). | |||
| 3.4 | Articles of Correction, filed with Mississippi Secretary of State on November 15, 1991 (filed as Exhibit 4.2 to the Registrant’s Form 10-Q for the quarter ended September 30, 1991). | |||
| 3.5 | Articles of Amendment to the Articles of Incorporation of Hancock Holding Company, adopted February 13, 1992 (filed as Exhibit 3.5 to the Registrant’s Form 10-K for the year ended December 31, 1992 and incorporated herein by reference). | |||
| 3.6 | Articles of Correction, filed with Mississippi Secretary of State on March 2, 1992 (filed as Exhibit 3.6 to the Registrant’s Form 10-K for the year ended December 31, 1992 and incorporated herein by reference). | |||
| 3.7 | Articles of Amendment to the Articles of Incorporation adopted February 20, 1997 (filed as Exhibit 3.7 to the Registrant’s Form 10-K for the year ended December 31, 1996 and incorporated herein by reference). | |||
| 4.1 | Specimen stock certificate (reflecting change in par value from $10.00 to $3.33, effective March 6, 1989) (filed as Exhibit 4.1 to the Registrant’s Form 10-Q for the quarter ended March 31, 1989 and incorporated herein by reference). | |||
| 4.2 | By executing this Form 10-K, the Registrant hereby agrees to deliver to the Commission upon request copies of instruments defining the rights of holders of long-term debt of the Registrant or its consolidated subsidiaries or its unconsolidated subsidiarie | |||
| *10.1 | 1996 Long Term Incentive Plan (filed as Exhibit 10.1 to the Registrant's Form 10-K for the year ended December 31, 1995, and incorporated herein by reference). | |||
| *10.2 | Description of Hancock Bank Executive Supplemental Reimbursement Plan, as amended (filed as Exhibit 10.2 to the Registrant’s Form 10-K for the year ended December 31, 1996, and incorporated herein by reference). | |||
| *10.3 | Description of Hancock Bank Automobile Plan (filed as Exhibit 10.3 to the Registrant’s Form 10-K for the year ended December 31, 1996, and incorporated herein by reference). | |||
Table of Contents
| *10.4 | Description of Deferred Compensation Arrangement for Directors (filed as Exhibit 10.4 to the Registrant’s Form 10-K for the year ended December 31, 1996, and incorporated herein by reference). | |||
| 10.5 | Hancock Holding Company 2005 Long-Term Incentive Plan, filed as Appendix “A” to the Company’s Definitive Proxy Statement filed with the Commission on February 28, 2005 and incorporated herein by reference. | |||
| 10.6 | Hancock Holding Company Nonqualified Deferred Compensation Plan, filed as Exhibit 99.1 to the Company’s Current Report on Form 8-K filed with the Commission on December 21, 2005 and incorporated herein by reference. | |||
| 10.7 | Shareholder Rights Agreement dated as of February 21, 1997, between Hancock Holding Company and Hancock Bank, as Rights Agent (as extended by the Company), attached as Exhibit 1 to Form 8-A12G filed with the Commission on February 27, 1997, as extended by Amendment No. 1 filed with the Commission as Exhibit 4.1 to Form 8-K filed with the Commission on February 20, 2007, both of which are incorporated herein by reference. | |||
| 10.8 | Purchase and Assumption Agreement (“Agreement”) with the Federal Deposit Insurance Corporation, Receiver of Peoples First Community Bank, Panama City Florida (“PCFB”) and the Federal Deposit Insurance Corporation acting in its corporate capacity (“FDIC”) incorporated by reference to Exhibit 10.8 to the Registrant's Annual Report on Form 10-K filed February 17, 2010. | |||
| 10.9 | Agreement and Plan of Merger between Hancock Holding Company and Whitney Holding Corporation dated as of December 21, 2010 (Exhibit 2.1 to the Company’s Current Report on Form 8-K filed with the Commission on December 23, 2010 and incorporated herein by reference.) | |||
| *10.10 | Hancock Holding Company 2010 Employee Stock Purchase Plan, filed as Exhibit 99.1 to the Company's Current Report on Form 8-K filed with the Commission on January 5, 2011 and incorporated herein by reference. | |||
| 10.11 | Term Loan Agreement among the Company, certain lenders from time to time, and Suntrust Bank filed as Exhibit 10.11 to the Company’s Quarterly Report on Form 10-Q filed with the Commission on August 9, 2011 and incorporated herein by reference. | |||
| *10.12 | Form of Change in Control Employment Agreement between certain bank subsidiaries of the Company and certain Named Executive Officers. | |||
| *10.13 | Retention Agreement dated March 1, 2011 between Hancock Bank of Louisiana (n/k/a Whitney Bank) and Joseph S. Exnicious. | |||
| *10.14 | Retention Agreement dated March 31, 2011 between Hancock Bank of Louisiana (n/k/a Whitney Bank) and Suzanne Thomas. | |||
| 21 | Subsidiaries of Hancock Holding Company. | |||
| 22 | Proxy Statement for the Registrant’s Annual Meeting of Shareholders on March 29, 2007 (deemed “filed for the purposes of this Form 10-K only for those portions which are specifically incorporated herein by reference) | |||
| 23.1 | Consent of PricewaterhouseCoopers, LLP. | |||
Table of Contents
| 31.1 |
Certification of Chief Executive Officers pursuant to Rule 13a-14(a) and Rule 15d-14(a) of the Securities Exchange Act, as amended. | |
| 31.2 |
Certification of Chief Financial Officer pursuant to Rule 13a-14(a) and Rule 15d-14(a) of the Securities Exchange Act, as amended. | |
| 32.1 |
Certification of Chief Executive Officers Pursuant to 18 U.S.C. 1350, as adopted pursuant to Section 906 of the Sarbanes-Oxley Act of 2002. | |
| 32.2 |
Certification of Chief Financial Officer Pursuant to 18 U.S.C. 1350, as adopted pursuant to Section 906 of the Sarbanes-Oxley Act of 2002. | |
| 99.1 |
Chief Executive Officer Certification - IFR Section 30.15 | |
| 99.2 |
Chief Financial Officer Certification - IFR Section 30.15 | |
| 101.INS |
XBRL Instance Document | |
| 101.SCH |
XBRL Schema Document | |
| 101.CAL |
XBRL Calculation Document | |
| 101.LAB |
XBRL Label Link Document | |
| 101.PRE |
XBRL Presenation Linkbase Document | |
| 101.DEF |
XBRL Definition Linkbase Document | |
| * | Compensatory plan or arrangement. |