Attached files
| file | filename |
|---|---|
| 8-K - 8-K - Agiliti Health, Inc. | a18-2553_18k.htm |
Forward looking statements Safe Harbor Statement under the Private Securities Litigation Reform Act of 1995: Universal Hospital Services, Inc. believes statements in this presentation looking forward in time involve risks and uncertainties based on management’s current views and assumptions. Actual events may differ materially. Please refer to the cautionary statement regarding forward-looking statements and risk factors that appear in the Company’s Annual Report on Form 10-K for the year ended December 31, 2016, and other filings with the SEC, which can be accessed at www.UHS.com.
We believe every interaction has the power to change a life.
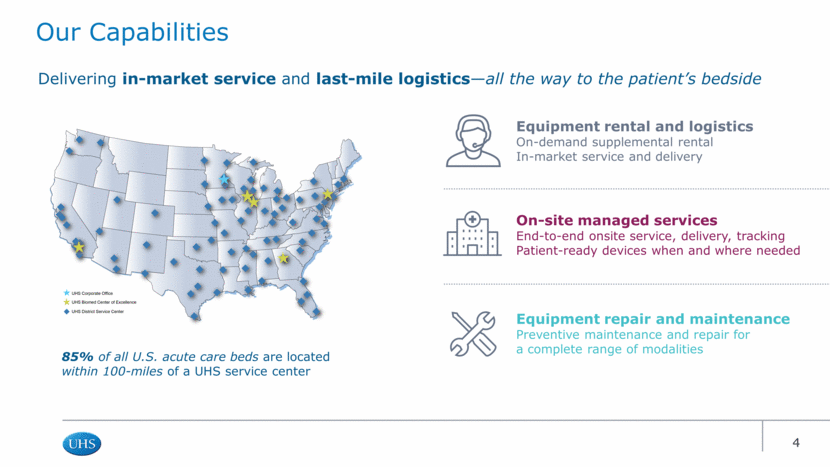
85% of all U.S. acute care beds are located within 100-miles of a UHS service center Equipment rental and logistics On-demand supplemental rental In-market service and delivery On-site managed services End-to-end onsite service, delivery, tracking Patient-ready devices when and where needed Equipment repair and maintenance Preventive maintenance and repair for a complete range of modalities Our Capabilities Delivering in-market service and last-mile logistics—all the way to the patient’s bedside
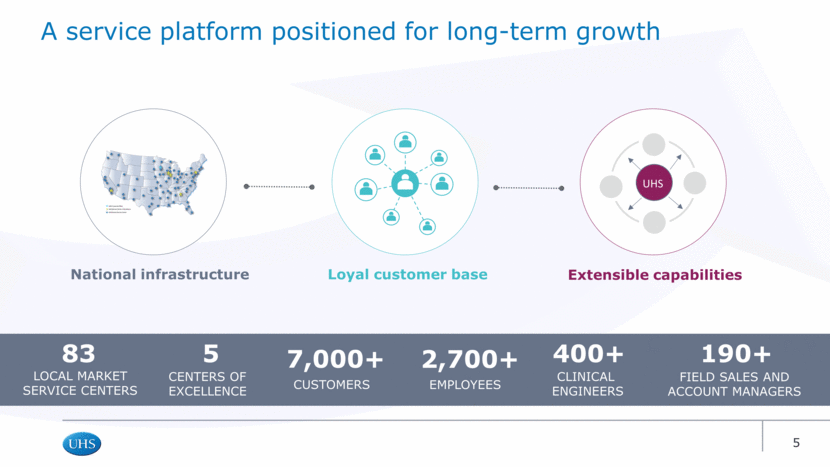
National infrastructure Loyal customer base Extensible capabilities A service platform positioned for long-term growth 83 5 7,000+ 2,700+ 400+ 190+ LOCAL MARKET SERVICE CENTERS CUSTOMERS CENTERS OF EXCELLENCE EMPLOYEES CLINICAL ENGINEERS FIELD SALES AND ACCOUNT MANAGERS UHS
We are creating a Category of One.
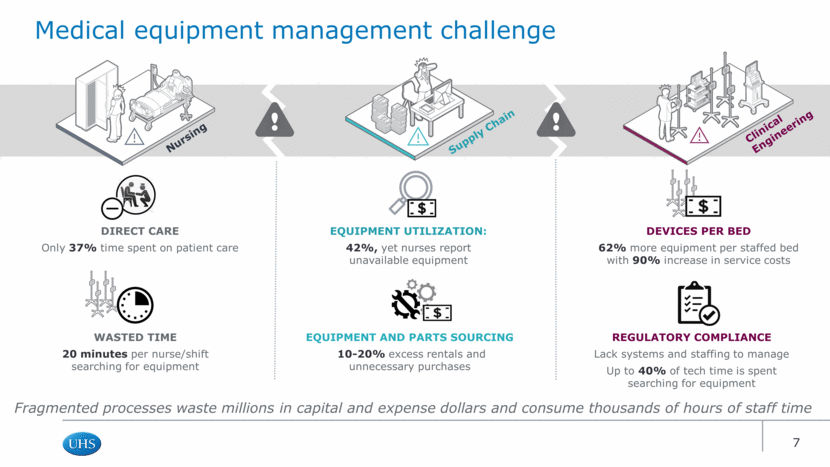
Fragmented processes waste millions in capital and expense dollars and consume thousands of hours of staff time Medical equipment management challenge Nursing Supply Chain Clinical Engineering DIRECT CARE Only 37% time spent on patient care EQUIPMENT UTILIZATION: 42%, yet nurses report unavailable equipment EQUIPMENT AND PARTS SOURCING 10-20% excess rentals and unnecessary purchases DEVICES PER BED 62% more equipment per staffed bed with 90% increase in service costs REGULATORY COMPLIANCE Lack systems and staffing to manage Up to 40% of tech time is spent searching for equipment WASTED TIME 20 minutes per nurse/shift searching for equipment
Clinical Engineering Programs On-Site Managed Programs Rental & Capital Management Programs UHS solution — Equipment Value Management End-to-end managed services provide the right equipment, in the right place, at the right time — with measurably lower costs of ownership EQUIPMENT UTILIZATION 30-40% improvement RENTAL & CAPITAL COSTS 10-30% annual savings OVERALL SERVICE COSTS 10-20% reduction
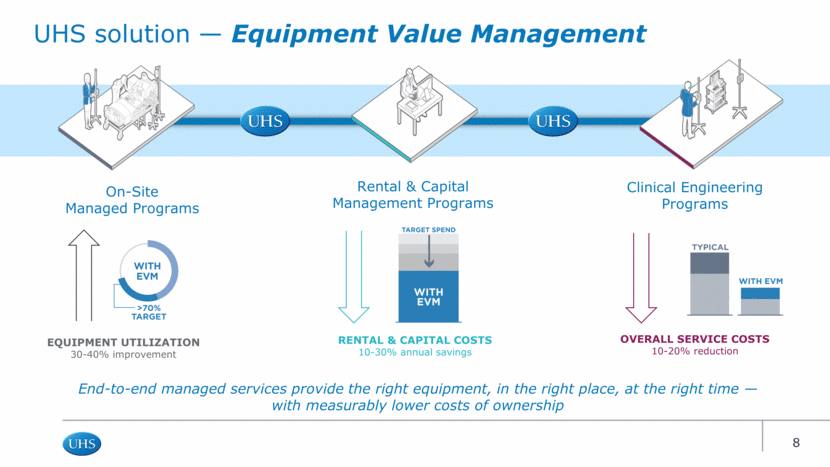
EQUIPMENT VALUE MANAGEMENT On-site Managed Programs Clinical Engineering Programs Equipment Rental Programs On-site Logistics Equipment tracking Safety/ compliance check National supplemental staffing (BMET) General biomed modality Imaging modality Medical & surgical rentals Quality system (ISO 13485) National footprint UHS Diversified manufacturers GE, Siemens Hill-Rom, Joerns Diversified services Aramark, Sodexo, Crothall Niche companies Freedom Medical, US Med-Equip Trimedx, BC Technical Comparison based on publicly available information Partial, unknown or unavailable UHS – category leader without obvious peer
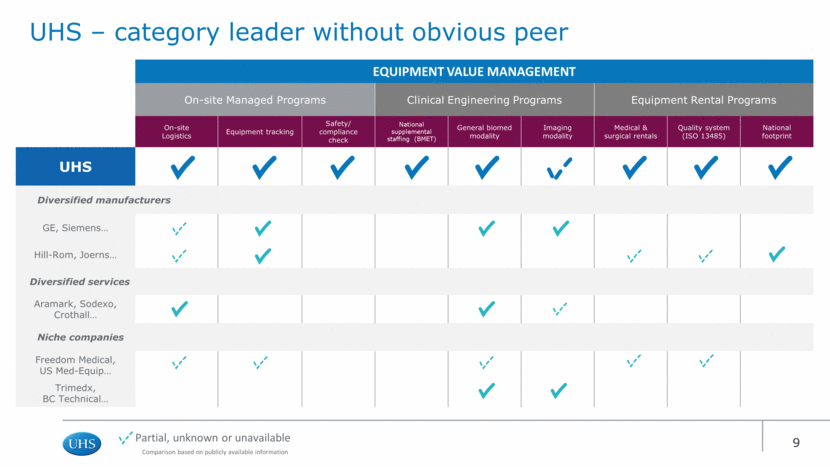
UHS participates in a $12B U.S. market opportunity Currently, acute care hospitals contract for more than $4.5B of annual spend across equipment rental, on-site management and clinical engineering services In the last 12 months, UHS generated $504M* in revenue, capturing just 11% of the current market UHS enjoys 17% share-of-wallet in its customer base, with significant opportunity for sustained above-market growth Significant opportunities for long-term growth *2017 Q3 LTM
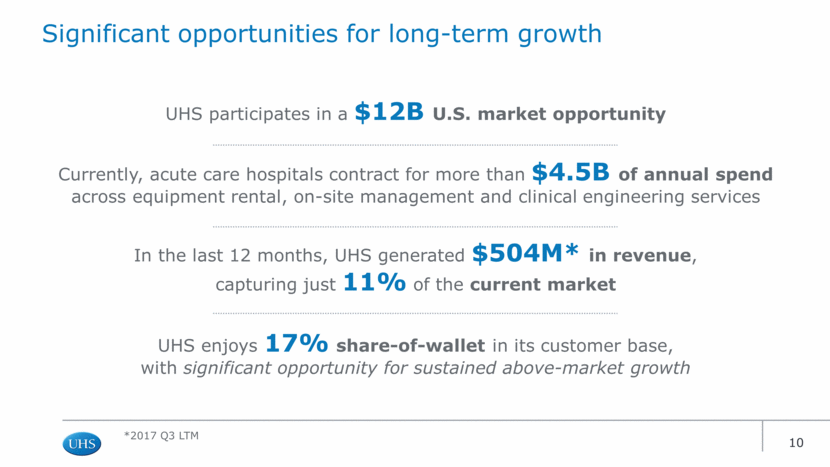
Focus on our People Engaged employees create highly satisfied Customers Happy Customers are the easiest and lowest cost customers to acquire Sales drives growth, and growth creates new opportunities for our People Why are we focused on share-of-wallet? Because we have a simple model for long-term value creation 1 2 3 4
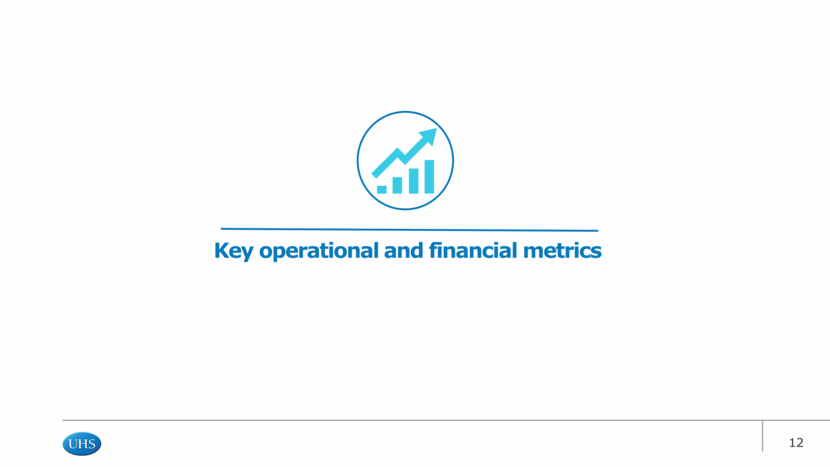
Key operational and financial metrics [icon]
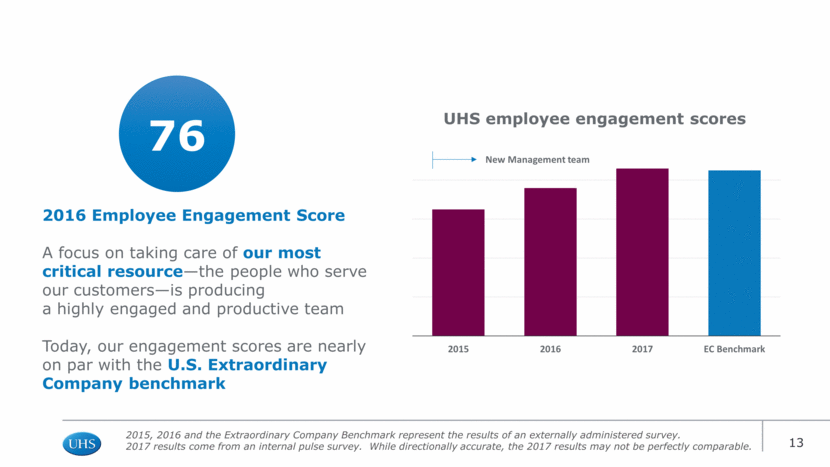
2016 Employee Engagement Score A focus on taking care of our most critical resource—the people who serve our customers—is producing a highly engaged and productive team Today, our engagement scores are nearly on par with the U.S. Extraordinary Company benchmark 2015, 2016 and the Extraordinary Company Benchmark represent the results of an externally administered survey. 2017 results come from an internal pulse survey. While directionally accurate, the 2017 results may not be perfectly comparable. UHS employee engagement scores 65 76 85 76 New Management team 2015 2016 2017 EC Benchmark
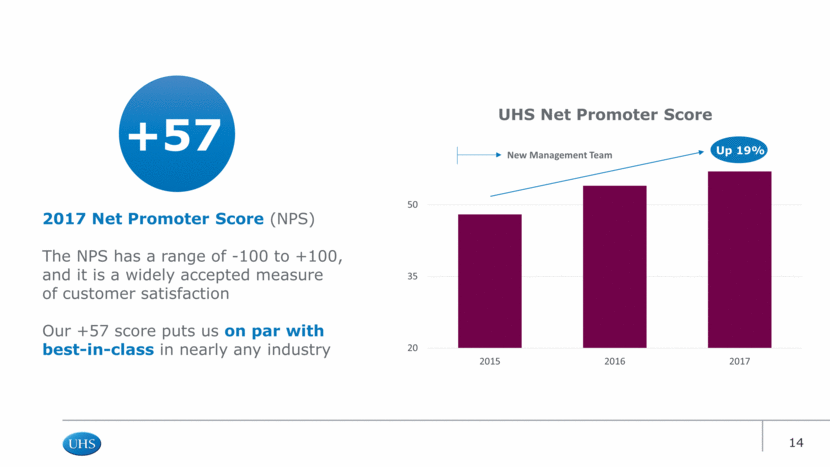
+57 2017 Net Promoter Score (NPS) The NPS has a range of -100 to +100, and it is a widely accepted measure of customer satisfaction Our +57 score puts us on par with best-in-class in nearly any industry UHS Net Promoter Score Up 19% New Management Team 20 35 50 2015 2016 2017
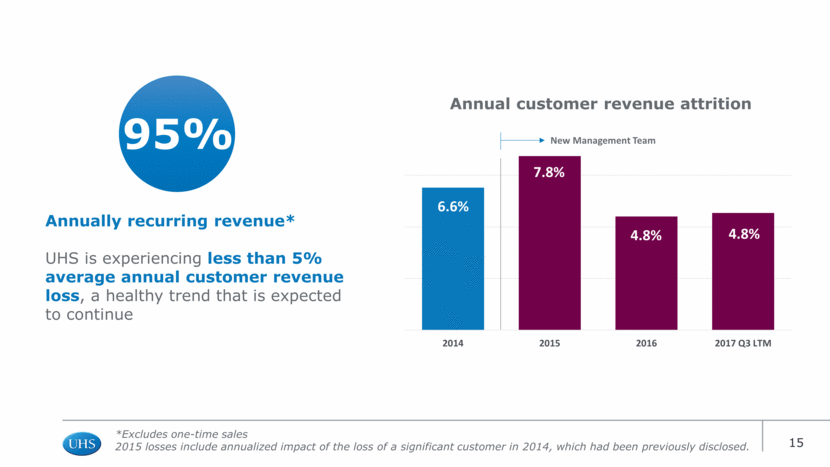
Annually recurring revenue* UHS is experiencing less than 5% average annual customer revenue loss, a healthy trend that is expected to continue *Excludes one-time sales 2015 losses include annualized impact of the loss of a significant customer in 2014, which had been previously disclosed. Annual customer revenue attrition 6.6% 7.8% 4.8% 4.8% 95% 7.8% 4.8% 4.8% New Management Team 2014 2015 2016 2017 Q3 LTM
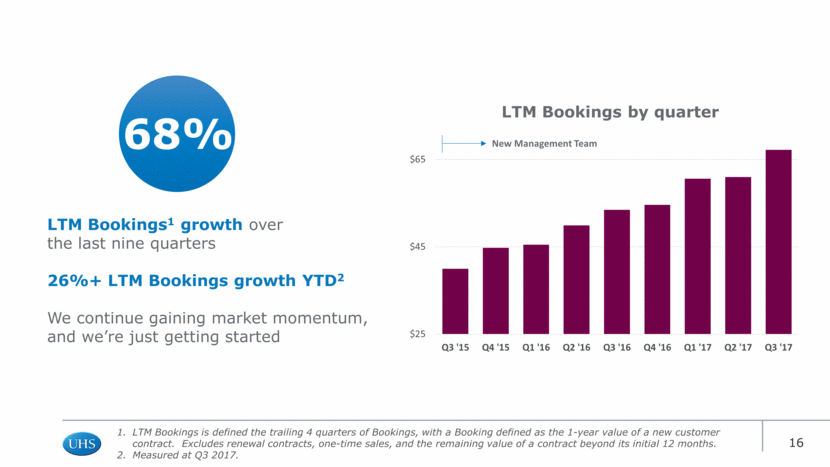
LTM Bookings1 growth over the last nine quarters 26%+ LTM Bookings growth YTD2 We continue gaining market momentum, and we’re just getting started LTM Bookings is defined the trailing 4 quarters of Bookings, with a Booking defined as the 1-year value of a new customer contract. Excludes renewal contracts, one-time sales, and the remaining value of a contract beyond its initial 12 months. Measured at Q3 2017. LTM Bookings by quarter 68% New Management Team $25 $45 $65 Q3 '15 Q4 '15 Q1 '16 Q2 '16 Q3 '16 Q4 '16 Q1 '17 Q2 '17 Q3 '17
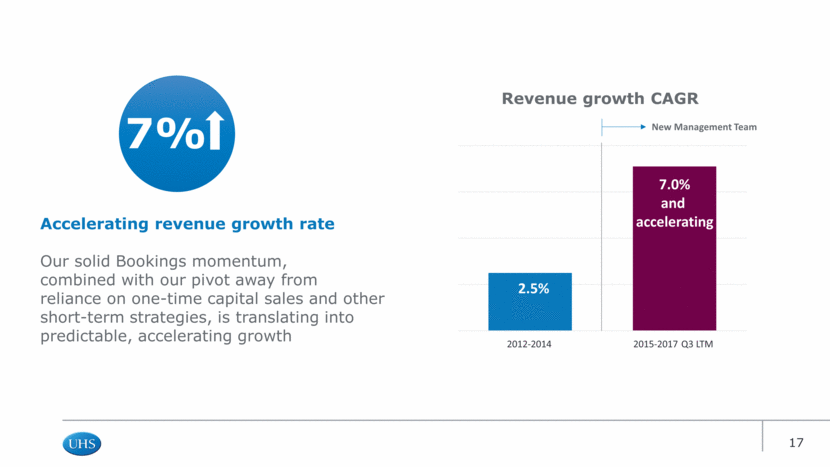
Accelerating revenue growth rate Our solid Bookings momentum, combined with our pivot away from reliance on one-time capital sales and other short-term strategies, is translating into predictable, accelerating growth Revenue growth CAGR 7.8% 4.8% 4.8% 7.8% 4.8% 4.8% 2.5% 7.0% and accelerating 7% 2012-2014 2015-2017 Q3 LTM New Management Team
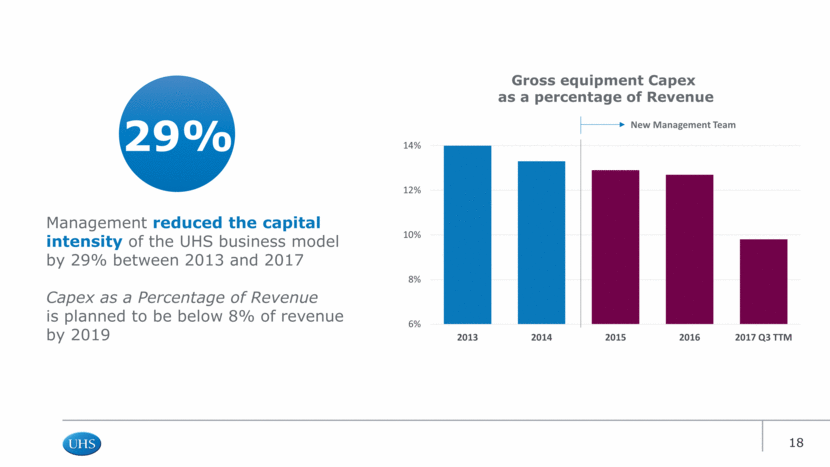
Management reduced the capital intensity of the UHS business model by 29% between 2013 and 2017 Capex as a Percentage of Revenue is planned to be below 8% of revenue by 2019 Gross equipment Capex as a percentage of Revenue 29% New Management Team 6% 8% 10% 12% 14% 2013 2014 2015 2016 2017 Q3 TTM
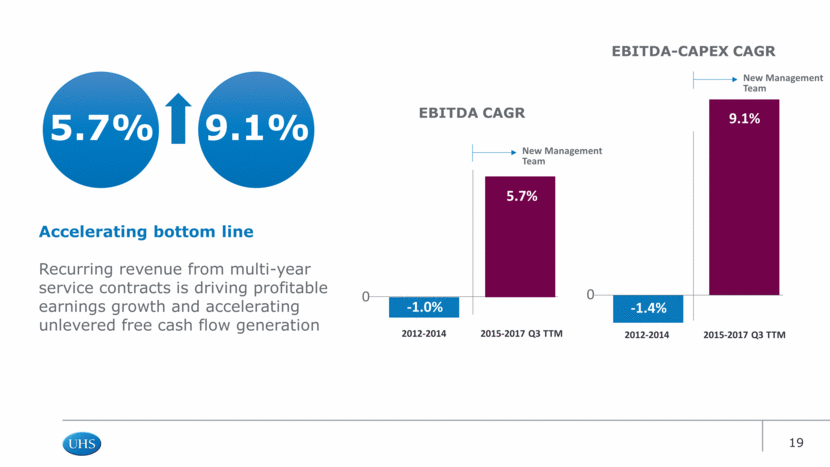
Accelerating bottom line Recurring revenue from multi-year service contracts is driving profitable earnings growth and accelerating unlevered free cash flow generation EBITDA CAGR 4.8% 4.8% 4.8% 7.1% and accelerating -1.4% 10.0% 0 -1.0% 5.7% 2012-2014 2015-2017 Q3 TTM 5.7% 9.1% EBITDA-CAPEX CAGR 2012-2014 2015-2017 Q3 TTM 0 -1.4% 9.1% New Management Team New Management Team
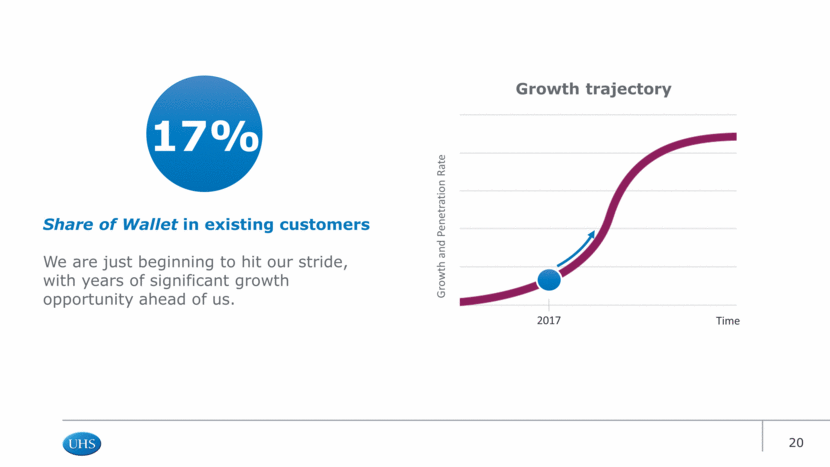
Share of Wallet in existing customers We are just beginning to hit our stride, with years of significant growth opportunity ahead of us. 17% Growth trajectory Growth and Penetration Rate Time 2017
Looking forward
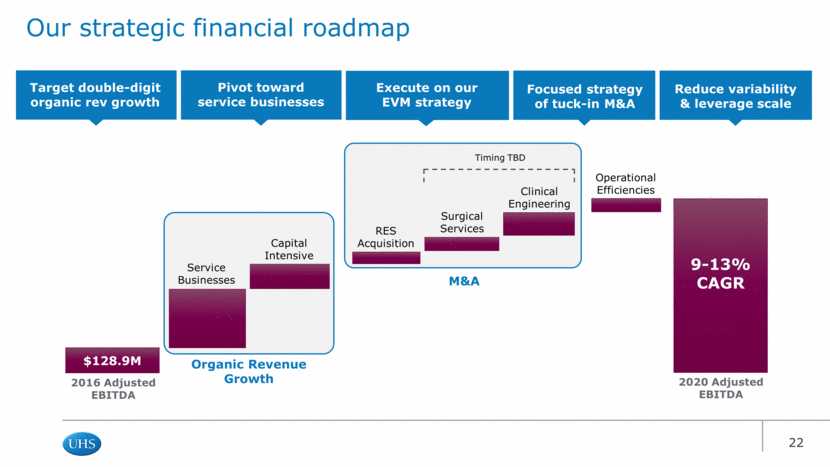
Our strategic financial roadmap $128.9M 9-13% CAGR 2016 Adjusted EBITDA 2020 Adjusted EBITDA Organic Revenue Growth Service Businesses Capital Intensive M&A Timing TBD Surgical Services Clinical Engineering RES Acquisition Operational Efficiencies Target double-digit organic rev growth Pivot toward service businesses Execute on our EVM strategy Focused strategy of tuck-in M&A Reduce variability & leverage scale
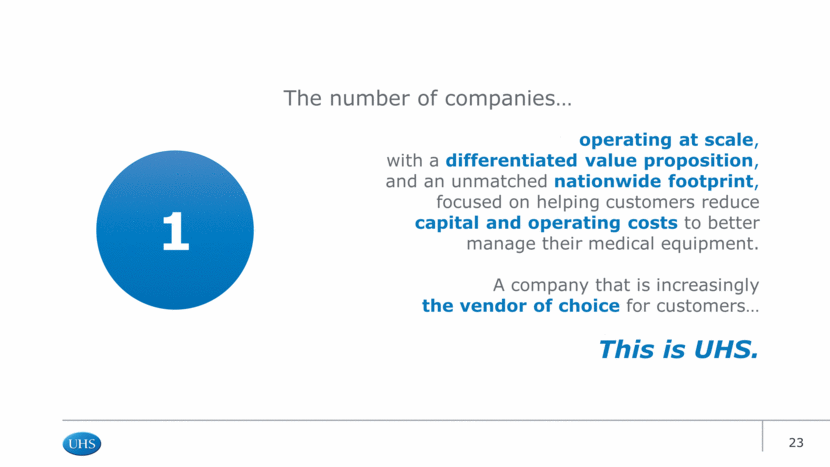
1 The number of companies operating at scale, with a differentiated value proposition, and an unmatched nationwide footprint, focused on helping customers reduce capital and operating costs to better manage their medical equipment. A company that is increasingly the vendor of choice for customers This is UHS.
Thank you.
