Attached files
| file | filename |
|---|---|
| EX-99.1 - EX-99.1 - Williams Industrial Services Group Inc. | ex-99d1.htm |
| 8-K - 8-K - Williams Industrial Services Group Inc. | f8-k.htm |
Exhibit 99.2
|
|
December 20, 2017 First Half 2017 Financial Results and Strategic Update Craig E. Holmes Co-President, Co-CEO Tracy Pagliara Co-President, Co-CEO Erin Gonzalez CFO |
|
|
Goal: Improve Liquidity 2 Aggressive, proactive efforts to address challenges Strategic initiatives: Divested Mechanical Solutions Significantly reducing debt Initiating strategic alternatives process for Electrical Solutions Services segment: Expand capabilities and build pipeline Leverage highly respected brand, broad set of service offerings and highly experienced team Liquidity focus: Working capital, operating expenses |
|
|
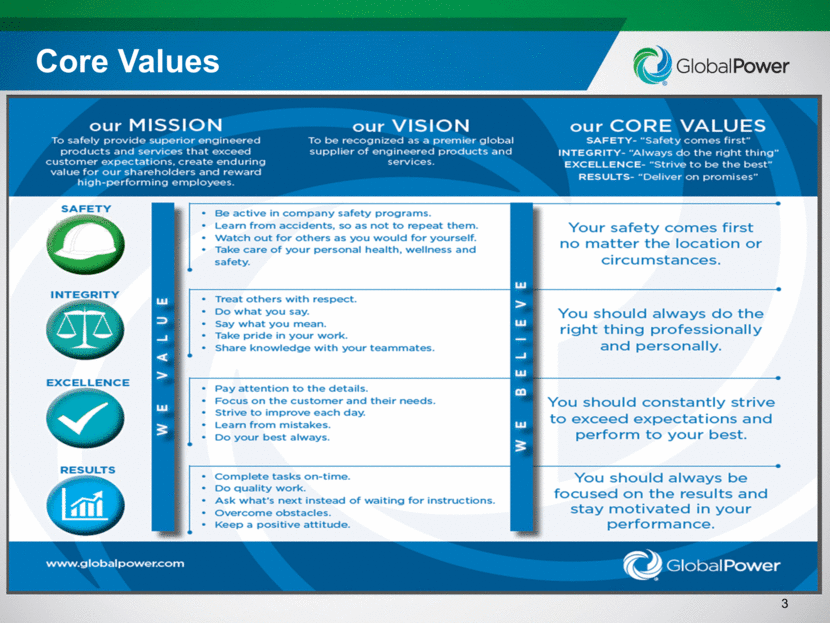
Core Values our MISSION To safely provide superior engineered products and services that exceed customer expectations, create enduring value for our shareholders and reward high-performing employees. Our VISION To be recognized as a premier global supplier of engineered products and services. our CORE VALUES SAFETY- “Safety comes first” INTEGRITY- “Always do the right thing” EXCELLENCE- “Strive to be the best” RESULTS- “Deliver on promises” SAFETY INTEGRITY EXCELLENCE RESULTS Be active in company safety programs. Learn from accidents, so as not to repeat them. Watch out for others as you would for yourself. Take care of your personal health, wellness and safety. Your safety comes first no matter the location or circumstances. Treat others with respect. Do what you say. Say what you mean. Take pride in your work. Share knowledge with your teammates. You should always do the right thing professionally and personally. Pay attention to the details. Focus on the customer and their needs. Strive to improve each day. Learn from mistakes. Do you best always. You should constantly strive to exceed expectations and perform to your best. Complete tasks on-time. Do quality work. Ask what’s next instead of waiting for instructions. Overcome obstacles. Keep a positive attitude. You should always be focused on the results and stay motivated in your performance. www.globalpower.com 3
|
|
|
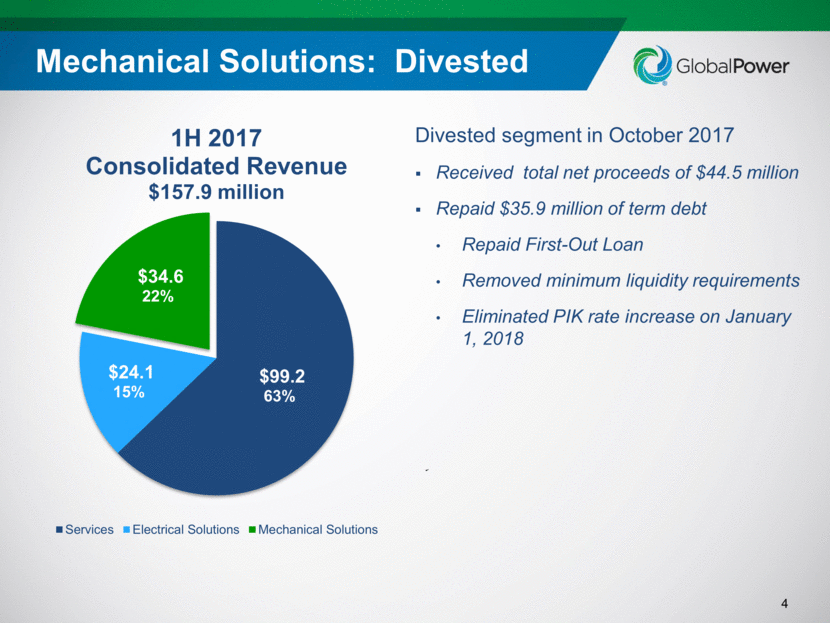
4 Divested segment in October 2017 Received total net proceeds of $44.5 million Repaid $35.9 million of term debt Repaid First-Out Loan Removed minimum liquidity requirements Eliminated PIK rate increase on January 1, 2018 Mechanical Solutions: Divested |
|
|
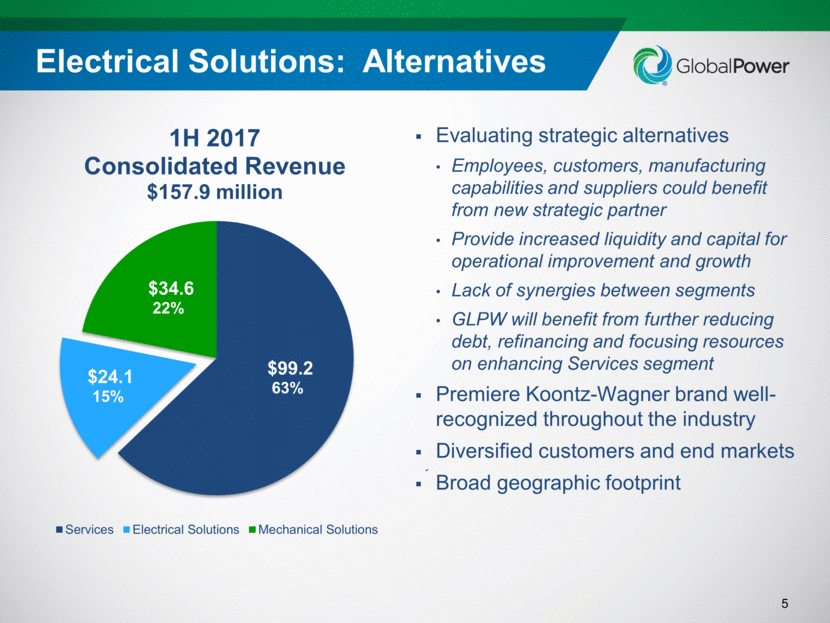
5 Evaluating strategic alternatives Employees, customers, manufacturing capabilities and suppliers could benefit from new strategic partner Provide increased liquidity and capital for operational improvement and growth Lack of synergies between segments GLPW will benefit from further reducing debt, refinancing and focusing resources on enhancing Services segment Premiere Koontz-Wagner brand well- recognized throughout the industry Diversified customers and end markets Broad geographic footprint Electrical Solutions: Alternatives |
|
|
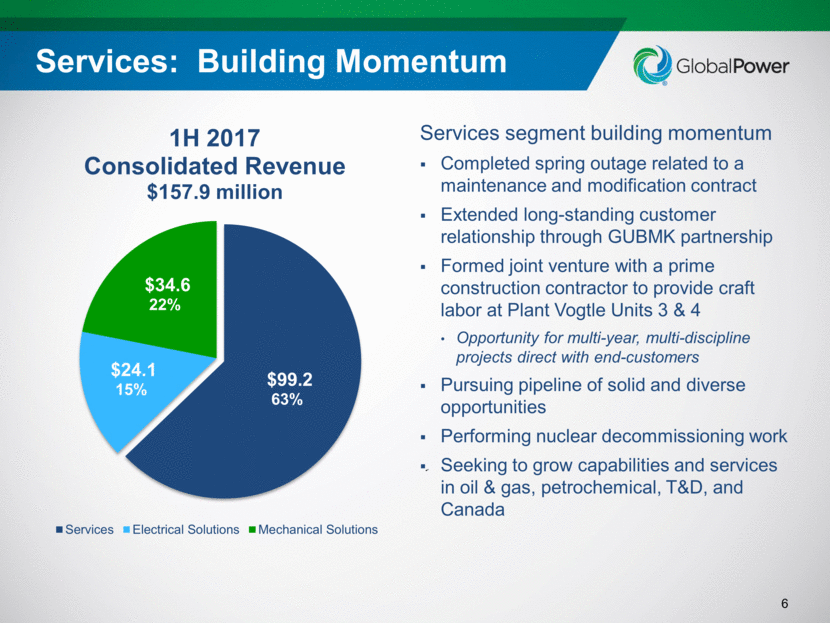
6 Services segment building momentum Completed spring outage related to a maintenance and modification contract Extended long-standing customer relationship through GUBMK partnership Formed joint venture with a prime construction contractor to provide craft labor at Plant Vogtle Units 3 & 4 Opportunity for multi-year, multi-discipline projects direct with end-customers Pursuing pipeline of solid and diverse opportunities Performing nuclear decommissioning work Seeking to grow capabilities and services in oil & gas, petrochemical, T&D, and Canada Services: Building Momentum |
|
|
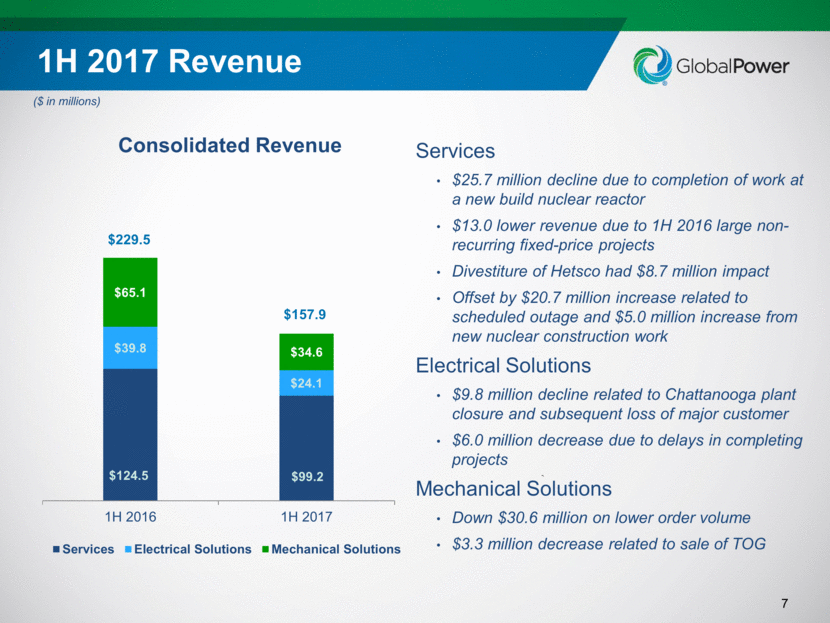
($ in millions) 7 1H 2017 Revenue Services $25.7 million decline due to completion of work at a new build nuclear reactor $13.0 lower revenue due to 1H 2016 large non-recurring fixed-price projects Divestiture of Hetsco had $8.7 million impact Offset by $20.7 million increase related to scheduled outage and $5.0 million increase from new nuclear construction work Electrical Solutions $9.8 million decline related to Chattanooga plant closure and subsequent loss of major customer $6.0 million decrease due to delays in completing projects Mechanical Solutions Down $30.6 million on lower order volume $3.3 million decrease related to sale of TOG |
|
|
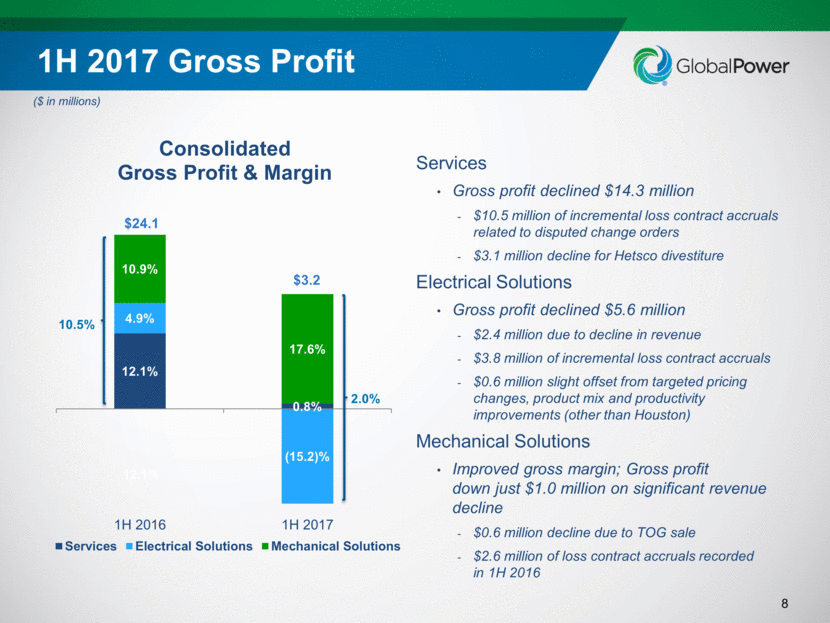
($ in millions) 8 1H 2017 Gross Profit Services Gross profit declined $14.3 million $10.5 million of incremental loss contract accruals related to disputed change orders $3.1 million decline for Hetsco divestiture Electrical Solutions Gross profit declined $5.6 million $2.4 million due to decline in revenue $3.8 million of incremental loss contract accruals $0.6 million slight offset from targeted pricing changes, product mix and productivity improvements (other than Houston) Mechanical Solutions Improved gross margin; Gross profit down just $1.0 million on significant revenue decline $0.6 million decline due to TOG sale $2.6 million of loss contract accruals recorded in 1H 2016 10.5% $24.1 10.9% 4.9% 12.1% 10.5% $3.2 17.6% 0.8% (15.2)% 2.0% |
|
|
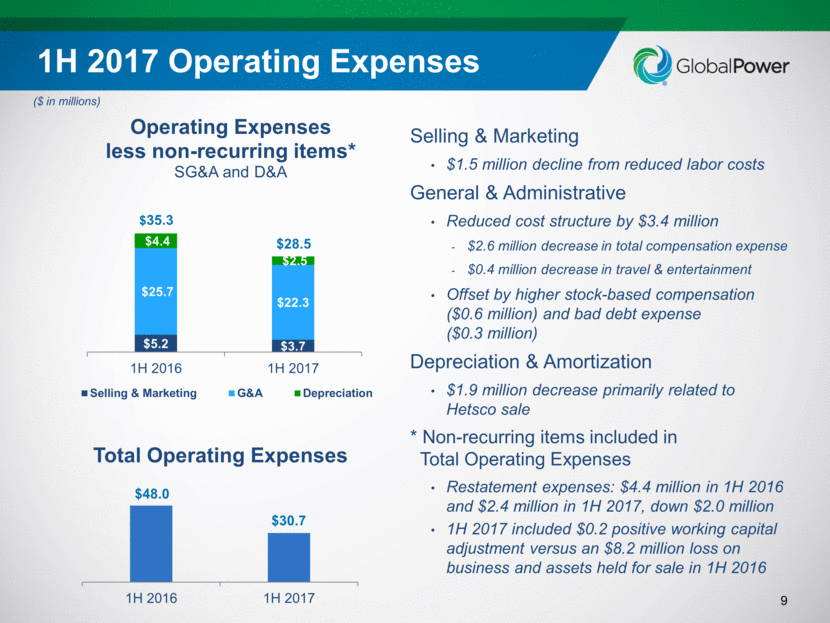
Selling & Marketing $1.5 million decline from reduced labor costs General & Administrative Reduced cost structure by $3.4 million $2.6 million decrease in total compensation expense $0.4 million decrease in travel & entertainment Offset by higher stock-based compensation ($0.6 million) and bad debt expense ($0.3 million) Depreciation & Amortization $1.9 million decrease primarily related to Hetsco sale * Non-recurring items included in Total Operating Expenses Restatement expenses: $4.4 million in 1H 2016 and $2.4 million in 1H 2017, down $2.0 million 1H 2017 included $0.2 positive working capital adjustment versus an $8.2 million loss on business and assets held for sale in 1H 2016 ($ in millions) 9 1H 2017 Operating Expenses $35.3 $28.5 |
|
|
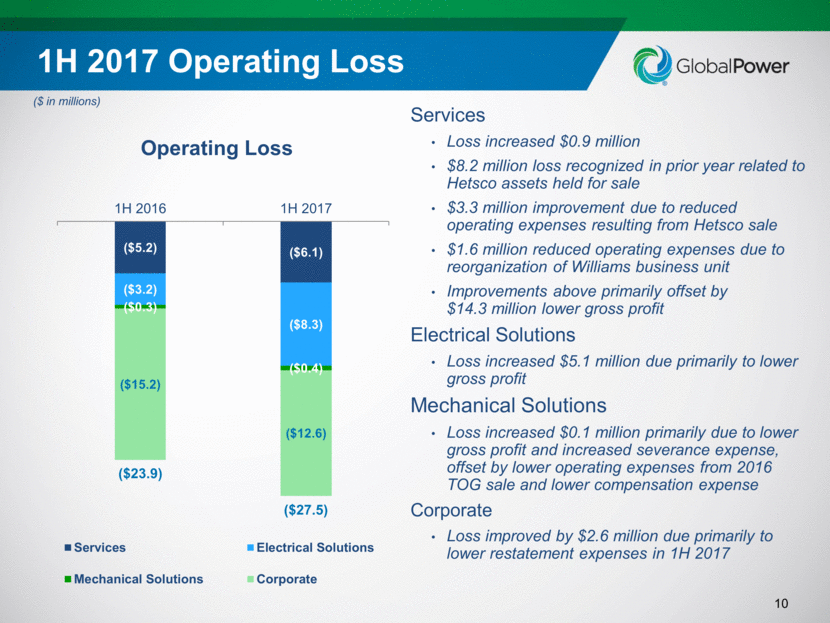
($ in millions) 10 1H 2017 Operating Loss Services Loss increased $0.9 million $8.2 million loss recognized in prior year related to Hetsco assets held for sale $3.3 million improvement due to reduced operating expenses resulting from Hetsco sale $1.6 million reduced operating expenses due to reorganization of Williams business unit Improvements above primarily offset by $14.3 million lower gross profit Electrical Solutions Loss increased $5.1 million due primarily to lower gross profit Mechanical Solutions Loss increased $0.1 million primarily due to lower gross profit and increased severance expense, offset by lower operating expenses from 2016 TOG sale and lower compensation expense Corporate Loss improved by $2.6 million due primarily to lower restatement expenses in 1H 2017 ($27.5) ($23.9) |
|
|
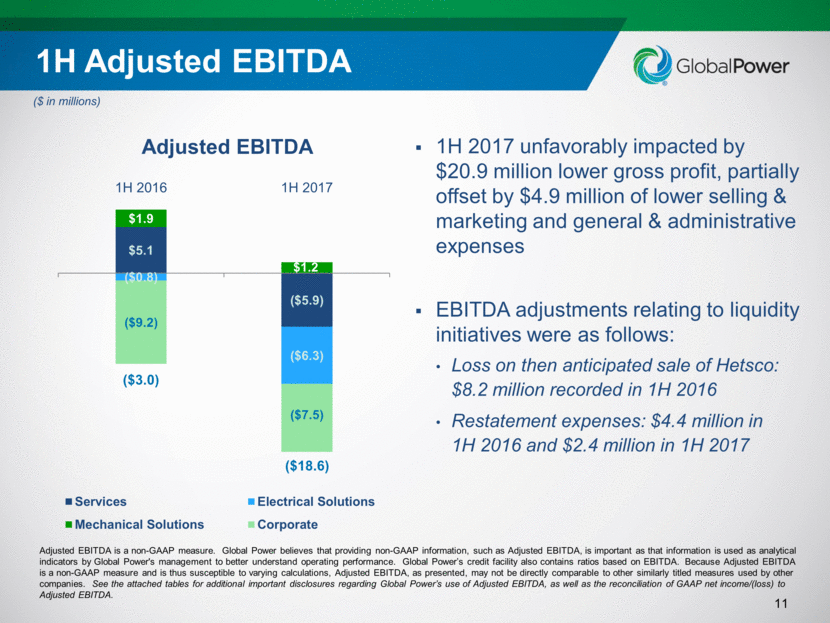
1H 2017 unfavorably impacted by $20.9 million lower gross profit, partially offset by $4.9 million of lower selling & marketing and general & administrative expenses EBITDA adjustments relating to liquidity initiatives were as follows: Loss on then anticipated sale of Hetsco: $8.2 million recorded in 1H 2016 Restatement expenses: $4.4 million in 1H 2016 and $2.4 million in 1H 2017 11 1H Adjusted EBITDA Adjusted EBITDA is a non-GAAP measure. Global Power believes that providing non-GAAP information, such as Adjusted EBITDA, is important as that information is used as analytical indicators by Global Power's management to better understand operating performance. Global Power’s credit facility also contains ratios based on EBITDA. Because Adjusted EBITDA is a non-GAAP measure and is thus susceptible to varying calculations, Adjusted EBITDA, as presented, may not be directly comparable to other similarly titled measures used by other companies. See the attached tables for additional important disclosures regarding Global Power’s use of Adjusted EBITDA, as well as the reconciliation of GAAP net income/(loss) to Adjusted EBITDA. ($ in millions) ($3.0) ($18.6) $5.1 ($5.9) ($0.8) ($6.3) $1.9 $1.2 ($9.2) ($7.5) 1H 2016 1H 2017 Adjusted EBITDA Services Electrical Solutions Mechanical Solutions Corporate |
|
|
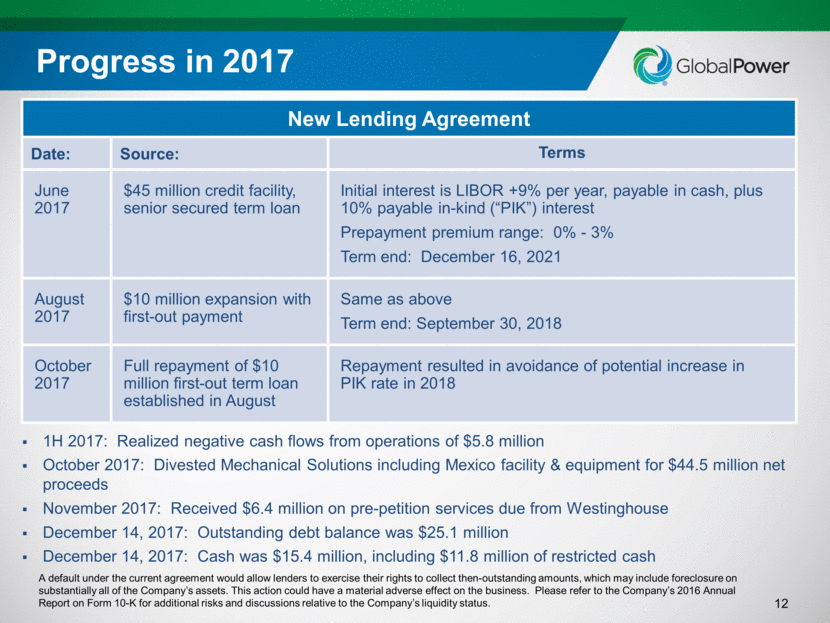
Progress in 2017 12 1H 2017: Realized negative cash flows from operations of $5.8 million October 2017: Divested Mechanical Solutions including Mexico facility & equipment for $44.5 million net proceeds November 2017: Received $6.4 million on pre-petition services due from Westinghouse December 14, 2017: Outstanding debt balance was $25.1 million December 14, 2017: Cash was $15.4 million, including $11.8 million of restricted cash New Lending Agreement Date: Source: Terms June 2017 $45 million credit facility, senior secured term loan Initial interest is LIBOR +9% per year, payable in cash, plus 10% payable in-kind (“PIK”) interest Prepayment premium range: 0% - 3% Term end: December 16, 2021 August 2017 $10 million expansion with first-out payment Same as above Term end: September 30, 2018 October2017 Full repayment of $10 million first-out term loan established in August Repayment resulted in avoidance of potential increase in PIK rate in 2018 A default under the current agreement would allow lenders to exercise their rights to collect then-outstanding amounts, which may include foreclosure on substantially all of the Company’s assets. This action could have a material adverse effect on the business. Please refer to the Company’s 2016 Annual Report on Form 10-K for additional risks and discussions relative to the Company’s liquidity status. |
|
|
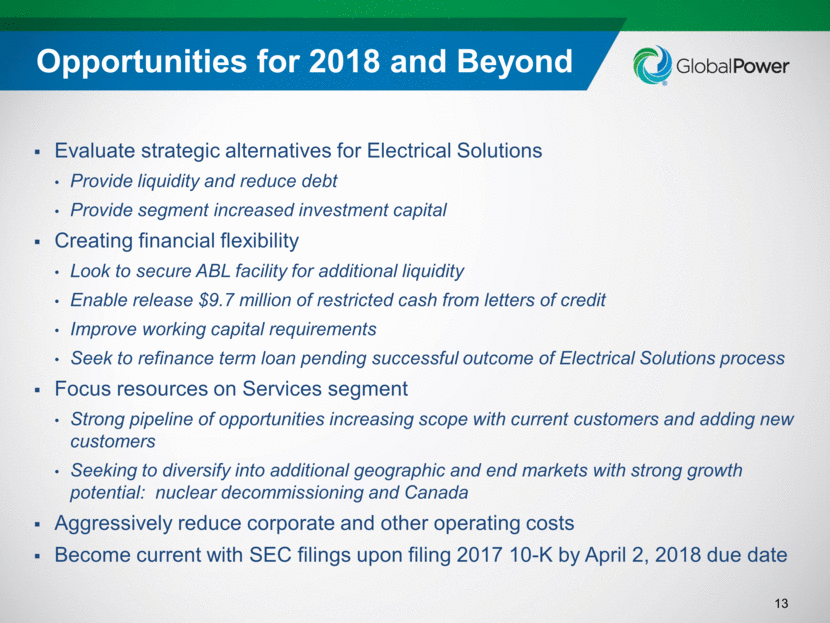
Opportunities for 2018 and Beyond 13 Evaluate strategic alternatives for Electrical Solutions Provide liquidity and reduce debt Provide segment increased investment capital Creating financial flexibility Look to secure ABL facility for additional liquidity Enable release $9.7 million of restricted cash from letters of credit Improve working capital requirements Seek to refinance term loan pending successful outcome of Electrical Solutions process Focus resources on Services segment Strong pipeline of opportunities increasing scope with current customers and adding new customers Seeking to diversify into additional geographic and end markets with strong growth potential: nuclear decommissioning and Canada Aggressively reduce corporate and other operating costs Become current with SEC filings upon filing 2017 10-K by April 2, 2018 due date |
|
|
First Half 2017 Financial Results and Strategic Update |
|
|
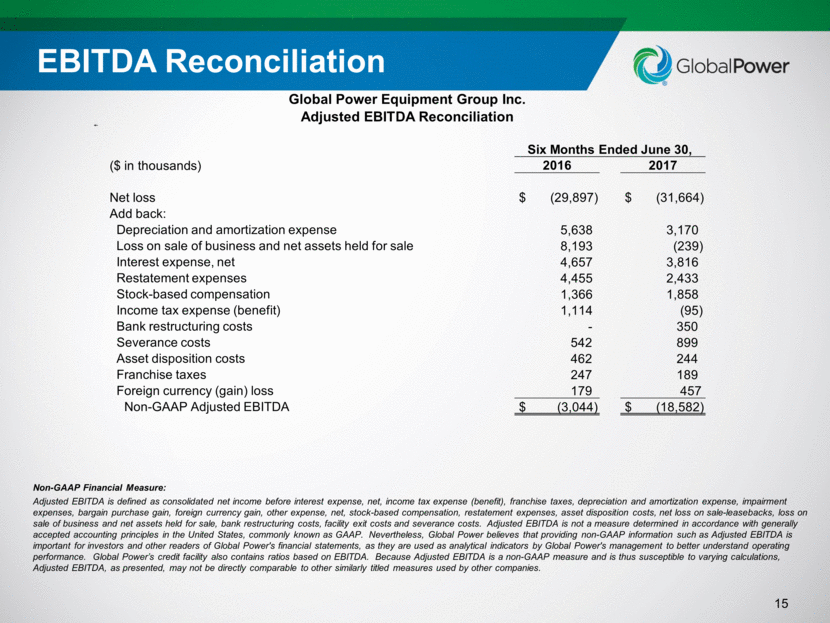
15 EBITDA Reconciliation Global Power Equipment Group Inc. Adjusted EBITDA Reconciliation Six Months Ended June 30, ($ in thousands) 2016 2017 Net loss $ (29,897) $ (31,664) Add back: Depreciation and amortization expense 5,638 3,170 Loss on sale of business and net assets held for sale 8,193 (239) Interest expense, net 4,657 3,816 Restatement expenses 4,455 2,433 Stock-based compensation 1,366 1,858 Income tax expense (benefit) 1,114 (95) Bank restructuring costs - 350 Severance costs 542 899 Asset disposition costs 462 244 Franchise taxes 247 189 Foreign currency (gain) loss 179 457 Non-GAAP Adjusted EBITDA $ (3,044) $ (18,582) Non-GAAP Financial Measure: Adjusted EBITDA is defined as consolidated net income before interest expense, net, income tax expense (benefit), franchise taxes, depreciation and amortization expense, impairment expenses, bargain purchase gain, foreign currency gain, other expense, net, stock-based compensation, restatement expenses, asset disposition costs, net loss on sale-leasebacks, loss on sale of business and net assets held for sale, bank restructuring costs, facility exit costs and severance costs. Adjusted EBITDA is not a measure determined in accordance with generally accepted accounting principles in the United States, commonly known as GAAP. Nevertheless, Global Power believes that providing non-GAAP information such as Adjusted EBITDA is important for investors and other readers of Global Power's financial statements, as they are used as analytical indicators by Global Power's management to better understand operating performance. Global Power’s credit facility also contains ratios based on EBITDA. Because Adjusted EBITDA is a non-GAAP measure and is thus susceptible to varying calculations, Adjusted EBITDA, as presented, may not be directly comparable to other similarly titled measures used by other companies. |

