Attached files
| file | filename |
|---|---|
| 8-K - 8-K INVESTOR PRESENTATION 12-6-17 - Blue Hills Bancorp, Inc. | a8-kinvestorpresentation12.htm |

Title
1 Footnote.
Compass Point
Investor Meetings
December 6, 2017
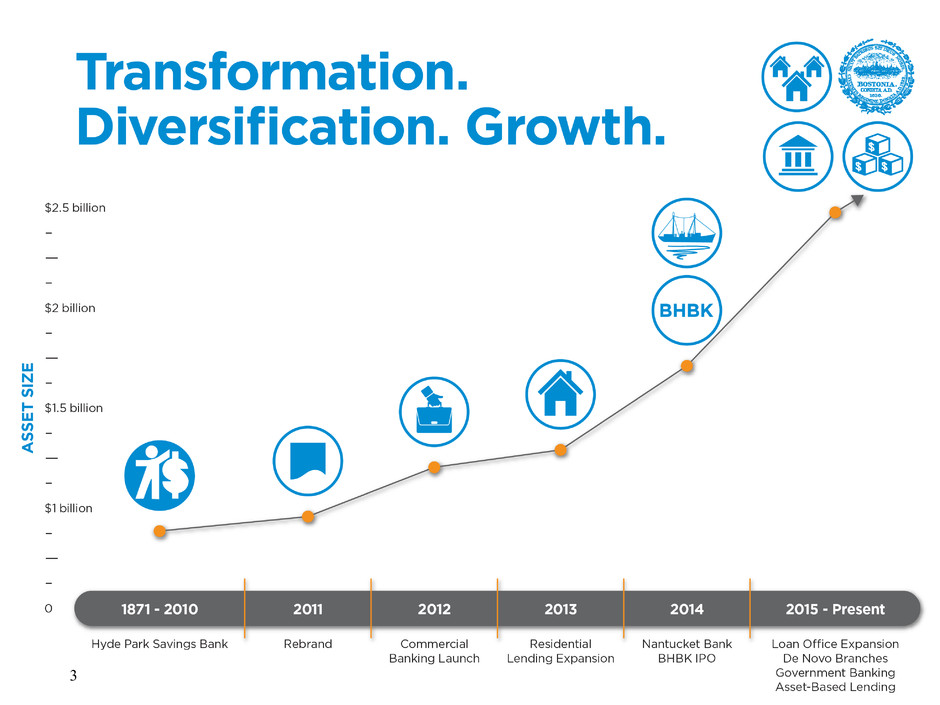
Transformation. Diversification. Growth.

Forward-Looking Statements
This presentation, as well as other written communications made from time to time by the Company and its subsidiaries and
oral communications made from time to time by authorized officers of the Company, may contain statements relating to the
future results of the Company (including certain projections and business trends) that are considered “forward-looking
statements” as defined in the Private Securities Litigation Reform Act of 1995 (the “PSLRA”). Such forward-looking
statements may be identified by the use of such words as “believe,” “expect,” “anticipate,” “should,” “planned,” “estimated,”
“intend” and “potential.” For these statements, the Company claims the protection of the safe harbor for forward-looking
statement contained in the PSLRA.
The Company cautions you that a number of important factors could cause actual results to differ materially from those
currently anticipated in any forward-looking statement. Such factors include, but are not limited to: our ability to implement
successfully our business strategy, which includes significant asset and liability growth; changes that could adversely affect the
business in which the Company and the Bank are engaged; prevailing economic and geopolitical conditions; changes in interest
rates, loan demand, real estate values and competition; changes in accounting principles, policies and guidelines; changes in
any applicable law, rule, regulation or practice with respect to tax or legal issues; and other economic, competitive,
governmental, regulatory and technological factors affecting the Company’s operations, pricing, products and services. For
additional information on some of the risks and important factors that could affect the Company’s future results and financial
condition, see “Risk Factors” in the Company’s Annual Report on Form 10-K as filed with the Securities and Exchange
Commission. The forward-looking statements are made as of the date of this presentation, and, except as may be required by
applicable law or regulation, the Company assumes no obligation to update the forward-looking statements or to update the
reasons why actual results could differ from those projected in the forward-looking statements.
2
3

Building Franchise Value
Experienced leadership team
Upgraded leverageable infrastructure
Diversified business model
Strong direct lending capabilities
Strong asset quality
Attractive deposit mix with ongoing growth
Improving spread / fee revenue diversity
4

Attractive Footprint
5
Blue Hills Bank branch
Loan production office
Nantucket Bank branch
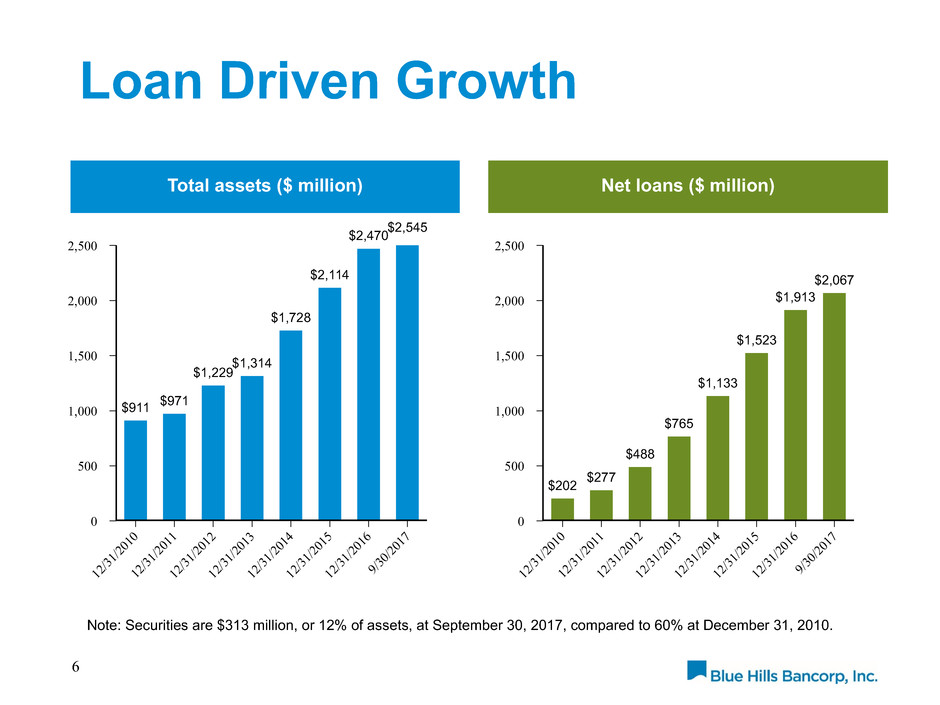
Loan Driven Growth
6
Total assets ($ million) Net loans ($ million)
2,500
2,000
1,500
1,000
500
0
12
/31
/20
10
12
/31
/20
11
12
/31
/20
12
12
/31
/20
13
12
/31
/20
14
12
/31
/20
15
12
/31
/20
16
9/3
0/2
01
7
$911 $971
$1,229
$1,314
$1,728
$2,114
$2,470$2,545
2,500
2,000
1,500
1,000
500
0
12
/31
/20
10
12
/31
/20
11
12
/31
/20
12
12
/31
/20
13
12
/31
/20
14
12
/31
/20
15
12
/31
/20
16
9/3
0/2
01
7
$202 $277
$488
$765
$1,133
$1,523
$1,913
$2,067
Note: Securities are $313 million, or 12% of assets, at September 30, 2017, compared to 60% at December 31, 2010.

Well Diversified Portfolio
7
Loan composition at 9/30/2017 Loan composition at 12/31/2010
$2.1 billion $204 million
Other Loans 6%
Residential
94%
Consumer
1%
Construction
4%
C&I
12%
CRE
36%
Home Equity
4%
Residential
43%

Valuable Origination Platform
8
Residential mortgages
($ million)
Commercial & construction loans
($ million)
Originations Purchases
600
500
400
300
200
100
0
2010 2011 2012 2013 2014 2015 2016 9MOS '17
$69
$134
$166 $176
$237
$272
$539
$383
Originations Purchases
600
500
400
300
200
100
0
2010 2011 2012 2013 2014 2015 2016 9MOS '17
$0 $2
$178
$305
$243
$325
$359
$257
56
13
88
46
89
77
104
72
66
236
171
36
13
526
108
70
186
119
72
171
295
30 85
274
6
377
91
166

Securities Restructuring
MBS / CMO
79%
GSE
10%
Asset Backed
8%
Equity
3%
• Securities reduced to 12% of total
assets at 9/30/2017 from 60% at
12/31/2010.
• All debt securities classified as Held
to Maturity (yield = 2.21%; duration =
3.82 years) at 9/30/2017.
• Mutual fund portfolio sold Q1'17.
• Corporate bond portfolio sold Q2'17.
• Actions eliminate earnings volatility
from securities gains/losses and
mutual fund dividends.
• Portfolio now managed in-house,
eliminating annual investment fees of
$400,000.
Securities Portfolio as of 9/30/2017
9
$313 million

Improved Deposit Mix
10
Deposits ($ million) Deposit composition
At 12/31/2010
At 9/30/2017
Cost of deposits:
1.60% in 2010 0.77% in 9MOS '17
2,500
2,000
1,500
1,000
500
0
12
/31
/20
10
12
/31
/20
11
12
/31
/20
12
12
/31
/20
13
12
/31
/20
14
12
/31
/20
15
12
/31
/20
16
9/3
0/2
01
7
$754 $756 $818
$915
$1,213
$1,434
$1,809
$1,986
NOW &
Demand
10%
Savings
23%
Money
market
2%
CDs
65%
NOW &
Demand
19%
Savings
12%
Money
market
36%
CDs
33%

Net Interest Income Growth
11
Net interest income ($ millions)
and net interest margin
(1) Adjusted net interest margin excludes the impact of volatile items: mutual fund dividends, purchase accounting accretion and accelerated
bond amortization/accretion.
70
60
50
40
30
20
10
0
2013 2014 2015 2016
$25.1
$42.4
$49.6
$57.0
Net Interest Margin
Reported Adjusted (1)
9MOS '17 2.75% 2.74%
2016 2.68% 2.66%
2015 2.83% 2.64%
2014 2.81% 2.57%
2013 2.24% 2.23%
Net Interest Income ($ millions)
50
40
30
20
10
0
9MOS '16 9MOS '17
$41.0
$49.2

Improving Core Fee Income
Note: Core fee income includes deposit account fees, interchange & ATM fees, mortgage
banking revenue, and loan level derivative income (CRE loan swaps)
12
Core fee income ($ millions)
10
9
8
7
6
5
4
3
2
1
0
2012 2013 2014 2015 2016 9MOS '16 9MOS '17
$2.7
$4.1 $4.2
$5.2
$7.7
$5.9
$7.0
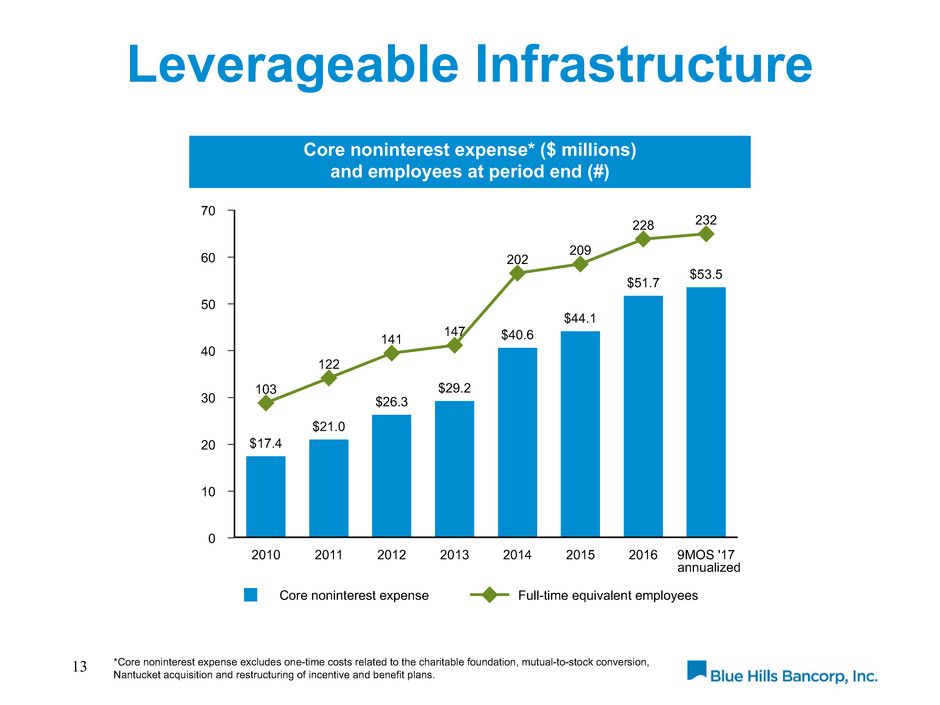
Leverageable Infrastructure
13
Core noninterest expense* ($ millions)
and employees at period end (#)
*Core noninterest expense excludes one-time costs related to the charitable foundation, mutual-to-stock conversion,
Nantucket acquisition and restructuring of incentive and benefit plans.
Core noninterest expense Full-time equivalent employees
70
60
50
40
30
20
10
0
2010 2011 2012 2013 2014 2015 2016 9MOS '17
$17.4
$21.0
$26.3
$29.2
$40.6
$44.1
$51.7 $53.5
103
122
141 147
202 209
228 232
annualized

Noninterest Expense Growth
($ thousands)
14
Q3 '17 LTM 2016 2015
Reported Noninterest Expense $ 53,630 $ 51,746 $ 44,082
Less: Equity Plans (5,370) (4,868) (1,124) effective Q4'15
Less: Seaport Branch (1,581) (476) (17) opened in Q4‘16
Less: Westwood Branch (963) (982) (484) opened in Q4'15
Adjusted Noninterest Expense $ 45,716 $ 45,420 $ 42,457
Note: Growth in adjusted noninterest expense includes costs related to the expansion of the
mortgage business, the onboarding of new asset-based lending and municipal banking businesses,
and relocating to a new headquarters.

Improvement in Earnings
($ thousands)
15
9MOS '17 2016 2015 2014(1)
Pre-Tax Income $ 21,857 $ 12,458 $ 10,064 $ 8,014
NRS Gain (5,947) — — —
Loss on Sale of Purchased Home
Equity Portfolio 118 — — —
Securities (Gains) & Losses 94 (1,280) (1,968) (2,515)
Pension Curtailment Gain — — — (1,304)
BOLI Death Benefits — (506) — (182)
Mutual Fund Dividends — (961) (3,647) (3,603)
Adjusted Pre-tax income $ 16,122 $ 9,711 $ 4,449 $ 410
(1) Pre-tax income for 2014 excludes Nantucket acquisition expenses, mutual-to-stock conversion expenses, and the Charitable
Foundation contribution.
Note: Equity plan expense of $4,108, $4,868 and $1,124 included in 9MOS '17, 2016 and 2015, respectively; no comparable expense
in 2014.

Positive Operating Leverage
($ thousands)
16
9MOS '17 9MOS '16 % Change
Net Interest Income $ 49,243 $ 41,012
Noninterest Income 14,152 8,320
NRS gain (5,947) —
Loss on Sale of Purchased Home
Equity Portfolio 118 —
Securities (Gains) / Losses 94 (982)
BOLI Death Benefit Gains — (506)
Adjusted Revenue 57,660 47,844 21%
Noninterest Expense 40,121 38,237 5%
Adjusted pre-tax, pre-loan loss
provision earnings $ 17,539 $ 9,607 83%
Adjusted Efficiency Ratio (1) 70% 80%
(1) Excluded from the calculation of adjusted efficiency ratio are the NRS gain, securities gains/losses, and BOLI death benefit gains.
Note: Adjusted Efficiency ratio was 67% in Q3 '17
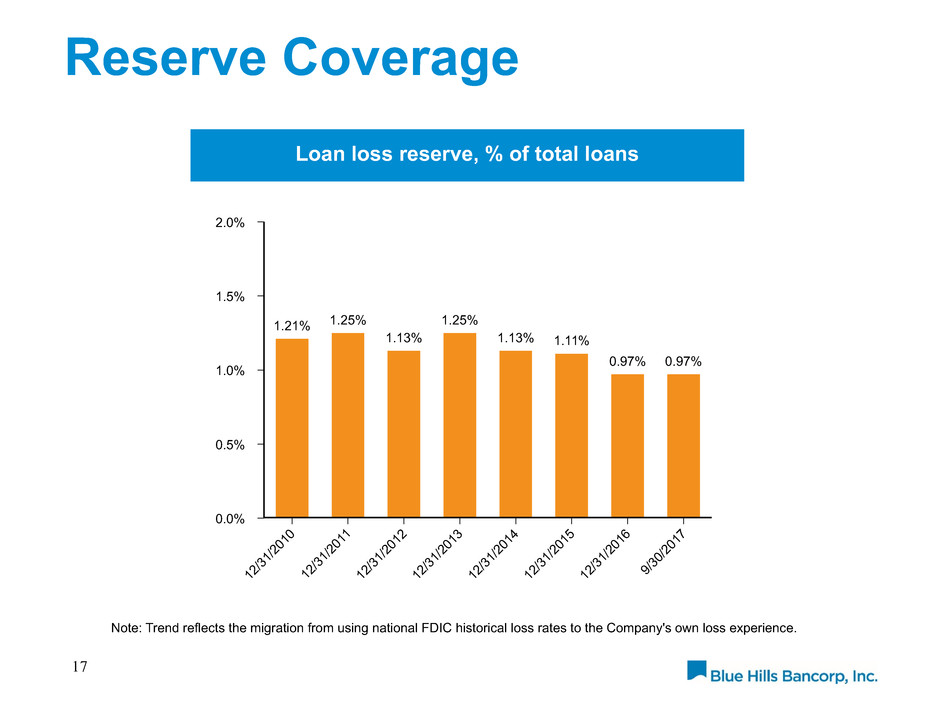
Reserve Coverage
17
Loan loss reserve, % of total loans
Note: Trend reflects the migration from using national FDIC historical loss rates to the Company's own loss experience.
2.0%
1.5%
1.0%
0.5%
0.0%
12
/31
/20
10
12
/31
/20
11
12
/31
/20
12
12
/31
/20
13
12
/31
/20
14
12
/31
/20
15
12
/31
/20
16
9/3
0/2
01
7
1.21% 1.25%
1.13%
1.25%
1.13% 1.11%
0.97% 0.97%

Nonperforming Assets
18
NPAs, % of assets
1.00%
0.75%
0.50%
0.25%
0.00%
12
/31
/20
10
12
/31
/20
11
12
/31
/20
12
12
/31
/20
13
12
/31
/20
14
12
/31
/20
15
12
/31
/20
16
9/3
0/2
01
7
0.18%
0.28%
0.18%
0.13%
0.26%
0.51%
0.36%
0.45%
Note: Approximately one-third of NPAs at 9/30/2017 relates to loans secured by one income property.
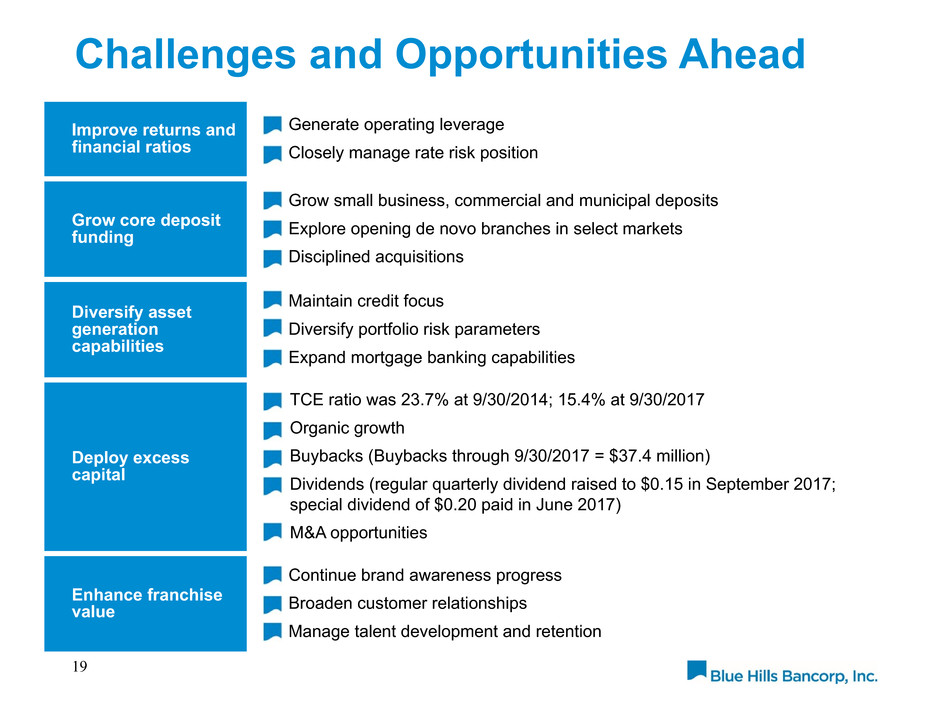
Challenges and Opportunities Ahead
19
Improve returns and
financial ratios
Generate operating leverage
Closely manage rate risk position
Grow core deposit
funding
Grow small business, commercial and municipal deposits
Explore opening de novo branches in select markets
Disciplined acquisitions
Diversify asset
generation
capabilities
Maintain credit focus
Diversify portfolio risk parameters
Expand mortgage banking capabilities
Deploy excess
capital
TCE ratio was 23.7% at 9/30/2014; 15.4% at 9/30/2017
Organic growth
Buybacks (Buybacks through 9/30/2017 = $37.4 million)
Dividends (regular quarterly dividend raised to $0.15 in September 2017;
special dividend of $0.20 paid in June 2017)
M&A opportunities
Enhance franchise
value
Continue brand awareness progress
Broaden customer relationships
Manage talent development and retention

Appendix
20

21
$ thousands Sept. 30, 2017 Dec. 31, 2016 Dec. 31, 2015
Cash and equivalents $38,363 $30,496 $33,298
Securities available for sale, at fair value 9,943 204,836 231,690
Securities held to maturity, at amortized cost 302,833 201,027 200,141
FHLB Stock, at cost 9,410 13,352 13,567
Loans held for sale 12,268 2,761 12,877
Total loans 2,087,535 1,931,621 1,540,377
Allowance for loan losses (20,248) (18,750) (17,102)
Loans, net 2,067,287 1,912,871 1,523,275
Premises and equipment, net 21,850 22,034 20,015
Accrued interest receivable 5,802 6,057 5,344
Goodwill and core deposit intangible 9,892 10,560 11,785
Net deferred tax asset 9,295 10,146 10,665
Bank-owned life insurance 32,800 32,015 31,626
Other assets 25,673 23,537 20,060
Total assets $2,545,416 $2,469,692 $2,114,343
Deposits $1,985,553 $1,808,687 $1,433,849
Short-term borrowings 20,000 146,000 205,000
Long-term debt 110,000 105,000 55,000
Other liabilities 30,829 23,098 21,665
Stockholders' equity 399,034 386,907 398,829
Total liabilities and stockholders' equity $2,545,416 $2,469,692 $2,114,343
Balance Sheet

22
Quarters ended
$ thousands, except per share data Sept. 30,2017
June 30,
2017
Sept. 30,
2016
Net interest and dividend income $16,954 $16,408 $14,495
Provision for loan losses 242 1,118 2,872
Net interest and dividend income, after provision 16,712 15,290 11,623
Noninterest income 2,826 4,510 4,132
Noninterest expense 13,355 13,366 13,234
Income before income taxes 6,183 6,434 2,521
Provision for income taxes 2,342 2,566 891
Net income $3,841 $3,868 $1,630
Earnings per common share:
Basic $0.16 $0.16 $0.07
Diluted $0.16 $0.16 $0.07
Income Statement
Note: Excluding a loss on the sale of a purchased home equity portfolio, Q3 '17 net income was $3,914, or $0.16 per diluted share.
Excluding a gain on the sale of the remaining available for sale debt securities portfolio, Q2 '17 net income was $3,273, or $0.14 per diluted
share.

23
Loans and Deposits
$ thousands Sept. 30, 2017 Dec. 31, 2016 Dec. 31, 2015
Loans
1-4 family residential $905,585 $854,478 $602,138
Home equity 77,819 79,132 77,633
Commercial real estate 751,209 686,522 559,609
Construction 88,979 75,950 79,386
Total real estate loans 1,823,592 1,696,082 1,318,766
Commercial business 240,801 205,832 182,536
Consumer 23,142 29,707 39,075
Total loans $2,087,535 $1,931,621 $1,540,377
Deposits
NOW and demand $376,864 $331,508 $288,143
Regular savings 244,662 262,984 287,344
Money market 666,388 573,204 368,050
Certificates of deposit 420,765 340,114 311,978
Brokered money market 41,768 53,357 41,807
Brokered certificates of deposit 235,106 247,520 136,527
Total deposits $1,985,553 $1,808,687 $1,433,849
Loans / total deposits 105% 107% 107%
Loans / customer deposits 122% 128% 123%

24
Financial Highlights
Quarters ended
$ thousands, except per share data Sept. 30, 2017 June 30, 2017 Sept. 30, 2016
Performance ratios (1)
ROA 0.61 % 0.53% 0.29%
ROE 3.87 % 3.29% 1.65%
Efficiency ratio 67 % 67% 71%
Asset Quality
Nonperforming assets $11,540 $12,779 $7,849
Nonperforming assets / total assets 0.45 % 0.51% 0.34%
Allowance for loan losses / total loans 0.97 % 0.97% 1.01%
Allowance for loan losses / nonperforming loans 175 % 156% 226%
Net charge-offs (recoveries) $(89) $76 $3,221
Net charge-offs (recoveries) / average loans, annualized (0.02)% 0.01% 0.74%
Capital metrics
Common shares outstanding 26,869,088 26,860,988 26,996,942
Book value per share $14.85 $14.79 $14.43
Tangible book value per share $14.48 $14.42 $14.03
Tangible common equity / tangible assets 15.35 % 15.47% 16.45%
(1) Q3 '17 excludes loss on sale of purchased home equity portfolio. Q2 '17 excludes gain on sale of remaining available for sale debt
securities portfolio.
