Attached files
| file | filename |
|---|---|
| EX-99.1 - EXHIBIT 99.1 - APARTMENT INVESTMENT & MANAGEMENT CO | investorpresentationnovf.htm |
| 8-K - 8-K - APARTMENT INVESTMENT & MANAGEMENT CO | a8-knareitnovember2017.htm |
1

INTRODUCTION
Net Asset Value is calculated as the market value of a company's assets less its liabilities and obligations. Net Asset Value is used by many investors in real estate companies because the value of company assets can be readily estimated, even for non-earning assets such as land or properties under development. Net Asset Value has the advantage of incorporating the investment decisions of the many thousands of real estate investors. It enhances comparability among companies that have differences in their accounting. It avoids distortions that can result from application of GAAP to investment properties and ownership structures.
While Net Asset Value is not identical to liquidation value in that some costs and benefits are disregarded, it is often considered a floor with upside for any value ascribed to the operating platform. Net Asset Value also provides an objective basis for the perceived quality, or predictability, of future cash flows as well as their expected growth as these are factors considered by real estate investors. As a result, Net Asset Value can be a valuable starting point for projecting future earnings.
2
GENERAL DISCLOSURES
The information provided in this presentation is intended to assist users in estimating Aimco’s Net Asset Value per share. This is not an offer to sell securities and does not constitute legal, tax, investment or other professional advice on any subject matter. Information provided is not all-inclusive and should not be relied upon as being all-inclusive.
This presentation describes a process to calculate Aimco's estimated Net Asset Value per share as of September 30, 2017. This value will fluctuate over time. Aimco's estimated Net Asset Value per share is based upon subjective judgments, assumptions and opinions and includes certain risks and uncertainties. Risks and uncertainties include, but are not limited to: Aimco's ability to maintain current or meet projected occupancy, rental rates and property operating results; the effect of acquisitions, dispositions, redevelopments and developments; Aimco's ability to meet budgeted costs and timelines, and achieve budgeted rental rates related to its developments and redevelopments; and Aimco's ability to meet timelines and budgeted rental rates related to its lease-up properties.
3
GENERAL DISCLOSURES (CONTINUED)
This Net Asset Value per share information is intended to measure Aimco’s value as a going concern, consistent with International Financial Reporting Standards (“IFRS”), and is not necessarily representative of the amount a stockholder could expect to receive in a liquidation event, now or in the future. Certain opportunities are excluded as are transaction costs, transfer taxes, income taxes, and any real estate tax adjustments that may impact the value a stockholder might receive and a buyer might ascribe to Aimco’s communities (see page 8).
Aimco's estimated Net Asset Value is based on management's judgments, assumptions and opinions as of this date, and Aimco assumes no obligation to revise or update them to reflect future events or circumstances.
Actual results may differ materially from management's forecasts as of this date and, in addition, will be affected by a variety of risks and factors, some of which are beyond Aimco's control, including, without limitation:
• | Real estate and operating risks, including fluctuations in real estate values and the general economic climate in the markets in which Aimco operates and competition for residents in such markets; national and local economic conditions, including the pace of job growth and the level of unemployment; the amount, location and quality of competitive new housing supply; the timing of acquisitions, dispositions, redevelopments and developments; and changes in operating costs, including energy costs; |
• | Financing risks, including the availability and cost of capital markets financing; the risk that our cash flows from operations may be insufficient to meet required payments of principal and interest; and the risk that our earnings may not be sufficient to maintain compliance with debt covenants; |
4
GENERAL DISCLOSURES (CONTINUED)
• | Insurance risk, including the cost of insurance; and natural disasters and severe weather such as hurricanes; and |
• | Legal and regulatory risks, including costs associated with prosecuting or defending claims and any adverse outcomes; the terms of governmental regulations that affect Aimco and interpretations of those regulations; and possible environmental liabilities, including costs, fines or penalties that may be incurred due to necessary remediation of contamination of apartment communities presently or previously owned by Aimco. |
In addition, Aimco's current and continuing qualification as a real estate investment trust involves the application of highly technical and complex provisions of the Internal Revenue Code and depends on its ability to meet the various requirements imposed by the Internal Revenue Code, through actual operating results, distribution levels and diversity of stock ownership.
Readers should carefully review Aimco's financial statements and the notes thereto, as well as the section entitled "Risk Factors" in Item 1A of Aimco's Annual Report on Form 10-K for the year ended December 31, 2016, and the other documents Aimco files from time to time with the Securities and Exchange Commission.
5
VALUATION METHODOLOGY
Real Estate - Aimco estimated the value of its communities using methods management believes to be appropriate based on the characteristics of the communities. For valuation purposes, Aimco segregated its portfolio into the following categories: Stabilized Portfolio; Redevelopment Communities Under Construction; Lease-Up Communities; and Other Real Estate. Communities in these categories were valued as follows:
• | Stabilized Portfolio - valued using a direct capitalization rate ("cap rate") method based on annualized 3Q 2017 property NOI, less a 2% management fee, and market cap rates. |
• | Redevelopment Communities Under Construction and Lease-Up Communities - valued based on discounted projected future cash flows. |
• | Other Real Estate Portfolio - includes communities under contract for sale valued at contract prices and certain land investments valued at Aimco's cost. |
6
VALUATION METHODOLOGY (CONTINUED)
Asset Management Business - represents the present value of the expected future cash flows from various low-income housing tax credit partnerships. Aimco provides asset management and other services to these partnerships and receives fees and other payments in return. To the extent the amounts due Aimco are not paid currently, the balances accrue and are satisfied from the partnerships’ future operating or liquidating cash flows.
Other Tangible Assets - consist of cash, restricted cash, accounts receivable and other assets for which Aimco reasonably expects to receive cash through the normal course of operations or another future event.
Debt - the fair value of Aimco's debt has been calculated based on the Money-Weighted Average interest rate on its debt, which rate takes into account the duration of the property debt as well as its loan to value and debt service coverage.
Other Tangible Liabilities - consist of accounts payable, accrued liabilities and other tangible liabilities Aimco reasonably expects to settle in cash through the normal course of operations or another future event.
Preferred Equity - the fair value of Aimco's preferred equity includes a mark-to-market adjustment for listed securities based on their closing share price on September 30, 2017.
7
VALUATION METHODOLOGY (CONTINUED)
Other Items of Note
• | Real estate values are based on Aimco's current uses and most importantly do not include the value of unused or underused land or air rights. |
• | Real estate values do not take into consideration transaction costs or other items such as real estate tax adjustments that may impact the value a buyer might ascribe to Aimco's communities. |
• | This calculation of Aimco’s Net Asset Value does not include the impact of transactions planned or completed transactions subsequent to September 30, 2017. |
• | This calculation of Aimco’s Net Asset Value does not include the value of fee income such as property management revenues, or non-recurring investment management revenues. |
• | This calculation of Aimco’s Net Asset Value does not consider enterprise value. |
• | Additional details of Aimco's calculations and methodologies are included on the following pages. |
8

September 30, 2017 Estimated Net Asset Value: $53 per share*
$78 | +$2 | -$27 | ||
Fair Value of Real Estate | Fair Value of Other Tangible Assets, Liabilities and Preferred Equity, Net Cash and restricted cash + Other tangible assets + Asset Management Business - Other tangible liabilities | Fair Value of Debt Carrying value of debt + Mark-to-market adjustment + Fair value of preferred equity | ||
Estimated NAV per share increased by $2 from the first quarter 2017 calculation. The increase in NAV is due primarily to an increase in net operating income and a 10 bps decrease in weighted average cap rates.
Fair Value of Real Estate: IFRS permit measurement of investment property at fair value. While Aimco does not report under IFRS, it believes the estimation of the fair value of real estate provided herein is determined consistently with IFRS requirements for investment properties.
*Refer to additional details and disclosures beginning on page 11. 9
September 30, 2017 Estimated
Fair Value of Real Estate: $78 per share*
Fair Value of Real Estate: $78 per share*
Stabilized Conventional Portfolio |
Annualized 3Q 2017 NOI Less: Management fee of 2% of revenue Divided By: NOI cap rate of 5.1% |
Redevelopment Portfolio |
Cash flows discounted from property stabilization to September 30, 2017. |
Lease-Up Portfolio |
Cash flows discounted from property stabilization to September 30, 2017. |
Other Real Estate Portfolio |
Other Investments: Certain land and non-multifamily real estate valued at cost. For Sale Communities: Communities currently under contract for sale. |
*Refer to additional details and disclosures beginning on page 11. 10

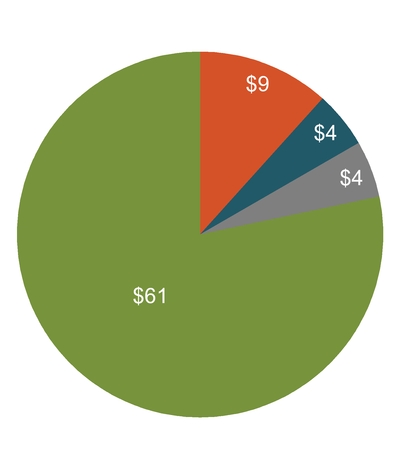
Fair Value of Real Estate as of September 30, 2017 ($M)
Stabilized Portfolio | ||||
NOI, less management fee | $ | 513 | (1) | |
NOI cap rate | 5.1 | % | (2) | |
Stabilized Portfolio Value | $ | 10,059 | ||
Non-Stabilized Portfolio | ||||
Redevelopment communities under construction | $ | 1,536 | (3) | |
Lease-up communities | 613 | (4) | ||
Other Real Estate | 592 | (5) | ||
Non-Stabilized Portfolio Value | $ | 2,741 | ||
Fair Value of Real Estate | $ | 12,800 | ||
*Refer to Footnotes beginning on page 14. | 11 |
Fair Value of Other Assets and Liabilities, Preferred Equity and Debt as of September 30, 2017 ($M)
Consolidated Amounts as Reported | Ownership Adjustments (6) | Fair Value Adjustments | Adjusted Amounts | ||||||||||
Other Tangible Assets | |||||||||||||
Cash and cash equivalents | $ | 39 | $ | (1 | ) | $ | — | $ | 38 | ||||
Restricted cash | 48 | — | — | 48 | |||||||||
Goodwill | 38 | — | (38 | ) | — | (7) | |||||||
Other tangible assets | 210 | (13 | ) | — | 197 | ||||||||
Asset Management Business | 30 | — | 183 | 213 | (8) | ||||||||
Fair Value of Other Tangible Assets | $ | 365 | $ | (14 | ) | $ | 145 | $ | 496 | ||||
Other Tangible Liabilities | |||||||||||||
Deferred income | $ | 25 | $ | — | $ | (25 | ) | $ | — | (9) | |||
Accounts payable | 31 | — | — | 31 | |||||||||
Other tangible liabilities | 152 | — | — | 152 | |||||||||
Liabilities related to assets held for sale | — | — | — | — | |||||||||
Fair Value of Other Tangible Liabilities | $ | 208 | $ | — | $ | (25 | ) | $ | 183 | ||||
Fair Value Other Tangible Assets and Liabilities, Net | $ | 157 | $ | (14 | ) | $ | 170 | $ | 313 | ||||
Preferred Equity | |||||||||||||
Preferred noncontrolling interests in Aimco Operating Partnership | $ | 102 | $ | — | $ | — | $ | 102 | |||||
Perpetual preferred stock | 125 | — | 7 | 132 | (10) | ||||||||
Fair Value of Preferred Equity | $ | 227 | $ | — | $ | 7 | $ | 234 | |||||
Debt | |||||||||||||
Non-recourse property debt | $ | 3,574 | $ | (10 | ) | $ | 62 | $ | 3,626 | ||||
Term loan, net | 249 | — | 1 | 250 | |||||||||
Revolving credit facility borrowings | 356 | — | — | 356 | |||||||||
Fair Value of Debt | $ | 4,179 | $ | (10 | ) | $ | 63 | $ | 4,232 | (11) | |||
Fair Value of Leverage | $ | 4,406 | $ | (10 | ) | $ | 70 | $ | 4,466 | ||||
*Refer to Footnotes beginning on page 14. | 12 |
Net Asset Value as of September 30, 2017 ($M, except per share amounts)
Fair Value of Real Estate | $ | 12,800 | ||
Fair Value of Other Tangible Assets and Liabilities, Net | $ | 313 | ||
Fair Value of Leverage | $ | (4,466 | ) | |
Net Asset Value | $ | 8,647 | ||
Total Shares, Units and Dilutive Share Equivalents Outstanding | $ | 164 | (12) | |
Net Asset Value per Share | $ | 53 | ||
It bears repeating that this NAV per share calculation is made at a point in time and its result may be expected to fluctuate based on subsequent events. Many factors influence this calculation including operating results, changes in use or density, the broader economy, and alternative investment opportunities. Our methodology relies on CBRE reporting of cap rates applicable to transactions in 1H 2017 which incorporated the facts and circumstances then prevalent. If cap rates were to increase or decrease by 25 basis points, then Aimco’s GAV and NAV would change by ~$500M which equates to $3 per share.
*Refer to Footnotes beginning on page 14. | 13 |

Footnotes
1. | Represents Stabilized Portfolio Property NOI for the three months ended September 30, 2017, annualized, and adjusted for an assumed property management fee. Market property management fees range between 1.5% and 3.0% with larger, higher quality portfolios at the lower end of that range. For the purposes of this calculation of Net Asset Value, Aimco has assumed a 2% management fee. For the purposes of this calculation of Net Asset Value, 3Q 2017 Property NOI is multiplied by four to arrive at annualized Property NOI. |
Three Months Ended September 30, 2017 | |||||||||||||||
Stabilized Portfolio NOI ($000s) | Consolidated Amount | Ownership Adjustments | Adjustments | Adjusted Amounts | |||||||||||
Rental and other property revenues | |||||||||||||||
Same Store | $ | 148,920 | $ | (713 | ) | $ | — | $ | 148,207 | ||||||
Acquisitions, Redevelopment and Development | 53,394 | (76 | ) | (30,653 | ) | a | 22,665 | ||||||||
Other Real Estate | 31,394 | 178 | (14,718 | ) | b | 16,854 | |||||||||
Total rental and other property revenues | $ | 233,708 | $ | (611 | ) | $ | (45,371 | ) | $ | 187,726 | |||||
Less: Direct property operating expenses | |||||||||||||||
Same Store | $ | (42,513 | ) | $ | 224 | $ | — | $ | (42,289 | ) | |||||
Acquisitions, Redevelopment and Development | (19,061 | ) | 27 | 11,527 | a | (7,507 | ) | ||||||||
Other Real Estate | (11,439 | ) | (34 | ) | 5,621 | b | (5,852 | ) | |||||||
Total property operating expenses | $ | (73,013 | ) | $ | 217 | $ | 17,148 | $ | (55,648 | ) | |||||
Property Net Operating Income | $ | 160,695 | $ | (394 | ) | $ | (28,223 | ) | $ | 132,078 | |||||
Less: Assumed property management fee of 2% of revenue | (4,674 | ) | 12 | 907 | (3,755 | ) | |||||||||
Property Net Operating Income after 2% management fee | $ | 156,021 | $ | (382 | ) | $ | (27,316 | ) | $ | 128,323 | |||||
Annualized Property Net Operating Income | $ | 624,084 | $ | (1,528 | ) | $ | (109,264 | ) | $ | 513,292 | |||||
Refer to the following pages for explanation of adjustments for purposes of computing Stabilized Portfolio Property NOI.
14
Footnotes (continued)
1.(continued)
a. | Represents revenues and expenses related to seven redevelopment communities currently under construction: The Palazzo at Park La Brea, located in Los Angeles, California; Saybrook Pointe, located in San Jose, California; Parc Mosaic (formerly Eastpointe), located in Boulder, Colorado; Yorktown, located in Lombard, Illinois; Calhoun Beach Club, located in Minneapolis, Minnesota; and Park Towne Place and The Sterling, both located in Center City Philadelphia, Pennsylvania. Also included in these adjustments are the revenue and expense items related to One Canal, located in Boston, Massachusetts and completed in 2Q 2016, and Indigo, located in Redwood City, California and purchased in August 2016. Aimco's redevelopment communities currently under construction and its lease-up communities are valued based on discounted cash flows as described in notes 3 and 4 on page 18. For the purposes of this Net Asset Value calculation, The Palazzo at Park La Brea, Saybrook Pointe, Parc Mosaic (formerly Eastpointe), Yorktown, Calhoun Beach Club, Park Towne Place and The Sterling are included in Aimco's Redevelopment Portfolio value. For the purpose of this Net Asset Value calculation, One Canal and Indigo are included in Aimco's Lease-Up Portfolio. |
After excluding the results related to the communities described above, stabilized NOI related to redevelopment and development communities represents the results of operations from the following communities: Palazzo East and Villas at Park La Brea, located in Los Angeles, California; Pacifica Park, located in Pacifica, California; Broadway Lofts, located in San Diego, California; Bay Parc Plaza and Flamingo South Beach, located in Miami, Florida; and Vivo, located in Cambridge, Massachusetts.
b. | Represents revenue and expenses related primarily to Aimco’s investment in land, non-multifamily real estate operations, and communities under contract for sale. Such properties are included in Aimco's Net Asset Value as described in notes on page 19. |
15
Footnotes (continued)
2. | Represents Aimco's estimated current NOI cap rate for its Stabilized Portfolio, which was calculated by Aimco on a property-by-property basis, based primarily on information published by CBRE in its 1H 2017 Cap Rate Survey. CBRE is a nationally recognized provider of real estate data. Such Survey includes ranges of current cap rates based on the following community characteristics: market in which the community is located; infill or suburban location within the market; property quality grade; and whether the community is stabilized or value-add. In estimating the appropriate current cap rate for its Stabilized Portfolio, Aimco categorized communities in the portfolio using the framework described above and, using its judgment and detailed knowledge of each community’s condition and location, other than the exceptions noted below, Aimco selected an appropriate current cap rate from within the range provided in CBRE's Cap Rate Survey. The results of this analysis are detailed on the following page. |
16
Footnotes (continued)
2.(continued)
3Q 2017 Stabilized Portfolio | ||||||||||||||
Range of CBRE Cap Rates for Aimco's Portfolio | ||||||||||||||
Communities | Apartment Homes | Average Revenue per Apartment Home | Average Rent as a Percentage of Market Average | Quality Grade | Low | High | Aimco Selected Cap Rate | |||||||
Atlanta | 5 | 817 | $1,772 | 155 | % | A | 5.3% | 5.8% | 5.6% | |||||
Bay Area | 14 | 2,449 | 2,802 | 97 | % | B | 4.3% | 4.9% | 4.7% | |||||
Boston | 14 | 4,379 | 1,761 | 78 | % | C+ | 5.9% | 6.5% | 6.1% | |||||
Chicago | 9 | 2,882 | 1,726 | 118 | % | B | 5.2% | 5.6% | 5.7% | a | ||||
Denver | 7 | 1,925 | 1,686 | 124 | % | B | 5.2% | 5.8% | 5.5% | |||||
Greater Washington, DC | 12 | 5,085 | 1,635 | 89 | % | C+ | 5.5% | 6.2% | 5.8% | |||||
Los Angeles | 12 | 3,826 | 2,914 | 153 | % | A | 4.0% | 4.5% | 4.2% | |||||
Miami | 5 | 2,640 | 2,297 | 147 | % | A | 4.1% | 4.6% | 4.3% | |||||
New York | 18 | 1,040 | 3,389 | 106 | % | B | 4.5% | 5.3% | 4.4% | b | ||||
Philadelphia | 3 | 1,320 | 1,714 | 123 | % | B | 5.2% | 5.8% | 5.7% | |||||
San Diego | 12 | 2,423 | 1,917 | 103 | % | B | 4.9% | 5.4% | 5.6% | a | ||||
Seattle | 2 | 239 | 2,361 | 130 | % | A | 4.8% | 5.3% | 4.9% | |||||
Other Markets | 10 | 3,010 | 1,730 | 123 | % | B | 5.0% | 5.4% | 5.4% | |||||
Total/Weighted Average | 123 | 32,035 | $2,059 | 112 | % | B | 4.8% | 5.3% | 5.1% | |||||
a. | Based on the quality of its communities and locations within the market, Aimco estimates the current NOI cap rates for its Chicago and San Diego portfolios are slightly higher than the high end of the range of cap rates indicated by the results of Aimco's analysis using the CBRE Cap Rate Survey. |
b. | Aimco estimates the current NOI cap rates for its communities located in New York City are on average 10 basis points lower than the low end of the range of cap rates that is indicated by the results of Aimco's analysis using the CBRE Cap Rate Survey. Aimco believes this lower cap rate is appropriate because the Survey reflects cap rates for the New York City metro area while Aimco's portfolio is concentrated in Manhattan, where today cap rates are lower. |
17
Footnotes (continued)
3. | Represents the value of seven communities currently under redevelopment: The Palazzo at Park La Brea, located in Los Angeles, California; Saybrook Pointe, located in San Jose, California; Parc Mosaic (formerly Eastpointe), located in Boulder, Colorado; Yorktown, located in Lombard, Illinois; Calhoun Beach Club, located in Minneapolis, Minnesota; and Park Towne Place and The Sterling, both located in Center City Philadelphia, Pennsylvania. Such communities are valued based on discounted cash flows using the following assumptions: |
a. | Revenues: based on in-place rents, projected submarket rent growth to property stabilization based on the average of projections published by REIS and AXIOmetrics, and the impacts of redevelopment. |
b. | Expenses: estimated operating costs adjusted for inflation as projected by Moody's Economy.com; management fee equal to 2% of projected revenue. |
c. | Cost to complete construction: based on current estimates. Please see Supplemental Schedule 10 to Aimco’s 3Q 2017 Earnings Release for additional information and descriptions of these redevelopments. |
d. | Terminal value: based on current market cap rate plus 5 basis points per year from September 30, 2017, to property stabilization. |
e. | Sales cost: 1.00 - 2.00% of terminal value. |
f. | Discount rate: 6.00% - 7.15% depending on construction and lease-up progress at September 30, 2017. |
4. | Represents the value of two communities that completed lease-up earlier in 2017 but that have not yet achieved stabilized operations: One Canal located in Boston, Massachusetts; and Indigo located in Redwood City, California. Communities are valued based on discounted cash flows using the same assumptions described in note 3 above for redevelopment communities under construction and a discount rate of 6.0%. |
18
Footnotes (continued)
5. | Represents the expected sales price of communities under contract for sale; as well as certain land and non-multifamily real estate valued at cost. |
6. | Represents adjustments to reflect Aimco’s share of the financial results of unconsolidated real estate partnerships and to exclude the non-controlling interest partners’ share of the financial results of consolidated real estate partnerships. |
7. | For the purposes of this Net Asset Value calculation, no realizable value has been assigned to goodwill. |
8. | Asset Management Business represents the present value of the expected future cash flows from various low-income housing tax credit partnerships using a 7% discount rate. Aimco provides asset management and other services to these partnerships and receives fees and other payments in return. To the extent the amounts due Aimco are not paid currently, the balances accrue and are satisfied from the partnerships’ future operating or liquidating cash flow. Platform or re-syndication value has not been included herein. |
9. | Deferred income includes below market lease liabilities related to rent-controlled or rent-stabilized apartment homes, which were recognized under GAAP in connection with purchase of the related apartment communities. Deferred income also includes cash received by Aimco in prior periods required under GAAP to be deferred upon receipt and recognized in income in future periods. For the purposes of this Net Asset Value calculation, Deferred Income is excluded and its impact on NAV is zero. |
19
Footnotes (continued)
10. | Represents the fair value of Aimco's preferred stock, which is estimated by Aimco as the closing stock price on September 30, 2017, less accrued dividends. Such accrued dividends are assumed to be accounted for in the closing stock price and these amounts are also included on Aimco's balance sheet in accrued liabilities. As such, an adjustment is made to the value of Aimco's preferred stock so as not to overstate the fair value of Aimco's liabilities and preferred stock on a combined basis. |
11. | Represents the carrying value of Aimco's non-recourse property debt, adjusted for the mark-to-market liability on Aimco's fixed-rate property debt as of September 30, 2017. Such mark-to-market has been computed by Aimco using a Money-Weighted Average Interest Rate of 4.15% which rate takes into account the timing of amortization and maturities, and a market rate of 3.75%, which takes into account the duration of the existing property debt, the loan-to-value and debt service coverage, as well as timing of amortization and maturities. Refer to Supplemental Schedule 5a to Aimco’s 3Q 2017 Earnings Release for additional information regarding Aimco’s leverage in general and property debt specifically, and a reconciliation of Aimco’s computation of leverage amounts to the most comparable GAAP amounts. |
12. | Represents total shares of Aimco common stock, common partnership units of the Aimco Operating Partnership held by entities other than Aimco, and potential dilutive share equivalents outstanding, which information may be found in Supplemental Schedule 5b to Aimco’s 3Q 2017 Earnings Release. |
20

Definitions
AIMCO OPERATING PARTNERSHIP (OP): AIMCO Properties, L.P., a Delaware limited partnership, is the operating partnership in Aimco's UPREIT structure. Aimco owns approximately 95% of the common partnership units of the Aimco OP.
PORTFOLIO QUALITY RATINGS: Aimco measures portfolio quality based on apartment community rents compared to local market average rents as reported by REIS, a third-party provider of commercial real estate performance information and analysis. Aimco defines portfolio quality as follows: "A" quality apartment communities are those earning rents greater than 125% of the local market average; "B" quality apartment communities are those earning rents between 90% and 125% of the local market average; "C+" quality apartment communities are those earning rents greater than $1,100 per month but lower than 90% of the local market average; and "C" quality apartment communities are those earning rents less than $1,100 per month and lower than 90% of the local market average.
21