Attached files
UNITED STATES | |
SECURITIES AND EXCHANGE COMMISSION | |
Washington, D.C. 20549 | |
_______________________________________ | |
Form 10-K | |
(Mark One) | |
x | ANNUAL REPORT PURSUANT TO SECTION 13 OR 15(d) OF THE SECURITIES EXCHANGE ACT OF 1934 |
For the fiscal year ended December 31, 2017 | |
OR | |
o | TRANSITION REPORT PURSUANT TO SECTION 13 OR 15(d) OF THE SECURITIES EXCHANGE ACT OF 1934 |
For the transition period from to | |
Commission File Number 1-13232 (Apartment Investment and Management Company) | |
Commission File Number 0-24497 (AIMCO Properties, L.P.) | |
Apartment Investment and Management Company | |
AIMCO Properties, L.P. | |
(Exact name of registrant as specified in its charter) | |
Maryland (Apartment Investment and Management Company) | 84-1259577 | ||
Delaware (AIMCO Properties, L.P.) | 84-1275621 | ||
(State or other jurisdiction of incorporation or organization) | (I.R.S. Employer Identification No.) | ||
4582 South Ulster Street, Suite 1100 | |||
Denver, Colorado | 80237 | ||
(Address of principal executive offices) | (Zip Code) | ||
(303) 757-8101 | |||
(Registrant’s telephone number, including area code) | |||
Securities registered pursuant to Section 12(b) of the Act: | |||
Title of Each Class | Name of Each Exchange on Which Registered | ||
Class A Common Stock (Apartment Investment and Management Company) | New York Stock Exchange | ||
Class A Cumulative Preferred Stock (Apartment Investment and Management Company) | New York Stock Exchange | ||
Securities registered pursuant to Section 12(g) of the Act: | |||
None (Apartment Investment and Management Company) | |||
Partnership Common Units (AIMCO Properties, L.P.) | |||
Indicate by check mark if the registrant is a well-known seasoned issuer, as defined by Rule 405 of the Securities Act. | ||
Apartment Investment and Management Company: Yes x No o | AIMCO Properties, L.P.: Yes x No o | |
Indicate by check mark if the registrant is not required to file reports pursuant to Section 13 or Section 15(d) of the Act. | ||
Apartment Investment and Management Company: Yes o No x | AIMCO Properties, L.P.: Yes o No x | |
Indicate by check mark whether the registrant (1) has filed all reports required to be filed by Section 13 or 15(d) of the Securities Exchange Act of 1934 during the preceding 12 months (or for such shorter period that the registrant was required to file such reports), and (2) has been subject to such filing requirements for the past 90 days. | ||
Apartment Investment and Management Company: Yes x No o | AIMCO Properties, L.P.: Yes x No o | |
Indicate by check mark whether the registrant has submitted electronically and posted on its corporate Website, if any, every Interactive Data File required to be submitted and posted pursuant to Rule 405 of Regulation S-T during the preceding 12 months (or for such shorter period that the registrant was required to submit and post such files). | ||
Apartment Investment and Management Company: Yes x No o | AIMCO Properties, L.P.: Yes x No o | |
Indicate by check mark if disclosure of delinquent filers pursuant to Item 405 of Regulation S-K is not contained herein, and will not be contained, to the best of registrant’s knowledge, in definitive proxy or information statements incorporated by reference in Part III of this Form 10-K or any amendment to this Form 10-K. | ||
Apartment Investment and Management Company: Yes o No x | AIMCO Properties, L.P.: Yes x No o | |
Indicate by check mark whether the registrant is a large accelerated filer, an accelerated filer, a non-accelerated filer, or a smaller reporting company. See the definitions of “large accelerated filer,” “accelerated filer,” “non-accelerated filer” and “smaller reporting company” in Rule 12b-2 of the Exchange Act. | |||||
Apartment Investment and Management Company: | |||||
Large accelerated filer | x | Accelerated filer | o | ||
Non-accelerated filer | o | (Do not check if a smaller reporting company) | Smaller reporting company | o | |
Emerging growth company | o | ||||
If an emerging growth company, indicate by check mark if the registrant has elected not to use the extended transition period for complying with any new or revised financial accounting standards provided pursuant to Section 13(a) of the Exchange Act. o | |||||
AIMCO Properties, L.P.: | |||||
Large accelerated filer | o | Accelerated filer | x | ||
Non-accelerated filer | o | (Do not check if a smaller reporting company) | Smaller reporting company | o | |
Emerging growth company | o | ||||
If an emerging growth company, indicate by check mark if the registrant has elected not to use the extended transition period for complying with any new or revised financial accounting standards provided pursuant to Section 13(a) of the Exchange Act. o | |||||
Indicate by check mark whether the registrant is a shell company (as defined in Rule 12b-2 of the Exchange Act). | ||
Apartment Investment and Management Company: Yes o No x | AIMCO Properties, L.P.: Yes o No x | |
The aggregate market value of the voting and non-voting common stock of Apartment Investment and Management Company held by non-affiliates of Apartment Investment and Management Company was approximately $6.7 billion as of June 30, 2017. As of February 27, 2018, there were 157,330,262 shares of Class A Common Stock outstanding. | ||
As of February 27, 2018, there were 164,901,915 Partnership Common Units outstanding. | ||
_______________________________________________________ |
Documents Incorporated by Reference |
Portions of Apartment Investment and Management Company’s definitive proxy statement to be issued in conjunction with Apartment Investment and Management Company’s annual meeting of stockholders to be held May 1, 2018, are incorporated by reference into Part III of this Annual Report. |
EXPLANATORY NOTE
This filing combines the Annual Reports on Form 10-K for the fiscal year ended December 31, 2017, of Apartment Investment and Management Company, or Aimco, and AIMCO Properties, L.P., or the Aimco Operating Partnership. Where it is important to distinguish between the two entities, we refer to them specifically. Otherwise, references to “we,” “us” or “our” mean collectively Aimco, the Aimco Operating Partnership and their consolidated entities.
Aimco, a Maryland corporation, is a self-administered and self-managed real estate investment trust, or REIT. Aimco, through wholly-owned subsidiaries, is the general and special limited partner of and, as of December 31, 2017, owned a 95.5% ownership interest in the common partnership units of, the Aimco Operating Partnership. The remaining 4.5% interest is owned by limited partners. As the sole general partner of the Aimco Operating Partnership, Aimco has exclusive control of the Aimco Operating Partnership’s day-to-day management.
The Aimco Operating Partnership holds all of Aimco’s assets and manages the daily operations of Aimco’s business. Pursuant to the Aimco Operating Partnership agreement, Aimco is required to contribute to the Aimco Operating Partnership any assets which it may acquire including all proceeds from the offerings of its securities. In exchange for the contribution of these assets, Aimco receives additional interests in the Aimco Operating Partnership with similar terms (e.g., if Aimco contributes proceeds of a stock offering, Aimco receives partnership units with terms substantially similar to the stock issued by Aimco).
We believe combining the periodic reports of Aimco and the Aimco Operating Partnership into this single report provides the following benefits:
• | We present our business as a whole, in the same manner our management views and operates the business; |
• | We eliminate duplicative disclosure and provide a more streamlined and readable presentation because a substantial portion of the disclosures apply to both Aimco and the Aimco Operating Partnership; and |
• | We save time and cost through the preparation of a single combined report rather than two separate reports. |
We operate Aimco and the Aimco Operating Partnership as one enterprise, the management of Aimco directs the management and operations of the Aimco Operating Partnership, and the members of the Board of Directors of Aimco are identical to those of the Aimco Operating Partnership.
We believe it is important to understand the few differences between Aimco and the Aimco Operating Partnership in the context of how Aimco and the Aimco Operating Partnership operate as a consolidated company. Aimco has no assets or liabilities other than its investment in the Aimco Operating Partnership. Also, Aimco is a corporation that issues publicly traded equity from time to time, whereas the Aimco Operating Partnership is a partnership that has no publicly traded equity. Except for the net proceeds from stock offerings by Aimco, which are contributed to the Aimco Operating Partnership in exchange for additional limited partnership interests (of a similar type and in an amount equal to the shares of stock sold in the offering), the Aimco Operating Partnership generates all remaining capital required by its business. These sources include the Aimco Operating Partnership’s working capital, net cash provided by operating activities, borrowings under its revolving credit facility, the issuance of debt and equity securities, including additional partnership units, and proceeds received from the sale of apartment communities.
Equity, partners’ capital and noncontrolling interests are the main areas of difference between the consolidated financial statements of Aimco and those of the Aimco Operating Partnership. Interests in the Aimco Operating Partnership held by entities other than Aimco, which we refer to as OP Units, are classified within partners’ capital in the Aimco Operating Partnership’s financial statements and as noncontrolling interests in Aimco’s financial statements.
To help investors understand the differences between Aimco and the Aimco Operating Partnership, this report provides separate consolidated financial statements for Aimco and the Aimco Operating Partnership; a single set of consolidated notes to such financial statements that includes separate discussions of each entity’s stockholders’ equity or partners’ capital, as applicable; and a combined Management’s Discussion and Analysis of Financial Condition and Results of Operations section that includes discrete information related to each entity.
This report also includes separate Part II, Item 9A. Controls and Procedures sections and separate Exhibits 31 and 32 certifications for Aimco and the Aimco Operating Partnership in order to establish that the requisite certifications have been made and that Aimco and the Aimco Operating Partnership are both compliant with Rule 13a-15 or Rule 15d-15 of the Securities Exchange Act of 1934, as amended (the “Exchange Act”), and 18 U.S.C. §1350.
APARTMENT INVESTMENT AND MANAGEMENT COMPANY
AIMCO PROPERTIES, L.P.
TABLE OF CONTENTS
ANNUAL REPORT ON FORM 10-K
For the Fiscal Year Ended December 31, 2017
Item | Page | |
1. | ||
1A. | ||
1B. | ||
2. | ||
3. | ||
4. | ||
5. | ||
6. | ||
7. | ||
7A. | ||
8. | ||
9. | ||
9A. | ||
9B. | ||
10. | ||
11. | ||
12. | ||
13. | ||
14. | ||
15. | ||
16. | ||
FORWARD-LOOKING STATEMENTS
The Private Securities Litigation Reform Act of 1995 provides a “safe harbor” for forward-looking statements in certain circumstances. Certain information included in this Annual Report contains or may contain information that is forward-looking, within the meaning of the federal securities laws, including, without limitation, statements regarding: our ability to maintain current or meet projected occupancy, rental rates and property operating results; the effect of acquisitions, dispositions, redevelopments and developments; our ability to meet budgeted costs and timelines, and achieve budgeted rental rates related to our redevelopment and development investments; expectations regarding sales of our apartment communities and the use of proceeds thereof; and our ability to comply with debt covenants, including financial coverage ratios.
Actual results may differ materially from those described in these forward-looking statements and, in addition, will be affected by a variety of risks and factors, some of which are beyond our control, including, without limitation:
• | Real estate and operating risks, including fluctuations in real estate values and the general economic climate in the markets in which we operate and competition for residents in such markets; national and local economic conditions, including the pace of job growth and the level of unemployment; the amount, location and quality of competitive new housing supply; the timing of acquisitions, dispositions, redevelopments and developments; and changes in operating costs, including energy costs; |
• | Financing risks, including the availability and cost of capital markets’ financing; the risk that our cash flows from operations may be insufficient to meet required payments of principal and interest; and the risk that our earnings may not be sufficient to maintain compliance with debt covenants; |
• | Insurance risks, including the cost of insurance, natural disasters and severe weather such as hurricanes; and |
• | Legal and regulatory risks, including costs associated with prosecuting or defending claims and any adverse outcomes; the terms of governmental regulations that affect us and interpretations of those regulations; and possible environmental liabilities, including costs, fines or penalties that may be incurred due to necessary remediation of contamination of apartment communities presently or previously owned by us. |
In addition, our current and continuing qualification as a real estate investment trust involves the application of highly technical and complex provisions of the Internal Revenue Code and depends on our ability to meet the various requirements imposed by the Internal Revenue Code, through actual operating results, distribution levels and diversity of stock ownership.
Readers should carefully review our financial statements and the notes thereto, as well as the section entitled “Risk Factors” described in Item 1A of this Annual Report and the other documents we file from time to time with the Securities and Exchange Commission.
PART I
Item 1. Business
The Company
Apartment Investment and Management Company, or Aimco, is a Maryland corporation incorporated on January 10, 1994. Aimco is a self-administered and self-managed real estate investment trust, or REIT, focused on the ownership, management, redevelopment and limited development of quality apartment communities located in some of the largest markets in the United States.
Aimco, through its wholly-owned subsidiaries, AIMCO-GP, Inc. and AIMCO-LP Trust, owns a majority of the ownership interests in AIMCO Properties, L.P., or the Aimco Operating Partnership, a Delaware limited partnership formed on May 16, 1994. Aimco conducts all of its business and owns all of its assets through the Aimco Operating Partnership.
As of December 31, 2017, we had ownership interests in 182 apartment communities with 43,802 apartment homes.
Business Overview
Our business activities are defined by a commitment to our core values of integrity, respect, collaboration, performance and a focus on our customers. These values and our corporate mission, “to consistently provide quality apartment homes in a respectful environment delivered by a team of people who care,” shape our culture. In all of our interactions with residents, team members, business partners, lenders, and equity holders, we aim to be the best owner and operator of apartment communities and an outstanding corporate citizen.
2
Our principal financial objective is to provide predictable and attractive returns to our equity holders. We measure our current return using Adjusted Funds From Operations and our long-term return using Economic Income (each of which are defined under the Non-GAAP Measures heading in Item 7). Our business plan to achieve this principal financial objective is to:
• | operate our portfolio of desirable apartment homes with a high level of focus on customer selection and customer satisfaction and in an efficient manner that produces predictable and growing Free Cash Flow, which is defined under the Operational Excellence heading, below; |
• | improve our portfolio of apartment communities, which is diversified both by geography and by price point by selling apartment communities with lower projected free cash flow internal rates of return and investing the proceeds from such sales through capital enhancements, redevelopment, development, and acquisitions with greater land value, higher expected rent growth, and projected free cash flow internal rates of return in excess of those expected from the communities sold; |
• | use low levels of financial leverage primarily in the form of non-recourse, long-dated, fixed-rate property debt and perpetual preferred equity, a combination which reduces our refunding and re-pricing risk and which provides a hedge against increases in interest rates; and |
• | focus intentionally on a collaborative and productive culture based on respect for others and personal responsibility. |
Our business is organized around five areas of strategic focus: operational excellence; redevelopment; portfolio management; balance sheet; and team and culture. Our areas of strategic focus are described in more detail below. Recent accomplishments in the execution of such strategies are discussed in the Executive Overview in Item 7.
Operational Excellence
We own and operate a portfolio of market rate apartment communities diversified by both geography and price point, which we refer to as our Real Estate portfolio. At December 31, 2017, our Real Estate portfolio included 136 apartment communities with 36,904 apartment homes in which we held an average ownership of 99%. This portfolio was divided about two thirds by value to our “Same Store” portfolio of stabilized apartment communities and about one third by value to “Other Real Estate,” which includes recently acquired communities and communities under redevelopment or development whose long-term financial contribution is not yet stabilized.
We also held nominal ownership positions in partnerships that own 46 low-income housing tax credit apartment communities with 6,898 apartment homes. We provide services to these partnerships and receive fees and other payments in return. Our relationship with these partnerships is different than real estate ownership and is better described as an asset management business, or Asset Management.
To manage our property operations efficiently and to increase the benefits from our local management expertise, we give direct responsibility for operations within each area to area operations leaders with regular oversight by senior management. To enable the area operations leaders to focus on sales and service, as well as to improve financial control and budgeting, we have dedicated area financial officers who support the operations leaders. Additionally, with the exception of routine maintenance and purchases and installation of equipment, we have specialized teams that manage capital spending related to larger and more complicated construction.
We seek to improve our property operations by: employing service-oriented, well-trained team members; taking advantage of advances in technology; centralizing operational tasks where efficient to do so; standardizing business processes, operational measurements, and internal reporting; and enhancing financial controls over field operations. We focus on the following areas:
• | Customer Satisfaction. Our operating culture is focused on our residents and providing them with a high level of service in a clean, safe, and respectful living environment. We regularly monitor and evaluate our performance by providing customers with numerous opportunities to grade our work. In 2017, we received 84,000 customer grades averaging 4.25 on a five-point scale. We use this customer feedback as a daily management tool. We also publish on-line these customer evaluations as important and credible information for prospective customers. We have automated certain aspects of our on-site operations to enable current and future residents to interact with us using methods that are efficient and effective for them, such as making on-line requests for service work and executing leases and lease renewals on-line. In addition, we emphasize the quality of our on-site team members through recruiting, training and retention programs, which, with the continuous, real-time customer feedback, contributes to improved customer service. We believe that greater customer satisfaction leads to higher resident retention and increased occupancy rates, which in turn leads to increased revenue and reduced costs. |
• | Resident Selection and Retention. In our apartment communities, we believe that one’s neighbors are a meaningful part of the customer experience, together with the location of the community and the physical quality of the apartment homes. |
3
Part of our property operations strategy is to focus on attracting and retaining stable, credit-worthy residents who are also good neighbors. We have explicit criteria for resident selection, which we apply to new leases and to renewal leases, including creditworthiness and behavior in accordance with our community standards and our written “Good Neighbor Commitment.” Our focus on resident selection and retention led to 53% of expiring leases being renewed in 2017, which is above peer average.
• | Revenue Management and Ancillary Services. We have a centralized revenue management system that leverages people, processes, and technology to work in partnership with our local property management teams to develop rental rate pricing. We seek to increase Free Cash Flow, which we define as net operating income less Capital Replacements, by optimizing the balance between rental and occupancy rates, as well as taking into consideration costs such as preparing an apartment home for a new resident. We are focused on careful measurements of on-site operations, as we believe that timely and accurate collection of apartment community performance and resident profile data will enable us to maximize Free Cash Flow through better property management and leasing decisions. We seek to maximize profit by performing timely data analysis of new and renewal pricing for each apartment home, thereby enabling us to adjust rents quickly in response to changes in supply and demand and minimize vacancy time. We also generate incremental revenue by providing services to our residents, including, at certain apartment communities, telecommunications services, parking options, package lockers, and storage space rental. |
• | Controlling Expenses. Innovation is the foundation of our cost control efforts. Innovative activities include: moving administrative tasks to our shared service center, which reduces costs and allows site teams to focus on sales and service; taking advantage of economies of scale at the corporate level, through electronic procurement which reduces complexity and increases purchasing volume discounts; focusing on life cycle costs by investing in more durable, longer-lived materials, which reduce turn times and costs; and leveraging technology to enhance the customer experience through website design and package lockers, which meet today’s customer preference for self-service. For the year ended December 31, 2017 compared to 2016, Same Store property operating expenses increased by 0.7%. Same Store controllable operating expenses, which we define as property operating expenses excluding taxes, insurance and utility expenses, decreased by 1.3%. The compounded annual growth rate for Same Store controllable operating expenses for the past decade is negative 0.4%. |
• | Improving and Maintaining Apartment Community Quality. We believe that the physical condition and amenities of our apartment communities are important factors in our ability to maintain and increase rental rates. We invest in the maintenance and improvement of our apartment communities primarily through: Capital Enhancements, which may include kitchen and bath remodeling, energy conservation projects, and investments in longer-lived materials as described above, all of which are generally lesser in scope than is a redevelopment and do not significantly disrupt property operations; Capital Improvements, which extend the useful life of an apartment community from its condition at our date of purchase; and Capital Replacements, which are capital additions made to replace the portion of an apartment community consumed during our ownership. During 2017, we invested approximately $2,800 per apartment home in Capital Enhancements, $470 per apartment home in Capital Improvements, and $1,050 per apartment home in Capital Replacements. |
Redevelopment
Redevelopment is our second line of business where we create value equal to 25% to 35% of our incremental investment by repositioning communities within the Aimco portfolio and by constructing new communities. We measure the rate and quality of financial returns by Net Asset Value creation, an important component of Economic Income, our primary measure of long-term financial performance (Net Asset Value is defined under the Non-GAAP Measures heading in Item 7). We invest to earn risk-adjusted returns in excess of those expected from the apartment communities sold in paired trades to fund the redevelopment and development.
We undertake a range of redevelopments, including those in which buildings or exteriors are renovated without the need to vacate apartment homes; those in which significant renovation of apartment homes may be accomplished upon lease expiration and turnover; and those in which an entire building or community is vacated. We often execute redevelopments using a phased approach, in which we renovate an apartment community in stages. Redevelopment work may include seeking entitlements from local governments, which enhance the value of our existing portfolio by increasing density, that is, the right to add apartment homes to a site.
We also undertake ground-up development when warranted by risk-adjusted investment returns, either directly in connection with the redevelopment of an existing apartment community or, on a more limited basis, at a new location. When warranted, we rely on the expertise and credit of a third-party developer familiar with the local market to limit our exposure to construction risk.
Of these two activities, we favor redevelopment because it permits adjustment of the scope and timing of spending to align with changing market conditions and customer preferences.
4
Portfolio Management
Our portfolio management strategy involves the allocation of investment capital to enhance rent growth and increase long term capital values through portfolio design emphasizing land value as well as location and submarket. We target geographic diversification in our portfolio in order to reduce the volatility of our rental revenue and to reduce the risk of undue concentration in any particular market. Similarly, we seek price point diversification by owning communities that offer apartment homes at rents below those asked by competitive new building supply.
Our portfolio of apartment communities is diversified across “A,” “B,” and “C+” price points, averaging “B/B+” in quality and is also diversified among some of the largest markets in the United States. Please refer to the Executive Overview heading under Item 7 for a description of our portfolio quality ratings. At December 31, 2017, our Real Estate portfolio was allocated about one half to “A” rated properties, and about one half to “B” and “C+” rated properties.
As part of our portfolio strategy, we seek to sell up to 10% of our portfolio annually and to reinvest the proceeds from such sales in accretive uses such as capital enhancements, redevelopments, occasional developments, and selective acquisitions with projected free cash flow internal rates of return higher than expected from the communities being sold. Through this disciplined approach to capital recycling, we have significantly increased the quality and expected rental rate growth of our portfolio.
Balance Sheet
Our leverage strategy seeks to increase financial returns while using leverage with appropriate caution. We limit risk through balance sheet structure, employing low leverage, primarily non-recourse and long-dated property debt; build financial flexibility by maintaining ample unused and available credit as well as holding properties with substantial value unencumbered by property debt; and use partners’ capital when it enhances financial returns or reduces investment risk.
We target the ratio of Proportionate Debt plus Preferred Equity to Adjusted EBITDA to be below 7.0x and we target the ratio of Adjusted EBITDA to Adjusted Interest Expense and Preferred Dividends to be greater than 2.5x. Please refer to the Non-GAAP Measures heading under Item 7 for definitions of these terms. Our leverage includes our share of long-term, non-recourse property debt secured by apartment communities in our Real Estate portfolio, our term loan, outstanding borrowings under our revolving credit facility, and outstanding preferred equity.
Our liquidity consists of cash balances and available capacity on our revolving line of credit. At December 31, 2017, we had on hand $616.6 million in cash and restricted cash plus available capacity on our line of credit.
We also manage our financial flexibility by maintaining an investment grade rating and holding apartment communities that are unencumbered by property debt. At December 31, 2017, we held unencumbered apartment communities with an estimated fair market value of approximately $1.8 billion, up 12.5% year-over year.
Please refer to the Executive Overview and Liquidity and Capital Resources headings under Item 7 for additional information regarding our balance sheet and liquidity.
Team and Culture
Our team and culture are keys to our success. Our intentional focus on a collaborative and productive culture based on respect for others and personal responsibility is reinforced by a preference for promotion from within based on succession planning and talent development to produce a strong, stable team that is the enduring foundation of our success. In 2017, Aimco was recognized by the Denver Post as a Top Work Place. We are one of only a dozen Colorado companies of all sizes that have earned this designation for five consecutive years.
Competition
In attracting and retaining residents to occupy our apartment communities, we compete with numerous other housing providers. Our apartment communities compete directly with other rental apartments as well as condominiums and single-family homes that are available for rent or purchase in the markets in which our apartment communities are located. Principal factors of competition include rent or price charged, attractiveness of the location and apartment community, and the quality and breadth of services. The number of competitive apartment communities relative to demand in a particular area has a material effect on our ability to lease apartment homes at our communities and on the rents we charge. In certain markets, there exists an oversupply of newly-constructed apartment homes, single-family homes, and condominiums relative to consumer demand, which affects the pricing and occupancy of our rental apartments.
We also compete with other real estate investors, including other apartment REITs, pension and investment funds, partnerships, and investment companies in acquiring, redeveloping, managing, obtaining financing for, and disposing of apartment communities. This competition affects our ability to acquire apartment communities we want to add to our portfolio and the price that we pay
5
in such acquisitions; our ability to finance or refinance communities in our portfolio and the cost of such financing; and our ability to dispose of communities we no longer desire to retain in our portfolio and the timing and price available to us when we seek to dispose of such communities.
Taxation
Aimco
Aimco has elected to be taxed as a REIT under the Internal Revenue Code of 1986, as amended, which we refer to as the Code, commencing with our taxable year ended December 31, 1994, and intends to continue to operate in such a manner. The Code imposes various requirements related to organizational structure, distribution levels, diversity of stock ownership, and certain restrictions with regard to owned assets and categories of income that must be met in order to continue to qualify as a REIT. If Aimco continues to qualify for taxation as a REIT, Aimco will generally not be subject to United States federal corporate income tax on its taxable income that is currently distributed to stockholders. This treatment substantially eliminates the “double taxation” (at the corporate and stockholder levels) that generally results from an investment in a corporation.
Certain of Aimco’s operations or a portion thereof, including property management and risk management are conducted through taxable REIT subsidiaries, each of which we refer to as a TRS. A TRS is a subsidiary C-corporation that has not elected REIT status and, as such, is subject to United States federal corporate income tax. We use TRS entities to facilitate our ability to offer certain services and activities to our residents and investment partners that cannot be offered directly by a REIT. We also use TRS entities to hold investments in certain apartment communities.
The Aimco Operating Partnership
The Aimco Operating Partnership is treated as a “pass-through” entity for United States federal income tax purposes and is not subject to United States federal income taxation. Partners in the Aimco Operating Partnership, however, are subject to tax on their allocable share of partnership income, gains, losses, deductions, and credits, regardless of whether the partners receive any actual distributions of cash or other property from the Aimco Operating Partnership during the taxable year. Generally, the characterization of any particular item is determined by the Aimco Operating Partnership, rather than at the partner level, and the amount of a partner’s allocable share of such item is governed by the terms of the Aimco Operating Partnership’s Partnership Agreement. The Aimco Operating Partnership is subject to tax in certain states.
Regulation
General
Apartment communities and their owners are subject to various laws, ordinances, and regulations, including those related to real estate broker licensing and regulations relating to recreational facilities such as swimming pools, activity centers and other common areas. Changes in laws increasing the potential liability for environmental conditions existing on apartment communities or increasing the restrictions on discharges or other conditions, as well as changes in laws affecting development, construction, and safety requirements, may result in significant unanticipated expenditures, which would adversely affect our net income and cash flows from operating activities. In addition, existing rent control laws, as well as future enactment of rent control or rent stabilization laws, such as legislation that has been considered in New York and certain cities in California, or other laws regulating multifamily housing may reduce rental revenue or increase operating costs in particular markets.
Environmental
Various federal, state, and local laws subject apartment community owners or operators to liability for management, and the costs of removal or remediation, of certain potentially hazardous materials that may be present at an apartment community. These materials may include lead-based paint, asbestos, polychlorinated biphenyls, and petroleum-based fuels. Such laws often impose liability without regard to fault or whether the owner or operator knew of, or was responsible for, the release or presence of such materials. In connection with the ownership, operation, and management of apartment communities, we could potentially be liable for environmental liabilities or costs associated with our current apartment communities, communities we acquire or manage in the future, or communities we previously owned or operated in the past. These and other risks related to environmental matters are described in more detail in Item 1A. Risk Factors.
Insurance
Our primary lines of insurance coverage are property, general liability, and workers’ compensation. We believe that our insurance coverages adequately insure our apartment communities against the risk of loss attributable to fire, earthquake, hurricane, tornado, flood, terrorism, and other perils, and adequately insure us against other risk. Our coverage includes deductibles, retentions and
6
limits that are customary in the industry. We have established loss prevention, loss mitigation, claims handling, and litigation management procedures to manage our exposure.
Employees
At December 31, 2017, we had approximately 1,350 team members, of which about 1,000 were at the apartment community level performing on-site functions, or at our shared service center performing tasks that have been centralized there, with the balance managing corporate and area functions, including investment and debt transactions, legal, finance and accounting, information systems, human resources and other support functions. As of December 31, 2017, unions represented approximately 80 of our team members. We have never experienced a work stoppage and believe we maintain satisfactory relations with our team members.
Available Information
Our combined Annual Report on Form 10-K, our combined Quarterly Reports on Form 10-Q, Current Reports on Form 8-K filed by Aimco or the Aimco Operating Partnership and any amendments to any of those reports that we file with the Securities and Exchange Commission are available free of charge as soon as reasonably practicable through Aimco’s website at www.aimco.com. The information contained on Aimco’s website is not incorporated into this Annual Report. Aimco’s Common Stock is listed on the New York Stock Exchange under the symbol “AIV.” In 2017, Aimco’s chief executive officer submitted his annual corporate governance listing standards certification to the New York Stock Exchange, which certification was unqualified.
Item 1A. Risk Factors
The risk factors noted in this section and other factors noted throughout this Annual Report, describe certain risks and uncertainties that could cause our actual results to differ materially from those contained in any forward-looking statement.
Redevelopment, development and construction risks could affect our profitability.
We are currently redeveloping certain of our apartment communities. During 2018, we expect to invest $120 million to $200 million in redevelopment and development activities. Redevelopment and development are subject to numerous risks, including the following:
• | we may be unable to obtain, or experience delays in obtaining, necessary zoning, occupancy, or other required governmental or third-party permits and authorizations, which could result in increased costs or the delay or abandonment of opportunities; |
• | we may incur costs that exceed our original estimates due to increased material, labor or other costs, such as litigation; |
• | we may be unable to complete construction and lease-up of an apartment community on schedule, resulting in increased construction and financing costs and a decrease in expected rental revenues; |
• | occupancy rates and rents at an apartment community may fail to meet our expectations for a number of reasons, including changes in market and economic conditions beyond our control and the development of competing communities; |
• | we may be unable to obtain financing with favorable terms, or at all, which may cause us to delay or abandon an opportunity; |
• | we may abandon opportunities that we have already begun to explore, or stop projects we have already commenced, for a number of reasons, including changes in local market conditions or increases in construction or financing costs, and, as a result, we may fail to recover costs already incurred in exploring those opportunities; |
• | we may incur liabilities to third parties during the redevelopment or development process; |
• | unexpected events or circumstances may arise during the redevelopment or development process that affect the timing of completion and the cost and profitability of the redevelopment or development; and |
• | loss of a key member of a redevelopment or development team could adversely affect our ability to deliver redevelopments and developments on time and within our budget. |
Failure to generate sufficient net operating income may adversely affect our liquidity, limit our ability to fund necessary capital expenditures or adversely affect our ability to pay dividends or distributions.
Our ability to fund necessary capital expenditures on our apartment communities depends on, among other things, our ability to generate net operating income in excess of required debt payments. If we are unable to fund capital expenditures on our apartment communities, we may not be able to preserve the competitiveness of our communities, which could adversely affect their net operating income and long term value.
7
Our ability to make payments to our investors depends on our ability to generate net operating income in excess of required debt payments and capital expenditure requirements. Our net operating income and liquidity may be adversely affected by events or conditions beyond our control, including:
• | the general economic climate; |
• | an inflationary environment in which the costs to operate and maintain our communities increase at a rate greater than our ability to increase rents, which we can only do upon renewal of existing leases or at the inception of new leases; |
• | competition from other apartment communities and other housing options; |
• | local conditions, such as loss of jobs, unemployment rates, or an increase in the supply of apartments, that might adversely affect apartment occupancy or rental rates; |
• | changes in governmental regulations and the related cost of compliance; |
• | changes in tax laws and housing laws, including the enactment of rent control laws or other laws regulating multifamily housing; and |
• | changes in interest rates and the availability of financing. |
Competition could limit our ability to lease apartment homes or increase or maintain rents.
Our apartment communities compete for residents with other housing alternatives, including other rental apartments and condominiums, and, to a lesser degree, single-family homes that are available for rent, as well as new and existing condominiums and single-family homes for sale. Competitive residential housing as well as household formation and job creation in a particular area could adversely affect our ability to lease apartment homes and to increase or maintain rental rates.
Because real estate investments are relatively illiquid, we may not be able to sell apartment communities when appropriate.
Real estate investments are relatively illiquid and generally cannot be sold quickly. REIT tax rules also restrict our ability to sell apartment communities. Thus, we may not be able to change our portfolio promptly in response to changes in economic or other market conditions. Our ability to dispose of apartment communities in the future will depend on prevailing economic and market conditions, including the cost and availability of financing. This could have a material adverse effect on our financial condition or results of operations.
If we are not successful in our acquisition of apartment communities, our results of operations could be adversely affected.
The selective acquisition of apartment communities is a component of our strategy. However, we may not be able to complete transactions successfully in the future. Although we seek to acquire apartment communities when such acquisitions increase our free cash flow internal rate of returns and are accretive to Net Asset Value, such transactions may fail to perform in accordance with our expectations. In particular, following acquisition, the value and operational performance of an apartment community may be diminished if obsolescence or neighborhood changes occur before we are able to redevelop or sell the community. This could have an adverse effect on our financial condition or results of operations.
Our existing and future debt financing could result in foreclosure of our apartment communities, prevent us from making distributions on our equity, or otherwise adversely affect our liquidity.
We are subject to the risk that our cash flow from operations will be insufficient to make required payments of principal and interest, and the risk that existing indebtedness may not be refinanced or that the terms of any refinancing will not be as favorable as the terms of existing indebtedness. If we fail to make required payments of principal and interest on our non-recourse debt, our lenders could foreclose on the apartment communities and other collateral securing such debt, which would result in the loss to us of income and asset value. As of December 31, 2017, the majority of our apartment communities were encumbered by debt. Our organizational documents do not limit the amount of debt that we may incur, and we have significant amounts of debt outstanding. Payments of principal and interest may leave us with insufficient cash resources to operate our communities or pay distributions required to be paid in order to maintain Aimco’s qualification as a REIT.
Disruptions in the financial markets could affect our ability to obtain financing and the cost of available financing and could adversely affect our liquidity.
Our ability to obtain financing and the cost of such financing depends on the overall condition of the United States credit markets. During periods of economic uncertainty, the United States credit markets may experience significant liquidity disruptions, which may cause the spreads on debt financings to widen considerably and make obtaining financing, both non-recourse property debt and corporate borrowings, such as those under our revolving credit agreement, more difficult. In particular, apartment
8
borrowers have benefited from the historic willingness of Federal National Mortgage Association, or Fannie Mae, and the Federal Home Loan Mortgage Corporation, or Freddie Mac, to make substantial amounts of loans secured by multi-family properties, even in times of economic distress. These two lenders are federally chartered and subject to federal regulation, making uncertain their prospects and ability to provide liquidity in a future downturn.
If our ability to obtain financing is adversely affected, we may be unable to satisfy scheduled maturities on existing financing through other sources of liquidity, which could result in lender foreclosure on the apartment communities securing such debt and loss of income and asset value, each of which would adversely affect our liquidity.
Increases in interest rates would increase our interest expense and reduce our profitability.
As of December 31, 2017, we had approximately $399.8 million of variable-rate indebtedness outstanding associated with our Real Estate portfolio. We estimate that an increase in 30-day LIBOR of 100 basis points with constant credit risk spreads would reduce our net income and the amount of net income attributable to our common security holders (including Aimco common stockholders and the Aimco Operating Partnership’s common unitholders) by approximately $3.8 million on an annual basis.
At December 31, 2017, our Real Estate portfolio had approximately $95.3 million in cash and cash equivalents and restricted cash, a portion of which bear interest at variable rates indexed to LIBOR-based rates, which may partially mitigate the effect of an increase in variable rates on our variable-rate indebtedness discussed above.
Covenant restrictions may limit our ability to make payments to our investors.
Some of our debt and other securities contain covenants that restrict our ability to make distributions or other payments to our investors unless certain financial tests or other criteria are satisfied. Our revolving credit agreement provides, among other things, that we may not make distributions to our investors during any four consecutive fiscal quarters in an aggregate amount greater than 95% of our Funds From Operations for such period, subject to certain non-cash adjustments, or such amount as may be necessary to maintain Aimco’s REIT status. Our outstanding classes of preferred stock or preferred units prohibit the payment of dividends on our Common Stock or common partnership units if we fail to pay the dividends to which the holders of the preferred stock or preferred units are entitled.
The Aimco Operating Partnership and its subsidiaries may be prohibited from making distributions and other payments.
All of Aimco’s apartment communities are owned, and all of Aimco’s operations are conducted, by the Aimco Operating Partnership. Further, many of the Aimco Operating Partnership’s apartment communities are owned by subsidiaries of the Aimco Operating Partnership. As a result, Aimco depends on distributions and other payments from the Aimco Operating Partnership, and the Aimco Operating Partnership depends on distributions and payments from its subsidiaries in order to satisfy our financial obligations and make payments to our investors. The ability of the Aimco Operating Partnership and its subsidiaries to make such distributions and other payments depends on their earnings and cash flows and may be subject to statutory or contractual limitations. As an equity investor in the Aimco Operating Partnership and its subsidiaries, our right to receive assets upon their liquidation or reorganization will be effectively subordinated to the claims of their creditors. To the extent that we are recognized as a creditor of such subsidiaries, our claims may still be subordinate to any security interest in or other lien on their assets and to any of their debt or other obligations that are senior to our claims.
Potential liability or other expenditures associated with potential environmental contamination may be costly.
Various federal, state and local laws subject apartment community owners or operators to liability for management, and the costs of removal or remediation, of certain potentially hazardous materials that may be present in the land or buildings of an apartment community. Potentially hazardous materials may include polychlorinated biphenyls, petroleum-based fuels, lead-based paint, or asbestos, among other materials. Such laws often impose liability without regard to fault or whether the owner or operator knew of, or was responsible for, the presence of such materials. The presence of, or the failure to manage or remediate properly, these materials may adversely affect occupancy at such apartment communities as well as the ability to sell or finance such apartment communities. In addition, governmental agencies may bring claims for costs associated with investigation and remediation actions, damages to natural resources and for potential fines or penalties in connection with such damage or with respect to the improper management of hazardous materials. Moreover, private plaintiffs may potentially make claims for investigation and remediation costs they incur or personal injury, disease, disability or other infirmities related to the alleged presence of hazardous materials at an apartment community. In addition to potential environmental liabilities or costs associated with our current apartment communities, we may also be responsible for such liabilities or costs associated with communities we acquire or manage in the future, or apartment communities we no longer own or operate.
9
Laws benefiting disabled persons may result in our incurrence of unanticipated expenses.
Under the Americans with Disabilities Act of 1990, or ADA, all places intended to be used by the public are required to meet certain federal requirements related to access and use by disabled persons. The Fair Housing Amendments Act of 1988, or FHAA, requires apartment communities first occupied after March 13, 1991, to comply with design and construction requirements for disabled access. For those apartment communities receiving federal funds, the Rehabilitation Act of 1973 also has requirements regarding disabled access. These and other federal, state and local laws may require structural modifications to our apartment communities or changes in policy/practice, or affect renovations of the communities. Noncompliance with these laws could result in the imposition of fines or an award of damages to private litigants and also could result in an order to correct any non-complying feature, which could result in substantial capital expenditures. Although we believe that our apartment communities are substantially in compliance with present requirements, we may incur unanticipated expenses to comply with the ADA, the FHAA and the Rehabilitation Act of 1973 in connection with the ongoing operation or redevelopment of our apartment communities.
Moisture infiltration and resulting mold remediation may be costly.
Although we are proactively engaged in managing moisture intrusion and preventing the presence of mold at our apartment communities, it is not unusual for periodic moisture intrusion to cause mold in isolated locations within an apartment community. We have implemented policies, procedures and training, and include a detailed moisture intrusion and mold assessment during acquisition due diligence. We believe these measures will manage mold exposure at our apartment communities and will minimize the effects that mold may have on our residents. To date, we have not incurred any material costs or liabilities relating to claims of mold exposure or to abate mold conditions. We have only limited insurance coverage for property damage claims arising from the presence of mold and for personal injury claims related to mold exposure.
Government housing regulations may limit the opportunities at some of our apartment communities and failure to comply with resident qualification requirements may result in financial penalties and/or loss of benefits, such as rental revenues paid by government agencies. Additionally, the government may cease to operate or reduce funding for government housing programs which would result in a loss of benefits from those programs.
We own equity interests in consolidated and unconsolidated entities that own certain apartment communities that benefit from governmental programs intended to provide housing to people with low or moderate incomes. These programs, which are usually administered by the United States Department of Housing and Urban Development, or HUD, or state housing finance agencies, typically provide one or more of the following: mortgage insurance; favorable financing terms; tax-exempt interest; historic or low-income housing tax credits; or rental assistance payments to the apartment community owners. As a condition of the receipt of assistance under these programs, the apartment communities must comply with various requirements, which typically limit rents to pre-approved amounts and limit our choice of residents to those with incomes at or below certain levels. Failure to comply with these requirements may result in financial penalties or loss of benefits. We are usually required to obtain the approval of HUD in order to acquire or dispose of a significant interest in or manage a HUD-assisted apartment community. We may not always receive such approval.
Additionally, there is no guarantee that the government will continue to operate these programs or that the programs will be operated in a manner that generates benefits consistent with those received in the past. Any cessation of or change in the administration of benefits from these government housing programs may result in our loss or reduction in the amount of the benefits we receive under these programs, including rental subsidies. During 2017, 2016 and 2015, rental revenues for our Real Estate portfolio included $30.6 million, $30.9 million and $25.6 million, respectively, from subsidies from government agencies. Of the 2017 subsidies, approximately 23.9% related to communities sold during 2017 leaving about $7.1 million related to communities benefiting from housing assistance contracts that expire in 2018, which we are in the process of renewing or anticipate renewing, and $16.2 million related to communities benefiting from housing assistance contracts that expire after 2018 and had a weighted average term of 8.0 years. Any loss or reduction in the amount of these benefits may adversely affect our liquidity and results of operations.
We also hold nominal ownership positions in partnerships owning low-income housing tax credit communities. We provide services to these partnerships and receive fees and other payments in return. We refer to this relationship as our Asset Management business. During 2017, 2016 and 2015, rental revenues of communities owned by partnerships served by our Asset Management business included $49.0 million, $49.3 million and $47.8 million, respectively, of subsidies from government agencies.
Although we are insured for certain risks, the cost of insurance, increased claims activity or losses resulting from casualty events may affect our operating results and financial condition.
We are insured for a portion of our consolidated apartment communities’ exposure to casualty losses resulting from fire, earthquake, hurricane, tornado, flood and other perils, which insurance is subject to deductibles and self-insurance retention. We recognize casualty losses or gains based on the net book value of the affected apartment community and the amount of any related
10
insurance proceeds. In many instances, the actual cost to repair or replace the apartment community may exceed its net book value and any insurance proceeds. We recognize the uninsured portion of losses as casualty losses in the periods in which they are incurred. In addition, we are self-insured for a portion of our exposure to third-party claims related to our employee health insurance plans, workers’ compensation coverage and general liability exposure. With respect to our exposure to claims of third parties, we establish reserves at levels that reflect our known and estimated losses. The ultimate cost of losses and the impact of unforeseen events may vary materially from recorded reserves, and variances may adversely affect our operating results and financial condition. We purchase insurance to reduce our exposure to losses and limit our financial losses on large individual risks. The availability and cost of insurance are determined by market conditions outside our control. No assurance can be made that we will be able to obtain and maintain insurance at the same levels and on the same terms as we do today. If we are not able to obtain or maintain insurance in amounts we consider appropriate for our business, or if the cost of obtaining such insurance increases materially, we may have to retain a larger portion of the potential loss associated with our exposures to risks.
Natural disasters and severe weather may affect our operating results and financial condition.
Natural disasters such as earthquakes and severe weather such as hurricanes may result in significant damage to our apartment communities. The extent of our casualty losses and loss in operating income in connection with such events is a function of the severity of the event and the total amount of exposure in the affected area. When we have geographic concentration of exposures, a single catastrophe (such as an earthquake) or destructive weather event (such as a hurricane) affecting a region may have a significant adverse effect on our financial condition and results of operations. We cannot accurately predict natural disasters or severe weather, or the number and type of such events that will affect us. As a result, our operating and financial results may vary significantly from one period to the next. Although we anticipate and plan for losses, there can be no assurance that our financial results will not be adversely affected by our exposure to losses arising from natural disasters or severe weather in the future that exceed our previous experience and assumptions.
We depend on our senior management.
Our success depends upon the retention of our senior management, including Terry Considine, our chief executive officer. We have a succession planning and talent development process that is designed to identify potential replacements and develop our team members to provide depth in the organization and a bench of talent on which to draw. However, there are no assurances that we would be able to find qualified replacements for the individuals who make up our senior management if their services were no longer available. The loss of services of one or more members of our senior management team could have a material adverse effect on our business, financial condition and results of operations. We do not currently maintain key-man life insurance for any of our employees.
Aimco may fail to qualify as a REIT.
If Aimco fails to qualify as a REIT, Aimco will not be allowed a deduction for dividends paid to its stockholders in computing its taxable income, and will be subject to United States federal income tax at regular corporate rates. This would substantially reduce our funds available for distribution to our investors. Unless entitled to relief under certain provisions of the Code, Aimco also would be disqualified from taxation as a REIT for the four taxable years following the year during which it ceased to qualify as a REIT. In addition, Aimco’s failure to qualify as a REIT would place us in default under our revolving credit agreement.
We believe that Aimco operates, and has since its taxable year ended December 31, 1994 operated, in a manner that enables it to meet the requirements for qualification as a REIT for United States federal income tax purposes. Aimco’s continued qualification as a REIT will depend on its satisfaction of certain asset, income, investment, organizational, distribution, stockholder ownership and other requirements on a continuing basis. Aimco’s ability to satisfy the asset tests depends upon our analysis of the fair market values of our assets, some of which are not susceptible to a precise determination, and for which we do not obtain independent appraisals. Aimco’s compliance with the REIT annual income and quarterly asset requirements also depends upon our ability to manage successfully the composition of our income and assets on an ongoing basis. Moreover, the proper classification of an instrument as debt or equity for United States federal income tax purposes may be uncertain in some circumstances, which could affect the application of the REIT qualification requirements. Accordingly, there can be no assurance that the Internal Revenue Service, or the IRS, will not contend that our interests in subsidiaries or other issuers constitutes a violation of the REIT requirements. Moreover, future economic, market, legal, tax or other considerations may cause Aimco to fail to qualify as a REIT, or Aimco’s Board of Directors may determine to revoke its REIT status.
REIT distribution requirements limit our available cash.
As a REIT, Aimco is subject to annual distribution requirements. The Aimco Operating Partnership pays distributions intended to enable Aimco to satisfy its distribution requirements. This limits the amount of cash available for other business purposes, including amounts to fund our growth. Aimco generally must distribute annually at least 90% of its REIT taxable income, determined without regard to the dividends paid deduction and excluding any net capital gain, in order for its distributed earnings not to be
11
subject to United States federal corporate income tax. We intend to make distributions to Aimco’s stockholders to comply with the requirements of the Code. However, differences in timing between the recognition of taxable income and the actual receipt of cash could require us to sell apartment communities or borrow funds on a short-term or long-term basis to meet the 90% distribution requirement of the Code.
Aimco may be subject to federal and state income taxes, in certain circumstances.
Even if Aimco qualifies as a REIT, Aimco may be subject to United States federal income and excise taxes in various situations, such as on its undistributed income. Aimco could also be required to pay a 100% tax on any net income on non-arm’s length transactions between Aimco and a taxable REIT subsidiary and on any net income from sales of apartment communities that were held for sale primarily in the ordinary course. State and local tax laws may not conform to the United States federal income tax treatment, and Aimco may be subject to state or local taxation in various state or local jurisdictions in which Aimco transacts business. Any taxes imposed on Aimco would reduce our operating cash flow and net income and could negatively impact our ability to pay dividends and distributions.
Dividends payable by REITs do not qualify for the reduced tax rates available for some dividends.
REITs are entitled to a U.S. federal tax deduction for dividends paid to their stockholders. As compared to other taxable corporations, this ability to reduce or eliminate the REIT’s taxable income by paying dividends to stockholders is a principal benefit of maintaining REIT status, generally resulting in a lower combined tax liability of the REIT and its stockholders as compared to that of the combined tax liability of other taxable corporations and their stockholders. Notwithstanding this combined benefit, dividends payable by REITs may result in marginally higher taxes to the stockholder.
C-corporations are generally required to pay U.S. federal income tax on earnings. After tax earnings are then available for stockholder dividends. The maximum U.S. federal tax rate applicable to income from "qualified dividends" payable to U.S. stockholders that are individuals, trusts and estates is currently 20%, plus the 3.8% investment tax surcharge. While dividends payable by REITs are generally not eligible for the qualified dividend reduced rates, stockholders that are individuals, trusts or estates may deduct 20% of the aggregate amount of ordinary dividends from REITs. This deduction is available for taxable years beginning after December 31, 2017 and before January 1, 2026 and will generally cause the maximum tax rate for ordinary dividends from REITs to be 29.6%, plus the 3.8% investment tax surcharge.
Beginning in 2018, REIT dividends payable to individuals, trusts and estates can be taxed at 20% for capital gains and qualified dividends, 25% for unrecaptured Section 1250 gains, or 29.6% for ordinary dividends, whereas qualified dividends from C-corporations are generally taxed at 20%. Both are subject to the 3.8% investment tax surcharge. Based on the character of Aimco’s 2017 REIT dividends, the effective U.S. federal income tax rate that would be be paid on Aimco’s 2018 dividends by stockholders who are individuals, trusts and estates would be 25.5% before considering the 3.8% investment tax surcharge. To the extent, the character of Aimco’s 2018 REIT dividends are similar to that of 2017, Aimco dividends would be taxed at a marginal rate 5.5% higher than the rate for a C-corporation dividend. In 2017, the ordinary income portion of of Aimco’s REIT taxable income was elevated compared to prior years. If the character of Aimco’s 2018 REIT dividends are similar to the average of the last three years, Aimco dividends would be taxed at a marginal rate 4.6% higher than the rate for a C-corporation dividend.
Changes to U.S. federal income tax laws could materially and adversely affect Aimco and Aimco's stockholders.
The present U.S. federal income tax treatment of REITs may be modified, possibly with retroactive effect, by legislative, judicial or administrative action at any time, which could affect the U.S. federal income tax treatment of an investment in Aimco Common Stock. The U.S. federal income tax rules dealing with REITs constantly are under review by persons involved in the legislative process, the IRS and the U.S. Treasury Department, which results in statutory changes as well as frequent revisions to regulations and interpretations. The recently enacted Tax Cuts and Jobs Act made substantial changes to the Code. Among those changes are a significant permanent reduction in the generally applicable corporate tax rate, changes in the taxation of individuals and other non-corporate taxpayers that generally but not universally reduce their tax rates on a temporary basis subject to ‘‘sunset” provisions, the elimination or modification of various currently allowed deductions (including substantial limitations on the deductibility of interest and, in the case of individuals, the deduction for personal state and local taxes), certain additional limitations on the deduction of net operating losses, and preferential rates of taxation on most ordinary REIT dividends and certain business income derived by noncorporate taxpayers in comparison to other ordinary income recognized by such taxpayers. The effect of these and the many other changes made in the Tax Cuts and Jobs Act is highly uncertain, both in terms of their direct effect on the taxation of an investment in our common stock and their indirect effect on market conditions generally. Furthermore, many of the provisions of the Tax Cuts and Jobs Act will require guidance through the issuance of Treasury regulations in order to assess their effect. There may be a substantial delay before such regulations are promulgated, increasing the uncertainty as to the ultimate effect of the statutory amendments on Aimco. There may also be technical corrections legislation proposed with respect to the Tax Cuts and Jobs Act, the effect and timing of which cannot be predicted and may be adverse to Aimco or Aimco's stockholders.
12
Investors are urged to consult their tax advisors with respect to these changes and the potential effect on their investment in Aimco’s Common Stock.
Limits on ownership of shares specified in Aimco’s charter may result in the loss of economic and voting rights by purchasers that violate those limits.
Aimco’s charter limits ownership of Common Stock by any single stockholder (applying certain “beneficial ownership” rules under the federal securities laws) to 8.7% (or up to 12.0% upon a waiver from Aimco’s Board of Directors) of outstanding shares of Common Stock, or 15% in the case of certain pension trusts, registered investment companies and Mr. Considine (or up to 18.0% for such pension trusts or registered investment companies upon a waiver from Aimco’s Board of Directors). Aimco’s charter also limits ownership of Aimco’s Common Stock and preferred stock by any single stockholder to 8.7% of the value of the outstanding Common Stock and preferred stock, or 15% in the case of certain pension trusts, registered investment companies and Mr. Considine. The charter also prohibits anyone from buying shares of Aimco’s capital stock if the purchase would result in Aimco losing its REIT status. This could happen if a transaction results in fewer than 100 persons owning all of Aimco’s shares of capital stock or results in five or fewer persons (applying certain attribution rules of the Code) owning 50% or more of the value of all of Aimco’s shares of capital stock. If anyone acquires shares in excess of the ownership limit or in violation of the ownership requirements of the Code for REITs:
• | the transfer will be considered null and void; |
• | we will not reflect the transaction on Aimco’s books; |
• | we may institute legal action to enjoin the transaction; |
• | we may demand repayment of any dividends received by the affected person on those shares; |
• | we may redeem the shares; |
• | the affected person will not have any voting rights for those shares; and |
• | the shares (and all voting and dividend rights of the shares) will be held in trust for the benefit of one or more charitable organizations designated by Aimco. |
Aimco may purchase the shares of capital stock held in trust at a price equal to the lesser of the price paid by the transferee of the shares or the then current market price. If the trust transfers any of the shares of capital stock, the affected person will receive the lesser of the price paid for the shares or the then current market price. An individual who acquires shares of capital stock that violate the above rules bears the risk that the individual:
• | may lose control over the power to dispose of such shares; |
• | may not recognize profit from the sale of such shares if the market price of the shares increases; |
• | may be required to recognize a loss from the sale of such shares if the market price decreases; and |
• | may be required to repay to us any dividends received from us as a result of his or her ownership of the shares. |
Aimco’s charter may limit the ability of a third-party to acquire control of Aimco.
The 8.7% and other ownership limits discussed above may have the effect of delaying or precluding acquisition by a third-party of control of Aimco without the consent of Aimco’s Board of Directors. Aimco’s charter authorizes its Board of Directors to issue up to 510,587,500 shares of capital stock. As of December 31, 2017, 500,787,260 shares were classified as Common Stock, of which 157,189,447 were outstanding, and 9,800,240 shares were classified as preferred stock, of which 5,000,000 were outstanding. Under Aimco’s charter, its Board of Directors has the authority to classify and reclassify any of Aimco’s unissued shares of capital stock into shares of capital stock with such preferences, conversion or other rights, voting power restrictions, limitations as to dividends, qualifications or terms or conditions of redemptions as the Board of Directors may determine. The authorization and issuance of a new class of capital stock could have the effect of delaying or preventing someone from taking control of Aimco, where there is a difference of opinion between the Aimco Board of Directors and others as to what is in Aimco’s stockholders’ best interests.
The Maryland General Corporation Law may limit the ability of a third-party to acquire control of Aimco.
As a Maryland corporation, Aimco is subject to various Maryland laws that may have the effect of discouraging offers to acquire Aimco and increasing the difficulty of consummating any such offers, where there is a difference of opinion between the Aimco Board of Directors and others as to what is in Aimco’s stockholders’ best interests. The Maryland General Corporation Law, specifically the Maryland Business Combination Act, restricts mergers and other business combination transactions between Aimco
13
and any person who acquires, directly or indirectly, beneficial ownership of shares of Aimco’s stock representing 10% or more of the voting power without Aimco’s Board of Directors’ prior approval. Any such business combination transaction could not be completed until five years after the person acquired such voting power, and generally only with the approval of stockholders representing 80% of all votes entitled to be cast and 66-2/3% of the votes entitled to be cast, excluding the interested stockholder, or upon payment of a fair price. The Maryland General Corporation Law, specifically the Maryland Control Share Acquisition Act, provides generally that a person who acquires shares of Aimco’s capital stock representing 10% or more of the voting power in electing directors will have no voting rights unless approved by a vote of two-thirds of the shares eligible to vote. Additionally, the Maryland General Corporation Law provides, among other things, that the board of directors has broad discretion in adopting stockholders’ rights plans and has the sole power to fix the record date, time and place for special meetings of the stockholders. To date, Aimco has not adopted a stockholders’ rights plan. In addition, the Maryland General Corporation Law provides that a corporation that:
• | has at least three directors who are not officers or employees of the entity or related to an acquiring person; and |
• | has a class of equity securities registered under the Securities Exchange Act of 1934, as amended, |
may elect in its charter or bylaws or by resolution of the board of directors to be subject to all or part of a special subtitle that provides that:
• | the corporation will have a staggered board of directors; |
• | any director may be removed only for cause and by the vote of two-thirds of the votes entitled to be cast in the election of directors generally, even if a lesser proportion is provided in the charter or bylaws; |
• | the number of directors may only be set by the board of directors, even if the procedure is contrary to the charter or bylaws; |
• | vacancies may only be filled by the remaining directors, even if the procedure is contrary to the charter or bylaws; and |
• | the secretary of the corporation may call a special meeting of stockholders at the request of stockholders only on the written request of the stockholders entitled to cast at least a majority of all the votes entitled to be cast at the meeting, even if the procedure is contrary to the charter or bylaws. |
To date, Aimco has not made any of the elections described above.
Item 1B. Unresolved Staff Comments
None.
14
Item 2. Properties
Additional information about our consolidated apartment communities is contained in “Schedule III - Real Estate and Accumulated Depreciation” in this Annual Report on Form 10-K. Refer to Note 4 to the consolidated financial statements in Item 8 for additional information regarding property debt.
Our Real Estate portfolio is diversified by both price point and geography and consists of market rate apartment communities in which we own a substantial interest. Our Real Estate portfolio includes garden style, mid-rise and high-rise apartment communities located in 22 states and the District of Columbia. Our portfolio strategy seeks predictable rent growth from a portfolio of apartment communities diversified among some of the largest markets in the United States, and that is diversified across “A,” “B” and “C+” price points, averaging “B/B+” in quality. As of December 31, 2017, our Real Estate portfolio consisted of roughly one half “A” quality communities and one half “B” and “C+” quality communities (as measured by gross asset value). Please refer to the Executive Overview heading under Item 7 for a description of our portfolio quality ratings. The following table sets forth information on the apartment communities in our Real Estate portfolio as of December 31, 2017:
Number of Apartment Communities | Number of Apartment Homes | Average Economic Ownership | |||||||
Atlanta | 5 | 817 | 100 | % | |||||
Bay Area | 16 | 3,236 | 100 | % | |||||
Boston | 15 | 4,689 | 100 | % | |||||
Chicago | 10 | 3,246 | 100 | % | |||||
Denver | 8 | 2,065 | 98 | % | |||||
Greater New York | 18 | — | 1,040 | 100 | % | ||||
Greater Washington, DC | 13 | 5,325 | 99 | % | |||||
Los Angeles | 13 | 4,347 | 100 | % | |||||
Miami | 5 | 2,652 | 100 | % | |||||
Philadelphia | 5 | 2,796 | 97 | % | |||||
San Diego | 12 | 2,423 | 97 | % | |||||
Seattle | 2 | 239 | 100 | % | |||||
Other markets | 14 | 4,029 | 97 | % | |||||
Total Real Estate portfolio | 136 | 36,904 | 99 | % | |||||
At December 31, 2017, we owned an equity interest in 136 apartment communities with 36,904 apartment homes in our Real Estate portfolio. We consolidated 132 of these apartment communities with 36,762 apartment homes.
These consolidated apartment communities contained, on average, 279 apartment homes, with the largest community containing 2,113 apartment homes. These apartment communities offer residents a range of amenities, including resort pools with cabanas, grills, clubhouses, spas, fitness centers, package lockers, dog parks and large open spaces. Many of the apartment homes offer features such as granite countertops, wood flooring, stainless steel appliances, fireplaces, spacious closets, washer and dryer connections, balconies and patios.
The majority of our consolidated apartment communities are encumbered by property debt. At December 31, 2017, apartment communities in our Real Estate portfolio were encumbered by, in aggregate, $3.5 billion of property debt with a weighted average interest rate of 4.6% and a weighted average maturity of 7.2 years. The apartment communities collateralizing this non-recourse property debt have an estimated aggregate fair value of $10.9 billion. At December 31, 2017, we held unencumbered apartment communities with an estimated fair value of approximately $1.8 billion.
At December 31, 2017, we also held nominal ownership positions in partnerships that own 46 apartment communities with 6,898 apartment homes that qualify for low-income housing tax credits and are structured to provide for the pass through of tax credits and tax deductions to their partners. We provide asset management and other services to these partnerships and receive fees and other payments in return. In accordance with accounting principles generally accepted in the United States of America, or GAAP, we consolidate most of these partnerships, which own an aggregate of 39 apartment communities with 6,211 apartment homes.
Item 3. Legal Proceedings
As further discussed in Note 5 to the consolidated financial statements in Item 8, we are engaged in discussions with regulatory agencies regarding environmental matters at apartment communities we, or predecessor entities, previously owned. Although the outcome of these matters is uncertain, we do not expect the resolution to have a material adverse effect on our consolidated financial condition, results of operations or cash flows.
15
Additionally, as further discussed in Note 3 to the consolidated financial statements in Item 8, in January 2018 we reached an agreement to settle litigation pertaining to the ownership of a property we acquired in 2014.
Item 4. Mine Safety Disclosures
Not applicable.
16
PART II
Item 5. Market for the Registrant’s Common Equity, Related Stockholder Matters and Issuer Purchases of Equity Securities
Aimco
Aimco’s Common Stock has been listed and traded on the NYSE under the symbol “AIV” since July 22, 1994. The following table sets forth the quarterly high and low sales prices of our Common Stock, as reported on the NYSE, and the dividends declared in the periods indicated:
Quarter Ended | High | Low | Dividends Declared (per share) | ||||||||
December 31, 2017 | $ | 45.47 | $ | 43.15 | $ | 0.36 | |||||
September 30, 2017 | 46.45 | 42.42 | 0.36 | ||||||||
June 30, 2017 | 44.99 | 42.64 | 0.36 | ||||||||
March 31, 2017 | 46.53 | 43.11 | 0.36 | ||||||||
December 31, 2016 | $ | 45.45 | $ | 39.88 | $ | 0.33 | |||||
September 30, 2016 | 47.59 | 43.30 | 0.33 | ||||||||
June 30, 2016 | 44.16 | 39.57 | 0.33 | ||||||||
March 31, 2016 | 41.82 | 35.45 | 0.33 | ||||||||
Aimco’s Board of Directors determines and declares its dividends. In making a dividend determination, Aimco’s Board of Directors considers a variety of factors, including: REIT distribution requirements; current market conditions; liquidity needs; and other uses of cash, such as for deleveraging and accretive investment activities. Aimco’s Board of Directors targets a dividend payout ratio between 65% and 70% of Adjusted Funds From Operations (which is defined in Item 7). In January 2018, Aimco’s Board of Directors declared a cash dividend of $0.38 per share on its Common Stock. On an annualized basis, this represents an increase of 6% compared to the dividends paid in 2017. This dividend is payable on February 28, 2018, to stockholders of record on February 16, 2018. Aimco’s Board of Directors anticipates similar per share quarterly cash dividends for the remainder of 2018. However, the Board of Directors may adjust the dividend amount or the frequency with which the dividend is paid based on then prevailing circumstances.
On February 27, 2018, the closing price of Aimco Common Stock was $38.43 per share, as reported on the NYSE, and there were 157,330,262 shares of Common Stock outstanding, held by 1,741 stockholders of record. The number of holders does not include individuals or entities who beneficially own shares but whose shares are held of record by a broker or clearing agency, but does include each such broker or clearing agency as one record holder.
As a REIT, Aimco is required to distribute annually to holders of its Common Stock at least 90% of its “real estate investment trust taxable income,” which, as defined by the Code and United States Department of Treasury regulations, is generally equivalent to net taxable ordinary income.
From time to time, Aimco may issue shares of Common Stock in exchange for OP Units, defined under The Aimco Operating Partnership heading below. Please refer to Note 7 to the consolidated financial statements in Item 8 for further discussion of such exchanges. Aimco may also issue shares of Common Stock in exchange for limited partnership interests in consolidated real estate partnerships. During the year ended December 31, 2017, Aimco did not issue any shares of Common Stock in exchange for OP Units or limited partnership interests in consolidated real estate partnerships.
Aimco’s Board of Directors has, from time to time, authorized Aimco to repurchase shares of its outstanding capital stock. There were no repurchases of Aimco shares during the year ended December 31, 2017. As of December 31, 2017, Aimco was authorized to repurchase approximately 19.3 million shares. This authorization has no expiration date. These repurchases may be made from time to time in the open market or in privately negotiated transactions.
17
Performance Graph
The following graph compares cumulative total returns for Aimco’s Common Stock, the MSCI US REIT Index, the NAREIT Apartment Index, and the Standard & Poor’s 500 Total Return Index (the “S&P 500”). The MSCI US REIT Index is published by Morgan Stanley Capital International Inc., a provider of equity indices. The NAREIT Apartment Index is published by The National Association of Real Estate Investment Trusts, or NAREIT, a representative of real estate investment trusts and publicly traded real estate companies with interests in United States real estate and capital markets. The MSCI REIT Index reflects total shareholder return for a broad range of REITs and the NAREIT Apartment Index provides a more direct multifamily peer comparison of total shareholder return. The indices are weighted for all companies that fit the definitional criteria of the particular index and are calculated to exclude companies as they are acquired and to add companies to the index calculation as they become publicly traded companies. All companies that fit the definitional criteria and existed at the point in time presented are included in the index calculations. The graph assumes the investment of $100 in Aimco’s Common Stock and in each index on December 31, 2012, and that all dividends paid have been reinvested. The historical information set forth below is not necessarily indicative of future performance.
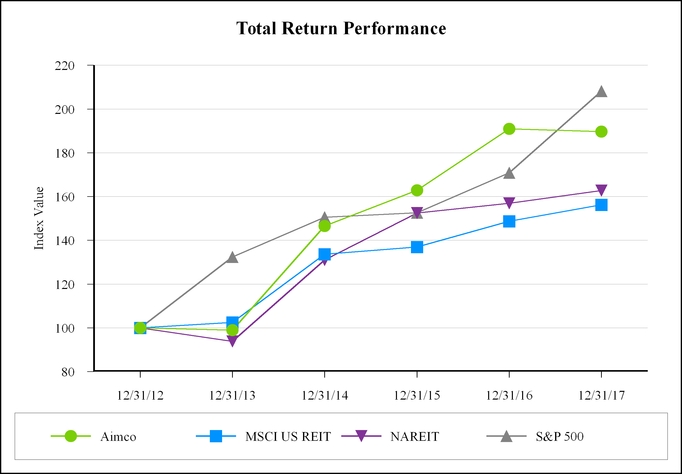
For the fiscal years ended December 31, | ||||||||||||||||||
Index | 2012 | 2013 | 2014 | 2015 | 2016 | 2017 | ||||||||||||
Aimco (1) | $ | 100.00 | $ | 98.95 | $ | 146.49 | $ | 162.81 | $ | 190.96 | $ | 189.68 | ||||||
MSCI US REIT (1) | 100.00 | 102.47 | 133.60 | 136.97 | 148.75 | 156.29 | ||||||||||||
NAREIT Apartment Index (2) | 100.00 | 93.80 | 130.97 | 152.52 | 156.88 | 162.72 | ||||||||||||
S&P 500 (1) | 100.00 | 132.39 | 150.51 | 152.59 | 170.84 | 208.14 | ||||||||||||
(1) Source: S&P Global Market Intelligence © 2018
(2) Source: National Association of Real Estate Investment Trusts
The Performance Graph will not be deemed to be incorporated by reference into any filing by Aimco under the Securities Act of 1933, as amended, or the Securities Exchange Act of 1934, as amended, except to the extent that Aimco specifically incorporates the same by reference.
18
The Aimco Operating Partnership
Interests in the Aimco Operating Partnership that are held by limited partners other than Aimco are referred to as OP Units. OP Units include common partnership units, which we refer to as common OP Units, as well as partnership preferred units, or preferred OP Units. There is no public market for the Aimco Operating Partnership’s common partnership units, including OP Units, and we have no intention of listing the common partnership units on any securities exchange. In addition, the Aimco Operating Partnership’s Partnership Agreement restricts the transferability of common partnership units, including OP Units. The following table sets forth the distributions declared per common partnership unit in each quarterly period during the two years ended December 31, 2017 and 2016:
Quarter Ended | 2017 | 2016 | |||||
December 31 | $ | 0.36 | $ | 0.33 | |||
September 30 | 0.36 | 0.33 | |||||
June 30 | 0.36 | 0.33 | |||||
March 31 | 0.36 | 0.33 | |||||
The Aimco Operating Partnership’s Board of Directors determines and declares its distributions. Aimco, through wholly-owned subsidiaries, is the general and special limited partner of and, as of December 31, 2017, owned a 95.5% ownership interest in the common partnership units of the Aimco Operating Partnership and the Aimco Operating Partnership holds all of Aimco’s assets and manages the daily operations of Aimco’s business. The distributions paid by the Aimco Operating Partnership to Aimco are used by Aimco to fund the dividends paid to its stockholders. Accordingly, the per share dividends Aimco pays to its stockholders generally equal the per share distributions paid by the Aimco Operating Partnership to holders of its common partnership units.
At February 27, 2018, there were 164,901,915 common partnership units and equivalents outstanding (157,330,262 of which were held by Aimco) that were held by 2,624 unitholders of record.
The Aimco Operating Partnership’s Partnership Agreement generally provides that after holding common OP Units for one year, limited partners other than Aimco have the right to redeem their common OP Units for cash or, at our election, shares of Aimco Common Stock.
No common OP Units or preferred OP Units held by Limited Partners were redeemed for shares of Aimco Common Stock during the year ended December 31, 2017.
The following table summarizes the Aimco Operating Partnership’s repurchases of common OP Units for the three months ended December 31, 2017:
Fiscal period | Total Number of Units Purchased | Average Price Paid per Unit | Total Number of Units Purchased as Part of Publicly Announced Plans or Programs | Maximum Number of Units that May Yet Be Purchased Under Plans or Programs | ||||||
October 1 - October 31, 2017 | 1,212 | $ | 45.04 | N/A | N/A | |||||
November 1 - November 30, 2017 | 4,155 | 44.26 | N/A | N/A | ||||||
December 1 - December 31, 2017 | 2,685 | 44.42 | N/A | N/A | ||||||
Total | 8,052 | $ | 44.43 | |||||||
Dividend and Distribution Payments
Our revolving credit agreement includes customary covenants, including a restriction on dividends and other restricted payments, but permits dividends and distributions during any four consecutive fiscal quarters in an aggregate amount of up to 95% of Aimco’s Funds From Operations for such period, subject to certain non-cash adjustments, or such amount as may be necessary to maintain Aimco’s REIT status.
19
Item 6. Selected Financial Data
The following selected financial data is based on audited historical financial statements of Aimco and the Aimco Operating Partnership. This information should be read in conjunction with such financial statements, including the notes thereto, and “Management’s Discussion and Analysis of Financial Condition and Results of Operations” included herein or in previous filings with the Securities and Exchange Commission.
Years Ended December 31, | |||||||||||||||||||
2017 | 2016 | 2015 | 2014 | 2013 | |||||||||||||||
(dollar amounts in thousands, except per share data) | |||||||||||||||||||
OPERATING DATA: | |||||||||||||||||||
Total revenues (1) | $ | 1,005,437 | $ | 995,854 | $ | 981,310 | $ | 984,363 | $ | 974,053 | |||||||||
Net income (1) | 347,079 | 483,273 | 271,983 | 356,111 | 237,825 | ||||||||||||||
Net income attributable to Aimco/the Aimco Operating Partnership per common share/unit – diluted | $ | 1.96 | $ | 2.67 | $ | 1.52 | $ | 2.06 | $ | 1.40 | |||||||||
BALANCE SHEET INFORMATION: | |||||||||||||||||||
Total assets | $ | 6,079,040 | $ | 6,232,818 | $ | 6,118,681 | $ | 6,068,631 | $ | 6,046,579 | |||||||||
Total indebtedness | 3,861,770 | 3,648,206 | 3,599,648 | 3,852,885 | 4,090,653 | ||||||||||||||
Non-recourse property debt of partnerships served by Asset Management business | 227,141 | 236,426 | 249,493 | 255,140 | 265,196 | ||||||||||||||
OTHER INFORMATION: | |||||||||||||||||||
Dividends/distributions declared per common share/unit | $ | 1.44 | $ | 1.32 | $ | 1.18 | $ | 1.04 | $ | 0.96 | |||||||||
(1) | Effective January 1, 2014, we adopted a new accounting standard, which revised the definition of a discontinued operation. In the selected financial data presentation above, for the year ended December 31, 2013, total revenues excludes revenue generated by discontinued operations of $62.2 million and net income includes income from discontinued operations, net of tax, of $203.2 million. |
Item 7. Management’s Discussion and Analysis of Financial Condition and Results of Operations
Executive Overview
We are focused on the ownership, management, redevelopment and limited development of quality apartment communities located in some of the largest markets in the United States.
Our principal financial objective is to provide predictable and attractive returns to our equity holders. We measure our current return using Adjusted Funds From Operations, or AFFO, and our long-term total return using Economic Income. In 2017, AFFO grew by 7.6% to $2.12 per share. Over the last five years, our Economic Income grew at a compound annual return of 13.7%, comprised of 10.6% compounded annual growth in net asset value, or NAV, per share and $5.78 in cash dividends per share paid over the period. We also use Pro forma Funds From Operations, or Pro forma FFO, as a measure of operational performance. Economic Income, NAV, AFFO, and Pro forma FFO are non-GAAP measures and are defined under the Non-GAAP Measures heading below.
Our business and five areas of strategic focus are described in more detail within the Business Overview in Item 1. The results from execution of our business plan in 2017 are further described in the sections that follow.
Net income attributable to common stockholders per common share decreased by $0.71 for the year ended December 31, 2017, as compared to 2016, primarily due to lower gains on the sale of apartment communities and higher depreciation expense, partially offset by increased contribution from property net operating income more fully described below.
Pro forma FFO per share increased $0.13, or 5.6%, for the year ended December 31, 2017, as compared to 2016. The primary driver of this increase was property net operating income growth of $0.11 per share, consisting of:
• | $0.10 from Same Store property net operating income growth of 4.2%, driven primarily by a 3.2% increase in revenue and almost flat expense growth; |
• | $0.12 from the lease-up over the last 12 months of more than 800 renovated homes at redevelopment communities and completion of the lease-up of One Canal in Boston, and Indigo in Redwood City, California; and |
20
• | $0.02 from our Other Real Estate apartment communities, primarily due to rate increases; partially offset by |
• | $0.13 lower property net operating income from apartment communities sold in 2016 to fund redevelopment and development activities and acquisitions. |
As compared to 2016, lower interest rates, higher tax benefit, higher transactional income and other factors, partially offset by lower deferred tax credit income, contributed an additional $0.02 to Pro forma FFO per share.
The $0.13 increase in year-over-year Pro forma FFO per share plus $0.02 in lower capital replacement spending due to fewer apartment homes increased AFFO by $0.15, or 7.6% per share.
Operational Excellence
We own and operate a portfolio of market rate apartment communities diversified by both geography and price point. At December 31, 2017, our Real Estate portfolio included 136 apartment communities with 36,904 apartment homes in which we held an average ownership of approximately 99%.
Our property operations team delivered solid results for our Real Estate portfolio for the year ended December 31, 2017. Highlights include:
• | Same Store net operating income growth greater than 4% for the seventh year in a row; |
• | Same Store rent increases on renewals and new leases averaged 4.6% and 0.6%, respectively, for a weighted average increase of 2.5%; and |
• | Completion of the lease-up of One Canal in Boston, and Indigo in Redwood City, California. |
Our focus on efficient operations through productivity initiatives such as centralization of administrative tasks, optimization of economies of scale at the corporate level, and investment in more durable, longer-lived materials has helped us control operating expenses. As a result of these efforts, our Same Store controllable operating expenses, which we define as property operating expenses before real estate taxes, insurance and utilities, decreased by 1.3% for the year ended December 31, 2017 compared to 2016. The compounded annual growth rate for Same Store controllable operating expenses for the past decade is negative 0.4%.
For the year ended December 31, 2017, our Real Estate portfolio provided 69% net operating income margins and 64% Free Cash Flow margins. Free Cash Flow is defined under the Non-GAAP Measures heading below.
In addition to those communities in our Real Estate portfolio, as of December 31, 2017, we held nominal ownership positions (generally less than 1%) in partnerships that own 46 low-income housing tax credit communities with 6,898 apartment homes. We provide asset management and other services to these partnerships and receive fees and other payments in return. Our relationship with these partnerships is different than real estate ownership and is better described as an Asset Management business. We have limited upside or downside exposure. In accordance with GAAP, we consolidate most of these partnerships and communities, thus reflecting their operating results as though they were our own until our fee and other interests have been repaid, generally upon sale of the underlying communities.
Redevelopment
Our second line of business is the redevelopment and development of apartment communities where we create value equal to 25% to 35% of our incremental investment by repositioning communities within the Aimco portfolio and by constructing new communities. We measure the rate and quality of financial returns by Net Asset Value creation, an important component of Economic Income, our primary measure of long-term financial performance. We invest to earn risk-adjusted returns in excess of those expected from the apartment communities sold in paired trades to fund the redevelopment or development.
We also undertake ground-up development when warranted by risk-adjusted investment returns, either directly in connection with the redevelopment of an existing apartment community or, on a more limited basis, at a new location. When warranted, we rely on the expertise and credit of a third-party developer familiar with the local market to limit our exposure to construction risk.
Of these two activities, we favor redevelopment because it permits adjustment of the scope and timing of spending to align with changing market conditions and customer preferences.
During the year ended December 31, 2017, we invested $172.4 million primarily in our ongoing redevelopment and development projects.
21
During the year ended December 31, 2017, we completed construction on the third tower of Park Towne Place in Center City, Philadelphia. As of December 31, 2017, the first three towers combined were 89% leased with approximately 40 homes remaining to be leased at the third redeveloped tower to reach occupancy stabilization. Based on these results, we decided to proceed with a $40 million redevelopment of the fourth and final tower. We have completed de-leasing and commenced construction on this tower, and lease-up is scheduled to commence in the spring of 2018.
We have planned and entitled a new $117.0 million, 226 apartment home community to be known as Parc Mosaic, located in Boulder, Colorado on the site of our Eastpointe community. As part of this plan, as of December 31, 2017, we completed the de-leasing of Eastpointe and commenced demolition and construction. The site is two miles from the new Google campus and is across the street from Ball Aerospace’s Technology Campus and Foothills Hospital. Building in Boulder is highly regulated and new supply is limited, notwithstanding higher enrollment at the University of Colorado and increased employment generally.
Inclusive of these two new projects, our total estimated net investment in redevelopment and development activities is $714.6 million, with a projected weighted average net operating income yield on these investments of 6.1%, assuming untrended rents. As of December 31, 2017, $513.1 million of this total has been funded.
During 2017, we leased over 800 apartment homes at our redevelopment communities. As of December 31, 2017, our lease-up exposure at active redevelopment and development projects included approximately 611 apartment homes, of which 232 were in the fourth tower of Park Towne Place, which we expect to be available for lease beginning in the summer of 2018 and 215 were in Parc Mosaic, which we expect to be available for lease beginning in the summer of 2019.
See below under the Liquidity and Capital Resources – Redevelopment/Development heading for additional information regarding our redevelopment and development investment during the year ended December 31, 2017.
Portfolio Management
Our portfolio of apartment communities is diversified across “A,” “B,” and “C+” price points, averaging “B/B+” in quality and is diversified across some of the largest markets in the U.S. We measure the quality of apartment communities in our Real Estate portfolio based on average rents of our apartment homes compared to local market average rents as reported by a third-party provider of commercial real estate performance and analysis. Under this rating system, we classify as “A” quality apartment communities those earning rents greater than 125% of the local market average, as “B” quality apartment communities those earning rents between 90% and 125% of the local market average; as “C+” quality apartment communities those earning rents greater than $1,100 per month, but lower than 90% of local market average; and as “C” quality apartment communities those earning rents less than $1,100 per month and lower than 90% of local market average. We classify as “B/B+” quality a portfolio that on average earns rents between 100% and 125% of the local market average rents where the portfolio is located. Although some companies and analysts within the multifamily real estate industry use apartment community quality ratings of “A,” “B,” and “C,” some of which are tied to local market rent averages, the metrics used to classify apartment community quality as well as the period for which local market rents are calculated may vary from company to company. Accordingly, our rating system for measuring apartment community quality is neither broadly nor consistently used in the multifamily real estate industry.
As part of our portfolio strategy, we seek to sell up to 10% of our portfolio annually and to reinvest the proceeds from such sales in accretive uses such as capital enhancements, redevelopments, occasional developments, and selective acquisitions with projected Free Cash Flow internal rates of return higher than expected from the communities being sold. Through this disciplined approach to capital recycling, we have significantly increased the quality and expected growth rate of our portfolio, resulting in a compound annual growth rate in average revenue per Aimco apartment home of 8.8% over the last three years.
Three Months Ended | |||||||
December 31, | |||||||
2017 | 2014 | ||||||
Average Revenue per Aimco apartment home (1) | $ | 2,123 | $ | 1,650 | |||
Portfolio Average Rents as a Percentage of Local Market Average Rents | 113 | % | 108 | % | |||
Percentage A (4Q 2017 Average Revenue per Aimco Apartment Home $2,707) | 53 | % | 45 | % | |||
Percentage B (4Q 2017 Average Revenue per Aimco Apartment Home $1,848) | 32 | % | 33 | % | |||
Percentage C+ (4Q 2017 Average Revenue per Aimco Apartment Home $1,721) | 15 | % | 5 | % | |||
Percentage C | — | % | 17 | % | |||
(1) Represents average monthly rental and other property revenues divided by the number of occupied apartment homes multiplied by our ownership interest in the apartment community as of the end of the current period. | |||||||
22
The quality of our portfolio improved through value created by our redevelopment and transaction activities, contributing to the increase in average revenue per apartment home. The increase is due to rent growth from the improved quality of our portfolio, driven in part by the sale of apartment communities with average monthly revenues per Aimco apartment home lower than those of the retained portfolio, and also by our reinvestment of the sales proceeds through redevelopment, development and acquisition of apartment communities with higher rents and better free cash flow return prospects than the apartment communities sold.
As we execute our portfolio strategy, we expect to increase average revenue per Aimco apartment home for our Real Estate portfolio at a rate greater than market rent growth; increase free cash flow margins; and maintain sufficient geographic and price point diversification to moderate volatility and concentration risk.
During the year ended December 31, 2017, we sold five apartment communities with 2,291 apartment homes for a gain of $297.9 million and gross proceeds of $397.0 million resulting in net proceeds of $381.1 million. Two of these apartment communities were affordable communities located in Washington, DC and Philadelphia, and three were located in southern New Jersey and southern Virginia.
In January 2018, we agreed to sell our interests in the entities owning the La Jolla Cove property in settlement of legal actions filed in 2014 by a group of disappointed buyers who had hoped to acquire the property. As a result of the settlement, we recognized a gross impairment loss of $35.8 million in our 2017 results, $25.6 million of which relates to the establishment of a deferred tax liability assumed in connection with our acquisition of the business entities. Upon closing of the transaction, the tax liability will be assumed by the buyer, resulting in no economic loss. The remaining $10.2 million loss is offset by cash distributions we received during our ownership and avoided legal costs for continued litigation. On an economic basis, we agreed to sell these entities at roughly our purchase price, adjusted for retained cash distributions and avoided legal costs.
Also in January 2018, we sold three additional apartment communities with 513 apartment homes for a gain of approximately $50.0 million, net of tax, and gross proceeds of $71.9 million, resulting in $64.6 million in net proceeds. Two of these communities are located in southern Virginia and one is located in suburban Maryland.
Proceeds from the 2017 and 2018 sales were used to repay outstanding borrowings on our revolving credit facility, effectively funding the equity portion of the Palazzo reacquisition, as further discussed in Note 3 to the consolidated financial statements in Item 8, as well as our 2017 redevelopment and development activities.
Balance Sheet
We target net leverage of $3.8 billion. At December 31, 2017, our leverage of $3.9 billion was above this target due to the timing of the three apartment community sales discussed above that closed in January 2018.
Our leverage includes our share of long-term, non-recourse property debt encumbering apartment communities in our Real Estate portfolio, our term loan, outstanding borrowings on the revolving credit facility and outstanding preferred equity. In our calculation of leverage, we exclude non-recourse property debt obligations of consolidated partnerships served by our Asset Management business, as these are not our obligations and they have limited effect on the amount of fees and other amounts we expect to receive in our role as asset manager for these partnerships.
Our leverage strategy seeks to increase financial returns while using leverage with appropriate caution. We limit risk through balance sheet structure, employing low leverage, primarily non-recourse and long-dated property debt; build financial flexibility by maintaining ample unused and available credit as well as holding properties with substantial value unencumbered by property debt; and use partners’ capital when it enhances financial returns or reduces investment risk.
We target the ratio of Proportionate Debt and Preferred Equity to Adjusted EBITDA to be below 7.0x and we target the ratio of Adjusted EBITDA to Adjusted Interest Expense and Preferred Dividends to be greater than 2.5x.
Proportionate Debt, Adjusted EBITDA and Adjusted Interest Expense, as used in these ratios, are non-GAAP financial measures, which are further discussed and reconciled under the Non-GAAP Measures – Leverage Ratios heading. Preferred Equity represents Aimco’s preferred stock and the Aimco Operating Partnership’s preferred OP Units. Our leverage ratios for the three months ended December 31, 2017, are presented below:
Proportionate Debt to Adjusted EBITDA | 6.5x |
Proportionate Debt and Preferred Equity to Adjusted EBITDA | 6.9x |
Adjusted EBITDA to Adjusted Interest Expense | 3.3x |
Adjusted EBITDA to Adjusted Interest Expense and Preferred Dividends | 3.1x |
23
We calculate our leverage ratios based on the most recent three month amounts, annualized. Our calculation of Adjusted EBITDA in our leverage ratios has been adjusted on a pro forma basis to reflect the disposition of five apartment communities during the period as if the sales had closed on October 1, 2017. The effect of this pro forma adjustment may be found in the Adjusted EBITDA reconciliation under the Non-GAAP Measures heading.
During 2017, we closed or rate-locked nine fixed-rate, non-recourse, amortizing, property loans totaling $550.8 million. On a weighted basis, the term of these loans averaged 9.1 years and their interest rates averaged 3.48%, 123 basis points above the corresponding treasury rates at the time of pricing.
Also during 2017, we restructured five fixed-rate, non-recourse, amortizing, property loans totaling $17.4 million, extending their maturity dates from 2018 to 2023 and reducing their weighted average interest rate from 4.13% to 3.63%.
The net effect of 2017 property debt refinancing activities has been to lower our weighted average fixed interest rates by about 20 basis points to 4.64%, generating prospective annual interest savings of approximately $6.6 million.
Our liquidity consists of cash balances and available capacity on our revolving line of credit. As of December 31, 2017, we had on hand $616.6 million of cash and restricted cash plus available capacity on our revolving line of credit.
We also manage our financial flexibility by maintaining an investment grade rating and holding apartment communities that are unencumbered by property debt. At December 31, 2017, we held unencumbered apartment communities with an estimated fair market value of approximately $1.8 billion, up 12.5% year-over-year.
Two credit rating agencies rate our creditworthiness, using different methodologies and ratios for assessing our credit, and both have rated our credit and outlook as BBB- (stable), an investment grade rating. Although some of the ratios they use are similar to those we use to measure our leverage, there are differences in our methods of calculation and therefore our leverage ratios disclosed above are not indicative of the ratios that may be calculated by these agencies.
For additional information regarding our leverage, please see the discussion under the Liquidity and Capital Resources heading.
Team and Culture
Our team and culture are keys to our success. Our intentional focus on a collaborative and productive culture based on respect for others and personal responsibility is reinforced by a preference for promotion from within based on succession planning and talent development to produce a strong, stable team that is the enduring foundation of our success. In 2017, Aimco was recognized by the Denver Post as a Top Work Place. We are one of only a dozen Colorado companies of all sizes that have earned this designation for five consecutive years.
Key Financial Indicators
The key financial indicators that we use in managing our business and in evaluating our operating performance are Economic Income, our measure of total return, and Adjusted Funds From Operations, our measure of current return. In addition to these indicators, we evaluate our operating performance and financial condition using: Pro forma Funds From Operations; FCF; same store property operating results; proportionate property net operating income; average revenue per effective apartment home; leverage ratios; and net leverage. Certain of these financial indicators are non-GAAP financial measures, which are defined, further described and, for certain of the measures, reconciled to comparable GAAP-based measures under the Non-GAAP Measures heading below.
Results of Operations
Because our operating results depend primarily on income from our apartment communities, the supply of and demand for apartments influences our operating results. Additionally, the level of expenses required to operate and maintain our apartment communities and the pace and price at which we redevelop, acquire and dispose of our apartment communities affect our operating results.
The following discussion and analysis of the results of our operations and financial condition should be read in conjunction with the accompanying consolidated financial statements in Item 8.
Overview
2017 compared to 2016
Net income attributable to Aimco and net income attributable to the Aimco Operating Partnership decreased by $114.6 million and $120.0 million, respectively, for the year ended December 31, 2017 as compared to 2016. The decrease in income was
24
principally due to a decrease in gain on dispositions of real estate and an increase in depreciation and amortization resulting from redeveloped apartment homes placed into service and the completion of One Canal and the acquisition of Indigo in 2016, partially offset by improved operating results as further described below.
2016 compared to 2015
Net income attributable to Aimco and net income attributable to the Aimco Operating Partnership increased by $181.7 million and $190.8 million, respectively, for the year ended December 31, 2016 as compared to 2015. The increase in income was principally due to an increase in gain on dispositions of real estate, partially offset by an increase in depreciation and amortization resulting from redeveloped apartment homes placed into service and the completion of One Canal and the acquisition of Indigo in 2016.
The following paragraphs discuss these and other items affecting the results of operations of Aimco and the Aimco Operating Partnership in more detail.
Property Operations
As described under the preceding Executive Overview heading, our Real Estate segment consists primarily of market rate apartment communities in which we hold a substantial equity ownership interest.
We use proportionate property net operating income to assess the operating performance of our Real Estate portfolio. Proportionate property net operating income reflects our share of rental and other property revenues less direct property operating expenses, including real estate taxes, for consolidated apartment communities we manage. Accordingly, the results of operations of our Real Estate segment discussed below are presented on a proportionate basis and exclude the results of four apartment communities with 142 apartment homes that we neither manage nor consolidate.
We do not include offsite costs associated with property management or casualty-related amounts in our assessment of segment performance. Accordingly, these items are not allocated to our segment results discussed below. Refer to Note 12 in the consolidated financial statements in Item 8 for further discussion regarding our reportable segments, including a reconciliation of these proportionate amounts to consolidated rental and other property revenues and property operating expenses.
Real Estate Proportionate Property Net Operating Income
We classify apartment communities within our Real Estate segment as Same Store and Other Real Estate. Same Store communities are those that have reached a stabilized level of operations as of the beginning of a two-year comparable period and maintained it throughout the current and comparable prior year, and are not expected to be sold within 12 months. Other Real Estate includes apartment communities that do not meet the Same Store definition, including, but not limited to: redevelopment and development apartment communities, which are those currently under construction that have not achieved a stabilized level of operations and those that have been completed in recent years that have not achieved and maintained stabilized operations for both the current and comparable prior year; acquisition apartment communities, which are those we have acquired since the beginning of a two-year comparable period; and communities that we expect to sell within 12 months but do not yet meet the criteria to be classified as held for sale.
As of December 31, 2017, as defined by our segment performance metrics, our Real Estate segment consisted of 92 Same Store communities with 26,386 apartment homes and 37 Other Real Estate communities with 9,863 apartment homes.
From December 31, 2016 to December 31, 2017, on a net basis, our Same Store portfolio decreased by nine communities and decreased by 4,507 apartment homes. These changes consisted of:
• | the addition of three redeveloped apartment communities with 974 apartment homes that were classified as Same Store upon maintaining stabilized operations for the entirety of both periods presented; |
• | the addition of one acquired apartment community with 94 apartment homes that was classified as Same Store because we have now owned it for the entirety of both periods presented; |
• | the reduction of five apartment communities with 2,460 apartment homes for which we commenced redevelopment during the period; |
• | the reduction of two apartment communities with 906 apartment homes we expected to sell during 2017; |
• | the reduction of three apartment communities with 1,696 apartment homes sold during the period; and |
• | the reduction of three apartment communities with 513 apartment homes held for sale. |
25
As of December 31, 2017, our Other Real Estate communities included:
• | 15 apartment communities with 6,386 apartment homes in redevelopment or development; |
• | 2 apartment communities with 578 apartment homes recently acquired; |
• | 4 apartment communities with 604 apartment homes owned that receive forms of government rental assistance; and |
• | 16 apartment communities with 2,295 apartment homes that do not meet the definition of Same Store because they are either subject to agreements that limit the amount by which we may increase rents or have not reached or maintained a stabilized level of occupancy as of the beginning of a two-year comparable period, often due to a casualty event. |
Prior to 2017, five of the Other Real Estate communities were classified as part of our former Affordable segment. The results of operations for these communities are reflected in the comparable periods in the tables below.
Our Real Estate segment results for the years ended December 31, 2017 and 2016, as presented below, are based on the apartment community classifications as of December 31, 2017.
Year Ended December 31, | ||||||||||||||
(in thousands) | 2017 | 2016 | $ Change | % Change | ||||||||||
Rental and other property revenues: | ||||||||||||||
Same Store communities | $ | 587,562 | $ | 569,522 | $ | 18,040 | 3.2 | % | ||||||
Other Real Estate communities | 266,929 | 222,065 | 44,864 | 20.2 | % | |||||||||
Total | 854,491 | 791,587 | 62,904 | 7.9 | % | |||||||||
Property operating expenses: | ||||||||||||||
Same Store communities | 167,356 | 166,134 | 1,222 | 0.7 | % | |||||||||
Other Real Estate communities | 97,830 | 85,502 | 12,328 | 14.4 | % | |||||||||
Total | 265,186 | 251,636 | 13,550 | 5.4 | % | |||||||||
Proportionate property net operating income: | ||||||||||||||
Same Store communities | 420,206 | 403,388 | 16,818 | 4.2 | % | |||||||||
Other Real Estate communities | 169,099 | 136,563 | 32,536 | 23.8 | % | |||||||||
Total | $ | 589,305 | $ | 539,951 | $ | 49,354 | 9.1 | % | ||||||
For the year ended December 31, 2017 compared to 2016, our Real Estate segment’s proportionate property net operating income increased $49.4 million, or 9.1%.
Same Store proportionate property net operating income increased by $16.8 million, or 4.2%. This increase was primarily attributable to an $18.0 million, or 3.2%, increase in rental and other property revenues due to higher average revenues ($59 per effective home), comprised primarily of increases in rental rates. Renewal rents (the rent paid by an existing resident who renewed her lease compared to the rent she previously paid) were up 4.6% for the year ended December 31, 2017, and new lease rents (the rent paid by a new resident compared to the rent paid by the previous resident of the same apartment home) were up 0.6%, resulting in a weighted average increase of 2.5%. The increase in Same Store rental and other property revenues was partially offset by a $1.2 million, or 0.7%, increase in property operating expenses, primarily due to increases in real estate taxes. During the year ended December 31, 2017 compared to 2016, controllable operating expenses, which exclude utility costs, real estate taxes and insurance, decreased by $1.0 million, or 1.3%.
The proportionate property net operating income of Other Real Estate communities increased by $32.5 million, or 23.8%, due to:
• | redevelopment and lease-up activities during the year ended December 31, 2017, which helped contribute to incremental property net operating income of $20.9 million compared to 2016; and |
• | higher property net operating income of $11.6 million from other communities, including the effect of our increased ownership interest in the Palazzo communities from our June 2017 reacquisition of the 47% limited partner interest in the related joint venture. |
26
As of December 31, 2016, as defined by our segment performance metrics, our Real Estate portfolio consisted of 95 Same Store apartment communities with 28,684 apartment homes and 34 Other Real Estate communities with 7,531 apartment homes.
As of December 31, 2016, our Other Real Estate communities included:
• | 13 apartment communities with 4,725 apartment homes in redevelopment or development; |
• | 3 apartment communities with 672 apartment homes recently acquired; |
• | 4 apartment communities with 604 apartment homes owned that receive forms of government rental assistance; and |
• | 14 apartment communities with 1,530 apartment homes that do not meet the definition of Same Store because they are either subject to agreements that limit the amount by which we may increase rents or have not reached or maintained a stabilized level of occupancy as of the beginning of a two-year comparable period, often due to a casualty event. |
Our Real Estate segment results for the years ended December 31, 2016 and 2015, as presented below, are based on the apartment community classifications as of December 31, 2016, including the five Other Real Estate communities that were classified as part of our former Affordable segment until 2017, and excluding amounts related to apartment communities sold or classified as held for sale during 2017.
Year Ended December 31, | ||||||||||||||
(in thousands) | 2016 | 2015 | $ Change | % Change | ||||||||||
Rental and other property revenues: | ||||||||||||||
Same Store communities | $ | 604,663 | $ | 577,159 | $ | 27,504 | 4.8 | % | ||||||
Other Real Estate communities | 186,924 | 159,920 | 27,004 | 16.9 | % | |||||||||
Total | 791,587 | 737,079 | 54,508 | 7.4 | % | |||||||||
Property operating expenses: | ||||||||||||||
Same Store communities | 181,077 | 179,186 | 1,891 | 1.1 | % | |||||||||
Other Real Estate communities | 70,559 | 61,603 | 8,956 | 14.5 | % | |||||||||
Total | 251,636 | 240,789 | 10,847 | 4.5 | % | |||||||||
Proportionate property net operating income: | ||||||||||||||
Same Store communities | 423,586 | 397,973 | 25,613 | 6.4 | % | |||||||||
Other Real Estate communities | 116,365 | 98,317 | 18,048 | 18.4 | % | |||||||||
Total | $ | 539,951 | $ | 496,290 | $ | 43,661 | 8.8 | % | ||||||
For the year ended December 31, 2016 compared to 2015, our Real Estate segment’s proportionate property net operating income increased $43.7 million, or 8.8%.
Same Store proportionate property net operating income increased by $25.6 million, or 6.4%. This increase was primarily attributable to a $27.5 million, or 4.8%, increase in rental and other property revenues due to higher average revenues ($85 per effective home), comprised primarily of increases in rental rates. Renewal rents (the rent paid by an existing resident who renewed her lease compared to the rent she previously paid) were up 5.7% for the year ended December 31, 2016, and new lease rents (the rent paid by a new resident compared to the rent paid by the previous resident of the same apartment home) were up 2.4%, resulting in a weighted average increase of 4.0%. The increase in Same Store rental and other property revenues was partially offset by a $1.9 million, or 1.1%, increase in property operating expenses, primarily due to increases in real estate taxes, personnel costs and repairs and maintenance, partially offset by lower utilities expenses and insurance costs. During the year ended December 31, 2016 compared to 2015, controllable operating expenses, which exclude utility costs, real estate taxes and insurance, increased by $1.4 million, or 1.7%.
The proportionate property net operating income of Other Real Estate communities increased by $18.0 million during the year ended December 31, 2016 compared to 2015. This increase is attributable to the following:
• | $7.8 million increase due to the net operating income stabilization of three redeveloped communities; |
• | $3.7 million due to lease-up activities at acquired and redeveloped apartment communities, partially offset by decreases due to apartment homes taken out of service for redevelopment; and |
• | $6.5 million from other communities, including apartment communities we acquired in 2015 and market rate increases at four apartment communities that were approved in 2016 by the Department of Housing and Urban Development. |
27
Non-Segment Real Estate Operations
Operating income amounts not attributed to our Real Estate segment include offsite costs associated with property management, casualty losses, and the results of apartment communities sold or held for sale, reported in consolidated amounts, which we do not allocate to our Real Estate segment for purposes of evaluating segment performance (see Note 12 to the consolidated financial statements in Item 8).
For the years ended December 31, 2017, 2016 and 2015, casualty losses totaled $8.2 million, $5.6 million and $7.0 million, respectively. Casualty losses were elevated during the year ended December 31, 2017, primarily due to hurricane damage. Casualty losses were elevated during the year ended December 31, 2015, primarily due to losses resulting from property damage and snow removal costs associated with the severe snow storms in the Northeast.
For the years ended December 31, 2017, 2016 and 2015, apartment communities previously in our Real Estate portfolio that were sold or classified as held for sale as of December 31, 2017 generated net operating income of $26.5 million, $46.8 million and $68.8 million, respectively.
Asset Management Results
As further discussed in Note 2 to the consolidated financial statements in Item 8, we provide asset management and other services to certain consolidated partnerships that own apartment communities that qualify for low-income housing tax credits and are structured to provide for the pass-through of tax credits and tax deductions to their partners.
Contribution from Asset Management included in our consolidated financial statements includes: fees and other amounts paid to us from the net operating income of partnerships served by our Asset Management business less interest expense incurred on non-recourse property debt obligations of the partnerships; income associated with delivery of tax credits to the third-party investors in the partnerships (including amounts received during the period and amounts received in previous periods); and transactional revenue and other income less asset management expenses (including certain allocated offsite costs related to the operation of this business).
The contribution from Asset Management for the years ended December 31, 2017, 2016 and 2015, is presented in the table below.
Year Ended December 31, | |||||||||||
(in thousands) | 2017 | 2016 | 2015 | ||||||||
Net operating income of partnerships served by the Asset Management business | $ | 43,745 | $ | 43,161 | $ | 41,887 | |||||
Interest expense on non-recourse property debt of partnerships | (13,031 | ) | (13,387 | ) | (12,984 | ) | |||||
Amount available for payment of Asset Management fees | 30,714 | 29,774 | 28,903 | ||||||||
Tax credit income, net | 10,049 | 16,546 | 22,819 | ||||||||
Asset management expenses | (5,934 | ) | (5,804 | ) | (6,770 | ) | |||||
Transactional revenue and other income | 5,208 | 8,290 | 3,146 | ||||||||
Contribution from the Asset Management business | $ | 40,037 | $ | 48,806 | $ | 48,098 | |||||
For the periods presented above, the contribution from the Asset Management business fluctuated for the reasons discussed below.
• | Increases in the amount available for payment of Asset Management fees generated by the partnerships were primarily attributed to increases in rental income due to higher rates, partially offset by the loss of net operating income from communities sold and higher operating expenses, including personnel and repairs and maintenance costs. |
• | Tax credit income, net, decreased primarily due to the delivery of substantially all of the tax credits on various partnerships and our 2016 acquisition of an investor limited partner’s interest in one of the tax credit partnerships (and their rights to undelivered tax credits) prior to the end of the tax credit delivery period. Following the purchase, we recognized tax benefits in our results of operations, which largely offset the tax credit income we otherwise would have recognized. |
• | Transactional revenues for the year ended December 31, 2017 includes $2.4 million in fees earned in connection with the disposition of real estate and for the year ended December 31, 2016 includes a $3.6 million fee earned for assisting a third-party property owner in a mark-up-to-market renewal related to an affordable community we previously owned. Other income, for each of the years presented, includes results related to the Napico business, which is further described under the Other, net heading below. |
28
We expect the contribution to our net income from the Asset Management business to decline in future years as we continue to deliver the final tax credits for these partnerships and, as part of our plan to exit the Asset Management business, the partnerships sell the underlying apartment communities.
Depreciation and Amortization
For the year ended December 31, 2017 compared to 2016, depreciation and amortization expense increased by $33.1 million primarily due to renovated apartment homes placed in service after their completion, a full year of depreciation following the 2016 completion of our One Canal development and 2016 acquisition of Indigo, and other capital additions, partially offset by decreases associated with apartment communities sold.
For the year ended December 31, 2016 compared to 2015, depreciation and amortization expense increased by $26.8 million primarily due to renovated apartment homes placed in service after their completion, the completion of our One Canal and Vivo developments, and our 2016 acquisition of Indigo and other capital additions, partially offset by decreases associated with apartment communities sold.
General and Administrative Expenses
In recent years, we have worked toward simplifying our business, which allowed us to reduce overhead and other costs. This simplification and our scale reductions have allowed us to reduce our offsite costs, which consist of general and administrative expenses, property management expenses and investment management expenses, by $11.6 million, or 15.1%, over the last three years.
For the year ended December 31, 2017 compared to 2016, general and administrative expenses decreased $3.1 million, primarily due to lower personnel and related costs including incentive compensation, professional services, technology costs and other corporate costs.
For the year ended December 31, 2016 compared to 2015, general and administrative expenses, excluding incentive compensation, decreased by approximately $0.2 million. Inclusive of incentive compensation, general and administrative expenses increased $0.5 million, primarily due to our performance against key performance indicators in 2016 as compared to 2015.
Other Expenses, Net
Other expenses, net includes franchise taxes, costs associated with our risk management activities, partnership administration expenses and certain non-recurring items.
For the year ended December 31, 2017 compared to 2016, other expenses, net decreased by $2.9 million. The decrease was primarily due to the 2016 recognition of estimated future environmental clean-up and abatement costs associated with the matters discussed in Note 5 to the consolidated financial statements in Item 8, partially offset by legal costs we incurred related to a challenge to the title of a property we acquired in 2014.
For the year ended December 31, 2016 compared to 2015, other expenses, net increased by $3.9 million. The increase was primarily due to the 2016 environmental costs discussed above, partially offset by lower legal and related costs.
Provision for Real Estate Impairment Loss
In January 2018, we agreed to sell our interests in the entities owning the La Jolla Cove property in settlement of legal actions filed in 2014 by a group of disappointed buyers who had hoped to acquire the property. As a result of the settlement, we recognized in our 2017 results a gross impairment loss of $35.8 million, $25.6 million of which relates to the establishment of a deferred tax liability assumed in connection with our acquisition of the business entities. Upon closing of the transaction, the tax liability will be assumed by the buyer, resulting in no economic loss to Aimco. The remaining $10.2 million loss is offset by cash distributions paid to us during our ownership and avoided legal costs for continued litigation. On an economic basis, we agreed to sell these entities at roughly our purchase price, adjusted for retained cash distributions and avoided legal costs.
We recognized no provisions for impairment losses during the years ended December 31, 2016 or 2015.
Interest Expense
For the year ended December 31, 2017 compared to 2016, interest expense, which includes the amortization of debt issuance costs and amortization of deferred financing costs, decreased by $1.8 million, or 0.9%. The decrease was primarily due to lower average outstanding balances on non-recourse property debt for our Real Estate apartment communities and lower interest rates, resulting in an $11.9 million reduction in interest expense. These decreases were partially offset by higher amounts outstanding on corporate borrowings (including our term loan and incremental line borrowings used to temporarily fund the reacquisition of
29
the Palazzo limited partner interests) and a decrease in capitalized interest associated with our redevelopment and development activities.
For the year ended December 31, 2016 compared to 2015, interest expense decreased by $3.3 million, or 1.7%. The decrease was primarily attributed to lower average outstanding balances from our repayment of non-recourse property debt and to a lesser extent from a lower average cost of debt on property loans refinanced during the year, resulting in an $8.1 million reduction in interest expense, and a $4.9 million reduction of interest expense on debt related to apartment community dispositions. These decreases were partially offset by increased interest expense on debt associated with apartment community acquisitions and on One Canal, the construction of which was completed during 2016 and for which we ceased interest capitalization, and higher average borrowings on our revolving credit facility.
Other, Net
Other, net includes our equity in the income or loss of unconsolidated real estate partnerships, and the results of operations related to the Napico business, which we accounted for under the profit sharing method prior to the derecognition of the final property during 2017.
For the year ended December 31, 2017 compared to 2016, net income of the Napico business increased by $2.1 million. For the year ended December 31, 2016 compared to 2015, net income of the Napico business increased by $5.4 million. As discussed in Note 3 to the consolidated financial statements in Item 8, in 2017 we derecognized the assets and liabilities related to the final Napico property, and in 2016 we partially derecognized the assets and liabilities of the Napico business, resulting in gains that contributed to the increase in other, net in both years.
Income Tax Benefit
Certain of our operations, including property management and risk management, are conducted through TRS entities. Additionally, some of our apartment communities are owned through TRS entities.
Our income tax benefit calculated in accordance with GAAP includes: (a) historic tax credits that offset income tax obligations of our TRS entities; (b) income taxes associated with the income or loss of our TRS entities, for which the tax consequences have been realized or will be realized in future periods; and (c) low income housing tax credits that offset REIT taxable income, primarily from retained capital gains. Income taxes related to these items (before gains on dispositions) are included in income tax benefit in our consolidated statements of operations.
Income tax benefit for the periods presented also reflects GAAP taxes associated with income and gains related to the Napico business, which was partially deconsolidated in 2016 and for which the final property was deconsolidated in 2017.
For the year ended December 31, 2017 compared to 2016, income tax benefit increased by $6.9 million, from $25.2 million to $32.1 million. The increase is primarily due to higher tax benefit associated with low-income housing tax credits from our September 2016 acquisition of the limited partner interests in a tax credit partnership, higher net operating losses at the TRS entities (including the La Jolla Cove impairment loss discussed above) and the $0.5 million net tax benefit we recognized as a result of the December 2017 tax reform legislation (as further discussed in Note 9 to the consolidated financial statements in Item 8). These increases were partially offset by a decrease in historic tax credits associated with the redevelopment of certain apartment communities, including the timing of final certification on one redevelopment in 2016.
For the year ended December 31, 2016 compared to 2015, income tax benefit decreased by $2.3 million, primarily due to lower net losses recognized by apartment communities owned by our TRS entities, partially offset by higher historic tax credits associated with the redevelopment of certain apartment communities and higher tax benefit associated with low-income housing tax credits from our acquisition of the limited partner interests in a tax credit partnership.
30
Gain on Dispositions of Real Estate, Net of Tax
The table below summarizes dispositions of apartment communities from our Real Estate portfolio and of consolidated partnerships served by our Asset Management business during the years ended (dollars in millions):
December 31, | ||||||||||||
2017 | 2016 | 2015 | ||||||||||
Real Estate | ||||||||||||
Number of apartment communities sold | 5 | 7 | 11 | |||||||||
Gross proceeds | $ | 397.0 | $ | 517.0 | $ | 404.3 | ||||||
Net proceeds (1) | $ | 385.3 | $ | 511.0 | $ | 229.4 | ||||||
Gain on disposition, net of tax | $ | 298.0 | $ | 377.3 | $ | 180.6 | ||||||
Asset Management | ||||||||||||
Number of apartment communities sold | 2 | 1 | N/A | |||||||||
Gross proceeds | $ | 10.9 | $ | 27.5 | N/A | |||||||
Net proceeds (1) | $ | 5.0 | $ | 13.2 | N/A | |||||||
Gain on disposition, net of tax | $ | 1.6 | $ | 16.5 | N/A | |||||||
(1) | Net proceeds are after repayment of debt, if any, net working capital settlements, payment of transaction costs and debt prepayment penalties, if applicable. |
The apartment communities sold from our Real Estate portfolio during 2017, 2016 and 2015 were primarily located outside of our primary markets or in lower-rated locations within our primary markets and had average revenues per apartment home significantly below those of our retained portfolio.
Noncontrolling Interests in Consolidated Real Estate Partnerships
Noncontrolling interests in consolidated real estate partnerships reflects the results of our consolidated real estate partnerships allocated to the owners who are not affiliated with Aimco. The amounts of income or loss of our consolidated real estate partnerships that we allocate to owners not affiliated with Aimco include their share of property management fees, interest on notes and other amounts that we charge to these partnerships.
For the years ended December 31, 2017, 2016 and 2015, we allocated net income of $9.1 million, $25.3 million, and $4.8 million, respectively, to noncontrolling interests in consolidated real estate partnerships. The amount of net income allocated to noncontrolling interests was driven by three primary factors: the operations of the consolidated apartment communities; gains on the sale of apartment communities with noncontrolling interest holders; and the results of operations of the Napico business, as further discussed below.
• | The amount of net income allocated to noncontrolling interests resulting from operations of the consolidated apartment communities was $2.4 million, $4.4 million and $4.2 million for the years ended December 31, 2017, 2016 and 2015, respectively. The decrease from 2016 to 2017 is primarily due to the June 30, 2017 reacquisition of our limited partner’s interest in the Palazzo joint venture. |
• | Gains on the sale of apartment communities allocated to noncontrolling interests totaled $7.3 million, $13.0 million and $6.0 million for the years ended December 31, 2017, 2016 and 2015, respectively. |
• | As discussed in Note 3 to the consolidated financial statements in Item 8, we derecognized the Napico business in two transactions, which occurred in 2016 and 2017. We allocated $8.1 million of the gain on sale and a $0.6 million net loss, respectively, to the noncontrolling interest holders in connection with the 2017 and 2016 transactions. In 2015, we allocated a net loss of $5.4 million to the noncontrolling interest holders from the results of Napico operations. |
Net Income Attributable to Aimco Preferred Stockholders and the Aimco Operating Partnership’s Preferred Unitholders
Net income attributable to Aimco preferred stockholders and the Aimco Operating Partnership’s preferred unitholders decreased by $3.4 million and $2.9 million, respectively, during the year ended December 31, 2017 as compared to 2016. These decreases were primarily due to Aimco’s redemption of its Class Z Preferred Stock in 2016. In connection with the redemption, we wrote off previously deferred issuance costs of $1.3 million. Additionally, the $0.7 million excess of the redemption value over the
31
carrying amount was reflected in the net income attributable to Aimco Preferred Stockholders and Aimco Operating Partnership’s Preferred Unitholders for the year ended December 31, 2016.
Net income attributable to Aimco preferred stockholders and the Aimco Operating Partnership’s preferred unitholders increased by $0.2 million and $0.5 million, respectively, during the year ended December 31, 2016 as compared to 2015. These increases were primarily due to Aimco’s redemption of its Class Z Preferred Stock described above, which resulted in $2.0 million of redemption related charges, partially offset by $1.1 million of lower dividends.
Critical Accounting Policies and Estimates
We prepare our consolidated financial statements in accordance with GAAP, which requires us to make estimates and assumptions. We believe that the following critical accounting policies involve our more significant judgments and estimates used in the preparation of our consolidated financial statements.
Capitalized Costs
We capitalize costs, including certain indirect costs, incurred in connection with our capital additions activities, including redevelopments and developments, other tangible apartment community improvements and replacements of existing apartment community components. Included in these capitalized costs are payroll costs associated with time spent by site employees in connection with the planning, execution and control of all capital additions activities at the apartment community level. We characterize as “indirect costs” an allocation of certain department costs, including payroll, at the area operations and corporate levels that clearly relate to capital additions activities. We also capitalize interest, property taxes and insurance during periods in which redevelopments and developments are in progress. We commence capitalization of costs, including certain indirect costs, incurred in connection with our capital addition activities, at the point in time when activities necessary to get apartment communities ready for their intended use begin. These activities include when apartment communities or apartment homes are undergoing physical construction, as well as when apartment homes are held vacant in advance of planned construction, provided that other activities such as permitting, planning and design are in progress. We cease the capitalization of costs when the apartment communities or components thereof are substantially complete and ready for their intended use, which is typically when construction has been completed and apartment homes are available for occupancy. We charge costs including ordinary repairs, maintenance and resident turnover costs to property operating expense, as incurred. Refer to the discussion of investing activities within the Liquidity and Capital Resources section for a summary of costs capitalized during the periods presented.
Impairment of Long-Lived Assets
Real estate and other long-lived assets to be held and used are stated at cost, less accumulated depreciation and amortization, unless the carrying amount of the asset is not recoverable. If events or circumstances indicate that the carrying amount of an apartment community may not be recoverable, we make an assessment of its recoverability by comparing the carrying amount to our estimate of the undiscounted future cash flows, excluding interest charges, of the apartment community. If the carrying amount exceeds the estimated aggregate undiscounted future cash flows, we recognize an impairment loss to the extent the carrying amount exceeds the estimated fair value of the apartment community.
As part of our portfolio strategy, we seek to sell up to 10% of our portfolio annually and to reinvest the proceeds from such sales in accretive uses such as capital enhancements, redevelopments, occasional developments, and selective acquisitions with projected Free Cash Flow internal rates of return higher than expected from the communities being sold. As we execute this strategy, we evaluate alternatives to sell or reduce our interest in apartment communities that do not align with our long-term investment strategy, although there is no assurance that we will sell or reduce our investment in such apartment communities during the desired time frame. For any apartment communities that are sold or meet the criteria to be classified as held for sale during the next 12 months, the reduction in the estimated holding period for these apartment communities may result in impairment losses.
Non-GAAP Measures
Various of the key financial indicators we use in managing our business and in evaluating our financial condition and operating performance are non-GAAP measures. Key non-GAAP measures we use are defined and described below, and for those non-GAAP financial measures used or disclosed within this annual report, reconciliations of the non-GAAP financial measures to the most comparable financial measure computed in accordance with GAAP are provided.
Funds from Operations, Pro forma Funds From Operations and Adjusted Funds From Operations are non-GAAP financial measures, which are defined and further described below under the Funds From Operations and Adjusted Funds From Operations heading. Economic Income and Net Asset Value are non-GAAP financial measures defined and further described below under the Economic Income heading.
32
Free Cash Flow, or FCF, as calculated for our retained portfolio, represents an apartment community’s property net operating income, or NOI, less spending for capital replacements, which represents our estimation of the capital additions made to replace capital assets consumed during our ownership period (further discussed under the Funds From Operations and Adjusted Funds From Operations heading and the Liquidity and Capital Resources heading). FCF margin represents an apartment community’s NOI less $1,200 per apartment home of assumed annual capital replacement spending, as a percentage of the apartment community’s rental and other property revenues. Capital replacement spending is a method of measuring the cost of capital asset usage during the period; therefore we believe that FCF is useful to investors as a supplemental measure of apartment community performance because it takes into consideration costs incurred during the period to replace capital assets that have been consumed during our ownership.
Funds From Operations and Adjusted Funds From Operations
Funds From Operations, or FFO, is a non-GAAP financial measure that we believe, when considered with the financial statements determined in accordance with GAAP, is helpful to investors in understanding our performance because it captures features particular to real estate performance by recognizing that real estate generally appreciates over time or maintains residual value to a much greater extent than do other depreciable assets such as machinery, computers or other personal property. The National Association of Real Estate Investment Trusts, or NAREIT, defines FFO as net income or loss computed in accordance with GAAP, excluding gains from sales of, and impairment losses recognized with respect to, depreciable real estate, plus depreciation and amortization related to real estate, and after adjustments for unconsolidated partnerships and joint ventures. Adjustments for unconsolidated partnerships and joint ventures are calculated on the same basis to determine FFO. We calculate FFO attributable to Aimco common stockholders (diluted) by subtracting, if dilutive, redemption or repurchase related preferred stock issuance costs and dividends on preferred stock.
In addition to FFO, we compute Pro forma FFO and Adjusted FFO, or AFFO, which are also non-GAAP financial measures that we believe are helpful to investors in understanding our performance. Pro forma FFO represents FFO attributable to Aimco common stockholders (diluted), excluding preferred equity redemption-related amounts (adjusted for noncontrolling interests). Preferred equity redemption-related amounts (gains or losses) are items that periodically affect our operating results and we exclude these items from our calculation of Pro forma FFO because such amounts are not representative of our operating performance.
Additionally in 2017, we recognized a net tax benefit associated with the December 2017 tax reform legislation consisting of a benefit related to the revaluation of net deferred tax liabilities of Aimco’s taxable REIT subsidiaries, partially offset by a valuation allowance related to deferred tax assets. We excluded this net tax benefit from our computation of Pro forma FFO because this type of tax benefit occurs infrequently and is not representative of our operating performance.
AFFO represents Pro forma FFO reduced by Capital Replacements (also adjusted for noncontrolling interests), which represents our estimation of the capital additions made to replace capital assets consumed during our ownership period. When we make capital additions at an apartment community, we evaluate whether the additions extend the useful life of an asset as compared to its condition at the time we purchased the apartment community. We classify as Capital Improvements those capital additions that meet these criteria and we classify as Capital Replacements those that do not. AFFO is a key financial indicator we use to evaluate our operational performance and is one of the factors that we use to determine the amounts of our dividend payments.
FFO, Pro forma FFO and AFFO should not be considered alternatives to net income (loss), as determined in accordance with GAAP, as indications of our performance. Although we use these non-GAAP measures for comparability in assessing our performance compared to other REITs, not all REITs compute these same measures and those who do may not compute them in the same manner. Additionally, computation of AFFO is subject to our definition of Capital Replacement spending. Accordingly, there can be no assurance that our basis for computing these non-GAAP measures is comparable with that of other REITs.
33
For the years ended December 31, 2017, 2016 and 2015, Aimco’s FFO, Pro forma FFO and AFFO are calculated as follows (in thousands):
2017 | 2016 | 2015 | |||||||||
Net income attributable to Aimco common stockholders (1) | $ | 306,861 | $ | 417,781 | $ | 235,966 | |||||
Adjustments: | |||||||||||
Real estate depreciation and amortization, net of noncontrolling partners’ interest | 352,109 | 314,840 | 288,611 | ||||||||
Gain on dispositions and other, net of noncontrolling partners’ interest | (262,583 | ) | (381,131 | ) | (174,797 | ) | |||||
Income tax provision related to gain on disposition of real estate | (8,265 | ) | 6,374 | 1,758 | |||||||
Common noncontrolling interests in Aimco Operating Partnership’s share of above adjustments (2) | (3,810 | ) | 2,782 | (5,548 | ) | ||||||
Amounts allocable to participating securities | (81 | ) | 88 | (473 | ) | ||||||
FFO attributable to Aimco common stockholders – diluted | $ | 384,231 | $ | 360,734 | $ | 345,517 | |||||
Revaluation of deferred tax accounts, net of common noncontrolling interests in Aimco Operating Partnership and participating securities | (498 | ) | — | — | |||||||
Preferred equity redemption related amounts, net of common noncontrolling interests in Aimco Operating Partnership and participating securities | — | 1,877 | 658 | ||||||||
Pro forma FFO attributable to Aimco common stockholders – diluted | $ | 383,733 | $ | 362,611 | $ | 346,175 | |||||
Capital Replacements, net of common noncontrolling interests in Aimco Operating Partnership and participating securities | (51,760 | ) | (55,289 | ) | (53,925 | ) | |||||
AFFO attributable to Aimco common stockholders – diluted | $ | 331,973 | $ | 307,322 | $ | 292,250 | |||||
Weighted average common shares outstanding – diluted (FFO, Pro forma FFO and AFFO) (3) | 156,796 | 156,391 | 155,570 | ||||||||
Net income attributable to Aimco per common share – diluted | $ | 1.96 | $ | 2.67 | $ | 1.52 | |||||
FFO per share – diluted | $ | 2.45 | $ | 2.31 | $ | 2.22 | |||||
Pro Forma FFO per share – diluted | $ | 2.45 | $ | 2.32 | $ | 2.23 | |||||
AFFO per share – diluted | $ | 2.12 | $ | 1.97 | $ | 1.88 | |||||
(1) | Represents the numerator for calculating Aimco’s earnings per common share in accordance with GAAP (see Note 10 to the consolidated financial statements in Item 8). |
(2) | During the years ended December 31, 2017, 2016 and 2015, the Aimco Operating Partnership had outstanding, on average, 7,422,334, 7,760,597 and 7,656,626 common OP Units. |
(3) | Represents the denominator for Aimco’s earnings per common share – diluted, calculated in accordance with GAAP. |
Refer to the Executive Overview for discussion of our Pro forma FFO and AFFO results for 2017, as compared to their comparable periods in 2016.
Refer to the Liquidity and Capital Resources section for further information regarding our capital investing activities, including Capital Replacements.
The Aimco Operating Partnership does not separately compute or report FFO, Pro forma FFO or AFFO. However, based on Aimco’s method for allocation of such amounts to noncontrolling interests in the Aimco Operating Partnership, as well as the limited differences between Aimco’s and the Aimco Operating Partnership’s net income amounts during the periods presented, FFO, Pro forma FFO and AFFO amounts on a per unit basis for the Aimco Operating Partnership would be expected to be substantially the same as the corresponding per share amounts for Aimco.
Economic Income
Economic Income represents stockholder value creation as measured by the change in estimated NAV per share plus cash dividends per share. We believe Economic Income is important to investors as it represents a measure of the total return we have earned for our stockholders. NAV, as used in our calculation of Economic Income, is a non-GAAP measure and represents the estimated fair value of assets net of liabilities attributable to Aimco’s common stockholders and the Aimco Operating Partnership’s common unitholders on a diluted basis. We believe NAV is considered useful by some investors in real estate companies because the value of company assets can be readily estimated, even for non-earning assets such as land or properties under development. NAV has the advantage of incorporating the investment decisions of thousands of real estate investors. We believe it enhances comparability among companies that have differences in their accounting. While NAV is not identical to liquidation value in that some costs and benefits are disregarded, it is often considered a floor with upside for value ascribed to the operating platform.
34
NAV also provides an objective basis for the perceived quality and predictability of future cash flows as well as their expected growth as these are factors considered by real estate investors.
Our estimated NAV per share and the quoted share price of Aimco Common Stock are not necessarily equal. Although we use Economic Income and NAV for comparability in assessing our value creation compared to other REITs, not all REITs publish these measures and those who do may not compute them in the same manner. Accordingly, there can be no assurance that our basis for computing these measures is comparable with that of other REITs.
We report NAV on a semiannual basis, as of the end of the first and third quarters. Economic Income for 2017, was calculated using the change in NAV per share between September 30, 2016 and 2017. NAV will fluctuate over time. This NAV information should not be relied upon as representative of the amount a stockholder could expect to receive in a liquidation event, now or in the future. Certain assets are excluded as are certain liabilities such as taxes and transaction costs associated with a liquidation. In addition, NAV is based on management’s subjective judgments, assumptions and opinions as of the date of determination. We assume no obligation to revise or update NAV to reflect subsequent or future events or circumstances. Our NAV estimate is subject to a variety of risks and uncertainties, many of which are beyond our control, including, without limitation, those described in Item 1A. Risk Factors.
A reconciliation of NAV to Aimco’s total equity, which we believe is the most directly comparable GAAP measure, as of September 30, 2017, is provided below (in millions, except per share data):
Total equity | $ | 1,436 | |||||||||||
Fair value adjustment for Real Estate portfolio | |||||||||||||
Less: consolidated real estate, at depreciated cost | $ | (5,543 | ) | ||||||||||
Plus: fair value of real estate (1) | |||||||||||||
Stabilized portfolio fair value (2) | $ | 10,059 | |||||||||||
Non-stabilized portfolio fair value (3) | 2,741 | ||||||||||||
Total real estate at fair value | 12,800 | ||||||||||||
Adjustment to present real estate at fair value | 7,257 | ||||||||||||
Fair value adjustment for total indebtedness | |||||||||||||
Plus: consolidated total indebtedness, net related to Real Estate portfolio | 4,162 | ||||||||||||
Less: fair value of indebtedness related to real estate shown above (4) | (4,232 | ) | |||||||||||
Adjustment to present indebtedness at fair value | (70 | ) | |||||||||||
Plus: fair value of Asset Management business (5) | 213 | ||||||||||||
Adjustments to present other tangible assets, liabilities and preferred equity at fair value (6) | (189 | ) | |||||||||||
Estimated NAV | $ | 8,647 | |||||||||||
Total shares, units and dilutive share equivalents (7) | 164 | ||||||||||||
Estimated NAV per weighted average common share and unit - diluted | $ | 53 | |||||||||||
(1) | We compute NAV by estimating the value of our communities, using methods we believe are appropriate based on the characteristics of the communities. For purposes of estimating NAV, real estate at fair value disclosed above includes wholly owned apartment communities plus our proportionate share of communities held by non-wholly owned entities (both consolidated and unconsolidated), and excludes the estimated fair value of communities that are part of the Asset Management business. The value of Asset Management communities is factored into the valuation of the Asset Management portfolio as described in footnote 5. A reconciliation of our consolidated apartment communities to those communities included in total real estate at fair value in the table above is as follows: |
Consolidated apartment communities as of September 30, 2017 | 176 | |
Less: Consolidated communities in the Asset Management portfolio | (39 | ) |
Plus: Unconsolidated apartment communities | 4 | |
Apartment communities in total real estate at fair value for NAV | 141 | |
For valuation purposes at September 30, 2017, we segregated these 141 communities into the following categories: stabilized portfolio and non-stabilized portfolio.
(2) | As of September 30, 2017, our stabilized portfolio includes 123 communities that had reached stabilized operations and were not expected to be sold within twelve months. We value this portfolio using a direct capitalization rate method based on the annualized proportionate property NOI for the three months ended September 30, 2017, less a 2% management fee. Market property management fees range between 1.5% and 3.0% with larger, higher quality portfolios at the lower end of that range. The weighted average estimated capitalization rate as applied to the annualized property NOI was 5.1%, which we calculate on a property-by-property basis, based |
35
primarily on information published by a third-party. Community characteristics that we use to determine comparable market capitalization rates include: the market in which the community is located; infill or suburban location within the market; property quality grade; and whether the community is stabilized or value-add. We used this valuation method for approximately 79% of real estate fair value at September 30, 2017.
(3) | The non-stabilized portfolio includes seven apartment communities under redevelopment at September 30, 2017 and two apartment communities in lease-up. We valued these communities by discounting projected future cash flows. Key assumptions used to estimate the value of these communities include: revenues, which are based on in-place rents, projected submarket rent growth to community stabilization based on projections published by third parties and adjusted for the impacts of redevelopment; expenses, which are based on estimated operating costs adjusted for inflation and a management fee equal to 2% of projected revenue; estimated remaining costs to complete construction; and a terminal value based on current market capitalization rates plus five basis points per year from September 30, 2017 to community stabilization. Discount rates applied to estimated future cash flows of these communities ranged between 6.00% and 7.15% depending on construction and lease-up progress. We used this valuation method for approximately 17% of the real estate fair value at September 30, 2017. The non-stabilized portfolio also included nine apartment communities under contract for sale, which were valued at sales contract price and represent approximately 4% of real estate fair value at September 30, 2017. |
(4) | We calculate the fair value of indebtedness related to real estate as the carrying value of our non-recourse property debt adjusted for the mark-to-market liability on our fixed-rate property debt as of September 30, 2017, plus the outstanding balances on the revolving line of credit and term loan, which approximate their fair value as of September 30, 2017. The mark-to-market has been computed using a money-weighted average interest rate of 4.15%, which rate takes into account the timing of amortization and maturities, and a market rate of 3.75%, which rate takes into account the duration of the existing property debt, the loan-to-value and debt service coverage, as well as timing of amortization and maturities. For purposes of estimating NAV, the fair value of debt includes our proportionate share of debt related to non-wholly owned entities (both consolidated and unconsolidated), and excludes non-recourse property debt obligations of consolidated partnerships of the Asset Management business, which is factored into the valuation of the Asset Management business as described in footnote 5. |
(5) | We estimate our share of the fair value of the Asset Management business as the present value of the expected future cash flows of various low-income housing tax credit partnerships using a 7% discount rate. As further discussed in Note 2 to the consolidated financial statements in Item 8, the future cash flows we expect to receive include fees and other amounts to be paid from cash flows from the operation of the underlying communities and proceeds from sale of the underlying communities after repayment of any associated property-level debt. The key assumptions used to estimate the future cash flows we expect to receive include: operating cash flow, which is based on an estimate of contractual rents and expenses reflecting expected increases; the value of the underlying apartment communities, which we value using a direct capitalization rate method similar to that described in footnote 2 above; and the estimated sale date of the apartment communities, which is generally upon or shortly after the expiration of the tax credit compliance periods. |
(6) | Other tangible assets consist of cash, restricted cash, accounts receivable and other assets for which we reasonably expect to receive cash through the normal course of operations or another future event. Other tangible liabilities consist of accounts payable, accrued liabilities and other tangible liabilities we reasonably expect to settle in cash through the normal course of operations or another future event. Other tangible assets and liabilities were generally valued at their carrying amounts and reduced by the noncontrolling interests’ portion of these amounts and exclude intangible assets and liabilities reflected on our consolidated balance sheet. The fair value of our preferred stock is estimated as the closing share price on September 30, 2017, less accrued dividends. Such accrued dividends are assumed to be accounted for in the closing share price and these amounts are also included in other tangible liabilities. |
(7) | Total shares, units and dilutive share equivalents represents Common Stock, OP Units, participating unvested restricted shares and the dilutive effect of common stock equivalents outstanding as of September 30, 2017. |
Leverage Ratios
As discussed under the Balance Sheet and Liquidity heading, as part of our leverage strategy, we target the ratio of Proportionate Debt and Preferred Equity to Adjusted EBITDA to be below 7.0x and we target the ratio of Adjusted EBITDA to Adjusted Interest Expense and Preferred Dividends to be greater than 2.5x. We believe these ratios are important measures as they are commonly used by investors and analysts to assess the relative financial risk associated with balance sheets of companies within the same industry, and they are believed to be similar to measures used by rating agencies to assess entity credit quality.
We calculate our leverage ratios based on the most recent three month amounts, annualized.
Proportionate Debt, as used in our leverage ratios, is a non-GAAP measure and includes our share of the long-term, non-recourse property debt secured by apartment communities in the Real Estate portfolio, our term loan, and outstanding borrowings under our revolving credit facility, reduced by our share of the cash and restricted cash of our consolidated and unconsolidated partnerships owning communities in our Real Estate portfolio, and also by our investment in the subordinate tranches of a securitization trust that holds certain of our property debt (essentially, an investment in our own non-recourse property loans).
In our Proportionate Debt computation, we increase our recorded debt by unamortized debt issue costs because these amounts represent cash expended in earlier periods and do not reduce our contractual obligations, and we reduce our recorded debt obligations by the amounts of cash and restricted cash on-hand (such restricted cash amounts being primarily restricted under the terms of
36
our property debt agreements) assuming these amounts would be used to reduce our outstanding leverage. We further reduce our recorded debt by the value of our investment in a securitization trust that holds certain of our property debt, as our payments of principal and interest associated with such property debt will ultimately repay our investments in the trust.
We exclude from our leverage the non-recourse property debt obligations of consolidated partnerships served by our Asset Management business. The non-recourse property debt obligations of these partnerships are not our obligations and have limited effect on the amount of fees and other payments we expect to receive.
We believe Proportionate Debt is useful to investors as it is a measure of our net exposure to debt obligations. Proportionate Debt, as used in our leverage ratios, is calculated as set forth in the table below.
Preferred Equity, as used in our leverage ratios, represents the redemption amounts for Aimco’s preferred stock and the Aimco Operating Partnership’s preferred OP Units. Preferred Equity, although perpetual in nature, is another component of our overall leverage.
Adjusted EBITDA is a non-GAAP measure. We believe Adjusted EBITDA provides investors relevant and useful information because it allows investors to view income from our operations on an unleveraged basis, before the effects of taxes, depreciation and amortization, gains or losses on sales of and impairment losses related to real estate and various other items described below.
Adjusted EBITDA represents Aimco’s share of the consolidated amount of our net income, adjusted to exclude the effect of the following items for the reasons set forth below:
• | Adjusted Interest Expense, defined below, to allow investors to compare a measure of our earnings before the effects of our indebtedness with that of other companies in the real estate industry; |
• | preferred dividends, to allow investors to compare a measure of our performance before the effects of our capital structure and indebtedness with that of other companies in the real estate industry; |
• | income taxes, to allow investors to measure our performance independent of income taxes, which may vary significantly from other companies within our industry due to leverage and tax planning strategies, among other factors; |
• | depreciation and amortization, gains or losses on dispositions and impairment losses related to real estate, for similar reasons to those set forth in our discussion of FFO, Pro forma FFO and AFFO in the preceding section; and |
• | other items, including gains on dispositions of non-depreciable assets, as these are items that periodically affect our operations but that are not necessarily representative of our ability to service our debt obligations. |
While Adjusted EBITDA is a relevant measure of performance and is commonly used in leverage ratios, it does not represent net income as defined by GAAP, and should not be considered as an alternative to net income in evaluating our performance. Further, our definition and computation of Adjusted EBITDA may not be comparable to similar measures reported by other companies.
Adjusted Interest Expense, as calculated in our leverage ratios, is a non-GAAP measure that we believe is meaningful for investors and analysts as it presents our share of current recurring interest requirements associated with leverage. Our calculation of Adjusted Interest Expense is set forth in the table below. Adjusted Interest Expense represents our proportionate share of interest expense on non-recourse property debt encumbering apartment communities in the Real Estate portfolio and interest expense on our term loan and revolving credit facility borrowings. We exclude from our calculation of Adjusted Interest Expense:
• | debt prepayment penalties, which are items that, from time to time, affect our operating results, but are not representative of our scheduled interest obligations; |
• | the amortization of debt issue costs, as these amounts have been expended in previous periods and are not representative of our current or prospective debt service requirements; and |
• | the income we receive on our investment in the securitization trust that holds certain of our property debt, as this income is being generated indirectly from interest we pay with respect to property debt held by the trust. |
Preferred Dividends represents the preferred dividends paid on Aimco’s preferred stock and the preferred distributions paid on the Aimco Operating Partnership’s preferred OP Units, exclusive of preferred equity redemption related amounts. We add Preferred Dividends to Adjusted Interest Expense for a more complete picture of the interest and dividend requirements of our leverage, inclusive of perpetual preferred equity.
37
Reconciliations of the most closely related GAAP measures to our calculations of Proportionate Debt, Preferred Equity, Adjusted EBITDA, Adjusted Interest Expense and Preferred Dividends, as used in our leverage ratios, are as follows (in thousands):
December 31, 2017 | |||
Total indebtedness associated with Real Estate portfolio | $ | 3,861,770 | |
Adjustments: | |||
Debt issue costs related to non-recourse property debt | 17,932 | ||
Debt issue costs related to term loan | 499 | ||
Proportionate share adjustments related to debt obligations of consolidated and unconsolidated partnerships | (9,560 | ) | |
Cash and restricted cash | (95,325 | ) | |
Proportionate share adjustments related to cash and restricted cash held by consolidated and unconsolidated partnerships | 1,271 | ||
Securitization trust investment and other | (82,794 | ) | |
Proportionate Debt | $ | 3,693,793 | |
Preferred stock | $ | 125,000 | |
Preferred OP Units | 101,537 | ||
Preferred Equity | 226,537 | ||
Proportionate Debt and Preferred Equity | $ | 3,920,330 | |
Three Months Ended December 31, 2017 | |||
Net income attributable to Aimco Common Stockholders | $ | 262,097 | |
Adjustments: | |||
Adjusted Interest Expense | 42,219 | ||
Income tax benefit | (17,248 | ) | |
Depreciation and amortization, net of noncontrolling interest | 97,418 | ||
Gain on dispositions and other, net of income taxes and noncontrolling partners’ interests | (255,516 | ) | |
Preferred stock dividends | 2,149 | ||
Net income attributable to noncontrolling interests in Aimco Operating Partnership | 14,374 | ||
Pro forma adjustment (1) | (4,248 | ) | |
Adjusted EBITDA | $ | 141,245 | |
Annualized Adjusted EBITDA | $ | 564,980 | |
(1) In our calculation of leverage ratios for the three months ended December 31, 2017, we adjusted our calculation of Adjusted EBITDA to reflect the disposition of five apartment communities sold during the period as if they had closed on October 1, 2017, because the proceeds from these sales were used to reduce leverage as of December 31, 2017. | |||
38
Three Months Ended December 31, 2017 | |||
Interest expense | $ | 49,193 | |
Interest expense related to non-recourse property debt obligations of consolidated partnerships served by our Asset Management business | (3,166 | ) | |
Interest expense attributable to Real Estate portfolio | 46,027 | ||
Adjustments: | |||
Proportionate share adjustments related to interest of consolidated and unconsolidated partnerships | (105 | ) | |
Debt prepayment penalties and other non-interest items | (496 | ) | |
Amortization of debt issue costs | (1,393 | ) | |
Interest income earned on securitization trust investment | (1,814 | ) | |
Adjusted Interest Expense | $ | 42,219 | |
Preferred stock dividends | 2,149 | ||
Preferred OP Unit distributions | 1,938 | ||
Preferred Dividends | 4,087 | ||
Adjusted Interest Expense and Preferred Dividends | $ | 46,306 | |
Annualized Adjusted Interest Expense | $ | 168,876 | |
Annualized Adjusted Interest Expense and Preferred Dividends | $ | 185,224 | |
Liquidity and Capital Resources
Liquidity
Liquidity is the ability to meet present and future financial obligations. Our primary source of liquidity is cash flow from our operations. Additional sources are proceeds from sales of apartment communities, proceeds from refinancings of existing property debt, borrowings under new property debt, borrowings under our Credit Agreement, as defined below, including our revolving credit facility, and proceeds from equity offerings.
Our principal uses for liquidity include normal operating activities, payments of principal and interest on outstanding property debt, capital expenditures, dividends paid to stockholders, distributions paid to noncontrolling interest partners and acquisitions of apartment communities. We use our cash and cash equivalents and our cash provided by operating activities to meet short-term liquidity needs. In the event that our cash and cash equivalents and cash provided by operating activities are not sufficient to cover our short-term liquidity needs, we have additional means, such as short-term borrowing availability and proceeds from apartment community sales and refinancings. We may use our revolving credit facility for working capital and other short-term purposes, such as funding investments on an interim basis. We expect to meet our long-term liquidity requirements, such as debt maturities, redevelopment spending and apartment community acquisitions, through long-term borrowings (primarily non-recourse), the issuance of equity securities (including OP Units), the sale of apartment communities and cash generated from operations.
As of December 31, 2017, our primary sources of liquidity were as follows:
• | $60.5 million in cash and cash equivalents; |
• | $34.8 million of restricted cash, which consists primarily of escrows related to resident security deposits and reserves and escrows held by lenders for capital additions, property taxes and insurance; and |
• | $521.3 million of available capacity to borrow under our revolving credit facility (which is more fully described below), after consideration of outstanding borrowings of $67.2 million and $11.5 million of letters of credit backed by the facility. |
At December 31, 2017, we also held unencumbered apartment communities with an estimated fair market value of approximately $1.8 billion. Each of the amounts presented above exclude amounts attributable to partnerships served by our Asset Management business.
Leverage and Capital Resources
The availability of credit and its related effect on the overall economy may affect our liquidity and future financing activities, both through changes in interest rates and access to financing. Currently, interest rates are low compared to historical levels and many lenders are active in the market. However, any adverse changes in the lending environment could negatively affect our
39
liquidity. We believe we have mitigated much of this exposure by reducing our short and intermediate term maturity risk through refinancing such loans with long-dated, fixed-rate property debt. However, if property financing options become unavailable for our further debt needs, we may consider alternative sources of liquidity, such as reductions in capital spending or proceeds from apartment community dispositions.
Two credit rating agencies rate our creditworthiness and both have rated our credit and outlook as BBB- (stable), an investment grade rating. Our investment grade rating would be useful in accessing capital through the sale of bonds in private or public transactions. However, our intention and historical practice has been to raise debt capital in the form of property-level, non-recourse, long-dated, fixed-rate, amortizing debt, the cost of which is generally less than that of recourse debt and the terms of which also provide for greater balance sheet safety.
At December 31, 2017, approximately 86.7% of our leverage consisted of property-level, non-recourse, long-dated, amortizing debt. Approximately 97.7% of our property-level debt is fixed-rate, which provides a hedge against increases in interest rates, capitalization rates and inflation. The weighted average maturity of our property-level debt was 7.2 years.
For property debt encumbering the communities in our Real Estate portfolio, $173.7 million of our unpaid principal balances mature during 2018, of which $111.5 million was refinanced in January 2018 with ten-year, fixed-rate, non-recourse property debt. On average, 13.6% of our unpaid principal balances will mature each year from 2019 through 2021.
While our primary source of leverage is property-level, non-recourse, long-dated, fixed-rate, amortizing debt, we have a Senior Secured Credit Agreement with a syndicate of financial institutions, which we refer to as our Credit Agreement. Our Credit Agreement provides for $600.0 million of revolving loan commitments. As of December 31, 2017, we had $67.2 million of outstanding borrowings under our revolving loan commitments, representing 1.6% of our total leverage. The Credit Agreement provides us with an option to expand the aggregate loan commitments, subject to customary conditions, by up to $200.0 million.
During 2017, we amended the Credit Agreement to add a $250.0 million term loan to fund partially our reacquisition of limited partner interests in the Palazzo joint venture. The term loan represents 6.1% of our total leverage as of December 31, 2017, matures on June 30, 2018, has a one-year extension option and bears interest at 30-day LIBOR plus 135 basis points.
As of December 31, 2017, our outstanding perpetual preferred equity represented approximately 5.5% of our total leverage. Our preferred securities are perpetual in nature; however, for illustrative purposes, we compute the weighted average maturity of our total leverage assuming a 40-year maturity on our preferred securities.
The combination of non-recourse property level debt, borrowings under our Credit Agreement and perpetual preferred equity that comprises our total leverage, reduces our refunding and re-pricing risk. The weighted average maturity for our total leverage described above was 8.5 years as of December 31, 2017.
Under the Credit Agreement, we have agreed to maintain Fixed Charge Coverage ratio of 1.40x, as well as other covenants customary for similar revolving credit arrangements. For the year ended December 31, 2017, our Fixed Charge Coverage ratio was 2.01x, compared to ratio of 1.96x for the year ended December 31, 2016. We expect to remain in compliance with this covenant during the next 12 months.
Changes in Cash and Cash Equivalents
The following discussion relates to changes in consolidated cash and cash equivalents due to operating, investing and financing activities, which are presented in our consolidated statements of cash flows in Item 8 of this report.
Operating Activities
For the year ended December 31, 2017, our net cash provided by operating activities was $394.1 million. Our operating cash flow is affected primarily by rental rates, occupancy levels and operating expenses related to our portfolio of apartment communities. Cash provided by operating activities for the year ended December 31, 2017, increased by $16.4 million compared to 2016, due to improved operating results of our Same Store communities and increased contribution from redevelopment and lease-up communities, partially offset by a decrease in the net operating income associated with apartment communities we sold during 2016.
40
Investing Activities
For the year ended December 31, 2017, net cash provided by investing activities of $14.7 million consisted primarily of $402.2 million in proceeds from the sale of apartment communities, partially offset by capital expenditures.
For the years ended December 31, 2017, 2016 and 2015, we sold and acquired various apartment communities as further discussed in Note 3 to the consolidated financial statements in Item 8.
Capital additions for our Real Estate segment totaled $338.0 million, $321.0 million and $340.3 million during the years ended December 31, 2017, 2016 and 2015, respectively. We generally fund capital additions with cash provided by operating activities and cash proceeds from sales of apartment communities.
We categorize capital spending for communities in our Real Estate portfolio broadly into six primary categories:
• | capital replacements, which represent capital additions made to replace the portion of acquired apartment communities consumed during our period of ownership; |
• | capital improvements, which represent capital additions made to replace the portion of acquired apartment communities consumed prior to our period of ownership; |
• | capital enhancements, which may include kitchen and bath remodeling, energy conservation projects and investments in longer-lived materials designed to reduce turnover and maintenance costs, all of which are generally lesser in scope than redevelopment additions and do not significantly disrupt property operations; |
• | redevelopment additions, which represent capital additions intended to enhance the value of the apartment community through the ability to generate higher average rental rates, and may include costs related to entitlement, which enhance the value of a community through increased density, and costs related to renovation of exteriors, common areas or apartment homes; |
• | development additions, which represent construction and related capitalized costs associated with development of apartment communities; and |
• | casualty capital additions, which represent construction and related capitalized costs incurred in connection with the restoration of an apartment community after a casualty event such as a severe snow storm, hurricane, tornado, flood or fire. |
We exclude from these measures the amounts of capital spending related to apartment communities sold or classified as held for sale at the end of the period, as well as amounts expended by consolidated partnerships served by our Asset Management business as such amounts generally do not affect the amount of cash flow we expect to receive from the operation and ultimate disposition of these communities.
A summary of the capital spending for these categories, along with a reconciliation of the total for these categories to the capital expenditures reported in the accompanying consolidated statements of cash flows for the years ended December 31, 2017, 2016 and 2015, are presented below (dollars in thousands):
2017 | 2016 | 2015 | |||||||||
Real Estate | |||||||||||
Capital replacements | $ | 38,037 | $ | 39,749 | $ | 38,009 | |||||
Capital improvements | 17,039 | 15,147 | 16,759 | ||||||||
Capital enhancements | 101,497 | 74,544 | 47,927 | ||||||||
Redevelopment additions | 158,141 | 155,399 | 117,794 | ||||||||
Development additions | 14,248 | 31,823 | 115,638 | ||||||||
Casualty capital additions | 9,060 | 4,304 | 4,184 | ||||||||
Real Estate capital additions | 338,022 | 320,966 | 340,311 | ||||||||
Plus: additions related to consolidated Asset Management communities, apartment communities sold or held for sale, and other adjustments | 16,207 | 17,548 | 22,637 | ||||||||
Consolidated capital additions | 354,229 | 338,514 | 362,948 | ||||||||
Plus: net change in accrued capital spending | 3,875 | 8,131 | 4,232 | ||||||||
Capital expenditures per consolidated statement of cash flows | $ | 358,104 | $ | 346,645 | $ | 367,180 | |||||
41
For the years ended December 31, 2017, 2016 and 2015, we capitalized $7.6 million, $9.6 million and $11.7 million of interest costs, respectively, and $36.0 million, $32.9 million and $28.2 million of other direct and indirect costs, respectively.
Redevelopment/Development
Information regarding our redevelopments and developments at December 31, 2017, is presented below (dollars in millions):
Location | Apartment Homes Approved for Redevelopment or Development | Estimated Net Investment | Inception-to-Date Net Investment | Expected Stabilized Occupancy (1) | Expected NOI Stabilization (1) | |||||||||||
Under Redevelopment or Development | ||||||||||||||||
Bay Parc | Miami, FL | 15 | $ | 20.0 | $ | 15.3 | (2) | (2) | ||||||||
Calhoun Beach Club | Minneapolis, MN | 275 | 28.7 | 9.4 | (3) | (3) | ||||||||||
Flamingo South Beach | Miami, FL | N/A | 9.7 | 4.2 | (4) | (4) | ||||||||||
Palazzo at Park La Brea | Los Angeles, CA | 389 | 24.5 | 16.2 | 2Q 2020 | 3Q 2021 | ||||||||||
Palazzo East at Park La Brea | Los Angeles, CA | 611 | 28.0 | 0.8 | 4Q 2020 | 1Q 2022 | ||||||||||
Parc Mosaic | Boulder, CO | 226 | 117.0 | 27.0 | 4Q 2020 | 1Q 2022 | ||||||||||
Park Towne Place | Philadelphia, PA | 942 | 176.0 | 140.8 | 1Q 2019 | 2Q 2020 | ||||||||||
Saybrook Pointe | San Jose, CA | 324 | 18.3 | 14.9 | 1Q 2019 | 2Q 2020 | ||||||||||
Yorktown | Lombard, IL | 292 | 25.7 | 18.3 | (5) | (5) | ||||||||||
Lease-up complete, NOI stabilization period | ||||||||||||||||
One Canal | Boston, MA | 310 | 195.2 | 195.2 | 2Q 2018 | |||||||||||
The Sterling | Philadelphia, PA | 534 | 71.5 | 71.0 | 4Q 2018 | |||||||||||
Total | 3,918 | $ | 714.6 | $ | 513.1 | |||||||||||
(1) | Redevelopments provide us with the flexibility to align the timing of completed apartment homes with market demand. As such, expected occupancy stabilization and expected NOI Stabilization dates may change as market conditions evolve. |
(2) | This phase of redevelopment encompasses common areas, amenity improvements, residential homes on one floor and the creation of a new retail space. |
(3) | In response to market conditions, during 2017, we decided to pause redevelopment activities pertaining to apartment homes and will reassess an appropriate time to resume such activity. Redevelopment of common areas, such as corridors, is ongoing and expected to be complete in early 2018. |
(4) | This phase of the redevelopment encompasses common areas and security system upgrades. |
(5) | In response to market conditions, during 2017, we decided to pause redevelopment activities and will reassess an appropriate time to resume redevelopment activity. |
Net investment represents the total actual or estimated investment, net of tax and other credits earned as a direct result of our redevelopment or development of the community.
NOI Stabilization represents the period in which we expect the communities to achieve stabilized rents and operating costs, generally five quarters after occupancy stabilization.
During the year ended December 31, 2017, we invested $172.4 million primarily in our ongoing redevelopment and development projects.
During the year ended December 31, 2017, we completed construction on the third tower of Park Towne Place in Center City, Philadelphia. As of December 31, 2017, the first three towers combined were 89% leased with approximately 40 homes remaining to be leased at the third redeveloped tower to reach occupancy stabilization. Based on these results, we decided to proceed with a $40 million redevelopment of the fourth and final tower. We have completed de-leasing and commenced construction on this tower, and lease-up is scheduled to commence in the spring of 2018.
Also in Center City Philadelphia, during the year ended December 31, 2017, we completed redevelopment and the lease-up of the 534 apartment homes at The Sterling and substantially completed the reconfiguration of the second floor commercial space, upgrades to the third and fourth floor commercial space and upgrades to residential common areas.
42
We have planned and entitled a new $117.0 million, 226 apartment home community to be known as Parc Mosaic, located in Boulder, Colorado on the site of our Eastpointe community. As part of this plan, as of December 31, 2017, we completed the de-leasing of Eastpointe and commenced demolition and construction. The site is two miles from the new Google campus and is across the street from Ball Aerospace’s Technology Campus and Foothills Hospital. Building in Boulder is highly regulated and new supply is limited, notwithstanding higher enrollment at the University of Colorado and increased employment generally.
Inclusive of the redevelopment and development projects discussed above, during the year ended December 31, 2017 we expanded our redevelopment and development pipeline by $228.9 million. The total estimated net investment for these redevelopment and development communities is $714.6 million, with a projected weighted average net operating income yield on these investments of 6.1% assuming untrended rents. As of December 31, 2017, $513.1 million of this total has been funded.
We expect our total redevelopment and development spending to range from $120 million to $200 million for the year ending December 31, 2018.
Financing Activities
For the year ended December 31, 2017, our net cash used in financing activities of $393.3 million was primarily attributed to our reacquisition of the limited partner interests in the Palazzo communities, dividends paid to common security holders, distributions paid to noncontrolling interests and principal payments on property loans, partially offset by proceeds from the term loan, net borrowings on our revolving credit facility, and proceeds from non-recourse property debt.
Net borrowings on our revolving credit facility primarily relate to the timing of property debt financing activities and apartment community dispositions. Proceeds from non-recourse property debt borrowings during the year consisted of the closing of seven fixed-rate, non-recourse, amortizing, property loans totaling $308.8 million. On a weighted basis, the term of these loans averaged 8.2 years and their interest rates averaged 3.48%, 121 basis points more than the corresponding 10-year Treasury rate at the time of pricing.
We like the discipline of financing our investments in real estate through the use of fixed-rate, amortizing, non-recourse property debt, as the amortization gradually reduces our leverage and reduces our refunding risk, the fixed-rate provides a hedge against increases in interest rates, and the non-recourse feature avoids entity risk.
Principal payments on property loans during the year totaled $409.2 million, consisting of $85.1 million of scheduled principal amortization and repayments of $324.1 million.
Net cash used in financing activities also includes $260.8 million of payments to equity holders, as further detailed in the table below.
Equity and Partners’ Capital Transactions
The following table presents our dividend and distribution activity, which is included in our net cash used in financing activities during the year ended December 31, 2017 (dollars in thousands):
2017 | |||
Cash distributions paid by the Aimco Operating Partnership to holders of noncontrolling interests in consolidated real estate partnerships | $ | 8,367 | |
Cash distributions paid by the Aimco Operating Partnership to preferred unitholders (1) | 16,358 | ||
Cash distributions paid by the Aimco Operating Partnership to common unitholders (2) | 236,044 | ||
Total cash distributions paid by the Aimco Operating Partnership | $ | 260,769 | |
Cash distributions paid by Aimco to holders of noncontrolling interests in consolidated real estate partnerships | $ | 8,367 | |
Cash distributions paid by Aimco to holders of OP Units | 18,431 | ||
Cash dividends paid by Aimco to preferred stockholders | 8,594 | ||
Cash dividends paid by Aimco to common stockholders | 225,377 | ||
Total cash dividends and distributions paid by Aimco | $ | 260,769 | |
(1) | $8.6 million represented distributions to Aimco, and $7.8 million represented distributions paid to holders of OP Units. |
(2) | $225.4 million represented distributions to Aimco, and $10.6 million represented distributions paid to holders of OP Units. |
43
Contractual Obligations
This table summarizes information contained elsewhere in this Annual Report on Form 10-K regarding payments due under contractual obligations and commitments as of December 31, 2017 (in thousands):
Total | Less than One Year | 1-3 Years | 3-5 Years | More than Five Years | |||||||||||
Non-recourse property debt - Real Estate (1) | $ | 3,563,041 | $ | 248,540 | $ | 915,257 | $ | 1,064,282 | $ | 1,334,962 | |||||
Revolving credit facility borrowings (2) | 67,160 | — | — | 67,160 | — | ||||||||||
Term loan (3) | 250,000 | 250,000 | — | — | — | ||||||||||
Interest related to long-term debt - Real Estate (4) | 785,945 | 163,403 | 251,541 | 131,621 | 239,380 | ||||||||||
Office space lease obligations | 5,676 | 2,203 | 2,013 | 1,460 | — | ||||||||||
Ground lease obligations (5) | 86,409 | 1,179 | 2,793 | 3,100 | 79,337 | ||||||||||
Construction obligations (6) | 91,125 | 78,232 | 12,893 | — | — | ||||||||||
Total | $ | 4,849,356 | $ | 743,557 | $ | 1,184,497 | $ | 1,267,623 | $ | 1,653,679 | |||||
(1) | Includes scheduled principal amortization and maturity payments related to our non-recourse property debt secured by communities in our Real Estate portfolio. |
(2) | Includes outstanding borrowings on our revolving credit facility assuming repayment at the contractual maturity date. Our revolving credit facility is subject to an annual commitment fee (0.25% of aggregate commitments), which is not included in the amounts above. |
(3) | Represents the term loan that matures on June 30, 2018 and has a one-year extension option. |
(4) | Includes interest related to both fixed-rate and variable-rate non-recourse property debt, our variable-rate revolving credit facility borrowings, and our variable-rate term loan. Interest related to variable-rate debt is estimated based on the rate effective at December 31, 2017. Refer to Note 4 to the consolidated financial statements in Item 8 for a description of average interest rates associated with our debt. |
(5) | These ground leases expire in years ranging from 2063 to 2087. |
(6) | Represents estimated obligations pursuant to construction contracts related to our redevelopment, development and other capital spending. Refer to Note 5 to the consolidated financial statements in Item 8 for additional information regarding these obligations. |
In addition to the amounts presented in the table above, at December 31, 2017, we had $125.0 million (liquidation value) of Aimco’s perpetual preferred stock outstanding with an annual dividend yield of 6.9% and $101.5 million (liquidation value) of redeemable preferred OP Units of the Aimco Operating Partnership outstanding with annual distribution yields ranging from 1.92% to 8.8%. The dividends and distributions that accrue on the perpetual preferred stock and redeemable preferred OP Units are cumulative and are paid quarterly.
At December 31, 2017, communities owned by partnerships served by our Asset Management business were encumbered by $231.4 million of non-recourse property debt, $43.3 million of which matures in the next five years. The partnerships’ future obligation for interest related to this debt is $124.6 million, $52.3 million of which will be incurred over the next five years. The non-recourse property debt obligations of these partnerships have limited effect on the amount of fees and other payments we expect to receive.
Additionally, we may enter into commitments to purchase goods and services in connection with the operations of our apartment communities. Those commitments generally have terms of one year or less and reflect expenditure levels comparable to our historical expenditures.
Future Capital Needs
In addition to the items set forth in “Contractual Obligations” above, we expect to fund any future acquisitions, redevelopment, development and other capital spending principally with proceeds from apartment community sales, short-term borrowings, debt and equity financing and operating cash flows. Our near-term business plan does not contemplate the issuance of equity.
44
Item 7A. Quantitative and Qualitative Disclosures About Market Risk
Our chief market risks are refunding risk, that is the availability of property debt or other cash sources to refund maturing property debt, and re-pricing risk, that is the possibility of increases in base interest rates and credit risk spreads. We use predominantly long-dated, fixed-rate, amortizing, non-recourse property debt in order to avoid the refunding and repricing risks of short-term borrowings. We use short-term debt financing and working capital primarily to fund short-term uses and generally expect to refinance such borrowings with cash from operating activities, proceeds from apartment community sales, long-term debt or equity financings. We make limited use of derivative financial instruments and we do not use them for trading or other speculative purposes.
Market Risk Associated with Loans Secured by Our Real Estate Portfolio
As of December 31, 2017, on a consolidated basis, we had approximately $82.7 million of variable-rate property-level debt outstanding and $317.2 million of variable-rate borrowings under our Credit Agreement, including a $250.0 million term loan that matures on June 30, 2018. We estimate that a change in 30-day LIBOR of 100 basis points with constant credit risk spreads would reduce or increase net income attributable to Aimco common stockholders and the Aimco Operating Partnership’s common unitholders by approximately $3.8 million on an annual basis.
At December 31, 2017, our Real Estate segment had approximately $95.3 million in cash and cash equivalents and restricted cash, a portion of which bears interest at variable rates, which may offset somewhat a change in rates on our variable-rate debt discussed above.
We estimate the fair value of debt instruments as described in Note 11 to the consolidated financial statements in Item 8. The estimated fair value of indebtedness associated with the Real Estate portfolio was approximately $3.9 billion at December 31, 2017, inclusive of a $55.1 million mark-to-market liability. The mark-to-market liability decreased by $9.8 million as compared to the mark-to-market liability at December 31, 2016.
If market rates for consolidated fixed-rate debt were higher by 100 basis points with constant credit risk spreads, the estimated fair value of debt discussed above would decrease from $3.9 billion to $3.8 billion. If market rates for consolidated debt discussed above were lower by 100 basis points with constant credit risk spreads, the estimated fair value of consolidated fixed-rate debt would increase from $3.9 billion in the aggregate to $4.0 billion.
Market Risk Associated with Our Asset Management Business
The carrying value of non-recourse property debt of the partnerships served by our Asset Management business of $227.1 million and $236.4 million approximated its estimated fair value at December 31, 2017 and 2016, respectively. All of the non-recourse property debt of these partnership is fixed-rate debt. We do not believe this indebtedness represents a market risk for Aimco because increases or decreases in the fair value of the indebtedness are not expected to have a significant effect on the fees we expect to collect from these consolidated partnerships.
Item 8. Financial Statements and Supplementary Data
The independent registered public accounting firm’s reports, consolidated financial statements and schedule listed in the “Index to Financial Statements” on page F-1 of this Annual Report are filed as part of this report and incorporated herein by this reference.
Item 9. Changes in and Disagreements With Accountants on Accounting and Financial Disclosure
None.
45
Item 9A. Controls and Procedures
Aimco
Disclosure Controls and Procedures
Aimco’s management, with the participation of Aimco’s chief executive officer and chief financial officer, has evaluated the effectiveness of its disclosure controls and procedures (as defined in Rules 13a-15(e) and 15d-15(e) under the Exchange Act), as of the end of the period covered by this report. Based on such evaluation, Aimco’s chief executive officer and chief financial officer have concluded that, as of the end of such period, Aimco’s disclosure controls and procedures are effective.
Management’s Report on Internal Control Over Financial Reporting
Aimco’s management is responsible for establishing and maintaining adequate internal control over financial reporting. Internal control over financial reporting is defined in Rule 13a-15(f) and 15d-15(f) under the Exchange Act as a process designed by, or under the supervision of, our principal executive and principal financial officers and effected by our Board of Directors, management and other personnel to provide reasonable assurance regarding the reliability of financial reporting and the preparation of financial statements for external purposes in accordance with generally accepted accounting principles and includes those policies and procedures that:
• | pertain to the maintenance of records that, in reasonable detail, accurately and fairly reflect the transactions and dispositions of assets; |
• | provide reasonable assurance that transactions are recorded as necessary to permit preparation of financial statements in accordance with generally accepted accounting principles, and that receipts and expenditures are being made only in accordance with authorizations of our management and directors; and |
• | provide reasonable assurance regarding prevention or timely detection of unauthorized acquisition, use or disposition of assets that could have a material effect on the financial statements. |
Because of its inherent limitations, internal control over financial reporting may not prevent or detect misstatements. Projections of any evaluation of effectiveness to future periods are subject to the risks that controls may become inadequate because of changes in conditions, or that the degree of compliance with the policies or procedures may deteriorate.
Management assessed the effectiveness of Aimco’s internal control over financial reporting as of December 31, 2017. In making this assessment, management used the criteria set forth by the Committee of Sponsoring Organizations of the Treadway Commission (COSO) in Internal Control-Integrated Framework (2013 Framework).
Based on their assessment, management concluded that, as of December 31, 2017, Aimco’s internal control over financial reporting is effective.
Aimco’s independent registered public accounting firm has issued an attestation report on Aimco’s internal control over financial reporting.
Changes in Internal Control Over Financial Reporting
There has been no change in Aimco’s internal control over financial reporting (as defined in Rules 13a-15(f) and 15d-15(f) under the Exchange Act) during the fourth quarter of 2017 that has materially affected, or is reasonably likely to materially affect, Aimco’s internal control over financial reporting.
46
REPORT OF INDEPENDENT REGISTERED PUBLIC ACCOUNTING FIRM
The Board of Directors and Stockholders of
Apartment Investment and Management Company
Opinion on Internal Control over Financial Reporting
We have audited Apartment Investment and Management Company’s internal control over financial reporting as of December 31, 2017, based on criteria established in Internal Control-Integrated Framework issued by the Committee of Sponsoring Organizations of the Treadway Commission (2013 framework) (the COSO criteria). In our opinion, Apartment Investment and Management Company (the Company) maintained, in all material respects, effective internal control over financial reporting as of December 31, 2017, based on the COSO criteria.
We also have audited, in accordance with the standards of the Public Company Accounting Oversight Board (United States) (PCAOB), the consolidated balance sheets of the Company as of December 31, 2017 and 2016, and the related consolidated statements of operations, comprehensive income, equity and cash flows for each of the three years in the period ended December 31, 2017 and the related notes and financial statement schedule listed in the accompanying Index to Financial Statements of the Company and our report dated February 28, 2018 expressed an unqualified opinion thereon.
Basis for Opinion
The Company’s management is responsible for maintaining effective internal control over financial reporting and for its assessment of the effectiveness of internal control over financial reporting included in the accompanying Management’s Report on Internal Control Over Financial Reporting. Our responsibility is to express an opinion on the Company’s internal control over financial reporting based on our audit. We are a public accounting firm registered with the PCAOB and are required to be independent with respect to the Company in accordance with the U.S. federal securities laws and the applicable rules and regulations of the Securities and Exchange Commission and the PCAOB.
We conducted our audit in accordance with the standards of the PCAOB. Those standards require that we plan and perform the audit to obtain reasonable assurance about whether effective internal control over financial reporting was maintained in all material respects.
Our audit included obtaining an understanding of internal control over financial reporting, assessing the risk that a material weakness exists, testing and evaluating the design and operating effectiveness of internal control based on the assessed risk, and performing such other procedures as we considered necessary in the circumstances. We believe that our audit provides a reasonable basis for our opinion.
Definition and Limitations of Internal Control Over Financial Reporting
A company’s internal control over financial reporting is a process designed to provide reasonable assurance regarding the reliability of financial reporting and the preparation of financial statements for external purposes in accordance with generally accepted accounting principles. A company’s internal control over financial reporting includes those policies and procedures that (1) pertain to the maintenance of records that, in reasonable detail, accurately and fairly reflect the transactions and dispositions of the assets of the company; (2) provide reasonable assurance that transactions are recorded as necessary to permit preparation of financial statements in accordance with generally accepted accounting principles, and that receipts and expenditures of the company are being made only in accordance with authorizations of management and directors of the company; and (3) provide reasonable assurance regarding prevention or timely detection of unauthorized acquisition, use, or disposition of the company’s assets that could have a material effect on the financial statements.
Because of its inherent limitations, internal control over financial reporting may not prevent or detect misstatements. Also, projections of any evaluation of effectiveness to future periods are subject to the risk that controls may become inadequate because of changes in conditions, or that the degree of compliance with the policies or procedures may deteriorate.
/s/ ERNST & YOUNG LLP
Denver, Colorado
February 28, 2018
47
The Aimco Operating Partnership
Disclosure Controls and Procedures
The Aimco Operating Partnership’s management, with the participation of the chief executive officer and chief financial officer of Aimco, who are the equivalent of the Aimco Operating Partnership’s chief executive officer and chief financial officer, respectively, has evaluated the effectiveness of the Aimco Operating Partnership’s disclosure controls and procedures (as defined in Rules 13a-15(e) and 15d-15(e) under the Exchange Act) as of the end of the period covered by this report. Based on such evaluation, the chief executive officer and chief financial officer of Aimco have concluded that, as of the end of such period, the Aimco Operating Partnership’s disclosure controls and procedures are effective.
Management’s Report on Internal Control Over Financial Reporting
Management of the Aimco Operating Partnership is responsible for establishing and maintaining adequate internal control over financial reporting. Internal control over financial reporting is defined in Rule 13a-15(f) and 15d-15(f) under the Exchange Act as a process designed by, or under the supervision of, our principal executive and principal financial officers and effected by our Board of Directors, management and other personnel to provide reasonable assurance regarding the reliability of financial reporting and the preparation of financial statements for external purposes in accordance with generally accepted accounting principles and includes those policies and procedures that:
• | pertain to the maintenance of records that, in reasonable detail, accurately and fairly reflect the transactions and dispositions of assets; |
• | provide reasonable assurance that transactions are recorded as necessary to permit preparation of financial statements in accordance with generally accepted accounting principles, and that receipts and expenditures are being made only in accordance with authorizations of our management and directors; and |
• | provide reasonable assurance regarding prevention or timely detection of unauthorized acquisition, use or disposition of assets that could have a material effect on the financial statements. |
Because of its inherent limitations, internal control over financial reporting may not prevent or detect misstatements. Projections of any evaluation of effectiveness to future periods are subject to the risks that controls may become inadequate because of changes in conditions, or that the degree of compliance with the policies or procedures may deteriorate.
Management assessed the effectiveness of the Aimco Operating Partnership’s internal control over financial reporting as of December 31, 2017. In making this assessment, management used the criteria set forth by the Committee of Sponsoring Organizations of the Treadway Commission (COSO) in Internal Control-Integrated Framework (2013 Framework).
Based on their assessment, management concluded that, as of December 31, 2017, the Aimco Operating Partnership’s internal control over financial reporting is effective.
The Aimco Operating Partnership’s independent registered public accounting firm has issued an attestation report on the Aimco Operating Partnership’s internal control over financial reporting.
Changes in Internal Control Over Financial Reporting
There has been no change in the Aimco Operating Partnership’s internal control over financial reporting (as defined in Rules 13a-15(f) and 15d-15(f) under the Exchange Act) during the fourth quarter of 2017 that has materially affected, or is reasonably likely to materially affect, the Aimco Operating Partnership’s internal control over financial reporting.
48
REPORT OF INDEPENDENT REGISTERED PUBLIC ACCOUNTING FIRM
The Partners of
AIMCO Properties, L.P.
Opinion on Internal Control over Financial Reporting
We have audited AIMCO Properties, L.P.’s internal control over financial reporting as of December 31, 2017, based on criteria established in Internal Control-Integrated Framework issued by the Committee of Sponsoring Organizations of the Treadway Commission (2013 framework) (the COSO criteria). In our opinion, AIMCO Properties, L.P. (the Partnership) maintained, in all material respects, effective internal control over financial reporting as of December 31, 2017, based on the COSO criteria.
We also have audited, in accordance with the standards of the Public Company Accounting Oversight Board (United States) (PCAOB), the consolidated balance sheets of the Partnership as of December 31, 2017 and 2016, and the related consolidated statements of operations, comprehensive income, partners’ capital and cash flows for each of the three years in the period ended December 31, 2017 and the related notes and financial statement schedule listed in the accompanying Index to Financial Statements of the Partnership and our report dated February 28, 2018 expressed an unqualified opinion thereon.
Basis for Opinion
The Partnership’s management is responsible for maintaining effective internal control over financial reporting and for its assessment of the effectiveness of internal control over financial reporting included in the accompanying Management’s Report on Internal Control Over Financial Reporting. Our responsibility is to express an opinion on the Partnership’s internal control over financial reporting based on our audit. We are a public accounting firm registered with the PCAOB and are required to be independent with respect to the Partnership in accordance with the U.S. federal securities laws and the applicable rules and regulations of the Securities and Exchange Commission and the PCAOB.
We conducted our audit in accordance with the standards of the PCAOB. Those standards require that we plan and perform the audit to obtain reasonable assurance about whether effective internal control over financial reporting was maintained in all material respects.
Our audit included obtaining an understanding of internal control over financial reporting, assessing the risk that a material weakness exists, testing and evaluating the design and operating effectiveness of internal control based on the assessed risk, and performing such other procedures as we considered necessary in the circumstances. We believe that our audit provides a reasonable basis for our opinion.
Definition and Limitations of Internal Control Over Financial Reporting
A company’s internal control over financial reporting is a process designed to provide reasonable assurance regarding the reliability of financial reporting and the preparation of financial statements for external purposes in accordance with generally accepted accounting principles. A company’s internal control over financial reporting includes those policies and procedures that (1) pertain to the maintenance of records that, in reasonable detail, accurately and fairly reflect the transactions and dispositions of the assets of the company; (2) provide reasonable assurance that transactions are recorded as necessary to permit preparation of financial statements in accordance with generally accepted accounting principles, and that receipts and expenditures of the company are being made only in accordance with authorizations of management and directors of the company; and (3) provide reasonable assurance regarding prevention or timely detection of unauthorized acquisition, use, or disposition of the company’s assets that could have a material effect on the financial statements.
Because of its inherent limitations, internal control over financial reporting may not prevent or detect misstatements. Also, projections of any evaluation of effectiveness to future periods are subject to the risk that controls may become inadequate because of changes in conditions, or that the degree of compliance with the policies or procedures may deteriorate.
/s/ ERNST & YOUNG LLP
Denver, Colorado
February 28, 2018
49
Item 9B. Other Information
None.
PART III
Item 10. Directors, Executive Officers and Corporate Governance
Each member of the board of directors of Aimco also is a director of the general partner of the Aimco Operating Partnership. The officers of Aimco are also the officers of the general partner of the Aimco Operating Partnership and hold the same titles. The information required by this item for both Aimco and the Aimco Operating Partnership is presented jointly under the captions “Board of Directors and Executive Officers,” “Corporate Governance Matters - Code of Ethics,” “Other Matters - Section 16(a) Beneficial Ownership Reporting Compliance,” “Corporate Governance Matters - Meetings and Committees: Nominating and Corporate Governance Committee,” “Corporate Governance Matters - Meetings and Committees: Audit Committee” and “Corporate Governance Matters - Meetings and Committees: Audit Committee Financial Expert” in the proxy statement for Aimco’s 2018 annual meeting of stockholders and is incorporated herein by reference.
Item 11. Executive Compensation
The information required by this item is presented under the captions “Compensation Discussion & Analysis,” “Compensation and Human Resources Committee Report to Stockholders,” “Summary Compensation Table,” “Grants of Plan-Based Awards in 2017,” “Outstanding Equity Awards at Fiscal Year-End 2017,” “Option Exercises and Stock Vested in 2017,” “Potential Payments Upon Termination or Change in Control” and “Corporate Governance Matters - Director Compensation” in the proxy statement for Aimco’s 2018 annual meeting of stockholders and is incorporated herein by reference.
Item 12. Security Ownership of Certain Beneficial Owners and Management and Related Stockholder Matters
The information required by this item, for both Aimco and the Aimco Operating Partnership, is presented under the captions “Security Ownership of Certain Beneficial Owners and Management” and “Securities Authorized for Issuance Under Equity Compensation Plans” in the proxy statement for Aimco’s 2018 annual meeting of stockholders and is incorporated herein by reference. In addition, as of February 27, 2018, Aimco, through its consolidated subsidiaries, held 95.4% of the Aimco Operating Partnership’s common partnership units outstanding.
Item 13. Certain Relationships and Related Transactions, and Director Independence
The information required by this item is presented under the caption “Certain Relationships and Related Transactions” and “Corporate Governance Matters - Independence of Directors” in the proxy statement for Aimco’s 2018 annual meeting of stockholders and is incorporated herein by reference.
Item 14. Principal Accountant Fees and Services
The information required by this item is presented under the caption “Principal Accountant Fees and Services” in the proxy statement for Aimco’s 2018 annual meeting of stockholders and is incorporated herein by reference.
PART IV
Item 15. Exhibits and Financial Statement Schedules
(a)(1) | The financial statements listed in the Index to Financial Statements on Page F-1 of this report are filed as part of this report and incorporated herein by reference. |
(a)(2) | The financial statement schedule listed in the Index to Financial Statements on Page F-1 of this report is filed as part of this report and incorporated herein by reference. |
(a)(3) | The Exhibit Index is incorporated herein by reference. |
50
INDEX TO EXHIBITS (1) (2)
EXHIBIT NO. | DESCRIPTION |
Charter (Exhibit 3.1 to Aimco’s Quarterly Report on Form 10-Q for the quarterly period ended June 30, 2015, is incorporated herein by this reference) | |
Amended and Restated Bylaws (Exhibit 3.1 to Aimco’s Current Report on Form 8-K dated January 26, 2016, is incorporated herein by this reference) | |
Fourth Amended and Restated Agreement of Limited Partnership of the Aimco Operating Partnership, dated as of July 29, 1994, as amended and restated as of February 28, 2007 (Exhibit 10.1 to Aimco’s Annual Report on Form 10-K for the year ended December 31, 2006, is incorporated herein by this reference) | |
First Amendment to Fourth Amended and Restated Agreement of Limited Partnership of the Aimco Operating Partnership, dated as of December 31, 2007 (Exhibit 10.1 to Aimco’s Current Report on Form 8-K, dated December 31, 2007, is incorporated herein by this reference) | |
Second Amendment to the Fourth Amended and Restated Agreement of Limited Partnership of the Aimco Operating Partnership, dated as of July 30, 2009 (Exhibit 10.1 to Aimco’s Quarterly Report on Form 10-Q for the quarterly period ended June 30, 2009, is incorporated herein by this reference) | |
Third Amendment to the Fourth Amended and Restated Agreement of Limited Partnership of the Aimco Operating Partnership, dated as of September 2, 2010 (Exhibit 10.1 to Aimco’s Current Report on Form 8-K, dated September 3, 2010, is incorporated herein by this reference) | |
Fourth Amendment to the Fourth Amended and Restated Agreement of Limited Partnership of the Aimco Operating Partnership, dated as of July 26, 2011 (Exhibit 10.1 to Aimco’s Current Report on Form 8-K, dated July 26, 2011, is incorporated herein by this reference) | |
Fifth Amendment to the Fourth Amended and Restated Agreement of Limited Partnership of the Aimco Operating Partnership, dated as of August 24, 2011 (Exhibit 10.1 to Aimco’s Current Report on Form 8-K, dated August 24, 2011, is incorporated herein by this reference) | |
Sixth Amendment to the Fourth Amended and Restated Agreement of Limited Partnership of the Aimco Operating Partnership, dated as of December 31, 2011 (Exhibit 10.1 to Aimco’s Current Report on Form 8-K, dated December 31, 2011, is incorporated herein by this reference) | |
Seventh Amendment to the Fourth Amended and Restated Agreement of Limited Partnership of the Aimco Operating Partnership, dated as of May 13, 2014 (Exhibit 10.1 to Aimco’s Current Report on Form 8-K, dated May 15, 2014, is incorporated herein by this reference) | |
Eighth Amendment to the Fourth Amended and Restated Agreement of Limited Partnership of the Aimco Operating Partnership, dated as of October 31, 2014 (Exhibit 10.1 to Aimco’s Current Report on Form 8-K, dated November 4, 2014, is incorporated herein by this reference) | |
Ninth Amendment to the Fourth Amended and Restated Agreement of Limited Partnership of the Aimco Operating Partnership, dated as of August 16, 2016 (Exhibit 10.1 to Aimco’s Current Report on Form 8-K, dated August 16, 2016, is incorporated herein by this reference) | |
Tenth Amendment to the Fourth Amended and Restated Agreement of Limited Partnership of the Aimco Operating Partnership, dated as of January 31, 2017 (Exhibit 10.1 to Aimco’s Current Report on Form 8-K, dated January 31, 2017, is incorporated herein by this reference) | |
Second Amended and Restated Senior Secured Credit Agreement, dated as of June 30, 2017, among Aimco, the Aimco Operating Partnership, AIMCO/Bethesda Holdings, Inc., the lenders party thereto, KeyBank N.A., as administrative agent, swing line lender and a letter of credit issuer (Exhibit 10.1 to Aimco’s Current Report on Form 8-K, dated June 30, 2017, is incorporated herein by this reference) | |
Master Indemnification Agreement, dated December 3, 2001, by and among Aimco, the Aimco Operating Partnership., XYZ Holdings LLC, and the other parties signatory thereto (Exhibit 10.2 to Aimco’s Current Report on Form 8-K, dated December 6, 2001, is incorporated herein by this reference) | |
Tax Indemnification and Contest Agreement, dated December 3, 2001, by and among Aimco, National Partnership Investments, Corp., and XYZ Holdings LLC and the other parties signatory thereto (Exhibit 10.3 to Aimco’s Current Report on Form 8-K, dated December 6, 2001, is incorporated herein by this reference) | |
Employment Contract executed on December 21, 2017, by and between the Aimco Operating Partnership and Terry Considine (Exhibit 10.1 to Aimco’s Current Report on Form 8-K, dated December 21, 2017, is incorporated herein by this reference)* | |
2007 Stock Award and Incentive Plan (Appendix A to Aimco’s Proxy Statement on Schedule 14A filed with the Securities and Exchange Commission on March 20, 2007 is incorporated herein by this reference)* | |
Form of Restricted Stock Agreement (2007 Stock Award and Incentive Plan) (Exhibit 10.2 to Aimco’s Current Report on Form 8-K, dated April 30, 2007, is incorporated herein by this reference)* | |
Form of Non-Qualified Stock Option Agreement (2007 Stock Award and Incentive Plan) (Exhibit 10.3 to Aimco’s Current Report on Form 8-K, dated April 30, 2007, is incorporated herein by this reference)* | |
51
2007 Employee Stock Purchase Plan (Appendix B to Aimco’s Proxy Statement on Schedule 14A filed with the Securities and Exchange Commission on March 20, 2007, is incorporated herein by this reference)* | |
Apartment Investment and Management Company 2015 Stock Award and Incentive Plan (as amended and restated January 31, 2017) (Exhibit 10.2 to Aimco’s Current Report on Form 8-K, dated January 31, 2017, is incorporated herein by this reference)* | |
Form of Performance Restricted Stock Agreement (2015 Stock Award and Incentive Plan) (Exhibit 10.24 to Aimco’s Annual Report on Form 10-K for the year ended December 31, 2015, is incorporated herein by this reference)* | |
Form of Restricted Stock Agreement (2015 Stock Award and Incentive Plan) (Exhibit 10.25 to Aimco’s Annual Report on Form 10-K for the year ended December 31, 2015, is incorporated herein by this reference)* | |
Form of Non-Qualified Stock Option Agreement (2015 Stock Award and Incentive Plan) (Exhibit 10.26 to Aimco’s Annual Report on Form 10-K for the year ended December 31, 2015, is incorporated herein by this reference)* | |
Form of LTIP Unit Agreement (2015 Stock Award and Incentive Plan) (Exhibit 10.3 to Aimco’s Current Report on Form 8-K, dated January 31, 2017, is incorporated herein by this reference)* | |
Form of Performance Vesting LTIP Unit Agreement (2015 Stock Award and Incentive Plan) (Exhibit 10.4 to Aimco’s Current Report on Form 8-K, dated January 31, 2017, is incorporated herein by this reference)* | |
Form of Non-Qualified Stock Option Agreement (2015 Stock Award and Incentive Plan) (Exhibit 10.26 to Aimco’s Annual Report on Form 10-K for the year ended December 31, 2016, is incorporated herein by this reference)* | |
List of Subsidiaries | |
Consent of Independent Registered Public Accounting Firm - Aimco | |
Consent of Independent Registered Public Accounting Firm - Aimco Operating Partnership | |
Certification of Chief Executive Officer pursuant to Securities Exchange Act Rules 13a-14(a)/15d-14(a), as Adopted Pursuant to Section 302 of the Sarbanes-Oxley Act of 2002 - Aimco | |
Certification of Chief Financial Officer pursuant to Securities Exchange Act Rules 13a-14(a)/15d-14(a), as Adopted Pursuant to Section 302 of the Sarbanes-Oxley Act of 2002 - Aimco | |
Certification of Chief Executive Officer pursuant to Securities Exchange Act Rules 13a-14(a)/15d-14(a), as Adopted Pursuant to Section 302 of the Sarbanes-Oxley Act of 2002 - Aimco Operating Partnership | |
Certification of Chief Financial Officer pursuant to Securities Exchange Act Rules 13a-14(a)/15d-14(a), as Adopted Pursuant to Section 302 of the Sarbanes-Oxley Act of 2002 - Aimco Operating Partnership | |
Certification Pursuant to 18 U.S.C. Section 1350, as Adopted Pursuant to Section 906 of the Sarbanes-Oxley Act of 2002 - Aimco | |
Certification Pursuant to 18 U.S.C. Section 1350, as Adopted Pursuant to Section 906 of the Sarbanes-Oxley Act of 2002 - Aimco | |
Certification Pursuant to 18 U.S.C. Section 1350, as Adopted Pursuant to Section 906 of the Sarbanes-Oxley Act of 2002 - Aimco Operating Partnership | |
Certification Pursuant to 18 U.S.C. Section 1350, as Adopted Pursuant to Section 906 of the Sarbanes-Oxley Act of 2002 - Aimco Operating Partnership | |
Agreement regarding disclosure of long-term debt instruments - Aimco | |
Agreement regarding disclosure of long-term debt instruments - Aimco Operating Partnership | |
101 | XBRL (Extensible Business Reporting Language). The following materials from Aimco’s and the Aimco Operating Partnership’s combined Annual Report on Form 10-K for the year ended December 31, 2017, formatted in XBRL: (i) consolidated balance sheets; (ii) consolidated statements of operations; (iii) consolidated statements of comprehensive income; (iv) consolidated statements of equity and consolidated statements of partners’ capital; (v) consolidated statements of cash flows; (vi) notes to the consolidated financial statements; and (vii) financial statement schedule (3) |
(1) | Schedule and supplemental materials to the exhibits have been omitted but will be provided to the Securities and Exchange Commission upon request. |
(2) | The Commission file numbers for exhibits is 001-13232 (Aimco) and 0-24497 (the Aimco Operating Partnership), and all such exhibits remain available pursuant to the Records Control Schedule of the Securities and Exchange Commission. |
(3) | As provided in Rule 406T of Regulation S-T, this information is furnished and not filed for purposes of Sections 11 and 12 of the Securities Act of 1933 and Section 18 of the Securities Exchange Act of 1934. |
* | Management contract or compensatory plan or arrangement |
Item 16. Form 10-K Summary
None.
52
SIGNATURES
Pursuant to the requirements of Section 13 or 15(d) of the Securities Exchange Act of 1934, each registrant has duly caused this report to be signed on its behalf by the undersigned, thereunto duly authorized.
APARTMENT INVESTMENT AND MANAGEMENT COMPANY | |
By: | /s/ TERRY CONSIDINE |
Terry Considine | |
Chairman of the Board and Chief Executive Officer | |
Date: | February 28, 2018 |
AIMCO PROPERTIES, L.P. | |
By: | AIMCO-GP, Inc., its General Partner |
By: | /s/ TERRY CONSIDINE |
Terry Considine | |
Chairman of the Board and Chief Executive Officer | |
Date: | February 28, 2018 |
53
Pursuant to the requirements of the Securities Exchange Act of 1934, this report has been signed below by the following persons on behalf of each registrant and in the capacities and on the dates indicated.
Signature | Title | Date | |
APARTMENT INVESTMENT AND MANAGEMENT COMPANY | |||
AIMCO PROPERTIES, L.P. | |||
By: AIMCO-GP, Inc., its General Partner | |||
/s/ TERRY CONSIDINE | Chairman of the Board and | February 28, 2018 | |
Terry Considine | Chief Executive Officer (principal executive officer) | ||
/s/ PAUL BELDIN | Executive Vice President and | February 28, 2018 | |
Paul Beldin | Chief Financial Officer (principal financial officer) | ||
/s/ ANDREW HIGDON | Senior Vice President and | February 28, 2018 | |
Andrew Higdon | Chief Accounting Officer (principal accounting officer) | ||
/s/ THOMAS L. KELTNER | Director | February 28, 2018 | |
Thomas L. Keltner | |||
/s/ J. LANDIS MARTIN | Director | February 28, 2018 | |
J. Landis Martin | |||
/s/ ROBERT A. MILLER | Director | February 28, 2018 | |
Robert A. Miller | |||
/s/ KATHLEEN M. NELSON | Director | February 28, 2018 | |
Kathleen M. Nelson | |||
/s/ MICHAEL A. STEIN | Director | February 28, 2018 | |
Michael A. Stein | |||
/s/ NINA A. TRAN | Director | February 28, 2018 | |
Nina A. Tran | |||
54
APARTMENT INVESTMENT AND MANAGEMENT COMPANY
AIMCO PROPERTIES, L.P.
INDEX TO FINANCIAL STATEMENTS
Page | |
Financial Statements: | |
Financial Statement Schedule: | |
All other schedules are omitted because they are not applicable or the required information is shown in the financial statements or notes thereto. | |
F-1
Report of Independent Registered Public Accounting Firm
The Board of Directors and Stockholders of
Apartment Investment and Management Company
Opinion on the Financial Statements
We have audited the accompanying consolidated balance sheets of Apartment Investment and Management Company (the Company) as of December 31, 2017 and 2016, the related consolidated statements of operations, comprehensive income, equity, and cash flows for each of the three years in the period ended December 31, 2017, and the related notes and the financial statement schedule listed in the accompanying Index to Financial Statements (collectively referred to as the “consolidated financial statements”). In our opinion, the consolidated financial statements present fairly, in all material respects, the financial position of the Company at December 31, 2017 and 2016, and the results of its operations and its cash flows for each of the three years in the period ended December 31, 2017, in conformity with U.S. generally accepted accounting principles.
We also have audited, in accordance with the standards of the Public Company Accounting Oversight Board (United States) (PCAOB), the Company's internal control over financial reporting as of December 31, 2017, based on criteria established in Internal Control-Integrated Framework issued by the Committee of Sponsoring Organizations of the Treadway Commission (2013 framework) and our report dated February 28, 2018 expressed an unqualified opinion thereon.
Adoption of New Accounting Standard
As discussed in Note 2 to the consolidated financial statements, the Company changed its accounting for the income tax consequences of intercompany transfers of assets effective January 1, 2017.
Basis for Opinion
These financial statements are the responsibility of the Company's management. Our responsibility is to express an opinion on the Company’s financial statements based on our audits. We are a public accounting firm registered with the PCAOB and are required to be independent with respect to the Company in accordance with the U.S. federal securities laws and the applicable rules and regulations of the Securities and Exchange Commission and the PCAOB.
We conducted our audits in accordance with the standards of the PCAOB. Those standards require that we plan and perform the audit to obtain reasonable assurance about whether the financial statements are free of material misstatement, whether due to error or fraud. Our audits included performing procedures to assess the risks of material misstatement of the financial statements, whether due to error or fraud, and performing procedures that respond to those risks. Such procedures included examining, on a test basis, evidence regarding the amounts and disclosures in the financial statements. Our audits also included evaluating the accounting principles used and significant estimates made by management, as well as evaluating the overall presentation of the financial statements. We believe that our audits provide a reasonable basis for our opinion.
/s/ ERNST & YOUNG LLP
We have served as the Company’s auditor since 1994.
Denver, Colorado
February 28, 2018
F-2
APARTMENT INVESTMENT AND MANAGEMENT COMPANY
CONSOLIDATED BALANCE SHEETS
As of December 31, 2017 and 2016
(In thousands, except share data)
2017 | 2016 | ||||||
ASSETS | |||||||
Buildings and improvements | $ | 6,174,149 | $ | 6,106,298 | |||
Land | 1,753,604 | 1,824,819 | |||||
Total real estate | 7,927,753 | 7,931,117 | |||||
Accumulated depreciation | (2,522,358 | ) | (2,421,357 | ) | |||
Net real estate | 5,405,395 | 5,509,760 | |||||
Cash and cash equivalents | 60,498 | 45,821 | |||||
Restricted cash | 34,827 | 36,405 | |||||
Other assets | 272,739 | 293,768 | |||||
Assets held for sale | 17,959 | — | |||||
Assets of partnerships served by Asset Management business: | |||||||
Real estate, net | 224,873 | 245,648 | |||||
Cash and cash equivalents | 16,288 | 15,423 | |||||
Restricted cash | 30,928 | 33,501 | |||||
Other assets | 15,533 | 52,492 | |||||
Total assets | $ | 6,079,040 | $ | 6,232,818 | |||
LIABILITIES AND EQUITY | |||||||
Non-recourse property debt secured by Real Estate communities, net | $ | 3,545,109 | $ | 3,630,276 | |||
Term loan, net | 249,501 | — | |||||
Revolving credit facility borrowings | 67,160 | 17,930 | |||||
Total indebtedness associated with Real Estate portfolio | 3,861,770 | 3,648,206 | |||||
Accrued liabilities and other | 200,540 | 218,937 | |||||
Liabilities of partnerships served by Asset Management business: | |||||||
Non-recourse property debt, net | 227,141 | 236,426 | |||||
Accrued liabilities and other | 19,812 | 62,630 | |||||
Deferred income | 12,487 | 18,452 | |||||
Total liabilities | 4,321,750 | 4,184,651 | |||||
Preferred noncontrolling interests in Aimco Operating Partnership (Note 7) | 101,537 | 103,201 | |||||
Commitments and contingencies (Note 5) | |||||||
Equity: | |||||||
Perpetual Preferred Stock (Note 6) | 125,000 | 125,000 | |||||
Common Stock, $0.01 par value, 500,787,260 shares authorized, 157,189,447 and 156,888,381 shares issued/outstanding at December 31, 2017 and 2016, respectively | 1,572 | 1,569 | |||||
Additional paid-in capital | 3,900,042 | 4,051,722 | |||||
Accumulated other comprehensive income | 3,603 | 1,011 | |||||
Distributions in excess of earnings | (2,367,073 | ) | (2,385,399 | ) | |||
Total Aimco equity | 1,663,144 | 1,793,903 | |||||
Noncontrolling interests in consolidated real estate partnerships | (1,716 | ) | 151,121 | ||||
Common noncontrolling interests in Aimco Operating Partnership | (5,675 | ) | (58 | ) | |||
Total equity | 1,655,753 | 1,944,966 | |||||
Total liabilities and equity | $ | 6,079,040 | $ | 6,232,818 | |||
See notes to the consolidated financial statements.
F-3
APARTMENT INVESTMENT AND MANAGEMENT COMPANY
CONSOLIDATED STATEMENTS OF OPERATIONS
For the Years Ended December 31, 2017, 2016 and 2015
(In thousands, except per share data)
2017 | 2016 | 2015 | |||||||||
REVENUES: | |||||||||||
Rental and other property revenues attributable to Real Estate | $ | 918,148 | $ | 899,891 | $ | 883,020 | |||||
Rental and other property revenues of partnerships served by Asset Management business | 74,046 | 74,640 | 73,934 | ||||||||
Tax credit and transaction revenues | 13,243 | 21,323 | 24,356 | ||||||||
Total revenues | 1,005,437 | 995,854 | 981,310 | ||||||||
OPERATING EXPENSES: | |||||||||||
Property operating expenses attributable to Real Estate | 318,939 | 317,957 | 324,579 | ||||||||
Property operating expenses of partnerships served by Asset Management business | 35,440 | 36,956 | 37,537 | ||||||||
Depreciation and amortization | 366,184 | 333,066 | 306,301 | ||||||||
General and administrative expenses | 43,657 | 46,784 | 46,310 | ||||||||
Other expenses, net | 11,353 | 14,295 | 10,368 | ||||||||
Provision for real estate impairment loss (Note 3) | 35,881 | — | — | ||||||||
Total operating expenses | 811,454 | 749,058 | 725,095 | ||||||||
Operating income | 193,983 | 246,796 | 256,215 | ||||||||
Interest income | 8,332 | 7,797 | 6,949 | ||||||||
Interest expense | (194,615 | ) | (196,389 | ) | (199,685 | ) | |||||
Other, net | 7,694 | 6,071 | 387 | ||||||||
Income before income taxes and gain on dispositions | 15,394 | 64,275 | 63,866 | ||||||||
Income tax benefit (Note 9) | 32,126 | 25,208 | 27,524 | ||||||||
Income before gain on dispositions | 47,520 | 89,483 | 91,390 | ||||||||
Gain on dispositions of real estate, net of tax | 299,559 | 393,790 | 180,593 | ||||||||
Net income | 347,079 | 483,273 | 271,983 | ||||||||
Noncontrolling interests: | |||||||||||
Net income attributable to noncontrolling interests in consolidated real estate partnerships | (9,084 | ) | (25,256 | ) | (4,776 | ) | |||||
Net income attributable to preferred noncontrolling interests in Aimco Operating Partnership | (7,764 | ) | (7,239 | ) | (6,943 | ) | |||||
Net income attributable to common noncontrolling interests in Aimco Operating Partnership | (14,457 | ) | (20,368 | ) | (11,554 | ) | |||||
Net income attributable to noncontrolling interests | (31,305 | ) | (52,863 | ) | (23,273 | ) | |||||
Net income attributable to Aimco | 315,774 | 430,410 | 248,710 | ||||||||
Net income attributable to Aimco preferred stockholders | (8,594 | ) | (11,994 | ) | (11,794 | ) | |||||
Net income attributable to participating securities | (319 | ) | (635 | ) | (950 | ) | |||||
Net income attributable to Aimco common stockholders | $ | 306,861 | $ | 417,781 | $ | 235,966 | |||||
Net income attributable to Aimco per common share – basic | $ | 1.96 | $ | 2.68 | $ | 1.52 | |||||
Net income attributable to Aimco per common share – diluted | $ | 1.96 | $ | 2.67 | $ | 1.52 | |||||
Weighted average common shares outstanding – basic | 156,323 | 156,001 | 155,177 | ||||||||
Weighted average common shares outstanding – diluted | 156,796 | 156,391 | 155,570 | ||||||||
See notes to the consolidated financial statements.
F-4
APARTMENT INVESTMENT AND MANAGEMENT COMPANY
CONSOLIDATED STATEMENTS OF COMPREHENSIVE INCOME
For the Years Ended December 31, 2017, 2016 and 2015
(In thousands)
2017 | 2016 | 2015 | |||||||||
Net income | $ | 347,079 | $ | 483,273 | $ | 271,983 | |||||
Other comprehensive income: | |||||||||||
Unrealized (losses) gains on interest rate swaps | (173 | ) | 221 | (1,299 | ) | ||||||
Losses on interest rate swaps reclassified into interest expense from accumulated other comprehensive income | 1,480 | 1,586 | 1,678 | ||||||||
Unrealized gains on debt securities classified as available-for-sale | 1,507 | 5,855 | 214 | ||||||||
Other comprehensive income | 2,814 | 7,662 | 593 | ||||||||
Comprehensive income | 349,893 | 490,935 | 272,576 | ||||||||
Comprehensive income attributable to noncontrolling interests | (31,527 | ) | (53,474 | ) | (23,450 | ) | |||||
Comprehensive income attributable to Aimco | $ | 318,366 | $ | 437,461 | $ | 249,126 | |||||
See notes to the consolidated financial statements.
F-5
APARTMENT INVESTMENT AND MANAGEMENT COMPANY
CONSOLIDATED STATEMENTS OF EQUITY
For the Years Ended December 31, 2017, 2016 and 2015
(In thousands)
Preferred Stock | Common Stock | ||||||||||||||||||||||||||||||||||||
Shares Issued | Amount | Shares Issued | Amount | Additional Paid-in Capital | Accumulated Other Comprehensive Income (Loss) | Distributions in Excess of Earnings | Total Aimco Equity | Noncontrolling Interests | Total Equity | ||||||||||||||||||||||||||||
Balances at December 31, 2014 | 6,391 | $ | 186,126 | 146,403 | $ | 1,464 | $ | 3,696,143 | $ | (6,456 | ) | $ | (2,649,542 | ) | $ | 1,227,735 | $ | 214,370 | $ | 1,442,105 | |||||||||||||||||
Issuance of Common Stock | — | — | 9,430 | 94 | 366,486 | — | — | 366,580 | — | 366,580 | |||||||||||||||||||||||||||
Repurchase of Preferred Stock | — | (27,000 | ) | — | — | 695 | — | (695 | ) | (27,000 | ) | — | (27,000 | ) | |||||||||||||||||||||||
Redemption of Aimco Operating Partnership units | — | — | — | — | — | — | — | — | (4,181 | ) | (4,181 | ) | |||||||||||||||||||||||||
Amortization of share-based compensation cost | — | — | 27 | — | 7,096 | — | — | 7,096 | — | 7,096 | |||||||||||||||||||||||||||
Effect of changes in ownership for consolidated entities | — | — | — | — | (6,008 | ) | — | — | (6,008 | ) | 4,189 | (1,819 | ) | ||||||||||||||||||||||||
Change in accumulated other comprehensive income | — | — | — | — | — | 416 | — | 416 | 177 | 593 | |||||||||||||||||||||||||||
Other, net | — | — | 466 | 5 | 247 | — | 100 | 352 | — | 352 | |||||||||||||||||||||||||||
Net income | — | — | — | — | — | — | 248,710 | 248,710 | 16,330 | 265,040 | |||||||||||||||||||||||||||
Distributions to noncontrolling interests | — | — | — | — | — | — | — | — | (89,371 | ) | (89,371 | ) | |||||||||||||||||||||||||
Common Stock dividends | — | — | — | — | — | — | (184,391 | ) | (184,391 | ) | — | (184,391 | ) | ||||||||||||||||||||||||
Preferred Stock dividends | — | — | — | — | — | — | (11,099 | ) | (11,099 | ) | — | (11,099 | ) | ||||||||||||||||||||||||
Balances at December 31, 2015 | 6,391 | 159,126 | 156,326 | 1,563 | 4,064,659 | (6,040 | ) | (2,596,917 | ) | 1,622,391 | 141,514 | 1,763,905 | |||||||||||||||||||||||||
Redemption of Preferred Stock | (1,391 | ) | (34,126 | ) | — | — | 1,307 | — | (1,980 | ) | (34,799 | ) | — | (34,799 | ) | ||||||||||||||||||||||
Redemption of Aimco Operating Partnership units | — | — | — | — | — | — | — | — | (10,819 | ) | (10,819 | ) | |||||||||||||||||||||||||
Amortization of share-based compensation cost | — | — | 31 | — | 8,610 | — | — | 8,610 | — | 8,610 | |||||||||||||||||||||||||||
Effect of changes in ownership for consolidated entities | — | — | — | — | (26,171 | ) | — | — | (26,171 | ) | 10,107 | (16,064 | ) | ||||||||||||||||||||||||
Change in accumulated other comprehensive income | — | — | — | — | — | 7,051 | — | 7,051 | 611 | 7,662 | |||||||||||||||||||||||||||
Other, net | — | — | 531 | 6 | 3,317 | — | — | 3,323 | — | 3,323 | |||||||||||||||||||||||||||
Net income | — | — | — | — | — | — | 430,410 | 430,410 | 45,624 | 476,034 | |||||||||||||||||||||||||||
Distributions to noncontrolling interests | — | — | — | — | — | — | — | — | (35,974 | ) | (35,974 | ) | |||||||||||||||||||||||||
Common Stock dividends | — | — | — | — | — | — | (206,898 | ) | (206,898 | ) | — | (206,898 | ) | ||||||||||||||||||||||||
Preferred Stock dividends | — | — | — | — | — | — | (10,014 | ) | (10,014 | ) | — | (10,014 | ) | ||||||||||||||||||||||||
Balances at December 31, 2016 | 5,000 | 125,000 | 156,888 | 1,569 | 4,051,722 | 1,011 | (2,385,399 | ) | 1,793,903 | 151,063 | 1,944,966 | ||||||||||||||||||||||||||
Redemption of Aimco Operating Partnership units | — | — | — | — | — | — | — | — | (11,882 | ) | (11,882 | ) | |||||||||||||||||||||||||
Amortization of share-based compensation cost | — | — | 18 | — | 8,638 | — | — | 8,638 | 613 | 9,251 | |||||||||||||||||||||||||||
Contributions from noncontrolling interests | — | — | — | — | — | — | — | — | 3,401 | 3,401 | |||||||||||||||||||||||||||
Effect of changes in ownership for consolidated entities | — | — | — | — | (160,586 | ) | — | — | (160,586 | ) | (152,189 | ) | (312,775 | ) | |||||||||||||||||||||||
Cumulative effect of a change in accounting principle | — | — | — | — | — | — | (62,682 | ) | (62,682 | ) | (3,028 | ) | (65,710 | ) | |||||||||||||||||||||||
Change in accumulated other comprehensive income | — | — | — | — | — | 2,592 | — | 2,592 | 222 | 2,814 | |||||||||||||||||||||||||||
Other, net | — | — | 283 | 3 | 268 | — | — | 271 | — | 271 | |||||||||||||||||||||||||||
Net income | — | — | — | — | — | — | 315,774 | 315,774 | 23,541 | 339,315 | |||||||||||||||||||||||||||
Distributions to noncontrolling interests | — | — | — | — | — | — | — | — | (19,132 | ) | (19,132 | ) | |||||||||||||||||||||||||
Common Stock dividends | — | — | — | — | — | — | (226,172 | ) | (226,172 | ) | — | (226,172 | ) | ||||||||||||||||||||||||
Preferred Stock dividends | — | — | — | — | — | — | (8,594 | ) | (8,594 | ) | — | (8,594 | ) | ||||||||||||||||||||||||
Balances at December 31, 2017 | 5,000 | $ | 125,000 | 157,189 | $ | 1,572 | $ | 3,900,042 | $ | 3,603 | $ | (2,367,073 | ) | $ | 1,663,144 | $ | (7,391 | ) | $ | 1,655,753 | |||||||||||||||||
See notes to the consolidated financial statements.
F-6
APARTMENT INVESTMENT AND MANAGEMENT COMPANY
CONSOLIDATED STATEMENTS OF CASH FLOWS
For the Years Ended December 31, 2017, 2016 and 2015
(In thousands)
2017 | 2016 | 2015 | |||||||||
CASH FLOWS FROM OPERATING ACTIVITIES: | |||||||||||
Net income | $ | 347,079 | $ | 483,273 | $ | 271,983 | |||||
Adjustments to reconcile net income to net cash provided by operating activities: | |||||||||||
Depreciation and amortization | 366,184 | 333,066 | 306,301 | ||||||||
Gain on dispositions of real estate, net of tax | (299,559 | ) | (393,790 | ) | (180,593 | ) | |||||
Provision for real estate impairment loss | 35,881 | — | — | ||||||||
Income tax benefit | (32,126 | ) | (25,208 | ) | (27,524 | ) | |||||
Share-based compensation expense | 7,877 | 7,629 | 6,640 | ||||||||
Amortization of debt issue costs and other | 5,666 | 5,060 | 5,186 | ||||||||
Other, net | (7,694 | ) | (6,071 | ) | (387 | ) | |||||
Changes in operating assets and operating liabilities: | |||||||||||
Accounts receivable and other assets | (13,375 | ) | (20,680 | ) | 619 | ||||||
Accounts payable, accrued liabilities and other | (15,794 | ) | (5,555 | ) | (22,334 | ) | |||||
Total adjustments | 47,060 | (105,549 | ) | 87,908 | |||||||
Net cash provided by operating activities | 394,139 | 377,724 | 359,891 | ||||||||
CASH FLOWS FROM INVESTING ACTIVITIES: | |||||||||||
Purchases of real estate and deposits related to purchases of real estate | (20,372 | ) | (290,729 | ) | (169,447 | ) | |||||
Capital expenditures | (358,104 | ) | (346,645 | ) | (367,180 | ) | |||||
Proceeds from dispositions of real estate | 402,162 | 535,513 | 367,571 | ||||||||
Purchases of corporate assets | (8,899 | ) | (7,540 | ) | (6,665 | ) | |||||
Changes in restricted cash | 1,506 | 1,374 | (429 | ) | |||||||
Other investing activities | (1,589 | ) | 10,254 | 5,253 | |||||||
Net cash provided by (used in) investing activities | 14,704 | (97,773 | ) | (170,897 | ) | ||||||
CASH FLOWS FROM FINANCING ACTIVITIES: | |||||||||||
Proceeds from non-recourse property debt | 312,434 | 417,714 | 352,602 | ||||||||
Principal repayments on non-recourse property debt | (409,167 | ) | (371,947 | ) | (514,294 | ) | |||||
Proceeds from term loan | 250,000 | — | — | ||||||||
Net borrowings (repayments) on revolving credit facility | 49,230 | (9,070 | ) | (85,330 | ) | ||||||
Proceeds from issuance of Common Stock | — | — | 366,580 | ||||||||
Redemptions of Preferred Stock | — | (34,799 | ) | (27,000 | ) | ||||||
Payment of dividends to holders of Preferred Stock | (8,594 | ) | (10,014 | ) | (11,099 | ) | |||||
Payment of dividends to holders of Common Stock | (225,377 | ) | (206,279 | ) | (184,082 | ) | |||||
Payment of distributions to noncontrolling interests | (26,799 | ) | (35,706 | ) | (57,401 | ) | |||||
Purchases and redemptions of noncontrolling interests | (327,815 | ) | (26,485 | ) | (4,517 | ) | |||||
Other financing activities | (7,213 | ) | 7,090 | (2,635 | ) | ||||||
Net cash used in financing activities | (393,301 | ) | (269,496 | ) | (167,176 | ) | |||||
NET INCREASE IN CASH AND CASH EQUIVALENTS | 15,542 | 10,455 | 21,818 | ||||||||
CASH AND CASH EQUIVALENTS AT BEGINNING OF PERIOD | 61,244 | 50,789 | 28,971 | ||||||||
CASH AND CASH EQUIVALENTS AT END OF PERIOD | $ | 76,786 | $ | 61,244 | $ | 50,789 | |||||
See notes to the consolidated financial statements.
F-7
APARTMENT INVESTMENT AND MANAGEMENT COMPANY
CONSOLIDATED STATEMENTS OF CASH FLOWS
For the Years Ended December 31, 2017, 2016 and 2015
(In thousands)
2017 | 2016 | 2015 | |||||||||
SUPPLEMENTAL CASH FLOW INFORMATION: | |||||||||||
Interest paid | $ | 196,438 | $ | 200,278 | $ | 207,087 | |||||
Cash paid for income taxes | 7,401 | 2,152 | 2,033 | ||||||||
Non-cash transactions associated with the acquisition or disposition of real estate: | |||||||||||
Non-recourse property debt assumed by buyer in connection with the disposition of real estate | — | — | 6,068 | ||||||||
Issuance of preferred OP Units in connection with acquisition of real estate | — | 17,000 | — | ||||||||
Other non-cash investing and financing transactions: | |||||||||||
Accrued capital expenditures (at end of period) | 31,719 | 35,594 | 43,725 | ||||||||
Accrued dividends on TSR restricted stock and LTIP awards (at end of period) (Note 8) | 1,720 | 927 | 309 | ||||||||
See notes to the consolidated financial statements.
F-8
Report of Independent Registered Public Accounting Firm
The Partners of
AIMCO Properties, L.P.
Opinion on the Financial Statements
We have audited the accompanying consolidated balance sheets of AIMCO Properties, L.P. (the “Partnership”) as of December 31, 2017 and 2016, the related consolidated statements of operations, comprehensive income, partners' capital, and cash flows for each of the three years in the period ended December 31, 2017, and the related notes and the financial statement schedule listed in the accompanying Index to Financial Statements (collectively referred to as the “consolidated financial statements”). In our opinion, the consolidated financial statements present fairly, in all material respects, the financial position of the Partnership at December 31, 2017 and 2016, and the results of its operations and its cash flows for each of the three years in the period ended December 31, 2017, in conformity with U.S. generally accepted accounting principles.
We also have audited, in accordance with the standards of the Public Company Accounting Oversight Board (United States) (PCAOB), the Partnership's internal control over financial reporting as of December 31, 2017, based on criteria established in Internal Control-Integrated Framework issued by the Committee of Sponsoring Organizations of the Treadway Commission (2013 framework) and our report dated February 28, 2018 expressed an unqualified opinion thereon.
Adoption of New Accounting Standard
As discussed in Note 2 to the consolidated financial statements, the Partnership changed its accounting for the income tax consequences of intercompany transfers of assets effective January 1, 2017.
Basis for Opinion
These financial statements are the responsibility of the Partnership's management. Our responsibility is to express an opinion on the Partnership’s financial statements based on our audits. We are a public accounting firm registered with the PCAOB and are required to be independent with respect to the Partnership in accordance with the U.S. federal securities laws and the applicable rules and regulations of the Securities and Exchange Commission and the PCAOB.
We conducted our audits in accordance with the standards of the PCAOB. Those standards require that we plan and perform the audit to obtain reasonable assurance about whether the financial statements are free of material misstatement, whether due to error or fraud. Our audits included performing procedures to assess the risks of material misstatement of the financial statements, whether due to error or fraud, and performing procedures that respond to those risks. Such procedures included examining, on a test basis, evidence regarding the amounts and disclosures in the financial statements. Our audits also included evaluating the accounting principles used and significant estimates made by management, as well as evaluating the overall presentation of the financial statements. We believe that our audits provide a reasonable basis for our opinion.
/s/ ERNST & YOUNG LLP
We have served as the Partnership’s auditor since 1994.
Denver, Colorado
February 28, 2018
F-9
AIMCO PROPERTIES, L.P.
CONSOLIDATED BALANCE SHEETS
As of December 31, 2017 and 2016
(In thousands)
2017 | 2016 | ||||||
ASSETS | |||||||
Buildings and improvements | $ | 6,174,149 | $ | 6,106,298 | |||
Land | 1,753,604 | 1,824,819 | |||||
Total real estate | 7,927,753 | 7,931,117 | |||||
Accumulated depreciation | (2,522,358 | ) | (2,421,357 | ) | |||
Net real estate | 5,405,395 | 5,509,760 | |||||
Cash and cash equivalents | 60,498 | 45,821 | |||||
Restricted cash | 34,827 | 36,405 | |||||
Other assets | 272,739 | 293,768 | |||||
Assets held for sale | 17,959 | — | |||||
Assets of partnerships served by Asset Management business: | |||||||
Real estate, net | 224,873 | 245,648 | |||||
Cash and cash equivalents | 16,288 | 15,423 | |||||
Restricted cash | 30,928 | 33,501 | |||||
Other assets | 15,533 | 52,492 | |||||
Total assets | $ | 6,079,040 | $ | 6,232,818 | |||
LIABILITIES AND PARTNERS’ CAPITAL | |||||||
Non-recourse property debt secured by Real Estate communities, net | $ | 3,545,109 | $ | 3,630,276 | |||
Term loan, net | 249,501 | — | |||||
Revolving credit facility borrowings | 67,160 | 17,930 | |||||
Total indebtedness associated with Real Estate portfolio | 3,861,770 | 3,648,206 | |||||
Accrued liabilities and other | 200,540 | 218,937 | |||||
Liabilities of partnerships served by Asset Management business: | |||||||
Non-recourse property debt, net | 227,141 | 236,426 | |||||
Accrued liabilities and other | 19,812 | 62,630 | |||||
Deferred income | 12,487 | 18,452 | |||||
Total liabilities | 4,321,750 | 4,184,651 | |||||
Redeemable preferred units (Note 7) | 101,537 | 103,201 | |||||
Commitments and contingencies (Note 5) | |||||||
Partners’ Capital: | |||||||
Preferred units (Note 7) | 125,000 | 125,000 | |||||
General Partner and Special Limited Partner | 1,538,144 | 1,668,903 | |||||
Limited Partners | (5,675 | ) | (58 | ) | |||
Partners’ capital attributable to the Aimco Operating Partnership | 1,657,469 | 1,793,845 | |||||
Noncontrolling interests in consolidated real estate partnerships | (1,716 | ) | 151,121 | ||||
Total partners’ capital | 1,655,753 | 1,944,966 | |||||
Total liabilities and partners’ capital | $ | 6,079,040 | $ | 6,232,818 | |||
See notes to the consolidated financial statements.
F-10
AIMCO PROPERTIES, L.P.
CONSOLIDATED STATEMENTS OF OPERATIONS
As of December 31, 2017, 2016 and 2015
(In thousands, except per unit data)
2017 | 2016 | 2015 | |||||||||
REVENUES: | |||||||||||
Rental and other property revenues attributable to Real Estate | $ | 918,148 | $ | 899,891 | $ | 883,020 | |||||
Rental and other property revenues of partnerships served by Asset Management business | 74,046 | 74,640 | 73,934 | ||||||||
Tax credit and transaction revenues | 13,243 | 21,323 | 24,356 | ||||||||
Total revenues | 1,005,437 | 995,854 | 981,310 | ||||||||
OPERATING EXPENSES: | |||||||||||
Property operating expenses attributable to Real Estate | 318,939 | 317,957 | 324,579 | ||||||||
Property operating expenses of partnerships served by Asset Management business | 35,440 | 36,956 | 37,537 | ||||||||
Depreciation and amortization | 366,184 | 333,066 | 306,301 | ||||||||
General and administrative expenses | 43,657 | 46,784 | 46,310 | ||||||||
Other expenses, net | 11,353 | 14,295 | 10,368 | ||||||||
Provision for real estate impairment loss (Note 3) | 35,881 | — | — | ||||||||
Total operating expenses | 811,454 | 749,058 | 725,095 | ||||||||
Operating income | 193,983 | 246,796 | 256,215 | ||||||||
Interest income | 8,332 | 7,797 | 6,949 | ||||||||
Interest expense | (194,615 | ) | (196,389 | ) | (199,685 | ) | |||||
Other, net | 7,694 | 6,071 | 387 | ||||||||
Income before income taxes and gain on dispositions | 15,394 | 64,275 | 63,866 | ||||||||
Income tax benefit (Note 9) | 32,126 | 25,208 | 27,524 | ||||||||
Income before gain on dispositions | 47,520 | 89,483 | 91,390 | ||||||||
Gain on dispositions of real estate, net of tax | 299,559 | 393,790 | 180,593 | ||||||||
Net income | 347,079 | 483,273 | 271,983 | ||||||||
Net income attributable to noncontrolling interests in consolidated real estate partnerships | (9,084 | ) | (25,256 | ) | (4,776 | ) | |||||
Net income attributable to the Aimco Operating Partnership | 337,995 | 458,017 | 267,207 | ||||||||
Net income attributable to the Aimco Operating Partnership’s preferred unitholders | (16,358 | ) | (19,233 | ) | (18,737 | ) | |||||
Net income attributable to participating securities | (337 | ) | (635 | ) | (950 | ) | |||||
Net income attributable to the Aimco Operating Partnership’s common unitholders | $ | 321,300 | $ | 438,149 | $ | 247,520 | |||||
Net income attributable to the Aimco Operating Partnership per common unit – basic | $ | 1.96 | $ | 2.68 | $ | 1.52 | |||||
Net income attributable to the Aimco Operating Partnership per common unit – diluted | $ | 1.96 | $ | 2.67 | $ | 1.52 | |||||
Weighted average common units outstanding – basic | 163,746 | 163,761 | 162,834 | ||||||||
Weighted average common units outstanding – diluted | 164,218 | 164,151 | 163,227 | ||||||||
See notes to the consolidated financial statements.
F-11
AIMCO PROPERTIES, L.P.
CONSOLIDATED STATEMENTS OF COMPREHENSIVE INCOME
For the Years Ended December 31, 2017, 2016 and 2015
(In thousands)
2017 | 2016 | 2015 | |||||||||
Net income | $ | 347,079 | $ | 483,273 | $ | 271,983 | |||||
Other comprehensive income: | |||||||||||
Unrealized (losses) gains on interest rate swaps | (173 | ) | 221 | (1,299 | ) | ||||||
Losses on interest rate swaps reclassified into interest expense from accumulated other comprehensive income | 1,480 | 1,586 | 1,678 | ||||||||
Unrealized gains on debt securities classified as available-for-sale | 1,507 | 5,855 | 214 | ||||||||
Other comprehensive income | 2,814 | 7,662 | 593 | ||||||||
Comprehensive income | 349,893 | 490,935 | 272,576 | ||||||||
Comprehensive income attributable to noncontrolling interests | (9,185 | ) | (25,516 | ) | (4,932 | ) | |||||
Comprehensive income attributable to the Aimco Operating Partnership | $ | 340,708 | $ | 465,419 | $ | 267,644 | |||||
See notes to the consolidated financial statements.
F-12
AIMCO PROPERTIES, L.P.
CONSOLIDATED STATEMENTS OF PARTNERS’ CAPITAL
For the Years Ended December 31, 2017, 2016 and 2015
(In thousands)
Preferred Units | General Partner and Special Limited Partner | Limited Partners | Partners’ Capital Attributable to the Partnership | Noncontrolling Interests | Total Partners’ Capital | ||||||||||||||||||
Balances at December 31, 2014 | $ | 186,126 | $ | 1,041,609 | $ | (18,926 | ) | $ | 1,208,809 | $ | 233,296 | $ | 1,442,105 | ||||||||||
Issuance of common partnership units to Aimco | — | 366,580 | — | 366,580 | — | 366,580 | |||||||||||||||||
Redemption of preferred units held by Aimco | (27,000 | ) | — | — | (27,000 | ) | — | (27,000 | ) | ||||||||||||||
Redemption of partnership units held by non-Aimco partners | — | — | (4,181 | ) | (4,181 | ) | — | (4,181 | ) | ||||||||||||||
Amortization of Aimco share-based compensation | — | 7,096 | — | 7,096 | — | 7,096 | |||||||||||||||||
Effect of changes in ownership for consolidated entities | — | (6,008 | ) | 10,739 | 4,731 | (6,550 | ) | (1,819 | ) | ||||||||||||||
Change in accumulated other comprehensive income | — | 416 | 21 | 437 | 156 | 593 | |||||||||||||||||
Other, net | — | 352 | — | 352 | — | 352 | |||||||||||||||||
Net income | — | 248,710 | 11,554 | 260,264 | 4,776 | 265,040 | |||||||||||||||||
Distributions to noncontrolling interests | — | — | — | — | (80,313 | ) | (80,313 | ) | |||||||||||||||
Distributions to common unitholders | — | (184,391 | ) | (9,058 | ) | (193,449 | ) | — | (193,449 | ) | |||||||||||||
Distributions to preferred unitholders | — | (11,099 | ) | — | (11,099 | ) | — | (11,099 | ) | ||||||||||||||
Balances at December 31, 2015 | 159,126 | 1,463,265 | (9,851 | ) | 1,612,540 | 151,365 | 1,763,905 | ||||||||||||||||
Redemption of preferred units held by Aimco | (34,126 | ) | (673 | ) | — | (34,799 | ) | — | (34,799 | ) | |||||||||||||
Redemption of partnership units held by non-Aimco partners | — | — | (10,819 | ) | (10,819 | ) | — | (10,819 | ) | ||||||||||||||
Amortization of Aimco share-based compensation | — | 8,610 | — | 8,610 | — | 8,610 | |||||||||||||||||
Effect of changes in ownership for consolidated entities | — | (26,171 | ) | 10,107 | (16,064 | ) | — | (16,064 | ) | ||||||||||||||
Change in accumulated other comprehensive income | — | 7,051 | 351 | 7,402 | 260 | 7,662 | |||||||||||||||||
Other, net | — | 3,323 | — | 3,323 | — | 3,323 | |||||||||||||||||
Net income | — | 430,410 | 20,368 | 450,778 | 25,256 | 476,034 | |||||||||||||||||
Distributions to noncontrolling interests | — | — | — | — | (25,760 | ) | (25,760 | ) | |||||||||||||||
Distributions to common unitholders | — | (206,898 | ) | (10,214 | ) | (217,112 | ) | — | (217,112 | ) | |||||||||||||
Distributions to preferred unitholders | — | (10,014 | ) | — | (10,014 | ) | — | (10,014 | ) | ||||||||||||||
Balances at December 31, 2016 | 125,000 | 1,668,903 | (58 | ) | 1,793,845 | 151,121 | 1,944,966 | ||||||||||||||||
Redemption of partnership units held by non-Aimco partners | — | — | (11,882 | ) | (11,882 | ) | — | (11,882 | ) | ||||||||||||||
Amortization of Aimco share-based compensation | — | 8,638 | 613 | 9,251 | — | 9,251 | |||||||||||||||||
Contributions from noncontrolling interests | — | — | — | — | 3,401 | 3,401 | |||||||||||||||||
Effect of changes in ownership for consolidated entities | — | (160,586 | ) | 4,867 | (155,719 | ) | (157,056 | ) | (312,775 | ) | |||||||||||||
Cumulative effect of a change in accounting principle | — | (62,682 | ) | (3,028 | ) | (65,710 | ) | — | (65,710 | ) | |||||||||||||
Change in accumulated other comprehensive income | — | 2,592 | 121 | 2,713 | 101 | 2,814 | |||||||||||||||||
Other, net | — | 271 | — | 271 | — | 271 | |||||||||||||||||
Net income | — | 315,774 | 14,457 | 330,231 | 9,084 | 339,315 | |||||||||||||||||
Distributions to noncontrolling interests | — | — | — | — | (8,367 | ) | (8,367 | ) | |||||||||||||||
Distributions to common unitholders | — | (226,172 | ) | (10,765 | ) | (236,937 | ) | — | (236,937 | ) | |||||||||||||
Distributions to preferred unitholders | — | (8,594 | ) | — | (8,594 | ) | — | (8,594 | ) | ||||||||||||||
Balances at December 31, 2017 | $ | 125,000 | $ | 1,538,144 | $ | (5,675 | ) | $ | 1,657,469 | $ | (1,716 | ) | $ | 1,655,753 | |||||||||
See notes to the consolidated financial statements.
F-13
AIMCO PROPERTIES, L.P.
CONSOLIDATED STATEMENTS OF CASH FLOWS
For the Years Ended December 31, 2017, 2016 and 2015
(In thousands)
2017 | 2016 | 2015 | |||||||||
CASH FLOWS FROM OPERATING ACTIVITIES: | |||||||||||
Net income | $ | 347,079 | $ | 483,273 | $ | 271,983 | |||||
Adjustments to reconcile net income to net cash provided by operating activities: | |||||||||||
Depreciation and amortization | 366,184 | 333,066 | 306,301 | ||||||||
Gain on dispositions of real estate, net of tax | (299,559 | ) | (393,790 | ) | (180,593 | ) | |||||
Provision for real estate impairment loss | 35,881 | — | — | ||||||||
Income tax benefit | (32,126 | ) | (25,208 | ) | (27,524 | ) | |||||
Share-based compensation expense | 7,877 | 7,629 | 6,640 | ||||||||
Amortization of debt issue costs and other | 5,666 | 5,060 | 5,186 | ||||||||
Other, net | (7,694 | ) | (6,071 | ) | (387 | ) | |||||
Changes in operating assets and operating liabilities: | |||||||||||
Accounts receivable and other assets | (13,375 | ) | (20,680 | ) | 619 | ||||||
Accounts payable, accrued liabilities and other | (15,794 | ) | (5,555 | ) | (22,334 | ) | |||||
Total adjustments | 47,060 | (105,549 | ) | 87,908 | |||||||
Net cash provided by operating activities | 394,139 | 377,724 | 359,891 | ||||||||
CASH FLOWS FROM INVESTING ACTIVITIES: | |||||||||||
Purchases of real estate and deposits related to purchases of real estate | (20,372 | ) | (290,729 | ) | (169,447 | ) | |||||
Capital expenditures | (358,104 | ) | (346,645 | ) | (367,180 | ) | |||||
Proceeds from dispositions of real estate | 402,162 | 535,513 | 367,571 | ||||||||
Purchases of corporate assets | (8,899 | ) | (7,540 | ) | (6,665 | ) | |||||
Changes in restricted cash | 1,506 | 1,374 | (429 | ) | |||||||
Other investing activities | (1,589 | ) | 10,254 | 5,253 | |||||||
Net cash provided by (used in) investing activities | 14,704 | (97,773 | ) | (170,897 | ) | ||||||
CASH FLOWS FROM FINANCING ACTIVITIES: | |||||||||||
Proceeds from non-recourse property debt | 312,434 | 417,714 | 352,602 | ||||||||
Principal repayments on non-recourse property debt | (409,167 | ) | (371,947 | ) | (514,294 | ) | |||||
Proceeds from term loan | 250,000 | — | — | ||||||||
Net borrowings (repayments) on revolving credit facility | 49,230 | (9,070 | ) | (85,330 | ) | ||||||
Proceeds from issuance of common partnership units to Aimco | — | — | 366,580 | ||||||||
Redemption of preferred units from Aimco | — | (34,799 | ) | (27,000 | ) | ||||||
Payment of distributions to preferred units | (16,358 | ) | (17,253 | ) | (18,042 | ) | |||||
Payment of distributions to General Partner and Special Limited Partner | (225,377 | ) | (206,279 | ) | (184,082 | ) | |||||
Payment of distributions to Limited Partners | (10,667 | ) | (10,214 | ) | (6,701 | ) | |||||
Payment of distributions to noncontrolling interests | (8,367 | ) | (18,253 | ) | (43,757 | ) | |||||
Purchases of noncontrolling interests in consolidated real estate partnerships | (314,269 | ) | (13,941 | ) | (320 | ) | |||||
Other financing activities | (20,760 | ) | (5,454 | ) | (6,832 | ) | |||||
Net cash used in financing activities | (393,301 | ) | (269,496 | ) | (167,176 | ) | |||||
NET INCREASE IN CASH AND CASH EQUIVALENTS | 15,542 | 10,455 | 21,818 | ||||||||
CASH AND CASH EQUIVALENTS AT BEGINNING OF PERIOD | 61,244 | 50,789 | 28,971 | ||||||||
CASH AND CASH EQUIVALENTS AT END OF PERIOD | $ | 76,786 | $ | 61,244 | $ | 50,789 | |||||
See notes to the consolidated financial statements.
F-14
AIMCO PROPERTIES, L.P.
CONSOLIDATED STATEMENTS OF CASH FLOWS
For the Years Ended December 31, 2017, 2016 and 2015
(In thousands)
2017 | 2016 | 2015 | |||||||||
SUPPLEMENTAL CASH FLOW INFORMATION: | |||||||||||
Interest paid | $ | 196,438 | $ | 200,278 | $ | 207,087 | |||||
Cash paid for income taxes | 7,401 | 2,152 | 2,033 | ||||||||
Non-cash transactions associated with the acquisition or disposition of real estate: | |||||||||||
Non-recourse property debt assumed by buyer in connection with the disposition of real estate | — | — | 6,068 | ||||||||
Issuance of preferred OP Units in connection with acquisition of real estate | — | 17,000 | — | ||||||||
Other non-cash investing and financing transactions: | |||||||||||
Accrued capital expenditures (at end of period) | 31,719 | 35,594 | 43,725 | ||||||||
Accrued dividends on TSR restricted stock and LTIP awards (at end of period) (Note 8) | 1,818 | 927 | 309 | ||||||||
See notes to the consolidated financial statements.
F-15
APARTMENT INVESTMENT AND MANAGEMENT COMPANY
AIMCO PROPERTIES, L.P.
NOTES TO THE CONSOLIDATED FINANCIAL STATEMENTS
December 31, 2017
Note 1 — Organization
Apartment Investment and Management Company, or Aimco, is a Maryland corporation incorporated on January 10, 1994. Aimco is a self-administered and self-managed real estate investment trust, or REIT. AIMCO Properties, L.P., or the Aimco Operating Partnership, is a Delaware limited partnership formed on May 16, 1994, to conduct our business, which is focused on the ownership, management, redevelopment and limited development of quality apartment communities located in some of the largest markets in the United States.
Aimco, through its wholly-owned subsidiaries, AIMCO-GP, Inc. and AIMCO-LP Trust, owns a majority of the ownership interests in the Aimco Operating Partnership. Aimco conducts all of its business and owns all of its assets through the Aimco Operating Partnership. Interests in the Aimco Operating Partnership that are held by limited partners other than Aimco are referred to as OP Units. OP Units include common partnership units, which we refer to as common OP Units, as well as partnership preferred units, which we refer to as preferred OP Units. As of December 31, 2017, after eliminations for units held by consolidated subsidiaries, the Aimco Operating Partnership had 164,617,537 common partnership units outstanding. As of December 31, 2017, Aimco owned 157,189,447 of the common partnership units (95.5% of the common partnership units) of the Aimco Operating Partnership and Aimco had outstanding an equal number of shares of its Class A Common Stock, which we refer to as Common Stock.
Except as the context otherwise requires, “we,” “our” and “us” refer to Aimco, the Aimco Operating Partnership and their consolidated subsidiaries, collectively.
As of December 31, 2017, we owned an equity interest in 136 apartment communities with 36,904 apartment homes in our Real Estate portfolio. Our Real Estate portfolio, which comprises our reportable segment, is diversified by both price point and geography and consists of market rate apartment communities in which we own a substantial interest. We consolidated 132 of these apartment communities with 36,762 apartment homes.
As of December 31, 2017, we also held nominal ownership positions in partnerships that own 46 low-income housing tax credit apartment communities with 6,898 apartment homes. We provide services to these partnerships and receive fees and other payments in return. Our relationship with these partnerships is different than real estate ownership and is better described as an asset management business, or Asset Management. In accordance with accounting principles generally accepted in the United States of America, or GAAP, we are required to consolidate partnerships owning an aggregate of 39 apartment communities with 6,211 apartment homes.
Note 2 — Basis of Presentation and Summary of Significant Accounting Policies
Principles of Consolidation
Aimco’s accompanying consolidated financial statements include the accounts of Aimco, the Aimco Operating Partnership, and their consolidated subsidiaries. The Aimco Operating Partnership’s consolidated financial statements include the accounts of the Aimco Operating Partnership and its consolidated subsidiaries. All significant intercompany balances have been eliminated in consolidation.
Interests in the Aimco Operating Partnership that are held by limited partners other than Aimco are reflected in Aimco’s accompanying balance sheets as noncontrolling interests in Aimco Operating Partnership. Interests in partnerships consolidated into the Aimco Operating Partnership that are held by third parties are reflected in our accompanying balance sheets as noncontrolling interests in consolidated real estate partnerships. The assets of real estate partnerships consolidated by the Aimco Operating Partnership must first be used to settle the liabilities of such consolidated real estate partnerships. These consolidated real estate partnerships’ creditors do not have recourse to the general credit of the Aimco Operating Partnership.
As used herein, and except where the context otherwise requires, “partnership” refers to a limited partnership or a limited liability company and “partner” refers to a partner in a limited partnership or a member of a limited liability company.
Acquisition of Real Estate and Related Depreciation and Amortization
We generally recognize the acquisition of apartment communities or interests in partnerships that own apartment communities at cost. The related transaction costs are generally included in the cost of the acquired apartment community.
F-16
We allocate the cost of apartment communities acquired based on the relative fair value of the assets acquired and liabilities assumed. We determine the fair value of tangible assets, such as land, buildings, furniture, fixtures and equipment, generally using valuation techniques that consider comparable market transactions, replacement costs and other available information. We determine the fair value of identified intangible assets (or liabilities), which typically relate to in-place leases, using valuation techniques that consider the terms of the in-place leases, current market data for comparable leases and our experience in leasing similar communities. The intangible assets or liabilities related to in-place leases are comprised of: (a) the value of the above- and below-market leases in-place, measured over the period, including probable lease renewals for below-market leases, that the leases are expected to remain in effect; (b) the estimated unamortized portion of avoided leasing commissions and other costs that ordinarily would be incurred to originate the in-place leases; and (c) the value associated with leased apartment homes during an estimated absorption period (estimates of rental revenue that would not have been earned had leased apartment homes been vacant at the time of acquisition assuming lease-up periods based on market demand and stabilized occupancy levels).
Depreciation for all tangible assets is calculated using the straight-line method over their estimated useful lives. Acquired buildings and improvements are depreciated over a useful life based on the age, condition and other physical characteristics of the apartment community. At December 31, 2017, the weighted average depreciable life of our buildings and improvements was approximately 28 years. Furniture, fixtures and equipment associated with apartment communities are depreciated over five years.
The above- and below-market lease intangibles are amortized to rental revenue over the expected remaining terms of the associated leases, which include reasonably assured renewal periods. Other intangible assets related to in-place leases are amortized to depreciation and amortization over the expected remaining terms of the associated leases.
At December 31, 2017 and 2016, deferred income in our consolidated balance sheets included below-market lease amounts totaling $9.1 million and $10.4 million, respectively, which are net of accumulated amortization of $34.4 million and $33.1 million, respectively. During the years ended December 31, 2017, 2016 and 2015, we included amortization of below-market leases of $1.3 million, $1.7 million and $1.7 million, respectively, in rental and other property revenues in our consolidated statements of operations.
At December 31, 2017, our below-market leases had a weighted average amortization period of 6.2 years and estimated aggregate amortization for each of the five succeeding years as follows (in thousands):
Estimated Amortization | ||||
2018 | $1,128 | |||
2019 | 998 | |||
2020 | 886 | |||
2021 | 811 | |||
2022 | 763 | |||
Capital Additions and Related Depreciation
We capitalize costs, including certain indirect costs, incurred in connection with our capital additions activities, including redevelopments, developments, other tangible apartment community improvements and replacements of existing apartment community components. Included in these capitalized costs are payroll costs associated with time spent by site employees in connection with capital additions activities at the apartment community level. We characterize as “indirect costs” an allocation of certain department costs, including payroll, at the area operations and corporate levels that clearly relate to capital additions activities. We also capitalize interest, property taxes and insurance during periods in which redevelopments, developments and construction projects are in progress. We begin capitalization of costs, including certain indirect costs, incurred in connection with our capital addition activities, upon commencement of activities necessary to get apartment communities ready for their intended use. These activities include when apartment communities or apartment homes are undergoing physical construction, as well as when apartment homes are held vacant in advance of planned construction, provided that other activities such as permitting, planning and design are in progress. We cease the capitalization of costs when the apartment communities are substantially complete and ready for their intended use, which is typically when construction has been completed and apartment homes are available for occupancy. Costs, including ordinary repairs, maintenance and resident turnover costs, are charged to property operating expense as incurred.
We depreciate capitalized costs using the straight-line method over the estimated useful life of the related improvement, which is generally 5, 15 or 30 years. All capitalized site payroll costs and indirect costs are allocated to capital additions proportionately, based on direct costs and depreciated over the estimated useful lives of such capital additions.
F-17
Certain homogeneous items that are purchased in bulk on a recurring basis, such as carpeting and appliances, are depreciated using group methods that reflect the average estimated useful life of the items in each group. Except in the case of apartment community casualties, where the net book value of the lost asset is written off in the determination of casualty gains or losses, we generally do not recognize any loss in connection with the replacement of an existing apartment community component because normal replacements are considered in determining the estimated useful lives used in connection with our composite and group depreciation methods.
For the years ended December 31, 2017, 2016 and 2015, we capitalized to buildings and improvements $7.6 million, $9.6 million and $11.7 million of interest costs, respectively, and $36.0 million, $32.9 million and $28.2 million of other direct and indirect costs, respectively.
Impairment of Long-Lived Assets
Real estate and other long-lived assets to be held and used are stated at cost, less accumulated depreciation and amortization, unless the carrying amount of the asset is not recoverable. If events or circumstances indicate that the carrying amount of an apartment community may not be recoverable, we make an assessment of its recoverability by comparing the carrying amount to our estimate of the undiscounted future cash flows, excluding interest charges, of the apartment community. If the carrying amount exceeds the aggregate undiscounted future cash flows, we recognize an impairment loss to the extent the carrying amount exceeds the estimated fair value of the apartment community.
Cash Equivalents
We classify highly liquid investments with an original maturity of three months or less as cash equivalents. We maintain cash equivalents in financial institutions in excess of insured limits. We have not experienced any losses in these accounts in the past and believe that we are not exposed to significant credit risk because our accounts are deposited with major financial institutions.
Restricted Cash
Restricted cash includes capital replacement reserves, completion repair reserves, bond sinking fund amounts, tax and insurance escrow accounts held by lenders and resident security deposits.
Other Assets
At December 31, 2017 and 2016, other assets was comprised of the following amounts (dollars in thousands):
2017 | 2016 | ||||||
Investments in securitization trust that holds Aimco property debt | $ | 82,794 | $ | 76,063 | |||
Accumulated unrecognized deferred tax expense from intercompany transfers | — | 62,468 | |||||
Deferred tax asset, net (Note 9) | 32,227 | 5,076 | |||||
Intangible assets, net | 38,701 | 39,039 | |||||
Prepaid expenses, commissions, real estate taxes and insurance | 36,508 | 37,082 | |||||
Software, equipment and leasehold improvements | 20,048 | 22,209 | |||||
Investments in unconsolidated real estate partnerships | 12,636 | 12,496 | |||||
Accounts receivable, net | 11,417 | 13,042 | |||||
Deferred expenses, deposits, notes receivable and other | 38,408 | 26,293 | |||||
Other assets per consolidated balance sheets | $ | 272,739 | $ | 293,768 | |||
As discussed under the Accounting Pronouncements Adopted in the Current Year heading, on January 1, 2017, we recognized a cumulative effect adjustment to retained earnings and partners’ capital, which reduced to zero the accumulated unrecognized deferred tax expense from intercompany transfers.
The table above excludes other assets of partnerships served by our Asset Management business, which are presented separately on our consolidated balance sheet.
Investments in Securitization Trust that holds Aimco Property Debt
We hold investments in a securitization trust that primarily holds certain of our property debt. These investments were initially recognized at their purchase price and the discount to the face value is being accreted into interest income over the expected term of the securities. We have designated these investments as available for sale securities and we measure these investments at fair
F-18
value with changes in their fair value, other than the changes attributed to the accretion described above, recognized as an adjustment of accumulated other comprehensive income or loss within equity and partners’ capital. Refer to Note 11 for further information regarding these debt securities.
Intangible Assets
At December 31, 2017 and 2016, other assets included goodwill associated with our reportable segment of $37.8 million. We perform an annual impairment test of goodwill by evaluating qualitative factors to determine the likelihood that goodwill may be impaired. We primarily consider the fair value of our real estate portfolio and the fair value of our debt relative to their carrying values. As a result of the qualitative analysis, we do not believe our goodwill is impaired as of the date of our annual test.
During the years ended December 31, 2016 and 2015, we allocated $4.5 million and $1.2 million, respectively, of goodwill related to our reportable segments to the carrying amounts of the apartment communities sold or classified as held for sale. The amounts of goodwill allocated to these apartment communities were based on the relative fair values of the apartment communities sold or classified as held for sale. As further discussed under the Accounting Pronouncements Adopted in the Current Year heading, commencing in 2017 we no longer allocate goodwill to the carrying amounts of apartment communities sold or classified as held for sale that do not meet the definition of a business.
Capitalized Software Costs
Purchased software and other costs related to software purchased or developed for internal use are capitalized during the application development stage and are amortized using the straight-line method over the estimated useful life of the software, generally three to five years. For the years ended December 31, 2017, 2016 and 2015, we capitalized software purchase and development costs totaling $2.0 million, $3.4 million and $3.6 million, respectively. At December 31, 2017 and 2016, other assets included $9.1 million and $12.6 million of net capitalized software, respectively. During the years ended December 31, 2017, 2016 and 2015, we recognized amortization of capitalized software of $5.5 million, $7.2 million and $6.9 million, respectively, which is included in depreciation and amortization in our consolidated statements of operations.
Investments in Unconsolidated Real Estate Partnerships
We own general and limited partner interests in partnerships that either directly, or through interests in other real estate partnerships, own apartment communities. We generally account for investments in real estate partnerships that we do not consolidate under the equity method. Under the equity method, we recognize our share of the earnings or losses of the entity for the periods presented, inclusive of our share of any impairments and disposition gains recognized by and related to such entities, and we present such amounts within other, net in our consolidated statements of operations.
The excess of the cost of the acquired partnership interests over the historical carrying amount of partners’ equity or deficit is generally ascribed to the fair values of land and buildings owned by the partnerships. We amortize the excess cost related to the buildings over the related estimated useful lives. Such amortization is recorded as an adjustment of the amounts of earnings or losses we recognize from such unconsolidated real estate partnerships.
Deferred Costs
We defer lender fees and other direct costs incurred in obtaining new financing and amortize the amounts over the terms of the related loan agreements. Amortization of these costs is included in interest expense. Debt issue costs associated with our revolving credit facility are included in other assets on our consolidated balance sheets. Debt issue costs associated with non-recourse property debt and our term loan are presented as a direct deduction from the related liabilities on our consolidated balance sheets.
We defer leasing commissions and other direct costs incurred in connection with successful leasing efforts and amortize the costs over the terms of the related leases. Amortization of these costs is included in depreciation and amortization.
Noncontrolling Interests in Consolidated Real Estate Partnerships
We report the unaffiliated partners’ interests in the net assets of our consolidated real estate partnerships as noncontrolling interests in consolidated real estate partnerships within consolidated equity and partners’ capital. Noncontrolling interests in consolidated real estate partnerships consist primarily of equity interests held by limited partners in consolidated real estate partnerships that have finite lives. We generally attribute to noncontrolling interests their share of income or loss of consolidated partnerships based on their proportionate interest in the results of operations of the partnerships, including their share of losses even if such attribution results in a deficit noncontrolling interest balance within our equity and partners’ capital accounts.
F-19
The terms of the related partnership agreements generally require the partnerships to be liquidated following the sale of the underlying real estate. As the general partner in these partnerships, we ordinarily control the execution of real estate sales and other events that could lead to the liquidation, redemption or other settlement of noncontrolling interests.
Changes in our ownership interest in consolidated real estate partnerships generally consist of our purchase of an additional interest in or the sale of our entire interest in a consolidated real estate partnership. The effect on our equity and partners’ capital of our purchase of additional interests in consolidated real estate partnerships during the years ended December 31, 2017, 2016 and 2015, is shown in our consolidated statements of equity and partners’ capital. The effect on our equity and partners’ capital of sales of consolidated real estate or sales of our entire interest in consolidated real estate partnerships is reflected in our consolidated financial statements as gains on disposition of real estate and accordingly the effect on our equity and partners’ capital is reflected within the amount of net income allocated to us and to noncontrolling interests. Upon our deconsolidation of a real estate partnership following the sale of our partnership interests or liquidation of the partnership following sale of the related apartment community, we derecognize any remaining noncontrolling interest of the associated partnership previously recorded in our consolidated balance sheets.
Noncontrolling Interests in Aimco Operating Partnership
Noncontrolling interests in Aimco Operating Partnership consist of common OP Units and preferred OP Units. Holders of preferred OP Units participate in the Aimco Operating Partnership’s income or loss only to the extent of their preferred distributions. Within Aimco’s consolidated financial statements, after provision for Preferred OP Unit distributions, the Aimco Operating Partnership’s income or loss is allocated to the holders of common partnership units based on the weighted average number of common partnership units (including those held by Aimco) outstanding during the period. During the years ended December 31, 2017, 2016 and 2015, the holders of common OP Units had a weighted average ownership interest in the Aimco Operating Partnership of 4.5%, 4.7% and 4.7%, respectively. See Note 7 for further information regarding the items comprising noncontrolling interests in the Aimco Operating Partnership.
Revenue Recognition
Our apartment communities have operating leases with apartment residents with terms averaging 12 months. We recognize rental revenue related to these leases, net of any concessions, on a straight-line basis over the term of the lease. We recognize revenues from asset management and other services when the related fees are earned and realized or realizable.
Asset Management Business
We are the general partner in certain low-income housing tax credit partnerships, which are structured to provide for the pass-through of tax credits and deductions to their partners. The tax credits are generally realized ratably over the first ten years of the tax credit arrangement and are subject to the partnership’s compliance with applicable laws and regulations for a period of 15 years. We hold nominal ownership positions in these partnerships, generally less than one percent. At inception, each investor agreed to fund capital contributions to the partnerships and we received a syndication fee from the partnerships upon the investors’ admission to the partnership. In our role, we provide asset management and other services to these partnerships and we receive fees and other payments in return. To the extent amounts due to us are not paid currently, the balances accrue and are satisfied from the partnerships’ future operating or liquidating cash flow.
Capital contributions received by the partnerships from tax credit investors represent, in substance, consideration that we receive in exchange for our obligation to deliver tax credits and other tax benefits to the investors. We record these contributions as deferred income in our consolidated balance sheets upon receipt, and we recognize these amounts as revenue in our consolidated statements of operations when our obligation to the investors is relieved upon delivery of the tax benefits.
We consolidate the low-income housing tax credit partnerships in which we are the sole general partner, as further discussed in Note 13. When the contractual arrangements obligate us to deliver tax benefits to the investors, and entitle us through fee arrangements to receive substantially all available cash flow from the partnerships, we recognize the income or loss generated by the underlying real estate based on our economic interest in the partnerships’ current period results, which is approximately 100% and represents the allocation of cash available for distribution we would receive from a hypothetical liquidation at the book value of the partnership’s net assets. Our economic interest in these partnerships will be 100% until the limited partners become entitled to an allocation of distributable cash (generally upon sale of the underlying real estate). Our economic interest generally differs from our legal interest.
Insurance
We believe our insurance coverages insure our apartment communities adequately against the risk of loss attributable to fire, earthquake, hurricane, tornado, flood and other perils. In addition, we have third-party insurance coverage (after self-insured
F-20
retentions) that defray the costs of large workers’ compensation, health and general liability exposures. We accrue losses based upon our estimates of the aggregate liability for uninsured losses incurred using certain actuarial assumptions followed in the insurance industry and based on our experience.
Share-Based Compensation
We issue various forms of share-based compensation, including stock options and restricted stock awards with service conditions and/or market conditions. We recognize share-based employee compensation based on the fair value on the grant date and recognize compensation cost over the awards’ requisite service periods. We reduce compensation cost related to forfeited awards in the period of forfeiture. See Note 8 for further discussion of our share-based compensation.
Income Taxes
Aimco has elected to be taxed as a REIT under the Internal Revenue Code commencing with its taxable year ended December 31, 1994, and it intends to continue to operate in such a manner. Aimco’s current and continuing qualification as a REIT depends on its ability to meet the various requirements imposed by the Internal Revenue Code, which are related to organizational structure, distribution levels, diversity of stock ownership and certain restrictions with regard to owned assets and categories of income. If Aimco qualifies for taxation as a REIT, it will generally not be subject to United States federal corporate income tax on its taxable income that is currently distributed to stockholders. This treatment substantially eliminates the “double taxation” (at the corporate and stockholder levels) that generally results from an investment in a corporation.
Even if Aimco qualifies as a REIT, it may be subject to United States federal income and excise taxes in various situations, such as on our undistributed income. Aimco also will be required to pay a 100% tax on any net income on non-arm’s length transactions between it and a TRS (described below) and on any net income from sales of apartment communities that were held for sale in the ordinary course. The state and local tax laws may not conform to the United States federal income tax treatment, and Aimco may be subject to state or local taxation in various state or local jurisdictions, including those in which we transact business. Any taxes imposed on us reduce our operating cash flow and net income.
Certain of our operations or a portion thereof, including property management and risk management, are conducted through taxable REIT subsidiaries, which are subsidiaries of the Aimco Operating Partnership, and each of which we refer to as a TRS. A TRS is a subsidiary C-corporation that has not elected REIT status and as such is subject to United States federal corporate income tax. We use TRS entities to facilitate our ability to offer certain services and activities to our residents and investment partners that cannot be offered directly by a REIT. We also use TRS entities to hold investments in certain apartment communities.
For our TRS entities, deferred income taxes result from temporary differences between the carrying amounts of assets and liabilities for financial reporting purposes and the amounts used for United States federal income tax purposes, and are measured using the enacted tax rates and laws that are expected to be in effect when the differences reverse. We reduce deferred tax assets by recording a valuation allowance when we determine, based on available evidence, that it is more likely than not that the assets will not be realized. As further discussed under the Accounting Pronouncements Adopted in the Current Year heading within this note, commencing in 2017, we recognize the tax consequences associated with intercompany transfers between the Aimco Operating Partnership and TRS entities when such transactions occur. Refer to Note 9 for further information about our income taxes.
Comprehensive Income or Loss
As discussed under the preceding Investments in Securitization Trust that holds Aimco Property Debt heading, we have investments that are measured at fair value with unrealized gains or losses recognized as an adjustment of accumulated other comprehensive loss within equity and partners’ capital. Additionally, as discussed in Note 11, we recognize changes in the fair value of our cash flow hedges as an adjustment of accumulated other comprehensive loss within equity and partners’ capital. The amounts of consolidated comprehensive income for the years ended December 31, 2017, 2016 and 2015, along with the corresponding amounts of such comprehensive income attributable to Aimco, the Aimco Operating Partnership and to noncontrolling interests, are presented within the accompanying consolidated statements of comprehensive income.
Earnings per Share and Unit
Aimco and the Aimco Operating Partnership calculate earnings (loss) per share and unit based on the weighted average number of shares of Common Stock or common partnership units, participating securities, common stock or common unit equivalents and dilutive convertible securities outstanding during the period. The Aimco Operating Partnership considers both common partnership units and equivalents, which have identical rights to distributions and undistributed earnings, to be common units for purposes of the earnings per unit computations. See Note 10 for further information regarding earnings per share and unit computations.
F-21
Use of Estimates
The preparation of our consolidated financial statements in conformity with GAAP requires management to make estimates and assumptions that affect the reported amounts included in the financial statements and accompanying notes thereto. Actual results could differ from those estimates.
Reclassifications
Certain items included in the 2016 and 2015 financial statements have been reclassified to conform to the current presentation.
Accounting Pronouncements Adopted in the Current Year
During 2017, we elected to adopt early the new accounting standard that revised the GAAP definition of a business. Under the new standard we expect apartment communities will no longer be considered businesses; therefore, transaction costs incurred related to the acquisition of real estate operations will be capitalized as a cost of the acquisition. Additionally, we will no longer allocate goodwill to sales of apartment communities for purposes of calculating gain or loss upon sale. We have applied the new standard prospectively to transactions occurring after adoption, which did not have a significant effect on our financial condition or results of operations.
Effective January 1, 2017, we adopted a new standard issued by the Financial Accounting Standards Board, or FASB, that simplifies the accounting for the income tax consequences of intercompany transfers of assets. Previously, the recognition within the statement of operations of income tax expense or benefit resulting from an intercompany transfer of assets did not occur until the assets affect GAAP income or loss, for example, through depreciation, impairment or upon the sale of the asset to a third-party. Under the new standard, we are required to recognize the income tax expense or benefit from an intercompany transfer of assets when the transfer occurs. We have applied this change on a modified retrospective basis and recognized a cumulative effect adjustment to retained earnings and partners’ capital of $65.7 million as of January 1, 2017, representing accumulated unrecognized tax expense from intercompany transfers between the Aimco Operating Partnership and TRS entities. Such amounts were included in other assets within our consolidated balance sheets at December 31, 2016.
Also effective January 1, 2017, we adopted guidance that simplifies the accounting for share-based compensation. Under prior practice, tax benefits in excess of those associated with compensation cost recognized in accordance with GAAP, or windfalls, were recorded in equity and tax deficiencies were recorded in equity until previous windfalls had been recovered and then recognized in earnings. Under the new guidance, all of the tax effects related to share-based compensation are recognized through earnings. This guidance is applied to all windfalls and tax deficiencies resulting from settlements occurring after January 1, 2017. The new guidance also requires windfalls to be recorded in the period the related transaction triggering tax consequences occurs, such as an exercise of stock options or vesting of restricted shares. This change in timing of recognition has been applied on a modified retrospective basis. We did not record a cumulative effect adjustment to opening retained earnings on the date of adoption as there were no accumulated windfalls recorded in equity. Compared to prior periods, we may experience incremental volatility in income tax benefit or expense resulting from the recognition in earnings of windfall benefits or deficiencies upon the exercise of stock options and vesting of restricted shares.
Recent Accounting Pronouncements
The FASB has issued new standards that affect accounting for revenue from contracts with customers and are effective for us on January 1, 2018. The new revenue standards establish a single comprehensive model for entities to use in accounting for revenue arising from contracts with customers and supersede most current GAAP applicable to revenue recognition. The core principle of the new guidance is that revenue should only be recognized when an entity has transferred control of goods or services to a customer and for an amount reflecting the consideration to which the entity expects to be entitled for such exchange. We have completed our analysis of the effect this guidance will have on our consolidated financial statements and have determined we will not recognize a cumulative effect adjustment upon adoption. We do not anticipate changes to the timing or amount of revenue we recognize on an ongoing basis as substantially all of our revenue is earned from leases and is subject to the current lease standard until the adoption of the new lease standard, which is discussed below.
The FASB has also issued a new standard on lease accounting, which is effective for us on January 1, 2019. Under the new lease standard, lessor accounting will be largely unchanged, but lessees will be required to recognize a right of use asset and a lease liability for virtually all leases, with such leases classified as either operating or finance. The new standard must be adopted using a modified retrospective method, which requires application of the new guidance at the beginning of the earliest comparative period presented and provides for certain practical expedients, which we anticipate electing. We do not anticipate significant changes in the timing of income from our leases with residents. However, in circumstances where we are a lessee, in primarily a limited population of ground leases and leases for corporate office space, we will be required to recognize right of use assets and related lease liabilities on our consolidated balance sheets. We do not anticipate the adoption of this standard will have a material
F-22
effect on our financial condition or results of operations. We are in the process of determining the amount of the right of use assets and related lease liabilities that will be recognized upon adoption.
During 2016, the FASB also issued an Accounting Standards Update that is intended to reduce diversity in the classification and presentation of changes in restricted cash in the statement of cash flows and is effective for us on January 1, 2018. The new standard requires that the statement of cash flows describe the changes in the combined balances of cash and cash equivalents and restricted cash during the period. The guidance is required to be applied retrospectively to each period presented in the financial statements. We currently present transfers between restricted and unrestricted cash accounts as operating, investing and financing activities depending upon the required or intended purpose for the restricted funds, and cash receipts and payments directly with third parties to or from restricted cash accounts are presented on the statement of cash flows as a net change in restricted cash and classified similarly to transfers between restricted and unrestricted cash. We expect that the primary change to our statement of cash flows will be the presentation of activity in the restricted cash accounts combined with similar activity in unrestricted accounts.
Note 3 — Significant Transactions
Reacquisition of Limited Partner Interest in Palazzo Joint Venture
During the year ended December 31, 2017, we reacquired for $451.5 million, the 47% noncontrolling limited partner interest in the Palazzo joint venture, which owns three communities with a total of 1,382 apartment homes located in Los Angeles, California. We assumed $140.5 million of the noncontrolling interest partner’s share of existing non-recourse property-level debt and paid $311.0 million in cash consideration, which was funded by short term borrowings. We now own all of the interests in the Palazzo joint venture and its underlying apartment communities. Prior to the transaction, we consolidated into our financial statements the joint venture and underlying apartment communities, therefore this transaction has been accounted for as an equity transaction. In accordance with GAAP, we recognized the $155.6 million of consideration paid in excess of the noncontrolling interest balance as a reduction of additional paid-in capital within Aimco’s equity and the Aimco Operating Partnership’s partners’ capital.
Acquisitions of Apartment Communities
During the year ended December 31, 2016, we purchased a 463-apartment community in Redwood City, California that was in the final stages of construction at the time of acquisition. At closing, we paid $303.0 million in cash and issued $17.0 million of 6.0% Class Ten preferred OP Units to the seller. The purchase price, plus $1.8 million of capitalized transaction costs, was allocated as follows: $26.9 million to land; $292.7 million to buildings and improvements (including construction in progress); and $2.2 million to furniture and fixtures.
In February 2018, we purchased a 748-apartment home community in Fairfax County, Virginia for $160.0 million. Based on the timing of this acquisition, we have not completed our purchase price allocation.
Dispositions of Apartment Communities and Assets Held for Sale
Summarized information regarding apartment communities sold during the years ended December 31, 2017, 2016 and 2015 is set forth in the table below (dollars in thousands):
2017 | 2016 | 2015 | ||||||
Real Estate portfolio: | ||||||||
Apartment communities sold | 5 | 7 | 11 | |||||
Apartment homes sold | 2,291 | 3,045 | 3,855 | |||||
Gain on disposition, net of tax | 297,944 | 377,280 | 180,593 | |||||
Consolidated partnerships served by the Asset Management business: | ||||||||
Apartment communities sold | 2 | 1 | — | |||||
Apartment homes sold | 252 | 296 | — | |||||
Gain on disposition, net of tax | 1,615 | 16,510 | — | |||||
The apartment communities sold from our Real Estate portfolio during 2017, 2016 and 2015 were predominantly located outside of our primary markets or in lower-rated locations within our primary markets and had average revenues per apartment home significantly below those of our retained portfolio.
In January 2018, we agreed to sell our interests in the entities owning the La Jolla Cove property in settlement of legal actions filed in 2014 by a group of disappointed buyers who had hoped to acquire the property. As a result of the settlement, we recognized
F-23
in our 2017 results of operations a gross impairment loss of $35.8 million, $25.6 million of which relates to the establishment of a deferred tax liability assumed in connection with our acquisition of the business entities. Upon closing of the transaction, the tax liability will be assumed by the buyer, resulting in no economic loss to Aimco.
In addition to the apartment communities we sold during the periods presented, from time to time we may be marketing for sale certain apartment communities that are inconsistent with our long-term investment strategy. At the end of each reporting period, we evaluate whether such communities meet the criteria to be classified as held for sale. As of December 31, 2017, we had three apartment communities with 513 apartment homes in our Real Estate portfolio that were classified as held for sale. In January 2018, we sold these apartment homes for a gain on disposition of $51.0 million, net of tax, and gross proceeds of $71.9 million resulting in $64.6 million of net proceeds to Aimco. Proceeds from the sales were primarily used to repay outstanding borrowings under our Credit Agreement.
Napico Disposition
In 2012, we sold the Napico business. The transaction was primarily seller-financed, and the associated notes were scheduled to be repaid from the operation and liquidation of the Napico business and were collateralized by the buyer’s interests in the portfolio. During 2016, the buyer paid in full the seller-financed notes as well as an agreed upon final payment representing future contingent consideration that may have been due under the terms of the sale. As a result, we derecognized the net assets and liabilities of the Napico business with the exception of the amounts related to one community in which we had continuing involvement in the form of a legal interest in the community and a guarantee related to property-level debt. We recognized a gain of $5.2 million in other, net on our consolidated statement of operations for the year ended December 31, 2016. We also wrote off a deficit balance in noncontrolling interests in consolidated real estate partnerships associated with the Napico business of $8.1 million, which is recorded in net income attributable to noncontrolling interests in consolidated real estate partnerships for the year ended December 31, 2016.
In 2017, the owner refinanced the mortgage related to the final community, resulting in the release of our remaining guarantee, which allowed us to transfer the nominal general partner interest in the community to the buyer. In connection with the transfer, we reduced other assets and accrued liabilities and other by $34.5 million and $38.4 million, respectively, and recognized a gain of $7.1 million, net of tax, in other, net in our consolidated financial statements for the year ended December 31, 2017.
Note 4 — Non-Recourse Property Debt and Credit Agreement
Non-Recourse Property Debt (Real Estate Portfolio)
We finance apartment communities in our Real Estate portfolio primarily using property-level, non-recourse, long-dated, fixed-rate, amortizing debt. The following table summarizes non-recourse property debt related to assets classified as held for use at December 31, 2017 and 2016 (in thousands):
2017 | 2016 | ||||||
Fixed-rate property debt | $ | 3,480,378 | $ | 3,564,979 | |||
Variable-rate property debt | 82,663 | 83,644 | |||||
Debt issue costs, net of accumulated amortization | (17,932 | ) | (18,347 | ) | |||
Non-recourse property debt, net | $ | 3,545,109 | $ | 3,630,276 | |||
Fixed-rate property debt matures at various dates through January 2055, and has interest rates that range from 2.73% to 8.05%, with a weighted average interest rate of 4.64%. Principal and interest on fixed-rate debt are generally payable monthly or in monthly interest-only payments with balloon payments due at maturity. At December 31, 2017, each of the fixed-rate loans payable related to apartment communities classified as held for use were secured by one of 98 apartment communities that had an aggregate gross book value of $6.3 billion.
Variable-rate property debt matures at various dates through July 2033, and had interest rates that ranged from 1.00% to 3.06%, as of December 31, 2017, with a weighted average interest rate of 2.70% at December 31, 2017. Principal and interest on variable-rate debt are generally payable in semi-annual installments with balloon payments due at maturity. As of December 31, 2017, our variable-rate property debt related to apartment communities classified as held for use were each secured by seven apartment communities that had an aggregate gross book value of $204.2 million.
These non-recourse property debt instruments contain covenants common to the type of borrowing, and at December 31, 2017, we were in compliance with all such covenants.
F-24
As of December 31, 2017, the scheduled principal amortization and maturity payments for the non-recourse property debt related to apartment communities classified as held for use were as follows (in thousands):
Amortization | Maturities | ||||||
2018 | $ | 74,807 | $ | 173,733 | |||
2019 | 71,792 | 481,136 | |||||
2020 | 65,362 | 296,967 | |||||
2021 | 49,542 | 741,523 | |||||
2022 | 39,778 | 233,439 | |||||
Thereafter | 1,334,962 | ||||||
Total | $ | 3,563,041 | |||||
Credit Agreement
We have a senior secured credit agreement with a syndicate of financial institutions, which we refer to as the Credit Agreement. Our Credit Agreement provides for $600.0 million of revolving loan commitments. Borrowings against the revolving loan commitments bear interest at a rate set forth on a pricing grid, which rate varies based on our credit rating as assigned by specified rating agencies (LIBOR plus 1.20%, or, at our option, a base rate plus 0.20% at December 31, 2017). The Credit Agreement matures on January 22, 2022. The Credit Agreement provides that we may make distributions to our investors during any four consecutive quarters in an aggregate amount that does not exceed the greater of 95% of our Funds From Operations for such period, subject to certain non-cash adjustments, or such amount as may be necessary to maintain Aimco’s REIT status.
During 2017, we amended the Credit Agreement to add a $250.0 million term loan, which we used to fund a portion of the reacquisition of our limited partner’s interest in the Palazzo joint venture. The term loan matures on June 30, 2018, includes a one-year extension option, subject to the satisfaction of customary conditions, and bears interest at 30-day LIBOR plus 1.35%. We paid lender and other fees of $1.0 million in connection with the term loan, which have been deferred and are amortized as additional interest using the effective interest method.
As of December 31, 2017 and 2016, we had $67.2 million and $17.9 million of outstanding borrowings under our revolving loan commitments, respectively. The interest rate on our outstanding borrowings was 3.26% and 2.09% at December 31, 2017 and 2016, respectively. As of December 31, 2017, after outstanding borrowings and $11.5 million of undrawn letters of credit backed by the Credit Agreement, our available borrowing capacity was $521.3 million.
Non-Recourse Property Debt (Asset Management Business)
The partnerships served by the Asset Management business finance apartment communities using property-level, non-recourse, long-dated, fixed-rate, amortizing debt. The following table summarizes non-recourse property debt related to assets classified as held for use at December 31, 2017 and 2016 (in thousands):
2017 | 2016 | ||||||
Fixed-rate property debt | 231,374 | 241,024 | |||||
Debt issue costs, net of accumulated amortization | (4,233 | ) | (4,598 | ) | |||
Non-recourse property debt, net | $ | 227,141 | $ | 236,426 | |||
Fixed-rate property debt secured by these communities matures at various dates through February 2061, and has interest rates that range from 2.50% to 8.50%, with a weighted average interest rate of 5.11%. At December 31, 2017, each of the fixed-rate loans payable related to apartment communities classified as held for use were secured by one of 39 apartment communities that had an aggregate gross book value of $551.1 million.
These non-recourse property debt instruments contain covenants common to the type of borrowing, and at December 31, 2017, the partnerships served by our Asset Management business were in compliance with all such covenants.
F-25
As of December 31, 2017, the scheduled payments for the non-recourse property debt related to apartment communities classified as held for use were as follows (in thousands):
Scheduled Payments | |||
2018 | $ | 5,959 | |
2019 | 6,192 | ||
2020 | 9,317 | ||
2021 | 17,090 | ||
2022 | 4,714 | ||
Thereafter | 188,102 | ||
Total | $ | 231,374 | |
Note 5 — Commitments and Contingencies
Commitments
In connection with our redevelopment, development and capital improvement activities, we have entered into various construction-related contracts and we have made commitments to complete redevelopment of certain apartment communities, pursuant to financing or other arrangements. As of December 31, 2017, our commitments related to these capital activities totaled approximately $91.1 million, most of which we expect to incur during the next 12 months.
We enter into certain commitments for future purchases of goods and services in connection with the operations of our apartment communities. Those commitments generally have terms of one year or less and reflect expenditure levels comparable to our historical expenditures.
Tax Credit Arrangements
For various consolidated partnerships served by our Asset Management business, we are required to manage the partnerships and related apartment communities in compliance with various laws, regulations and contractual provisions that apply to historic and low-income housing tax credit syndication arrangements. In some instances, noncompliance with applicable requirements could result in projected tax benefits not being realized by the limited partners in these partnerships and would require a refund or reduction of investor capital contributions, which are reported as deferred income in our consolidated balance sheets until such time as our obligation to deliver tax benefits is relieved. The remaining compliance periods for the tax credit syndication arrangements range from less than one year to eight years. We do not anticipate that any material refunds or reductions of investor capital contributions will be required in connection with these arrangements.
Legal Matters
In addition to the matters described below, we are a party to various legal actions and administrative proceedings arising in the ordinary course of business, some of which are covered by our general liability insurance program, and none of which we expect to have a material adverse effect on our consolidated financial condition, results of operations or cash flows.
Environmental
Various federal, state and local laws subject apartment community owners or operators to liability for management, and the costs of removal or remediation, of certain potentially hazardous materials that may be present in the land or buildings of an apartment community. Such laws often impose liability without regard to fault or whether the owner or operator knew of, or was responsible for, the presence of such materials. The presence of, or the failure to manage or remediate properly, these materials may adversely affect occupancy at such apartment communities as well as the ability to sell or finance such apartment communities. In addition, governmental agencies may bring claims for costs associated with investigation and remediation actions. Moreover, private plaintiffs may potentially make claims for investigation and remediation costs they incur or for personal injury, disease, disability or other infirmities related to the alleged presence of hazardous materials. In addition to potential environmental liabilities or costs associated with our current apartment communities, we may also be responsible for such liabilities or costs associated with communities we acquire or manage in the future, or apartment communities we no longer own or operate.
We are engaged in discussions with the Environmental Protection Agency, or EPA, and the Indiana Department of Environmental Management, or IDEM, regarding contaminated groundwater in a residential area in the vicinity of an Indiana apartment community that has not been owned by us since 2008. The contamination allegedly derives from a dry cleaner that operated on our former property, prior to our ownership. We have undertaken a voluntary remediation of the dry cleaner contamination under IDEM’s
F-26
oversight, and in previous years accrued our share of the then-estimated cleanup and abatement costs. In 2016, EPA listed our former community and a number of residential communities in the vicinity on the National Priorities List, or NPL (i.e. as a Superfund site), and IDEM has formally sought to terminate us from the voluntary remediation program. We continue discussions with both agencies on potential long-term solutions. We have filed a formal appeal of the EPA listing and the IDEM termination of us from the voluntary remediation program. Although the outcome of these processes are uncertain, we do not expect their resolution to have a material adverse effect on our consolidated financial condition, results of operations or cash flows.
We also have been contacted by regulators and the current owner of a property in Lake Tahoe, California regarding environmental issues allegedly stemming from the historic operation of a dry cleaner. An entity owned by us was the former general partner of a now-dissolved partnership that previously owned a site that was used for dry cleaning. That entity and the current property owner have been remediating the dry cleaner site since 2009, under the oversight of the Lahontan Regional Water Quality Control Board, or Lahontan. In May 2017, Lahontan issued a final cleanup and abatement order that names four potentially-responsible parties, acknowledges that there may be additional responsible parties, and requires the named parties to perform additional groundwater investigation and corrective actions with respect to onsite and offsite contamination. We are appealing the final order while simultaneously complying with it. Although the outcome of this process is uncertain, we do not expect its resolution to have a material adverse effect on our consolidated financial condition, results of operations or cash flows.
We have determined that our legal obligations to remove or remediate certain potentially hazardous materials may be conditional asset retirement obligations, as defined in GAAP. Except in limited circumstances where the asset retirement activities are expected to be performed in connection with a planned construction project or apartment community casualty, we believe that the fair value of our asset retirement obligations cannot be reasonably estimated due to significant uncertainties in the timing and manner of settlement of those obligations. Asset retirement obligations that are reasonably estimable as of December 31, 2017, are immaterial to our consolidated financial condition, results of operations and cash flows.
Operating Leases
We are obligated under non-cancelable operating leases for office space. We are also obligated under non-cancelable operating leases for the ground under certain of our apartment communities with remaining terms ranging from 46 years to 70 years. Approximate minimum annual rental payments under operating leases are as follows (in thousands):
Office Lease Obligations | Ground Lease Obligations | Total Operating Lease Obligations | |||||||||
2018 | $ | 2,203 | $ | 1,179 | $ | 3,382 | |||||
2019 | 1,050 | 1,279 | 2,329 | ||||||||
2020 | 963 | 1,514 | 2,477 | ||||||||
2021 | 832 | 1,550 | 2,382 | ||||||||
2022 | 628 | 1,550 | 2,178 | ||||||||
Thereafter | — | 79,337 | 79,337 | ||||||||
Total | $ | 5,676 | $ | 86,409 | $ | 92,085 | |||||
Substantially all of the office space subject to the operating leases in the table above is for the use of our corporate offices and area operations. Rent expense recognized totaled $3.0 million, $3.3 million and $3.2 million for the years ended December 31, 2017, 2016 and 2015, respectively. Rent expense recognized for the ground leases totaled $1.8 million, $1.7 million and $0.9 million for the years ended December 31, 2017, 2016 and 2015, respectively, and is included within interest expense in the accompanying statements of operations.
Note 6 — Aimco Equity
Preferred Stock
At December 31, 2017 and 2016, Aimco had a single class of perpetual preferred stock outstanding, its Class A Cumulative Preferred Stock, with 5,000,000 shares authorized, issued and outstanding and with a balance of $125.0 million as of December 31, 2017 and 2016.
Aimco’s Class A Preferred Stock has a $0.01 per share par value, is senior to Aimco’s Common Stock, has a liquidation preference per share of $25.00 and is redeemable at our option on or after May 17, 2019. The holders of Preferred Stock are generally not entitled to vote on matters submitted to stockholders. Dividends at an annual rate of 6.88% are subject to declaration by Aimco’s Board of Directors.
F-27
During the year ended December 31, 2016, Aimco redeemed all of the outstanding shares of its Class Z Cumulative Preferred Stock at a redemption value of $34.8 million. We reflected the $0.7 million excess of the redemption value over the carrying amount and $1.3 million of previously deferred issuance costs as an adjustment of net income attributable to preferred stockholders for the year ended December 31, 2016.
During the year ended December 31, 2015, Aimco redeemed the remaining outstanding shares, or $27.0 million in liquidation preference, of its Series A Community Reinvestment Act, or CRA, Preferred Stock. We reflected $0.7 million of issuance costs as an adjustment of net income attributable to preferred stockholders for the year ended December 31, 2015.
In connection with these redemptions of Aimco preferred stock, the Aimco Operating Partnership redeemed from Aimco a number of Partnership Preferred Units equal to the number of shares redeemed or repurchased by Aimco.
Common Stock
During the years ended December 31, 2017, 2016 and 2015, Aimco declared dividends per common share of $1.44, $1.32 and $1.18, respectively.
During the year ended December 31, 2015, Aimco issued 9,430,000 shares of its Common Stock, par value $0.01 per share, in an underwritten public offering, for net proceeds per share of $38.90. The offering generated net proceeds to Aimco of $366.6 million, net of issuance costs. Aimco contributed the net proceeds from the sale of Common Stock to the Aimco Operating Partnership in exchange for a number of common partnership units equal to the number of shares of Common Stock issued.
Registration Statements
Aimco and the Aimco Operating Partnership have a shelf registration statement that provides for the issuance of debt and equity securities by Aimco and debt securities by the Aimco Operating Partnership.
Note 7 — Partners’ Capital
Partnership Preferred Units Owned by Aimco
At December 31, 2017 and 2016, the Aimco Operating Partnership had outstanding preferred units in classes and amounts similar to Aimco’s Preferred Stock described in Note 6, or Partnership Preferred Units. All of these Partnership Preferred Units were owned by Aimco during the periods presented.
The Partnership Preferred Units are senior to the Aimco Operating Partnership’s common partnership units. The Partnership Preferred Units do not have voting rights, except the right to approve certain changes to the Aimco Operating Partnership’s Partnership Agreement that would adversely affect holders of such class of units. Distributions on Partnership Preferred Units are subject to being declared by the General Partner. The Partnership Preferred Units are redeemable by the Aimco Operating Partnership only in connection with a concurrent redemption by Aimco of the corresponding Aimco Preferred Stock held by unrelated parties.
As discussed in Note 6, during the years ended December 31, 2016 and 2015, Aimco completed various Preferred Stock redemptions. In connection with these redemptions, the Aimco Operating Partnership redeemed from Aimco a corresponding number of Partnership Preferred Units.
F-28
Redeemable Preferred OP Units
In addition to the Partnership Preferred Units owned by Aimco, the Aimco Operating Partnership has outstanding various classes of redeemable Partnership Preferred Units owned by third parties, which we refer to as preferred OP Units. As of December 31, 2017 and 2016, the Aimco Operating Partnership had the following classes of preferred OP Units (stated at their redemption values, in thousands, except unit and per unit data):
Distributions per Annum | Units Issued and Outstanding | Redemption Values | ||||||||||||||||||
Class of Preferred Units | Percent | Per Unit | 2017 | 2016 | 2017 | 2016 | ||||||||||||||
Class One | 8.75 | % | $ | 8.00 | 90,000 | 90,000 | $ | 8,229 | $ | 8,229 | ||||||||||
Class Two | 1.92 | % | $ | 0.48 | 17,750 | 17,750 | 444 | 444 | ||||||||||||
Class Three | 7.88 | % | $ | 1.97 | 1,338,524 | 1,341,289 | 33,462 | 33,532 | ||||||||||||
Class Four | 8.00 | % | $ | 2.00 | 644,954 | 644,954 | 16,124 | 16,124 | ||||||||||||
Class Six | 8.50 | % | $ | 2.13 | 780,036 | 780,036 | 19,501 | 19,501 | ||||||||||||
Class Seven | 7.87 | % | $ | 1.97 | 27,960 | 27,960 | 699 | 699 | ||||||||||||
Class Nine | 6.00 | % | $ | 1.50 | 243,112 | 306,890 | 6,078 | 7,672 | ||||||||||||
Class Ten | 6.00 | % | $ | 1.50 | 680,000 | 680,000 | 17,000 | 17,000 | ||||||||||||
Total | 3,822,336 | 3,888,879 | $ | 101,537 | $ | 103,201 | ||||||||||||||
Each class of preferred OP Units is currently redeemable at the holders’ option. The Aimco Operating Partnership, at its sole discretion, may settle such redemption requests in cash or cause Aimco to issue shares of its Common Stock with a value equal to the redemption price. In the event the Aimco Operating Partnership requires Aimco to issue shares of Common Stock to settle a redemption request, the Aimco Operating Partnership would issue to Aimco a corresponding number of common partnership units. The Aimco Operating Partnership has a redemption policy that requires cash settlement of redemption requests for the preferred OP Units, subject to limited exceptions. Subject to certain conditions, the Class Four and Class Six preferred OP Units may be converted into common OP Units.
These redeemable units are classified within temporary equity in Aimco’s consolidated balance sheets and within temporary capital in the Aimco Operating Partnership’s consolidated balance sheets.
During the years ended December 31, 2017, 2016 and 2015, approximately 67,000, 69,000 and 700 preferred OP Units, respectively, were redeemed in exchange for cash, and no preferred OP Units were redeemed in exchange for shares of Aimco Common Stock.
The Class Ten preferred OP Units were issued as partial consideration for an acquisition during the year ended December 31, 2016.
The following table presents a reconciliation of the Aimco Operating Partnership’s preferred OP Units during the years ended December 31, 2017, 2016 and 2015 (dollars in thousands):
2017 | 2016 | 2015 | |||||||||
Balance at January 1 | $ | 103,201 | $ | 87,926 | $ | 87,937 | |||||
Preferred distributions | (7,764 | ) | (7,239 | ) | (6,943 | ) | |||||
Redemption of preferred units and other | (1,664 | ) | (1,725 | ) | (11 | ) | |||||
Issuance of preferred units | — | 17,000 | — | ||||||||
Net income | 7,764 | 7,239 | 6,943 | ||||||||
Balance at December 31 | $ | 101,537 | $ | 103,201 | $ | 87,926 | |||||
Common Partnership Units
In the Aimco Operating Partnership’s consolidated balance sheets, the common partnership units held by Aimco are classified within Partners’ Capital as General Partner and Special Limited Partner capital and the common OP Units are classified within Limited Partners’ capital. In Aimco’s consolidated balance sheets, the common OP Units are classified within permanent equity as common noncontrolling interests in the Aimco Operating Partnership.
Common partnership units held by Aimco are not redeemable whereas common OP Units are redeemable at the holders’ option, subject to certain restrictions, on the basis of one common OP Unit for either one share of Common Stock or cash equal to the fair
F-29
value of a share of Common Stock at the time of redemption. Aimco has the option to deliver shares of Common Stock in exchange for all or any portion of the common OP Units tendered for redemption. When a limited partner redeems a common OP Unit for Common Stock, Limited Partners’ capital is reduced and the General Partner and Special Limited Partners’ capital is increased.
The holders of the common OP Units receive distributions, prorated from the date of issuance, in an amount equivalent to the dividends paid to holders of Common Stock. During the years ended December 31, 2017, 2016 and 2015, the Aimco Operating Partnership declared distributions per common unit of $1.44, $1.32 and $1.18, respectively.
During the years ended December 31, 2017, 2016 and 2015, approximately 98,000, 248,000 and 112,000 common OP Units, respectively, were redeemed in exchange for cash, and no common OP Units were redeemed in exchange for shares of Common Stock.
Note 8 — Share-Based Compensation
We have a stock award and incentive program to attract and retain officers and independent directors. As of December 31, 2017, approximately 0.4 million shares were available for issuance under our 2015 Stock Award and Incentive Plan. The total number of shares available for issuance under this plan may be increased by an additional 0.7 million shares to the extent of any forfeiture, cancellation, exchange, surrender, termination or expiration of an award outstanding under our 2007 Stock Award and Incentive Plan. Awards under the 2015 plan may be in the form of incentive stock options, non-qualified stock options and restricted stock, or other types of awards as authorized under the plan.
Our plans are administered by the Compensation and Human Resources Committee of Aimco’s Board of Directors. In the case of stock options, the exercise price of the options granted may not be less than the fair market value of a share of Common Stock at the date of grant.
Total compensation cost recognized for stock based awards was $9.3 million, $8.6 million and $7.2 million for the years ended December 31, 2017, 2016 and 2015, respectively. Of these amounts, $1.4 million, $1.0 million and $0.5 million, respectively, were capitalized. At December 31, 2017, total unvested compensation cost not yet recognized was $11.8 million. We expect to recognize this compensation over a weighted average period of approximately 1.6 years.
We have granted five different types of awards that are outstanding as of December 31, 2017. We have granted stock options and restricted stock awards that are subject to time-based vesting and require continuous employment, typically over a period of four years from the grant date, and we refer to these awards as Time-Based Stock Options and Time-Based Restricted Stock, respectively. We have also granted stock options, restricted stock awards and long-term incentive partnership units, or LTIP units, that vest conditioned on Aimco’s total shareholder return, or TSR, relative to the NAREIT Apartment Index (60% weighting) and the MSCI US REIT Index (40% weighting) over a forward-looking performance period of three years. We refer to these awards as TSR Stock Options, TSR Restricted Stock and TSR LTIP units. Earned TSR-based awards, if any, will vest 50% on each of the third anniversary and fourth anniversary of the grant date, based on continued employment. The term of Time-Based Stock Options and TSR Stock Options is generally ten years from the date of grant.
We recognize compensation cost associated with Time-Based awards ratably over the requisite service periods, which are typically four years. We recognize compensation cost related to the TSR-based awards, which have graded vesting periods, over the requisite service period for each separate vesting tranche of the award, commencing on the grant date. The value of the TSR-based awards take into consideration the probability that the market condition will be achieved; therefore previously recorded compensation cost is not adjusted in the event that the market condition is not achieved and awards do not vest.
F-30
Stock Options
During the years ended December 31, 2017 and 2016, we granted TSR Stock Options, and during and prior to the year ended December 31, 2015, we granted Time-Based Stock Options.
The following table summarizes activity for our outstanding stock options, for the years ended December 31, 2017, 2016 and 2015 (numbers of options in thousands):
2017 | 2016 | 2015 | ||||||||||||||||||
Number of Options | Weighted Average Exercise Price | Number of Options | Weighted Average Exercise Price | Number of Options | Weighted Average Exercise Price | |||||||||||||||
Outstanding at beginning of year | 675 | $ | 29.55 | 1,394 | $ | 30.85 | 1,640 | $ | 28.91 | |||||||||||
Granted | 184 | 44.07 | 216 | 38.73 | 239 | 39.05 | ||||||||||||||
Exercised | (211 | ) | 9.90 | (934 | ) | 33.61 | (484 | ) | 28.33 | |||||||||||
Forfeited | — | — | (1 | ) | 29.11 | (1 | ) | 25.78 | ||||||||||||
Outstanding at end of year | 648 | $ | 40.08 | 675 | $ | 29.55 | 1,394 | $ | 30.85 | |||||||||||
Exercisable at end of year | 128 | $ | 37.59 | 280 | $ | 16.38 | 1,155 | $ | 29.16 | |||||||||||
The intrinsic value of a stock option represents the amount by which the current price of the underlying stock exceeds the exercise price of the option. As of December 31, 2017, options outstanding had an aggregate intrinsic value of $2.4 million and a weighted average remaining contractual term of 7.9 years. Options exercisable at December 31, 2017, had an aggregate intrinsic value of $0.8 million and a weighted average remaining contractual term of 6.7 years. The intrinsic value of stock options exercised during the years ended December 31, 2017, 2016 and 2015, was $7.1 million, $11.1 million and $5.5 million, respectively.
The weighted average grant date fair value of stock options granted during the years ended December 31, 2017, 2016 and 2015 was $11.39, $9.94 and $6.97 per option, respectively.
Time-Based Restricted Stock Awards
The following table summarizes activity for Time-Based Restricted Stock awards for the years ended December 31, 2017, 2016 and 2015 (numbers of shares in thousands):
2017 | 2016 | 2015 | ||||||||||||||||||
Number of Shares | Weighted Average Grant-Date Fair Value | Number of Shares | Weighted Average Grant-Date Fair Value | Number of Shares | Weighted Average Grant-Date Fair Value | |||||||||||||||
Unvested at beginning of year | 249 | $ | 33.61 | 339 | $ | 29.96 | 513 | $ | 26.34 | |||||||||||
Granted | 45 | 44.07 | 91 | 40.03 | 145 | 39.39 | ||||||||||||||
Vested | (134 | ) | 32.35 | (181 | ) | 29.99 | (259 | ) | 27.54 | |||||||||||
Forfeited | — | — | — | — | (60 | ) | 32.29 | |||||||||||||
Unvested at end of year | 160 | $ | 37.63 | 249 | $ | 33.61 | 339 | $ | 29.96 | |||||||||||
The aggregate fair value of shares that vested during the years ended December 31, 2017, 2016 and 2015 was $6.0 million, $7.0 million and $10.4 million, respectively.
F-31
TSR Restricted Stock Awards
The following table summarizes activity for TSR Restricted Stock awards for the years ended December 31, 2017, 2016 and 2015 (numbers of shares in thousands):
2017 | 2016 | 2015 | ||||||||||||||||||
Number of Shares | Weighted Average Grant-Date Fair Value | Number of Shares | Weighted Average Grant-Date Fair Value | Number of Shares | Weighted Average Grant-Date Fair Value | |||||||||||||||
Unvested at beginning of year | 214 | $ | 39.66 | 123 | $ | 39.72 | — | $ | — | |||||||||||
Granted | 39 | 46.39 | 91 | 39.59 | 142 | 39.72 | ||||||||||||||
Forfeited | — | — | — | — | (19 | ) | 39.72 | |||||||||||||
Unvested at end of year | 253 | $ | 40.70 | 214 | $ | 39.66 | 123 | $ | 39.72 | |||||||||||
TSR LTIP Units
The following table summarizes activity for TSR LTIP units for the years ended December 31, 2017 (numbers of units in thousands):
2017 | ||||||
Number of Units | Weighted Average Grant-Date Fair Value | |||||
Unvested at beginning of year | — | $ | — | |||
Granted | 45 | 46.21 | ||||
Unvested at end of year | 45 | $ | 46.21 | |||
Determination of Grant-Date Fair Value of Awards
We estimated the fair value of TSR-based awards granted in 2017, 2016 and 2015 using a Monte Carlo model using the assumptions set forth in the table below.
The risk-free interest rate reflects the annualized yield of a zero coupon U.S. Treasury security with a term equal to the expected term of the option. The expected dividend yield reflects expectations regarding cash dividend amounts per share paid on Aimco’s Common Stock during the expected term of the option. Expected volatility reflects an average of the historical volatility of Aimco’s Common Stock during the historical period commensurate with the expected term of the options that ended on the date of grant, and the implied volatility is calculated from observed call option contracts closest to the expected term. The derived vesting period of TSR Restricted Stock and TSR LTIP units was determined based on the graded vesting terms. The expected term of the TSR-options was based on historical option exercises and post-vesting terminations. The midpoints of our valuation assumptions for the 2017, 2016 and 2015 grants were as follows:
2017 | 2016 | 2015 | |||||||||
Grant date market value of a common share | $ | 44.07 | $ | 38.73 | $ | 39.05 | |||||
Risk-free interest rate | 1.57 | % | 1.15 | % | 1.04 | % | |||||
Dividend yield | 3.27 | % | 3.41 | % | 2.87 | % | |||||
Expected volatility | 21.33 | % | 21.24 | % | 19.48 | % | |||||
Derived vesting period of TSR Restricted Stock and TSR LTIP units | 3.4 years | 3.4 years | 3.4 years | ||||||||
Weighted average expected term of TSR Stock Options | 5.8 years | 5.8 years | n/a | ||||||||
The grant date fair value for the Time-Based Restricted Stock awards reflects the closing price of a share of Aimco common stock on the grant date.
F-32
Note 9 — Income Taxes
Deferred income taxes reflect the net effects of temporary differences between the carrying amounts of assets and liabilities of the TRS entities for financial reporting purposes and the amounts used for income tax purposes. Significant components of our deferred tax liabilities and assets are as follows (in thousands):
December 31, | |||||||
2017 | 2016 | ||||||
Deferred tax liabilities: | |||||||
Real estate and real estate partnership basis differences | $ | 32,032 | $ | 72,726 | |||
Deferred tax assets: | |||||||
Net operating, capital and other loss carryforwards | $ | 9,523 | $ | 8,873 | |||
Accruals and expenses | 6,575 | 7,537 | |||||
Tax credit carryforwards | 73,450 | 65,559 | |||||
Management contracts and other | 200 | 300 | |||||
Total deferred tax assets | 89,748 | 82,269 | |||||
Valuation allowance | (25,489 | ) | (4,467 | ) | |||
Net deferred tax assets | $ | 32,227 | $ | 5,076 | |||
In December 2017, the U.S. Congress passed the Tax Cuts and Jobs Act, or the 2017 Act, which is effective for years beginning with 2018. The 2017 Act provides for a reduction in the federal income tax rate. In accordance with GAAP, we revalued our deferred tax assets and liabilities as of December 31, 2017. We have not completed our accounting for the tax effects of enactment of the 2017 Act; however, we have made a reasonable estimate of the effects on our existing deferred tax balances, resulting in our recognition of a net tax benefit of $15.9 million.
At December 31, 2017, we had federal and state net operating loss carryforwards, or NOLs, for which the deferred tax asset was approximately $9.5 million, before a valuation allowance of $6.6 million. The NOLs expire in years 2018 to 2033. Subject to certain separate return limitations, we may use these NOLs to offset a portion of state taxable income generated by our TRS entities.
As of December 31, 2017, we had low-income housing and rehabilitation tax credit carryforwards and corresponding deferred tax assets of approximately $73.5 million for income tax purposes that expire in years 2024 to 2037. In light of the lower federal tax rate under the 2017 Act, our TRS entities must generate more taxable income in future years to utilize tax credit carryforwards, which are recorded as deferred tax assets. As a result, during the year ended December 31, 2017, we recognized a partial valuation allowance of $15.4 million against the deferred tax assets associated with low-income housing and rehabilitation tax credit carryforwards.
At December 31, 2017, we had a real estate partnership basis difference of $4.4 million related to the 2017 impairment loss recognized related to the La Jolla Cove property discussed in Note 3, for which we have recognized a full valuation allowance.
A reconciliation of the beginning and ending balance of our unrecognized tax benefits is presented below (in thousands):
2017 | 2016 | 2015 | |||||||||
Balance at January 1 | $ | 2,286 | $ | 2,897 | $ | 2,286 | |||||
Additions (reductions) based on tax positions related to prior years | 190 | (611 | ) | 611 | |||||||
Balance at December 31 | $ | 2,476 | $ | 2,286 | $ | 2,897 | |||||
Because the statute of limitations has not yet elapsed, our United States federal income tax returns for the year ended December 31, 2013 and subsequent years and certain of our State income tax returns for the year ended December 31, 2013 and subsequent years are currently subject to examination by the IRS or other taxing authorities. If recognized, the unrecognized benefit would affect the effective rate.
In 2014, the IRS initiated an audit of the Aimco Operating Partnership’s 2011 and 2012 tax years. This audit remains in process as of December 31, 2017. We do not believe the audit will have any material effect on our unrecognized tax benefits, financial condition or results of operations.
Our policy is to include any interest and penalties related to income taxes within the income tax line item in our consolidated statements of operations.
F-33
In accordance with the accounting requirements for stock-based compensation, we may recognize tax benefits in connection with the exercise of stock options by employees of our TRS entities and the vesting of restricted stock awards. As of December 31, 2017, all cumulative excess tax benefits from employee stock option exercises and vested restricted stock awards had been realized. As further discussed in the Accounting Pronouncements Adopted in the Current Year heading in Note 2, in 2017 we began recognizing the tax effects related to stock-based compensation through earnings in the period the compensation was recognized.
Significant components of the income tax benefit or expense are as follows and are classified within income tax benefit in income before gain on dispositions and gain on dispositions of real estate, net of tax, in our consolidated statements of operations for the years ended December 31, 2017, 2016 and 2015 (in thousands):
2017 | 2016 | 2015 | |||||||||
Current: | |||||||||||
Federal (1) | $ | (938 | ) | $ | 5,038 | $ | 1,310 | ||||
State | 525 | 2,916 | 1,357 | ||||||||
Total current | (413 | ) | 7,954 | 2,667 | |||||||
Deferred: | |||||||||||
Federal | (10,908 | ) | (26,173 | ) | (27,382 | ) | |||||
State | (3,621 | ) | (623 | ) | (1,052 | ) | |||||
Revaluation of deferred taxes due to change in tax rate | (15,894 | ) | — | — | |||||||
Total deferred | (30,423 | ) | (26,796 | ) | (28,434 | ) | |||||
Total benefit | $ | (30,836 | ) | $ | (18,842 | ) | $ | (25,767 | ) | ||
Classification: | |||||||||||
Income before gain on dispositions | $ | (32,126 | ) | $ | (25,208 | ) | $ | (27,524 | ) | ||
Gain on dispositions of real estate | $ | 1,290 | $ | 6,366 | $ | 1,757 | |||||
(1) | As a result of the 2017 Act, Alternative Minimum Tax credits that are not used will be refunded before 2022, therefore in 2017 we reclassified $2.7 million in AMT credits from deferred tax assets to receivables, which is included in other assets on our consolidated balance sheet, resulting in a net current federal tax benefit. |
Consolidated income or loss subject to tax consists of pretax income or loss of our TRS entities and income and gains retained by the REIT. For the years ended December 31, 2017, 2016 and 2015, we had consolidated net loss subject to tax of $55.6 million, net income subject to tax of $109.3 million and net loss subject to tax of $31.3 million, respectively.
The reconciliation of income tax attributable to operations computed at the United States statutory rate to income tax benefit is shown below (dollars in thousands):
2017 | 2016 | 2015 | ||||||||||||||||||
Amount | Percent | Amount | Percent | Amount | Percent | |||||||||||||||
Tax (benefit) provision at United States statutory rates on consolidated income or loss subject to tax | $ | (19,459 | ) | 35.0 | % | $ | 38,257 | 35.0 | % | $ | (10,947 | ) | 35.0 | % | ||||||
State income tax expense, net of federal tax (benefit) expense | (1,769 | ) | 3.2 | % | 7,152 | 6.5 | % | (361 | ) | 1.2 | % | |||||||||
Establishment of deferred tax asset related to partnership basis difference (1) | (3,501 | ) | 6.3 | % | — | — | % | — | — | % | ||||||||||
Effect of permanent differences | (1,629 | ) | 2.9 | % | (132 | ) | (0.1 | )% | (27 | ) | 0.1 | % | ||||||||
Tax effect of intercompany transactions (2) | — | — | % | (47,369 | ) | (43.3 | )% | (1,515 | ) | 4.8 | % | |||||||||
Tax credits | (9,607 | ) | 17.3 | % | (16,750 | ) | (15.3 | )% | (13,583 | ) | 43.4 | % | ||||||||
Tax reform revaluation (3) | (15,894 | ) | 28.6 | % | — | — | % | — | — | % | ||||||||||
Increase in valuation allowance (4) | 21,023 | (37.8 | )% | — | — | % | 666 | (2.1 | )% | |||||||||||
Total income tax benefit | $ | (30,836 | ) | 55.5 | % | $ | (18,842 | ) | (17.2 | )% | $ | (25,767 | ) | 82.4 | % | |||||
(1) | Includes the establishment of a deferred tax asset related to partnership basis difference when it became apparent that it would reverse in the foreseeable future. This deferred tax asset is fully reserved in the valuation allowance described below. |
(2) | 2016 and 2015 include the effect of intercompany asset transfers between the Aimco Operating Partnership and TRS entities, for which tax was deferred and recognized as the assets affected GAAP income or loss, for example, through depreciation, impairment, or upon the sale of the asset to a third-party. Effective January 1, 2017, we adopted a new accounting standard applicable to intercompany asset transfers. As a result, the accumulated unrecognized deferred tax expense associated with historical intercompany transfers was recognized as a cumulative effect adjustment through retained earnings at that time, as further described in Note 2. |
F-34
(3) | Reflects revaluation of deferred tax assets and liabilities using the TRS entities’ lower effective tax rates resulting from the 2017 Act. |
(4) | Includes a $15.4 million valuation allowance against the deferred tax assets associated with rehabilitation tax credits due to the lower federal tax rate under the 2017 Act. |
Income taxes paid totaled approximately $7.4 million, $2.2 million and $2.0 million in the years ended December 31, 2017, 2016 and 2015, respectively.
For income tax purposes, dividends paid to holders of Common Stock primarily consist of ordinary income, capital gains, qualified dividends and unrecaptured Section 1250 gains, or a combination thereof. For the years ended December 31, 2017, 2016 and 2015, dividends per share held for the entire year were estimated to be taxable as follows:
2017 | 2016 | 2015 | ||||||||||||||||||
Amount | Percentage | Amount | Percentage | Amount | Percentage | |||||||||||||||
Ordinary income | $ | 0.75 | 51.5 | % | $ | 0.45 | 34.2 | % | $ | 0.36 | 30.2 | % | ||||||||
Capital gains | 0.51 | 35.7 | % | 0.47 | 35.4 | % | 0.37 | 31.3 | % | |||||||||||
Qualified dividends | 0.02 | 1.6 | % | 0.13 | 9.9 | % | 0.17 | 14.5 | % | |||||||||||
Unrecaptured Section 1250 gain | 0.16 | 11.2 | % | 0.27 | 20.5 | % | 0.28 | 24.0 | % | |||||||||||
$ | 1.44 | 100.0 | % | $ | 1.32 | 100.0 | % | $ | 1.18 | 100.0 | % | |||||||||
Note 10 — Earnings per Share/Unit
Aimco and the Aimco Operating Partnership calculate basic earnings per common share and basic earnings per common unit based on the weighted average number of shares of Common Stock and common partnership units and participating securities outstanding, and calculate diluted earnings per share and diluted earnings per unit taking into consideration dilutive common stock and common partnership unit equivalents and dilutive convertible securities outstanding during the period.
Our common stock equivalents and common partnership unit equivalents include options to purchase shares of Common Stock, which, if exercised, would result in Aimco’s issuance of additional shares and the Aimco Operating Partnership’s issuance to Aimco of additional common partnership units equal to the number of shares purchased under the options. These equivalents also include unvested TSR Restricted Stock awards that do not meet the definition of participating securities, which would result in the issuance of additional common shares and common partnership units equal to the number of shares that vest. The effect of these securities was dilutive for the years ended December 31, 2017, 2016, and 2015, and accordingly has been included in the denominator for calculating diluted earnings per share and unit during these periods.
Our Time-Based Restricted Stock awards receive dividends similar to shares of Common Stock and common partnership units prior to vesting and our TSR LTIP units receive a percentage of the distributions paid to common partnership units prior to vesting. These dividends and distributions are not forfeited in the event the awards do not vest. Therefore, the unvested restricted shares and units related to these awards are participating securities. The effect of participating securities is included in basic and diluted earnings per share and unit computations using the two-class method of allocating distributed and undistributed earnings when the two-class method is more dilutive than the treasury stock method. At December 31, 2017, 2016 and 2015, there were 0.2 million, 0.2 million and 0.3 million shares of unvested participating restricted securities, respectively.
As discussed in Note 7, the Aimco Operating Partnership has various classes of preferred OP Units, which may be redeemed at the holders’ option. The Aimco Operating Partnership may redeem these units for cash, or at its option, shares of Common Stock. As of December 31, 2017, these preferred OP Units were potentially redeemable for approximately 2.3 million shares of Common Stock (based on the period end market price), or cash. The Aimco Operating Partnership has a redemption policy that requires cash settlement of redemption requests for the preferred OP Units, subject to limited exceptions. Accordingly, we have excluded these securities from earnings per share and unit computations for the periods presented above, and we expect to exclude them in future periods.
Note 11 — Fair Value Measurements
Recurring Fair Value Measurements
We measure at fair value on a recurring basis our investment in the securitization trust that holds certain of our property debt, which we classify as available for sale (AFS) debt securities, and our interest rate swaps, both of which are classified within Level 2 of the GAAP fair value hierarchy.
Our investments classified as AFS are presented within other assets in the accompanying consolidated balance sheets. We hold several positions in the securitization trust that pay interest currently and we also hold the first loss position in the securitization
F-35
trust, which accrues interest over the term of the investment. We are accreting the discount to the $100.9 million face value of the investments into interest income using the effective interest method over the remaining expected term of the investments, which as of December 31, 2017, was approximately 3.4 years. Our amortized cost basis for these investments, which represents the original cost adjusted for interest accretion less interest payments received, was $77.7 million and $72.5 million at December 31, 2017 and 2016, respectively. We estimated the fair value of these investments to be $82.8 million and $76.1 million at December 31, 2017 and 2016, respectively.
We estimate the fair value of these investments using an income and market approach with primarily observable inputs, including yields and other information regarding similar types of investments, and adjusted for certain unobservable inputs specific to these investments. The fair value of the positions that pay interest currently typically moves in an inverse relationship with movements in interest rates. The fair value of the first loss position is primarily correlated to collateral quality and demand for similar subordinate commercial mortgage-backed securities.
Certain consolidated partnerships served by our Asset Management business have entered into interest rate swap agreements, which limit exposure to interest rate risk on the partnerships’ debt by effectively converting the interest from a variable rate to a fixed rate. We estimate the fair value of interest rate swaps using an income approach with primarily observable inputs, including information regarding the hedged variable cash flows and forward yield curves relating to the variable interest rates on which the hedged cash flows are based.
The following table sets forth a summary of changes in fair value in the interest rate swaps (in thousands):
Year Ended December 31, | |||||||||||
2017 | 2016 | 2015 | |||||||||
Beginning balance | $ | (3,175 | ) | $ | (4,938 | ) | $ | (5,273 | ) | ||
Realized (unrealized) losses included in interest expense | 73 | (44 | ) | (44 | ) | ||||||
Realized losses on derecognition of interest rate swaps included in earnings | 273 | — | — | ||||||||
Losses on interest rate swaps reclassified into interest expense from accumulated other comprehensive loss | 1,207 | 1,586 | 1,678 | ||||||||
Unrealized (losses) gains included in equity and partners’ capital | (173 | ) | 221 | (1,299 | ) | ||||||
Ending balance | $ | (1,795 | ) | $ | (3,175 | ) | $ | (4,938 | ) | ||
Realized losses on derecognition of interest rate swaps included in earnings represents previously unrealized losses related to an interest rate swap to which the partnership owning the final Napico property was a party. We wrote off the accumulated other comprehensive income related to this swap in conjunction with the derecognition of the property’s assets and liabilities as discussed in Note 3.
As of December 31, 2017 and 2016, the remaining interest rate swaps, exclusive of the derecognized Napico interest rate swap, had aggregate notional amounts of $22.0 million and $22.4 million, respectively. As of December 31, 2017, these swaps had a weighted average remaining term of 6.0 years. We have designated these interest rate swaps as cash flow hedges. The fair value of these swaps is presented within accrued liabilities and other related to the Asset Management business within our consolidated balance sheets, and we recognize any changes in the fair value as an adjustment of accumulated other comprehensive loss within equity and partners’ capital to the extent of their effectiveness.
If the forward rates at December 31, 2017, remain constant, we estimate that during the next 12 months, we would reclassify into earnings approximately $0.3 million of the unrealized losses in accumulated other comprehensive loss. If market interest rates increase above the 3.26% weighted average fixed rate under these interest rate swaps we will benefit from net cash payments due to us from our counterparty to the interest rate swaps.
F-36
Fair Value Disclosures
We believe that the carrying values of the consolidated amounts of cash and cash equivalents, receivables and payables approximates their fair value at December 31, 2017 and 2016, due to their relatively short-term nature and high probability of realization. The estimated fair value of total indebtedness associated with our Real Estate portfolio was approximately $3.9 billion and $3.7 billion at December 31, 2017 and 2016, respectively, as compared to carrying amounts of $3.9 billion and $3.6 billion, respectively. The carrying amounts of the non-recourse property debt of the consolidated partnerships served by our Asset Management business approximated its estimated fair value at December 31, 2017 and December 31, 2016. We estimate the fair value of our consolidated debt using an income and market approach, including comparison of the contractual terms to observable and unobservable inputs such as market interest rate risk spreads, contractual interest rates, remaining periods to maturity, collateral quality and loan to value ratios on similarly encumbered apartment communities within our portfolio. We classify the fair value of our consolidated debt within Level 3 of the GAAP valuation hierarchy based on the significance of certain of the unobservable inputs used to estimate their fair values.
Note 12 — Business Segments
During the year ended December 31, 2017, we revised the information regularly reviewed by our chief executive officer, who is our chief operating decision maker, to assess our operating performance. Apartment communities are classified as either part of our Real Estate portfolio or as those owned by partnerships served by our Asset Management business.
Our chief operating decision maker uses proportionate property net operating income to assess the operating performance of our apartment communities. Proportionate property net operating income reflects our share of rental and other property revenues less direct property operating expenses, including real estate taxes, for consolidated apartment communities we own and manage. As of December 31, 2017, for segment performance evaluation, our Real Estate segment included 132 consolidated apartment communities with 36,762 apartment homes and excluded four apartment communities with 142 apartment homes that we neither manage nor consolidate.
As of December 31, 2017, through our Asset Management business we also held nominal ownership positions in consolidated partnerships that own 46 low-income housing tax credit apartment communities with 6,898 apartment homes. Neither the results of operations nor the assets of these partnerships and apartment communities are quantitatively material; therefore, we have one reportable segment, Real Estate. The results of operations for the years ended December 31, 2016 and 2015, and the segment assets as of December 31, 2016, shown below have been revised to reflect the change in our reportable segments.
The following tables present the revenues, net operating income and income before gain on dispositions of our Real Estate segment on a proportionate basis (excluding amounts related to apartment communities sold or classified as held for sale as of December 31, 2017) for the years ended December 31, 2017, 2016 and 2015 (in thousands):
Real Estate | Proportionate Adjustments (1) | Corporate and Amounts Not Allocated to Reportable Segment (2) | Consolidated | ||||||||||||
Year Ended December 31, 2017: | |||||||||||||||
Rental and other property revenues attributable to Real Estate | $ | 854,491 | $ | 15,481 | $ | 48,176 | $ | 918,148 | |||||||
Rental and other property revenues of partnerships served by Asset Management business | — | — | 74,046 | 74,046 | |||||||||||
Tax credit and transaction revenues | — | — | 13,243 | 13,243 | |||||||||||
Total revenues | 854,491 | 15,481 | 135,465 | 1,005,437 | |||||||||||
Property operating expenses attributable to Real Estate | 265,186 | 4,887 | 48,866 | 318,939 | |||||||||||
Property operating expenses of partnerships served by Asset Management business | — | — | 35,440 | 35,440 | |||||||||||
Other operating expenses not allocated to reportable segment (3) | — | — | 457,075 | 457,075 | |||||||||||
Total operating expenses | 265,186 | 4,887 | 541,381 | 811,454 | |||||||||||
Operating income | 589,305 | 10,594 | (405,916 | ) | 193,983 | ||||||||||
Other items included in income before gain on dispositions (4) | — | — | (146,463 | ) | (146,463 | ) | |||||||||
Income before gain on dispositions | $ | 589,305 | $ | 10,594 | $ | (552,379 | ) | $ | 47,520 | ||||||
F-37
Real Estate | Proportionate Adjustments (1) | Corporate and Amounts Not Allocated to Reportable Segment (2) | Consolidated | ||||||||||||
Year Ended December 31, 2016: | |||||||||||||||
Rental and other property revenues attributable to Real Estate | $ | 791,587 | $ | 28,509 | $ | 79,795 | $ | 899,891 | |||||||
Rental and other property revenues of partnerships served by Asset Management business | — | — | 74,640 | 74,640 | |||||||||||
Tax credit and transaction revenues | — | — | 21,323 | 21,323 | |||||||||||
Total revenues | 791,587 | 28,509 | 175,758 | 995,854 | |||||||||||
Property operating expenses attributable to Real Estate | 251,636 | 8,284 | 58,037 | 317,957 | |||||||||||
Property operating expenses of partnerships served by Asset Management business | — | — | 36,956 | 36,956 | |||||||||||
Other operating expenses not allocated to reportable segment (3) | — | — | 394,145 | 394,145 | |||||||||||
Total operating expenses | 251,636 | 8,284 | 489,138 | 749,058 | |||||||||||
Operating income | 539,951 | 20,225 | (313,380 | ) | 246,796 | ||||||||||
Other items included in income before gain on dispositions (4) | — | — | (157,313 | ) | (157,313 | ) | |||||||||
Income before gain on dispositions | $ | 539,951 | $ | 20,225 | $ | (470,693 | ) | $ | 89,483 | ||||||
Real Estate | Proportionate Adjustments (1) | Corporate and Amounts Not Allocated to Reportable Segment (2) | Consolidated | ||||||||||||
Year Ended December 31, 2015: | |||||||||||||||
Rental and other property revenues attributable to Real Estate | $ | 737,079 | $ | 28,875 | $ | 117,066 | $ | 883,020 | |||||||
Rental and other property revenues of partnerships served by Asset Management business | — | — | 73,934 | 73,934 | |||||||||||
Tax credit and transaction revenues | — | — | 24,356 | 24,356 | |||||||||||
Total revenues | 737,079 | 28,875 | 215,356 | 981,310 | |||||||||||
Property operating expenses attributable to Real Estate | 240,789 | 8,857 | 74,933 | 324,579 | |||||||||||
Property operating expenses of partnerships served by Asset Management business | — | — | 37,537 | 37,537 | |||||||||||
Other operating expenses not allocated to reportable segment (3) | — | — | 362,979 | 362,979 | |||||||||||
Total operating expenses | 240,789 | 8,857 | 475,449 | 725,095 | |||||||||||
Operating income | 496,290 | 20,018 | (260,093 | ) | 256,215 | ||||||||||
Other items included in income before gain on dispositions (4) | — | — | (164,825 | ) | (164,825 | ) | |||||||||
Income before gain on dispositions | $ | 496,290 | $ | 20,018 | $ | (424,918 | ) | $ | 91,390 | ||||||
(1) | Represents adjustments for the noncontrolling interests in consolidated real estate partnerships’ share of the results of consolidated apartment communities in our Real Estate segment, which are included in the related consolidated amounts, but excluded from proportionate property net operating income for our segment evaluation. |
(2) | Includes the operating results of apartment communities sold during the periods shown or held for sale at the end of the period, if any, and the operating results of apartment communities owned by consolidated partnerships served by our Asset Management business. Corporate and Amounts Not Allocated to Reportable Segment also includes property management expenses and casualty gains and losses (which are included in consolidated property operating expenses), which are property related items that are not part of our segment performance measure. |
(3) | Other operating expenses not allocated to reportable segment consists of depreciation and amortization, general and administrative expenses and other operating expenses including provision for real estate impairment loss, which are not included in our measure of segment performance. |
(4) | Other items included in income before gain on dispositions primarily consist of interest expense and income tax benefit. |
F-38
The assets of our reportable segment and the consolidated assets not allocated to our segment are as follows (in thousands):
December 31, | |||||||
2017 | 2016 | ||||||
Real Estate | $ | 5,495,069 | $ | 5,432,642 | |||
Corporate and other assets (1) | 583,971 | 800,176 | |||||
Total consolidated assets | $ | 6,079,040 | $ | 6,232,818 | |||
(1) | Includes the assets of consolidated partnerships served by the Asset Management business and apartment communities sold or classified as held for sale as of December 31, 2017. |
For the years ended December 31, 2017, 2016 and 2015, capital additions related to our Real Estate segment totaled $338.0 million, $321.0 million and $340.3 million, respectively.
Note 13 — Variable Interest Entities
Generally, a variable interest entity, or VIE, is a legal entity in which the equity investors do not have the characteristics of a controlling financial interest or the equity investors lack sufficient equity at risk for the entity to finance its activities without additional subordinated financial support. A limited partnership is considered a VIE when the majority of the limited partners unrelated to the general partner possess neither the right to remove the general partner without cause, nor certain rights to participate in the decisions that most significantly affect the financial results of the partnership. In determining whether we are the primary beneficiary of a VIE, we consider qualitative and quantitative factors, including, but not limited to: which activities most significantly impact the VIE’s economic performance and which party controls such activities; the amount and characteristics of our investment; the obligation or likelihood for us or other investors to provide financial support; and the similarity with and significance to our business activities and the business activities of the other investors. Significant judgments related to these determinations include estimates about the current and future fair values and performance of real estate held by these VIEs and general market conditions.
Aimco consolidates the Aimco Operating Partnership, which is a VIE for which Aimco is the primary beneficiary. Aimco, through the Aimco Operating Partnership, consolidates all VIEs for which it is the primary beneficiary.
All of the VIEs we consolidate own interests in one or more apartment communities. VIEs that own apartment communities we classify as part of our Real Estate segment are typically structured to generate a return for their partners through the operation and ultimate sale of the communities. We are the primary beneficiary in the limited partnerships in which we are the sole decision maker and have a substantial economic interest.
Certain partnerships served by our Asset Management business own interests in low-income housing tax credit apartment communities that are structured to provide for the pass-through of tax credits and tax deductions to their partners and are VIEs. We hold a nominal ownership position in these partnerships, generally one percent or less. As general partner in these partnerships, we are the sole decision maker and we receive fees and other payments in return for the asset management and other services we provide and thus share in the economics of the partnerships, and as such, we are the primary beneficiary of these partnerships. The table below summarizes information regarding VIEs that are consolidated by the Aimco Operating Partnership:
December 31, | |||||
2017 | 2016 | ||||
Real Estate portfolio: | |||||
VIEs with interests in apartment communities | 14 | 17 | |||
Apartment communities held by VIEs | 14 | 19 | |||
Apartment homes in communities held by VIEs | 4,321 | 6,110 | |||
Consolidated partnerships served by the Asset Management business: | |||||
VIEs with interests in apartment communities | 49 | 50 | |||
Apartment communities held by VIEs | 37 | 38 | |||
Apartment homes in communities held by VIEs | 5,893 | 6,093 | |||
F-39
Assets of the Aimco Operating Partnership’s consolidated VIEs must first be used to settle the liabilities of such consolidated VIEs. These consolidated VIEs’ creditors do not have recourse to the general credit of the Aimco Operating Partnership. Assets and liabilities of VIEs are summarized in the table below (in thousands):
December 31, | |||||||
2017 | 2016 | ||||||
Real Estate portfolio: | |||||||
Assets | |||||||
Net real estate | $ | 529,898 | $ | 897,510 | |||
Cash and cash equivalents | 16,111 | 15,877 | |||||
Restricted cash | 4,798 | 7,981 | |||||
Liabilities | |||||||
Non-recourse property debt | 412,205 | 725,061 | |||||
Accrued liabilities and other | 10,623 | 14,270 | |||||
Consolidated partnerships served by the Asset Management business: | |||||||
Assets | |||||||
Real estate, net | 215,580 | 235,920 | |||||
Cash and cash equivalents | 15,931 | 14,926 | |||||
Restricted cash | 30,107 | 32,542 | |||||
Liabilities | |||||||
Non-recourse property debt | 220,356 | 229,509 | |||||
Accrued liabilities and other | 20,241 | 16,934 | |||||
Note 14 — Unaudited Summarized Consolidated Quarterly Information
Aimco
Aimco’s summarized unaudited consolidated quarterly information for the years ended December 31, 2017 and 2016, is provided below (in thousands, except per share amounts):
Quarter | |||||||||||||||
2017 | First | Second | Third | Fourth | |||||||||||
Total revenues | $ | 246,481 | $ | 249,092 | $ | 254,635 | $ | 255,229 | |||||||
Operating income | 57,789 | 59,706 | 59,205 | 17,283 | |||||||||||
Net income | 17,155 | 21,591 | 22,144 | 286,189 | |||||||||||
Net income attributable to Aimco common stockholders | 11,491 | 15,843 | 17,430 | 262,097 | |||||||||||
Net income attributable to Aimco common stockholders per common share - basic | $ | 0.07 | $ | 0.10 | $ | 0.11 | $ | 1.68 | |||||||
Net income attributable to Aimco common stockholders per common share - diluted | $ | 0.07 | $ | 0.10 | $ | 0.11 | $ | 1.67 | |||||||
Quarter | |||||||||||||||
2016 | First | Second | Third | Fourth | |||||||||||
Total revenues | $ | 246,239 | $ | 251,218 | $ | 248,904 | $ | 249,493 | |||||||
Operating income | 63,534 | 64,436 | 58,732 | 60,094 | |||||||||||
Net income | 29,885 | 245,953 | 30,036 | 177,399 | |||||||||||
Net income attributable to Aimco common stockholders | 23,223 | 221,382 | 11,176 | 162,000 | |||||||||||
Net income attributable to Aimco common stockholders per common share - basic | $ | 0.15 | $ | 1.42 | $ | 0.07 | $ | 1.04 | |||||||
Net income attributable to Aimco common stockholders per common share - diluted | $ | 0.15 | $ | 1.41 | $ | 0.07 | $ | 1.03 | |||||||
F-40
The Aimco Operating Partnership
The Aimco Operating Partnership’s summarized unaudited consolidated quarterly information for the years ended December 31, 2017 and 2016, is provided below (in thousands, except per unit amounts):
Quarter | |||||||||||||||
2017 | First | Second | Third | Fourth | |||||||||||
Total revenues | $ | 246,481 | $ | 249,092 | $ | 254,635 | $ | 255,229 | |||||||
Operating income | 57,789 | 59,706 | 59,205 | 17,283 | |||||||||||
Net income | 17,155 | 21,591 | 22,144 | 286,189 | |||||||||||
Net income attributable to the Partnership’s common unitholders | 12,047 | 16,627 | 18,246 | 274,380 | |||||||||||
Net income attributable to the Partnership’s common unitholders per common unit - basic | $ | 0.07 | $ | 0.10 | $ | 0.11 | $ | 1.68 | |||||||
Net income attributable to the Partnership’s common unitholders per common unit - diluted | $ | 0.07 | $ | 0.10 | $ | 0.11 | $ | 1.67 | |||||||
Quarter | |||||||||||||||
2016 | First | Second | Third | Fourth | |||||||||||
Total revenues | $ | 246,239 | $ | 251,218 | $ | 248,904 | $ | 249,493 | |||||||
Operating income | 63,534 | 64,436 | 58,732 | 60,094 | |||||||||||
Net income | 29,885 | 245,953 | 30,036 | 177,399 | |||||||||||
Net income attributable to the Partnership’s common unitholders | 24,395 | 232,517 | 11,368 | 169,869 | |||||||||||
Net income attributable to the Partnership’s common unitholders per common unit - basic | $ | 0.15 | $ | 1.42 | $ | 0.07 | $ | 1.04 | |||||||
Net income attributable to the Partnership’s common unitholders per common unit - diluted | $ | 0.15 | $ | 1.41 | $ | 0.07 | $ | 1.03 | |||||||
F-41
APARTMENT INVESTMENT AND MANAGEMENT COMPANY | ||||||||||||
AIMCO PROPERTIES, L.P. | ||||||||||||
SCHEDULE III: REAL ESTATE AND ACCUMULATED DEPRECIATION | ||||||||||||
December 31, 2017 | ||||||||||||
(In Thousands Except Apartment Home Data) | ||||||||||||
(2) | |||||||||||||||||||||||||||||||||
(1) | Initial Cost | Cost Capitalized | December 31, 2017 | ||||||||||||||||||||||||||||||
Apartment | Date | Year | Apartment | Buildings and | Subsequent to | Buildings and | (3) | Accumulated | Total Cost | (4) | |||||||||||||||||||||||
Apartment Community Name | Type | Consolidated | Location | Built | Homes | Land | Improvements | Consolidation | Land | Improvements | Total | Depreciation (AD) | Net of AD | Encumbrances | |||||||||||||||||||
Real Estate Segment: | |||||||||||||||||||||||||||||||||
100 Forest Place | High Rise | Dec 1997 | Oak Park, IL | 1987 | 234 | $ | 2,664 | $ | 18,815 | $ | 9,965 | $ | 2,664 | $ | 28,780 | $ | 31,444 | $ | (14,718 | ) | $ | 16,726 | $ | — | |||||||||
118-122 West 23rd Street | High Rise | Jun 2012 | New York, NY | 1987 | 42 | 14,985 | 23,459 | 6,520 | 14,985 | 29,979 | 44,964 | (7,532 | ) | 37,432 | 17,897 | ||||||||||||||||||
173 E. 90th Street | High Rise | May 2004 | New York, NY | 1910 | 72 | 12,066 | 4,535 | 7,725 | 12,066 | 12,260 | 24,326 | (2,893 | ) | 21,433 | 6,783 | ||||||||||||||||||
182-188 Columbus Avenue | Mid Rise | Feb 2007 | New York, NY | 1910 | 32 | 19,123 | 3,300 | 5,282 | 19,123 | 8,582 | 27,705 | (3,371 | ) | 24,334 | 14,204 | ||||||||||||||||||
1045 on the Park Apartments Homes | Mid Rise | Jul 2013 | Atlanta, GA | 2012 | 30 | 2,793 | 6,662 | 600 | 2,793 | 7,262 | 10,055 | (1,116 | ) | 8,939 | 5,750 | ||||||||||||||||||
1582 First Avenue | High Rise | Mar 2005 | New York, NY | 1900 | 17 | 4,281 | 752 | 508 | 4,281 | 1,260 | 5,541 | (506 | ) | 5,035 | 2,319 | ||||||||||||||||||
21 Fitzsimons | Mid-Rise | Aug 2014 | Aurora, CO | 2008 | 600 | 12,864 | 104,720 | 16,930 | 12,864 | 121,650 | 134,514 | (13,639 | ) | 120,875 | 47,097 | ||||||||||||||||||
234 East 88th Street | Mid-Rise | Jan 2014 | New York, NY | 1900 | 20 | 2,448 | 4,449 | 755 | 2,448 | 5,204 | 7,652 | (875 | ) | 6,777 | 3,296 | ||||||||||||||||||
236-238 East 88th Street | High Rise | Jan 2004 | New York, NY | 1900 | 43 | 8,820 | 2,914 | 2,051 | 8,820 | 4,965 | 13,785 | (1,835 | ) | 11,950 | 11,122 | ||||||||||||||||||
237-239 Ninth Avenue | High Rise | Mar 2005 | New York, NY | 1900 | 36 | 8,495 | 1,866 | 3,235 | 8,495 | 5,101 | 13,596 | (2,428 | ) | 11,168 | 5,664 | ||||||||||||||||||
240 West 73rd Street, LLC | High Rise | Sep 2004 | New York, NY | 1900 | 200 | 68,109 | 12,140 | 11,586 | 68,109 | 23,726 | 91,835 | (9,215 | ) | 82,620 | — | ||||||||||||||||||
2900 on First Apartments | Mid Rise | Oct 2008 | Seattle, WA | 1989 | 135 | 19,070 | 17,518 | 33,024 | 19,070 | 50,542 | 69,612 | (21,502 | ) | 48,110 | 14,218 | ||||||||||||||||||
306 East 89th Street | High Rise | Jul 2004 | New York, NY | 1930 | 20 | 2,680 | 1,006 | 1,088 | 2,680 | 2,094 | 4,774 | (734 | ) | 4,040 | 1,891 | ||||||||||||||||||
311 & 313 East 73rd Street | Mid Rise | Mar 2003 | New York, NY | 1904 | 34 | 5,678 | 1,609 | 417 | 5,678 | 2,026 | 7,704 | (1,365 | ) | 6,339 | 3,993 | ||||||||||||||||||
322-324 East 61st Street | High Rise | Mar 2005 | New York, NY | 1900 | 40 | 6,372 | 2,224 | 1,476 | 6,372 | 3,700 | 10,072 | (1,618 | ) | 8,454 | 3,478 | ||||||||||||||||||
3400 Avenue of the Arts | Mid Rise | Mar 2002 | Costa Mesa, CA | 1987 | 770 | 57,241 | 65,506 | 79,189 | 57,241 | 144,695 | 201,936 | (84,070 | ) | 117,866 | 148,926 | ||||||||||||||||||
452 East 78th Street | High Rise | Jan 2004 | New York, NY | 1900 | 12 | 1,982 | 608 | 539 | 1,982 | 1,147 | 3,129 | (443 | ) | 2,686 | 2,600 | ||||||||||||||||||
464-466 Amsterdam & 200-210 W. 83rd Street | Mid Rise | Feb 2007 | New York, NY | 1910 | 71 | 25,553 | 7,101 | 5,641 | 25,553 | 12,742 | 38,295 | (5,569 | ) | 32,726 | 20,933 | ||||||||||||||||||
510 East 88th Street | High Rise | Jan 2004 | New York, NY | 1900 | 20 | 3,163 | 1,002 | 599 | 3,163 | 1,601 | 4,764 | (567 | ) | 4,197 | 2,785 | ||||||||||||||||||
514-516 East 88th Street | High Rise | Mar 2005 | New York, NY | 1900 | 36 | 6,282 | 2,168 | 1,319 | 6,282 | 3,487 | 9,769 | (1,460 | ) | 8,309 | 3,770 | ||||||||||||||||||
518 East 88th Street | Mid-Rise | Jan 2014 | New York, NY | 1900 | 20 | 2,233 | 4,315 | 572 | 2,233 | 4,887 | 7,120 | (868 | ) | 6,252 | 2,855 | ||||||||||||||||||
707 Leahy | Garden | Apr 2007 | Redwood City, CA | 1973 | 110 | 15,444 | 7,909 | 6,581 | 15,444 | 14,490 | 29,934 | (6,901 | ) | 23,033 | 8,930 | ||||||||||||||||||
865 Bellevue | Garden | Jul 2000 | Nashville, TN | 1972 | 326 | 3,562 | 12,037 | 22,966 | 3,562 | 35,003 | 38,565 | (21,942 | ) | 16,623 | 16,828 | ||||||||||||||||||
All Hallows | Garden | Jan 2006 | San Francisco, CA | 1976 | 157 | 1,338 | 29,770 | 21,530 | 1,338 | 51,300 | 52,638 | (32,886 | ) | 19,752 | 21,512 | ||||||||||||||||||
Axiom Apartment Homes | Mid Rise | Apr 2015 | Cambridge, MA | 2015 | 115 | — | 63,612 | 2,006 | — | 65,618 | 65,618 | (6,386 | ) | 59,232 | 33,677 | ||||||||||||||||||
Bank Lofts | High Rise | Apr 2001 | Denver, CO | 1920 | 125 | 3,525 | 9,045 | 4,425 | 3,525 | 13,470 | 16,995 | (6,845 | ) | 10,150 | 10,722 | ||||||||||||||||||
Bay Parc | High Rise | Sep 2004 | Miami, FL | 2000 | 474 | 22,680 | 41,847 | 27,069 | 22,680 | 68,916 | 91,596 | (18,431 | ) | 73,165 | 43,045 | ||||||||||||||||||
Bay Ridge at Nashua | Garden | Jan 2003 | Nashua, NH | 1984 | 412 | 3,262 | 40,713 | 15,881 | 3,262 | 56,594 | 59,856 | (22,065 | ) | 37,791 | — | ||||||||||||||||||
Bayberry Hill Estates | Garden | Aug 2002 | Framingham, MA | 1971 | 424 | 19,944 | 35,945 | 17,864 | 19,944 | 53,809 | 73,753 | (24,945 | ) | 48,808 | 30,710 | ||||||||||||||||||
Bayview | Garden | Jun 2005 | San Francisco, CA | 1976 | 146 | 582 | 15,265 | 18,447 | 582 | 33,712 | 34,294 | (23,433 | ) | 10,861 | 11,133 | ||||||||||||||||||
Bluffs at Pacifica, The | Garden | Oct 2006 | Pacifica, CA | 1963 | 64 | 8,108 | 4,132 | 19,367 | 8,108 | 23,499 | 31,607 | (11,739 | ) | 19,868 | — | ||||||||||||||||||
Boston Lofts | High Rise | Apr 2001 | Denver, CO | 1890-01-01 | 158 | 3,446 | 20,589 | 5,257 | 3,446 | 25,846 | 29,292 | (13,192 | ) | 16,100 | 15,663 | ||||||||||||||||||
Boulder Creek | Garden | Jul 1994 | Boulder, CO | 1973 | 221 | 754 | 7,730 | 20,443 | 754 | 28,173 | 28,927 | (18,728 | ) | 10,199 | 4,289 | ||||||||||||||||||
Broadcast Center | Garden | Mar 2002 | Los Angeles, CA | 1990 | 279 | 29,407 | 41,244 | 20,096 | 29,407 | 61,340 | 90,747 | (28,704 | ) | 62,043 | 55,920 | ||||||||||||||||||
Broadway Lofts | High Rise | Sep 2012 | San Diego, CA | 1909 | 84 | 5,367 | 14,442 | 3,531 | 5,367 | 17,973 | 23,340 | (3,516 | ) | 19,824 | 11,755 | ||||||||||||||||||
Burke Shire Commons | Garden | Mar 2001 | Burke, VA | 1986 | 360 | 4,867 | 23,617 | 16,505 | 4,867 | 40,122 | 44,989 | (22,116 | ) | 22,873 | 38,703 | ||||||||||||||||||
Calhoun Beach Club | High Rise | Dec 1998 | Minneapolis, MN | 1928 | 332 | 11,708 | 73,334 | 65,235 | 11,708 | 138,569 | 150,277 | (75,654 | ) | 74,623 | 43,292 | ||||||||||||||||||
Canyon Terrace | Garden | Mar 2002 | Saugus, CA | 1984 | 130 | 7,508 | 6,601 | 5,453 | 7,508 | 12,054 | 19,562 | (7,037 | ) | 12,525 | 9,285 | ||||||||||||||||||
Cedar Rim | Garden | Apr 2000 | Newcastle, WA | 1980 | 104 | 761 | 5,218 | 11,587 | 761 | 16,805 | 17,566 | (13,464 | ) | 4,102 | 6,979 | ||||||||||||||||||
Charlesbank Apartment Homes | Mid Rise | Sep 2013 | Watertown, MA | 2012 | 44 | 3,399 | 11,726 | 702 | 3,399 | 12,428 | 15,827 | (1,897 | ) | 13,930 | 7,890 | ||||||||||||||||||
Chestnut Hall | High Rise | Oct 2006 | Philadelphia, PA | 1923 | 315 | 12,338 | 14,299 | 9,990 | 12,338 | 24,289 | 36,627 | (11,182 | ) | 25,445 | 37,443 | ||||||||||||||||||
F-42
(2) | |||||||||||||||||||||||||||||||||
(1) | Initial Cost | Cost Capitalized | December 31, 2017 | ||||||||||||||||||||||||||||||
Apartment | Date | Year | Apartment | Buildings and | Subsequent to | Buildings and | (3) | Accumulated | Total Cost | (4) | |||||||||||||||||||||||
Apartment Community Name | Type | Consolidated | Location | Built | Homes | Land | Improvements | Consolidation | Land | Improvements | Total | Depreciation (AD) | Net of AD | Encumbrances | |||||||||||||||||||
Chestnut Hill Village | Garden | Apr 2000 | Philadelphia, PA | 1963 | 821 | 6,469 | 49,316 | 42,678 | 6,469 | 91,994 | 98,463 | (56,047 | ) | 42,416 | 73,566 | ||||||||||||||||||
Chimneys of Cradle Rock | Garden | Jun 2004 | Columbia, MD | 1979 | 198 | 2,040 | 8,108 | 1,005 | 2,040 | 9,113 | 11,153 | (3,814 | ) | 7,339 | 15,021 | ||||||||||||||||||
Columbus Avenue | Mid Rise | Sep 2003 | New York, NY | 1880-01-01 | 59 | 35,527 | 9,450 | 8,604 | 35,527 | 18,054 | 53,581 | (9,266 | ) | 44,315 | 25,778 | ||||||||||||||||||
Creekside | Garden | Jan 2000 | Denver, CO | 1974 | 328 | 3,189 | 12,698 | 6,879 | 3,189 | 19,577 | 22,766 | (12,738 | ) | 10,028 | 11,570 | ||||||||||||||||||
Crescent at West Hollywood, The | Mid Rise | Mar 2002 | West Hollywood, CA | 1985 | 130 | 15,765 | 10,215 | 9,096 | 15,765 | 19,311 | 35,076 | (12,693 | ) | 22,383 | — | ||||||||||||||||||
Elm Creek | Mid Rise | Dec 1997 | Elmhurst, IL | 1987 | 400 | 8,987 | 30,878 | 31,161 | 8,987 | 62,039 | 71,026 | (30,121 | ) | 40,905 | 52,349 | ||||||||||||||||||
Evanston Place | High Rise | Dec 1997 | Evanston, IL | 1990 | 190 | 3,232 | 25,546 | 13,094 | 3,232 | 38,640 | 41,872 | (17,535 | ) | 24,337 | — | ||||||||||||||||||
Farmingdale | Mid Rise | Oct 2000 | Darien, IL | 1975 | 240 | 11,763 | 15,174 | 9,514 | 11,763 | 24,688 | 36,451 | (12,231 | ) | 24,220 | 13,774 | ||||||||||||||||||
Flamingo Towers | High Rise | Sep 1997 | Miami Beach, FL | 1960 | 1,305 | 32,427 | 48,808 | 317,464 | 32,427 | 366,272 | 398,699 | (160,620 | ) | 238,079 | 105,371 | ||||||||||||||||||
Four Quarters Habitat | Garden | Jan 2006 | Miami, FL | 1976 | 336 | 2,379 | 17,199 | 27,711 | 2,379 | 44,910 | 47,289 | (24,508 | ) | 22,781 | 4,624 | ||||||||||||||||||
Foxchase | Garden | Dec 1997 | Alexandria, VA | 1940 | 2,113 | 15,496 | 96,062 | 43,269 | 15,496 | 139,331 | 154,827 | (79,714 | ) | 75,113 | 228,636 | ||||||||||||||||||
Georgetown | Garden | Aug 2002 | Framingham, MA | 1964 | 207 | 12,351 | 13,168 | 3,280 | 12,351 | 16,448 | 28,799 | (7,575 | ) | 21,224 | — | ||||||||||||||||||
Georgetown II | Mid Rise | Aug 2002 | Framingham, MA | 1958 | 72 | 4,577 | 4,057 | 1,642 | 4,577 | 5,699 | 10,276 | (3,128 | ) | 7,148 | — | ||||||||||||||||||
Heritage Park Escondido | Garden | Oct 2000 | Escondido, CA | 1986 | 196 | 1,055 | 7,565 | 2,284 | 1,055 | 9,849 | 10,904 | (6,589 | ) | 4,315 | 6,377 | ||||||||||||||||||
Heritage Park Livermore | Garden | Oct 2000 | Livermore, CA | 1988 | 167 | — | 10,209 | 1,889 | — | 12,098 | 12,098 | (7,854 | ) | 4,244 | 6,603 | ||||||||||||||||||
Heritage Village Anaheim | Garden | Oct 2000 | Anaheim, CA | 1986 | 196 | 1,832 | 8,541 | 1,985 | 1,832 | 10,526 | 12,358 | (6,665 | ) | 5,693 | 7,741 | ||||||||||||||||||
Hidden Cove | Garden | Jul 1998 | Escondido, CA | 1983 | 334 | 3,043 | 17,616 | 10,386 | 3,043 | 28,002 | 31,045 | (15,425 | ) | 15,620 | 33,765 | ||||||||||||||||||
Hidden Cove II | Garden | Jul 2007 | Escondido, CA | 1986 | 118 | 12,849 | 6,530 | 5,093 | 12,849 | 11,623 | 24,472 | (5,362 | ) | 19,110 | 13,684 | ||||||||||||||||||
Hillcreste | Garden | Mar 2002 | Century City, CA | 1989 | 315 | 35,862 | 47,216 | 12,220 | 35,862 | 59,436 | 95,298 | (26,131 | ) | 69,167 | 64,958 | ||||||||||||||||||
Hillmeade | Garden | Nov 1994 | Nashville, TN | 1986 | 288 | 2,872 | 16,070 | 19,270 | 2,872 | 35,340 | 38,212 | (19,327 | ) | 18,885 | 27,866 | ||||||||||||||||||
Horizons West Apartments | Mid Rise | Dec 2006 | Pacifica, CA | 1970 | 78 | 8,887 | 6,377 | 2,298 | 8,887 | 8,675 | 17,562 | (4,167 | ) | 13,395 | 14,046 | ||||||||||||||||||
Hunt Club | Garden | Sep 2000 | Gaithersburg, MD | 1986 | 336 | 17,859 | 13,149 | 13,136 | 17,859 | 26,285 | 44,144 | (14,636 | ) | 29,508 | — | ||||||||||||||||||
Hyde Park Tower | High Rise | Oct 2004 | Chicago, IL | 1990 | 155 | 4,731 | 14,927 | 11,493 | 4,731 | 26,420 | 31,151 | (7,939 | ) | 23,212 | 12,926 | ||||||||||||||||||
Indian Oaks | Garden | Mar 2002 | Simi Valley, CA | 1986 | 254 | 24,523 | 15,801 | 8,551 | 24,523 | 24,352 | 48,875 | (11,896 | ) | 36,979 | 28,163 | ||||||||||||||||||
Indigo | High Rise | Aug 2016 | Redwood City, CA | 2016 | 463 | 26,932 | 296,116 | 878 | 26,932 | 296,994 | 323,926 | (14,249 | ) | 309,677 | 141,411 | ||||||||||||||||||
Island Club | Garden | Oct 2000 | Oceanside, CA | 1986 | 592 | 18,027 | 28,654 | 15,611 | 18,027 | 44,265 | 62,292 | (28,228 | ) | 34,064 | 56,392 | ||||||||||||||||||
Key Towers | High Rise | Apr 2001 | Alexandria, VA | 1964 | 140 | 1,526 | 7,050 | 7,355 | 1,526 | 14,405 | 15,931 | (11,077 | ) | 4,854 | — | ||||||||||||||||||
Lakeside | Garden | Oct 1999 | Lisle, IL | 1972 | 568 | 5,840 | 27,937 | 22,369 | 5,840 | 50,306 | 56,146 | (32,466 | ) | 23,680 | 25,709 | ||||||||||||||||||
La Salle | Garden | Oct 2000 | San Francisco, CA | 1976 | 145 | 1,866 | 19,567 | 19,145 | 1,866 | 38,712 | 40,578 | (28,312 | ) | 12,266 | 17,052 | ||||||||||||||||||
Latrobe | High Rise | Jan 2003 | Washington, DC | 1980 | 175 | 3,459 | 9,103 | 13,498 | 3,459 | 22,601 | 26,060 | (12,042 | ) | 14,018 | 27,356 | ||||||||||||||||||
Laurel Crossing | Garden | Jan 2006 | San Mateo, CA | 1971 | 418 | 49,474 | 17,756 | 14,730 | 49,474 | 32,486 | 81,960 | (16,074 | ) | 65,886 | 72,788 | ||||||||||||||||||
Lincoln Place (5) | Garden | Oct 2004 | Venice, CA | 1951 | 795 | 128,332 | 10,439 | 334,559 | 44,197 | 344,998 | 389,195 | (95,770 | ) | 293,425 | 191,039 | ||||||||||||||||||
Lodge at Chattahoochee, The | Garden | Oct 1999 | Sandy Springs, GA | 1970 | 312 | 2,335 | 16,370 | 16,477 | 2,335 | 32,847 | 35,182 | (21,310 | ) | 13,872 | 19,775 | ||||||||||||||||||
Malibu Canyon | Garden | Mar 2002 | Calabasas, CA | 1986 | 698 | 69,834 | 53,438 | 32,597 | 69,834 | 86,035 | 155,869 | (41,216 | ) | 114,653 | 107,643 | ||||||||||||||||||
Maple Bay | Garden | Dec 1999 | Virginia Beach, VA | 1971 | 414 | 2,597 | 16,141 | 18,032 | 2,597 | 34,173 | 36,770 | (22,497 | ) | 14,273 | — | ||||||||||||||||||
Mariner's Cove | Garden | Mar 2002 | San Diego, CA | 1984 | 500 | — | 66,861 | 9,980 | — | 76,841 | 76,841 | (36,154 | ) | 40,687 | — | ||||||||||||||||||
Meadow Creek | Garden | Jul 1994 | Boulder, CO | 1968 | 332 | 1,435 | 24,533 | 8,739 | 1,435 | 33,272 | 34,707 | (17,699 | ) | 17,008 | 41,229 | ||||||||||||||||||
Merrill House | High Rise | Jan 2000 | Falls Church, VA | 1964 | 159 | 1,836 | 10,831 | 8,031 | 1,836 | 18,862 | 20,698 | (10,460 | ) | 10,238 | — | ||||||||||||||||||
Mezzo | High Rise | Mar 2015 | Atlanta, GA | 2008 | 94 | 4,292 | 34,178 | 1,039 | 4,292 | 35,217 | 39,509 | (4,115 | ) | 35,394 | 24,002 | ||||||||||||||||||
Monterey Grove | Garden | Jun 2008 | San Jose, CA | 1999 | 224 | 34,325 | 21,939 | 7,585 | 34,325 | 29,524 | 63,849 | (11,678 | ) | 52,171 | — | ||||||||||||||||||
Ocean House on Prospect | Mid Rise | Apr 2013 | La Jolla, CA | 1970 | 53 | 12,528 | 18,805 | 14,936 | 12,528 | 33,741 | 46,269 | (4,584 | ) | 41,685 | 13,191 | ||||||||||||||||||
One Canal | High Rise | Sep 2013 | Boston, MA | 2016 | 310 | — | 15,873 | 178,996 | — | 194,869 | 194,869 | (12,378 | ) | 182,491 | 112,037 | ||||||||||||||||||
Pacific Bay Vistas (5) | Garden | Mar 2001 | San Bruno, CA | 1987 | 308 | 28,694 | 62,460 | 37,025 | 23,354 | 99,485 | 122,839 | (28,511 | ) | 94,328 | 68,704 | ||||||||||||||||||
Pacifica Park | Garden | Jul 2006 | Pacifica, CA | 1977 | 104 | 12,970 | 6,579 | 7,766 | 12,970 | 14,345 | 27,315 | (5,667 | ) | 21,648 | 11,195 | ||||||||||||||||||
Palazzo at Park La Brea, The | Mid Rise | Feb 2004 | Los Angeles, CA | 2002 | 521 | 48,362 | 125,464 | 40,851 | 48,362 | 166,315 | 214,677 | (72,351 | ) | 142,326 | 170,000 | ||||||||||||||||||
Palazzo East at Park La Brea, The | Mid Rise | Mar 2005 | Los Angeles, CA | 2005 | 611 | 72,578 | 136,503 | 16,160 | 72,578 | 152,663 | 225,241 | (66,415 | ) | 158,826 | 111,494 | ||||||||||||||||||
Parc Mosaic | Garden | Dec 2014 | Boulder, CO | 1970 | 140 | 15,300 | — | 11,748 | 15,300 | 11,748 | 27,048 | — | 27,048 | — | |||||||||||||||||||
Park Towne Place | High Rise | Apr 2000 | Philadelphia, PA | 1959 | 942 | 10,472 | 47,301 | 303,898 | 10,472 | 351,199 | 361,671 | (91,256 | ) | 270,415 | — | ||||||||||||||||||
F-43
(2) | |||||||||||||||||||||||||||||||||
(1) | Initial Cost | Cost Capitalized | December 31, 2017 | ||||||||||||||||||||||||||||||
Apartment | Date | Year | Apartment | Buildings and | Subsequent to | Buildings and | (3) | Accumulated | Total Cost | (4) | |||||||||||||||||||||||
Apartment Community Name | Type | Consolidated | Location | Built | Homes | Land | Improvements | Consolidation | Land | Improvements | Total | Depreciation (AD) | Net of AD | Encumbrances | |||||||||||||||||||
Pathfinder Village | Garden | Jan 2006 | Fremont, CA | 1973 | 246 | 19,595 | 14,838 | 14,497 | 19,595 | 29,335 | 48,930 | (12,384 | ) | 36,546 | 38,136 | ||||||||||||||||||
Peachtree Park | Garden | Jan 1996 | Atlanta, GA | 1969 | 303 | 4,684 | 11,713 | 13,347 | 4,684 | 25,060 | 29,744 | (15,621 | ) | 14,123 | 1,337 | ||||||||||||||||||
Plantation Gardens | Garden | Oct 1999 | Plantation, FL | 1971 | 372 | 3,773 | 19,443 | 24,563 | 3,773 | 44,006 | 47,779 | (25,406 | ) | 22,373 | — | ||||||||||||||||||
Post Ridge | Garden | Jul 2000 | Nashville, TN | 1972 | 150 | 1,883 | 6,712 | 5,120 | 1,883 | 11,832 | 13,715 | (7,856 | ) | 5,859 | 5,218 | ||||||||||||||||||
Preserve at Marin | Mid Rise | Aug 2011 | Corte Madera, CA | 1964 | 126 | 18,179 | 30,132 | 83,631 | 18,179 | 113,763 | 131,942 | (19,787 | ) | 112,155 | 37,034 | ||||||||||||||||||
Ravensworth Towers | High Rise | Jun 2004 | Annandale, VA | 1974 | 219 | 3,455 | 17,157 | 3,639 | 3,455 | 20,796 | 24,251 | (13,849 | ) | 10,402 | 20,789 | ||||||||||||||||||
River Club,The | Garden | Apr 2005 | Edgewater, NJ | 1998 | 266 | 30,579 | 30,638 | 6,689 | 30,579 | 37,327 | 67,906 | (15,673 | ) | 52,233 | — | ||||||||||||||||||
Riverloft | High Rise | Oct 1999 | Philadelphia, PA | 1910 | 184 | 2,120 | 11,286 | 30,432 | 2,120 | 41,718 | 43,838 | (21,471 | ) | 22,367 | 9,378 | ||||||||||||||||||
Rosewood | Garden | Mar 2002 | Camarillo, CA | 1976 | 152 | 12,430 | 8,060 | 4,081 | 12,430 | 12,141 | 24,571 | (6,385 | ) | 18,186 | 16,095 | ||||||||||||||||||
Royal Crest Estates | Garden | Aug 2002 | Warwick, RI | 1972 | 492 | 22,433 | 24,095 | 4,309 | 22,433 | 28,404 | 50,837 | (18,569 | ) | 32,268 | — | ||||||||||||||||||
Royal Crest Estates | Garden | Aug 2002 | Nashua, NH | 1970 | 902 | 68,230 | 45,562 | 13,521 | 68,230 | 59,083 | 127,313 | (38,506 | ) | 88,807 | — | ||||||||||||||||||
Royal Crest Estates | Garden | Aug 2002 | Marlborough, MA | 1970 | 473 | 25,178 | 28,786 | 11,388 | 25,178 | 40,174 | 65,352 | (24,315 | ) | 41,037 | 30,841 | ||||||||||||||||||
Royal Crest Estates | Garden | Aug 2002 | North Andover, MA | 1970 | 588 | 51,292 | 36,808 | 24,271 | 51,292 | 61,079 | 112,371 | (32,966 | ) | 79,405 | 42,110 | ||||||||||||||||||
Savannah Trace | Garden | Mar 2001 | Shaumburg, IL | 1986 | 368 | 13,960 | 20,731 | 11,147 | 13,960 | 31,878 | 45,838 | (15,939 | ) | 29,899 | 23,202 | ||||||||||||||||||
Saybrook Pointe | Garden | Dec 2014 | San Jose, CA | 1995 | 324 | 32,842 | 84,457 | 19,633 | 32,842 | 104,090 | 136,932 | (9,681 | ) | 127,251 | 63,540 | ||||||||||||||||||
Shoreview | Garden | Oct 1999 | San Francisco, CA | 1976 | 156 | 1,476 | 19,071 | 20,752 | 1,476 | 39,823 | 41,299 | (30,085 | ) | 11,214 | 18,461 | ||||||||||||||||||
Shenandoah Crossing | Garden | Sep 2000 | Fairfax, VA | 1984 | 640 | 18,200 | 57,198 | 24,350 | 18,200 | 81,548 | 99,748 | (53,306 | ) | 46,442 | 59,748 | ||||||||||||||||||
Springwoods at Lake Ridge | Garden | Jul 2002 | Woodbridge, VA | 1984 | 180 | 5,587 | 7,284 | 3,069 | 5,587 | 10,353 | 15,940 | (4,160 | ) | 11,780 | — | ||||||||||||||||||
St. George Villas | Garden | Jan 2006 | St. George, SC | 1984 | 40 | 107 | 1,025 | 400 | 107 | 1,425 | 1,532 | (1,218 | ) | 314 | 336 | ||||||||||||||||||
Sterling Apartment Homes, The | Garden | Oct 1999 | Philadelphia, PA | 1961 | 534 | 8,871 | 55,365 | 117,562 | 8,871 | 172,927 | 181,798 | (70,455 | ) | 111,343 | 146,650 | ||||||||||||||||||
Stone Creek Club | Garden | Sep 2000 | Germantown, MD | 1984 | 240 | 13,593 | 9,347 | 7,230 | 13,593 | 16,577 | 30,170 | (11,902 | ) | 18,268 | — | ||||||||||||||||||
Timbers at Long Reach Apartment Homes | Garden | Apr 2005 | Columbia, MD | 1979 | 178 | 2,430 | 12,181 | 1,283 | 2,430 | 13,464 | 15,894 | (7,340 | ) | 8,554 | 12,405 | ||||||||||||||||||
Towers Of Westchester Park, The | High Rise | Jan 2006 | College Park, MD | 1972 | 303 | 15,198 | 22,029 | 12,858 | 15,198 | 34,887 | 50,085 | (16,965 | ) | 33,120 | 23,836 | ||||||||||||||||||
Township At Highlands | Town Home | Nov 1996 | Centennial, CO | 1985 | 161 | 1,536 | 9,773 | 8,471 | 1,536 | 18,244 | 19,780 | (11,272 | ) | 8,508 | 13,965 | ||||||||||||||||||
Tremont | Mid Rise | Dec 2014 | Atlanta, GA | 2009 | 78 | 5,274 | 18,011 | 2,335 | 5,274 | 20,346 | 25,620 | (2,258 | ) | 23,362 | — | ||||||||||||||||||
Twin Lake Towers | High Rise | Oct 1999 | Westmont, IL | 1969 | 399 | 3,268 | 18,763 | 36,186 | 3,268 | 54,949 | 58,217 | (40,894 | ) | 17,323 | 29,851 | ||||||||||||||||||
Vantage Pointe | Mid Rise | Aug 2002 | Swampscott, MA | 1987 | 96 | 4,748 | 10,089 | 1,663 | 4,748 | 11,752 | 16,500 | (4,853 | ) | 11,647 | 3,385 | ||||||||||||||||||
Villa Del Sol | Garden | Mar 2002 | Norwalk, CA | 1972 | 120 | 7,476 | 4,861 | 4,040 | 7,476 | 8,901 | 16,377 | (4,628 | ) | 11,749 | 10,813 | ||||||||||||||||||
Villas at Park La Brea, The | Garden | Mar 2002 | Los Angeles, CA | 2002 | 250 | 8,630 | 48,871 | 7,116 | 8,630 | 55,987 | 64,617 | (27,703 | ) | 36,914 | 14,477 | ||||||||||||||||||
Villas of Pasadena | Mid Rise | Jan 2006 | Pasadena, CA | 1973 | 92 | 9,693 | 6,818 | 3,963 | 9,693 | 10,781 | 20,474 | (3,740 | ) | 16,734 | 9,299 | ||||||||||||||||||
Vivo | High Rise | Jun 2015 | Cambridge, MA | 2015 | 91 | 6,450 | 35,974 | 5,089 | 6,450 | 41,063 | 47,513 | (5,853 | ) | 41,660 | 20,796 | ||||||||||||||||||
Waterford Village | Garden | Aug 2002 | Bridgewater, MA | 1971 | 588 | 29,110 | 28,101 | 5,644 | 29,110 | 33,745 | 62,855 | (24,149 | ) | 38,706 | 36,024 | ||||||||||||||||||
Waterways Village | Garden | Jun 1997 | Aventura, FL | 1994 | 180 | 4,504 | 11,064 | 13,340 | 4,504 | 24,404 | 28,908 | (10,804 | ) | 18,104 | 13,456 | ||||||||||||||||||
Waverly Apartments | Garden | Aug 2008 | Brighton, MA | 1970 | 103 | 7,920 | 11,347 | 5,912 | 7,920 | 17,259 | 25,179 | (5,740 | ) | 19,439 | 11,770 | ||||||||||||||||||
Wexford Village | Garden | Aug 2002 | Worcester, MA | 1974 | 264 | 6,349 | 17,939 | 2,595 | 6,349 | 20,534 | 26,883 | (11,885 | ) | 14,998 | — | ||||||||||||||||||
Willow Bend | Garden | May 1998 | Rolling Meadows, IL | 1969 | 328 | 2,717 | 15,437 | 22,524 | 2,717 | 37,961 | 40,678 | (26,029 | ) | 14,649 | 33,838 | ||||||||||||||||||
Windrift | Garden | Mar 2001 | Oceanside, CA | 1987 | 404 | 24,960 | 17,590 | 19,948 | 24,960 | 37,538 | 62,498 | (21,906 | ) | 40,592 | 39,408 | ||||||||||||||||||
Windsor Park | Garden | Mar 2001 | Woodbridge, VA | 1987 | 220 | 4,279 | 15,970 | 5,686 | 4,279 | 21,656 | 25,935 | (12,356 | ) | 13,579 | 17,338 | ||||||||||||||||||
Yacht Club at Brickell | High Rise | Dec 2003 | Miami, FL | 1998 | 357 | 31,362 | 32,214 | 13,762 | 31,362 | 45,976 | 77,338 | (15,954 | ) | 61,384 | 45,303 | ||||||||||||||||||
Yorktown Apartments | High Rise | Dec 1999 | Lombard, IL | 1971 | 364 | 3,055 | 18,162 | 50,494 | 3,055 | 68,656 | 71,711 | (23,943 | ) | 47,768 | 29,010 | ||||||||||||||||||
Other (6) | — | 75,903 | 10,474 | 7,948 | 40,022 | 18,422 | 58,444 | (6,675 | ) | 51,769 | — | ||||||||||||||||||||||
Total Real Estate Segment | 36,249 | 1,878,960 | 3,249,698 | 2,924,451 | 1,753,604 | 6,174,149 | 7,927,753 | (2,522,358 | ) | 5,405,395 | 3,563,041 | ||||||||||||||||||||||
Asset Management Business: | |||||||||||||||||||||||||||||||||
Arvada House | High Rise | Nov 2004 | Arvada, CO | 1977 | 88 | 405 | 3,314 | 2,475 | 405 | 5,789 | 6,194 | (3,174 | ) | 3,020 | 3,806 | ||||||||||||||||||
Beacon Hill | High Rise | Mar 2002 | Hillsdale, MI | 1980 | 198 | 1,094 | 7,044 | 6,271 | 1,094 | 13,315 | 14,409 | (7,607 | ) | 6,802 | 6,512 | ||||||||||||||||||
Biltmore Towers | High Rise | Mar 2002 | Dayton, OH | 1980 | 230 | 1,814 | 6,411 | 13,688 | 1,814 | 20,099 | 21,913 | (14,027 | ) | 7,886 | 9,863 | ||||||||||||||||||
Butternut Creek | Mid Rise | Jan 2006 | Charlotte, MI | 1980 | 100 | 505 | 3,617 | 4,163 | 505 | 7,780 | 8,285 | (6,461 | ) | 1,824 | 4,042 | ||||||||||||||||||
F-44
(2) | |||||||||||||||||||||||||||||||||
(1) | Initial Cost | Cost Capitalized | December 31, 2017 | ||||||||||||||||||||||||||||||
Apartment | Date | Year | Apartment | Buildings and | Subsequent to | Buildings and | (3) | Accumulated | Total Cost | (4) | |||||||||||||||||||||||
Apartment Community Name | Type | Consolidated | Location | Built | Homes | Land | Improvements | Consolidation | Land | Improvements | Total | Depreciation (AD) | Net of AD | Encumbrances | |||||||||||||||||||
Carriage House | Mid Rise | Dec 2006 | Petersburg, VA | 1885-01-01 | 118 | 716 | 2,886 | 4,173 | 716 | 7,059 | 7,775 | (4,390 | ) | 3,385 | 1,767 | ||||||||||||||||||
Copperwood Apartments I | Garden | Apr 2006 | The Woodlands, TX | 1980 | 150 | 383 | 8,373 | 6,182 | 383 | 14,555 | 14,938 | (12,789 | ) | 2,149 | 4,969 | ||||||||||||||||||
Copperwood Apartments II | Garden | Oct 2005 | The Woodlands, TX | 1981 | 150 | 459 | 5,553 | 3,890 | 459 | 9,443 | 9,902 | (6,160 | ) | 3,742 | 5,126 | ||||||||||||||||||
Country Club Heights | Garden | Mar 2004 | Quincy, IL | 1976 | 200 | 676 | 5,715 | 5,444 | 676 | 11,159 | 11,835 | (6,957 | ) | 4,878 | 5,252 | ||||||||||||||||||
Crevenna Oaks | Town Home | Jan 2006 | Burke, VA | 1979 | 50 | — | 5,203 | 616 | — | 5,819 | 5,819 | (3,686 | ) | 2,133 | 2,136 | ||||||||||||||||||
Fountain Place | Mid Rise | Jan 2006 | Connersville, IN | 1980 | 102 | 378 | 2,091 | 3,427 | 378 | 5,518 | 5,896 | (2,725 | ) | 3,171 | 816 | ||||||||||||||||||
Hopkins Village | Mid Rise | Sep 2003 | Baltimore, MD | 1979 | 165 | 549 | 5,973 | 3,527 | 549 | 9,500 | 10,049 | (4,799 | ) | 5,250 | 9,100 | ||||||||||||||||||
Ingram Square | Garden | Jan 2006 | San Antonio, TX | 1980 | 120 | 800 | 3,136 | 6,057 | 800 | 9,193 | 9,993 | (6,468 | ) | 3,525 | 2,980 | ||||||||||||||||||
Kirkwood House | High Rise | Sep 2004 | Baltimore, MD | 1979 | 261 | 1,337 | 9,358 | 9,572 | 1,337 | 18,930 | 20,267 | (10,453 | ) | 9,814 | 16,000 | ||||||||||||||||||
La Vista | Garden | Jan 2006 | Concord, CA | 1981 | 75 | 581 | 4,449 | 4,835 | 581 | 9,284 | 9,865 | (4,793 | ) | 5,072 | 4,723 | ||||||||||||||||||
Loring Towers | High Rise | Oct 2002 | Minneapolis, MN | 1975 | 230 | 886 | 7,445 | 9,213 | 886 | 16,658 | 17,544 | (9,269 | ) | 8,275 | 9,225 | ||||||||||||||||||
Loring Towers Apartments | High Rise | Sep 2003 | Salem, MA | 1973 | 250 | 187 | 14,050 | 8,738 | 187 | 22,788 | 22,975 | (12,437 | ) | 10,538 | 9,622 | ||||||||||||||||||
New Baltimore | Mid Rise | Mar 2002 | New Baltimore, MI | 1980 | 101 | 896 | 2,360 | 5,404 | 896 | 7,764 | 8,660 | (4,999 | ) | 3,661 | 1,887 | ||||||||||||||||||
Northpoint | Garden | Jan 2000 | Chicago, IL | 1921 | 304 | 2,510 | 14,334 | 16,358 | 2,510 | 30,692 | 33,202 | (23,479 | ) | 9,723 | 17,170 | ||||||||||||||||||
Panorama Park | Garden | Mar 2002 | Bakersfield, CA | 1982 | 66 | 521 | 5,520 | 1,324 | 521 | 6,844 | 7,365 | (4,299 | ) | 3,066 | 1,558 | ||||||||||||||||||
Park Place | Mid Rise | Jun 2005 | St Louis, MO | 1977 | 242 | 705 | 6,327 | 8,557 | 705 | 14,884 | 15,589 | (11,702 | ) | 3,887 | 8,065 | ||||||||||||||||||
Parkways, The | Garden | Jun 2004 | Chicago, IL | 1925 | 446 | 3,426 | 23,257 | 23,186 | 3,426 | 46,443 | 49,869 | (29,364 | ) | 20,505 | 14,892 | ||||||||||||||||||
Pleasant Hills | Garden | Apr 2005 | Austin, TX | 1982 | 100 | 1,229 | 2,631 | 4,322 | 1,229 | 6,953 | 8,182 | (4,581 | ) | 3,601 | 2,841 | ||||||||||||||||||
Plummer Village | Mid Rise | Mar 2002 | North Hills, CA | 1983 | 75 | 666 | 2,647 | 1,394 | 666 | 4,041 | 4,707 | (3,069 | ) | 1,638 | 2,226 | ||||||||||||||||||
Riverwoods | High Rise | Jan 2006 | Kankakee, IL | 1983 | 125 | 598 | 4,931 | 3,834 | 598 | 8,765 | 9,363 | (4,467 | ) | 4,896 | 3,412 | ||||||||||||||||||
Round Barn Manor | Garden | Mar 2002 | Champaign, IL | 1979 | 156 | 810 | 5,134 | 6,086 | 810 | 11,220 | 12,030 | (5,222 | ) | 6,808 | 3,774 | ||||||||||||||||||
San Jose Apartments | Garden | Sep 2005 | San Antonio, TX | 1970 | 220 | 234 | 5,770 | 12,543 | 234 | 18,313 | 18,547 | (11,656 | ) | 6,891 | 4,154 | ||||||||||||||||||
San Juan Del Centro | Mid Rise | Sep 2005 | Boulder, CO | 1971 | 150 | 439 | 7,110 | 12,694 | 439 | 19,804 | 20,243 | (12,108 | ) | 8,135 | 11,389 | ||||||||||||||||||
South Bay Villa | Garden | Mar 2002 | Los Angeles, CA | 1981 | 80 | 1,352 | 2,770 | 3,944 | 1,352 | 6,714 | 8,066 | (5,716 | ) | 2,350 | 2,622 | ||||||||||||||||||
Summit Oaks | Town Home | Jan 2006 | Burke, VA | 1980 | 50 | — | 5,311 | 631 | — | 5,942 | 5,942 | (3,571 | ) | 2,371 | 2,113 | ||||||||||||||||||
Tamarac Pines Apartments I | Garden | Nov 2004 | Woodlands, TX | 1980 | 144 | 363 | 2,775 | 3,828 | 363 | 6,603 | 6,966 | (4,287 | ) | 2,679 | 3,483 | ||||||||||||||||||
Tamarac Pines Apartments II | Garden | Nov 2004 | Woodlands, TX | 1980 | 156 | 266 | 3,195 | 4,363 | 266 | 7,558 | 7,824 | (4,863 | ) | 2,961 | 3,774 | ||||||||||||||||||
Terry Manor | Mid Rise | Oct 2005 | Los Angeles, CA | 1977 | 170 | 1,997 | 5,848 | 5,441 | 1,997 | 11,289 | 13,286 | (9,346 | ) | 3,940 | 5,960 | ||||||||||||||||||
Tompkins Terrace | Garden | Oct 2002 | Beacon, NY | 1974 | 193 | 872 | 6,827 | 14,918 | 872 | 21,745 | 22,617 | (12,629 | ) | 9,988 | 6,318 | ||||||||||||||||||
Van Nuys Apartments | High Rise | Mar 2002 | Los Angeles, CA | 1981 | 299 | 3,576 | 21,226 | 23,955 | 3,576 | 45,181 | 48,757 | (23,501 | ) | 25,256 | 23,531 | ||||||||||||||||||
Walnut Hills | High Rise | Jan 2006 | Cincinnati, OH | 1983 | 198 | 820 | 5,608 | 6,000 | 820 | 11,608 | 12,428 | (6,847 | ) | 5,581 | 4,799 | ||||||||||||||||||
Washington Square West | Mid Rise | Sep 2004 | Philadelphia, PA | 1982 | 132 | 582 | 11,169 | 5,479 | 582 | 16,648 | 17,230 | (12,146 | ) | 5,084 | 3,298 | ||||||||||||||||||
Whitefield Place | Garden | Apr 2005 | San Antonio, TX | 1980 | 80 | 219 | 3,151 | 2,445 | 219 | 5,596 | 5,815 | (3,681 | ) | 2,134 | 1,932 | ||||||||||||||||||
Winter Gardens | High Rise | Mar 2004 | St Louis, MO | 1920 | 112 | 300 | 3,072 | 4,973 | 300 | 8,045 | 8,345 | (3,261 | ) | 5,084 | 3,132 | ||||||||||||||||||
Woodland Hills | Garden | Oct 2005 | Jackson, MI | 1980 | 125 | 320 | 3,875 | 4,237 | 320 | 8,112 | 8,432 | (5,262 | ) | 3,170 | 3,105 | ||||||||||||||||||
Total Asset Management Business | 6,211 | 33,471 | 249,466 | 268,187 | 33,471 | 517,653 | 551,124 | (326,251 | ) | 224,873 | 231,374 | ||||||||||||||||||||||
Total | 42,460 | $ | 1,912,431 | $ | 3,499,164 | $ | 3,192,638 | $ | 1,787,075 | $ | 6,691,802 | $ | 8,478,877 | $ | (2,848,609 | ) | $ | 5,630,268 | $ | 3,794,415 | |||||||||||||
(1) Date we acquired the apartment community or first consolidated the partnership that owns the apartment community. | |||||||||||||||||||||||||||||||||
(2) Includes costs capitalized since acquisition or date of initial consolidation of the partnership/apartment community. | |||||||||||||||||||||||||||||||||
(3) The aggregate cost of land and depreciable property for federal income tax purposes was approximately $3.7 billion at December 31, 2017. | |||||||||||||||||||||||||||||||||
(4) Encumbrances are presented before reduction for debt issuance costs. | |||||||||||||||||||||||||||||||||
(5) The current carrying value of the apartment community reflects an impairment loss recognized during prior periods. | |||||||||||||||||||||||||||||||||
(6) Other includes land parcels and certain non-residential properties held for future development. The current carrying value of land reflects an impairment loss recognized during the current period. | |||||||||||||||||||||||||||||||||
F-45
APARTMENT INVESTMENT AND MANAGEMENT COMPANY
AIMCO PROPERTIES, L.P.
SCHEDULE III: REAL ESTATE AND ACCUMULATED DEPRECIATION
For the Years Ended December 31, 2017, 2016 and 2015
(In Thousands)
2017 | 2016 | 2015 | |||||||||
Real Estate Segment | |||||||||||
Real Estate balance at beginning of year | $ | 7,931,117 | $ | 7,744,894 | $ | 7,577,031 | |||||
Additions during the year: | |||||||||||
Acquisitions | 16,687 | 333,174 | 147,077 | ||||||||
Capital additions | 345,974 | 329,697 | 355,569 | ||||||||
Deductions during the year: | |||||||||||
Casualty and other write-offs (1) | (106,590 | ) | (170,744 | ) | (66,844 | ) | |||||
Impairment of real estate | (35,881 | ) | — | — | |||||||
Amounts related to assets held for sale | (38,208 | ) | — | (7,036 | ) | ||||||
Sales | (185,346 | ) | (305,904 | ) | (260,903 | ) | |||||
Real Estate balance at end of year | $ | 7,927,753 | $ | 7,931,117 | $ | 7,744,894 | |||||
Accumulated Depreciation balance at beginning of year | $ | 2,421,357 | $ | 2,488,448 | $ | 2,393,292 | |||||
Additions during the year: | |||||||||||
Depreciation | 320,870 | 287,661 | 262,235 | ||||||||
Deductions during the year: | |||||||||||
Casualty and other write-offs (1) | (106,521 | ) | (169,098 | ) | (66,246 | ) | |||||
Amounts related to assets held for sale | (20,383 | ) | — | (4,427 | ) | ||||||
Sales | (92,965 | ) | (185,654 | ) | (96,406 | ) | |||||
Accumulated depreciation balance at end of year | $ | 2,522,358 | $ | 2,421,357 | $ | 2,488,448 | |||||
Asset Management Business | |||||||||||
Real Estate balance at beginning of year | $ | 555,049 | $ | 562,589 | $ | 567,927 | |||||
Additions during the year: | |||||||||||
Capital additions | 8,255 | 8,909 | 7,379 | ||||||||
Deductions during the year: | |||||||||||
Casualty and other write-offs (2) | (1,711 | ) | (2,116 | ) | (12,717 | ) | |||||
Amounts related to assets held for sale | — | (2,801 | ) | — | |||||||
Sales | (10,469 | ) | (11,532 | ) | — | ||||||
Real Estate balance at end of year | $ | 551,124 | $ | 555,049 | $ | 562,589 | |||||
Accumulated Depreciation balance at beginning of year | $ | 309,401 | $ | 289,574 | $ | 278,887 | |||||
Additions during the year: | |||||||||||
Depreciation | 24,090 | 24,704 | 23,279 | ||||||||
Deductions during the year: | |||||||||||
Casualty and other write-offs (2) | (2,480 | ) | (68 | ) | (12,592 | ) | |||||
Amounts related to assets held for sale | — | (1,525 | ) | — | |||||||
Sales | (4,760 | ) | (3,284 | ) | — | ||||||
Accumulated depreciation balance at end of year | $ | 326,251 | $ | 309,401 | $ | 289,574 | |||||
(1) | Includes the write-off of fully depreciated assets totaling $106.4 million, $167.9 million and $65.1 million, during the years ended December 31, 2017, 2016 and 2015, respectively. |
(2) | Includes the write-off of fully depreciated assets totaling $1.8 million and $11.8 million, during the years ended December 31, 2017 and 2015, respectively. |
F-46