Attached files
| file | filename |
|---|---|
| EX-32 - EXHIBIT 32 - NATIONAL RESEARCH CORP | ex_98474.htm |
| EX-31.2 - EXHIBIT 31.2 - NATIONAL RESEARCH CORP | ex_98473.htm |
| EX-31.1 - EXHIBIT 31.1 - NATIONAL RESEARCH CORP | ex_98472.htm |
UNITED STATES
SECURITIES AND EXCHANGE COMMISSION
Washington, D.C. 20549
FORM 10-Q
|
[X] |
QUARTERLY REPORT PURSUANT TO SECTION 13 OR 15(d) OF THE SECURITIES EXCHANGE ACT OF 1934 |
|
|
|
|
|
For the quarterly period ended September 30, 2017 |
or
|
[ ] |
TRANSITION REPORT PURSUANT TO SECTION 13 OR 15(d) OF THE SECURITIES EXCHANGE ACT OF 1934 |
|
|
|
|
|
For the transition period from ________ to ________ |
Commission File Number 0-29466
National Research Corporation
(Exact name of Registrant as specified in its charter)
|
Wisconsin |
|
47-0634000 |
|
(State or other jurisdiction of |
|
(I.R.S. Employer |
|
incorporation or organization) |
|
Identification No.) |
|
|
1245 Q Street, Lincoln, Nebraska 68508 |
|
|
|
(Address of principal executive offices) (Zip Code) |
|
|
|
(402) 475-2525 |
|
|
|
(Registrant’s telephone number, including area code) |
|
Indicate by check mark whether the registrant (1) has filed all reports required to be filed by Section 13 or 15(d) of the Securities Exchange Act of 1934 during the preceding 12 months (or for such shorter period that the registrant was required to file such reports), and (2) has been subject to such filing requirements for the past 90 days.
Yes ☒ No ☐
Indicate by check mark whether the registrant has submitted electronically and posted on its corporate Web site, if any, every Interactive Data File required to be submitted and posted pursuant to Rule 405 of Regulation S-T during the preceding 12 months (or for such shorter period that the registrant was required to submit and post such files). Yes ☒ No ☐
Indicate by check mark whether the registrant is a large accelerated filer, an accelerated filer, a non-accelerated filer, smaller reporting company, or an emerging growth company. See the definitions of "large accelerated filer," "accelerated filer," "smaller reporting company," and "emerging growth company" in Rule 12b-2 of the Exchange Act.
|
Large accelerated filer |
☐ |
Accelerated filer |
☒ |
|
Non-accelerated filer |
☐ (Do not check if a smaller reporting company) |
Smaller reporting company |
☐ |
|
|
|
Emerging growth company |
☐ |
If an emerging growth company, indicate by check mark if the registrant has elected not to use the extended transition period for complying with any new or revised financial accounting standards provided pursuant to Section 13(a) of the Exchange Act. ☐
Indicate by check mark whether the registrant is a shell company (as defined in Rule 12b-2 of the Act.)
Yes ☐ No ☒
Indicate the number of shares outstanding of each of the issuer’s classes of common stock as of the latest practicable date.
Class A Common Stock, $.001 par value, outstanding as of October 27, 2017: 20,942,785 shares
Class B Common Stock, $.001 par value, outstanding as of October 27, 2017: 3,540,244 shares
FORM 10-Q INDEX
For the Quarter Ended September 30, 2017
|
|
|
Page No. |
|
|
|
|
|
|
|
PART I. |
|
||
|
|
|
|
|
|
|
Item 1. |
|
|
|
|
|
|
|
|
|
|
4 |
|
|
|
|
5 |
|
|
|
|
6 |
|
|
|
|
7 |
|
|
|
|
8-16 |
|
|
|
|
|
|
|
|
Item 2. |
Management’s Discussion and Analysis of Financial Condition and Results of Operations |
17-24 |
|
|
|
|
|
|
|
Item 3. |
24 |
|
|
|
|
|
|
|
|
Item 4. |
24 |
|
|
|
|
|
|
|
PART II. |
|
||
|
|
|
|
|
|
|
Item 1A. |
25 |
|
|
|
|
|
|
|
|
Item 2. |
25 |
|
|
|
|
|
|
|
|
Item 6. |
25 |
|
|
|
|
|
|
|
|
26 |
||
Special Note Regarding Forward-Looking Statements
Certain matters discussed in this Quarterly Report on Form 10-Q are “forward-looking statements” within the meaning of Section 21E of the Securities Exchange Act of 1934, as amended. These forward-looking statements can generally be identified as such because the context of the statement includes phrases such as National Research Corporation, doing business as NRC Health (“NRC Health,” the “Company,” “we,” “our,” “us” or similar terms), “believes,” “expects,” or other words of similar import. Similarly, statements that describe the Company’s future plans, objectives or goals are also forward-looking statements. Such forward-looking statements are subject to certain risks and uncertainties which could cause actual results or outcomes to differ materially from those currently anticipated. Factors that could affect actual results or outcomes include, without limitation, the following factors:
|
● |
The possibility of non-renewal of the Company’s client service contracts and retention of key clients; |
|
● |
The Company’s ability to compete in its markets, which are highly competitive, and the possibility of increased price pressure and expenses; |
|
● |
The effects of an economic downturn; |
|
● |
The impact of consolidation in the healthcare industry; |
|
● |
The impact of federal healthcare reform legislation or other regulatory changes; |
|
● |
The Company’s ability to attract and retain key managers and other personnel; |
|
● |
The possibility that the Company’s intellectual property and other proprietary information technology could be copied or independently developed by its competitors; |
|
● |
The possibility that the Company could be subject to security breaches or computer viruses; and |
|
● |
The factors set forth under the caption “Risk Factors” in Part I, Item 1A of the Company’s Annual Report on Form 10-K for the year ended December 31, 2016, as such section may be updated or supplemented by Part II, Item 1A of the Company’s subsequently filed Quarterly Reports on Form 10-Q (including this Report). |
Shareholders, potential investors and other readers are urged to consider these and other factors in evaluating the forward-looking statements, and are cautioned not to place undue reliance on such forward-looking statements. The forward-looking statements included are only made as of the date of this Quarterly Report on Form 10-Q and the Company undertakes no obligation to publicly update such forward-looking statements to reflect subsequent events or circumstances.
PART I – Financial Information
NATIONAL RESEARCH CORPORATION AND SUBSIDIARY
CONDENSED CONSOLIDATED BALANCE SHEETS
(In thousands, except share amounts and par value)
|
September 30, 2017 |
December 31, 2016 |
|||||||
|
(unaudited) |
||||||||
|
Assets |
||||||||
|
Current assets: |
||||||||
|
Cash and cash equivalents |
$ | 35,750 | $ | 33,021 | ||||
|
Trade accounts receivable, less allowance for doubtful accounts of $188 and $169 in 2017 and 2016, respectively |
13,588 | 10,864 | ||||||
|
Unbilled revenue |
1,283 | 1,546 | ||||||
|
Prepaid expenses |
3,075 | 1,585 | ||||||
|
Income tax receivable |
61 | 14 | ||||||
|
Other current assets |
65 | 35 | ||||||
|
Total current assets |
53,822 | 47,065 | ||||||
|
Property and equipment, net |
12,089 | 11,806 | ||||||
|
Intangible assets, net |
2,932 | 3,124 | ||||||
|
Goodwill |
58,036 | 57,861 | ||||||
|
Other |
1,861 | 768 | ||||||
|
Total assets |
$ | 128,740 | $ | 120,624 | ||||
|
Liabilities and Shareholders’ Equity |
||||||||
|
Current liabilities: |
||||||||
|
Current portion of notes payable |
$ | 1,693 | $ | 2,683 | ||||
|
Accounts payable |
548 | 765 | ||||||
|
Accrued wages, bonus and profit sharing |
4,151 | 4,543 | ||||||
|
Accrued expenses |
3,122 | 3,069 | ||||||
|
Current portion of capital lease obligations |
87 | 82 | ||||||
|
Income taxes payable |
1,862 | 662 | ||||||
|
Dividends payable |
4,218 | 4,213 | ||||||
|
Deferred revenue |
18,486 | 15,497 | ||||||
|
Total current liabilities |
34,167 | 31,514 | ||||||
|
Notes payable, net of current portion |
- | 857 | ||||||
|
Deferred income taxes |
4,855 | 4,670 | ||||||
|
Other long term liabilities |
874 | 777 | ||||||
|
Total liabilities |
39,896 | 37,818 | ||||||
|
Shareholders’ equity: |
||||||||
|
Preferred stock, $0.01 par value; authorized 2,000,000 shares, none issued |
-- | -- | ||||||
|
Class A Common stock, $0.001 par value; authorized 60,000,000 shares, issued 25,799,230 in 2017 and 25,656,760 in 2016, outstanding 20,942,785 in 2017 and 20,891,069 in 2016 |
26 | 26 | ||||||
|
Class B Common stock, $0.001 par value; authorized 80,000,000 shares, issued 4,317,656 in 2017 and 4,308,875 in 2016, outstanding 3,540,244 in 2017 and 3,539,931 in 2016 |
4 | 4 | ||||||
|
Additional paid-in capital |
50,121 | 46,725 | ||||||
|
Retained earnings |
75,278 | 71,507 | ||||||
|
Accumulated other comprehensive loss |
(1,528 |
) |
(2,626 |
) |
||||
|
Treasury stock, at cost; 4,856,445 Class A shares, 777,412 Class B shares in 2017 and 4,765,691 Class A shares, 768,944 Class B shares in 2016 |
(35,057 |
) |
(32,830 |
) |
||||
|
Total shareholders’ equity |
88,844 | 82,806 | ||||||
|
Total liabilities and shareholders’ equity |
$ | 128,740 | $ | 120,624 | ||||
See accompanying notes to condensed consolidated financial statements
NATIONAL RESEARCH CORPORATION AND SUBSIDIARY
CONDENSED CONSOLIDATED STATEMENTS OF INCOME
(In thousands, except for per share amounts, unaudited)
|
Three months ended |
Nine months ended |
|||||||||||||||
|
2017 |
2016 |
2017 |
2016 |
|||||||||||||
|
Revenue |
$ | 28,951 | $ | 27,032 | $ | 87,661 | $ | 81,016 | ||||||||
|
Operating expenses: |
||||||||||||||||
|
Direct |
12,267 | 11,468 | 36,706 | 33,741 | ||||||||||||
|
Selling, general and administrative |
8,430 | 7,139 | 22,021 | 21,766 | ||||||||||||
|
Depreciation and amortization |
1,132 | 1,086 | 3,376 | 3,146 | ||||||||||||
|
Total operating expenses |
21,829 | 19,693 | 62,103 | 58,653 | ||||||||||||
|
Operating income |
7,122 | 7,339 | 25,558 | 22,363 | ||||||||||||
|
Other income (expense): |
||||||||||||||||
|
Interest income |
29 | 12 | 58 | 34 | ||||||||||||
|
Interest expense |
(18 |
) |
(38 |
) |
(68 |
) |
(158 |
) |
||||||||
|
Other, net |
40 | (4 |
) |
76 | 112 | |||||||||||
|
Total other income (expense) |
51 | (30 |
) |
66 | (12 |
) |
||||||||||
|
Income before income taxes |
7,173 | 7,309 | 25,624 | 22,351 | ||||||||||||
|
Provision for income taxes |
3,020 | 2,580 | 9,198 | 7,558 | ||||||||||||
|
Net income |
$ | 4,153 | $ | 4,729 | $ | 16,426 | $ | 14,793 | ||||||||
|
Earnings Per Share of Common Stock: |
||||||||||||||||
|
Basic Earnings Per Share: |
||||||||||||||||
|
Class A |
$ | 0.10 | $ | 0.11 | $ | 0.39 | $ | 0.35 | ||||||||
|
Class B |
$ | 0.59 | $ | 0.67 | $ | 2.34 | $ | 2.11 | ||||||||
|
Diluted Earnings Per Share: |
||||||||||||||||
|
Class A |
$ | 0.09 | $ | 0.11 | $ | 0.38 | $ | 0.35 | ||||||||
|
Class B |
$ | 0.57 | $ | 0.66 | $ | 2.28 | $ | 2.08 | ||||||||
|
Dividends Per Share of Common Stock: |
||||||||||||||||
|
Class A |
$ | 0.10 | $ | 0.08 | $ | 0.30 | $ | 0.24 | ||||||||
|
Class B |
$ | 0.60 | $ | 0.48 | $ | 1.80 | $ | 1.44 | ||||||||
|
Weighted average shares and share equivalents outstanding: |
||||||||||||||||
|
Class A – basic |
20,788 | 20,716 | 20,759 | 20,712 | ||||||||||||
|
Class B – basic |
3,514 | 3,511 | 3,514 | 3,503 | ||||||||||||
|
Class A – diluted |
21,740 | 21,068 | 21,537 | 21,017 | ||||||||||||
|
Class B – diluted |
3,620 | 3,556 | 3,595 | 3,557 | ||||||||||||
See accompanying notes to condensed consolidated financial statements
NATIONAL RESEARCH CORPORATION AND SUBSIDIARY
CONDENSED CONSOLIDATED STATEMENTS OF COMPREHENSIVE INCOME
(In thousands, unaudited)
|
Three months ended |
Nine months ended September 30, |
|||||||||||||||
|
2017 |
2016 |
2017 |
2016 |
|||||||||||||
|
Net income |
$ | 4,153 | $ | 4,729 | $ | 16,426 | $ | 14,793 | ||||||||
|
Other comprehensive income: |
||||||||||||||||
|
Foreign currency translation adjustment |
599 | (198 |
) |
1,098 | 680 | |||||||||||
|
Other comprehensive income |
$ | 599 | $ | (198 |
) |
$ | 1,098 | $ | 680 | |||||||
|
Comprehensive Income |
$ | 4,752 | $ | 4,531 | $ | 17,524 | $ | 15,473 | ||||||||
See accompanying notes to condensed consolidated financial statements.
NATIONAL RESEARCH CORPORATION AND SUBSIDIARY
CONDENSED CONSOLIDATED STATEMENTS OF CASH FLOWS
(In thousands, unaudited)
|
Nine months ended |
||||||||
|
September 30, |
||||||||
|
2017 |
2016 |
|||||||
|
Cash flows from operating activities: |
||||||||
|
Net income |
$ | 16,426 | $ | 14,793 | ||||
|
Adjustments to reconcile net income to net cash provided by operating activities: |
||||||||
|
Depreciation and amortization |
3,376 | 3,146 | ||||||
|
Deferred income taxes |
184 | 905 | ||||||
|
Reserve for uncertain tax positions |
112 | (42 |
) |
|||||
|
Non-cash share-based compensation expense |
1,273 | 1,548 | ||||||
|
Net changes in assets and liabilities: |
||||||||
|
Trade accounts receivable |
(2,574 |
) |
(4,197 |
) |
||||
|
Unbilled revenue |
276 | 141 | ||||||
|
Prepaid expenses |
(1,274 |
) |
(315 |
) |
||||
|
Accounts payable |
(108 |
) |
73 | |||||
|
Accrued expenses, wages, bonuses and profit sharing |
(293 |
) |
(90 |
) |
||||
|
Income taxes receivable and payable |
1,157 | (476 |
) |
|||||
|
Deferred revenue |
2,925 | 2,533 | ||||||
|
Net cash provided by operating activities |
21,480 | 18,019 | ||||||
|
Cash flows from investing activities: |
||||||||
|
Purchase of equity investment |
(1,300 |
) |
-- | |||||
|
Purchase of intangible Content License |
(250 |
) |
-- | |||||
|
Purchases of property and equipment |
(3,347 |
) |
(3,066 |
) |
||||
|
Net cash used in investing activities |
(4,897 |
) |
(3,066 |
) |
||||
|
Cash flows from financing activities: |
||||||||
|
Payments on notes payable |
(1,847 |
) |
(1,795 |
) |
||||
|
Payments on capital lease obligations |
(81 |
) |
(73 |
) |
||||
|
Cash paid for non-controlling interest |
-- | (2,000 |
) |
|||||
|
Proceeds from exercise of stock options |
-- | 548 | ||||||
|
Payment of employee payroll tax withholdings on share-based awards exercised |
(105 |
) |
(204 |
) |
||||
|
Payment of dividends on common stock |
(12,649 |
) |
(25,180 |
) |
||||
|
Net cash used in financing activities |
(14,682 |
) |
(28,704 |
) |
||||
|
Effect of exchange rate changes on cash |
828 | 484 | ||||||
|
Change in cash and cash equivalents |
2,729 | (13,267 |
) |
|||||
|
Cash and cash equivalents at beginning of period |
33,021 | 42,145 | ||||||
|
Cash and cash equivalents at end of period |
$ | 35,750 | $ | 28,878 | ||||
|
Supplemental disclosure of cash paid for: |
||||||||
|
Interest, net of capitalized amounts |
$ | 65 | $ | 152 | ||||
|
Income taxes |
$ | 7,749 | $ | 7,254 | ||||
|
Supplemental disclosure of non-cash investing and financing activities: |
||||||||
|
Capital lease obligations originated for property and equipment |
$ | 74 | $ | 109 | ||||
|
Stock tendered to the Company for cashless exercise of stock options in connection with equity incentive plans |
$ | 2,123 | $ | 397 | ||||
See accompanying notes to condensed consolidated financial statements.
NATIONAL RESEARCH CORPORATION AND SUBSIDIARY
NOTES TO CONDENSED CONSOLIDATED FINANCIAL STATEMENTS
|
1. |
BASIS OF CONSOLIDATION AND PRESENTATION |
National Research Corporation, doing business as NRC Health (“NRC Health,” the “Company,” “we,” “our,” “us” or similar terms), is a leading provider of analytics and insights that facilitate measurement and improvement of the patient and employee experience while also increasing patient engagement and customer loyalty for healthcare providers, payers and other healthcare organizations in the United States and Canada. The Company’s solutions enable its clients to understand the voice of the customer with greater clarity, immediacy and depth.
The Company’s six operating segments are aggregated into one reporting segment because they have similar economic characteristics and meet the other aggregation criteria from the Financial Accounting Standards Board (“FASB”) guidance on segment disclosure. The six operating segments are Experience, The Governance Institute, Market Insights, Transparency, NRC Health Canada and Transitions (formerly Connect), which offer a portfolio of solutions that address specific needs around market insight, experience, transparency and governance for healthcare providers, payers and other healthcare organizations.
The condensed consolidated balance sheet of the Company at December 31, 2016, was derived from the Company’s audited consolidated balance sheet as of that date. All other financial statements contained herein are unaudited and, in the opinion of management, include all adjustments (consisting only of normal recurring adjustments) the Company considers necessary for a fair presentation of financial position, results of operations and cash flows in accordance with accounting principles generally accepted in the United States.
Information and footnote disclosures included in financial statements prepared in accordance with accounting principles generally accepted in the United States have been condensed or omitted. These condensed consolidated financial statements should be read in conjunction with the consolidated financial statements and notes thereto that are included in the Company’s Form 10-K for the year ended December 31, 2016, filed with the Securities and Exchange Commission (the “SEC”) on March 3, 2017.
The preparation of financial statements in conformity with accounting principles generally accepted in the United States requires management to make certain estimates and assumptions that affect the reported amounts of assets and liabilities at the date of the financial statements and the reported amounts of revenue and expenses during the reporting period. Actual results could differ from those estimates.
The condensed consolidated financial statements include the accounts of the Company and its wholly-owned subsidiary, National Research Corporation Canada, doing business as NRC Health Canada. The condensed consolidated statement of income for the nine months ended September 30, 2016 also included Customer-Connect LLC. Customer-Connect LLC became a wholly-owned subsidiary in March 2016 and was previously a variable interest entity for which NRC Health was deemed the primary beneficiary. On June 30, 2016, Customer-Connect LLC was dissolved. All significant intercompany transactions and balances have been eliminated.
The functional currency of the Company’s foreign subsidiary, National Research Corporation Canada, doing business as NRC Health Canada, is the subsidiary’s local currency. The Company translates the assets and liabilities of its foreign subsidiary at the period-end rate of exchange and its foreign subsidiary’s income statement balances at the average rate prevailing during the period. The Company records the resulting translation adjustment in accumulated other comprehensive loss, a component of shareholders’ equity. Since the undistributed earnings of the Company’s foreign subsidiary are considered to be indefinitely reinvested, no taxes were provided for on currency translation adjustments arising from converting the investment denominated in a foreign currency to U.S. dollars. Gains and losses related to transactions denominated in a currency other than the subsidiary’s local currency and short-term intercompany accounts are included in other income (expense) in the condensed consolidated statements of income.
Equity Investments
The Company acquires equity investments to promote business and strategic objectives. For investments that do not have a readily determinable fair value, the Company applies either cost or equity method of accounting depending on the nature of its investment and its ability to exercise significant influence. Investments are periodically analyzed to determine whether or not there are any indicators of impairment and written down to fair value if the investment has incurred an other than temporary impairment. During the three-month period ended September 30, 2017, the Company acquired a $1.3 million investment in convertible preferred stock of PracticingExcellence.com, Inc., a privately-held Delaware Corporation (“PX”), which is carried at cost and included in other non-current assets. The Company has a seat on PX's board of directors and the Company's investment, which is not considered to be in-substance common stock, represents approximately 15.7% of the issued and outstanding equity interests in PX at September 30, 2017.
Reclassifications
Reclassifications have been made from noncurrent deferred income taxes to other noncurrent liabilities in the 2016 condensed consolidated balance sheet to present the unrecognized tax benefits related to state taxes gross of federal tax benefits, consistent with the 2017 financial statement presentation. There was no impact on the previously reported net income and earnings per share.
Fair Value Measurements
The Company’s valuation techniques are based on maximizing observable inputs and minimizing the use of unobservable inputs when measuring fair value. Observable inputs reflect readily obtainable data from independent sources, while unobservable inputs reflect the Company’s market assumptions. The inputs are then classified into the following hierarchy: (1) Level 1 Inputs—quoted prices in active markets for identical assets and liabilities; (2) Level 2 Inputs—observable market-based inputs other than Level 1 inputs, such as quoted prices for similar assets or liabilities in active markets, quoted prices for similar or identical assets or liabilities in markets that are not active, or other inputs that are observable or can be corroborated by observable market data; and (3) Level 3 Inputs—unobservable inputs.
Commercial paper and Eurodollar deposits are included in cash equivalents and are valued at amortized cost, which approximates fair value due to their short-term nature. Eurodollar deposits are United States dollars deposited in a foreign bank branch of a United States bank and have daily liquidity. Both of these are included as a Level 2 measurement in the table below.
The following details the Company’s financial assets and liabilities within the fair value hierarchy at September 30, 2017 and December 31, 2016:
Fair Values Measured on a Recurring Basis
|
Level 1 |
Level 2 |
Level 3 |
Total |
|||||||||||||
|
(In thousands) |
||||||||||||||||
|
As of September 30, 2017 |
||||||||||||||||
|
Money Market Funds |
$ | 12,586 | $ | -- | $ | -- | $ | 12,586 | ||||||||
|
Commercial Paper |
-- | 12,948 | -- | 12,948 | ||||||||||||
|
Eurodollar Deposits |
-- | 10,008 | -- | 10,008 | ||||||||||||
|
Total |
$ | 12,586 | $ | 22,956 | $ | -- | $ | 35,542 | ||||||||
|
As of December 31, 2016 |
||||||||||||||||
|
Money Market Funds |
$ | 11,200 | $ | -- | $ | -- | $ | 11,200 | ||||||||
|
Commercial Paper |
-- | 21,450 | -- | 21,450 | ||||||||||||
|
Total |
$ | 11,200 | $ | 21,450 | $ | -- | $ | 32,650 | ||||||||
The Company’s long-term debt is recorded at historical cost. The following are the carrying amounts and estimated fair values, using a Level 2 discounted cash flow analysis based primarily on estimated current rates available for debt of the same remaining duration and adjusted for nonperformance and credit risk:
|
September 30, 2017 |
December 31, 2016 |
|||||||
|
(In thousands) |
||||||||
|
Total carrying amounts of long-term debt |
$ | 1,693 | $ | 3,540 | ||||
|
Estimated fair value of long-term debt |
$ | 1,690 | $ | 3,533 | ||||
The Company believes that the carrying amounts of trade accounts receivable, accounts payable and accrued expenses approximate their fair value due to the short maturity of those instruments. Long-lived assets that are not recognized or disclosed at fair value in the financial statements on a recurring basis, which includes property and equipment, goodwill, intangibles, and cost method investments are measured at fair value in certain circumstances (for example, when there is evidence of impairment). As of September 30, 2017, and December 31, 2016, there was no indication of impairment related to these assets.
|
2. |
INCOME TAXES |
The effective tax rate for the three-month period ended September 30, 2017 increased to 42.1% compared to 35.3% for the same period in 2016 mainly due to $384,000 of additional tax expense from non-deductible proposed recapitalization expenses (see Note 9). The effective tax rate for the nine-month period ended September 30, 2017 increased to 35.9% compared to 33.8% for the same period in 2016. The increase in the effective tax rate for the nine-month period ended September 30, 2017 was primarily due to $384,000 of additional tax expense from non-deductible proposed recapitalization expenses, increases in the estimated state tax rates as well as a greater proportion of United States income subject to higher tax rates than Canadian income. The Company also had reduced tax expense in 2016 of $105,000 from United States federal tax examination adjustments, net of interest and penalties, and state tax return adjustments decreasing tax expense. These are partially offset by increased tax benefits of $149,000 in 2017 from the exercise of options and dividends paid to non-vested shareholders.
|
3. |
NOTES PAYABLE |
The Company’s term note is payable in monthly installments of $212,468. Borrowings under the term note bear interest at an annual rate of 3.12%. The outstanding balance of the term note at September 30, 2017 was $1.7 million.
The Company also has a revolving credit note which was amended and extended effective June 30, 2017 with a maturity date of June 30, 2018. The maximum aggregate amount available under the revolving credit note is $12.0 million. Borrowings under the revolving credit note bear interest at a variable annual rate, with three rate options at the discretion of management as follows: (1) 2.1% plus the one-month London Interbank Offered Rate (“LIBOR”) or (2) 2.1% plus the one-, two- or three- month LIBOR rate, or (3) the bank’s one-, two, three, six, or twelve month Money Market Loan Rate. As of September 30, 2017 the revolving credit note did not have a balance and the Company had the capacity to borrow $12.0 million.
The term note and revolving credit note are secured by certain of the Company’s assets, including the Company’s land, building, trade accounts receivable and intangible assets. The term note and revolving credit note contain various restrictions and covenants applicable to the Company, including requirements that the Company maintain certain financial ratios at prescribed levels and restrictions on the ability of the Company to consolidate or merge, create liens, incur additional indebtedness or dispose of assets. As of September 30, 2017, the Company was in compliance with its financial covenants.
|
4. |
SHARE-BASED COMPENSATION |
The Company measures and recognizes compensation expense for all share-based payments based on the grant-date fair value of those awards. All of the Company’s existing stock option awards and unvested stock awards have been determined to be equity-classified awards.
The Company’s 2001 Equity Incentive Plan provided for the granting of stock options, stock appreciation rights, restricted stock, performance shares and other share-based awards and benefits up to an aggregate of 1,800,000 shares of class A common stock and 300,000 shares of class B common stock. Stock options granted could have been either nonqualified or incentive stock options. Stock options vest over one to five years following the date of grant and option terms are generally five to ten years following the date of grant.
The Company’s 2004 Non-Employee Director Stock Plan, as amended (the “2004 Director Plan”), is a nonqualified plan that provides for the granting of options with respect to 3,000,000 shares of class A common stock and 500,000 shares of class B common stock. The 2004 Director Plan provides for grants of nonqualified stock options to each director of the Company who is not employed by the Company. On the date of each annual meeting of shareholders of the Company, options to purchase 36,000 shares of class A common stock and 6,000 shares of class B common stock are granted to directors that are elected or retained as a director at such meeting. Stock options vest one year following the date of grant and option terms are generally ten years following the date of grant, or three years in the case of termination of the outside director’s service.
The Company’s 2006 Equity Incentive Plan provides for the granting of stock options, stock appreciation rights, restricted stock, performance shares and other share-based awards and benefits up to an aggregate of 1,800,000 shares of class A common stock and 300,000 shares of class B common stock. Stock options granted may be either incentive stock options or nonqualified stock options. Vesting terms vary with each grant and option terms are generally five to ten years following the date of grant.
The Company granted options to purchase 299,917 shares of the Company’s class A common stock and 49,986 shares of the class B common stock during the nine-month period ended September 30, 2017. Options to purchase shares of common stock were granted with exercise prices equal to the fair value of the common stock on the date of grant. The fair value of the stock options granted was estimated using a Black-Scholes valuation model with the following assumptions:
|
|
|
2017 |
|
|
2016 |
|
||||||||||||||
|
|
|
Class A |
|
|
Class B |
|
|
Class A |
|
|
Class B |
|
||||||||
|
|
|
|
|
|
|
|
|
|
|
|
|
|
|
|
|
|
|
|
|
|
|
Expected dividend yield at date of grant |
|
2.46 |
to |
2.87% |
|
|
7.99 |
to |
8.10% |
|
|
2.96 |
to |
3.02% |
|
|
6.67 |
to |
8.12% |
|
|
Expected stock price volatility |
|
32.20 |
to |
32.62% |
|
|
26.47 |
to |
27.18% |
|
|
31.33 |
to |
34.61% |
|
|
27.64 |
to |
31.77% |
|
|
Risk-free interest rate |
|
2.08 |
to |
2.33% |
|
|
2.08 |
to |
2.33% |
|
|
1.36 |
to |
2.12% |
|
|
1.36 |
to |
2.12% |
|
|
Expected life of options (in years) |
|
6 |
to |
8 |
|
|
6 |
to |
8 |
|
|
6 |
to |
8 |
|
|
6 |
to |
8 |
|
The risk-free interest rate assumptions were based on the U.S. Treasury yield curve in effect at the time of the grant. The expected volatility was based on historical monthly price changes of the Company’s common stock based on the expected life of the options at the date of grant. The expected life of options is the average number of years the Company estimates that options will be outstanding. The Company considers groups of associates that have similar historical exercise behavior separately for valuation purposes.
The following table summarizes stock option activity under the Company’s 2001 and 2006 Equity Incentive Plans and the 2004 Director Plan for the nine months ended September 30, 2017:
|
Number of |
Weighted Average Exercise Price |
Weighted Average Remaining Contractual Terms (Years) |
Aggregate Intrinsic Value (In thousands) |
|||||||||||||
|
Class A |
||||||||||||||||
|
Outstanding at December 31, 2016 |
1,705,483 | $ | 12.31 | |||||||||||||
|
Granted |
299,917 | $ | 22.13 | |||||||||||||
|
Exercised |
(161,784 |
) |
$ | 11.01 | $ | 1,808 | ||||||||||
|
Forfeited |
(60,982 |
) |
$ | 21.35 | ||||||||||||
|
Outstanding at September 30, 2017 |
1,782,634 | $ | 13.77 | 5.54 | $ | 42,651 | ||||||||||
|
Exercisable at September 30, 2017 |
1,310,361 | $ | 12.04 | 4.46 | $ | 33,621 | ||||||||||
|
Class B |
||||||||||||||||
|
Outstanding at December 31, 2016 |
250,493 | $ | 29.70 | |||||||||||||
|
Granted |
49,986 | $ | 42.90 | |||||||||||||
|
Exercised |
(12,000 |
) |
$ | 28.41 | $ | 142 | ||||||||||
|
Forfeited |
(10,163 |
) |
$ | 41.53 | ||||||||||||
|
Outstanding at September 30, 2017 |
278,316 | $ | 31.69 | 5.74 | $ | 6,044 | ||||||||||
|
Exercisable at September 30, 2017 |
200,550 | $ | 29.06 | 4.66 | $ | 4,884 | ||||||||||
As of September 30, 2017, the total unrecognized compensation cost related to non-vested stock option awards was approximately $1.5 million and $186,000 for class A and class B common shares, respectively, which is expected to be recognized over a weighted average period of 2.46 years and 2.56 years for class A and class B common stock shares, respectively.
The following table summarizes information for the nine months ended September 30, 2017 regarding non-vested stock granted to associates under the 2001 and 2006 Equity Incentive Plans:
|
Class A Shares Outstanding |
Class A Weighted Average Grant Date Fair Value Per Share |
Class B Shares Outstanding |
Class B Weighted Average Grant Date Fair Value Per Share |
|||||||||||||
|
Outstanding at December 31, 2016 |
174,487 | $ | 13.93 | 29,081 | $ | 37.21 | ||||||||||
|
Granted |
-- | -- | -- | -- | ||||||||||||
|
Vested |
-- | -- | -- | -- | ||||||||||||
|
Forfeited |
(19,314 |
) |
$ | 14.26 | (3,219 |
) |
$ | 34.69 | ||||||||
|
Outstanding at September 30, 2017 |
155,173 | $ | 13.89 | 25,862 | $ | 37.53 | ||||||||||
As of September 30, 2017, the total unrecognized compensation cost related to non-vested stock awards was approximately $1.0 million and is expected to be recognized over a weighted average period of 2.42 years.
|
5. |
GOODWILL AND OTHER INTANGIBLE ASSETS |
The following represents a summary of changes in the Company’s carrying amount of goodwill for the nine months ended September 30, 2017:
|
(In thousands) |
||||
|
Balance as of December 31, 2016 |
$ | 57,861 | ||
|
Foreign currency translation |
175 | |||
|
Balance as of September 30, 2017 |
$ | 58,036 | ||
Intangible assets consisted of the following:
|
September 30, 2017 |
December 31, 2016 |
|||||||
|
(In thousands) |
||||||||
|
Non-amortizing other intangible assets: |
||||||||
|
Trade name |
$ | 1,191 | $ | 1,191 | ||||
|
Amortizing other intangible assets: |
||||||||
|
Customer related |
9,349 | 9,331 | ||||||
|
Technology |
1,359 | 1,110 | ||||||
|
Trade name |
1,572 | 1,572 | ||||||
|
Total other intangible assets |
13,471 | 13,204 | ||||||
|
Accumulated amortization |
(10,539 |
) |
(10,080 |
) |
||||
|
Other intangible assets, net |
$ | 2,932 | $ | 3,124 | ||||
|
6. |
PROPERTY AND EQUIPMENT |
|
September 30, 2017 |
December 31, 2016 |
|||||||
|
(In thousands) |
||||||||
|
Property and equipment |
$ | 41,183 | $ | 37,890 | ||||
|
Accumulated depreciation |
(29,094 |
) |
(26,084 |
) |
||||
|
Property and equipment, net |
$ | 12,089 | $ | 11,806 | ||||
|
7. |
EARNINGS PER SHARE |
Net income per share of class A common stock and class B common stock is computed using the two-class method. Basic net income per share is computed by allocating undistributed earnings to common shares and using the weighted-average number of common shares outstanding during the period.
Diluted net income per share is computed using the weighted-average number of common shares and, if dilutive, the potential common shares outstanding during the period. Potential common shares consist of the incremental common shares issuable upon the exercise of stock options and vesting of restricted stock. The dilutive effect of outstanding stock options is reflected in diluted earnings per share by application of the treasury stock method.
The liquidation rights and the rights upon the consummation of an extraordinary transaction are the same for the holders of class A common stock and class B common stock. Other than share distributions and liquidation rights, the amount of any dividend or other distribution payable on each share of class A common stock will be equal to one-sixth (1/6th) of the amount of any such dividend or other distribution payable on each share of class B common stock. As a result, the undistributed earnings for each period are allocated based on the contractual participation rights of the class A and class B common stock as if the earnings for the period had been distributed.
For the three months ended September 30, 2016, 156,610 options of class A shares and 118,830 options of class B shares have been excluded from the diluted net income per share computation because the exercise or grant price exceeded the fair market value. For the three months ended September 30, 2016, an additional 351,620 options of class A shares were excluded as their inclusion would be anti-dilutive.
|
For the Three Months Ended September 30, 2017 |
For the Three Months Ended September 30, 2016 |
|||||||||||||||
|
Class A Common Stock |
Class B Common Stock |
Class A Common Stock |
Class B Common Stock |
|||||||||||||
|
(In thousands, except per share data) |
||||||||||||||||
|
Numerator for net income per share - basic: |
||||||||||||||||
|
Net income |
$ | 2,062 | $ | 2,091 | $ | 2,345 | $ | 2,384 | ||||||||
|
Allocation of distributed and undistributed income to unvested restricted stock shareholders |
(15 |
) |
(15 |
) |
(21 |
) |
(21 |
) |
||||||||
|
Net income attributable to common shareholders |
$ | 2,047 | $ | 2,076 | $ | 2,324 | $ | 2,363 | ||||||||
|
Denominator for net income per share - basic: |
||||||||||||||||
|
Weighted average common shares outstanding - basic |
20,788 | 3,514 | 20,716 | 3,511 | ||||||||||||
|
Net income per share – basic |
$ | 0.10 | $ | 0.59 | $ | 0.11 | $ | 0.67 | ||||||||
|
Numerator for net income per share - diluted: |
||||||||||||||||
|
Net income attributable to common shareholders for basic computation |
$ | 2,047 | $ | 2,076 | $ | 2,324 | $ | 2,363 | ||||||||
|
Denominator for net income per share - diluted: |
||||||||||||||||
|
Weighted average common shares outstanding – basic |
20,788 | 3,514 | 20,716 | 3,511 | ||||||||||||
|
Weighted average effect of dilutive securities – stock options |
952 | 106 | 352 | 45 | ||||||||||||
|
Denominator for diluted earnings per share – adjusted weighted average shares |
21,740 | 3,620 | 21,068 | 3,556 | ||||||||||||
|
Net income per share – diluted |
$ | 0.09 | $ | 0.57 | $ | 0.11 | $ | 0.66 | ||||||||
For the nine months ended September 30, 2016, the Company had 506,250 options of class A shares and 56,728 options of class B shares, respectively, which have been excluded from the diluted net income per share computation because the exercise or grant price exceeded the fair market value. For the nine months ended September 30, 2017 and 2016, an additional 91,385 and 204,170 options of class A shares and 15,231 and 47,429 of Class B shares were excluded as their inclusion would be anti-dilutive, respectively.
|
For the Nine Months Ended September 30, 2017 |
For the Nine Months Ended September 30, 2016 |
|||||||||||||||
|
Class A Common Stock |
Class B Common Stock |
Class A Common Stock |
Class B Common Stock |
|||||||||||||
|
(In thousands, except per share data) |
||||||||||||||||
|
Numerator for net income per share - basic: |
||||||||||||||||
|
Net income |
$ | 8,151 | $ | 8,275 | $ | 7,339 | $ | 7,454 | ||||||||
|
Allocation of distributed and undistributed income to unvested restricted stock shareholders |
(63 |
) |
(64 |
) |
(64 |
) |
(64 |
) |
||||||||
|
Net income attributable to common shareholders |
$ | 8,088 | $ | 8,211 | $ | 7,275 | $ | 7,390 | ||||||||
|
Denominator for net income per share - basic: |
||||||||||||||||
|
Weighted average common shares outstanding – basic |
20,759 | 3,514 | 20,712 | 3,503 | ||||||||||||
|
Net income per share – basic |
$ | 0.39 | $ | 2.34 | $ | 0.35 | $ | 2.11 | ||||||||
|
Numerator for net income per share - diluted: |
||||||||||||||||
|
Net income attributable to common shareholders for basic computation |
$ | 8,088 | $ | 8,211 | $ | 7,275 | $ | 7,390 | ||||||||
|
Denominator for net income per share - diluted: |
||||||||||||||||
|
Weighted average common shares outstanding – basic |
20,759 | 3,514 | 20,712 | 3,503 | ||||||||||||
|
Weighted average effect of dilutive securities – stock options |
778 | 81 | 305 | 54 | ||||||||||||
|
Denominator for diluted earnings per share – adjusted weighted average shares |
21,537 | 3,595 | 21,017 | 3,557 | ||||||||||||
|
Net income per share – diluted |
$ | 0.38 | $ | 2.28 | $ | 0.35 | $ | 2.08 | ||||||||
|
8. |
RELATED PARTY |
A director of the Company serves as an officer of Ameritas Life Insurance Corp. (“Ameritas”). In connection with the Company’s regular assessment of its insurance-based associate benefits, which is conducted by an independent insurance broker, and the costs associated therewith, the Company purchases dental and vision insurance for certain of its associates from Ameritas. The total value of these purchases was $63,000 and $59,000 for the three-month periods ended September 30, 2017 and 2016, respectively, and $183,000 and $174,000 for the nine-month periods ended September 30, 2017 and 2016, respectively.
Mr. Hays, the Chief Executive Officer, majority shareholder and director of the Company, is an owner of 14% of the equity interest of Nebraska Global Investment Company LLC (“Nebraska Global”). The Company, directly or indirectly through its former subsidiary Customer-Connect LLC, purchased certain services from Nebraska Global, primarily consisting of software development services. The total value of these purchases were $68,000 and $488,000 in the three-month and nine-month periods ended September 30, 2016, respectively. There were no purchases from Nebraska Global in 2017.
Mr. Hays incurred approximately $538,000 of fees and expenses in connection with exploring strategic alternatives for the Company, including the proposed recapitalization (see Note 9), for which the Company has reimbursed Mr. Hays in the three and nine-month periods ended September 30, 2017.
During the three months ended September 30, 2017, the Company acquired a cost method investment in convertible preferred stock of PX. Prior to the investment, the Company entered into an agreement with PX, under which the Company acts as a reseller of PX services (the “PX reseller agreement”). Additionally, the Company acquired content licenses from PX for content that the Company includes in certain of its subscription services. The total revenue earned from the PX reseller agreement in the three and nine month periods ended September 30, 2017 was $159,000 and $454,000, respectively. There was no revenue earned during the three and nine month periods ended September 30, 2016. The total amount paid for licensed content from PX in the three and nine-month periods ended September 30, 2017 was $250,000. There were no such purchases in 2016.
|
9. |
PROPOSED RECAPITALIZATION |
In September 2017, the Company’s Board of Directors approved a 1-for-1,764,560 reverse stock split of the Company’s class B common stock followed by a 1,764,560-for-1 forward stock split that will cash out all holders of the Company's class B common stock, other than the Company's founder and chief executive officer.
In September 2017, the Company entered into a commitment letter with First National Bank of Omaha, which expires on December 29, 2017, to provide a senior secured term loan of $70 million, a senior secured delayed draw term loan facility of $20 million and a senior secured revolving line of credit facility in an amount equal to $10 million.
The proposed recapitalization is subject to closing of financing and approval by the holders of the Company’s class A common stock, class B common stock and both classes of stock voting together as a group.
The Company incurred expenses related to the proposed recapitalization of approximately $975,000 and $1.1 million in the three and nine months ended September 30, 2017, respectively, which are included in selling and administrative expenses. These expenses include the amount reimbursed to Mr. Hays (see Note 8).
|
10. |
RECENT ACCOUNTING PRONOUNCEMENTS |
In May 2014, the FASB issued Accounting Standards Update ("ASU") 2014-09, Revenue from Contracts with Customers (Topic 606) (“ASU 2014-09”). ASU 2014-09 requires an entity to recognize the amount of revenue to which it expects to be entitled for the transfer of promised goods or services to customers. ASU 2014-09 will replace most existing revenue recognition guidance in accounting principles generally accepted in the United States when it becomes effective. The standard is effective for annual and interim reporting periods in fiscal years beginning after December 15, 2017, with early adoption allowed for years beginning after December 15, 2016. An entity may choose to adopt ASU 2014-09 either retrospectively or through a cumulative effect adjustment as of the start of the first period for which it applies the standard. The Company is currently in the process of evaluating the impact that this new guidance will have on its consolidated financial statements as well as developing and testing changes to our processes and systems. Due to cost benefit considerations reviewed during the second quarter of 2017, the Company now plans to adopt the guidance beginning January 1, 2018 by recording a cumulative effect adjustment rather than retrospectively, as previously planned. The Company currently expects the most significant changes to result from deferring commissions and recognizing the expense over the estimated life of the client relationship rather than expensing as incurred, which is the Company’s current practice, and estimating variable consideration at the outset of the contract.
In January 2016, the FASB issued ASU 2016-01, Financial Instruments—Overall: Recognition and Measurement of Financial Assets and Financial Liabilities. ASU 2016-01 changes certain recognition, measurement, presentation and disclosure aspects related to financial instruments. ASU 2016-01 is effective for financial statements issued for fiscal years beginning after December 15, 2017, and interim periods within those fiscal years. Early adoption is not permitted. The Company believes its adoption will not significantly impact the Company’s results of operations and financial position.
In February 2016, the FASB issued ASU 2016-02, Leases (Topic 842). This ASU requires lessees to recognize a lease liability and a right-to-use asset for all leases, including operating leases, with a term greater than twelve months on its balance sheet. This ASU is effective in fiscal years beginning after December 15, 2018, with early adoption permitted, and requires a modified retrospective transition method. As of September 30, 2017, the Company had approximately $1.8 million of operating lease commitments which would be recorded on the balance sheet under the new guidance. However, the Company is currently in the process of further evaluating the impact that this new guidance will have on its consolidated financial statements and does not plan to elect early adoption.
In June 2016, the FASB issued ASU 2016-13, Financial Instruments – Credit Losses (Topic 326): Measurement of Credit Losses on Financial Instruments. This ASU will require the measurement of all expected credit losses for financial assets, including trade receivables, held at the reporting date based on historical experience, current conditions, and reasonable and supportable forecasts. The guidance is effective for annual reporting periods beginning after December 15, 2019 and interim periods within those fiscal years. The Company believes its adoption will not significantly impact the Company’s results of operations and financial position.
In August 2016, the FASB issued ASU 2016-15, Statement of Cash Flows (Topic 230) Classification of Certain Cash Receipts and Cash Payments which eliminates the diversity in practice related to eight cash flow classification issues. This ASU is effective for the Company on January 1, 2018 with early adoption permitted. The Company plans to adopt this ASU on January 1, 2018 and believes its adoption will not significantly impact the Company’s results of operations and financial position.
In October 2016, the FASB issued ASU 2016-16, Intra-Entity Transfers of Asset Other Than Inventory (“ASU 2016-16”), which requires entities to recognize the tax consequences of intercompany asset transfers other than inventory transfers in the period in which the transfer takes place. ASU 2016-16 is effective for fiscal years and interim periods within fiscal years beginning after December 15, 2017. ASU 2016-16 is to be adopted using a modified retrospective approach with a cumulative effect adjustment to retained earnings as of the beginning of the period of adoption. The cumulative effect adjustment will include recognition of the income tax consequences of intra-entity transfers of assets other than inventory that occur before the adoption date. The Company believes the adoption of ASU 2016-16 will not significantly impact the Company’s consolidated financial statements.
In November 2016, the FASB issued ASU 2016-18, Statement of Cash Flows (Topic 230), Restricted Cash (“ASU 2016-18”), which requires that the amounts generally described as restricted cash or restricted cash equivalents be included with cash and cash equivalents when reconciling the beginning-of-the period and end-of-period total amounts shown on the statement of cash flows. ASU 2016-18 does not provide a definition of restricted cash or restricted cash equivalents. ASU 2016-18 is effective for fiscal years and interim periods beginning after December 15, 2017. The Company does not expect the adoption of ASU 2016-18 to have any impact on the consolidated financial statements.
In January 2017, the FASB issued ASU 2017-04, Intangibles—Goodwill and Other (Topic 350), Simplifying the Test for Goodwill Impairment (“ASU 2017-04”). The new guidance eliminates Step 2 of the goodwill impairment testing which requires the fair value of individual assets and liabilities of a reporting unit to be determined when measuring goodwill impairment. The new guidance may result in different amounts of impairment that could be recognized compared to existing guidance. In addition, failing step 1 of the impairment test may not result in impairment under existing guidance. However, under the revised guidance, failing step 1 will always result in a goodwill impairment. ASU 2017-04 is to be applied prospectively for goodwill impairment testing performed in years beginning after December 15, 2019. The Company plans to adopt this guidance early with its annual impairment testing as of October 1, 2017 but does not believe the adoption will impact the Company's results of operations or financial position.
|
Management’s Discussion and Analysis of Financial Condition and Results of Operations |
The Company is a leading provider of analytics and insights that facilitate measurement and improvement of the patient and employee experience while also increasing patient engagement and customer loyalty for healthcare providers, payers and other healthcare organizations. The Company’s solutions enable its clients to understand the voice of the customer with greater clarity, immediacy and depth. NRC Health’s heritage, proprietary methods, and holistic approach enable our partners to better understand the people they care for and design experiences that inspire loyalty and trust, while also facilitating regulatory compliance and the shift to population-based health management. The Company’s ability to measure what matters most and systematically capture, analyze and deliver insights based on self-reported information from patients, families and consumers is critical in today’s healthcare market. NRC Health believes that access to and analysis of its extensive consumer-driven information is becoming more valuable as healthcare providers increasingly need to more deeply understand and engage patients and consumers in an effort towards effective population-based health management.
The Company’s portfolio of subscription-based solutions provide actionable information and analysis to healthcare organizations and payers across a range of mission-critical, constituent-related elements, including patient experience and satisfaction, community population health risks, workforce engagement, community perceptions, and physician engagement. NRC Health partners with clients across the continuum of healthcare services. The Company’s clients range from integrated health systems and post-acute providers, such as home health, long term care and hospice, to numerous payer organizations. The Company believes this cross-continuum positioning is a unique and an increasingly important capability as evolving payment models drive healthcare providers and payers towards a more collaborative and integrated service model.
Results of Operations
The following table and graphs set forth, for the periods indicated, select financial information derived from the Company’s condensed consolidated financial statements expressed as a percentage of total revenue. The trends illustrated may not necessarily be indicative of future results. The discussion that follows the table should be read in conjunction with the condensed consolidated financial statements.
|
Three months ended |
Nine months ended |
|||||||||||||||
|
September 30, |
September 30, |
|||||||||||||||
|
2017 |
2016 |
2017 |
2016 |
|||||||||||||
|
Revenue: |
100.0 |
% |
100.0 |
% |
100.0 |
% |
100.0 |
% |
||||||||
|
Operating expenses: |
||||||||||||||||
|
Direct |
42.4 | 42.4 | 41.9 | 41.6 | ||||||||||||
|
Selling, general and administrative |
29.1 | 26.4 | 25.1 | 26.9 | ||||||||||||
|
Depreciation and amortization |
3.9 | 4.0 | 3.8 | 3.9 | ||||||||||||
|
Total operating expenses |
75.4 | 72.8 | 70.8 | 72.4 | ||||||||||||
|
Operating income |
24.6 |
% |
27.2 |
% |
29.2 |
% |
27.6 |
% |
||||||||
Three Months Ended September 30, 2017, Compared to Three Months Ended September 30, 2016
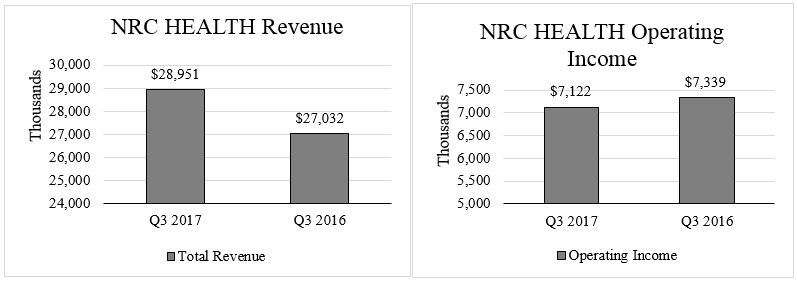
Revenue. Revenue for the three-month period ended September 30, 2017, increased 7.1% to $29.0 million, compared to $27.0 million in the three-month period ended September 30, 2016. The increase was due to new customer sales, as well as increases in sales to the existing client base.
Direct expenses. Direct expenses increased 7.0% to $12.3 million for the three-month period ended September 30, 2017, compared to $11.5 million in the same period in 2016. This was due to an increase in variable expenses of $302,000 and fixed expenses of $497,000. Variable expense increased mainly due increased costs to support the larger revenue and higher contracted voice recognition technology, phone costs, and labor costs, partially offset by decreased postage, printing and paper costs due to changes in survey methodologies. Fixed expenses increased primarily as a result of increased salary and benefit costs in the customer service area. Direct expenses as a percentage of revenue were 42.4% in the three-month periods ended September 30, 2017 and 2016.
Selling, general and administrative expenses. Selling, general and administrative expenses increased 18.1% to $8.4 million for the three-month period ended September 30, 2017, compared to $7.1 million for the same period in 2016, primarily due to expenses associated with the proposed recapitalization of $975,000, higher recruiting fees of $264,000, and increased computer supplies and software license fees of $142,000, partially offset by lower marketing expenses of $162,000. Selling, general, and administrative expenses increased as a percentage of revenue to 29.1% for the three-month period ended September 30, 2017, from 26.4% for the same period in 2016 as expenses increased by 18.1% while revenue for the same period increased by 7.1%.
Depreciation and amortization. Depreciation and amortization remained at $1.1 million for the three-month periods ended September 30, 2017 and 2016. Depreciation and amortization expenses as a percentage of revenue was 3.9% for the three-month period ended September 30, 2017, and 4.0% for the same period in 2016.
Provision for income taxes. Provision for income taxes was $3.0 million (42.1% effective tax rate) for the three-month period ended September 30, 2017, compared to $2.6 million (35.3% effective tax rate) for the same period in 2016. The effective tax rate for the three-month period ended September 30, 2017, was higher mainly due to $384,000 of additional tax expense from non-deductible proposed recapitalization expenses.
Nine Months Ended September 30, 2017, Compared to Nine Months Ended September 30, 2016
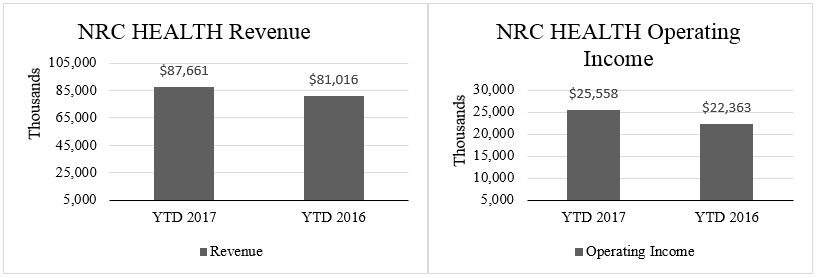
Revenue. Revenue for the nine-month period ended September 30, 2017, increased 8.2% to $87.7 million, compared to $81.0 million in the nine-month period ended September 30, 2016. The increase was due to new customer sales, as well as increases in sales to the existing client base.
Direct expenses. Direct expenses increased 8.8% to $36.7 million for the nine-month period ended September 30, 2017, compared to $33.7 million in the same period in 2016. This was due to an increase in variable expenses of $889,000 and fixed expenses of $2.1 million. Variable expense increased mainly increased costs to support the larger revenue and higher contracted voice recognition technology, phone costs, and labor costs, partially offset by decreased postage, printing and paper costs due to a reduction in postage fees and changes in survey methodologies. Fixed expenses increased primarily as a result of increased salary and benefit costs in the customer service area, partially offset by decreased contracted service costs. Direct expenses increased as a percentage of revenue to 41.9% in the nine-month period ended September 30, 2017, compared to 41.6% during the same period of 2016 as expenses increased by 8.8% while revenue for the same period increased by 8.2%.
Selling, general and administrative expenses. Selling, general and administrative expenses increased 1.2% to $22.0 million for the nine-month period ended September 30, 2017, compared to $21.8 million for the same period in 2016, primarily due to expenses associated with the proposed recapitalization of $1.1 million, higher recruiting fees of $412,000, and higher computer supplies and software license fees of $357,000, partially offset by lower salary and benefit costs (including lower incentives, commissions, and share based compensation expense totaling $970,000), lower travel costs of $180,000, $177,000 reduction due to shelf registration fees expensed in 2016, marketing expense decreases of $126,000 and lower development and training costs of $124,000. Selling, general, and administrative expenses decreased as a percentage of revenue to 25.1% for the nine-month period ended September 30, 2017, from 26.9% for the same period in 2016 as expenses increased by 1.2% while revenue for the same period increased by 8.2%.
Depreciation and amortization. Depreciation and amortization expenses increased to $3.4 million for the nine-month period ended September 30, 2017, compared to $3.1 million for the same period in 2016 primarily due to increased amortization of $314,000 from additional computer software investments, partially offset by decreased amortization of $66,000 as a result of certain intangibles becoming fully amortized. Depreciation and amortization expenses as a percentage of revenue was 3.8% and 3.9% for the nine-month periods ended September 30, 2017 and 2016, respectively.
Provision for income taxes. Provision for income taxes was $9.2 million (35.9% effective tax rate) for the nine-month period ended September 30, 2017, compared to $7.6 million (33.8% effective tax rate) for the same period in 2016. The effective tax rate for the nine-month period ended September 30, 2017 increased primarily from $384,000 of additional tax expense from non-deductible proposed recapitalization expenses, increases in the estimated state tax rates as well as a greater proportion of United States income subject to higher tax rates than Canadian income. The Company also had reduced tax expense in 2016 of $105,000 from United States federal tax examination adjustments, net of interest and penalties, and state tax return adjustments decreasing tax expense. These were partially offset by increased tax benefits of $149,000 in 2017 from the exercise of options and dividends paid to non-vested shareholders.
Liquidity and Capital Resources
The Company believes that its existing sources of liquidity, including cash and cash equivalents, borrowing availability, and operating cash flows will be sufficient to meet its projected capital and debt maturity needs and dividend policy for the foreseeable future.
As of September 30, 2017, our principal sources of liquidity included $35.8 million of cash and cash equivalents and up to $12.0 million of unused borrowings under our revolving credit note. Of this cash, $12.8 million was held in Canada. All of the amounts held in Canada are intended to be indefinitely reinvested in foreign operations. The amounts held in Canada are eligible for repatriation, but under current law, would be subject to U.S. federal income taxes less applicable foreign tax credits. The Company estimated at December 31, 2016, that an additional tax liability of $536,000 would become due if repatriation of undistributed earnings would occur.
Working Capital
The Company's working capital was $19.7 million and $15.6 million on September 30, 2017 and December 31, 2016, respectively. The change was primarily due to increases in cash and cash equivalents of $2.7 million, increases in trade accounts receivable of $2.7 million, increases in prepaid expenses of $1.5 million, decreases in current portion of notes payable of $990,000, and decreases in accrued wages, bonus, and profit sharing of $392,000. This was partially offset by increases in deferred revenue of $3.0 million and increases in income taxes payable of $1.2 million. Trade accounts receivable increased due to the timing of billings and collections on new and renewal contracts. Accrued wages, bonus and profit sharing decreased due to the payment of 2016 annual bonuses in the nine-month period ended September 30, 2017. Prepaid expenses changed due to the timing of vendor payments and pre-payments for services. Income taxes payable changed due to the timing of income tax payments. Current portion of notes payable decreased due to normal payment and amortization of the term note. The Company’s working capital is significantly impacted by its large deferred revenue balances which will vary based on the timing and frequency of billings on annual agreements. The deferred revenue balances as of September 30, 2017 and December 31, 2016 were $18.5 million and $15.5 million, respectively.
The deferred revenue balance is primarily due to timing of initial billings on new and renewal contracts. The Company typically invoices clients for performance tracking services and custom research projects before they have been completed. Billed amounts are recorded as billings in excess of revenue earned, or deferred revenue, on the Company’s consolidated financial statements, and are recognized as income when earned. In addition, when work is performed in advance of billing, the Company records this work as revenue earned in excess of billings, or unbilled revenue. Substantially all deferred revenue and all unbilled revenue will be earned and billed respectively, within 12 months of the respective period ends.
Cash Flow Analysis
A summary of operating, investing, and financing activities is shown in the following table:
|
Nine Months Ended September 30, |
||||||||
|
2017 |
2016 |
|||||||
|
(In thousands) |
||||||||
|
Provided by operating activities |
$ | 21,480 | $ | 18,019 | ||||
|
Used in investing activities |
(4,897 |
) |
(3,066 |
) |
||||
|
Used in financing activities |
(14,682 |
) |
(28,704 |
) |
||||
|
Effect of exchange rate change on cash |
828 | 484 | ||||||
|
Net change in cash and cash equivalents |
2,729 | (13,267 |
) |
|||||
|
Cash and cash equivalents at end of period |
$ | 35,750 | $ | 28,878 | ||||
Cash Flows from Operating Activities
Cash flows from operating activities consist of net income adjusted for non-cash items including depreciation and amortization, deferred taxes, share-based compensation and related taxes, reserve for uncertain tax positions and the effect of working capital changes.
Net cash provided by operating activities was $21.5 million for the nine months ended September 30, 2017, which included net income of $16.4 million, plus non-cash charges (benefits) for deferred tax expense, depreciation and amortization, reserve for uncertain tax positions and non-cash stock compensation totaling $4.9 million. Changes in working capital increased cash flows from operating activities by $109,000, primarily due to increases in deferred revenue, which fluctuate due to the timing and frequency of billings on new and renewal contracts, and increases in income taxes receivable and payable which fluctuate with the timing of income tax payments. These were partially offset by increases in trade accounts receivable and increases in prepaid expenses.
Net cash provided by operating activities was $18.0 million for the nine months ended September 30, 2016, which included net income of $14.8 million, plus non-cash charges (benefits) for deferred tax expense, depreciation and amortization, provision for uncertain tax positions and non-cash stock compensation totaling $5.6 million. Changes in working capital decreased 2016 cash flows from operating activities by $2.3 million, primarily due to increases in trade accounts receivable and prepaid expenses and a decrease in income taxes payable, net of increases in deferred revenue due to the timing of billing, collections and revenue recognition on new or renewal contracts.
Net cash provided by operating activities increased $3.5 million for the nine months ended September 30, 2017 compared to the nine months ended September 30, 2016. The increase was mainly due to an increase in net income of $1.6 million and working capital changes of $2.4 million. Working capital increased primarily due to changes in trade accounts receivable, income taxes receivable and payable, and prepaid expenses.
Cash Flows from Investing Activities
Net cash of $4.9 million and $3.1 million was used for investing activities in the nine months ended September 30, 2017 and 2016, respectively. Purchases of property and equipment totaled $3.3 million and $3.1 million in the nine months ended September 30, 2017 and 2016, respectively. In addition, the Company used $1.3 million of cash in the three months ended September 30, 2017 to acquire a strategic investment in PX.
Cash Flows from Financing Activities
Net cash used in financing activities was $14.7 million in the nine months ended September 30, 2017. Cash was used to repay borrowings under the term note totaling $1.8 million and for capital lease obligations of $81,000. Cash was also used to pay $12.6 million of dividends on common stock, and to pay payroll tax withholdings related to share-based compensation of $105,000.
Net cash used in financing activities was $28.7 million in the nine months ended September 30, 2016. The exercise of stock options provided cash of $548,000. Cash was used to pay payroll taxes on vested restricted shares of $204,000, to pay capital lease obligations of $73,000, to repay borrowings under the term note totaling $1.8 million, to pay dividends on common stock of $25.2 million, and to pay $2.0 million for Customer-Connect LLC non-controlling interests.
The effect of changes in foreign exchange rates increased cash and cash equivalents by $828,000 and $484,000 in the nine months ended September 30, 2017 and 2016, respectively.
Capital Expenditures
Cash paid for capital expenditures was $3.3 million for the nine months ended September 30, 2017. These expenditures consisted mainly of computer software classified in property and equipment. The Company expects similar capital expenditure purchases for the remainder of 2017 consisting primarily of computer software and hardware and other equipment to be funded through cash generated from operations.
Debt and Equity
The Company’s term note is payable in monthly installments of $212,468. Borrowings under the term note bear interest at an annual rate of 3.12%. The outstanding balance of the term note at September 30, 2017 was $1.7 million.
The Company also has a revolving credit note which was amended and extended effective June 30, 2017 with a maturity date of June 30, 2018. The maximum aggregate amount available under the revolving credit note is $12.0 million. Borrowings under the revolving credit note bear interest at a variable annual rate, with three rate options at the discretion of management as follows: (1) 2.1% plus the one-month London Interbank Offered Rate (“LIBOR”) or (2) 2.1% plus the one-, two- or three- month LIBOR rate, or (3) the bank’s one-, two, three, six, or twelve month Money Market Loan Rate. As of September 30, 2017 the revolving credit note did not have a balance. The Company had the capacity to borrow $12.0 million as of September 30, 2017.
The term note and revolving credit note are secured by certain of the Company’s assets, including the Company’s land, building, trade accounts receivable and intangible assets. The term note and revolving credit note contain various restrictions and covenants applicable to the Company, including requirements that the Company maintain certain financial ratios at prescribed levels and restrictions on the ability of the Company to consolidate or merge, create liens, incur additional indebtedness or dispose of assets. As of September 30, 2017, the Company was in compliance with its financial covenants.
The Company has capital leases for computer equipment, office equipment, printing and inserting equipment. The balance of the capital leases as of September 30, 2017 was $185,000.
Shareholders’ equity increased $6.0 million to $88.8 million at September 30, 2017, from $82.8 million at December 31, 2016. The increase was mainly due to net income of $16.4 million, share-based compensation of $1.3 million and changes in the cumulative translation adjustment of $1.1 million. This was partially offset by dividends declared of $12.7 million.
In September 2017, the Company’s Board of Directors approved a 1-for-1,764,560 reverse stock split of the Company’s class B common stock followed by a 1,764,560-for-1 forward stock split that will cash out all holders of the Company's class B common stock, other than the Company's founder and chief executive officer. Outstanding unvested share based awards of class B common stock will vest immediately preceding the reverse stock split. Each holder of class B common stock, other than the Company’s founder and chief executive officer, will receive a cash payment from the Company of $53.44 for each share of class B common stock. The class B common stock will cease trading and be delisted. The transaction is designed to address shareholder concerns with public market trading confusion related to the Company’s two classes of common stock (the class A common stock and class B common stock) and to provide a timely and cost-effective liquidity event for the holders of the Company’s class B common stock. The transaction will be funded by cash on hand in the United States, a $70 million term loan and borrowings on a line of credit.
In September 2017, the Company entered into a commitment letter with First National Bank of Omaha (“FNB”), which expires on December 29, 2017, to provide a senior secured term loan of $70 million (the “Term Loan”), a senior secured delayed draw term loan facility of $20 million (the “Delayed Draw Term Loan”) and a senior secured revolving line of credit facility in an amount equal to $10 million (the “Line of Credit” and, collectively with the Term Loan and the Delayed Draw Term Loan, the “Credit Facilities”). If the Company closes on the Credit Facilities with FNB, any balances remaining on the existing term note and revolving credit note will be repaid. The Term Loan will be used to fund, in part, the reverse stock split, related costs and cashing out outstanding stock options and restricted shares tied to the class B common stock. The Delayed Draw Term Loan, if used, is designated to fund any future business acquisitions or repurchasing of class A common stock. The Line of Credit has a three year term and will be used to fund ongoing working capital needs and for other general corporate purpose. The Company will also pay loan origination fees equal to 0.25% of the amount borrowed under the Term Loan at closing.
The proposed recapitalization is subject to closing of financing and approval by the holders of the Company’s class A common stock, class B common stock and both classes of stock voting together as a group. The Company incurred expenses related to the proposed recapitalization of approximately $975,000 and $1.1 million in the three and nine months ended September 30, 2017, respectively, which are included in selling and administrative expenses.
Contractual Obligations
The Company had contractual obligations to make payments in the following amounts in the future as of September 30, 2017:
|
Contractual Obligations(1) |
Total Payments |
Remainder |
One to Three Years |
Three to Five Years |
After Five Years |
|||||||||||||||
|
(In thousands) |
||||||||||||||||||||
|
Operating leases |
$ | 1,820 | $ | 190 | $ | 1,143 | $ | 487 | $ | -- | ||||||||||
|
Capital leases |
203 | 30 | 130 | 42 | 1 | |||||||||||||||
|
Uncertain tax positions(2) |
-- | -- | -- | -- | -- | |||||||||||||||
|
Long-term debt |
1,711 | 848 | 863 | -- | -- | |||||||||||||||
|
Total |
$ | 3,734 | $ | 1,068 | $ | 2,136 | $ | 529 | $ | 1 | ||||||||||
|
(1) |
Amounts are inclusive of interest payments, where applicable. |
|
(2) |
We have $769,000 in liabilities associated with uncertain tax positions. We are unable to reasonably estimate the expected cash settlement dates of these uncertain tax positions with the taxing authorities. |
Stock Repurchase Program
The Board of Directors of the Company authorized the repurchase of up to 2,250,000 class A and 375,000 class B shares of common stock in the open market or in privately negotiated transactions under a stock repurchase program that was originally approved in February 2006 and subsequently amended in May 2013. As of September 30, 2017 the remaining number of common stock shares that could be purchased under this authorization was 280,491 class A shares and 69,491 class B shares.
|
Quantitative and Qualitative Disclosures about Market Risk |
There are no material changes to the disclosures regarding the Company’s market risk exposures made in its Annual Report on Form 10-K for the year ended December 31, 2016.
|
Controls and Procedures |
The Company’s management, with the participation of the Company’s Chief Executive Officer and Chief Financial Officer, has evaluated the effectiveness of the design and operation of the Company’s disclosure controls and procedures (as such term is defined in Rules 13a-15(e) and 15d-15(e) under the Securities Exchange Act of 1934) as of the end of the period covered by this report, and has concluded that, as of the end of such period, the Company’s disclosure controls and procedures were effective.
There have been no changes in the Company’s internal control over financial reporting (as such term is defined in Rules 13a-15(f) and 15d-15(f) under the Securities Exchange Act of 1934) that occurred during the quarter ended September 30, 2017, that have materially affected, or are reasonably likely to materially affect, the Company’s internal control over financial reporting.
|
ITEM 1A. |
Risk Factors |
There have been no material changes to the risk factors relating to the Company set forth in Part I, Item 1A of its Annual Report on Form 10-K for the year ended December 31, 2016.
|
ITEM 2. |
Unregistered Sales of Equity Securities and Use of Proceeds |
The Board of Directors of the Company authorized the repurchase of up to 2,250,000 class A and 375,000 class B shares of common stock in the open market or in privately negotiated transactions under a stock repurchase program that was originally approved in February 2006 and subsequently amended in May 2013. Unless terminated earlier by resolution of the Company’s Board of Directors, the repurchase program will expire when the Company has repurchased all shares authorized for repurchase thereunder. As of October 27, 2017, 1,969,509 shares of class A common stock and 305,509 shares of class B common stock have been repurchased under that authorization. No stock was repurchased under the program during the three-month period ended September 30, 2017.
|
ITEM 6. |
Exhibits |
The exhibits listed in the exhibit index below are filed as part of this Quarterly Report on Form 10-Q.
EXHIBIT INDEX
|
(31.1) |
|
(31.2) |
|
(32) |
|
(101)* |
Financial statements from the Quarterly Report on Form 10-Q of National Research Corporation for the quarter ended September 30, 2017, formatted in eXtensible Business Reporting Language (XBRL): (i) the Condensed Consolidated Balance Sheets, (ii) the Condensed Consolidated Statements of Income, (iii) the Condensed Consolidated Statements of Comprehensive Income, (iv) the Condensed Consolidated Statements of Cash Flows, (v) the Notes to Condensed Consolidated Financial Statements, and (vi) document and entity information. |
|
* |
In accordance with Rule 406T of Regulation S-T, the information in these exhibits shall not be deemed to be “filed” for purposes of Section 18 of the Securities Exchange Act of 1934, as amended, or otherwise subject to liability under that section, and shall not be incorporated by reference into any registration statement or other document filed under the Securities Act of 1933, as amended, except as expressly set forth by specific reference in such filing. |
Pursuant to the requirements of the Securities Exchange Act of 1934, the Registrant has duly caused this report to be signed on its behalf by the undersigned thereunto duly authorized.
|
|
NATIONAL RESEARCH CORPORATION |
|
|
|
|
|
|
|
|
|
|
|
|
|
Date: November 9, 2017 |
By: |
/s/ Michael D. Hays |
|
|
|
|
Michael D. Hays |
|
|
|
|
Chief Executive Officer (Principal Executive Officer) |
|
|
|
|
|
|
|
|
|
|
|
|
|
|
|
|
|
Date: November 9, 2017 |
By: |
/s/ Kevin R. Karas |
|
|
|
|
Kevin R. Karas Senior Vice President Finance, Treasurer, Secretary and Chief Financial Officer (Principal Financial and Accounting Officer) |
|
-26-