Attached files
| file | filename |
|---|---|
| EX-32.1 - CHIEF EXECUTIVE OFFICER 906 CERTIFICATION - DYNEGY INC. | dyn-2017930xex321.htm |
| EX-32.2 - CHIEF FINANCIAL OFFICER 906 CERTIFICATION - DYNEGY INC. | dyn-2017930xex322.htm |
| EX-31.2 - CHIEF FINANCIAL OFFICER 302 CERTIFICATION - DYNEGY INC. | dyn-2017930xex312.htm |
| EX-31.1 - CHIEF EXECUTIVE OFFICER 302 CERTIFICATION - DYNEGY INC. | dyn-2017930xex311.htm |
UNITED STATES
SECURITIES AND EXCHANGE COMMISSION
Washington, D.C. 20549
FORM 10-Q
ý QUARTERLY REPORT PURSUANT TO SECTION 13 OR 15(d) OF THE SECURITIES EXCHANGE ACT OF 1934
For the quarterly period ended September 30, 2017
o TRANSITION REPORT PURSUANT TO SECTION 13 OR 15(d) OF THE SECURITIES EXCHANGE ACT OF 1934
For the transition period from ________ to ________
Commission file number: 001-33443
DYNEGY INC.
(Exact name of registrant as specified in its charter)
State of Incorporation | I.R.S. Employer Identification No. | |
Delaware | 20-5653152 | |
601 Travis, Suite 1400 | ||
Houston, Texas | 77002 | |
(Address of principal executive offices) | (Zip Code) | |
(713) 507-6400
(Registrant’s telephone number, including area code)
Indicate by check mark whether the registrant (1) has filed all reports required to be filed by Section 13 or 15(d) of the Securities Exchange Act of 1934 during the preceding 12 months (or for such shorter period that the registrant was required to file such reports), and (2) has been subject to such filing requirements for the past 90 days. Yes x No ¨
Indicate by check mark whether the registrant has submitted electronically and posted on its corporate web site, if any, every Interactive Data File required to be submitted and posted pursuant to Rule 405 of Regulation S-T (§232.405 of this chapter) during the preceding 12 months (or for such shorter period that the registrant was required to submit and post such files). Yes x No ¨
Indicate by check mark whether the registrant is a large accelerated filer, an accelerated filer, a non-accelerated filer, a smaller reporting company, or an emerging growth company. See definitions of “large accelerated filer,” “accelerated filer,” “smaller reporting company” and “emerging growth company” in Rule 12b-2 of the Exchange Act.
Large accelerated filer ý | Accelerated filer o | |
Non-accelerated filer o | Smaller reporting company o | |
(Do not check if a smaller reporting company) | Emerging growth company o | |
If an emerging growth company, indicate by check mark if the registrant has elected not to use the extended transition period for complying with any new or revised financial accounting standards provided pursuant to Section 13(a) of the Exchange Act. ¨
Indicate by check mark whether the registrant is a shell company (as defined in Rule 12b-2 of the Exchange Act). Yes ¨ No x
Indicate by check mark whether the registrant filed all documents and reports required to be filed by Sections 12, 13 or 15(d) of the Securities Exchange Act of 1934 subsequent to the distribution of securities under a plan confirmed by a court. Yes x No ¨
Indicate the number of shares outstanding of our class of common stock, as of the latest practicable date: Common stock, $0.01 par value per share, 131,378,891 shares outstanding as of October 31, 2017.
TABLE OF CONTENTS
Page | ||
Item 1. | ||
Item 2. | ||
Item 3. | ||
Item 4. | ||
Item 1. | ||
Item 1A. | ||
Item 4. | ||
Item 6. | ||
DEFINITIONS
As used in this Form 10-Q, the abbreviations contained herein have the meanings set forth below.
ATSI | American Transmission Service, Inc. | |
CAA | Clean Air Act | |
CAISO | The California Independent System Operator | |
CDD | Cooling Degree Days | |
COMED | Commonwealth Edison | |
CT | Combustion Turbine | |
EBITDA | Earnings Before Interest, Taxes, Depreciation and Amortization | |
EMAAC | Eastern Mid-Atlantic Area Council | |
EPA | Environmental Protection Agency | |
ERCOT | Electric Reliability Council of Texas | |
FCA | Forward Capacity Auction | |
FERC | Federal Energy Regulatory Commission | |
FTR | Financial Transmission Rights | |
HDD | Heating Degree Days | |
IMA | In-market Asset Availability | |
IPH | IPH, LLC | |
ISO | Independent System Operator | |
ISO-NE | Independent System Operator New England | |
kW | Kilowatt | |
LIBOR | London Interbank Offered Rate | |
MAAC | Mid-Atlantic Area Council | |
MISO | Midcontinent Independent System Operator, Inc. | |
MMBtu | One Million British Thermal Units | |
Moody’s | Moody’s Investors Service Inc. | |
MW | Megawatts | |
MWh | Megawatt Hour | |
NYISO | New York Independent System Operator | |
PJM | PJM Interconnection, LLC | |
PPE | Ponderosa Pine Energy, LLC | |
PPL | PPL Electric Utilities, Corp. | |
PRIDE | Producing Results through Innovation by Dynegy Employees | |
RGGI | Regional Greenhouse Gas Initiative | |
RTO | Regional Transmission Organization | |
S&P | Standard & Poor’s Ratings Services | |
SEC | U.S. Securities and Exchange Commission | |
i
PART I. FINANCIAL INFORMATION
Item 1—FINANCIAL STATEMENTS
DYNEGY INC.
CONSOLIDATED BALANCE SHEETS
(unaudited) (in millions, except share data)
September 30, 2017 | December 31, 2016 | |||||||
ASSETS | ||||||||
Current Assets | ||||||||
Cash and cash equivalents | $ | 613 | $ | 1,776 | ||||
Restricted cash | — | 62 | ||||||
Accounts receivable, net of allowance for doubtful accounts of $1 and $1, respectively | 478 | 386 | ||||||
Inventory | 429 | 445 | ||||||
Assets from risk management activities | 50 | 130 | ||||||
Intangible assets | 24 | 38 | ||||||
Prepayments and other current assets | 110 | 150 | ||||||
Total Current Assets | 1,704 | 2,987 | ||||||
Property, plant and equipment, net | 8,929 | 7,121 | ||||||
Investment in unconsolidated affiliate | 154 | — | ||||||
Restricted cash | — | 2,000 | ||||||
Assets from risk management activities | 49 | 16 | ||||||
Goodwill | 772 | 799 | ||||||
Intangible assets | 49 | 23 | ||||||
Assets held-for-sale | 181 | — | ||||||
Other long-term assets | 169 | 107 | ||||||
Total Assets | $ | 12,007 | $ | 13,053 | ||||
See the notes to consolidated financial statements.
1
DYNEGY INC.
CONSOLIDATED BALANCE SHEETS
(unaudited) (in millions, except share data)
September 30, 2017 | December 31, 2016 | |||||||
LIABILITIES AND EQUITY | ||||||||
Current Liabilities | ||||||||
Accounts payable | $ | 288 | $ | 332 | ||||
Accrued interest | 154 | 81 | ||||||
Intangible liabilities | 18 | 21 | ||||||
Accrued taxes | 57 | 45 | ||||||
Accrued liabilities and other current liabilities | 136 | 88 | ||||||
Liabilities from risk management activities | 58 | 97 | ||||||
Asset retirement obligations | 57 | 51 | ||||||
Debt, current portion, net | 99 | 201 | ||||||
Total Current Liabilities | 867 | 916 | ||||||
Liabilities subject to compromise (Note 18) | — | 832 | ||||||
Debt, long-term portion, net | 8,648 | 8,778 | ||||||
Liabilities from risk management activities | 20 | 43 | ||||||
Asset retirement obligations | 268 | 236 | ||||||
Deferred income taxes | 18 | 5 | ||||||
Intangible liabilities | 36 | 34 | ||||||
Other long-term liabilities | 166 | 170 | ||||||
Total Liabilities | 10,023 | 11,014 | ||||||
Commitments and Contingencies (Note 13) | ||||||||
Stockholders’ Equity | ||||||||
Preferred stock, $0.01 par value, 20,000,000 shares authorized: | ||||||||
Series A 5.375% mandatory convertible preferred stock, $0.01 par value; 4,000,000 shares issued and outstanding, respectively | 400 | 400 | ||||||
Common stock, $0.01 par value, 420,000,000 shares authorized; 142,699,979 shares issued and 131,373,857 shares outstanding at September 30, 2017; 128,626,740 shares issued and 117,300,618 outstanding at December 31, 2016 | 1 | 1 | ||||||
Additional paid-in capital | 3,320 | 3,547 | ||||||
Accumulated other comprehensive income, net of tax | 26 | 21 | ||||||
Accumulated deficit | (1,758 | ) | (1,927 | ) | ||||
Total Dynegy Stockholders’ Equity | 1,989 | 2,042 | ||||||
Noncontrolling interest | (5 | ) | (3 | ) | ||||
Total Equity | 1,984 | 2,039 | ||||||
Total Liabilities and Equity | $ | 12,007 | $ | 13,053 | ||||
See the notes to consolidated financial statements.
2
DYNEGY INC.
CONSOLIDATED STATEMENTS OF OPERATIONS
(unaudited) (in millions, except per share data)
Three Months Ended September 30, | Nine Months Ended September 30, | |||||||||||||||
2017 | 2016 | 2017 | 2016 | |||||||||||||
Revenues | $ | 1,437 | $ | 1,184 | $ | 3,848 | $ | 3,211 | ||||||||
Cost of sales, excluding depreciation expense | (787 | ) | (660 | ) | (2,225 | ) | (1,698 | ) | ||||||||
Gross margin | 650 | 524 | 1,623 | 1,513 | ||||||||||||
Operating and maintenance expense | (236 | ) | (218 | ) | (750 | ) | (695 | ) | ||||||||
Depreciation expense | (202 | ) | (163 | ) | (611 | ) | (494 | ) | ||||||||
Impairments | (29 | ) | (212 | ) | (148 | ) | (857 | ) | ||||||||
Loss on sale of assets, net | (78 | ) | — | (107 | ) | — | ||||||||||
General and administrative expense | (44 | ) | (41 | ) | (126 | ) | (117 | ) | ||||||||
Acquisition and integration costs | (3 | ) | (7 | ) | (55 | ) | (8 | ) | ||||||||
Other | — | — | 1 | (16 | ) | |||||||||||
Operating income (loss) | 58 | (117 | ) | (173 | ) | (674 | ) | |||||||||
Bankruptcy reorganization items (Note 18) | 12 | — | 494 | — | ||||||||||||
Earnings from unconsolidated investments | 4 | 4 | 4 | 7 | ||||||||||||
Interest expense | (161 | ) | (166 | ) | (478 | ) | (449 | ) | ||||||||
Loss on early extinguishment of debt (Note 12) | (66 | ) | — | (75 | ) | — | ||||||||||
Other income and expense, net | 19 | 29 | 65 | 60 | ||||||||||||
Loss before income taxes | (134 | ) | (250 | ) | (163 | ) | (1,056 | ) | ||||||||
Income tax benefit (expense) (Note 14) | 1 | 1 | 330 | (6 | ) | |||||||||||
Net income (loss) | (133 | ) | (249 | ) | 167 | (1,062 | ) | |||||||||
Less: Net loss attributable to noncontrolling interest | (1 | ) | — | (2 | ) | (2 | ) | |||||||||
Net income (loss) attributable to Dynegy Inc. | (132 | ) | (249 | ) | 169 | (1,060 | ) | |||||||||
Less: Dividends on preferred stock | 5 | 5 | 16 | 16 | ||||||||||||
Net income (loss) attributable to Dynegy Inc. common stockholders | $ | (137 | ) | $ | (254 | ) | $ | 153 | $ | (1,076 | ) | |||||
Earnings (Loss) Per Share (Note 16): | ||||||||||||||||
Basic earnings (loss) per share attributable to Dynegy Inc. common stockholders | $ | (0.89 | ) | $ | (1.81 | ) | $ | 1.01 | $ | (8.54 | ) | |||||
Diluted earnings (loss) per share attributable to Dynegy Inc. common stockholders | $ | (0.89 | ) | $ | (1.81 | ) | $ | 0.96 | $ | (8.54 | ) | |||||
Basic shares outstanding | 154 | 140 | 152 | 126 | ||||||||||||
Diluted shares outstanding | 154 | 140 | 159 | 126 | ||||||||||||
See the notes to consolidated financial statements.
3
DYNEGY INC.
CONSOLIDATED STATEMENTS OF COMPREHENSIVE INCOME (LOSS)
(unaudited) (in millions)
Three Months Ended September 30, | Nine Months Ended September 30, | |||||||||||||||
2017 | 2016 | 2017 | 2016 | |||||||||||||
Net income (loss) | $ | (133 | ) | $ | (249 | ) | $ | 167 | $ | (1,062 | ) | |||||
Other comprehensive income before reclassifications: | ||||||||||||||||
Actuarial gain and plan amendment (net of tax of zero, zero, $4, and zero for each respective period) | — | — | 11 | — | ||||||||||||
Amounts reclassified from accumulated other comprehensive income: | ||||||||||||||||
Amortization of unrecognized prior service credit (net of tax of zero for each respective period) | (2 | ) | (2 | ) | (6 | ) | (4 | ) | ||||||||
Other comprehensive income (loss), net of tax | (2 | ) | (2 | ) | 5 | (4 | ) | |||||||||
Comprehensive income (loss) | (135 | ) | (251 | ) | 172 | (1,066 | ) | |||||||||
Less: Comprehensive loss attributable to noncontrolling interest | (1 | ) | — | (2 | ) | (2 | ) | |||||||||
Total comprehensive income (loss) attributable to Dynegy Inc. | $ | (134 | ) | $ | (251 | ) | $ | 174 | $ | (1,064 | ) | |||||
See the notes to consolidated financial statements.
4
DYNEGY INC.
CONSOLIDATED STATEMENTS OF CASH FLOWS
(unaudited) (in millions)
Nine Months Ended September 30, | ||||||||
2017 | 2016 | |||||||
CASH FLOWS FROM OPERATING ACTIVITIES: | ||||||||
Net income (loss) | $ | 167 | $ | (1,062 | ) | |||
Adjustments to reconcile net income (loss) to net cash flows from operating activities: | ||||||||
Depreciation expense | 611 | 494 | ||||||
Non-cash interest expense | 36 | 37 | ||||||
Amortization of intangibles | 13 | 17 | ||||||
Risk management activities | (38 | ) | (75 | ) | ||||
Loss on sale of assets, net | 107 | — | ||||||
Loss on early extinguishment of debt | 75 | — | ||||||
Earnings from unconsolidated investments | (4 | ) | (7 | ) | ||||
Deferred income taxes | (330 | ) | 6 | |||||
Impairments | 148 | 857 | ||||||
Change in value of common stock warrants | (16 | ) | (5 | ) | ||||
Bankruptcy reorganization items | (494 | ) | — | |||||
Other | 50 | 1 | ||||||
Changes in working capital: | ||||||||
Accounts receivable, net | (20 | ) | 32 | |||||
Inventory | 106 | 153 | ||||||
Prepayments and other current assets | 81 | 179 | ||||||
Accounts payable and accrued liabilities | 9 | 104 | ||||||
Distributions from unconsolidated investments | 2 | 1 | ||||||
Changes in non-current assets | (2 | ) | (16 | ) | ||||
Changes in non-current liabilities | — | 12 | ||||||
Net cash provided by operating activities | 501 | 728 | ||||||
CASH FLOWS FROM INVESTING ACTIVITIES: | ||||||||
Capital expenditures | (129 | ) | (337 | ) | ||||
Acquisitions, net of cash acquired | (3,249 | ) | — | |||||
Distributions from unconsolidated investments | 7 | 14 | ||||||
Proceeds received from asset sales, net | 600 | — | ||||||
Other investing | — | 10 | ||||||
Net cash used in investing activities | (2,771 | ) | (313 | ) | ||||
CASH FLOWS FROM FINANCING ACTIVITIES: | ||||||||
Proceeds from long-term borrowings, net of debt issuance costs | 1,747 | 2,277 | ||||||
Repayments of borrowings | (2,261 | ) | (21 | ) | ||||
Proceeds from issuance of equity, net of issuance costs | 150 | 359 | ||||||
Payments of debt extinguishment costs | (50 | ) | — | |||||
Preferred stock dividends paid | (16 | ) | (16 | ) | ||||
Interest rate swap settlement payments | (15 | ) | (13 | ) | ||||
Acquisition of noncontrolling interest | (375 | ) | — | |||||
Payments related to bankruptcy settlement | (133 | ) | — | |||||
Other financing | (2 | ) | (2 | ) | ||||
Net cash provided by (used in) financing activities | (955 | ) | 2,584 | |||||
Net increase (decrease) in cash, cash equivalents and restricted cash | (3,225 | ) | 2,999 | |||||
Cash, cash equivalents and restricted cash, beginning of period | 3,838 | 544 | ||||||
Cash, cash equivalents and restricted cash, end of period | $ | 613 | $ | 3,543 | ||||
See the notes to consolidated financial statements.
5
DYNEGY INC.
NOTES TO CONSOLIDATED FINANCIAL STATEMENTS
(Unaudited)
For the Interim Periods Ended September 30, 2017 and 2016
Note 1—Basis of Presentation and Organization
The accompanying unaudited consolidated financial statements have been prepared in accordance with the instructions to interim financial reporting as prescribed by the SEC. The year-end consolidated balance sheet data was derived from audited consolidated financial statements, but does not include all disclosures required by the Generally Accepted Accounting Principles of the United States of America (“GAAP”). The unaudited consolidated financial statements contained in this report include all material adjustments of a normal recurring nature that, in the opinion of management, are necessary for a fair presentation of the results for the interim periods. Certain prior period amounts in our unaudited consolidated financial statements have been reclassified to conform to current year presentation. These interim financial statements should be read together with the consolidated financial statements and notes thereto included in our annual report on Form 10-K for the year ended December 31, 2016, filed with the SEC on February 24, 2017, which we refer to as our “Form 10-K.” Unless the context indicates otherwise, throughout this report, the terms “Dynegy,” “the Company,” “we,” “us,” “our,” and “ours” are used to refer to Dynegy Inc. and its direct and indirect subsidiaries.
We sell electric energy, capacity and ancillary services primarily on a wholesale basis from our power generation facilities. We also serve residential, municipal, commercial and industrial customers primarily in MISO, PJM and NY/NE through our Homefield Energy and Dynegy Energy Services retail businesses. We report the results of our power generation business as six segments in our unaudited consolidated financial statements: (i) PJM, (ii) ISO-NE/NYISO (“NY/NE”), (iii) ERCOT, (iv) MISO, (v) IPH, and (vi) CAISO. Our consolidated financial results also reflect corporate-level expenses such as general and administrative expense, interest expense, and income tax benefit (expense). All significant intercompany transactions have been eliminated. Please read Note 19—Segment Information for further discussion.
On February 2, 2017 (the “Emergence Date”), Illinois Power Generating Company (“Genco”) emerged from bankruptcy. Please read Note 18—Genco Chapter 11 Bankruptcy and Emergence for further discussion.
Note 2—Accounting Policies
The accounting policies followed by the Company are set forth in Note 2—Summary of Significant Accounting Policies in our Form 10-K. The accompanying unaudited consolidated financial statements include our accounts and the accounts of our majority-owned or controlled subsidiaries. Accounting policies for all of our operations are in accordance with GAAP. Except for the adoption of new policies as described below, there have been no significant changes to our accounting policies during the nine months ended September 30, 2017.
Use of Estimates. The preparation of unaudited consolidated financial statements in conformity with GAAP requires management to make informed estimates and judgments that affect our reported financial position and results of operations based on currently available information. Actual results could differ materially from our estimates. The results of operations for the interim periods presented in this Form 10-Q are not necessarily indicative of the results to be expected for the full year or any other interim period due to seasonal fluctuations in demand for our energy products and services, changes in commodity prices, timing of maintenance and other expenditures, and other factors.
Accounting Standards Adopted
Statement of Cash Flows. In August 2016, the Financial Accounting Standards Board (“FASB”) issued Accounting Standards Update (“ASU”) 2016-15-Statement of Cash Flows (Topic 230): Classification of Certain Cash Receipts and Cash Payments. To reduce current and future diversity in practice, the amendments in this ASU provide guidance for several cash flow classification issues identified where current GAAP is either unclear or does not include specific guidance. We adopted this ASU on January 1, 2017 and applied the amendments on a retrospective basis. The adoption of this ASU affected the classification of prepayments for future planned outage work performed under long-term service agreements. The majority of the cash prepayments required under these agreements will now be reflected as cash outflows from investing activities and the remainder will be classified as cash outflows from operating activities, based on whether they are anticipated to be expensed or capitalized. As a result of the retrospective application of this ASU, we reclassified approximately $80 million of cash prepayments from operating activities to investing activities in our unaudited consolidated statement of cash flows for the nine months ended September 30, 2016.
In November 2016, the FASB issued ASU 2016-18-Statement of Cash Flows (Topic 230): Restricted Cash. The amendments in this ASU require that a statement of cash flows explains the change during the period in the total of cash, cash equivalents, and amounts generally described as restricted cash or restricted cash equivalents. Therefore, amounts generally described as restricted cash and restricted cash equivalents should be included with cash and cash equivalents when reconciling
6
DYNEGY INC.
NOTES TO CONSOLIDATED FINANCIAL STATEMENTS
(Unaudited)
For the Interim Periods Ended September 30, 2017 and 2016
the beginning-of-period and end-of-period total amounts shown on the statement of cash flows. We adopted this ASU as of January 1, 2017 and applied the amendments on a retrospective basis. As a result of the retrospective application of this ASU, changes in restricted cash of $1 million and $2.045 billion previously reflected as cash flows from operating activities and investing activities, respectively, are now reflected in Net increase (decrease) in cash, cash equivalents, and restricted cash in our unaudited consolidated statement of cash flows for the nine months ended September 30, 2016. Additionally, restricted cash of $39 million and $2.085 billion are now reflected in the beginning of period and end of period cash, cash equivalents and restricted cash line items, respectively, in our unaudited consolidated statement of cash flows for the nine months ended September 30, 2016. Please read Note 7—Cash Flow Information for further discussion.
Compensation. In March 2016, the FASB issued ASU 2016-09-Compensation-Stock Compensation (Topic 718): Improvements to Employee Share-Based Payment Accounting. The amendments in this ASU simplify several aspects of the accounting for share-based payment transactions, including the income tax consequences, classification of awards as either equity or liabilities and classification on the statement of cash flows. We adopted this ASU on January 1, 2017 with no material impact on our unaudited consolidated financial statements.
Goodwill. In January 2017, the FASB issued ASU 2017-04-Intangibles-Goodwill and Other (Topic 350): Simplifying the Test for Goodwill Impairment. To simplify the subsequent measure of goodwill, the amendments in this ASU eliminate step two from the goodwill impairment test. An entity will no longer be required to calculate the implied fair value of goodwill by assigning the fair value of a reporting unit to all of its assets and liabilities as if the reporting unit had been acquired in a business combination to determine the impairment of goodwill. The amendments in this ASU will now require goodwill impairment to be measured by the amount by which the carrying value of the reporting unit exceeds its fair value. The guidance in this ASU is effective for fiscal years, and interim periods within those fiscal years, beginning after December 15, 2019. Upon adoption, an entity shall apply the guidance in this ASU prospectively with early adoption permitted for annual goodwill tests performed after January 1, 2017. We adopted this ASU on January 1, 2017 with no material impact on our unaudited consolidated financial statements.
Accounting Standards Not Yet Adopted
Business Combinations. In January 2017, the FASB issued ASU 2017-01-Business Combinations (Topic 805): Clarifying the Definition of a Business. The amendments in this ASU clarify the definition of a business. The amendments affect all companies and other reporting organizations that must determine whether they have acquired or sold a business. The guidance in this ASU is effective for fiscal years, and interim periods within those fiscal years, beginning after December 15, 2017, with early adoption permitted. We are currently evaluating this ASU and any potential impacts the adoption will have on our unaudited consolidated financial statements.
Pensions. In March 2017, the FASB issued ASU No. 2017-07, Compensation-Retirement Benefits (Topic 715): Improving the Presentation of Net Periodic Pension Cost and Net Periodic Postretirement Benefit Cost. The amendments of this ASU require an entity to report the service cost component of net benefit costs in the same line item as other compensation costs arising from services rendered by the related employees during the applicable service period. The other components of net benefit cost are required to be presented separately from the service cost component and below the subtotal of operating income. Additionally, only the service cost component of net benefit costs is eligible for capitalization. The guidance in this ASU is effective for fiscal years, and interim periods within those fiscal years, beginning after December 15, 2017, with early adoption permitted. The adoption of this standard must be applied on a retrospective basis for the amendments concerning income statement presentation and on a prospective basis for the amendments regarding the capitalization of the service cost component. We are currently evaluating this ASU and any potential impacts the adoption will have on our unaudited consolidated financial statements.
Leases. In February 2016, the FASB issued ASU 2016-02-Leases (Topic 842). The provisions in this ASU will require lessees to recognize lease assets and lease liabilities, for all leases, including operating leases, on the balance sheet. The lease assets recognized in the balance sheet will represent a right-of-use asset, which is an asset that represents the lessee’s right to use, or control the use of, a specified asset for the lease term. The lease liability recognized in the balance sheet will represent the lessee’s obligation to make lease payments arising from a lease, measured based on the present value of the minimum rental payments. Entities may make an accounting policy election to not recognize lease assets or lease liabilities for leases with a term of 12 months or less. The guidance in this ASU is effective for fiscal years, and interim periods within those fiscal years, beginning after December 15, 2018, with early adoption permitted. We are currently evaluating this ASU and any potential impacts the adoption will have on our unaudited consolidated financial statements.
7
DYNEGY INC.
NOTES TO CONSOLIDATED FINANCIAL STATEMENTS
(Unaudited)
For the Interim Periods Ended September 30, 2017 and 2016
Revenue from Contracts with Customers. In May 2014, the FASB issued ASU 2014-09-Revenue from Contracts with Customers (Topic 606). This ASU supersedes current revenue recognition requirements and industry specific guidance and develops a common revenue recognition standard whereby an entity will recognize revenue when it transfers promised goods or services to customers in an amount that reflects the consideration the entity expects to be entitled to in exchange for those goods or services. Additional disclosures will be required to describe the nature, amount, timing, and uncertainty of revenues and cash flows from contracts with customers. The guidance in this ASU and its amendments are effective for interim and annual periods beginning after December 15, 2017, with early adoption permitted for interim and annual periods beginning after December 15, 2016. We intend on adopting the ASU using the modified retrospective approach.
We have previously established an implementation team to assess the impact the new accounting standard will have on our financial statements, as well as accounting policies, business processes and controls upon adoption.
Currently, the Company has completed its contract assessments in accordance with the new standard and has also considered industry specific guidance as well as certain other non-authoritative interpretations. As a result, the Company has not identified any material changes to the timing of our revenue recognition. We will continue to assess any new contracts as well as monitor the issuance of any new interpretations of the standard through the adoption date.
We believe changes to our disclosures will primarily include a regional presentation of our revenues disaggregated by revenue type - energy, capacity, and ancillary services. Additionally, we have assessed our accounting policies and identified changes which will become effective upon adoption. We are also in process of assessing the impact to our internal control structure. and have identified certain changes mainly related to the assessment of new contracts as well as the disaggregation of our revenues which will be disclosed in our footnotes upon adoption.
Note 3—Acquisitions and Divestitures
Acquisition
ENGIE Acquisition. On February 7, 2017 (the “ENGIE Acquisition Closing Date”), pursuant to the terms of the stock purchase agreement, as amended and restated on June 27, 2016, (the “ENGIE Acquisition Stock Purchase Agreement”), Dynegy acquired approximately 9,017 MW of generation from GDF SUEZ Energy North America, Inc. (“GSENA”) and International Power, S.A. (the “Seller”), including (i) 15 natural gas-fired facilities located in Illinois, Massachusetts, New Jersey, Ohio, Pennsylvania, Texas, Virginia, and West Virginia, (ii) one coal-fired facility in Texas, and (iii) one waste coal-fired facility in Pennsylvania for a base purchase price of approximately $3.3 billion in cash, subject to certain adjustments (the “ENGIE Acquisition”).
Business Combination Accounting. The ENGIE Acquisition has been accounted for in accordance with ASC 805, Business Combinations, with identifiable assets acquired and liabilities assumed recorded at their estimated fair values on the acquisition date, February 7, 2017. A summary of the various techniques used to fair value the identifiable assets and liabilities, as well as their classification within the fair value hierarchy are listed below.
• | Working capital was valued using available market information (Level 2). |
• | Acquired property, plant and equipment (“PP&E”), excluding those assets classified as held-for-sale, was valued using a discounted cash flow (“DCF”) analysis based upon a debt-free, free cash flow model (Level 3). The DCF model was created for each power generation facility based on its remaining useful life, and: |
◦ | for the years 2017 and 2018, included gross margin forecasts using quoted forward commodity market prices; |
8
DYNEGY INC.
NOTES TO CONSOLIDATED FINANCIAL STATEMENTS
(Unaudited)
For the Interim Periods Ended September 30, 2017 and 2016
◦ | for the years 2019 through 2026, we used gross margin forecasts based upon commodity and capacity price curves developed internally using forward New York Mercantile Exchange natural gas prices and supply and demand factors; |
◦ | for periods beyond 2026, we assumed a 2.5 percent growth rate. |
We also used management’s forecasts of operations and maintenance expense, general and administrative expense, as well as capital expenditures for the years 2017 through 2021, and for years thereafter assumed a 2.5 percent growth rate. These cash flows were discounted using discount rates of approximately 9 percent to 13 percent for gas-fired, and approximately 13 percent to 14 percent for coal-fired, generation facilities, based upon the plant’s age, efficiency, region, and years until retirement.
• | Acquired PP&E classified as held-for-sale was valued based upon the sale price of the assets (Level 3). |
• | Acquired derivatives were valued using the methods described in Note 6—Fair Value Measurements (Level 2 or Level 3). |
• | Contracts with terms that were not at current market prices were also valued using a DCF analysis (Level 3). The cash flows generated by the contracts were compared with their cash flows based on current market prices with the resulting difference recorded as either an intangible asset or liability. |
• | Asset retirement obligations (“AROs”) were recorded in accordance with ASC 410, Asset Retirement and Environmental Obligations (Level 3). |
The accounting for the ENGIE Acquisition is not complete because certain information and analysis that may impact our initial valuation is still being obtained or reviewed. Dynegy expects to finalize these amounts during the first quarter of 2018. The significant assets and liabilities for which provisional amounts are recognized are PP&E, deferred income taxes, and taxes other than deferred income taxes. Additionally, some taxes have not yet been finalized with the associated taxing jurisdictions, resulting in a potential change to their fair value at acquisition. These changes may also impact the fair value of the acquired PP&E or deferred tax liability. As such, the provisional amounts recognized are subject to revision until our valuation is completed, not to exceed one year from the ENGIE Acquisition Closing Date, and any material adjustments identified that existed as of the acquisition date will be recognized in the period in which they are identified.
9
DYNEGY INC.
NOTES TO CONSOLIDATED FINANCIAL STATEMENTS
(Unaudited)
For the Interim Periods Ended September 30, 2017 and 2016
The following table summarizes the consideration paid and the provisional fair value amounts recognized for the assets acquired and liabilities assumed related to the ENGIE Acquisition, as of the acquisition date, February 7, 2017:
(amounts in millions) | ||||
Base purchase price | $ | 3,300 | ||
Working capital adjustments and other | (31 | ) | ||
Fair value of total consideration transferred | $ | 3,269 | ||
Cash | $ | 20 | ||
Accounts receivable | 22 | |||
Inventory | 101 | |||
Prepayments and other current assets | 3 | |||
Assets from risk management activities (including current portion of $21 million) | 25 | |||
Property, plant and equipment | 2,716 | |||
Investment in unconsolidated affiliate | 159 | |||
Intangible assets (including current portion of $7 million) | 50 | |||
Assets held-for-sale | 478 | |||
Other long-term assets | 131 | |||
Total assets acquired | 3,705 | |||
Accounts payable | 28 | |||
Liabilities from risk management activities (including current portion of $13 million) | 16 | |||
Asset retirement obligations | 19 | |||
Intangible liabilities (including current portion of $16 million) | 30 | |||
Deferred income taxes, net | 342 | |||
Other long-term liabilities | 1 | |||
Total liabilities assumed | 436 | |||
Net assets acquired | $ | 3,269 | ||
The following table summarizes certain information related to the ENGIE Acquisition, which is included in our unaudited consolidated statements of operations:
Three Months Ended September 30, | Nine Months Ended September 30, | |||||||||||||||
(amounts in millions) | 2017 | 2016 | 2017 | 2016 | ||||||||||||
Acquisition costs | $ | — | $ | 3 | $ | 35 | $ | 5 | ||||||||
Revenues | $ | 345 | N/A | $ | 669 | N/A | ||||||||||
Operating loss | $ | (36 | ) | N/A | $ | (32 | ) | N/A | ||||||||
Pro Forma Results. The unaudited pro forma financial results for the nine months ended September 30, 2017 and 2016 assume the ENGIE Acquisition occurred on January 1, 2016. The unaudited pro forma financial results may not be indicative of the results that would have occurred had the acquisition been completed as of January 1, 2016, nor are they indicative of future results of operations. The unaudited pro forma financial results for the nine months ended September 30, 2017 and 2016 include adjustments of $35 million and $5 million, respectively, for non-recurring acquisition costs attributable to the ENGIE Acquisition.
Nine Months Ended September 30, | ||||||||
(amounts in millions) | 2017 | 2016 | ||||||
Revenue | $ | 3,905 | $ | 3,942 | ||||
Net income (loss) | $ | 169 | $ | (1,090 | ) | |||
Net income (loss) attributable to Dynegy Inc. | $ | 171 | $ | (1,088 | ) | |||
10
DYNEGY INC.
NOTES TO CONSOLIDATED FINANCIAL STATEMENTS
(Unaudited)
For the Interim Periods Ended September 30, 2017 and 2016
AER Acquisition. On April 12, 2017, we received approximately $25 million of cash related to the 2013 AER Acquisition. As a result, we have recorded $25 million in Other income and expense, net in our unaudited consolidated statement of operations for the nine months ended September 30, 2017.
Divestitures
Troy and Armstrong. On July 11, 2017, Dynegy completed the sale of its equity ownership interests in two peaking facilities in PJM to LS Power (the “Troy and Armstrong Sale”) for approximately $480 million in cash. The facilities sold were recently acquired in the ENGIE Acquisition and total 1,269 MW.
Lee. On July 10, 2017, Dynegy signed a membership interest purchase agreement (the “Lee Sale Agreement”) with an affiliate of Rockland Capital for the sale of its equity ownership interest in the Lee facility, a natural gas-fueled peaking facility in PJM, for $180 million in cash, plus adjustments for working capital. On October 4, 2017, the FERC approved our sale of Lee, and we completed the sale on October 12, 2017. Our Lee facility, associated inventory, and allocated goodwill of $9 million are classified as long-term assets held-for-sale as of September 30, 2017. Goodwill was allocated based on the relative fair values of the assets sold to the reporting unit.
For the three and nine months ended September 30, 2017, we wrote down the carrying value of the assets held-for-sale to the sales price and recognized an impairment of $15 million, which was recorded in Impairments in our unaudited consolidated statements of operations.
Dighton and Milford-MA. On September 22, 2017, Dynegy completed the sale of its equity ownership interests in two intermediate natural gas-fueled facilities in NY/NE to Starwood Energy Group for approximately $125 million in cash, including $6 million in working capital adjustments. This sale has fulfilled the mitigation plan approved by FERC regarding the Company’s purchase of ENGIE’s US-based asset portfolio. For the three and nine months ended September 30, 2017, we recognized a loss on sale of assets on our Dighton and Milford-MA facilities of $77 million, which includes $18 million of allocated goodwill. Goodwill was allocated based on the relative fair values of the assets sold to the reporting unit.
Note 4—Unconsolidated Investments
Equity Method Investments
NELP. In connection with the ENGIE Acquisition, we acquired a 50 percent interest in Northeast Energy, LP (“NELP”), a joint venture with NextEra Energy, Inc., which indirectly owns the Bellingham NEA facility and the Sayreville facility. At September 30, 2017, our equity method investment in NELP included in our unaudited consolidated balance sheets was $154 million. Upon the acquisition, we recognized basis differences in the net assets of approximately $14 million primarily related to PP&E. These basis differences are being amortized over their respective useful lives. Our risk of loss related to our equity method investment is limited to our investment balance.
For the three and nine months ended September 30, 2017, we recorded $4 million and $4 million, respectively, in equity earnings related to our investment in NELP which is reflected in Earnings from unconsolidated investments in our unaudited consolidated statements of operations. For the nine months ended September 30, 2017, we received distributions of $9 million, of which $7 million was considered to be a return of investment using the cumulative earnings approach and reflected as Distributions from unconsolidated investments in our unaudited consolidated statements of cash flows.
Elwood. On November 21, 2016, Dynegy sold its 50 percent equity interest in Elwood Energy, LLC, a limited liability company (“Elwood Energy”) and Elwood Expansion LLC, a limited liability company (and together with Elwood Energy “Elwood”), to J-Power USA Development Co. Ltd. for approximately $173 million (the “Elwood Sale”). As a result, we recorded an impairment charge of $9 million to Impairments in our unaudited consolidated statements of operations for the three and nine months ended September 30, 2016, to write down our investment in Elwood to the sales price. For the three and nine months ended September 30, 2016, we recorded $4 million and $7 million, respectively, in equity earnings related to our investment in Elwood, which is reflected in Earnings from unconsolidated investments in our unaudited consolidated statements of operations. For the nine months ended September 30, 2016, we received distributions of $15 million, of which $14 million was considered to be a return of investment using the accumulated earnings approach and reflected as Distributions from unconsolidated investments in our unaudited consolidated statements of cash flows.
Note 5—Risk Management Activities, Derivatives and Financial Instruments
The nature of our business involves commodity market and financial risks. Specifically, we are exposed to commodity price variability related to our power generation business. Our commercial team manages these commodity price risks with financially and physically settled contracts consistent with our commodity risk management policy. Our treasury team manages our interest rate risk.
Our commodity risk management policy gives us the flexibility to sell energy and capacity and purchase fuel through a combination of spot market sales and near-term contractual arrangements (generally over a rolling one- to three-year time frame). Our commodity risk management goal is to protect cash flow in the near-term while keeping the ability to capture value longer-term.
Many of our contractual arrangements are derivative instruments and are accounted for at fair value as part of Revenues in our unaudited consolidated statements of operations. We have other contractual arrangements such as capacity forward sales arrangements, tolling arrangements, fixed price coal purchases, and retail power sales, which do not receive recurring fair value accounting treatment because these arrangements do not meet the definition of a derivative or are designated as “normal purchase, normal sale,” in accordance with ASC 815, Derivatives and Hedging. As a result, the gains and losses with respect to these arrangements are not reflected in the unaudited consolidated statements of operations until the delivery occurs.
Quantitative Disclosures Related to Financial Instruments and Derivatives
As of September 30, 2017, we had net purchases and sales of derivative contracts outstanding in the following quantities:
Contract Type | Quantity | Unit of Measure | Fair Value (1) | ||||||
(dollars and quantities in millions) | Purchases (Sales) | Asset (Liability) | |||||||
Commodity contracts: | |||||||||
Electricity derivatives (2) | (60 | ) | MWh | $ | 14 | ||||
Electricity basis derivatives (3) | (34 | ) | MWh | $ | (7 | ) | |||
Natural gas derivatives (2) | 380 | MMBtu | $ | (1 | ) | ||||
Natural gas basis derivatives | 108 | MMBtu | $ | (14 | ) | ||||
Physical heat rate derivatives | 125/(13) | MMBtu/MWh | $ | 14 | |||||
Emissions derivatives | 17 | Metric Ton | $ | 4 | |||||
Interest rate swaps | 1,963 | U.S. Dollar | $ | (11 | ) | ||||
Common stock warrants (4) | 25 | Warrant | $ | (2 | ) | ||||
__________________________________________
(1) | Includes both asset and liability risk management positions but excludes margin and collateral netting of $22 million. |
(2) | Mainly comprised of swaps and physical forwards. |
(3) | Comprised of FTRs and swaps. |
(4) | Each warrant is convertible into one share of Dynegy common stock. |
11
DYNEGY INC.
NOTES TO CONSOLIDATED FINANCIAL STATEMENTS
(Unaudited)
For the Interim Periods Ended September 30, 2017 and 2016
Derivatives on the Balance Sheet. The following tables present the fair value and balance sheet classification of derivatives in our unaudited consolidated balance sheets as of September 30, 2017 and December 31, 2016. As of September 30, 2017 and December 31, 2016, there were no gross amounts available to be offset that were not offset in our unaudited consolidated balance sheets.
September 30, 2017 | |||||||||||||||||||
Gross amounts offset in the balance sheet | |||||||||||||||||||
Contract Type | Balance Sheet Location | Gross Fair Value | Contract Netting | Collateral or Margin Received or Paid | Net Fair Value | ||||||||||||||
(amounts in millions) | |||||||||||||||||||
Derivative assets: | |||||||||||||||||||
Commodity contracts | Assets from risk management activities | $ | 204 | $ | (117 | ) | $ | — | $ | 87 | |||||||||
Interest rate contracts | Assets from risk management activities | 12 | — | — | 12 | ||||||||||||||
Total derivative assets | $ | 216 | $ | (117 | ) | $ | — | $ | 99 | ||||||||||
Derivative liabilities: | |||||||||||||||||||
Commodity contracts | Liabilities from risk management activities | $ | (194 | ) | $ | 117 | $ | 22 | $ | (55 | ) | ||||||||
Interest rate contracts | Liabilities from risk management activities | (23 | ) | — | — | (23 | ) | ||||||||||||
Common stock warrants | Accrued liabilities and other current liabilities and other long-term liabilities | (2 | ) | — | — | (2 | ) | ||||||||||||
Total derivative liabilities | $ | (219 | ) | $ | 117 | $ | 22 | $ | (80 | ) | |||||||||
Total derivatives | $ | (3 | ) | $ | — | $ | 22 | $ | 19 | ||||||||||
December 31, 2016 | |||||||||||||||||||
Gross amounts offset in the balance sheet | |||||||||||||||||||
Contract Type | Balance Sheet Location | Gross Fair Value | Contract Netting | Collateral or Margin Received or Paid | Net Fair Value | ||||||||||||||
(amounts in millions) | |||||||||||||||||||
Derivative assets: | |||||||||||||||||||
Commodity contracts | Assets from risk management activities | $ | 311 | $ | (165 | ) | $ | — | $ | 146 | |||||||||
Total derivative assets | $ | 311 | $ | (165 | ) | $ | — | $ | 146 | ||||||||||
Derivative liabilities: | |||||||||||||||||||
Commodity contracts | Liabilities from risk management activities | $ | (329 | ) | $ | 165 | $ | 54 | $ | (110 | ) | ||||||||
Interest rate contracts | Liabilities from risk management activities | (30 | ) | — | — | (30 | ) | ||||||||||||
Common stock warrants | Accrued liabilities and other current liabilities | (1 | ) | — | — | (1 | ) | ||||||||||||
Total derivative liabilities | $ | (360 | ) | $ | 165 | $ | 54 | $ | (141 | ) | |||||||||
Total derivatives | $ | (49 | ) | $ | — | $ | 54 | $ | 5 | ||||||||||
Certain of our derivative instruments have credit limits that require us to post collateral. The amount of collateral required to be posted is a function of the net liability position of the derivative as well as our established credit limit with the respective counterparty. If our credit rating were to worsen, the counterparties could require us to post additional collateral. The amount of additional collateral that would be required to be posted would vary depending on the extent of change in our credit rating as well as the requirements of the individual counterparty. As of September 30, 2017, the aggregate fair value of all commodity derivative instruments containing credit-risk-related contingent features, in a liability position and not fully collateralized, is $9 million for which we have posted no collateral. Transactions with our clearing brokers are excluded as they are fully collateralized. Our
12
DYNEGY INC.
NOTES TO CONSOLIDATED FINANCIAL STATEMENTS
(Unaudited)
For the Interim Periods Ended September 30, 2017 and 2016
remaining derivative instruments do not have credit-related collateral contingencies as they are included within our first-lien collateral program.
The following table summarizes our cash collateral posted as of September 30, 2017 and December 31, 2016, within Prepayments and other current assets in our unaudited consolidated balance sheets and the amount applied against short-term risk management activities:
Location on Balance Sheet | September 30, 2017 | December 31, 2016 | ||||||
(amounts in millions) | ||||||||
Gross collateral posted with counterparties | $ | 54 | $ | 116 | ||||
Less: Collateral netted against risk management liabilities | 22 | 54 | ||||||
Net collateral within Prepayments and other current assets | $ | 32 | $ | 62 | ||||
Impact of Derivatives on the Unaudited Consolidated Statements of Operations
We elect not to designate derivatives related to our power generation business and interest rate instruments as cash flow or fair value hedges. Thus, we account for changes in the fair value of these derivatives within our unaudited consolidated statements of operations.
Our unaudited consolidated statements of operations for the three and nine months ended September 30, 2017 and 2016 include the impact of derivative financial instruments as presented below:
Derivatives Not Designated as Hedges | Location of Gain (Loss) Recognized in Income on Derivatives | Three Months Ended September 30, | Nine Months Ended September 30, | |||||||||||||||
2017 | 2016 | 2017 | 2016 | |||||||||||||||
(amounts in millions) | ||||||||||||||||||
Commodity contracts | Revenues | $ | 29 | $ | (27 | ) | $ | 242 | $ | 188 | ||||||||
Interest rate contracts | Interest expense | $ | 1 | $ | 1 | $ | 4 | $ | (11 | ) | ||||||||
Common stock warrants | Other income and (expense), net | $ | 1 | $ | 4 | $ | 16 | $ | 5 | |||||||||
Note 6—Fair Value Measurements
We apply the market approach for recurring fair value measurements, employing valuation techniques that maximize the use of observable inputs and minimize the use of unobservable inputs. We have consistently used the same valuation techniques for all periods presented. Please read Note 2—Summary of Significant Accounting Policies—Fair Value Measurements in our Form 10-K for further discussion.
13
DYNEGY INC.
NOTES TO CONSOLIDATED FINANCIAL STATEMENTS
(Unaudited)
For the Interim Periods Ended September 30, 2017 and 2016
The following tables set forth, by level within the fair value hierarchy, our financial assets and liabilities that were accounted for at fair value on a recurring basis as of September 30, 2017 and December 31, 2016, and are presented on a gross basis before consideration of amounts netted under master netting agreements and the application of collateral and margin paid:
Fair Value as of September 30, 2017 | ||||||||||||||||
(amounts in millions) | Level 1 | Level 2 | Level 3 | Total | ||||||||||||
Assets: | ||||||||||||||||
Assets from commodity risk management activities: | ||||||||||||||||
Electricity derivatives | $ | — | $ | 100 | $ | 21 | $ | 121 | ||||||||
Natural gas derivatives | — | 45 | 6 | 51 | ||||||||||||
Physical heat rate derivatives | — | 20 | 1 | 21 | ||||||||||||
Emissions derivatives | — | 11 | — | 11 | ||||||||||||
Total assets from commodity risk management activities | — | 176 | 28 | 204 | ||||||||||||
Assets from interest rate contracts | — | 12 | — | 12 | ||||||||||||
Total assets | $ | — | $ | 188 | $ | 28 | $ | 216 | ||||||||
Liabilities: | ||||||||||||||||
Liabilities from commodity risk management activities: | ||||||||||||||||
Electricity derivatives | $ | — | $ | (94 | ) | $ | (20 | ) | $ | (114 | ) | |||||
Natural gas derivatives | — | (60 | ) | (6 | ) | (66 | ) | |||||||||
Physical heat rate derivatives | — | (7 | ) | — | (7 | ) | ||||||||||
Emissions derivatives | — | (7 | ) | — | (7 | ) | ||||||||||
Total liabilities from commodity risk management activities | — | (168 | ) | (26 | ) | (194 | ) | |||||||||
Liabilities from interest rate contracts | — | (23 | ) | — | (23 | ) | ||||||||||
Liabilities from outstanding common stock warrants | (2 | ) | — | — | (2 | ) | ||||||||||
Total liabilities | $ | (2 | ) | $ | (191 | ) | $ | (26 | ) | $ | (219 | ) | ||||
Fair Value as of December 31, 2016 | ||||||||||||||||
(amounts in millions) | Level 1 | Level 2 | Level 3 | Total | ||||||||||||
Assets: | ||||||||||||||||
Assets from commodity risk management activities: | ||||||||||||||||
Electricity derivatives | $ | — | $ | 118 | $ | 20 | $ | 138 | ||||||||
Natural gas derivatives | — | 169 | 4 | 173 | ||||||||||||
Total assets from commodity risk management activities | $ | — | $ | 287 | $ | 24 | $ | 311 | ||||||||
Liabilities: | ||||||||||||||||
Liabilities from commodity risk management activities: | ||||||||||||||||
Electricity derivatives | $ | — | $ | (245 | ) | $ | (12 | ) | $ | (257 | ) | |||||
Natural gas derivatives | — | (52 | ) | (10 | ) | (62 | ) | |||||||||
Emissions derivatives | — | (10 | ) | — | (10 | ) | ||||||||||
Total liabilities from commodity risk management activities | — | (307 | ) | (22 | ) | (329 | ) | |||||||||
Liabilities from interest rate contracts | — | (30 | ) | — | (30 | ) | ||||||||||
Liabilities from outstanding common stock warrants | (1 | ) | — | — | (1 | ) | ||||||||||
Total liabilities | $ | (1 | ) | $ | (337 | ) | $ | (22 | ) | $ | (360 | ) | ||||
Level 3 Valuation Methods. The electricity derivatives classified within Level 3 include financial swaps executed in illiquid trading locations or on long dated contracts, capacity contracts and FTRs. The curves used to generate the fair value of the financial swaps are based on basis adjustments applied to forward curves for liquid trading points, while the curves for the capacity deals are based upon auction results in the marketplace, which are infrequently executed. The forward market price of FTRs is derived using historical congestion patterns within the marketplace and heat rate derivative valuations are derived using
14
DYNEGY INC.
NOTES TO CONSOLIDATED FINANCIAL STATEMENTS
(Unaudited)
For the Interim Periods Ended September 30, 2017 and 2016
a DCF model, which uses modeled forward natural gas and power prices. The natural gas derivatives classified within Level 3 include financial swaps, basis swaps, and physical purchases executed in illiquid trading locations or on long dated contracts.
Sensitivity to Changes in Significant Unobservable Inputs for Level 3 Valuations. The significant unobservable inputs used in the fair value measurement of our commodity instruments categorized within Level 3 of the fair value hierarchy include estimates of forward congestion, power price spreads, and natural gas pricing, and the difference between our plant locational prices to liquid hub prices. Power price spreads, and natural gas pricing, and the difference between our plant locational prices to liquid hub prices are generally based on observable markets where available, or derived from historical prices and forward market prices from similar observable markets when not available. Increases in the price of the spread on a buy or sell position in isolation would result in a higher/lower fair value measurement. The significant unobservable inputs used in the valuation of Dynegy’s contracts classified as Level 3 as of September 30, 2017 are as follows:
Transaction Type | Quantity | Unit of Measure | Net Fair Value | Valuation Technique | Significant Unobservable Input | Significant Unobservable Input Range | |||||||||
(dollars in millions) | |||||||||||||||
Electricity derivatives: | |||||||||||||||
Forward contracts—power (1) | (14 | ) | Million MWh | $ | 4 | Basis spread + liquid location | Basis spread | $4.25 - $6.25 | |||||||
FTRs | (29 | ) | Million MWh | $ | (3 | ) | Historical congestion | Forward price | $0 - $6.00 | ||||||
Physical heat rate derivatives | 23/(3) | Million MMBtu/Million MWh | $ | 1 | Discounted Cash Flow | Forward price | $2.40 - $3.30 / $20 - $24 | ||||||||
Natural gas derivatives (1) | 102 | Million MMBtu | $ | — | Illiquid location fixed price | Forward price | $1.75 - $2.15 | ||||||||
__________________________________________
(1) | Represents forward financial and physical transactions at illiquid pricing locations and long-dated contracts. |
15
DYNEGY INC.
NOTES TO CONSOLIDATED FINANCIAL STATEMENTS
(Unaudited)
For the Interim Periods Ended September 30, 2017 and 2016
The following tables set forth a reconciliation of changes in the fair value of financial instruments classified as Level 3 in the fair value hierarchy:
Three Months Ended September 30, 2017 | ||||||||||||||||
(amounts in millions) | Electricity Derivatives | Natural Gas Derivatives | Heat Rate Derivatives | Total | ||||||||||||
Balance at June 30, 2017 | $ | (1 | ) | $ | 1 | $ | (2 | ) | $ | (2 | ) | |||||
Total gains (losses) included in earnings | 6 | (1 | ) | 3 | 8 | |||||||||||
Transfers out of level 3 (1) | (2 | ) | — | — | (2 | ) | ||||||||||
Settlements (2) | (2 | ) | — | — | (2 | ) | ||||||||||
Balance at September 30, 2017 | $ | 1 | $ | — | $ | 1 | $ | 2 | ||||||||
Unrealized gains (losses) relating to instruments held as of September 30, 2017 | $ | 6 | $ | (1 | ) | $ | 3 | $ | 8 | |||||||
Nine Months Ended September 30, 2017 | ||||||||||||||||
(amounts in millions) | Electricity Derivatives | Natural Gas Derivatives | Heat Rate Derivatives | Total | ||||||||||||
Balance at December 31, 2016 | $ | 8 | $ | (6 | ) | $ | — | $ | 2 | |||||||
Acquired derivatives | 1 | — | — | 1 | ||||||||||||
Total gains (losses) included in earnings | (16 | ) | 10 | 1 | (5 | ) | ||||||||||
Settlements (2) | 8 | (4 | ) | — | 4 | |||||||||||
Balance at September 30, 2017 | $ | 1 | $ | — | $ | 1 | $ | 2 | ||||||||
Unrealized gains (losses) relating to instruments held as of September 30, 2017 | $ | (16 | ) | $ | 10 | $ | 1 | $ | (5 | ) | ||||||
Three Months Ended September 30, 2016 | ||||||||||||||||
(amounts in millions) | Electricity Derivatives | Natural Gas Derivatives | Coal Derivatives | Total | ||||||||||||
Balance at June 30, 2016 | $ | (24 | ) | $ | (15 | ) | $ | 1 | $ | (38 | ) | |||||
Total gains (losses) included in earnings | 9 | (4 | ) | 1 | 6 | |||||||||||
Settlements (2) | 5 | 5 | (1 | ) | 9 | |||||||||||
Balance at September 30, 2016 | $ | (10 | ) | $ | (14 | ) | $ | 1 | $ | (23 | ) | |||||
Unrealized gains (losses) relating to instruments held as of September 30, 2016 | $ | 9 | $ | (4 | ) | $ | 1 | $ | 6 | |||||||
Nine Months Ended September 30, 2016 | ||||||||||||||||
(amounts in millions) | Electricity Derivatives | Natural Gas Derivatives | Coal Derivatives | Total | ||||||||||||
Balance at December 31, 2015 | $ | (18 | ) | $ | (32 | ) | $ | 2 | $ | (48 | ) | |||||
Total gains included in earnings | 4 | — | — | 4 | ||||||||||||
Settlements (2) | 4 | 18 | (1 | ) | 21 | |||||||||||
Balance at September 30, 2016 | $ | (10 | ) | $ | (14 | ) | $ | 1 | $ | (23 | ) | |||||
Unrealized gains relating to instruments held as of September 30, 2016 | $ | 4 | $ | — | $ | — | $ | 4 | ||||||||
(1) | During the three months ended September 30, 2017, we had transfers from Level 3 to Level 2 due to changes in market liquidity. |
(2) | For purposes of these tables, we define settlements as the beginning of period fair value of contracts that settled during the period. |
16
DYNEGY INC.
NOTES TO CONSOLIDATED FINANCIAL STATEMENTS
(Unaudited)
For the Interim Periods Ended September 30, 2017 and 2016
Gains and losses recognized for Level 3 recurring items are included in Revenues in our unaudited consolidated statements of operations for commodity derivatives. We believe an analysis of commodity instruments classified as Level 3 should be undertaken with the understanding that these items generally serve as economic hedges of our power generation portfolio.
Nonfinancial Assets and Liabilities. Nonfinancial assets and liabilities that are measured at fair value on a nonrecurring basis are classified in their entirety based on the lowest level of input that is significant to the fair value measurement. Our assessment of the significance of a particular input to the fair value measurement requires judgment and may affect the valuation of such assets and liabilities and their placement within the fair value hierarchy.
Impairments. During the three and nine months ended September 30, 2017 and 2016, we recorded impairment charges related to certain of our facilities, materials and supplies inventory and assets held-for-sale using fair value measurements. See Note 3—Acquisitions and Divestitures, Note 8—Inventory and Note 9—Property, Plant and Equipment for further discussion.
Acquisitions. We fair valued the ENGIE Acquisition and our acquisition of additional joint ownership interest in the Zimmer facility using fair value measurements. See Note 3—Acquisitions and Divestitures and Note 10—Joint Ownership of Generating Facilities for further discussion of the fair value hierarchy classifications of valuations of acquired identifiable assets and liabilities.
Fair Value of Financial Instruments. The following table discloses the fair value of financial instruments which are not recognized at fair value in our unaudited consolidated balance sheets. Unless otherwise noted, the fair value of debt as reflected in the table has been calculated based on the average of certain available broker quotes as of September 30, 2017 and December 31, 2016, respectively.
September 30, 2017 | December 31, 2016 | |||||||||||||||||
(amounts in millions) | Fair Value Hierarchy | Carrying Amount | Fair Value | Carrying Amount | Fair Value | |||||||||||||
Dynegy Inc.: | ||||||||||||||||||
Tranche C-1 Term Loan, due 2024 (1) | Level 2 | $ | (1,940 | ) | $ | (2,029 | ) | $ | (1,994 | ) | $ | (2,025 | ) | |||||
Tranche B-2 Term Loan, due 2020 (1) | Level 2 | $ | — | $ | — | $ | (219 | ) | $ | (225 | ) | |||||||
Revolving Facility (1) | Level 2 | $ | (300 | ) | $ | (300 | ) | $ | — | $ | — | |||||||
6.75% Senior Notes, due 2019 (1) | Level 2 | $ | (845 | ) | $ | (881 | ) | $ | (2,083 | ) | $ | (2,137 | ) | |||||
7.375% Senior Notes, due 2022 (1) | Level 2 | $ | (1,733 | ) | $ | (1,824 | ) | $ | (1,731 | ) | $ | (1,665 | ) | |||||
5.875% Senior Notes, due 2023 (1) | Level 2 | $ | (493 | ) | $ | (498 | ) | $ | (492 | ) | $ | (431 | ) | |||||
7.625% Senior Notes, due 2024 (1) | Level 2 | $ | (1,237 | ) | $ | (1,294 | ) | $ | (1,237 | ) | $ | (1,156 | ) | |||||
8.034% Senior Notes, due 2024 (1) | Level 2 | $ | (188 | ) | $ | (190 | ) | $ | — | $ | — | |||||||
8.00% Senior Notes, due 2025 (1) | Level 2 | $ | (739 | ) | $ | (778 | ) | $ | (738 | ) | $ | (703 | ) | |||||
8.125% Senior Notes, due 2026 (1) | Level 2 | $ | (842 | ) | $ | (880 | ) | $ | — | $ | — | |||||||
7.00% Amortizing Notes, due 2019 (TEUs) (1) | Level 2 | $ | (58 | ) | $ | (62 | ) | $ | (78 | ) | $ | (90 | ) | |||||
Forward capacity agreement (1) | Level 3 | $ | (212 | ) | $ | (212 | ) | $ | (205 | ) | $ | (205 | ) | |||||
Inventory financing agreements | Level 3 | $ | (48 | ) | $ | (48 | ) | $ | (129 | ) | $ | (127 | ) | |||||
Equipment financing agreements (1) | Level 3 | $ | (112 | ) | $ | (112 | ) | $ | (73 | ) | $ | (73 | ) | |||||
Genco: | ||||||||||||||||||
Liabilities subject to compromise (2) | Level 3 | $ | — | $ | — | $ | (825 | ) | $ | (366 | ) | |||||||
__________________________________________
(1) | Carrying amounts include unamortized discounts and debt issuance costs. Please read Note 12—Debt for further discussion. |
(2) | Carrying amounts represent the Genco senior notes that were classified as liabilities subject to compromise as of December 31, 2016. The fair value of the senior notes was equal to the Genco Plan consideration and is a Level 3 valuation due to a lack of observable inputs that make up the consideration. Please read Note 22—Genco Chapter 11 Bankruptcy in our Form 10-K for further details. |
17
DYNEGY INC.
NOTES TO CONSOLIDATED FINANCIAL STATEMENTS
(Unaudited)
For the Interim Periods Ended September 30, 2017 and 2016
Note 7—Cash Flow Information
The supplemental disclosures of our non-cash investing and financing information are as follows:
Nine Months Ended September 30, | ||||||||
(amounts in millions) | 2017 | 2016 | ||||||
Change in capital expenditures included in accounts payable | $ | 5 | $ | (10 | ) | |||
Change in capital expenditures pursuant to an equipment financing agreement | $ | 34 | $ | 11 | ||||
Issuance of 2017 Warrants | $ | 17 | $ | — | ||||
Issuance of senior notes related to the Genco restructuring | $ | 188 | $ | — | ||||
Sale of interest in Conesville facility | $ | (58 | ) | $ | — | |||
Acquisition of interest in Zimmer facility | $ | 27 | $ | — | ||||
The following table provides a reconciliation of cash, cash equivalents and restricted cash reported within our unaudited consolidated balance sheets that sum to the total of the same such amounts shown in our unaudited consolidated statements of cash flows:
(amounts in millions) | September 30, 2017 | September 30, 2016 | ||||||
Cash and cash equivalents | $ | 613 | $ | 1,458 | ||||
Restricted cash included in current assets (1) | — | 85 | ||||||
Restricted cash included in long-term assets (2) | — | 2,000 | ||||||
Total cash, cash equivalents and restricted cash | $ | 613 | $ | 3,543 | ||||
__________________________________________
(1) | Includes $45 million placed in escrow for the issuance of the Tranche C Term Loan ($25 million of pre-funded interest and interest income earned and $20 million of pre-funded original issue discount) and $40 million related to collateral. |
(2) | Relates to amounts placed into escrow for the issuance of the Tranche C Term Loan. |
Note 8—Inventory
A summary of our inventories is as follows:
(amounts in millions) | September 30, 2017 | December 31, 2016 | ||||||
Materials and supplies | $ | 236 | $ | 182 | ||||
Coal | 165 | 238 | ||||||
Fuel oil | 14 | 17 | ||||||
Natural gas | 12 | — | ||||||
Emissions allowances (1) | 2 | 8 | ||||||
Total | $ | 429 | $ | 445 | ||||
__________________________________________
(1) | At September 30, 2017 and December 31, 2016, a portion of this inventory was held as collateral by one of our counterparties as part of an inventory financing agreement. Please read Note 12—Debt—Emissions Repurchase Agreements for further discussion. |
As discussed in Note 10—Joint Ownership of Generating Facilities, Stuart Unit 1 was retired early on September 30, 2017, with remaining Stuart and Killen units scheduled to be retired by mid-2018. We determined that we would not be able to recover the carrying value of our Materials and supplies inventory at these facilities and, as a result, recognized a charge of $14 million in Impairments in our unaudited consolidated statements of operations for the three and nine months ended September 30, 2017.
18
DYNEGY INC.
NOTES TO CONSOLIDATED FINANCIAL STATEMENTS
(Unaudited)
For the Interim Periods Ended September 30, 2017 and 2016
Note 9—Property, Plant and Equipment
A summary of our property, plant and equipment is as follows:
(amounts in millions) | September 30, 2017 | December 31, 2016 | ||||||
Power generation | $ | 9,845 | $ | 7,537 | ||||
Buildings and improvements | 958 | 944 | ||||||
Office and other equipment | 115 | 98 | ||||||
Property, plant and equipment | 10,918 | 8,579 | ||||||
Accumulated depreciation | (1,989 | ) | (1,458 | ) | ||||
Property, plant and equipment, net | $ | 8,929 | $ | 7,121 | ||||
Impairments
For the three and nine months ended September 30, 2017 and 2016, we recognized the following PP&E impairments in our unaudited consolidated statements of operations (amounts in millions). Each valuation is classified as Level 3 within the fair value hierarchy and is presented as of the date of its impairment.
Three Months Ended September 30, | Nine Months Ended September 30, | |||||||||||||||||||
Facility | Fair Value | 2017 | 2016 | 2017 | 2016 | |||||||||||||||
Baldwin (1) | $ | 97 | — | — | — | 645 | ||||||||||||||
Stuart (2) | $ | — | — | 55 | — | 55 | ||||||||||||||
Newton FGD (3) | $ | — | — | 148 | — | 148 | ||||||||||||||
Killen (4) | $ | — | — | — | 20 | — | ||||||||||||||
Hennepin (1) | $ | 16 | — | — | 10 | — | ||||||||||||||
Havana (1) | $ | 37 | — | — | 89 | — | ||||||||||||||
Total (5) | $ | — | $ | 203 | $ | 119 | $ | 848 | ||||||||||||
_________________________________________
(1) | Units failed to recover their basic operating costs in the MISO capacity auctions. The impairment was measured using a DCF model. |
(2) | We determined that the facility would experience recurring negative cash flows due to on-going required maintenance and environmental capital expenditures, combined with consistently poor reliability. The impairment was measured using a DCF model. |
(3) | We terminated the flue gas desulfurization (“FGD”) systems construction project at our Newton generation facility. The capitalized cost of the project was used to determine the impairment amount. |
(4) | In first quarter 2017, Dayton Power and Light Co., the partner and operator of Killen, announced the shutdown of the Killen generation facility by June 2018. The impairment charge was equal to the book value. |
(5) | Excludes impairments related to Goodwill and Materials and supplies inventory. |
Brayton Point Retirement
The Brayton Point facility officially retired on June 1, 2017. During the three and nine months ended September 30, 2017, we recognized approximately $7 million and $12 million of severance costs, respectively, which were classified within Operating and maintenance expense in our unaudited consolidated statement of operations.
Note 10—Joint Ownership of Generating Facilities
We hold ownership interests in certain jointly owned generating facilities. We are entitled to the proportional share of the generating capacity and the output of each unit equal to our ownership interests. We pay our share of capital expenditures, fuel inventory purchases, and operating expenses, except in certain instances where agreements have been executed to limit certain joint owners’ maximum exposure to additional costs. Our share of revenues and operating costs of the jointly owned generating facilities is included within the corresponding financial statement line items in our unaudited consolidated statements of operations.
19
DYNEGY INC.
NOTES TO CONSOLIDATED FINANCIAL STATEMENTS
(Unaudited)
For the Interim Periods Ended September 30, 2017 and 2016
The following tables present the ownership interests of the jointly owned facilities as of September 30, 2017 and December 31, 2016 included in our unaudited consolidated balance sheets. Each facility is co-owned with one or more other generation companies.
September 30, 2017 | |||||||||||||||||||
(dollars in millions) | Ownership Interest | Property, Plant and Equipment | Accumulated Depreciation | Construction Work in Progress | Total | ||||||||||||||
Miami Fort | 64.0 | % | $ | 208 | $ | (55 | ) | $ | 4 | $ | 157 | ||||||||
Stuart (1)(2) | 39.0 | % | $ | — | $ | — | $ | 1 | $ | 1 | |||||||||
Zimmer | 71.9 | % | $ | 131 | $ | (37 | ) | $ | 8 | $ | 102 | ||||||||
Killen (1)(2) | 33.0 | % | $ | — | $ | — | $ | — | $ | — | |||||||||
December 31, 2016 | |||||||||||||||||||
(dollars in millions) | Ownership Interest | Property, Plant and Equipment | Accumulated Depreciation | Construction Work in Progress | Total | ||||||||||||||
Miami Fort | 64.0 | % | $ | 207 | $ | (39 | ) | $ | 4 | $ | 172 | ||||||||
Stuart (1) | 39.0 | % | $ | — | $ | — | $ | 4 | $ | 4 | |||||||||
Conesville (1) | 40.0 | % | $ | 61 | $ | (3 | ) | $ | 6 | $ | 64 | ||||||||
Zimmer | 46.5 | % | $ | 115 | $ | (25 | ) | $ | 6 | $ | 96 | ||||||||
Killen (1) | 33.0 | % | $ | 19 | $ | (2 | ) | $ | 3 | $ | 20 | ||||||||
__________________________________________
(1) | Facilities not operated by Dynegy. |
(2) | Stuart Unit 1 was retired early on September 30, 2017, with remaining Stuart and Killen units scheduled to be retired by mid-2018. |
On May 9, 2017, Dynegy finalized the sale of its 40 percent ownership interest in Conesville to American Electric Power (“AEP”) in exchange for AEP’s 25.4 percent ownership interest in Zimmer. As a result, Dynegy now owns 71.9 percent of the Zimmer facility and no longer has an ownership interest in the Conesville facility. No cash was exchanged in the transaction and no additional debt was incurred by either party. AEP returned a previously issued letter of credit totaling $58 million to Dynegy. The acquisition of the additional interest in Zimmer has been accounted for as a business combination using similar fair value methodologies as described in Note 3—Acquisitions and Divestitures. The fair value of the additional Zimmer interest is $27 million and was allocated $14 million to Property, plant and equipment, $14 million to Inventory, and $1 million to ARO liability in our unaudited consolidated balance sheets. As a result of the Conesville sale, we recognized a loss of $31 million for the nine months ended September 30, 2017, representing the difference between the $58 million book value of our transferred interest in Conesville and the $27 million fair value of the acquired interest in Zimmer.
On April 21, 2017, Dynegy reached an agreement with AES Ohio Generation, LLC and The Dayton Power and Light Company (collectively, “AES”) under which Dynegy will purchase AES’ 28.1 percent interest in Zimmer and 36 percent interest in Miami Fort for $50 million in cash and the assumption of certain liabilities, subject to customary adjustments. The transaction is expected to close by the end of 2017.
20
DYNEGY INC.
NOTES TO CONSOLIDATED FINANCIAL STATEMENTS
(Unaudited)
For the Interim Periods Ended September 30, 2017 and 2016
Note 11—Intangible Assets and Liabilities
The following table summarizes the components of our intangible assets and liabilities as of September 30, 2017 and December 31, 2016:
September 30, 2017 | December 31, 2016 | |||||||||||||||||||||||
(amounts in millions) | Gross Carrying Amount | Accumulated Amortization | Net Carrying Amount | Gross Carrying Amount | Accumulated Amortization | Net Carrying Amount | ||||||||||||||||||
Intangible Assets: | ||||||||||||||||||||||||
Electricity contracts | $ | 230 | $ | (176 | ) | $ | 54 | $ | 260 | $ | (206 | ) | $ | 54 | ||||||||||
Gas transport contracts | 30 | (11 | ) | 19 | 13 | (6 | ) | 7 | ||||||||||||||||
Total intangible assets | $ | 260 | $ | (187 | ) | $ | 73 | $ | 273 | $ | (212 | ) | $ | 61 | ||||||||||
Intangible Liabilities: | ||||||||||||||||||||||||
Electricity contracts | $ | (19 | ) | $ | 17 | $ | (2 | ) | $ | (28 | ) | $ | 26 | $ | (2 | ) | ||||||||
Coal contracts | (32 | ) | 32 | — | (49 | ) | 42 | (7 | ) | |||||||||||||||
Coal transport contracts | (84 | ) | 78 | (6 | ) | (86 | ) | 73 | (13 | ) | ||||||||||||||
Gas transport contracts | (58 | ) | 13 | (45 | ) | (41 | ) | 8 | (33 | ) | ||||||||||||||
Gas storage contracts | (2 | ) | 1 | (1 | ) | — | — | — | ||||||||||||||||
Total intangible liabilities | $ | (195 | ) | $ | 141 | $ | (54 | ) | $ | (204 | ) | $ | 149 | $ | (55 | ) | ||||||||
Intangible assets and liabilities, net | $ | 65 | $ | (46 | ) | $ | 19 | $ | 69 | $ | (63 | ) | $ | 6 | ||||||||||
The following table presents our amortization expense (revenue) of intangible assets and liabilities for the three and nine months ended September 30, 2017 and 2016:
Three Months Ended September 30, | Nine Months Ended September 30, | |||||||||||||||
(amounts in millions) | 2017 | 2016 | 2017 | 2016 | ||||||||||||
Electricity contracts, net (1) | $ | 5 | $ | 19 | $ | 29 | $ | 52 | ||||||||
Coal contracts, net (2) | (1 | ) | (9 | ) | (4 | ) | (32 | ) | ||||||||
Coal transport contracts, net (2) | (2 | ) | (7 | ) | (7 | ) | (21 | ) | ||||||||
Gas transport contracts, net (2) | (3 | ) | 1 | (4 | ) | 18 | ||||||||||
Gas storage contracts, net (2) | — | — | (1 | ) | — | |||||||||||
Total | $ | (1 | ) | $ | 4 | $ | 13 | $ | 17 | |||||||
__________________________________________
(1) | The amortization of these contracts is recognized in Revenues or Cost of sales in our unaudited consolidated statements of operations. |
(2) | The amortization of these contracts is recognized in Cost of sales in our unaudited consolidated statements of operations. |
21
DYNEGY INC.
NOTES TO CONSOLIDATED FINANCIAL STATEMENTS
(Unaudited)
For the Interim Periods Ended September 30, 2017 and 2016
The following table summarizes the components of our contract based intangible assets and liabilities recorded in connection with the ENGIE Acquisition in February 2017:
(amounts in millions/months) | Gross Carrying Amount | Weighted-Average Amortization Period | ||||
Intangible Assets: | ||||||
Electricity contracts | $ | 34 | 39 | |||
Gas transport contracts | 16 | 47 | ||||
Total intangible assets | $ | 50 | 41 | |||
Intangible Liabilities: | ||||||
Electricity contracts | $ | (11 | ) | 32 | ||
Gas contracts | — | 1 | ||||
Gas transport contracts | (17 | ) | 35 | |||
Gas storage contracts | (2 | ) | 13 | |||
Total intangible liabilities | $ | (30 | ) | 33 | ||
Total intangible assets and liabilities, net | $ | 20 | ||||
Amortization expense (revenue), net related to intangible assets and liabilities recorded in connection with the ENGIE Acquisition for the next five years as of September 30, 2017 is as follows: 2017—$(3) million, 2018—$11 million, 2019—$17 million, 2020—$4 million and 2021—$(1) million.
22
DYNEGY INC.
NOTES TO CONSOLIDATED FINANCIAL STATEMENTS
(Unaudited)
For the Interim Periods Ended September 30, 2017 and 2016
Note 12—Debt
A summary of our long-term debt is as follows:
(amounts in millions) | September 30, 2017 | December 31, 2016 | ||||||
Secured Obligations: | ||||||||
Tranche C-1 Term Loan, due 2024 (1) | $ | 2,018 | $ | 2,000 | ||||
Tranche B-2 Term Loan, due 2020 | — | 224 | ||||||
Revolving Facility | 300 | — | ||||||
Forward Capacity Agreements | 241 | 219 | ||||||
Inventory Financing Agreements | 48 | 129 | ||||||
Subtotal secured obligations | 2,607 | 2,572 | ||||||
Unsecured Obligations: | ||||||||
7.00% Amortizing Notes, due 2019 (TEUs) | 60 | 80 | ||||||
6.75% Senior Notes, due 2019 | 850 | 2,100 | ||||||
7.375% Senior Notes, due 2022 | 1,750 | 1,750 | ||||||
5.875% Senior Notes, due 2023 | 500 | 500 | ||||||
7.625% Senior Notes, due 2024 | 1,250 | 1,250 | ||||||
8.034% Senior Notes, due 2024 (2) | 188 | — | ||||||
8.00% Senior Notes, due 2025 | 750 | 750 | ||||||
8.125% Senior Notes, due 2026 | 850 | — | ||||||
Equipment Financing Agreements | 139 | 97 | ||||||
Subtotal unsecured obligations | 6,337 | 6,527 | ||||||
Total debt obligations | 8,944 | 9,099 | ||||||
Unamortized debt discounts and issuance costs | (197 | ) | (120 | ) | ||||
8,747 | 8,979 | |||||||
Less: Current maturities, including unamortized debt discounts and issuance costs, net | 99 | 201 | ||||||
Total long-term debt | $ | 8,648 | $ | 8,778 | ||||
__________________________________________
(1) | At December 31, 2016, the $2.0 billion Tranche C Term Loan was held by Dynegy Finance IV. Upon the close of the ENGIE Acquisition, this debt obligation became Dynegy Inc.’s secured obligation. |
(2) | See Note 18—Genco Chapter 11 Bankruptcy and Emergence for further discussion. |
Credit Agreement
As of September 30, 2017, we had a $3.769 billion credit agreement, as amended, that consisted of (i) a $2.224 billion seven-year senior secured term loan facility (the “Tranche C-1 Term Loan”) and (ii) $1.545 billion in senior secured revolving credit facilities (the “Revolving Facility,” and collectively with the Tranche C-1 Term Loan the “Credit Agreement”). During the nine months ended September 30, 2017, we made the following changes to the Credit Agreement:
• | On January 10, 2017, we amended the Credit Agreement (Fourth Amendment) to increase the revolver capacity by $45 million and to extend the maturity date on $450 million in revolver capacity to 2021, which was effective upon the ENGIE Acquisition Closing Date. |
• | On the ENGIE Acquisition Closing Date, we amended the Credit Agreement (Fifth Amendment) to (i) reduce the interest rate applicable to the Tranche C Term Loan by 75 basis points and (ii) extend the maturity to 2024 of the existing Tranche B-2 Term Loan through the exchange of the outstanding initial Tranche B-2 Term Loan for the $2.224 billion Tranche C-1 Term Loan. As a result of this exchange, we recorded a loss on early extinguishment of debt of approximately $9 million in our unaudited consolidated statements of operations in the first quarter of 2017, of which approximately $7 |
23
DYNEGY INC.
NOTES TO CONSOLIDATED FINANCIAL STATEMENTS
(Unaudited)
For the Interim Periods Ended September 30, 2017 and 2016
million was related to the write-off of unamortized deferred financing costs and approximately $2 million was related to the write-off of unamortized debt discount.
• | On August 22, 2017, we repaid $200 million of our Tranche C-1 term loan. As a result of this transaction, we recorded a loss on early extinguishment of debt of approximately $8 million in our unaudited consolidated statements of operations for the three and nine months ended September 30, 2017, of which $6 million was related to the write-off of unamortized deferred financing costs and $2 million was related to the write-off of unamortized debt discount. |
At September 30, 2017, there was $300 million drawn on the Revolving Facility. We also had outstanding letters of credit (“LCs”) of approximately $310 million, which reduce the amount available under the Revolving Facility. The Credit Agreement contains customary events of default and affirmative and negative covenants, subject to certain specified exceptions, including a Senior Secured Leverage Ratio (as defined in the Credit Agreement) calculated on a rolling four quarters basis. Under the Credit Agreement, if Dynegy utilizes 25 percent or more of its Revolving Facility, Dynegy must be in compliance with the Consolidated Senior Secured Net Debt to Consolidated Adjusted EBITDA ratio of 4.00:1.00. Our revolver usage at September 30, 2017 was 39 percent of the aggregate revolver commitment due to outstanding LCs and revolver draws. Based on the calculation outlined in the Credit Agreement, we were in compliance with these covenants as of September 30, 2017. In October 2017, we repaid the outstanding Revolving Facility balance of $300 million.
Under the terms of the Credit Agreement, existing balances under our Forward Capacity Agreement, Inventory Financing Agreements, and Equipment Financing Agreements are excluded from Consolidated Senior Secured Net Debt, as defined in the Credit Agreement.
Interest Rate Swaps. In March 2017, we amended our existing interest rate swaps to more closely match the terms of our Tranche C-1 Term Loan. The swaps have an aggregate notional value of approximately $763 million at an average fixed rate of 3.03 percent and expire between the second quarter of 2018 and the second quarter of 2020. In a previous extension to the existing interest rate swaps, in lieu of paying the breakage fees related to terminating the old swaps and issuing the new swaps, the costs were incorporated into the terms of the new swaps. As a result, any cash flows related to the settlement of the swaps are reflected as a financing activity in our unaudited consolidated statements of cash flows.
Additionally, in May 2017, we entered into new interest rate swap agreements. The swaps have an aggregate notional value of approximately $1.2 billion at an average fixed rate of 1.97 percent, and expire in the first quarter of 2024. Any cash flows related to the settlement of these swaps are reflected as an operating activity in our unaudited consolidated statements of cash flows.
Senior Notes
The senior notes are unsecured and unsubordinated obligations of the Company and are guaranteed by each of the Company’s current and future wholly-owned domestic subsidiaries that from time to time are a borrower or guarantor under the Credit Agreement. The senior notes indentures limit, among other things, the ability of the Company or any of the guarantors to create liens upon any principal property to secure debt for borrowed money in excess of, among other limitations, 30 percent of total assets.
On August 21, 2017, we issued $850 million of 8.125 percent senior notes due 2026 (the “2026 Senior Notes”) in a private placement transaction. Interest is payable semiannually in arrears on January 30 and July 30 of each year, beginning January 30, 2018. Dynegy used the proceeds of the offering, together with proceeds from the sale of certain facilities, and cash-on-hand to repurchase $1.25 billion of its 6.75 percent senior notes due 2019 and repay $200 million of its Tranche C-1 term loan, as noted above.
In connection with the extinguishment of a portion of our 2019 senior notes, we recorded a loss on early extinguishment of debt of approximately $58 million in our unaudited consolidated statements of operations for the three and nine months ended September 30, 2017, of which approximately $44 million related to a premium paid in excess of debt principal, approximately $8 million related to the write-off of unamortized deferred financing costs, and approximately $6 million related to fees. The Company, pursuant to a Registration Rights Agreement, has agreed to use commercially reasonable efforts to register the 2026 Senior Notes by August 16, 2018. Otherwise, the 2026 Senior Notes are generally identical in all material respects to Dynegy’s other outstanding senior notes.
24
DYNEGY INC.
NOTES TO CONSOLIDATED FINANCIAL STATEMENTS
(Unaudited)
For the Interim Periods Ended September 30, 2017 and 2016
Amortizing Notes
On June 21, 2016, in connection with the issuance of the tangible equity units (“TEUs”), Dynegy issued the Amortizing Notes with a principal amount of approximately $87 million. The Amortizing Notes mature on July 1, 2019. Each installment payment per Amortizing Note will be paid in cash and will constitute a partial repayment of principal and a payment of interest, computed at an annual rate of 7 percent. Interest will be calculated on the basis of a 360 day year consisting of twelve 30 day months. Payments will be applied first to the interest due and payable and then to the reduction of the unpaid principal amount, allocated as set forth in the Indenture.
The indenture limits, among other things, the ability of Dynegy to consolidate, merge, sell, or dispose all or substantially all of its assets. If a fundamental change occurs, or if Dynegy elects to settle the prepaid stock contracts (“SPCs”) early, then the holders of the Amortizing Notes will have the right to require Dynegy to repurchase the Amortizing Notes at a repurchase price equal to the principal amount of the Amortizing Notes as of the repurchase date (as described in the supplemental indenture) plus accrued and unpaid interest. The indenture also contains customary events of default which would permit the holders of the Amortizing Notes to declare those Amortizing Notes to be immediately due and payable if not cured within applicable grace periods, including the failure to make timely installment payments on the Amortizing Notes or other material indebtedness, the failure to satisfy covenants, and specified events of bankruptcy and insolvency.
Letter of Credit Facilities
Dynegy has a Letter of Credit Reimbursement Agreement with an issuing bank, for an LC in an amount not to exceed $55 million. In July 2017, the expiry date of the facility was extended one year, to September 19, 2018. As of September 30, 2017, there was $55 million outstanding under this LC.
Following the ENGIE Acquisition Closing Date, Dynegy entered into a Letter of Credit Reimbursement Agreement with an issuing bank, pursuant to which the issuing bank agreed to provide LCs in an amount not to exceed $50 million. The facility matures February 7, 2018 and may be extended at the Lender’s discretion for up to four additional one-year terms. As of September 30, 2017, there was $40 million outstanding under this facility.
Forward Capacity Agreement
As of September 30, 2017, we have sold a portion of our PJM capacity that cleared for Planning Years 2018-2019, 2019-2020 and 2020-2021 to a financial institution. Dynegy will continue to be subject to the performance obligations as well as any associated performance penalties and bonus payments for those planning years. As a result, this transaction is accounted for as a debt issuance of $241 million with an implied interest rate of 4.9 percent. On March 29, 2017, we replaced an existing Planning Year 2017-2018 contract in the amount of $110 million, with a Planning Year 2019-2020 contract in the amount of $121 million. On July 7, 2017, we replaced $99 million of $109 million of an existing Planning Year 2018-2019 contract with a Planning Year 2020-2021 contract in the amount of $110 million.
Inventory Financing Agreements
Brayton Point Inventory Financing. On May 31, 2017, the Brayton Point inventory financing agreement terminated and the remaining obligation was paid. The Brayton Point facility officially retired on June 1, 2017.
Emissions Repurchase Agreements. In August 2015, we entered into two repurchase transactions with a third party in which we sold approximately $78 million of RGGI inventory and received cash. In February 2017, we repurchased approximately $30 million of the previously sold RGGI inventory. We are obligated to repurchase the remaining inventory in February 2018 at a specified price with an annualized carry cost of approximately 3.49 percent. As of September 30, 2017, there was $48 million, in aggregate, outstanding under these agreements.
Equipment Financing Agreements
Under certain of our contractual service agreements in which we receive maintenance and capital improvements for our gas-fueled generation fleet, we have obtained parts and equipment intended to increase the output, efficiency, and availability of our generation units. We have financed these parts and equipment under agreements with maturities ranging from 2017 to 2025. The portion of future payments attributable to principal will be classified as cash outflows from financing activities, and the portion of future payments attributable to interest will be classified as cash outflows from operating activities in our unaudited consolidated statements of cash flows. The related assets were recorded at the net present value of the payments of $112 million. The $27 million discount is currently being amortized as interest expense over the life of the payments.
25
DYNEGY INC.
NOTES TO CONSOLIDATED FINANCIAL STATEMENTS
(Unaudited)
For the Interim Periods Ended September 30, 2017 and 2016
Note 13—Commitments and Contingencies
Legal Proceedings
Set forth below is a summary of our material ongoing legal proceedings. We record accruals for estimated losses from contingencies when available information indicates that a loss is probable and the amount of the loss, or range of loss, can be reasonably estimated. In addition, we disclose matters for which management believes a material loss is reasonably possible. In all instances, management has assessed the matters below based on current information and made judgments concerning their potential outcome, giving consideration to the nature of the claim, the amount, if any, the nature of damages sought, and the probability of success. Management regularly reviews all new information with respect to such contingencies and adjusts its assessments and estimates of such contingencies accordingly. Because litigation is subject to inherent uncertainties including unfavorable rulings or developments, it is possible that the ultimate resolution of our legal proceedings could involve amounts that are different from our currently recorded accruals, and that such differences could be material.
In addition to the matters discussed below, we are party to other routine proceedings arising in the ordinary course of business. Any accruals or estimated losses related to these matters are not material. In management’s judgment, the ultimate resolution of these matters will not have a material effect on our financial condition, results of operations, or cash flows.
Gas Index Pricing Litigation. We, through our subsidiaries, and other energy companies are named as defendants in several lawsuits claiming damages resulting from alleged price manipulation and false reporting of natural gas prices to various index publications from 2000-2002. The cases allege that the defendants engaged in an antitrust conspiracy to inflate natural gas prices in three states (Kansas, Missouri, and Wisconsin) during the relevant time period. The cases are consolidated in a multi-district litigation proceeding pending in the United States District Court for Nevada. On March 30, 2017, the court denied Plaintiffs’ motion to certify a class action, which will be subject to an interlocutory appeal granted by the Ninth Circuit on June 13, 2017. At this time we cannot reasonably estimate a potential loss.
Advatech Dispute. On September 2, 2016, our Genco subsidiary terminated its Second Amended and Restated Newton Flue Gas Desulfurization System Engineering, Procurement, Construction and Commissioning Services Contract dated as of December 15, 2014 with Advatech, LLC. Advatech issued Genco its final invoice on September 30, 2016 totaling $81 million. Genco contested the invoice on October 3, 2016 and believes the proper amount is less than $1 million. On October 27, 2016, Advatech initiated the dispute resolution process under the Contract and filed for arbitration on March 16, 2017. Settlement discussions required under the dispute resolution process have been unsuccessful. We believe the risk of a material loss related to this dispute to be remote. We dispute the allegations and will defend our position vigorously.
Other Contingencies
MISO 2015-2016 Planning Resource Auction. In May 2015, three complaints were filed at FERC regarding the Zone 4 results for the 2015-2016 Planning Resource Auction (“PRA”) conducted by MISO. Dynegy is a named party in one of the complaints. The complainants, Public Citizen, Inc., the Illinois Attorney General, and Southwestern Electric Cooperative, Inc., have challenged the results of the PRA as unjust and unreasonable, requested rate relief/refunds, and requested changes to the MISO PRA structure going forward. Complainants have also alleged that Dynegy may have engaged in economic or physical withholding in Zone 4 constituting market manipulation in the 2015-2016 PRA. The Independent Market Monitor for MISO (“MISO IMM”), which was responsible for monitoring the MISO 2015-2016 PRA, determined that all offers were competitive and that no physical or economic withholding occurred. The MISO IMM also stated, in a filing responding to the complaints, that there is no basis for the proposed remedies. We filed our Answer to these complaints and believe that we complied fully with the terms of the MISO tariff in connection with the 2015-2016 PRA, disputed the allegations, and will defend our actions vigorously. In addition, the Illinois Industrial Energy Consumers filed a complaint at FERC against MISO on June 30, 2015 requesting prospective changes to the MISO tariff. Dynegy also responded to this complaint.
On October 1, 2015, FERC issued an order of non-public, formal investigation, stating that shortly after the conclusion of the 2015-2016 PRA, FERC’s Office of Enforcement began a non-public informal investigation into whether market manipulation or other potential violations of FERC orders, rules, and regulations occurred before or during the PRA (the “Order”). The Order noted that the investigation is ongoing, and that the order converting the informal, non-public investigation to a formal, non-public investigation does not indicate that FERC has determined that any entity has engaged in market manipulation or otherwise violated any FERC order, rule, or regulation. Dynegy is participating in the investigation. We believe the risk of a material loss related to the investigation to be remote.
26
DYNEGY INC.
NOTES TO CONSOLIDATED FINANCIAL STATEMENTS
(Unaudited)
For the Interim Periods Ended September 30, 2017 and 2016
On December 31, 2015, FERC issued an order on the complaints requiring a number of prospective changes to the MISO tariff provisions associated with calculating Initial Reference Levels and Local Clearing Requirements, effective as of the 2016-2017 PRA. The order did not address the arguments of the complainants regarding the 2015-2016 PRA, and stated that those issues remain under consideration and will be addressed in a future order.
New Source Review and CAA Matters.
New Source Review. Since 1999, the EPA has been engaged in a nationwide enforcement initiative to determine whether coal-fired power plants failed to comply with the requirements of the New Source Review and New Source Performance Standard provisions under the CAA when the plants implemented modifications. The EPA’s initiative focuses on whether projects performed at power plants triggered various permitting requirements, including the need to install pollution control equipment.
In August 2012, the EPA issued a Notice of Violation (“NOV”) alleging that projects performed in 1997, 2006, and 2007 at the Newton facility violated Prevention of Significant Deterioration, Title V permitting, and other requirements. The NOV remains unresolved. We believe our defenses to the allegations described in the NOV are meritorious. A decision by the U.S. Court of Appeals for the Seventh Circuit in 2013 held that similar claims older than five years were barred by the statute of limitations. This decision may provide an additional defense to the allegations in the Newton facility NOV. In September 2016, we retired Newton Unit 2.
Zimmer NOVs. In December 2014, the EPA issued an NOV alleging violation of opacity standards at the Zimmer facility, which we co-own and operate. The EPA previously had issued NOVs to Zimmer in 2008 and 2010 alleging violations of the CAA, the Ohio State Implementation Plan, and the station’s air permits involving standards applicable to opacity, sulfur dioxide, sulfuric acid mist, and heat input. The NOVs remain unresolved. We are unable to predict the outcome of these matters.
Killen and Stuart NOVs/ Notices of Intent to Sue. The EPA issued NOVs in December 2014 for Killen and Stuart, and in February 2017 for Stuart, alleging violations of opacity standards. In May and June 2017, we received two letters from the Sierra Club providing notice of its intent to sue various Dynegy entities and the owner and operator of the Killen and Stuart facilities, respectively, alleging violations of opacity standards under the CAA. The Dayton Power and Light Company, the operator of Killen and Stuart, is expected to act on behalf of itself and the co-owners with respect to these matters. We are unable to predict the outcome of these matters.
Edwards CAA Citizen Suit. In April 2013, environmental groups filed a CAA citizen suit in the U.S. District Court for the Central District of Illinois alleging violations of opacity and particulate matter limits at our IPH segment’s Edwards facility. In August 2016, the District Court granted the plaintiffs’ motion for summary judgment on certain liability issues. We filed a motion seeking interlocutory appeal of the court’s summary judgment ruling. In February 2017, the appellate court denied our motion for interlocutory appeal. The District Court has scheduled the remedy phase trial for October 2018. We dispute the allegations and will defend the case vigorously.
Ultimate resolution of any of these CAA matters could have a material adverse impact on our future financial condition, results of operations, and cash flows. A resolution could result in increased capital expenditures for the installation of pollution control equipment, increased operations and maintenance expenses, and penalties. At this time we are unable to make a reasonable estimate of the possible costs, or range of costs, that might be incurred to resolve these matters.
Coal Combustion Residuals/ Groundwater.
MISO Segment. In 2012, the Illinois EPA (“IEPA”) issued violation notices alleging violations of groundwater standards onsite at our Baldwin and Vermilion facilities’ Coal Combustion Residuals (“CCR”) surface impoundments. In 2016, the IEPA approved our closure and post-closure care plans for the Baldwin old east, east, and west fly ash CCR surface impoundments. We are working towards implementation of those closure plans.
At our retired Vermilion facility, which is not subject to the CCR rule, we submitted proposed corrective action plans involving closure of two CCR surface impoundments (i.e., the old east and the north impoundments) to the IEPA in 2012, with revised plans submitted in 2014. In May 2017, in response to a request from the IEPA for additional information regarding the closure of these Vermilion surface impoundments, we agreed to perform additional groundwater sampling and further analysis of closure options and riverbank stabilization options.
IPH Segment. In 2012, the IEPA issued violation notices alleging violations of groundwater standards at the Newton and Coffeen facilities’ CCR surface impoundments. We are addressing these CCR surface impoundments in accordance with the CCR rule.
27
DYNEGY INC.
NOTES TO CONSOLIDATED FINANCIAL STATEMENTS
(Unaudited)
For the Interim Periods Ended September 30, 2017 and 2016
If remediation measures concerning groundwater are necessary at any of our coal-fired MISO or IPH Segment facilities, we may incur significant costs that could have a material adverse effect on our financial condition, results of operations, and cash flows. At this time, we cannot reasonably estimate the costs, or range of costs, of remediation, if any, that ultimately may be required. CCR surface impoundment and landfill closure costs are reflected in our AROs.
Dam Safety Assessment Reports. The EPA initiated a nationwide investigation of the structural integrity of CCR surface impoundments in 2009. The EPA assessments found all of our surface impoundments to be in satisfactory or fair condition, with the exception of the surface impoundments at the Baldwin and Hennepin facilities.
In response to the Hennepin report, we made capital improvements to the Hennepin east CCR surface impoundment berms and notified the EPA of our intent to close the Hennepin west CCR surface impoundment, which is reflected in our AROs. We performed further studies needed to support closure of the west CCR surface impoundment, submitted those studies to the IEPA in 2014 and await IEPA action.
In response to the Baldwin report, we notified the EPA of our action plan, which included implementation of recommended operating practices, remedial measures and studies. At this time, to resolve the concerns raised in the EPA’s assessment report and as a result of the CCR rule, we plan to initiate closure of the Baldwin west fly ash CCR surface impoundment in the fourth quarter of 2017, which is reflected in our AROs.
Other Commitments
In conducting our operations, we routinely enter into long-term commodity purchase and sale commitments, as well as agreements that commit future cash flow to the lease or acquisition of assets used in our businesses. These commitments have been typically associated with commodity supply arrangements, capital projects, reservation charges associated with firm transmission, transportation, storage and leases for office space, equipment, design and construction, plant sites, and power generation assets.
Indemnifications and Guarantees
In the ordinary course of business, we routinely enter into contractual agreements that contain various representations, warranties, indemnifications and guarantees. Examples of such agreements include, but are not limited to, service agreements, equipment purchase agreements, engineering and technical service agreements, asset sales agreements, and procurement and construction contracts. Some agreements contain indemnities that cover the other party’s negligence or limit the other party’s liability with respect to third party claims, in which event we will effectively be indemnifying the other party. Virtually all such agreements contain representations or warranties that are covered by indemnifications against the losses incurred by the other parties in the event such representations and warranties are false. While there is always the possibility of a loss related to such representations, warranties, indemnifications, and guarantees in our contractual agreements, and such loss could be significant, in most cases management considers the probability of loss to be remote. We have accrued no amounts with respect to the indemnifications as of September 30, 2017 because none were probable of occurring, nor could they be reasonably estimated.
28
DYNEGY INC.
NOTES TO CONSOLIDATED FINANCIAL STATEMENTS
(Unaudited)
For the Interim Periods Ended September 30, 2017 and 2016
Note 14—Income Taxes
Income Tax Benefit. We compute our quarterly taxes under the effective tax rate method based on applying an anticipated annual effective rate to our year-to-date income or loss, except for significant, unusual, or extraordinary transactions. Income taxes for significant, unusual, or extraordinary transactions are computed and recorded in the period that the specific transaction occurs. The income taxes related to income (loss) from continuing operations were as follows:
Three Months Ended September 30, | Nine Months Ended September 30, | |||||||||||||||
(amounts in millions) | 2017 | 2016 | 2017 | 2016 | ||||||||||||
Expected refund of AMT credits previously subject to a valuation allowance | $ | 2 | $ | — | $ | 9 | $ | — | ||||||||
Release of valuation allowance for OCI transactions that impacted deferred income taxes | (1 | ) | — | 4 | — | |||||||||||
Valuation allowance release as a result of the 2017 ENGIE Acquisition and the 2016 EquiPower Acquisition | — | — | 317 | 3 | ||||||||||||
Other state taxes | — | 1 | — | (9 | ) | |||||||||||
Income tax benefit (expense) | $ | 1 | $ | 1 | $ | 330 | $ | (6 | ) | |||||||
As of September 30, 2017, we continued to maintain a valuation allowance against our net deferred tax assets in each jurisdiction as they arise as there was not sufficient evidence to overcome our historical cumulative losses to conclude that it is more-likely-than-not our net deferred tax assets can be realized in the future.
Unrecognized Tax Benefits. During the first quarter of 2017, we increased our unrecognized tax benefits by $66 million as a result of the ENGIE Acquisition for uncertain tax positions included in GSENA’s tax returns prior to our ownership. The entire $66 million would impact our effective tax rate if recognized.
Note 15—Pension and Other Post-Employment Benefit Plans
We sponsor and administer defined benefit plans and defined contribution plans for the benefit of our employees and also provide other post-employment benefits to retirees who meet age and service requirements, which are further described in Note 19—Employee Compensation, Savings, Pension and Other Post-Employment Benefit Plans in our Form 10-K.
In the first quarter of 2017, the Dynegy pension and other post-employment plans were amended as a result of negotiations with former Duke Midwest union participants, IBEW Local 1347. As part of these amendments, the participants’ previous pension plan accrued benefits will be frozen as of December 31, 2017 and will begin accruing on January 1, 2018 with a minimum interest crediting rate of 4 percent. Other post-employment plans were amended to provide retiree medical plan benefits to only certain participants as of January 1, 2018. As a result of these amendments, we remeasured our benefit obligations and funded status of the affected plans and recorded a net-of-tax gain of approximately $15 million through accumulated other comprehensive income during the first quarter of 2017.
Components of Net Periodic Benefit Cost (Gain). The components of net periodic benefit cost (gain) were as follows:
Pension Benefits | Other Benefits | |||||||||||||||
Three Months Ended September 30, | ||||||||||||||||
(amounts in millions) | 2017 | 2016 | 2017 | 2016 | ||||||||||||
Service cost benefits earned during period | $ | 4 | $ | 4 | $ | — | $ | — | ||||||||
Interest cost on projected benefit obligation | 5 | 5 | — | 1 | ||||||||||||
Expected return on plan assets | (6 | ) | (5 | ) | — | (1 | ) | |||||||||
Amortization of prior service credit | (1 | ) | (1 | ) | (1 | ) | (1 | ) | ||||||||
Net periodic benefit cost (gain) | $ | 2 | $ | 3 | $ | (1 | ) | $ | (1 | ) | ||||||
29
DYNEGY INC.
NOTES TO CONSOLIDATED FINANCIAL STATEMENTS
(Unaudited)
For the Interim Periods Ended September 30, 2017 and 2016
Pension Benefits | Other Benefits | |||||||||||||||
Nine Months Ended September 30, | ||||||||||||||||
(amounts in millions) | 2017 | 2016 | 2017 | 2016 | ||||||||||||
Service cost benefits earned during period | $ | 13 | $ | 12 | $ | — | $ | — | ||||||||
Interest cost on projected benefit obligation | 15 | 15 | 1 | 3 | ||||||||||||
Expected return on plan assets | (19 | ) | (17 | ) | (1 | ) | (3 | ) | ||||||||
Amortization of prior service credit | (2 | ) | (1 | ) | (4 | ) | (3 | ) | ||||||||
Net periodic benefit cost (gain) | $ | 7 | $ | 9 | $ | (4 | ) | $ | (3 | ) | ||||||
Note 16—Stockholders' Equity
Preferred Stock
We pay quarterly dividends on our mandatory convertible preferred stock on February 1, May 1, August 1, and November 1 of each year, if declared by our Board of Directors. For each of the nine months ended September 30, 2017 and 2016, we paid $16 million in dividends.
On October 2, 2017, our Board of Directors declared a dividend on our mandatory convertible preferred stock of $1.34 per share, or approximately $5 million in the aggregate. The dividend is for the period beginning on August 1, 2017 and ending on October 31, 2017. Such dividends were paid on November 1, 2017, to stockholders of record as of October 15, 2017. In addition, on November 1, 2017 (the “Mandatory Conversion Date”), each share of Preferred Stock converted at 3.2258 shares of Common Stock for a total issuance of approximately 12.9 million shares of Common Stock.
Stock Purchase Agreement-Terawatt
On February 24, 2016, Dynegy entered into a Stock Purchase Agreement with Terawatt Holdings, LP (“Terawatt”), an affiliate of the ECP Funds, pursuant to which, at the ENGIE Acquisition Closing Date, Dynegy issued to Terawatt 13,711,152 shares of Dynegy common stock for $150 million (the “PIPE Transaction”).
ECP Buyout
Dynegy settled its payment obligation to Energy Capital Partners (“ECP”) of $375 million on the ENGIE Acquisition Closing Date. This payment is recorded as a reduction in additional paid-in capital in our unaudited consolidated balance sheet and is reflected as a purchase of a noncontrolling interest in financing activities in our unaudited consolidated statement of cash flows as of September 30, 2017.
Warrants
On October 2, 2017, the warrants to purchase up to 15.6 million shares of Common Stock for an exercise price of $40 per share expired. These warrants were issued to Legacy Dynegy stockholders upon our emergence from bankruptcy on October 1, 2012 and had a five-year term.
Earnings (Loss) Per Share
Basic earnings (loss) per share is based on the weighted average number of common shares outstanding during the period. Diluted earnings (loss) is based on the weighted average number of common shares used for the basic earnings (loss) per share computation, adjusted for the incremental issuance of shares of common stock assuming (i) our stock options and warrants are exercised under the treasury stock method, (ii) our restricted stock units and performance stock units are fully vested under the treasury stock method, and (iii) our mandatory convertible preferred stock and the SPCs are converted into common stock under the if-converted method. Please read Note 18—Capital Stock and Note 13—Tangible Equity Units in our Form 10-K for further discussion.
30
DYNEGY INC.
NOTES TO CONSOLIDATED FINANCIAL STATEMENTS
(Unaudited)
For the Interim Periods Ended September 30, 2017 and 2016
The following table reflects significant components of our weighted-average shares outstanding used in the basic and diluted loss per share calculations for the three and nine months ended September 30, 2017 and 2016:
Three Months Ended September 30, | Nine Months Ended September 30, | |||||||||||
(in millions) | 2017 | 2016 | 2017 | 2016 | ||||||||
Shares outstanding at the beginning of the period (1) | 154 | 140 | 140 | 117 | ||||||||
Weighted-average shares outstanding during the period of: | ||||||||||||
Shares issued under long-term compensation plans | — | — | 1 | — | ||||||||
Shares issued under the PIPE Transaction | — | — | 11 | — | ||||||||
Prepaid stock purchase contract (TEUs) (1) | — | — | — | 9 | ||||||||
Basic weighted-average shares outstanding | 154 | 140 | 152 | 126 | ||||||||
Dilution from potentially dilutive shares (2) | — | — | 7 | — | ||||||||
Diluted weighted-average shares outstanding (3) | 154 | 140 | 159 | 126 | ||||||||
_________________________________________
(1) | The minimum settlement amount of the TEUs, or 23,092,460 shares, is considered to be outstanding since the issuance date of June 21, 2016, and is included in the computation of basic earnings (loss) per share for the three and nine months ended September 30, 2017 and 2016. Please read Note 13—Tangible Equity Units in our Form 10-K for further discussion. |
(2) | Shares included in the computation of diluted earnings per share for the nine months ended September 30, 2017 consist of: |
• | 5,425,700 additional shares upon settlement of the TEUs - which reflects the difference between the minimum settlement amount included in basic weighted-average shares outstanding and the maximum settlement amount (28,518,160 shares); and |
• | 1,279,515 additional shares attributable to restricted stock units and performance stock units. |
(3) | Entities with a net loss from continuing operations are prohibited from including potential common shares in the computation of diluted per share amounts. Accordingly, we have utilized the basic shares outstanding amount to calculate both basic and diluted loss per share for the three months ended September 30, 2017 and three and nine months ended September 30, 2016. |
For the three and nine months ended September 30, 2017 and 2016, the following potentially dilutive securities were not included in the computation of diluted per share amounts because the effect would be anti-dilutive:
Three Months Ended September 30, | Nine Months Ended September 30, | |||||||||||
(in millions of shares) | 2017 | 2016 | 2017 | 2016 | ||||||||
Stock options | 4.2 | 2.8 | 2.8 | 2.8 | ||||||||
Restricted stock units | 1.3 | 1.3 | — | 1.3 | ||||||||
Performance stock units | 1.6 | 1.2 | — | 1.2 | ||||||||
Warrants (1) | 24.6 | 15.6 | 24.6 | 15.6 | ||||||||
Series A 5.375% mandatory convertible preferred stock (2) | 12.9 | 12.9 | 12.9 | 12.9 | ||||||||
Prepaid stock purchase contract (TEUs) | 5.4 | 5.4 | — | 5.4 | ||||||||
Total | 50.0 | 39.2 | 40.3 | 39.2 | ||||||||
_________________________________________
(1) | Warrants to purchase 15,606,936 shares of our Common Stock expired on October 2, 2017. |
(2) | On November 1, 2017, our outstanding Preferred Stock was converted to approximately12.9 million shares of Common Stock. |
31
DYNEGY INC.
NOTES TO CONSOLIDATED FINANCIAL STATEMENTS
(Unaudited)
For the Interim Periods Ended September 30, 2017 and 2016
Accumulated Other Comprehensive Income
Changes in accumulated other comprehensive income, net of tax, by component, are as follows:
Nine Months Ended September 30, | ||||||||
(amounts in millions) | 2017 | 2016 | ||||||
Beginning of period | $ | 21 | $ | 19 | ||||
Other comprehensive income before reclassifications: | ||||||||
Actuarial gain and plan amendments (net of tax of $4 and zero, respectively) | 11 | — | ||||||
Amounts reclassified from accumulated other comprehensive income: | ||||||||
Amortization of unrecognized prior service credit (net of tax of zero and zero, respectively) (1) | (6 | ) | (4 | ) | ||||
Net current period other comprehensive income (loss), net of tax | 5 | (4 | ) | |||||
End of period | $ | 26 | $ | 15 | ||||
__________________________________________
(1) | Amounts are associated with our defined benefit pension and other post-employment benefit plans and are included in the computation of net periodic pension cost (gain). Please read Note 15—Pension and Other Post-Employment Benefit Plans for further discussion. |
Note 17—Condensed Consolidating Financial Information
Dynegy’s senior notes are guaranteed by certain, but not all, of our wholly owned subsidiaries. The following condensed consolidating financial statements present the financial information of (i) Dynegy (“Parent”), which is the parent and issuer of the senior notes, on a stand-alone, unconsolidated basis, (ii) the guarantor subsidiaries of Dynegy, (iii) the non-guarantor subsidiaries of Dynegy, and (iv) the eliminations necessary to arrive at the information for Dynegy on a consolidated basis. The 100 percent owned subsidiary guarantors, jointly, severally, fully, and unconditionally, guarantee the payment obligations under the senior notes. Please read Note 12—Debt for further discussion.
These statements should be read in conjunction with the unaudited consolidated financial statements and notes thereto of Dynegy. The supplemental condensed consolidating financial information has been prepared pursuant to the rules and regulations for condensed financial information and does not include all disclosures included in annual financial statements. The inclusion of Dynegy’s subsidiaries as either guarantor subsidiaries or non-guarantor subsidiaries in the condensed consolidating financial information is determined as of the most recent balance sheet date presented. On February 2, 2017, upon Genco’s emergence from bankruptcy, IPH (excluding Electric Energy, Inc.) became a guarantor to the senior notes. Accordingly, condensed consolidating financial information previously reported has been retroactively adjusted to reflect the status of Dynegy’s subsidiaries as either guarantor subsidiaries or non-guarantor subsidiaries as of September 30, 2017.
For purposes of the unaudited condensed consolidating financial statements, a portion of our intercompany receivable, which we do not consider to be likely of settlement, has been classified as equity as of September 30, 2017 and December 31, 2016.
32
DYNEGY INC.
NOTES TO CONSOLIDATED FINANCIAL STATEMENTS
(Unaudited)
For the Interim Periods Ended September 30, 2017 and 2016
Condensed Consolidating Balance Sheet as of September 30, 2017
(amounts in millions)
Parent | Guarantor Subsidiaries | Non-Guarantor Subsidiaries | Eliminations | Consolidated | |||||||||||||||
Current Assets | |||||||||||||||||||
Cash and cash equivalents | $ | 354 | $ | 252 | $ | 7 | $ | — | $ | 613 | |||||||||
Accounts receivable, net | 157 | 3,990 | 12 | (3,681 | ) | 478 | |||||||||||||
Inventory | — | 388 | 41 | — | 429 | ||||||||||||||
Other current assets | 8 | 265 | 2 | (91 | ) | 184 | |||||||||||||
Total Current Assets | 519 | 4,895 | 62 | (3,772 | ) | 1,704 | |||||||||||||
Property, plant and equipment, net | — | 8,621 | 308 | — | 8,929 | ||||||||||||||
Investment in affiliates | 16,462 | — | — | (16,462 | ) | — | |||||||||||||
Investment in unconsolidated affiliates | — | 154 | — | — | 154 | ||||||||||||||
Goodwill | — | 772 | — | — | 772 | ||||||||||||||
Assets held-for-sale | — | 181 | — | — | 181 | ||||||||||||||
Other long-term assets | 17 | 214 | 36 | — | 267 | ||||||||||||||
Intercompany note receivable | 46 | — | — | (46 | ) | — | |||||||||||||
Total Assets | $ | 17,044 | $ | 14,837 | $ | 406 | $ | (20,280 | ) | $ | 12,007 | ||||||||
Current Liabilities | |||||||||||||||||||
Accounts payable | $ | 3,310 | $ | 426 | $ | 233 | $ | (3,681 | ) | $ | 288 | ||||||||
Other current liabilities | 226 | 342 | 102 | (91 | ) | 579 | |||||||||||||
Total Current Liabilities | 3,536 | 768 | 335 | (3,772 | ) | 867 | |||||||||||||
Debt, long-term portion, net | 8,347 | 268 | 33 | — | 8,648 | ||||||||||||||
Intercompany note payable | 3,042 | 46 | — | (3,088 | ) | — | |||||||||||||
Other long-term liabilities | 130 | 331 | 47 | — | 508 | ||||||||||||||
Total Liabilities | 15,055 | 1,413 | 415 | (6,860 | ) | 10,023 | |||||||||||||
Stockholders’ Equity | |||||||||||||||||||
Dynegy Stockholders’ Equity | 1,989 | 16,471 | (9 | ) | (16,462 | ) | 1,989 | ||||||||||||
Intercompany note receivable | — | (3,042 | ) | — | 3,042 | — | |||||||||||||
Total Dynegy Stockholders’ Equity | 1,989 | 13,429 | (9 | ) | (13,420 | ) | 1,989 | ||||||||||||
Noncontrolling interest | — | (5 | ) | — | — | (5 | ) | ||||||||||||
Total Equity | 1,989 | 13,424 | (9 | ) | (13,420 | ) | 1,984 | ||||||||||||
Total Liabilities and Equity | $ | 17,044 | $ | 14,837 | $ | 406 | $ | (20,280 | ) | $ | 12,007 | ||||||||
33
DYNEGY INC.
NOTES TO CONSOLIDATED FINANCIAL STATEMENTS
(Unaudited)
For the Interim Periods Ended September 30, 2017 and 2016
Condensed Consolidating Balance Sheet as of December 31, 2016
(amounts in millions)
Parent | Guarantor Subsidiaries | Non-Guarantor Subsidiaries | Eliminations | Consolidated | |||||||||||||||
Current Assets | |||||||||||||||||||
Cash and cash equivalents | $ | 1,529 | $ | 221 | $ | 26 | $ | — | $ | 1,776 | |||||||||
Restricted cash | 21 | 41 | — | — | 62 | ||||||||||||||
Accounts receivable, net | 141 | 2,604 | 39 | (2,398 | ) | 386 | |||||||||||||
Inventory | — | 326 | 119 | — | 445 | ||||||||||||||
Other current assets | 12 | 408 | 2 | (104 | ) | 318 | |||||||||||||
Total Current Assets | 1,703 | 3,600 | 186 | (2,502 | ) | 2,987 | |||||||||||||
Property, plant and equipment, net | — | 6,772 | 349 | — | 7,121 | ||||||||||||||
Investment in affiliates | 12,175 | — | — | (12,175 | ) | — | |||||||||||||
Restricted cash | 2,000 | — | — | — | 2,000 | ||||||||||||||
Goodwill | — | 799 | — | — | 799 | ||||||||||||||
Other long-term assets | 2 | 109 | 35 | — | 146 | ||||||||||||||
Intercompany note receivable | — | 8 | — | (8 | ) | — | |||||||||||||
Total Assets | $ | 15,880 | $ | 11,288 | $ | 570 | $ | (14,685 | ) | $ | 13,053 | ||||||||
Current Liabilities | |||||||||||||||||||
Accounts payable | $ | 1,990 | $ | 443 | $ | 297 | $ | (2,398 | ) | $ | 332 | ||||||||
Other current liabilities | 143 | 377 | 168 | (104 | ) | 584 | |||||||||||||
Total Current Liabilities | 2,133 | 820 | 465 | (2,502 | ) | 916 | |||||||||||||
Liabilities subject to compromise | — | 832 | — | — | 832 | ||||||||||||||
Debt, long-term portion, net | 8,531 | 216 | 31 | — | 8,778 | ||||||||||||||
Intercompany note payable | 3,042 | — | — | (3,042 | ) | — | |||||||||||||
Other long-term liabilities | 132 | 313 | 51 | (8 | ) | 488 | |||||||||||||
Total Liabilities | 13,838 | 2,181 | 547 | (5,552 | ) | 11,014 | |||||||||||||
Stockholders’ Equity | |||||||||||||||||||
Dynegy Stockholders’ Equity | 2,042 | 12,152 | 23 | (12,175 | ) | 2,042 | |||||||||||||
Intercompany note receivable | — | (3,042 | ) | — | 3,042 | — | |||||||||||||
Total Dynegy Stockholders’ Equity | 2,042 | 9,110 | 23 | (9,133 | ) | 2,042 | |||||||||||||
Noncontrolling interest | — | (3 | ) | — | — | (3 | ) | ||||||||||||
Total Equity | 2,042 | 9,107 | 23 | (9,133 | ) | 2,039 | |||||||||||||
Total Liabilities and Equity | $ | 15,880 | $ | 11,288 | $ | 570 | $ | (14,685 | ) | $ | 13,053 | ||||||||
34
DYNEGY INC.
NOTES TO CONSOLIDATED FINANCIAL STATEMENTS
(Unaudited)
For the Interim Periods Ended September 30, 2017 and 2016
Condensed Consolidating Statements of Operations for the Three Months Ended September 30, 2017
(amounts in millions)
Parent | Guarantor Subsidiaries | Non-Guarantor Subsidiaries | Eliminations | Consolidated | |||||||||||||||
Revenues | $ | — | $ | 1,380 | $ | 84 | $ | (27 | ) | $ | 1,437 | ||||||||
Cost of sales, excluding depreciation expense | — | (760 | ) | (54 | ) | 27 | (787 | ) | |||||||||||
Gross margin | — | 620 | 30 | — | 650 | ||||||||||||||
Operating and maintenance expense | — | (209 | ) | (27 | ) | — | (236 | ) | |||||||||||
Depreciation expense | — | (193 | ) | (9 | ) | — | (202 | ) | |||||||||||
Impairments | — | (29 | ) | — | — | (29 | ) | ||||||||||||
Loss on sale of assets, net | — | (78 | ) | — | — | (78 | ) | ||||||||||||
General and administrative expense | 8 | (50 | ) | (2 | ) | — | (44 | ) | |||||||||||
Acquisition and integration costs | — | (3 | ) | — | — | (3 | ) | ||||||||||||
Other | — | — | — | — | — | ||||||||||||||
Operating income (loss) | 8 | 58 | (8 | ) | — | 58 | |||||||||||||
Bankruptcy reorganization items | — | 12 | — | — | 12 | ||||||||||||||
Earnings from unconsolidated investments | — | 4 | — | — | 4 | ||||||||||||||
Equity in losses from investments in affiliates | 78 | — | — | (78 | ) | — | |||||||||||||
Interest expense | (155 | ) | (6 | ) | (3 | ) | 3 | (161 | ) | ||||||||||
Loss on early extinguishment of debt | (66 | ) | — | — | — | (66 | ) | ||||||||||||
Other income and expense, net | 3 | 19 | — | (3 | ) | 19 | |||||||||||||
Income (loss) before income taxes | (132 | ) | 87 | (11 | ) | (78 | ) | (134 | ) | ||||||||||
Income tax benefit | — | 1 | — | — | 1 | ||||||||||||||
Net income (loss) | (132 | ) | 88 | (11 | ) | (78 | ) | (133 | ) | ||||||||||
Less: Net loss attributable to noncontrolling interest | — | (1 | ) | — | — | (1 | ) | ||||||||||||
Net Income (loss) attributable to Dynegy Inc. | $ | (132 | ) | $ | 89 | $ | (11 | ) | $ | (78 | ) | $ | (132 | ) | |||||
35
DYNEGY INC.
NOTES TO CONSOLIDATED FINANCIAL STATEMENTS
(Unaudited)
For the Interim Periods Ended September 30, 2017 and 2016
Condensed Consolidating Statements of Operations for the Nine Months Ended September 30, 2017
(amounts in millions)
Parent | Guarantor Subsidiaries | Non-Guarantor Subsidiaries | Eliminations | Consolidated | |||||||||||||||
Revenues | $ | — | $ | 3,616 | $ | 342 | $ | (110 | ) | $ | 3,848 | ||||||||
Cost of sales, excluding depreciation expense | — | (2,108 | ) | (227 | ) | 110 | (2,225 | ) | |||||||||||
Gross margin | — | 1,508 | 115 | — | 1,623 | ||||||||||||||
Operating and maintenance expense | — | (660 | ) | (90 | ) | — | (750 | ) | |||||||||||
Depreciation expense | — | (567 | ) | (44 | ) | — | (611 | ) | |||||||||||
Impairments | — | (148 | ) | — | — | (148 | ) | ||||||||||||
Gain (loss) on sale of assets, net | — | (108 | ) | 1 | — | (107 | ) | ||||||||||||
General and administrative expense | — | (121 | ) | (5 | ) | — | (126 | ) | |||||||||||
Acquisition and integration costs | (51 | ) | (4 | ) | — | — | (55 | ) | |||||||||||
Other | — | 1 | — | — | 1 | ||||||||||||||
Operating loss | (51 | ) | (99 | ) | (23 | ) | — | (173 | ) | ||||||||||
Bankruptcy reorganization items | — | 494 | — | — | 494 | ||||||||||||||
Earnings from unconsolidated investments | — | 4 | — | — | 4 | ||||||||||||||
Equity in earnings from investments in affiliates | 730 | — | — | (730 | ) | — | |||||||||||||
Interest expense | (461 | ) | (18 | ) | (9 | ) | 10 | (478 | ) | ||||||||||
Loss on early extinguishment of debt | (75 | ) | — | — | — | (75 | ) | ||||||||||||
Other income and expense, net | 26 | 49 | — | (10 | ) | 65 | |||||||||||||
Income (loss) before income taxes | 169 | 430 | (32 | ) | (730 | ) | (163 | ) | |||||||||||
Income tax benefit | — | 330 | — | — | 330 | ||||||||||||||
Net income (loss) | 169 | 760 | (32 | ) | (730 | ) | 167 | ||||||||||||
Less: Net loss attributable to noncontrolling interest | — | (2 | ) | — | — | (2 | ) | ||||||||||||
Net income (loss) attributable to Dynegy Inc. | $ | 169 | $ | 762 | $ | (32 | ) | $ | (730 | ) | $ | 169 | |||||||
Condensed Consolidating Statements of Operations for the Three Months Ended September 30, 2016
(amounts in millions)
Parent | Guarantor Subsidiaries | Non-Guarantor Subsidiaries | Eliminations | Consolidated | |||||||||||||||
Revenues | $ | — | $ | 1,082 | $ | 128 | $ | (26 | ) | $ | 1,184 | ||||||||
Cost of sales, excluding depreciation expense | — | (609 | ) | (77 | ) | 26 | (660 | ) | |||||||||||
Gross margin | — | 473 | 51 | — | 524 | ||||||||||||||
Operating and maintenance expense | — | (189 | ) | (29 | ) | — | (218 | ) | |||||||||||
Depreciation expense | — | (146 | ) | (17 | ) | — | (163 | ) | |||||||||||
Impairments | — | (212 | ) | — | — | (212 | ) | ||||||||||||
General and administrative expense | (2 | ) | (38 | ) | (1 | ) | — | (41 | ) | ||||||||||
Acquisition and integration costs | (5 | ) | (2 | ) | — | — | (7 | ) | |||||||||||
Other | — | (1 | ) | 1 | — | — | |||||||||||||
Operating income (loss) | (7 | ) | (115 | ) | 5 | — | (117 | ) | |||||||||||
Earnings from unconsolidated investments | — | 4 | — | — | 4 | ||||||||||||||
Equity in losses from investments in affiliates | (136 | ) | — | — | 136 | — | |||||||||||||
Interest expense | (138 | ) | (27 | ) | (2 | ) | 1 | (166 | ) | ||||||||||
Other income and expense, net | 25 | 5 | — | (1 | ) | 29 | |||||||||||||
Income (loss) before income taxes | (256 | ) | (133 | ) | 3 | 136 | (250 | ) | |||||||||||
Income tax benefit (expense) | 7 | (6 | ) | — | — | 1 | |||||||||||||
Net income (loss) attributable to Dynegy Inc. | $ | (249 | ) | $ | (139 | ) | $ | 3 | $ | 136 | $ | (249 | ) | ||||||
36
DYNEGY INC.
NOTES TO CONSOLIDATED FINANCIAL STATEMENTS
(Unaudited)
For the Interim Periods Ended September 30, 2017 and 2016
Condensed Consolidating Statements of Operations for the Nine Months Ended September 30, 2016
(amounts in millions)
Parent | Guarantor Subsidiaries | Non-Guarantor Subsidiaries | Eliminations | Consolidated | |||||||||||||||
Revenues | $ | — | $ | 2,921 | $ | 355 | $ | (65 | ) | $ | 3,211 | ||||||||
Cost of sales, excluding depreciation expense | — | (1,570 | ) | (193 | ) | 65 | (1,698 | ) | |||||||||||
Gross margin | — | 1,351 | 162 | — | 1,513 | ||||||||||||||
Operating and maintenance expense | — | (595 | ) | (100 | ) | — | (695 | ) | |||||||||||
Depreciation expense | — | (436 | ) | (58 | ) | — | (494 | ) | |||||||||||
Impairments | — | (857 | ) | — | — | (857 | ) | ||||||||||||
General and administrative expense | (5 | ) | (108 | ) | (4 | ) | — | (117 | ) | ||||||||||
Acquisition and integration costs | (8 | ) | — | — | — | (8 | ) | ||||||||||||
Other | — | (9 | ) | (7 | ) | — | (16 | ) | |||||||||||
Operating loss | (13 | ) | (654 | ) | (7 | ) | — | (674 | ) | ||||||||||
Earnings from unconsolidated investments | — | 7 | — | — | 7 | ||||||||||||||
Equity in losses from investments in affiliates | (693 | ) | — | — | 693 | — | |||||||||||||
Interest expense | (382 | ) | (65 | ) | (6 | ) | 4 | (449 | ) | ||||||||||
Other income and expense, net | 28 | 36 | — | (4 | ) | 60 | |||||||||||||
Loss before income taxes | (1,060 | ) | (676 | ) | (13 | ) | 693 | (1,056 | ) | ||||||||||
Income tax expense | — | (6 | ) | — | — | (6 | ) | ||||||||||||
Net loss | (1,060 | ) | (682 | ) | (13 | ) | 693 | (1,062 | ) | ||||||||||
Less: Net loss attributable to noncontrolling interest | — | (2 | ) | — | — | (2 | ) | ||||||||||||
Net loss attributable to Dynegy Inc. | $ | (1,060 | ) | $ | (680 | ) | $ | (13 | ) | $ | 693 | $ | (1,060 | ) | |||||
37
DYNEGY INC.
NOTES TO CONSOLIDATED FINANCIAL STATEMENTS
(Unaudited)
For the Interim Periods Ended September 30, 2017 and 2016
Condensed Consolidating Statements of Comprehensive Income (Loss) for the Three Months Ended September 30, 2017
(amounts in millions)
Parent | Guarantor Subsidiaries | Non-Guarantor Subsidiaries | Eliminations | Consolidated | |||||||||||||||
Net income (loss) | $ | (132 | ) | $ | 88 | $ | (11 | ) | $ | (78 | ) | $ | (133 | ) | |||||
Other comprehensive income before reclassifications: | |||||||||||||||||||
Actuarial gain and plan amendments, net of tax of zero | — | — | — | — | — | ||||||||||||||
Amounts reclassified from accumulated other comprehensive income: | |||||||||||||||||||
Amortization of unrecognized prior service credit, net of tax of zero | (2 | ) | — | — | — | (2 | ) | ||||||||||||
Other comprehensive loss, net of tax | (2 | ) | — | — | — | (2 | ) | ||||||||||||
Comprehensive income (loss) | (134 | ) | 88 | (11 | ) | (78 | ) | (135 | ) | ||||||||||
Less: Comprehensive loss attributable to noncontrolling interest | — | (1 | ) | — | — | (1 | ) | ||||||||||||
Total comprehensive income (loss) attributable to Dynegy Inc. | $ | (134 | ) | $ | 89 | $ | (11 | ) | $ | (78 | ) | $ | (134 | ) | |||||
Condensed Consolidating Statements of Comprehensive Income (Loss) for the Nine Months Ended September 30, 2017
(amounts in millions)
Parent | Guarantor Subsidiaries | Non-Guarantor Subsidiaries | Eliminations | Consolidated | |||||||||||||||
Net income (loss) | $ | 169 | $ | 760 | $ | (32 | ) | $ | (730 | ) | $ | 167 | |||||||
Other comprehensive income before reclassifications: | |||||||||||||||||||
Actuarial gain and plan amendments, net of tax of $4 | 11 | — | — | — | 11 | ||||||||||||||
Amounts reclassified from accumulated other comprehensive income: | |||||||||||||||||||
Amortization of unrecognized prior service credit, net of tax of zero | (5 | ) | — | (1 | ) | — | (6 | ) | |||||||||||
Other comprehensive loss from investment in affiliates | (1 | ) | — | — | 1 | — | |||||||||||||
Other comprehensive income (loss), net of tax | 5 | — | (1 | ) | 1 | 5 | |||||||||||||
Comprehensive income (loss) | 174 | 760 | (33 | ) | (729 | ) | 172 | ||||||||||||
Less: Comprehensive loss attributable to noncontrolling interest | — | (2 | ) | — | — | (2 | ) | ||||||||||||
Total comprehensive income (loss) attributable to Dynegy Inc. | $ | 174 | $ | 762 | $ | (33 | ) | $ | (729 | ) | $ | 174 | |||||||
Condensed Consolidating Statements of Comprehensive Income (Loss) for the Three Months Ended September 30, 2016
(amounts in millions)
Parent | Guarantor Subsidiaries | Non-Guarantor Subsidiaries | Eliminations | Consolidated | |||||||||||||||
Net income (loss) | $ | (249 | ) | $ | (139 | ) | $ | 3 | $ | 136 | $ | (249 | ) | ||||||
Amounts reclassified from accumulated other comprehensive income: | |||||||||||||||||||
Amortization of unrecognized prior service credit and actuarial gain, net of tax of zero | (1 | ) | (1 | ) | — | — | (2 | ) | |||||||||||
Other comprehensive loss from investment in affiliates | (1 | ) | — | — | 1 | — | |||||||||||||
Other comprehensive loss, net of tax | (2 | ) | (1 | ) | — | 1 | (2 | ) | |||||||||||
Comprehensive income (loss) | (251 | ) | (140 | ) | 3 | 137 | (251 | ) | |||||||||||
Less: Comprehensive income attributable to noncontrolling interest | — | — | — | — | — | ||||||||||||||
Total comprehensive income (loss) attributable to Dynegy Inc. | $ | (251 | ) | $ | (140 | ) | $ | 3 | $ | 137 | $ | (251 | ) | ||||||
38
DYNEGY INC.
NOTES TO CONSOLIDATED FINANCIAL STATEMENTS
(Unaudited)
For the Interim Periods Ended September 30, 2017 and 2016
Condensed Consolidating Statements of Comprehensive Income (Loss) for the Nine Months Ended September 30, 2016
(amounts in millions)
Parent | Guarantor Subsidiaries | Non-Guarantor Subsidiaries | Eliminations | Consolidated | |||||||||||||||
Net loss | $ | (1,060 | ) | $ | (682 | ) | $ | (13 | ) | $ | 693 | $ | (1,062 | ) | |||||
Amounts reclassified from accumulated other comprehensive income: | |||||||||||||||||||
Amortization of unrecognized prior service credit and actuarial gain, net of tax of zero | (3 | ) | (1 | ) | — | — | (4 | ) | |||||||||||
Other comprehensive loss from investment in affiliates | (1 | ) | — | — | 1 | — | |||||||||||||
Other comprehensive loss, net of tax | (4 | ) | (1 | ) | — | 1 | (4 | ) | |||||||||||
Comprehensive loss | (1,064 | ) | (683 | ) | (13 | ) | 694 | (1,066 | ) | ||||||||||
Less: Comprehensive loss attributable to noncontrolling interest | — | (2 | ) | — | — | (2 | ) | ||||||||||||
Total comprehensive loss attributable to Dynegy Inc. | $ | (1,064 | ) | $ | (681 | ) | $ | (13 | ) | $ | 694 | $ | (1,064 | ) | |||||
Condensed Consolidating Statements of Cash Flows for the Nine Months Ended September 30, 2017
(amounts in millions)
Parent | Guarantor Subsidiaries | Non-Guarantor Subsidiaries | Eliminations | Consolidated | |||||||||||||||
CASH FLOWS FROM OPERATING ACTIVITIES: | |||||||||||||||||||
Net cash provided by (used in) operating activities | $ | (455 | ) | $ | 877 | $ | 79 | $ | — | $ | 501 | ||||||||
CASH FLOWS FROM INVESTING ACTIVITIES: | |||||||||||||||||||
Capital expenditures | — | (123 | ) | (6 | ) | — | (129 | ) | |||||||||||
Acquisitions, net of cash acquired | (3,244 | ) | (5 | ) | — | — | (3,249 | ) | |||||||||||
Distributions from unconsolidated investments | — | 7 | — | — | 7 | ||||||||||||||
Net intercompany transfers | 726 | — | — | (726 | ) | — | |||||||||||||
Proceeds received from asset sales, net | 599 | — | 1 | — | 600 | ||||||||||||||
Net cash used in investing activities | (1,919 | ) | (121 | ) | (5 | ) | (726 | ) | (2,771 | ) | |||||||||
CASH FLOWS FROM FINANCING ACTIVITIES: | |||||||||||||||||||
Proceeds from long-term borrowings, net of debt issuance costs | 1,747 | — | — | — | 1,747 | ||||||||||||||
Repayments of borrowings | (2,180 | ) | (30 | ) | (51 | ) | — | (2,261 | ) | ||||||||||
Proceeds from issuance of equity, net of issuance costs | 150 | — | — | — | 150 | ||||||||||||||
Payments of debt extinguishment costs | (50 | ) | — | — | — | (50 | ) | ||||||||||||
Preferred stock dividends paid | (16 | ) | — | — | — | (16 | ) | ||||||||||||
Interest rate swap settlement payments | (15 | ) | — | — | — | (15 | ) | ||||||||||||
Acquisition of noncontrolling interest | (375 | ) | — | — | — | (375 | ) | ||||||||||||
Payments related to bankruptcy settlement | (126 | ) | (7 | ) | — | — | (133 | ) | |||||||||||
Net intercompany transfers | — | (684 | ) | (42 | ) | 726 | — | ||||||||||||
Intercompany borrowings, net of repayments | 45 | (45 | ) | — | — | — | |||||||||||||
Other financing | (2 | ) | — | — | — | (2 | ) | ||||||||||||
Net cash used in financing activities | (822 | ) | (766 | ) | (93 | ) | 726 | (955 | ) | ||||||||||
Net decrease in cash, cash equivalents and restricted cash | (3,196 | ) | (10 | ) | (19 | ) | — | (3,225 | ) | ||||||||||
Cash, cash equivalents, and restricted cash beginning of period | 3,550 | 262 | 26 | — | 3,838 | ||||||||||||||
Cash, cash equivalents, and restricted cash end of period | $ | 354 | $ | 252 | $ | 7 | $ | — | $ | 613 | |||||||||
39
DYNEGY INC.
NOTES TO CONSOLIDATED FINANCIAL STATEMENTS
(Unaudited)
For the Interim Periods Ended September 30, 2017 and 2016
Condensed Consolidating Statements of Cash Flows for the Nine Months Ended September 30, 2016
(amounts in millions)
Parent | Guarantor Subsidiaries | Non-Guarantor Subsidiaries | Eliminations | Consolidated | |||||||||||||||
CASH FLOWS FROM OPERATING ACTIVITIES: | |||||||||||||||||||
Net cash provided by (used in) operating activities | $ | (236 | ) | $ | 977 | $ | (13 | ) | $ | — | $ | 728 | |||||||
CASH FLOWS FROM INVESTING ACTIVITIES: | |||||||||||||||||||
Capital expenditures | — | (271 | ) | (66 | ) | — | (337 | ) | |||||||||||
Distributions from unconsolidated investments | — | 14 | — | — | 14 | ||||||||||||||
Net intercompany transfers | 801 | — | — | (801 | ) | — | |||||||||||||
Other investing | — | 10 | — | — | 10 | ||||||||||||||
Net cash provided by (used in) investing activities | 801 | (247 | ) | (66 | ) | (801 | ) | (313 | ) | ||||||||||
CASH FLOWS FROM FINANCING ACTIVITIES: | |||||||||||||||||||
Proceeds from long-term borrowings, net of debt issuance costs | 2,079 | 198 | — | — | 2,277 | ||||||||||||||
Repayments of borrowings | (6 | ) | (15 | ) | — | — | (21 | ) | |||||||||||
Proceeds from issuance of equity, net of issuance costs | 359 | — | — | — | 359 | ||||||||||||||
Preferred stock dividends paid | (16 | ) | — | — | — | (16 | ) | ||||||||||||
Interest rate swap settlement payments | (13 | ) | — | — | — | (13 | ) | ||||||||||||
Net intercompany transfers | — | (837 | ) | 36 | 801 | — | |||||||||||||
Other financing | (2 | ) | — | — | — | (2 | ) | ||||||||||||
Net cash provided by (used in) financing activities | 2,401 | (654 | ) | 36 | 801 | 2,584 | |||||||||||||
Net increase (decrease) in cash, cash equivalents and restricted cash | 2,966 | 76 | (43 | ) | — | 2,999 | |||||||||||||
Cash, cash equivalents and restricted cash, beginning of period | 327 | 133 | 84 | — | 544 | ||||||||||||||
Cash, cash equivalents and restricted cash, end of period | $ | 3,293 | $ | 209 | $ | 41 | $ | — | $ | 3,543 | |||||||||
Note 18—Genco Chapter 11 Bankruptcy and Emergence
On December 9, 2016, Genco filed a petition (the “Bankruptcy Petition”) under title 11 of the United States Code (the “Bankruptcy Code”) in the United States Bankruptcy Court for the Southern District of Texas (the “Bankruptcy Court”). On January 25, 2017, the Bankruptcy Court confirmed the Genco Plan and Genco emerged from bankruptcy on February 2, 2017. As a result, we eliminated $825 million of Genco senior notes and $7 million of accrued interest in exchange for:
• | On the Emergence Date, approximately $113 million of cash, $182 million of new Dynegy seven-year unsecured notes, and warrants (the “2017 Warrants”) to purchase up to 8.7 million shares of common stock with a fair value of $17 million. |
• | On April 18, 2017, approximately $3 million of cash, $3 million of new Dynegy seven-year unsecured notes, and 0.1 million 2017 Warrants with a fair value of less than $1 million. |
• | On August 1, 2017, approximately $6 million of cash, $4 million of new Dynegy seven-year unsecured notes, and 0.2 million 2017 Warrants with a fair value of less than $1 million were issued to remaining eligible holders of Genco senior notes and represented the final payment in the Genco restructuring. |
The 2017 Warrants, which have an exercise price of $35 per share of common stock, have a seven-year term expiring on February 2, 2024 and are recorded as Other long-term liabilities in our unaudited consolidated balance sheet as of September 30, 2017.
40
DYNEGY INC.
NOTES TO CONSOLIDATED FINANCIAL STATEMENTS
(Unaudited)
For the Interim Periods Ended September 30, 2017 and 2016
The following table summarizes the Company’s gain from the termination of the Genco senior notes, which is recognized in Bankruptcy reorganization items in our unaudited consolidated statement of operations for the nine months ended September 30, 2017:
(amounts in millions) | ||||
Liabilities subject to compromise, which were terminated | $ | 832 | ||
Less: | ||||
Seven-year unsecured notes | 188 | |||
Cash consideration | 122 | |||
2017 Warrants, at fair value | 17 | |||
Legal and consulting fees | 11 | |||
Bankruptcy reorganization items | $ | 494 | ||
Included in the table above is an approximate $12 million gain to Bankruptcy reorganization items recognized for the three months ended September 30, 2017 upon the final payment under the Genco restructuring.
For income tax purposes, the income from cancellation of debt is excluded from taxable income in the current year and will instead reduce Genco’s tax attributes.
Note 19—Segment Information
We report the results of our operations in six segments: (i) PJM, (ii) NY/NE, (iii) ERCOT, (iv) MISO, (v) IPH, and (vi) CAISO. PJM also includes our Dynegy Energy Services retail business in Ohio and Pennsylvania. NY/NE also includes our Dynegy Energy Services retail business in Massachusetts. IPH also includes our Homefield Energy retail business in Illinois. Our unaudited consolidated financial results also reflect corporate-level expenses such as general and administrative expense, interest expense, and income tax benefit (expense).
41
DYNEGY INC.
NOTES TO CONSOLIDATED FINANCIAL STATEMENTS
(Unaudited)
For the Interim Periods Ended September 30, 2017 and 2016
Reportable segment information, including intercompany transactions accounted for at prevailing market rates, for the three and nine months ended September 30, 2017 and 2016 is presented below:
Segment Data as of and for the Three Months Ended September 30, 2017
(amounts in millions) | PJM | NY/NE | ERCOT | MISO | IPH | CAISO | Other and Eliminations | Total | ||||||||||||||||||||||||
Domestic: | ||||||||||||||||||||||||||||||||
Unaffiliated revenues | $ | 628 | $ | 269 | $ | 210 | $ | 98 | $ | 182 | $ | 50 | $ | — | $ | 1,437 | ||||||||||||||||
Intercompany and affiliate revenues | (25 | ) | (1 | ) | (1 | ) | 6 | 21 | — | — | — | |||||||||||||||||||||
Total revenues | $ | 603 | $ | 268 | $ | 209 | $ | 104 | $ | 203 | $ | 50 | $ | — | $ | 1,437 | ||||||||||||||||
Depreciation expense | $ | (94 | ) | $ | (52 | ) | $ | (20 | ) | $ | (9 | ) | $ | (11 | ) | $ | (14 | ) | $ | (2 | ) | $ | (202 | ) | ||||||||
Impairments | (29 | ) | — | — | — | — | — | — | (29 | ) | ||||||||||||||||||||||
Loss on sale of assets, net | (1 | ) | (77 | ) | — | — | — | — | — | (78 | ) | |||||||||||||||||||||
General and administrative expense | — | — | — | — | — | — | (44 | ) | (44 | ) | ||||||||||||||||||||||
Acquisition and integration costs | — | — | — | — | — | — | (3 | ) | (3 | ) | ||||||||||||||||||||||
Operating income (loss) | $ | 86 | $ | (30 | ) | $ | 50 | $ | (9 | ) | $ | 11 | $ | — | $ | (50 | ) | $ | 58 | |||||||||||||
Bankruptcy reorganization items | — | — | — | — | 12 | — | — | 12 | ||||||||||||||||||||||||
Earnings from unconsolidated investments | 2 | 2 | — | — | — | — | — | 4 | ||||||||||||||||||||||||
Interest expense | — | — | — | — | — | — | (161 | ) | (161 | ) | ||||||||||||||||||||||
Loss on early extinguishment of debt | — | — | — | — | — | — | (66 | ) | (66 | ) | ||||||||||||||||||||||
Other income and expense, net | 16 | — | — | — | — | — | 3 | 19 | ||||||||||||||||||||||||
Loss before income taxes | (134 | ) | ||||||||||||||||||||||||||||||
Income tax benefit | — | — | — | — | — | — | 1 | 1 | ||||||||||||||||||||||||
Net loss | (133 | ) | ||||||||||||||||||||||||||||||
Less: Net loss attributable to noncontrolling interest | (1 | ) | ||||||||||||||||||||||||||||||
Net loss attributable to Dynegy Inc. | $ | (132 | ) | |||||||||||||||||||||||||||||
Total assets—domestic | $ | 5,158 | $ | 3,401 | $ | 1,564 | $ | 232 | $ | 581 | $ | 461 | $ | 610 | $ | 12,007 | ||||||||||||||||
Investment in unconsolidated affiliate | $ | 77 | $ | 77 | $ | — | $ | — | $ | — | $ | — | $ | — | $ | 154 | ||||||||||||||||
Capital expenditures | $ | (6 | ) | $ | (6 | ) | $ | (3 | ) | $ | — | $ | (4 | ) | $ | (3 | ) | $ | (2 | ) | $ | (24 | ) | |||||||||
42
DYNEGY INC.
NOTES TO CONSOLIDATED FINANCIAL STATEMENTS
(Unaudited)
For the Interim Periods Ended September 30, 2017 and 2016
Segment Data as of and for the Nine Months Ended September 30, 2017
(amounts in millions) | PJM | NY/NE | ERCOT | MISO | IPH | CAISO | Other and Eliminations | Total | ||||||||||||||||||||||||
Domestic: | ||||||||||||||||||||||||||||||||
Unaffiliated revenues | $ | 1,806 | $ | 817 | $ | 322 | $ | 276 | $ | 538 | $ | 89 | $ | — | $ | 3,848 | ||||||||||||||||
Intercompany and affiliate revenues | (47 | ) | (2 | ) | (1 | ) | 16 | 34 | — | — | — | |||||||||||||||||||||
Total revenues | $ | 1,759 | $ | 815 | $ | 321 | $ | 292 | $ | 572 | $ | 89 | $ | — | $ | 3,848 | ||||||||||||||||
Depreciation expense | $ | (283 | ) | $ | (171 | ) | $ | (54 | ) | $ | (22 | ) | $ | (35 | ) | $ | (40 | ) | $ | (6 | ) | $ | (611 | ) | ||||||||
Impairments | (49 | ) | — | — | (99 | ) | — | — | — | (148 | ) | |||||||||||||||||||||
Gain (loss) on sale of assets, net | (31 | ) | (77 | ) | — | — | 1 | — | — | (107 | ) | |||||||||||||||||||||
General and administrative expense | — | — | — | — | — | — | (126 | ) | (126 | ) | ||||||||||||||||||||||
Acquisition and integration costs | — | — | — | — | — | — | (55 | ) | (55 | ) | ||||||||||||||||||||||
Operating income (loss) | $ | 178 | $ | (72 | ) | $ | (8 | ) | $ | (90 | ) | $ | 40 | $ | (33 | ) | $ | (188 | ) | $ | (173 | ) | ||||||||||
Bankruptcy reorganization items | — | — | — | — | 494 | — | — | 494 | ||||||||||||||||||||||||
Earnings from unconsolidated investments | 2 | 2 | — | — | — | — | — | 4 | ||||||||||||||||||||||||
Interest expense | — | — | — | — | — | — | (478 | ) | (478 | ) | ||||||||||||||||||||||
Loss on early extinguishment of debt | — | — | — | — | — | — | (75 | ) | (75 | ) | ||||||||||||||||||||||
Other income and expense, net | 16 | — | — | — | 26 | — | 23 | 65 | ||||||||||||||||||||||||
Loss before income taxes | 0 | — | 0 | — | — | — | 0 | (163 | ) | |||||||||||||||||||||||
Income tax benefit | — | — | — | — | — | — | 330 | 330 | ||||||||||||||||||||||||
Net income | 167 | |||||||||||||||||||||||||||||||
Less: Net loss attributable to noncontrolling interest | (2 | ) | ||||||||||||||||||||||||||||||
Net income attributable to Dynegy Inc. | $ | 169 | ||||||||||||||||||||||||||||||
Total assets—domestic | $ | 5,158 | $ | 3,401 | $ | 1,564 | $ | 232 | $ | 581 | $ | 461 | $ | 610 | $ | 12,007 | ||||||||||||||||
Investment in unconsolidated affiliate | $ | 77 | $ | 77 | $ | — | $ | — | $ | — | $ | — | $ | — | $ | 154 | ||||||||||||||||
Capital expenditures | $ | (74 | ) | $ | (46 | ) | $ | (20 | ) | $ | (3 | ) | $ | (10 | ) | $ | (34 | ) | $ | (5 | ) | $ | (192 | ) | ||||||||
43
DYNEGY INC.
NOTES TO CONSOLIDATED FINANCIAL STATEMENTS
(Unaudited)
For the Interim Periods Ended September 30, 2017 and 2016
Segment Data as of and for the Three Months Ended September 30, 2016
(amounts in millions) | PJM | NY/NE | MISO | IPH | CAISO | Other and Eliminations | Total | |||||||||||||||||||||
Domestic: | ||||||||||||||||||||||||||||
Unaffiliated revenues | $ | 551 | $ | 200 | $ | 130 | $ | 241 | $ | 46 | $ | — | $ | 1,168 | ||||||||||||||
Intercompany revenues | 17 | (5 | ) | 3 | 1 | — | — | 16 | ||||||||||||||||||||
Total revenues | $ | 568 | $ | 195 | $ | 133 | $ | 242 | $ | 46 | $ | — | $ | 1,184 | ||||||||||||||
Depreciation expense | $ | (88 | ) | $ | (53 | ) | $ | (3 | ) | $ | (7 | ) | $ | (11 | ) | $ | (1 | ) | $ | (163 | ) | |||||||
Impairments | (64 | ) | — | — | (148 | ) | — | — | (212 | ) | ||||||||||||||||||
General and administrative expense | — | — | — | — | — | (41 | ) | (41 | ) | |||||||||||||||||||
Acquisition and integration costs | — | — | — | — | — | (7 | ) | (7 | ) | |||||||||||||||||||
Operating income (loss) | $ | 29 | $ | (15 | ) | $ | 13 | $ | (104 | ) | $ | 10 | $ | (50 | ) | $ | (117 | ) | ||||||||||
Earnings from unconsolidated investments | 4 | — | — | — | — | — | 4 | |||||||||||||||||||||
Interest expense | — | — | — | — | — | (166 | ) | (166 | ) | |||||||||||||||||||
Other income and expense, net | 3 | — | — | 1 | — | 25 | 29 | |||||||||||||||||||||
Loss before income taxes | (250 | ) | ||||||||||||||||||||||||||
Income tax benefit | — | — | — | — | — | 1 | 1 | |||||||||||||||||||||
Net loss | (249 | ) | ||||||||||||||||||||||||||
Less: Net loss attributable to noncontrolling interest | — | |||||||||||||||||||||||||||
Net loss attributable to Dynegy Inc. | $ | (249 | ) | |||||||||||||||||||||||||
Total assets—domestic | $ | 5,208 | $ | 2,807 | $ | 371 | $ | 746 | $ | 499 | $ | 3,393 | $ | 13,024 | ||||||||||||||
Investment in unconsolidated affiliate | $ | 173 | $ | — | $ | — | $ | — | $ | — | $ | — | $ | 173 | ||||||||||||||
Capital expenditures | $ | (13 | ) | $ | (10 | ) | $ | (1 | ) | $ | (9 | ) | $ | (1 | ) | $ | (1 | ) | $ | (35 | ) | |||||||
44
DYNEGY INC.
NOTES TO CONSOLIDATED FINANCIAL STATEMENTS
(Unaudited)
For the Interim Periods Ended September 30, 2017 and 2016
Segment Data as of and for the Nine Months Ended September 30, 2016
(amounts in millions) | PJM | NY/NE | MISO | IPH | CAISO | Other and Eliminations | Total | |||||||||||||||||||||
Domestic: | ||||||||||||||||||||||||||||
Unaffiliated revenues | $ | 1,559 | $ | 630 | $ | 315 | $ | 575 | $ | 105 | $ | — | $ | 3,184 | ||||||||||||||
Intercompany revenues | 45 | (2 | ) | (15 | ) | (1 | ) | — | — | 27 | ||||||||||||||||||
Total revenues | $ | 1,604 | $ | 628 | $ | 300 | $ | 574 | $ | 105 | $ | — | $ | 3,211 | ||||||||||||||
Depreciation expense | $ | (257 | ) | $ | (167 | ) | $ | (19 | ) | $ | (21 | ) | $ | (26 | ) | $ | (4 | ) | $ | (494 | ) | |||||||
Impairments | (64 | ) | — | (645 | ) | (148 | ) | — | — | (857 | ) | |||||||||||||||||
General and administrative expense | — | — | — | — | — | (117 | ) | (117 | ) | |||||||||||||||||||
Acquisition and integration costs | — | — | — | 8 | — | (16 | ) | (8 | ) | |||||||||||||||||||
Operating income (loss) | $ | 277 | $ | (22 | ) | $ | (703 | ) | $ | (87 | ) | $ | — | $ | (139 | ) | $ | (674 | ) | |||||||||
Earnings from unconsolidated investments | 7 | — | — | — | — | — | 7 | |||||||||||||||||||||
Interest expense | — | — | — | — | — | (449 | ) | (449 | ) | |||||||||||||||||||
Other income and expense, net | 9 | — | — | 15 | 12 | 24 | 60 | |||||||||||||||||||||
Loss before income taxes | (1,056 | ) | ||||||||||||||||||||||||||
Income tax expense | — | — | — | — | — | (6 | ) | (6 | ) | |||||||||||||||||||
Net loss | (1,062 | ) | ||||||||||||||||||||||||||
Less: Net loss attributable to noncontrolling interest | (2 | ) | ||||||||||||||||||||||||||
Net loss attributable to Dynegy Inc. | $ | (1,060 | ) | |||||||||||||||||||||||||
Total assets—domestic | $ | 5,208 | $ | 2,807 | $ | 371 | $ | 746 | $ | 499 | $ | 3,393 | $ | 13,024 | ||||||||||||||
Investment in unconsolidated affiliate | $ | 173 | $ | — | $ | — | $ | — | $ | — | $ | — | $ | 173 | ||||||||||||||
Capital expenditures | $ | (124 | ) | $ | (84 | ) | $ | (9 | ) | $ | (30 | ) | $ | (4 | ) | $ | (9 | ) | $ | (260 | ) | |||||||
45
DYNEGY INC.
NOTES TO CONSOLIDATED FINANCIAL STATEMENTS
(Unaudited)
For the Interim Periods Ended September 30, 2017 and 2016
Note 20—Subsequent Events
On October 29, 2017, Dynegy and Vistra Energy Corp., a Delaware corporation (“Vistra Energy”), entered into an Agreement and Plan of Merger (the “Merger Agreement”). Under the Merger Agreement, which has been approved by the boards of directors of both companies, Dynegy will merge with and into Vistra Energy in a tax-free, all-stock transaction, with Vistra Energy continuing as the surviving corporation (the “Merger”).
Under the terms of the agreement, Dynegy stockholders will receive 0.652 shares of Vistra Energy common stock for each share of Dynegy common stock they own, resulting in Vistra Energy stockholders and Dynegy stockholders owning approximately 79 percent and 21 percent, respectively, of the combined company.
Completion of the Merger is subject to various customary conditions, including, among others, (a) approval by Vistra Energy’s stockholders of the issuance of the Vistra Energy common stock in the Merger, (b) adoption of the Merger Agreement by Dynegy’s stockholders and Vistra Energy’s stockholders, (c) receipt of all requisite regulatory approvals, which includes, among others, approvals of the FERC, the Public Utility Commission of Texas and the New York Public Service Commission, and the expiration or termination of the applicable waiting period under the Hart-Scott-Rodino Antitrust Improvements Act of 1976, and (d) effectiveness of the registration statement for the shares of Vistra Energy common stock to be issued in the Merger, and the approval of the listing of such shares on the New York Stock Exchange. Each party’s obligation to consummate the Merger is also subject to certain additional customary conditions. The Merger Agreement contains customary representations, warranties and covenants of Dynegy and Vistra Energy, and contains certain termination rights for both Dynegy and Vistra Energy.
46
DYNEGY INC.
MANAGEMENT’S DISCUSSION AND ANALYSIS OF FINANCIAL CONDITION
AND RESULTS OF OPERATIONS
For the Interim Periods Ended September 30, 2017 and 2016
Item 2—MANAGEMENT’S DISCUSSION AND ANALYSIS OF FINANCIAL CONDITION AND RESULTS OF OPERATIONS
The following discussion should be read together with the unaudited consolidated financial statements and the notes thereto included in this report and with the audited consolidated financial statements and the notes thereto included in our Form 10-K.
We are a holding company and conduct substantially all of our business operations through our subsidiaries. We sell electric energy, capacity and ancillary services primarily on a wholesale basis from our power generation facilities. We also serve residential, municipal, commercial and industrial customers primarily in MISO, PJM and NY/NE through our Homefield Energy and Dynegy Energy Services retail businesses. We currently own approximately 27,000 MW of generating capacity in twelve states and also provide retail electricity to residential, commercial, industrial, and municipal customers in Illinois, Massachusetts, Ohio, and Pennsylvania. We report the results of our power generation business as six separate segments in our unaudited consolidated financial statements: (i) PJM, (ii) NY/NE, (iii) ERCOT, (iv) MISO (v) IPH and (vi) CAISO.
47
The charts below show our wholesale generation, retail load and Adjusted EBITDA contribution by fuel type during the nine months ended September 30, 2017.
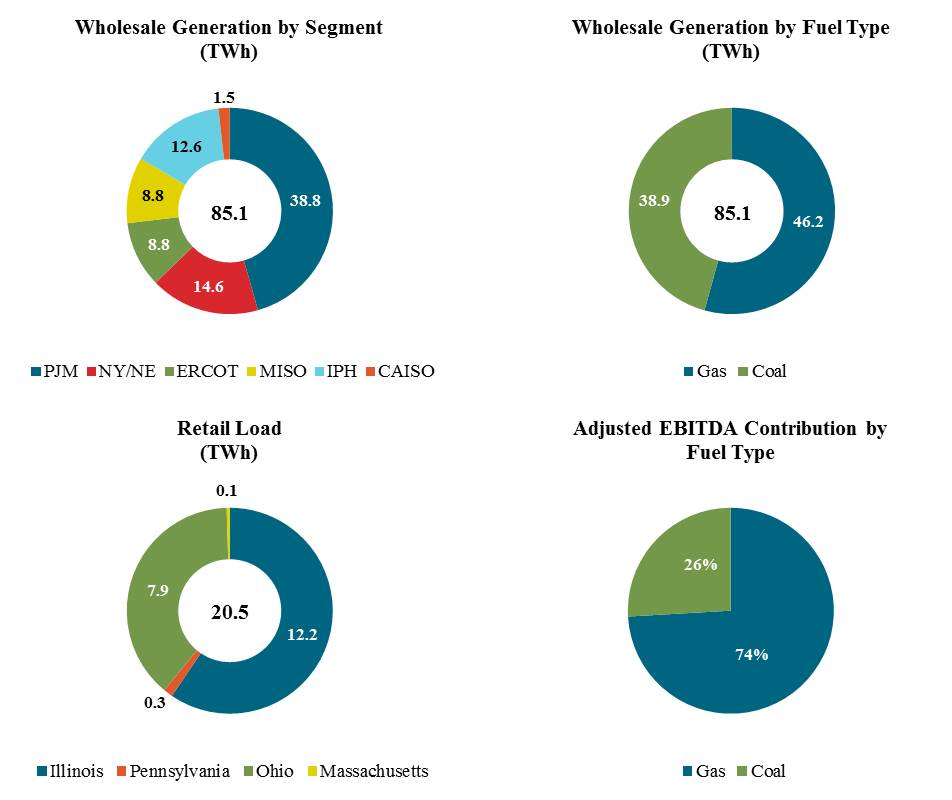
LIQUIDITY AND CAPITAL RESOURCES
Overview
We maintain a strong focus on liquidity. We believe that we have adequate resources from a combination of our current liquidity position and cash expected to be generated from future operations and select asset sales to fund our liquidity and capital requirements as they become due. Our liquidity and capital requirements are primarily a function of our debt maturities and debt service requirements, contractual obligations, capital expenditures (including required environmental expenditures), and working capital needs. Examples of working capital needs include purchases and sales of commodities and associated collateral requirements, facility maintenance costs, and other costs such as payroll.
Since 2013, we have increased scale and shifted our portfolio mix, which was predominately coal-based, to a predominately gas-based portfolio, through four major acquisitions. We used a significant portion of our balance sheet capacity to finance these acquisitions. We are now focused on strengthening our balance sheet, managing debt maturities and improving our leverage profile through debt reduction primarily from operating cash flows, PRIDE initiatives, and select asset sales.
48
Liquidity. The following table summarizes our liquidity position at September 30, 2017 (amounts in millions):
Revolving facilities and LC capacity (1) | $ | 1,650 | ||
Less: | ||||
Outstanding revolver draws | (300 | ) | ||
Outstanding LCs | (405 | ) | ||
Revolving facilities and LC availability | 945 | |||
Cash and cash equivalents | 613 | |||
Total available liquidity | $ | 1,558 | ||
__________________________________________
(1) | Includes $1.545 billion in senior secured revolving credit facilities and $105 million related to LCs. Please read Note 12—Debt for further discussion. |
Liquidity Highlights:
• | July 2017 - We received approximately $480 million in proceeds from the Troy and Armstrong Sale. |
• | July 2017 - Refinanced previously monetized capacity under our Forward Capacity Sales Agreement by 24 months. |
• | July 2017 - Extended a $55 million LC for an additional year. |
• | August 2017 - We exchanged $25 million of the Genco senior notes for approximately $6 million cash, $4 million in Dynegy senior notes, and 0.2 million 2017 Warrants. This was the final payment related to the Genco restructuring. |
• | August 2017 - We issued $850 million of 2026 Senior Notes. We used the proceeds of the offering, together with proceeds from asset sales, and cash-on-hand to repurchase $1.25 billion of our 6.75 percent senior notes due 2019 and repay $200 million of our Tranche C-1 term loan. |
• | September 2017 - We received approximately $125 million in proceeds, including $6 million in working capital adjustments, from the sale of our Dighton and Milford-MA facilities. |
• | October 2017 - We received approximately $180 million in proceeds from the Lee Sale Agreement. |
• | October 2017 - We repaid the outstanding Revolving Facility balance of $300 million. |
Cash Flows
The following table presents net cash from operating, investing, and financing activities for the nine months ended September 30, 2017 and 2016:
Nine Months Ended September 30, | ||||||||||||
(amounts in millions) | 2017 | 2016 | Change | |||||||||
Net cash provided by operating activities | $ | 501 | $ | 728 | $ | (227 | ) | |||||
Net cash used in investing activities | $ | (2,771 | ) | $ | (313 | ) | $ | (2,458 | ) | |||
Net cash provided by (used in) financing activities | $ | (955 | ) | $ | 2,584 | $ | (3,539 | ) | ||||
Operating Activities
Changes in net cash provided by operating activities for the nine months ended September 30, 2017 compared to the same period September 30, 2016 were primarily due to:
(in millions) | ||||
Increase in cash provided by operation of our power generation facilities and retail operations | $ | 159 | ||
Increase in interest payments on our various debt agreements | (85 | ) | ||
Increase in payments for acquisition-related costs | (39 | ) | ||
Decrease in cash provided by changes in working capital and other | (262 | ) | ||
$ | (227 | ) | ||
49
Future Operating Cash Flows. Our future operating cash flows will vary based on a number of factors, many of which are beyond our control, including the price of power, the prices of natural gas, coal, and fuel oil and their correlation to power prices, collateral requirements, the value of capacity and ancillary services, the run-time of our generating facilities, the effectiveness of our commercial strategy, legal, environmental, and regulatory requirements, and our ability to achieve the cost savings contemplated in our “PRIDE Energized” initiative.
Collateral Postings. We use a portion of our capital resources in the form of cash and LCs to satisfy counterparty collateral demands. The following table summarizes our collateral postings to third parties at September 30, 2017 and December 31, 2016:
(amounts in millions) | September 30, 2017 | December 31, 2016 | ||||||
Cash (1) | $ | 55 | $ | 124 | ||||
LCs | 405 | 382 | ||||||
Total | $ | 460 | $ | 506 | ||||
__________________________________________
(1) | Includes broker margin as well as other collateral postings included in Prepayments and other current assets in our unaudited consolidated balance sheets. At September 30, 2017 and December 31, 2016, $22 million and $54 million, respectively, of cash posted as collateral were netted against Liabilities from risk management activities in our unaudited consolidated balance sheets. |
Collateral postings decreased from December 31, 2016 to September 30, 2017, due to a decrease in cash posted for our hedges, partially offset by an increase in LCs. Other LCs increased primarily as the result of the ENGIE Acquisition, and were offset by LCs returned by AEP related to the Conesville/Zimmer JOU transaction and collateral efficiencies associated with the IPH restructuring. The fair value of our derivatives collateralized by first priority liens included liabilities of $79 million and $136 million at September 30, 2017 and December 31, 2016, respectively.
Investing Activities
Historical Investing Cash Flows. Changes in net cash used in investing activities for the nine months ended September 30, 2017 compared to the same period September 30, 2016 were primarily due to:
(in millions) | ||||
Cash paid, net of cash acquired for the ENGIE Acquisition | $ | (3,249 | ) | |
Decrease in capital expenditures | 208 | |||
Net proceeds received from asset sales in 2017 | 600 | |||
Decrease in other investing inflows | (17 | ) | ||
$ | (2,458 | ) | ||
Capital Expenditures. Our capital spending by reportable segment was as follows:
Nine Months Ended September 30, | Estimated Remaining | ||||||||||||
(amounts in millions) | 2017 | 2016 | 2017 | ||||||||||
PJM | $ | 74 | $ | 124 | $ | 31 | |||||||
NY/NE | 46 | 84 | 15 | ||||||||||
ERCOT | 20 | — | 10 | ||||||||||
MISO | 3 | 9 | 2 | ||||||||||
IPH | 10 | 30 | 14 | ||||||||||
CAISO | 34 | 4 | 1 | ||||||||||
Other | 5 | 9 | 3 | ||||||||||
Total capital expenditures incurred (1) | $ | 192 | $ | 260 | $ | 76 | |||||||
Non-cash investing activities (2) | (39 | ) | (1 | ) | N/A | ||||||||
Capital work performed under prepaid long-term service agreement | (31 | ) | — | N/A | |||||||||
Prepaid cash for long-term service agreements (3) | 7 | 78 | N/A | ||||||||||
Capital Expenditures - Statement of Cash Flows | $ | 129 | $ | 337 | N/A | ||||||||
50
____________________________________
(1) | Includes capitalized interest of $2 million and $9 million for the nine months ended September 30, 2017 and 2016, respectively. |
(2) | Please read Note 7—Cash Flow Information for further details. |
(3) | Prepaid cash reclassified into Investing Activities on the consolidated statements of cash flows. |
Capital spending in our PJM, MISO, and IPH segments primarily consisted of environmental and maintenance capital projects. Capital spending in our NY/NE, ERCOT, and CAISO segments primarily consisted of only maintenance capital projects.
Future Investing Cash Flows. The expected capital expenditures for the remainder of 2017 are noted above. The capital budget is subject to revision as opportunities arise or circumstances change. Please read Note 3—Acquisitions and Divestitures for further discussion.
Financing Activities
Historical Financing Cash Flows. Changes in net cash provided by financing activities for the nine months ended September 30, 2017 compared to the same period September 30, 2016 were primarily due to:
(in millions) | ||||
Decrease in proceeds from long-term borrowings, net of issuance costs | $ | (332 | ) | |
Proceeds related to the SPC TEUs in 2016 | (359 | ) | ||
Proceeds from issuance of equity related to the PIPE Transaction in 2017 | 150 | |||
Proceeds related to the Forward Capacity Agreement in 2016 | (198 | ) | ||
Cash paid related to the ECP Buyout in 2017 | (375 | ) | ||
Cash paid related to the Genco Bankruptcy in 2017 | (133 | ) | ||
Increase in repayment of borrowings | (2,240 | ) | ||
Cash paid for debt extinguishment costs in 2017 | (50 | ) | ||
Increase in other financing activity | (2 | ) | ||
$ | (3,539 | ) | ||
Future Financing Cash Flows. Our future cash flows from financing activities include principal payments on our debt instruments and other financial obligations and periodic payments to settle our interest rate swap agreements.
Financing Trigger Events. Our debt instruments and certain of our other financial obligations include provisions, which, if not met, could require early payment, additional collateral support or similar actions. The trigger events include the violation of covenants (including, in the case of the Credit Agreement under certain circumstances, the senior secured leverage ratio covenant discussed below), defaults on scheduled principal or interest payments, including any indebtedness to the extent linked to it by reason of cross-default or cross-acceleration provisions, insolvency events, acceleration of other financial obligations, and, in the case of the Credit Agreement, change of control provisions. We do not have any trigger events tied to specified credit ratings or stock price in our debt instruments and are not party to any contracts that require us to issue equity based on credit ratings or other trigger events. Please read Note 12—Debt for further discussion.
Financial Covenants
Credit Agreement. Our Credit Agreement contains customary events of default and affirmative and negative covenants, subject to certain specified exceptions, including a financial covenant specifying required thresholds for our senior secured leverage ratio calculated on a rolling four quarters basis. To the extent Dynegy uses 25 percent or more of its Revolving Facility, the Fourth Amendment of the Credit Agreement requires that Dynegy must be in compliance with the Consolidated Senior Secured Net Debt to Consolidated Adjusted EBITDA ratio (as defined in the Credit Agreement). The Consolidated Senior Secured Net Debt to Consolidated Adjusted EBITDA ratio is 4.00:1.00. We were in compliance with these covenants as of September 30, 2017.
Existing balances under our Forward Capacity Agreement, Inventory Financing Agreements, and Equipment Financing Agreements are excluded from Net Debt, as defined in the Credit Agreement.
Senior Notes. Our senior notes indentures limit, among other things, the ability of the Company or any of the guarantors to create liens upon any principal property to secure debt for borrowed money in excess of, among other limitations, 30.0 percent of total assets.
51
Dividends. We have paid no cash dividends on our common stock and have no current intention of doing so. Any future determinations to pay cash dividends will be at the discretion of our Board of Directors, subject to applicable limitations under Delaware law, and will be dependent upon our results of operations, financial condition, contractual restrictions, and other factors deemed relevant by our Board of Directors.
We pay quarterly dividends on our mandatory convertible preferred stock on February 1, May 1, August 1, and November 1 of each year, if declared by our Board of Directors. Our dividends paid for 2017 and 2016 are as follows:
Dividend Payment Dates and Amounts Paid | ||||||||
(amounts in millions) | 2017 | 2016 | ||||||
February 1 | $ | 5.4 | $ | 5.4 | ||||
May 1 | $ | 5.4 | $ | 5.4 | ||||
August 1 | $ | 5.4 | $ | 5.4 | ||||
November 1 | $ | 5.4 | $ | 5.4 | ||||
Credit Ratings
Our credit rating status is currently “non-investment grade” and our current ratings are as follows:
Moody’s | S&P | |||
Dynegy Inc.: | ||||
Corporate Family Rating | B2 | B+ | ||
Senior Secured | Ba3 | BB | ||
Senior Unsecured | B3 | B+ | ||
RESULTS OF OPERATIONS
Overview and Discussion of Comparability of Results
In this section, we discuss our results of operations, both on a consolidated basis and, where appropriate, by segment, for the three and nine months ended September 30, 2017 and 2016. At the end of this section, we have included our business outlook for each segment.
We report the results of our power generation business primarily as six separate segments in our unaudited consolidated financial statements: (i) PJM, (ii) NY/NE, (iii) ERCOT, (iv) MISO, (v) IPH, and (vi) CAISO. Our consolidated financial results also reflect corporate-level expenses such as general and administrative expense, interest expense and income tax benefit (expense). All references to hedging within this Form 10-Q relate to economic hedging activities as we do not elect hedge accounting.
We completed the ENGIE Acquisition on February 7, 2017; therefore, the results of our newly acquired plants within our PJM, NY/NE and ERCOT segments are included in our consolidated results since the acquisition date. Please read Note 3—Acquisitions and Divestitures—ENGIE Acquisition for further discussion.
52
Consolidated Summary Financial Information — Three Months Ended September 30, 2017 Compared to Three Months Ended September 30, 2016
The following table provides summary financial data regarding our unaudited consolidated results of operations for the three months ended September 30, 2017 and 2016, respectively:
Three Months Ended September 30, | Favorable (Unfavorable) $ Change | |||||||||||
(amounts in millions) | 2017 | 2016 | ||||||||||
Revenues | ||||||||||||
Energy | $ | 1,105 | $ | 992 | $ | 113 | ||||||
Capacity | 278 | 193 | 85 | |||||||||
Mark-to-market income (loss), net | 32 | (18 | ) | 50 | ||||||||
Contract amortization | (5 | ) | (23 | ) | 18 | |||||||
Other | 27 | 40 | (13 | ) | ||||||||
Total revenues | 1,437 | 1,184 | 253 | |||||||||
Cost of sales, excluding depreciation expense | (787 | ) | (660 | ) | (127 | ) | ||||||
Gross margin | 650 | 524 | 126 | |||||||||
Operating and maintenance expense | (236 | ) | (218 | ) | (18 | ) | ||||||
Depreciation expense | (202 | ) | (163 | ) | (39 | ) | ||||||
Impairments | (29 | ) | (212 | ) | 183 | |||||||
Loss on sale of assets | (78 | ) | — | (78 | ) | |||||||
General and administrative expense | (44 | ) | (41 | ) | (3 | ) | ||||||
Acquisition and integration costs | (3 | ) | (7 | ) | 4 | |||||||
Operating income (loss) | 58 | (117 | ) | 175 | ||||||||
Bankruptcy reorganization items | 12 | — | 12 | |||||||||
Earnings from unconsolidated investment | 4 | 4 | — | |||||||||
Interest expense | (161 | ) | (166 | ) | 5 | |||||||
Loss on early extinguishment of debt | (66 | ) | — | (66 | ) | |||||||
Other income and expense, net | 19 | 29 | (10 | ) | ||||||||
Loss before income taxes | (134 | ) | (250 | ) | 116 | |||||||
Income tax benefit | 1 | 1 | — | |||||||||
Net loss | (133 | ) | (249 | ) | 116 | |||||||
Less: Net loss attributable to noncontrolling interest | (1 | ) | — | (1 | ) | |||||||
Net loss attributable to Dynegy Inc. | $ | (132 | ) | $ | (249 | ) | $ | 117 | ||||
53
The following tables provide summary financial data regarding our operating income (loss) by segment for the three months ended September 30, 2017 and 2016, respectively:
Three Months Ended September 30, 2017 | ||||||||||||||||||||||||||||||||
(amounts in millions) | PJM | NY/NE | ERCOT | MISO | IPH | CAISO | Other | Total | ||||||||||||||||||||||||
Revenues | $ | 603 | $ | 268 | $ | 209 | $ | 104 | $ | 203 | $ | 50 | $ | — | $ | 1,437 | ||||||||||||||||
Cost of sales, excluding depreciation expense | (303 | ) | (131 | ) | (116 | ) | (70 | ) | (136 | ) | (31 | ) | — | (787 | ) | |||||||||||||||||
Gross margin | 300 | 137 | 93 | 34 | 67 | 19 | — | 650 | ||||||||||||||||||||||||
Operating and maintenance expense | (90 | ) | (38 | ) | (23 | ) | (34 | ) | (45 | ) | (5 | ) | (1 | ) | (236 | ) | ||||||||||||||||
Depreciation expense | (94 | ) | (52 | ) | (20 | ) | (9 | ) | (11 | ) | (14 | ) | (2 | ) | (202 | ) | ||||||||||||||||
Impairments | (29 | ) | — | — | — | — | — | — | (29 | ) | ||||||||||||||||||||||
Loss on sale of assets | (1 | ) | (77 | ) | — | — | — | — | — | (78 | ) | |||||||||||||||||||||
General and administrative expense | — | — | — | — | — | — | (44 | ) | (44 | ) | ||||||||||||||||||||||
Acquisition and integration costs | — | — | — | — | — | — | (3 | ) | (3 | ) | ||||||||||||||||||||||
Operating income (loss) | $ | 86 | $ | (30 | ) | $ | 50 | $ | (9 | ) | $ | 11 | $ | — | $ | (50 | ) | $ | 58 | |||||||||||||
Three Months Ended September 30, 2016 | ||||||||||||||||||||||||||||
(amounts in millions) | PJM | NY/NE | MISO | IPH | CAISO | Other | Total | |||||||||||||||||||||
Revenues | $ | 568 | $ | 195 | $ | 133 | $ | 242 | $ | 46 | $ | — | $ | 1,184 | ||||||||||||||
Cost of sales, excluding depreciation expense | (296 | ) | (122 | ) | (84 | ) | (142 | ) | (16 | ) | — | (660 | ) | |||||||||||||||
Gross margin | 272 | 73 | 49 | 100 | 30 | — | 524 | |||||||||||||||||||||
Operating and maintenance expense | (91 | ) | (35 | ) | (33 | ) | (50 | ) | (9 | ) | — | (218 | ) | |||||||||||||||
Depreciation expense | (88 | ) | (53 | ) | (3 | ) | (7 | ) | (11 | ) | (1 | ) | (163 | ) | ||||||||||||||
Impairments | (64 | ) | — | — | (148 | ) | — | — | (212 | ) | ||||||||||||||||||
General and administrative expense | — | — | — | — | — | (41 | ) | (41 | ) | |||||||||||||||||||
Acquisition and integration costs | — | — | — | — | — | (7 | ) | (7 | ) | |||||||||||||||||||
Other | — | — | — | 1 | — | (1 | ) | — | ||||||||||||||||||||
Operating income (loss) | $ | 29 | $ | (15 | ) | $ | 13 | $ | (104 | ) | $ | 10 | $ | (50 | ) | $ | (117 | ) | ||||||||||
Discussion of Consolidated Results of Operations
Revenues. The following table summarizes the change in revenues by segment:
(amounts in millions) | PJM | NY/NE | ERCOT | MISO | IPH | CAISO | Total | |||||||||||||||||||||
Revenues, net of hedges, attributable to newly acquired ENGIE plants | $ | 61 | $ | 75 | $ | 209 | $ | — | $ | — | $ | — | $ | 345 | ||||||||||||||
Higher (lower) realized power prices | (32 | ) | 3 | — | (5 | ) | (24 | ) | 12 | (46 | ) | |||||||||||||||||
Higher (lower) generation volumes (1) | (38 | ) | (32 | ) | — | (24 | ) | (25 | ) | 14 | (105 | ) | ||||||||||||||||
Higher (lower) capacity revenues | 30 | 14 | — | 4 | 7 | (9 | ) | 46 | ||||||||||||||||||||
Change in MTM value of derivative transactions | 22 | 14 | — | (5 | ) | 1 | (5 | ) | 27 | |||||||||||||||||||
Lower contract amortization | 10 | 3 | — | — | 1 | 4 | 18 | |||||||||||||||||||||
Other (2) | (18 | ) | (4 | ) | — | 1 | 1 | (12 | ) | (32 | ) | |||||||||||||||||
Total change in revenues | $ | 35 | $ | 73 | $ | 209 | $ | (29 | ) | $ | (39 | ) | $ | 4 | $ | 253 | ||||||||||||
_______________________________________
(1) | Decrease primarily due to milder weather at our PJM, NY/NE, MISO and IPH segments, unit shutdowns primarily at our MISO and IPH segments, and a plant retirement at our NY/NE segment; offsetting increase primarily due to warmer weather at our CAISO segment. |
(2) | Other primarily consists of ancillary, tolling, transmission and gas revenues. |
54
Cost of Sales. The following table summarizes the change in cost of sales by segment:
(amounts in millions) | PJM | NY/NE | ERCOT | MISO | IPH | CAISO | Total | |||||||||||||||||||||
Cost of sales attributable to newly acquired ENGIE plants | $ | 34 | $ | 34 | $ | 116 | $ | — | $ | — | $ | — | $ | 184 | ||||||||||||||
Higher (lower) prices | (10 | ) | 9 | — | 3 | 2 | 3 | 7 | ||||||||||||||||||||
Higher (lower) burn volumes (1) | (31 | ) | (36 | ) | — | (17 | ) | (5 | ) | 12 | (77 | ) | ||||||||||||||||
Lower (higher) contract amortization | 10 | (1 | ) | — | — | 2 | — | 11 | ||||||||||||||||||||
Other (2) | 4 | 3 | — | — | (5 | ) | — | 2 | ||||||||||||||||||||
Total change in cost of sales | $ | 7 | $ | 9 | $ | 116 | $ | (14 | ) | $ | (6 | ) | $ | 15 | $ | 127 | ||||||||||||
_______________________________________
(1) | Lower burn volumes primarily due to milder weather at our PJM, NY/NE, MISO and IPH segments, unit shutdowns primarily at our MISO and IPH segments, and a plant retirement at our NY/NE segment; offsetting increase primarily due to warmer weather at our CAISO segment. |
(2) | Other primarily consists of transmission expenses. |
Operating and Maintenance Expense. O&M expense increased by $18 million primarily due to the newly acquired ENGIE plants, partially offset by lower costs primarily from long-term service agreements at our PJM, NY/NE and CAISO segments and plant shutdowns at our NY/NE and MISO segments.
Depreciation Expense. Depreciation expense increased by $39 million primarily due to increases from the newly acquired ENGIE plants.
Impairments. Impairments decreased by $183 million due to the following (amounts in millions):
Three Months Ended September 30, | ||||||||
Description | 2017 | 2016 | ||||||
Materials and supplies inventory | $ | 14 | $ | — | ||||
Property, plant and equipment, net | — | 203 | ||||||
Equity investment | — | 9 | ||||||
Assets held-for-sale (Lee) | 15 | — | ||||||
Total | $ | 29 | $ | 212 | ||||
Please read Note 3—Acquisitions and Divestitures, Note 4—Unconsolidated Investments, Note 8—Inventory, and Note 9—Property, Plant and Equipment for further discussion.
Loss on Sale of Assets, net. Loss on sale of assets increased by $78 million primarily due to the sale of our Dighton and Milford-MA facilities. Please read Note 3—Acquisitions and Divestitures for further discussion.
General and Administrative Expense. General and administrative expense increased by $3 million primarily due to higher overhead associated with the ENGIE Acquisition and higher professional services.
Acquisition and Integration Costs. Acquisition and integration costs decreased by $4 million primarily due to lower advisory and consulting fees.
Bankruptcy Reorganization Items. Gain on bankruptcy reorganization items increased by $12 million primarily due to the final payment under the Genco restructuring which was less than the previously accrued amount. Please read Note 18—Genco Chapter 11 Bankruptcy and Emergence for further discussion.
Interest Expense. Interest expense decreased by $5 million primarily due to the elimination of the Genco senior notes, offset by increases due to other debt issuances. Please read Note 12—Debt for further discussion.
Loss on Early Extinguishment of Debt. Loss on early extinguishment of debt was $66 million due to the repurchase of a portion of our senior notes due 2019 and the repayment of a portion of our Tranche C-1 Term Loan. Please read Note 12—Debt for further discussion.
Other Income and Expense. Other income and expense decreased by $10 million primarily due to $20 million gain in 2016 related to the PPE settlement and a $3 million change in fair value of our common stock warrants, offset by $13 million due to casualty loss insurance reimbursements on Stuart and Zimmer.
55
Net Loss Attributable to Dynegy Inc. The $117 million decrease was primarily due to $86 million of income attributable to newly acquired ENGIE plants and $183 million in lower impairment charges, partially offset by $78 million on loss on sale of assets and $66 million loss on early extinguishment of debt.
Discussion of Adjusted EBITDA
Non-GAAP Measures. In analyzing and planning for our business, we supplement our use of GAAP financial measures with non-GAAP financial measures, including EBITDA and Adjusted EBITDA as performance measures. These non-GAAP financial measures reflect an additional way of viewing aspects of our business that, when viewed with our GAAP results and the accompanying reconciliations to corresponding GAAP financial measures included in the tables below, may provide a more complete understanding of factors and trends affecting our business. These non-GAAP financial measures should not be relied upon to the exclusion of GAAP financial measures and are by definition an incomplete understanding of Dynegy and must be considered in conjunction with GAAP measures.
We believe that the non-GAAP measures disclosed in our filings are only useful as an additional tool to help management and investors make informed decisions about our financial and operating performance. By definition, non-GAAP measures do not give a full understanding of Dynegy; therefore, to be truly valuable, they must be used in conjunction with the comparable GAAP measures. In addition, non-GAAP financial measures are not standardized; therefore, it may not be possible to compare these financial measures with other companies’ non-GAAP financial measures having the same or similar names. We strongly encourage investors to review our consolidated financial statements and publicly filed reports in their entirety and not rely on any single financial measure.
EBITDA and Adjusted EBITDA. We define EBITDA as earnings (loss) before interest expense, income tax expense (benefit), and depreciation and amortization expense. We define Adjusted EBITDA as EBITDA adjusted to exclude (i) gains or losses on the sale of certain assets, (ii) the impacts of mark-to-market changes on derivatives related to our generation portfolio, as well as warrants, (iii) the impact of impairment charges, (iv) certain amounts such as those associated with acquisitions or restructurings, (v) non-cash compensation expense, (vi) modification or extinguishment of debt, and (vii) other material or unusual items.
We believe EBITDA and Adjusted EBITDA provide meaningful representations of our operating performance. We consider EBITDA as another way to measure financial performance on an ongoing basis. Adjusted EBITDA is meant to reflect the operating performance of our entire power generation fleet for the period presented; consequently, it excludes the impact of mark-to-market accounting, impairment charges, and other items that could be considered “non-operating” or “non-core” in nature. Because EBITDA and Adjusted EBITDA are financial measures that management uses to allocate resources, determine our ability to fund capital expenditures, assess performance against our peers, and evaluate overall financial performance, we believe they provide useful information for our investors. In addition, many analysts, fund managers, and other stakeholders who communicate with us typically request our financial results in an EBITDA and Adjusted EBITDA format.
As prescribed by the SEC, when EBITDA or Adjusted EBITDA is discussed in reference to performance on a consolidated basis, the most directly comparable GAAP financial measure to EBITDA and Adjusted EBITDA is Net income (loss). Management does not analyze interest expense and income taxes on a segment level; therefore, the most directly comparable GAAP financial measure to EBITDA or Adjusted EBITDA when performance is discussed on a segment level is Operating income (loss).
56
Adjusted EBITDA — Three Months Ended September 30, 2017 Compared to Three Months Ended September 30, 2016
The following table provides summary financial data regarding our Adjusted EBITDA by segment for the three months ended September 30, 2017:
Three Months Ended September 30, 2017 | ||||||||||||||||||||||||||||||||
(amounts in millions) | PJM | NY/NE | ERCOT | MISO | IPH | CAISO | Other | Total | ||||||||||||||||||||||||
Net loss | $ | (133 | ) | |||||||||||||||||||||||||||||
Income tax benefit | (1 | ) | ||||||||||||||||||||||||||||||
Other income and expense, net | (19 | ) | ||||||||||||||||||||||||||||||
Loss on early extinguishment of debt | 66 | |||||||||||||||||||||||||||||||
Interest expense | 161 | |||||||||||||||||||||||||||||||
Earnings from unconsolidated investments | (4 | ) | ||||||||||||||||||||||||||||||
Bankruptcy reorganization items | (12 | ) | ||||||||||||||||||||||||||||||
Operating income (loss) | $ | 86 | $ | (30 | ) | $ | 50 | $ | (9 | ) | $ | 11 | $ | — | $ | (50 | ) | $ | 58 | |||||||||||||
Depreciation and amortization expense | 95 | 52 | 20 | 19 | 11 | 15 | 2 | 214 | ||||||||||||||||||||||||
Bankruptcy reorganization items | — | — | — | — | 12 | — | — | 12 | ||||||||||||||||||||||||
Earnings from unconsolidated investments | 2 | 2 | — | — | — | — | — | 4 | ||||||||||||||||||||||||
Loss on early extinguishment of debt | — | — | — | — | — | — | (66 | ) | (66 | ) | ||||||||||||||||||||||
Other income and expense, net | 16 | — | — | — | — | — | 3 | 19 | ||||||||||||||||||||||||
EBITDA | 199 | 24 | 70 | 10 | 34 | 15 | (111 | ) | 241 | |||||||||||||||||||||||
Adjustments to reflect Adjusted EBITDA from unconsolidated investments and exclude noncontrolling interest | 2 | 1 | — | — | — | — | — | 3 | ||||||||||||||||||||||||
Acquisition and integration costs | — | — | — | — | — | — | 3 | 3 | ||||||||||||||||||||||||
Bankruptcy reorganization items | — | — | — | — | (12 | ) | — | — | (12 | ) | ||||||||||||||||||||||
Mark-to-market adjustments, including warrants | 12 | (11 | ) | (23 | ) | 1 | (1 | ) | 3 | (1 | ) | (20 | ) | |||||||||||||||||||
Impairments | 29 | — | — | — | — | — | — | 29 | ||||||||||||||||||||||||
Loss on sale of assets, net | 1 | 77 | — | — | — | — | — | 78 | ||||||||||||||||||||||||
Loss on early extinguishment of debt | — | — | — | — | — | — | 66 | 66 | ||||||||||||||||||||||||
Non-cash compensation expense | — | — | — | — | — | — | 6 | 6 | ||||||||||||||||||||||||
Other | — | 1 | (1 | ) | 1 | — | — | 2 | 3 | |||||||||||||||||||||||
Adjusted EBITDA | $ | 243 | $ | 92 | $ | 46 | $ | 12 | $ | 21 | $ | 18 | $ | (35 | ) | $ | 397 | |||||||||||||||
57
The following table provides summary financial data regarding our Adjusted EBITDA by segment for the three months ended September 30, 2016:
Three Months Ended September 30, 2016 | ||||||||||||||||||||||||||||
(amounts in millions) | PJM | NY/NE | MISO | IPH | CAISO | Other | Total | |||||||||||||||||||||
Net loss | $ | (249 | ) | |||||||||||||||||||||||||
Income tax benefit | (1 | ) | ||||||||||||||||||||||||||
Other income and expense, net | (29 | ) | ||||||||||||||||||||||||||
Interest expense | 166 | |||||||||||||||||||||||||||
Earnings from unconsolidated investments | (4 | ) | ||||||||||||||||||||||||||
Operating income (loss) | $ | 29 | $ | (15 | ) | $ | 13 | $ | (104 | ) | $ | 10 | $ | (50 | ) | $ | (117 | ) | ||||||||||
Depreciation and amortization expense | 92 | 55 | 5 | 7 | 15 | 1 | 175 | |||||||||||||||||||||
Earnings from unconsolidated investments | 4 | — | — | — | — | — | 4 | |||||||||||||||||||||
Other income and expense, net | 3 | — | — | 1 | — | 25 | 29 | |||||||||||||||||||||
EBITDA | 128 | 40 | 18 | (96 | ) | 25 | (24 | ) | 91 | |||||||||||||||||||
Adjustments to reflect Adjusted EBITDA from unconsolidated investments and exclude noncontrolling interest | (4 | ) | — | — | (1 | ) | — | — | (5 | ) | ||||||||||||||||||
Acquisition and integration costs | — | — | — | — | — | 12 | 12 | |||||||||||||||||||||
Mark-to-market adjustments, including warrants | 25 | 14 | (4 | ) | 2 | (2 | ) | (4 | ) | 31 | ||||||||||||||||||
Impairments | 64 | — | — | 148 | — | — | 212 | |||||||||||||||||||||
Non-cash compensation expense | — | 1 | — | — | — | 5 | 6 | |||||||||||||||||||||
Other (1) | 2 | — | 2 | (3 | ) | 1 | 1 | 3 | ||||||||||||||||||||
Adjusted EBITDA | $ | 215 | $ | 55 | $ | 16 | $ | 50 | $ | 24 | $ | (10 | ) | $ | 350 | |||||||||||||
__________________________________________
(1) | Other includes an adjustment to exclude Wood River’s energy margin and O&M costs of $3 million for the three months ended September 30, 2016. Adjusted EBITDA did not include this adjustment for the three months ended September 30, 2017. |
Adjusted EBITDA increased by $47 million. The newly acquired ENGIE plants contributed $108 million in the third quarter of 2017. The offsetting $61 million decrease was primarily driven by lower energy margin, net of hedges as a result of decreased realized spark spreads driven by higher gas costs at the PJM segment, decreased dark spreads at the IPH segment, and lower retail contribution at the PJM and IPH segments, all driven by milder weather. Please read Discussion of Segment Adjusted EBITDA for further information.
58
Discussion of Segment Adjusted EBITDA — Three Months Ended September 30, 2017 Compared to Three Months Ended September 30, 2016
PJM Segment
The following table provides summary financial data regarding our PJM segment results of operations for the three months ended September 30, 2017 and 2016, respectively:
Three Months Ended September 30, | Favorable (Unfavorable) $ Change | |||||||||||
(dollars in millions, except for price information) | 2017 (1) | 2016 | ||||||||||
Operating revenues | ||||||||||||
Energy | $ | 458 | $ | 499 | $ | (41 | ) | |||||
Capacity | 133 | 86 | 47 | |||||||||
Mark-to-market income (loss), net | 1 | (17 | ) | 18 | ||||||||
Contract amortization | (3 | ) | (14 | ) | 11 | |||||||
Other | 14 | 14 | — | |||||||||
Total operating revenues | 603 | 568 | 35 | |||||||||
Operating costs | ||||||||||||
Cost of sales | (306 | ) | (307 | ) | 1 | |||||||
Contract amortization | 3 | 11 | (8 | ) | ||||||||
Total operating costs | (303 | ) | (296 | ) | (7 | ) | ||||||
Gross margin | 300 | 272 | 28 | |||||||||
Operating and maintenance expense | (90 | ) | (91 | ) | 1 | |||||||
Depreciation expense | (94 | ) | (88 | ) | (6 | ) | ||||||
Impairments | (29 | ) | (64 | ) | 35 | |||||||
Loss on sale of assets, net | (1 | ) | — | (1 | ) | |||||||
Operating income | 86 | 29 | 57 | |||||||||
Depreciation and amortization expense | 95 | 92 | 3 | |||||||||
Earnings from unconsolidated investments | 2 | 4 | (2 | ) | ||||||||
Other income and expense, net | 16 | 3 | 13 | |||||||||
EBITDA | 199 | 128 | 71 | |||||||||
Adjustments to reflect Adjusted EBITDA from unconsolidated investments | 2 | (4 | ) | 6 | ||||||||
Mark-to-market adjustments | 12 | 25 | (13 | ) | ||||||||
Loss on sale of assets | 1 | — | 1 | |||||||||
Impairments | 29 | 64 | (35 | ) | ||||||||
Other | — | 2 | (2 | ) | ||||||||
Adjusted EBITDA | $ | 243 | $ | 215 | $ | 28 | ||||||
Million Megawatt Hours Generated | 14.5 | 15.1 | (0.6 | ) | ||||||||
IMA (2): | ||||||||||||
Combined-Cycle Facilities | 98 | % | 97 | % | ||||||||
Coal-Fired Facilities | 75 | % | 83 | % | ||||||||
Average Capacity Factor (3): | ||||||||||||
Combined-Cycle Facilities | 70 | % | 79 | % | ||||||||
Coal-Fired Facilities | 62 | % | 65 | % | ||||||||
CDDs (4) | 787 | 1,044 | (257 | ) | ||||||||
HDDs (4) | 34 | 17 | 17 | |||||||||
Average Market On-Peak Spark Spreads ($/MWh) (5): | ||||||||||||
PJM West | $ | 23.21 | $ | 31.48 | $ | (8.27 | ) | |||||
AD Hub | $ | 24.95 | $ | 27.27 | $ | (2.32 | ) | |||||
Average Market On-Peak Power Prices ($/MWh) (6): | ||||||||||||
PJM West | $ | 35.10 | $ | 40.74 | $ | (5.64 | ) | |||||
AD Hub | $ | 36.30 | $ | 38.75 | $ | (2.45 | ) | |||||
Average natural gas price—TetcoM3 ($/MMBtu) (7) | $ | 1.70 | $ | 1.32 | $ | 0.38 | ||||||
59
__________________________________________
(1) | Includes the activity of the assets acquired in the ENGIE Acquisition. |
(2) | IMA is an internal measurement calculation that reflects the percentage of generation available during periods when market prices are such that these units could be profitably dispatched. The calculation excludes certain events outside of management control such as weather related issues. The calculation excludes CTs. |
(3) | Reflects actual production as a percentage of available capacity. The calculation excludes CTs. |
(4) | Reflects CDDs or HDDs for the PJM Region based on National Oceanic and Atmospheric Association (“NOAA”) data. |
(5) | Reflects the average of the on-peak spark spreads available to a 7.0 MMBtu/MWh heat rate generator selling power at day-ahead prices and buying delivered natural gas at a daily cash market price and does not reflect spark spreads available to us. |
(6) | Reflects the average of day-ahead settled prices for the periods presented and does not necessarily reflect prices we realized. |
(7) | Reflects the average of daily quoted prices for the periods presented and does not reflect costs incurred by us. |
Operating income increased by $57 million primarily due to the following:
(in millions) | ||||
Income attributable to newly acquired plants | $ | 13 | ||
Lower energy margin due to the following: | ||||
Lower spark spreads, net of hedges as a result of higher gas costs and milder weather | $ | (18 | ) | |
Lower generation volumes primarily due to lower demand as a result of milder weather | $ | (16 | ) | |
Lower retail contribution as a result of higher supply costs and milder weather | $ | (13 | ) | |
Higher capacity revenues as a result of higher pricing and performance penalties in 2016 | $ | 30 | ||
Change in MTM value of derivative transactions | $ | 22 | ||
Lower asset impairments | $ | 35 | ||
Lower O&M costs due to lower costs from long-term service agreements | $ | 9 | ||
Adjusted EBITDA increased by $28 million primarily due to the following:
(in millions) | ||||
Contribution from newly acquired plants | $ | 26 | ||
Lower energy margin due to the following: | ||||
Lower spark spreads, net of hedges as a result of higher gas costs and milder weather | $ | (13 | ) | |
Lower generation volumes primarily due to lower demand as a result of milder weather | $ | (18 | ) | |
Lower retail contribution as a result of higher supply costs and milder weather | $ | (13 | ) | |
Higher capacity revenues as a result of higher pricing and performance penalties in 2016 | $ | 30 | ||
Lower O&M costs due to lower costs from long-term service agreements | $ | 7 | ||
Net casualty loss insurance reimbursement | $ | 13 | ||
60
NY/NE Segment
The following table provides summary financial data regarding our NY/NE segment results of operations for the three months ended September 30, 2017 and 2016, respectively:
Three Months Ended September 30, | Favorable (Unfavorable) $ Change | |||||||||||
(dollars in millions, except for price information) | 2017 (1) | 2016 | ||||||||||
Operating revenues | ||||||||||||
Energy | $ | 173 | $ | 152 | $ | 21 | ||||||
Capacity | 77 | 41 | 36 | |||||||||
Mark-to-market income (loss), net | 11 | (7 | ) | 18 | ||||||||
Contract amortization | (1 | ) | (3 | ) | 2 | |||||||
Other | 8 | 12 | (4 | ) | ||||||||
Total operating revenues | 268 | 195 | 73 | |||||||||
Operating costs | ||||||||||||
Cost of sales | (132 | ) | (122 | ) | (10 | ) | ||||||
Contract amortization | 1 | — | 1 | |||||||||
Total operating costs | (131 | ) | (122 | ) | (9 | ) | ||||||
Gross margin | 137 | 73 | 64 | |||||||||
Operating and maintenance expense | (38 | ) | (35 | ) | (3 | ) | ||||||
Depreciation expense | (52 | ) | (53 | ) | 1 | |||||||
Loss on sale of assets | (77 | ) | — | (77 | ) | |||||||
Operating loss | (30 | ) | (15 | ) | (15 | ) | ||||||
Depreciation and amortization expense | 52 | 55 | (3 | ) | ||||||||
Earnings from unconsolidated investments | 2 | — | 2 | |||||||||
EBITDA | 24 | 40 | (16 | ) | ||||||||
Adjustments to reflect Adjusted EBITDA from unconsolidated investments | 1 | — | 1 | |||||||||
Mark-to-market adjustments | (11 | ) | 14 | (25 | ) | |||||||
Loss on sale of assets | 77 | — | 77 | |||||||||
Non-cash compensation expense | — | 1 | (1 | ) | ||||||||
Other | 1 | — | 1 | |||||||||
Adjusted EBITDA | $ | 92 | $ | 55 | $ | 37 | ||||||
Million Megawatt Hours Generated | 5.7 | 5.4 | 0.3 | |||||||||
IMA for Combined-Cycle Facilities (2) | 87 | % | 98 | % | ||||||||
Average Capacity Factor for Combined-Cycle Facilities (3) | 52 | % | 63 | % | ||||||||
CDDs (4) | 519 | 724 | (205 | ) | ||||||||
HDDs (4) | 62 | 100 | (38 | ) | ||||||||
Average Market On-Peak Spark Spreads ($/MWh) (5): | ||||||||||||
New York—Zone C | $ | 18.52 | $ | 26.04 | $ | (7.52 | ) | |||||
Mass Hub | $ | 16.17 | $ | 21.58 | $ | (5.41 | ) | |||||
Average Market On-Peak Power Prices ($/MWh) (6): | ||||||||||||
New York—Zone C | $ | 29.86 | $ | 34.79 | $ | (4.93 | ) | |||||
Mass Hub | $ | 31.94 | $ | 41.31 | $ | (9.37 | ) | |||||
Average natural gas price—Algonquin Citygates ($/MMBtu) (7) | $ | 2.25 | $ | 2.82 | $ | (0.57 | ) | |||||
(1) | Includes the activity of the assets acquired in the ENGIE Acquisition. |
(2) | IMA is an internal measurement calculation that reflects the percentage of generation available during periods when market prices are such that these units could be profitably dispatched. The calculation excludes certain events outside of management control such as weather related issues. The calculation excludes our Brayton Point facility. |
(3) | Reflects actual production as a percentage of available capacity. The calculation excludes our Brayton Point facility. |
(4) | Reflects CDDs or HDDs for the ISO-NE Region based on NOAA data. |
61
(5) | Reflects the average of the on-peak spark spreads available to a 7.0 MMBtu/MWh heat rate generator selling power at day-ahead prices and buying delivered natural gas at a daily cash market price and does not reflect spark spreads available to us. |
(6) | Reflects the average of day-ahead settled prices for the periods presented and does not necessarily reflect prices we realized. |
(7) | Reflects the average of daily quoted prices for the periods presented and does not reflect costs incurred by us. |
Operating loss decreased by $15 million primarily due to the following:
(in millions) | ||||
Income attributable to newly acquired plants | $ | 21 | ||
Lower energy margin due to the following: | ||||
Lower generation volumes as a result of milder weather and the retirement of Brayton Point | $ | (9 | ) | |
Higher price impact due to favorable hedge settlements partially offset by lower spark spreads, net of hedges as a result of milder weather | $ | 2 | ||
Higher capacity revenues as a result of higher pricing, partially offset by capacity lost due to the retirement of Brayton Point | $ | 14 | ||
Change in MTM value of derivative transactions | $ | 14 | ||
Lower contract amortization | $ | 4 | ||
Loss on sale of our Dighton and Milford-MA facilities | $ | (77 | ) | |
Lower O&M due to the retirement of Brayton Point | $ | 3 | ||
Lower depreciation primarily due to the retirement of Brayton Point | $ | 14 | ||
Adjusted EBITDA increased by $37 million primarily due to the following:
(in millions) | ||||
Contribution from newly acquired plants | $ | 36 | ||
Lower energy margin due to the following: | ||||
Lower spark spreads, net of hedges as a result of milder weather | $ | (6 | ) | |
Lower generation volumes as a result of milder weather and the retirement of Brayton Point | $ | (9 | ) | |
Higher capacity revenues as a result of higher pricing, partially offset by capacity lost due to the retirement of Brayton Point | $ | 14 | ||
Lower O&M due to the retirement of Brayton Point | $ | 3 | ||
62
ERCOT Segment
The ERCOT segment includes the results of operations since the ENGIE Acquisition Closing Date. The following table provides summary financial data regarding our ERCOT segment for the three months ended September 30, 2017:
Three Months Ended September 30, | Favorable (Unfavorable) $ Change | |||||||||||
(dollars in millions, except for price information) | 2017 | 2016 | ||||||||||
Operating revenues | ||||||||||||
Energy | $ | 182 | $ | — | N/A | |||||||
Mark-to-market income, net | 23 | — | N/A | |||||||||
Other | 4 | — | N/A | |||||||||
Total operating revenues | 209 | — | N/A | |||||||||
Operating costs | ||||||||||||
Cost of sales | (117 | ) | — | N/A | ||||||||
Contract amortization | 1 | — | N/A | |||||||||
Total operating costs | (116 | ) | — | N/A | ||||||||
Gross margin | 93 | — | N/A | |||||||||
Operating and maintenance expense | (23 | ) | — | N/A | ||||||||
Depreciation expense | (20 | ) | — | N/A | ||||||||
Operating income | 50 | — | N/A | |||||||||
Depreciation and amortization expense | 20 | — | N/A | |||||||||
EBITDA | 70 | — | N/A | |||||||||
Mark-to-market adjustments | (23 | ) | — | N/A | ||||||||
Other | (1 | ) | — | N/A | ||||||||
Adjusted EBITDA | $ | 46 | $ | — | N/A | |||||||
Million Megawatt Hours Generated | 5.0 | — | N/A | |||||||||
IMA (1): | ||||||||||||
Combined-Cycle Facilities | 86 | % | — | % | ||||||||
Coal-Fired Facility | 93 | % | — | % | ||||||||
Average Capacity Factor (2): | ||||||||||||
Combined-Cycle Facilities | 47 | % | — | % | ||||||||
Coal-Fired Facility | 75 | % | — | % | ||||||||
CDDs (3) | 1,701 | 1,808 | (107 | ) | ||||||||
HDDs (3) | — | — | — | |||||||||
Average Market On-Peak Spark Spreads ($/MWh) (4): | ||||||||||||
ERCOT North | $ | 12.65 | $ | 14.51 | $ | (1.86 | ) | |||||
Average Market On-Peak Power Prices ($/MWh) (5): | ||||||||||||
ERCOT North | $ | 31.21 | $ | 33.25 | $ | (2.04 | ) | |||||
Average natural gas price—Waha Hub ($/MMBtu) (6) | $ | 2.65 | $ | 2.68 | $ | (0.03 | ) | |||||
__________________________________________
(1) | IMA is an internal measurement calculation that reflects the percentage of generation available when market prices are such that these units could be profitably dispatched. The calculation excludes certain events outside of management control such as weather related issues. The calculation excludes CTs. |
(2) | Reflects actual production as a percentage of available capacity. The calculation excludes CTs. |
(3) | Reflects CDDs or HDDs for the ERCOT Region based on NOAA data. |
(4) | Reflects the average of the on-peak spark spreads available to a 7.0 MMBtu/MWh heat rate generator selling power at day-ahead prices and buying delivered natural gas at a daily cash market price and does not reflect spark spreads available to us. |
(5) | Reflects the average of day-ahead settled prices for the periods presented and does not necessarily reflect prices we realized. |
(6) | Reflects the average of daily quoted prices for the periods presented and does not reflect costs incurred by us. |
63
Operating income of $50 million primarily consisted of the following:
(in millions) | ||||
Energy margin, net of hedges | $ | 68 | ||
MTM gain | $ | 23 | ||
O&M costs | $ | (23 | ) | |
Depreciation and amortization expense | $ | (19 | ) | |
Adjusted EBITDA was $46 million primarily related to the following:
(in millions) | ||||
Energy margin, net of hedges | $ | 68 | ||
O&M costs | $ | (23 | ) | |
MISO Segment
The following table provides summary financial data regarding our MISO segment results of operations for the three months ended September 30, 2017 and 2016, respectively:
Three Months Ended September 30, | Favorable (Unfavorable) $ Change | |||||||||||
(dollars in millions, except for price information) | 2017 | 2016 | ||||||||||
Operating revenues | ||||||||||||
Energy | $ | 94 | $ | 122 | $ | (28 | ) | |||||
Capacity | 11 | 7 | 4 | |||||||||
Mark-to-market income (loss), net | (1 | ) | 4 | (5 | ) | |||||||
Total operating revenues | 104 | 133 | (29 | ) | ||||||||
Operating costs | ||||||||||||
Cost of sales | (70 | ) | (84 | ) | 14 | |||||||
Total operating costs | (70 | ) | (84 | ) | 14 | |||||||
Gross margin | 34 | 49 | (15 | ) | ||||||||
Operating and maintenance expense | (34 | ) | (33 | ) | (1 | ) | ||||||
Depreciation expense | (9 | ) | (3 | ) | (6 | ) | ||||||
Operating income (loss) | (9 | ) | 13 | (22 | ) | |||||||
Depreciation and amortization expense | 19 | 5 | 14 | |||||||||
EBITDA | 10 | 18 | (8 | ) | ||||||||
Mark-to-market adjustments | 1 | (4 | ) | 5 | ||||||||
Other (1) | 1 | 2 | (1 | ) | ||||||||
Adjusted EBITDA | $ | 12 | $ | 16 | $ | (4 | ) | |||||
Million Megawatt Hours Generated | 3.4 | 4.2 | (0.8 | ) | ||||||||
IMA for Coal-Fired Facilities (2) | 94 | % | 90 | % | ||||||||
Average Capacity Factor for Coal-Fired Facilities (3) | 82 | % | 76 | % | ||||||||
CDDs (4) | 786 | 1,029 | (243 | ) | ||||||||
HDDs (4) | 11 | 46 | (35 | ) | ||||||||
Average Market On-Peak Power Prices ($/MWh) (5): | ||||||||||||
Indiana (Indy Hub) | $ | 37.04 | $ | 40.19 | $ | (3.15 | ) | |||||
Commonwealth Edison (NI Hub) | $ | 34.03 | $ | 38.41 | $ | (4.38 | ) | |||||
64
__________________________________________
(1) | Other includes an adjustment to exclude Wood River’s energy margin and O&M costs of $3 million for the three months ended September 30, 2016. Adjusted EBITDA did not include this adjustment for the three months ended September 30, 2017. |
(2) | IMA is an internal measurement calculation that reflects the percentage of generation available during periods when market prices are such that these units could be profitably dispatched. The calculation excludes certain events outside of management control such as weather related issues. |
(3) | Reflects actual production as a percentage of available capacity. |
(4) | Reflects CDDs or HDDs for the MISO Region based on NOAA data. |
(5) | Reflects the average of day-ahead settled prices for the periods presented and does not necessarily reflect prices we realized. |
Operating income decreased by $22 million primarily due to the following:
(in millions) | ||||
Lower energy margin due to the following: | ||||
Lower dark spreads, net of hedges as a result of milder weather | $ | (8 | ) | |
Lower generation volumes as a result of shutdowns in 2016 | $ | (6 | ) | |
Higher capacity revenues due to favorable pricing and volumes | $ | 4 | ||
Change in MTM value of derivative transactions | $ | (5 | ) | |
Higher O&M costs due to ARO accretion partially offset by shutdowns in 2016 | $ | (1 | ) | |
Higher depreciation expense | $ | (6 | ) | |
Adjusted EBITDA decreased by $4 million primarily due to the following:
(in millions) | ||||
Lower energy margin due to the following: | ||||
Lower dark spreads, net of hedges as a result of milder weather | $ | (8 | ) | |
Lower generation volumes as a result of shutdowns in 2016 | $ | (6 | ) | |
Higher capacity revenues due to favorable pricing and volumes | $ | 4 | ||
Lower O&M costs due to shutdowns in 2016 | $ | 5 | ||
65
IPH Segment
The following table provides summary financial data regarding our IPH segment results of operations for the three months ended September 30, 2017 and 2016, respectively:
Three Months Ended September 30, | Favorable (Unfavorable) $ Change | |||||||||||
(dollars in millions, except for price information) | 2017 | 2016 | ||||||||||
Operating revenues | ||||||||||||
Energy | $ | 152 | $ | 200 | $ | (48 | ) | |||||
Capacity | 49 | 42 | 7 | |||||||||
Mark-to-market income, net | 1 | — | 1 | |||||||||
Contract amortization | (1 | ) | (2 | ) | 1 | |||||||
Other | 2 | 2 | — | |||||||||
Total operating revenues | 203 | 242 | (39 | ) | ||||||||
Operating costs | ||||||||||||
Cost of sales | (138 | ) | (146 | ) | 8 | |||||||
Contract amortization | 2 | 4 | (2 | ) | ||||||||
Total operating costs | (136 | ) | (142 | ) | 6 | |||||||
Gross margin | 67 | 100 | (33 | ) | ||||||||
Operating and maintenance expense | (45 | ) | (50 | ) | 5 | |||||||
Depreciation expense | (11 | ) | (7 | ) | (4 | ) | ||||||
Impairments | — | (148 | ) | 148 | ||||||||
Other | — | 1 | (1 | ) | ||||||||
Operating income (loss) | 11 | (104 | ) | 115 | ||||||||
Depreciation and amortization expense | 11 | 7 | 4 | |||||||||
Bankruptcy reorganization items | 12 | — | 12 | |||||||||
Other income and expense, net | — | 1 | (1 | ) | ||||||||
EBITDA | 34 | (96 | ) | 130 | ||||||||
Adjustment to exclude noncontrolling interest | — | (1 | ) | 1 | ||||||||
Bankruptcy reorganization items | (12 | ) | — | (12 | ) | |||||||
Mark-to-market adjustments | (1 | ) | 2 | (3 | ) | |||||||
Impairments | — | 148 | (148 | ) | ||||||||
Other | — | (3 | ) | 3 | ||||||||
Adjusted EBITDA | $ | 21 | $ | 50 | $ | (29 | ) | |||||
Million Megawatt Hours Generated | 4.6 | 5.0 | (0.4 | ) | ||||||||
IMA (1) | 85 | % | 88 | % | ||||||||
Average Capacity Factor for IPH Facilities (2) | 62 | % | 59 | % | ||||||||
CDDs (3) | 786 | 1,029 | (243 | ) | ||||||||
HDDs (3) | 11 | 46 | (35 | ) | ||||||||
Average Market On-Peak Power Prices ($/MWh) (4): | ||||||||||||
Indiana (Indy Hub) | $ | 37.04 | $ | 40.19 | $ | (3.15 | ) | |||||
Commonwealth Edison (NI Hub) | $ | 34.03 | $ | 38.41 | $ | (4.38 | ) | |||||
________________________________________
(1) | IMA is an internal measurement calculation that reflects the percentage of generation available during periods when market prices are such that these units could be profitably dispatched. The calculation excludes certain events outside of management control such as weather related issues. The calculation excludes CTs. |
(2) | Reflects actual production as a percentage of available capacity. The calculation excludes CTs. |
(3) | Reflects CDDs or HDDs for the MISO Region based on NOAA data. |
(4) | Reflects the average of day-ahead settled prices for the periods presented and does not necessarily reflect prices we realized. |
66
Operating income increased by $115 million primarily due to the following:
(in millions) | ||||
Lower energy margin due to the following: | ||||
Lower dark spreads, net of hedges as a result of milder weather | $ | (6 | ) | |
Lower generation as a result of milder weather and 2016 shutdowns | $ | (7 | ) | |
Lower retail contribution as a result of milder weather | $ | (28 | ) | |
Higher capacity revenues due to higher pricing | $ | 7 | ||
Change in MTM value of derivative transactions | $ | 1 | ||
Lower O&M costs due to lower ARO accretion and shutdowns in 2016 | $ | 5 | ||
Higher depreciation expense | $ | (4 | ) | |
Lower impairment charges in 2017 | $ | 148 | ||
Adjusted EBITDA decreased by $29 million primarily due to the following:
(in millions) | ||||
Lower energy margin due to the following: | ||||
Lower dark spreads, net of hedges as a result of milder weather | $ | (6 | ) | |
Lower generation as a result of milder weather and 2016 shutdowns | $ | (7 | ) | |
Lower retail contribution as a result of milder weather | $ | (28 | ) | |
Higher capacity revenues due to higher pricing | $ | 7 | ||
Lower O&M costs due to shutdowns in 2016 | $ | 5 | ||
67
CAISO Segment
The following table provides summary financial data regarding our CAISO segment results of operations for the three months ended September 30, 2017 and 2016, respectively:
Three Months Ended September 30, | Favorable (Unfavorable) $ Change | |||||||||||
(dollars in millions, except for price information) | 2017 | 2016 | ||||||||||
Operating revenues | ||||||||||||
Energy | $ | 46 | $ | 19 | $ | 27 | ||||||
Capacity | 8 | 17 | (9 | ) | ||||||||
Mark-to-market income (loss), net | (3 | ) | 2 | (5 | ) | |||||||
Contract amortization | — | (4 | ) | 4 | ||||||||
Other | (1 | ) | 12 | (13 | ) | |||||||
Total operating revenues | 50 | 46 | 4 | |||||||||
Operating costs | ||||||||||||
Cost of sales | (31 | ) | (16 | ) | (15 | ) | ||||||
Total operating costs | (31 | ) | (16 | ) | (15 | ) | ||||||
Gross margin | 19 | 30 | (11 | ) | ||||||||
Operating and maintenance expense | (5 | ) | (9 | ) | 4 | |||||||
Depreciation expense | (14 | ) | (11 | ) | (3 | ) | ||||||
Operating income | — | 10 | (10 | ) | ||||||||
Depreciation and amortization expense | 15 | 15 | — | |||||||||
EBITDA | 15 | 25 | (10 | ) | ||||||||
Mark-to-market adjustments | 3 | (2 | ) | 5 | ||||||||
Other | — | 1 | (1 | ) | ||||||||
Adjusted EBITDA | $ | 18 | $ | 24 | $ | (6 | ) | |||||
Million Megawatt Hours Generated | 1.0 | 0.5 | 0.5 | |||||||||
IMA for Combined-Cycle Facilities (1) | 86 | % | 92 | % | ||||||||
Average Capacity Factor for Combined-Cycle Facilities (2) | 43 | % | 20 | % | ||||||||
CDDs (3) | 874 | 723 | 151 | |||||||||
HDDs (3) | 6 | 22 | (16 | ) | ||||||||
Average Market On-Peak Spark Spreads ($/MWh) (4): | ||||||||||||
North of Path 15 (NP 15) | $ | 23.84 | $ | 15.44 | $ | 8.40 | ||||||
Average natural gas price—PG&E Citygate ($/MMBtu) (5) | $ | 3.27 | $ | 3.18 | $ | 0.09 | ||||||
__________________________________________
(1) | IMA is an internal measurement calculation that reflects the percentage of generation available when market prices are such that these units could be profitably dispatched. The calculation excludes certain events outside of management control such as weather related issues. The calculation excludes CTs. |
(2) | Reflects actual production as a percentage of available capacity. The calculation excludes CTs. |
(3) | Reflects CDDs or HDDs for the CAISO Region based on NOAA data. |
(4) | Reflects the average of the on-peak spark spreads available to a 7.0 MMBtu/MWh heat rate generator selling power at day-ahead prices and buying delivered natural gas at a daily cash market price and does not reflect spark spreads available to us. |
(5) | Reflects the average of daily quoted prices for the periods presented and does not reflect costs incurred by us. |
Operating income decreased $10 million primarily due to the following:
(in millions) | ||||
Higher energy margin, net of hedges due to higher spark spreads as a result of warmer weather | $ | 11 | ||
Lower capacity revenues due to lower contracted volumes and prices | $ | (9 | ) | |
Change in MTM value of derivative transactions | $ | (5 | ) | |
Lower tolling revenue due to expiration of tolling agreement | $ | (11 | ) | |
Lower O&M costs due to shutdowns | $ | 3 | ||
68
Adjusted EBITDA decreased by $6 million primarily due to the following:
(in millions) | ||||
Higher energy margin, net of hedges due to higher spark spreads as a result of warmer weather | $ | 11 | ||
Lower capacity revenues due to lower contracted volumes and prices | $ | (9 | ) | |
Lower tolling revenue due to expiration of tolling agreement | $ | (11 | ) | |
Lower O&M costs due to shutdowns | $ | 3 | ||
Consolidated Summary Financial Information — Nine Months Ended September 30, 2017 Compared to Nine Months Ended September 30, 2016
The following table provides summary financial data regarding our unaudited consolidated results of operations for the nine months ended September 30, 2017 and 2016, respectively:
Nine Months Ended September 30, | Favorable (Unfavorable) $ Change | |||||||||||
(amounts in millions) | 2017 | 2016 | ||||||||||
Revenues | ||||||||||||
Energy | $ | 3,036 | $ | 2,526 | $ | 510 | ||||||
Capacity | 722 | 573 | 149 | |||||||||
Mark-to-market income, net | 20 | 73 | (53 | ) | ||||||||
Contract amortization | (29 | ) | (58 | ) | 29 | |||||||
Other | 99 | 97 | 2 | |||||||||
Total revenues | 3,848 | 3,211 | 637 | |||||||||
Cost of sales, excluding depreciation expense | (2,225 | ) | (1,698 | ) | (527 | ) | ||||||
Gross margin | 1,623 | 1,513 | 110 | |||||||||
Operating and maintenance expense | (750 | ) | (695 | ) | (55 | ) | ||||||
Depreciation expense | (611 | ) | (494 | ) | (117 | ) | ||||||
Impairments | (148 | ) | (857 | ) | 709 | |||||||
Loss on sale of assets, net | (107 | ) | — | (107 | ) | |||||||
General and administrative expense | (126 | ) | (117 | ) | (9 | ) | ||||||
Acquisition and integration costs | (55 | ) | (8 | ) | (47 | ) | ||||||
Other | 1 | (16 | ) | 17 | ||||||||
Operating loss | (173 | ) | (674 | ) | 501 | |||||||
Bankruptcy reorganization items | 494 | — | 494 | |||||||||
Earnings from unconsolidated investments | 4 | 7 | (3 | ) | ||||||||
Interest expense | (478 | ) | (449 | ) | (29 | ) | ||||||
Loss on early extinguishment of debt | (75 | ) | — | (75 | ) | |||||||
Other income and expense, net | 65 | 60 | 5 | |||||||||
Loss before income taxes | (163 | ) | (1,056 | ) | 893 | |||||||
Income tax benefit (expense) | 330 | (6 | ) | 336 | ||||||||
Net income (loss) | 167 | (1,062 | ) | 1,229 | ||||||||
Less: Net loss attributable to noncontrolling interest | (2 | ) | (2 | ) | — | |||||||
Net income (loss) attributable to Dynegy Inc. | $ | 169 | $ | (1,060 | ) | $ | 1,229 | |||||
69
The following tables provide summary financial data regarding our operating income (loss) by segment for the nine months ended September 30, 2017 and 2016, respectively:
Nine Months Ended September 30, 2017 | ||||||||||||||||||||||||||||||||
(amounts in millions) | PJM | NY/NE | ERCOT | MISO | IPH | CAISO | Other | Total | ||||||||||||||||||||||||
Revenues | $ | 1,759 | $ | 815 | $ | 321 | $ | 292 | $ | 572 | $ | 89 | $ | — | $ | 3,848 | ||||||||||||||||
Cost of sales, excluding depreciation expense | (922 | ) | (504 | ) | (209 | ) | (175 | ) | (365 | ) | (50 | ) | — | (2,225 | ) | |||||||||||||||||
Gross margin | 837 | 311 | 112 | 117 | 207 | 39 | — | 1,623 | ||||||||||||||||||||||||
Operating and maintenance expense | (296 | ) | (135 | ) | (66 | ) | (86 | ) | (133 | ) | (32 | ) | (2 | ) | (750 | ) | ||||||||||||||||
Depreciation expense | (283 | ) | (171 | ) | (54 | ) | (22 | ) | (35 | ) | (40 | ) | (6 | ) | (611 | ) | ||||||||||||||||
Impairments | (49 | ) | — | — | (99 | ) | — | — | — | (148 | ) | |||||||||||||||||||||
Gain (loss) on sale of assets | (31 | ) | (77 | ) | — | — | 1 | — | — | (107 | ) | |||||||||||||||||||||
General and administrative expense | — | — | — | — | — | — | (126 | ) | (126 | ) | ||||||||||||||||||||||
Acquisition and integration costs | — | — | — | — | — | — | (55 | ) | (55 | ) | ||||||||||||||||||||||
Other | — | — | — | — | — | — | 1 | 1 | ||||||||||||||||||||||||
Operating income (loss) | $ | 178 | $ | (72 | ) | $ | (8 | ) | $ | (90 | ) | $ | 40 | $ | (33 | ) | $ | (188 | ) | $ | (173 | ) | ||||||||||
Nine Months Ended September 30, 2016 | ||||||||||||||||||||||||||||
(amounts in millions) | PJM | NY/NE | MISO | IPH | CAISO | Other | Total | |||||||||||||||||||||
Revenues | $ | 1,604 | $ | 628 | $ | 300 | $ | 574 | $ | 105 | $ | — | $ | 3,211 | ||||||||||||||
Cost of sales, excluding depreciation expense | (712 | ) | (361 | ) | (232 | ) | (342 | ) | (51 | ) | — | (1,698 | ) | |||||||||||||||
Gross margin | 892 | 267 | 68 | 232 | 54 | — | 1,513 | |||||||||||||||||||||
Operating and maintenance expense | (294 | ) | (122 | ) | (107 | ) | (143 | ) | (28 | ) | (1 | ) | (695 | ) | ||||||||||||||
Depreciation expense | (257 | ) | (167 | ) | (19 | ) | (21 | ) | (26 | ) | (4 | ) | (494 | ) | ||||||||||||||
Impairments | (64 | ) | — | (645 | ) | (148 | ) | — | — | (857 | ) | |||||||||||||||||
General and administrative expense | — | — | — | — | — | (117 | ) | (117 | ) | |||||||||||||||||||
Acquisition and integration costs | — | — | — | 8 | — | (16 | ) | (8 | ) | |||||||||||||||||||
Other | — | — | — | (15 | ) | — | (1 | ) | (16 | ) | ||||||||||||||||||
Operating income (loss) | $ | 277 | $ | (22 | ) | $ | (703 | ) | $ | (87 | ) | $ | — | $ | (139 | ) | $ | (674 | ) | |||||||||
Discussion of Consolidated Results of Operations
Revenues. The following table summarizes the change in revenues by segment:
(amounts in millions) | PJM | NY/NE | ERCOT | MISO | IPH | CAISO | Total | |||||||||||||||||||||
Revenues, net of hedges, attributable to newly acquired ENGIE plants for the first quarter of 2017 | $ | 180 | $ | 167 | $ | 321 | $ | — | $ | — | $ | — | $ | 668 | ||||||||||||||
Higher (lower) realized power prices | 51 | 94 | — | (9 | ) | (42 | ) | 27 | 121 | |||||||||||||||||||
Lower generation volumes (1) | (39 | ) | (40 | ) | — | (59 | ) | — | (15 | ) | (153 | ) | ||||||||||||||||
Higher (lower) capacity revenues | 9 | 12 | — | 7 | 37 | (14 | ) | 51 | ||||||||||||||||||||
Change in MTM value of derivative transactions | (66 | ) | (52 | ) | — | 51 | (1 | ) | (4 | ) | (72 | ) | ||||||||||||||||
Lower contract amortization | 14 | 1 | — | — | 5 | 7 | 27 | |||||||||||||||||||||
Other (2) | 6 | 5 | — | 2 | (1 | ) | (17 | ) | (5 | ) | ||||||||||||||||||
Total change in revenues | $ | 155 | $ | 187 | $ | 321 | $ | (8 | ) | $ | (2 | ) | $ | (16 | ) | $ | 637 | |||||||||||
_______________________________________
(1) | Decrease primarily due to unit shutdowns at our MISO and IPH segments, higher outages at our PJM and CAISO segments, milder weather at our PJM, NY/NE, MISO and IPH segments, and a plant retirement at our NY/NE segment. |
(2) | Other primarily consists of ancillary, tolling, transmission and gas revenues. |
70
Cost of Sales. The following table summarizes the change in cost of sales by segment:
(amounts in millions) | PJM | NY/NE | ERCOT | MISO | IPH | CAISO | Total | |||||||||||||||||||||
Cost of sales attributable to newly acquired ENGIE plants for the first quarter of 2017 | $ | 80 | $ | 79 | $ | 209 | $ | — | $ | — | $ | — | $ | 368 | ||||||||||||||
Higher (lower) prices | 124 | 129 | — | (9 | ) | (5 | ) | 12 | 251 | |||||||||||||||||||
Higher (lower) burn volumes (1) | (38 | ) | (51 | ) | — | (49 | ) | 31 | (13 | ) | (120 | ) | ||||||||||||||||
Lower (higher) contract amortization | 31 | (17 | ) | — | — | 12 | — | 26 | ||||||||||||||||||||
Other (2) | 13 | 3 | — | 1 | (15 | ) | — | 2 | ||||||||||||||||||||
Total change in cost of sales | $ | 210 | $ | 143 | $ | 209 | $ | (57 | ) | $ | 23 | $ | (1 | ) | $ | 527 | ||||||||||||
_______________________________________
(1) | Lower burn volumes primarily due to unit shutdowns at our MISO and IPH segments, higher outages at our PJM and CAISO segments, milder weather at our PJM, NY/NE, MISO and IPH segments, and a plant retirement at our NY/NE segment; offsetting increase primarily due to higher market prices at our IPH segment. |
(2) | Other primarily consists of transmission expenses. |
Operating and Maintenance Expense. O&M expense increased by $55 million primarily due to the newly acquired ENGIE plants, partially offset by lower costs from long-term service agreements at our PJM, NY/NE and CAISO segments, plant shutdowns at our MISO and IPH segments, and a plant retirement at our NY/NE segment.
Depreciation Expense. Depreciation expense increased by $117 million primarily due to increases from the newly acquired ENGIE plants.
Impairments. Impairments decreased by $709 million due to the following (amounts in millions):
Nine Months Ended September 30, | ||||||||
Description | 2017 | 2016 | ||||||
Materials and supplies inventory | $ | 14 | $ | — | ||||
Property, plant and equipment, net | 119 | 848 | ||||||
Equity investment | — | 9 | ||||||
Assets held-for-sale (Lee) | 15 | — | ||||||
Total | $ | 148 | $ | 857 | ||||
Please read Note 3—Acquisitions and Divestitures, Note 4—Unconsolidated Investments, Note 8—Inventory, and Note 9—Property, Plant and Equipment for further discussion.
Loss on Sale of Assets, net. Loss on sale of assets, net increased by $107 million primarily due to the Conesville and Zimmer ownership interest exchange and the sale of our Dighton and Milford-MA facilities. Please read Note 10—Joint Ownership of Generating Facilities and Note 3—Acquisitions and Divestitures for further discussion.
General and Administrative Expense. General and administrative expense increased by $9 million primarily due to higher overhead associated with the ENGIE Acquisition and higher professional services fees.
Acquisition and Integration Costs. Acquisition and integration costs increased by $47 million primarily due to $37 million higher advisory and consulting fees and $10 million higher severance, retention, and payroll costs primarily related to the ENGIE Acquisition in 2017.
Other. Other improved by $17 million primarily due to the termination of an above market coal supply contract in 2016 at our IPH segment.
Bankruptcy Reorganization Items. Bankruptcy reorganization items increased by $494 million primarily due to the gain on extinguishment of debt and legal costs associated with the Genco bankruptcy reorganization. Please read Note 18—Genco Chapter 11 Bankruptcy and Emergence for further discussion.
Interest Expense. Interest expense increased by $29 million primarily due to the interest on our Tranche C-1 Term Loan and our Senior Notes, partially offset by a decrease due to the elimination of the Genco senior notes. Please read Note 12—Debt for further discussion.
71
Loss on Early Extinguishment of Debt. Loss on early extinguishment of debt was $75 million due to the repurchase of a portion of our senior notes due 2019, the repayment of a portion of our Tranche C-1 Term Loan, and our Tranche C/Tranche B-2 Term Loan debt exchange. Please read Note 12—Debt for further discussion.
Income Tax Benefit (Expense). The net favorable change of $336 million was primarily due to a partial release of our valuation allowance as a result of the ENGIE Acquisition and recognition of the benefit of AMT credits that had previously been subject to a valuation allowance.
Net Income (Loss) Attributable to Dynegy Inc. The $1.229 billion increase was primarily due to (i) a $82 million income attributable to newly acquired ENGIE plants, (ii) income from a $317 million deferred tax valuation allowance release in 2017, (iii) a $494 million gain primarily due to extinguishment of debt associated with the Genco bankruptcy reorganization, and (iv) $709 million lower impairment charges, partially offset by (i) $72 million in non-cash mark-to-market losses associated with our hedging transactions, (ii) $55 million in acquisition and integration costs related to the ENGIE Acquisition, (iii) $107 million loss on sale of assets, and (iv) $75 million on loss on early extinguishment of debt.
Adjusted EBITDA — Nine Months Ended September 30, 2017 Compared to Nine Months Ended September 30, 2016
The following table provides summary financial data regarding our Adjusted EBITDA by segment for the nine months ended September 30, 2017:
Nine Months Ended September 30, 2017 | ||||||||||||||||||||||||||||||||
(amounts in millions) | PJM | NY/NE | ERCOT | MISO | IPH | CAISO | Other | Total | ||||||||||||||||||||||||
Net income | $ | 167 | ||||||||||||||||||||||||||||||
Income tax benefit | (330 | ) | ||||||||||||||||||||||||||||||
Other income and expense, net | (65 | ) | ||||||||||||||||||||||||||||||
Loss on early extinguishment of debt | 75 | |||||||||||||||||||||||||||||||
Interest expense | 478 | |||||||||||||||||||||||||||||||
Earnings from unconsolidated investments | (4 | ) | ||||||||||||||||||||||||||||||
Bankruptcy reorganization items | (494 | ) | ||||||||||||||||||||||||||||||
Operating income (loss) | $ | 178 | $ | (72 | ) | $ | (8 | ) | $ | (90 | ) | $ | 40 | $ | (33 | ) | $ | (188 | ) | $ | (173 | ) | ||||||||||
Depreciation and amortization expense | 293 | 179 | 55 | 34 | 38 | 44 | 6 | 649 | ||||||||||||||||||||||||
Bankruptcy reorganization items | — | — | — | — | 494 | — | — | 494 | ||||||||||||||||||||||||
Earnings from unconsolidated investments | 2 | 2 | — | — | — | — | — | 4 | ||||||||||||||||||||||||
Loss on early extinguishment of debt | — | — | — | — | — | — | (75 | ) | (75 | ) | ||||||||||||||||||||||
Other income and expense, net | 16 | — | — | — | 26 | — | 23 | 65 | ||||||||||||||||||||||||
EBITDA | 489 | 109 | 47 | (56 | ) | 598 | 11 | (234 | ) | 964 | ||||||||||||||||||||||
Adjustments to reflect Adjusted EBITDA to exclude earnings from unconsolidated investments and noncontrolling interest | 4 | 2 | — | — | (1 | ) | — | — | 5 | |||||||||||||||||||||||
Acquisition and integration costs | — | — | — | — | — | — | 55 | 55 | ||||||||||||||||||||||||
Bankruptcy reorganization items | — | — | — | — | (494 | ) | — | — | (494 | ) | ||||||||||||||||||||||
Mark-to-market adjustments, including warrants | 28 | 6 | (9 | ) | (18 | ) | (2 | ) | 3 | (16 | ) | (8 | ) | |||||||||||||||||||
Impairments | 49 | — | — | 99 | — | — | — | 148 | ||||||||||||||||||||||||
Loss (gain) on sale of assets, net | 31 | 77 | — | — | (1 | ) | — | — | 107 | |||||||||||||||||||||||
Loss on early extinguishment of debt | — | — | — | — | — | — | 75 | 75 | ||||||||||||||||||||||||
Non-cash compensation expense | — | — | — | — | — | — | 16 | 16 | ||||||||||||||||||||||||
Other | 1 | — | — | — | (1 | ) | — | (1 | ) | (1 | ) | |||||||||||||||||||||
Adjusted EBITDA | $ | 602 | $ | 194 | $ | 38 | $ | 25 | $ | 99 | $ | 14 | $ | (105 | ) | $ | 867 | |||||||||||||||
72
The following table provides summary financial data regarding our Adjusted EBITDA by segment for the nine months ended September 30, 2016:
Nine Months Ended September 30, 2016 | ||||||||||||||||||||||||||||
(amounts in millions) | PJM | NY/NE | MISO | IPH | CAISO | Other | Total | |||||||||||||||||||||
Net loss | $ | (1,062 | ) | |||||||||||||||||||||||||
Income tax expense | 6 | |||||||||||||||||||||||||||
Other income and expense, net | (60 | ) | ||||||||||||||||||||||||||
Interest expense | 449 | |||||||||||||||||||||||||||
Earnings from unconsolidated investments | (7 | ) | ||||||||||||||||||||||||||
Operating income (loss) | $ | 277 | $ | (22 | ) | $ | (703 | ) | $ | (87 | ) | $ | — | $ | (139 | ) | $ | (674 | ) | |||||||||
Depreciation and amortization expense | 259 | 190 | 23 | 20 | 33 | 4 | 529 | |||||||||||||||||||||
Earnings from unconsolidated investments | 7 | — | — | — | — | — | 7 | |||||||||||||||||||||
Other income and expense, net | 9 | — | — | 15 | 12 | 24 | 60 | |||||||||||||||||||||
EBITDA | 552 | 168 | (680 | ) | (52 | ) | 45 | (111 | ) | (78 | ) | |||||||||||||||||
Acquisition, integration and restructuring costs | — | — | — | (8 | ) | — | 21 | 13 | ||||||||||||||||||||
Mark-to-market adjustments, including warrants | (43 | ) | (27 | ) | 33 | (3 | ) | (1 | ) | (5 | ) | (46 | ) | |||||||||||||||
Impairments | 64 | — | 645 | 148 | — | — | 857 | |||||||||||||||||||||
Non-cash compensation expense | 1 | 1 | — | — | — | 16 | 18 | |||||||||||||||||||||
Other (1) | 2 | — | 21 | (3 | ) | 1 | 3 | 24 | ||||||||||||||||||||
Adjusted EBITDA | $ | 576 | $ | 142 | $ | 19 | $ | 82 | $ | 45 | $ | (76 | ) | $ | 788 | |||||||||||||
__________________________________________
(1) | Other primarily includes an adjustment to exclude Wood River’s energy margin and O&M costs of $23 million for the nine months ended September 30, 2016. Adjusted EBITDA did not include this adjustment for the nine months ended September 30, 2017. |
Adjusted EBITDA increased by $79 million. The newly acquired ENGIE plants contributed $183 million in 2017. The offsetting $104 million decrease was primarily driven by lower energy margin, net of hedges as a result of decreased spark spreads, driven by higher gas costs at the PJM segment, decreased dark spreads at the IPH segment and lower retail contribution at the PJM and IPH segments, all driven by milder weather. Please read Discussion of Segment Adjusted EBITDA for further information.
73
Discussion of Segment Adjusted EBITDA — Nine Months Ended September 30, 2017 Compared to Nine Months Ended September 30, 2016
PJM Segment
The following table provides summary financial data regarding our PJM segment results of operations for the nine months ended September 30, 2017 and 2016, respectively:
Nine Months Ended September 30, | Favorable (Unfavorable) $ Change | |||||||||||
(dollars in millions, except for price information) | 2017 (1) | 2016 | ||||||||||
Operating revenues | ||||||||||||
Energy | $ | 1,351 | $ | 1,239 | $ | 112 | ||||||
Capacity | 367 | 302 | 65 | |||||||||
Mark-to-market income, net | — | 61 | (61 | ) | ||||||||
Contract amortization | (16 | ) | (35 | ) | 19 | |||||||
Other | 57 | 37 | 20 | |||||||||
Total operating revenues | 1,759 | 1,604 | 155 | |||||||||
Operating costs | ||||||||||||
Cost of sales | (931 | ) | (748 | ) | (183 | ) | ||||||
Contract amortization | 9 | 36 | (27 | ) | ||||||||
Total operating costs | (922 | ) | (712 | ) | (210 | ) | ||||||
Gross margin | 837 | 892 | (55 | ) | ||||||||
Operating and maintenance expense | (296 | ) | (294 | ) | (2 | ) | ||||||
Depreciation expense | (283 | ) | (257 | ) | (26 | ) | ||||||
Impairments | (49 | ) | (64 | ) | 15 | |||||||
Loss on sale of assets | (31 | ) | — | (31 | ) | |||||||
Operating income | 178 | 277 | (99 | ) | ||||||||
Depreciation and amortization expense | 293 | 259 | 34 | |||||||||
Earnings from unconsolidated investments | 2 | 7 | (5 | ) | ||||||||
Other income and expense, net | 16 | 9 | 7 | |||||||||
EBITDA | 489 | 552 | (63 | ) | ||||||||
Adjustments to reflect Adjusted EBITDA from unconsolidated investments | 4 | — | 4 | |||||||||
Mark-to-market adjustments | 28 | (43 | ) | 71 | ||||||||
Impairments | 49 | 64 | (15 | ) | ||||||||
Loss on sale of assets | 31 | — | 31 | |||||||||
Non-cash compensation expense | — | 1 | (1 | ) | ||||||||
Other | 1 | 2 | (1 | ) | ||||||||
Adjusted EBITDA | $ | 602 | $ | 576 | $ | 26 | ||||||
Million Megawatt Hours Generated | 38.8 | 39.3 | (0.5 | ) | ||||||||
IMA (2): | ||||||||||||
Combined-Cycle Facilities | 93 | % | 97 | % | ||||||||
Coal-Fired Facilities | 71 | % | 81 | % | ||||||||
Average Capacity Factor (3): | ||||||||||||
Combined-Cycle Facilities | 63 | % | 75 | % | ||||||||
Coal-Fired Facilities | 54 | % | 51 | % | ||||||||
CDDs (4) | 1,085 | 1,377 | (292 | ) | ||||||||
HDDs (4) | 2,606 | 3,056 | (450 | ) | ||||||||
Average Market On-Peak Spark Spreads ($/MWh) (5): | ||||||||||||
PJM West | $ | 16.79 | $ | 23.79 | $ | (7.00 | ) | |||||
AD Hub | $ | 18.05 | $ | 28.88 | $ | (10.83 | ) | |||||
Average Market On-Peak Power Prices ($/MWh) (6): | ||||||||||||
PJM West | $ | 33.62 | $ | 34.77 | $ | (1.15 | ) | |||||
AD Hub | $ | 33.76 | $ | 32.66 | $ | 1.10 | ||||||
Average natural gas price—TetcoM3 ($/MMBtu) (7) | $ | 2.40 | $ | 1.57 | $ | 0.83 | ||||||
74
__________________________________________
(1) | Includes the activity of the assets acquired in the ENGIE Acquisition for our period of ownership. Million Megawatt Hours Generated and Average Capacity Factor include such activity for the full month of February. IMA excludes such activity for our period of ownership in February. |
(2) | IMA is an internal measurement calculation that reflects the percentage of generation available during periods when market prices are such that these units could be profitably dispatched. The calculation excludes certain events outside of management control such as weather related issues. The calculation excludes CTs. |
(3) | Reflects actual production as a percentage of available capacity. The calculation excludes CTs. |
(4) | Reflects CDDs or HDDs for the PJM Region based on NOAA data. |
(5) | Reflects the average of the on-peak spark spreads available to a 7.0 MMBtu/MWh heat rate generator selling power at day-ahead prices and buying delivered natural gas at a daily cash market price and does not reflect spark spreads available to us. |
(6) | Reflects the average of day-ahead settled prices for the periods presented and does not necessarily reflect prices we realized. |
(7) | Reflects the average of daily quoted prices for the periods presented and does not reflect costs incurred by us. |
Operating income decreased by $99 million primarily due to the following:
(in millions) | ||||
Income attributable to newly acquired plants | $ | 62 | ||
Lower energy margin primarily due to the following: | ||||
Lower spark spreads, net of hedges as a result of higher gas costs and milder weather | $ | (51 | ) | |
Lower generation volumes primarily due to higher outages and milder weather | $ | (30 | ) | |
Lower retail contribution as a result of higher supply costs and milder weather | $ | (8 | ) | |
Higher capacity revenues as a result of higher pricing and performance penalties in 2016 | $ | 9 | ||
Change in MTM value of derivative transactions | $ | (66 | ) | |
Lower contract amortization | $ | (17 | ) | |
Lower O&M costs associated with outages in 2016 and lower costs from long-term service agreements | $ | 17 | ||
Lower impairment charges | $ | 15 | ||
Loss on sale of assets due to the Conesville and Zimmer ownership interest exchange | $ | (31 | ) | |
Adjusted EBITDA increased by $26 million primarily due to the following:
(in millions) | ||||
Contribution from newly acquired plants | $ | 75 | ||
Lower energy margin primarily due to the following: | ||||
Lower spark spreads, net of hedges as a result of higher gas costs and milder weather | $ | (38 | ) | |
Lower generation volumes primarily due to higher outages and milder weather | $ | (35 | ) | |
Lower retail contribution as a result of higher supply costs and milder weather | $ | (8 | ) | |
Higher capacity revenues as a result of higher pricing and performance penalties in 2016 | $ | 9 | ||
Lower O&M costs associated with outages in 2016 and lower costs from long-term service agreements | $ | 15 | ||
Net casualty loss insurance reimbursement | $ | 7 | ||
75
NY/NE Segment
The following table provides summary financial data regarding our NY/NE segment results of operations for the nine months ended September 30, 2017 and 2016, respectively:
Nine Months Ended September 30, | Favorable (Unfavorable) $ Change | |||||||||||
(dollars in millions, except for price information) | 2017 (1) | 2016 | ||||||||||
Operating revenues | ||||||||||||
Energy | $ | 619 | $ | 430 | $ | 189 | ||||||
Capacity | 182 | 128 | 54 | |||||||||
Mark-to-market income (loss), net | (6 | ) | 41 | (47 | ) | |||||||
Contract amortization | (8 | ) | (6 | ) | (2 | ) | ||||||
Other | 28 | 35 | (7 | ) | ||||||||
Total operating revenues | 815 | 628 | 187 | |||||||||
Operating costs | ||||||||||||
Cost of sales | (505 | ) | (345 | ) | (160 | ) | ||||||
Contract amortization | 1 | (16 | ) | 17 | ||||||||
Total operating costs | (504 | ) | (361 | ) | (143 | ) | ||||||
Gross margin | 311 | 267 | 44 | |||||||||
Operating and maintenance expense | (135 | ) | (122 | ) | (13 | ) | ||||||
Depreciation expense | (171 | ) | (167 | ) | (4 | ) | ||||||
Loss on sale of assets | (77 | ) | — | (77 | ) | |||||||
Operating loss | (72 | ) | (22 | ) | (50 | ) | ||||||
Depreciation and amortization expense | 179 | 190 | (11 | ) | ||||||||
Earnings from unconsolidated investments | 2 | — | 2 | |||||||||
EBITDA | 109 | 168 | (59 | ) | ||||||||
Adjustments to reflect Adjusted EBITDA from unconsolidated investments | 2 | — | 2 | |||||||||
Mark-to-market adjustments | 6 | (27 | ) | 33 | ||||||||
Loss on sale of assets | 77 | — | 77 | |||||||||
Non-cash compensation expense | — | 1 | (1 | ) | ||||||||
Adjusted EBITDA | $ | 194 | $ | 142 | $ | 52 | ||||||
Million Megawatt Hours Generated | 14.6 | 13.1 | 1.5 | |||||||||
IMA for Combined-Cycle Facilities (2) | 91 | % | 95 | % | ||||||||
Average Capacity Factor for Combined-Cycle Facilities (3) | 42 | % | 50 | % | ||||||||
CDDs (4) | 687 | 874 | (187 | ) | ||||||||
HDDs (4) | 3,543 | 3,658 | (115 | ) | ||||||||
Average Market On-Peak Spark Spreads ($/MWh) (5): | ||||||||||||
New York—Zone C | $ | 13.30 | $ | 17.37 | $ | (4.07 | ) | |||||
Mass Hub | $ | 11.63 | $ | 14.49 | $ | (2.86 | ) | |||||
Average Market On-Peak Power Prices ($/MWh) (6): | ||||||||||||
New York—Zone C | $ | 29.01 | $ | 26.74 | $ | 2.27 | ||||||
Mass Hub | $ | 33.97 | $ | 34.44 | $ | (0.47 | ) | |||||
Average natural gas price—Algonquin Citygates ($/MMBtu) (7) | $ | 3.19 | $ | 2.85 | $ | 0.34 | ||||||
(1) | Adjusted EBITDA includes the activity of the assets acquired in the ENGIE Acquisition for our period of ownership. Million Megawatt Hours Generated and Average Capacity Factor include such activity for the full month of February. IMA excludes such activity for our period of ownership in February. |
(2) | IMA is an internal measurement calculation that reflects the percentage of generation available during periods when market prices are such that these units could be profitably dispatched. The calculation excludes certain events outside of management control such as weather related issues. The calculation excludes our Brayton Point facility. |
(3) | Reflects actual production as a percentage of available capacity. The calculation excludes our Brayton Point facility. |
(4) | Reflects CDDs or HDDs for the ISO-NE Region based on NOAA data. |
76
(5) | Reflects the average of the on-peak spark spreads available to a 7.0 MMBtu/MWh heat rate generator selling power at day-ahead prices and buying delivered natural gas at a daily cash market price and does not reflect spark spreads available to us. |
(6) | Reflects the average of day-ahead settled prices for the periods presented and does not necessarily reflect prices we realized. |
(7) | Reflects the average of daily quoted prices for the periods presented and does not reflect costs incurred by us. |
Operating loss increased by $50 million primarily due to the following:
(in millions) | ||||
Income attributable to newly acquired plants in 2017 | $ | 27 | ||
Lower energy margin due to the following: | ||||
Lower spark spreads, net of hedges as a result of higher gas costs and milder weather | $ | (8 | ) | |
Lower generation volumes as a result of milder weather and the retirement of our Brayton Point facility | $ | (11 | ) | |
Higher capacity revenues as a result of higher pricing, offset by capacity lost due to the retirement of our Brayton Point facility | $ | 12 | ||
Change in MTM value of derivative transactions | $ | (52 | ) | |
Lower contract amortization | $ | 18 | ||
Lower depreciation primarily due to the retirement of our Brayton Point facility | $ | 37 | ||
Loss on sale of our Dighton and Milford-MA facilities | $ | (77 | ) | |
Adjusted EBITDA increased by $52 million primarily due to the following:
(in millions) | ||||
Contribution from newly acquired plants in 2017 | $ | 70 | ||
Lower energy margin due to the following: | ||||
Lower spark spreads, net of hedges as a result of higher gas costs and milder weather | $ | (24 | ) | |
Lower generation volumes as a result of milder weather and the retirement of our Brayton Point facility | $ | (12 | ) | |
Higher capacity revenues as a result of higher pricing, offset by capacity lost due to the retirement of our Brayton Point facility | $ | 12 | ||
77
ERCOT Segment
The ERCOT segment includes the results of operations since the ENGIE Acquisition Closing Date. The following table provides summary financial data regarding our ERCOT segment for the nine months ended September 30, 2017:
Nine Months Ended September 30, | Favorable (Unfavorable) $ Change | |||||||||||
(dollars in millions, except for price information) | 2017 | 2016 | ||||||||||
Operating revenues | ||||||||||||
Energy | $ | 305 | $ | — | N/A | |||||||
Mark-to-market income, net | 9 | — | N/A | |||||||||
Other | 7 | — | N/A | |||||||||
Total operating revenues | 321 | — | N/A | |||||||||
Operating costs | ||||||||||||
Cost of sales | (209 | ) | — | N/A | ||||||||
Total operating costs | (209 | ) | — | N/A | ||||||||
Gross margin | 112 | — | N/A | |||||||||
Operating and maintenance expense | (66 | ) | — | N/A | ||||||||
Depreciation expense | (54 | ) | — | N/A | ||||||||
Impairments | — | — | — | |||||||||
Operating loss | (8 | ) | — | N/A | ||||||||
Depreciation and amortization expense | 55 | — | N/A | |||||||||
EBITDA | 47 | — | N/A | |||||||||
Mark-to-market adjustments | (9 | ) | — | N/A | ||||||||
Adjusted EBITDA | $ | 38 | $ | — | N/A | |||||||
Million Megawatt Hours Generated (1) | 8.8 | — | N/A | |||||||||
IMA (1)(2): | ||||||||||||
Combined-Cycle Facilities | 89 | % | — | % | ||||||||
Coal-Fired Facility | 95 | % | — | % | ||||||||
Average Capacity Factor (1)(3): | ||||||||||||
Combined-Cycle Facilities | 30 | % | — | % | ||||||||
Coal-Fired Facility | 63 | % | — | % | ||||||||
CDDs (4) | 3,026 | 2,909 | 117 | |||||||||
HDDs (4) | 509 | 788 | (279 | ) | ||||||||
Average Market On-Peak Spark Spreads ($/MWh) (5): | ||||||||||||
ERCOT North | $ | 8.16 | $ | 10.60 | $ | (2.44 | ) | |||||
Average Market On-Peak Power Prices ($/MWh) (6): | ||||||||||||
ERCOT North | $ | 27.17 | $ | 25.72 | $ | 1.45 | ||||||
Average natural gas price—Waha Hub ($/MMBtu) (7) | $ | 2.72 | $ | 2.16 | $ | 0.56 | ||||||
__________________________________________
(1) | Million Megawatt Hours Generated and Average Capacity Factor include such activity for the full month of February. IMA excludes such activity for our period of ownership in February. |
(2) | IMA is an internal measurement calculation that reflects the percentage of generation available when market prices are such that these units could be profitably dispatched. The calculation excludes certain events outside of management control such as weather related issues. The calculation excludes CTs. |
(3) | Reflects actual production as a percentage of available capacity. The calculation excludes CTs. |
(4) | Reflects CDDs or HDDs for the ERCOT Region based on NOAA data. |
(5) | Reflects the average of the on-peak spark spreads available to a 7.0 MMBtu/MWh heat rate generator selling power at day-ahead prices and buying delivered natural gas at a daily cash market price and does not reflect spark spreads available to us. |
(6) | Reflects the average of day-ahead settled prices for the periods presented and does not necessarily reflect prices we realized. |
(7) | Reflects the average of daily quoted prices for the periods presented and does not reflect costs incurred by us. |
78
Operating loss of $8 million primarily consisted of the following:
(in millions) | ||||
Energy margin, net of hedges | $ | 103 | ||
MTM gain | $ | 9 | ||
O&M costs | $ | (66 | ) | |
Depreciation expense | $ | (54 | ) | |
Adjusted EBITDA was $38 million primarily related to the following:
(in millions) | ||||
Energy margin, net of hedges | $ | 103 | ||
O&M costs | $ | (65 | ) | |
MISO Segment
The following table provides summary financial data regarding our MISO segment results of operations for the nine months ended September 30, 2017 and 2016, respectively:
Nine Months Ended September 30, | Favorable (Unfavorable) $ Change | |||||||||||
(dollars in millions, except for price information) | 2017 | 2016 | ||||||||||
Operating revenues | ||||||||||||
Energy | $ | 246 | $ | 313 | $ | (67 | ) | |||||
Capacity | 27 | 20 | 7 | |||||||||
Mark-to-market income (loss), net | 18 | (33 | ) | 51 | ||||||||
Other | 1 | — | 1 | |||||||||
Total operating revenues | 292 | 300 | (8 | ) | ||||||||
Operating costs | ||||||||||||
Cost of sales | (175 | ) | (232 | ) | 57 | |||||||
Total operating costs | (175 | ) | (232 | ) | 57 | |||||||
Gross margin | 117 | 68 | 49 | |||||||||
Operating and maintenance expense | (86 | ) | (107 | ) | 21 | |||||||
Depreciation expense | (22 | ) | (19 | ) | (3 | ) | ||||||
Impairments | (99 | ) | (645 | ) | 546 | |||||||
Operating loss | (90 | ) | (703 | ) | 613 | |||||||
Depreciation and amortization expense | 34 | 23 | 11 | |||||||||
EBITDA | (56 | ) | (680 | ) | 624 | |||||||
Mark-to-market adjustments | (18 | ) | 33 | (51 | ) | |||||||
Impairments | 99 | 645 | (546 | ) | ||||||||
Other (1) | — | 21 | (21 | ) | ||||||||
Adjusted EBITDA | $ | 25 | $ | 19 | $ | 6 | ||||||
Million Megawatt Hours Generated | 8.8 | 11.2 | (2.4 | ) | ||||||||
IMA for Coal-Fired Facilities (2) | 90 | % | 89 | % | ||||||||
Average Capacity Factor for Coal-Fired Facilities (3) | 71 | % | 61 | % | ||||||||
CDDs (4) | 1,167 | 1,529 | (362 | ) | ||||||||
HDDs (4) | 2,610 | 3,006 | (396 | ) | ||||||||
Average Market On-Peak Power Prices ($/MWh) (5): | ||||||||||||
Indiana (Indy Hub) | $ | 34.91 | $ | 32.32 | $ | 2.59 | ||||||
Commonwealth Edison (NI Hub) | $ | 32.49 | $ | 31.54 | $ | 0.95 | ||||||
79
__________________________________________
(1) | Other includes an adjustment to exclude Wood River’s energy margin and O&M costs of $23 million for the nine months ended September 30, 2016. Adjusted EBITDA did not include this adjustment for the nine months ended September 30, 2017. |
(2) | IMA is an internal measurement calculation that reflects the percentage of generation available during periods when market prices are such that these units could be profitably dispatched. The calculation excludes certain events outside of management control such as weather related issues. |
(3) | Reflects actual production as a percentage of available capacity. |
(4) | Reflects CDDs or HDDs for the MISO Region based on NOAA data. |
(5) | Reflects the average of day-ahead settled prices for the periods presented and does not necessarily reflect prices we realized. |
Operating loss decreased by $613 million primarily due to the following:
(in millions) | ||||
Lower energy margin due to the following: | ||||
Lower dark spreads, net of hedges as a result of milder weather | $ | (13 | ) | |
Lower generation volumes as a result of shutdowns in 2016 | $ | (10 | ) | |
Change in fuel and transportation costs related to Wood River | $ | 14 | ||
Higher capacity revenues due to favorable pricing and volumes | $ | 7 | ||
Change in MTM value of derivative transactions | $ | 51 | ||
Lower O&M costs primarily due to shutdowns in 2016 | $ | 21 | ||
Higher depreciation expense | $ | (3 | ) | |
Lower impairment charges primarily due to our Baldwin facility in 2016 | $ | 546 | ||
Adjusted EBITDA increased by $6 million primarily due to the following:
(in millions) | ||||
Lower energy margin due to the following: | ||||
Lower dark spreads, net of hedges as a result of milder weather | $ | (15 | ) | |
Lower generation volumes as a result of shutdowns in 2016 | $ | (5 | ) | |
Higher capacity revenues due to favorable pricing and volumes | $ | 7 | ||
Lower O&M costs primarily due to shutdowns in 2016 | $ | 18 | ||
80
IPH Segment
The following table provides summary financial data regarding our IPH segment results of operations for the nine months ended September 30, 2017 and 2016, respectively:
Nine Months Ended September 30, | Favorable (Unfavorable) $ Change | |||||||||||
(dollars in millions, except for price information) | 2017 | 2016 | ||||||||||
Operating revenues | ||||||||||||
Energy | $ | 440 | $ | 482 | $ | (42 | ) | |||||
Capacity | 131 | 94 | 37 | |||||||||
Mark-to-market income, net | 2 | 3 | (1 | ) | ||||||||
Contract amortization | (5 | ) | (10 | ) | 5 | |||||||
Other | 4 | 5 | (1 | ) | ||||||||
Total operating revenues | 572 | 574 | (2 | ) | ||||||||
Operating costs | ||||||||||||
Cost of sales | (371 | ) | (360 | ) | (11 | ) | ||||||
Contract amortization | 6 | 18 | (12 | ) | ||||||||
Total operating costs | (365 | ) | (342 | ) | (23 | ) | ||||||
Gross margin | 207 | 232 | (25 | ) | ||||||||
Operating and maintenance expense | (133 | ) | (143 | ) | 10 | |||||||
Depreciation expense | (35 | ) | (21 | ) | (14 | ) | ||||||
Impairments | — | (148 | ) | 148 | ||||||||
Acquisition and integration costs | — | 8 | (8 | ) | ||||||||
Other | 1 | (15 | ) | 16 | ||||||||
Operating income (loss) | 40 | (87 | ) | 127 | ||||||||
Depreciation and amortization expense | 38 | 20 | 18 | |||||||||
Bankruptcy reorganization items | 494 | — | 494 | |||||||||
Other income and expense, net | 26 | 15 | 11 | |||||||||
EBITDA | 598 | (52 | ) | 650 | ||||||||
Adjustment to exclude noncontrolling interest | (1 | ) | — | (1 | ) | |||||||
Acquisition and integration costs | — | (8 | ) | 8 | ||||||||
Bankruptcy reorganization items | (494 | ) | — | (494 | ) | |||||||
Mark-to-market adjustments | (2 | ) | (3 | ) | 1 | |||||||
Impairments | — | 148 | (148 | ) | ||||||||
Gain on sale of assets, net | (1 | ) | — | (1 | ) | |||||||
Other | (1 | ) | (3 | ) | 2 | |||||||
Adjusted EBITDA | $ | 99 | $ | 82 | $ | 17 | ||||||
Million Megawatt Hours Generated | 12.6 | 11.6 | 1.0 | |||||||||
IMA (1) | 87 | % | 88 | % | ||||||||
Average Capacity Factor for IPH Facilities (2) | 57 | % | 45 | % | ||||||||
CDDs (3) | 1,167 | 1,529 | (362 | ) | ||||||||
HDDs (3) | 2,610 | 3,006 | (396 | ) | ||||||||
Average Market On-Peak Power Prices ($/MWh) (4): | ||||||||||||
Indiana (Indy Hub) | $ | 34.91 | $ | 32.32 | $ | 2.59 | ||||||
Commonwealth Edison (NI Hub) | $ | 32.49 | $ | 31.54 | $ | 0.95 | ||||||
________________________________________
(1) | IMA is an internal measurement calculation that reflects the percentage of generation available during periods when market prices are such that these units could be profitably dispatched. The calculation excludes certain events outside of management control such as weather related issues. The calculation excludes CTs. |
(2) | Reflects actual production as a percentage of available capacity. The calculation excludes CTs. |
(3) | Reflects CDDs or HDDs for the MISO Region based on NOAA data. |
(4) | Reflects the average of day-ahead settled prices for the periods presented and does not necessarily reflect prices we realized. |
81
Operating income increased by $127 million primarily due to the following:
(in millions) | ||||
Lower energy margin due to the following: | ||||
Lower dark spreads, net of hedges as a result of milder weather | $ | (12 | ) | |
Lower retail contribution as a result of milder weather | $ | (41 | ) | |
Higher capacity revenues due to favorable pricing and volumes | $ | 37 | ||
Change in MTM value of derivative transactions | $ | (1 | ) | |
Termination of an above market coal supply contract in 2016 | $ | 15 | ||
Lower O&M costs due to lower ARO accretion, property taxes, and outage costs | $ | 10 | ||
Higher depreciation and amortization | $ | (21 | ) | |
Absence of impairment charges due to our Newton facility in 2016 | $ | 148 | ||
Adjusted EBITDA increased by $17 million primarily due to the following:
(in millions) | ||||
Lower energy margin due to the following: | ||||
Lower dark spreads, net of hedges as a result of milder weather | $ | (12 | ) | |
Lower retail contribution as a result of milder weather | $ | (41 | ) | |
Higher capacity revenues due to favorable pricing and volumes | $ | 37 | ||
AER proceeds | $ | 25 | ||
Lower O&M costs due to lower property taxes, and outage costs | $ | 8 | ||
82
CAISO Segment
The following table provides summary financial data regarding our CAISO segment results of operations for the nine months ended September 30, 2017 and 2016, respectively:
Nine Months Ended September 30, | Favorable (Unfavorable) $ Change | |||||||||||
(dollars in millions, except for price information) | 2017 | 2016 | ||||||||||
Operating revenues | ||||||||||||
Energy | $ | 75 | $ | 62 | $ | 13 | ||||||
Capacity | 15 | 29 | (14 | ) | ||||||||
Mark-to-market income (loss), net | (3 | ) | 1 | (4 | ) | |||||||
Contract amortization | — | (7 | ) | 7 | ||||||||
Other | 2 | 20 | (18 | ) | ||||||||
Total operating revenues | 89 | 105 | (16 | ) | ||||||||
Operating costs | ||||||||||||
Cost of sales | (50 | ) | (51 | ) | 1 | |||||||
Total operating costs | (50 | ) | (51 | ) | 1 | |||||||
Gross margin | 39 | 54 | (15 | ) | ||||||||
Operating and maintenance expense | (32 | ) | (28 | ) | (4 | ) | ||||||
Depreciation expense | (40 | ) | (26 | ) | (14 | ) | ||||||
Operating loss | (33 | ) | — | (33 | ) | |||||||
Depreciation and amortization expense | 44 | 33 | 11 | |||||||||
Other income and expense, net | — | 12 | (12 | ) | ||||||||
EBITDA | 11 | 45 | (34 | ) | ||||||||
Mark-to-market adjustments | 3 | (1 | ) | 4 | ||||||||
Other | — | 1 | (1 | ) | ||||||||
Adjusted EBITDA | $ | 14 | $ | 45 | $ | (31 | ) | |||||
Million Megawatt Hours Generated | 1.5 | 2.0 | (0.5 | ) | ||||||||
IMA for Combined-Cycle Facilities (1) | 85 | % | 96 | % | ||||||||
Average Capacity Factor for Combined-Cycle Facilities (2) | 23 | % | 27 | % | ||||||||
CDDs (3) | 1,126 | 1,051 | 75 | |||||||||
HDDs (3) | 834 | 737 | 97 | |||||||||
Average Market On-Peak Spark Spreads ($/MWh) (4): | ||||||||||||
North of Path 15 (NP 15) | $ | 13.89 | $ | 12.32 | $ | 1.57 | ||||||
Average natural gas price—PG&E Citygate ($/MMBtu) (5) | $ | 3.29 | $ | 2.52 | $ | 0.77 | ||||||
__________________________________________
(1) | IMA is an internal measurement calculation that reflects the percentage of generation available when market prices are such that these units could be profitably dispatched. The calculation excludes certain events outside of management control such as weather related issues. The calculation excludes CTs. |
(2) | Reflects actual production as a percentage of available capacity. The calculation excludes CTs. |
(3) | Reflects CDDs or HDDs for the CAISO Region based on NOAA data. |
(4) | Reflects the average of the on-peak spark spreads available to a 7.0 MMBtu/MWh heat rate generator selling power at day-ahead prices and buying delivered natural gas at a daily cash market price and does not reflect spark spreads available to us. |
(5) | Reflects the average of daily quoted prices for the periods presented and does not reflect costs incurred by us. |
83
Operating loss increased by $33 million primarily due to the following:
(in millions) | ||||
Higher energy margin, net of hedges due to higher spark spreads as a result of warmer weather, offset by lower generation volumes for a portion of the year | $ | 13 | ||
Lower capacity revenues due to lower contracted volumes and prices | $ | (14 | ) | |
Lower tolling revenue due to expiration of tolling agreement | $ | (16 | ) | |
Change in MTM value of derivative transactions | $ | (4 | ) | |
Higher O&M costs due to higher ARO accretion | $ | (4 | ) | |
Higher depreciation and amortization | $ | (7 | ) | |
Adjusted EBITDA decreased by $31 million primarily due to the following:
(in millions) | ||||
Higher energy margin, net of hedges due to higher spark spreads as a result of warmer weather, offset by lower generation volumes for a portion of the year | $ | 13 | ||
Lower capacity revenues due to lower contracted volumes and prices | $ | (14 | ) | |
Lower tolling revenue due to expiration of tolling agreement | $ | (16 | ) | |
Supplier settlement in 2016 | $ | (12 | ) | |
Outlook
We expect that our future financial results will continue to be impacted by market structure and prices for electric energy, capacity, and ancillary services, including pricing at our plant locations relative to pricing at their respective trading hubs, the volatility of fuel and electricity prices, transportation and transmission logistics, weather conditions, and the availability of our plants. Further, there has been a historical trend toward greater environmental regulation of all aspects of our business. To the extent this trend continues, it is possible that we will experience additional costs related to water, air, and coal ash regulations.
Certain states (Illinois, New York and Connecticut) in our markets have passed legislation or orders whereby those states will subsidize or could subsidize certain nuclear energy producers. We believe these subsidies have and will continue to adversely affect the energy and capacity markets by artificially suppressing prices. As a result, we are currently a party to lawsuits in Illinois and New York challenging these subsidy programs. Other states including New Jersey, Pennsylvania, and Ohio are also considering similar nuclear subsidy programs. Please read Environmental and Regulatory Matters below for further discussion.
The portions of our generation volumes sold, coal requirements contracted, coal requirements priced, and coal transportation requirements contracted, by segment, are discussed below. We look to procure and price additional coal and coal transportation opportunistically. For our gas-fired fleet, we hedge price risk by selling forward spark spreads which involves purchasing the required amount of natural gas at the same time as we sell power. We expect to continue our hedging program for energy over a one- to three-year period using various instruments, including retail sales in our PJM, NY/NE, and IPH segments, and in accordance with our risk management policy.
Since 2013, we have increased scale and shifted our portfolio mix, which was predominately coal-based, to a predominately gas-based portfolio, through four major acquisitions. We used a significant portion of our balance sheet capacity to finance these acquisitions. We are now focused on strengthening our balance sheet, managing debt maturities and improving our leverage profile through debt reduction primarily from operating cash flows, PRIDE initiatives, and select asset sales.
Our Operating Segments
PJM Segment. The PJM segment is comprised of 19 power generation facilities located within the PJM region, with a total generating capacity of 11,008 MW. We have recently announced the planned retirements of our jointly owned Stuart and Killen facilities by mid-2018. Stuart Unit 1 (225 MW) was retired early on September 30, 2017. On July 11, 2017, we completed the Troy and Armstrong Sale (1,523 MW). On October 12, 2017, we completed the Lee Sale (787 MW).
In PJM, we have installed 326 MW of uprates since 2014. We are installing an additional 18 MW of uprates in the spring of 2018 primarily through upgrades to the hot gas path components of our combined-cycle gas turbines and one peaking facility.
84
PJM introduced its new Capacity Performance (“CP”) product beginning with the Planning Year 2016-2017 capacity auction. CP resources must be capable of sustainable, predictable operation that allows them to be available to provide energy and reserves during performance assessment hours throughout the Delivery Year. Beginning in Planning Year 2018-2019, PJM introduced the Base product, which, alongside CP, replaced the legacy capacity product. Base capacity resources are those capacity resources that are not capable of sustained, predictable operation throughout the entire delivery year, but are capable of providing energy and reserves during hot weather operations. They are subject to non-performance charges assessed during emergency conditions from June through September.
We use our retail business to hedge a portion of the energy output from our facilities. Our portfolio beyond 2018 is primarily open to benefit from possible future power market pricing improvements.
The following table reflects our hedging activities as of September 30, 2017:
2017 | 2018 | 2019 to 2021 | ||||
Generation volumes hedged | 87% | 71% | 12% | |||
Coal requirements contracted (1) | 100% | 93% | 33% | |||
Coal requirements priced (1) | 100% | 93% | 21% | |||
Coal transportation requirements contracted (1) | 100% | 100% | 100% | |||
__________________________________________
(1) | Excludes non-operated jointly-owned generating units. |
PJM Capacity Market. The most recent Reliability Pricing Model auction results, for the zones in which our assets are located, are as follows for each Planning Year:
2017-2018 | 2018-2019 | 2019-2020 | 2020-2021 | |||||||||||||||||||||||||
(price per MW-day) | Legacy Capacity | CP | Base | CP | Base | CP | CP | |||||||||||||||||||||
RTO zone (1) | $ | 120.00 | $ | 151.50 | $ | 149.98 | $ | 164.77 | $ | 80.00 | $ | 100.00 | $ | 88.32 | ||||||||||||||
MAAC zone | $ | 120.00 | $ | 151.50 | $ | 149.98 | $ | 164.77 | $ | 80.00 | $ | 100.00 | $ | 86.04 | ||||||||||||||
EMAAC zone | $ | 120.00 | $ | 151.50 | $ | 210.63 | $ | 225.42 | $ | 99.77 | $ | 119.77 | $ | 187.87 | ||||||||||||||
COMED zone | $ | 120.00 | $ | 151.50 | $ | 200.21 | $ | 215.00 | $ | 182.77 | $ | 202.77 | $ | 188.12 | ||||||||||||||
ATSI zone | $ | 120.00 | $ | 151.50 | $ | 149.98 | $ | 164.77 | $ | 80.00 | $ | 100.00 | $ | 76.53 | ||||||||||||||
PPL zone | $ | 120.00 | $ | 151.50 | $ | 75.00 | $ | 164.77 | $ | 80.00 | $ | 100.00 | $ | 86.04 | ||||||||||||||
__________________________________________
(1) | Planning Year 2020-2021 includes DEOK zone which broke out from RTO zone at $130.00 per MW-day. |
Our capacity sales, net of purchases, aggregated by Planning Year and capacity type through Planning Year 2020-2021, are as follows:
2017-2018 | 2018-2019 | 2019-2020 | 2020-2021 | |||||
Legacy/Base auction capacity sold, net (MW) | 2,871 | 1,910 | 1,413 | — | ||||
CP auction capacity sold, net (MW) | 6,666 | 7,142 | 7,500 | 7,862 | ||||
Bilateral capacity sold, net (MW) | 2 | 270 | 200 | 200 | ||||
Total segment capacity sold, net (MW) | 9,539 | 9,322 | 9,113 | 8,062 | ||||
Average price per MW-day | $143.63 | $181.86 | $130.79 | $130.14 | ||||
Our Kendall facility has one tolling agreement for 85 MW that expired in the third quarter of 2017.
NY/NE Segment. The NY/NE segment is comprised of 8 power generation facilities located within the ISO-NE (3,518 MW) and NYISO (1,212 MW) regions, totaling 4,730 MW of electric generating capacity.
In New England, at our Lake Road and Milford-Connecticut facilities, we cleared 70 MW of new uprates in FCA-10, at a capacity rate of $7.03 per kW-month for seven years beginning with Planning Year 2019-2020 and extending through Planning Year 2025-2026. For FCA-11, we cleared a total of 34 MW of uprates at Lake Road and Casco Bay that did not qualify for a seven-year rate lock. Dynegy has been awarded six municipal load contracts encompassing 76,100 accounts in the state of MA.
85
On February 2, 2017, FERC issued an order accepting the December 27, 2016 Compliance Filing of Atlas Power Finance, LLC, Dynegy, and ECP (collectively, “Applicants”), which proposed mitigation measures in response to market power concerns identified by FERC in its December 22, 2016 order conditionally authorizing the ENGIE Acquisition. In this order, FERC accepted, among other commitments, Applicants’ proposal to divest at least 224 MW in the Southeast New England capacity zone in ISO-NE, and Applicants’ commitment to execute agreements to sell the divested capacity by August 7, 2017. On September 22, 2017, we completed the sale of our Dighton and Milford-MA facilities (356 MW).
The following table reflects our hedging activities as of September 30, 2017:
2017 | 2018 | 2019 to 2021 | ||||
Generation volumes hedged (1) | 100% | 60% | 9% | |||
__________________________________________
(1) | Excludes volumes subject to tolling agreements. |
NYISO Capacity Market. We have approximately 1,212 MW of power generation in NYISO. The most recent seasonal auction results for NYISO's Rest-of-State zones, in which the capacity for our Independence plant clears, are as follows for each planning period:
Summer 2017 | Winter 2017-2018 | |||
Price per kW-month | $3.00 | $0.37 | ||
Due to the short-term, seasonal nature of the NYISO capacity auctions, we monetize the majority of Independence’s capacity through bilateral trades. Our capacity sales, aggregated by season through Summer 2020, are as follows:
Summer 2017 | Winter 2017-2018 | Summer 2018 | Winter 2018-2019 | Summer 2019 | Winter 2019-2020 | Summer 2020 | ||||||||
Auction capacity sold (MW) | 83 | — | — | — | — | — | — | |||||||
Bilateral capacity sold (MW) | 870 | 1,021 | 745 | 430 | 255 | 160 | 75 | |||||||
Total capacity sold (MW) | 953 | 1,021 | 745 | 430 | 255 | 160 | 75 | |||||||
Average price per kW-month | $3.36 | $2.08 | $3.34 | $2.75 | $3.39 | $2.94 | $3.15 | |||||||
ISO-NE Capacity Market. We have approximately 3,518 MW of power generation in ISO-NE. The most recent FCA results for ISO-NE Rest-of-Pool, in which most of our assets are located, are as follows for each Planning Year:
2016-2017 | 2017-2018 | 2018-2019 | 2019-2020 | 2020-2021 | ||||||
Price per kW-month | $3.15 | $7.03 | $9.55 | $7.03 | $5.30 | |||||
Performance incentive rules will go into effect for Planning Year 2018-2019, having the potential to increase capacity payments for those resources that are providing excess energy or reserves during a shortage event, while penalizing those that produce less than the required level. Dynegy continues to market and pursue longer term multi-year capacity transactions that extend past Planning Year 2020-2021.
Our capacity sales, aggregated by planning year through Planning Year 2020-2021, are as follows:
2017-2018 | 2018-2019 | 2019-2020 | 2020-2021 | |||||
Auction capacity sold (MW) | 3,129 | 3,167 | 3,203 | 3,229 | ||||
Bilateral capacity sold (MW) | 148 | 77 | 30 | — | ||||
Total capacity sold (MW) | 3,277 | 3,244 | 3,233 | 3,229 | ||||
Average price per kW-month | $6.97 | $9.99 | $7.02 | $5.39 | ||||
ERCOT Segment. The ERCOT segment is comprised of six power generation facilities located within the ERCOT region, with a total generating capacity of 4,529 MW.
86
The following table reflects our hedging activities as of September 30, 2017:
2017 | 2018 | 2019 to 2021 | ||||
Generation volumes hedged | 100% | 79% | 8% | |||
Coal requirements contracted | 100% | 100% | —% | |||
Coal requirements priced | 100% | 100% | —% | |||
Coal transportation requirements contracted | 100% | 100% | —% | |||
ERCOT Market. In addition to the energy and fuel hedges summarized in the table above we also hedge using the forward sale of ancillary services.
MISO and IPH Segments.
MISO Segment. The MISO segment is comprised of three power generation facilities located within the MISO region, with a total generating capacity of 1,913 MW. On June 9, 2016, Dynegy announced that Hennepin would receive firm transmission service for a majority of the facility into the PJM control area beginning with Planning Year 2017-2018. As of June 1, 2017, Hennepin began offering 260 MW of the facility’s energy and capacity into PJM as a block schedule. Hennepin’s remaining volume of approximately 34 MW will continue to be offered into MISO.
Dynegy’s portfolio beyond 2018 is primarily open to benefit from possible future power market pricing improvements. The following table reflects our hedging activities as of September 30, 2017:
2017 | 2018 | 2019 to 2021 | ||||
Generation volumes hedged | 77% | 64% | 6% | |||
Coal requirements contracted | 100% | 76% | 40% | |||
Coal requirements priced | 100% | 76% | —% | |||
Coal transportation requirements contracted | 100% | 98% | 96% | |||
IPH Segment. The IPH segment is comprised of five power generation facilities, totaling 3,563 MW and primarily operates in MISO. Joppa, which is within the Electric Energy, Inc. control area, is interconnected to Tennessee Valley Authority and Louisville Gas and Electric Company, but primarily sells its capacity and energy to MISO. We currently offer a portion of our IPH segment generating capacity and energy into PJM. As of June 1, 2016, our Coffeen, Duck Creek, E.D. Edwards, and Newton facilities have 937 MW, or 26 percent of IPH’s current capacity and energy, electrically tied into PJM through pseudo-tie arrangements. Additionally, IPH has secured firm transmission as of June 1, 2017 which will allow the Joppa facility to export 240 MW into PJM.
IPH will continue to use our retail business to hedge a portion of the output from our IPH facilities. The retail hedges are well correlated to our facilities due to the close proximity of the hedge and through participation in FTR markets.
The following table reflects our hedging activities as of September 30, 2017:
2017 | 2018 | 2019 to 2021 | ||||
Generation volumes hedged | 70% | 56% | 23% | |||
Coal requirements contracted | 100% | 47% | 27% | |||
Coal requirements priced | 91% | 43% | —% | |||
Coal transportation requirements contracted | 100% | 100% | 100% | |||
MISO Capacity Market. We have approximately 5,476 MW of power generation in MISO between our MISO and IPH segments. As noted above, we have secured transmission rights to deliver 1,437 MW into PJM. The capacity auction results for MISO Local Resource Zone 4, in which our assets are located, are as follows for each Planning Year:
2017-2018 | ||
Price per MW-day | $1.50 | |
87
Our MISO and IPH segments cleared no incremental volumes, in excess of our retail load obligations, in the MISO Planning Year 2017-2018 capacity auction. MISO capacity sales through Planning Year 2020-2021 are as follows:
2017-2018 | 2018-2019 | 2019-2020 | 2020-2021 | |||||
MISO Segment: | ||||||||
Bilateral capacity sold in MISO (MW) | 1,075 | 342 | 185 | 385 | ||||
Legacy/Base auction capacity sold in PJM (MW) | 207 | — | — | — | ||||
CP auction capacity sold in PJM (MW) | — | — | — | 38 | ||||
Total MISO segment capacity sold (MW) | 1,282 | 342 | 185 | 423 | ||||
Average price per kW-month | $2.97 | $2.69 | $2.60 | $3.03 | ||||
IPH Segment: | ||||||||
Bilateral capacity sold in MISO (MW) | 2,431 | 1,971 | 930 | 674 | ||||
Legacy/Base auction capacity sold in PJM (MW) | 365 | — | 260 | — | ||||
CP auction capacity sold in PJM (MW) | 472 | 835 | 356 | 406 | ||||
Total IPH segment capacity sold (MW) | 3,268 | 2,806 | 1,546 | 1,080 | ||||
Average price per kW-month | $4.32 | $4.85 | $3.95 | $4.12 | ||||
The results of the most recent MISO capacity auction further validate our strategy of right-sizing our MISO wholesale generation business to more closely match our retail business, export capacity, and wholesale origination effort. Despite a meaningful decline in the auction clearing price over the past two years, Dynegy has still been able to effectively monetize much of its available MISO capacity at attractive prices.
CAISO Segment. The CAISO segment is comprised of two power generation facilities located within the CAISO region, with a total generating capacity of 1,185 MW.
The following table reflects our hedging activities as of September 30, 2017:
2017 | 2018 | 2019 to 2021 | ||||
Generation volumes hedged | 65% | 86% | 10% | |||
CAISO Capacity Market. The CAISO capacity market is a bilateral market in which Load Serving Entities are required to procure sufficient resources to meet their peak load plus a 15 percent reserve margin. We transact with investor owned utilities, municipalities, community choice aggregators, retail providers, and other marketers through Request for Offers solicitations, broker markets, and directly with bilateral transactions for both the Standard and Flexible RA capacity.
Our capacity sales, aggregated by calendar year for 2017 through 2019 for Moss Landing, are as follows:
Remainder of 2017 | 2018 | 2019 | ||||
Bilateral capacity sold (Avg. MW) | 737 | 444 | 850 | |||
We have also sold seasonal capacity for Moss Landing opportunistically. Our Oakland facility operated under a reliability must run (“RMR”) contract with the CAISO for 2017 and was given notice of extension for 2018.
Environmental and Regulatory Matters
Please read Item 1. Business—Environmental Matters in our Form 10-K and Item 2. Management’s Discussion and Analysis of Financial Condition and Results of Operations-Outlook-Environmental and Regulatory Matters in our Form 10-Q for the period ended June 30, 2017 for a detailed discussion of our environmental and regulatory matters.
88
State-based Subsidies
On August 1, 2016, the New York Public Service Commission (“NY PSC”) promulgated an Order adopting a Clean Energy Standard. The Order includes a program whereby the State will subsidize certain nuclear energy producers in New York through “zero emissions credits” (“ZECs”), which load serving entities will be required to buy, with the cost passed on to retail ratepayers. In October 2016, a group of generators including Dynegy, and our trade association, the Electric Power Supply Association, filed a lawsuit in the Southern District of New York challenging the NY PSC’s ruling on constitutional grounds. On July 25, 2017, the court granted the motions of the Defendants and Exelon to dismiss the complaint. On August 25, 2017, we filed a notice of appeal of the July 25 Order to the United States Court of Appeals for the Second Circuit. We cannot predict the outcome of that litigation, but if left unchecked, we believe these subsidies have already and will continue to adversely affect the energy and capacity markets in NYISO by artificially suppressing prices.
In December 2016, Illinois passed legislation, the Future Energy Jobs Act (“FEJA”) amending the Illinois Power Agency Act (“IPAA”) to create a ZEC program for Illinois nuclear generators. The FEJA amendments to the IPAA became effective on June 1, 2017 and, unless enjoined or eliminated, the ZECs will result in an estimated $2.35 billion of payments over ten years to Exelon. In February 2017, a group of generators including Dynegy and our trade association, the Electric Power Supply Association, filed a lawsuit challenging the FEJA on constitutional grounds in the Northern District of Illinois, Eastern Division, followed by a Motion for Preliminary Injunction in March 2017. On July 14, 2017, the court granted the motions of Defendants and Exelon to dismiss the complaint and denied the motion for preliminary injunction. On July 17, 2017, we filed a notice of appeal of the July 14 Order to the United States Court of Appeals for the Seventh Circuit. We cannot predict the outcome of that litigation but, if left unchecked, we believe these subsidies have already and will continue to adversely affect the energy and capacity markets in PJM and MISO.
The Clean Water Act
Effluent Limitation Guidelines. In April 2017, the EPA granted petitions requesting reconsideration of the Effluent Limitations Guideline (“ELG”) final rule and administratively stayed the ELG rule’s compliance date deadlines pending ongoing judicial review of the rule. In August 2017, the EPA announced its decision to conduct a rulemaking to potentially revise the ELG Rule effluent limits that apply to bottom ash transport water and FGD wastewater. The EPA projects it will take approximately three years to propose and finalize a new rule addressing bottom ash transport water and FGD wastewater. In September 2017, the EPA issued a final rule postponing the earliest compliance dates in the ELG rule for bottom ash transport water and FGD wastewater by two years, from November 1, 2018 to November 1, 2020. The EPA did not extend the latest compliance date (i.e., December 31, 2023) in the ELG rule for bottom ash transport water and FGD wastewater. However, the EPA anticipates the reconsideration rulemaking will address the compliance dates in some fashion. The EPA’s final rule, which withdraws the administrative stay, did not postpone the compliance dates for fly ash transport water or flue gas mercury control wastewater. Environmental groups have challenged the postponement rulemaking.
Given the EPA’s decision to reconsider and potentially revise the bottom ash transport water and FGD wastewater provisions of the ELG rule, the rule postponing the ELG rule’s earliest compliance dates for those provisions, and the intertwined relationship of the ELG rule with the CCR rule, which is also being reconsidered by the EPA, as well as pending legal challenges concerning both rules, substantial uncertainty exists regarding our projected capital expenditures for ELG compliance, including the timing of such expenditures. As rulemaking developments, planning and work progress, we continue to review our estimates as well as timing of our capital expenditures. The following table presents the projected capital expenditures by period for ELG compliance as of September 30, 2017 assuming the majority of ELG compliance expenditures will be required to occur in the 2019-2023 timeframe:
(amounts in millions) | Less than 1 Year | 1 - 3 Years | 3 - 5 Years | More than 5 Years | Total | |||||||||||||||
ELG expenditures (1) | $ | — | $ | 52 | $ | 155 | $ | 38 | $ | 245 | ||||||||||
__________________________________________
(1) | Projections have not been adjusted to reflect the pending AES transaction. Please read Note 10—Joint Ownership of Generating Facilities for further discussion. |
Coal Combustion Residuals
EPA CCR Rule. In September 2017, the EPA granted petitions requesting reconsideration of the CCR rule and agreed to seek to hold in abeyance pending legal challenges to the rule. At this time the EPA has not decided the merits of any issue raised in the reconsideration petitions but, as part of the reconsideration process, if the EPA conducts a rulemaking to potentially revise any part of the CCR rule, the EPA will provide an opportunity for notice and public comment. The D.C. Circuit subsequently
89
rescheduled oral argument in the pending legal challenges to the rule until November 20, 2017 and ordered the parties to be prepared to address at oral argument whether abeyance, in whole or in part, is appropriate for the case.
Given the EPA’s decision to reconsider and potentially revise the CCR rule and the intertwined relationship of the CCR rule with ELG rule, which is also being reconsidered by the EPA, substantial uncertainty exists regarding our projected compliance costs with the CCR rule, including the timing of such expenditures. At this time, assuming no significant changes to the CCR rule, we estimate the cost of our compliance with the CCR rule will be approximately $312 million with the majority of the expenditures in the 2017-2023 timeframe. This estimate is reflected in our AROs.
Coal Combustion Residuals/Groundwater. Please read Note 13—Commitments and Contingencies, Other Contingencies, Coal Combustion Residuals/Groundwater, for further discussion.
The Clean Air Act
Texas Regional Haze FIP. In September 2017, the EPA issued a final rule Best Available Retrofit Technology (“BART”) federal implementation plan (“FIP”) for Electric Generating Units (“EGUs”) in Texas. In contrast to the EPA’s January 2017 proposed rule, which would have imposed EGU-specific sulfur dioxide (“SO2”) emission limits based on installation of FGDs at certain EGUs, including our Coleto Creek facility, the final rule FIP establishes an SO2 emissions intrastate trading program for affected Texas EGUs. The FIP’s intrastate SO2 trading program will begin in 2019. The EPA final rule also approves Texas’ participation in the Cross-State Air Pollution Rule (“CSAPR”) ozone season nitrogen oxide (“NOx”) trading program as BART for NOx and Texas’ determination that EGUs in the State are not subject to BART for particulate matter (“PM”), and determines that the BART FIP is sufficient to address CAA interstate visibility transport requirements for six relevant 1997 ozone National Ambient Air Quality Standards (“NAAQS”). The EPA’s final rule does not fully resolve the Agency’s obligations as a result of the Fifth Circuit’s remand of the EPA’s December 2016 regional haze reasonable progress FIP, which the EPA intends to address in future action. Various groups have filed a legal challenge to the EPA’s final rule BART FIP. In a separate final rule issued in September 2017, the EPA withdrew FIP revisions requiring EGUs in Texas to participate in the CSAPR Phase 2 for annual SO2 and NOx, determined that Texas sources do not contribute significantly to nonattainment in, or interfere with maintenance by, other states regarding the PM NAAQS, and affirmed that participation in CSAPR meets BART.
Based on the BART FIP’s annual SO2 allowance allocation for Coleto Creek and anticipated liquidity in the Texas intrastate SO2 trading program, we do not believe the BART FIP will cause any material financial, operational or cash flow issues for our Coleto Creek facility. Texas is expected to replace the BART FIP with a future state implementation plan submission that follows the approach described in an August 2017 memorandum of agreement between Texas and the EPA to address interstate viability transport requirements and BART requirements for EGUs with a BART alternative trading program based on CSAPR.
Illinois MPS. In October 2017, the Illinois EPA filed a proposed rule with the Illinois Pollution Control Board that would amend the Illinois Multi-Pollutant Standards (“MPS”) rule by replacing the two separate group-wide annual emission rate limits that currently apply to our eight downstate Illinois coal-fired stations with tonnage limits for both SO2 (annual) and NOx (annual and seasonal) that apply to the eight stations as a single group. Allowed annual emissions would be lower than under the current MPS rule, including a 20 percent reduction in SO2 emissions. All other federal and state air quality regulations, including health-based standards, would remain unchanged and in place. The proposed rule also would impose new requirements to ensure the continuous operation of existing selective catalytic reduction (“SCR”) control systems during the ozone season, require SCR-controlled units to meet an ozone season NOx emission rate limit, and set an additional, site-specific annual SO2 limit for our Joppa Power Station. The proposed rule, if approved, would provide operating flexibility to meet changing electricity market conditions without imposing a material adverse impact on our future financial results.
NAAQS. In fall 2017, Maryland and several environmental groups filed lawsuits against the EPA seeking to compel the Agency to act on the State’s November 2016 petition under CAA section 126 alleging that additional NOx emission control requirements were needed on 36 EGUs in five upwind states, including our co-owned Zimmer facility. While we cannot predict the outcome of the judicial or petition proceedings, given that the Zimmer facility utilizes SCR technology to control NOx emissions, we do not believe that the result of these proceedings will cause a material adverse impact on our future financial results.
90
Climate Change
Clean Power Plan. In October 2017, the EPA issued a proposed rule to repeal the Clean Power Plan. Based on its review of the Clean Power Plan in accordance with Executive Order 13783, the EPA has concluded the Clean Power Plan exceeds the Agency’s authority under the CAA. The EPA has not determined whether it will promulgate a rule under CAA section 111(d) to regulate greenhouse gas (“GHG”) emissions from existing EGUs, and, if it will do so, when it will do so and what form that rule will take. The EPA is considering whether it is appropriate to propose such a rule and intends to issue an advance notice of proposed rulemaking in the near future.
In June 2017, the President of the United States announced that the United States would withdraw from the Paris Climate Accord.
Massachusetts. In August 2017, the Massachusetts Department of Environmental Protection (“MassDEP”) adopted final rules establishing an annual declining limit on aggregate carbon dioxide (“CO2”) emissions from 21 in-state fossil-fuel fired electric generating facilities. The rules establish an allowance trading system under which the annual aggregate EGU sector cap on CO2 emissions declines from 8.96 million metric tons in 2018 to 1.8 million metric tons in 2050. MassDEP will allocate emission allowances to affected facilities for 2018. Beginning in 2019, allowances will be distributed through a competitive auction process. Limited banking of unused allowances is allowed. The New England Power Generators Association, in which Dynegy is a member, and other generators have filed complaints in Massachusetts superior court challenging the rules.
Based on current projections of operations for our Massachusetts generating facilities in 2018, we anticipate that allocated allowances will cover CO2 emissions. We expect the rules will have little or no near-term impact on the financial results of our generating facilities in Massachusetts. However, if upheld, the rules would have an adverse impact on the long-term future of these facilities.
RGGI. In August 2017, the RGGI states proposed changes to the CO2 budget trading program, including an additional 30 percent reduction in the CO2 annual cap by the year 2030, relative to 2020 levels. The RGGI cap on CO2 emissions would decline by 2.275 million tons per year beginning in 2021.
California. In July 2017, California extended its GHG cap-and-trade program through 2030.
91
RISK MANAGEMENT DISCLOSURES
The following table provides a reconciliation of the risk management data contained within our unaudited consolidated balance sheets on a net basis:
(amounts in millions) | As of and for the Nine Months Ended September 30, 2017 | |||
Fair value of portfolio at December 31, 2016 | $ | 6 | ||
Risk management gains recognized through the statement of operations in the period, net | 35 | |||
Contracts realized or otherwise settled during the period | 3 | |||
Acquired derivatives | 9 | |||
Change in collateral/margin netting | (32 | ) | ||
Fair value of portfolio at September 30, 2017 | $ | 21 | ||
The net risk management asset of $21 million is the aggregate of the following line items in our unaudited consolidated balance sheets: Current Assets—Assets from risk management activities, Other Assets—Assets from risk management activities, Current Liabilities—Liabilities from risk management activities, and Other Liabilities—Liabilities from risk management activities.
Risk Management Asset and Liability Disclosures. The following table provides an assessment of net contract values by year as of September 30, 2017, based on our valuation methodology:
Net Fair Value of Risk Management Portfolio
(amounts in millions) | Total | 2017 | 2018 | 2019 | 2020 | 2021 | Thereafter | |||||||||||||||||||||
Market quotations (1)(2) | $ | (3 | ) | $ | 4 | $ | (11 | ) | $ | (7 | ) | $ | — | $ | 2 | $ | 9 | |||||||||||
Prices based on models (2) | 2 | (2 | ) | (2 | ) | 3 | 3 | — | — | |||||||||||||||||||
Total (3) | $ | (1 | ) | $ | 2 | $ | (13 | ) | $ | (4 | ) | $ | 3 | $ | 2 | $ | 9 | |||||||||||
__________________________________________
(1) Prices obtained from actively traded, liquid markets for commodities.
(2) The market quotations category represents our transactions classified as Level 1 and Level 2. The prices based on models category represents transactions classified as Level 3. Please read Note 5—Risk Management Activities, Derivatives and Financial Instruments for further discussion.
(3) | Excludes $22 million of broker margin that has been netted against Risk management liabilities in our unaudited consolidated balance sheets. Please read Note 5—Risk Management Activities, Derivatives and Financial Instruments for further discussion. |
UNCERTAINTY OF FORWARD-LOOKING STATEMENTS AND INFORMATION
This Form 10-Q includes statements reflecting assumptions, expectations, projections, intentions, or beliefs about future events that are intended as “forward-looking statements.” All statements included or incorporated by reference in this quarterly report, other than statements of historical fact, that address activities, events, or developments that we expect, believe, or anticipate will or may occur in the future are forward-looking statements. These statements represent our reasonable judgment of the future based on various factors and using numerous assumptions and are subject to known and unknown risks, uncertainties, and other factors that could cause our actual results and financial position to differ materially from those contemplated by the statements. You can identify these statements by the fact that they do not relate strictly to historical or current facts. They use words such as “anticipate,” “estimate,” “project,” “forecast,” “plan,” “may,” “will,” “should,” “expect,” and other words of similar meaning. In particular, these include, but are not limited to, statements relating to the following:
• | expectations regarding the Merger, including beliefs concerning stockholder and regulatory approvals; |
• | the occurrence of any event that could give rise to the termination of the Merger Agreement, including a termination of the Merger Agreement under circumstances that could require us to pay a termination fee; |
• | beliefs and assumptions about weather and general economic conditions; |
• | beliefs, assumptions, and projections regarding the demand for power, generation volumes, and commodity pricing, including natural gas prices and the timing of a recovery in power market prices, if any; |
92
• | beliefs and assumptions about market competition, generation capacity, and regional supply and demand characteristics of the wholesale and retail power markets, including the anticipation of plant retirements and higher market pricing over the longer term; |
• | sufficiency of, access to, and costs associated with coal, fuel oil, and natural gas inventories and transportation thereof; |
• | the effects of, or changes to the power and capacity procurement processes in the markets in which we operate; |
• | expectations regarding, or impacts of, environmental matters, including costs of compliance, availability and adequacy of emission credits, and the impact of ongoing proceedings and potential regulations or changes to current regulations, including those relating to climate change, air emissions, cooling water intake structures, coal combustion byproducts, and other laws and regulations that we are, or could become, subject to, which could increase our costs, result in an impairment of our assets, cause us to limit or terminate the operation of certain of our facilities, or otherwise have a negative financial effect; |
• | beliefs about the outcome of legal, administrative, legislative, and regulatory matters, including any impacts from the change in administration to these matters; |
• | projected operating or financial results, including anticipated cash flows from operations, revenues, and profitability; |
• | our focus on safety and our ability to operate our assets efficiently so as to capture revenue generating opportunities and operating margins; |
• | our ability to mitigate forced outage risk, including managing risk associated with CP in PJM and performance incentives in ISO-NE; |
• | our ability to optimize our assets through targeted investment in cost effective technology enhancements; |
• | the effectiveness of our strategies to capture opportunities presented by changes in commodity prices and to manage our exposure to energy price volatility; |
• | efforts to secure retail sales and the ability to grow the retail business; |
• | efforts to identify opportunities to reduce congestion and improve busbar power prices; |
• | ability to mitigate impacts associated with expiring RMR and/or capacity contracts; |
• | expectations regarding our compliance with the Credit Agreement, including collateral demands, interest expense, any applicable financial ratios, and other payments; |
• | expectations regarding performance standards and capital and maintenance expenditures; |
• | the timing and anticipated benefits to be achieved through our company-wide improvement programs; |
• | expectations regarding strengthening the balance sheet, managing debt maturities and improving Dynegy’s leverage profile; |
• | expectations, timing and benefits of the AES transaction; |
• | efforts to divest assets and the associated timing of such divestitures, and anticipated use of proceeds from such divestitures; |
• | anticipated timing, outcome, and impact of expected retirements; |
• | beliefs about the costs and scope of the ongoing demolition and site remediation efforts; and |
• | expectations regarding the synergies and anticipated benefits resulting from the ENGIE Acquisition. |
Any or all of our forward-looking statements may turn out to be wrong. They can be affected by inaccurate assumptions or by known or unknown risks, uncertainties, and other factors, many of which are beyond our control, including those set forth herein and under Item 1A—Risk Factors of our Form 10-K.
CRITICAL ACCOUNTING POLICIES
Please read “Critical Accounting Policies” in our Form 10-K for a complete description of our critical accounting policies, with respect to which there have been no material changes since the filing of such Form 10-K.
Item 3—QUANTITATIVE AND QUALITATIVE DISCLOSURES ABOUT MARKET RISK
Please read Item 7A. Quantitative and Qualitative Disclosures About Market Risk in our Form 10-K for a discussion of our exposure to commodity price variability and other market risks related to our net non-trading derivative assets and liabilities. The following is a discussion of the more material of these risks and our relative exposures as of September 30, 2017.
Value at Risk (“VaR”). The following table sets forth the aggregate daily VaR of the mark-to-market portion of our risk-management portfolio primarily associated with the PJM, NY/NE, ERCOT, MISO, and CAISO segments. The VaR calculation does not include market risks associated with the accrual portion of the risk-management portfolio that is designated as “normal purchase, normal sale,” nor does it include expected future production from our generating assets. Please read “VaR” in our Form 10-K for a complete description of our valuation methodology. The daily VaR at September 30, 2017 compared to December 31, 2016 was lower due to a decrease in estimated volatility and price levels.
Daily and Average VaR for Risk Management Portfolios
(amounts in millions) | September 30, 2017 | December 31, 2016 | ||||||
One day VaR—95 percent confidence level | $ | 9 | $ | 38 | ||||
One day VaR—99 percent confidence level | $ | 12 | $ | 53 | ||||
Average VaR—95 percent confidence level for the rolling twelve months ended | $ | 16 | $ | 14 | ||||
93
Credit Risk. The following table represents our credit exposure at September 30, 2017 associated with the mark-to-market portion of our risk management portfolio, on a net basis.
Credit Exposure Summary
(amounts in millions) | Investment Grade Quality | Non-Investment Grade Quality | Total | |||||||||
Type of Business: | ||||||||||||
Financial institutions | $ | 42 | $ | 1 | $ | 43 | ||||||
Oil and gas producers | 8 | — | 8 | |||||||||
Utility and power generators | 14 | — | 14 | |||||||||
Commercial/industrial/end users | 1 | — | 1 | |||||||||
Total | $ | 65 | $ | 1 | $ | 66 | ||||||
Interest Rate Risk
We are exposed to fluctuating interest rates related to our variable rate debt obligations outstanding under our Credit Agreement. We have entered into interest rate swaps to mitigate volatility in our variable rate indices, generally LIBOR, which results in a partially fixed interest rate. Our interest rate hedging instruments are recorded at their fair value, with changes in mark-to-market reflected in earnings. An increase in LIBOR by 25 basis points would result in a $0.1 million increase in our annual interest expense on the unhedged portion of our indebtedness.
The absolute notional amounts associated with our interest rate contracts were as follows at September 30, 2017 and December 31, 2016, respectively:
September 30, 2017 | December 31, 2016 | |||||||
Interest rate swaps (in millions of U.S. dollars) | $ | 1,963 | $ | 769 | ||||
Fixed interest rate paid (percent) | 2.38 | % | 3.19 | % | ||||
Item 4—CONTROLS AND PROCEDURES
Evaluation of Disclosure Controls and Procedures
As of the end of the period covered by this report, an evaluation was carried out under the supervision and with the participation of our management, including our Chief Executive Officer (“CEO”) and our Chief Financial Officer (“CFO”), of the effectiveness of the design and operation of our disclosure controls and procedures (as defined in Rules 13a-15(e) and 15d-15(e) under the Securities Exchange Act of 1934, as amended). This evaluation included consideration of the various processes carried out under the direction of our disclosure committee. This evaluation also considered the work completed relating to our compliance with Section 404 of the Sarbanes-Oxley Act of 2002. Based on this evaluation, our CEO and CFO concluded that our disclosure controls and procedures were effective as of September 30, 2017.
Changes in Internal Controls over Financial Reporting
There were no changes in our internal control over financial reporting that have materially affected or are reasonably likely to materially affect our internal control over financial reporting during the quarter ended September 30, 2017.
94
PART II. OTHER INFORMATION
Item 1—LEGAL PROCEEDINGS
Please read Note 13—Commitments and Contingencies—Legal Proceedings to the accompanying unaudited consolidated financial statements for a discussion of the legal proceedings that we believe could be material to us.
Item 1A—RISK FACTORS
Please also read Item 1A—Risk Factors of our Form 10-K for factors, risks, and uncertainties that may affect future results.
Risks related to the proposed Merger with Vistra Energy Corporation.
On October 30, 2017, we announced the execution of the Merger Agreement with Vistra Energy.
Before the Merger may be completed, both Dynegy and Vistra Energy will need to obtain stockholder approval in connection with the proposed transaction. In addition, various filings must be made with FERC and various regulatory, antitrust and other authorities in the United States. These governmental authorities may impose conditions on the completion, or require changes to the terms, of the Merger, including restrictions or conditions on the business, operations or financial performance of the combined company following completion of the Merger. These conditions or changes, including potential litigation brought in connection with the proposed merger, could have the effect of delaying completion of the Merger or imposing additional costs on or limiting the revenues of the combined company following the Merger, which could have a material adverse effect on the financial condition, results of operations and cash flows of the combined company and/or cause either Dynegy or Vistra Energy to abandon the Merger.
If we are unable to complete the Merger, we still will incur and will remain liable for significant transaction costs, including legal, accounting, filing, printing and other costs relating to the Merger. Also, depending upon the reasons for not completing the Merger, we may be required to pay Vistra Energy a termination fee of $87 million.
If completed, the Merger may not achieve its intended results.
We entered into the Merger Agreement with the expectation that the Merger would result in various benefits, including, among other things, cost savings and operating efficiencies. Achieving the anticipated benefits of the Merger is subject to a number of uncertainties, including whether the businesses of Dynegy and Vistra Energy are integrated in an efficient and effective manner. Failure to achieve these anticipated benefits could result in increased costs, decreases in the amount of expected revenues generated by the combined company and diversion of management’s time and energy and could have an adverse effect on the combined company’s business, financial results and prospects.
We will be subject to business uncertainties and contractual restrictions while the Merger is pending that could adversely affect our financial results.
Uncertainty about the effect of the Merger with Vistra Energy on employees, customers and suppliers may have an adverse effect on our business. Although we intend to take steps designed to reduce any adverse effects, these uncertainties may impair our ability to attract, retain and motivate key personnel until the Merger is completed and for a period of time thereafter, and could cause customers, suppliers and others that deal with us to seek to change existing business relationships.
Employee retention and recruitment may be particularly challenging prior to the completion of the Merger, as employees and prospective employees may experience uncertainty about their future roles with the combined company. If, despite our retention and recruiting efforts, key employees depart or prospective employees fail to accept employment with us because of issues relating to the uncertainty and difficulty of integration or a desire not to remain with the combined company, our financial results could be affected.
The pursuit of the Merger and the preparation for the integration of Dynegy and Vistra Energy may place a significant burden on management and internal resources. The diversion of management attention away from ongoing business concerns and any difficulties encountered in the transition and integration process could affect our business, and our financial condition, results of operations and cash flows.
In addition, we are restricted under the Merger Agreement, without Vistra Energy’s consent, from making certain acquisitions and taking other specified actions until the Merger occurs or the Merger Agreement terminates. These restrictions may prevent us from pursuing otherwise attractive business opportunities and making other changes to our business prior to completion of the Merger or termination of the Merger Agreement.
95
Because the market price of shares of Vistra Energy and Dynegy common stock will fluctuate and the exchange ratio is fixed, the market value of the Merger consideration at the date of the closing may vary significantly from the date the Merger Agreement was executed.
Upon completion of the Merger, each outstanding share of Dynegy common stock will be converted into the right to receive 0.652 of a share of Vistra Energy common stock. The number of shares of Vistra Energy common stock to be issued pursuant to the Merger Agreement for each share of Dynegy common stock is fixed and will not change to reflect changes in the market price of Vistra Energy common stock or Dynegy common stock. The market prices of Vistra Energy common stock or Dynegy common stock at the time of completion of the Merger may vary significantly from the market prices of Vistra Energy common stock on the date the Merger agreement was executed.
In addition, the Merger might not be completed until a significant period of time has passed after the respective stockholder meetings. Because the exchange ratio is fixed, the market value of the Vistra Energy common stock issued in connection with the Merger and the Dynegy common stock surrendered in connection with the Merger may be higher or lower than the values of those shares on earlier dates. Stock price changes may result from market assessment of the likelihood that the Merger will be completed, changes in the business, operations or prospects of Vistra Energy or Dynegy prior to or following the Merger, litigation or regulatory considerations, general business, market, industry or economic conditions and other factors both within and beyond the control of Vistra Energy and Dynegy. Neither Vistra Energy nor Dynegy is permitted to terminate the Merger Agreement solely because of changes in the market price of either company’s common stock.
The Merger Agreement contains provisions that limit Dynegy’s ability to pursue alternatives to the Merger, could discourage a potential competing acquirer of Dynegy from making a favorable alternative transaction proposal and, in certain circumstances, could require Dynegy to pay a termination fee to Vistra Energy.
Under the Merger Agreement, Dynegy is restricted from entering into alternative transactions. Unless and until the Merger Agreement is terminated, subject to specified exceptions, Dynegy is restricted from soliciting, initiating or knowingly encouraging, inducing or facilitating, or participating in any discussions or negotiations with any person regarding, or cooperating in any way with any person with respect to, any alternative proposal or any inquiry or proposal that would reasonably be expected to lead to an alternative proposal. While Dynegy’s Board of Directors is permitted to change its recommendation to stockholders prior to the special meeting under certain circumstances, namely if Dynegy is in receipt of a superior proposal or an intervening event has occurred, before Dynegy’s Board of Directors changes its recommendation to stockholders in such circumstances, Dynegy must, if requested by Vistra Energy, negotiate with Vistra Energy regarding potential amendments to the Merger Agreement. Dynegy may terminate the Merger Agreement and enter into an agreement with respect to a superior proposal only if specified conditions have been satisfied, including compliance with the provisions of the Merger Agreement restricting solicitation of alternative proposals and requiring payment of a termination fee in certain circumstances. These provisions could discourage a third party that may have an interest in acquiring all or a significant part of Dynegy from considering or proposing such an acquisition, even if such third party were prepared to pay consideration with a higher per share cash or market value than the market value proposed to be received or realized in the merger, or could result in a potential competing acquirer proposing to pay a lower price than it would otherwise have proposed to pay because of the added expense of the termination fee that may become payable in certain circumstances. As a result of these restrictions, Dynegy may not be able to enter into an agreement with respect to a more favorable alternative transaction without incurring potentially significant liability to the other.
If the Merger Agreement is terminated because Dynegy’s Board of Directors changes its recommendation to stockholders or Dynegy enters into a definitive agreement for a superior proposal, Dynegy will be required to pay Vistra Energy a termination fee of $87 million. If such a termination fee is payable, the payment of this fee could have a material adverse effect on the financial condition, results of operations and cash flows of Dynegy.
Current Dynegy stockholders will have a reduced ownership and voting interest after the Merger and will exercise less influence over management of the combined company.
Upon completion of the Merger, Dynegy stockholders will own approximately 21% of the combined company. Dynegy stockholders currently have the right to vote for Dynegy’s Board of Directors and on other matters affecting Dynegy. When the Merger occurs, each Dynegy stockholder will receive 0.652 shares of Vistra Energy common stock per share of Dynegy common stock, with a percentage ownership of the combined company that is significantly smaller than the stockholders’ percentage ownership of Dynegy prior to the Merger. As a result of these reduced ownership percentages, current Dynegy stockholders will have less influence on the management and policies of the combined company than they now have with respect to Dynegy.
96
Item 4—MINE SAFETY DISCLOSURES
Not applicable.
Item 6—EXHIBITS
The following documents are included as exhibits to this Form 10-Q:
Exhibit Number | Description | ||
2.1 | Agreement and Plan of Merger, dated as of October 29, 2017, by and between Dynegy Inc. and Vistra Energy Corp.* (incorporated by reference to Exhibit 2.1 to the Current Report on Form 8-K of Dynegy Inc. filed on October 30, 2017 File No. 001-33443). | ||
4.1 | Indenture, dated August 21, 2017, by and among Dynegy Inc., the Guarantors and Wilmington Trust, National Association, as trustee (incorporated by reference to Exhibit 4.1 to the Current Report on Form 8-K of Dynegy Inc. filed on August 21, 2017 File No. 001-33443). | ||
4.2 | Registration Rights Agreement, dated August 21, 2017, by and among Dynegy Inc., the Guarantors and Goldman Sachs & Co. LLC (incorporated by reference to Exhibit 4.2 to the Current Report on Form 8-K of Dynegy Inc. filed on August 21, 2017 File No. 001-33443). | ||
10.1 | Amendment No. 1 to the Investor Rights Agreement by and between Dynegy Inc. and Terawatt Holdings, LP (incorporated by reference to Exhibit 10.1 to the Current Report on Form 8-K of Dynegy Inc. filed on September 6, 2017 File No. 001-33443). | ||
10.2 | Merger Support Agreement, dated as of October 29, 2017, by and between Dynegy Inc. and Stockholders of Vistra Energy Corp. Party Thereto (incorporated by reference to Exhibit 10.1 to the Current Report on Form 8-K of Dynegy Inc. filed on October 30, 2017 File No. 001-33443). | ||
10.3 | First Amendment to Amended and Restated Employment Agreement, dated as of October 29, 2017, by and between Dynegy Operating Company and Robert Flexon (incorporated by reference to Exhibit 10.2 to the Current Report on Form 8-K of Dynegy Inc. filed on October 30, 2017 File No. 001-33443). | ||
**31.1 | |||
**31.2 | |||
†32.1 | |||
†32.2 | |||
**101.INS | XBRL Instance Document | ||
**101.SCH | XBRL Taxonomy Extension Schema Document | ||
**101.CAL | XBRL Taxonomy Extension Calculation Linkbase Document | ||
**101.DEF | XBRL Taxonomy Extension Definition Linkbase Document | ||
**101.LAB | XBRL Taxonomy Extension Label Linkbase Document | ||
**101.PRE | XBRL Taxonomy Extension Presentation Linkbase Document | ||
__________________________________________
** | Filed herewith. |
* | Schedules and exhibits have been omitted pursuant to Item 601(b)(2) of Regulation S-K. Dynegy will furnish the omitted schedules and exhibits to the Securities and Exchange Commission upon request by the Commission. |
† | Pursuant to Securities and Exchange Commission Release No. 33-8238, this certification will be treated as “accompanying” this report and not “filed” as part of such report for purposes of Section 18 of the Securities Exchange Act of 1934, as amended, or the Exchange Act, or otherwise subject to the liability of Section 18 of the Exchange Act, and this certification will not be deemed to be incorporated by reference into any filing under the Securities Act of 1933, as amended, or the Exchange Act. |
97
DYNEGY INC.
SIGNATURE
Pursuant to the requirements of Section 13 or 15(d) of the Securities Exchange Act of 1934, the registrant has duly caused this report to be signed on its behalf by the undersigned thereunto duly authorized.
DYNEGY INC. | |||
Date: | November 1, 2017 | By: | /s/ CLINT C. FREELAND |
Clint C. Freeland Executive Vice President and Chief Financial Officer | |||
98