Attached files
| file | filename |
|---|---|
| EX-99.2 - EXHIBIT 99.2 - SEACOAST BANKING CORP OF FLORIDA | tv478034_ex99-2.htm |
| EX-99.1 - EXHIBIT 99.1 - SEACOAST BANKING CORP OF FLORIDA | tv478034_ex99-1.htm |
| 8-K - FORM 8-K - SEACOAST BANKING CORP OF FLORIDA | tv478034_8k.htm |
Exhibit 99.3

Q3 - 2017 Earnings Presentation Contact: (email) Chuck.Shaffer@SeacoastBank.com (phone) 772.221.7003 (web) www.SeacoastBanking.com
This presentation contains “forward - looking statements” within the meaning of Section 27 A of the Securities Act of 1933 and Section 21 E of the Securities Exchange Act of 1934 , including, without limitation, statements about future financial and operating results, ability to realized deferred tax assets, cost savings, enhanced revenues, economic and seasonal conditions in our markets, and improvements to reported earnings that may be realized from cost controls and for integration of banks that we have acquired, as well as statements with respect to Seacoast’s objectives, expectations and intentions and other statements that are not historical facts . Actual results may differ from those set forth in the forward - looking statements . Forward - looking statements include statements with respect to our beliefs, plans, objectives, goals, expectations, anticipations, estimates and intentions, and involve known and unknown risks, uncertainties and other factors, which may be beyond our control, and which may cause the actual results, performance or achievements of Seacoast to be materially different from future results, performance or achievements expressed or implied by such forward - looking statements . You should not expect us to update any forward - looking statements . You can identify these forward - looking statements through our use of words such as “may,” “will,” “anticipate,” “assume,” “should,” “support”, “indicate,” “would,” “believe,” “contemplate,” “expect,” “estimate,” “continue,” “further”, “point to,” “project,” “could,” “intend” or other similar words and expressions of the future . These forward - looking statements may not be realized due to a variety of factors, including, without limitation : the effects of future economic and market conditions, including seasonality ; governmental monetary and fiscal policies, as well as legislative, tax and regulatory changes ; changes in accounting policies, rules and practices ; the risks of changes in interest rates on the level and composition of deposits, loan demand, liquidity and the values of loan collateral, securities, and interest sensitive assets and liabilities ; interest rate risks, sensitivities and the shape of the yield curve ; the effects of competition from other commercial banks, thrifts, mortgage banking firms, consumer finance companies, credit unions, securities brokerage firms, insurance companies, money market and other mutual funds and other financial institutions operating in our market areas and elsewhere, including institutions operating regionally, nationally and internationally, together with such competitors offering banking products and services by mail, telephone, computer and the Internet ; and the failure of assumptions underlying the establishment of reserves for possible loan losses . The risks of mergers and acquisitions, include, without limitation : unexpected transaction costs, including the costs of integrating operations ; the risks that the businesses will not be integrated successfully or that such integration may be more difficult, time - consuming or costly than expected ; the potential failure to fully or timely realize expected revenues and revenue synergies, including as the result of revenues following the merger being lower than expected ; the risk of deposit and customer attrition ; any changes in deposit mix ; unexpected operating and other costs, which may differ or change from expectations ; the risks of customer and employee loss and business disruption, including, without limitation, as the result of difficulties in maintaining relationships with employees ; increased competitive pressures and solicitations of customers by competitors ; as well as the difficulties and risks inherent with entering new markets . All written or oral forward - looking statements attributable to us are expressly qualified in their entirety by this cautionary notice, including, without limitation, those risks and uncertainties described in our annual report on Form 10 - K for the year ended December 31 , 2016 under “Special Cautionary Notice Regarding Forward - Looking Statements” and “Risk Factors”, and otherwise in our SEC reports and filings . Such reports are available upon request from the Company, or from the Securities and Exchange Commission, including through the SEC’s Internet website at http : //www . sec . gov . Cautionary Notice Regarding Forward - Looking Statements 2
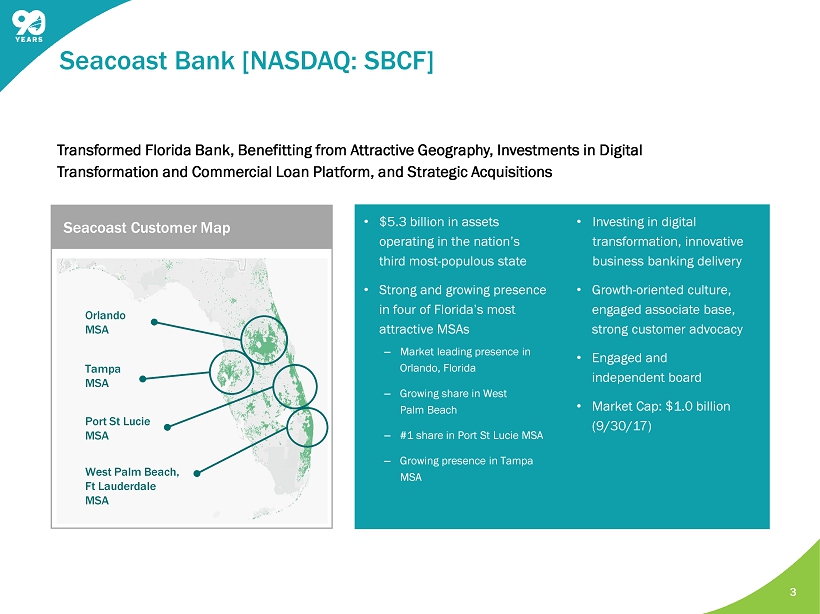
• $5.3 billion in assets operating in the nation’s third most - populous state • Strong and growing presence in four of Florida’s most attractive MSAs ‒ Market leading presence in Orlando, Florida ‒ Growing share in West Palm Beach ‒ #1 share in Port St Lucie MSA ‒ Growing presence in Tampa MSA • Investing in digital transformation, innovative business banking delivery • Growth - oriented culture, engaged associate base, strong customer advocacy • Engaged and independent board • Market Cap: $1.0 billion (9/30/17) Transformed Florida Bank, Benefitting from Attractive Geography, Investments in Digital Transformation and Commercial Loan Platform, and Strategic Acquisitions 3 Seacoast Bank [NASDAQ: SBCF] Orlando MSA West Palm Beach, Ft Lauderdale MSA Port St Lucie MSA Tampa MSA Seacoast Customer Map

Experienced Board & Management Team Comprehensive Customer Servicing Model Track Record of Value - Creating Acquisitions Expanding Analytical & Digital Capabilities Well - Positioned to Benefit From Florida Market Focused on Controls Experienced Board & Management Team Comprehensive Customer Servicing Model Track Record of Value - Creating Acquisitions Expanding Analytical & Digital Capabilities Well - Positioned to Benefit From Florida Market Focused on Controls 4 Seacoast’s Differentiated Strategy

5 3Q’17 Highlights With over 100,000 households and a growing presence in Florida’s most attractive markets, we have one of Florida’s top - performing banking franchises. • The third quarter earnings per share totaled $0.32 on a GAAP basis, and $0.35 per share on an adjusted basis 1 . • Unlike prior quarters, the impact of merger - related expenses and expenses associated with branch reductions was modest, highlighting the strong momentum in growth of earnings and growth in tangible book value per share. • Net revenue increased 21% year - over - year to $57.2 million, net income rose 56% to $14.2 million during the same period, adjusted net income increased 37% to $ 15.1 million. • On a GAAP basis, we ended the quarter at 1.12% ROTA, 12.4% ROTCE, and 58.9% efficiency ratio. On an adjusted basis, third quarter results were 1.16% adjusted ROTA 1 , 12.8% adjusted ROTCE 1 , and 57.7% adjusted efficiency ratio 1 . We are on - target to achieve our Vision 2020 goals of 1.30+% ROTA, 16%+ ROTCE, and <50.0% efficiency ratio. • During the third quarter, the commercial banking group originated $146 million in production, and ended the quarter with a pipeline of $155 million, both record results. • We received regulatory approvals on Northstar Banking Corporation and Palm Beach Community Bank during the third quarter. Northstar closed and converted on October 20, 2017 and Palm Beach Community Bank is on - track to close and consolidate in November 2017. 1 Non - GAAP measure, see “Explanation of Certain Unaudited Non - GAAP Financial Measures” Effective in the first quarter of 2017, adjusted net income and adjusted noninterest expense exclude the effect of amortizati on of acquisition - related intangibles. Prior periods have been revised to conform with the current period presentation.

Hurricane Irma Impact 6 • Late in the third quarter, the entire state of Florida was preparing for the potential impact of dangerous category 5 Hurricane Irma. This caused a full two weeks of business interruption as one week was spent on preparation and a second week on recovery. Ultimately the storm made landfall in the Florida keys as a category 4 storm and a second landfall in Marco Island in southwest Florida. • The impact of Hurricane Irma on the quarter was approximately $0.01 per share. Revenue was impacted in the form of waived service charges, slower activity in wealth management, and delayed closings on loans. Direct expenses totaled $0.4 million, comprising compensation for staff working throughout the storm to ensure our customers had digital and web access at all times, remote support from our backup site in Nashville, Tennessee, and recovery expenses to bring our branch network back on - line. These direct incremental expenses were removed from the presentation of adjusted results. • To assist our borrowers in recovering from Irma, we provided a loan deferral/extension allowing borrowers to request up to 3 payments to be deferred, effectively moving the due date out 1 - 3 months. • In the days following the storm, we conducted site visits and inquiries with commercial customers throughout our markets to help assess potential recovery needs. We had direct conversations with commercial customers covering 69 % of the commercial portfolio, and expect any credit - related impacts to be nominal. • The residential mortgage pipeline ended the quarter lower; however, prequalification and application intake has stabilized post - storm.

7 $37,735 $37,628 $38,377 $44,320 $45,903 3.69% 3.56% 3.63% 3.84% 3.74% $10,000 $15,000 $20,000 $25,000 $30,000 $35,000 $40,000 $45,000 Q3-16 Q4-16 Q1-17 Q2-17 Q3-17 Net Interest Income and Net Interest Margin* ($ in thousands) • Net interest income* totaled $45.9 million, up $1.6 million or 4% from the prior quarter and $8.3 million or 22% from the prior year quarter. • Net interest margin was 3.74% in the current quarter compared to 3.84% in the prior quarter and 3.69% in the third quarter of 2016. The decrease quarter over quarter was the result of lower accretion on both securities and loans when compared to the prior quarter, as well as higher interest expense on deposits and borrowings. *Calculated on a fully taxable equivalent basis using amortized cost. Net Interest Income and Margin

8 $2,698 $2,612 $2,422 $2,435 $2,626 $2,306 $2,334 $2,494 $2,671 $2,582 $1,283 $1,449 $1,257 $1,268 $1,318 $1,885 $1,616 $1,552 $1,272 $2,138 $1,210 $1,300 $1,447 $2,064 $1,981 $611 $733 $757 $836 $0 $1,000 $2,000 $3,000 $4,000 $5,000 $6,000 $7,000 $8,000 $9,000 $10,000 $11,000 $12,000 Q3-16 Q4-16 Q1-17 Q2-17 Q3-17 BOLI Other Income Mortgage Banking Fees Wealth Management Fees Interchange Income Service Charges $836 Adjusted Noninterest Income (in thousands) $9,764 • During the quarter the Company liquidated salable conforming mortgages originated from prior periods totaling $ 57.7 million at a weighted average yield of 3.41%. This action was taken to manage on - balance sheet liquidity, and monetize gains given the fall in long term rates during the quarter. • Late in the quarter, the Company purchased $30 million investment in bank owned life insurance at a first - year tax equivalent return of 6.2%. $9,922 $9,905 $10,467 $11,481 $ 382 Adjusted Noninterest Income 1 1 Non - GAAP measure, see “Explanation of Certain Unaudited Non - GAAP Financial Measures” Effective in the first quarter of 2017, adjusted net income and adjusted noninterest expense exclude the effect of amortizati on of acquisition - related intangibles. Prior periods have been revised to conform with the current period presentation.

9 $15,828 $14,799 $16,389 $18,225 $18,097 $3,223 $3,030 $3,267 $3,108 $3,211 $4,418 $4,463 $4,625 $4,750 $4,500 $6,645 $6,562 $6,641 $7,746 $6,998 $0 $5,000 $10,000 $15,000 $20,000 $25,000 $30,000 $35,000 $40,000 Q3-16 Q4-16 Q1-17 Q2-17 Q3-17 Other Occupancy / Telephone Data Processing Cost Salaries and Benefits Adjusted Noninterest Expense (in thousands) $32,806 $30,114 $28,854 $30,922 $33,829 • As a percentage of average tangible assets, adjusted noninterest expense in the third quarter of 2017 was 2.50% compared to 2.73% for the prior quarter and 2.76% for the third quarter of 2016. • The reduction in other expenses quarter over quarter includes a net gain on other real estate owned and repossessed assets of $ 414,000 in the quarter. 1 Non - GAAP measure, see “Explanation of Certain Unaudited Non - GAAP Financial Measures” Effective in the first quarter of 2017, adjusted net income and adjusted noninterest expense exclude the effect of amortizati on of acquisition - related intangibles. Prior periods have been revised to conform with the current period presentation. Adjusted Noninterest Expense 1
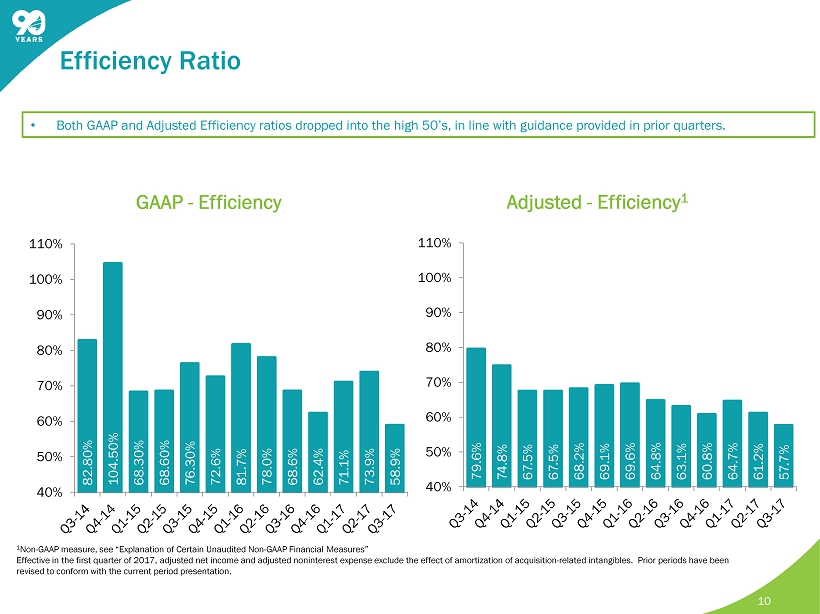
10 82.80% 104.50% 68.30% 68.60% 76.30% 72.6% 81.7% 78.0% 68.6% 62.4% 71.1% 73.9% 58.9% 40% 50% 60% 70% 80% 90% 100% 110% GAAP - Efficiency 79.6% 74.8% 67.5% 67.5% 68.2% 69.1% 69.6% 64.8% 63.1% 60.8% 64.7% 61.2% 57.7% 40% 50% 60% 70% 80% 90% 100% 110% Adjusted - Efficiency 1 1 Non - GAAP measure, see “Explanation of Certain Unaudited Non - GAAP Financial Measures” Effective in the first quarter of 2017, adjusted net income and adjusted noninterest expense exclude the effect of amortizati on of acquisition - related intangibles. Prior periods have been revised to conform with the current period presentation. • Both GAAP and Adjusted Efficiency ratios dropped into the high 50’s, in line with guidance provided in prior quarters. Efficiency Ratio
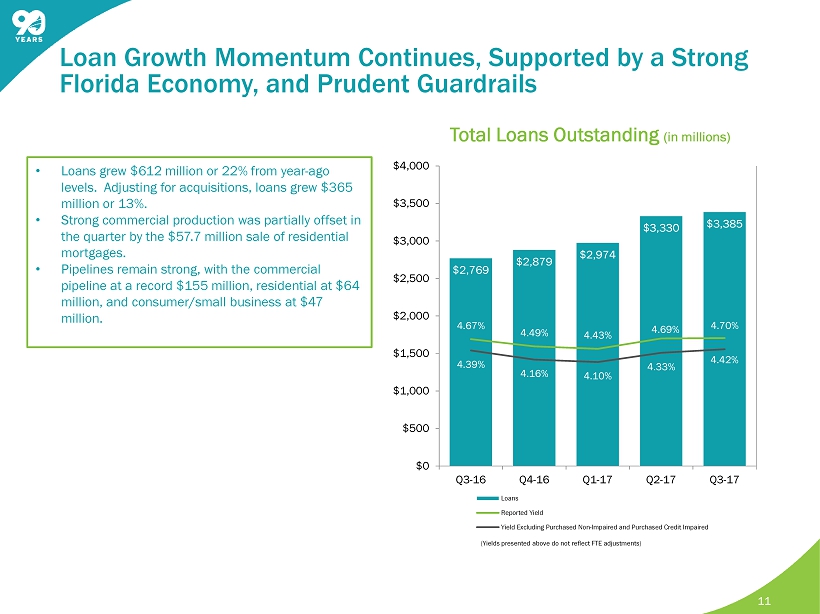
11 Total Loans Outstanding (in millions) • Loans grew $612 million or 22% from year - ago levels. Adjusting for acquisitions, loans grew $365 million or 13%. • Strong commercial production was partially offset in the quarter by the $ 57.7 million sale of residential mortgages. • Pipelines remain strong, with the commercial pipeline at a record $155 million, residential at $64 million, and consumer/small business at $47 million. $2,769 $2,879 $2,974 $3,330 $3,385 4.67% 4.49% 4.43% 4.69% 4.70% 4.39% 4.16% 4.10% 4.33% 4.42% $0 $500 $1,000 $1,500 $2,000 $2,500 $3,000 $3,500 $4,000 Q3-16 Q4-16 Q1-17 Q2-17 Q3-17 Loans Reported Yield Yield Excluding Purchased Non-Impaired and Purchased Credit Impaired Loan Growth Momentum Continues, Supported by a Strong Florida Economy, and Prudent Guardrails (Yields presented above do not reflect FTE adjustments)

12 • Total deposits increased 17% from the third quarter of 2016. Organic deposits grew 1% compared to one year prior. Growth across all markets was partially offset by outflow associated with public fund money market accounts. Without this outflow, organic deposit growth was 3% year over year. • Transaction accounts represent 54% of total deposits, and have increased 14% year over year. • Brokered time deposits totaled $282 million at the end of the third quarter. • Cost of deposits remains very attractive at 0.22%. $1,945 $2,022 $2,096 $2,243 $2,220 $1,200 $1,149 $1,185 $1,238 $1,250 $365 $352 $398 $494 $643 $0 $500 $1,000 $1,500 $2,000 $2,500 $3,000 $3,500 $4,000 $4,500 Q3-16 Q4-16 Q1-17 Q2-17 Q3-17 Transaction Accounts Savings and Money Market Time Deposits Deposit Balances (in millions) $4,113 $3,510 $3,253 $3,679 54% $3,975 The Deposit Franchise Continues to Perform Well and Serves as a Source of Earnings Strength

13 Net Charge - offs Nonperforming Loans ALLL $22,684 $23,400 $24,562 $26,000 $26,232 0.98% 0.96% 0.95% 0.95% 0.91% 0.82% 0.81% 0.83% 0.78% 0.77% 1 2 3 4 5 ALLL ALLL Ratio - Non-Acquired ALLL Ratio - Total Non - Acquired ALLL to Nonperforming $(1,492) $228 $93 $(101) $279 - 0.22% 0.03% 0.01% - 0.01% 0.03% 3Q 16 4Q 16 1Q 17 2Q 17 3Q 17 NCO NCO / Loans $10,561 $11,023 $10,557 $10,541 $10,877 $7,876 $7,048 $6,428 $6,632 $3,498 0.67% 0.63% 0.57% 0.52% 0.42% 3Q 16 4Q 16 1Q 17 2Q 17 3Q 17 NPL - Non-Acquired NPL - Acquired Total NPL Ratio Credit Quality ($ in thousands) $22,225 $23,243 $24,487 $25,809 $25,822 210.44% 210.86% 231.95% 244.84% 237.40% 3Q 16 4Q 16 1Q 17 2Q 17 3Q 17 ALLL Non-Acquired ALLL to Nonperforming Non-Acquired Ratio

Capital Position 14 Tangible Book Value / Book Value Per Share $9.35 $9.37 $10.41 $10.55 $10.95 $11.45 $11.45 $12.34 $13.29 $13.66 3Q 16 4Q 16 1Q 17 2Q 17 3Q 17 Tangible Book Value Per Share Book Value Per Share 12.6% 13.1% 10.7% 11.2% 12.8% 3Q 16 4Q 16 1Q 17 2Q 17 3Q 17 Adjusted Return on Tangible Common Equity 1 13.4% 13.3% 14.9% 14.5% 14.8% 12.6% 12.6% 14.2% 13.8% 14.1% 3Q 16 4Q 16 1Q 17 2Q 17 3Q 17 Total Risk Based Capital Tier 1 Ratio Total Risk Based and Tier 1 Capital Tangible Common Equity / Tangible Assets 8.0% 7.7% 9.0% 8.9% 9.1% 3Q 16 4Q 16 1Q 17 2Q 17 3Q 17 1 Non - GAAP measure, see “Explanation of Certain Unaudited Non - GAAP Financial Measures” Effective in the first quarter of 2017, adjusted net income and adjusted noninterest expense exclude the effect of amortizati on of acquisition - related intangibles. Prior periods have been revised to conform with the current period presentation.

Investor Presentation Charles M. Shaffer Executive Vice President Chief Financial Officer (772) 221 - 7003 Chuck.Shaffer@seacoastbank.com INVESTOR RELATIONS www.SeacoastBanking.com NASDAQ: SBCF 15 15 Contact Details: Seacoast Banking Corporation of Florida

16

This presentation contains financial information determined by methods other than Generally Accepted Accounting Principles (“GAAP”) . The financial highlights provide reconciliations between GAAP net income and adjusted net income, GAAP income and adjusted pretax, preprovision income . Management uses these non - GAAP financial measures in its analysis of the Company’s performance and believes these presentations provide useful supplemental information, and a clearer understanding of the Company’s performance . The Company believes the non - GAAP measures enhance investors’ understanding of the Company’s business and performance and if not provided would be requested by the investor community . These measures are also useful in understanding performance trends and facilitate comparisons with the performance of other financial institutions . The limitations associated with operating measures are the risk that persons might disagree as to the appropriateness of items comprising these measures and that different companies might calculate these measures differently . The Company provides reconciliations between GAAP and these non - GAAP measures . These disclosures should not be considered an alternative to GAAP . Explanation of Certain Unaudited Non - GAAP Financial Measures 17
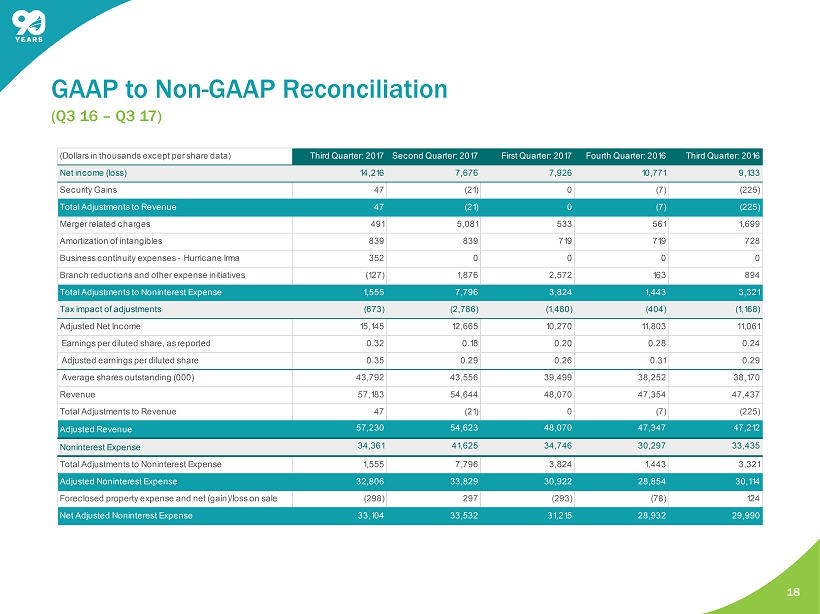
(Q3 16 – Q3 17) GAAP to Non - GAAP Reconciliation 18 (Dollars in thousands except per share data) Third Quarter: 2017Second Quarter: 2017 First Quarter: 2017 Fourth Quarter: 2016 Third Quarter: 2016 Net income (loss) 14,216 7,676 7,926 10,771 9,133 Security Gains 47 (21) 0 (7) (225) Total Adjustments to Revenue 47 (21) 0 (7) (225) Merger related charges 491 5,081 533 561 1,699 Amortization of intangibles 839 839 719 719 728 Business continuity expenses - Hurricane Irma 352 0 0 0 0 Branch reductions and other expense initiatives (127) 1,876 2,572 163 894 Total Adjustments to Noninterest Expense 1,555 7,796 3,824 1,443 3,321 Tax impact of adjustments (673) (2,786) (1,480) (404) (1,168) Adjusted Net Income 15,145 12,665 10,270 11,803 11,061 Earnings per diluted share, as reported 0.32 0.18 0.20 0.28 0.24 Adjusted earnings per diluted share 0.35 0.29 0.26 0.31 0.29 Average shares outstanding (000) 43,792 43,556 39,499 38,252 38,170 Revenue 57,183 54,644 48,070 47,354 47,437 Total Adjustments to Revenue 47 (21) 0 (7) (225) Adjusted Revenue 57,230 54,623 48,070 47,347 47,212 Noninterest Expense 34,361 41,625 34,746 30,297 33,435 Total Adjustments to Noninterest Expense 1,555 7,796 3,824 1,443 3,321 Adjusted Noninterest Expense 32,806 33,829 30,922 28,854 30,114 Foreclosed property expense and net (gain)/loss on sale (298) 297 (293) (78) 124 Net Adjusted Noninterest Expense 33,104 33,532 31,215 28,932 29,990

GAAP to Non - GAAP Reconciliation (Q3 16 – Q3 17) 19 (Dollars in thousands) Third Quarter: 2017Second Quarter: 2017 First Quarter: 2017 Fourth Quarter: 2016 Third Quarter: 2016 Adjusted Revenue 57,230 54,623 48,070 47,347 47,212 Impact of FTE adjustment 154 164 211 204 287 Adjusted Revenue on a fully taxable equivalent basis 57,384 54,787 48,281 47,551 47,499 Adjusted Efficiency Ratio 57.7% 61.2% 64.7% 60.8% 63.1% Average Assets 5,316,119 5,082,002 4,699,745 4,572,188 4,420,438 Less average goodwill and intangible assets (118,364) (114,563) (78,878) (79,620) (80,068) Average Tangible Assets 5,197,755 4,967,439 4,620,867 4,492,568 4,340,370 Return on Average Assets (ROA) 1.06% 0.61% 0.68% 0.94% 0.82% Impact of removing average intangible assets and related amortization 0.06% 0.05% 0.06% 0.06% 0.06% Return on Tangible Average Assets (ROTA) 1.12% 0.66% 0.74% 1.00% 0.88% Impact of other adjustments for Adjusted Net Income 0.04% 0.36% 0.16% 0.05% 0.13% Adjusted Return on Average Tangible Assets 1.16% 1.02% 0.90% 1.05% 1.01% Average Shareholders' Equity 587,919 567,448 466,847 437,077 430,410 Less average goodwill and intangible assets (118,364) (114,563) (78,878) (79,620) (80,068) Average Tangible Equity 469,555 452,885 387,969 357,457 350,342 Return on Average Shareholders' Equity 9.6% 5.4% 6.9% 9.8% 8.4% Impact of removing average intangible assets and related amortization 2.8% 1.9% 1.9% 2.7% 2.5% Return on Average Tangible Common Equity (ROTCE) 12.4% 7.3% 8.8% 12.5% 10.9% Impact of other adjustments for Adjusted Net Income 0.4% 3.9% 1.9% 0.6% 1.7% Adjusted Return on Average Tangible Common Equity 12.8% 11.2% 10.7% 13.1% 12.6%