Attached files
| file | filename |
|---|---|
| EX-32.2 - EXHIBIT 32.2 - SEACOAST BANKING CORP OF FLORIDA | tv484852_ex32-2.htm |
| EX-32.1 - EXHIBIT 32.1 - SEACOAST BANKING CORP OF FLORIDA | tv484852_ex32-1.htm |
| EX-31.2 - EXHIBIT 31.2 - SEACOAST BANKING CORP OF FLORIDA | tv484852_ex31-2.htm |
| EX-31.1 - EXHIBIT 31.1 - SEACOAST BANKING CORP OF FLORIDA | tv484852_ex31-1.htm |
| EX-23.1 - EXHIBIT 23.1 - SEACOAST BANKING CORP OF FLORIDA | tv484852_ex23-1.htm |
| EX-21 - EXHIBIT 21 - SEACOAST BANKING CORP OF FLORIDA | tv484852_ex21.htm |
UNITED STATES
SECURITIES AND EXCHANGE COMMISSION
WASHINGTON, DC 20549
FORM 10-K
x ANNUAL REPORT PURSUANT TO SECTION 13 OR 15(d) OF THE SECURITIES EXCHANGE ACT OF 1934
For the fiscal year ended December 31, 2017
¨ TRANSITION REPORT PURSUANT TO SECTION 13 OR 15(d) OF THE SECURITIES EXCHANGE ACT OF 1934
For the transition period from _______ to _________
Commission File No. 0-13660
SEACOAST BANKING CORPORATION OF
FLORIDA
(Exact Name of Registrant as Specified in Its Charter)
| Florida | 59-2260678 | |
| (State
or Other Jurisdiction of Incorporation or Organization) |
(I.R.S.
Employer Identification No.) | |
| 815 Colorado Avenue, Stuart, FL | 34994 | |
| (Address of Principal Executive Offices) | (Zip Code) |
| Registrant’s telephone number, including area code | (772) 287-4000 |
Securities registered pursuant to Section 12 (b) of the Act:
| Title of Each Class | Name of Each Exchange on Which Registered |
| Common Stock, Par Value $0.10 | Nasdaq Global Select Market |
Securities registered pursuant to Section 12(g) of the Act: None.
Indicate by check mark if the registrant is a well-known seasoned issuer, as defined in Rule 405 of the Securities Act.
YES x NO ¨
Indicate by check mark if the registrant is not required to file reports pursuant to Section 13 or Section 15(d) of the Act.
YES ¨ NO x
Indicate by check mark whether the registrant: (1) has filed all reports required to be filed by Section 13 or 15(d) of the Securities Exchange Act of 1934 during the preceding 12 months (or for such shorter period that the registrant was required to file such reports), and (2) has been subject to such filing requirements for the past 90 days.
YES x NO ¨
Indicate by check mark whether the registrant has submitted electronically and posted on its corporate Web site, if any, every Interactive Data File required to be submitted and posted pursuant to Rule 405 of Regulation S-T (§ 232.405 of this chapter) during the preceding 12 months (or for such shorter period that the registrant was required to submit and post such files).
YES x NO ¨
Indicate by check mark if disclosure of delinquent filers pursuant to Item 405 of Regulation S-K (§ 229.405 of this chapter) is not contained herein, and will not be contained, to the best of registrant’s knowledge, in definitive proxy or information statements incorporated by reference in Part III of this Form 10-K or any amendment to this Form 10-K. ¨
Indicate by check mark whether the registrant is a large accelerated filer, an accelerated filer, a non-accelerated filer, or a smaller reporting company. See the definitions of “large accelerated filer,” “accelerated filer” and “smaller reporting company” in Rule 12b-2 of the Exchange Act. (Check one):
| Large Accelerated Filer x | Accelerated Filer ¨ |
| Non-Accelerated Filer ¨ | Smaller Reporting Company ¨ |
| Emerging Growth Company ¨ |
If an emerging growth company, indicate by check mark if the registrant has elected not to use the extended transition period for complying with any new or revised financial accounting standards provided pursuant to Section 13(a) of the Exchange Act. ¨
Emerging growth company ¨
Indicate by check mark whether the registrant is a shell company (as defined by Rule 12b-2 of the Exchange Act).
YES ¨ NO x
The aggregate market value of Seacoast Banking Corporation of Florida common stock, par value $0.10 per share, held by non-affiliates, computed by reference to the price at which the stock was last sold on June 30, 2017, as reported on the Nasdaq Global Select Market, was $1,005,690,952. The number of shares outstanding of Seacoast Banking Corporation of Florida common stock, par value $0.10 per share, as of January 31, 2018, was 46,917,528.
TABLE OF CONTENTS
| 2 |
DOCUMENTS INCORPORATED BY REFERENCE
Certain portions of the registrant’s 2018 Proxy Statement for the Annual Meeting of Shareholders to be held May 24, 2018 (the “2018 Proxy Statement”) are incorporated by reference into Part III, Items 10 through 14 of this report. Other than those portions of the 2018 Proxy Statement specifically incorporated by reference herein pursuant to Items 10 through 14, no other portions of the 2018 Proxy Statement shall be deemed so incorporated.
SPECIAL CAUTIONARY NOTICE
REGARDING FORWARD-LOOKING STATEMENTS
Certain statements made or incorporated by reference herein which are not statements of historical fact, including those under “Management’s Discussion and Analysis of Financial Condition and Results of Operations” and elsewhere herein, are “forward-looking statements” within the meaning and protections of Section 27A of the Securities Act of 1933, as amended, and Section 21E of the Securities Exchange Act of 1934, as amended (the “Exchange Act”). Forward-looking statements include statements with respect to our beliefs, plans, objectives, goals, expectations, anticipations, assumptions, estimates, intentions and future performance, and involve known and unknown risks, uncertainties and other factors, which may be beyond our control, and which may cause the actual results, performance or achievements of Seacoast Banking Corporation of Florida (“Seacoast” or the “Company”) to be materially different from those set forth in the forward-looking statements.
All statements other than statements of historical fact are statements that could be forward-looking statements. You can identify these forward-looking statements through our use of words such as “may,” “will,” “anticipate,” “assume,” “should,” “indicate,” “would,” “believe,” “contemplate,” “expect,” “estimate,” “continue,” “further,” “plan,” “point to,” “project,” “could,” “intend,” “target” and other similar words and expressions of the future. These forward-looking statements may not be realized due to a variety of factors, including, without limitation:
| · | the effects of current and future economic, business and market conditions in the United States generally or in the communities we serve; |
| · | changes in governmental monetary and fiscal policies, including interest rate policies of the Board of Governors of the Federal Reserve System (the “Federal Reserve”); |
| · | legislative and regulatory changes, including changes in banking, securities and tax laws and regulations and their application by our regulators, including those associated with the Dodd Frank Wall Street Reform and Consumer Protection Act (the “Dodd-Frank Act”) and changes in the scope and cost of Federal Deposit Insurance Corporation (“FDIC”) insurance and other coverage; |
| · | changes in accounting policies, rules and practices and applications or determinations made thereunder, as may be adopted by the bank regulatory agencies, the Financial Accounting Standards Board (the “FASB”), the Securities and Exchange Commission (the “Commission” or “SEC”), and the Public Company Accounting Oversight Board (the “PCAOB”); |
| · | the risks of changes in interest rates on the levels, composition and costs of deposits, loan demand, and the values and liquidity of loan collateral, securities, and interest sensitive assets and liabilities; |
| · | changes in borrower credit risks and payment behaviors; |
| · | changes in the availability and cost of credit and capital in the financial markets; |
| · | changes in the prices, values and sales volumes of residential and commercial real estate in the United States and in the communities we serve, which could impact write-downs of assets, our ability to liquidate non-performing assets, realized losses on the disposition of non-performing assets and increased credit losses; |
| 3 |
| · | our ability to comply with any requirements imposed on us or on our banking subsidiary, Seacoast National Bank (“Seacoast Bank”) by regulators and the potential negative consequences that may result; |
| · | our concentration in commercial real estate loans; |
| · | the failure of assumptions and estimates, as well as differences in, and changes to, economic, market and credit conditions, including changes in borrowers’ credit risks and payment behaviors from those used in our loan portfolio stress test; |
| · | the effects of competition from a wide variety of local, regional, national and other providers of financial, investment and insurance services; |
| · | the failure of assumptions and estimates underlying the establishment of reserves for possible loan losses and other estimates; |
| · | the impact on the valuation of our investments due to market volatility or counterparty payment risk; |
| · | statutory and regulatory restrictions on our ability to pay dividends to our shareholders; |
| · | any applicable regulatory limits on Seacoast Bank’s ability to pay dividends to us; |
| · | increases in regulatory capital requirements for banking organizations generally, which may adversely affect our ability to expand our business or could cause us to shrink our business; |
| · | the risks of mergers, acquisitions and divestitures, including, without limitation, the related time and costs of implementing such transactions, integrating operations as part of these transactions and possible failures to achieve expected gains, revenue growth and/or expense savings from such transactions; | |
| · | our ability to continue to identify acquisition targets and successfully acquire desirable financial institutions to sustain our growth, to expand our presence in our markets and to enter new markets; |
| · | changes in technology or products that may be more difficult, costly, or less effective than anticipated; |
| · | increased cybersecurity risks, including potential business disruptions or financial losses; inability of our risk management framework to manage risks associated with our business such as credit risk and operational risk, including third party vendors and other service providers; |
| · | reduction in or the termination of our ability to use the mobile-based platform that is critical to our business growth strategy, including a failure in or breach of our operational or security systems or those of its third party service providers; |
| · | the effects of war or other conflicts, acts of terrorism, natural disasters or other catastrophic events that may affect general economic conditions; |
| · | the risks that our deferred tax assets could be reduced if estimates of future taxable income from our operations and tax planning strategies are less than currently estimated, or adjustments to our preliminary estimates of the impact of the Tax Cuts and Jobs Act (the “Tax Reform Act”) on certain tax attributes including our deferred tax assets, and sales of our capital stock could trigger a reduction in the amount of net operating loss carryforwards that we may be able to utilize for income tax purposes; and |
| · | other factors and risks described under “Risk Factors” herein and in any of our subsequent reports filed with the SEC and available on its website at www.sec.gov. |
All written or oral forward-looking statements that are made by us or are attributable to us are expressly qualified in their entirety by this cautionary notice. We assume no obligation to update, revise or correct any forward-looking statements that are made from time to time, either as a result of future developments, new information or otherwise, except as may be required by law.
| 4 |
| Item 1. | Business |
General
Seacoast Banking Corporation of Florida (“Seacoast” or the “Company”) is a bank holding company, incorporated in Florida in 1983, and registered under the Bank Holding Company Act of 1956, as amended (the “BHC Act”). Our principal subsidiary is Seacoast National Bank, a national banking association (“Seacoast Bank”). Seacoast Bank commenced its operations in 1933, and operated as “First National Bank & Trust Company of the Treasure Coast” prior to 2006 when we changed its name to “Seacoast National Bank.”
As of December 31, 2017, the Company’s legal structure includes one domestic subsidiary bank, Seacoast Bank, which has five wholly owned subsidiaries and seven trusts formed for the purpose of issuing trust preferred securities. Seacoast coordinates the financial resources of the consolidated enterprise and maintains financial, operational and administrative systems that allow centralized evaluation of subsidiary operations and coordination of selected policies and activities. Our operating revenues and net income are derived primarily from Seacoast Bank through dividends and fees for services performed. In 2015, Seacoast Bank acquired a receivables factoring company headquartered in Boynton Beach, Florida, and operates this office as Seacoast Business Funding, a division of Seacoast Bank.
As of December 31, 2017, Seacoast had total consolidated assets of approximately $5.8 billion, total deposits of approximately $4.6 billion, total consolidated liabilities, including deposits, of approximately $5.1 billion and consolidated shareholders’ equity of approximately $690 million. Our operations are discussed in more detail under “Item 7. Management’s Discussion and Analysis of Consolidated Financial Condition and Results of Operations.”
Our principal offices are located at 815 Colorado Avenue, Stuart, Florida 34994, and the telephone number at that address is (772) 287-4000. We and our subsidiary Seacoast Bank maintain Internet websites at www.seacoastbanking.com and www.seacoastbank.com, respectively. We are not incorporating the information on our or Seacoast Bank’s website into this report, and neither of these websites nor the information appearing on these websites is included or incorporated in, or is a part of, this report.
We make available, free of charge on our corporate website, our Annual Report on Form 10-K, quarterly reports on Form 10-Q, current reports on Form 8-K, and any amendments to those reports filed or furnished pursuant to Section 13(a) or 15(d) of the Exchange Act, as soon as reasonably practicable after we electronically file such material with or furnish it to the SEC.
| 5 |
Products and Services
Seacoast provides integrated financial services including commercial and retail banking, wealth management, and mortgage services to customers through advanced banking solutions, 51 traditional branches of its locally-branded wholly-owned subsidiary bank, Seacoast Bank, and five commercial banking centers. Offices stretch from Ft. Lauderdale, Boca Raton and West Palm Beach north through the Daytona Beach area, into Orlando and Central Florida and the adjacent Tampa market, and west to Okeechobee and surrounding counties.
Seacoast has strategically positioned a network of branches throughout Florida to serve our customers. Our dedicated Florida bankers work to assist customers with all of their banking needs on a personal level. The branches offer extended drive-through hours to accommodate our business and retail customers. Most of our banking offices have one or more automated teller machines (“ATMs”) providing customers with 24-hour access to their deposit accounts. We are a member of the “NYCE Payments Network,” an electronic funds transfer organization represented in all fifty states in the United States, which permits banking customers access to their accounts at 2.5 million participating ATMs and retail locations throughout the United States.
Seacoast offers Online and Mobile banking to business and retail customers. These services enable customers to access transactional information on their deposit accounts, review loan and deposit balances, transfer funds between linked accounts and digitally deposit checks, all online or through their mobile devices, 24 hours a day, seven days a week.
Seacoast Bank “MoneyPhone” system allows retail and business customers to access information on their loan or deposit account balances, transfer funds between linked accounts, make loan payments, and verify deposits or checks that may have cleared, all via telephone. Seacoast customers also can bank through our “Text Banking” system as well as reach out to us via Live Chat on our website 24 hours a day, seven days a week, 365 days a year.
In 2017, Seacoast expanded its Customer Service Center (“CSC”) to nearly 50 staff members and opened a new state of the art call center facility in Lake Mary, Florida. Our CSC staff is available to open accounts, accept applications for certain types of loans, resolve account issues, and offer information on other bank products and services to existing and potential customers. These services are available 24 hours a day, seven days a week, 365 days a year.
Seacoast Bank also provides brokerage and annuity services. Seacoast Bank personnel managing the sale of these services are dual employees with LPL Financial, the company through which Seacoast Bank presently conducts its brokerage and annuity services.
Seacoast Bank has significantly expanded its technology platform and the products it offers to customers by introducing digital deposit capture on smart phones, launching new consumer and business tablet and mobile platforms, improving its website, and enhancing its ATM capabilities. During 2017, these new services proved so popular with our customers that online transactions eclipsed the number of transactions processed through our physical branch network.
Expansion of Business
Seacoast has focused on growing its business to serve a broader customer base across the state of Florida. This has involved investing in digital and traditional products and services to meet the changing needs of our customers, and strategic acquisitions of community banks in Florida’s most attractive markets.
Seacoast Bank has focused on continued expansion, both organically and through the acquisition of other financial institutions and branches. We believe that with the current economic environment, there may be additional opportunities for us to acquire and consolidate other financial institutions in the State of Florida.
Since the beginning of 2014, one de novo office was opened, 49 branch locations were acquired (of which 19 branches were closed and consolidated into existing office locations), and another 14 branches unrelated to acquisitions were closed and consolidated. A total of 6 offices in close proximity to existing Seacoast branches were closed during 2017, in alignment with our plans to consolidate redundant and/or inefficient banking locations and reduce our branch footprint. Most importantly, as a result of our acquisitions in Central Florida, we have transformed from virtually no presence in Orlando to becoming the largest Florida based bank in that market, and among the top 10 overall in that market.
| 6 |
Employees
As of December 31, 2017, we and our subsidiaries employed 805 full-time equivalent employees. We consider our employee relations to be good, and we have no collective bargaining agreements with any employees.
Seasonality; Cycles
We believe our commercial banking operations are somewhat seasonal in nature. Investment management fees and deposits often peak in the first and second quarters, and often are lowest in the third quarter. Transactional fees from merchants, and ATM and debit card use also typically peak in the first and second quarters. Public deposits tend to increase with tax collections in the first and fourth quarters and decline as a result of spending thereafter. Commercial and residential real estate activity, demand, prices and sales volumes are less seasonal and vary based upon various factors, including economic conditions, interest rates and credit availability.
Competition
Seacoast and our subsidiaries operate in the highly competitive markets of Martin, St. Lucie, Indian River, Brevard, Palm Beach and Broward Counties in southeastern Florida, and in the Orlando metropolitan statistical area in Orange, Seminole and Lake County, as well as Volusia County. We also operate in Hillsborough and Pinellas County on the west coast of Florida, and in three competitive counties in central Florida near Lake Okeechobee. Seacoast Bank not only competes with other banks of comparable or larger size in its markets, but also competes with various other nonbank financial institutions, including savings and loan associations, credit unions, mortgage companies, personal and commercial financial companies, peer to peer lending businesses, investment brokerage and financial advisory firms and mutual fund companies. We compete for deposits, commercial, fiduciary and investment services and various types of loans and other financial services. Seacoast Bank also competes for interest-bearing funds with a number of other financial intermediaries and investment alternatives, including mutual funds, brokerage and insurance firms, governmental and corporate bonds, and other securities. Continued consolidation and rapid technological changes within the financial services industry will most likely change the nature and intensity of competition that we face, but can also create opportunities for us to demonstrate and leverage what we believe are our competitive advantages. Our competitors include not only financial institutions based in the State of Florida, but also a number of large out-of-state and foreign banks, bank holding companies and other financial institutions that have an established market presence in the State of Florida, or that offer products by mail, telephone or online. Many of our competitors are engaged in local, regional, national and international operations and have greater assets, personnel and other resources. Some of these competitors are subject to less regulation and/or more favorable tax treatment than we are subject to. Many of these institutions have greater resources, broader geographic markets and higher lending limits than we can and may offer services that we do not offer. In addition, these institutions may be able to better afford and make broader use of media advertising, support services, and electronic and other technology than we do. To offset these potential competitive disadvantages, we depend on our reputation for superior service, ability to make credit and other business decisions quickly, and the delivery of an integrated distribution of traditional branches and bankers, with digital technology.
Supervision and Regulation
Bank holding companies and banks are extensively regulated under federal and state law. This discussion is qualified in its entirety by reference to the particular statutory and regulatory provisions described below and is not intended to be an exhaustive description of the statutes or regulations applicable to us and Seacoast Bank’s business. As a bank holding company under federal law, we are subject to regulation, supervision and examination by the Federal Reserve. As a national bank, our primary bank subsidiary, Seacoast Bank, is subject to regulation, supervision and examination by the Office of the Comptroller of the Currency (“OCC”). In addition, as discussed in more detail below, Seacoast Bank and any other of our subsidiaries that offer consumer financial products could be subject to regulation, supervision, and examination by the Consumer Financial Protection Bureau (“CFPB”). Supervision, regulation, and examination of us, Seacoast Bank and our respective subsidiaries by the bank regulatory agencies are intended primarily for the protection of consumers, bank depositors and the Deposit Insurance Fund (“DIF”) of the FDIC, rather than holders of our capital stock. Any change in laws, regulations, or supervisory actions, whether by the OCC, the Federal Reserve, the FDIC, the CFPB, or Congress, could have a material adverse impact on us and Seacoast Bank.
7
We are required to comply with various corporate governance and financial reporting requirements under the Sarbanes-Oxley Act of 2002, as well as rules and regulations adopted by the SEC, the Public Company Accounting Oversight Board, and NASDAQ. In particular, we are required to include management and independent registered public accounting firm reports on internal controls as part of our Annual Report on Form 10-K in order to comply with Section 404 of the Sarbanes-Oxley Act. We have evaluated our controls, including compliance with the SEC rules on internal controls, and have and expect to continue to spend significant amounts of time and money on compliance with these rules. Our failure to comply with these internal control rules may materially adversely affect our reputation, ability to obtain the necessary certifications to financial statements, and the values of our securities. The assessments of our financial reporting controls as of December 31, 2017 are included in this report under “ Item 9A. Controls and Procedures.”
Regulatory Developments
Tax Reform
On December 22, 2017, the President of the United States signed the Tax Cuts and Jobs Act (the “Tax Reform Act”) into law. The Tax Reform Act represents the most significant tax reform implemented in the United States in decades and will have a significant and continuing impact on the financial services industry. Provisions in the Tax Reform Act that have impacted or are likely to impact the Company include:
| · | The reduction of the highest marginal tax rate for corporations from 35% to 21%. As addressed in more detail under “Item 1A. Risk Factors”, the rate change results in a reduction in the value of the Company’s deferred tax assets and could result in improved net income performance over prospective periods through lower income tax expense. |
| · | Repeal of the corporate alternative minimum tax. |
| · | The use of net operating losses arising in tax years beginning after December 31, 2017 will be limited to 80% of taxable income. Net operating losses may be carried forward indefinitely but not carried back. |
| · | The expansion of the bonus depreciation rules permit 100% expensing of qualified property placed in service after September 27, 2017 and before January 1, 2023. |
| · | The deduction for net business interest expense for tax years beginning after December 31, 2017 is limited to 30% of adjusted taxable income. |
The Dodd-Frank Wall Street Reform and Consumer Protection Act of 2010
On July 21, 2010, the President of the United States signed into law the Dodd-Frank Act. The Dodd-Frank Act has and will continue to have a broad impact on the financial services industry, imposing significant regulatory and compliance changes, increased capital, leverage and liquidity requirements, and numerous other provisions designed to improve supervision and oversight of, and strengthen safety and soundness within, the financial services sector. Provisions of the Dodd-Frank Act that have affected or are likely to affect our operations or the operations of Seacoast Bank include:
| · | Creation of the CFPB with centralized authority, including examination and enforcement authority, for consumer protection in the banking industry. |
| · | Limitations on federal preemption. |
8
| · | Prohibitions and restrictions on the ability of a banking entity to engage in proprietary trading for its own account and have certain interests in, or relationships with, certain unregistered hedge funds, private equity funds and commodity pools (together, “covered funds”). |
| · | Application of regulatory capital requirements, including changes to leverage and risk-based capital standards and changes to the components of permissible tiered capital. |
| · | Requirement that holding companies and their subsidiary banks be well capitalized and well managed in order to engage in activities permitted for financial holding companies. |
| · | Changes to the assessment base for deposit insurance premiums. |
| · | Permanently raising the FDIC’s standard maximum insurance amount to $250,000. |
| · | Repealed the prohibition of the payment of interest on demand deposits. |
| · | Restrictions on compensation, including a prohibition on incentive-based compensation arrangements that encourage inappropriate risk taking by covered financial institutions that are deemed to be excessive, or that may lead to material losses. |
| · | Requirement that sponsors of asset-backed securities retain a percentage of the credit risk underlying the securities. |
| · | Requirement that banking regulators remove references to and requirements of reliance upon credit ratings from their regulations and replace them with appropriate alternatives for evaluating creditworthiness. |
The following items and information provided in subsequent sections provide a further description of certain relevant provisions of the Dodd-Frank Act and their potential impact on our operations and activities, both currently and prospectively.
Creation of Governmental Authorities. The Dodd-Frank Act created various governmental authorities such as the Oversight Council and the CFPB, an independent regulatory authority housed within the Federal Reserve. The CFPB has broad authority to regulate the offering and provision of consumer financial products. The CFPB’s authority to supervise and examine depository institutions with $10 billion or less in assets for compliance with federal consumer laws remains largely with those institutions’ primary regulators. However, the CFPB may participate in examinations of these smaller institutions on a “sampling basis” and may refer potential enforcement actions against such institutions to their primary regulators. The CFPB also may participate in examinations of Seacoast Bank, which currently has assets of less than $10 billion, and could supervise and examine our other direct or indirect subsidiaries that offer consumer financial products or services. In addition, the Dodd-Frank Act permits states to adopt consumer protection laws and regulations that are stricter than those regulations promulgated by the CFPB, and state attorneys general are permitted to enforce consumer protection rules adopted by the CFPB against certain institutions.
Limitation on Federal Preemption. The Dodd-Frank Act significantly reduced the ability of national banks to rely upon federal preemption of state consumer financial laws. Although the OCC will have the ability to make preemption determinations where certain conditions are met, the broad rollback of federal preemption has the potential to create a patchwork of federal and state compliance obligations. This could, in turn, result in significant new regulatory requirements applicable to us, with attendant potential significant changes in our operations and increases in our compliance costs. It could also result in uncertainty concerning compliance, with attendant regulatory and litigation risks.
Corporate Governance. The Dodd-Frank Act addresses many investor protections, corporate governance, and executive compensation matters that will affect most U.S. publicly traded companies. The Dodd-Frank Act (1) grants shareholders of U.S. publicly traded companies an advisory vote on executive compensation; (2) enhances independence requirements for Compensation Committee members; and (3) requires companies listed on national securities exchanges to adopt incentive-based compensation claw-back policies for executive officers.
9
Incentive Compensation. The Dodd-Frank Act requires the banking agencies and the SEC to establish joint rules or guidelines for financial institutions with more than $1 billion in assets, such as us and Seacoast Bank, which prohibit incentive compensation arrangements that the agencies determine to encourage inappropriate risks by the institution. The banking agencies issued proposed rules in 2011 and previously issued guidance on sound incentive compensation policies. In 2016, the Federal Reserve and the OCC also proposed rules that would, depending upon the assets of the institution, directly regulate incentive compensation arrangements and would require enhanced oversight and recordkeeping. As of December 31, 2017, these rules have not been implemented. We and Seacoast Bank have undertaken efforts to ensure that our incentive compensation plans do not encourage inappropriate risks, consistent with three key principles—that incentive compensation arrangements should appropriately balance risk and financial rewards, be compatible with effective controls and risk management, and be supported by strong corporate governance.
Shareholder Say-On-Pay Votes. The Dodd-Frank Act requires public companies to take shareholders’ votes on proposals addressing compensation (known as say-on-pay), the frequency of a say-on-pay vote, and the golden parachutes available to executives in connection with change-in-control transactions. Public companies must give shareholders the opportunity to vote on the compensation at least every three years and the opportunity to vote on frequency at least every six years, indicating whether the say-on-pay vote should be held annually, biennially, or triennially. The first say-on-pay vote occurred at our 2011 annual shareholders meeting. The say-on-pay, the say-on-parachute and the say-on-frequency votes are explicitly nonbinding and cannot override a decision of our board of directors.
Volcker Rule. In December 2013, the Federal Reserve and other regulators jointly issued final rules implementing requirements of a new Section 13 to the Bank Holding Company Act, commonly referred to as the “Volcker Rule.” The Volcker Rule generally prohibits us and our subsidiaries from (i) engaging in proprietary trading for our own account, and (ii) acquiring or retaining an ownership interest in or sponsoring a “covered fund,” all subject to certain exceptions. The Volcker Rule also specifies certain limited activities in which we and our subsidiaries may continue to engage, and required us to implement a compliance program. The regulators provided for a Volcker Rule conformance date of July 21, 2015. The Federal Reserve extended the conformance deadline twice (first to July 21, 2016, and again to July 21, 2017) for certain legacy “covered funds” activities and investments in place before December 31, 2013. Further, the Federal Reserve Board permits limited exemptions, upon application, for divestiture of certain “illiquid” covered funds, for an additional period of up to 5 years beyond that date.
Given the extent of the changes brought about by the Dodd-Frank Act and the significant discretion afforded to federal regulators to implement those changes, we cannot fully predict the extent of the impact such requirements will have on our operations. The changes resulting from the Dodd-Frank Act may impact the profitability of our business activities, require changes to certain of our business practices, impose upon us more stringent capital, liquidity and leverage requirements or otherwise adversely affect our business. These changes may also require us to invest significant management attention and resources to evaluate and make any changes necessary to comply with new statutory and regulatory requirements. Failure to comply with the new requirements may negatively impact our results of operations and financial condition. While we cannot predict what effect any presently contemplated or future changes in the laws or regulations or their interpretations would have on us, these changes could be materially adverse to our investors.
Basel III
As of January 1, 2015, we were required to comply with higher minimum capital requirements. These new rules (“Revised Capital Rules”) implement the Dodd-Frank Act and a separate international regulatory regime known as “Basel III” (which is discussed below). Prior to January 1, 2015, we and Seacoast Bank were subject to risk-based capital guidelines issued by the Federal Reserve and the OCC for bank holding companies and national banks, respectively. The risk-based capital guidelines that applied to us and Seacoast Bank through December 31, 2014, were based upon the 1988 capital accord of the international Basel Committee on Banking Supervision, a committee of central banks and bank supervisors, as implemented by the U.S. federal banking agencies on an interagency basis.
10
The following is a brief description of the relevant provisions of the Revised Capital Rules and their potential impact on our capital levels. Among other things, the Revised Capital Rules (i) introduce a new capital measure called “Common Equity Tier 1” (“CET1”), (ii) specify that Tier 1 Capital consist of CET1 and “Additional Tier 1 Capital” instruments meeting certain requirements, (iii) define CET1 narrowly by requiring that most deductions/adjustments to regulatory capital measures be made to CET1 and note to the other components of capital and (iv) expand the scope of the deductions/adjustments from capital as compared to existing regulation that apply to us and other banking organizations.
Minimum Capital Requirements. The Revised Capital Rules required the following initial minimum capital ratios as of January 1, 2015:
| · | 4.5% CET1 to risk-weighted assets. | |
| · | 6.0% Tier 1 capital to risk-weighted assets. | |
| · | 8.0% Total capital to risk-weighted assets. | |
| · | 4.0% Tier 1 capital to average consolidated assets as reported on consolidated financial statements (known as the “leverage ratio”). |
Capital Conservation Buffer. The Revised Capital Rules also introduce a “capital conservation buffer,” composed entirely of CET1, on top of the minimum risk-weighted asset ratios, which is designed to absorb losses during periods of economic stress. Banking organizations with a ratio of CET1 to risk-weighted assets above the minimum but below the capital conservation buffer will face constraints on dividends, equity repurchases and compensation based on the amount of this difference.
When fully phased in on January 1, 2019, the Revised Capital Rules will require us and Seacoast Bank to maintain (i) a minimum ratio of CET1 to risk-weighted assets of 7% (4.5% attributable to CET1 plus the 2.5% capital conservation buffer); (ii) a minimum ratio of Tier 1 capital to risk-weighted assets of at least 8.5% (6.0% attributable to Tier 1 capital plus the 2.5% capital conservation buffer), (iii) a minimum ratio of Total capital (that is, Tier 1 plus Tier 2) to risk-weighted assets of at least 10.5% (8.0% attributable to Total capital plus the 2.5% capital conservation buffer) and (iv) a minimum leverage ratio of 4%, calculated as the ratio of Tier 1 capital to average assets (as compared to a current minimum leverage ratio of 3% for banking organizations that either have the highest supervisory rating or have implemented the appropriate federal regulatory authority’s risk-adjusted measure for market risk). At December 31, 2017, Seacoast was subject to the requisite capital conservation buffer of 1.25%.
Regulatory Deductions. The Revised Capital Rules provide for a number of deductions from and adjustments to CET1, including the requirement that mortgage servicing rights, deferred tax assets that arise from operating loss and tax credit carryforwards, net of associated deferred tax liabilities and significant investments in non-consolidated financial entities be deducted from CET1 to the extent that any one such category exceeds 10% of CET1 or all such categories in the aggregate exceed 15% of CET1. Implementation of the deductions and other adjustments to CET1 began on January 1, 2015 and were phased-in over a three-year period (beginning at 40% on January 1, 2015 and an additional 20% per year thereafter until fully phased-in as of January 1, 2018).
Under the Revised Capital Rules, the effects of certain accumulated other comprehensive items (except gains and losses on cash flow hedges where the hedged item is not recognized on a banking organization’s balance sheet at fair value) are not excluded; however, certain banking organizations, including us and Seacoast Bank, may make a one-time permanent election to continue to exclude these items. The Revised Capital Rules also preclude counting certain hybrid securities, such as trust preferred securities, as Tier 1 capital of bank or thrift holding companies. However, for bank or thrift holding companies that had assets of less than $15 billion as of December 31, 2009 (like us), trust preferred securities issued prior to May 19, 2010 can be treated as Tier 1 capital to the extent that they do not exceed 25% of Tier 1 capital after applying all capital deductions and adjustments.
Management believes, at December 31, 2017, that we and Seacoast Bank meet all capital adequacy requirements under the Revised Capital Rules on a fully phased-in basis if such requirements were currently effective.
11
Bank Holding Company Regulation
As a bank holding company, we are subject to supervision and regulation by the Federal Reserve under the BHC Act. Bank holding companies generally are limited to the business of banking, managing or controlling banks, and other activities that the Federal Reserve determines to be closely related to banking, or managing or controlling banks as to be a proper incident thereto. We are required to file with the Federal Reserve periodic reports and such other information as the Federal Reserve may request. Ongoing supervision is provided through regular examinations by the Federal Reserve and other means that allow the regulators to gauge management’s ability to identify, assess and control risk in all areas of operations in a safe and sound manner and to ensure compliance with laws and regulations. The Federal Reserve may also examine our non-bank subsidiaries.
Expansion and Activity Limitations. Under the BHC Act, a bank holding company is generally permitted to engage in, or acquire direct or indirect control of more than 5 percent of the voting shares of, any company engaged in the following activities:
| · | banking or managing or controlling banks. |
| · | furnishing services to or performing services for our subsidiaries; and |
| · | any activity that the Federal Reserve determines to be so closely related to banking as to be a proper incident to the business of banking, including: |
| • | factoring accounts receivable; |
| • | making, acquiring, brokering or servicing loans and usual related activities; |
| • | leasing personal or real property; |
| • | operating a non-bank depository institution, such as a savings association; |
| • | performing trust company functions; |
| • | providing financial and investment advisory activities; |
| • | conducting discount securities brokerage activities; |
| • | underwriting and dealing in government obligations and money market instruments; |
| • | providing specified management consulting and counseling activities; |
| • | performing selected data processing services and support services; |
| • | acting as agent or broker in selling credit life insurance and other types of insurance in connection with credit transactions; |
| • | performing selected insurance underwriting activities; |
| • | providing certain community development activities (such as making investments in projects designed primarily to promote community welfare); and, |
| • | issuing and selling money orders and similar consumer-type payment instruments |
12
With certain exceptions, the BHC Act prohibits a bank holding company from acquiring direct or indirect ownership or control of voting shares of any company which is not a bank or bank holding company, and from engaging directly or indirectly in any activity other than banking or managing or controlling banks or performing services for its authorized subsidiaries. A bank holding company, may, however, engage in or acquire an interest in a company that engages in activities which the Federal Reserve has determined by regulation or order to be so closely related to banking or managing or controlling banks as to be a proper incident thereto.
Under BHC Act, bank holding companies that are, and whose depository institution subsidiaries are “well-capitalized” and “well-managed”, as defined in Federal Reserve Regulation Y, which have and maintain “satisfactory” ratings under the Community Reinvestment Act of 1977, as amended (the “CRA”), and meet certain other conditions, can elect to become “financial holding companies”. Financial holding companies and their subsidiaries are permitted to acquire or engage in activities such as insurance underwriting, securities underwriting, travel agency activities, a broad range of insurance agency activities, merchant banking, and other activities that the Federal Reserve determines to be financial in nature or complementary thereto. While we have not become a financial holding company, we may elect to do so in the future in order to exercise these broader activity powers. Banks may also engage in similar “financial activities” through subsidiaries.
The BHC Act permits acquisitions of banks by bank holding companies, such that we and any other bank holding company, whether located in Florida or elsewhere, may acquire a bank located in any other state, subject to certain deposit-percentage, age of bank charter requirements, and other restrictions. Federal law also permits national and state-chartered banks to branch interstate through acquisitions of banks in other states, subject to certain requirements.
Support of Subsidiary Banks by Holding Companies. Federal Reserve policy requires a bank holding company to act as a source of financial and managerial strength and to preserve and protect its bank subsidiaries in situations where additional investments in a troubled bank may not otherwise be warranted. Notably, the Dodd-Frank Act has codified the Federal Reserve’s “source of strength” doctrine. In addition, the Dodd-Frank Act’s new provisions authorize the Federal Reserve to require a company that directly or indirectly controls a bank to submit reports that are designed both to assess the ability of such company to comply with its “source of strength” obligations and to enforce the company’s compliance with these obligations. As of December 31, 2017, the Federal Reserve and other federal banking regulators had not issued rules implementing this requirement.
FDICIA and Prompt Corrective Action
The Federal Deposit Insurance Corporation Improvement Act of 1991 (“FDICIA”), among other things, requires the federal bank regulatory agencies to take “prompt corrective action” regarding depository institutions that do not meet minimum capital requirements. FDICIA establishes five regulatory capital tiers: “well capitalized”, “adequately capitalized”, “undercapitalized”, “significantly undercapitalized”, and “critically undercapitalized”. A depository institution’s capital tier will depend upon how its capital levels compare to various relevant capital measures and certain other factors, as established by regulation. The FDICIA imposes progressively more restrictive restraints on operations, management and capital distributions, depending on the category in which an institution is classified.
All of the federal bank regulatory agencies have adopted regulations establishing relevant capital measures and relevant capital levels for federally insured depository institutions. Notably, the Revised Capital Rule updated the prompt corrective action framework to correspond to the rule’s new minimum capital thresholds, which took effect on January 1, 2015. Under this new framework, (i) a well-capitalized insured depository institution is one having a total risk-based capital ratio of 10 percent or greater, a Tier 1 risk-based capital ratio of 8 percent or greater, a CET1 capital ratio of 6.5 percent or greater, a leverage capital ratio of 5 percent or greater and that is not subject to any order or written directive to meet and maintain a specific capital level for any capital measure; (ii) an adequately-capitalized depository institution is one having a total risk based capital ratio of 8 percent or more, a Tier 1 capital ratio of 6 percent or more, a CET1 capital ratio of 4.5 percent or more, and a leverage ratio of 4 percent or more; (iii) an undercapitalized depository institution is one having a total capital ratio of less than 8 percent, a Tier 1 capital ratio of less than 6 percent, a CET1 capital ratio of less than 4.5 percent, or a leverage ratio of less than 4 percent; and (iv) a significantly undercapitalized institution is one having a total risk-based capital ratio of less than 6 percent, a Tier 1 capital ratio of less than 4 percent, a CET1 ratio of less than 3 percent or a leverage capital ratio of less than 3 percent. The Revised Capital Rules retain the 2 percent threshold for critically undercapitalized institutions, but make certain changes to the framework for calculating an institution’s ratio of tangible equity to total assets.
13
As of December 31, 2017, the consolidated capital ratios of Seacoast and Seacoast Bank were as follows:
| Seacoast | Seacoast | Minimum to be | ||||||||||
| (Consolidated) | Bank | Well-Capitalized* | ||||||||||
| Common equity Tier 1 ratio (CET1) | 12.04 | % | 12.41 | % | 6.5 | % | ||||||
| Tier 1 capital ratio | 13.61 | % | 12.41 | % | 8.0 | % | ||||||
| Total risk-based capital ratio | 14.24 | % | 13.04 | % | 10.0 | % | ||||||
| Leverage ratio | 10.68 | % | 9.72 | % | 5.0 | % | ||||||
| * For subsidiary bank only | ||||||||||||
FDICIA generally prohibits a depository institution from making any capital distribution (including payment of a dividend) or paying any management fee to its holding company if the depository institution would thereafter be undercapitalized. Undercapitalized depository institutions are subject to growth limitations and are required to submit a capital restoration plan for approval within 90 days of becoming undercapitalized. For a capital restoration plan to be acceptable, the depository institution’s parent holding company must guarantee that the institution will comply with such capital restoration plan. The aggregate liability of the parent holding company is limited to the lesser of 5% of the depository institution’s total assets at the time it became undercapitalized and the amount necessary to bring the institution into compliance with applicable capital standards. If a depository institution fails to submit an acceptable plan, it is treated as if it is significantly undercapitalized. If the controlling holding company fails to fulfill its obligations under FDICIA and files (or has filed against it) a petition under the federal Bankruptcy Code, the claim for such liability would be entitled to a priority in such bankruptcy proceeding over third party creditors of the bank holding company. In addition, an undercapitalized institution is subject to increased monitoring and asset growth restrictions and is required to obtain prior regulatory approval for acquisitions, new lines of business, and branching. Such an institution also is barred from soliciting, taking or rolling over brokered deposits.
Significantly undercapitalized depository institutions may be subject to a number of requirements and restrictions, including orders to sell sufficient voting stock to become adequately capitalized, requirements to reduce total assets, and cessation of receipt of deposits from correspondent banks. Critically undercapitalized institutions are subject to the appointment of a receiver or conservator within 90 days of becoming significantly undercapitalized, except under limited circumstances. Because our company and Seacoast Bank exceed applicable capital requirements, the respective managements of our company and Seacoast Bank do not believe that the provisions of FDICIA have had any material effect on our company and Seacoast Bank or our respective operations.
FDICIA also contains a variety of other provisions that may affect the operations of our company and Seacoast Bank, including reporting requirements, regulatory standards for real estate lending, “truth in savings” provisions, the requirement that a depository institution give 90 days’ prior notice to customers and regulatory authorities before closing any branch, and a prohibition on the acceptance or renewal of brokered deposits by depository institutions that are not well capitalized, or are adequately capitalized and have not received a waiver from the FDIC. Seacoast Bank was well capitalized at December 31, 2017, and brokered deposits are not restricted.
Payment of Dividends
We are a legal entity separate and distinct from Seacoast Bank and our other subsidiaries. Our primary source of cash, other than securities offerings, is dividends from Seacoast Bank. The prior approval of the OCC is required if the total of all dividends declared by a national bank (such as Seacoast Bank) in any calendar year will exceed the sum of such bank’s net profits for that year and its retained net profits for the preceding two calendar years, less any required transfers to surplus. Federal law also prohibits any national bank from paying dividends that would be greater than such bank’s undivided profits after deducting statutory bad debts in excess of such bank’s allowance for possible loan losses.
14
In addition, we and Seacoast Bank are subject to various general regulatory policies and requirements relating to the payment of dividends, including requirements to maintain adequate capital above regulatory minimums. The appropriate federal bank regulatory authority may prohibit the payment of dividends where it has determined that the payment of dividends would be an unsafe or unsound practice and to prohibit payment thereof. The OCC and the Federal Reserve have indicated that paying dividends that deplete a national or state member bank’s capital base to an inadequate level would be an unsound and unsafe banking practice. The OCC and the Federal Reserve have each indicated that depository institutions and their holding companies should generally pay dividends only out of current operating earnings.
Under a Federal Reserve policy adopted in 2009, the board of directors of a bank holding company must consider different factors to ensure that its dividend level is prudent relative to maintaining a strong financial position, and is not based on overly optimistic earnings scenarios, such as potential events that could affect its ability to pay, while still maintaining a strong financial position. As a general matter, the Federal Reserve has indicated that the board of directors of a bank holding company should consult with the Federal Reserve and eliminate, defer or significantly reduce the bank holding company’s dividends if:
| · | its net income available to shareholders for the past four quarters, net of dividends previously paid during that period, is not sufficient to fully fund the dividends; |
| · | its prospective rate of earnings retention is not consistent with its capital needs and overall current and prospective financial condition; or |
| · | it will not meet, or is in danger of not meeting, its minimum regulatory capital adequacy ratios. |
Seacoast Bank recorded net income in 2017, 2016 and 2015, but no dividends were paid to us during any of these years. Prior approval by the OCC is required if the total of all dividends declared by a national bank in any calendar year exceeds the bank’s profits for that year combined with its retained net profits for the preceding two calendar years. Under this restriction Seacoast Bank is eligible to distribute dividends up to $87.7 million to the Holding Company, without prior OCC approval, as of December 31, 2017.
No dividends on our common stock were declared or paid in 2017, 2016 or 2015.
Enforcement Policies and Actions
The Federal Reserve and the OCC monitor compliance with laws and regulations. Violations of laws and regulations, or other unsafe and unsound practices, may result in these agencies imposing fines or penalties, cease and desist orders, or taking other enforcement actions. Under certain circumstances, these agencies may enforce these remedies directly against officers, directors, employees and other parties participating in the affairs of a bank or bank holding company.
Bank and Bank Subsidiary Regulation
Seacoast Bank is a national bank subject to supervision, regulation and examination by the OCC, which monitors all areas of operations, including reserves, loans, mortgages, the issuance of securities, payment of dividends, establishing branches, capital adequacy, and compliance with laws. Seacoast Bank is a member of the FDIC and, as such, its deposits are insured by the FDIC to the maximum extent provided by law. See “FDIC Insurance Assessments”.
Under Florida law, Seacoast Bank may establish and operate branches throughout the State of Florida, subject to the maintenance of adequate capital and the receipt of OCC approval.
The OCC has adopted the Federal Financial Institutions Examination Council’s (“FFIEC”) rating system and assigns each financial institution a confidential composite rating based on an evaluation and rating of six essential components of an institution’s financial condition and operations, including Capital Adequacy, Asset Quality, Management, Earnings, Liquidity and Sensitivity to Market Risk, as well as the quality of risk management practices.
15
FNB Insurance, a Seacoast Bank subsidiary, is authorized by the State of Florida to market insurance products as an agent. FNB Insurance is a separate and distinct entity from Seacoast Bank and is subject to supervision and regulation by state insurance authorities. It is a financial subsidiary, but is inactive.
Standards for Safety and Soundness
The Federal Deposit Insurance Act requires the federal bank regulatory agencies to prescribe, by regulation or guideline, operational and managerial standards for all insured depository institutions relating to: (1) internal controls; (2) information systems and audit systems; (3) loan documentation; (4) credit underwriting; (5) interest rate risk exposure; and (6) asset quality.
The agencies also must prescribe standards for asset quality, earnings, and stock valuation, as well as standards for compensation, fees and benefits. The federal banking agencies have adopted regulations and Interagency Guidelines Establishing Standards for Safety and Soundness to implement these required standards. These guidelines set forth the safety and soundness standards used to identify and address problems at insured depository institutions before capital becomes impaired. Under the regulations, if a regulator determines that a bank fails to meet any standards prescribed by the guidelines, the regulator may require the bank to submit an acceptable plan to achieve compliance, consistent with deadlines for the submission and review of such safety and soundness compliance plans.
FDIC Insurance Assessments
Seacoast Bank’s deposits are insured by the FDIC’s DIF, and Seacoast Bank is subject to FDIC assessments for its deposit insurance, as well as assessments by the FDIC to pay interest on Financing Corporation (“FICO”) bonds.
The FDIC calculates assessments based on an institution’s average consolidated total assets less its average tangible equity in accordance with changes mandated by the Dodd-Frank Act. In determining the deposit insurance assessments to be paid by insured depository institutions, the FDIC generally assigns institutions to one of four risk categories based on supervisory ratings and capital ratios. Under the FDIC’s risk-based assessment system, insured institutions are assigned to risk categories based on supervisory evaluations, regulatory capital levels and certain other factors.
As of September 30, 2017, 2016 and 2015, Seacoast Bank’s rate was 4.38 basis points, 5.06 basis points, and 6.54 basis points, respectively. Seacoast Bank’s deposit insurance premiums totaled $2.3 million for 2017, $2.4 million for 2016, and $2.2 million for 2015.
In addition, the FDIC collects FICO deposit assessments, which are calculated off of the assessment base described above. FICO assessments are set quarterly, and our FICO assessment averaged 0.52 basis points for all four quarters during 2017. Our FICO assessment rate for the first quarter of 2018 is 0.46 basis points.
16
Change in Control
Subject to certain exceptions, the BHC Act and the Change in Bank Control Act, together with regulations promulgated thereunder, require Federal Reserve approval prior to any person or company acquiring “control” of a bank or bank holding company. Control is conclusively presumed to exist if an individual or company acquires 25 percent or more of any class of voting securities, and rebuttably presumed to exist if a person acquires 10 percent or more, but less than 25 percent, of any class of voting securities and either the company has registered securities under Section 12 of the Exchange Act or no other person owns a greater percentage of that class of voting securities immediately after the transaction. In certain cases, a company may also be presumed to have control under the BHC Act if it acquires 5 percent or more of any class of voting securities.
Other Regulations
Anti-Money Laundering. The International Money Laundering Abatement and Anti-Terrorism Funding Act of 2001 specifies “know your customer” requirements that obligate financial institutions to take actions to verify the identity of the account holders in connection with opening an account at any U.S. financial institution. Banking regulators will consider compliance with the Act’s money laundering provisions in acting upon acquisition and merger proposals. Sanctions for violations of the Act can be imposed in an amount equal to twice the sum involved in the violating transaction, up to $1 million.
Under the Uniting and Strengthening America by Providing Appropriate Tools Required to Intercept and Obstruct Terrorism (“USA PATRIOT”) Act of 2001, financial institutions are subject to prohibitions against specified financial transactions and account relationships as well as enhanced due diligence and “know your customer” standards in their dealings with foreign financial institutions and foreign customers.
The USA PATRIOT Act, and its implementing regulations adopted by the Financial Crimes Enforcement Network (“FinCen”), a bureau of the U.S. Department of the Treasury, requires financial institutions to establish anti-money laundering programs with minimum standards that include:
| · | the development of internal policies, procedures, and controls; | |
| · | the designation of a compliance officer; | |
| · | an ongoing employee training program; and | |
| · | an independent audit function to test the programs. |
Bank regulators routinely examine institutions for compliance with these anti-money laundering obligations and recently have been active in imposing “cease and desist” and other regulatory orders and money penalty sanctions against institutions found to be in violation of these requirements. In addition, FinCEN issued a final rule, which was published in the Federal Register on May 11, 2016, that requires, subject to certain exclusions and exemptions, covered financial institutions to identify and verify the identity of beneficial owners of legal entity customers, beginning on May 11, 2018.
Economic Sanctions. The Office of Foreign Assets Control (“OFAC”) is responsible for helping to ensure that U.S. entities do not engage in transactions with certain prohibited parties, as defined by various Executive Orders and acts of Congress. OFAC publishes, and routinely updates, lists of names of persons and organizations suspected of aiding, harboring or engaging in terrorist acts, including the Specially Designated Nationals and Blocked Persons List. If we find a name on any transaction, account or wire transfer that is on an OFAC list, we must undertake certain specified activities, which could include blocking or freezing the account or transaction requested, and we must notify the appropriate authorities.
Transactions with Related Parties. We are a legal entity separate and distinct from Seacoast Bank and our other subsidiaries. Various legal limitations restrict our banking subsidiaries from lending or otherwise supplying funds to us or our non-bank subsidiaries. We and our banking subsidiaries are subject to Section 23A of the Federal Reserve Act and the corresponding provisions of Federal Reserve Regulation W thereunder. Section 23A defines “covered transactions” to include, among other types of transactions, extensions of credit, and limits a bank’s covered transactions with any of its “affiliates” to 10% of such bank’s capital and surplus. All covered and exempt transactions between a bank and its affiliates must be on terms and conditions consistent with safe and sound banking practices, and banks and their operating subsidiaries are prohibited from purchasing low-quality assets from the bank’s affiliates. Finally, Section 23A requires that all of a bank’s extensions of credit to its affiliates be appropriately secured by acceptable collateral, generally United States government or agency securities.
17
We and our bank subsidiaries also are subject to Section 23B of the Federal Reserve Act and the corresponding provisions of Federal Reserve Regulation W thereunder, which generally require covered transactions and certain other transactions between a bank and its affiliates to be on terms, including credit standards, that are substantially the same or at least as favorable to, the bank as those prevailing at the time for similar transactions with unaffiliated companies.
The Dodd-Frank Act generally enhances the restrictions on banks’ transactions with affiliates under Sections 23A and 23B of the Federal Reserve Act, including an expansion of the definition of “covered transactions” and an increase in the amount of time for which collateral requirements regarding covered credit transactions must be satisfied. Specifically, Section 608 of the Dodd-Frank Act broadens the definition of “covered transactions” to include derivative transactions and the borrowing or lending of securities if the transaction will cause a bank to have credit exposure to an affiliate. The revised definition also includes the acceptance of debt obligations of an affiliate as collateral for a loan or extension of credit to a third party. Furthermore, reverse repurchase transactions will be viewed as extensions of credit (instead of asset purchases) and thus become subject to collateral requirements. These expanded definitions took effect on July 21, 2012. The ability of the Federal Reserve to grant exemptions from these restrictions is also narrowed by the Dodd-Frank Act, including with respect to the requirement for the OCC, FDIC and Federal Reserve to coordinate with one another.
Concentrations in Lending. During 2006, the federal bank regulatory agencies released guidance on “Concentrations in Commercial Real Estate Lending” (the “Guidance”) and advised financial institutions of the risks posed by commercial real estate (“CRE”) lending concentrations.
The Guidance requires that appropriate processes be in place to identify, monitor and control risks associated with real estate lending concentrations. Higher allowances for loan losses and capital levels may also be required. The Guidance is triggered when CRE loan concentrations exceed either:
| · | Total reported loans for construction, land development, and other land of 100 percent or more of a bank’s total risk based capital; or | |
| · | Total reported loans secured by multifamily and nonfarm nonresidential properties and loans for construction, land development, and other land of 300 percent or more of a bank’s total risk based capital. |
The Guidance also applies when a bank has a sharp increase in CRE loans or has significant concentrations of CRE secured by a particular property type.
We have always had exposures to loans secured by commercial real estate due to the nature of our markets and the loan needs of both retail and commercial customers. We believe our long term experience in CRE lending, underwriting policies, internal controls, and other policies currently in place, as well as our loan and credit monitoring and administration procedures, are generally appropriate to managing our concentrations as required under the Guidance. At December 31, 2017, we had outstanding $188.8 million in commercial construction and residential land development loans and $154.4 million in residential construction loans to individuals, which represents approximately 61 percent of Seacoast Bank’s total risk based capital at December 31, 2017, well below the Guidance’s threshold. At December 31, 2017, the total CRE exposure for Seacoast Bank represents approximately 209 percent of total risk based capital, also below the Guidance’s threshold.
18
Community Reinvestment Act. We and our banking subsidiaries are subject to the provisions of the Community Reinvestment Act (“CRA”) and related federal bank regulatory agencies’ regulations. Under the CRA, all banks and thrifts have a continuing and affirmative obligation, consistent with their safe and sound operation, to help meet the credit needs for their entire communities, including low- and moderate-income neighborhoods. The CRA requires a depository institution’s primary federal regulator, in connection with its examination of the institution, to assess the institution’s record of assessing and meeting the credit needs of the communities served by that institution, including low- and moderate-income neighborhoods. The bank regulatory agency’s assessment of the institution’s record is made available to the public. Further, such assessment is required of any institution which has applied to: (i) charter a national bank; (ii) obtain deposit insurance coverage for a newly-chartered institution; (iii) establish a new branch office that accepts deposits; (iv) relocate an office; (v) merge or consolidate with, or acquire the assets or assume the liabilities of, a federally regulated financial institution, or (vi) expand other activities, including engaging in financial services activities authorized by the GLB. A less than satisfactory CRA rating will slow, if not preclude, expansion of banking activities and prevent a company from becoming or remaining a financial holding company.
Following the enactment of the Gramm-Leach-Bliley Act (“GLB”), CRA agreements with private parties must be disclosed and annual CRA reports must be made to a bank’s primary federal regulator. A bank holding company will not be permitted to become or remain a financial holding company and no new activities authorized under GLB may be commenced by a holding company or by a bank financial subsidiary if any of its bank subsidiaries received less than a “satisfactory” CRA rating in its latest CRA examination. Federal CRA regulations require, among other things, that evidence of discrimination against applicants on a prohibited basis, and illegal or abusive lending practices be considered in the CRA evaluation.
Privacy and Data Security. The GLB generally prohibits disclosure of consumer information to non-affiliated third parties unless the consumer has been given the opportunity to object and has not objected to such disclosure. Financial institutions are further required to disclose their privacy policies to customers annually. Financial institutions, however, will be required to comply with state law if it is more protective of consumer privacy than the GLB. The GLB also directed federal regulators, including the FDIC and the OCC, to prescribe standards for the security of consumer information. Seacoast Bank is subject to such standards, as well as standards for notifying customers in the event of a security breach. Under federal law, Seacoast Bank must disclose its privacy policy to consumers, permit customers to opt out of having nonpublic customer information disclosed to third parties in certain circumstances, and allow customers to opt out of receiving marketing solicitations based on information about the customer received from another subsidiary. States may adopt more extensive privacy protections. We are similarly required to have an information security program to safeguard the confidentiality and security of customer information and to ensure proper disposal. Customers must be notified when unauthorized disclosure involves sensitive customer information that may be misused.
Consumer Regulation. Activities of Seacoast Bank are subject to a variety of statutes and regulations designed to protect consumers. These laws and regulations include, among numerous other things, provisions that:
| · | limit the interest and other charges collected or contracted for by Seacoast Bank, including new rules respecting the terms of credit cards and of debit card overdrafts; |
| · | govern Seacoast Bank’s disclosures of credit terms to consumer borrowers; |
| · | require Seacoast Bank to provide information to enable the public and public officials to determine whether it is fulfilling its obligation to help meet the housing needs of the community it serves; |
| · | prohibit Seacoast Bank from discriminating on the basis of race, creed or other prohibited factors when it makes decisions to extend credit; |
| · | govern the manner in which Seacoast Bank may collect consumer debts; and |
| · | prohibit unfair, deceptive or abusive acts or practices in the provision of consumer financial products and services. |
19
The CFPB adopted a rule that implements the ability-to-repay and qualified mortgage provisions of the Dodd-Frank Act (the “ATR/QM rule”), which took effect on January 10, 2014, and has impacted our residential mortgage lending practices, and the residential mortgage market generally. The ATR/QM rule requires lenders to consider, among other things, income, employment status, assets, payment amounts, and credit history before approving a mortgage, and provides a compliance “safe harbor” for lenders that issue certain “qualified mortgages.” The ATR/QM rule defines a “qualified mortgage” to have certain specified characteristics, and generally prohibit loans with negative amortization, interest-only payments, balloon payments, or terms exceeding 30 years from being qualified mortgages. The rule also establishes general underwriting criteria for qualified mortgages, including that monthly payments be calculated based on the highest payment that will apply in the first five years of the loan and that the borrower have a total debt-to-income ratio that is less than or equal to 43 percent. While “qualified mortgages” will generally be afforded safe harbor status, a rebuttable presumption of compliance with the ability-to-repay requirements will attach to “qualified mortgages” that are “higher priced mortgages” (which are generally subprime loans). In addition, under rules that became effective December 24, 2015, the securitizer of asset-backed securities must retain not less than 5 percent of the credit risk of the assets collateralizing the asset-backed securities, unless subject to an exemption for asset-backed securities that are collateralized exclusively by residential mortgages that qualify as “qualified residential mortgages.” These definitions are expected to significantly shape the parameters for the majority of consumer mortgage lending in the U.S.
Reflecting the CFPB’s focus on the residential mortgage lending market, the CFPB has also issued rules to implement requirements of the Dodd-Frank Act pertaining to mortgage loan origination (including with respect to loan originator compensation and loan originator qualifications) and has finalized integrated mortgage disclosure rules that replace and combine certain requirements under the Truth in Lending Act and the Real Estate Settlement Procedures Act. In addition, the CFPB has issued rules that require servicers to comply with new standards and practices with regard to: error correction; information disclosure; force-placement of insurance; information management policies and procedures; requiring information about mortgage loss mitigation options be provided to delinquent borrowers; providing delinquent borrowers access to servicer personnel with continuity of contact about the borrower’s mortgage loan account; and evaluating borrowers’ applications for available loss mitigation options. These rules also address initial rate adjustment notices for adjustable-rate mortgages (ARMs), periodic statements for residential mortgage loans, and prompt crediting of mortgage payments and response to requests for payoff amounts.
It is anticipated that the CFPB will engage in numerous other rulemakings in the near term that may impact our business, as the CFPB has indicated that, in addition to specific statutory mandates, it is working on a wide range of initiatives to address issues in markets for consumer financial products and services. The CFPB has also undertaken an effort to “streamline” consumer regulations and has established a database to collect, track and make public consumer complaints, including complaints against individual financial institutions.
The CFPB also has broad authority to prohibit unfair, deceptive and abusive acts and practices (“UDAAP”) and to investigate and penalize financial institutions that violate this prohibition. While the statutory language of the Dodd-Frank Act sets forth the standards for acts and practices that violate this prohibition, certain aspects of these standards are untested, which has created some uncertainty regarding how the CFPB will exercise this authority. The CFPB has, however, begun to bring enforcement actions against certain financial institutions for UDAAP violations and issued some guidance on the topic, which provides insight into the agency’s expectations regarding these standards. Among other things, CFPB guidance and its UDAAP-related enforcement actions have emphasized that management of third-party service providers is essential to effective UDAAP compliance and that the CFPB is particularly focused on marketing and sales practices.
We cannot fully predict the effect that being regulated by an additional regulatory authority focused on consumer financial protection, or any new implementing regulations or revisions to existing regulations that may result from the establishment of this new authority, will have on our businesses.
The deposit operations of Seacoast Bank are also subject to laws and regulations that:
| · | require Seacoast Bank to adequately disclose the interest rates and other terms of consumer deposit accounts; |
| · | impose a duty on Seacoast Bank to maintain the confidentiality of consumer financial records and prescribe procedures for complying with administrative subpoenas of financial records; |
| · | require escheatment of unclaimed funds to the appropriate state agencies after the passage of certain statutory time frames; and, |
| · | govern automatic deposits to and withdrawals from deposit accounts with Seacoast Bank and the rights and liabilities of customers who use automated teller machines, or ATMs, and other electronic banking services. As described above, beginning in July 2010, new rules took effect that limited Seacoast Bank’s ability to charge fees for the payment of overdrafts for every day debit and ATM card transactions. |
20
Non-Discrimination Policies. Seacoast Bank is also subject to, among other things, the provisions of the Equal Credit Opportunity Act (the “ECOA”) and the Fair Housing Act (the “FHA”), both of which prohibit discrimination based on race or color, religion, national origin, sex, and familial status in any aspect of a consumer or commercial credit or residential real estate transaction. The Department of Justice (the “DOJ”), and the federal bank regulatory agencies have issued an Interagency Policy Statement on Discrimination in Lending that provides guidance to financial institutions in determining whether discrimination exists, how the agencies will respond to lending discrimination, and what steps lenders might take to prevent discriminatory lending practices. The DOJ has increased its efforts to prosecute what it regards as violations of the ECOA and FHA.
Enforcement Authority. Seacoast Bank and its “institution-affiliated parties,” including management, employees, agents, independent contractors and consultants, such as attorneys and accountants and others who participate in the conduct of the institution’s affairs, are subject to potential civil and criminal penalties for violations of law, regulations or written orders of a government agency. Violations can include failure to timely file required reports, filing false or misleading information or submitting inaccurate reports. Civil penalties may be as high as $1 million a day for such violations, and criminal penalties for some financial institution crimes may include imprisonment for 20 years. Regulators have flexibility to commence enforcement actions against institutions and institution-affiliated parties, and the FDIC has the authority to terminate deposit insurance. When issued by a banking agency, cease-and-desist orders may, among other things, require affirmative action to correct any harm resulting from a violation or practice, including restitution, reimbursement, indemnifications or guarantees against loss. A financial institution may also be ordered to restrict its growth, dispose of certain assets, rescind agreements or contracts, or take other actions determined to be appropriate by the ordering agency. The federal banking agencies also may remove a director or officer from an insured depository institution (or bar them from the industry) if a violation is willful or reckless.
Other Regulatory Matters. We and our subsidiaries are subject to oversight by the SEC, the Financial Industry Regulatory Authority, (“FINRA”), the PCAOB, NASDAQ and various state securities regulators. We and our subsidiaries have from time to time received requests for information from regulatory authorities in various states, including state attorneys general, securities regulators and other regulatory authorities, concerning our business practices. Such requests are considered incidental to the normal conduct of business.
Statistical Information
Certain statistical and financial information (as required by SEC Guide 3) is included in response to Item 7 of this Annual Report on Form 10-K. Certain additional statistical information is also included in response to Item 6 and Item 8 of this Annual Report on Form 10-K.
| Item 1A. | Risk Factors |
In addition to the other information contained in this Form 10-K, you should carefully consider the risks described below, as well as the risk factors and uncertainties discussed in our other public filings with the SEC under the caption “Risk Factors” in evaluating us and our business and making or continuing an investment in our stock. The risks contained in this Form 10-K are not the only risks that we face. Additional risks that are not presently known, or that we presently deem to be immaterial, could also harm our business, results of operations and financial condition and an investment in our stock. The trading price of our securities could decline due to the materialization of any of these risks, and our shareholders may lose all or part of their investment. This Form 10-K also contains forward-looking statements that may not be realized as a result of certain factors, including, but not limited to, the risks described herein and in our other public filings with the SEC. Please refer to the section in this Form 10-K entitled “Special Cautionary Notice Regarding Forward-Looking Statements” for additional information regarding forward-looking statements.
21
Risks Related to Our Business
A reduction in consumer confidence could negatively impact our results of operations and financial condition.
Significant market volatility driven in part by concerns relating to, among other things, actions by the U.S. Congress or imposed through Executive Order by the President of the U.S. could adversely affect the U.S. or global economies, with direct or indirect impacts on the Company and our business. Results could include drops in consumer and business confidence, credit deterioration, diminished capital markets activity, and delays in the Federal Reserve Board increases in interest rates.
Consumers may decide not to use banks to complete their financial transactions, which could affect our net income.
Technology and other changes now allow parties to complete financial transactions without banks. For example, consumers can pay bills, transfer funds directly and obtain loans without banks. This process could result in the loss of interest and fee income, as well as the loss of customer deposits and the income generated from those deposits. The impact to our loan growth may be more significant prospectively.
Further, clients may choose to conduct business with other market participants who engage in business or offer products in areas we deem speculative or risky, such as cryptocurrencies. Increased competition may negatively affect our earnings by creating pressure to lower prices or credit standards on our products and services requiring additional investment to improve the quality and delivery of our technology and/or reducing our market share, or affecting the willingness of our clients to do business with us.
In addition, the widespread adoption of new technologies, including internet services, cryptocurrencies and payment systems, could require substantial expenditures to modify or adapt our existing products and services as we grow and develop our internet banking and mobile banking channel strategies in addition to remote connectivity solutions. We might not be successful in developing or introducing new products and services, integrating new products or services into our existing offerings, responding or adapting to changes in consumer behavior, preferences, spending, investing and/or saving habits, achieving market acceptance of our products and services, reducing costs in response to pressures to deliver products and services at lower prices or sufficiently developing and maintaining loyal customers.
Our customers may pursue alternatives to bank deposits, causing us to lose a relatively inexpensive source of funding.
We may experience a decrease in customer deposits if customers perceive alternative investments, such as the stock market, as providing superior expected returns. When customers move money out of bank deposits in favor of alternative investments, we may lose a relatively inexpensive source of funds, and be forced to rely more heavily on borrowings and other sources of funding to fund our business and meet withdrawal demands, thereby increasing our funding costs and adversely affecting our net interest margin.
Our future success is dependent on our ability to compete effectively in highly competitive markets.
We operate from Ft. Lauderdale, Boca Raton and West Palm Beach north through the Daytona Beach area, into Orlando and Central Florida and the adjacent Tampa market, and west to Okeechobee and surrounding counties. Our future growth and success will depend on our ability to compete effectively in these and other potential markets. We compete for loans, deposits and other financial services in geographic markets with other local, regional and national commercial banks, thrifts, credit unions, mortgage lenders, and securities and insurance brokerage firms. Many of our competitors offer products and services different from us, and have substantially greater resources, name recognition and market presence than we do, which benefits them in attracting business. Larger competitors may be able to price loans and deposits more aggressively than we can, and have broader customer and geographic bases to draw upon.
Lending goals may not be attainable.
It may not be possible to safely, soundly and profitably make sufficient loans to creditworthy persons in the current economy to satisfy our prospective goals for commercial, residential and consumer lending volumes. Future demand for additional lending is unclear and uncertain, and opportunities to make loans may be more limited and/or involve risks or terms that we likely would not find acceptable or in our shareholders’ best interest. A failure to meet our lending goals could adversely affect our results of operation, and financial condition, liquidity and capital.
22
Deterioration in the real estate markets, including the secondary market for residential mortgage loans, can adversely affect us.
The effects of ongoing mortgage market challenges, combined with a correction in residential real estate market prices and reduced levels of home sales, could result in lower single family home values, adversely affecting the liquidity and value of collateral securing commercial loans for residential land acquisition, construction and development, as well as residential mortgage loans and residential property collateral securing loans that we hold, mortgage loan originations and gains on the sale of mortgage loans. Declining real estate prices cause higher delinquencies and losses on certain mortgage loans, generally, and particularly on second lien mortgages and home equity lines of credit. Significant ongoing disruptions in the secondary market for residential mortgage loans can limit the market for and liquidity of most residential mortgage loans other than conforming Fannie Mae and Freddie Mac loans. Deteriorating trends could occur, as various government programs to boost the residential mortgage markets and stabilize the housing markets wind down or are discontinued. Declines in real estate values, home sales volumes and financial stress on borrowers as a result of job losses, interest rate resets on adjustable rate mortgage loans or other factors could have adverse effects on borrowers that result in higher delinquencies and greater charge-offs in future periods, which would adversely affect our financial condition, including capital and liquidity, or results of operations. In the event our allowance for loan losses is insufficient to cover such losses, our earnings, capital and liquidity could be adversely affected.
Our real estate portfolios are exposed if weakness in the Florida housing market or general economy arises.
Florida has experienced deeper recessions and more dramatic slowdowns in economic activity than other states and a decline in real estate values in Florida can be significantly larger than the national average. Declines in home prices and the volume of home sales in Florida, along with the reduced availability of certain types of mortgage credit, can result in increases in delinquencies and losses in our portfolios of home equity lines and loans, and commercial loans related to residential real estate acquisition, construction and development. Declines in home prices coupled with high or increased unemployment levels can cause losses which adversely affect our earnings and financial condition, including our capital and liquidity.
Our concentration in commercial real estate loans could result in increased loan losses.
Commercial real estate (“CRE”) is cyclical and poses risks of loss to us due to our concentration levels and risks of the asset, especially during a difficult economy. As of December 31, 2017 and 2016, 47.9 percent and 50.2 percent of our loan portfolio were comprised of CRE loans, respectively. The banking regulators continue to give CRE lending greater scrutiny, and banks with higher levels of CRE loans are expected to have implemented improved underwriting, internal controls, risk management policies and portfolio stress testing, as well as higher levels of allowances for possible losses and capital levels as a result of CRE lending growth and exposures.
Seacoast Bank has a written CRE concentration risk management program and monitors its exposure to CRE; however, there is no guarantee that the program will be effective in managing our concentration in CRE.
Nonperforming assets could result in an increase in our provision for loan losses, which could adversely affect our results of operations and financial condition.
At December 31, 2017 and 2016, our nonperforming loans (which consist of nonaccrual loans) totaled $19.5 million and $18.1 million, or 0.5 percent and 0.6 percent of the loan portfolio, respectively. At December 31, 2017 and 2016, our nonperforming assets (which include foreclosed real estate and bank branches taken out of service) were $27.2 million and $28.0 million, or 0.4 percent and 0.6 percent of assets, respectively. Other real estate owned (“OREO”) included $3.8 million for branches taken out of service at December 31, 2017, versus $5.7 million at December 31, 2016. In addition, we had approximately $8.9 million and $3.8 million in accruing loans that were 30 days or more delinquent at December 31, 2017 and 2016, respectively. Our nonperforming assets adversely affect our net income in various ways. We generally do not record interest income on nonaccrual loans or OREO, thereby adversely affecting our income, and increasing our loan administration costs. When the only source of repayment expected is the underlying collateral, we are required to mark the related loan to the then fair market value of the collateral, which may result in a loss. These loans and OREO also increase our risk profile and the capital our regulators believe is appropriate in light of such risks. We may incur additional losses relating to an increase in nonperforming loans. If economic conditions and market factors negatively and/or disproportionately affect some of our larger loans, then we could see a sharp increase in our total net charge-offs and our provision for loan losses. Any further increase in our nonperforming assets and related increases in our provision for losses on loans could negatively affect our business and could have a material adverse effect on our capital, financial condition and results of operations.
23
Decreases in the value of these assets, or the underlying collateral, or in these borrowers’ performance or financial conditions, whether or not due to economic and market conditions beyond our control, could adversely affect our business, results of operations and financial condition. In addition, the resolution of nonperforming assets requires significant commitments of time from management and our personnel, which can be detrimental to the performance of their other responsibilities. There can be no assurance that we will not experience further increases in nonperforming loans in the future, or that nonperforming assets will not result in further losses in the future.
Our allowance for loan losses may prove inadequate or we may be adversely affected by credit risk exposures.
Our business depends on the creditworthiness of our customers. We periodically review our allowance for loan losses for adequacy considering economic conditions and trends, collateral values and credit quality indicators, including past charge-off experience and levels of past due loans and nonperforming assets. The determination of the appropriate level of the allowance for loan losses involves a high degree of subjectivity and judgment and requires us to make significant estimates of current credit risks and future trends, all of which may undergo material changes. We cannot be certain that our allowance for loan losses will be adequate over time to cover credit losses in our portfolio because of unanticipated adverse changes in the economy, market conditions or events adversely affecting specific customers, industries or markets, or borrower behaviors towards repaying their loans. Generally speaking, the credit quality of our borrowers can deteriorate as a result of economic downturns in our markets. Although the economy is stable and growing, if the credit quality of our customer base or their debt service behavior materially decreases, if the risk profile of a market, industry or group of customers declines or weakness in the real estate markets and other economics were to arise, or if our allowance for loan losses is not adequate, our business, financial condition, including our liquidity and capital, and results of operations could be materially adversely affected. In addition, bank regulatory agencies periodically review our allowance for loan losses and may require an increase in the provision for loan losses or the recognition of further loan charge-offs, based on judgments different than those of management. If charge-offs in future periods exceed the allowance for loan losses, we will need additional provisions to increase the allowance for loan losses, which would result in a decrease in net income and capital, and could have a material adverse effect on our financial condition and results of operations.
We must effectively manage our information systems risk. Disruptions to our information systems and security breaches could adversely affect our business and reputation.
We rely heavily on our communications and information systems to conduct our business. The financial services industry is undergoing rapid technological changes with frequent introductions of new technology-driven products and services. Our ability to compete successfully depends in part upon our ability to use technology to provide products and services that will satisfy customer demands. Many of the Company’s competitors invest substantially greater resources in technological improvements than we do. We may not be able to effectively implement new technology-driven products and services or be successful in marketing these products and services to our customers, which may negatively affect our business, results of operations or financial condition.
Our communications and information systems remain vulnerable to unexpected disruptions and failures. Any failure or interruption of these systems could impair our ability to serve our customers and to operate our business and could damage our reputation, result in a loss of business, subject us to additional regulatory scrutiny or enforcement or expose us to civil litigation and possible financial liability. While we have developed extensive recovery plans, we cannot assure that those plans will be effective to prevent adverse effects upon us and our customers resulting from system failures. While we maintain an insurance policy which we believe provides sufficient coverage at a manageable expense for an institution of our size and scope with similar technological systems, we cannot assure that this policy would be sufficient to cover all related financial losses and damages should we experience any one or more of our or a third party’s systems failing or experiencing a cyber-attack.
24
We collect and store sensitive data, including personally identifiable information of our customers and employees. Computer break-ins of our systems or our customers’ systems, thefts of data and other breaches and criminal activity may result in significant costs to respond, liability for customer losses if we are at fault, damage to our customer relationships, regulatory scrutiny and enforcement and loss of future business opportunities due to reputational damage. Although we, with the help of third-party service providers, will continue to implement security technology and establish operational procedures to protect sensitive data, there can be no assurance that these measures will be effective. We advise and provide training to our customers regarding protection of their systems, but there is no assurance that our advice and training will be appropriately acted upon by our customers or effective to prevent losses. In some cases we may elect to contribute to the cost of responding to cybercrime against our customers, even when we are not at fault, in order to maintain valuable customer relationships.
In our ordinary course of business, we rely on electronic communications and information systems to conduct our businesses and to store sensitive data, including financial information regarding our customers. The integrity of information systems of financial institutions are under significant threat from cyber-attacks by third parties, including through coordinated attacks sponsored by foreign nations and criminal organizations to disrupt business operations and other compromises to data and systems for political or criminal purposes. We employ an in-depth, layered, defense approach that leverages people, processes and technology to manage and maintain cyber security controls.
Notwithstanding the strength of our defensive measures, the threat from cyber-attacks is severe, attacks are sophisticated and attackers respond rapidly to changes in defensive measures. Cyber security risks may also occur with our third-party service providers, and may interfere with their ability to fulfill their contractual obligations to us, with attendant potential for financial loss or liability that could adversely affect our financial condition or results of operations. We offer our clients the ability to bank remotely and provide other technology based products and services, which services include the secure transmission of confidential information over the Internet and other remote channels. To the extent that our client’s systems are not secure or are otherwise compromised, our network could be vulnerable to unauthorized access, malicious software, phishing schemes and other security breaches. To the extent that our activities or the activities of our clients or third-party service providers involve the storage and transmission of confidential information, security breaches and malicious software could expose us to claims, regulatory scrutiny, litigation and other possible liabilities. While to date we have not experienced a significant compromise, significant data loss or material financial losses related to cyber security attacks, our systems and those of our clients and third-party service providers are under constant threat and it is possible that we could experience a significant event in the future. We may suffer material financial losses related to these risks in the future or we may be subject to liability for compromises to our client or third-party service provider systems. Any such losses or liabilities could adversely affect our financial condition or results of operations, and could expose us to reputation risk, the loss of client business, increased operational costs, as well as additional regulatory scrutiny, possible litigation, and related financial liability. These risks also include possible business interruption, including the inability to access critical information and systems.
We operate in a heavily regulated environment. Regulatory compliance burdens and associated costs have increased and adversely affect our business.
We and our subsidiaries are regulated by several regulators, including, but not limited to, the Federal Reserve, the OCC, the SEC, the FDIC, NASDAQ, and the CFPB. Our success is affected by state and federal regulations affecting banks and bank holding companies, the securities markets and banking, securities and insurance regulators. Banking regulations are primarily intended to protect consumers and depositors, not shareholders. The financial services industry also is subject to frequent legislative and regulatory changes and proposed changes, the effects of which cannot be predicted. These changes, if adopted, could require us to maintain more capital, liquidity and risk controls which could adversely affect our growth, profitability and financial condition.
The Dodd-Frank Act directs applicable regulatory authorities to promulgate regulations implementing its provisions, and its effect on the Company and on the financial services industry as a whole will be clarified as those regulations are issued. Certain provisions of the Act have been implemented by regulation, while others are expected to be implemented in the coming years. The Dodd-Frank Act addresses a number of issues, including capital requirements, compliance and risk management, debit card overdraft fees, healthcare, incentive compensation, expanded disclosures and corporate governance. The Dodd-Frank Act established the CFPB, which has broad independent rulemaking, supervisory and enforcement authority over consumer financial products and services, including deposit products, residential mortgages, home equity loans and credit cards.
25
The Dodd-Frank Act has increased our regulatory compliance burden in recent years, and may continue to do so as the CFPB and other agencies amend existing regulations or adopt new ones as required by the Act. Any such changes in law can impact the profitability of our business activities, require changes to our operating polices and polices, or otherwise adversely impact our business.
The CFPB’s issued rules may have a negative impact on our loan origination process, and compliance and collection costs, which could adversely affect our mortgage lending operations and operating results.
The CFPB has issued mortgage-related rules required under the Dodd-Frank act addressing borrower ability-to-repay and qualified mortgage standards. The CFPB has also issued rules for loan originators related to compensation, licensing requirements, administration capabilities and restrictions on pursuance of delinquent borrowers. These rules could have a negative effect on the financial performance of Seacoast Bank’s mortgage lending operations such as limiting the volume of mortgage originations and sales into the secondary market, increased compliance burden and impairing Seacoast Bank’s ability to proceed against certain delinquent borrowers with timely and effective collection efforts.
Higher FDIC deposit insurance premiums and assessments could adversely affect our financial condition.
FDIC insurance premiums we pay may change and be significantly higher in the future. Market developments may significantly deplete the insurance fund of the FDIC and further reduce the ratio of reserves to insured deposits, thereby making it requisite upon the FDIC to charge higher premiums prospectively.
Changes in accounting and tax rules applicable to banks could adversely affect our financial condition and results of operations.
From time to time, the Financial Accounting Standards Board (the “FASB”) and the SEC change the financial accounting and reporting standards that govern the preparation of our financial statements. These changes can be hard to predict and can materially impact how we record and report our financial condition and results of operations. In some cases, we could be required to apply a new or revised standard retroactively, resulting in a restatement of our prior period financial statements.
The Tax Cuts and Jobs Act of 2017 may have an immediate or retroactive impact on net income, shareholders’ equity and the Company’s regulatory capital ratios.
On December 22, 2017, the President of the United States signed the Tax Cuts and Jobs Act (the “Tax Reform Act”) into law. Under the Tax Reform Act, the highest marginal tax rate for corporations has been lowered from 35% to 21% resulting in a reduction to the Company’s deferred tax assets (“DTA’s”). This remeasurement resulted in an immediate, one-time adjustment increasing the provision for taxes, and lowering net income for the fourth quarter of 2017 by $8.6 million. Over prospective periods, a lower federal tax rate could result in improved net income performance. We believe the initial impact of a reduction to the federal rate, and the resultant reduction to DTA’s and capital, via higher tax provisioning at inception, will be recovered with lower tax provisioning prospectively from the date of inception. The reduction in our DTA’s negatively impacts our capital ratios (as a small portion of our DTA is includable in regulatory capital calculations) but not below well-capitalized levels, as defined by our regulators. As higher net income is recorded due to lower tax provisioning, and increases shareholders’ equity, the detrimental impact to capital ratios will diminish and accrete capital over time.
26
Our ability to realize our deferred tax assets may be further reduced in the future if our estimates of future taxable income from our operations and tax planning strategies do not support our deferred tax amount. Additionally, the amount of net operating loss carry-forwards and certain other tax attributes realizable for income tax purposes may be reduced under Section 382 of the Internal Revenue Code (“Section 382”) by issuance of our capital securities or purchase of concentrations by investors.
As of December 31, 2017, we had DTAs of $25.4 million, based on management’s estimation of the likelihood of those DTAs being realized. These and future DTA’s may be reduced in the future if our estimates of future taxable income from our operations and tax planning strategies do not support the amounts recorded.
The Company recorded income for 2017, 2016 and 2015. Management expects to realize the $25.4 million in DTAs well in advance of the statutory carryforward period, based on its forecast of future taxable income. We consider positive and negative evidence, including the impact of reversals of existing taxable temporary differences, tax planning strategies and projected earnings within the statutory tax loss carryover period. This process requires significant judgment by management about matters that are by nature uncertain. If we were to conclude that significant portions of our DTAs were not more likely than not to be realized (due to operating results or other factors), a requirement to establish a valuation allowance could adversely affect our financial position and results of operations.
The amount of net operating loss carry-forwards and certain other tax attributes realizable annually for income tax purposes may be reduced by an offering and/or other sales of our capital securities, including transactions in the open market by 5% or greater shareholders, if an ownership change is deemed to occur under Section 382. The determination of whether an ownership change has occurred under Section 382 is highly fact-specific and can occur through one or more acquisitions of capital stock (including open market trading) if the result of such acquisitions is that the percentage of our outstanding common stock held by shareholders or groups of shareholders owning at least 5% of our common stock at the time of such acquisition, as determined under Section 382, is more than 50 percentage points higher than the lowest percentage of our outstanding common stock owned by such shareholders or groups of shareholders within the prior three-year period. Management does not believe any stock offerings, issuances, or reverse stock split have any negative implications for the Company under Section 382. Deferred taxes for Section 382 events netting to $0.9 million were recorded by BANKshares for acquisition activity prior to our merger on October 1, 2014, and were migrated and recorded to the Company’s financial statements.
Future acquisition and expansion activities may disrupt our business, dilute existing shareholders and adversely affect our operating results.
We periodically evaluate potential acquisitions and expansion opportunities. To the extent we grow through acquisition, we cannot assure you that we will be able to adequately or profitably manage this growth. Acquiring other banks, branches or businesses, as well as other geographic and product expansion activities, involve various risks including:
| · | risks of unknown or contingent liabilities; |
| · | unanticipated costs and delays; |
| · | risks that acquired new businesses do not perform consistent with our growth and profitability expectations; |
| · | risks of entering new market or product areas where we have limited experience; |
| · | risks that growth will strain out infrastructure, staff, internal controls and management, which may require additional personnel, time and expenditures; |
| · | exposure to potential asset quality issues with acquired institutions; |
| · | difficulties, expenses and delays of integrating the operations and personnel of acquired institutions, and start-up delays and costs of other expansion activities; |
27
| · | potential disruptions to our business; |
| · | possible loss of key employees and customers of acquired institutions; |
| · | potential short-term decrease in profitability; and |
| · | diversion of our management’s time and attention from our existing operations and businesses. |
Our business strategy includes significant growth plans, and our financial condition and results of operations could be negatively affected if we fail to grow or fail to manage our growth effectively.
We intend to pursue an organic growth strategy for our business while also regularly evaluating potential acquisitions and expansion opportunities. If appropriate opportunities present themselves, we expect to engage in selected acquisitions of financial institutions, branch acquisitions and other business growth initiatives or undertakings. There can be no assurance that we will successfully identify appropriate opportunities, that we will be able to negotiate or finance such activities or that such activities, if undertaken, will be successful.
There are risks associated with our growth strategy. To the extent that we grow through acquisitions, we cannot ensure that we will be able to adequately or profitably manage this growth. Acquiring other banks, branches or other assets, as well as other expansion activities, involves various risks including the risks of incorrectly assessing the credit quality of acquired assets, encountering greater than expected costs of integrating acquired banks or branches into us, the risk of loss of customers and/or employees of the acquired institution or branch, executing cost savings measures, not achieving revenue enhancements and otherwise not realizing the transaction’s anticipated benefits. Our ability to address these matters successfully cannot be assured. In addition, our strategic efforts may divert resources or management’s attention from ongoing business operations, may require investment in integration and in development and enhancement of additional operational and reporting processes and controls and may subject us to additional regulatory scrutiny.
Our growth initiatives may also require us to recruit and retain experienced personnel to assist in such initiatives. Accordingly, the failure to identify and retain such personnel would place significant limitations on our ability to successfully execute our growth strategy. In addition, to the extent we expand our lending beyond our current market areas, we could incur additional risks related to those new market areas. We may not be able to expand our market presence in our existing market areas or successfully enter new markets.
If we do not successfully execute our acquisition growth plan, it could adversely affect our business, financial condition, results of operations, reputation and growth prospects. In addition, if we were to conclude that the value of an acquired business had decreased, that conclusion may result in an impairment charge to goodwill or other tangible or intangible assets, which would adversely affect our results of operations. While we believe we have the executive management resources and internal systems in place to successfully manage our future growth, there can be no assurance growth opportunities will be available or that we will successfully manage our growth.
Additionally, we may pursue divestitures of non-strategic branches or other assets. Such divestitures involve various risks, including the risks of not being able to timely or fully replace liquidity previously provided by deposits which may be transferred as part of a divestiture, which could adversely affect our financial condition and results of operations.
28
Liquidity risks could affect operations and jeopardize our financial condition.
Liquidity is essential to our business. An inability to raise funds through deposits, borrowings, the sale of loans and other sources could have a substantial negative effect on our liquidity. Our non-core funding sources include federal funds purchases, securities sold under repurchase agreements, non-core deposits, and short- and long-term debt. We are also members of the Federal Home Loan Bank of Atlanta (the “FHLB”) and the Federal Reserve Bank of Atlanta, where we can obtain advances collateralized with eligible assets. We maintain a portfolio of securities that can be used as a secondary source of liquidity. There are also other sources of liquidity available to us or Seacoast Bank should they be needed, including our ability to acquire additional non-core deposits, the issuance and sale of debt securities, and the issuance and sale of preferred or common securities in public or private transactions.
Our access to funding sources in amounts adequate or on terms which are acceptable to us could be impaired by other factors that affect us specifically or the financial services industry or economy in general. Factors that could detrimentally impact our access to liquidity sources include a downturn in the markets in which our loans are concentrated or adverse regulatory action against us. In addition, our access to deposits may be affected by the liquidity and/or cash flow needs of depositors. Although we have historically been able to replace maturing deposits and FHLB advances as necessary, we might not be able to replace such funds in the future and can lose a relatively inexpensive source of funds and increase our funding costs if, among other things, customers move funds out of bank deposits and into alternative investments, such as the stock market, that may be perceived as providing superior expected returns. We may be required to seek additional regulatory capital through capital raises at terms that may be very dilutive to existing shareholders.
Our ability to borrow could also be impaired by factors that are not specific to us, such as disruptions in the financial markets or negative views and expectations about the prospects for the financial services industry.
Our ability to receive dividends from our subsidiaries could affect our liquidity and ability to pay interest on our trust preferred securities or reinstate dividends.
We are a legal entity separate and distinct from Seacoast Bank and our other subsidiaries. Our primary source of revenue consists of dividends from Seacoast Bank. These dividends are the principal source of funds to pay dividends on our common stock, interest on our trust preferred securities and interest and principal on our debt. Various laws and regulations limit the amount of dividends that Seacoast Bank may pay us. Also, our right to participate in a distribution of assets upon a subsidiary’s liquidation or reorganization is subject to the prior claims of the subsidiary’s creditors. Limitations on our ability to receive dividends from our subsidiaries could have a material adverse effect on our liquidity and on our ability to pay dividends on common stock. Additionally, if our subsidiaries’ earnings are not sufficient to make dividend payments to us while maintaining adequate capital levels, we may not be able to make payments on our trust preferred securities or reinstate dividend payments to our common shareholders. We currently do not expect to pay dividends on our common stock to shareholders and expect to retain all earnings, if any, to support our growth.
We must effectively manage our interest rate risk. The impact of changing interest rates on our results is difficult to predict and changes in interest rates may impact our performance in ways we cannot predict.
Our profitability is dependent to a large extent on our net interest income, which is the difference between the interest income paid to us on our loans and investments and the interest we pay to third parties such as our depositors, lenders and debt holders. Changes in interest rates can impact our profits and the fair values of certain of our assets and liabilities. Prolonged periods of unusually low interest rates may have an incrementally adverse effect on our earnings by reducing yields on loans and other earning assets over time. Increases in market interest rates may reduce our customers’ desire to borrow money from us or adversely affect their ability to repay their outstanding loans by increasing their debt service obligations through the periodic reset of adjustable interest rate loans. If our borrowers’ ability to pay their loans is impaired by increasing interest payment obligations, our level of nonperforming assets would increase, producing an adverse effect on operating results. Increases in interest rates can have a material impact on the volume of mortgage originations and re-financings, adversely affecting the profitability of our mortgage finance business. Interest rate risk can also result from mismatches between the dollar amounts of re-pricing or maturing assets and liabilities and from mismatches in the timing and rates at which our assets and liabilities re-price. We actively monitor and manage the balances of our maturing and re-pricing assets and liabilities to reduce the adverse impact of changes in interest rates, but there can be no assurance that we will be able to avoid material adverse effects on our net interest margin in all market conditions.
29
Federal prohibitions on the ability of financial institutions to pay interest on commercial demand deposit accounts were repealed in 2011 by the Dodd-Frank Act. This change has had limited impact to date due to the excess of commercial liquidity and the very low rate environment in recent years. There can be no assurance that we will not be materially adversely affected in the future if economic activity increases and interest rates rise, which may result in our interest expense increasing, and our net interest margin decreasing, if we must offer interest on commercial demand deposits to attract or retain customer deposits.
We are required to maintain capital to meet regulatory requirements, and if we fail to maintain sufficient capital, whether due to losses, growth opportunities, or an inability to raise additional capital or otherwise, our financial condition, liquidity and results of operations, as well as our compliance with regulatory requirements, would be adversely affected.
Both we and Seacoast Bank must meet regulatory capital requirements and maintain sufficient liquidity and our regulators may modify and adjust such requirements in the future. Our ability to raise additional capital, when and if needed in the future, will depend on conditions in the capital markets, general economic conditions and a number of other factors, including investor perceptions regarding the banking industry and the market, governmental activities, many of which are outside our control, and on our financial condition and performance. Accordingly, we cannot assure you that we will be able to raise additional capital if needed or on terms acceptable to us. If we fail to meet these capital and other regulatory requirements, our financial condition, liquidity and results of operations would be materially and adversely affected.
Although we currently comply with all capital requirements, we will be subject to more stringent regulatory capital ratio requirements in the future and we may need additional capital in order to meet those requirements. Our failure to remain “well capitalized” for bank regulatory purposes could affect customer confidence, our ability to grow, our costs of funds and FDIC insurance costs, our ability to resume payments of dividends on common stock, make distributions on our trust preferred securities, our ability to make acquisitions, and our business, results of operations and financial condition, generally. Under FDIC rules, if Seacoast Bank ceases to be a “well capitalized” institution for bank regulatory purposes, its ability to accept brokered deposits and the interest rates that it pays may both be restricted.
Our cost of funds may increase as a result of general economic conditions, FDIC insurance assessments, interest rates and competitive pressures.
We have traditionally obtained funds through local deposits and thus we have a base of lower cost transaction deposits. Generally, we believe local deposits are a cheaper and more stable source of funds than other borrowings because interest rates paid for local deposits are typically lower than interest rates charged for borrowings from other institutional lenders and reflect a mix of transaction and time deposits, whereas brokered deposits typically are higher cost time deposits. Our costs of funds and our profitability and liquidity are likely to be adversely affected if, and to the extent, we have to rely upon higher cost borrowings from other institutional lenders or brokers to fund loan demand or liquidity needs, and changes in our deposit mix and growth could adversely affect our profitability and the ability to expand our loan portfolio.
30
Federal banking agencies periodically conduct examinations of our business, including for compliance with laws and regulations, and our failure to comply with any supervisory actions to which we are or become subject as a result of such examinations may adversely affect us.
The Federal Reserve and the OCC periodically conduct examinations of our business and Seacoast Bank’s business, including for compliance with laws and regulations, and Seacoast Bank also may be subject to future regulatory examinations by the CFPB as discussed in the “Supervision and Regulation” section above. If, as a result of an examination, the Federal Reserve, the OCC and/or the CFPB were to determine that the financial condition, capital resources, asset quality, asset concentrations, earnings prospects, management, liquidity, sensitivity to market risk, or other aspects of any of our or Seacoast Bank’s operations had become unsatisfactory, or that we or our management were in violation of any law, regulation or guideline in effect from time to time, the regulators may take a number of different remedial actions as they deem appropriate. These actions include the power to enjoin “unsafe or unsound” practices, to require affirmative actions to correct any conditions resulting from any violation or practice, to issue an administrative order that can be judicially enforced, to direct an increase in our capital, to restrict our growth, to change the composition of our concentrations in portfolio or balance sheet assets, to assess civil monetary penalties against our officers or directors or to remove officers and directors.
We are dependent on key personnel and the loss of one or more of those key personnel could harm our business.
Our future success significantly depends on the continued services and performance of our key management personnel. We believe our management team’s depth and breadth of experience in the banking industry is integral to executing our business plan. We also will need to continue to attract, motivate and retain other key personnel. The loss of the services of members of our senior management team or other key employees or the inability to attract additional qualified personnel as needed could have a material adverse effect on our business, financial position, results of operations and cash flows.
We are subject to losses due to fraudulent and negligent acts on the part of loan applicants, mortgage brokers, other vendors and our employees.
When we originate mortgage loans, we rely heavily upon information supplied by loan applicants and third parties, including the information contained in the loan application, property appraisal, title information and employment and income documentation provided by third parties. If any of this information is misrepresented and such misrepresentation is not detected prior to loan funding, we generally bear the risk of loss associated with the misrepresentation.
We are subject to internal control reporting requirements that increase compliance costs and failure to comply with such requirements could adversely affect our reputation and the value of our securities.
We are required to comply with various corporate governance and financial reporting requirements under the Sarbanes-Oxley Act of 2002, as well as rules and regulations adopted by the SEC, the Public Company Accounting Oversight Board and NASDAQ. In particular, we are required to include management and independent registered public accounting firm reports on internal controls as part of our Annual Report on Form 10-K pursuant to Section 404 of the Sarbanes-Oxley Act. The SEC also has proposed a number of new rules or regulations requiring additional disclosure, such as lower-level employee compensation. We expect to continue to spend significant amounts of time and money on compliance with these rules. Our failure to track and comply with the various rules may materially adversely affect our reputation, ability to obtain the necessary certifications to financial statements, and the value of our securities.
Our controls and procedures may fail or be circumvented.
Management regularly reviews and updates our internal controls over financial reporting, disclosure controls and procedures, and corporate governance policies and procedures. Any system of controls, however well designed and operated, is based in part on certain assumptions and can provide only reasonable, not absolute, assurances that the objectives of the system are met. Any failure or circumvention of our controls and procedures or failure to comply with regulations related to controls and procedures could have a material adverse effect on our business, results of operations and financial condition.
Our operations rely on external vendors.
We rely on certain external vendors to provide products and services necessary to maintain our day-to-day operations, particularly in the areas of operations, treasury management systems, information technology and security, exposing us to the risk that these vendors will not perform as required by our agreements. An external vendor’s failure to perform in accordance with our agreement could be disruptive to our operations, which could have a material adverse impact on our business, financial condition and results of operations. Our regulators also impose requirements on us with respect to monitoring and implementing adequate controls and procedures in connection with our third party vendors.
31
From time to time, we may decide to retain a new vendor for new or existing products and services. Transition to these new vendors may not proceed as anticipated and could negatively impact our customers or our ability to conduct business, which, in turn, could have an adverse effect on our business, results of operations and financial condition.
The anti-takeover provisions in our Articles of Incorporation and under Florida law may make it more difficult for takeover attempts that have not been approved by our board of directors.
Florida law and our Articles of Incorporation include anti-takeover provisions, such as provisions that encourage persons seeking to acquire control of us to consult with our board, and which enable the board to negotiate and give consideration on behalf of us and our shareholders and other constituencies to the merits of any offer made. Such provisions, as well as supermajority voting and quorum requirements, and a staggered board of directors, may make any takeover attempts and other acquisitions of interests in us, by means of a tender offer, open market purchase, a proxy fight or otherwise, that have not been approved by our board of directors more difficult and more expensive. These provisions may discourage possible business combinations that a majority of our shareholders may believe to be desirable and beneficial. As a result, our board of directors may decide not to pursue transactions that would otherwise be in the best interests of holders of our common stock.
Hurricanes or other adverse weather events could negatively affect our local economies or disrupt our operations, which would have an adverse effect on our business and results of operations.
Our market areas in Florida are susceptible to hurricanes, tropical storms and related flooding and wind damage. Such weather events can disrupt operations, result in damage to properties and negatively affect the local economies in the markets where we operate. We cannot predict whether or to what extent damage that may be caused by future hurricanes will affect our operations or the economies in our current or future market areas, but such weather events could result in a decline in loan originations, a decline in the value or destruction of properties securing our loans and an increase in delinquencies, foreclosures or loan losses. Our business and results of operations may be adversely affected by these and other negative effects of future hurricanes, tropical storms, related flooding and wind damage and other similar weather events. As a result of the potential for such weather events, many of our customers have incurred significantly higher property and casualty insurance premiums on their properties located in our markets, which may adversely affect real estate sales and values in our markets.
Risks Related to our Common Stock
We may issue additional shares of common or preferred stock, which may dilute the interests of our shareholders and may adversely affect the market price of our common stock.
We are currently authorized to issue up to 60 million shares of common stock, of which 46.9 million shares were outstanding as of December 31, 2017, and up to 4 million shares of preferred stock, of which no shares are outstanding. Subject to certain NASDAQ requirements, our board of directors has authority, without action or vote of the shareholders, to issue all or part of the remaining authorized but unissued shares and to establish the terms of any series of preferred stock. These authorized but unissued shares could be issued on terms or in circumstances that could dilute the interests of other shareholders.
Our stock price is subject to fluctuations, and the value of your investment may decline.
The trading price of our common stock is subject to wide fluctuations during certain periods, and may be subject to fluctuations in the future. The stock market in general, and the market for the stocks of commercial banks and other financial services companies in particular, has experienced significant price and volume fluctuations that sometimes have been unrelated or disproportionate to the operating performance of those companies. These broad market and industry factors may seriously harm the market price of our common stock, regardless of our operating performance, and the value of your investment may decline.
32
Securities analysts might not continue coverage on our common stock, which could adversely affect the market for our common stock.
The trading price of our common stock depends in part on the research and reports that securities analysts publish about us and our business. We do not have any control over these analysts, and they may not continue to cover our common stock. If securities analysts do not continue to cover our common stock, the lack of research coverage may adversely affect its market price. If securities analysts continue to cover our common stock, and our common stock is the subject of an unfavorable report, the price of our common stock may decline. If one or more of these analysts cease to cover us or fail to publish regular reports on us, we could lose visibility in the financial markets, which could cause the price or trading volume of our common stock to decline.
Offerings of debt, which would rank senior to our common stock upon liquidation, may adversely affect the market price of our common stock.
We may attempt to increase our capital resources or, if our or Seacoast Bank’s regulatory capital ratios fall below the required minimums, we could be forced to raise additional capital by making additional offerings of debt or equity securities, senior or subordinated notes, preferred stock and common stock. Upon liquidation, holders of our debt securities and lenders with respect to other borrowings will receive distributions of our available assets prior to the holders of our common stock.
Shares of our common stock are not insured deposits and may lose value.
Shares of our common stock are not savings accounts, deposits or other obligations of any depository institution and are not insured or guaranteed by the FDIC or any other governmental agency or instrumentality, any other deposit insurance fund or by any other public or private entity, and are subject to investment risk, including the possible loss of principal.
| Item 1B. | Unresolved Staff Comments |
None.
| Item 2. | Properties |
Seacoast’s main office occupies all of a 68,000 square foot building in Stuart, Florida. This building, together with an adjacent 10-lane drive-through banking facility and an additional 27,000-square foot office building are situated on approximately eight acres of land in the center of Stuart that is zoned for commercial use. The buildings and land are owned by Seacoast Bank, which leases out portions of the 27,000-square foot building not utilized by us and Seacoast Bank to unaffiliated third parties.
Adjacent to the main office, Seacoast Bank leases approximately 21,400 square feet of office space from third parties to house operational departments, consisting primarily of information systems and retail support. Seacoast Bank owns its equipment, which is used for servicing bank deposits and loan accounts as well as on-line banking services, and providing tellers and other customer service personnel with access to customers’ records. In addition, Seacoast Bank owns an operations center consisting of a 4,939 square foot building situated on 1.44 acres in Okeechobee, Florida. Seacoast Bank contracts with a third party in Nashville, Tennessee to provide network backup services for disaster recovery should natural disasters or other events preclude the use of Seacoast Bank’s primary operations center.
33
Seacoast currently operates its Seacoast Marine Finance Division in a 2,009 square foot leased facility in Ft. Lauderdale, Florida, and has representation in California and Texas.
Seacoast Business Funding, a receivables factoring division of Seacoast Bank, occupies 6,000 square feet of leased space in Boynton Beach, Florida.
Seacoast Bank owns or leases all of the real property and/or buildings in which we operate our business. At December 31, 2017, we and our subsidiaries had 50 branch offices, five commercial lending offices and its main office in Florida. At December 31, 2017, the net carrying value of these offices (excluding the main office) was approximately $49.6 million.
For additional information regarding our properties, please refer to Notes G and K of the Notes to Consolidated Financial Statements.
| Item 3. | Legal Proceedings |
We and our subsidiaries are subject, in the ordinary course, to litigation incidental to the businesses in which we are engaged. Management presently believes that none of the legal proceedings to which we are a party are likely to have a material effect on our consolidated financial position, operating results or cash flows, although no assurance can be given with respect to the ultimate outcome of any such claim or litigation.
| Item 4. | Mine Safety Disclosures |
Not applicable.
| Item 5. | Market For Registrant’s Common Equity, Related Stockholder Matters and Issuer Purchases of Equity Securities |
Holders of our common stock are entitled to one vote per share on all matters presented to shareholders as provided in our Articles of Incorporation.
34
Our common stock is traded under the symbol “SBCF” on the Nasdaq Global Select Market, which is a national securities exchange (“NASDAQ”). As of January 31, 2018 there were 46,917,528 shares of our common stock outstanding, held by approximately 1,818 record holders.
The table below sets forth the high and low sale prices per share of our common stock on NASDAQ for the indicated periods. We have not paid dividends to our shareholders since 2009.
| Sales Price per Share of | ||||||||
| Seacoast Common Stock | ||||||||
| High | Low | |||||||
| 2016 | ||||||||
| First Quarter | $ | 16.22 | $ | 13.40 | ||||
| Second Quarter | 17.19 | 15.21 | ||||||
| Third Quarter | 17.80 | 15.50 | ||||||
| Fourth Quarter | 22.91 | 15.85 | ||||||
| 2017 | ||||||||
| First Quarter | $ | 25.13 | $ | 20.59 | ||||
| Second Quarter | 25.88 | 21.65 | ||||||
| Third Quarter | 24.87 | 20.58 | ||||||
| Fourth Quarter | 27.13 | 22.42 | ||||||
Dividends from Seacoast Bank are our primary source of funds to pay dividends on our common stock. Under the National Bank Act, national banks may in any calendar year, without the approval of the OCC, pay dividends to the extent of net profits for that year, plus retained net profits for the preceding two years (less any required transfers to surplus). The need to maintain adequate capital in Seacoast Bank also limits dividends that may be paid to us.
Any dividends paid on our common stock would be declared and paid at the discretion of our board of directors and would be dependent upon our liquidity, financial condition, results of operations, capital requirements and such other factors as our board of directors may deem relevant. We do not expect to pay dividends on our common stock in the immediate future and expect to retain any earnings to support our growth.
Additional information regarding restrictions on the ability of Seacoast Bank to pay dividends to us is contained in Note C of the Notes to Consolidated Financial Statements. See “Item 1. Business- Payment of Dividends” of this Form 10-K for information with respect to the regulatory restrictions on dividends.
Securities Authorized for Issuance Under Equity Compensation Plans
See the information included under Part III, Item 12, which is incorporated in response to this item by reference.
| Item 6. | Selected Financial Data |
Five years of selected financial data of the Company is set forth under the caption “Financial Highlights” on page 104.
| Item 7. | Management’s Discussion and Analysis of Financial Condition and Results of Operations |
Management’s Discussion and Analysis of Financial Condition and Results of Operations appears under the caption “Management’s Discussion and Analysis of Financial Condition and Results of Operations” on pages 45-84.
35
| Item 7A. | Quantitative and Qualitative Disclosures About Market Risk |
For discussion of the quantitative and qualitative disclosures about market risk, see “Interest Rate Sensitivity,” “Securities,” and “Market Risk” sections of Management’s Discussion and Analysis of Financial Condition and Results of Operations on pages 82, 62-63, and pages 82-83.
| Item 8. | Financial Statements and Supplementary Data |
The report of Crowe Horwath LLP, independent registered public accounting firm and the Consolidated Financial Statements and Notes appear on pages 105-168. Quarterly Consolidated Income Statements are included on page 103 entitled “Selected Quarterly Financial Information”.
| Item 9. | Changes in and Disagreements with Accountants on Accounting and Financial Disclosure |
None.
| Item 9A. | Controls and Procedures |
| (a) | Evaluation of Disclosure Controls and Procedures |
We maintain disclosure controls and procedures that are designed to ensure that information required to be disclosed in our reports under the Exchange Act is recorded, processed, summarized and reported within the time periods specified in the SEC’s rules and forms, and that such information is accumulated and communicated to management, including our Chief Executive Officer (“CEO”) and Chief Financial Officer (“CFO”), as appropriate, to allow timely decisions regarding required disclosure. In designing and evaluating our disclosure controls and procedures, as defined in SEC Rule 13a-15 under the Exchange Act, management recognized that any controls and procedures, no matter how well designed and operated, can provide only reasonable assurance of achieving the desired control objectives.
In connection with the preparation of this Annual Report on Form 10-K, as of the end of the period covered by this report, an evaluation was performed, with the participation of the CEO and CFO, of the effectiveness of our disclosure controls and procedures, as required by Rule 13a-15 of the Exchange Act. Based upon that evaluation, the CEO and CFO concluded that our disclosure controls and procedures were effective as of the end of the period covered by this report.
| (b) | Management’s Report on Internal Control over Financial Reporting |
Management is responsible for establishing and maintaining adequate internal control over financial reporting for the Company. Our internal control system was designed to provide reasonable assurance to our management and board of directors regarding the reliability of financial reporting and the preparation of financial statements for external purposes.
Management conducted an assessment of the effectiveness of our internal control over financial reporting as of December 31, 2017. This assessment was based on the criteria set forth by the Committee of Sponsoring Organizations of the Treadway Commission in Internal Control—Integrated Framework 2013. Based on this assessment, management believes that, as of December 31, 2017, our internal control over financial reporting was effective.
Our independent registered public accounting firm, Crowe Horwath LLP, has issued an audit report on our internal control over financial reporting which is included herein.
| (c) | Change in Internal Control Over Financial Reporting |
During 2016 and 2017, there were no changes in our internal control over financial reporting that occurred or that have materially affected, or are reasonably likely to materially affect, our internal control over financial reporting.
| Item 9B. | Other Information. |
None.
36
| Item 10. | Directors, Executive Officers and Corporate Governance |
Information concerning our directors and executive officers is set forth under the headings “Proposal 1 - Election of Directors,” “Corporate Governance,” “Section 16(a) Beneficial Ownership Reporting Compliance” and “Certain Transactions and Business Relationships” in the 2018 Proxy Statement, incorporated herein by reference.
| Item 11. | Executive Compensation |
Information regarding the compensation paid by us to our directors and executive officers is set forth under the headings “Executive Compensation,” “Compensation Discussion & Analysis,” “Compensation and Governance Committee Report” and “2017 Director Compensation” in the 2018 Proxy Statement which are incorporated herein by reference.
| Item 12. | Security Ownership of Certain Beneficial Owners and Management and Related Stockholder Matters |
The following table sets forth information about our common stock that may be issued under all of our existing compensation plans as of December 31, 2017.
Equity Compensation Plan Information
| Number of securities | ||||||||||||
| remaining available | ||||||||||||
| (a) | for future issuance | |||||||||||
| Number of securities | Weighted average | under equity | ||||||||||
| to be issued upon | exercise price of | compensation plans | ||||||||||
| exercise of outstanding | outstanding | (excluding securities | ||||||||||
| options, warrants | options, warrants | represented | ||||||||||
| Plan Category | and rights | and rights | in column (a)) | |||||||||
| Equity compensation plans approved by shareholders: | ||||||||||||
| 2000 Plan (1) | 0 | $ | 0.00 | 0 | ||||||||
| 2008 Plan (2) | 0 | 0.00 | 0 | |||||||||
| 2013 Plan (3) | 951,349 | 17.29 | 598,913 | |||||||||
| Employee Stock Purchase Plan (4) | 0 | 0.00 | 84,659 | |||||||||
| TOTAL | 951,349 | $ | 17.29 | 683,572 | ||||||||
| (1) | Seacoast Banking Corporation of Florida 2000 Long-Term Incentive Plan. Shares reserved under this plan are available for issuance pursuant to the exercise of stock options and stock appreciation rights granted under the plan, as well as vesting of performance award shares, and awards of restricted stock or stock-based awards, previously issued. |
| (2) | Seacoast Banking Corporation of Florida 2008 Long-Term Incentive Plan. Shares reserved under this plan are available for issuance pursuant to the exercise of stock options and stock appreciation rights granted under the plan, as well as vesting of performance award shares, and awards of restricted stock or stock-based awards, previously issued. |
37
| (3) | Seacoast Banking Corporation of Florida 2013 Long-Term Incentive Plan. Shares reserved under this plan are available for issuance pursuant to the exercise of stock options and stock appreciation rights granted under the plan, and may be granted as awards of restricted stock, performance shares, or other stock-based awards, prospectively. |
| (4) | Seacoast Banking Corporation of Florida Employee Stock Purchase Plan, as amended. |
Additional information regarding the ownership of our common stock is set forth under the headings “Proposal 1 - Election of Directors” and “Security Ownership of Management and Certain Beneficial Holders” in the 2018 Proxy Statement, and is incorporated herein by reference.
| Item 13. | Certain Relationships and Related Transactions, and Director Independence |
Information regarding certain relationships and transactions between us and our officers, directors and significant shareholders is set forth under the heading “Compensation and Governance Committee Interlocks and Insider Participation” and “Certain Transactions and Business Relationships” and “Corporate Governance” in the 2018 Proxy Statement and is incorporated herein by reference.
| Item 14. | Principal Accountant Fees and Services |
Information concerning our principal accounting fees and services is set forth under the heading “Relationship with Independent Registered Public Accounting Firm; Audit and Non- Audit Fees” in the 2018 Proxy Statement, and is incorporated herein by reference.
| Item 15. | Exhibits, Financial Statement Schedules |
(a)(1) The Consolidated Financial Statements, the Notes thereto and the report of the Independent Registered Public Accounting Firm thereon listed in Item 8 are set forth commencing on page 105.
(a)(2) List of financial statement schedules
All schedules normally required by Form 10-K are omitted, since either they are not applicable or the required information is shown in the financial statements or the notes thereto.
(a)(3) Listing of Exhibits
PLEASE NOTE: It is inappropriate for readers to assume the accuracy of, or rely upon any covenants, representations or warranties that may be contained in agreements or other documents filed as Exhibits to, or incorporated by reference in, this report. Any such covenants, representations or warranties may have been qualified or superseded by disclosures contained in separate schedules or exhibits not filed with or incorporated by reference in this report, may reflect the parties’ negotiated risk allocation in the particular transaction, may be qualified by materiality standards that differ from those applicable for securities law purposes, may not be true as of the date of this report or any other date, and may be subject to waivers by any or all of the parties. Where exhibits and schedules to agreements filed or incorporated by reference as Exhibits hereto are not included in these Exhibits, such exhibits and schedules to agreements are not included or incorporated by reference herein.
The following Exhibits are attached hereto or incorporated by reference herein (unless indicated otherwise, all documents referenced below were filed pursuant to the Exchange Act by Seacoast Banking Corporation of Florida, Commission File No. 0-13660):
38
Exhibit 3.1.1 Amended and Restated Articles of Incorporation
Incorporated herein by reference from Exhibit 3.1 to the Company’s Quarterly Report on Form 10-Q, filed May 10, 2006.
Exhibit 3.1.2 Articles of Amendment to the Amended and Restated Articles of Incorporation
Incorporated herein by reference from Exhibit 3.1 to the Company’s Form 8-K, filed December 23, 2008.
Exhibit 3.1.3 Articles of Amendment to the Amended and Restated Articles of Incorporation
Incorporated herein by reference from Exhibit 3.4 to the Company’s Form S-1, filed June 22, 2009.
Exhibit 3.1.4 Articles of Amendment to the Amended and Restated Articles of Incorporation
Incorporated herein by reference from Exhibit 3.1 to the Company’s Form 8-K, filed July 20, 2009.
Exhibit 3.1.5 Articles of Amendment to the Amended and Restated Articles of Incorporation
Incorporated herein by reference from Exhibit 3.1 to the Company’s Form 8-K, filed December 3, 2009.
Exhibit 3.1.6 Articles of Amendment to the Amended and Restated Articles of Incorporation
Incorporated herein by reference from Exhibit 3.1 to the Company’s Form 8-K/A, filed July 14, 2010.
Exhibit 3.1.7 Articles of Amendment to the Amended and Restated Articles of Incorporation
Incorporated herein by reference from Exhibit 3.1 to the Company’s Form 8-K, filed June 25, 2010.
Exhibit 3.1.8 Articles of Amendment to the Amended and Restated Articles of Incorporation
Incorporated herein by reference from Exhibit 3.1 to the Company’s Form 8-K, filed June 1, 2011.
Exhibit 3.1.9 Articles of Amendment to the Amended and Restated Articles of Incorporation
Incorporated herein by reference from Exhibit 3.1 to the Company’s Form 8-K, filed December 13, 2013.
Exhibit 3.2 Amended and Restated By-laws of the Company
Incorporated herein by reference from Exhibit 3.2 to the Company’s Form 8-K, filed December 21, 2007.
Exhibit 4.1 Specimen Common Stock Certificate
Incorporated herein by reference from Exhibit 4.1 to the Company’s Form 10-K, filed on March 17, 2014.
Exhibit 4.2 Junior Subordinated Indenture
Dated as of March 31, 2005, between the Company and Wilmington Trust Company, as Trustee (including the form of the Floating Rate Junior Subordinated Note, which appears in Section 2.1 thereof), incorporated herein by reference from Exhibit 10.1 to the Company’s Form 8-K filed April 5, 2005.
Exhibit 4.3 Guarantee Agreement
Dated as of March 31, 2005 between the Company, as Guarantor, and Wilmington Trust Company, as Guarantee Trustee, incorporated herein by reference from Exhibit 10.2 to the Company’s Form 8-K filed April 5, 2005.
Exhibit 4.4 Amended and Restated Trust Agreement
Dated as of March 31, 2005, among the Company, as Depositor, Wilmington Trust Company, as Property Trustee, Wilmington Trust Company, as Delaware Trustee and the Administrative Trustees named therein, as Administrative Trustees (including exhibits containing the related forms of the SBCF Capital Trust I Common Securities Certificate and the Preferred Securities Certificate), incorporated herein by reference from Exhibit 10.3 to the Company’s Form 8-K filed April 5, 2005.
Dated as of December 16, 2005, between the Company and U.S. Bank National Association, as Trustee (including the form of the Junior Subordinated Debt Security, which appears as Exhibit A to the Indenture), incorporated herein by reference from Exhibit 10.1 to the Company’s Form 8-K filed December 21, 2005.
39
Exhibit 4.6 Guarantee Agreement
Dated as of December 16, 2005, between the Company, as Guarantor, and U.S. Bank National Association, as Guarantee Trustee, incorporated herein by reference from Exhibit 10.2 to the Company’s Form 8-K filed December 21, 2005.
Exhibit 4.7 Amended and Restated Declaration of Trust
Dated as of December 16, 2005, among the Company, as Sponsor, Dennis S. Hudson, III and William R. Hahl, as Administrators, and U.S. Bank National Association, as Institutional Trustee (including exhibits containing the related forms of the SBCF Statutory Trust II Common Securities Certificate and the Capital Securities Certificate), incorporated herein by reference from Exhibit 10.3 to the Company’s Form 8-K filed December 21, 2005.
Dated June 29, 2007, between the Company and LaSalle Bank, as Trustee (including the form of the Junior Subordinated Debt Security, which appears as Exhibit A to the Indenture), incorporated herein by reference from Exhibit 10.1 to the Company’s Form 8-K filed July 3, 2007.
Exhibit 4.9 Guarantee Agreement
Dated June 29, 2007, between the Company, as Guarantor, and LaSalle Bank, as Guarantee Trustee, incorporated herein by reference from Exhibit 10.2 to the Company’s Form 8-K filed July 3, 2007.
Exhibit 4.10 Amended and Restated Declaration of Trust
Dated June 29, 2007, among the Company, as Sponsor, Dennis S. Hudson, III and William R. Hahl, as Administrators, and LaSalle Bank, as Institutional Trustee (including exhibits containing the related forms of the SBCF Statutory Trust III Common Securities Certificate and the Capital Securities Certificate), incorporated herein by reference from Exhibit 10.3 to the Company’s Form 8-K filed July 3, 2007.
Exhibit 10.1 Amended and Restated Retirement Savings Plan*
Incorporated herein by reference from Exhibit 10.1 to the Company’s Annual Report on Form 10-K, filed March 15, 2011.
Exhibit 10.2 Amended and Restated Employee Stock Purchase Plan*
Incorporated by reference to Exhibit A to the Company’s Definitive Proxy Statement on DEF 14A, filed with the Commission on April 27, 2009.
Exhibit 10.3 Dividend Reinvestment and Stock Purchase Plan
Incorporated by reference to the Company’s Form S-3 filed on November 30, 2017.
Exhibit 10.4 2000 Long Term Incentive Plan as Amended*
Incorporated herein by reference from the Company’s Registration Statement on Form S-8 File No. 333-49972, filed November 15, 2000, and Proxy Statement on Form DEF 14A, filed on March 13, 2000.
Exhibit 10.5 Executive Deferred Compensation Plan*
Incorporated herein by reference from Exhibit 10.12 to the Company’s Annual Report on Form 10-K, filed March 30, 2001.
Exhibit 10.6 Change of Control Employment Agreement*
Dated December 24, 2003 between William R. Hahl and the Company, incorporated herein by reference from Exhibit 10.17 to the Company’s Form 8-K, filed December 29, 2003.
Exhibit 10.7 Amended and Restated Directors Deferred Compensation Plan*
Incorporated herein to the Company’s Form 10-K filed March 14, 2016.
Exhibit 10.8 2008 Long-Term Incentive Plan*
Incorporated herein by reference from Exhibit A to the Company’s Proxy Statement on Form DEF 14A, filed March 18, 2008.
40
Exhibit 10.9 Form of 409A Amendment to Employment Agreement with William R. Hahl*
Incorporated herein by reference from Exhibit 10.1 to the Company’s Form 8-K, filed January 5, 2009.
Exhibit 10.10 2013 Incentive Plan
Incorporated herein by reference from Appendix A to the Company’s Proxy Statement on Form DEF 14A, filed April 9, 2013.
Exhibit 10.11 Letter Agreement Regarding Lead Director Position*
Dated March 1, 2014 between Roger O. Goldman and the Company, incorporated herein by reference from Exhibit 10.1 to the Company’s Form 8-K, filed March 6, 2014.
Incorporated herein by reference from Exhibit 10.1 to the Company’s Form 8-K, filed November 3, 2014.
Exhibit 10.13 Employment Agreement*
Dated December 18, 2014 between Dennis S. Hudson, III and the Company, incorporated herein by reference from Exhibit 10.1 to the Company’s Form 8-K, filed December 19, 2014.
Exhibit 10.14 Change of Control Employment Agreement*
Dated August 6, 2015 between Stephen Fowle and the Company, incorporated herein by reference from Exhibit 10.1 to the Company’s Form 8-K, filed August 10, 2015.
Exhibit 10.15 Observation Rights Agreement
Dated March 23, 2016, Observer Rights Agreement by and between the Company, Basswood and Matthew Lindenbaum, incorporated herein by reference from Exhibit 10.1 to the Company’s Form 8-K, filed March 24, 2016.
Exhibit 10.16 Amendment No. 1 to Observer Rights Agreement
Dated July 26, 2016, the Company entered into Amendment No. 1 to the Observer Rights Agreement dated as of March 23, 2016, whereby the date which either Matthew Lindenbaum or the Company may terminate the Agreement was extended, incorporated herein by reference from Exhibit 10.1 to the Company’s From 8-K, filed July 29, 2016.
Exhibit 10.17 Form of Change of Control Employment Agreement with Charles Cross, David Houdeshell and Charles Shaffer, incorporated herein by reference from Exhibit 10.1 to the Company’s Form 8-K, filed September 23, 2016.
Exhibit 10.18 Agreement and Plan of Merger
Dated November 3, 2016, by and among the Company, Seacoast Bank, Gulfshore Bancshares, Inc. and Gulfshore Bank, incorporated herein by reference from Exhibit 2.1 to the Company’s Form 8-K, filed November 9, 2016.
Exhibit 10.19 Agreement and Plan of Merger
Dated May 4, 2017, by and among the Company, Seacoast Bank, Palm Beach Community Bank, incorporated herein by reference from Exhibit 2.1 to the Company’s Form 8-K, filed May 9, 2017.
Exhibit 10.20 Agreement and Plan of Merger
Dated May 8, 2017, by and among the Company, Seacoast Bank, and NorthStar Banking Corporation and NorthStar Bank incorporated herein by reference from Exhibit 2.1 to the Company’s Form 8-K, filed May 24, 2017.
Exhibit 10.21 Amendment to Employment Agreement with Dennis S. Hudson, III
Incorporated herein by reference to Exhibit 10.1 to the Company’s Form 8-K, filed June 27, 2017.
Exhibit 21 Subsidiaries of Registrant
Exhibit 23.1 Consent of Independent Registered Public Accounting Firm
41
Exhibit 101 Interactive Data File
| * | Management contract or compensatory plan or arrangement. |
| ** | The certifications attached as Exhibits 32.1 and 32.2 accompany this Annual Report on Form 10-K and are “furnished” to the Securities and Exchange Commission pursuant to Section 906 of the Sarbanes-Oxley Act of 2002 and shall not be deemed “filed” by the Company for purposes of Section 18 of the Exchange Act. |
| (b) | Exhibits |
The response to this portion of Item 15 is submitted under item (a)(3) above.
| (c) | Financial Statement Schedules |
None.
| Item 16. | Form 10-K Summary |
Not applicable.
42
SIGNATURES
Pursuant to the requirements of Section 13 or 15(d) of the Securities Exchange Act of 1934, the registrant has duly caused this report to be signed on its behalf by the undersigned, thereunto duly authorized.
| SEACOAST BANKING CORPORATION OF FLORIDA | ||
| (Registrant) | ||
| By: | /s/ Dennis S. Hudson, III | |
| Dennis S. Hudson, III | ||
| Chairman of the Board and Chief Executive Officer | ||
Date: February 28, 2018
Pursuant to the requirements of the Securities Exchange Act of 1934, this report has been signed below by the following persons on behalf of the registrant and in the capacities and on the dates indicated.
| Date | ||
| /s/ Dennis S. Hudson, III | February 28, 2018 | |
| Dennis S. Hudson, III, Chairman of the Board, | ||
| Chief Executive Officer and Director | ||
| (principal executive officer) | ||
| /s/ Charles M. Shaffer | February 28, 2018 | |
| Charles M. Shaffer, Executive Vice President and | ||
| Chief Financial Officer | ||
| (principal financial and accounting officer) | ||
| /s/ Dennis J. Arczynski | February 28, 2018 | |
| Dennis J. Arczynski, Director | ||
| /s/ Stephen E. Bohner | February 28, 2018 | |
| Stephen E. Bohner, Director | ||
| /s/ H. Gilbert Culbreth, Jr. | February 28, 2018 | |
| H. Gilbert Culbreth, Jr, Director | ||
| /s/ Christopher E. Fogal | February 28, 2018 | |
| Christopher E. Fogal, Director | ||
| /s/ Maryann Goebel | February 28, 2018 | |
| Maryann Goebel, Director |
43
| /s/ Herbert Lurie | February 28, 2018 | |
| Herbert Lurie, Director | ||
| /s/ Alvarro Monserrat | February 28, 2018 | |
| Alvaro Monserrat, Director |
44
Item 7. MANAGEMENT’S DISCUSSION AND ANALYSIS OF FINANCIAL CONDITION AND RESULTS OF OPERATIONS
The purpose of this discussion and analysis is to aid in understanding significant changes in the financial condition of Seacoast Banking Corporation of Florida and its subsidiaries (the “Company”) and their results of operations during 2017, 2016 and 2015. Nearly all of the Company’s operations are contained in its banking subsidiary, Seacoast Bank (“Seacoast Bank” or the “Bank”). This discussion and analysis is intended to highlight and supplement information presented elsewhere in the annual report on Form 10-K, particularly the consolidated financial statements and related notes appearing in Item 8. For purposes of the following discussion, the words the “Company,” “we,” “us,” and “our” refer to the combined entities of Seacoast Banking Corporation of Florida and its direct and indirect wholly owned subsidiaries.
Overview – Strategy and Results
Seacoast Banking Corporation of Florida (“Seacoast” or the “Company”), a bank holding company, incorporated in Florida in 1983, and registered under the Bank Holding Company Act of 1956, as amended (the “BHC Act”), is one of the largest community banks in Florida with approximately $5.8 billion in assets and $4.6 billion in deposits as of December 31, 2017. The Company provides integrated financial services including commercial and retail banking, wealth management, and mortgage services to customers through advanced banking solutions, 51 traditional branches of its locally-branded wholly-owned subsidiary bank, Seacoast National Bank, a national banking association (“Seacoast Bank”) and five commercial banking centers.
The Company’s offices stretch from Ft. Lauderdale, Boca Raton and West Palm Beach north through the Daytona Beach area, into Orlando and Central Florida, and the adjacent Tampa market as well as Okeechobee and surrounding counties.
Seacoast is executing a balanced growth strategy, combining both organic growth with strategic acquisitions in growing urban markets. The Company delivers integrated banking services, combining traditional retail locations with online and mobile technology and a 365 day a year 24/7 call center.
Seacoast has built a fully integrated distribution platform across all channels to provide our customers with the ability to choose their path of convenience to satisfy their banking needs, and which provides us an opportunity to reach our customers through a variety of sales channels. For 2017, the number of deposit accounts opened through our website and 24/7 customer support center grew by 12% year over year. The customer support center also originated $32.7 million in consumer and small business loans. Non-teller transactions surpassed teller transactions during 2017, with 41% of checks now deposited outside the branch network, compared to 37% a year ago in December. This shift in customer preference is expected to continue, requiring our continued focus on building and enhancing our digitally integrated business model.
We believe our digital delivery and products are contributing to growing our franchise. As of December 31, 2017, the total number of services utilized by Seacoast’s retail customers averaged 4.3 per household, primarily due to increases in debit card activation, direct deposit and mobile banking users. Personal and business mobile banking has grown from 32,305 users at December 31, 2015, to 47,131 users at December 31, 2016, to 62,516 users at December 31, 2017. There were 83,881 online users at year-end 2017, increasing almost 25% from December 31, 2016.
45
The Company enhanced its footprint with the acquisitions of GulfShore, NorthStar and PBCB in 2017, Floridian and BMO offices in 2016, and Grand in 2015 (see “Note S – Business Combinations”). During 2017, our acquisitions of GulfShore and NorthStar allowed the expansion of the Seacoast franchise into the Tampa market. We look forward to significant opportunities in the fast-growing, business rich Tampa market. Our approach to the Tampa market uses lessons learned from our successful build in the fast-growing Orlando marketplace during 2016. We are now the largest Florida-based bank in Orlando and a top-10 bank in that market overall. At year-end 2017, Orlando and Tampa represent 29% and 9% of our franchise, respectively, measured by deposits. The PBCB, Floridian, BMO and Grand transactions solidified our market share in the attractive Palm Beach and Central Florida markets, expanded our customer base and leveraged operating costs through economies of scale. All of these acquisitions not only increased our households, but opened markets and customer bases where our convenience offering resonates and were immediately accretive to earnings. In aggregate, the GulfShore, NorthStar and PBCB acquisitions added $736 million in total deposits and $660 million in loans to our balance sheet. The Floridian and BMO acquisitions contributed $651 million in total deposits and $328 million in loans to our balance sheet. The Grand acquisition provided $188 million in total deposits and $111 million in loans. Total merger related charges for 2017, 2016 and 2015 were $12.9 million, $9.0 million and $4.7 million, respectively, primarily consisting of salaries and wages, outsourced data processing costs, and legal and professional fees.
The Company will likely continue to consider strategic acquisitions as part of the Company’s overall future growth plans. The Florida economy continues to amplify our success and the state of Florida remains an attractive market in which to live and work. There are many positive indications that Florida’s economy will continue to expand.
During 2017, we also successfully renegotiated our agreement with a key technology and digital services provider. The agreement expands digital banking capabilities, improves service level agreements, and increases our ability to scale. We have also on-boarded key talent in the areas of data analysis, digital marketing, business-to-business marketing and compliance. During the first quarter of 2018, a Chief Technology Officer has been added to our executive team. These changes and additions support and position Seacoast for prospective growth. In 2018, we plan to invest a portion of the additional financial resources provided by the tax savings associated with Tax Cuts and Jobs Act of 2017 to accelerate the achievement of our operating model, and improving the digital customer experience.
Highlights of our performance in 2017 included:
| · | A 24% year-over-year adjusted revenue growth during 2017, outpacing a 13% increase in adjusted noninterest expense over the corresponding period. Adjusted revenues and adjusted noninterest expense are non-GAAP measures (see page 59-61, “Explanation of Certain Unaudited Non-GAAP Financial Measures” in “Results of Operations”); |
46
| · | Achievement of our $1.28 adjusted diluted earnings per share goal for 2017, a non-GAAP measure (see pages 59-61, “Explanation of Certain Unaudited Non-GAAP Financial Measures” in “Results of Operations”). This metric represented a 23% increase from the prior year, exiting 2017 on a strong upward trajectory and on a path to outperform peers; |
| · | Continued execution on the Company’s strategic acquisition strategy through the completion and successful integration of the acquisitions of GulfShore on April 7, 2017, NorthStar on October 20, 2017, and PBCB on November 3, 2017, together with organic and acquisition-related revenue growth momentum and cost reductions, all expected to drive earnings improvement in 2018. These acquisitions further solidified Seacoast’s status in Tampa, and added to its presence in Palm Beach County; |
| · | Reduction in costs related to branch consolidations, with ten branches added from acquisitions during 2017 offset by the successful consolidation of six branches, compared to 2016 when 24 branches were added and we closed 20 branches. Deposits per facility improved, with total deposits per branch increasing to $90 million at December 31, 2017, from $75 million one year earlier and $66 million at year-end 2015. We expect to continue consolidating our more expensive, traditional banking facilities, and related personnel costs, as digital and call center channels expand; |
| · | Continuation of the Company’s analytics-driven product marketing and service delivery combined with a favorable Florida economy that drove record loan production; total loans increased 33% compared to a year ago; excluding acquisitions, total loans were 10% higher year over year; |
| · | Other notable highlights for 2017 include a $15.2 million gain during the fourth quarter on the sale of shares of Visa Class B stock that were acquired in early 2017, and an additional income tax expense of $8.6 million in the fourth quarter to write down the Company’s net deferred tax assets as a result of the Tax Cuts and Jobs Act of 2017. The write down is an estimate and subject to additional procedures that could result in further adjustments in prospective periods. |
Results of Operations
Earnings Summary
The Company has steadily improved results over the past three years. Net income for 2017 totaled $42.9 million or $0.99 diluted earnings per share, compared to $29.2 million or $0.78 diluted earnings per share for 2016, and $22.1 million or $0.66 diluted earnings per share for 2015. Return on average assets (“ROA”) increased to 0.91% during the fourth quarter of 2017, and return on average equity (“ROE”) to 7.87% for the same period.
Adjusted net income1 totaled $55.3 million and was $16.3 million or 42% higher year-over-year for the twelve months ended December 31, 2017. In comparison, adjusted net income1 increased $12.8 million or 49% during 2016, compared to 2015. Adjusted diluted earnings per share1 increased to $1.28 for 2017, compared to $1.04 for 2016 and $0.78 for 2015.
1 See page 59, Explanation of Certain Unaudited Non-GAAP Financial Measures.
47
Net Interest Income and Margin
Net interest income (on a fully taxable equivalent basis) for 2017 totaled $177.0 million, increasing $36.5 million or 26% as compared to 2016’s net interest income of $140.5 million, which increased by $30.5 million or 28% compared to 2015. The Company’s net interest margin increased 10 basis points to 3.73% during 2017 from 2016, and decreased one basis point to 3.63% during 2016 from 2015.
Loan growth, balance sheet mix and yield/cost management have been the primary forces affecting net interest income and net interest margin results. Acquisitions have further accelerated these trends. Organic loan growth (excluding acquisitions) year-over-year was $278 million, or 10%. GulfShore loans and deposits added $251 million and $285 million, respectively, NorthStar loans and deposits added $137 million and $182 million, respectively, and PBCB loans and deposits added $272 million and $269 million, respectively, and were contributors to net interest income improvement year-over-year for 2017, compared to 2016. The same full-year income growth dynamic occurred in 2016 compared to 2015, with the acquisition of Floridian adding $266 million in loans, $67 million in securities and $337 million in deposits, and the purchase of investment securities ahead of the BMO acquisition, which added $314 million in deposits and $63 million in loans. We expect 2018’s net interest income will continue to benefit from the full year impact of acquisitions completed in 2017.
The increase in margin in 2017 compared to 2016 reflects significantly improved yields on investment securities, and federal funds sold and other investments, up 35 basis points and 118 basis points, respectively. Lower non-cash related loan accretion associated with acquisitions limited the increase in yield on loans to one basis point for 2017, compared to 2016. The slight decrease in margin for 2016 year over year from 2015 reflected decreased loan yields, due to the lower interest rate environment, but was partially offset by an improved balance sheet mix.
Table 2 presents the Company’s average balance sheets, interest income and expenses, and yields and rates, for the past three years.
The following table details the trend for net interest income and margin results (on a tax equivalent basis)(1), and yield on earning assets and rate on interest bearing liabilities that has changed nominally for the past five quarters. The second quarter of 2017 benefited from accretion of $1.5 million associated with early payoffs on securities and acquired loans, which added 13 basis points to the margin for that period.
| Net Interest | Net Interest | Yield on | Rate on Interest | |||||||||||||
| (Dollars in thousands) | Income (1) | Margin (1) | Earning Assets (1) | Bearing Liabilities | ||||||||||||
| Fourth quarter 2016 | 37,628 | 3.56 | % | 3.78 | % | 0.31 | % | |||||||||
| First quarter 2017 | 38,377 | 3.63 | 3.88 | 0.35 | ||||||||||||
| Second quarter 2017 | 44,320 | 3.84 | 4.12 | 0.41 | ||||||||||||
| Third quarter 2017 | 45,903 | 3.74 | 4.10 | 0.51 | ||||||||||||
| Fourth quarter 2017 | 48,402 | 3.71 | 4.11 | 0.56 | ||||||||||||
(1) On tax equivalent basis, a non-GAAP measure. See "Non-GAAP Measures regarding Net Interest Income and Margin."
48
Looking forward and inclusive of the NorthStar and PBCB acquisitions, we expect the net interest margin to be in the mid-3.70s and to increase to the high 3.70’s by the second quarter of 2018, assuming no change in long-term rates.
Total average loans increased $739.0 million or 29% during 2017, compared to 2016, and increased $599.8 million or 30% during 2016 compared to 2015. Our average investment securities also increased $144.9 million or 12% during 2017 versus 2016, and $238.3 million or 25% during 2016.
For 2017, average loans (the highest yielding component of earning assets) as a percentage of average earning assets totaled 70.1%, compared to 66.8% a year ago and 65.6% for 2015 while interest earning deposits and other investments decreased to 1.5%, compared to 2.2% in 2016 and 2.5% in 2015, reflecting the Company’s continuing efforts to reduce excess liquidity. As average total loans as a percentage of earning assets increased, the mix of loans has remained fairly stable, with volumes related to commercial real estate representing 47.9% of total loans at December 31, 2017 (compared to 50.2% at December 31, 2016 and 49.8% at December 31, 2015). Residential loan balances with individuals (including home equity loans and lines, and personal construction loans) represented 31.2% of total loans at December 31, 2017 (versus 31.6% at December 31, 2016 and 35.7% at December 31, 2015) (see “Loan Portfolio”).
Commercial and commercial real estate loan production for 2017 totaled $483 million, compared to production for all of 2016 and 2015 of $432 million and $299 million, respectively. Consumer and small business originations reached $354 million during 2017, compared to $302 million during 2016 and $203 million during 2015. Closed residential loan production totaled $488 million compared to production for all of 2016 and 2015 of $403 million and $272 million, respectively. During 2017, an additional $43 million pool of whole loan adjustable rate residential mortgages with a weighted average yield of 3.2% and average FICO score of 751 was acquired and added to our portfolio, offset by $86.3 million in sales of two seasoned pools of portfolio residential mortgages. The sales were deemed opportunities given the Treasury yield curve at the time, and to manage interest rate risk, adjust loan mix to permit growth in construction lending and to manage liquidity. During 2016, an additional $63.5 million of residential mortgage and $19.2 million of marine loan pools were purchased, and partially offset by $70.6 million in sales of seasoned pools of portfolio residential mortgages. The following chart details the trend for commercial and residential loans closed and pipelines for the past three years:
| For the Year Ended December 31, | ||||||||||||
| (In thousands) | 2017 | 2016 | 2015 | |||||||||
| Commercial/commercial real estate loan pipeline at year-end | $ | 118,930 | $ | 88,814 | $ | 105,556 | ||||||
| Commercial/commercial real estate loans closed | 482,705 | 432,438 | 298,998 | |||||||||
| Residential loan pipeline at year-end | $ | 48,836 | $ | 72,604 | $ | 30,340 | ||||||
| Residential loan originations retained | 312,656 | 243,831 | 130,479 | |||||||||
| Residential loan originations sold* | 261,458 | 230,136 | 141,352 | |||||||||
| Consumer and small business pipeline | $ | 38,790 | $ | 45,936 | $ | 20,364 | ||||||
| Consumer and small business originations | 354,383 | 302,317 | 202,562 | |||||||||
* Includes sales of previously retained seasoned production of $86.3 million for 2017 and $70.6 million for 2016.
49
Pipelines (loans in underwriting and approval or approved and not yet closed) reflect the lingering effects of the fall hurricanes. At December 31, 2017, pipelines were $119 million in commercial, $49 million in residential mortgages, and $39 million in consumer and small business. Commercial pipelines increased $30 million or 34%, over 2016, mortgage pipelines were $24 million or 33% lower, compared to 2016, and consumer and small business pipelines decreased from 2016 by $7 million, or 16%.
The addition of the GulfShore team into our lending business in the second quarter of 2017 supplemented the commercial pipeline and commercial loans closed during the third and fourth quarters of 2017, and the addition of NorthStar and PBCB during the fourth quarter of 2017 provide an additional opportunity to further grow our balance sheet prospectively.
The average securities portfolio grew in size but was a smaller percentage of average earning assets, 28.4% for 2017 compared to 31.1% for 2016. However, careful portfolio management has resulted in increased securities yields. For 2017 our securities yielded 2.66%, up from 2.31% in 2016 and 2.21% in 2015.
For 2017, the cost of average interest-bearing liabilities increased 15 basis points to 0.46% from 2016. For 2016, this cost decreased 2 basis points to 0.31% from 2015. The cost of our funding reflects the low interest rate environment and the Company’s successful core deposit focus that produced strong growth in core deposit customer relationships over the past several years. Excluding higher cost certificates of deposit (CDs), core deposits including noninterest bearing demand deposits at December 31, 2017 represent 30.5% of total deposits. The cost of average total deposits (including noninterest bearing demand deposits) for the fourth quarter of 2017 was 0.29%, compared to 0.15% and 0.12% for the fourth quarters of 2016 and 2015.
The following table provides trend detail on the ending balance components of our customer relationship funding as of:
| Customer Relationship Funding | December 31, | |||||||||||
| (Dollars in thousands) | 2017 | 2016 | 2015 | |||||||||
| Noninterest demand | $ | 1,400,227 | $ | 1,148,309 | $ | 854,447 | ||||||
| Interest-bearing demand | 1,050,755 | 873,727 | 734,749 | |||||||||
| Money market | 931,458 | 802,697 | 665,353 | |||||||||
| Savings | 434,346 | 346,662 | 295,851 | |||||||||
| Time certificates of deposit | 775,934 | 351,850 | 293,987 | |||||||||
| Total deposits | $ | 4,592,720 | $ | 3,523,245 | $ | 2,844,387 | ||||||
| Customer sweep accounts | $ | 216,094 | $ | 204,202 | $ | 172,005 | ||||||
| Total core customer funding (1) | $ | 4,032,880 | $ | 3,375,597 | $ | 2,722,405 | ||||||
| Noninterest demand deposit mix | 30.5 | % | 32.6 | % | 30.0 | % | ||||||
| (1) Total deposits and customer sweep accounts, excluding time certificates of deposit | ||||||||||||
50
The Company’s focus on convenience, with high quality customer service, expanded digital offerings and distribution channels provides stable, low cost core deposit funding for the Company. Over the past several years, the Company has strengthened its retail deposit franchise using new strategies and product offerings, while maintaining a focus on growing customer relationships. We believe that digital product offerings are central to core deposit growth as access via these distribution channels is required by customers. During 2017 and 2016, we have significantly grown our average transaction deposits (noninterest and interest bearing demand), with significant increases of $370.8 million or 20% in 2017 and $379.3 million or 26% in 2016. Along with new relationships, our deposit programs and digital sales have improved our market share and increased average services per household.
Our growth in core deposits has also provided low funding costs. The Company’s deposit mix remains favorable, with 83 percent of average deposit balances comprised of savings, money market, and demand deposits in the fourth quarter of 2017. The Company’s average cost of deposits, including noninterest bearing demand deposits, was 0.21% for 2017, slightly above 2016’s rate of 0.14%, as acquired deposits marginally increased the Company’s cost of deposits.
Short-term borrowings (principally comprised of sweep repurchase agreements with customers of Seacoast Bank) decreased $15.9 million or 8% to average $171.7 million during 2017, after increasing $19.4 million or 12% to average $187.6 million for 2016, as compared to 2015. With balances typically peaking during the fourth and first quarters each year, public fund clients with larger balances have the most significant influence on average sweep repurchase agreement balances outstanding during the year. The average rate on customer repurchase accounts was 0.46% for 2017. No federal funds sold were utilized at December 31, 2017 and 2016.
FHLB borrowings, maturing in 30 days or less (along with $7.0 million of FHLB borrowings acquired from PBCB maturing in 2018 and 2019), totaled $211.0 million at December 31, 2017, with an average rate of 1.39% at year-end, compared to $415.0 million a year ago with an average rate of 0.61%. Advances from the FHLB of $50.0 million at a fixed rate of 3.22% to mature in late 2017 were redeemed early in April 2016 with an early redemption penalty of $1.8 million incurred. FHLB borrowings averaged $377.4 million for 2017, up from $198.3 million for 2016 and $64.7 million for 2015 (see “Note I – Borrowings” to the Company’s consolidated financial statements).
For 2017, average subordinated debt of $70.4 million related to trust preferred securities issued by subsidiary trusts of the Company (including subordinated debt for Grand and BANKshares assumed on July 17, 2015 and October 1, 2014, respectively) carried an average cost of 3.47%.
We have a positive interest rate gap and our net interest margin will benefit from rising interest rates. During 2017 and 2016, the Federal Reserve increased its overnight interest rate by 75 basis points and 25 basis points, respectively. Further increases in interest rates are currently expected for 2018 (see “Interest Rate Sensitivity”).
Fully taxable equivalent net interest income is a common term and measure used in the banking industry but is not a term used under GAAP. We believe that these presentations of tax-equivalent net interest income and tax equivalent net interest margin aid in the comparability of net interest income arising from both taxable and tax-exempt sources over the periods presented. We further believe these non-GAAP measures enhance investors’ understanding of the Company’s business and performance, and facilitate an understanding of performance trends and comparisons with the performance of other financial institutions. The limitations associated with these measures are the risk that persons might disagree as to the appropriateness of items comprising these measures and that different companies might calculate these measures differently, including as a result of using different assumed tax rates. These disclosures should not be considered as an alternative to GAAP. The following information is provided to reconcile GAAP measures and tax equivalent net interest income and net interest margin on a tax equivalent basis.
51
| Total | Fourth | Third | Second | First | Total | Fourth | ||||||||||||||||||||||
| Year | Quarter | Quarter | Quarter | Quarter | Year | Quarter | ||||||||||||||||||||||
| (Dollars in thousands) | 2017 | 2017 | 2017 | 2017 | 2017 | 2016 | 2016 | |||||||||||||||||||||
| Nontaxable interest adjustment | $ | 706 | $ | 176 | $ | 154 | $ | 164 | $ | 212 | $ | 925 | $ | 203 | ||||||||||||||
| Tax rate | 35 | % | 35 | % | 35 | % | 35 | % | 35 | % | 35 | % | 35 | % | ||||||||||||||
| Net interest income (TE) | $ | 177,002 | $ | 48,402 | $ | 45,903 | $ | 44,320 | $ | 38,377 | $ | 140,514 | $ | 37,628 | ||||||||||||||
| Total net interest income (not TE) | 176,296 | 48,226 | 45,749 | 44,156 | 38,165 | 139,588 | 37,425 | |||||||||||||||||||||
| Net interest margin (TE) | 3.73 | % | 3.71 | % | 3.74 | % | 3.84 | % | 3.63 | % | 3.63 | % | 3.56 | % | ||||||||||||||
| Net interest margin (not TE) | 3.72 | 3.70 | 3.73 | 3.83 | 3.61 | 3.61 | 3.54 | |||||||||||||||||||||
TE = Tax Equivalent, a non-GAAP measure.
Noninterest Income
Noninterest income (excluding securities gains and gain on sale of Class B Visa stock) totaled $43.2 million for 2017, an increase of $5.8 million or 16% compared to 2016. The gain on sale of Class B Visa stock totaled $15.2 million and was recorded in the fourth quarter of 2017. The Visa shares were purchased early in 2017. For 2016, noninterest income (excluding securities gains) totaled $37.4 million, $5.4 million or 17% higher than for 2015. For 2015, noninterest income (excluding securities gains and bargain purchase gain) of $32.0 million was 29% higher than for 2014. Noninterest income accounted for 19.1% of total revenue (net interest income plus noninterest income, excluding securities gains, and the gain on sale of Class B Visa stock), compared to 21.1% in 2016 and 22.6% for 2015 (on the same basis) as net interest income growth, helped by expanding net interest margin, outpaced a strong increase in noninterest income. Analytics driven product marketing and service delivery, combined with organic and acquisition-related household growth, were primary factors contributing to the growth in noninterest income during 2017, 2016 and 2015.
Table 4 provides detail regarding noninterest income components for the past three years.
For 2017, most categories of service fee income showed strong year over year growth compared to 2016, with service charges on deposit accounts increasing $0.4 million or 4% to $10.0 million, interchange income up $1.4 million or 15% to $10.6 million, while other deposit based EFT charges were generally flat year over year. These increases reflect continued strength in customer acquisition and cross sell and benefits from acquisition activity. Overdraft fees represent 57% of total service charges on deposits for 2017, versus 60% for 2016. Overdraft fees totaled $5.7 million during 2017, decreasing $0.1 million from 2016, in part due to third quarter 2017’s post-hurricane Irma accommodations for customers including waivers of fees where circumstance were appropriate. Regulators continue to review banking industry’s practices for overdraft programs and additional regulation could reduce fee income for the Company’s overdraft services. Interchange revenue is dependent upon business volumes transacted, as well as the fees permitted by VISA® and MasterCard®.
52
Wealth management, including brokerage commissions and fees, and trust income, decreased during 2017, declining by $0.4 million or 8%. Growth in trust revenues of $0.3 million or 8% was entirely offset by a decline in the Company’s brokerage fees of $0.7 million, a result of our shifting to fee-based accounts and an investment management model. We expect wealth management revenues to grow over time.
Mortgage production was higher during 2017 (see “Loan Portfolio”), with mortgage banking activity generating fees of $6.4 million, which were $0.6 million or 10% higher, compared to 2016. Originated residential mortgage loans are processed by commissioned employees of Seacoast, with many mortgage loans referred by the Company’s branch personnel. Fee income opportunities were more limited during 2017, a result of shifting consumer demand to construction products and low inventory levels of homes for sale. During 2017, two pools of seasoned portfolio mortgages were sold, generating gains of $1.3 million. During 2016, two pools of seasoned portfolio mortgages were sold, generating gains of $0.9 million.
Seacoast chose to sell a larger portion of its marine financing originations during 2017. Marine lending business volumes sold were higher in 2017, reflecting stronger demand for marine vessels and favorably impacting fees from marine financing, which grew $0.2 million or 35% from 2016 levels. In addition to our principal office in Ft. Lauderdale, Florida, we continue to use third party independent contractors in Texas and on the West coast of the United States to assist in generating marine loans.
During 2017, BOLI income totaled $3.4 million, up from $2.2 million for 2016. An additional purchase of $30 million of BOLI in the third quarter of 2017. At December 31, 2017, the BOLI asset totaled $124.0 million.
Other income was $2.5 million or 64% higher for 2017 compared to a year ago, with additional fees of $0.8 million for swap related income with loan customers, $0.5 million for secondary market activities with the Small Business Administration (“SBA”), $0.2 million for distributions from CRA investments, $0.2 million for check cashing fees, $0.1 million for wire transfer activity, $0.1 million for credit card related fees, and $0.1 million for income generated by factoring fees related to asset lending. A general increase in other fee categories also occurred year over year, the result of pricing increases implemented across the franchise on a number of services offered.
53
For 2016, Seacoast’s noninterest income (excluding securities gains) was $5.4 million or 17% higher compared to 2015. While service charges on deposit accounts, interchange income and other EFT charges grew $1.1 million or 13%, $1.5 million or 20% and $0.1 million or 20%, respectively, reflecting successful household growth, wealth management fee income and mortgage banking income were higher as well, by $0.2 million or 4% and $1.6 million or 38%, respectively. For 2016, BOLI income increased $0.8 million from 2015, and included an additional death benefit of $0.5 million and the benefit of a purchase of new BOLI in the fourth quarter of 2016. Marine lending business volumes sold were lower in 2016, negatively impacting fees from marine financing which declined $0.5 million or 42% from 2015 levels.
Noninterest income in the fourth quarter of 2015 included a bargain purchase gain of $0.4 million from the acquisition of Grand, that arose from unanticipated recoveries and resulting adjustments to loans and other real estate owned realized during the fourth quarter. Seacoast also benefited from a gain on a participated loan of $0.7 million that was realized during the second quarter of 2015. Accounting treatment for this gain, related to a discount accreted on a BANKshares loan that was participated during the second quarter of 2015, required this income to be included in other operating income rather than recognition through the margin.
Noninterest Expense
Table 5 provides detail of noninterest expense components for the years ending December 31, 2017, 2016 and 2015.
Seacoast management expects its efficiency ratios to improve in 2018. The Company expects its digital servicing capabilities and technology to support better, more efficient channel integration allowing consumers to choose their path of convenience to satisfy their banking needs, resulting in organic growth of our products and services as well as related revenue, in addition to increased efficiency in how we serve our customers. Acquisition activity added to noninterest expenses with acquisition related costs for GulfShore, NorthStar and PBCB in 2017, Floridian and BMO in 2016, and Grand in 2015 of approximately $12.9 million, $9.0 million and $4.7 million, respectively, as well as ongoing costs related to this growth. The Company anticipates making investments totaling approximately $4.5 million in 2018 to improve our processes and tools for commercial banking, invest in talent and tools for our enterprise risk management and technology functions, and further upgrade our analytics and digital marketing capabilities. These investments will help to scale our organization appropriately, and we believe will set the stage for sustainable earnings growth in 2019 and beyond.
For 2017, our efficiency ratio defined as noninterest expense less foreclosed property expense and amortization of intangibles divided by net operating revenue (net interest income on a fully tax equivalent basis plus noninterest income excluding securities gains, the gain on sale of Visa stock and bargain purchase gain) was 66.7%, compared to 72.1% for 2016 and 71.6% for 2015. Adjusted noninterest expense1 (a non-GAAP measure, see table below for a reconciliation to noninterest expense, the most comparable GAAP number) was $129.0 million for 2017, compared to $114.2 million for 2016 and $97.4 million for 2015. Noninterest expense includes the addition during the second and fourth quarters of 2017 of additional personnel and expenses associated with our acquisitions. Outsourced data processing costs reflect the value of our renegotiated contract with our core processing vendor. The adjusted efficiency ratio1 for 2017 steadily improved over the course of the year, from 64.7% for the first quarter, to 61.2% for the second quarter, to 57.7% for the third quarter, and to 52.5% for the fourth quarter of 2017.
54
| For the Year Ended December 31, | ||||||||||||
| (In thousands) | 2017 | 2016 | 2015 | |||||||||
| Noninterest expense, as reported | $ | 149,916 | $ | 130,881 | $ | 103,770 | ||||||
| Merger related charges | 12,922 | 9,028 | 4,673 | |||||||||
| Amortization of intangibles | 3,360 | 2,486 | 1,424 | |||||||||
| Branch reductions and other expense initiatives | 4,321 | 3,357 | 0 | |||||||||
| Business continuity expenses for Hurricane Irma | 352 | 0 | 0 | |||||||||
| Early redemption cost for FHLB advances | 0 | 1,777 | 0 | |||||||||
| Other | 0 | 0 | 281 | |||||||||
| Total adjustments | 20,955 | 16,648 | 6,378 | |||||||||
| Adjusted noninterest expense1 | $ | 128,961 | $ | 114,233 | $ | 97,392 | ||||||
| Adjusted efficiency ratio1,2 | 58.7 | % | 64.6 | % | 68.6 | % | ||||||
| 1 See page 59, Explanation of Certain Unaudited Non-GAAP Financial Measures. | ||||||||||||
| 2 Adjusted efficiency ratio is defined as noninterest expense, including adjustments to noninterest expense (see pages 60-61) divided by aggregated tax equivalent net interest income (see pages 51-52) and noninterest income, including adjustments to revenue (see pages 60-61). | ||||||||||||
Salaries and wages totaling $65.7 million were $11.6 million or 21% higher for 2017, than for 2016, including $8.5 million in expenses related to mergers and other non-routine items. Base salaries were $6.9 million or 15% higher during 2017, reflecting the full-year impact of additional personnel retained as part of first quarter 2016’s acquisition of Floridian, second quarter 2016’s purchase of BMO’s Orlando operations, second quarter 2017’s purchase of GulfShore, and fourth quarter 2017’s acquisitions of NorthStar and PBCB. Improved revenue generation and lending production, among other factors, resulted in commissions, cash and stock incentives (aggregated) that were $3.5 million higher for 2017, compared to 2016. Temporary services and severance costs increased $1.1 million and $1.8 million, respectively, in 2017. Deferred loan origination costs (a contra expense), increased $1.7 million, reflecting a greater number of loans produced during 2017.
Similarly, salaries and wages for 2016 were $13.0 million or 32% higher than for 2015. A significant portion of the increase was for base salaries that were $7.3 million or 19% greater, reflecting the full-year impact of additional Grand personnel and retained personnel from first quarter 2016’s acquisition of Floridian and second quarter 2016’s purchase of BMO’s Orlando operations. Commissions, cash and stock incentives (aggregated) were $4.9 million higher for 2016 compared to 2015, and deferred loan origination costs were lower by $0.5 million, reflecting a greater number of loans produced but at a more efficient cost per loan.
During 2017, employee benefits costs (group health insurance, defined contribution plan, payroll taxes, as well as unemployment compensation) increased $1.8 million or 19% to $11.7 million from 2016, and compared to a $0.3 million or 4% increase in 2016, versus 2015 expenditures. These costs reflect the increased staffing and salary costs, discussed above. Our self-funded health care plan comprises the largest portion of employee benefits, totaling $5.3 million for 2017, and payroll taxes totaling $4.4 million were the second largest category. The Company offers competitively priced health coverage to all of its associates that qualify for benefits, to attract the best professional talent to the Company, at a reasonable cost and competitive with other businesses in the Florida markets where we conduct business.
55
Seacoast Bank utilizes third parties for its core data processing systems and outsourced data processing costs are directly related to the number of transactions processed. Outsourced data processing costs totaled $14.1 million for 2017, an increase of $0.6 million or 4% from 2016, and were $3.4 million higher for 2016 versus 2015. Data processing costs include one-time charges for conversion activity related to our acquisitions. We continue to improve and enhance our mobile and other digital products and services through our core data processor, which may increase our outsourced data processing costs as customers adopt improvements and products and as the Company’s business volumes grow.
Telephone and data line expenditures, including electronic communications with customers and between branch locations and personnel, as well as third party data processors, increased $0.2 million or 9% to $2.3 million for 2017 when compared to 2016, and were $0.3 million or 17% higher in 2016 compared to 2015. Additional activity for acquired GulfShore, NorthStar and PBCB locations in 2017, and Floridian and BMO locations in 2016, and locations closed during 2017 and 2016, as well as additional customers from the acquisitions, were the primary contributors to the increases in telephone and data line expenses for each year.
Total occupancy, furniture and equipment expense for 2017 increased $1.5 million or 8% (on an aggregate basis) to $19.4 million year over year. For 2016, these costs were $5.7 million or 47% higher than in 2015. For 2017 and 2016, the increases were primarily driven by the 10 offices acquired from GulfShore, NorthStar and PBCB and the 24 offices acquired from the Floridian and BMO acquisitions. Seacoast Bank consolidated 6 offices and 20 offices, respectively, during the 2017 and 2016 calendar years. Lease payments were higher by $0.5 million or 9% and $1.1 million or 27% for 2017 and 2016, respectively, and include recurring payments for many of the closed offices. Depreciation was also $0.5 million or 11% greater for 2017 than 2016. Write downs totaling $2.3 million were incurred during both 2017 and 2016 for closed offices. We believe branches are still valuable to our customers for more complex transactions, but simple tasks, such as depositing and withdrawing funds, are rapidly migrating to a digital world. Our goal at the beginning of 2017 was to close 20% of our locations over the next 24 to 36 months. Some of the operational expense savings will be invested into technology and talent to deliver products and services in more convenient ways. Branch consolidations will continue for the Company and the banking industry in general (see “Item 2, Properties” for a complete description of our banking offices).
For 2017, marketing expenses (including sales promotion costs, ad agency production and printing costs, digital, newspaper, TV and radio advertising, and other public relations costs) increased by $1.2 million or 32% to $4.8 million, compared to 2016. For 2016, these costs were $0.8 million or 18% lower, versus 2015. Incremental use of outdoor media, digital media and direct mail to connect and solidify customer acquisition and corporate brand awareness within the new Tampa footprint contributed to the increase in 2017. Primary to the decrease during 2016 was an effort to utilize digital media as a primary source for brand awareness rather than more costly, traditional venues such as newspaper, radio and TV advertising, with the savings utilized for more direct mail and customer incentives.
Legal and professional fees for 2017 were higher by $1.4 million or 15% from 2016, and were $1.6 million higher for 2016 versus 2015. Included were acquisition related fees that totaled $1.9 million for 2017 and $1.5 million for 2016. Regulatory examination fees increased as total assets increased (the basis for examination fee calculation).
56
Growth in total assets (both organic and through acquisitions) increased the basis for calculating our FDIC premiums. The Company’s total assets and equity have increased during the past three years and Seacoast expects increases prospectively. FDIC rates declined for financial institutions under $10 billion in total assets during 2016 as FDIC insurance pools achieved higher amounts specified by the U.S. Congress. FDIC assessments were $2.3 million, $2.4 million and $2.2 million for 2017, 2016 and 2015, respectively.
As nonperforming assets have declined so have associated costs (see “Nonperforming Loans, Troubled Debt Restructurings, Other Real Estate Owned, and Credit Quality”). For the last three years, asset disposition costs and net (gains) losses on other real estate owned and repossessed assets on an aggregated basis have been stable or declined, from $0.7 million for 2015 to zero for 2016 to a gain of ($0.3) million for 2017.
Included in noninterest expenses for 2016 was an early redemption cost of $1.8 million for Federal Home Loan Bank advances that was paid in April. Two $25 million advances with a combined fixed rate of 3.22% and maturing in November 2017 were redeemed (see “Note I – Borrowings”).
Other expenses were higher by $2.0 million or 15% for 2017 compared to 2016, totaling $13.5 million. For 2016, other expenses were $1.3 million or 11% higher, compared to 2015. Contributing to the $2.0 million increase for 2017 were the following: miscellaneous losses and charge-offs (up $0.4 million from 2016), travel related expenses (up $0.4 million), bank meetings costs (rising $0.2 million compared to 2016), robberies (rising $0.1 million from 2016), director fees (higher by $0.1 million), employee placement fees (increasing $0.1 million), and armored car services (higher by $0.1 million). Larger increases during 2016 were driven by a full-year and partial-year impacts of acquisitions and variable costs related to our successful lending activity.
Income Taxes
The Tax Cuts and Jobs Act of 2017, enacted by the U.S. Congress and signed by the President of the United States near the end of December 2017, had a significant impact on our deferred tax position and provision for taxes at year-end 2017. For 2017, 2016 and 2015, provision for income taxes totaled $36.3 million, and $14.9 million and $13.5 million, respectively. The new legislation resulted in additional provisioning of $8.6 million during the fourth quarter of 2017. This estimate is subject to additional procedures which could result in further adjustments in future periods.
While various tax strategies have been implemented to reduce the Company’s overall effective tax rate, the additional provisioning for taxes related to this enactment resulted in a rate of 45.9% for 2017, an increase from 33.8% in 2016 and 37.9% in 2015. Without the additional provision from the legislation, the effective rate for 2017 was 35.1%. For 2017, 2016 and 2015, a portion of investment banking fees, and legal and professional fees expended and related to the acquisitions were not deductible for tax purposes. Additionally, the adoption of ASU 2016-09 provided a tax benefit of $1.1 million for 2017 and $0.8 million for 2016 after the standard’s adoption in the third quarter of that year (see “Note A- Significant Accounting Policies”).
Management believes all of the future tax benefits of the Company’s deferred tax assets can be realized and no valuation allowance is required (see “Note L – Income Taxes”).
57
Fourth Quarter Review
Earnings highlights for the fourth quarter 2017:
| · | Fourth quarter 2017 net income totaled $13.0 million, an increase of $2.3 million or 21% from the same period of 2016, and declined $1.2 million or 8% compared with third quarter 2017 levels. Adjusted net income (1) increased $5.5 million or 46% from fourth quarter 2016 levels and $2.1 million or 14% from third quarter 2017. Diluted earnings per common share (“EPS”) were $0.28 and adjusted diluted EPS (1) were $0.37 in the fourth quarter of 2017, compared to diluted EPS of $0.28 and adjusted diluted EPS (1) of $0.31 in the fourth quarter of 2016; |
| · | Fourth quarter revenues increased $27.5 million or 58% from fourth quarter 2016 levels. Net interest income improved $10.8 million or 29% compared to fourth quarter 2016, due to organic growth and the acquisitions settled during 2017; |
| · | A $15.2 million gain on the sale of shares of Class B Visa stock was recorded in the quarter. |
(1) See page 59, Explanation of Certain Unaudited Non-GAAP Financial Measures.
Net interest income (on a tax-equivalent basis, a non-GAAP measure) for the fourth quarter 2017 totaled $48.4 million, a $10.8 million or 29% increase from the fourth quarter 2016 and $2.5 million higher than third quarter 2017. Net interest margin (on a tax-equivalent basis) increased to 3.71%, a 15 basis point increase from 2016, and 3 basis points lower than third quarter 2017. Year-over-year net interest income growth was amplified by the acquisitions of GulfShore, NorthStar and PBCB. The margin increase year over year reflects increased loan and securities yields, reflecting the rising interest rate environment, and improved balance sheet mix. Linked quarter results reflect higher rates on deposits and lower non-cash related loan accretion associated with prior acquisitions.
Noninterest income (excluding securities gains and gain on sale of Class B Visa stock) totaled $11.4 million for the fourth quarter of 2017, an increase of $1.5 million or 15% from fourth quarter 2016 and compared to $11.5 million in the third quarter 2017. Interchange income and BOLI income increased the most year-over-year, each increasing $0.5 million, respectively, as well as other income that was higher by $0.7 million. Interchange income reflects continued growth and benefits from our acquisition activity, including the GulfShore, NorthStar and PBCB acquisitions in the second and fourth quarters of 2017. BOLI income was 80% higher, with additional purchases of BOLI during 2017 and the BOLI asset totaling $124.0 million at year-end. The increase in other income year over year for the fourth quarter included income from interest rate swaps with customers of $0.3 million and SBA gains on sold guarantees of $0.3 million.
58
Noninterest expenses for the fourth quarter 2017 totaled $39.2 million, up 29% from 2016 and 14% higher than third quarter 2017. Of the $8.9 million increase year-over-year for fourth quarter 2017, salaries, wages and employee benefits increased $3.8 million, outsourced data processing grew $1.1 million, and occupancy and furniture and equipment costs (aggregated) were $1.0 million higher. The acquisitions of GulfShore, NorthStar and PBCB were the primary cause and incremental, although for 2017 the Company added only four more branch offices, compared to year-end 2016. Fourth quarter 2017 expense also reflected merger related charges of $6.8 million from our acquisitions, including related severance. The most significant factor impacting the fourth quarter 2016’s noninterest expense was also merger related charges, totaling $0.6 million from acquisitions, and including related severance.
A provision for loan losses of $2.3 million and $1.0 million was recorded in the fourth quarter of 2017 and 2016, respectively. Third quarter 2017’s provision for loan losses totaled $0.7 million. Our fourth quarter 2017 provisioning reflects the effect of higher charge-offs, including a $0.6 million charge-off related to one customer whose business exporting to the Caribbean was significantly impacted by the hurricanes of 2017. For the fourth quarter of 2017, net charge-offs totaled $1.3 million, compared to $0.2 million for fourth quarter 2016. The allowance for loan losses to portfolio loans outstanding ratio at December 31, 2017 was 0.90%, compared to 0.96% a year earlier, and the coverage ratio (the allowance for loan losses to nonaccrual loans) was 150.3% at December 31, 2017 compared to 125.10% at December 31, 2016, reflecting improvement in credit quality.
Update on Vision 2020
Our Vision 2020 objectives were introduced at our investor day in early 2017. These targets are reiterated below. The enactment of the Tax Cuts and Jobs Act of 2017 is expected to have a significant positive impact on our Florida markets, and creates an opportunity for us to accelerate the achievement of our Vision 2020 objectives. As the impact of this new legislation on our operating markets materializes, we will provide further updates on our progress and updated objectives.
| Vision 2020 Targets | ||
| Return on Tangible Assets | 1.30%+ | |
| Return on Tangible Common Equity | 16%+ | |
| Efficiency Ratio | Below 50% |
Explanation of Certain Unaudited Non-GAAP Financial Measures
This report contains financial information determined by methods other than Generally Accepted Accounting Principles (“GAAP”), including adjusted net income tax, tax equivalent net interest income and margin, and adjusted noninterest expense and efficiency ratios. The most directly comparable GAAP measures are net income, net interest income, net interest margin, noninterest expense, and efficiency ratios. Management uses these non-GAAP financial measures in its analysis of the Company’s performance and believes these presentations provide useful supplemental information, and a clearer understanding of the Company’s performance. The Company believes the non-GAAP measures enhance investors’ understanding of the Company’s business and performance and if not provided would be requested by the investor community. These measures are also useful in understanding performance trends and facilitate comparisons with the performance of other financial institutions. The limitations associated with operating measures are the risk that persons might disagree as to the appropriateness of items comprising these measures and that different companies might calculate these measures differently. The Company provides reconciliations between GAAP and these non-GAAP measures. These disclosures should not be considered an alternative to GAAP.
59
The tables below provide reconciliation between GAAP net income and adjusted net income. Effective in the first quarter of 2017, adjusted net income and adjusted noninterest expense exclude the effect of amortization of acquisition-related intangibles. Prior periods have been revised to conform to the current period presentation.
| Quarters | ||||||||||||||||||||
| Fourth | Third | Second | First | Total | ||||||||||||||||
| (In thousands except per share data) | 2017 | 2017 | 2017 | 2017 | Year | |||||||||||||||
| Net income, as reported: | ||||||||||||||||||||
| Net income | $ | 13,047 | $ | 14,216 | $ | 7,676 | $ | 7,926 | $ | 42,865 | ||||||||||
| Diluted earnings per share | $ | 0.28 | $ | 0.32 | $ | 0.18 | $ | 0.20 | $ | 0.99 | ||||||||||
| Adjusted net income: | ||||||||||||||||||||
| Net income | $ | 13,047 | $ | 14,216 | $ | 7,676 | $ | 7,926 | $ | 42,865 | ||||||||||
| Gain on sale of Visa Class B Shares | $ | (15,153 | ) | 0 | 0 | 0 | $ | (15,153 | ) | |||||||||||
| Securities gains | (112 | ) | 47 | (21 | ) | 0 | (86 | ) | ||||||||||||
| Total adjustments to revenue | (15,265 | ) | 47 | (21 | ) | 0 | (15,239 | ) | ||||||||||||
| Merger related charges | 6,817 | 491 | 5,081 | 533 | 12,922 | |||||||||||||||
| Amortization of intangibles | 963 | 839 | 839 | 719 | 3,360 | |||||||||||||||
| Business continuity expenses - Hurricane Irma | 0 | 352 | 0 | 0 | 352 | |||||||||||||||
| Branch reductions and other expense initiatives | 0 | (127 | ) | 1,876 | 2,572 | 4,321 | ||||||||||||||
| Total adjustments to noninterest expense | 7,780 | 1,555 | 7,796 | 3,824 | 20,955 | |||||||||||||||
| Effective tax rate on adjustments | 3,147 | (673 | ) | (2,786 | ) | (1,480 | ) | (1,792 | ) | |||||||||||
| Effect of change in corporate tax rate | 8,552 | 0 | 0 | 0 | 8,552 | |||||||||||||||
| Adjusted net income | $ | 17,261 | $ | 15,145 | $ | 12,665 | $ | 10,270 | $ | 55,341 | ||||||||||
| Adjusted diluted earnings per share | $ | 0.37 | $ | 0.35 | $ | 0.29 | $ | 0.26 | $ | 1.28 | ||||||||||
60
| Quarters | ||||||||||||||||||||
| Fourth | Third | Second | First | Total | ||||||||||||||||
| (In thousands except per share data) | 2016 | 2016 | 2016 | 2016 | Year | |||||||||||||||
| Net income, as reported: | ||||||||||||||||||||
| Net income | $ | 10,771 | $ | 9,133 | $ | 5,332 | $ | 3,966 | $ | 29,202 | ||||||||||
| Diluted earnings per share | $ | 0.28 | $ | 0.24 | $ | 0.14 | $ | 0.11 | $ | 0.78 | ||||||||||
| Adjusted net income: | ||||||||||||||||||||
| Net income | $ | 10,771 | $ | 9,133 | $ | 5,332 | $ | 3,966 | $ | 29,202 | ||||||||||
| BOLI income (benefits upon death) | 0 | 0 | 0 | (464 | ) | (464 | ) | |||||||||||||
| Securities gains | (7 | ) | (225 | ) | (47 | ) | (89 | ) | (368 | ) | ||||||||||
| Total adjustments to revenue | (7 | ) | (225 | ) | (47 | ) | (553 | ) | (832 | ) | ||||||||||
| Merger related charges | 561 | 1,699 | 2,446 | 4,322 | 9,028 | |||||||||||||||
| Amortization of intangibles | 719 | 728 | 593 | 446 | 2,486 | |||||||||||||||
| Branch closure charges and costs related to expense initiatives | 163 | 894 | 1,587 | 713 | 3,357 | |||||||||||||||
| Early redemption cost for FHLB advances | 0 | 0 | 1,777 | 0 | 1,777 | |||||||||||||||
| Total adjustments to noninterest expense | 1,443 | 3,321 | 6,403 | 5,481 | 16,648 | |||||||||||||||
| Effective tax rate on adjustments | (404 | ) | (1,168 | ) | (2,532 | ) | (1,845 | ) | (5,949 | ) | ||||||||||
| Adjusted net income | $ | 11,803 | $ | 11,061 | $ | 9,156 | $ | 7,049 | $ | 39,069 | ||||||||||
| Adjusted diluted earnings per share | $ | 0.31 | $ | 0.29 | $ | 0.24 | $ | 0.20 | $ | 1.04 | ||||||||||
| Quarters | ||||||||||||||||||||
| Fourth | Third | Second | First | Total | ||||||||||||||||
| (In thousands except per share data) | 2015 | 2015 | 2015 | 2015 | Year | |||||||||||||||
| Net income, as reported: | ||||||||||||||||||||
| Net income | $ | 6,036 | $ | 4,441 | $ | 5,805 | $ | 5,859 | $ | 22,141 | ||||||||||
| Diluted earnings per share | $ | 0.18 | $ | 0.13 | $ | 0.18 | $ | 0.18 | $ | 0.66 | ||||||||||
| Adjusted net income: | ||||||||||||||||||||
| Net income | $ | 6,036 | $ | 4,441 | $ | 5,805 | $ | 5,859 | $ | 22,141 | ||||||||||
| Securities gains | (1 | ) | (160 | ) | 0 | 0 | (161 | ) | ||||||||||||
| Bargain purchase gain | (416 | ) | 0 | 0 | 0 | (416 | ) | |||||||||||||
| Total adjustments to revenue | (417 | ) | (160 | ) | 0 | 0 | (577 | ) | ||||||||||||
| Merger related charges | 1,230 | 2,790 | 366 | 287 | 4,673 | |||||||||||||||
| Amortization of intangibles | 397 | 397 | 315 | 315 | 1,424 | |||||||||||||||
| Other | 48 | 233 | 0 | 0 | 281 | |||||||||||||||
| Total adjustments to noninterest expense | 1,675 | 3,420 | 681 | 602 | 6,378 | |||||||||||||||
| Effective tax rate on adjustments | (328 | ) | (1,072 | ) | (140 | ) | (111 | ) | (1,651 | ) | ||||||||||
| Adjusted net income | $ | 6,966 | $ | 6,629 | $ | 6,346 | $ | 6,350 | $ | 26,291 | ||||||||||
| Adjusted diluted earnings per share | $ | 0.20 | $ | 0.19 | $ | 0.19 | $ | 0.19 | $ | 0.78 | ||||||||||
61
Financial Condition
Total assets increased $1.13 billion or 24% to $5.81 billion at December 31, 2017, and $1.15 billion or 32% to $4.68 billion in 2016. Growth highlights were our acquisitions: GulfShore which closed April 7, 2017, NorthStar which closed October 20, 2017, PBCB which closed November 3, 2017, Floridian which closed March 11, 2016, and BMO which closed June 3, 2016, expanding our presence in Tampa, Palm Beach and Central Florida (particularly in the greater Tampa and Orlando markets), and increasing total assets by $358 million, $216 million, $357 million, $417 million, $314 million, respectively.
Securities
Information related to yields, maturities, carrying values and fair value of the Company’s securities is set forth in Tables 13-16 and “Note D – Securities” of the Company’s consolidated financial statements.
At December 31, 2017, the Company had no trading securities, $955.8 million in securities available for sale, and $416.9 million in securities held to maturity. The Company's total securities portfolio increased $49.7 million or 4% from December 31, 2016. During the first quarter of 2016, securities totaling $66.9 million were added from Floridian. Security purchases during the first and second quarter of 2016 of $258.3 million were primarily to utilize anticipated cash to be received by Seacoast from the acquisition of BMO branches, with an increase of $203.4 million in securities held to maturity during the second quarter. Security purchases during the third quarter of 2016 were more limited, totaling only $13 million, and totaled $130 million in the fourth quarter of 2016, $43 million in the first quarter of 2017, $213 million in the second quarter of 2017, $35 million in the third quarter of 2017, and $220 million during the fourth quarter of 2017. Securities acquired from GulfShore in the second quarter of 2017 were nominal, and securities acquired from NorthStar and PBCB aggregated to $78.2 million. These actions were primary factors for the overall increase in the securities portfolio during 2016 and 2017. Funding for investments was derived from liquidity, both legacy and acquired in mergers, and increases in funding from our core customer deposit base and FHLB borrowings.
During 2017, proceeds from the sales of securities totaled $235.6 million (including net gains of $0.1 million). In comparison, proceeds from the sales of securities totaled $40.4 million (including net gains of $0.4 million) for 2016, and proceeds from the sale of securities totaled $60.3 million for 2015 (including net gains of $0.2 million). Management believes the securities sold had minimal opportunity to further increase in value.
Securities are generally acquired which return principal monthly. During 2017, maturities (primarily pay-downs of $294.1 million) totaled $298.9 million. During 2016, maturities (primarily pay-downs of $175.1 million) totaled $176.6 million and for 2015 maturities totaled $147.1 million (including $146.6 million in pay-downs). The modified duration of the investment portfolio at December 31, 2017 was 4.4 years, compared to 4.1 years at December 31, 2016.
62
At December 31, 2017, available for sale securities had gross unrealized losses of $8.6 million and gross unrealized gains of $4.2 million, compared to gross unrealized losses of $14.1 million and gross unrealized gains of $3.8 million at December 31, 2016. All of the securities with unrealized losses are reviewed for other-than-temporary impairment at least quarterly. As a result of these reviews it was determined that the securities were not other than temporarily impaired and the Company has the intent and ability to retain these securities (see additional discussion under “Other Fair Value Measurements” and “Other than Temporary Impairment of Securities” in “Critical Accounting Policies and Estimates”).
Company management considers the overall quality of the securities portfolio to be high. The Company has no exposure to securities with subprime collateral. The Company does not have an investment position in trust preferred securities.
The credit quality of the Company’s securities holdings are primarily investment grade. As of December 31, 2017, the Company’s investment securities, except for approximately $45.9 million of securities issued by states and their political subdivisions, generally are traded in liquid markets. U.S. Treasury and U.S. Government agency obligations totaled $944.5 million, or 71% of the total portfolio. The portfolio also includes $71.1 million in private label securities, most secured by residential real estate collateral originated in 2005 or prior years with low loan to values, and current FICO scores above 700. Generally these securities have credit support exceeding 5%. The collateral underlying these mortgage investments are primarily 30- and 15-year fixed rate, 5/1 and 10/1 adjustable rate mortgage loans. Historically, the mortgage loans serving as collateral for those investments have had minimal foreclosures and losses. The Company also has invested $304.8 million in uncapped 3-month Libor floating rate collateralized loan obligations. Collateralized loan obligations are special purpose vehicles that purchase loans as assets that provide a steady stream of income and possible capital appreciation. The collateral for the securities is first lien senior secured corporate debt. The Company has purchased senior tranches rated credit A or higher and performed stress tests, which indicated that the senior subordination levels are sufficient and no principal loss is forecast, verifying the independent rating.
Loans
Total loans (net of unearned income and excluding the allowance for loan losses) were $3.82 billion at December 31, 2017, $937.8 million or 33% more than at December 31, 2016, and were $2.88 billion at December 31, 2016, $732.2 million or 34% more than at December 31, 2015. Successful acquisition activity has further supplemented loan growth. The GulfShore, NorthStar and PBCB acquisitions in 2017 and Floridian and BMO acquisitions in 2016, contributed $251 million, $137 million, $272 million, $266 million and $63 million in loans, respectively. Also, during 2017, we purchased a mortgage loan pool of $43.0 million and sold two seasoned mortgage loan pools totaling $86.4 million. During the last six months of 2016, we purchased four separate mortgage loan pools aggregating to $63.5 million and a marine loan pool of $16.0 million (a total of $79.5 million in loans purchased), and sold two seasoned mortgage portfolio pools (summing to $70.6 million). The sale of mortgage pools believed to have reached their peak in market value resulted in gains of $1.3 million during 2017 and $0.9 million for 2016. Loan pools acquired had a weighted average yield of 3.4% at acquisition, with the total acquired of $122.5 million adjustable rate, and contain borrowers with an average FICO score above 740. An $11.0 million Small Business Administration (“SBA”) loan pool acquired in 2017 has weighted average yield of 3.0% at acquisition and is zero risk weighted for capital calculations. Success in commercial lending through our Accelerate Commercial banking model has increased loan growth as well. Analytics and digital marketing have further fueled loan growth in the consumer and small business channels. Loan production of $1.150 billion and $979 million was retained in the loan portfolio during the twelve months ended December 31, 2017 and 2016, respectively.
63
Seacoast saw continued loan growth across all business lines for 2017 and 2016. For 2017, $483 million in commercial and commercial real estate loans were originated compared to $432 million for 2016. Our loan pipeline for commercial and commercial real estate loans totaled $119 million at December 31, 2017, versus $89 million at December 31, 2016. The Company also closed $488 million in residential loans during 2017, compared to $403 million in 2016. The residential loan pipeline at December 31, 2017 totaled $49 million, versus $73 million at December 31, 2016. Pipelines reflect the lingering effect of the fall hurricanes. Increasing home values and lower interest rates have bolstered consumer borrowing. Consumer and small business originations improved as well, totaling $354 million during 2017 compared to $302 million during 2016.
The Company expects more loan growth opportunities for all types of lending in 2018. We will continue to expand our business banking teams, adding new, seasoned, commercial loan officers where market opportunities arise, and improving service through electronic and digital means. We believe that achieving our loan growth objectives, together with the prudent management of credit risk will provide us with the potential to make further, meaningful improvements to our earnings in 2018.
Our strong growth is accompanied by sound risk management procedures. Our lending policies contain numerous guardrails that pertain to lending by type of collateral and purpose, along with limits regarding loan concentrations and the dollar amount (size) of loans. In recent years the Company increased its focus and monitoring of its exposure to residential land, acquisition and development loans. Overall, the Company has reduced its exposure to commercial developers of residential land, acquisition and development loans from its peak of $352 million or 20% of total loans in early 2007 to $189 million or 5% at December 31, 2017. Our exposure to commercial real estate lending is significantly below regulatory limits (see “Loan Concentrations”).
Table 7 shows total loans (net of unearned income) for commercial and residential real estate, commercial and financial and consumer loans outstanding for the last five years.
The following table details loan portfolio composition at December 31, 2017 and 2016 for portfolio loans, purchase credit impaired loans (“PCI”), and purchase unimpaired loans (“PUL”) as defined in Note E-Loans.
64
| December 31, 2017 | Portfolio Loans | PCI Loans | PUL's | Total | ||||||||||||
| (In thousands) | ||||||||||||||||
| Construction and land development | $ | 215,315 | $ | 1,121 | $ | 126,689 | $ | 343,125 | ||||||||
| Commercial real estate (1) | 1,170,618 | 9,776 | 459,598 | 1,639,992 | ||||||||||||
| Residential real estate | 845,420 | 5,626 | 187,764 | 1,038,810 | ||||||||||||
| Commercial and financial (2) | 512,430 | 894 | 92,690 | 606,014 | ||||||||||||
| Consumer | 178,826 | 0 | 10,610 | 189,436 | ||||||||||||
| NET LOAN BALANCES | $ | 2,922,609 | $ | 17,417 | $ | 877,351 | $ | 3,817,377 | ||||||||
| December 31, 2016 | Portfolio Loans | PCI Loans | PUL's | Total | ||||||||||||
| (In thousands) | ||||||||||||||||
| Construction and land development | $ | 137,480 | $ | 114 | $ | 22,522 | $ | 160,116 | ||||||||
| Commercial real estate (1) | 1,041,915 | 11,257 | 304,420 | 1,357,592 | ||||||||||||
| Residential real estate | 784,290 | 684 | 51,813 | 836,787 | ||||||||||||
| Commercial and financial (2) | 308,731 | 941 | 60,917 | 370,589 | ||||||||||||
| Consumer | 153,434 | 0 | 1,018 | 154,452 | ||||||||||||
| NET LOAN BALANCES | $ | 2,425,850 | $ | 12,996 | $ | 440,690 | $ | 2,879,536 | ||||||||
| (1) | Commercial real estate includes owner-occupied balances of $791.4 million and $623.8 million at December 31, 2017 and 2016, respectively. |
| (2) | Commercial and financial includes lease financings of $30.3 million and $0 at December 31, 2017 and 2016, respectively. |
Net loan balances at December 31, 2017 and 2016 are net of deferred costs of $11.2 million and $10.6 million, respectively.
Commercial real estate mortgages increased $282.4 million or 21% to $1.64 billion at December 31, 2017, compared to December 31, 2016, a result of improving loan production and loans acquired in the mergers. Office building loans of $507.4 million or 31% of commercial real estate mortgages, comprise our largest concentration with a substantial portion owner-occupied. Portfolio composition also includes lending for retail trade, industrial, healthcare, churches and educational facilities, recreation, multifamily, mobile home parks, lodging, restaurants, agriculture, convenience stores, marinas, and other types of real estate.
The Company’s ten largest commercial real estate funded and unfunded loan relationships at December 31, 2017 aggregated to $169.7 million (versus $153.0 million a year ago), of which $145.0 million was funded. The Company’s 89 commercial real estate relationships in excess of $5 million totaled $803.5 million, of which $684.2 million was funded (compared to 65 relationships of $564.3 million a year ago, of which $502.1 million was funded).
Fixed rate and adjustable rate loans secured by commercial real estate, excluding construction loans, was $1.230 billion and $410 million, respectively, at December 31, 2017, compared to $1.042 billion and $315 million, respectively, a year ago.
65
Reflecting the impact of organic loan growth and the GulfShore, NorthStar and PBCB loan acquisitions, commercial loans (“C&I”) outstanding at year-end 2017 increased to $606.0 million, up substantially from $370.6 million a year ago. Commercial lending activities are directed principally towards businesses whose demand for funds are within the Company’s lending limits, such as small- to medium-sized professional firms, retail and wholesale outlets, and light industrial and manufacturing concerns. Such businesses are smaller and subject to lending risks, including, but not limited to, the effects of a downturn in the local economy, possible business failure, and insufficient cash flows.
Residential mortgage loans increased $202.0 million or 24% to $1.039 billion as of December 31, 2017. Substantially all residential originations have been underwritten to conventional loan agency standards, including loans having balances that exceed agency value limitations. During 2017 and 2016, $43 million and $64 million of whole loan mortgages were acquired and added to the portfolio, respectively. At December 31, 2017, approximately $487 million or 47% of the Company’s residential mortgage balances were adjustable 1-4 family mortgage loans (including hybrid adjustable rate mortgages). Fixed rate mortgages totaled approximately $247 million (24% of the residential mortgage portfolio) at December 31, 2017, of which 15- and 30-year mortgages totaled $22 million and $173 million, respectively. Remaining fixed rate balances were comprised of home improvement loans totaling $123 million, most with maturities of 10 years or less and home equity lines of credit, primarily floating rates, totaling $233 million at December 31, 2017. In comparison, loans secured by residential properties having fixed rates totaled $210 million at December 31, 2016, with 15- and 30-year fixed rate residential mortgages totaling $24 million and $153 million, respectively, and home equity mortgages and lines of credit totaled $78 million and $164 million, respectively.
The Company also provides consumer loans (including installment loans, loans for automobiles, boats, and other personal, family and household purposes) which increased $34.8 million or 23% year over year and totaled $188.7 million (versus $153.9 million a year ago). Of the $34.8 million increase, nominal changes occurred in marine loans or in automobile and truck loans, but other consumer loans increased $35.1 million. Marine loans at December 31, 2017 and 2016 included $10.8 million and $15.5 million, respectively, in purchased loan pools acquired during the third quarter of 2016.
At December 31, 2017, the Company had unfunded commitments to make loans of $807.7 million, compared to $532.1 million at December 31, 2016 (see “Note P - Contingent Liabilities and Commitments with Off-Balance Sheet Risk” to the Company’s consolidated financial statements).
Loan Concentrations
The Company has developed guardrails to manage loan types that are most impacted by stressed market conditions in order to achieve lower levels of credit loss volatility in the future. Commercial and commercial real estate loan relationships greater than $10 million totaled $388.0 million, representing 10% of the total portfolio at December 31, 2017, compared to $161.7 million or 13% at year-end 2010.
66
Concentrations in total construction and land development loans and total commercial real estate (“CRE”) loans are maintained well below regulatory limits. Construction and land development and CRE loan concentrations as a percentage of total risk based capital, were stable at 61% and 209%, respectively, at December 31, 2017. Regulatory guidance suggests limits of 100% and 300%, respectively.
The Company defines CRE in accordance with the guidance on “Concentrations in Commercial Real Estate Lending” (the “Guidance”) issued by the federal bank regulatory agencies in 2006, which defines CRE loans as exposures secured by land development and construction, including 1-4 family residential construction, multi-family property, and non-farm nonresidential property where the primary or a significant source of repayment is derived from rental income associated with the property (i.e. loans for which 50 percent or more of the source of repayment comes from third party, non-affiliated, rental income) or the proceeds of the sale, refinancing, or permanent financing of the property. Loans to real estate investment trusts, or “REITs”, and unsecured loans to developers that closely correlate to the inherent risks in CRE markets would also be considered CRE loans under the Guidance. Loans on owner occupied CRE are generally excluded.
Nonperforming Loans, Troubled Debt Restructurings, Other Real Estate Owned, and Credit Quality
Table 12 provides certain information concerning nonperforming assets for the years indicated.
Nonperforming assets (“NPAs”) at December 31, 2017 totaled $27.2 million, and were comprised of $12.5 million of nonaccrual portfolio loans, $7.0 million of nonaccrual purchased loans, $2.2 million of non-acquired other real estate owned (“OREO”), $1.6 million of acquired OREO and $3.8 million of branches out of service. NPAs decreased from $28.0 million recorded as of December 31, 2016 (comprised of $11.0 million of nonaccrual portfolio loans, $7.1 million of nonaccrual purchased loans, and $3.0 million of non-acquired OREO, $1.2 million of acquired OREO, and $5.7 million of branches out of service). At December 31, 2017, approximately 87% of nonaccrual loans were secured with real estate. See the tables below for details about nonaccrual loans. At December 31, 2017, nonaccrual loans have been written down by approximately $3.7 million or 16% of the original loan balance (including specific impairment reserves). During 2017, total OREO decreased $2.3 million or 23%, primarily related to branches taken out of service and sold in 2017.
Nonperforming loans to total loans outstanding at December 31, 2017 decreased to 0.51% from 0.63% at December 31, 2016.
The Company’s asset mitigation staff handles all foreclosure actions together with outside legal counsel.
The Company pursues loan restructurings in selected cases where it expects to realize better values than may be expected through traditional collection activities. The Company has worked with retail mortgage customers, when possible, to achieve lower payment structures in an effort to avoid foreclosure. Troubled debt restructurings (“TDRs”) have been a part of the Company’s loss mitigation activities and can include rate reductions, payment extensions and principal deferrals. Company policy requires Troubled debt restructurings (“TDRs”) that are classified as nonaccrual loans after restructuring remain on nonaccrual until performance can be verified, which usually requires six months of performance under the restructured loan terms. Accruing restructured loans totaled $15.6 million at December 31, 2017 compared to $17.7 million at December 31, 2016. Accruing TDRs are excluded from our nonperforming asset ratios. The tables below set forth details related to nonaccrual and accruing restructured loans.
67
| Accruing | ||||||||||||||||
| December 31, 2017 | Nonaccrual Loans | Restructured | ||||||||||||||
| (In thousands) | Non-Current | Current | Total | Loans | ||||||||||||
| Construction & land development | ||||||||||||||||
| Residential | $ | 0 | $ | 0 | $ | 0 | $ | 0 | ||||||||
| Commercial | 0 | 72 | 72 | 30 | ||||||||||||
| Individuals | 0 | 166 | 166 | 207 | ||||||||||||
| 0 | 238 | 238 | 237 | |||||||||||||
| Residential real estate mortgages | 6,255 | 7,601 | 13,856 | 9,195 | ||||||||||||
| Commercial real estate mortgages | 1,903 | 931 | 2,834 | 5,838 | ||||||||||||
| Real estate loans | 8,158 | 8,770 | 16,928 | 15,270 | ||||||||||||
| Commercial and financial | 807 | 1,691 | 2,498 | 0 | ||||||||||||
| Consumer | 0 | 98 | 98 | 289 | ||||||||||||
| Total loans | $ | 8,965 | $ | 10,559 | $ | 19,524 | $ | 15,559 | ||||||||
At December 31, 2017 and 2016, total TDRs (performing and nonperforming) were comprised of the following loans by type of modification:
| December 31, 2017 | December 31, 2016 | |||||||||||||||
| (Dollars in thousands) | Number | Amount | Number | Amount | ||||||||||||
| Rate reduction | 71 | $ | 12,843 | 81 | $ | 14,472 | ||||||||||
| Maturity extended with change in terms | 51 | 5,803 | 56 | 6,975 | ||||||||||||
| Chapter 7 bankruptcies | 28 | 1,812 | 36 | 2,308 | ||||||||||||
| Not elsewhere classified | 11 | 1,190 | 13 | 1,739 | ||||||||||||
| Total loans | 161 | $ | 21,648 | 186 | $ | 25,494 | ||||||||||
During the twelve months ended December 31, 2017, newly identified TDRs totaled $0.1 million, compared to $2.0 million for 2016. Loan modifications are not reported in calendar years after modification if the loans were modified at an interest rate equal to the yields of new loan originations with comparable risk and the loans are performing based on the terms of the restructuring agreements. No accruing loans that were restructured within the twelve months preceding December 31, 2017 defaulted during the twelve months ended December 31, 2017, the same as for 2016. A restructured loan is considered in default when it becomes 90 days or more past due under the modified terms, has been transferred to nonaccrual status, or has been transferred to OREO.
At December 31, 2017, loans (excluding PCI loans) totaling $30.3 million were considered impaired (comprised of total nonaccrual, loans 90 days or more past due, and TDRs) and $2.4 million of the allowance for loan losses was allocated for probable losses on these loans, compared to $32.7 million and $2.5 million, respectively, at December 31, 2016.
68
In accordance with regulatory reporting requirements, loans are placed on nonaccrual following the Retail Classification of Loan interagency guidance. Typically loans 90 days or more past due are reviewed for impairment, and if deemed impaired, are placed on nonaccrual. Once impaired, the current fair market value of the collateral is assessed and a specific reserve and/or charge-off taken. Quarterly thereafter, the loan carrying value is analyzed and any changes are appropriately made as described above.
Deposits
The Company’s balance sheet continues to be primarily funded with core deposits.
Total deposits increased $1.07 billion or 30% to $4.59 billion at December 31, 2017, compared to one year earlier. Excluding the GulfShore, NorthStar and PBCB acquisitions, total deposits increased $123.0 million or 4% from December 31, 2016. In comparison, total deposits increased $678.9 million or 24% to $3.52 billion at December 31, 2016, compared to one year earlier. Excluding the Floridian and BMO acquisitions, total deposits increased $27.3 million or 1% from December 31, 2015. Deposit growth during 2016 was impacted by declines in public fund balances, which decreased by more than $36 million from year-end 2015.
Since December 31, 2016, interest bearing deposits (interest bearing demand, savings and money markets deposits) increased $393.5 million or 19% to $2.42 billion, noninterest bearing demand deposits increased $251.9 million or 22% to $1.40 billion, and CDs increased $424.1 million or 121% to $775.9 million. Excluding acquired deposits, noninterest demand deposits were $82.4 million or 7% higher from year-end 2016, and represent 30% deposits, compared to 33% at December 31, 2016. Core deposit growth reflects our success in growing relationships both organically and through acquisitions.
Additions in brokered CDs and through acquisitions have been the primary contributors to the increase in CDs during 2017 and 2016. An intentional decrease in higher cost time deposits was recorded over the two years prior to 2016’s acquisitions, and was more than offset by increases in low cost or no cost deposits.
Customer repurchase agreements totaled $216.1 million at December 31, 2017, increasing $11.9 million or 6% from December 31, 2016. The repurchase agreements are offered by Seacoast to select customers who wish to sweep excess balances on a daily basis for investment purposes. Public funds comprise a significant amount of the outstanding balance.
No unsecured federal funds purchased were outstanding at December 31, 2017, or 2016.
Borrowings
At December 31, 2017 and 2016, borrowings were comprised of subordinated debt of $70.5 million and $70.2 million, respectively, related to trust preferred securities issued by trusts organized or acquired by the Company, and borrowings from FHLB of $211.0 million and $415.0 million, respectively. At December 31, 2017, our FHLB borrowings were substantially all maturing within 30 days, with the exception of $7.0 million acquired from PBCB that mature in 2018 and 2019, and the rate for FHLB funds at year-end was 1.39%. In the second quarter of 2016, we paid an early redemption cost of $1.8 million related to prepayment of $50.0 million of FHLB advances having a weighted average cost of 3.22% and scheduled to mature in late 2017 (see “Noninterest Expense”). The two FHLB advances redeemed in 2016 had been outstanding since 2007. Secured FHLB borrowings are an integral tool in liquidity management for the Company.
69
The Company issued subordinated debt in conjunction with its wholly owned trust subsidiaries, SBCF Capital Trust I and SBCF Statutory Trust II that were formed in 2005. In 2007, the Company issued additional subordinated debt for its wholly owned trust subsidiary, SBCF Statutory Trust III. The 2005 subordinated debt for each trust totaled $20.6 million (aggregating to $41.2 million) and the 2007 subordinated debt totaled $12.4 million. As part of the October 1, 2014 BANKshares acquisition the Company inherited three junior subordinated debentures totaling $5.2 million, $4.1 million, and $5.2 million, respectively. Also, as part of the Grand acquisition, the Company inherited an additional junior subordinated debenture totaling $7.2 million. The acquired junior subordinated debentures (in accordance with ASU 805 Business Combinations) were recorded at fair value, which collectively is $4.8 million lower than face value at December 31, 2017. This amount is being amortized into interest expense over the acquired subordinated debts’ remaining term to maturity. All trust preferred securities are guaranteed by the Company on a junior subordinated basis.
Under Basel III and Federal Reserve rules, qualified trust preferred securities and other restricted capital elements can be included as Tier 1 capital, within limitations. The Company believes that its trust preferred securities qualify under these capital rules. The weighted average interest rate of our outstanding subordinated debt related to trust preferred securities was 3.47% for the twelve month period ended December 31, 2017, compared to 2.94% for all of 2016.
Go to “Note I – Borrowings” of our consolidated financial statements for more detailed information pertaining to borrowings.
Off-Balance Sheet Transactions
In the normal course of business, we may engage in a variety of financial transactions that, under generally accepted accounting principles, either are not recorded on the balance sheet or are recorded on the balance sheet in amounts that differ from the full contract or notional amounts. These transactions involve varying elements of market, credit and liquidity risk.
Lending commitments include unfunded loan commitments and standby and commercial letters of credit. For loan commitments, the contractual amount of a commitment represents the maximum potential credit risk that could result if the entire commitment had been funded, the borrower had not performed according to the terms of the contract, and no collateral had been provided. A large majority of loan commitments and standby letters of credit expire without being funded, and accordingly, total contractual amounts are not representative of our actual future credit exposure or liquidity requirements. Loan commitments and letters of credit expose the Company to credit risk in the event that the customer draws on the commitment and subsequently fails to perform under the terms of the lending agreement.
For commercial customers, loan commitments generally take the form of revolving credit arrangements. For retail customers, loan commitments are generally lines of credit secured by residential property. These instruments are not recorded on the balance sheet until funds are advanced under the commitment. Loan commitments were $808 million at December 31, 2017, and $532 million at December 31, 2016 (see “Note P-Contingent Liabilities and Commitments with Off-Balance Sheet Risk” to the Company’s consolidated financial statements).
70
Cash and Cash Equivalents, Liquidity Risk Management and Contractual Commitments
Cash and cash equivalents (including interest bearing deposits) totaled $109.5 million on a consolidated basis at December 31, 2017, compared to $109.6 million at December 31, 2016.
Liquidity risk involves the risk of being unable to fund assets with the appropriate duration and rate-based liability, as well as the risk of not being able to meet unexpected cash needs. Liquidity planning and management are necessary to ensure the ability to fund operations cost effectively and to meet current and future potential obligations such as loan commitments and unexpected deposit outflows.
The table below presents maturities of our funding. In this table, all deposits with indeterminate maturities such as interest bearing and noninterest bearing demand deposits, savings accounts and money market accounts are presented as having a maturity of one year or less. We consider these low cost, no-cost deposits to be our largest, most stable funding source, despite no contracted maturity.
| Contractual Obligations as of: | ||||||||||||||||||||
| December 31, 2017 | ||||||||||||||||||||
| Over One | Over Three | |||||||||||||||||||
| One Year | Year Through | Years Through | Over Five | |||||||||||||||||
| (In thousands) | Total | or Less | Three Years | Five Years | Years | |||||||||||||||
| Deposit maturities | $ | 4,592,720 | $ | 4,444,226 | $ | 109,061 | $ | 38,405 | $ | 1,028 | ||||||||||
| Short-term borrowings | 216,094 | 216,094 | 0 | 0 | 0 | |||||||||||||||
| FHLB borrowings | 211,000 | 208,000 | 3,000 | 0 | 0 | |||||||||||||||
| Subordinated debt | 70,521 | 0 | 0 | 0 | 70,521 | |||||||||||||||
| Operating leases | 40,725 | 6,303 | 11,259 | 7,278 | 15,885 | |||||||||||||||
| TOTAL | $ | 5,131,060 | $ | 4,874,623 | $ | 123,320 | $ | 45,683 | $ | 87,434 | ||||||||||
Funding sources primarily include customer-based core deposits, collateral-backed borrowings, cash flows from operations, cash flows from our loan and investment portfolios and asset sales (primarily secondary marketing for residential real estate mortgages and marine financings). Cash flows from operations are a significant component of liquidity risk management and we consider both deposit maturities and the scheduled cash flows from loan and investment maturities and payments when managing risk.
Deposits are also a primary source of liquidity. The stability of this funding source is affected by numerous factors, including returns available to customers on alternative investments, the quality of customer service levels, perception of safety and soundness and competitive forces. We routinely use securities and loans as collateral for secured borrowings. In the event of severe market disruptions, we have access to secured borrowings through the FHLB and the Federal Reserve Bank of Atlanta under its borrower-in-custody program.
71
Contractual maturities for assets and liabilities are reviewed to meet current and expected future liquidity requirements. Sources of liquidity, both anticipated and unanticipated, are maintained through a portfolio of high quality marketable assets, such as residential mortgage loans, securities held for sale and interest-bearing deposits. The Company is also able to provide short term financing of its activities by selling, under an agreement to repurchase, United States Treasury and Government agency securities not pledged to secure public deposits or trust funds. At December 31, 2017, Seacoast Bank had available unsecured lines of $95 million and lines of credit under current lendable collateral value, which are subject to change, of $1.006 billion. Seacoast Bank had $455 million of United States Treasury and Government agency securities and mortgage backed securities not pledged and available for use under repurchase agreements, and had an additional $593 million in residential and commercial real estate loans available as collateral. In comparison, at December 31, 2016, the Company had available unsecured lines of $75 million and lines of credit of $578 million, and had $688 million of Treasury and Government agency securities and mortgage backed securities not pledged and available for use under repurchase agreements, as well as an additional $378 million in residential and commercial real estate loans available as collateral.
The Company does not rely on and is not dependent on off-balance sheet financing or significant amounts of wholesale funding. During the first, second and third quarters of 2017, the Company acquired an additional $273.7 million of brokered certificates of deposit (“CDs”) at an overall average rate of 1.31%. Most have maturities of 12 months or less and will mature in 2018, with the exception of $64 million that matured in the fourth quarter of 2017. Brokered CDs at December 31, 2017 total $210.0 million.
The Company has traditionally relied upon dividends from Seacoast Bank and securities offerings to provide funds to pay the Company’s expenses and to service the Company’s debt. At December 31, 2017, Seacoast Bank can distribute dividends to the Company of approximately $87.7 million. At December 31, 2017, the Company had cash and cash equivalents at the parent of approximately $34.4 million (exclusive of $21.3 million to settle in early 2018 for the sale of Visa Class B stock), compared to $13.3 million at December 31, 2016, with the increase directly related to the Company’s capital raise in February 2017 (see “Note M – Shareholders’ Equity”), net of cash paid in the GulfShore, NorthStar and PBCB acquisitions (see “Note S – Business Combinations”).
Capital Resources and Management
Table 6 summarizes the Company’s capital position and selected ratios.
Activity in shareholders’ equity:
| For the Year Ended December 31, | ||||||||
| (In thousands) | 2017 | 2016 | ||||||
| Beginning balance at January 1, 2017 and 2016 | $ | 435,397 | $ | 353,453 | ||||
| Net income | 42,865 | 29,202 | ||||||
| Issuance of stock via common stock offering on February 21, 2017 | 55,641 | 0 | ||||||
| Issuance of stock pursuant to acquisition of GulfShores Bancshares, Inc., | ||||||||
| NorthStar Banking Corporation, Palm Beach Community Bank (2017) and Floridian Bank (2016) | 146,547 | 50,913 | ||||||
| Stock compensation (net of Treasury shares acquired) | 5,211 | 3,129 | ||||||
| Change in other comprehensive income | 4,003 | (1,300 | ) | |||||
| Ending balance at December 31, 2017 and 2016 | $ | 689,664 | $ | 435,397 | ||||
72
The Company’s equity capital at December 31, 2017 increased $254.3 million to $689.7 million since December 31, 2016, and was $81.9 million higher at December 31, 2016, when compared to year-end 2015.
On February 21, 2017, the Company closed on an offering of 8,912,500 shares of common stock, consisting of 2,702,500 shares sold by the Company and 6,210,000 shares sold by one of its shareholders. Seacoast received proceeds (net of expense) of $55.6 million from the issuance of the 2,702,500 shares of its common stock. The Company has used and intends to use the net proceeds from the offering for general corporate purposes, including acquisitions completed, potential future acquisitions, and to support organic growth. Seacoast did not receive any proceeds from the sale of its shareholder’s shares (see “Note N – Shareholders’ Equity”).
The Company also issued common shares of $62.9 million, $27.4 million, $56.3 million, and $50.9 million in conjunction with the acquisition of GulfShore, NorthStar, PBCB in 2017 and Floridian in 2016, respectively. The Company issued shares of common stock as consideration for each of the mergers. The BMO purchase did not include an issuance of any equity.
The ratio of shareholders’ equity to period end total assets was 11.87% and 9.30% at December 31, 2017 and 2016, respectively. The ratio of tangible shareholders’ equity to tangible assets was 9.27% and 7.74% at December 31, 2017 and 2016, respectively. Equity has also increased as a result of earnings retained by the Company. During 2016, the ratio of shareholders’ equity to assets declined, as the Company successfully grew assets at a faster pace than equity over the period.
Capital ratios are well above regulatory requirements for well-capitalized institutions. Seacoast management’s use of risk-based capital ratios in its analysis of the Company’s capital adequacy are “non-GAAP” financial measures. Seacoast’s management uses these measures to assess the quality of capital and believes that investors may find it useful in their analysis of the Company. The capital measures are not necessarily comparable to similar capital measures that may be presented by other companies (see “Table 6 - Capital Resources” and “Note N – Shareholders’ Equity”).
| Seacoast | Seacoast | Minimum to be | ||||||||||
| (Consolidated) | Bank | Well-Capitalized* | ||||||||||
| Common equity Tier 1 ratio (CET1) | 12.04 | % | 12.41 | % | 6.5 | % | ||||||
| Tier 1 capital ratio | 13.61 | % | 12.41 | % | 8.0 | % | ||||||
| Total risk-based capital ratio | 14.24 | % | 13.04 | % | 10.0 | % | ||||||
| Leverage ratio | 10.68 | % | 9.72 | % | 5.0 | % | ||||||
| * For subsidiary bank only | ||||||||||||
The Company’s total risk-based capital ratio was 14.24% at December 31, 2017, an increase from December 31, 2016’s ratio of 13.25%. Higher earnings have been a primary contributor, as well as the capital raise in February 2017. As of December 31, 2017, the Bank’s leverage ratio (Tier 1 capital to adjusted total assets) was 9.72%, compared to 8.78% at December 31, 2016, reflecting earnings and the effect of push down accounting on Seacoast’s subsidiary bank’s capital.
73
The Company and Seacoast Bank are subject to various general regulatory policies and requirements relating to the payment of dividends, including requirements to maintain adequate capital above regulatory minimums. The appropriate federal bank regulatory authority may prohibit the payment of dividends where it has determined that the payment of dividends would be an unsafe or unsound practice. The Company is a legal entity separate and distinct from Seacoast Bank and its other subsidiaries, and the Company’s primary source of cash and liquidity, other than securities offerings and borrowings, is dividends from its bank subsidiary. Without Office of the Comptroller of the Currency (“OCC”) approval, Seacoast Bank can pay $87.7 million of dividends to the Company (see “Note C - Cash, Dividend and Loan Restrictions”).
The OCC and the Federal Reserve have policies that encourage banks and bank holding companies to pay dividends from current earnings, and have the general authority to limit the dividends paid by national banks and bank holding companies, respectively, if such payment may be deemed to constitute an unsafe or unsound practice. If, in the particular circumstances, either of these federal regulators determined that the payment of dividends would constitute an unsafe or unsound banking practice, either the OCC or the Federal Reserve may, among other things, issue a cease and desist order prohibiting the payment of dividends by Seacoast Bank or us, respectively. Under a recently adopted Federal Reserve policy, the board of directors of a bank holding company must consider different factors to ensure that its dividend level is prudent relative to the organization’s financial position and is not based on overly optimistic earnings scenarios such as any potential events that may occur before the payment date that could affect its ability to pay, while still maintaining a strong financial position. As a general matter, the Federal Reserve has indicated that the board of directors of a bank holding company, such as Seacoast, should consult with the Federal Reserve and eliminate, defer, or significantly reduce the bank holding company’s dividends if: (i) its net income available to shareholders for the past four quarters, net of dividends previously paid during that period, is not sufficient to fully fund the dividends; (ii) its prospective rate of earnings retention is not consistent with its capital needs and overall current and prospective financial condition; or (iii) it will not meet, or is in danger of not meeting, its minimum regulatory capital adequacy ratios.
The Company has seven wholly owned trust subsidiaries, two of which, SBCF Capital Trust I and SBCF Statutory Trust II, were formed in 2005 to issue trust preferred securities. In 2007, the Company formed an additional wholly owned trust subsidiary, SBCF Statutory Trust III. The 2005 trusts each issued $20.0 million (totaling $40.0 million) of trust preferred securities and the 2007 trust issued an additional $12.0 million in trust preferred securities. In 2014, as part of the BANKshares acquisition, the Company acquired BankFIRST Statutory Trust I, BankFIRST Statutory Trust II and The BANKshares Capital Trust I that issued in the aggregate $14.4 million in trust preferred securities. In 2015, as part of the Grand acquisition, the Company also acquired Grand Bankshares Capital Trust I that issued $7.2 million in trust preferred securities. Trust preferred securities from our acquisitions are recorded at fair value when acquired. All trust preferred securities are guaranteed by the Company on a junior subordinated basis. The Federal Reserve’s rules permit qualified trust preferred securities and other restricted capital elements to be included under Basel III capital guidelines, with limitations, and net of goodwill and intangibles. The Company believes that its trust preferred securities qualify under these revised regulatory capital rules and believes that it will be able to treat all $70.5 million of trust preferred securities as Tier 1 capital. For regulatory purposes, the trust preferred securities are added to the Company’s tangible common shareholders’ equity to calculate Tier 1 capital.
The Company’s capital is expected to continue to increase with positive earnings.
74
Critical Accounting Policies and Estimates
The Company’s consolidated financial statements are prepared in accordance with U.S. generally accepted accounting principles, (“GAAP”), including prevailing practices within the financial services industry. The preparation of consolidated financial statements requires management to make judgments in the application of certain of its accounting policies that involve significant estimates and assumptions. We have established policies and control procedures that are intended to ensure valuation methods are well controlled and applied consistently from period to period. These estimates and assumptions, which may materially affect the reported amounts of certain assets, liabilities, revenues and expenses, are based on information available as of the date of the financial statements, and changes in this information over time and the use of revised estimates and assumptions could materially affect amounts reported in subsequent financial statements. Management, after consultation with the Company’s Audit Committee, believes the most critical accounting estimates and assumptions that involve the most difficult, subjective and complex assessments are:
| • | the allowance and the provision for loan losses; |
| • | acquisition accounting and purchased loans; |
| • | intangible assets and impairment testing; |
| • | other fair value adjustments; |
| • | other than temporary impairment of securities; |
| • | income taxes and realization of deferred tax assets; and |
| • | contingent liabilities. |
The following is a discussion of the critical accounting policies intended to facilitate a reader’s understanding of the judgments, estimates and assumptions underlying these accounting policies and the possible or likely events or uncertainties known to us that could have a material effect on our reported financial information. For more information regarding management’s judgments relating to significant accounting policies and recent accounting pronouncements (see “Note A-Significant Accounting Policies” to the Company’s consolidated financial statements).
Allowance and Provision for Loan Losses – Critical Accounting Policies and Estimates
Management determines the provision for loan losses by continuously analyzing and monitoring delinquencies, nonperforming loans levels and the outstanding balances for each loan category, as well as the amount of net charge-offs, for estimating losses inherent in its portfolio. While the Company’s policies and procedures used to estimate the provision for loan losses charged to operations are considered adequate by management, factors beyond the control of the Company, such as general economic conditions, both locally and nationally, make management’s judgment as to the adequacy of the provision and allowance for loan losses approximate and imprecise (see “Nonperforming Assets”).
75
The provision for loan losses is the result of a detailed analysis estimating for probable loan losses. The analysis includes the evaluation of impaired and purchased credit impaired loans as prescribed under FASB Accounting Standards Codification (“ASC”) 310, Receivables as well as an analysis of homogeneous loan pools not individually evaluated as prescribed under ASC 450, Contingencies. For 2017, the Company recorded provision for loan losses of $5.6 million, which compared to provision for loan losses for 2016 of $2.4 million, and a recapture of the allowance for loan losses for 2015 of $2.6 million. The Company incurred net charge-offs for 2017 of $1.6 million, compared to net recoveries for 2016 of $2.1 million, and net charge-offs for 2015 of $0.4 million representing 0.05%, (0.08%) and 0.02% of average total loans for each year, respectively. For 2017, provision for loan losses reflects continued strong credit metrics, decreases in the residential loan portfolio with lower modeled loss rates given near-zero historical losses and lower balances (after the $57.9 million sale in the third quarter and $28.5 million sale in the fourth quarter), and decreases reflecting reduced concentration risk in the commercial and commercial real estate portfolios. Delinquency trends remain low and show continued stability (see section titled “Nonperforming Loans, Troubled Debt Restructurings, Other Real Estate Owned, and Credit Quality”).
Management continuously monitors the quality of the Company’s loan portfolio and maintains an allowance for loan losses it believes is sufficient to absorb probable losses incurred in the loan portfolio. The allowance for loan losses increased $3.7 million to $27.1 million at December 31, 2017, compared to $23.4 million at December 31, 2016. The allowance for loan and lease losses (“ALLL”) framework has four basic elements: (1) specific allowances for loans individually evaluated for impairment; (2) general allowances for pools of homogeneous non-purchased loans (“portfolio loans”) within the portfolio that have similar risk characteristics, which are not individually evaluated; (3) specific allowances for purchased impaired loans which are individually evaluated based on the loans expected principal and interest cash flows; and (4) general allowances for purchased unimpaired pools of homogeneous loans that have similar risk characteristics. The aggregate of these four components results in our total ALLL.
The first component of the ALLL analysis involves the estimation of an allowance specific to individually evaluated impaired portfolio loans, including accruing and non-accruing restructured commercial and consumer loans. In this process, a specific allowance is established for impaired loans based on an analysis of the most probable sources of repayment, including discounted cash flows, liquidation or operation of the collateral, or the market value of the loan itself. It is the Company’s policy to charge off any portion of the loan deemed uncollectable. Restructured consumer loans are also evaluated and included in this element of the estimate. As of December 31, 2017, the specific allowance related to impaired portfolio loans individually evaluated totaled $2.4 million, compared to $2.5 million as of December 31, 2016. Residential loans that become 90 days past due are placed on nonaccrual and a specific allowance is made for any loan that becomes 120 days past due. Residential loans are subsequently written down if they become 180 days past due and such write-downs are supported by a current appraisal, consistent with current banking regulations.
The second component of the ALLL analysis, the general allowance for homogeneous portfolio loan pools not individually evaluated, is determined by applying factors to pools of loans within the portfolio that have similar risk characteristics. The general allowance is determined using a baseline factor that is developed from an analysis of historical net charge-off experience. These baseline factors are developed and applied to the various portfolio loan pools. Adjustments may be made to baseline reserves for some of the loan pools based on an assessment of internal and external influences on credit quality not fully reflected in the historical loss experience. These influences may include elements such as changes in concentration, macroeconomic conditions, and/or recent observable asset quality trends.
76
The third component consists of amounts reserved for purchased credit-impaired loans (PCI). On a quarterly basis, the Company updates the amount of loan principal and interest cash flows expected to be collected, incorporating assumptions regarding default rates, loss severities, the amounts and timing of prepayments and other factors that are reflective of current market conditions. Probable decreases in expected loan cash flows trigger the recognition of impairment, which is then measured as the present value of the expected principal loss plus any related foregone interest cash flows discounted at the pool’s effective interest rate. Impairments that occur after the acquisition date are recognized through the provision for loan losses. Probable and significant increases in expected principal cash flows would first reverse any previously recorded allowance for loan losses; any remaining increases are recognized prospectively as interest income. The impacts of (i) prepayments, (ii) changes in variable interest rates, and (iii) any other changes in the timing of expected cash flows are recognized prospectively as adjustments to interest income. Disposals of loans, which may include sales of loans, receipt of payments in full by the borrower, or foreclosure, result in removal of the loan from the purchased credit impaired portfolio.
The final component consists of amounts reserved for purchased unimpaired loans (PUL). Loans collectively evaluated for impairment reported at December 31, 2017 include loans acquired from GulfShore Bank on April 7, 2017, NorthStar on October 20, 2017, PBCB on November 3, 2017, BMO Harris on June 3, 2016, Floridian Bank on March 11, 2016, Grand Bank on July 17, 2015 and BANKshares on October 1, 2014 that are not PCI loans. These loans are performing loans recorded at estimated fair value at the acquisition date. These fair value discount amounts are accreted into income over the remaining lives of the related loans on a level yield basis.
Our analysis of the adequacy of the allowance for loan losses also takes into account qualitative factors such as credit quality, loan concentrations, internal controls, audit results, staff turnover, local market conditions, employment levels and loan growth.
During the first quarter of 2017, management enhanced its processes for evaluating the adequacy of the general reserve components of the allowance for loan losses due to the increasing size and complexity of the commercial loan portfolio. Using a software tool, the enhanced process applies a migration model to portfolio segments that allows us to observe performance over time, and the ability to separately analyze sub-segments based on vintage, risk rating, and origination tactics. Previously, an analysis was based on an average loss rate for various lookback periods.
These enhancements provide a more reliable estimate of probable losses in the portfolio, improve the efficiency of the process for preparing the analysis, and provide the foundation for moving to a current expected credit loss approach. This change in accounting estimate was implemented on January 1, 2017 and had no material impact on the ALLL.
The allowance as a percentage of portfolio loans outstanding (excluding PCI and PUL loans) was 0.90% at December 31, 2017, compared to 0.96% at December 31, 2016. The reduced level of impaired loans contributed to a lower risk of loss and the lower ALLL as of December 31, 2017. The risk profile of the loan portfolio reflects adherence to credit management methodologies to execute a low risk strategic plan for loan growth. New loan production is focused on adjustable rate residential real estate loans, owner-occupied commercial real estate, small business loans for professionals and businesses, as well as consumer lending. Strategies, processes and controls are in place to ensure that new production is well underwritten and maintains a focus on smaller, diversified and lower-risk lending.
77
Concentrations of credit risk, discussed under the caption “Loan Portfolio” of this discussion and analysis, can affect the level of the allowance and may involve loans to one borrower, an affiliated group of borrowers, borrowers engaged in or dependent upon the same industry, or a group of borrowers whose loans are predicated on the same type of collateral. At December 31, 2017, the Company had $1.193 billion in loans secured by residential real estate and $1.829 billion in loans secured by commercial real estate, representing 31.3% and 47.9% of total loans outstanding, respectively. In addition, the Company is subject to a geographic concentration of credit because it only operates in central and southeastern Florida.
It is the practice of the Company to ensure that its charge-off policy meets or exceeds regulatory minimums. Losses on unsecured consumer loans are recognized at 90 days past due, compared to the regulatory loss criteria of 120 days. In compliance with Federal Financial Institution Examination Council guidelines, secured consumer loans, including residential real estate, are typically charged-off or charged down between 120 and 180 days past due, depending on the collateral type. Commercial loans and real estate loans are typically placed on nonaccrual status when principal or interest is past due for 90 days or more, unless the loan is both secured by collateral having realizable value sufficient to discharge the debt in-full and the loan is in process of collection. Secured loans may be charged-down to the estimated value of the collateral with previously accrued unpaid interest reversed. Subsequent charge-offs may be required as a result of changes in the market value of collateral or other repayment prospects. Initial charge-off amounts are based on valuation estimates derived from appraisals, broker price opinions, or other market information. Generally, new appraisals are not received until the foreclosure process is completed; however, collateral values are evaluated periodically based on market information and incremental charge-offs are recorded if it is determined that collateral values have declined from their initial estimates.
While it is the Company’s policy to charge off in the current period loans in which a loss is considered probable, there are additional risks of future losses that cannot be quantified precisely or attributed to particular loans or classes of loans. Because these risks include the state of the economy, borrower payment behaviors and local market conditions as well as conditions affecting individual borrowers, management’s judgment of the allowance is necessarily approximate and imprecise. The allowance is also subject to regulatory examinations and determinations as to adequacy, which may take into account such factors as the methodology used to calculate the ALLL and the size of the ALLL in comparison to a group of peer companies identified by the regulatory agencies. Management will consistently evaluate the ALLL methodology and seek to refine and enhance this process as appropriate. As a result, it is likely that the methodology will continue to evolve over time.
Table 10 provides certain information concerning the Company’s provisioning for loan losses and allowance (recapture) for the years indicated.
Note F - Allowance for loan losses to the financial statements summarizes the Company’s allocation of the ALLL to construction and land development loans, commercial and residential estate loans, commercial and financial loans, and consumer loans, and provides more specific detail regarding charge-offs and recoveries for each loan component and the composition of the loan portfolio at December 31, 2017 and 2016.
78
Acquisition Accounting and Purchased Loans – Critical Accounting Policies and Estimates
The Company accounts for its acquisitions under ASC Topic 805, Business Combinations, which requires the use of the acquisition method of accounting. All identifiable assets acquired, including loans, are recorded at fair value. No allowance for loan losses related to the acquired loans is recorded on the acquisition date as the fair value of the loans acquired incorporates assumptions regarding credit risk. All loans acquired are recorded at fair value in accordance with the fair value methodology prescribed in ASC Topic 820. The fair value estimates associated with the loans include estimates related to expected prepayments and the amount and timing of expected principal, interest and other cash flows.
Over the life of the purchased credit impaired loans acquired, the Company continues to estimate cash flows expected to be collected. The Company evaluates at each balance sheet date whether the present value of the acquired loans using the effective interest rates has decreased and if so, recognizes a provision for loan loss in its consolidated statement of income. For any increases in cash flows expected to be collected, the Company adjusts the amount of accretable yield recognized on a prospective basis over the loan’s remaining life.
Intangible Assets and Impairment Testing – Critical Accounting Policies and Estimates
Intangible assets consist of goodwill and core deposit intangibles. Goodwill represents the excess purchase price over the fair value of net assets acquired in business acquisitions. The core deposit intangible represents the excess intangible value of acquired deposit customer relationships as determined by valuation specialists. Core deposit intangibles are amortized on a straight-line basis, and are evaluated for indications of potential impairment at least annually. Goodwill is not amortized but rather is evaluated for impairment on at least an annual basis. We performed an annual impairment test of goodwill as required by FASB ASC 350, Intangibles—Goodwill and Other, in the fourth quarter of 2017. Seacoast conducted the test internally, documenting the impairment test results, and concluded that no impairment occurred. Goodwill was not recorded for the Grand acquisition (on July 17, 2015) that resulted in a bargain purchase gain; however a core deposit intangible was recorded.
Fair value estimates for acquired assets and assumed liabilities are based on the information available, and are subject to change for up to one year after the closing date of the acquisition as additional information relative to closing date fair values becomes available.
Other Fair Value Measurements – Critical Accounting Policies and Estimates
“As Is” values are used to measure fair market value on impaired loans, OREO and repossessed assets. All impaired loans, OREO and repossessed assets are reviewed quarterly to determine if fair value adjustments are necessary based on known changes in the market and/or the project assumptions. When necessary, the “As Is” appraised value may be adjusted based on more recent appraisal assumptions received by the Company on other similar properties, the tax assessed market value, comparative sales and/or an internal valuation. Collateral dependent impaired loans are loans that are solely dependent on the liquidation of the collateral or operation of the collateral for repayment. If an updated assessment is deemed necessary and an internal valuation cannot be made, an external “As Is” appraisal will be requested. Upon receipt of the “As Is” appraisal a charge-off is recognized for the difference between the loan amount and its current fair market value.
79
The fair value of the available for sale portfolio at December 31, 2017 was less than historical amortized cost, producing net unrealized losses of $4.4 million that have been included in other comprehensive income (loss) as a component of shareholders’ equity (net of taxes). The Company made no change to the valuation techniques used to determine the fair values of securities during 2017 and 2016. The fair value of each security available for sale was obtained from independent pricing sources utilized by many financial institutions or from dealer quotes. The fair value of many state and municipal securities are not readily available through market sources, so fair value estimates are based on quoted market price or prices of similar instruments. Generally, the Company obtains one price for each security. However, actual values can only be determined in an arms-length transaction between a willing buyer and seller that can, and often do, vary from these reported values. Furthermore, significant changes in recorded values due to changes in actual and perceived economic conditions can occur rapidly, producing greater unrealized losses or gains in the available for sale portfolio.
During 2014, management identified $158.8 million of investment securities available for sale and transferred them to held for investment. The unrealized holding losses at the date of transfer totaled $3.0 million. For the securities that were transferred into the held for investment category from the available for sale category, the unrealized holding losses at the date of the transfer will continue to be reported in other comprehensive income, and will be amortized over the remaining life of the security as an adjustment of yield in a manner consistent with the amortization of a discount. At December 31, 2017 and 2016, the remaining unamortized amount of these losses was $1.2 million and $1.8 million, respectively. The amortization of unrealized holding losses reported in equity will offset the effect on interest income of the amortization of the discount. Management believes the securities transferred are a core banking asset that they now intend to hold until maturity, and if interest rates were to increase before maturity, the fair values would be impacted more significantly and therefore are not consistent with the characteristics of an available for sale investment.
Seacoast Bank also holds 11,330 shares of Visa Class B stock, which following resolution of Visa’s litigation will be converted to Visa Class A shares (the conversion rate presently is 1.6483 shares of Class A stock for each share of Class B stock) for a total of 18,675 shares of Visa Class A stock. Our ownership is related to prior ownership in Visa’s network, while Visa operated as a cooperative. This ownership is recorded on our financial records at a zero basis.
Other Than Temporary Impairment of Securities – Critical Accounting Policies and Estimates
Seacoast reviews investments quarterly for other than temporary impairment (“OTTI”). The following primary factors are considered for securities identified for OTTI testing: percent decline in fair value, rating downgrades, subordination, duration, amortized loan-to-value, and the ability of the issuers to pay all amounts due in accordance with the contractual terms. Prices obtained from pricing services are usually not adjusted. Based on our internal review procedures and the fair values provided by the pricing services, we believe that the fair values provided by the pricing services are consistent with the principles of ASC 820, Fair Value Measurement. However, on occasion pricing provided by the pricing services may not be consistent with other observed prices in the market for similar securities. Using observable market factors, including interest rate and yield curves, volatilities, prepayment speeds, loss severities and default rates, the Company may at times validate the observed prices using a discounted cash flow model and using the observed prices for similar securities to determine the fair value of its securities.
80
Changes in the fair values, as a result of deteriorating economic conditions and credit spread changes, should only be temporary. Further, management believes that the Company’s other sources of liquidity, as well as the cash flow from principal and interest payments from its securities portfolio, reduces the risk that losses would be realized as a result of a need to sell securities to obtain liquidity.
Income Taxes and Realization of Deferred Taxes – Critical Accounting Policies and Estimates
Seacoast is subject to income tax laws of the various jurisdictions in which it operates, including U.S. federal, state and local jurisdictions. These laws can be complex and subject to interpretation. Seacoast makes assumptions about how these laws should be applied when determining the provision for income tax expense, including assumptions around the timing of when certain items may be deemed taxable.
Seacoast’s provision for income taxes is comprised of current and deferred taxes. Deferred taxes represent the difference in measurement of assets and liabilities for financial reporting purposes compared to income tax return purposes. Deferred tax assets may also be recognized in connection with certain net operating losses (NOLs) and tax credits. Deferred tax assets are recognized if, based upon management’s judgment, it is more likely than not the benefits of the deferred tax assets will be realized.
At December 31, 2017, the Company had net deferred tax assets (“DTA”) of $25.4 million, after adjustment for recent legislation enacted by the U.S. Congress and signed into law by the President of the U.S. prior to year-end. Although realization is not assured, management believes that realization of the carrying value of the DTA is more likely than not, based upon expectations as to future taxable income and tax planning strategies, as defined by ASC 740 Income Taxes. In comparison, at December 31, 2016 the Company had a net DTA of $60.8 million.
Factors that support this conclusion:
| · | Income before tax (“IBT”) has steadily increased as a result of organic growth, and the 2015 Grand, 2016 Floridian and BMO, and 2017 GulfShore, NorthStar and PBCB acquisitions will further assist in achieving management’s forecast of future earnings which recovers the net operating loss carry-forwards well before expiration; |
| · | Credit costs and overall credit risk has been stable which decreases their impact on future taxable earnings; |
| · | Growth rates for loans are at levels adequately supported by loan officers and support staff; |
| · | We believe new loan production credit quality and concentrations are well managed; and |
| · | Current economic growth forecasts for Florida and the Company’s markets are supportive. |
81
Contingent Liabilities – Critical Accounting Policies and Estimates
The Company is subject to contingent liabilities, including judicial, regulatory and arbitration proceedings, and tax and other claims arising from the conduct of our business activities. These proceedings include actions brought against the Company and/or our subsidiaries with respect to transactions in which the Company and/or our subsidiaries acted as a lender, a financial advisor, a broker or acted in a related activity. Accruals are established for legal and other claims when it becomes probable that the Company will incur an expense and the amount can be reasonably estimated. Company management, together with attorneys, consultants and other professionals, assesses the probability and estimated amounts involved in a contingency. Throughout the life of a contingency, the Company or our advisors may learn of additional information that can affect our assessments about probability or about the estimates of amounts involved. Changes in these assessments can lead to changes in recorded reserves. In addition, the actual costs of resolving these claims may be substantially higher or lower than the amounts reserved for the claims. At December 31, 2017 and 2016, the Company had no significant accruals for contingent liabilities and had no known pending matters that could potentially be significant.
Interest Rate Sensitivity
Fluctuations in interest rates may result in changes in the fair value of the Company’s financial instruments, cash flows and net interest income. This risk is managed using simulation modeling to calculate the most likely interest rate risk utilizing estimated loan and deposit growth. The objective is to optimize the Company’s financial position, liquidity, and net interest income while limiting their volatility.
Senior management regularly reviews the overall interest rate risk position and evaluates strategies to manage the risk. The Company’s fourth quarter 2017 Asset and Liability Management Committee (“ALCO”) model simulation indicates net interest income would increase 7.5% if interest rates increased 200 basis points in a parallel fashion over the next 12 months and 3.9% if interest rates increased 100 basis points in a parallel fashion, and improve 11.6% and 6.1%, respectively, on a 13 to 24 month basis. This compares with the Company’s fourth quarter 2016 model simulation, which indicated net interest income would increase 1.7% if interest rates increased 200 basis points over the next 12 months in a parallel fashion and 0.9% if interest rates increased 100 basis points in a parallel fashion.
The Company had a positive gap position based on contractual and prepayment assumptions for the next 12 months, with a positive cumulative interest rate sensitivity gap as a percentage of total earning assets of 21.4% at December 31, 2017. This result includes assumptions for core deposit re-pricing validated for the Company by an independent third party consulting group.
The computations of interest rate risk do not necessarily include certain actions management may undertake to manage this risk in response to changes in interest rates. Derivative financial instruments, such as interest rate swaps, options, caps, floors, futures and forward contracts may be utilized as components of the Company’s risk management profile.
Market Risk
Market risk refers to potential losses arising from changes in interest rates, and other relevant market rates or prices.
82
Interest rate risk, defined as the exposure of net interest income and Economic Value of Equity, or “EVE,” to adverse movements in interest rates, is the Company’s primary market risk, and mainly arises from the structure of the balance sheet (non-trading activities). The Company is also exposed to market risk in its investing activities. The Company’s Asset/Liability Committee, or “ALCO,” meets regularly and is responsible for reviewing the interest rate sensitivity position of the Company and establishing policies to monitor and limit exposure to interest rate risk. The policies established by the ALCO are reviewed and approved by the Company’s Board of Directors. The primary goal of interest rate risk management is to control exposure to interest rate risk, within policy limits approved by the Board. These limits reflect the Company’s tolerance for interest rate risk over short-term and long-term horizons.
The Company also performs valuation analyses, which are used for evaluating levels of risk present in the balance sheet that might not be taken into account in the net interest income simulation analyses. Whereas net interest income simulation highlights exposures over a relatively short time horizon, valuation analysis incorporates all cash flows over the estimated remaining life of all balance sheet positions. The valuation of the balance sheet, at a point in time, is defined as the discounted present value of asset cash flows minus the discounted value of liability cash flows, the net result of which is the EVE. The sensitivity of EVE to changes in the level of interest rates is a measure of the longer-term re-pricing risks and options risks embedded in the balance sheet. In contrast to the net interest income simulation, which assumes interest rates will change over a period of time, EVE uses instantaneous changes in rates.
EVE values only the current balance sheet, and does not incorporate the growth assumptions that are used in the net interest income simulation model. As with the net interest income simulation model, assumptions about the timing and variability of balance sheet cash flows are critical in the EVE analysis. Particularly important are the assumptions driving prepayments and the expected changes in balances and pricing of the indeterminate life deposit portfolios. Core deposits are a more significant funding source for the Company, making the lives attached to core deposits more important to the accuracy of our modeling of EVE. The Company periodically reassesses its assumptions regarding the indeterminate lives of core deposits utilizing an independent third party resource to assist. With lower interest rates over a prolonged period, the average lives of core deposits have trended higher and favorably impacted our model estimates of EVE for higher rates. Based on our fourth quarter 2017 modeling, an instantaneous 100 basis point parallel increase in rates is estimated to increase the EVE 12.2% versus the EVE in a stable rate environment, while a 200 basis point parallel increase in rates is estimated to increase the EVE 21.8%.
While an instantaneous and severe shift in interest rates is used in this analysis to provide an estimate of exposure under an extremely adverse scenario, a gradual shift in interest rates would have a much more modest impact. Since EVE measures the discounted present value of cash flows over the estimated lives of instruments, the change in EVE does not directly correlate to the degree that earnings would be impacted over a shorter time horizon, i.e., the next fiscal year. Further, EVE does not take into account factors such as future balance sheet growth, changes in product mix, change in yield curve relationships, and changing product spreads that could mitigate the adverse impact of changes in interest rates.
83
Effects of Inflation and Changing Prices
The condensed consolidated financial statements and related financial data presented herein have been prepared in accordance with U.S. GAAP, which require the measurement of financial position and operating results in terms of historical dollars, without considering changes in the relative purchasing power of money, over time, due to inflation.
Unlike most industrial companies, virtually all of the assets and liabilities of a financial institution are monetary in nature. As a result, interest rates have a more significant impact on a financial institution’s performance than the general level of inflation. However, inflation affects financial institutions by increasing their cost of goods and services purchased, as well as the cost of salaries and benefits, occupancy expense, and similar items. Inflation and related increases in interest rates generally decrease the market value of investments and loans held and may adversely affect liquidity, earnings, and shareholders’ equity. Mortgage originations and re-financings tend to slow as interest rates increase, and higher interest rates likely will reduce the Company’s earnings from such activities and the income from the sale of residential mortgage loans in the secondary market.
Internal Controls
The Company's management, with the participation of its Chief Executive Officer and Chief Financial Officer, has evaluated the effectiveness of the Company's disclosure controls and procedures (as defined in rule 13a-15(e) and Rule 15d-15(e) under the Exchange Act) as of December 31, 2017 and concluded that those disclosure controls and procedures are effective. There have been no changes to the Company’s internal control over financial reporting that occurred since the beginning of 2017 that have materially affected, or are reasonably likely to materially affect, the Company’s internal control over financial reporting.
84
Table 1 - Condensed Income Statement*
| For the Year Ended December 31, | ||||||||||||
| 2017 | 2016 | 2015 | ||||||||||
| (Tax equivalent basis) | ||||||||||||
| Net interest income | 3.40 | % | 3.34 | % | 3.33 | % | ||||||
| Provision for loan losses | 0.11 | 0.06 | 0.08 | |||||||||
| Noninterest income | ||||||||||||
| Securities gains, net | 0.00 | 0.01 | 0.00 | |||||||||
| Gain on sale of VISA stock | 0.29 | 0.00 | 0.00 | |||||||||
| Bargain purchase gains, net | 0.00 | 0.00 | 0.01 | |||||||||
| Other | 0.83 | 0.89 | 0.97 | |||||||||
| Noninterest expense | 2.88 | 3.11 | 3.14 | |||||||||
| Income before income taxes | 1.53 | 1.07 | 1.09 | |||||||||
| Provision for income taxes including tax equivalent adjustment | 0.71 | 0.38 | 0.42 | |||||||||
| Net income | 0.82 | % | 0.69 | % | 0.67 | % | ||||||
* As a Percent of Average Assets
85
Table 2 – Three Year Summary
Average Balances, Interest Income and Expenses, Yields and Rates (1)
| For the Year Ended December 31, | ||||||||||||||||||||||||||||||||||||
| 2017 | 2016 | 2015 | ||||||||||||||||||||||||||||||||||
| Average | Yield/ | Average | Yield/ | Average | Yield/ | |||||||||||||||||||||||||||||||
| Balance | Interest | Rate | Balance | Interest | Rate | Balance | Interest | Rate | ||||||||||||||||||||||||||||
| (Dollars in thousands) | ||||||||||||||||||||||||||||||||||||
| EARNING ASSETS | ||||||||||||||||||||||||||||||||||||
| Securities | ||||||||||||||||||||||||||||||||||||
| Taxable | $ | 1,316,972 | $ | 34,442 | 2.62 | % | $ | 1,174,627 | $ | 26,133 | 2.22 | % | $ | 946,986 | $ | 20,341 | 2.15 | % | ||||||||||||||||||
| Nontaxable | 28,369 | 1,401 | 4.94 | 25,841 | 1,592 | 6.16 | 15,208 | 895 | 5.89 | |||||||||||||||||||||||||||
| 1,345,341 | 35,843 | 2.66 | 1,200,468 | 27,725 | 2.31 | 962,194 | 21,236 | 2.21 | ||||||||||||||||||||||||||||
| Federal funds sold and other investments | 71,352 | 2,416 | 3.39 | 75,442 | 1,669 | 2.21 | 76,851 | 1,022 | 1.33 | |||||||||||||||||||||||||||
| Loans, net (2) | 3,323,403 | 154,043 | 4.64 | 2,584,389 | 119,587 | 4.63 | 1,984,545 | 94,640 | 4.77 | |||||||||||||||||||||||||||
| TOTAL EARNING ASSETS | 4,740,096 | 192,302 | 4.06 | 3,860,299 | 148,981 | 3.86 | 3,023,590 | 116,898 | 3.87 | |||||||||||||||||||||||||||
| Allowance for loan losses | (25,485 | ) | (21,131 | ) | (18,725 | ) | ||||||||||||||||||||||||||||||
| Cash and due from banks | 106,710 | 88,919 | 73,001 | |||||||||||||||||||||||||||||||||
| Bank premises and equipment, net | 59,842 | 60,470 | 51,396 | |||||||||||||||||||||||||||||||||
| Bank owned life insurance | 97,939 | 45,009 | 39,343 | |||||||||||||||||||||||||||||||||
| Goodwill | 99,660 | 53,792 | 25,320 | |||||||||||||||||||||||||||||||||
| Other intangible assets, net | 15,851 | 12,819 | 7,956 | |||||||||||||||||||||||||||||||||
| Other assets | 112,004 | 101,645 | 102,516 | |||||||||||||||||||||||||||||||||
| $ | 5,206,617 | $ | 4,201,822 | $ | 3,304,397 | |||||||||||||||||||||||||||||||
| INTEREST BEARING LIABILITIES | ||||||||||||||||||||||||||||||||||||
| Interest bearing demand | $ | 922,353 | 1,065 | 0.12 | % | $ | 764,917 | 616 | 0.08 | % | $ | 632,304 | 472 | 0.07 | % | |||||||||||||||||||||
| Savings deposits | 385,515 | 241 | 0.06 | 325,371 | 161 | 0.05 | 281,470 | 158 | 0.06 | |||||||||||||||||||||||||||
| Money market | 868,427 | 2,348 | 0.27 | 791,998 | 1,816 | 0.23 | 607,768 | 1,455 | 0.24 | |||||||||||||||||||||||||||
| Time deposits | 523,646 | 4,678 | 0.89 | 351,646 | 2,074 | 0.59 | 307,329 | 1,228 | 0.40 | |||||||||||||||||||||||||||
| Federal funds purchased and other short term borrowings | 171,686 | 782 | 0.46 | 187,560 | 484 | 0.26 | 168,188 | 340 | 0.20 | |||||||||||||||||||||||||||
| Federal Home Loan Bank borrowings | 377,396 | 3,743 | 0.99 | 198,268 | 1,256 | 0.63 | 64,726 | 1,643 | 2.54 | |||||||||||||||||||||||||||
| Other borrowings | 70,377 | 2,443 | 3.47 | 70,097 | 2,060 | 2.94 | 67,056 | 1,634 | 2.44 | |||||||||||||||||||||||||||
| TOTAL INTEREST BEARING LIABILITIES | 3,319,400 | 15,300 | 0.46 | 2,689,857 | 8,467 | 0.31 | 2,128,841 | 6,930 | 0.33 | |||||||||||||||||||||||||||
| Noninterest demand | 1,279,825 | 1,066,463 | 819,801 | |||||||||||||||||||||||||||||||||
| Other liabilities | 36,993 | 31,628 | 18,388 | |||||||||||||||||||||||||||||||||
| 4,636,218 | 3,787,948 | 2,967,030 | ||||||||||||||||||||||||||||||||||
| Shareholders' equity | 570,399 | 413,874 | 337,367 | |||||||||||||||||||||||||||||||||
| $ | 5,206,617 | $ | 4,201,822 | $ | 3,304,397 | |||||||||||||||||||||||||||||||
| Interest expense as % of earning assets | 0.32 | % | 0.22 | % | 0.23 | % | ||||||||||||||||||||||||||||||
| Net interest income/yield on earning assets | $ | 177,002 | 3.73 | % | $ | 140,514 | 3.63 | % | $ | 109,968 | 3.64 | % | ||||||||||||||||||||||||
(1) The tax equivalent adjustment is based on a 35% tax rate.
(2) Nonperforming loans are included in average loan balances. Fees on loans are included in interest on loans.
86
Table 3 - Rate/Volume Analysis (on a Tax Equivalent Basis)(1)
| 2017 vs 2016 | 2016 vs 2015 | |||||||||||||||||||||||
| Due to Change in: | Due to Change in: | |||||||||||||||||||||||
| Volume | Rate | Total | Volume | Rate | Total | |||||||||||||||||||
| (In thousands) | ||||||||||||||||||||||||
| Amount of increase (decrease) | ||||||||||||||||||||||||
| EARNING ASSETS | ||||||||||||||||||||||||
| Securities | ||||||||||||||||||||||||
| Taxable | $ | 3,445 | $ | 4,864 | $ | 8,309 | $ | 4,977 | $ | 815 | $ | 5,792 | ||||||||||||
| Nontaxable | 140 | (331 | ) | (191 | ) | 640 | 57 | 697 | ||||||||||||||||
| 3,585 | 4,533 | 8,118 | 5,617 | 872 | 6,489 | |||||||||||||||||||
| Federal funds sold and other investments | (115 | ) | 862 | 747 | (26 | ) | 673 | 647 | ||||||||||||||||
| Loans, net | 34,225 | 231 | 34,456 | 28,181 | (3,234 | ) | 24,947 | |||||||||||||||||
| TOTAL EARNING ASSETS | 37,695 | 5,626 | 43,321 | 33,772 | (1,689 | ) | 32,083 | |||||||||||||||||
| INTEREST BEARING LIABILITIES | ||||||||||||||||||||||||
| Interest bearing demand | 154 | 295 | 449 | 103 | 41 | 144 | ||||||||||||||||||
| Savings deposits | 34 | 46 | 80 | 23 | (20 | ) | 3 | |||||||||||||||||
| Money market accounts | 192 | 340 | 532 | 433 | (72 | ) | 361 | |||||||||||||||||
| Time deposits | 1,276 | 1,328 | 2,604 | 219 | 627 | 846 | ||||||||||||||||||
| 1,656 | 2,009 | 3,665 | 778 | 576 | 1,354 | |||||||||||||||||||
| Federal funds purchased and other short term borrowings | (57 | ) | 355 | 298 | 45 | 99 | 144 | |||||||||||||||||
| Federal Home Loan Bank borrowings | 1,456 | 1,031 | 2,487 | 2,118 | (2,505 | ) | (387 | ) | ||||||||||||||||
| Other borrowings | 9 | 374 | 383 | 82 | 344 | 426 | ||||||||||||||||||
| TOTAL INTEREST BEARING LIABILITIES | 3,064 | 3,769 | 6,833 | 3,023 | (1,486 | ) | 1,537 | |||||||||||||||||
| NET INTEREST INCOME | $ | 34,631 | $ | 1,857 | $ | 36,488 | $ | 30,749 | $ | (203 | ) | $ | 30,546 | |||||||||||
(1) Changes attributable to rate/volume (mix) are allocated to rate and volume on an equal basis.
87
Table 4 – Noninterest Income
| For the Year Ended December 31, | % Change | |||||||||||||||||||
| 2017 | 2016 | 2015 | 17/16 | 16/15 | ||||||||||||||||
| (In thousands) | ||||||||||||||||||||
| Service charges on deposit accounts | $ | 10,049 | $ | 9,669 | $ | 8,563 | 3.9 | % | 12.9 | % | ||||||||||
| Trust fees | 3,705 | 3,433 | 3,132 | 7.9 | 9.6 | |||||||||||||||
| Mortgage banking fees | 6,449 | 5,864 | 4,252 | 10.0 | 37.9 | |||||||||||||||
| Brokerage commissions and fees | 1,352 | 2,044 | 2,132 | (33.9 | ) | (4.1 | ) | |||||||||||||
| Marine finance fees | 910 | 673 | 1,152 | 35.2 | (41.6 | ) | ||||||||||||||
| Interchange income | 10,583 | 9,227 | 7,684 | 14.7 | 20.1 | |||||||||||||||
| Other deposit based EFT fees | 465 | 477 | 397 | (2.5 | ) | 20.2 | ||||||||||||||
| BOLI income | 3,426 | 2,213 | 1,426 | 54.8 | 55.2 | |||||||||||||||
| Gain on participated loan | 0 | 0 | 725 | n/m | (100.0 | ) | ||||||||||||||
| Other | 6,291 | 3,827 | 2,555 | 64.4 | 49.8 | |||||||||||||||
| 43,230 | 37,427 | 32,018 | 15.5 | 16.9 | ||||||||||||||||
| Securities gains, net | 86 | 368 | 161 | (76.6 | ) | 128.6 | ||||||||||||||
| Gain on sale of VISA stock | 15,153 | 0 | 0 | n/m | 0.0 | |||||||||||||||
| Bargain purchase gain, net | 0 | 0 | 416 | n/m | (100.0 | ) | ||||||||||||||
| TOTAL | $ | 58,469 | $ | 37,795 | $ | 32,595 | 54.7 | 16.0 | ||||||||||||
n/m = not meaningful
88
Table 5 - Noninterest Expense
| For the Year Ended December 31, | % Change | |||||||||||||||||||
| 2017 | 2016 | 2015 | 17/16 | 16/15 | ||||||||||||||||
| (In thousands) | ||||||||||||||||||||
| Salaries and wages | $ | 65,692 | $ | 54,096 | $ | 41,075 | 21.4 | % | 31.7 | % | ||||||||||
| Employee benefits | 11,732 | 9,903 | 9,564 | 18.5 | 3.5 | |||||||||||||||
| Outsourced data processing costs | 14,116 | 13,516 | 10,150 | 4.4 | 33.2 | |||||||||||||||
| Telephone / data lines | 2,291 | 2,108 | 1,797 | 8.7 | 17.3 | |||||||||||||||
| Occupancy | 13,290 | 13,122 | 8,744 | 1.3 | 50.1 | |||||||||||||||
| Furniture and equipment | 6,067 | 4,720 | 3,434 | 28.5 | 37.4 | |||||||||||||||
| Marketing | 4,784 | 3,633 | 4,428 | 31.7 | (18.0 | ) | ||||||||||||||
| Legal and professional fees | 11,022 | 9,596 | 8,022 | 14.9 | 19.6 | |||||||||||||||
| FDIC assessments | 2,326 | 2,365 | 2,212 | (1.6 | ) | 6.9 | ||||||||||||||
| Amortization of intangibles | 3,361 | 2,486 | 1,424 | 35.2 | 74.6 | |||||||||||||||
| Asset dispositions expense | 411 | 553 | 472 | (25.7 | ) | 17.2 | ||||||||||||||
| Net (gain) loss on other real estate owned and repossessed assets | (711 | ) | (509 | ) | 239 | 39.7 | (313.0 | ) | ||||||||||||
| Early redemption cost for Federal Home Loan Bank advances | 0 | 1,777 | 0 | (100.0 | ) | n/m | ||||||||||||||
| Other | 15,535 | 13,515 | 12,209 | 14.9 | 10.7 | |||||||||||||||
| TOTAL | $ | 149,916 | $ | 130,881 | $ | 103,770 | 14.5 | 26.1 | ||||||||||||
* n/m = not meaningful
89
Table 6 - Capital Resources
| December 31, | ||||||||||||
| 2017 | 2016 | 2015 | ||||||||||
| (In thousands) | ||||||||||||
| TIER 1 CAPITAL | ||||||||||||
| Common stock | $ | 4,693 | $ | 3,802 | $ | 3,435 | ||||||
| Additional paid in capital | 661,632 | 454,001 | 399,162 | |||||||||
| Retained earnings (Accumulated deficit) | 29,914 | (13,657 | ) | (42,858 | ) | |||||||
| Treasury stock | (2,359 | ) | (1,236 | ) | (73 | ) | ||||||
| Goodwill | (147,578 | ) | (64,649 | ) | (25,211 | ) | ||||||
| Intangibles | (15,150 | ) | (6,371 | ) | (2,057 | ) | ||||||
| Other | (7,320 | ) | (20,121 | ) | (15,394 | ) | ||||||
| COMMON EQUITY TIER 1 CAPITAL | 523,832 | 351,769 | 317,004 | |||||||||
| Qualifying trust preferred securities | 70,521 | 70,241 | 69,961 | |||||||||
| Other | (1,791 | ) | (13,414 | ) | (23,092 | ) | ||||||
| TOTAL TIER 1 CAPITAL | 592,562 | 408,596 | 363,873 | |||||||||
| TIER 2 CAPITAL | ||||||||||||
| Allowance for loan losses, as limited | 27,184 | 23,462 | 19,166 | |||||||||
| TOTAL TIER 2 CAPITAL | 27,184 | 23,462 | 19,166 | |||||||||
| TOTAL RISK-BASED CAPITAL | $ | 619,746 | $ | 432,058 | $ | 383,039 | ||||||
| Risk weighted assets | $ | 4,352,390 | $ | 3,259,871 | $ | 2,392,668 | ||||||
| Common equity Tier 1 ratio (CET1) | 12.04 | % | 10.79 | % | 13.25 | % | ||||||
| Regulatory minimum (2) | 4.50 | 4.50 | 4.50 | |||||||||
| Tier 1 capital ratio | 13.61 | 12.53 | 15.21 | |||||||||
| Regulatory minimum (2) | 6.00 | 6.00 | 6.00 | |||||||||
| Total capital ratio | 14.24 | 13.25 | 16.01 | |||||||||
| Regulatory minimum (2) | 8.00 | 8.00 | 8.00 | |||||||||
| Tier 1 capital to adjusted total assets | 10.68 | 9.15 | 10.70 | |||||||||
| Regulatory minimum | 4.00 | 4.00 | 4.00 | |||||||||
| Shareholders' equity to assets | 11.87 | 9.30 | 10.00 | |||||||||
| Average shareholders' equity to average total assets | 10.96 | 9.85 | 10.21 | |||||||||
| Tangible shareholders' equity to tangible assets | 9.27 | 7.74 | 9.13 | |||||||||
| (2) | Excludes capital conservation buffer of 1.250% the Company is subject to, which if not exceeded may constrain dividends, equity repurchases, and compensation. |
n/a = not applicable
90
Table 7 - Loans Outstanding
| December 31, | ||||||||||||||||||||
| 2017 | 2016 | 2015 | 2014 | 2013 | ||||||||||||||||
| (In thousands) | ||||||||||||||||||||
| Construction and land development | ||||||||||||||||||||
| Residential | $ | 97,725 | $ | 29,693 | $ | 31,650 | $ | 16,155 | $ | 10,566 | ||||||||||
| Commercial | 91,043 | 57,856 | 31,977 | 37,194 | 22,733 | |||||||||||||||
| 188,768 | 87,549 | 63,627 | 53,349 | 33,299 | ||||||||||||||||
| Individuals | 154,357 | 72,567 | 45,160 | 33,687 | 34,151 | |||||||||||||||
| 343,125 | 160,116 | 108,787 | 87,036 | 67,450 | ||||||||||||||||
| Commercial real estate (1) | 1,639,992 | 1,357,592 | 1,009,378 | 837,147 | 520,382 | |||||||||||||||
| Residential real estate | ||||||||||||||||||||
| Adjustable | 487,231 | 418,276 | 429,826 | 441,238 | 391,885 | |||||||||||||||
| Fixed rate | 246,884 | 210,365 | 110,391 | 93,865 | 91,108 | |||||||||||||||
| Home equity mortgages | 71,367 | 44,484 | 69,339 | 71,838 | 62,043 | |||||||||||||||
| Home equity lines | 233,328 | 163,662 | 114,229 | 79,956 | 47,710 | |||||||||||||||
| 1,038,810 | 836,787 | 723,785 | 686,897 | 592,746 | ||||||||||||||||
| Commercial and financial | 606,014 | 370,589 | 228,517 | 157,396 | 78,636 | |||||||||||||||
| Installment loans to individuals | ||||||||||||||||||||
| Automobiles and trucks | 19,006 | 19,234 | 14,965 | 7,817 | 6,607 | |||||||||||||||
| Marine loans | 78,855 | 78,993 | 46,534 | 26,236 | 20,208 | |||||||||||||||
| Other | 90,851 | 55,718 | 23,857 | 18,844 | 17,898 | |||||||||||||||
| 188,712 | 153,945 | 85,356 | 52,897 | 44,713 | ||||||||||||||||
| Other loans | 724 | 507 | 507 | 512 | 280 | |||||||||||||||
| TOTAL | $ | 3,817,377 | $ | 2,879,536 | $ | 2,156,330 | $ | 1,821,885 | $ | 1,304,207 | ||||||||||
| (1) | Commercial real estate includes owner-occupied balances of $791.4 million, $623.8 million, $453.3 million, $362.3 million, and $194.0 million, respectively, for each of the years, beginning with 2017. |
91
Table 8 - Loan Maturity Distribution
| December 31, 2017 | ||||||||||||
| Commercial
and Financial | Construction
and Land Development | Total | ||||||||||
| (In thousands) | ||||||||||||
| In one year or less | $ | 261,032 | $ | 156,771 | $ | 417,803 | ||||||
| After one year but within five years: | ||||||||||||
| Interest rates are floating or adjustable | 61,707 | 44,055 | 105,762 | |||||||||
| Interest rates are fixed | 198,569 | 22,350 | 220,919 | |||||||||
| In five years or more: | ||||||||||||
| Interest rates are floating or adjustable | 9,386 | 45,672 | 55,058 | |||||||||
| Interest rates are fixed | 75,320 | 74,277 | 149,597 | |||||||||
| TOTAL | $ | 606,014 | $ | 343,125 | $ | 949,139 | ||||||
92
Table 9 - Maturity of Certificates of Deposit of $100,000 or More
| Maturity of Certificates of Deposit of $100,000 through $250,000 | ||||||||||||||||
| December 31, | ||||||||||||||||
| % of | % of | |||||||||||||||
| 2017 | Total | 2016 | Total | |||||||||||||
| (In thousands) | ||||||||||||||||
| Maturity Group: | ||||||||||||||||
| Under 3 Months | $ | 22,266 | 10.5 | % | $ | 20,304 | 16.4 | % | ||||||||
| 3 to 6 Months | 36,380 | 17.1 | 15,919 | 12.9 | ||||||||||||
| 6 to 12 Months | 89,486 | 42.2 | 31,608 | 25.6 | ||||||||||||
| Over 12 Months | 63,954 | 30.2 | 55,801 | 45.1 | ||||||||||||
| TOTAL | $ | 212,086 | 100.0 | % | $ | 123,632 | 100.0 | % | ||||||||
| Maturity of Certificates of Deposit of more than $250,000 | ||||||||||||||||
| December 31, | ||||||||||||||||
| % of | % of | |||||||||||||||
| 2017 | Total | 2016 | Total | |||||||||||||
| (In thousands) | ||||||||||||||||
| Maturity Group: | ||||||||||||||||
| Under 3 Months | $ | 17,774 | 12.3 | % | $ | 15,832 | 23.3 | % | ||||||||
| 3 to 6 Months | 20,100 | 13.9 | 14,325 | 21.1 | ||||||||||||
| 6 to 12 Months | 59,344 | 41.2 | 12,294 | 18.1 | ||||||||||||
| Over 12 Months | 47,054 | 32.6 | 25,450 | 37.5 | ||||||||||||
| TOTAL | $ | 144,272 | 100.0 | % | $ | 67,901 | 100.0 | % | ||||||||
93
Table 10 - Summary of Allowance for Loan Loss Experience
| For the Year Ended December 31, | ||||||||||||||||||||
| 2017 | 2016 | 2015 | 2014 | 2013 | ||||||||||||||||
| (In thousands, except percentages) | ||||||||||||||||||||
| Beginning balance | $ | 23,400 | $ | 19,128 | $ | 17,071 | $ | 20,068 | $ | 22,104 | ||||||||||
| Provision (recapture) for loan losses | 5,648 | 2,411 | 2,644 | (3,486 | ) | 3,188 | ||||||||||||||
| Charge offs: | ||||||||||||||||||||
| Construction and land development | 0 | 0 | 1,271 | 640 | 604 | |||||||||||||||
| Commercial real estate | 407 | 256 | 263 | 285 | 2,186 | |||||||||||||||
| Residential real estate | 569 | 205 | 779 | 1,126 | 3,153 | |||||||||||||||
| Commercial and financial | 1,869 | 439 | 726 | 398 | 60 | |||||||||||||||
| Consumer | 1,257 | 244 | 341 | 193 | 253 | |||||||||||||||
| TOTAL CHARGE OFFS | 4,102 | 1,144 | 3,380 | 2,642 | 6,256 | |||||||||||||||
| Recoveries: | ||||||||||||||||||||
| Construction and land development | 896 | 226 | 404 | 415 | 212 | |||||||||||||||
| Commercial real estate | 747 | 306 | 700 | 1,683 | 547 | |||||||||||||||
| Residential real estate | 336 | 786 | 1,260 | 902 | 449 | |||||||||||||||
| Commercial and financial | 226 | 1,809 | 531 | 170 | 326 | |||||||||||||||
| Consumer | 290 | 109 | 117 | 74 | 26 | |||||||||||||||
| TOTAL RECOVERIES | 2,495 | 3,236 | 3,012 | 3,244 | 1,560 | |||||||||||||||
| Net loan charge offs (recoveries) | 1,607 | (2,092 | ) | 368 | (602 | ) | 4,696 | |||||||||||||
| TDR valuation adjustments: | ||||||||||||||||||||
| Construction and land development | 2 | 8 | (43 | ) | 12 | (122 | ) | |||||||||||||
| Commercial real estate | 64 | 132 | 69 | (25 | ) | 580 | ||||||||||||||
| Residential real estate | 244 | 86 | 151 | 118 | 63 | |||||||||||||||
| Commercial and financial | 0 | 0 | 6 | 0 | 0 | |||||||||||||||
| Consumer | 9 | 5 | 36 | 8 | 7 | |||||||||||||||
| Total TDR VALUATION ADJUSTMENTS | 319 | 231 | 219 | 113 | 528 | |||||||||||||||
| ENDING BALANCE | $ | 27,122 | $ | 23,400 | $ | 19,128 | $ | 17,071 | $ | 20,068 | ||||||||||
| Loans outstanding at end of year* | $ | 3,814,377 | $ | 2,879,536 | $ | 2,156,330 | $ | 1,821,885 | $ | 1,304,207 | ||||||||||
| Ratio of allowance for loan losses to loans outstanding at end of year | 0.71 | % | 0.81 | % | 0.89 | % | 0.94 | % | 1.54 | % | ||||||||||
| Ratio of allowance for loan losses to loans outstanding (excluding purchased loans) at end of period (1) | 0.90 | % | 0.96 | % | 1.03 | % | 1.14 | % | 1.54 | % | ||||||||||
| Daily average loans outstanding* | $ | 3,323,403 | $ | 2,584,389 | $ | 1,984,545 | $ | 1,452,751 | $ | 1,272,447 | ||||||||||
| Ratio of net charge offs (recoveries) to average loans outstanding | 0.05 | % | (0.08 | )% | 0.02 | % | (0.04 | )% | 0.37 | % | ||||||||||
| (1) | A non-GAAP measure. |
* Net of unearned income.
94
Table 11 - Allowance for Loan Losses
| December 31, | ||||||||||||||||||||
| 2017 | 2016 | 2015 | 2014 | 2013 | ||||||||||||||||
| (In thousands) | ||||||||||||||||||||
| ALLOCATION BY LOAN TYPE | ||||||||||||||||||||
| Construction and land development | $ | 1,642 | $ | 1,219 | $ | 1,151 | $ | 765 | $ | 808 | ||||||||||
| Commercial real estate loans | 9,285 | 9,273 | 6,756 | 4,531 | 6,160 | |||||||||||||||
| Residential real estate loans | 7,131 | 7,483 | 8,057 | 9,802 | 11,659 | |||||||||||||||
| Commercial and financial loans | 7,297 | 3,636 | 2,042 | 1,179 | 710 | |||||||||||||||
| Consumer loans | 1,767 | 1,789 | 1,122 | 794 | 731 | |||||||||||||||
| TOTAL | $ | 27,122 | $ | 23,400 | $ | 19,128 | $ | 17,071 | $ | 20,068 | ||||||||||
| YEAR END LOAN TYPES AS A PERCENT OF TOTAL LOANS | ||||||||||||||||||||
| Construction and land development | 9.0 | % | 5.6 | % | 5.0 | % | 4.8 | % | 5.2 | % | ||||||||||
| Commercial real estate loans | 43.0 | 47.1 | 46.8 | 46.0 | 39.9 | |||||||||||||||
| Residential real estate loans | 27.2 | 29.1 | 33.6 | 37.7 | 45.5 | |||||||||||||||
| Commercial and financial loans | 15.9 | 12.9 | 10.6 | 8.6 | 6.0 | |||||||||||||||
| Consumer loans | 4.9 | 5.3 | 4.0 | 2.9 | 3.4 | |||||||||||||||
| TOTAL | 100.0 | % | 100.0 | % | 100.0 | % | 100.0 | % | 100.0 | % | ||||||||||
95
Table 12 - Nonperforming Assets
| December 31, | ||||||||||||||||||||
| 2017 | 2016 | 2015 | 2014 | 2013 | ||||||||||||||||
| (In thousands) | ||||||||||||||||||||
| Nonaccrual loans (1) (2) | ||||||||||||||||||||
| Construction and land development | $ | 238 | $ | 470 | $ | 309 | $ | 1,963 | $ | 1,302 | ||||||||||
| Commercial real estate loans | 2,833 | 7,341 | 6,410 | 4,189 | 5,111 | |||||||||||||||
| Residential real estate loans | 13,856 | 9,844 | 10,290 | 14,797 | 20,705 | |||||||||||||||
| Commercial and financial loans | 2,499 | 246 | 130 | 0 | 13 | |||||||||||||||
| Consumer loans | 98 | 170 | 247 | 191 | 541 | |||||||||||||||
| Total | 19,524 | 18,071 | 17,386 | 21,140 | 27,672 | |||||||||||||||
| Other real estate owned | ||||||||||||||||||||
| Construction and land development | 1,268 | 1,203 | 2,617 | 223 | 421 | |||||||||||||||
| Commercial real estate loans | 2,550 | 3,041 | 3,959 | 5,771 | 5,138 | |||||||||||||||
| Residential real estate loans | 60 | 0 | 463 | 1,468 | 1,301 | |||||||||||||||
| Bank branches closed | 3,762 | 5,705 | 0 | 0 | 0 | |||||||||||||||
| Total | 7,640 | 9,949 | 7,039 | 7,462 | 6,860 | |||||||||||||||
| TOTAL NONPERFORMING ASSETS | $ | 27,164 | $ | 28,020 | $ | 24,425 | $ | 28,602 | $ | 34,532 | ||||||||||
| Amount of loans outstanding at end of year (2) | $ | 3,817,377 | $ | 2,879,536 | $ | 2,156,330 | $ | 1,821,885 | $ | 1,304,207 | ||||||||||
| Ratio of total nonperforming assets to loans outstanding and other real estate owned at end of period | 0.71 | % | 0.97 | % | 1.13 | % | 1.56 | % | 2.63 | % | ||||||||||
| Accruing loans past due 90 days or more | $ | 0 | $ | 0 | $ | 0 | $ | 311 | $ | 160 | ||||||||||
| Loans restructured and in compliance with modified terms (3) | 15,559 | 17,711 | 19,970 | 24,997 | 25,137 | |||||||||||||||
| (1) | Interest income that could have been recorded during 2017, 2016, and 2015 related to nonaccrual loans was $319,000, $728,000, and $614,000, respectively, none of which was included in interest income or net income. All nonaccrual loans are secured. |
| (2) | Net of unearned income. |
| (3) | Interest income that would have been recorded based on original contractual terms was $682,000, $1,001,000, and $1,211,000, respectively, for 2017, 2016 and 2015. The amount included in interest income under the modified terms for 2017, 2016, and 2015 was $723,000, $792,000, and $836,000, respectively. |
96
Table 13 - Securities Available For Sale
| December 31, | ||||||||||||||||
| Gross | Gross | Gross | ||||||||||||||
| Amortized | Fair | Unrealized | Unrealized | |||||||||||||
| Cost | Value | Gains | Losses | |||||||||||||
| (In thousands) | ||||||||||||||||
| U.S. Treasury securities and obligations of U.S. Government Sponsored Entities | ||||||||||||||||
| 2017 | $ | 9,475 | $ | 9,744 | $ | 274 | $ | (5 | ) | |||||||
| 2016 | 12,073 | 12,328 | 255 | 0 | ||||||||||||
| Mortgage-backed securities of U.S. Government Sponsored Entities | ||||||||||||||||
| 2017 | 318,771 | 316,356 | 891 | (3,306 | ) | |||||||||||
| 2016 | 287,726 | 283,488 | 585 | (4,823 | ) | |||||||||||
| Collateralized mortgage obligations of U.S. Government Sponsored Entities | ||||||||||||||||
| 2017 | 235,466 | 231,044 | 272 | (4,694 | ) | |||||||||||
| 2016 | 238,805 | 234,054 | 314 | (5,065 | ) | |||||||||||
| Commercial mortgage-backed securities of U.S. Government Sponsored Entities | ||||||||||||||||
| 2017 | 16,210 | 16,341 | 165 | (34 | ) | |||||||||||
| 2016 | 22,351 | 22,545 | 222 | (28 | ) | |||||||||||
| Private mortgage-backed securities | ||||||||||||||||
| 2017 | 18,056 | 18,440 | 384 | 0 | ||||||||||||
| 2016 | 32,780 | 31,989 | 0 | (791 | ) | |||||||||||
| Private collateralized mortgage obligations | ||||||||||||||||
| 2017 | 47,045 | 47,365 | 605 | (285 | ) | |||||||||||
| 2016 | 67,542 | 67,289 | 563 | (816 | ) | |||||||||||
| Collateralized loan obligations | ||||||||||||||||
| 2017 | 263,579 | 264,309 | 798 | (68 | ) | |||||||||||
| 2016 | 124,716 | 124,889 | 838 | (665 | ) | |||||||||||
| Obligations of state and political subdivisions | ||||||||||||||||
| 2017 | 45,118 | 45,861 | 813 | (70 | ) | |||||||||||
| 2016 | 63,161 | 62,888 | 622 | (895 | ) | |||||||||||
| Corporate and other debt securities | ||||||||||||||||
| 2017 | 6,500 | 6,344 | 0 | (156 | ) | |||||||||||
| 2016 | 74,121 | 73,861 | 257 | (517 | ) | |||||||||||
| Private commercial mortgage backed securities | ||||||||||||||||
| 2017 | 0 | 0 | 0 | 0 | ||||||||||||
| 2016 | 37,534 | 37,172 | 111 | (473 | ) | |||||||||||
| Total Securities Available For Sale | ||||||||||||||||
| 2017 | $ | 960,220 | $ | 955,804 | $ | 4,202 | $ | (8,618 | ) | |||||||
| 2016 | $ | 960,809 | $ | 950,503 | $ | 3,767 | $ | (14,073 | ) | |||||||
97
Table 14 - Securities Held to Maturity
| December 31, | ||||||||||||||||
| Gross | Gross | Gross | ||||||||||||||
| Amortized | Fair | Unrealized | Unrealized | |||||||||||||
| Cost | Value | Gains | Losses | |||||||||||||
| (In thousands) | ||||||||||||||||
| Mortgage-backed securities of U.S. Government Sponsored Entities | ||||||||||||||||
| 2017 | $ | 172,261 | $ | 171,616 | $ | 747 | $ | (1,392 | ) | |||||||
| 2016 | 159,941 | 159,402 | 704 | (1,243 | ) | |||||||||||
| Collateralized mortgage obligations of U.S. Government Sponsored Entities | ||||||||||||||||
| 2017 | 181,279 | 178,569 | 56 | (2,768 | ) | |||||||||||
| 2016 | 147,208 | 144,964 | 386 | (2,630 | ) | |||||||||||
| Commercial mortgage-backed securities of U.S. Government Sponsored Entities | ||||||||||||||||
| 2017 | 17,463 | 18,168 | 705 | 0 | ||||||||||||
| 2016 | 17,375 | 17,534 | 233 | (74 | ) | |||||||||||
| Collateralized loan obligations | ||||||||||||||||
| 2017 | 40,523 | 40,826 | 303 | 0 | ||||||||||||
| 2016 | 41,547 | 41,663 | 430 | (314 | ) | |||||||||||
| Private mortgage backed securities | ||||||||||||||||
| 2017 | 5,337 | 5,293 | 9 | (53 | ) | |||||||||||
| 2016 | 6,427 | 6,318 | 0 | (109 | ) | |||||||||||
| Total Securities Held to Maturity | ||||||||||||||||
| 2017 | $ | 416,863 | $ | 414,472 | $ | 1,820 | $ | (4,213 | ) | |||||||
| 2016 | $ | 372,498 | $ | 369,881 | $ | 1,753 | $ | (4,370 | ) | |||||||
98
Table 15 - Maturity Distribution of Securities Available For Sale
| December 31, 2017 | ||||||||||||||||||||||||
| Average | ||||||||||||||||||||||||
| 1 Year | 1-5 | 5-10 | After 10 | Maturity | ||||||||||||||||||||
| Or Less | Years | Years | Years | Total | In Years | |||||||||||||||||||
| (In thousands) | ||||||||||||||||||||||||
| AMORTIZED COST | ||||||||||||||||||||||||
| U.S. Treasury securities and obligations of U.S. Government Sponsored Entities | $ | 5,139 | $ | 4,336 | $ | 0 | $ | 0 | $ | 9,475 | 0.69 | |||||||||||||
| Mortgage-backed securities of U.S. Government Sponsored Entities | 0 | 105,926 | 172,134 | 40,711 | 318,771 | 7.43 | ||||||||||||||||||
| Collateralized mortgage obligations of U.S. Government Sponsored Entities | 560 | 127,645 | 91,339 | 15,922 | 235,466 | 5.40 | ||||||||||||||||||
| Commercial mortgage backed securities of U.S. Government Sponsored Entities | 1,250 | 4,090 | 10,870 | 0 | 16,210 | 6.48 | ||||||||||||||||||
| Private mortgage backed securities | 0 | 0 | 2,460 | 15,596 | 18,056 | 10.55 | ||||||||||||||||||
| Private collateralized mortgage obligations | 26,223 | 12,335 | 5,408 | 3,079 | 47,045 | 2.88 | ||||||||||||||||||
| Collateralized loan obligations | 0 | 27,441 | 236,138 | 0 | 263,579 | 6.90 | ||||||||||||||||||
| Obligations of state and political subdivisions | 1,109 | 10,671 | 20,168 | 13,170 | 45,118 | 9.02 | ||||||||||||||||||
| Corporate and other debt securities | 6,500 | 0 | 0 | 0 | 6,500 | 0.00 | ||||||||||||||||||
| Total Securities Available For Sale | $ | 40,781 | $ | 292,444 | $ | 538,517 | $ | 88,478 | $ | 960,220 | 6.51 | |||||||||||||
| FAIR VALUE | ||||||||||||||||||||||||
| U.S. Treasury securities and obligations of U.S. Government Sponsored Entities | $ | 5,359 | $ | 4,385 | $ | 0 | $ | 0 | $ | 9,744 | ||||||||||||||
| Mortgage-backed securities of U.S. Government Sponsored Entities | 0 | 105,181 | 170,617 | 40,558 | 316,356 | |||||||||||||||||||
| Collateralized mortgage obligations of U.S. Government Sponsored Entities | 560 | 125,034 | 89,578 | 15,872 | 231,044 | |||||||||||||||||||
| Commercial mortgage backed securities of U.S. Government Sponsored Entities | 1,247 | 4,059 | 11,035 | 0 | 16,341 | |||||||||||||||||||
| Private mortgage backed securities | 0 | 0 | 2,538 | 15,902 | 18,440 | |||||||||||||||||||
| Private collateralized mortgage obligations | 26,373 | 12,399 | 5,572 | 3,021 | 47,365 | |||||||||||||||||||
| Collateralized loan obligations | 0 | 27,491 | 236,818 | 0 | 264,309 | |||||||||||||||||||
| Obligations of state and political subdivisions | 1,114 | 10,740 | 20,631 | 13,376 | 45,861 | |||||||||||||||||||
| Corporate and other debt securities | 6,344 | 0 | 0 | 0 | 6,344 | |||||||||||||||||||
| Total Securities Available For Sale | $ | 40,997 | $ | 289,289 | $ | 536,789 | $ | 88,729 | $ | 955,804 | ||||||||||||||
| WEIGHTED AVERAGE YIELD (FTE) | ||||||||||||||||||||||||
| U.S. Treasury securities and obligations of U.S. Government Sponsored Entities | 3.39 | % | 2.74 | % | 0.00 | % | 0.00 | % | 3.09 | % | ||||||||||||||
| Mortgage-backed securities of U.S. Government Sponsored Entities | 0.00 | % | 2.26 | % | 2.69 | % | 2.99 | % | 2.59 | % | ||||||||||||||
| Collateralized mortgage obligations of U.S. Government Sponsored Entities | 1.90 | % | 2.20 | % | 2.51 | % | 2.81 | % | 2.35 | % | ||||||||||||||
| Commercial mortgage backed securities of U.S. Government Sponsored Entities | 1.88 | % | 2.03 | % | 3.92 | % | 0.00 | % | 3.62 | % | ||||||||||||||
| Private mortgage backed securities | 0.00 | % | 0.00 | % | 3.10 | % | 2.84 | % | 2.88 | % | ||||||||||||||
| Private collateralized mortgage obligations | 2.11 | % | 3.67 | % | 2.86 | % | 2.23 | % | 2.64 | % | ||||||||||||||
| Collateralized loan obligations | 0.00 | % | 2.58 | % | 2.99 | % | 0.00 | % | 2.95 | % | ||||||||||||||
| Obligations of state and political subdivisions | 2.26 | % | 2.58 | % | 3.27 | % | 3.47 | % | 3.14 | % | ||||||||||||||
| Corporate and other debt securities | 2.14 | % | 0.00 | % | 0.00 | % | 0.00 | % | 2.14 | % | ||||||||||||||
| Total Securities Available For Sale | 2.27 | % | 2.30 | % | 2.82 | % | 2.98 | % | 2.68 | % | ||||||||||||||
99
Table 16 - Maturity Distribution of Securities Held to Maturity
| December 31, 2017 | ||||||||||||||||||||||||
| Average | ||||||||||||||||||||||||
| 1 Year | 1-5 | 5-10 | After 10 | Maturity | ||||||||||||||||||||
| Or Less | Years | Years | Years | Total | In Years | |||||||||||||||||||
| (In thousands) | ||||||||||||||||||||||||
| AMORTIZED COST | ||||||||||||||||||||||||
| Mortgage-backed securities of U.S. Government Sponsored Entities | $ | 0 | $ | 59,622 | $ | 72,403 | $ | 40,236 | $ | 172,261 | 6.91 | |||||||||||||
| Collateralized mortgage obligations of U.S. Government Sponsored Entities | 0 | 90,717 | 90,562 | 0 | 181,279 | 5.31 | ||||||||||||||||||
| Commercial mortgage backed securities of U.S. Government Sponsored Entities | 0 | 0 | 17,463 | 0 | 17,463 | 7.21 | ||||||||||||||||||
| Collateralized loan obligations | 0 | 3,600 | 36,923 | 0 | 40,523 | 7.81 | ||||||||||||||||||
| Private collateralized mortgage obligations | 0 | 0 | 5,337 | 0 | 5,337 | 6.22 | ||||||||||||||||||
| Total Securities Held for Investment | $ | 0 | $ | 153,939 | $ | 222,688 | $ | 40,236 | $ | 416,863 | 6.31 | |||||||||||||
| FAIR VALUE | ||||||||||||||||||||||||
| Mortgage-backed securities of U.S. Government Sponsored Entities | $ | 0 | $ | 60,060 | $ | 71,583 | $ | 39,973 | $ | 171,616 | ||||||||||||||
| Collateralized mortgage obligations of U.S. Government Sponsored Entities | 0 | 89,431 | 89,136 | 0 | 178,567 | |||||||||||||||||||
| Commercial mortgage backed securities of U.S. Government Sponsored Entities | 0 | 0 | 18,168 | 0 | 18,168 | |||||||||||||||||||
| Collateralized loan obligations | 0 | 3,607 | 37,219 | 0 | 40,826 | |||||||||||||||||||
| Private collateralized mortgage obligations | 0 | 0 | 5,293 | 0 | 5,293 | |||||||||||||||||||
| Total Securities Held for Investment | $ | 0 | $ | 153,098 | $ | 221,399 | $ | 39,973 | $ | 414,470 | ||||||||||||||
| WEIGHTED AVERAGE YIELD (FTE) | ||||||||||||||||||||||||
| Mortgage-backed securities of U.S. Government Sponsored Entities | 0.00 | % | 2.31 | % | 2.60 | % | 2.89 | % | 2.57 | % | ||||||||||||||
| Collateralized mortgage obligations of U.S. Government Sponsored Entities | 0.00 | % | 2.34 | % | 2.54 | % | 0.00 | % | 2.44 | % | ||||||||||||||
| Commercial mortgage backed securities of U.S. Government Sponsored Entities | 0.00 | % | 0.00 | % | 4.24 | % | 0.00 | % | 4.24 | % | ||||||||||||||
| Collateralized loan obligations | 0.00 | % | 3.37 | % | 3.89 | % | 0.00 | % | 3.85 | % | ||||||||||||||
| Private collateralized mortgage obligations | 0.00 | % | 0.00 | % | 2.18 | % | 0.00 | % | 2.18 | % | ||||||||||||||
| Total Securities Held for Investment | 0.00 | % | 2.35 | % | 2.91 | % | 2.89 | % | 2.70 | % | ||||||||||||||
100
Table 17 - Interest Rate Sensitivity Analysis (1)
| December 31, 2017 | ||||||||||||||||||||
| 0-3 | 4-12 | 1-5 | Over | |||||||||||||||||
| Months | Months | Years | 5 Years | Total | ||||||||||||||||
| (In thousands) | ||||||||||||||||||||
| Federal funds sold and interest bearing deposits | $ | 12,553 | $ | 0 | $ | 0 | $ | 0 | $ | 12,553 | ||||||||||
| Securities (2) | 491,399 | 58,750 | 282,622 | 539,896 | 1,372,667 | |||||||||||||||
| Loans, net (3) | 1,316,938 | 486,273 | 1,468,700 | 569,772 | 3,841,683 | |||||||||||||||
| Earning assets | 1,820,890 | 545,023 | 1,751,322 | 1,109,668 | 5,226,903 | |||||||||||||||
| Savings deposits (4) | 2,416,559 | 0 | 0 | 0 | 2,416,559 | |||||||||||||||
| Time deposits | 154,351 | 473,088 | 147,466 | 1,028 | 775,933 | |||||||||||||||
| Borrowings | 497,615 | 0 | 0 | 0 | 497,615 | |||||||||||||||
| Interest bearing liabilities | 3,068,525 | 473,088 | 147,466 | 1,028 | 3,690,107 | |||||||||||||||
| Interest sensitivity gap | $ | (1,247,635 | ) | $ | 71,935 | $ | 1,603,856 | $ | 1,108,640 | $ | 1,536,796 | |||||||||
| Cumulative gap | $ | (1,247,635 | ) | $ | (1,175,700 | ) | $ | 428,156 | $ | 1,536,796 | ||||||||||
| Cumulative gap to total earning assets (%) | (23.9 | ) | (22.5 | ) | 8.2 | 29.4 | ||||||||||||||
| Earning assets to interest bearing liabilities (%) | 59.3 | 115.2 | 1,187.6 | n/m | ||||||||||||||||
| (1) | The repricing dates may differ from maturity dates for certain assets due to prepayment assumptions. |
| (2) | Securities are stated at carrying value. |
| (3) | Includes loans available for sale. |
| (4) | This category is comprised of interest-bearing demand, savings and money market deposits. If interest-bearing demand and savings deposits (totaling $1,365,804) were deemed repriceable in "4-12 months", the interest sensitivity gap and cumulative gap would be $118,169 or 2.3% of total earning assets and earning assets to interest bearing liabilities percentage for the 0-3 months category of 106.9%. |
n/m = not meaningful
101
Stock Performance Graph
The line graph below compares the cumulative total stockholder return on Seacoast common stock for the five years ended December 31, 2017 with the cumulative total return of the NASDAQ Composite Index and the SNL Southeast Bank Index for the same period. The graph and table assume that $100 was invested on December 31, 2012 (the last day of trading for the year ended December 31, 2012) in each of Seacoast common stock, the NASDAQ Composite Index and the SNL Southeast Bank Index. The cumulative total return represents the change in stock price and the amount of dividends received over the period, assuming all dividends were reinvested.
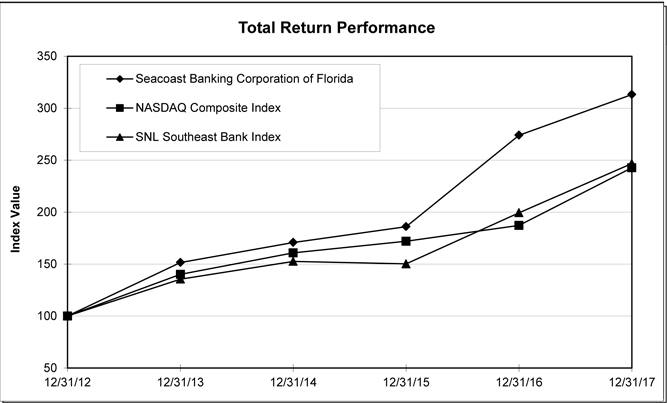
| Period Ending | ||||||||||||||||||||||||
| Index | 12/31/12 | 12/31/13 | 12/31/14 | 12/31/15 | 12/31/16 | 12/31/17 | ||||||||||||||||||
| Seacoast Banking Corporation of Florida | 100.00 | 151.55 | 170.81 | 186.09 | 274.04 | 313.17 | ||||||||||||||||||
| NASDAQ Composite Index | 100.00 | 140.12 | 160.78 | 171.97 | 187.22 | 242.71 | ||||||||||||||||||
| SNL Southeast Bank Index | 100.00 | 135.52 | 152.63 | 150.24 | 199.45 | 246.72 | ||||||||||||||||||
Source: S&P Global Market Intelligence
© 2017
102
SELECTED QUARTERLY INFORMATION
QUARTERLY CONSOLIDATED INCOME (LOSS) STATEMENTS (UNAUDITED)
| 2017 Quarters | 2016 Quarters | |||||||||||||||||||||||||||||||
| Fourth | Third | Second | First | Fourth | Third | Second | First | |||||||||||||||||||||||||
| (In thousands, except per share data) | ||||||||||||||||||||||||||||||||
| Net interest income: | ||||||||||||||||||||||||||||||||
| Interest income | $ | 53,344 | $ | 50,079 | $ | 47,398 | $ | 40,775 | $ | 39,691 | $ | 39,614 | $ | 36,579 | $ | 32,171 | ||||||||||||||||
| Interest expense | 5,118 | 4,330 | 3,242 | 2,610 | 2,266 | 2,166 | 2,086 | 1,949 | ||||||||||||||||||||||||
| Net interest income | 48,226 | 45,749 | 44,156 | 38,165 | 37,425 | 37,448 | 34,493 | 30,222 | ||||||||||||||||||||||||
| Provision for loan losses | 2,263 | 680 | 1,401 | 1,304 | 1,000 | 550 | 662 | 199 | ||||||||||||||||||||||||
| Net interest income after provision for loan losses | 45,963 | 45,069 | 42,755 | 36,861 | 36,425 | 36,898 | 33,831 | 30,023 | ||||||||||||||||||||||||
| Noninterest income: | ||||||||||||||||||||||||||||||||
| Service charges on deposit accounts | 2,566 | 2,626 | 2,435 | 2,422 | 2,612 | 2,698 | 2,230 | 2,129 | ||||||||||||||||||||||||
| Trust fees | 941 | 967 | 917 | 880 | 969 | 820 | 838 | 806 | ||||||||||||||||||||||||
| Mortgage banking fees | 1,487 | 2,138 | 1,272 | 1,552 | 1,616 | 1,885 | 1,364 | 999 | ||||||||||||||||||||||||
| Brokerage commissions and fees | 273 | 351 | 351 | 377 | 480 | 463 | 470 | 631 | ||||||||||||||||||||||||
| Marine finance fees | 313 | 137 | 326 | 134 | 115 | 138 | 279 | 141 | ||||||||||||||||||||||||
| Interchange income | 2,836 | 2,582 | 2,671 | 2,494 | 2,334 | 2,306 | 2,370 | 2,217 | ||||||||||||||||||||||||
| Other deposit based EFT fees | 111 | 100 | 114 | 140 | 125 | 109 | 116 | 127 | ||||||||||||||||||||||||
| BOLI income | 1,100 | 836 | 757 | 733 | 611 | 382 | 379 | 841 | ||||||||||||||||||||||||
| Other income | 1,750 | 1,744 | 1,624 | 1,173 | 1,060 | 963 | 1,065 | 739 | ||||||||||||||||||||||||
| Gain on sale of VISA stock | 15,153 | 0 | 0 | 0 | 0 | 0 | 0 | 0 | ||||||||||||||||||||||||
| Securities gains (losses), net | 112 | (47 | ) | 21 | 0 | 7 | 225 | 47 | 89 | |||||||||||||||||||||||
| Total noninterest income | 26,642 | 11,434 | 10,488 | 9,905 | 9,929 | 9,989 | 9,158 | 8,719 | ||||||||||||||||||||||||
| Noninterest expenses: | ||||||||||||||||||||||||||||||||
| Salaries and wages | 16,321 | 15,627 | 18,375 | 15,369 | 12,476 | 14,337 | 13,884 | 13,399 | ||||||||||||||||||||||||
| Employee benefits | 2,812 | 2,917 | 2,935 | 3,068 | 2,475 | 2,425 | 2,521 | 2,482 | ||||||||||||||||||||||||
| Outsourced data processing costs | 4,160 | 3,231 | 3,456 | 3,269 | 3,076 | 3,198 | 2,803 | 4,439 | ||||||||||||||||||||||||
| Telephone / data lines | 538 | 573 | 648 | 532 | 502 | 539 | 539 | 528 | ||||||||||||||||||||||||
| Occupancy | 3,265 | 2,447 | 4,421 | 3,157 | 2,830 | 3,675 | 3,645 | 2,972 | ||||||||||||||||||||||||
| Furniture and equipment | 1,806 | 1,191 | 1,679 | 1,391 | 1,211 | 1,228 | 1,283 | 998 | ||||||||||||||||||||||||
| Marketing | 1,490 | 1,298 | 1,074 | 922 | 847 | 780 | 957 | 1,049 | ||||||||||||||||||||||||
| Legal and professional fees | 3,054 | 2,560 | 3,276 | 2,132 | 2,370 | 2,213 | 2,656 | 2,357 | ||||||||||||||||||||||||
| FDIC assessments | 558 | 548 | 650 | 570 | 661 | 517 | 643 | 544 | ||||||||||||||||||||||||
| Amortization of intangibles | 964 | 839 | 839 | 719 | 719 | 728 | 593 | 446 | ||||||||||||||||||||||||
| Asset dispositions expense | 105 | 117 | 136 | 53 | 84 | 219 | 160 | 90 | ||||||||||||||||||||||||
| Net (gain)/loss on other real estate owned and repossessed assets | (112 | ) | (414 | ) | 161 | (346 | ) | (161 | ) | (96 | ) | (201 | ) | (51 | ) | |||||||||||||||||
| Early redemption cost for Federal Home Loan Bank advances | 0 | 0 | 0 | 0 | 0 | 0 | 1,777 | 0 | ||||||||||||||||||||||||
| Other | 4,223 | 3,427 | 3,975 | 3,910 | 3,207 | 3,672 | 3,548 | 3,088 | ||||||||||||||||||||||||
| Total noninterest expenses | 39,184 | 34,361 | 41,625 | 34,746 | 30,297 | 33,435 | 34,808 | 32,341 | ||||||||||||||||||||||||
| Income before income taxes | 33,421 | 22,142 | 11,618 | 12,020 | 16,057 | 13,452 | 8,181 | 6,401 | ||||||||||||||||||||||||
| Provision for income taxes | 20,374 | 7,926 | 3,942 | 4,094 | 5,286 | 4,319 | 2,849 | 2,435 | ||||||||||||||||||||||||
| Net income | $ | 13,047 | $ | 14,216 | $ | 7,676 | $ | 7,926 | $ | 10,771 | $ | 9,133 | $ | 5,332 | $ | 3,966 | ||||||||||||||||
| PER COMMON SHARE DATA | ||||||||||||||||||||||||||||||||
| Net income diluted | $ | 0.28 | $ | 0.32 | $ | 0.18 | $ | 0.20 | $ | 0.28 | $ | 0.24 | $ | 0.14 | $ | 0.11 | ||||||||||||||||
| Net income basic | 0.29 | 0.33 | 0.18 | 0.20 | 0.29 | 0.24 | 0.14 | 0.11 | ||||||||||||||||||||||||
| Cash dividends declared: | ||||||||||||||||||||||||||||||||
| Common stock | 0.00 | 0.00 | 0.00 | 0.00 | 0.00 | 0.00 | 0.00 | 0.00 | ||||||||||||||||||||||||
| Market price common stock: | ||||||||||||||||||||||||||||||||
| Low close | 22.42 | 20.58 | 21.65 | 20.59 | 15.85 | 15.50 | 15.21 | 13.40 | ||||||||||||||||||||||||
| High close | 27.13 | 24.87 | 25.88 | 25.13 | 22.91 | 17.80 | 17.19 | 16.22 | ||||||||||||||||||||||||
| Bid price at end of period | 25.21 | 23.89 | 24.10 | 23.98 | 22.06 | 16.09 | 16.24 | 15.79 | ||||||||||||||||||||||||
103
FINANCIAL HIGHLIGHTS
| For the Year Ended and at December 31, | ||||||||||||||||||||
| (In thousands, except per share data) | 2017 | 2016 | 2015 | 2014 | 2013 | |||||||||||||||
| Net interest income | $ | 176,296 | $ | 139,588 | $ | 109,487 | $ | 74,907 | $ | 65,206 | ||||||||||
| Provision (recapture) for loan losses | 5,648 | 2,411 | 2,644 | (3,486 | ) | 3,188 | ||||||||||||||
| Noninterest income: | ||||||||||||||||||||
| Other | 43,230 | 37,427 | 32,018 | 24,744 | 24,319 | |||||||||||||||
| Securities gains, net | 86 | 368 | 161 | 469 | 419 | |||||||||||||||
| Gain on sale of VISA stock | 15,153 | 0 | 0 | 0 | 0 | |||||||||||||||
| Bargain purchase gains, net | 0 | 0 | 416 | 0 | 0 | |||||||||||||||
| Noninterest expenses | 149,916 | 130,881 | 103,770 | 93,366 | 75,152 | |||||||||||||||
| Income before income taxes | 79,201 | 44,091 | 35,668 | 10,240 | 11,604 | |||||||||||||||
| Provision (benefit) for income taxes | 36,336 | 14,889 | 13,527 | 4,544 | (40,385 | ) | ||||||||||||||
| Net income | $ | 42,865 | $ | 29,202 | $ | 22,141 | $ | 5,696 | $ | 51,989 | ||||||||||
| Per Share Data | ||||||||||||||||||||
| Net income available to common shareholders: | ||||||||||||||||||||
| Diluted | 0.99 | 0.78 | 0.66 | 0.21 | 2.44 | |||||||||||||||
| Basic | 1.01 | 0.79 | 0.66 | 0.21 | 2.46 | |||||||||||||||
| Cash dividends declared | 0.00 | 0.00 | 0.00 | 0.00 | 0.00 | |||||||||||||||
| Book value per share common | 14.70 | 11.45 | 10.29 | 9.44 | 8.40 | |||||||||||||||
| Assets | $ | 5,810,129 | $ | 4,680,932 | $ | 3,534,780 | $ | 3,093,335 | $ | 2,268,940 | ||||||||||
| Securities | 1,372,667 | 1,323,001 | 994,291 | 949,279 | 641,611 | |||||||||||||||
| Net loans | 3,790,255 | 2,856,136 | 2,137,202 | 1,804,814 | 1,284,139 | |||||||||||||||
| Deposits | 4,592,720 | 3,523,245 | 2,844,387 | 2,416,534 | 1,806,045 | |||||||||||||||
| FHLB borrowings | 211,000 | 415,000 | 50,000 | 130,000 | 50,000 | |||||||||||||||
| Subordinated debt | 70,521 | 70,241 | 69,961 | 64,583 | 53,610 | |||||||||||||||
| Shareholders' equity | 689,664 | 435,397 | 353,453 | 312,651 | 198,604 | |||||||||||||||
| Performance ratios: | ||||||||||||||||||||
| Return on average assets | 0.82 | % | 0.69 | % | 0.67 | % | 0.23 | % | 2.38 | % | ||||||||||
| Return on average equity | 7.51 | 7.06 | 6.56 | 2.22 | 28.36 | |||||||||||||||
| Net interest margin (1) | 3.73 | 3.63 | 3.64 | 3.25 | 3.15 | |||||||||||||||
| Average equity to average assets | 10.96 | 9.85 | 10.21 | 10.34 | 8.38 | |||||||||||||||
(1) On a fully taxable equivalent basis, a non-GAAP measure (see page 52 of Management's Discussion and Analysis).
| 104 |
REPORT OF INDEPENDENT REGISTERED PUBLIC ACCOUNTING FIRM
Shareholders and the Board of Directors of Seacoast Banking Corporation of Florida
Stuart, Florida
Opinions on the Financial Statements and Internal Control over Financial Reporting
We have audited the accompanying consolidated balance sheets of Seacoast Banking Corporation of Florida (the "Company") as of December 31, 2017 and 2016, the related consolidated statements of income, comprehensive income, shareholders’ equity, and cash flows for each of the years in the three-year period ended December 31, 2017, and the related notes (collectively referred to as the "financial statements"). We also have audited the Company’s internal control over financial reporting as of December 31, 2017, based on criteria established in Internal Control – Integrated Framework: (2013) issued by the Committee of Sponsoring Organizations of the Treadway Commission (COSO).
In our opinion, the financial statements referred to above present fairly, in all material respects, the financial position of the Company as of December 31, 2017 and 2016, and the results of its operations and its cash flows for each of the years in the three-year period ended December 31, 2017 in conformity with accounting principles generally accepted in the United States of America. Also in our opinion, the Company maintained, in all material respects, effective internal control over financial reporting as of December 31, 2017, based on criteria established in Internal Control – Integrated Framework: (2013) issued by COSO.
Basis for Opinions
The Company’s management is responsible for these financial statements, for maintaining effective internal control over financial reporting, and for its assessment of the effectiveness of internal control over financial reporting, included in the accompanying Management’s Report on Internal Control over Financial Reporting. Our responsibility is to express an opinion on the Company’s financial statements and an opinion on the Company’s internal control over financial reporting based on our audits. We are a public accounting firm registered with the Public Company Accounting Oversight Board (United States) ("PCAOB") and are required to be independent with respect to the Company in accordance with the U.S. federal securities laws and the applicable rules and regulations of the Securities and Exchange Commission and the PCAOB.
We conducted our audits in accordance with the standards of the PCAOB. Those standards require that we plan and perform the audits to obtain reasonable assurance about whether the financial statements are free of material misstatement, whether due to error or fraud, and whether effective internal control over financial reporting was maintained in all material respects.
Our audits of the financial statements included performing procedures to assess the risks of material misstatement of the financial statements, whether due to error or fraud, and performing procedures that respond to those risks. Such procedures included examining, on a test basis, evidence regarding the amounts and disclosures in the financial statements. Our audits also included evaluating the accounting principles used and significant estimates made by management, as well as evaluating the overall presentation of the financial statements. Our audit of internal control over financial reporting included obtaining an understanding of internal control over financial reporting, assessing the risk that a material weakness exists, and testing and evaluating the design and operating effectiveness of internal control based on the assessed risk. Our audits also included performing such other procedures as we considered necessary in the circumstances. We believe that our audits provide a reasonable basis for our opinions.
| 105 |
Definition and Limitations of Internal Control Over Financial Reporting
A company’s internal control over financial reporting is a process designed to provide reasonable assurance regarding the reliability of financial reporting and the preparation of financial statements for external purposes in accordance with generally accepted accounting principles. A company’s internal control over financial reporting includes those policies and procedures that (1) pertain to the maintenance of records that, in reasonable detail, accurately and fairly reflect the transactions and dispositions of the assets of the company; (2) provide reasonable assurance that transactions are recorded as necessary to permit preparation of financial statements in accordance with generally accepted accounting principles, and that receipts and expenditures of the company are being made only in accordance with authorizations of management and directors of the company; and (3) provide reasonable assurance regarding prevention or timely detection of unauthorized acquisition, use, or disposition of the company’s assets that could have a material effect on the financial statements.
Because of its inherent limitations, internal control over financial reporting may not prevent or detect misstatements. Also, projections of any evaluation of effectiveness to future periods are subject to the risk that controls may become inadequate because of changes in conditions, or that the degree of compliance with the policies or procedures may deteriorate.
/s/ Crowe Horwath LLP
Crowe Horwath LLP
We have served as the Company's auditor since 2014.
Atlanta, Georgia
February 28, 2018
| 106 |
SEACOAST BANKING CORPORATION OF FLORIDA AND SUBSIDIARIES
CONSOLIDATED STATEMENTS OF INCOME
| For the Year Ended December 31 | ||||||||||||
| 2017 | 2016 | 2015 | ||||||||||
| (In thousands, except share data) | ||||||||||||
| INTEREST INCOME | ||||||||||||
| Interest on securities | ||||||||||||
| Taxable | $ | 34,442 | $ | 26,133 | $ | 20,341 | ||||||
| Nontaxable | 913 | 1,036 | 585 | |||||||||
| Interest and fees on loans | 153,825 | 119,217 | 94,469 | |||||||||
| Interest on federal funds sold and other investments | 2,416 | 1,669 | 1,022 | |||||||||
| Total interest income | 191,596 | 148,055 | 116,417 | |||||||||
| INTEREST EXPENSE | ||||||||||||
| Interest on savings deposits | 3,654 | 2,593 | 2,085 | |||||||||
| Interest on time certificates | 4,678 | 2,074 | 1,228 | |||||||||
| Interest on federal funds purchased and other short term borrowings | 781 | 484 | 340 | |||||||||
| Interest on Federal Home Loan Bank borrowings | 3,744 | 1,256 | 1,643 | |||||||||
| Interest on subordinated debt | 2,443 | 2,060 | 1,634 | |||||||||
| Total interest expense | 15,300 | 8,467 | 6,930 | |||||||||
| NET INTEREST INCOME | 176,296 | 139,588 | 109,487 | |||||||||
| Provision for loan losses | 5,648 | 2,411 | 2,644 | |||||||||
| NET INTEREST INCOME AFTER PROVISION FOR LOAN LOSSES | 170,648 | 137,177 | 106,843 | |||||||||
| NONINTEREST INCOME (Note M) | ||||||||||||
| Bargain purchase gain | 0 | 0 | 416 | |||||||||
| Gain on sale of VISA stock | 15,153 | 0 | 0 | |||||||||
| Securities gains, net (includes net gains of $1,950, and net losses of ($617) and ($325) in other comprehensive income reclassifications for 2017, 2016, and 2015 respectively) | 86 | 368 | 161 | |||||||||
| Other | 43,230 | 37,427 | 32,018 | |||||||||
| Total noninterest income | 58,469 | 37,795 | 32,595 | |||||||||
| NONINTEREST EXPENSE (Note M) | 149,916 | 130,881 | 103,770 | |||||||||
| INCOME BEFORE INCOME TAXES | 79,201 | 44,091 | 35,668 | |||||||||
| Income taxes | 36,336 | 14,889 | 13,527 | |||||||||
| NET INCOME | $ | 42,865 | $ | 29,202 | $ | 22,141 | ||||||
| SHARE DATA | ||||||||||||
| Net income per share of common stock | ||||||||||||
| Diluted | $ | 0.99 | $ | 0.78 | $ | 0.66 | ||||||
| Basic | 1.01 | 0.79 | 0.66 | |||||||||
| Average common shares outstanding | ||||||||||||
| Diluted | 43,350,314 | 37,508,046 | 33,744,171 | |||||||||
| Basic | 42,613,086 | 36,872,007 | 33,495,827 | |||||||||
See notes to consolidated financial statements.
| 107 |
SEACOAST BANKING CORPORATION OF FLORIDA AND SUBSIDIARIES
CONSOLIDATED STATEMENTS OF COMPREHENSIVE INCOME
| For the Year Ended December 31 | ||||||||||||
| 2017 | 2016 | 2015 | ||||||||||
| (In thousands) | ||||||||||||
| NET INCOME | $ | 42,865 | $ | 29,202 | $ | 22,141 | ||||||
| Other comprehensive income (loss): | ||||||||||||
| Unrealized gains (losses) on securities available for sale | 5,976 | (2,129 | ) | (2,634 | ) | |||||||
| Amortization of unrealized losses on securities transferred to held to maturity, net | 596 | 488 | 539 | |||||||||
| Reclassification adjustment for gains included in net income | (86 | ) | (368 | ) | (161 | ) | ||||||
| (Provision) benefit for income taxes | (2,483 | ) | 709 | 870 | ||||||||
| Total other comprehensive income (loss) | 4,003 | (1,300 | ) | (1,386 | ) | |||||||
| COMPREHENSIVE INCOME | $ | 46,868 | $ | 27,902 | $ | 20,755 | ||||||
| 108 |
SEACOAST BANKING CORPORATION OF FLORIDA AND SUBSIDIARIES
CONSOLIDATED BALANCE SHEETS
| December 31, | ||||||||
| 2017 | 2016 | |||||||
| (In thousands, except share data) | ||||||||
| ASSETS | ||||||||
| Cash and due from banks | $ | 104,039 | $ | 82,520 | ||||
| Interest bearing deposits with other banks | 5,465 | 27,124 | ||||||
| Total cash and cash equivalents | 109,504 | 109,644 | ||||||
| Time deposits with other banks | 12,553 | 0 | ||||||
| Securities available for sale (at fair value) | 955,804 | 950,503 | ||||||
| Securities held to maturity (fair value $414,470 in 2017 and $369,881 in 2016 ) | 416,863 | 372,498 | ||||||
| Total securities | 1,372,667 | 1,323,001 | ||||||
| Loans held for sale | 24,306 | 15,332 | ||||||
| Loans | 3,817,377 | 2,879,536 | ||||||
| Less: Allowance for loan losses | (27,122 | ) | (23,400 | ) | ||||
| Net loans | 3,790,255 | 2,856,136 | ||||||
| Bank premises and equipment, net | 66,883 | 58,684 | ||||||
| Other real estate owned | 7,640 | 9,949 | ||||||
| Goodwill | 147,578 | 64,649 | ||||||
| Other intangible assets, net | 19,099 | 14,572 | ||||||
| Bank owned life insurance | 123,981 | 84,580 | ||||||
| Net deferred tax assets | 25,417 | 60,818 | ||||||
| Other assets | 110,246 | 83,567 | ||||||
| TOTAL ASSETS | $ | 5,810,129 | $ | 4,680,932 | ||||
| LIABILITIES | ||||||||
| Noninterest demand | $ | 1,400,227 | $ | 1,148,309 | ||||
| Interest-bearing demand | 1,050,755 | 873,727 | ||||||
| Savings | 434,346 | 346,662 | ||||||
| Money market | 931,458 | 802,697 | ||||||
| Other time deposits | 414,277 | 276,607 | ||||||
| Brokered time certificates | 217,385 | 7,342 | ||||||
| Time certificates of more than $250,000 | 144,272 | 67,901 | ||||||
| Total deposits | 4,592,720 | 3,523,245 | ||||||
| Securities sold under agreements to repurchase, maturing within 30 days | 216,094 | 204,202 | ||||||
| Federal Home Loan Bank borrowings | 211,000 | 415,000 | ||||||
| Subordinated debt | 70,521 | 70,241 | ||||||
| Other liabilities | 30,130 | 32,847 | ||||||
| 5,120,465 | 4,245,535 | |||||||
| Commitments and Contingencies (Notes K and P) | ||||||||
| SHAREHOLDERS' EQUITY | ||||||||
| Common stock, par value $0.10 per share authorized 60,000,000 shares, issued 47,032,259 and outstanding 46,917,735 shares in 2017 and authorized 60,000,000 shares, issued 38,090,568 and outstanding 38,021,835 shares in 2016 | 4,693 | 3,802 | ||||||
| Additional paid-in capital | 661,632 | 454,001 | ||||||
| Retained earnings (accumulated deficit) | 29,914 | (13,657 | ) | |||||
| Less: Treasury stock (114,524 shares in 2017 and 68,733 shares in 2016), at cost | (2,359 | ) | (1,236 | ) | ||||
| 693,880 | 442,910 | |||||||
| Accumulated other comprehensive loss, net | (4,216 | ) | (7,513 | ) | ||||
| 689,664 | 435,397 | |||||||
| TOTAL LIABILITIES AND SHAREHOLDERS' EQUITY | $ | 5,810,129 | $ | 4,680,932 | ||||
See notes to consolidated financial statements.
| 109 |
SEACOAST BANKING CORPORATION OF FLORIDA AND SUBSIDIARIES
CONSOLIDATED STATEMENT OF CASH FLOWS
| For the Year Ended December 31, | ||||||||||||
| 2017 | 2016 | 2015 | ||||||||||
| (Dollars in thousands) | ||||||||||||
| CASH FLOWS FROM OPERATING ACTIVITIES | ||||||||||||
| Net Income | $ | 42,865 | $ | 29,202 | $ | 22,141 | ||||||
| Adjustments to reconcile net income to net cash provided by operating activities: | ||||||||||||
| Depreciation | 5,614 | 5,076 | 3,773 | |||||||||
| Amortization of premiums and discounts on securities, net | 3,977 | 7,559 | 3,920 | |||||||||
| Other amortization and accretion, net | (697 | ) | (2,238 | ) | (1,601 | ) | ||||||
| Stock based compensation | 5,267 | 4,154 | 2,859 | |||||||||
| Origination of loans designated for sale | (213,027 | ) | (175,842 | ) | (206,199 | ) | ||||||
| Sale of loans designated for sale | 211,091 | 190,843 | 199,425 | |||||||||
| Provision for loan losses | 5,648 | 2,411 | 2,644 | |||||||||
| Deferred income taxes | 35,827 | 14,206 | 12,888 | |||||||||
| Gains on sale of securities | (86 | ) | (368 | ) | (161 | ) | ||||||
| Gain on sale of VISA Class B stock | (15,153 | ) | 0 | 0 | ||||||||
| Gains on sale of loans | (7,038 | ) | (6,335 | ) | (5,146 | ) | ||||||
| Losses (gains) on sale and write-downs of other real estate owned | (711 | ) | (509 | ) | 239 | |||||||
| Losses on disposition of fixed assets | 2,270 | 2,442 | 183 | |||||||||
| Changes in operating assets and liabilities, net of effects from acquired companies: | ||||||||||||
| Net increase in other assets | (5,506 | ) | (11,573 | ) | (4,828 | ) | ||||||
| Net increase (decrease) in other liabilities | (21,432 | ) | 2,979 | (628 | ) | |||||||
| Net cash provided by operating activities | 48,909 | 62,007 | 29,509 | |||||||||
| CASH FLOWS FROM INVESTING ACTIVITIES | ||||||||||||
| Maturities and repayments of securities available for sale | 211,173 | 127,879 | 118,493 | |||||||||
| Maturities and repayments of securities held for investment | 86,460 | 48,705 | 28,629 | |||||||||
| Proceeds from sale of securities available for sale | 235,613 | 40,421 | 60,314 | |||||||||
| Purchases of securities available for sale | (371,926 | ) | (297,719 | ) | (159,616 | ) | ||||||
| Purchases of securities held for investment | (131,439 | ) | (218,654 | ) | (24,366 | ) | ||||||
| Maturities of time deposits with other banks | 4,720 | 0 | 0 | |||||||||
| Net new loans and principal repayments | (328,868 | ) | (396,862 | ) | (224,391 | ) | ||||||
| Proceeds from the sale of portfolio loans | 106,815 | 71,433 | 525 | |||||||||
| Purchases of loans held for investment | (55,352 | ) | (64,925 | ) | 0 | |||||||
| Proceeds from the sale of other real estate owned | 6,069 | 7,952 | 5,758 | |||||||||
| Proceeds from sale of Federal Home Loan Bank (FHLB) and Federal Reserve Bank Stock | 48,295 | 9,350 | 7,427 | |||||||||
| Purchase of FHLB and Federal Reserve Bank Stock | (42,680 | ) | (28,857 | ) | (7,510 | ) | ||||||
| Purchase of VISA Class B stock | (6,180 | ) | 0 | 0 | ||||||||
| Redemption of bank owned life insurance | 3,609 | 0 | 0 | |||||||||
| Purchase of bank owned life insurance | (30,000 | ) | (40,000 | ) | 0 | |||||||
| Net cash from bank acquisitions | 23,825 | 235,546 | 32,927 | |||||||||
| Additions to bank premises and equipment | (5,710 | ) | (6,054 | ) | (9,091 | ) | ||||||
| Net cash used in investing activities | (245,576 | ) | (511,785 | ) | (170,901 | ) | ||||||
| CASH FLOWS FROM FINANCING ACTIVITIES | ||||||||||||
| Net increase in deposits | 333,049 | 27,320 | 240,086 | |||||||||
| Net increase in federal funds purchased and repurchase agreements | 11,892 | 32,196 | 16,707 | |||||||||
| Net increase (decrease) in FHLB borrowings | (204,000 | ) | 415,000 | (80,000 | ) | |||||||
| Early redemption of FHLB borrowings | 0 | (50,000 | ) | 0 | ||||||||
| Stock based employee benefit plans | (55 | ) | (1,161 | ) | 127 | |||||||
| Issuance of common stock, net of related expense | 55,641 | 0 | 0 | |||||||||
| Dividends paid | 0 | 0 | 0 | |||||||||
| Net cash provided by financing activities | 196,527 | 423,355 | 176,920 | |||||||||
| Net increase (decrease) in cash and cash equivalents | (140 | ) | (26,423 | ) | 35,528 | |||||||
| Cash and cash equivalents at beginning of year | 109,644 | 136,067 | 100,539 | |||||||||
| Cash and cash equivalents at end of year | $ | 109,504 | $ | 109,644 | $ | 136,067 | ||||||
| Supplemental disclosure of cash flow information: | ||||||||||||
| Cash paid during the period for interest | $ | 15,125 | $ | 7,855 | $ | 6,636 | ||||||
| Cash paid during the period for income taxes | 400 | 703 | 575 | |||||||||
| Supplemental disclosure of non cash investing activities: | ||||||||||||
| Transfer from loans to other real estate owned | $ | 1,774 | $ | 3,009 | $ | 4,946 | ||||||
| Transfer from bank premises to other real estate owned | 1,212 | 7,708 | 309 | |||||||||
See notes to consolidated financial statements.
| 110 |
SEACOAST BANKING CORPORATION AND SUBSIDIARIES
CONSOLIDATED STATEMENTS OF SHAREHOLDERS' EQUITY
| Retained | Accumulated | |||||||||||||||||||||||||||
| Earnings | Other | |||||||||||||||||||||||||||
| Common Stock | Paid-in | (Accumulated | Treasury | Comprehensive | ||||||||||||||||||||||||
| (Dollars and shares in thousands) | Shares | Amount | Capital | Deficit) | Stock | Income (Loss), Net | Total | |||||||||||||||||||||
| BALANCE AT DECEMBER 31, 2014 | 33,137 | 3,300 | 379,249 | (65,000 | ) | (71 | ) | (4,827 | ) | 312,651 | ||||||||||||||||||
| Comprehensive income | 0 | 0 | 0 | 22,141 | 0 | (1,386 | ) | 20,755 | ||||||||||||||||||||
| Stock based compensation expense | 0 | 0 | 2,859 | 0 | 0 | 0 | 2,859 | |||||||||||||||||||||
| Common stock issued for stock based employee benefit plans | 124 | 0 | 17 | 0 | (2 | ) | 0 | 15 | ||||||||||||||||||||
| Issuance of common stock, pursuant to acquisition | 1,090 | 109 | 17,063 | 0 | 0 | 0 | 17,172 | |||||||||||||||||||||
| Other | 0 | 26 | (26 | ) | 1 | 0 | 0 | 1 | ||||||||||||||||||||
| BALANCE AT DECEMBER 31, 2015 | 34,351 | 3,435 | 399,162 | (42,858 | ) | (73 | ) | (6,213 | ) | 353,453 | ||||||||||||||||||
| Comprehensive income | 0 | 0 | 0 | 29,202 | 0 | (1,300 | ) | 27,902 | ||||||||||||||||||||
| Stock based compensation expense | 0 | 0 | 4,154 | 0 | 0 | 0 | 4,154 | |||||||||||||||||||||
| Common stock issued for stock based employee benefit plans | 87 | 0 | 2 | 0 | (1,163 | ) | 0 | (1,161 | ) | |||||||||||||||||||
| Common stock issued for stock options | 12 | 1 | 133 | 0 | 0 | 0 | 134 | |||||||||||||||||||||
| Issuance of common stock, pursuant to acquisition | 3,291 | 329 | 50,584 | 0 | 0 | 0 | 50,913 | |||||||||||||||||||||
| Other | 281 | 37 | (34 | ) | (1 | ) | 0 | 0 | 2 | |||||||||||||||||||
| BALANCE AT DECEMBER 31, 2016 | 38,022 | $ | 3,802 | $ | 454,001 | $ | (13,657 | ) | $ | (1,236 | ) | $ | (7,513 | ) | 435,397 | |||||||||||||
| Comprehensive income | 0 | 0 | 0 | 42,865 | 0 | 4,003 | 46,868 | |||||||||||||||||||||
| Reclassification of disproportionate tax effects upon adoption of new accounting pronouncement | 0 | 0 | 0 | 706 | 0 | (706 | ) | 0 | ||||||||||||||||||||
| Stock based compensation expense | 0 | 0 | 5,267 | 0 | 0 | 0 | 5,267 | |||||||||||||||||||||
| Common stock issued for stock based employee benefit plans | 61 | 0 | (15 | ) | 0 | (1,123 | ) | 0 | (1,138 | ) | ||||||||||||||||||
| Common stock issued for stock options | 91 | 16 | 1,066 | 0 | 0 | 0 | 1,082 | |||||||||||||||||||||
| Issuance of common stock, net of related expenses | 2,703 | 270 | 55,371 | 0 | 0 | 0 | 55,641 | |||||||||||||||||||||
| Issuance of common stock, pursuant to acquisition | 6,041 | 605 | 145,942 | 0 | 0 | 0 | 146,547 | |||||||||||||||||||||
| BALANCE AT DECEMBER 31, 2017 | 46,918 | $ | 4,693 | $ | 661,632 | $ | 29,914 | $ | (2,359 | ) | $ | (4,216 | ) | $ | 689,664 | |||||||||||||
See notes to consolidated financial statements.
| 111 |
NOTES TO CONSOLIDATED FINANCIAL STATEMENTS
Seacoast Banking Corporation of Florida and Subsidiaries
Note A - Significant Accounting Policies
General: Seacoast Banking Corporation of Florida (“Seacoast” or the “Company”) is a single segment bank holding company with one operating subsidiary bank, Seacoast National Bank (“Seacoast Bank”). The Company provides integrated financial services including commercial and retail banking, wealth management, and mortgage services to customers through advanced banking solutions, 51 traditional branch offices and five commercial banking centers operated by Seacoast Bank. Offices stretch from Ft. Lauderdale, Boca Raton and West Palm Beach north through the Daytona Beach area, into Orlando and Central Florida and the adjacent Tampa market, and west to Okeechobee and surrounding counties.
The consolidated financial statements include the accounts of Seacoast and all its majority-owned subsidiaries but exclude trusts created for the issuance of trust preferred securities. In consolidation, all significant intercompany accounts and transactions are eliminated.
The accounting and reporting policies of the Company are in accordance with accounting principles generally accepted in the United States of America, and they conform to general practices within the applicable industries. Certain reclassifications have been made to prior period amounts to conform to the current period presentation. The reclassifications had no impact to net income or retained earnings.
Use of Estimates: The preparation of consolidated financial statements requires management to make judgments in the application of certain of its accounting policies that involve significant estimates and assumptions. We have established policies and control procedures that are intended to ensure valuation methods are well controlled and applied consistently from period to period. These estimates and assumptions, which may materially affect the reported amounts of certain assets, liabilities, revenues and expenses, are based on information available as of the date of the financial statements, and changes in this information over time and the use of revised estimates and assumptions could materially affect amounts reported in subsequent financial statements. Specific areas, among others, requiring the application of management’s estimates include determination of the allowance for loan losses, acquisition accounting and purchased loans, intangible assets and impairment testing, other fair value adjustments, other than temporary impairment of securities, income taxes and realization of deferred tax assets and contingent liabilities.
Cash and Cash Equivalents: Cash and cash equivalents include cash and due from banks and interest-bearing bank balances. Cash equivalents have original maturities of three months or less, and accordingly, the carrying amount of these instruments is deemed to be a reasonable estimate of fair value.
Time deposits with other banks: Time deposits with other banks consist of certificates of deposit with a maturity greater than three months and are carried at cost.
Securities Purchased and Sold Agreements: Securities purchased under resale agreements and securities sold under repurchase agreements are generally accounted for as collateralized financing transactions and are recorded at the amount at which the securities were acquired or sold plus accrued interest. It is the Company’s policy to take possession of securities purchased under resale agreements, which are primarily U.S. Government and Government agency securities. The fair value of securities purchased and sold is monitored and collateral is obtained from or returned to the counterparty when appropriate.
Securities: Securities are classified at date of purchase as available for sale or held to maturity. Securities that may be sold as part of the Company's asset/liability management or in response to, or in anticipation of changes in interest rates and resulting prepayment risk, or for other factors are stated at fair value with unrealized gains or losses reflected as a component of shareholders' equity net of tax or included in noninterest income as appropriate. The estimated fair value of a security is determined based on market quotations when available or, if not available, by using quoted market prices for similar securities, pricing models or discounted cash flow analyses, using observable market data where available. Debt securities that the Company has the ability and intent to hold to maturity are carried at amortized cost.
Realized gains and losses, including other than temporary impairments, are included in noninterest income as investment securities gains (losses). Interest and dividends on securities, including amortization of premiums and accretion of discounts, is recognized in interest income on an accrual basis using the interest method. The Company anticipates prepayments of principal in the calculation of the effective yield for collateralized mortgage obligations and mortgage backed securities by obtaining estimates of prepayments from independent third parties. The adjusted cost of each specific security sold is used to compute realized gains or losses on the sale of securities on a trade date basis.
On a quarterly basis, the Company makes an assessment to determine whether there have been any events or economic circumstances to indicate that a security is impaired on an other-than-temporary basis. Management considers many factors including the length of time the security has had a fair value less than the cost basis; recent events specific to the issuer or industry; and for debt securities, external credit ratings and recent downgrades. Management also assesses whether it intends to sell, or it is more likely than not that it will be required to sell, a security in an unrealized loss position before recovery of its amortized cost basis. Securities on which there is an unrealized loss that is deemed to be other-than temporary are written down to fair value with the write-down recorded as a realized loss.
| 112 |
In 2014, Seacoast transferred securities into held to maturity which had previously been classified as available for sale. The unrealized loss at the date of transfer was reported as a component of shareholders’ equity and is amortized over the remaining life as an adjustment of yield using the interest method.
Seacoast Bank is a member of the Federal Home Loan Bank (“FHLB”) system. Members are required to own a certain amount of FHLB stock based on the level of borrowings and other factors, and may invest in additional amounts. FHLB stock is carried at cost, and periodically evaluated for impairment based on ultimate recovery of par value. Both cash and stock dividends are reported as income.
Loans: Seacoast accounts for a loan depending on the strategy for the loan and on the credit impaired status of the loan upon acquisition. Loans are accounted for using the following categories:
| · | Loans held for sale |
| · | Loans originated by Seacoast and held for investment |
| · | Loans purchased by Seacoast, which are considered purchased unimpaired (“PUL), and held for investment |
| · | Loans purchased by Seacoast, which are considered purchased credit impaired (“PCI”) |
Loans that are held for sale are carried as held for sale based on management’s intent to sell the loans, either as part of a core business strategy or related to a risk mitigation strategy. Loans held for sale and any related unfunded lending commitments are recorded at fair value, if elected, or the lower of cost (which is the carrying amount net of deferred fees and costs and applicable allowance for loan losses and reserve for unfunded lending commitments) or fair market value less costs to sell. Adjustments to reflect unrealized gains and losses resulting from changes in fair value and realized gains and losses upon ultimate sale of the loans are classified as noninterest income in the Consolidated Statements of Income. At the time of the transfer to loans held for sale, if the fair market value is less than cost, the difference is recorded as additional provision for credit losses in the results of operations. Fair market value is determined based on quoted market prices for the same or similar loans, outstanding investor commitments or discounted cash flow analyses using market assumptions.
Fair market value for substantially all the loans in loans held for sale was obtained by reference to prices for the same or similar loans from recent transactions. Fair market value changes occur due to changes in interest rates, the borrower’s credit, the secondary loan market and the market for a borrower’s debt.
Individual loans or pools of loans are transferred from the loan portfolio to loans held for sale when the intent to hold the loans has changed and there is a plan to sell the loans within a reasonable period of time.
Loans that management has the intent and ability to hold for the foreseeable future or until maturity or payoff are considered held for investment. Loans originated by Seacoast and held for investment are recognized at the principal amount outstanding, net of unearned income and amounts charged off. Unearned income includes discounts, premiums and deferred loan origination fees reduced by loan origination costs. Unearned income on loans is amortized to interest income over the life of the related loan using the effective interest rate method. Interest income is recognized on an accrual basis.
As a part of business acquisitions, the Company acquires loans which are recorded at fair value on the acquisition date. Accordingly, the associated allowance for credit losses related to these loans is not carried over at the acquisition date. Any losses after acquisition are recognized through the allowance for loan losses.
These loans fall into two groups: purchased unimpaired loans (“PUL”) and purchased credit-impaired loans (“PCI”). PULs demonstrate no evidence of significant credit deterioration and there is an expectation that all contractual payments will be made. The Company determines fair value by estimating the amount and timing of expected future cash flows and assigning a discount or premium to each loan. The difference between the expected cash flows and the amount paid is recorded as interest income over the remaining life of the loan.
| 113 |
PCI loans demonstrate evidence of credit deterioration since origination and the risk that all contractual payments will not be made. The Company estimates fair value by estimating the amount of loan principal and interest cash flows expected to be collected, incorporating assumptions regarding default rates, loss severities, the amounts and timing of prepayments and other factors that are reflective of current market conditions on a quarterly basis. Probable decreases in expected loan principal cash flows trigger the recognition of impairment, which is then measured as the present value of the expected principal loss plus any related foregone interest cash flows discounted at the loan’s effective interest rate. Impairments that occur after the acquisition date are recognized through the provision for loan losses. Probable and significant increases in expected principal cash flows would first reverse any previously recorded allowance for loan losses; any remaining increases are recognized prospectively as interest income. The impacts of (i) prepayments, (ii) changes in variable interest rates, and (iii) any other changes in the timing of expected cash flows are recognized prospectively as adjustments to interest income. Disposals of loans, which may include sales of loans, receipt of payments in full by the borrower, or foreclosure, result in removal of the loan from the purchased credit impaired portfolio. In contrast, PULs are evaluated using the same procedures as used for the Company’s non-purchased loan portfolio.
Under certain scenarios, the Company will grant modifications to a loan when a borrower is experiencing financial difficulties. Such modifications allow the Company to minimize the risk of loss on the loan and maximize future cash flows received from the borrower. Such modifications are referred to as troubled debt restructured (TDR) loans. TDRs are considered impaired and placed in nonaccrual status. If borrowers perform pursuant to the modified loan terms for at least six months and the remaining loan balances are considered collectible, the loans are returned to accrual status.
The Company reviews all loans for impairment on a periodic basis. A loan is considered to be impaired when based on current information, it is probable the Company will not receive all amounts due in accordance with the contractual terms of a loan agreement. The fair value is measured based on either the present value of expected future cash flows discounted at the loan’s effective interest rate, the loan’s observable market price or the fair value of the collateral if the loan is collateral dependent. When the ultimate collectability of the principal balance of an impaired loan is in doubt, all cash receipts are applied to principal. Once the recorded principal balance has been reduced to zero, future cash receipts are applied to interest income, to the extent any interest has been forgone, and then they are recorded as recoveries of any amounts previously charged off.
The accrual of interest is generally discontinued on loans, except consumer loans, that become 90 days past due as to principal or interest unless collection of both principal and interest is assured by way of collateralization, guarantees or other security. When interest accruals are discontinued, unpaid interest is reversed against interest income. Consumer loans that become 120 days past due are generally charged off. When borrowers demonstrate over an extended period the ability to repay a loan in accordance with the contractual terms of a loan classified as nonaccrual, the loan is returned to accrual status. Interest income on nonaccrual loans is either recorded using the cash basis method of accounting or recognized after the principal has been reduced to zero, depending on the type of loan.
Derivatives: The Company enters into derivative contracts with customers who request such services, and into offsetting contracts with substantially matching terms with third parties to minimize the risks involved with these types of transactions.
Loan Commitments and letters of credit: Loan commitments and letters of credit are an off-balance sheet item and represent commitments to make loans or lines of credit available to borrowers. The face amount of these commitments represents an exposure to loss, before considering customer collateral or ability to repay. Such commitments are recognized as loans when funded.
Fees received for providing loan commitments and letters of credit that may result in loans are typically deferred and amortized to interest income over the life of the related loan, beginning with the initial borrowing. Fees on commitments and letters of credit are amortized to noninterest income as banking fees and commissions on a straight-line basis over the commitment period when funding is not expected.
Fair Value Measurements: The Company measures or monitors many of its assets and liabilities on a fair value basis. Certain assets are measured on a recurring basis, including available for sale securities and loans held for sale. These assets are carried at fair value on the Company’s balance sheets. Additionally, fair value is measured on a non-recurring basis to evaluate assets or liabilities for impairment or for disclosure purposes. Examples include impaired loans, OREO, mortgage servicing rights, goodwill, and long-lived assets.
Fair value is defined as the price that would be received to sell an asset or paid to transfer a liability in an orderly transaction between market participants at the measurement date. Depending on the nature of the asset or liability, the Company uses various valuation techniques and assumptions when estimating fair value.
The Company applies the following fair value hierarchy:
Level 1 – Assets or liabilities for which the identical item is traded on an active exchange, such as publicly-traded instruments or futures contracts.
Level 2 – Assets and liabilities valued based on observable market data for similar instruments.
Level 3 – Assets and liabilities for which significant valuation assumptions are not readily observable in the market; instruments valued based on the best available data, some of which is internally-developed, and considers risk premiums that a market participant would require.
| 114 |
When determining the fair value measurements for assets and liabilities required or permitted to be recorded at and/or marked to fair value, the Company considers the principal market in which it would transact and considers assumptions that market participants would use when pricing the asset or liability. When possible, the Company looks to active and observable markets to price identical assets or liabilities. When identical assets and liabilities are not traded in active markets, the Company looks to market observable data for similar assets and liabilities. Nevertheless, certain assets and liabilities are not actively traded in observable markets and the Company must use alternative valuation techniques to derive a fair value measurement.
Other Real Estate Owned: Other real estate owned (“OREO”) consists primarily of real estate acquired in lieu of unpaid loan balances. These assets are carried at an amount equal to the loan balance prior to foreclosure plus costs incurred for improvements to the property, but no more than the estimated fair value of the property less estimated selling costs. Any valuation adjustments required at the date of transfer are charged to the allowance for loan losses. Subsequently, unrealized losses and realized gains and losses are included in other noninterest expense. Operating results from OREO are recorded in other noninterest expense.
OREO may also include bank premises no longer utilized in the course of our business (closed branches) that are initially recorded at the lower of carrying value or fair value, less costs to sell. If fair value of the premises is less than amortized book value, a write down is recorded through noninterest expense. Costs to operate the facility are expensed.
Bank Premises and Equipment: Bank premises and equipment are stated at cost, less accumulated depreciation and amortization. Premises and equipment include certain costs associated with the acquisition of leasehold improvements. Depreciation and amortization are recognized principally by the straight-line method, over the estimated useful lives as follows: buildings - 25-40 years, leasehold improvements - 5-25 years, furniture and equipment - 3-12 years. Leasehold improvements typically amortize over the shorter of lease terms or estimated useful life. Premises and equipment and other long-term assets are reviewed for impairment when events indicate their carrying amount may not be recoverable from future undiscounted cash flows. If impaired, the assets are written down to fair value with a corresponding impact to noninterest expense.
Intangible assets. The Company’s intangible assets consist goodwill and core deposit intangibles (CDIs). Goodwill results from business combinations and represents the difference between the purchase price and the fair value of net assets acquired. Goodwill may be adjusted for up to one year from the acquisition date in the event new information is obtained which, if known at the date of acquisitions would have impacted the fair value of the acquired assets and liabilities. Goodwill is considered to have an indefinite useful life and is not amortized, but rather tested for impairment annually in the fourth quarter, or more often if circumstances arise that may indicate risk of impairment. If impaired, Goodwill is written down with a corresponding impact to noninterest expense.
The Company recognizes CDIs that result from either whole bank acquisitions or branch acquisitions. They are initially measured at fair value and then amortized over periods ranging from six to eight years on a straight line basis. The Company evaluates CDIs for impairment annually in the fourth quarter, or more often if circumstances arise that may indicate risk of impairment. If impaired, the CDI is written down with a corresponding impact to noninterest expense.
Bank owned life insurance (BOLI): The Company, through its subsidiary bank, has purchased life insurance policies on certain key executives. BOLI is recorded at the amount that can be realized under the insurance contract at the balance sheet date, which is the cash surrender value adjusted for other charges or other amounts due that are probable at settlement.
Revenue Recognition: Revenue is recognized when the earnings process is complete and collectibility is assured. Brokerage fees and commissions are recognized on a trade date basis. Asset management fees, measured by assets at a particular date, are accrued as earned. Commission expenses are recorded when the related revenue is recognized.
Allowance for Loan Losses and Reserve for Unfunded Lending Commitments: The allowance for loan losses is a valuation allowance for probable incurred credit losses. Loan losses are charged against the allowance when the Company believes the uncollectibility of a loan balance is confirmed. Subsequent recoveries, if any, are credited to the allowance.
The allowance for loan losses and reserve for unfunded lending commitments is maintained at a level the Company believes is adequate to absorb probable losses incurred in the loan portfolio and unfunded lending commitments as of the date of the consolidated financial statements. The Company employs a variety of modeling and estimation tools in developing the appropriate allowance for loan losses and reserve for unfunded lending commitments. The allowance for loan losses and reserve for unfunded lending commitments consists of formula-based components for commercial and consumer loans, allowance for impaired commercial loans and allowance related to additional factors that are believed indicative of current trends and business cycle issues.
If necessary, a specific allowance is established for individually evaluated impaired loans. The specific allowance established for these loans is based on a thorough analysis of the most probable source of repayment, including the present value of the loan’s expected future cash flows, the loan’s estimated market value, or the estimated fair value of the underlying collateral depending on the most likely source of repayment. General allowances are established for loans grouped into pools based on similar characteristics. In this process, general allowance factors are based on an analysis of historical charge-off experience, portfolio trends, regional and national economic conditions, and expected loss given default derived from the Company’s internal risk rating process.
| 115 |
The Company monitors qualitative and quantitative trends in the loan portfolio, including changes in the levels of past due, criticized and nonperforming loans. The distribution of the allowance for loan losses and reserve for unfunded lending commitments between the various components does not diminish the fact that the entire allowance for loan losses and reserve for unfunded lending commitments is available to absorb credit losses in the loan portfolio. The principal focus is, therefore, on the adequacy of the total allowance for loan losses and reserve for unfunded lending commitments.
In addition, various regulatory agencies, as an integral part of their examination process, periodically review the Company’s bank subsidiary’s allowance for loan losses and reserve for unfunded lending commitments. These agencies may require such subsidiary to recognize changes to the allowance for loan losses and reserve for unfunded lending commitments based on their judgments about information available to them at the time of their examination.
Income Taxes: The Company uses the asset and liability method of accounting for income taxes. Deferred tax assets and liabilities are determined based on temporary differences between the carrying amounts of assets and liabilities in the consolidated financial statements and their related tax bases and are measured using the enacted tax rates and laws that are in effect. A valuation allowance is recognized for a deferred tax asset if, based on the weight of available evidence, it is more likely than not that some portion or all of the deferred tax asset will not be realized. The effect on deferred tax assets and liabilities of a change in rates is recognized as income or expense in the period in which the change occurs.
On December 22, 2017, the Tax Cuts and Jobs Act (the “Tax Reform Act”) was signed into law. Some of the most significant impacts included a decrease in the highest marginal corporate tax, from 35% to 21%, the repeal of the corporate alternative minimum tax, changes to net operating losses such that they may only be used as a carryforward, with a limit of 80% of taxable income, expansion of bonus depreciation rules, and limitation of the deduction for net business interest expense to 30% of adjusted taxable income. The Company remeasured its deferred tax assets and liabilities to reflect the impact of the Tax Reform Act, resulting in additional income tax expense of $8.6 million in 2017. This amount is subject to additional procedures that may result in adjustments in 2018.
In February 2018, the Financial Accounting Standards Board (“FASB”) issued Accounting Standards Update (“ASU”) 2018-02, which permits companies to reclassify the disproportionate tax effects in accumulated other comprehensive income (“AOCI”), caused by the Tax Reform Act, to retained earnings. The Company early adopted ASU 2018-02 in 2017, and elected to reclassify the income tax effects of the Tax Reform Act, totaling $0.7 million, from AOCI to retained earnings.
Earnings per Share: Basic earnings per share are computed by dividing net income available to common shareholders by the weighted-average number of common shares outstanding during each period. Diluted earnings per share are based on the weighted-average number of common shares outstanding during each period, plus common share equivalents calculated for stock options and performance restricted stock outstanding using the treasury stock method.
Stock-Based Compensation: The stock option plans are accounted for under ASC Topic 718 and the fair value of each option grant is estimated on the date of grant using the Black-Scholes option-pricing model with market assumptions. This amount is amortized on a straight-line basis over the vesting period, generally five years. For restricted stock awards, which generally vest based on continued service with the Company, the deferred compensation is measured as the fair value of the shares on the date of grant, and the deferred compensation is amortized as salaries and employee benefits in accordance with the applicable vesting schedule, generally straight-line over five years. Some shares vest based upon the Company achieving certain performance goals and salary amortization expense is based on an estimate of the most likely results on a straight line basis. Forfeitures are estimated at the date of grant based on historical rates, and updated as necessary.
| 116 |
Note B - Recently Issued Accounting Standards, Not Adopted at December 31, 2017
The following provides a brief description of accounting standards that have been issued but are not yet adopted that could have a material effect on the Company's financial statements:
| ASU 2014-09, Revenue from Contracts with Customers (Topic 606) | |
| Description | In May 2014, the FASB amended existing guidance related to revenue from contracts with customers. This amendment supersedes and replaces nearly all existing revenue recognition guidance, including industry specific guidance, establishes a new control based revenue recognition model, changes the basis for deciding when revenue is recognized over time or at a point in time, provides new and more detailed guidance on specific topics and expands and improves disclosures about revenue. In addition, this amendment specifies the accounting for some costs to obtain or fulfill a contract with a customer. |
| Date of Adoption | This amendment is effective for public business entities for reporting periods beginning after December 15, 2017, including interim periods within that reporting period. Early adoption is permitted only as of annual reporting periods after December 15, 2016, including interim reporting periods within that period. |
| Effect on the Consolidated Financial Statements | The Company has applied the modified retrospective approach in adopting this guidance effective January 1, 2018. Noninterest income items in the scope of the new guidance include service charges on deposits, trust fees, brokerage commissions and fees and interchange income. Adoption had no material impact on the Company’s consolidated financial statements. |
| ASU 2016-01, Financial Instruments – Overall (Subtopic 825-10): Recognition and Measurement of Financial Assets and Financial Liabilities | |
| Description | In January 2016, the FASB amended existing guidance that requires equity investments (except those accounted for under the equity method of accounting, or those that result in consolidation of the investee) to be measured at fair value with changes in the fair value recognized in net income. It requires public business entities to use the exit price notion when measuring the fair value of financial instruments for disclosure purposes. It requires separate presentation of financial assets and liabilities by measurement category and form of financial asset (i.e. securities or loans and receivables). It eliminates the requirement for public business entities to disclose methods and significant assumptions used to estimate fair value that is required to be disclosed for financial instruments measured at amortized cost. |
| Date of Adoption | This amendment is effective for public business entities for reporting periods beginning after December 15, 2017, including interim periods within that reporting period. The new guidance permits early adoption of the own credit provision. |
| Effect on the Consolidated Financial Statements | Adoption of the guidance on January 1, 2018 had no material impact on the Company’s consolidated financial statements. |
| 117 |
| ASU 2016-02, Leases (Topic 842) | |
| Description | In February 2016, the FASB amended existing guidance that requires lessees recognize the following for all leases (with the exception of short-term leases) at the commencement date: 1. A lease liability, which is a lessee’s obligation to make lease payments arising from a lease, measured on a discounted basis. 2. A right-of-use specified asset, which is an asset that represents the lessee’s right to use, or control the use of, a specified asset for the lease term. Under the new guidance, lessor accounting is largely unchanged. Certain targeted improvements were made to align lessor accounting with the lessee accounting model and Topic 606, Revenue from Contracts with Customers. |
| Date of Adoption | This amendment is effective for public business entities for reporting periods beginning after December 15, 2018, including interim periods within that reporting period. Early adoption is permitted. |
| Effect on the Consolidated Financial Statements | The Company is in the process of evaluating the impact of this pronouncement and expects to adopt it effective January 1, 2019. |
| ASU 2016-13, Financial Instruments –Credit Losses (Topic 326) | |
| Description | In June 2016, FASB issued guidance to replace the incurred loss model with an expected loss model, which is referred to as the current expected credit loss (CECL) model. The CECL model is applicable to the measurement of credit losses on financial assets measured at amortized cost, including loan receivables and held to maturity debt securities. It also applies to off-balance sheet credit exposures not accounted for as insurance (i.e. loan commitments, standby letters of credit, financial guarantees and other similar instruments). |
| Date of Adoption | This amendment is effective for public business entities for reporting periods beginning after December 15, 2019, including interim periods within that reporting period. Early adoption is permitted only as of annual reporting periods after December 15, 2018, including interim reporting periods within that period. |
| Effect on the Consolidated Financial Statements | The Company has formed a transition oversight committee which is currently in the process of evaluating both potential CECL models and the technology needs to support the models. The Company expects a one-time cumulative adjustment to the allowance for loan losses beginning in the first period of adoption. However, the size of the impact has not yet been determined. The Company will adopt effective January 1, 2020. |
| ASU 2016-15, Statement of Cash Flows (Topic 320): Classification of Certain Cash Receipts and Cash Payments | |
| Description | In August 2016, the FASB issued this ASU to address the diversity in how certain cash receipts and cash payments are presented and classified in the statement of cash flows, including debt prepayment or debt extinguishment costs, contingent consideration payments made soon after a business combination, proceeds from the settlements of insurance claims, and proceeds from the settlements of BOLI policies.
|
| Date of Adoption | This amendment is effective for public business entities for reporting periods beginning after December 15, 2017, including interim periods within that reporting period. Early adoption is permitted. |
| 118 |
| Effect on the Consolidated Financial Statements | Adoption of the guidance on January 1, 2018 had no material impact on the Company’s consolidated financial statements. |
| ASU 2016-18, Statement of Cash Flows (Topic 230): Restricted Cash | |
| Description | In November 2016, the FASB amended existing guidance to require that a statement of cash flows explain the change during the period in the total of cash, cash equivalents and amounts generally described as restricted cash or restricted cash equivalents. Therefore, amounts generally described as restricted cash and restricted cash equivalents should be included with cash and cash equivalents when reconciling the beginning of period and end of period total amounts shown on the statement of cash flows. |
| Date of Adoption | This amendment is effective for public business entities for reporting periods beginning after December 15, 2017, including interim periods within that reporting period. Early adoption is permitted. |
| Effect on the Consolidated Financial Statements | Adoption of the guidance on January 1, 2018 had no material impact on the Company’s consolidated financial statements. |
| ASU 2017-04, Intangibles – Goodwill and Other (Topic 350): Simplifying the Test for Goodwill | |
| Description | In January 2017, the FASB amended the existing guidance to simplify the goodwill impairment measurement test by eliminating Step 2. The amendment requires the Company to perform the goodwill impairment test by comparing the fair value of a reporting unit with its carrying amount and recognizing an impairment charge for the amount by which the carrying amount exceeds the fair value. Additionally, an entity should consider the tax effects from any tax deductible goodwill on the carrying amount when measuring the impairment loss. |
| Date of Adoption | This amendment is effective for public business entities for reporting periods beginning after December 15, 2019, including interim periods within that reporting period. Early adoption is permitted on annual goodwill impairment tests performed after January 1, 2017. |
| Effect on the Consolidated Financial Statements | The impact to the consolidated financial statements from the adoption of this pronouncement is not expected to be material. |
| ASU 2017-01, Business Combinations(Topic 805): Clarifying the Definition of a Business | |
| Description |
In January 2017, the FASB amended existing guidance to clarify the definition of a business with the objective of adding guidance to assist entities with evaluating whether transactions should be accounted for as acquisitions of assets or businesses. The amendments provide a screen to determine when a set of assets and activities (collectively referred to as a “set”) is not a business. The screen requires that when substantially all of the fair value of the group assets acquired is concentrated in a single identifiable asset or a group of similar identifiable assets, the set is not a business.
If the screen is not met, the amendments (1) require that to be considered a business, a set must include, at a minimum, an input and a substantive process that together significantly contribute to the ability to create output and (2) remove the evaluation of whether a market participant could replace missing elements. |
| Date of adoption | The amendments are effective for public business entities for annual periods beginning after December 15, 2017, including interim periods with those periods. |
| Effect on the Consolidated Financial Statements | Adoption of the guidance on January 1, 2018 had no material impact on the Company’s consolidated financial statements. |
119
| ASU 2017-08, Receivables-Nonrefundable Fees and Other Costs (Subtopic 310-20): Premium Amortization on Purchased callable Debt Securities | |
| Description | In March 2017, the FASB issued guidance which requires entities to amortize premiums on certain purchased callable debt securities to their earliest call date. The accounting for purchased callable debt securities held at a discount did not change. Amortizing the premium to the earliest call date generally aligns interest income recognition with the economics of instruments. This guidance requires a modified retrospective approach under which a cumulative adjustment will be made to retained earnings as of the beginning of the period in which it is adopted. |
| Date of adoption | The amendments are effective for public business entities for annual periods beginning after December 15, 2017, including interim periods with those periods. |
| Effect on the Consolidated Financial Statements | Adoption of the guidance on January 1, 2018 had no material impact on the Company’s consolidated financial statements. |
| ASU 2017-09, Compensation-Stock Compensation (Topic 718):Scope of Modification Accounting | |
| Description | In May 2017, the FASB provided clarification that changes to the terms of share-based awards, such as value, vesting condition or classification of the awards, should be accounting for as modifications. All disclosures about modifications that are currently required would need to be made, along with disclosure of any change (or no change) in compensation expense. |
| Date of adoption | The amendments are effective for public business entities for annual periods beginning after December 15, 2017, including interim periods with those periods. |
| Effect on the Consolidated Financial Statements | Adoption of the guidance on January 1, 2018 had no material impact on the Company’s consolidated financial statements. |
| ASU 2017-12, Derivatives and Hedging (Topic 815): Targeted Improvements to Accounting for Hedging Activities | |
| Description |
In August 2017, the FASB provided guidance to improve the financial reporting of hedging relationships to better portray the economic results of an entity’s risk management activities in its financial statements. The amendments also simplify the application of the hedge accounting guidance.
|
| Date of adoption | The amendments are effective for public business entities for annual periods beginning after December 15, 2018, including interim periods with those periods. |
| Effect on the Consolidated Financial Statements | The impact to the consolidated financial statements from the adoption of this pronouncement is not expected to be material. |
120
Note C - Cash, Dividend and Loan Restrictions
In the normal course of business, the Company and Seacoast Bank enter into agreements, or are subject to regulatory agreements that result in cash, debt and dividend restrictions. A summary of the most restrictive items follows:
Seacoast Bank may be required to maintain average reserve balances with the Federal Reserve Bank; the average amount of those reserve balances was $0.5 million for 2017 and no reserve balances were necessary for 2016.
Under Federal Reserve regulation, Seacoast Bank is limited as to the amount it may loan to its affiliates, including the Company, unless such loans are collateralized by specified obligations. At December 31, 2017, the maximum amount available for transfer from Seacoast Bank to the Company in the form of loans approximated $69.9 million, if the Company has sufficient acceptable collateral. There were no loans made to affiliates during the periods ending December 31, 2017, 2016 and 2015.
The approval of the Office of the Comptroller of the Currency (“OCC”) is required if the total of all dividends declared by a national bank in any calendar year exceeds the bank's profits, as defined, for that year combined with its retained net profits for the preceding two calendar years. Under this restriction Seacoast Bank can distribute dividends of approximately $87.7 million to the Company as of December 31, 2017, without prior approval of the OCC.
121
Note D - Securities
The amortized cost and fair value of securities available for sale and held to maturity at December 31, 2017 and December 31, 2016 are summarized as follows:
| December 31, 2017 | ||||||||||||||||
| Gross | Gross | |||||||||||||||
| Amortized | Unrealized | Unrealized | Fair | |||||||||||||
| Cost | Gains | Losses | Value | |||||||||||||
| (In thousands) | ||||||||||||||||
| SECURITIES AVAILABLE FOR SALE | ||||||||||||||||
| U.S. Treasury securities and obligations of U.S. Government Sponsored Entities | $ | 9,475 | $ | 274 | $ | (5 | ) | $ | 9,744 | |||||||
| Mortgage-backed securities of U.S. Government Sponsored Entities | 318,771 | 891 | (3,306 | ) | 316,356 | |||||||||||
| Collateralized mortgage obligations of U.S. Government Sponsored Entities | 235,466 | 272 | (4,694 | ) | 231,044 | |||||||||||
| Commercial mortgage backed securities of U.S. Government Sponsored Entities | 16,210 | 165 | (34 | ) | 16,341 | |||||||||||
| Private mortgage backed securities | 18,056 | 384 | 0 | 18,440 | ||||||||||||
| Private collateralized mortgage obligations | 47,045 | 605 | (285 | ) | 47,365 | |||||||||||
| Collateralized loan obligations | 263,579 | 798 | (68 | ) | 264,309 | |||||||||||
| Obligations of state and political subdivisions | 45,118 | 813 | (70 | ) | 45,861 | |||||||||||
| Corporate and other debt securities | 6,500 | 0 | (156 | ) | 6,344 | |||||||||||
| $ | 960,220 | $ | 4,202 | $ | (8,618 | ) | $ | 955,804 | ||||||||
| SECURITIES HELD TO MATURITY | ||||||||||||||||
| Mortgage-backed securities of U.S. Government Sponsored Entities | $ | 172,261 | $ | 746 | $ | (1,392 | ) | $ | 171,615 | |||||||
| Collateralized mortgage obligations of U.S. Government Sponsored Entities | 181,280 | 56 | (2,767 | ) | 178,569 | |||||||||||
| Commercial mortgage backed securities of U.S. Government Sponsored Entities | 17,462 | 705 | 0 | 18,167 | ||||||||||||
| Collateralized loan obligations | 40,523 | 303 | 0 | 40,826 | ||||||||||||
| Private mortgage backed securities | 5,337 | 9 | (53 | ) | 5,293 | |||||||||||
| $ | 416,863 | $ | 1,819 | $ | (4,212 | ) | $ | 414,470 | ||||||||
| December 31, 2016 | ||||||||||||||||
| Gross | Gross | |||||||||||||||
| Amortized | Unrealized | Unrealized | Fair | |||||||||||||
| Cost | Gains | Losses | Value | |||||||||||||
| (In thousands) | ||||||||||||||||
| SECURITIES AVAILABLE FOR SALE | ||||||||||||||||
| U.S. Treasury securities and obligations of U.S. Government Sponsored Entities | $ | 12,073 | $ | 255 | $ | 0 | $ | 12,328 | ||||||||
| Mortgage-backed securities of U.S. Government Sponsored Entities | 287,726 | 585 | (4,823 | ) | 283,488 | |||||||||||
| Collateralized mortgage obligations of U.S. Government Sponsored Entities | 238,805 | 314 | (5,065 | ) | 234,054 | |||||||||||
| Commercial mortgage backed securities of U.S. Government Sponsored Entities | 22,351 | 222 | (28 | ) | 22,545 | |||||||||||
| Private mortgage backed securities | 32,780 | 0 | (791 | ) | 31,989 | |||||||||||
| Private collateralized mortgage obligations | 67,542 | 563 | (816 | ) | 67,289 | |||||||||||
| Collateralized loan obligations | 124,716 | 838 | (665 | ) | 124,889 | |||||||||||
| Obligations of state and political subdivisions | 63,161 | 622 | (895 | ) | 62,888 | |||||||||||
| Corporate and other debt securities | 74,121 | 257 | (517 | ) | 73,861 | |||||||||||
| Private commercial mortgage backed securities | 37,534 | 111 | (473 | ) | 37,172 | |||||||||||
| $ | 960,809 | $ | 3,767 | $ | (14,073 | ) | $ | 950,503 | ||||||||
| SECURITIES HELD TO MATURITY | ||||||||||||||||
| Mortgage-backed securities of U.S. Government Sponsored Entities | $ | 159,941 | $ | 704 | $ | (1,243 | ) | $ | 159,402 | |||||||
| Collateralized mortgage obligations of U.S. Government Sponsored Entities | 147,208 | 386 | (2,630 | ) | 144,964 | |||||||||||
| Commercial mortgage backed securities of U.S. Government Sponsored Entities | 17,375 | 233 | (74 | ) | 17,534 | |||||||||||
| Collateralized loan obligations | 41,547 | 430 | (314 | ) | 41,663 | |||||||||||
| Private mortgage backed securities | 6,427 | 0 | (109 | ) | 6,318 | |||||||||||
| $ | 372,498 | $ | 1,753 | $ | (4,370 | ) | $ | 369,881 | ||||||||
Proceeds from sales of securities during 2017 were $235.6 million, with gross gains at $1.6 million and gross losses at $1.5 million. Proceeds from sales of securities during 2016 were $40.1 million with gross gains of $0.5 million and gross losses of $0.1 million. Proceeds from sales of securities during 2015 were $60.3 million with gross gains of $0.7 million and gross losses of $0.5 million.
Securities at December 31, 2017 with a fair value of $169.0 million were pledged as collateral for United States Treasury deposits, other public deposits and trust deposits. Securities with fair value of $216.1 million were pledged as collateral for repurchase agreements.
The amortized cost and fair value of securities at December 31, 2017, by contractual maturity, are shown below. Expected maturities will differ from contractual maturities because borrowers may have the right to call or repay obligations with or without call or prepayment penalties.
122
| Held to Maturity | Available for Sale | |||||||||||||||
| Amortized | Fair | Amortized | Fair | |||||||||||||
| Cost | Value | Cost | Value | |||||||||||||
| (In thousands) | ||||||||||||||||
| Due in less than one year | $ | 0 | $ | 0 | $ | 6,248 | $ | 6,473 | ||||||||
| Due after one year through five years | 3,600 | 3,607 | 42,448 | 42,616 | ||||||||||||
| Due after five years through ten years | 36,923 | 37,219 | 256,306 | 257,449 | ||||||||||||
| Due after ten years | 0 | 0 | 13,170 | 13,376 | ||||||||||||
| 40,523 | 40,826 | 318,172 | 319,914 | |||||||||||||
| Mortgage-backed securities of U.S. Government Sponsored Entities | 172,261 | 171,616 | 318,771 | 316,356 | ||||||||||||
| Collateralized mortgage obligations of U.S. Government Sponsored Entities | 181,279 | 178,567 | 235,466 | 231,044 | ||||||||||||
| Commercial mortgage backed securities of U.S. Government Sponsored Entities | 17,463 | 18,168 | 16,210 | 16,341 | ||||||||||||
| Private mortgage-backed securities | 0 | 0 | 18,056 | 18,440 | ||||||||||||
| Private collateralized mortgage obligations | 5,337 | 5,293 | 47,045 | 47,365 | ||||||||||||
| Corporate and other debt securities | 0 | 0 | 6,500 | 6,344 | ||||||||||||
| $ | 416,863 | $ | 414,470 | $ | 960,220 | $ | 955,804 | |||||||||
The estimated fair value of a security is determined based on market quotations when available or, if not available, by using quoted market prices for similar securities, pricing models or discounted cash flows analyses, using observable market data where available. The tables below indicate the amount of securities with unrealized losses and period of time for which these losses were outstanding at December 31, 2017 and December 31, 2016, respectively.
| December 31, 2017 | ||||||||||||||||||||||||
| Less than 12 months | 12 months or longer | Total | ||||||||||||||||||||||
| Fair | Unrealized | Fair | Unrealized | Fair | Unrealized | |||||||||||||||||||
| Value | Losses | Value | Losses | Value | Losses | |||||||||||||||||||
| (In thousands) | ||||||||||||||||||||||||
| U.S. Treasury securities and obligations of U.S. Government Sponsored Entities | $ | 1,107 | $ | (5 | ) | $ | 0 | $ | 0 | $ | 1,107 | $ | (5 | ) | ||||||||||
| Mortgage-backed securities of U.S. Government Sponsored Entities | 123,195 | (515 | ) | 213,590 | (4,183 | ) | 336,785 | (4,698 | ) | |||||||||||||||
| Collateralized mortgage obligations of U.S. Government Sponsored Entities | 176,452 | (1,507 | ) | 199,086 | (5,955 | ) | 375,538 | (7,462 | ) | |||||||||||||||
| Commercial mortgage backed securities of U.S. Government Sponsored Entities | 5,076 | (25 | ) | 1,049 | (9 | ) | 6,125 | (34 | ) | |||||||||||||||
| Private mortgage backed securities | 0 | 0 | 0 | 0 | 0 | 0 | ||||||||||||||||||
| Private collateralized mortgage obligations | 0 | 0 | 20,744 | (338 | ) | 20,744 | (338 | ) | ||||||||||||||||
| Collateralized loan obligations | 14,933 | (68 | ) | 0 | 0 | 14,933 | (68 | ) | ||||||||||||||||
| Obligations of state and political subdivisions | 5,414 | (14 | ) | 5,864 | (56 | ) | 11,278 | (70 | ) | |||||||||||||||
| Corporate and other debt securities | 6,500 | (156 | ) | 0 | 0 | 6,500 | (156 | ) | ||||||||||||||||
| Total temporarily impaired securities | $ | 332,677 | $ | (2,290 | ) | $ | 440,333 | $ | (10,541 | ) | $ | 773,010 | $ | (12,831 | ) | |||||||||
| December 31, 2016 | ||||||||||||||||||||||||
| Less than 12 months | 12 months or longer | Total | ||||||||||||||||||||||
| Fair | Unrealized | Fair | Unrealized | Fair | Unrealized | |||||||||||||||||||
| Value | Losses | Value | Losses | Value | Losses | |||||||||||||||||||
| (In thousands) | ||||||||||||||||||||||||
| Mortgage-backed securities of U.S. Government Sponsored Entities | $ | 327,759 | $ | (5,991 | ) | $ | 5,387 | $ | (75 | ) | $ | 333,146 | $ | (6,066 | ) | |||||||||
| Collateralized mortgage obligations of U.S. Government Sponsored Entities | 234,175 | (5,599 | ) | 58,912 | (2,096 | ) | 293,087 | (7,695 | ) | |||||||||||||||
| Commercial mortgage backed securities of U.S. Government Sponsored Entities | 7,934 | (102 | ) | 0 | 0 | 7,934 | (102 | ) | ||||||||||||||||
| Private mortgage backed securities | 0 | 0 | 36,848 | (900 | ) | 36,848 | (900 | ) | ||||||||||||||||
| Private collateralized mortgage obligations | 1,460 | 0 | 38,417 | (816 | ) | 39,877 | (816 | ) | ||||||||||||||||
| Collateralized loan obligations | 8,152 | (41 | ) | 51,694 | (938 | ) | 59,846 | (979 | ) | |||||||||||||||
| Obligations of state and political subdivisions | 39,321 | (895 | ) | 0 | 0 | 39,321 | (895 | ) | ||||||||||||||||
| Corporate and other debt securities | 33,008 | (517 | ) | 0 | 0 | 33,008 | (517 | ) | ||||||||||||||||
| Private commercial mortgage backed securities | 12,667 | (306 | ) | 7,139 | (167 | ) | 19,806 | (473 | ) | |||||||||||||||
| Total temporarily impaired securities | $ | 664,476 | $ | (13,451 | ) | $ | 198,397 | $ | (4,992 | ) | $ | 862,873 | $ | (18,443 | ) | |||||||||
The two tables above include securities held to maturity that were transferred from available for sale into held to maturity. In 2014, approximately $158.8 million of available for sale securities were transferred into held to maturity. The unrealized losses at the date of transfer were $3.1 million. These unrealized losses remained in other accumulated comprehensive income and are amortized over the remaining life of the securities as an adjustment to yield consistent with the amortization of a discount. The amortization of unrealized losses reported in equity offsets the effect of discount amortization reported in interest income. As of December 31, 2017 the remaining unamortized amount was $1.2 million. The fair value of those securities in an unrealized loss position for less than 12 months at December 31, 2017 and December 31, 2016 is $22.9 million and $22.8 million respectively. The unrealized losses on those securities in an unrealized loss position for less than 12 months at December 31, 2017 and December 31, 2016 is $0.2 million and $0.4 million, respectively. The fair value of those securities in an unrealized loss position for 12 months or more at December 31, 2017 and December 31, 2016 is $15.3 million and none, respectively. The unrealized losses on those securities in an unrealized loss position for 12 months or more at December 31, 2017 and December 31, 2016 is $0.4 million and none, respectively.
At December 31, 2017, the Company had $12.2 million of unrealized losses on mortgage backed securities of government sponsored entities having a fair value of $718.4 million that were attributable to a combination of factors, including relative changes in interest rates since the time of purchase. The contractual cash flows for these securities are guaranteed by U.S. government agencies and U.S. government-sponsored enterprises. Based on the assessment of these mitigating factors, management believes that the unrealized losses on these debt security holdings are a function of changes in investment spreads and interest movements and not changes in credit quality. Management expects to recover the entire amortized cost basis of these securities.
At December 31, 2017, approximately $0.3 million of the unrealized losses pertain to private label securities secured by seasoned residential collateral with a fair value of $20.8 million. Management attributes the loss to a combination of factors including relative changes in interest rates since the time of purchase. The collateral underlying these mortgage investments are 30- and 15-year fixed and 10/1 adjustable rate mortgage loans with low loan to values, and improving subordination. Based on its assessment of these factors and bi-annual stress testing, management believes that the unrealized losses on these debt security holdings are a function of changes in investment spreads and interest rate movements and not changes in credit quality. Management expects to recover the entire amortized cost basis of these securities.
As of December 31, 2017 the Company does not intend to sell securities that are in an unrealized loss position and it is not more likely than not that the Company will be required to sell these securities before recovery of the amortized cost basis. Therefore, management does not consider any investment to be other-than-temporarily impaired at December 31, 2017.
Included in other assets is $32.5 million of Federal Home Loan Bank and Federal Reserve Bank stock stated at par value. At December 31, 2017, the Company has not identified events or changes in circumstances which may have a significant adverse effect on the fair value of these cost method investment securities.
The Company acquired 200,000 shares of Visa Class B stock in March 2017 at a cost of $6.2 million. The shares were sold in December 2017 at a gain of $15.2 million. Proceeds from the sale were not received until January 2018.
The Company also holds 11,330 shares of Visa Class B stock, which following resolution of Visa litigation will be converted to Visa Class A shares (the conversion rate presently is 1.6483 shares of Class A stock for each share of Class B stock) for a total of 18,675 shares of Visa Class A stock. Our ownership is related to prior ownership in Visa's network, while Visa operated as a cooperative. This ownership is recorded on our financial records at zero basis.
123
Note E - Loans
Seacoast accounts for a loan depending on the strategy for the loan and on the credit impaired status of the loan upon acquisition. Loans are accounted for using the following categories:
| · | Loans and leases held for sale |
| · | Loans and leases originated by Seacoast and held for investment |
| · | Loans and leases purchased by Seacoast, which are considered purchased unimpaired (“PUL”), and held for investment |
| · | Loans and leases purchased by Seacoast, which are considered purchased credit impaired (“PCI”) |
Refer to Note A for further discussion on how the categories above are defined.
Loans are also categorized based on the customer and use type of the credit extended. The following outlines the categories used:
| · | Construction and Land Development Loans The Company defines construction and land development loans as exposures secured by land development and construction (including 1-4 family residential construction), multi-family property, and non-farm nonresidential property where the primary or significant source of repayment is from rental income associated with that property (that is, loans for which 50 percent or more of the source of repayment comes from third party, non-affiliated rental income) or the proceeds of the sale, refinancing, or permanent financing of the property. |
| · | Commercial Real Estate Loans Commercial real estate loans are subject to underwriting standards and processes similar to commercial and industrial loans. These loans are viewed primarily as cash flow loans and the repayment of these loans is largely dependent on the successful operation of the property. Loan performance may be adversely affected by factors impacting the general economy or conditions specific to the real estate market such as geographic location and/or property type. |
| · | Residential Real Estate Loans The Company selectively adds residential mortgage loans to its portfolio, primarily loans with adjustable rates, home equity mortgages and home equity lines. Substantially all residential originations have been underwritten to conventional loan agency standards, including loans having balances that exceed agency value limitations. |
| · | Commercial and Financial Loans Commercial credit is extended primarily to small to medium sized professional firms, retail and wholesale operators and light industrial and manufacturing concerns. Such credits typically comprise working capital loans, loans for physical asset expansion, asset acquisition and other business loans. Loans to closely held businesses will generally be guaranteed in full or for a meaningful amount by the businesses’ major owners. Commercial loans are made based primarily on the historical and projected cash flow of the borrower and secondarily on the underlying collateral provided by the borrower. The cash flows of borrowers, however, may not behave as forecasted and collateral securing loans may fluctuate in value due to economic or individual performance factors. Minimum standards and underwriting guidelines have been established for all commercial loan types. |
124
| · | Consumer Loans The Company originates consumer loans including installment loans, loans for automobiles, boats, and other personal, family and household purposes. For each loan type several factors including debt to income, type of collateral and loan to collateral value, credit history and Company relationship with the borrower is considered during the underwriting process. |
The following table outlines net loans balances by category as of:
| December 31, 2017 | ||||||||||||||||
| Portfolio Loans | PCI Loans | PULs | Total | |||||||||||||
| (In thousands) | ||||||||||||||||
| Construction and land development | $ | 215,315 | $ | 1,121 | $ | 126,689 | $ | 343,125 | ||||||||
| Commercial real estate | 1,170,618 | 9,776 | 459,598 | 1,639,992 | ||||||||||||
| Residential real estate | 845,420 | 5,626 | 187,764 | 1,038,810 | ||||||||||||
| Commercial and financial (2) | 512,430 | 894 | 92,690 | 606,014 | ||||||||||||
| Consumer | 178,826 | 0 | 10,610 | 189,436 | ||||||||||||
| NET LOAN BALANCES (1) | $ | 2,922,609 | $ | 17,417 | $ | 877,351 | $ | 3,817,377 | ||||||||
| December 31, 2016 | ||||||||||||||||
| Portfolio Loans | PCI Loans | PULs | Total | |||||||||||||
| (In thousands) | ||||||||||||||||
| Construction and land development | $ | 137,480 | $ | 114 | $ | 22,522 | $ | 160,116 | ||||||||
| Commercial real estate | 1,041,915 | 11,257 | 304,420 | 1,357,592 | ||||||||||||
| Residential real estate | 784,290 | 684 | 51,813 | 836,787 | ||||||||||||
| Commercial and financial (2) | 308,731 | 941 | 60,917 | 370,589 | ||||||||||||
| Consumer | 153,434 | 0 | 1,018 | 154,452 | ||||||||||||
| NET LOAN BALANCES (1) | $ | 2,425,850 | $ | 12,996 | $ | 440,690 | $ | 2,879,536 | ||||||||
| (1) | Net loan balances at December 31, 2017 and 2016 include deferred costs of $11.5 million and $10.6 million, respectively. |
| (2) | Commercial and financial includes equipment lease financing of $30.3 million and $0 as of December 31, 2017 and 2016, respectively. |
125
Loan accrual status is a primary qualitative credit factor monitored by the Company’s Credit Risk Management when determining the allowance for loan and lease losses. As a loan remains delinquent, the likelihood increases that a borrower is either unable or unwilling to repay. Loans are moved to nonaccrual status when they become 90 days past due, have been evaluated for impairment and have been deemed impaired. The following table presents the balances outstanding status by class of loans as of:
| Accruing | ||||||||||||||||||||||||
| Accruing | Accruing | Greater | Total | |||||||||||||||||||||
| 30-59 Days | 60-89 Days | Than | Financing | |||||||||||||||||||||
| December 31, 2017 (in thousands) | Current | Past Due | Past Due | 90 Days | Nonaccrual | Receivables | ||||||||||||||||||
| Portfolio Loans | ||||||||||||||||||||||||
| Construction and land development | $ | 215,077 | $ | 0 | $ | 0 | $ | 0 | $ | 238 | $ | 215,315 | ||||||||||||
| Commercial real estate | 1,165,738 | 2,605 | 585 | 0 | 1,690 | 1,170,618 | ||||||||||||||||||
| Residential real estate | 836,117 | 812 | 75 | 0 | 8,416 | 845,420 | ||||||||||||||||||
| Commercial and financial | 507,501 | 2,776 | 26 | 0 | 2,127 | 512,430 | ||||||||||||||||||
| Consumer | 178,676 | 52 | 0 | 0 | 98 | 178,826 | ||||||||||||||||||
| Total Portfolio Loans | 2,903,109 | 6,245 | 686 | 0 | 12,569 | 2,922,609 | ||||||||||||||||||
| Purchased Unimpaired Loans | ||||||||||||||||||||||||
| Construction and land development | 126,655 | 34 | 0 | 0 | 0 | 126,689 | ||||||||||||||||||
| Commercial real estate | 457,899 | 979 | 0 | 0 | 720 | 459,598 | ||||||||||||||||||
| Residential real estate | 186,549 | 128 | 87 | 0 | 1,000 | 187,764 | ||||||||||||||||||
| Commercial and financial | 92,315 | 54 | 0 | 0 | 321 | 92,690 | ||||||||||||||||||
| Consumer | 10,610 | 0 | 0 | 0 | 0 | 10,610 | ||||||||||||||||||
| Total Purchased Unimpaired Loans | 874,028 | 1,195 | 87 | 0 | 2,041 | 877,351 | ||||||||||||||||||
| Purchased Credit Impaired Loans | ||||||||||||||||||||||||
| Construction and land development | 1,121 | 0 | 0 | 0 | 0 | 1,121 | ||||||||||||||||||
| Commercial real estate | 9,352 | 0 | 0 | 0 | 424 | 9,776 | ||||||||||||||||||
| Residential real estate | 544 | 642 | 0 | 0 | 4,440 | 5,626 | ||||||||||||||||||
| Commercial and financial | 844 | 0 | 0 | 0 | 50 | 894 | ||||||||||||||||||
| Consumer | 0 | 0 | 0 | 0 | 0 | 0 | ||||||||||||||||||
| Total Purchased Credit Impaired Loans | 11,861 | 642 | 0 | 0 | 4,914 | 17,417 | ||||||||||||||||||
| Total Loans | $ | 3,788,998 | $ | 8,082 | $ | 773 | $ | 0 | $ | 19,524 | $ | 3,817,377 | ||||||||||||
126
| Accruing | ||||||||||||||||||||||||
| Accruing | Accruing | Greater | Total | |||||||||||||||||||||
| 30-59 Days | 60-89 Days | Than | Financing | |||||||||||||||||||||
| December 31, 2016 (in thousands) | Current | Past Due | Past Due | 90 Days | Nonaccrual | Receivables | ||||||||||||||||||
| Portfolio Loans | ||||||||||||||||||||||||
| Construction and land development | $ | 137,042 | $ | 0 | $ | 0 | $ | 0 | $ | 438 | $ | 137,480 | ||||||||||||
| Commercial real estate | 1,039,882 | 78 | 171 | 0 | 1,784 | 1,041,915 | ||||||||||||||||||
| Residential real estate | 773,877 | 1,570 | 261 | 0 | 8,582 | 784,290 | ||||||||||||||||||
| Commercial and financial | 308,652 | 30 | 0 | 0 | 49 | 308,731 | ||||||||||||||||||
| Consumer | 153,176 | 29 | 59 | 0 | 170 | 153,434 | ||||||||||||||||||
| Total Portfolio Loans | 2,412,629 | 1,707 | 491 | 0 | 11,023 | 2,425,850 | ||||||||||||||||||
| Purchased Unimpaired Loans | ||||||||||||||||||||||||
| Construction and land development | 22,490 | 0 | 0 | 0 | 32 | 22,522 | ||||||||||||||||||
| Commercial real estate | 302,318 | 345 | 485 | 0 | 1,272 | 304,420 | ||||||||||||||||||
| Residential real estate | 50,398 | 153 | 0 | 0 | 1,262 | 51,813 | ||||||||||||||||||
| Commercial and financial | 60,353 | 39 | 328 | 0 | 197 | 60,917 | ||||||||||||||||||
| Consumer | 981 | 37 | 0 | 0 | 0 | 1,018 | ||||||||||||||||||
| Total Purchased Unimpaired Loans | 436,540 | 574 | 813 | 0 | 2,763 | 440,690 | ||||||||||||||||||
| Purchased Credit Impaired Loans | ||||||||||||||||||||||||
| Construction and land development | 114 | 0 | 0 | 0 | 0 | 114 | ||||||||||||||||||
| Commercial real estate | 6,972 | 0 | 0 | 0 | 4,285 | 11,257 | ||||||||||||||||||
| Residential real estate | 499 | 0 | 185 | 0 | 0 | 684 | ||||||||||||||||||
| Commercial and financial | 941 | 0 | 0 | 0 | 0 | 941 | ||||||||||||||||||
| Consumer | 0 | 0 | 0 | 0 | 0 | 0 | ||||||||||||||||||
| Total Purchased Credit Impaired Loans | 8,526 | 0 | 185 | 0 | 4,285 | 12,996 | ||||||||||||||||||
| Total Loans | $ | 2,857,695 | $ | 2,281 | $ | 1,489 | $ | 0 | $ | 18,071 | $ | 2,879,536 | ||||||||||||
The reduction in interest income associated with loans on nonaccrual status was approximately $0.7 million, $0.7 million, and $0.6 million, for the years ended December 31, 2017, 2016, and 2015, respectively.
The Company’s Credit Risk Management also utilizes an internal asset classification system as a means of identifying problem and potential problem loans. The following classifications are used to categorize loans under the internal classification system:
| · | Pass: Loans that are not problems or potential problem loans are considered to be pass-rated. |
| · | Special Mention: Loans that do not currently expose the Company to sufficient risk to warrant classification in the Substandard or Doubtful categories, but possess weaknesses that deserve management’s close attention are deemed to be Special Mention. |
| · | Substandard: Loans with the distinct possibility that the Company will sustain some loss if the deficiencies are not corrected. |
| · | Doubtful: Loans that have all the weaknesses inherent in those classified Substandard with the added characteristic that the weaknesses present make collection or liquidation in full, on the basis of currently existing facts, conditions and values, highly questionable and improbable. The principal balance of loans classified as doubtful is generally charged off. |
127
Risk grades are recalculated at least annually by the loan relationship manager. The following tables present the risk category of loans by class of loans based on the most recent analysis performed as of:
| December 31, 2017 | ||||||||||||||||||||
| Special | ||||||||||||||||||||
| Pass | Mention | Substandard | Doubtful | Total | ||||||||||||||||
| (In thousands) | ||||||||||||||||||||
| Construction and land development | $ | 328,127 | $ | 10,414 | $ | 4,584 | $ | 0 | $ | 343,125 | ||||||||||
| Commercial real estate | 1,586,932 | 29,273 | 23,787 | 0 | 1,639,992 | |||||||||||||||
| Residential real estate | 1,023,925 | 4,621 | 10,203 | 61 | 1,038,810 | |||||||||||||||
| Commercial and financial | 593,689 | 3,237 | 8,838 | 250 | 606,014 | |||||||||||||||
| Consumer | 189,354 | 0 | 82 | 0 | 189,436 | |||||||||||||||
| Total Loans | $ | 3,722,027 | $ | 47,545 | $ | 47,494 | $ | 311 | $ | 3,817,377 | ||||||||||
| December 31, 2016 | ||||||||||||||||||||
| Pass | Special Mention | Substandard | Doubtful | Total | ||||||||||||||||
| (In thousands) | ||||||||||||||||||||
| Construction and land development | $ | 148,607 | $ | 5,037 | $ | 6,472 | $ | 0 | $ | 160,116 | ||||||||||
| Commercial real estate | 1,324,685 | 17,184 | 15,724 | 0 | 1,357,593 | |||||||||||||||
| Residential real estate | 811,934 | 1,780 | 23,073 | 0 | 836,787 | |||||||||||||||
| Commercial and financial | 364,241 | 3,949 | 2,399 | 0 | 370,589 | |||||||||||||||
| Consumer | 153,774 | 67 | 611 | 0 | 154,452 | |||||||||||||||
| Total loans | $ | 2,803,241 | $ | 28,017 | $ | 48,279 | $ | 0 | $ | 2,879,536 | ||||||||||
Loans to directors and executive officers totaled $1.1 million and $2.1 million at December 31, 2017 and 2016, respectively. No new loans were originated to directors or officers in 2017.
At December 31, 2017 and 2016 loans pledged as collateral for borrowings totaled $211 million and $415 million, respectively.
128
Concentrations of Credit
The Company’s lending activity primarily occurs within the State of Florida, including Orlando, Tampa and Southeast coastal counties from Brevard County in the north to Palm Beach County in the south, as well as the counties surrounding Lake Okeechobee in the center of the state.
PCI Loans
PCI loans are accounted for pursuant to ASC Topic 310-30. The excess of cash flows expected to be collected over the estimated fair value is referred to as the accretable yield and is recognized in interest income over the remaining life of the loan in situations where there is a reasonable expectation about the timing and amount of cash flows expected to be collected. The difference between the contractually required payments and the cash flows expected to be collected at acquisition, considering the impact of prepayments, is referred to as the nonaccretable difference.
The table below summarizes the changes in accretable yield on PCI loans for the years ended:
| December 31, | ||||||||||||
| 2017 | 2016 | 2015 | ||||||||||
| (In thousands) | ||||||||||||
| Beginning balance | $ | 3,807 | $ | 2,610 | $ | 1,192 | ||||||
| Additions | 763 | 2,052 | 702 | |||||||||
| Deletions | (11 | ) | (15 | ) | (357 | ) | ||||||
| Accretion | (1,647 | ) | (1,734 | ) | (601 | ) | ||||||
| Reclassifications from non-accretable difference | 787 | 894 | 1,674 | |||||||||
| Ending Balance | $ | 3,699 | $ | 3,807 | $ | 2,610 | ||||||
See Note S for information related to loans purchased during the periods presented.
Troubled Debt Restructured Loans
The Company pursues troubled debt restructures (TDR) for loans in selected cases where it expects to realize better values than may be expected through traditional collection activities. The Company has worked with retail mortgage customers, when possible, to achieve lower payment structures in an effort to avoid foreclosure. TDRs have been a part of the Company’s loss mitigation activities and can include rate reductions, payment extensions and principal deferrals. Company policy requires TDRs that are classified as nonaccrual loans after restructuring remain on nonaccrual until performance can be verified, which usually requires six months of performance under the restructured loan terms.
129
The Company’s TDR concessions granted generally do not include forgiveness of principal balances. Loan modifications are not reported in the calendar years after modification if the loans were modified at an interest rate equal to yields of originations with comparable risk and loans are performing based on the terms of the restructuring agreements. When a loan is modified as a TDR, there is not a direct, material impact on the carrying value of the loans within the consolidated balance sheet, as principal balances generally are not forgiven. Most loans prior to modification were classified as an impaired loan and the allowance for loan losses is determined in accordance with Company policy.
The following table presents accruing loans that were modified within the twelve months ending:
| Number of Contracts | Pre- Modification Outstanding Recorded Investment | Post-Modification Outstanding Recorded Investment | Valuation Allowance Recorded | |||||||||||||
| (In thousands) | ||||||||||||||||
| December 31, 2017: | ||||||||||||||||
| Construction and Land Development | 1 | $ | 52 | $ | 46 | $ | 6 | |||||||||
| Residential Real Estate | 1 | 15 | 15 | 0 | ||||||||||||
| Total | 2 | $ | 67 | $ | 61 | $ | 6 | |||||||||
| December 31, 2016: | ||||||||||||||||
| Construction and Land Development | 1 | $ | 20 | $ | 18 | $ | 2 | |||||||||
| Residential Real Estate | 4 | 1,169 | 1,019 | 150 | ||||||||||||
| Total | 5 | $ | 1,189 | $ | 1,037 | $ | 152 | |||||||||
During the years 2017, 2016 and 2015, there were no payment defaults on loans that had been modified to a TDR within the previous twelve months. The Company considers a loan to have defaulted when it becomes 90 days or more delinquent under the modified terms, has been transferred to nonaccrual status or has been transferred to other real estate owned. A defaulted TDR is generally placed on nonaccrual status and a specific allowance for loan losses assigned in accordance with the Company’s policy.
Impaired Loans
Loans are considered impaired if they are 90 days or more past due, in nonaccrual status, or are TDRs. At December 31, 2017 and 2016, the Company’s recorded investment in impaired loans, excluding PCI loans, and related valuation allowance was as follows:
130
| December 31, 2017 | ||||||||||||
| Unpaid | Related | |||||||||||
| Recorded | Principal | Valuation | ||||||||||
| (In thousands) | Investment | Balance | Allowance | |||||||||
| Impaired Loans with No Related Allowance Recorded: | ||||||||||||
| Construction and land development | $ | 223 | $ | 510 | $ | 0 | ||||||
| Commercial real estate | 3,475 | 4,873 | 0 | |||||||||
| Residential real estate | 10,272 | 15,063 | 0 | |||||||||
| Commercial and financial | 19 | 29 | 0 | |||||||||
| Consumer | 105 | 180 | 0 | |||||||||
| Impaired Loans with an Allowance Recorded: | ||||||||||||
| Construction and land development | 251 | 264 | 23 | |||||||||
| Commercial real estate | 4,780 | 4,780 | 195 | |||||||||
| Residential real estate | 8,448 | 8,651 | 1,091 | |||||||||
| Commercial and financial | 2,436 | 883 | 1,050 | |||||||||
| Consumer | 282 | 286 | 43 | |||||||||
| Total Impaired Loans | ||||||||||||
| Construction and land development | 474 | 774 | 23 | |||||||||
| Commercial real estate | 8,255 | 9,653 | 195 | |||||||||
| Residential real estate | 18,720 | 23,714 | 1,091 | |||||||||
| Commercial and financial | 2,455 | 912 | 1,050 | |||||||||
| Consumer | 387 | 466 | 43 | |||||||||
| Total | $ | 30,291 | $ | 35,519 | $ | 2,402 | ||||||
| December 31, 2016 | ||||||||||||
| Unpaid | Related | |||||||||||
| Recorded | Principal | Valuation | ||||||||||
| (In thousands) | Investment | Balance | Allowance | |||||||||
| Impaired Loans with No Related Allowance Recorded: | ||||||||||||
| Construction and land development | $ | 226 | $ | 321 | $ | 0 | ||||||
| Commercial real estate | 3,267 | 4,813 | 0 | |||||||||
| Residential real estate | 9,706 | 14,136 | 0 | |||||||||
| Commercial and financial | 199 | 206 | 0 | |||||||||
| Consumer | 0 | 0 | 0 | |||||||||
| Impaired Loans with an Allowance Recorded: | ||||||||||||
| Construction and land development | 51 | 51 | 0 | |||||||||
| Commercial real estate | 6,937 | 6,949 | 395 | |||||||||
| Residential real estate | 12,332 | 12,681 | 2,059 | |||||||||
| Commercial and financial | 0 | 0 | 0 | |||||||||
| Consumer | 0 | 0 | 0 | |||||||||
| Total Impaired Loans | ||||||||||||
| Construction and land development | 277 | 372 | 0 | |||||||||
| Commercial real estate | 10,204 | 11,762 | 395 | |||||||||
| Residential real estate | 22,038 | 26,817 | 2,059 | |||||||||
| Commercial and financial | 199 | 206 | 0 | |||||||||
| Consumer | 0 | 0 | 0 | |||||||||
| Total | $ | 32,718 | $ | 39,157 | $ | 2,454 | ||||||
Impaired loans also include TDRs where concessions have been granted to borrowers who have experienced financial difficulty. At December 31, 2017 and 2016, accruing TDRs totaled $15.6 million and $17.7 million, respectively.
Average impaired loans for the years ended December 31, 2017, 2016, and 2015 were $30.9 million, $31.2 million, and $38.5 million, respectively. The impaired loans were measured for impairment based on the value of underlying collateral or the present value of expected future cash flows discounted at the loan’s effective interest rate. The valuation allowance is included in the allowance for loan losses.
131
Interest payments received on impaired loans are recorded as interest income unless collection of the remaining recorded investment is doubtful at which time payments received are recorded as reductions in principal. For the years ended December 31, 2017, 2016 and 2015, the Company recorded $1.5 million, $1.6 million, and $0.9 million, respectively, in interest income on impaired loans.
For impaired loans whose impairment is measured based on the present value of future cash flows, a total of $0.3 million, $0.2 million and $0.2 million, respectively, for 2017, 2016, and 2015 was included in interest income and represents the change in present value attributable to the passage of time.
132
Note F - Allowance for Loan Losses
Activity in the allowance for loans losses for the three years ended December 31, 2017, 2016 and 2015 is summarized as follows:
| Beginning Balance | Provision for Loan Losses | Charge- Offs | Recoveries | TDR Allowance Adjustments | Ending Balance | |||||||||||||||||||
| (In thousands) | ||||||||||||||||||||||||
| December 31 , 2017 | ||||||||||||||||||||||||
| Construction and land development | $ | 1,219 | $ | (471 | ) | $ | 0 | $ | 896 | $ | (2 | ) | $ | 1,642 | ||||||||||
| Commercial real estate | 9,273 | (264 | ) | (407 | ) | 747 | (64 | ) | 9,285 | |||||||||||||||
| Residential real estate | 7,483 | 125 | (569 | ) | 336 | (244 | ) | 7,131 | ||||||||||||||||
| Commercial and financial | 3,636 | 5,304 | (1,869 | ) | 226 | 0 | 7,297 | |||||||||||||||||
| Consumer | 1,789 | 954 | (1,257 | ) | 290 | (9 | ) | 1,767 | ||||||||||||||||
| Total | $ | 23,400 | $ | 5,648 | $ | (4,102 | ) | $ | 2,495 | $ | (319 | ) | $ | 27,122 | ||||||||||
| December 31 , 2016 | ||||||||||||||||||||||||
| Construction and land development | $ | 1,151 | $ | (150 | ) | $ | 0 | $ | 226 | $ | (8 | ) | $ | 1,219 | ||||||||||
| Commercial real estate | 6,756 | 2,599 | (256 | ) | 306 | (132 | ) | 9,273 | ||||||||||||||||
| Residential real estate | 8,057 | (1,069 | ) | (205 | ) | 786 | (86 | ) | 7,483 | |||||||||||||||
| Commercial and financial | 2,042 | 224 | (439 | ) | 1,809 | 0 | 3,636 | |||||||||||||||||
| Consumer | 1,122 | 807 | (244 | ) | 109 | (5 | ) | 1,789 | ||||||||||||||||
| Total | $ | 19,128 | $ | 2,411 | $ | (1,144 | ) | $ | 3,236 | $ | (231 | ) | $ | 23,400 | ||||||||||
| December 31 , 2015 | ||||||||||||||||||||||||
| Construction and land development | $ | 722 | $ | 1,296 | $ | (1,271 | ) | $ | 404 | $ | 43 | $ | 1,151 | |||||||||||
| Commercial real estate | 4,528 | 2,010 | (263 | ) | 700 | (69 | ) | 6,756 | ||||||||||||||||
| Residential real estate | 9,784 | (2,208 | ) | (779 | ) | 1,260 | (150 | ) | 8,057 | |||||||||||||||
| Commercial and financial | 1,179 | 1,058 | (726 | ) | 531 | (6 | ) | 2,042 | ||||||||||||||||
| Consumer | 794 | 552 | (341 | ) | 117 | (36 | ) | 1,122 | ||||||||||||||||
| Total | $ | 17,007 | $ | 2,708 | $ | (3,380 | ) | $ | 3,012 | $ | (218 | ) | $ | 19,128 | ||||||||||
133
As discussed in Note A, "Significant Accounting Policies," the allowance for loan losses is composed of specific allowances for certain impaired loans and general allowances grouped into loan pools based on similar characteristics. The Company's loan portfolio (excluding PCI loans) and related allowance at December 31, 2017 and 2016 is shown in the following tables.
| Individually Evaluated
for Impairment | Collectively Evaluated
for Impairment | Total | ||||||||||||||||||||||
| Recorded Investment | Associated Allowance | Recorded Investment | Associated Allowance | Recorded Investment | Associated Allowance | |||||||||||||||||||
| (In thousands) | ||||||||||||||||||||||||
| December 31, 2017 | ||||||||||||||||||||||||
| Construction and land development | $ | 474 | $ | 23 | $ | 341,530 | $ | 1,619 | $ | 342,004 | $ | 1,642 | ||||||||||||
| Commercial real estate | 8,255 | 195 | 1,621,960 | 9,090 | 1,630,215 | 9,285 | ||||||||||||||||||
| Residential real estate | 18,720 | 1,091 | 1,014,465 | 6,040 | 1,033,185 | 7,131 | ||||||||||||||||||
| Commercial and financial | 2,455 | 1,050 | 602,666 | 6,247 | 605,121 | 7,297 | ||||||||||||||||||
| Consumer | 387 | 43 | 189,049 | 1,724 | 189,436 | 1,767 | ||||||||||||||||||
| Total | $ | 30,291 | $ | 2,402 | $ | 3,769,670 | $ | 24,720 | $ | 3,799,961 | $ | 27,122 | ||||||||||||
| Individually Evaluated for | Collectively Evaluated for | |||||||||||||||||||||||
| Impairment | Impairment | Total | ||||||||||||||||||||||
| Recorded Investment | Associated Allowance | Recorded Investment | Associated Allowance | Recorded Investment | Associated Allowance | |||||||||||||||||||
| (In thousands) | ||||||||||||||||||||||||
| December 31, 2016 | ||||||||||||||||||||||||
| Construction and land development | $ | 277 | $ | 0 | $ | 159,839 | $ | 1,219 | $ | 160,116 | $ | 1,219 | ||||||||||||
| Commercial real estate | 10,204 | 395 | 1,324,276 | 8,878 | 1,334,480 | 9,273 | ||||||||||||||||||
| Residential real estate | 22,038 | 2,059 | 813,751 | 5,424 | 835,789 | 7,483 | ||||||||||||||||||
| Commercial and financial | 199 | 0 | 368,508 | 3,636 | 368,707 | 3,636 | ||||||||||||||||||
| Consumer | 0 | 0 | 154,452 | 1,789 | 154,452 | 1,789 | ||||||||||||||||||
| Total | $ | 32,718 | $ | 2,454 | $ | 2,820,826 | $ | 20,946 | $ | 2,853,544 | $ | 23,400 | ||||||||||||
Loans collectively evaluated for impairment reported at December 31, 2017 included acquired loans that are not PCI loans. At December 31, 2017, the remaining fair value adjustments for loans acquired was $17.5 million, or 2.00% of the outstanding aggregate PUL balances. At December 31, 2016, the remaining fair value adjustments for loans acquired was $13.7 million, or 3.11% of the outstanding aggregate PUL balances.
These amounts, which represent the remaining fair value discount of each PUL, are accreted into interest income over the remaining lives of the related loans on a level yield basis. Recapture for loan losses of $0.4 million and net recoveries of $1.0 million were recorded for these loans during 2017. No provision for loan losses was recorded related to these loans during 2016. Provisioning for loan losses of $1.3 million and net charge-offs of $1.2 million were recorded for these loans during 2015.
The table below summarizes PCI loans that were individually evaluated for impairment based on expected cash flows at December 31, 2017 and 2016.
| December 31, 2017 | December 31, 2016 | |||||||||||||||
| PCI Loans Individually
Evaluated for Impairment | PCI Loans Individually
Evaluated for Impairment | |||||||||||||||
| Recorded Investment | Associated Allowance | Recorded Investment | Associated Allowance | |||||||||||||
| (In thousands) | ||||||||||||||||
| Construction and land development | $ | 1,121 | $ | 0 | $ | 114 | $ | 0 | ||||||||
| Commercial real estate | 9,776 | 0 | 11,257 | 0 | ||||||||||||
| Residential real estate | 5,626 | 0 | 684 | 0 | ||||||||||||
| Commercial and financial | 894 | 0 | 941 | 0 | ||||||||||||
| Consumer | 0 | 0 | 0 | 0 | ||||||||||||
| Total | $ | 17,417 | $ | 0 | $ | 12,996 | $ | 0 | ||||||||
134
Note G - Bank Premises and Equipment
Bank premises and equipment as of:
| Accumulated | Net | |||||||||||
| Depreciation & | Carrying | |||||||||||
| Cost | Amortization | Value | ||||||||||
| (In thousands) | ||||||||||||
| December 31, 2017 | ||||||||||||
| Premises (including land of $18,269) | $ | 78,255 | $ | (24,045 | ) | $ | 54,210 | |||||
| Furniture and equipment | 34,532 | (21,859 | ) | 12,673 | ||||||||
| Total | $ | 112,787 | $ | (45,904 | ) | $ | 66,883 | |||||
| December 31, 2016 | ||||||||||||
| Premises (including land of $14,773) | $ | 71,562 | $ | (22,969 | ) | $ | 48,593 | |||||
| Furniture and equipment | 30,281 | (20,190 | ) | 10,091 | ||||||||
| Total | $ | 101,843 | $ | (43,159 | ) | $ | 58,684 | |||||
135
Note H - Goodwill and Acquired Intangible Assets
The following table presents changes in the carrying amount of goodwill:
| For the Year Ended December 31, | ||||||||||||
| 2017 | 2016 | 2015 | ||||||||||
| (In thousands) | ||||||||||||
| Beginning of year | $ | 64,649 | $ | 25,211 | $ | 25,309 | ||||||
| Changes from business combinations | 82,929 | 39,438 | 0 | |||||||||
| Other | 0 | 0 | (98 | ) | ||||||||
| Total Goodwill | $ | 147,578 | $ | 64,649 | $ | 25,211 | ||||||
In accordance with ASC 350-20-35, the Company performs an analysis of goodwill impairment on an annual basis. Based on the analysis performed in the fourth quarter, the Company has concluded goodwill was not impaired as of December 31, 2017 and 2016.
Acquired intangible assets consist of core deposit intangibles ("CDI"), which are intangible assets arising from the purchase of deposits separately or from bank acquisitions. The change in balance for CDI is as follows:
| For the Year Ended December 31, | ||||||||||||
| 2017 | 2016 | 2015 | ||||||||||
| (In thousands) | ||||||||||||
| Beginning of year | $ | 14,572 | $ | 8,594 | $ | 7,454 | ||||||
| Acquired CDI | 7,726 | 8,464 | 2,564 | |||||||||
| Amortization expense | (3,361 | ) | (2,486 | ) | (1,424 | ) | ||||||
| End of year | $ | 18,937 | $ | 14,572 | $ | 8,594 | ||||||
| (In months) | ||||||||||||
| Remaining Average Amortization Period for CDI | 63 | 64 | 67 | |||||||||
The gross carrying amount and accumulated amortization of the Company's CDI subject to amortization as of:
| December 31, 2017 | December 31, 2016 | |||||||||||||||
| Gross | Gross | |||||||||||||||
| Carrying | Accumulated | Carrying | Accumulated | |||||||||||||
| Amount | Amortization | Amount | Amortization | |||||||||||||
| (In thousands) | ||||||||||||||||
| Deposit base | $ | 26,522 | $ | (7,585 | ) | $ | 18,796 | $ | (4,224 | ) | ||||||
The annual amortization expense for the Company's CDI determined using the straight line method for each of the five years subsequent to December 31, 2017 is $4 million, $4 million, $3.9 million, $2.7 million and $2.2 million, respectively.
Mortgage servicing rights ("MSRs") retained from the sale of Small Business Administration ("SBA") guarantees totaled $0.2 million at December 31, 2017.
136
Note I - Borrowings
A significant portion of the Company's short-term borrowings were comprised of unsecured federal funds purchased and securities sold under agreements to repurchase with maturities primarily from overnight to seven days:
| For the Year Ended December 31, | ||||||||||||
| 2017 | 2016 | 2015 | ||||||||||
| (In thousands) | ||||||||||||
| Maximum amount outstanding at any month end | $ | 216,094 | $ | 236,099 | $ | 192,786 | ||||||
| Weighted average interest rate at end of year | 0.71 | % | 0.31 | % | 0.28 | % | ||||||
| Average amount outstanding | $ | 171,686 | $ | 187,560 | $ | 168,188 | ||||||
| Weighted average interest rate during the year | 0.46 | % | 0.26 | % | 0.20 | % | ||||||
Securities sold under agreements to repurchase are accounted for as secured borrowings. For securities sold under agreements to repurchase, the Company would be obligated to provide additional collateral in the event of a significant decline in fair value of collateral pledged. Company securities pledged were as follows by collateral type and maturity as of:
| December 31, | ||||||||||||
| 2017 | 2016 | 2015 | ||||||||||
| (In thousands) | ||||||||||||
| Fair-Value of Pledge Securities – overnight and continuous | ||||||||||||
| Mortgage-backed securities and collateralized mortgage obligations of U.S. Government Sponsored Entities | $ | 216,094 | $ | 204,202 | $ | 172,005 | ||||||
Seacoast Bank had secured lines of credit of $1.3 billion at December 31, 2017, of which $211 million was outstanding from the Federal Home Loan Bank ("FHLB") at the end of 2017, with $207 million maturing within 30 days or less, and the remainder maturing by April 2019. The weighted average interest rate on the balance at end of year 2017 was 1.39% and during the year averaged 0.99% for all of 2017. The Company acquired FHLB advances of $2.0 million and $14.0 million, respectively, from NorthStar and Palm Beach Community Bank on October 20, 2017 and November 3, 2017. Of the $16.0 million acquired, as of December 31, 2017, $7.0 million remained outstanding with a weighted average interest rate of 1.12%.
On April 7, 2016, Seacoast Bank incurred an early redemption cost of $1.8 million related to prepayment of $50.0 million of FHLB advances. The $50.0 million of FHLB borrowings was comprised of two advances of $25.0 million each borrowed on September 15, 2007 and November 27, 2007, respectively, and had fixed rates of 3.64% and 2.70%, respectively, payable quarterly.
The Company issued $20.6 million in junior subordinated debentures on March 31, 2005 and December 16, 2005, for an aggregate of $41.2 million. These debentures were issued in conjunction with the formation of a Delaware and Connecticut trust subsidiary, SBCF Capital Trust I, and SBCF Statutory Trust II ("Trusts I and II"), respectively, which each completed a private sale of $20.0 million of floating rate preferred securities. On June 29, 2007, the Company issued an additional $12.4 million in junior subordinated debentures which was issued in conjunction with the formation of a Delaware trust subsidiary, SBCF Statutory Trust III ("Trust III"), which completed a private sale of $12.0 million of floating rate trust preferred securities. The rates on the trust preferred securities are the 3-month LIBOR rate plus 175 basis points, the 3-month LIBOR rate plus 133 basis points, and the 3-month LIBOR rate plus 135 basis points, respectively. The rates as of December 31, 2017 are 3.09%, 2.92%, and 2.94%, respectively. The trust preferred securities have original maturities of thirty years, and may be redeemed without penalty, upon approval of the Federal Reserve or upon occurrence of certain events affecting their tax or regulatory capital treatment. Distributions on the trust preferred securities are payable quarterly in March, June, September, and December of each year. The Trusts also issued $619 million, $619 million and $372 million, respectively, of common equity securities to the Company. The proceeds of the offering of trust preferred securities and common equity securities were used by Trusts I and II to purchase the $41.2 million junior subordinated deferrable interest notes issued by the Company, and by Trust III to purchase the $12.4 million junior subordinated deferrable interest notes issued by the Company, all of which have terms substantially similar to the trust preferred securities.
137
As part of the October 1, 2014 BANKshares acquisition the Company acquired three junior subordinated debentures. Correspondingly, at December 31, 2015, the Company had $5.2 million and $4.1 million of Floating Rate Junior Subordinated Deferrable Interest Debentures outstanding which are due December 26, 2032 and March 17, 2034, and callable by the Company, at its option, any time after December 26, 2007 and March 17, 2009. The rates on these trust preferred securities are the 3-month LIBOR rate plus 325 basis points and the 3-month LIBOR rate plus 279 basis points, respectively. The rates as of December 31, 2017 are 4.58% and 4.39%, respectively, per annum. At December 31, 2015, the Company also had $5.2 million outstanding of Junior Subordinated Debentures due February 23, 2036. The coupon rate floats quarterly at the three month LIBOR rate plus 139 basis points. The junior subordinated debenture is redeemable in certain circumstances. The interest rate was 2.84% at December 31, 2017. The above three junior subordinated debentures in accordance with ASU 805 Business Combinations have been recorded at their acquisition date fair values which collectively is $3.5 million lower than face value and will be amortized into interest expense over the remaining term to maturity.
As part of the July 17, 2015 Grand Bank acquisition the Company acquired one junior subordinated debenture. Correspondingly, at December 31, 2016 the Company has $7.2 million of Floating Rate Junior Subordinated Deferrable Interest Debenture outstanding which is due December 30, 2034. The interest rate is the 3-month LIBOR rate plus 198 basis points. The rate, which adjusts every three months is currently 3.67%, per annum. The junior subordinated debentures in accordance with ASU 805 Business Combinations have been recorded at the acquisition date fair values which is $2.1 million lower than face value and will be amortized into interest expense over the remaining term to maturity.
The Company has the right to defer payments of interest on the notes at any time or from time to time, in the event that under certain circumstances there is an event of default under the notes or the Company has elected to defer interest on the notes, the Company may not, with certain exceptions, declare or pay any dividends or distributions on its capital stock or purchase or acquire any of its capital stock. As of December 31, 2017, 2016 and 2015, all interest payments on trust preferred securities were current.
The Company has entered into agreements to guarantee the payments of distributions on the trust preferred securities and payments of redemption of the trust preferred securities. Under these agreements, the Company also agrees, on a subordinated basis, to pay expenses and liabilities of the Trusts other than those arising under the trust preferred securities. The obligations of the Company under the junior subordinated notes, the trust agreement establishing the Trusts, the guarantees and agreements as to expenses and liabilities, in aggregate, constitute a full and conditional guarantee by the Company of the Trusts' obligations under the trust preferred securities.
138
Note J - Employee Benefits and Stock Compensation
The Company’s defined contribution plan covers substantially all employees after one year of service and includes a matching benefit for employees who can elect to defer a portion of their compensation. In addition, amounts of compensation contributed by employees are matched on a percentage basis under the plan. The defined contribution plan contributions charged to operations were $1.9 million in 2017, $1.7 million in 2016, and $1.5 million in 2015.
The Company, through its Compensation and Governance Committee of the Board of Directors (the “Compensation Committee”), offers equity compensation to employees and non-employee directors of Seacoast and Seacoast Bank in the form of various share-based awards, including stock options, restricted stock awards (“RSAs”), or restricted stock units (“RSUs”). The awards may vest over time, have certain performance based criteria, or both.
Stock options are granted with an exercise price at least equal to the market price of the Company’s stock at the date of grant. The fair value of options granted is estimated on the date of grant using the Black-Scholes option-pricing model. Compensation cost is amortized on a straight-line basis over the vesting period. Vesting is determined by the Compensation Committee at the time of grant, generally over five years. The options have a maximum term of ten years.
The fair value of RSAs and RSUs are estimated based on the price of the Company’s common stock on the date of grant. Compensation cost is measured straight-line for RSAs and ratably for RSUs over the vesting period of the awards and reversed for awards which are forfeited due to unfulfilled service or performance criteria. To the extent the Company has treasury shares available, stock options exercised or stock grants awarded may be issued from treasury shares. If treasury shares are insufficient, the Company can issue new shares.
Vesting of share-based awards is immediately accelerated on death or disability of the recipient. The Compensation Committee may, at its discretion, accelerate vesting upon retirement (including a voluntary termination of employment at age 55) for those employees with five or more years of service with the Company, or upon the event of a change-in-control.
Awards are currently granted under the Seacoast 2013 Incentive Plan (“2013 Plan”), which shareholders approved on May 23, 2013 and amended on August 26, 2015 to increase the number of authorized shares for issuance thereunder to 3,000,000. The 2013 Plan expires on May 26, 2025. Approximately 591,000 shares remain available for issuance as of December 31, 2017.
The impact of share-based compensation on the Company’s financial results is presented below:
| For the Year Ended December 31, | ||||||||||||
| (In thousands) | 2017 | 2016 | 2015 | |||||||||
| Share-based compensation expense | $ | 5,267 | $ | 4,154 | 2,859 | |||||||
| Income tax benefit | (1,966 | ) | (1,602 | ) | (963 | ) | ||||||
139
The total unrecognized compensation cost and the weighted-average period over which unrecognized compensation cost is expected to be recognized related to non-vested share-based compensation arrangements at December 31, 2017 is presented below:
| (In thousands) | Unrecognized Compensation Cost | Weighted- Average Period Remaining (Years) | ||||||
| Restricted stock awards | $ | 2,383 | 1.7 | |||||
| Restricted stock units | 3,403 | 1.7 | ||||||
| Stock options | 1,374 | 2.4 | ||||||
| Total | $ | 7,160 | 1.8 | |||||
Restricted Stock Awards
RSAs were granted in 2017 to various employees and vest over time, generally three years. Compensation cost of RSAs is based on the market value of the Company’s common stock at the date of grant and is recognized over the required service period on a straight-line basis. The Company’s accounting policy is to recognize forfeitures as they occur.
A summary of the status of the Company’s non-vested RSUs as of December 31, 2017, and changes during the year then ended, is presented below:
| (In thousands, except share and per share data) | Restricted Award Shares | Weighted- Average Grant- Date Fair Value | ||||||
| Non-vested at January 1, 2017 | 206,952 | $ | 14.72 | |||||
| Granted | 114,331 | 24.08 | ||||||
| Forfeited/Cancelled | (8,733 | ) | 20.76 | |||||
| Vested | (99,574 | ) | 14.13 | |||||
| Non-vested at December 31, 2017 | 212,976 | 19.77 | ||||||
Information regarding restricted stock awards during each of the following years:
| (In thousands, except share and per share data) | Year Ended December 31, | |||||||||||
| 2017 | 2016 | 2015 | ||||||||||
| Shares granted | 114,331 | 164,599 | 123,806 | |||||||||
| Weighted-average grant date fair value | $ | 24.08 | $ | 16.03 | $ | 15.03 | ||||||
| Fair value of awards vested(1) | $ | 1,407 | $ | 1,981 | $ | 836 | ||||||
| (1) Based on grant date fair value | ||||||||||||
Restricted Stock Units
Certain RSUs granted in 2017 allow the grantee to earn 0%-200% of the target award based on either the Company’s adjusted earnings per share growth or its adjusted return on average tangible equity. In 2016, RSUs allowed the grantee to earn 0%-175% of the target award as determined by two criteria, the Company’s adjusted net income and its adjusted return on tangible equity. Both measure performance through December 31, 2019. If the Company does not achieve the target performance goal for either or both of the criteria being tracked, then the RSUs will not vest and will be forfeited.
140
A summary of the status of the Company’s non-vested RSUs as of December 31, 2017, and changes during the year then ended, is presented below:
| (In thousands, except share and per share data) | Restricted Award Shares | Weighted- Average Grant- Date Fair Value | ||||||
| Non-vested at January 1, 2017 | 322,692 | $ | 12.61 | |||||
| Granted | 164,268 | 21.61 | ||||||
| Forfeited/Cancelled | (22,113 | ) | 13.79 | |||||
| Vested | (88,880 | ) | 10.54 | |||||
| Non-vested at December 31, 2017 | 375,967 | 16.96 | ||||||
Information regarding restricted stock units during the following years:
| (In thousands, except share and per share data) | For the Year Ended December 31, | |||||||||||
| 2017 | 2016 | 2015 | ||||||||||
| Shares granted | 164,268 | 136,188 | 127,128 | |||||||||
| Weighted-average grant date fair value | $ | 23.94 | $ | 13.53 | $ | 12.63 | ||||||
| Fair value of awards vested(1) | $ | 937 | $ | 846 | $ | - | ||||||
| (1) Based on grant date fair value | ||||||||||||
Stock Options
The Company estimated the fair value of each option grant on the date of grant using the Black-Scholes options-pricing model with the following weighted-average assumptions:
| For the Year Ended December 31, | ||||||||||||
| 2017 | 2016 | 2015 | ||||||||||
| Risk-free interest rates | 1.85 | % | 1.63 | % | 1.65 | % | ||||||
| Expected dividend yield | 0 | % | 0 | % | 0 | % | ||||||
| Expected volatility | 25.4 | % | 21.9 | % | 15.5 | % | ||||||
| Expected lives (years) | 5.0 | 5.0 | 5.0 | |||||||||
141
A summary of the Company’s stock options as of December 31, 2017, and changes during the year then ended, are presented below:
| Options | Weighted- Average Exercise Price | Weighted- Average Remaining Contractual Term (Years) | Aggregate Intrinsic Value (000s) | |||||||||||||
| Outstanding at January 1, 2017 | 778,778 | $ | 15.86 | |||||||||||||
| Granted | 297,576 | 28.21 | ||||||||||||||
| Exercised | (91,468 | ) | 11.77 | |||||||||||||
| Forfeited | (33,537 | ) | 96.17 | |||||||||||||
| Outstanding at December 31, 2017 | 951,349 | 17.29 | 6.86 | $ | 8,493 | |||||||||||
| Exercisable at December 31, 2017 | 517,100 | 12.09 | 5.85 | 6,787 | ||||||||||||
Information related to stock options during each of the following years:
| (In thousands, except share and per share data) | For the Year Ended December 31, | |||||||||||
| 2017 | 2016 | 2015 | ||||||||||
| Options granted | 297,576 | 243,391 | 63,650 | |||||||||
| Weighted-average grant date fair value | $ | 4.66 | $ | 3.41 | $ | 2.21 | ||||||
| Intrinsic value of stock options exercised | 1,143 | 80 | - | |||||||||
The following table summarizes information related to stock options as of December 31, 2017:
| Range of Exercise Prices | Options Outstanding | Remaining Contractual Life (Years) | Shares Exercisable | Weighted Average Exercise Price | ||||||||||||
| $10.54 to $10.78 | 330,000 | 5.8 | 330,000 | $ | 10.67 | |||||||||||
| $10.97 to $15.99 | 323,773 | 5.8 | 163,538 | 13.42 | ||||||||||||
| $22.65 to $28.69 | 297,576 | 9.2 | 23,562 | 22.65 | ||||||||||||
| Total | 951,349 | 6.9 | 517,100 | $ | 12.09 | |||||||||||
Employee Stock Purchase Plan
The Employee Stock Purchase Plan (“ESPP”), as amended, was approved by shareholders on April 25, 1989, and additional shares were authorized for issuance by shareholders on June 18, 2009 and May 2, 2013. Under the ESPP, the Company is authorized to issue up to 300,000 common shares of the Company’s common stock to eligible employees of the Company. These shares may be purchased by employees at a price equal to 95% of the fair market value of the shares on the purchase date. Purchases under the ESPP are made monthly. Employee contributions to the ESPP are made through payroll deductions.
| 2017 | 2016 | 2015 | ||||||||||
| ESPP shares purchased | 12,434 | 10,483 | 9,083 | |||||||||
| Weighted-average employee purchase price | $ | 22.67 | $ | 16.02 | $ | 13.99 | ||||||
142
Note K - Lease Commitments
The Company is obligated under various noncancellable operating leases for equipment, buildings, and land. Minimum rent payments under operating leases are recognized on a straight-line basis over the term of the lease. At December 31, 2017, future minimum lease payments under leases with initial or remaining terms in excess of one year are as follows:
| (In thousands) | ||||
| 2018 | $ | 6,303 | ||
| 2019 | 5,935 | |||
| 2020 | 5,324 | |||
| 2021 | 4,003 | |||
| 2022 | 3,275 | |||
| Thereafter | 15,885 | |||
| $ | 40,725 | |||
Rent expense charged to operations was $5.8 million for 2017, $5.3 million for 2016 and $4.1 million for 2015. Certain leases contain provisions for renewal and change with the consumer price index.
143
Note L - Income Taxes
The provision for income taxes is as follows:
| For the Year Ended December 31 | ||||||||||||
| 2017 | 2016 | 2015 | ||||||||||
| (In thousands) | ||||||||||||
| Current | ||||||||||||
| Federal | $ | 667 | $ | 653 | $ | 578 | ||||||
| State | 2 | 30 | 61 | |||||||||
| Deferred | ||||||||||||
| Federal | 32,791 | 12,163 | 10,818 | |||||||||
| State | 2,876 | 2,043 | 2,070 | |||||||||
| $ | 36,336 | $ | 14,889 | $ | 13,527 | |||||||
The difference between the total expected tax benefit (computed by applying the U.S. Federal tax rate of 35% to pretax income in 2017, 2016 and 2015) and the reported income tax provision relating to income before income taxes is as follows:
| For the Year Ended December 31 | ||||||||||||
| 2017 | 2016 | 2015 | ||||||||||
| (In thousands) | ||||||||||||
| Tax rate applied to income before income taxes | $ | 27,720 | $ | 15,431 | $ | 12,484 | ||||||
| Increase (decrease) resulting from the effects of: | ||||||||||||
| Tax law change | 8,552 | 0 | 0 | |||||||||
| Nondeductible acquisition costs | 657 | 217 | 441 | |||||||||
| Tax exempt interest on loans, obligations of states and political subdivisions and bank owned life insurance | (1,445 | ) | (1,215 | ) | (761 | ) | ||||||
| State income taxes | (1,007 | ) | (726 | ) | (746 | ) | ||||||
| Nontaxable bargain purchase gain | 0 | 0 | (146 | ) | ||||||||
| Tax credit investments | (165 | ) | (55 | ) | 0 | |||||||
| Stock compensation | (1,027 | ) | (731 | ) | 127 | |||||||
| Other | 173 | (105 | ) | (3 | ) | |||||||
| Federal tax provision | 33,458 | 12,816 | 11,396 | |||||||||
| State tax provision | 2,878 | 2,073 | 2,131 | |||||||||
| Total income tax provision | $ | 36,336 | $ | 14,889 | $ | 13,527 | ||||||
The net deferred tax assets (liabilities) are comprised of the following as of:
| December 31, | ||||||||
| 2017 | 2016 | |||||||
| (In thousands) | ||||||||
| Allowance for loan losses | $ | 7,187 | $ | 9,477 | ||||
| Premises and equipment | 1,390 | 2,334 | ||||||
| Other real estate owned | 207 | 841 | ||||||
| Accrued stock compensation | 1,569 | 1,561 | ||||||
| Federal tax loss carryforward | 4,755 | 28,089 | ||||||
| State tax loss carryforward | 5,578 | 6,123 | ||||||
| Alternative minimum tax credit carryforward | 2,209 | 4,261 | ||||||
| Net unrealized securities losses | 1,429 | 4,616 | ||||||
| Deferred compensation | 2,125 | 3,279 | ||||||
| Accrued interest and fee income | 2,411 | 3,267 | ||||||
| Other | 2,248 | 3,748 | ||||||
| Gross deferred tax assets | 31,108 | 67,596 | ||||||
| Less: Valuation allowance | 0 | 0 | ||||||
| Deferred tax assets net of valuation allowance | 31,108 | 67,596 | ||||||
| Core deposit base intangible | (3,964 | ) | (3,953 | ) | ||||
| Other | (1,727 | ) | (2,825 | ) | ||||
| Gross deferred tax liabilities | (5,691 | ) | (6,778 | ) | ||||
| Net deferred tax assets | $ | 25,417 | $ | 60,818 | ||||
Included in the table above is the effect of certain temporary differences for which no deferred tax expense or benefit was recognized. The effect of these items is instead recorded as Accumulated Other Comprehensive Income in the shareholders' equity section of the consolidated balance sheet. In 2017 and 2016 such items consisted primarily of $5.6 million and $12.1 million, respectively of unrealized losses on certain investments in debt and equity securities accounted for under ASC 320.
At December 31, 2017, the Company's deferred tax assets ("DTAs") of $25.4 million consists of approximately $15.4 million of net U.S. federal DTAs and $10.0 million of net state DTAs.
Management assesses the necessity of a valuation allowance recorded against DTAs at each reporting period. The determination of whether a valuation allowance for net DTAs is appropriate is subject to considerable judgment and requires an evaluation of all positive and negative evidence. Based on an assessment of all of the evidence, including favorable trending in asset quality and certainty regarding the amount of future taxable income that the Company forecasts, management concluded that it was more likely than not that its net DTAs will be realized based upon future taxable income. Management's confidence in the realization of projected future taxable income is based upon analysis of the Company's risk profile and its trending financial performance, including credit quality. The Company believes it can confidently and reasonably predict future results of operations that result in taxable income at sufficient levels over the future period of time that the Company has available to realize its net DTA.
Management expects to realize the $25.4 million in net DTAs well in advance of the statutory carryforward period. At December 31, 2017, approximately $4.8 million of DTAs relate to federal net operating losses which will expire in annual installments beginning in 2029 through 2032. Additionally, $5.6 million of the DTAs relate to state net operating losses which will expire in annual installments beginning in 2029 through 2034. Tax credit carryforwards at December 31, 2017 represent federal alternative minimum tax credits totaling $2.2 million. Remaining DTAs are not related to net operating losses or credits and therefore, have no expiration date.
A valuation allowance could be required in future periods based on the assessment of positive and negative evidence. Management's conclusion at December 31, 2017 that it is more likely than not that the net DTAs of $25.4 million will be realized is based upon estimates of future taxable income that are supported by internal projections which consider historical performance, various internal estimates and assumptions, as well as certain external data, all of which management believes to be reasonable although inherently subject to judgment. If actual results differ significantly from the current estimates of future taxable income, even if caused by adverse macro-economic conditions, a valuation allowance may need to be recorded for some or all of the Company's DTAs. The establishment of a DTA valuation allowance could have a material adverse effect on the Company's financial condition and results of operations.
144
The Company recognizes interest and penalties, as appropriate, as part of the provisioning for income taxes. No interest or penalties were accrued at December 31, 2017.
In March 2016, the FASB issued ASU No. 2016-09, Improvements to Employee Share-Based Payment Accounting, Compensation – Stock Compensation (Topic 718). ASU 2016-09 changes several aspects of the accounting for share-based payment award transactions, including: (1) accounting and cash flow classification for excess tax benefits and deficiencies, (2) forfeitures, and (3) tax withholding requirements and cash flow classification. The standard is effective for public business entities in annual and interim periods in fiscal years beginning after December 15, 2016. Early adoption is permitted if the entire standard is adopted. If an entity early adopts the standard in an interim period, any adjustments should be reflected as of the beginning of the fiscal year that includes that interim period. The Company adopted ASU 2016-09 in the third quarter of 2016 and recognized a $0.8 million tax benefit in the Consolidated Statements of Operations over the third and fourth quarters of 2016. During 2017, the Company recognized $1.1 million of tax benefit under this standard. In addition, the Company presented excess tax benefits as an operating activity in the Consolidated Statement of Cash Flows using a retrospective transition method.
As a result of the adoption of ASU No. 2014-01, “Investments-Equity Method and Joint Ventures: Accounting for Investments in Qualified Affordable Housing Projects,” the amortization of our low-income housing credit investment has been reflected as income tax expense. Accordingly, $713,000 and $39,000 of such amortization has been reflected as income tax expense for the years ended December 31, 2017 and 2016, respectively. The amount of affordable housing tax credits, amortization and tax benefits recorded as income tax expense for the year ended December 31, 2017 were $622,000, $713,000 and $256,000, respectively. The amount of affordable housing tax credits, amortization and tax benefits recorded as income tax expense for the year ended December 31, 2016 were $32,000, $39,000 and $67,000, respectively. The carrying value of the investment in affordable housing credits is $9.3 million and $10.0 million at December 31, 2017 and 2016, respectively, of which $5.2 million and $8.3 million is unfunded, respectively.
The Company has no unrecognized income tax benefits or provisions due to uncertain income tax positions. The following are the major tax jurisdictions in which the Company operates and the earliest tax year, exclusive of the impact of the net operating loss carryforwards, subject to examination:
| Jurisdiction | Tax Year | |||
| United States of America | 2014 | |||
| Florida | 2014 |
On December 22, 2017 H.R. 1, also known as the Tax Cut and Jobs Act (Act), was enacted. As a result, the Company was required to revalue its existing net DTA on that date based on the future federal corporate tax rate of 21%. The DTA revaluation resulted in a one-time charge to income tax expense in the amount of $8.6 million. Prior to enactment of this new legislation, the Company's net DTA was $34.0 million which was then revalued to the $25.4 million reflected in the table above. The tax charge was estimated by the Company as of December 22, 2017 based on an initial analysis of the Act and may be adjusted in future periods following completion of the Company’s 2017 federal income tax return and evaluation of the effects, if any, of implementation guidance or regulations that may be issued by the Internal Revenue Service on the Company’s initial analysis of the Act.
During the period, the Company early adopted ASU 2018-02 as discussed in Note A - Significant Accounting Policies to adjust for the historical impact of the corporate tax rate change to accumulated other comprehensive income. The adjustment relates to changes in the deferred tax asset associated with mark to market adjustments on available for sale securities. The table below reflects the balances before and after the adjustment between accumulated other comprehensive income and retained earnings:
| Unadjusted as of December 31, 2017 | Adjustment | Adjusted as of December 31, 2017 | ||||||||||
| Retained Earnings | $ | 29,208 | $ | 706 | $ | 29,914 | ||||||
| Accumulated Other Comprehensive Income | (3,510 | ) | (706 | ) | (4,216 | ) | ||||||
145
Note M - Noninterest Income and Expenses
Details of noninterest income and expense is as follows:
| For the Year Ended December 31, | ||||||||||||
| 2017 | 2016 | 2015 | ||||||||||
| (In thousands) | ||||||||||||
| Noninterest income | ||||||||||||
| Service charges on deposit accounts | $ | 10,049 | $ | 9,669 | $ | 8,563 | ||||||
| Trust fees | 3,705 | 3,433 | 3,132 | |||||||||
| Mortgage banking fees | 6,449 | 5,864 | 4,252 | |||||||||
| Brokerage commissions and fees | 1,352 | 2,044 | 2,132 | |||||||||
| Marine finance fees | 910 | 673 | 1,152 | |||||||||
| Interchange income | 10,583 | 9,227 | 7,684 | |||||||||
| Other deposit based EFT fees | 465 | 477 | 397 | |||||||||
| BOLI Income | 3,426 | 2,213 | 1,426 | |||||||||
| Gain on participated loan | 0 | 0 | 725 | |||||||||
| Other | 6,291 | 3,827 | 2,555 | |||||||||
| 43,230 | 37,427 | 32,018 | ||||||||||
| Securities gains, net | 86 | 368 | 161 | |||||||||
| Gain on sale of VISA stock | 15,153 | 0 | 0 | |||||||||
| Bargain purchase gain, net | 0 | 0 | 416 | |||||||||
| TOTAL | $ | 58,469 | $ | 37,795 | $ | 32,595 | ||||||
| Noninterest expense | ||||||||||||
| Salaries and wages | $ | 65,692 | $ | 54,096 | $ | 41,075 | ||||||
| Employee benefits | 11,732 | 9,903 | 9,564 | |||||||||
| Outsourced data processing costs | 14,116 | 13,516 | 10,150 | |||||||||
| Telephone / data lines | 2,291 | 2,108 | 1,797 | |||||||||
| Occupancy | 13,290 | 13,122 | 8,744 | |||||||||
| Furniture and equipment | 6,067 | 4,720 | 3,434 | |||||||||
| Marketing | 4,784 | 3,633 | 4,428 | |||||||||
| Legal and professional fees | 11,022 | 9,596 | 8,022 | |||||||||
| FDIC assessments | 2,326 | 2,365 | 2,212 | |||||||||
| Amortization of intangibles | 3,361 | 2,486 | 1,424 | |||||||||
| Asset dispositions expense | 411 | 553 | 472 | |||||||||
| Net (gain)/loss on other real estate owned and repossessed assets | (711 | ) | (509 | ) | 239 | |||||||
| Early redemption cost for Federal Home Loan Bank advances | 0 | 1,777 | 0 | |||||||||
| Other | 15,535 | 13,515 | 12,209 | |||||||||
| TOTAL | $ | 149,916 | $ | 130,881 | $ | 103,770 | ||||||
146
Note N - Shareholders' Equity
The Company has reserved 300,000 common shares for issuance in connection with an employee stock purchase plan and 1,000,000 common shares for issuance in connection with an employee profit sharing plan. At December 31, 2017, an aggregate of 175,997 shares and 32,120 shares, respectively, have been issued as a result of employee participation in these plans.
Holders of common stock are entitled to one vote per share on all matters presented to shareholders as provided in the Company’s Articles of Incorporation. The Company implemented a dividend reinvestment plan during 2007, issuing no shares from treasury stock during 2017 and 2016.
Required Regulatory Capital
| Minimum
for Capital Adequacy Purpose (1) | Minimum
To Be Well Capitalized Under Prompt Corrective Action Provisions | |||||||||||||||||||||||
| Amount | Ratio | Amount | Ratio | Amount | Ratio | |||||||||||||||||||
| (Dollars in thousands) | ||||||||||||||||||||||||
| SEACOAST BANKING CORP | ||||||||||||||||||||||||
| (CONSOLIDATED) | ||||||||||||||||||||||||
| At December 31, 2017: | ||||||||||||||||||||||||
| Total Capital Ratio (to risk-weighted assets) | $ | 619,746 | 14.24 | % | $ | 348,191 | ≥ 8.00 | % | n/a | n/a | ||||||||||||||
| Tier 1 Capital Ratio (to risk-weighted assets) | 592,562 | 13.61 | 261,143 | ≥ 6.00 | % | n/a | n/a | |||||||||||||||||
| Common Equity Tier 1 Capital (to risk-weighted assets) | 523,832 | 12.04 | 195,858 | ≥ 4.50 | % | n/a | n/a | |||||||||||||||||
| Tier 1 Leverage Ratio (to adjusted average assets) | 592,562 | 10.68 | 221,863 | ≥ 4.00 | % | n/a | n/a | |||||||||||||||||
| At December 31, 2016: | ||||||||||||||||||||||||
| Total Capital Ratio (to risk-weighted assets) | $ | 432,058 | 13.25 | % | $ | 260,790 | ≥ 8.00 | % | n/a | n/a | ||||||||||||||
| Tier 1 Capital Ratio (to risk-weighted assets) | 408,596 | 12.53 | 195,592 | ≥ 6.00 | % | n/a | n/a | |||||||||||||||||
| Common Equity Tier 1 Capital (to risk-weighted assets) | 351,769 | 10.79 | 146,694 | ≥ 4.50 | % | n/a | n/a | |||||||||||||||||
| Tier 1 Leverage Ratio (to adjusted average assets) | 408,596 | 9.15 | 178,656 | ≥ 4.00 | % | n/a | n/a | |||||||||||||||||
| SEACOAST NATIONAL BANK | ||||||||||||||||||||||||
| (A WHOLLY OWNED BANK SUBSIDIARY) | ||||||||||||||||||||||||
| At December 31, 2017: | ||||||||||||||||||||||||
| Total Capital Ratio (to risk-weighted assets) | $ | 565,149 | 13.04 | % | $ | 346,780 | ≥ 8.00 | % | $ | 433,475 | ≥ 10.00 | % | ||||||||||||
| Tier 1 Capital Ratio (to risk-weighted assets) | 537,965 | 12.41 | 260,085 | ≥ 6.00 | % | 346,780 | ≥ 8.00 | % | ||||||||||||||||
| Common Equity Tier 1 Capital (to risk-weighted assets) | 537,965 | 12.41 | 195,022 | ≥ 4.50 | % | 281,759 | ≥ 6.50 | % | ||||||||||||||||
| Tier 1 Leverage Ratio (to adjusted average assets) | 537,965 | 9.72 | 221,432 | ≥ 4.00 | % | 276,791 | ≥ 5.00 | % | ||||||||||||||||
| At December 31, 2016: | ||||||||||||||||||||||||
| Total Capital Ratio (to risk-weighted assets) | $ | 415,147 | 12.75 | % | $ | 260,491 | ≥ 8.00 | % | $ | 325,987 | ≥ 10.00 | % | ||||||||||||
| Tier 1 Capital Ratio (to risk-weighted assets) | 391,685 | 12.03 | 195,368 | ≥ 6.00 | % | 260,790 | ≥ 8.00 | % | ||||||||||||||||
| Common Equity Tier 1 Capital (to risk-weighted assets) | 391,685 | 12.03 | 146,526 | ≥ 4.50 | % | 211,892 | ≥ 6.50 | % | ||||||||||||||||
| Tier 1 Leverage Ratio (to adjusted average assets) | 391,685 | 8.78 | 178,501 | ≥ 4.00 | % | 223,320 | ≥ 5.00 | % | ||||||||||||||||
| (1) | Excludes capital conservation buffer of 1.250% the Company is subject to, which if not exceeded may constrain dividends, equity repurchases and compensation. |
n/a - not applicable
The Company is subject to various regulatory capital requirements administered by the federal banking agencies. Under Basel III standards adopted January 1, 2015, deferred tax assets (DTAs) were substantially restricted in regulatory capital calculations, the Common Equity Tier 1 Capital calculation was created, and new minimum adequacy and well capitalized thresholds were established. Failure to meet minimum capital requirements can initiate certain mandatory, and possibly additional discretionary, actions by regulators that, if undertaken, could have a direct material effect on the Company's financial statements. Under capital adequacy guidelines and the regulatory framework for prompt corrective action, the Company must meet specific capital guidelines that involve quantitative measures of the Company's assets, liabilities and certain off-balance sheet items as calculated under regulatory accounting practices. The Company's capital amounts and classification are also subject to qualitative judgments by the regulators about components, risk weightings, and other factors. At year-end 2017 and 2016, the most recent regulatory notifications categorize the Company as well capitalized under the regulatory frame work for prompt corrective action.
Quantitative measures established by regulation to ensure capital adequacy require the Company to maintain minimum amounts and ratios of total, Tier 1 capital and common equity Tier 1 capital (as defined in the regulations) to risk-weighted assets (as defined) and of Tier 1 capital to average assets (as defined). Management believes, as of December 31, 2017, that the Company and Seacoast Bank meets all capital adequacy requirements to which it is subject. At December 31, 2017, the capital conservation buffer requisite the Company is subject to was 1.250%.
On February 21, 2017, the Company closed on its offering of 8.9 million shares of common stock, consisting of 2.7 million shares sold by the Company and 6.2 million shares sold by one of its shareholders. The Company received proceeds of $56.7 million less legal and professional fees of $1.1 million from the issuance of the 2.7 million shares of its common stock. The Company is using the net proceeds from the offering for general corporate purposes, including the acquisitions of GulfShore Bank, NorthStar Bank and Palm Beach Communities Bank in 2017 and to support organic growth. Seacoast did not receive any proceeds from the sale of its shareholder's shares. Herbert Lurie, who is a member of our board of directors is a consulting Senior Advisor to Guggenheim Securities, LLC, an underwriter of this offering. Under his consulting agreement with Guggenheim, Mr. Lurie was entitled to receive customary compensation, including in connection with our offering of common stock. Mr. Lurie recused himself from board decisions regarding this offering.
147
Note O - Seacoast Banking Corporation of Florida
(Parent Company Only) Financial Information
Balance Sheets
| December 31, | ||||||||
| 2017 | 2016 | |||||||
| (In thousands) | ||||||||
| ASSETS | ||||||||
| Cash | $ | 1,154 | $ | 648 | ||||
| Securities purchased under agreement to resell with subsidiary bank, maturing within 30 days | 33,151 | 12,676 | ||||||
| Investment in subsidiaries | 711,973 | 494,809 | ||||||
| Other assets | 21,337 | 1,211 | ||||||
| $ | 767,615 | $ | 509,344 | |||||
| LIABILITIES AND SHAREHOLDERS' EQUITY | ||||||||
| Subordinated debt | $ | 70,521 | $ | 70,241 | ||||
| Other liabilities | 7,430 | 3,706 | ||||||
| Shareholders' equity | 689,664 | 435,397 | ||||||
| $ | 767,615 | $ | 509,344 | |||||
148
Statements of Income (Loss)
| Year Ended December 31 | ||||||||||||
| 2017 | 2016 | 2015 | ||||||||||
| (In thousands) | ||||||||||||
| Income | ||||||||||||
| Interest/other | $ | 2,104 | $ | 352 | $ | 115 | ||||||
| Dividends from subsidiary Bank | 0 | 0 | 0 | |||||||||
| Gain on sale of VISA stock | 15,153 | 0 | 0 | |||||||||
| 17,257 | 352 | 115 | ||||||||||
| Interest expense | 2,499 | 2,115 | 1,671 | |||||||||
| Other expenses | 649 | 462 | 317 | |||||||||
| Income (loss) before income taxes and equity in undistributed income of subsidiaries | 14,109 | (2,225 | ) | (1,873 | ) | |||||||
| Income tax provision (benefit) benefit | 4,938 | (801 | ) | (661 | ) | |||||||
| Income (loss) before equity in undistributed income of subsidiaries | 9,171 | (1,424 | ) | (1,212 | ) | |||||||
| Equity in undistributed income of subsidiaries | 33,694 | 30,626 | 23,353 | |||||||||
| Net income | $ | 42,865 | $ | 29,202 | $ | 22,141 | ||||||
149
Statements of Cash Flows
| Year Ended December 31 | ||||||||||||
| 2017 | 2016 | 2015 | ||||||||||
| (In thousands) | ||||||||||||
| Cash flows from operating activities | ||||||||||||
| Adjustments to reconcile net income to net cash provided by operating activities: | ||||||||||||
| Net Income | $ | 42,865 | $ | 29,202 | $ | 22,141 | ||||||
| Equity in undistributed income of subsidiaries | (33,694 | ) | (30,626 | ) | (23,353 | ) | ||||||
| Gain on sale of VISA stock | (15,153 | ) | 0 | 0 | ||||||||
| Net (increase) decrease in other assets | 1,415 | (12 | ) | 10 | ||||||||
| Net increase (decrease) in other liabilities | 4,005 | 12 | (48 | ) | ||||||||
| Net cash used in operating activities | (562 | ) | (1,424 | ) | (1,250 | ) | ||||||
| Cash flows from investing activities | ||||||||||||
| Net cash paid for bank acquisition | (27,862) | (28,905 | ) | 0 | ||||||||
| Investment in unconsolidated subsidiary | 0 | (200 | ) | 0 | ||||||||
| Investment in VISA stock | (6,180 | ) | 0 | 0 | ||||||||
| Decrease (increase) in securities purchased under agreement to resell, maturing within 30 days, net | (20,475 | ) | 30,647 | (5,487 | ) | |||||||
| Net cash provided by (used in) investment activities | (54,517 | ) | 1,542 | (5,487 | ) | |||||||
| Cash flows from financing activities | ||||||||||||
| Issuance of common stock, net of related expense | 55,641 | 0 | 0 | |||||||||
| Subordinated debt increase | 0 | 0 | 6,494 | |||||||||
| Stock based employment plans | (56 | ) | 166 | 127 | ||||||||
| Net cash provided by financing activities | 55,585 | 166 | 6,621 | |||||||||
| Net change in cash | 506 | 284 | (116 | ) | ||||||||
| Cash at beginning of year | 648 | 364 | 480 | |||||||||
| Cash at end of year | $ | 1,154 | $ | 648 | $ | 364 | ||||||
| Supplemental disclosure of cash flow information: | ||||||||||||
| Cash paid during the period for interest | $ | 2,205 | $ | 1,824 | $ | 1,487 | ||||||
150
Note P - Contingent Liabilities and Commitments with Off-Balance Sheet Risk
The Company and its subsidiaries, because of the nature of their business, are at all times subject to numerous legal actions, threatened or filed. Management presently believes that none of the legal proceedings to which it is a party are likely to have a materially adverse effect on the Company’s consolidated financial condition, or operating results or cash flows.
The Company's subsidiary bank is party to financial instruments with off balance sheet risk in the normal course of business to meet the financing needs of its customers. These financial instruments include commitments to extend credit, standby letters of credit, and limited partner equity commitments.
The subsidiary bank’s exposure to credit loss in the event of non-performance by the other party to the financial instrument for commitments to extend credit and standby letters of credit is represented by the contract or notional amount of those instruments. The subsidiary bank uses the same credit policies in making commitments and standby letters of credit as they do for on balance sheet instruments.
Commitments to extend credit are agreements to lend to a customer as long as there is no violation of any condition established in the contract. Commitments generally have fixed expiration dates or other termination clauses and may require payment of a fee. Since many of the commitments are expected to expire without being drawn upon, the total commitment amounts do not necessarily represent future cash requirements. The subsidiary bank evaluates each customer's creditworthiness on a case-by-case basis. The amount of collateral obtained, if deemed necessary by the bank upon extension of credit, is based on management's credit evaluation of the counterparty. Collateral held varies but may include accounts receivable, inventory, equipment, and commercial and residential real estate. Of the $807.7 million in commitments to extend credit outstanding at December 31, 2017, $368.7 million is secured by 1-4 family residential properties for individuals with approximately $86.5 million at fixed interest rates ranging from 3.00 to 5.50%.
Standby letters of credit are conditional commitments issued by the subsidiary bank to guarantee the performance of a customer to a third party. These instruments have fixed termination dates and most end without being drawn; therefore, they do not represent a significant liquidity risk. Those guarantees are primarily issued to support public and private borrowing arrangements, including commercial paper, bond financing, and similar transactions. The credit risk involved in issuing letters of credit is essentially the same as that involved in extending loan facilities to customers. The subsidiary bank holds collateral supporting these commitments for which collateral is deemed necessary. The extent of collateral held for secured standby letters of credit at December 31, 2017 and 2016 amounted to $26.4 million and $46.6 million respectively.
Unfunded limited partner equity commitments at December 31, 2017 totaled $10.9 million that the Company has committed to small business investment companies under the SBIC Act to be used to provide capital to small businesses, and entities that provide low income housing tax credits.
151
Unfunded commitments for the Company as of:
| December 31, | ||||||||
| 2017 | 2016 | |||||||
| (In thousands) | ||||||||
| Contract or Notional Amount | ||||||||
| Financial instruments whose contract amounts represent credit risk: | ||||||||
| Commitments to extend credit | $ | 807,651 | $ | 532,082 | ||||
| Standby letters of credit and financial guarantees written: | ||||||||
| Secured | 12,913 | 10,776 | ||||||
| Unsecured | 681 | 554 | ||||||
| Unfunded limited partner equity commitment | 10,914 | 10,148 | ||||||
152
Note Q - Fair Value
Under ASC 820, fair value measurements for items measured at fair value on a recurring and nonrecurring basis at December 31, 2017 and December 31, 2016 included:
| Quoted Prices in | Significant Other | Significant Other | ||||||||||||||
| Active Markets for | Observable | Unobservable | ||||||||||||||
| Fair Value | Identical Assets | Inputs | Inputs | |||||||||||||
| (In thousands) | Measurements | Level 1 | Level 2 | Level 3 | ||||||||||||
| At December 31, 2017 | ||||||||||||||||
| Available for sale securities (1) | $ | 955,804 | $ | 6,600 | $ | 949,204 | $ | 0 | ||||||||
| Loans held for sale (2) | 24,306 | 0 | 24,306 | 0 | ||||||||||||
| Loans (3) | 4,192 | 0 | 3,454 | 738 | ||||||||||||
| Other real estate owned (4) | 7,640 | 0 | 60 | 7,580 | ||||||||||||
| At December 31, 2016 | ||||||||||||||||
| Available for sale securities (1) | $ | 950,503 | $ | 100 | $ | 950,403 | $ | 0 | ||||||||
| Loans held for sale (2) | 15,332 | 0 | 15,332 | 0 | ||||||||||||
| Loans (3) | 4,120 | 0 | 3,170 | 950 | ||||||||||||
| Other real estate owned (4) | 9,949 | 0 | 0 | 9,949 | ||||||||||||
| (1) | See Note D for further detail of fair value of individual investment categories. |
| (2) | Recurring fair value basis determined using observable market data. |
| (3) | See Note E. Nonrecurring fair value adjustments to loans identified as impaired reflect full or partial write- downs that are based on the loan’s observable market price or current appraised value of the collateral in accordance with ASC 310. |
| (4) | Fair value is measured on a nonrecurring basis in accordance with ASC 360. |
The fair value of impaired loans which are not troubled debt restructurings is based on recent real estate appraisals less estimated costs of sale. For residential real estate impaired loans, appraised values or internal evaluation are based on the comparative sales approach. These impaired loans are considered level 2 in the fair value hierarchy. For commercial and commercial real estate impaired loans, evaluations may use either a single valuation approach or a combination of approaches, such as comparative sales, cost and/or income approach. A significant unobservable input in the income approach is the estimated capitalization rate for a given piece of collateral. At December 31, 2017 the range of capitalization rates utilized to determine fair value of the underlying collateral averaged approximately 7.8%. Adjustments to comparable sales may be made by an appraiser to reflect local market conditions or other economic factors and may result in changes in the fair value of an asset over time. As such, the fair value of these impaired loans is considered level 3 in the fair value hierarchy. Impaired loans measured at fair value totaled $4.2 million with a specific reserve of $2.4 million at December 31, 2017, compared to $4.1 million with a specific reserve of $0.4 million at December 31, 2016.
153
Fair value of available for sale securities are determined using valuation techniques for individual investments as described in Note A.
When appraisals are used to determine fair value and the appraisals are based on a market approach, the fair value of OREO is classified as level 2. When the fair value of OREO is based on appraisals which require significant adjustments to market-based valuation inputs or apply an income approach based on unobservable cash flows, the fair value of OREO is classified as Level 3.
Transfers between levels of the fair value hierarchy are recognized on the actual date of the event or circumstances that caused the transfer, which generally coincides with the Company's monthly and/or quarter valuation process.
For loans classified as level 3 additions totaled $0.4 million consisting of loans that became impaired during the twelve months ended December 31, 2017. Reductions were $0.6 million, primarily principal payments totaling $0.5 million.
Charge-offs recognized upon loan foreclosures are generally offset by general or specific allocations of the allowance for loan losses and generally do not, and did not during the reported periods, significantly impact the Company's provision for loan losses.
For OREO classified as level 3 during the twelve months ended December 31, 2017, foreclosed loans added $1.7 million and migrated branches taken out of service added $1.2 million. Reductions summed to $5.3 million and consisted almost entirely of sales of $5.0 million.
The carrying amount and fair value of the Company's other significant financial instruments that were not disclosed previously in the balance sheet and for which carrying amount is not fair value as of December 31, 2017 and December 31, 2016 is as follows:
| Quoted Prices in | Significant Other | Significant Other | ||||||||||||||
| Active Markets for | Observable | Unobservable | ||||||||||||||
| Carrying | Identical Assets | Inputs | Inputs | |||||||||||||
| (In thousands) | Amount | Level 1 | Level 2 | Level 3 | ||||||||||||
| At December 31, 2017 | ||||||||||||||||
| Financial Assets | ||||||||||||||||
| Securities held to maturity (1) | $ | 416,863 | $ | 0 | $ | 414,472 | $ | 0 | ||||||||
| Time deposits with other banks | 12,553 | 0 | 0 | 12,493 | ||||||||||||
| Loans, net | 3,786,063 | 0 | 0 | 3,760,754 | ||||||||||||
| Financial Liabilities | ||||||||||||||||
| Deposits | 4,592,720 | 0 | 0 | 4,588,515 | ||||||||||||
| Subordinated debt | 70,521 | 0 | 61,530 | 0 | ||||||||||||
| At December 31, 2016 | ||||||||||||||||
| Financial Assets | ||||||||||||||||
| Securities held to maturity (1) | $ | 372,498 | $ | 0 | $ | 369,881 | $ | 0 | ||||||||
| Loans, net | 2,852,016 | 0 | 0 | 2,840,993 | ||||||||||||
| Financial Liabilities | ||||||||||||||||
| Deposits | 3,523,245 | 0 | 0 | 3,523,322 | ||||||||||||
| Subordinated debt | 70,241 | 0 | 54,908 | 0 | ||||||||||||
| (1) | See Note D for further detail of recurring fair value basis of individual investment categories. |
154
The short maturity of Seacoast’s assets and liabilities results in having a significant number of financial instruments whose fair value equals or closely approximates carrying value. Such financial instruments are reported in the following balance sheet captions: cash and cash equivalents, interest bearing deposits with other banks, federal funds purchased, FHLB borrowings, and securities sold under agreement to repurchase, maturing within 30 days.
The following methods and assumptions were used to estimate the fair value of each class of financial instrument for which it is practicable to estimate that value at December 31, 2017 and December 31, 2016:
Securities: U.S. Treasury securities are reported at fair value utilizing Level 1 inputs. Other securities are reported at fair value utilizing Level 2 inputs. The fair value measurements consider observable data that may include dealer quotes, market spreads, cash flows, the U.S. Treasury yield curve, live trading levels, trade execution data, market consensus prepayment speeds, credit information and the bond’s terms and conditions, among other things.
The Company reviews the prices supplied by the independent pricing service, as well as their underlying pricing methodologies, for reasonableness and to ensure such prices are aligned with traditional pricing matrices. In general, the Company does not purchase investment portfolio securities that are esoteric or that have a complicated structure. The Company’s entire portfolio consists of traditional investments, the majority of which are U.S. Treasury obligations, federal agency bullet, mortgage pass-through securities, or general obligation or revenue based municipal bonds. Pricing for such instruments is fairly generic and is easily obtained. The fair value of the collateralized loan obligations is determined from broker quotes. From time to time, the Company will validate, on a sample basis, prices supplied by brokers and the independent pricing service by comparison to prices obtained from other brokers and third-party sources or derived using internal models.
Loans: Fair values are estimated for portfolios of loans with similar financial characteristics. Loans are segregated by type such as commercial, mortgage, etc. Each loan category is further segmented into fixed and adjustable rate interest terms and by performing and nonperforming categories. The fair value of loans, except residential mortgages, is calculated by discounting scheduled cash flows through the estimated maturity using estimated market discount rates that reflect the credit and interest rate risks inherent in the loan. For residential mortgage loans, fair value is estimated by discounting contractual cash flows adjusting for prepayment assumptions using discount rates based on secondary market sources. The estimated fair value is not an exit price fair value under ASC 820 when this valuation technique is used.
Loans held for sale: Fair values are based upon estimated values to be received from independent third party purchasers. These loans are intended for sale and the Company believes the fair value is the best indicator of the resolution of these loans. Interest income is recorded based on contractual terms of the loan in accordance with Company policy on loans held for investment. None of the loans are 90 days or more past due or on nonaccrual as of:
| December 31, | ||||||||
| (In thousands) | 2017 | 2016 | ||||||
| Aggregate fair value | $ | 24,306 | $ | 15,332 | ||||
| Contractual balance | 23,627 | 14,904 | ||||||
| Excess | 679 | 428 | ||||||
Deposit Liabilities: The fair value of demand deposits, savings accounts and money market deposits is the amount payable at the reporting date. The fair value of fixed maturity certificates of deposit is estimated using the rates currently offered for funding of similar remaining maturities.
155
Note R - Earnings Per Share
Basic earnings per common share is computed by dividing net income available to common shareholders by the weighted average number of shares of common stock outstanding during the year.
In 2017, 2016, and 2015, options and warrants to purchase 274,000, 131,000, and 456,000 shares, respectively, were antidilutive and accordingly were excluded in determining diluted earnings per share.
| For the Year Ended December 31 | ||||||||||||
| (In thousands, except per share data) | 2017 | 2016 | 2015 | |||||||||
| Basic earnings per share | ||||||||||||
| Net Income | $ | 42,865 | $ | 29,202 | $ | 22,141 | ||||||
| Total weighted average common stock outstanding | 42,613 | 36,872 | 33,496 | |||||||||
| Net income per share | $ | 1.01 | $ | 0.79 | $ | 0.66 | ||||||
| Diluted earnings per share | ||||||||||||
| Net Income | $ | 42,865 | $ | 29,202 | $ | 22,141 | ||||||
| Total weighted average common stock outstanding | $ | 42,613 | $ | 36,872 | $ | 33,496 | ||||||
| Add: Dilutive effect of employee restricted stock and stock options (See Note J) | 737 | 636 | 248 | |||||||||
| Total weighted average diluted stock outstanding | 43,350 | 37,508 | 33,744 | |||||||||
| Net income per share | $ | 0.99 | $ | 0.78 | $ | 0.66 | ||||||
156
Note S - Business Combinations
Acquisition of Floridian Financial Group, Inc.
On March 11, 2016, Seacoast completed its acquisition of Floridian Financial Group, Inc. (“Floridian”). Simultaneously, upon completion of the merger, Floridian’s wholly owned subsidiary bank, Floridian Bank, was merged with and into Seacoast Bank. Floridian, headquartered in Lake Mary, Florida, operated 10 branches in Orlando and Daytona Beach, of which several were consolidated with Seacoast locations. This acquisition added $417 million in total assets, $266 million in loans and $337 million in deposits.
Seacoast expects to benefit from this acquisition through solidifying its market share in the Central Florida market, expanding its customer base and leveraging operating costs through economies of scale, and positively affect the Company’s operating results.
The Company acquired 100% of the outstanding common stock of Floridian. Under the terms of the definitive agreement, Floridian shareholders received, at their election, (i) the combination of $4.29 in cash and 0.5291 shares of Seacoast common stock, (ii) $12.25 in cash, or (iii) 0.8140 shares of Seacoast common stock, subject to a customary proration mechanism so that the aggregate consideration mix equals 35% cash and 65% Seacoast shares (based on Seacoast’s closing price of $15.47 per share on March 11, 2016).
| (In thousands, except per share data) | March 11, 2016 | |||
| Floridian shares exchanged for cash | $ | 26,699 | ||
| Number of Floridian common shares outstanding | 6,222 | |||
| Per share exchange ratio | 0.5289 | |||
| Number of shares of common stock issued | 3,291 | |||
| Multiplied by common stock price per share on March 11, 2016 | $ | 15.47 | ||
| Value of common stock issued | 50,913 | |||
| Total purchase price | $ | 77,612 | ||
The acquisition was accounted for under the acquisition method in accordance with ASC Topic 805, Business Combinations. The Company recognized goodwill of $32 million on this acquisition which is nondeductible for tax. The goodwill was calculated based on the fair values of the assets acquired and liabilities assumed. The fair values initially assigned to assets acquired and liabilities assumed were preliminary. The adjustments reflected in the table below are the result of new information obtained subsequent to the initial measurement.
157
| Measurement | ||||||||||||
| March 11, 2016 | Period | March 11, 2016 | ||||||||||
| (Initially Reported) | Adjustments | (As Adjusted) | ||||||||||
| (in thousands) | ||||||||||||
| Assets: | ||||||||||||
| Cash | $ | 28,243 | $ | 0 | $ | 28,243 | ||||||
| Investment securities | 66,912 | 95 | 67,007 | |||||||||
| Loans, net | 268,249 | (2,112 | ) | 266,137 | ||||||||
| Fixed assets | 7,801 | (628 | ) | 7,173 | ||||||||
| Core deposit intangibles | 3,375 | 0 | 3,375 | |||||||||
| Goodwill | 29,985 | 1,647 | 31,632 | |||||||||
| Other assets | 12,879 | 998 | 13,877 | |||||||||
| $ | 417,444 | $ | 0 | $ | 417,444 | |||||||
| Liabilities: | ||||||||||||
| Deposits | $ | 337,341 | $ | 0 | $ | 337,341 | ||||||
| Other liabilities | 2,492 | 0 | 2,492 | |||||||||
| $ | 339,833 | $ | 0 | $ | 339,833 | |||||||
The table below presents information with respect to the fair value of acquired loans, as well as their unpaid principal balance (“Book Balance”) at acquisition date.
| March 11, 2016 | ||||||||
| (In thousands) | Book Balance | Fair Value | ||||||
| Loans: | ||||||||
| Single family residential real estate | $ | 38,304 | $ | 37,367 | ||||
| Commercial real estate | 172,531 | 167,105 | ||||||
| Construction/development/land | 20,546 | 18,108 | ||||||
| Commercial loans | 39,070 | 37,804 | ||||||
| Consumer and other loans | 3,385 | 3,110 | ||||||
| Purchased credit-impaired | 6,186 | 2,643 | ||||||
| Total acquired loans | $ | 280,022 | $ | 266,137 | ||||
For the loans acquired we first segregated all acquired loans with specifically identified credit deficiency factor(s). The factors we considered to identify loans as Purchase Credit Impaired (“PCI”) loans were all acquired loans that were nonaccrual, 60 days or more past due, designated as Trouble Debt Restructured (“TDR”), graded “special mention” or “substandard.” These loans were then evaluated to determine estimated fair values as of the acquisition date. The table below summarizes the total contractually required principal and interest cash payments, management’s estimate of expected total cash payments and fair value of the loans as of March 11, 2016 for PCI loans. Contractually required principal and interest payments have been adjusted for estimated prepayments.
| March 11, 2016 | ||||
| (In thousands) | ||||
| Contractually required principal and interest | $ | 8,031 | ||
| Non-accretable difference | (4,820 | ) | ||
| Cash flows expected to be collected | 3,211 | |||
| Accretable yield | (568 | ) | ||
| Total purchased credit impaired loans acquired | $ | 2,643 | ||
158
Loans without specifically identified credit deficiency factors are referred to as Purchased Unimpaired Loans (“PULs”) for disclosure purposes. These loans were then evaluated to determine estimated fair values as of the acquisition date. Although no specific credit deficiencies were identifiable, we believe there is an element of risk as to whether all contractual cash flows will be eventually received. Factors that were considered included the economic environment both nationally and locally as well as the real estate market particularly in Florida.
The Company believes the deposits assumed from the acquisition have an intangible value. In determining the valuation amount, deposits were analyzed based on factors such as type of deposit, deposit retention, interest rates and age of deposit relationships.
Acquisition of BMO Harris Central Florida Offices, Deposits and Loans
On June 3, 2016, Seacoast completed its acquisition of the Orlando banking operations of BMO Harris Bank N.A. (BMO), which included fourteen branches. The acquisition added $314 million in total assets, $63 million in loans and $314 million in deposits. The business and consumer banking deposits were acquired at a deposit premium of 3.0% and business loans at a loan premium of 0.5%.
Seacoast expects to benefit from this acquisition through solidifying its market share in the Central Florida market, expanding its customer base and leveraging operating costs through economies of scale, and positively affecting the Company’s operating results.
The acquisition was accounted for under the acquisition method in accordance with ASC Topic 805, Business Combinations. The Company recognized $13 million goodwill on this acquisition that is deductible for tax purposes over a 15-year period. The goodwill was calculated based on the fair values of the assets acquired and liabilities assumed. The fair values initially assigned to assets acquired and liabilities assumed were preliminary. The adjustments reflected in the table below are the result of new information obtained subsequent to the initial measurement.
| Measurement | ||||||||||||
| June 3, 2016 | Period | June 3, 2016 | ||||||||||
| (Initially Reported) | Adjustments | (As Adjusted) | ||||||||||
| (in thousands) | ||||||||||||
| Assets: | ||||||||||||
| Cash from BMO (net of payable) | $ | 234,094 | $ | 0 | $ | 234,094 | ||||||
| Loans, net | 62,671 | 0 | 62,671 | |||||||||
| Fixed assets | 3,715 | 0 | 3,715 | |||||||||
| Core deposit intangibles | 5,223 | (135 | ) | 5,088 | ||||||||
| Goodwill | 7,645 | 163 | 7,808 | |||||||||
| Other assets | 952 | (28 | ) | 924 | ||||||||
| $ | 314,300 | $ | 0 | $ | 314,300 | |||||||
| Liabilities: | ||||||||||||
| Deposits | $ | 314,248 | $ | 0 | $ | 314,248 | ||||||
| Other liabilities | 52 | 0 | 52 | |||||||||
| $ | 314,300 | $ | 0 | $ | 314,300 | |||||||
159
The table below presents information with respect to the fair value of acquired loans, as well as their Book Balance at acquisition date.
| June 3, 2016 | ||||||||
| (In thousands) | Book Balance | Fair Value | ||||||
| Loans: | ||||||||
| Commercial real estate | $ | 31,564 | $ | 31,200 | ||||
| Commercial loans | 32,479 | 31,471 | ||||||
| Purchased credit-impaired | 0 | 0 | ||||||
| Total acquired loans | $ | 64,043 | $ | 62,671 | ||||
At June 3, 2016, no loans acquired from BMO Harris were specifically identified with a credit deficiency factor(s). The factors we consider to identify loans as PCI loans are acquired loans that were nonaccrual, 60 days or more past due, designated as TDR, graded “special mention” or “substandard.” PULs were evaluated to determine estimated fair values as of the acquisition date. Although no specific credit deficiencies were identifiable, we believe there is an element of risk as to whether all contractual cash flows will be eventually received. Factors that were considered included the economic environment both nationally and locally as well as the real estate market particularly in Florida.
The Company believes the deposits assumed from the acquisition have an intangible value. In determining the valuation amount, deposits were analyzed based on factors such as type of deposit, deposit retention, interest rates and age of deposit relationships.
Acquisition of GulfShore Bancshares, Inc.
On April 7, 2017, the Company completed its acquisition of GulfShore, the parent company of GulfShore Bank. Simultaneously, upon completion of the merger, GulfShore’s wholly owned subsidiary bank, GulfShore Bank, was merged with and into Seacoast Bank. GulfShore, headquartered in Tampa, Florida, operated 3 branches in Tampa and St. Petersburg. This acquisition added $358 million in total assets, $251 million in loans and $285 million in deposits to Seacoast.
As a result of this acquisition the Company expects to enhance its presence in the Tampa, Florida market, expand its customer base and leverage operating cost through economies of scale, and positively affect the Company’s operating results to the extent the Company earns more from interest earning assets than it pays in interest on its interest bearing liabilities.
The Company acquired 100% of the outstanding common stock of GulfShore. Under the terms of the definitive agreement, GulfShore shareholders received, for each share of GulfShore common stock, the combination of $1.47 in cash and 0.4807 shares of Seacoast common stock (based on Seacoast’s closing price of $23.94 per share on April 7, 2017).
160
| (In thousands, except per share data) | April 7, 2017 | |||
| Shares exchanged for cash | $ | 8,034 | ||
| Number of GulfShore Bancshares, Inc. common shares outstanding | 5,464 | |||
| Per share exchange ratio | 0.4807 | |||
| Number of shares of common stock issued | 2,627 | |||
| Multiplied by common stock price per share on April 7, 2017 | $ | 23.94 | ||
| Value of common stock issued | 62,883 | |||
| Total purchase price | $ | 70,917 | ||
The acquisition was accounted for under the acquisition method in accordance with ASC Topic 805, Business Combinations. The Company recognized goodwill of $37.1 million for this acquisition that is nondeductible for tax purposes. The fair values initially assigned to assets acquired and liabilities assumed are preliminary and could change for up to one year after the closing date of the acquisition as new information and circumstances relative to closing date fair values are known. Determining fair values of assets and liabilities, especially the loan portfolio, core deposit intangibles and deferred taxes, is a complicated process involving significant judgment regarding methods and assumptions used to calculate estimated fair values.
| Measurement | ||||||||||||
| April 7, 2017 | Period | April 7, 2017 | ||||||||||
| Date of acquisition | (Initially Reported) | Adjustments | (As Adjusted) | |||||||||
| (in thousands) | ||||||||||||
| Assets: | ||||||||||||
| Cash | $ | 38,267 | $ | 0 | $ | 38,267 | ||||||
| Time deposits with other banks | 17,273 | 0 | 17,273 | |||||||||
| Investment securities | 21 | 0 | 21 | |||||||||
| Loans, net | 250,876 | 0 | 250,876 | |||||||||
| Fixed assets | 1,307 | 0 | 1,307 | |||||||||
| Other real estate owned | 13 | 0 | 13 | |||||||||
| Core deposit intangibles | 3,927 | 0 | 3,927 | |||||||||
| Goodwill | 37,098 | 0 | 37,098 | |||||||||
| Other assets | 8,867 | 0 | 8,867 | |||||||||
| $ | 357,649 | $ | 0 | $ | 357,649 | |||||||
| Liabilities: | ||||||||||||
| Deposits | $ | 285,350 | $ | 0 | $ | 285,350 | ||||||
| Other liabilities | 1,382 | 0 | 1,382 | |||||||||
| $ | 286,732 | $ | 0 | $ | 286,732 | |||||||
161
The table below presents information with respect to the fair value of acquired loans, as well as their unpaid principal balance (“Book Balance”) at acquisition date.
| April 7, 2017 | ||||||||
| (In thousands) | Book Balance | Fair Value | ||||||
| Loans: | ||||||||
| Single family residential real estate | $ | 101,281 | $ | 99,598 | ||||
| Commercial real estate | 106,729 | 103,905 | ||||||
| Construction/development/land | 13,175 | 11,653 | ||||||
| Commercial loans | 32,137 | 32,247 | ||||||
| Consumer and other loans | 3,554 | 3,473 | ||||||
| Purchased credit-impaired | 0 | 0 | ||||||
| Total acquired loans | $ | 256,876 | $ | 250,876 | ||||
No loans acquired were specifically identified with credit deficiency factor(s), pursuant to ASC Topic 310-30. The factors we considered to identify loans as PCI loans were all acquired loans that were nonaccrual, 60 days or more past due, designated as TDR, graded “special mention” or “substandard.”
Loans without specifically identified credit deficiency factors are referred to as PULs for disclosure purposes. These loans were then evaluated to determine estimated fair values as of the acquisition date. Although no specific credit deficiencies were identifiable, we believe there is an element of risk as to whether all contractual cash flows will be eventually received. Factors that were considered included the economic environment both nationally and locally as well as the real estate market particularly in Florida. We have applied ASC Topic 310-20 accounting treatment to the PULs.
The Company believes the deposits assumed from the acquisition have an intangible value. In determining the valuation amount, deposits were analyzed based on factors such as type of deposit, deposit retention, interest rates and age of deposit relationships.
Acquisition of NorthStar Banking Corporation
On October 20, 2017, the Company completed its acquisition of NorthStar Banking Corporation (“NSBC”). Simultaneously, upon completion of the merger, NSBC’s wholly owned subsidiary bank, NorthStar Bank, was merged with and into Seacoast Bank. NorthStar, headquartered in Tampa, Florida, operated three branches in Tampa, of which all have been retained as Seacoast locations. This acquisition added $216 million in total assets, $137 million in loans and $182 million in deposits to Seacoast.
As a result of this acquisition the Company expects to enhance its presence in the Tampa, Florida market, expand its customer base and leverage operating cost through economies of scale, and positively affect the Company’s operating results to the extent the Company earns more from interest earning assets than it pays in interest on its interest bearing liabilities.
The Company acquired 100% of the outstanding common stock of NSBC. Under the terms of the definitive agreement, NSBC shareholders received, for each share of NSBC common stock, the combination of $2.40 in cash and 0.5605 shares of Seacoast common stock (based on Seacoast’s closing price of $24.92 per share on October 20, 2017).
162
| (In thousands, except per share data) | October 20, 2017 | |||
| Shares exchanged for cash | $ | 4,701 | ||
| Number of NorthStar Banking Corporation Common shares outstanding | 1,958 | |||
| Per share exchange ratio | 0.5605 | |||
| Number of shares of common stock issued | 1,098 | |||
| Multiplied by common stock price per share on October 20, 2017 | $ | 24.92 | ||
| Value of common stock issued | 27,353 | |||
| Cash paid for NorthStar Banking Corporation vested stock options | 801 | |||
| Total purchase price | $ | 32,855 | ||
The acquisition was accounted for under the acquisition method in accordance with ASC Topic 805, Business Combinations. The Company recognized goodwill of $12.4 million for this acquisition that is nondeductible for tax purposes. The fair values initially assigned to assets acquired and liabilities assumed are preliminary and could change for up to one year after the closing date of the acquisition as new information and circumstances relative to closing date fair values are known. Determining fair values of assets and liabilities, especially the loan portfolio core deposit intangibles, and deferred taxes, is a complicated process involving significant judgment regarding methods and assumptions used to calculate estimated fair values.
| Date of acquisition | October 20, 2017 | |||
| (in thousands) | ||||
| Assets: | ||||
| Cash | $ | 5,485 | ||
| Investment securities | 56,123 | |||
| Loans, net | 136,832 | |||
| Fixed assets | 2,637 | |||
| Core deposit intangibles | 1,275 | |||
| Goodwill | 12,404 | |||
| Other assets | 1,522 | |||
| Total assets | $ | 216,278 | ||
| Liabilities: | ||||
| Deposits | $ | 182,443 | ||
| Other liabilities | 980 | |||
| Total liabilities | $ | 183,423 | ||
163
The table below presents information with respect to the fair value of acquired loans, as well as their unpaid principal balance (“Book Balance”) at acquisition date.
| October 20, 2017 | ||||||||
| (In thousands) | Book Balance | Fair Value | ||||||
| Loans: | ||||||||
| Single family residential real estate | $ | 15,111 | $ | 15,096 | ||||
| Commercial real estate | 73,139 | 69,554 | ||||||
| Construction/development/land | 11,706 | 10,390 | ||||||
| Commercial loans | 31,200 | 30,854 | ||||||
| Consumer and other loans | 6,761 | 6,645 | ||||||
| Purchased Credit Impaired | 5,527 | 4,293 | ||||||
| Total acquired loans | $ | 143,444 | $ | 136,832 | ||||
For the loans acquired we first segregated all acquired loans with specifically identified credit deficiency factor(s). The factors we considered to identify loans as PCI loans were all acquired loans that were nonaccrual, 60 days or more past due, designated as TDR, graded “special mention” or “substandard.” These loans were then evaluated to determine estimated fair values as of the acquisition date. As required by generally accepted accounting principles, we are accounting for these loans pursuant to ASC Topic 310-30. The table below summarizes the total contractually required principal and interest cash payments, management’s estimate of expected total cash payments and fair value of the loans as of October 20, 2017 for purchased credit impaired loans. Contractually required principal and interest payments have been adjusted for estimated prepayments.
| October 20, 2017 | ||||
| (In thousands) | ||||
| Contractually required principal and interest | $ | 5,596 | ||
| Non-accretable difference | (689 | ) | ||
| Cash flows expected to be collected | 4,907 | |||
| Accretable yield | (614 | ) | ||
| Total purchased credit-impaired loan acquired | $ | 4,293 | ||
Loans without specifically identified credit deficiency factors are referred to as PULs for disclosure purposes. These loans were then evaluated to determine estimated fair values as of the acquisition date. Although no specific credit deficiencies were identifiable, we believe there is an element of risk as to whether all contractual cash flows will be eventually received. Factors that were considered included the economic environment both nationally and locally as well as the real estate market particularly in Florida. We have applied ASC Topic 310-20 accounting treatment to the PULs.
The Company believes the deposits assumed from the acquisition have an intangible value. In determining the valuation amount, deposits were analyzed based on factors such as type of deposit, deposit retention, interest rates and age of deposit relationships.
Acquisition of Palm Beach Community Bank
On November 3, 2017, the Company completed its acquisition of Palm Beach Community Bank (“PBCB”). PBCB was merged with and into Seacoast Bank. This acquisition added $357 million in total assets, $272 million in loans and $269 million in deposits to Seacoast. PBCB, headquartered in West Palm Beach, Florida, operated four branches in West Palm Beach, two of which were consolidated with Seacoast locations in February 2018.
164
As a result of this acquisition the Company expects to enhance its presence in the Palm Beach, Florida market, expand its customer base and leverage operating cost through economies of scale, and positively affect the Company’s operating results to the extent the Company earns more from interest earning assets than it pays in interest on its interest bearing liabilities.
The Company acquired 100% of the outstanding common stock of PBCB. Under the terms of the definitive agreement, PBCB shareholders received, for each share of PBCB common stock, the combination of $6.26 in cash and 0.9240 shares of Seacoast common stock (based on Seacoast’s closing price of $24.31 per share on November 3, 2017).
| (In thousands, except per share data) | November 3, 2017 | |||
| Shares exchanged for cash | $ | 15,694 | ||
| Number of Palm Beach Community Bank Common shares outstanding | 2,507 | |||
| Per share exchange ratio | 0.9240 | |||
| Number of shares of common stock issued | 2,316 | |||
| Multiplied by common stock price per share on November 3, 2017 | $ | 24.31 | ||
| Value of common stock issued | 56,312 | |||
| Total purchase price | $ | 72,006 | ||
The acquisition was accounted for under the acquisition method in accordance with ASC Topic 805, Business Combinations. The Company recognized goodwill of $33.4 million for this acquisition that is nondeductible for tax purposes. The fair values initially assigned to assets acquired and liabilities assumed are preliminary and could change for up to one year after the closing date of the acquisition as new information and circumstances relative to closing date fair values are known. Determining fair values of assets and liabilities, especially the loan portfolio, core deposit intangibles, and deferred taxes, is a complicated process involving significant judgment regarding methods and assumptions used to calculate estimated fair values.
165
| Date of acquisition | November 3, 2017 | |||
| (In thousands) | ||||
| Assets: | ||||
| Cash | $ | 9,301 | ||
| Investment securities | 22,098 | |||
| Loans, net | 272,090 | |||
| Fixed assets | 7,641 | |||
| Core deposit intangibles | 2,523 | |||
| Goodwill | 33,428 | |||
| Other assets | 9,909 | |||
| Total assets | $ | 356,990 | ||
| Liabilities: | ||||
| Deposits | $ | 268,633 | ||
| Other liabilities | 16,351 | |||
| Total liabilities | $ | 284,984 | ||
The table below presents information with respect to the fair value of acquired loans, as well as their Book Balance at acquisition date.
| November 3, 2017 | ||||||||
| (In thousands) | Book Balance | Fair Value | ||||||
| Loans: | ||||||||
| Single family residential real estate | $ | 30,153 | $ | 30,990 | ||||
| Commercial real estate | 134,705 | 132,654 | ||||||
| Construction/development/land | 69,686 | 67,425 | ||||||
| Commercial loans | 36,076 | 37,083 | ||||||
| Consumer and other loans | 179 | 172 | ||||||
| Purchased Credit Impaired | 4,768 | 3,766 | ||||||
| Total acquired loans | $ | 275,567 | $ | 272,090 | ||||
For the loans acquired we first segregated all acquired loans with specifically identified credit deficiency factor(s). The factors we considered to identify loans as PCI loans were all acquired loans that were nonaccrual, 60 days or more past due, designated as TDR, graded “special mention” or “substandard.” These loans were then evaluated to determine estimated fair values as of the acquisition date. As required by generally accepted accounting principles, we are accounting for these loans pursuant to ASC Topic 310-30. The table below summarizes the total contractually required principal and interest cash payments, management’s estimate of expected total cash payments and fair value of the loans as of November 3, 2017 for purchased credit impaired loans. Contractually required principal and interest payments have been adjusted for estimated prepayments.
166
| (In thousands) | November 3, 2017 | |||
| Contractually required principal and interest | $ | 4,768 | ||
| Non-accretable difference | (1,002 | ) | ||
| Cash flows expected to be collected | 3,766 | |||
| Accretable yield | 0 | |||
| Total purchased credit-impaired loan acquired | $ | 3,766 | ||
Loans without specifically identified credit deficiency factors are referred to as PULs for disclosure purposes. These loans were then evaluated to determine estimated fair values as of the acquisition date. Although no specific credit deficiencies were identifiable, we believe there is an element of risk as to whether all contractual cash flows will be eventually received. Factors that were considered included the economic environment both nationally and locally as well as the real estate market particularly in Florida. We have applied ASC Topic 310-20 accounting treatment to the PULs.
The Company believes the deposits assumed from the acquisition have an intangible value. In determining the valuation amount, deposits were analyzed based on factors such as type of deposit, deposit retention, interest rates and age of deposit relationships.
Pro-Forma Information
Pro-forma data as of 2016 and 2017 present information as if the acquisitions of Gulfshore, NSBC and PBCB occurred at the beginning of 2016:
| Twelve Months Ended December 31, | ||||||||
| (In thousands, except per share data) | 2017 | 2016 | ||||||
| Net interest income | $ | 196,259 | $ | 170,363 | ||||
| Net income available to common shareholders | 51,274 | 41,594 | ||||||
| EPS - basic | $ | 1.11 | $ | 0.97 | ||||
| EPS - diluted | $ | 1.09 | $ | 0.96 | ||||
Acquisition costs included in the Company’s income statement for the years ended December 31, 2017 and December 31, 2016 are $12.9 million and $9.0 million, respectively.
167