Attached files
| file | filename |
|---|---|
| EX-99.1 - EXHIBIT 99.1 - R1 RCM INC. | q32017pressreleasefinal.htm |
| 8-K - 8-K - R1 RCM INC. | a10-318xk.htm |

Third Quarter 2017 Results Conference Call
October 31, 2017
2
Forward-Looking Statements and Non-GAAP Financial Measures
This presentation includes information that may constitute “forward‐looking statements,” made pursuant to the safe harbor
provisions of the Private Securities Litigation Reform Act of 1995. Forward‐looking statements relate to future, not past, events
and often address our expected future growth, plans and performance or forecasts. These forward‐looking statements are often
identified by the use of words such as “anticipate,” “believe,” “designed,” “estimate,” “expect,” “forecast,” “intend,” “may,” “plan,”
“predict,” “project,” “target,” “will,” or “would,” and similar expressions or variations, although not all forward‐looking statements
contain these identifying words. Such forward‐looking statements are based on management’s current expectations about future
events as of the date hereof and involve many risks and uncertainties that could cause our actual results to differ materially from
those expressed or implied in our forward‐looking statements. Subsequent events and developments, including actual results or
changes in our assumptions, may cause our views to change. We do not undertake to update our forward‐looking statements
except to the extent required by applicable law. Readers are cautioned not to place undue reliance on such forward‐looking
statements.
All forward‐looking statements included herein are expressly qualified in their entirety by these cautionary statements. Our actual
results and outcomes could differ materially from those included in these forward‐looking statements as a result of various factors,
including, but not limited to our ability to successfully integrate transitioned Ascension employees, our ability to achieve or
maintain profitability and retain existing customers or acquire new customers, risks associated with the implementation of our
technologies or services with our customers or implementation costs that exceed our expectations, fluctuations in our quarterly
results of operations and cash flows, as well as the factors discussed under the heading “Risk Factors” in our annual report on
Form 10‐K for the year ended December 31, 2016, our 2017 quarterly reports on Form 10‐Q and any other periodic reports that
the Company files with the Securities and Exchange Commission.
This presentation includes the following non‐GAAP financial measures : Gross Cash Generated and Net Cash Generated from
Customer Contracting Activities (on a historical basis), and Adjusted EBITDA (on a projected basis). Please refer to the Appendix
located at the end of this presentation for a reconciliation of the non‐GAAP financial measures to the most directly comparable
GAAP financial measure.
3
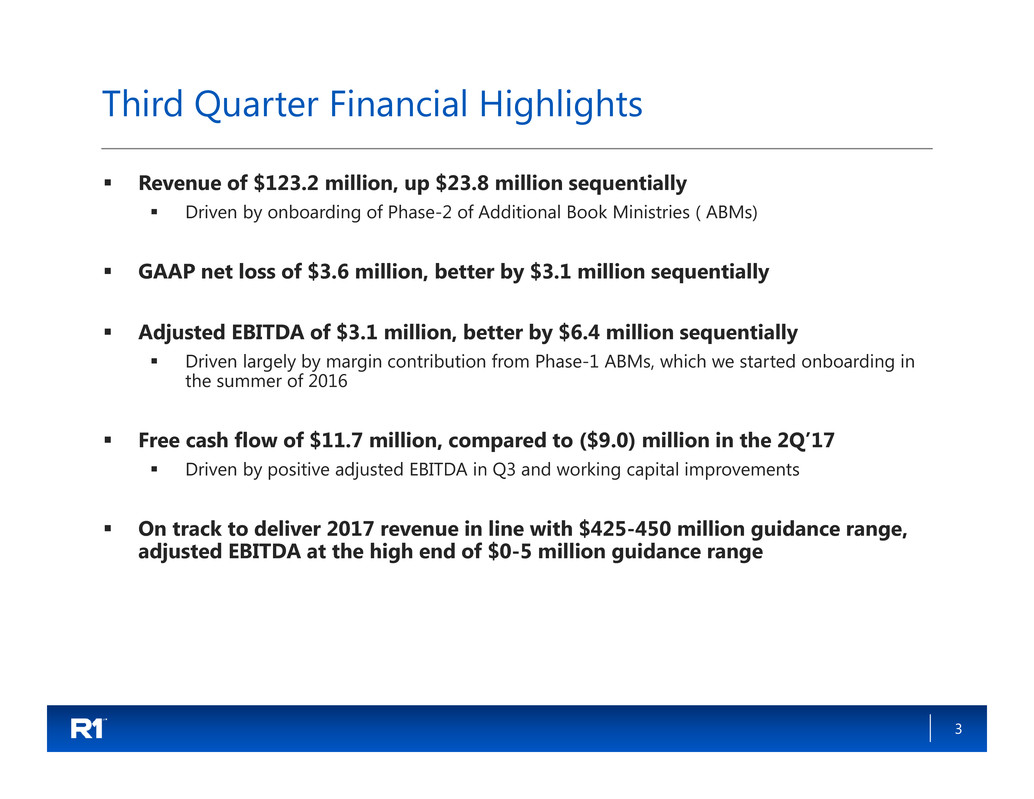
Third Quarter Financial Highlights
Revenue of $123.2 million, up $23.8 million sequentially
Driven by onboarding of Phase-2 of Additional Book Ministries ( ABMs)
GAAP net loss of $3.6 million, better by $3.1 million sequentially
Adjusted EBITDA of $3.1 million, better by $6.4 million sequentially
Driven largely by margin contribution from Phase-1 ABMs, which we started onboarding in
the summer of 2016
Free cash flow of $11.7 million, compared to ($9.0) million in the 2Q’17
Driven by positive adjusted EBITDA in Q3 and working capital improvements
On track to deliver 2017 revenue in line with $425-450 million guidance range,
adjusted EBITDA at the high end of $0-5 million guidance range
4
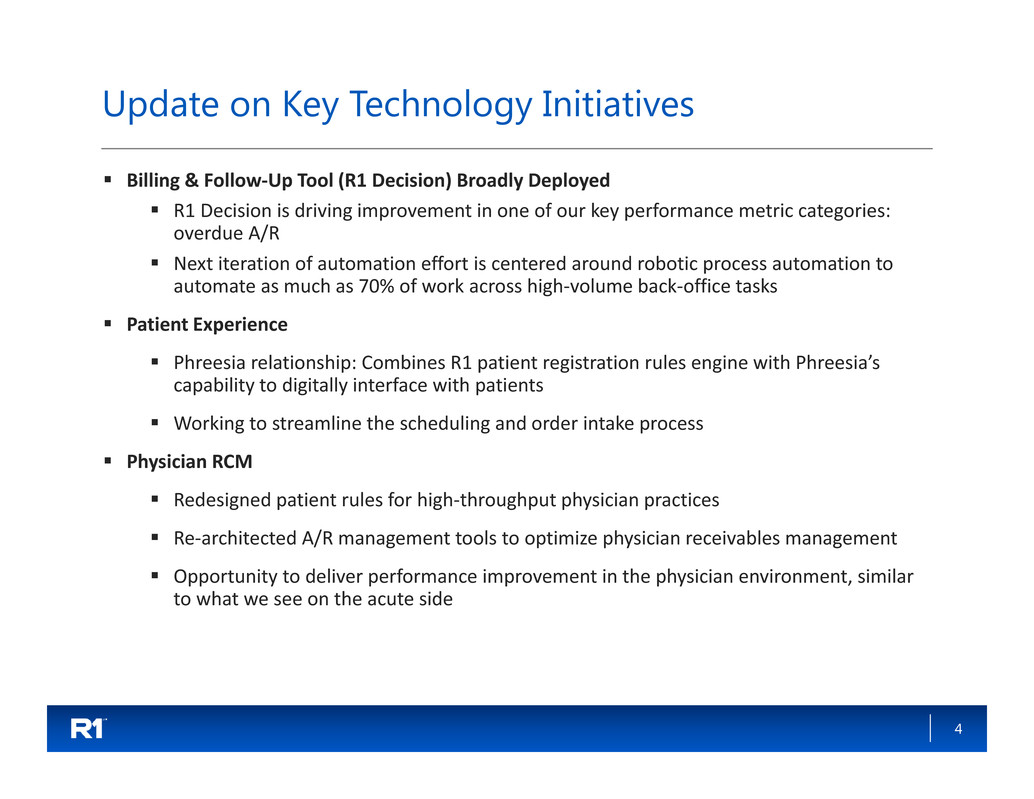
Update on Key Technology Initiatives
Billing & Follow‐Up Tool (R1 Decision) Broadly Deployed
R1 Decision is driving improvement in one of our key performance metric categories:
overdue A/R
Next iteration of automation effort is centered around robotic process automation to
automate as much as 70% of work across high‐volume back‐office tasks
Patient Experience
Phreesia relationship: Combines R1 patient registration rules engine with Phreesia’s
capability to digitally interface with patients
Working to streamline the scheduling and order intake process
Physician RCM
Redesigned patient rules for high‐throughput physician practices
Re‐architected A/R management tools to optimize physician receivables management
Opportunity to deliver performance improvement in the physician environment, similar
to what we see on the acute side
5
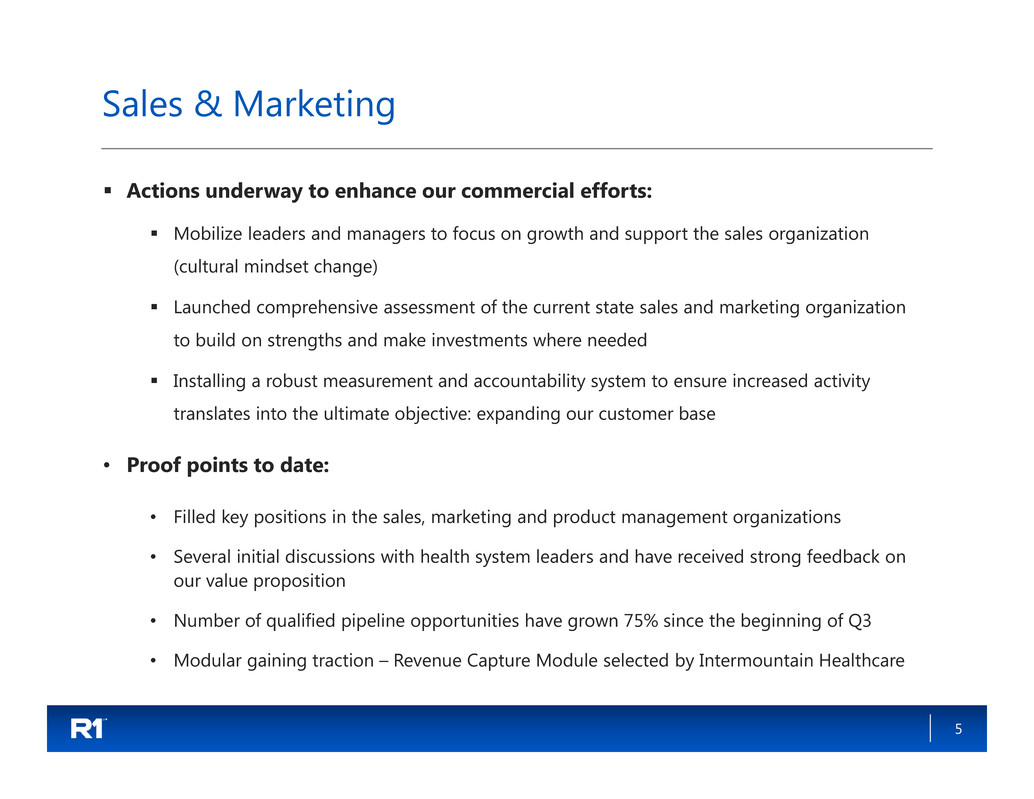
Sales & Marketing
Actions underway to enhance our commercial efforts:
Mobilize leaders and managers to focus on growth and support the sales organization
(cultural mindset change)
Launched comprehensive assessment of the current state sales and marketing organization
to build on strengths and make investments where needed
Installing a robust measurement and accountability system to ensure increased activity
translates into the ultimate objective: expanding our customer base
• Proof points to date:
• Filled key positions in the sales, marketing and product management organizations
• Several initial discussions with health system leaders and have received strong feedback on
our value proposition
• Number of qualified pipeline opportunities have grown 75% since the beginning of Q3
• Modular gaining traction – Revenue Capture Module selected by Intermountain Healthcare
6
Ascension Deployment Update
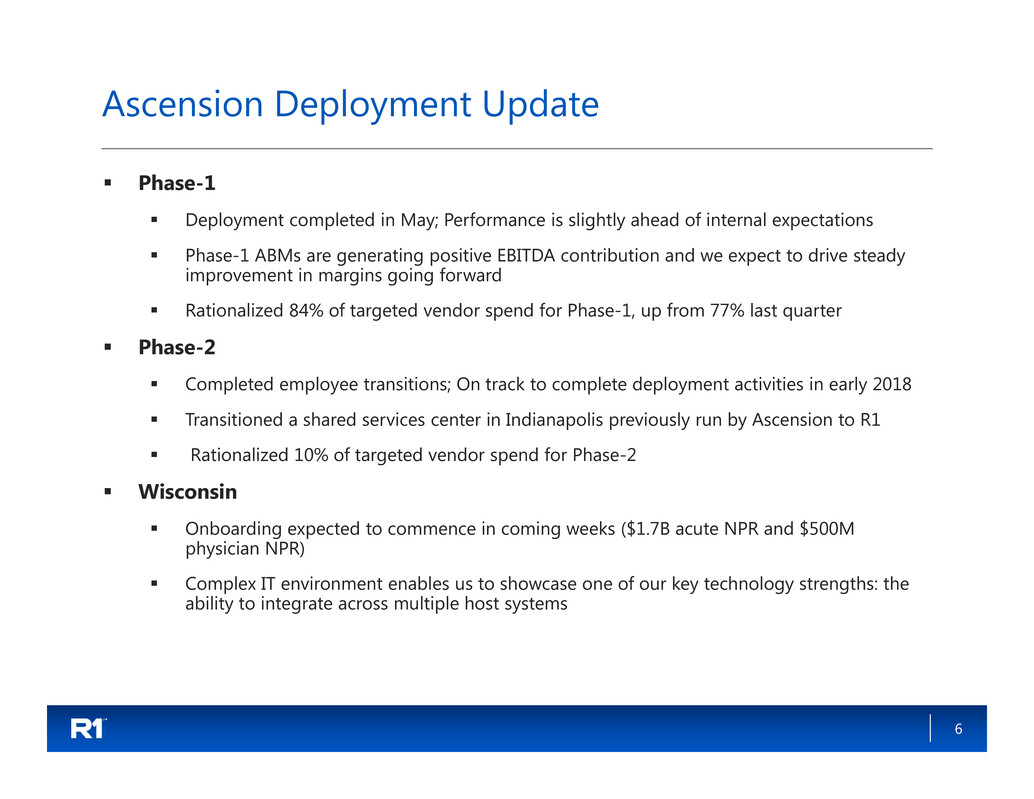
Phase-1
Deployment completed in May; Performance is slightly ahead of internal expectations
Phase-1 ABMs are generating positive EBITDA contribution and we expect to drive steady
improvement in margins going forward
Rationalized 84% of targeted vendor spend for Phase-1, up from 77% last quarter
Phase-2
Completed employee transitions; On track to complete deployment activities in early 2018
Transitioned a shared services center in Indianapolis previously run by Ascension to R1
Rationalized 10% of targeted vendor spend for Phase-2
Wisconsin
Onboarding expected to commence in coming weeks ($1.7B acute NPR and $500M
physician NPR)
Complex IT environment enables us to showcase one of our key technology strengths: the
ability to integrate across multiple host systems
7
3Q’17 non-GAAP Results – Q/Q and Y/Y
Comparison
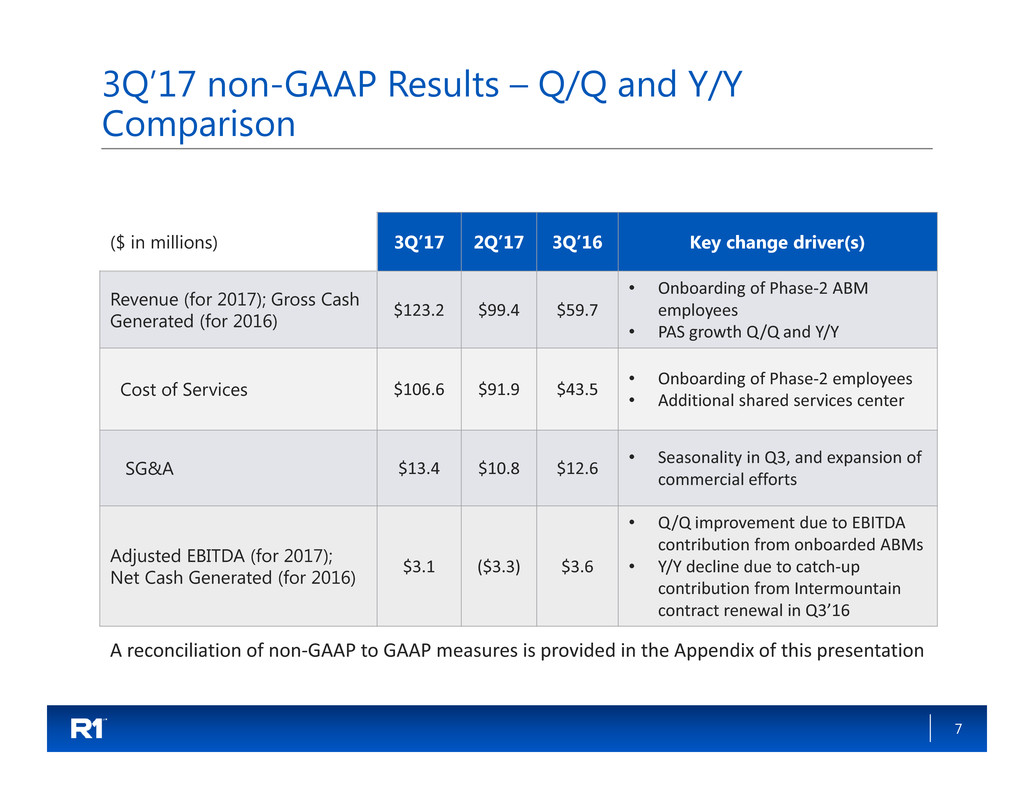
($ in millions) 3Q’17 2Q’17 3Q’16 Key change driver(s)
Revenue (for 2017); Gross Cash
Generated (for 2016)
$123.2 $99.4 $59.7
• Onboarding of Phase‐2 ABM
employees
• PAS growth Q/Q and Y/Y
Cost of Services $106.6 $91.9 $43.5
• Onboarding of Phase‐2 employees
• Additional shared services center
SG&A $13.4 $10.8 $12.6
• Seasonality in Q3, and expansion of
commercial efforts
Adjusted EBITDA (for 2017);
Net Cash Generated (for 2016)
$3.1 ($3.3) $3.6
• Q/Q improvement due to EBITDA
contribution from onboarded ABMs
• Y/Y decline due to catch‐up
contribution from Intermountain
contract renewal in Q3’16
A reconciliation of non‐GAAP to GAAP measures is provided in the Appendix of this presentation
8
Additional Commentary
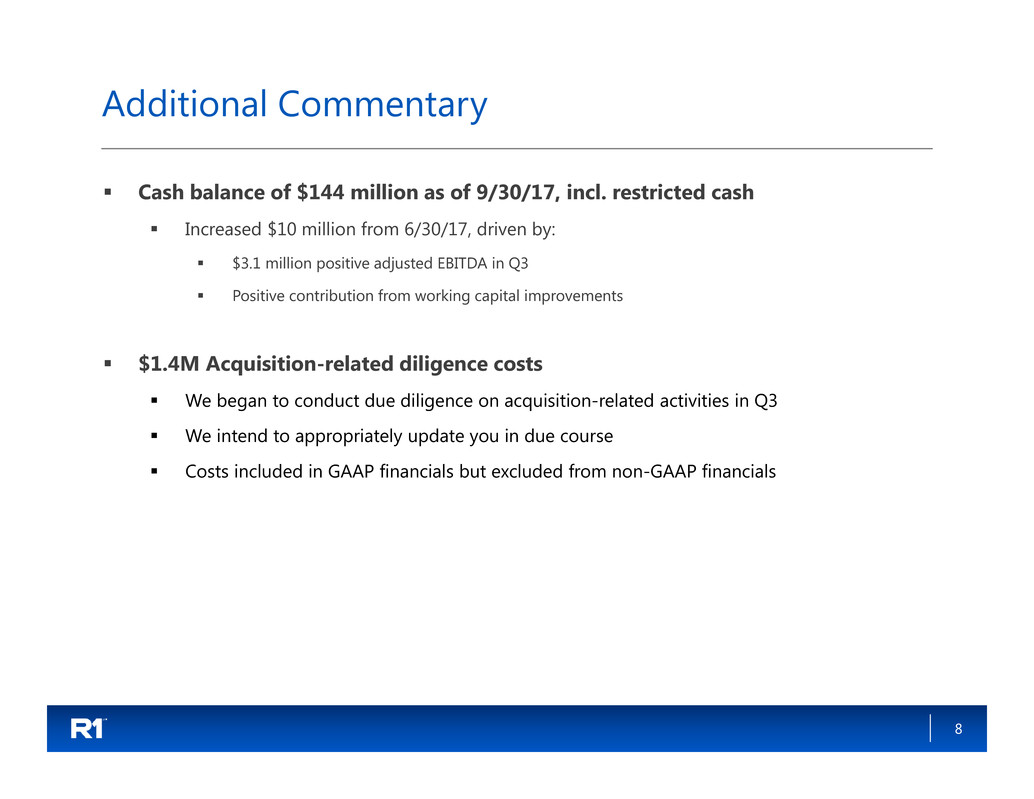
Cash balance of $144 million as of 9/30/17, incl. restricted cash
Increased $10 million from 6/30/17, driven by:
$3.1 million positive adjusted EBITDA in Q3
Positive contribution from working capital improvements
$1.4M Acquisition-related diligence costs
We began to conduct due diligence on acquisition-related activities in Q3
We intend to appropriately update you in due course
Costs included in GAAP financials but excluded from non-GAAP financials
9
2017 Guidance
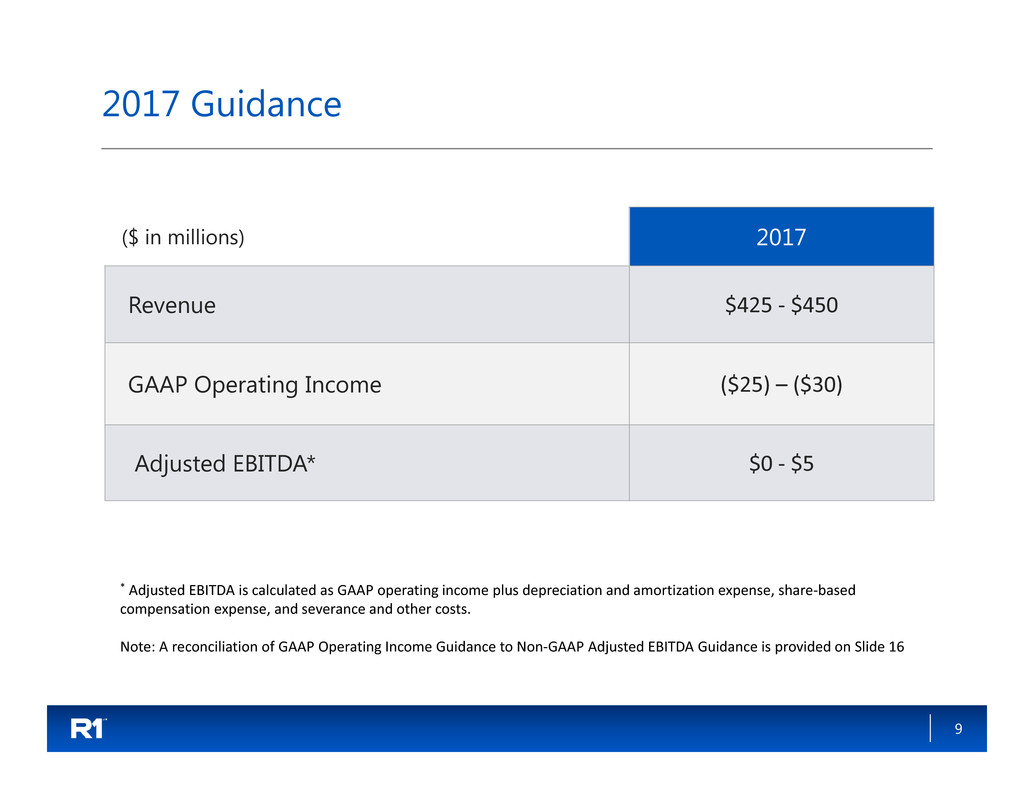
($ in millions) 2017
Revenue $425 ‐ $450
GAAP Operating Income ($25) – ($30)
Adjusted EBITDA* $0 ‐ $5
* Adjusted EBITDA is calculated as GAAP operating income plus depreciation and amortization expense, share‐based
compensation expense, and severance and other costs.
Note: A reconciliation of GAAP Operating Income Guidance to Non‐GAAP Adjusted EBITDA Guidance is provided on Slide 16
10
Appendix
11
Use of Non-GAAP Financial Measures
In order to provide a more comprehensive understanding of the information used by R1’s management team in financial and
operational decision making, the Company supplements its GAAP consolidated financial statements with certain non-GAAP
financial measures, which are included in this presentation.
For the three and nine months ended September 30, 2017: As of January 1, 2017, the Company adopted Accounting Standards
Update ("ASU") No. 2014-09, Revenue from Contracts with Customers (Topic 606). Subsequent to adoption of Topic 606, the
non-GAAP financial measure referenced in the press release is adjusted EBITDA. Adjusted EBITDA is defined as GAAP net income
before net interest income, income tax provision, depreciation and amortization expense, share-based compensation expense,
and severance & certain other items.
For the three and nine months ended September 30, 2017 : Prior to the adoption of Topic 606, non-GAAP financial measures
utilized by the company included gross cash generated from customer contracting activities, and net cash generated from
customer contracting activities. Gross cash generated from customer contracting activities was defined as GAAP net services
revenue, plus the change in deferred customer billings. Accordingly, gross cash generated from customer contracting activities
is the sum of (i) invoiced or accrued net operating fees, (ii) cash collections on incentive fees and (iii) other services fees. Net
cash generated from customer contracting activities was defined as net income before net interest income, income tax
provision, depreciation and amortization expense, share-based compensation expense, and severance and certain other items.
Deferred customer billings included the portion of both (i) invoiced or accrued net operating fees and (ii) cash collections of
incentive fees, in each case, that have not met our revenue recognition criteria. Deferred customer billings are included in the
detail of our customer liabilities and customer liabilities – related party balance in the condensed consolidated balance sheets
available in the Company’s Quarterly Report on Form 10-Q for the three months ended September 30, 2016.
Our Board and management team use non-GAAP measures as (i) one of the primary methods for planning and forecasting
overall expectations and for evaluating actual results against such expectations and (ii) a performance evaluation metric in
determining achievement of certain executive incentive compensation programs, as well as for incentive compensation
programs for employees.
Free cash flow is defined as cash flow from operations less capital expenditures.
These adjusted measures are non-GAAP and should be considered in addition to, but not as a substitute for, the information
prepared in accordance with GAAP.
12
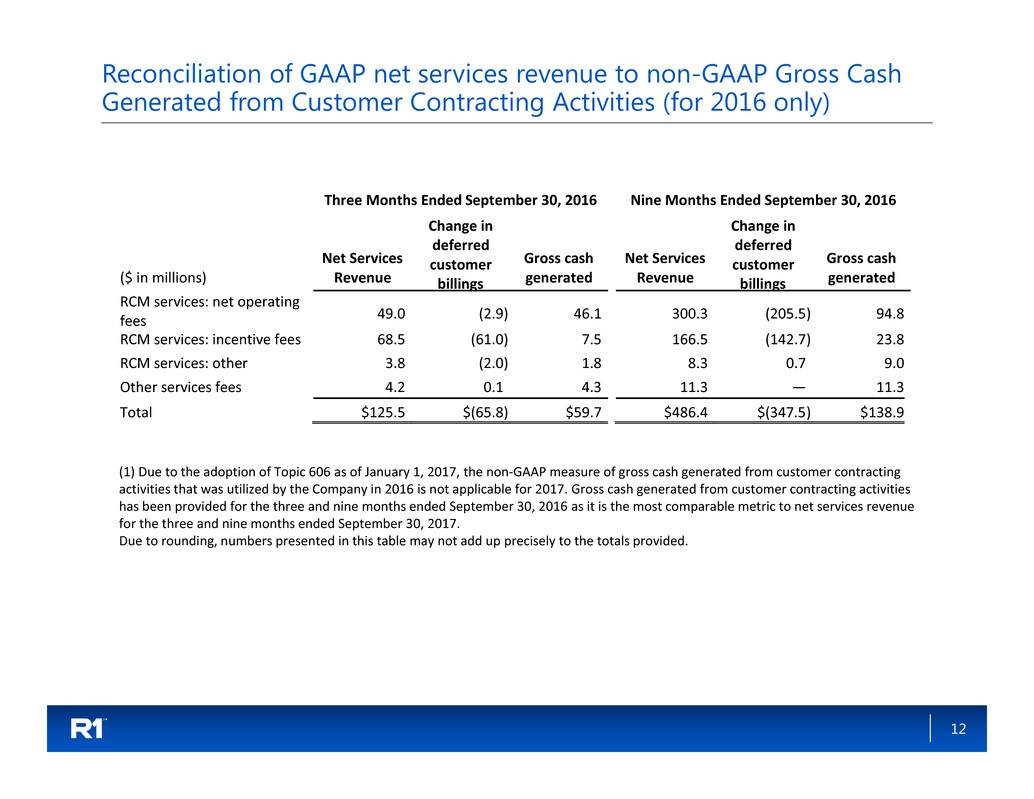
Reconciliation of GAAP net services revenue to non-GAAP Gross Cash
Generated from Customer Contracting Activities (for 2016 only)
(1) Due to the adoption of Topic 606 as of January 1, 2017, the non‐GAAP measure of gross cash generated from customer contracting
activities that was utilized by the Company in 2016 is not applicable for 2017. Gross cash generated from customer contracting activities
has been provided for the three and nine months ended September 30, 2016 as it is the most comparable metric to net services revenue
for the three and nine months ended September 30, 2017.
Due to rounding, numbers presented in this table may not add up precisely to the totals provided.
Three Months Ended September 30, 2016 Nine Months Ended September 30, 2016
($ in millions)
Net Services
Revenue
Change in
deferred
customer
billings
Gross cash
generated
Net Services
Revenue
Change in
deferred
customer
billings
Gross cash
generated
RCM services: net operating
fees 49.0 (2.9) 46.1
300.3 (205.5) 94.8
RCM services: incentive fees 68.5 (61.0) 7.5 166.5 (142.7) 23.8
RCM services: other 3.8 (2.0) 1.8 8.3 0.7 9.0
Other services fees 4.2 0.1 4.3 11.3 — 11.3
Total $125.5 $(65.8) $59.7 $486.4 $(347.5) $138.9
13
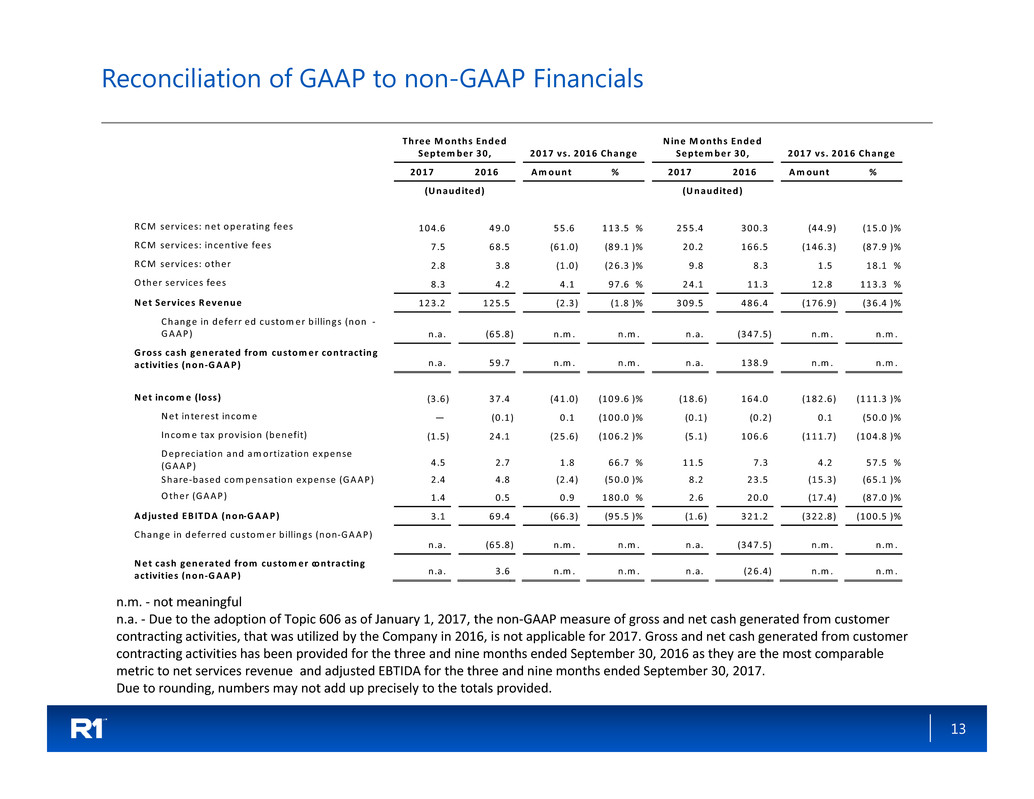
Reconciliation of GAAP to non-GAAP Financials
n.m. ‐ not meaningful
n.a. ‐ Due to the adoption of Topic 606 as of January 1, 2017, the non‐GAAP measure of gross and net cash generated from customer
contracting activities, that was utilized by the Company in 2016, is not applicable for 2017. Gross and net cash generated from customer
contracting activities has been provided for the three and nine months ended September 30, 2016 as they are the most comparable
metric to net services revenue and adjusted EBTIDA for the three and nine months ended September 30, 2017.
Due to rounding, numbers may not add up precisely to the totals provided.
Three Months Ended
Septem ber 30, 2017 vs. 2016 Change
Nine Months Ended
September 30, 2017 vs. 2016 Change
2017 2016 Amount % 2017 2016 Amount %
(Unaudited) (Unaudited)
RCM services: net operating fees 104.6 49.0 55.6 113.5 % 255.4 300.3 (44.9) (15.0 )%
RCM services: incentive fees 7.5 68.5 (61 .0) (89.1 )% 20.2 166.5 (146.3) (87.9 )%
RCM services: other 2.8 3.8 (1.0) (26.3 )% 9.8 8.3 1.5 18.1 %
Other services fees 8.3 4.2 4 .1 97.6 % 24.1 11.3 12.8 113.3 %
Net Serv ices Revenue 123.2 125.5 (2.3) (1 .8 )% 309.5 486.4 (176.9) (36.4 )%
Change in deferr ed custom er billings (non ‐
GAAP)
n.a. (65.8) n.m . n.m . n.a. (347.5) n .m . n.m .
Gross cash generated from custom er contracting
activ ities (non‐GAAP)
n.a. 59.7 n.m . n.m . n.a. 138.9 n.m . n.m .
Net income (loss) (3 .6) 37.4 (41 .0) (109.6 )% (18.6) 164.0 (182.6) (111.3 )%
Net in terest incom e — (0.1) 0.1 (100.0 )% (0.1) (0 .2) 0.1 (50.0 )%
Income tax provision (benefit) (1 .5) 24.1 (25 .6) (106.2 )% (5.1) 106.6 (111.7) (104.8 )%
Depreciation and am ortization expense
(GAAP)
4.5 2.7 1.8 66.7 % 11.5 7.3 4.2 57.5 %
Share‐based compensation expense (GAAP) 2.4 4.8 (2.4) (50.0 )% 8.2 23.5 (15.3) (65.1 )%
Other (GAAP) 1.4 0.5 0.9 180.0 % 2.6 20.0 (17.4) (87.0 )%
Adjusted EB ITDA (non‐GAAP) 3.1 69.4 (66 .3) (95.5 )% (1.6) 321.2 (322.8) (100.5 )%
Change in deferred custom er billings (non‐GAAP)
n.a. (65.8) n.m . n.m . n.a. (347.5) n .m . n.m .
Net cash generated from customer contracting
activ ities (non‐GAAP)
n.a. 3 .6 n.m . n.m . n.a. (26.4) n .m . n.m .
14
Share-Based Compensation and D&A Expense included within Operating
Expenses
Share‐Based Compensation Expense Allocation Details
Depreciation and Amortization Expense Allocation Details
$ in millions
$ in millions
Three Months Ended
September 30,
Nine Months Ended
September 30,
2017 2016 2017 2016
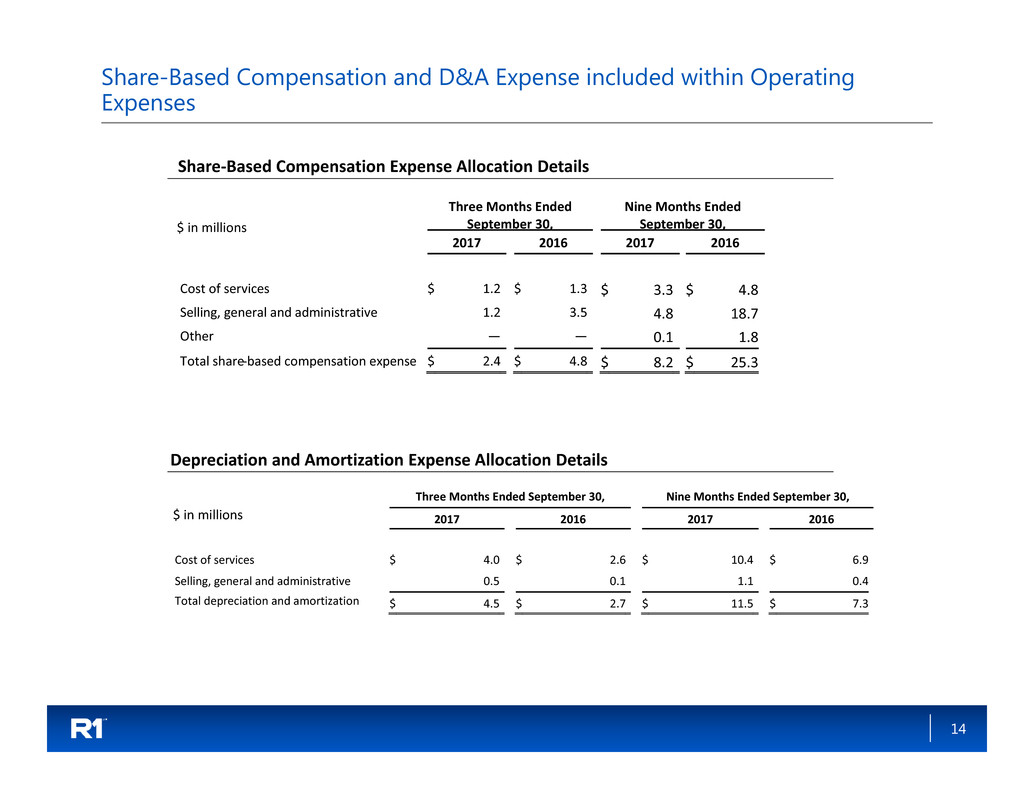
Cost of services $ 1.2 $ 1.3 $ 3.3 $ 4.8
Selling, general and administrative 1.2 3.5 4.8 18.7
Other — — 0.1 1.8
Total share‐based compensation expense $ 2.4 $ 4.8 $ 8.2 $ 25.3
Three Months Ended September 30, Nine Months Ended September 30,
2017 2016 2017 2016
Cost of services $ 4.0 $ 2.6 $ 10.4 $ 6.9
Selling, general and administrative 0.5 0.1 1.1 0.4
Total depreciation and amortization $ 4.5 $ 2.7 $ 11.5 $ 7.3
15
Consolidated non-GAAP Financial Information
$ in millions
(1) Excludes share‐based compensation, depreciation and amortization and other costs
(2) Due to the adoption of Topic 606 as of January 1, 2017, the non‐GAAP measure of gross and net cash generated from customer
contracting activities that were utilized by the Company in 2016 are not applicable for 2017. Gross and net cash generated from customer
contracting activities have been provided for the three and nine months ended September 30, 2016 as they are the most comparable
metric to net services revenue and adjusted EBITDA, respectively, for the three and nine months ended September 30, 2017.
Three Months Ended September 30, Nine Months Ended September 30,
2017 2016 2017 2016
(Unaudited) (Unaudited)
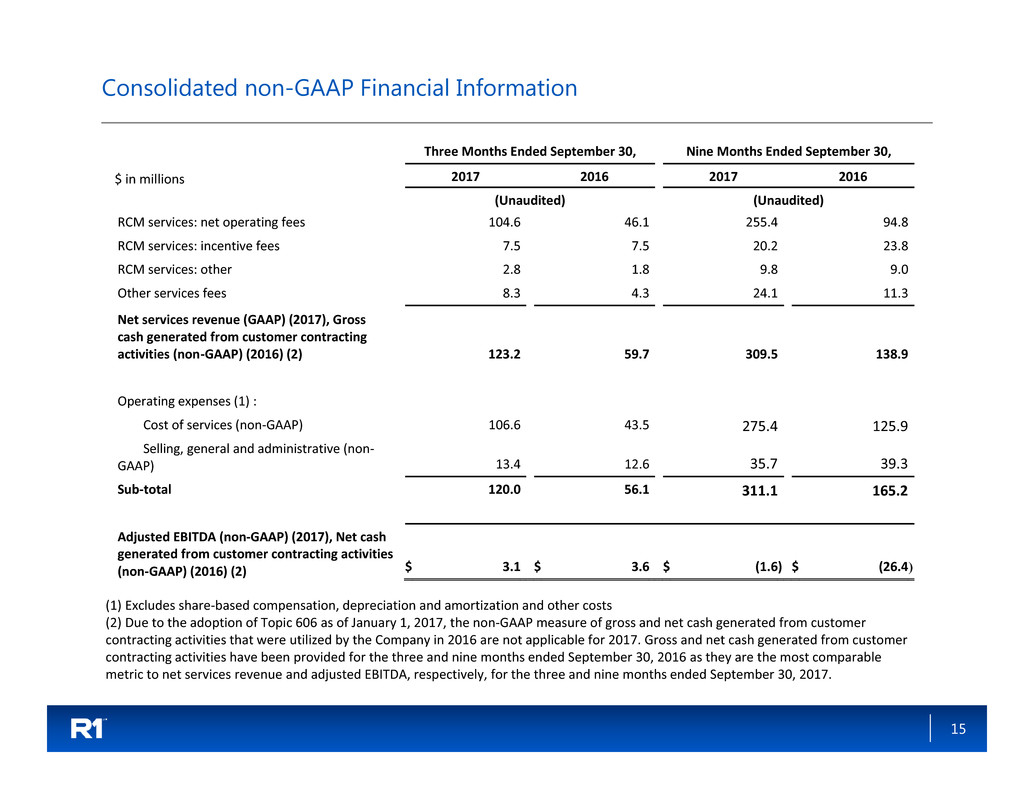
RCM services: net operating fees 104.6 46.1 255.4 94.8
RCM services: incentive fees 7.5 7.5 20.2 23.8
RCM services: other 2.8 1.8 9.8 9.0
Other services fees 8.3 4.3 24.1 11.3
Net services revenue (GAAP) (2017), Gross
cash generated from customer contracting
activities (non‐GAAP) (2016) (2) 123.2 59.7 309.5 138.9
Operating expenses (1) :
Cost of services (non‐GAAP) 106.6 43.5 275.4 125.9
Selling, general and administrative (non‐
GAAP) 13.4 12.6 35.7 39.3
Sub‐total 120.0 56.1 311.1 165.2
Adjusted EBITDA (non‐GAAP) (2017), Net cash
generated from customer contracting activities
(non‐GAAP) (2016) (2) $ 3.1 $ 3.6 $ (1.6) $ (26.4)
16
Reconciliation GAAP Operating Income Guidance to non-GAAP Adjusted EBITDA
Guidance
$ in millions
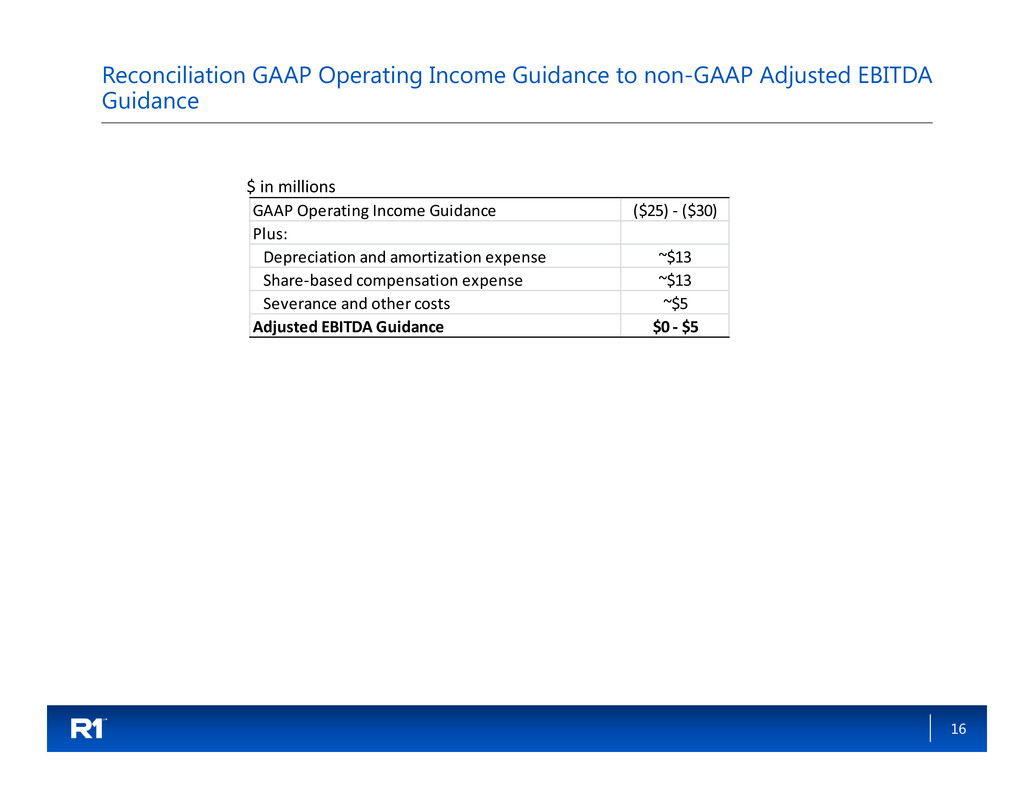
GAAP Operating Income Guidance ($25) ‐ ($30)
Plus:
Depreciation and amortization expense ~$13
Share‐based compensation expense ~$13
Severance and other costs ~$5
Adjusted EBITDA Guidance $0 ‐ $5
