Attached files
| file | filename |
|---|---|
| EX-99.1 - EXHIBIT 99.1 - BROADWIND, INC. | exh_991.htm |
| 8-K - FORM 8-K - BROADWIND, INC. | f8k_103117.htm |
EXHIBIT 99.2

Q3 2017 Earnings Call October 31, 2017
Industry Data and Forward - Looking Statements Disclaimer ▪ Broadwind obtained the industry and market data used throughout this presentation from our own research, internal surveys and st udies conducted by third parties, independent industry associations or general publications and other publicly available informatio n. Independent industry publications and surveys generally state that they have obtained information from sources believed to be reliable, but do not gu arantee the accuracy or completeness of such information. Forecasts are particularly likely to be inaccurate, especially over long periods of time. W e a re not aware of any misstatements in the industry data we have presented herein, but estimates involve risks and uncertainties and a re subject to change based on various factors beyond our control. ▪ This presentation contains “forward - looking statements ”, as defined in Section 21E of the Securities Exchange Act of 1934, as amended. Forward - looking statements include any statement that does not directly relate to a current or historical fact. Our forward - look ing statements may include or relate to our beliefs, expectations, plans and/or assumptions with respect to the following: (i ) state, local and federal regulatory frameworks affecting the industries in which we compete, including the wind energy industry, and the related extension, conti nua tion or renewal of federal tax incentives and grants and state renewable portfolio standards; (ii) our customer relationships and efforts to div ers ify our customer base and sector focus and leverage customer relationships across business units; (iii) our ability to continue to grow our busines s o rganically and through acquisitions; (iv) the sufficiency of our liquidity and alternate sources of funding, if necessary; (v) our ability t o r ealize revenue from customer orders and backlog; (vi) our ability to operate our business efficiently, manage capital expenditures and costs effe cti vely, and generate cash flow; (vii) the economy and the potential impact it may have on our business, including our customers; (viii) the state of the wind energy market and other energy and industrial markets generally and the impact of competition and economic volatility in those marke ts; (ix) the effects of market disruptions and regular market volatility, including fluctuations in the price of oil, gas and other commodities; (x) the effects of the recent change of administrations in the U.S. federal government; (xi) our ability to successfully integrate and operate the business of Red Wolf Company, LLC and to identify, negotiate and execute future acquisitions; and (xii) the potential loss of tax benefits if we experience an “ownership change” under Section 382 of the Internal Revenue Code of 1986, as amended. These statements are based on information currently available to us and are subject to various risks, uncertainties and other factors. We are under no duty to update any of these statements. You sh oul d not consider any list of such factors to be an exhaustive statement of all of the risks, uncertainties or other factors that could cause our c urr ent beliefs, expectations, plans and/or assumptions to change. ▪ This presentation contains non - GAAP financial information. We believe that certain non - GAAP financial measures may provide users of this financial information with meaningful comparisons between current results and results in prior operating periods. We believe tha t these non - GAAP financial measures can provide additional meaningful reflection of underlying trends of the business because they provide a c omp arison of historical information that excludes certain infrequently occurring or non - operational items that impact the overall comparabili ty. Non - GAAP financial measures should be viewed in addition to, and not as an alternative to, our reported results prepared in accordance wi th GAAP. Please see our earnings release dated October 31, 2017 for a reconciliation of certain non - GAAP measures presented in this presentation. October 31, 2017 2 © 2017 Broadwind Energy, Inc. All rights reserved.

Highlights October 31, 2017 ▪ Q3 revenue of $30 million due to Tower weakness, offset by growth in other segments ▪ Oil and gas markets remain strong; mining demand accelerating ▪ Gearing segment results improved but fall short of expectation ▪ Process Systems is accretive in quarter, although short of earn - out targets ▪ Successful cost reduction removes $1.1 million of overhead in quarter ▪ Credit line balance declines to $8 million - $12 million additional availability on line 3 © 2017 Broadwind Energy, Inc. All rights reserved.
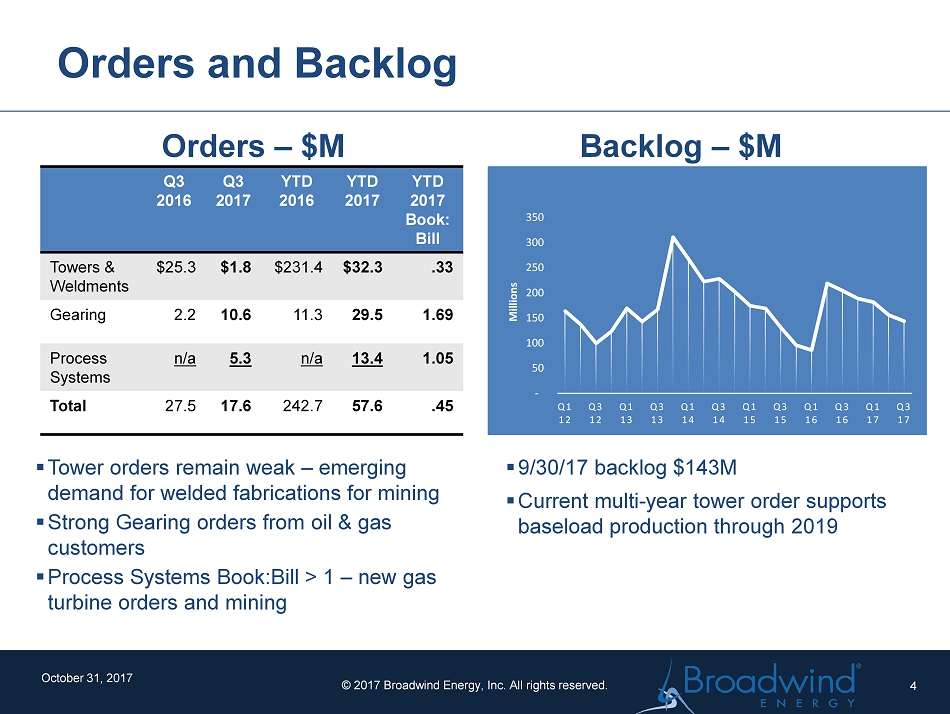
Orders and Backlog Orders – $M ▪ Tower orders remain weak – emerging demand for welded fabrications for mining ▪ Strong Gearing orders from oil & gas customers ▪ Process Systems Book:Bill > 1 – new gas turbine orders and mining Backlog – $M ▪ 9 /30/17 backlog $143M ▪ Current multi - year tower order supports baseload production through 2019 October 31, 2017 - 50 100 150 200 250 300 350 Q1 12 Q3 12 Q1 13 Q3 13 Q1 14 Q3 14 Q1 15 Q3 15 Q1 16 Q3 16 Q1 17 Q3 17 Millions Q3 2016 Q3 2017 YTD 2016 YTD 2017 YTD 2017 Book: Bill Towers & Weldments $25.3 $1.8 $231.4 $32.3 .33 Gearing 2.2 10.6 11.3 29.5 1.69 Process Systems n/a 5.3 n/a 13.4 1.05 Total 27.5 17.6 242.7 57.6 .45 4 © 2017 Broadwind Energy, Inc. All rights reserved.

US Wind Market Update October 31, 2017 Source: MAKE Global Wind Market Outlook Update Development Pipeline - GW Source: AWEA Q3 2017 Market Report 5 ▪ Pipeline of projects under construction or in advanced development continues to grow – 27% increase vs. Q3 2016 ▪ Adv. dev means turbines ordered, PPA signed or utility owned ▪ Little change vs. prior quarter ▪ Slight shift of demand toward PTC - expiration year ▪ Post - PTC uncertainty remains © 2017 Broadwind Energy, Inc. All rights reserved. 0 5 10 15 20 25 30 35 Q1 16 Q2 16 Q3 16 Q4 16 Q1 17 Q2 17 Q3 17 Under construction at QE Adv. Development Evolving Forecast – GW Installations 6 7 8 9 10 11 12 13 2015a 2016a 2017e 2018e 2019e 2020e Q4 2016 FC Q2 2017 FC Q3 2017 FC

*Excluding automotive 6 US Gearing Production Increasing Sources: AGMA & IHS ▪ US market reached inflection point in 2016 ▪ BWEN’s gearing market generally growing faster ▪ Gearing plant configuration has been modified for improved efficiency and production flexibility 5.1% CAGR US Gear Demand by Market 2014 - 2016 CAGR 2017 - 2019 CAGR Turbines/Power - 11.5% 9.5% Oil & Gas - 24.7% 17.4% Mining - 19.8% 7.8% Other Industrial - 7.5% 5.3% US Total - 8.9% 6.2% Source: IHS Markit August 2017 0 500 1,000 1,500 2,000 2,500 3,000 3,500 4,000 2015a 2016a 2017e 2018e 2019e 2020e $M US Gear Production

7 © 2017 Broadwind Energy, Inc. All rights reserved. Global Gas Turbine Market October 31, 2017 ▪ Red Wolf sales concentrated in gas turbine market – new units and aftermarket ▪ New unit market deliveries running well behind 2016, although back - end loading not unusual ▪ Industry experts predicting ~3% annual growth rate 2018 - 2020 Sources: McCoy Power Reports 0 10 20 30 40 50 60 70 80 0 50 100 150 200 250 300 350 400 450 500 2012 2013 2014 2015 2016 Capacity (GW) # of Units # of Units GW Global Gas Turbine Orders (Utility and IPP segment ) 2016 2017 Units 132 100 259 GW 24 17 42 First Half Memo: 2016 Full Year

BWEN Consolidated Financial Results October 31, 2017 ▪ Q3 17 sales down from Q3 16 – lower tower sales volumes, partially offset by added Red Wolf sales and increased Gearing sales ▪ Operating loss for Q3 17 due to low tower volume, partially offset by reductions in m anufacturing overhead and operating expenses ▪ Adj. EBITDA of $.9 million in Q3 17 – includes $1.4M release of Red Wolf earn out payment 8 © 2017 Broadwind Energy, Inc. All rights reserved. Q3 16 Q3 17 YTD 16 YTD 17 Total Sales $42.6 $29.6 $132.7 $129.0 Gross Profit 5.3 1.0 13.4 11.3 Gross Profit % 12.5% 3.4% 10.1% 8.7% Operating Expense 4.0 2.8 12.1 12.0 Operating Income/(Loss) 1.4 - 1.8 1.3 - 0.7 % of sales 3.2% - 6.2% 1.0% - 0.5% Adj. EBITDA 3.3 0.9 7.1 6.7 % of sales 7.7% 2.9% 5.4% 5.2% EPS, Continuing 0.08 - 0.14 0.06 0.25 $M except as noted otherwise

Towers and Weldments Q3 2016 Q3 2017 YTD 2016 YTD 2017 Orders ($M) $25.3 $1.8 $231.4 $32.3 Towers Sold (#) 113 42 339 263 Revenue ($M) 38.0 16.0 117.9 99.2 Operating Inc/Loss ($M) 4.1 - 1.5 10.0 7.2 - % of Sales 10.7 - 9.2 8.5 7.2 EBITDA* ($M) 5.1 - 0.2 13.3 10.8 - % of Sales 13.4 - 1.0 11.2 10.9 Q3 Results ▪ Tower orders remain weak – emerging demand for welded fabrications for mining ▪ Q3 17 tower count down to 42 as customers work down inventories ▪ Operating loss due to low tower volume, partially offset by lower manufacturing overhead and operating expense ▪ YTD EBITDA margin 10.9% Current Objectives ▪ Aggressive cost management in response to soft demand ▪ Complete capital investments to provide better production flexibility ▪ Diversify tower customer base and grow weldment business October 31, 2017 * Reconciliation to non - GAAP measure included in Appendix 9 © 2017 Broadwind Energy, Inc. All rights reserved. 0 100 200 300 400 500 2015a 2016a 2017e # of towers BWEN Annual Tower Sales

Gearing Q3 2016 Q3 2017 YTD 2016 YTD 2017 Orders ($M) 2.2 10.6 11.3 29.5 Revenue ($M) 4.6 7.6 14.8 17.5 Operating Loss ($M) - 0.7 - 0.4 - 3.1 - 2.6 EBITDA* ($M) 0.0 0.3 - 1.1 - 0.6 Q3 Results ▪ Orders continue to be strong primarily from oil & gas customers ▪ Revenue up 65% in Q3 and 18% YTD ▪ Plant layout reconfigured to boost productivity ▪ Operating loss improved – increased volume and productivity, partly offset by ramp - up expenses October 31, 2017 Current Objectives ▪ Leverage expanded sales resources to improve capacity utilization ▪ Continue CI events to improve production flow ▪ Continue aggressive cost management ▪ Positive EBITDA for 2017 — trending to positive operating income ▪ Complete rationalization of manufacturing footprint/finalize environmental remediation * Reconciliation to non - GAAP measure included in Appendix 10 © 2017 Broadwind Energy, Inc. All rights reserved. 0 10 20 30 40 50 2013a 2014a 2015a 2016a 2017e $ M Gearing Revenue by Market Oil & Gas Mining Wind Industrial Steel

October 31, 2017 Process Systems Q3 2016 Q3 2017 YTD 2016 YTD 2017 Orders ($M) n/a 5.3 n/a 13.4 Revenue ($M) n/a 6.1 n/a 12.3 Operating Profit/(Loss) ($M) n/a 0.1 n/a - 1.8 EBITDA* ($M) n/a 0.6 n/a - 0.5 * Reconciliation to non - GAAP measure included in Appendix Q3 Results ▪ Process Systems includes Abilene - based CNG, and Red Wolf as of Feb 1, 2017 ▪ Q3 orders up sequentially due to increased weldment orders ▪ Q3 17 revenue double Q2 17 Current Objectives ▪ Complete integration of Red Wolf into BWEN ▪ Grow Red Wolf business by expanding customer base and entering new markets ▪ Refine procurement process to support scaling up business 11 © 2017 Broadwind Energy, Inc. All rights reserved.

$- $0.05 $0.10 $0.15 $0.20 Operating Working Capital (OWC) October 31, 2017 ▪ Q3 OWC cents/$ sales flat compared to Q2 17 ▪ OWC dollars decreased as expected, due to lower sales and the timing of customer receipts * Operating Working Capital = Trade A/R + Inventories – Trade Payables – Customer Deposits 12/31/16 3/31/17 6/30/17 9/30/17 DSO 22 39 45 29 Inv. Turns 8.2 7.7 7.4 7.7 DPO 33 36 34 21 Cash Conv. (days) 0 28 50 48 OWC $M - 0.8 16.3 23.0 15.5 OWC* Historical Trend – cents/$ sales OWC* Management 12 © 2017 Broadwind Energy, Inc. All rights reserved.

Balance Sheet and Capital Expenditures October 31, 2017 $1.6 $6.2 $6.0 2015 2016 2017 YTD Cap Ex Actual $M Capital Expenditures ▪ Debt declined by $6M due to working capital reduction ▪ CIBC (previously The Private Bank) $25M credit line had $12M of additional availability at quarter - end ▪ Capital expenditures totaled $1.7M in Q3 17, $6.0M YTD – above normal 2% of sales run rate due to Abilene expansion 12/31/2016 6/30/2017 9/30/2017 Cash Assets 21.9$ 0.2$ 0.0$ Accounts Receivable 11.9 21.5 9.3 Inventory 21.2 21.3 15.4 PPE 54.6 57.4 56.5 Other 8.1 24.6 24.1 Total Assets 117.7 125.0 105.3 Accounts Payable 15.9 14.6 7.1 Customer Deposits 18.0 5.2 2.1 Debt + Cap. Leases 4.1 19.1 12.9 Other 11.1 11.5 10.4 Total Liabilities 49.1 50.4 32.5 Equity 68.6 74.6 72.8 (In Millions) 13 © 2017 Broadwind Energy, Inc. All rights reserved. % of sales 0.8% 3.4% 4.6%
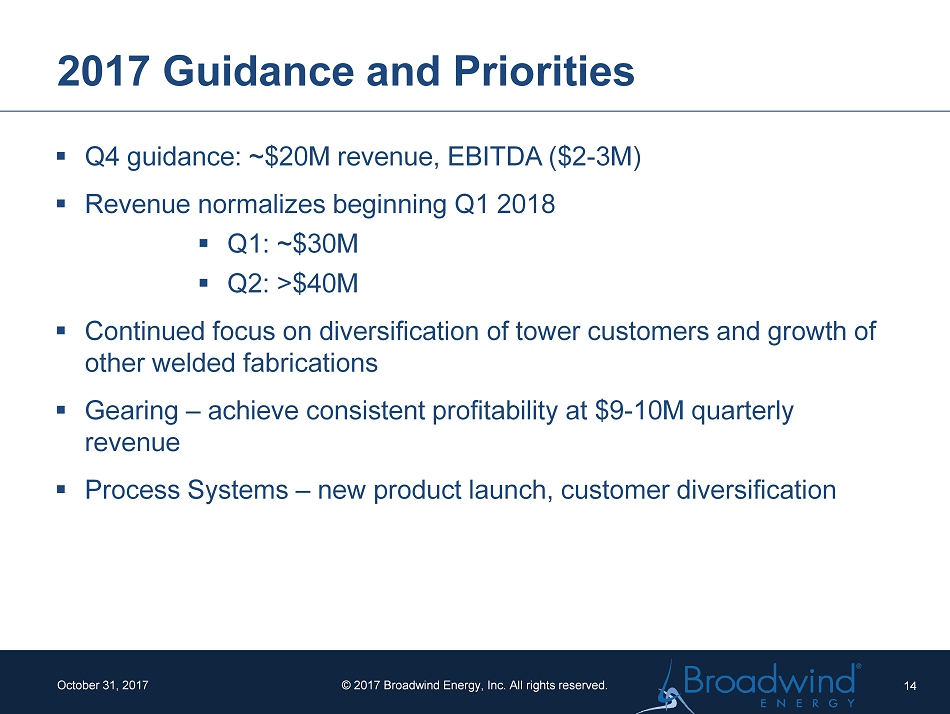
2017 Guidance and Priorities October 31, 2017 ▪ Q4 g uidance: ~$20M revenue, EBITDA ($2 - 3M) ▪ Revenue normalizes beginning Q1 2018 ▪ Q1: ~$30M ▪ Q2: >$40M ▪ Continued focus on diversification of tower customers and growth of other welded fabrications ▪ Gearing – achieve consistent profitability at $9 - 10M quarterly revenue ▪ Process Systems – new product launch, customer diversification 14 © 2017 Broadwind Energy, Inc. All rights reserved.

Appendix October 31, 2017 15 © 2017 Broadwind Energy, Inc. All rights reserved. Consolidated 2017 2016 2017 2016 Net Income/(Loss) from continuing operations…………………………….(2,049)$ 1,245$ 3,745$ 929$ Interest Expense…………………………………. 228 125 584 431 Income Tax Provision/(Benefit)……………………………… (22) 0 (5,056) (16) Depreciation and Amortization………………………………………………………………2,267 1,695 6,571 5,138 Share-based Compensation and Other Stock Payments………………………………………………………………439 195 900 628 Adjusted EBITDA (Non-GAAP)………………… 863$ 3,260$ 6,744$ 7,110$ Three Months Ended September 30, Nine Months Ended September 30, Towers and Weldments Segment 2017 2016 2017 2016 Net Income…...……………………………. (901)$ 2,797$ 5,127$ 6,738$ Interest Expense/(Benefit)…………………………………. 28 5 63 21 Income Tax Provision/(Benefit)……………………………… (600) 1,259 2,003 3,285 Depreciation and Amortization………………………………………………………………1,121 1,007 3,283 3,066 Share-based Compensation and Other Stock Payments………………………………………………………………197 79 312 154 Adjusted EBITDA (Non-GAAP)…………………. (155)$ 5,147$ 10,788$ 13,264$ Three Months Ended September 30, Nine Months Ended September 30, Gearing Segment 2017 2016 2017 2016 Net Loss……………………………. (393)$ (697)$ (2,568)$ (3,099)$ Interest Expense…………………………………. 3 1 9 8 Income Tax Provision/(Benefit)……………………………… (7) 5 (2) 7 Depreciation and Amortization………………………………………………………………610 638 1,847 1,918 Share-based Compensation and Other Stock Payments………………………………………………………………72 17 113 89 Adjusted EBITDA (Non-GAAP)…………………. 285$ (36)$ (601)$ (1,077)$ Three Months Ended September 30, Nine Months Ended September 30, Process Systems 2017 2016 2017 2016 Net Income/(Loss)……………………………. 124$ -$ (1,817)$ -$ Interest Expense…………………………………. 1 - 4 - Income Tax Provision/(Benefit)……………………………… (22) - (10) - Depreciation and Amortization………………………………………………………………477 - 1,278 - Share-based Compensation and Other Stock Payments………………………………………………………………18 - 34 - Adjusted EBITDA (Non-GAAP)…………………. 598$ -$ (511)$ -$ Three Months Ended September 30, Nine Months Ended September 30, Corporate and Other 2017 2016 2017 2016 Net Income/(Loss)……………………………. (879)$ (855)$ 3,003$ (2,710)$ Interest Expense…………………………………. 196 119 508 402 Income Tax Provision/(Benefit)……………………………… 607 (1,264) (7,047) (3,308) Depreciation and Amortization………………………………………………………………59 50 163 154 Share-based Compensation and Other Stock Payments………………………………………………………………152 99 441 385 Adjusted EBITDA (Non-GAAP)…………………. 135$ (1,851)$ (2,932)$ (5,077)$ Three Months Ended September 30, Six Months Ended June 30,

Broadwind Energy is a precision manufacturer of structures, equipment & components for clean tech and other specialized applications . www.BWEN.com October 31, 2017 16 © 2017 Broadwind Energy, Inc. All rights reserved.