Attached files
| file | filename |
|---|---|
| EX-95 - EX-95 - NOV Inc. | d474153dex95.htm |
| EX-32.2 - EX-32.2 - NOV Inc. | d474153dex322.htm |
| EX-32.1 - EX-32.1 - NOV Inc. | d474153dex321.htm |
| EX-31.2 - EX-31.2 - NOV Inc. | d474153dex312.htm |
| EX-31.1 - EX-31.1 - NOV Inc. | d474153dex311.htm |
UNITED STATES
SECURITIES AND EXCHANGE COMMISSION
Washington, D.C. 20549
FORM 10-Q
(Mark one)
| ☒ | QUARTERLY REPORT PURSUANT TO SECTION 13 OR 15(d) OF THE SECURITIES EXCHANGE ACT OF 1934 |
FOR THE QUARTERLY PERIOD ENDED SEPTEMBER 30, 2017
OR
| ☐ | TRANSITION REPORT PURSUANT TO SECTION 13 OR 15(d) OF THE SECURITIES EXCHANGE ACT OF 1934 |
Commission File Number 1-12317
NATIONAL OILWELL VARCO, INC.
(Exact name of registrant as specified in its charter)
| Delaware | 76-0475815 | |
| (State or other jurisdiction of incorporation or organization) |
(I.R.S. Employer Identification No.) |
7909 Parkwood Circle Drive
Houston, Texas
77036-6565
(Address of principal executive offices)
(713) 346-7500
(Registrant’s telephone number, including area code)
Indicate by check mark whether the registrant (1) has filed all reports required to be filed by Section 13 or 15(d) of the Securities Exchange Act of 1934 during the preceding 12 months (or for such shorter period that the registrant was required to file such reports), and (2) has been subject to such filing requirements for the past 90 days. Yes ☒ No ☐
Indicate by check mark whether the registrant has submitted electronically and posted on its corporate Web site, if any, every Interactive Data File required to be submitted and posted pursuant to Rule 405 of Regulation S-T (§232.405 of this chapter) during the preceding 12 months (or for such shorter period that the registrant was required to submit and post such files). Yes ☒ No ☐
Indicate by check mark whether the registrant is a large accelerated filer, an accelerated filer, a non-accelerated filer, smaller reporting company, or an emerging growth company. See the definitions of “large accelerated filer”, “accelerated filer”, “smaller reporting company” and “emerging growth company” in Rule 12b-2 of the Exchange Act. (Check one):
| Large accelerated filer | ☑ | Accelerated filer | ☐ | |||
| Non-accelerated filer | ☐ (Do not check if a smaller reporting company) | Smaller reporting company | ☐ | |||
| Emerging growth company | ☐ | |||||
If an emerging growth company, indicate by check mark if the registrant has elected not to use the extended transition period for complying with any new or revised financial accounting standards provided pursuant to Section 13(a) of the Exchange Act. ☐
Indicate by check mark whether the registrant is a shell company (as defined in Rule 12b-2 of the Exchange Act). Yes ☐ No ☑
As of October 20, 2017, the registrant had 380,032,211 shares of common stock, par value $0.01 per share, outstanding.
PART I - FINANCIAL INFORMATION
Item 1. Financial Statements
NATIONAL OILWELL VARCO, INC.
CONSOLIDATED BALANCE SHEETS
(In millions, except share data)
| September 30, | December 31, | |||||||
| 2017 | 2016 | |||||||
| (Unaudited) | ||||||||
| ASSETS |
||||||||
| Current assets: |
||||||||
| Cash and cash equivalents |
$ | 1,722 | $ | 1,408 | ||||
| Receivables, net |
2,060 | 2,083 | ||||||
| Inventories, net |
3,219 | 3,325 | ||||||
| Costs in excess of billings |
518 | 665 | ||||||
| Prepaid and other current assets |
306 | 395 | ||||||
|
|
|
|
|
|||||
| Total current assets |
7,825 | 7,876 | ||||||
| Property, plant and equipment, net |
3,031 | 3,150 | ||||||
| Deferred income taxes |
71 | 86 | ||||||
| Goodwill |
6,165 | 6,067 | ||||||
| Intangibles, net |
3,377 | 3,530 | ||||||
| Investment in unconsolidated affiliates |
309 | 307 | ||||||
| Other assets |
156 | 124 | ||||||
|
|
|
|
|
|||||
| Total assets |
$ | 20,934 | $ | 21,140 | ||||
|
|
|
|
|
|||||
| LIABILITIES AND STOCKHOLDERS’ EQUITY |
||||||||
| Current liabilities: |
||||||||
| Accounts payable |
$ | 447 | $ | 414 | ||||
| Accrued liabilities |
1,544 | 1,568 | ||||||
| Billings in excess of costs |
288 | 440 | ||||||
| Current portion of long-term debt and short-term borrowings |
506 | 506 | ||||||
| Accrued income taxes |
57 | 119 | ||||||
|
|
|
|
|
|||||
| Total current liabilities |
2,842 | 3,047 | ||||||
| Long-term debt |
2,707 | 2,708 | ||||||
| Deferred income taxes |
925 | 1,064 | ||||||
| Other liabilities |
309 | 318 | ||||||
|
|
|
|
|
|||||
| Total liabilities |
6,783 | 7,137 | ||||||
|
|
|
|
|
|||||
| Commitments and contingencies |
||||||||
| Stockholders’ equity: |
||||||||
| Common stock—par value $.01; 1 billion shares authorized; 380,053,721 and 378,637,403 shares issued and outstanding at September 30, 2017 and December 31, 2016 |
4 | 4 | ||||||
| Additional paid-in capital |
8,190 | 8,103 | ||||||
| Accumulated other comprehensive loss |
(1,109 | ) | (1,452 | ) | ||||
| Retained earnings |
6,999 | 7,285 | ||||||
|
|
|
|
|
|||||
| Total Company stockholders’ equity |
14,084 | 13,940 | ||||||
| Noncontrolling interests |
67 | 63 | ||||||
|
|
|
|
|
|||||
| Total stockholders’ equity |
14,151 | 14,003 | ||||||
|
|
|
|
|
|||||
| Total liabilities and stockholders’ equity |
$ | 20,934 | $ | 21,140 | ||||
|
|
|
|
|
|||||
See notes to unaudited consolidated financial statements.
2
NATIONAL OILWELL VARCO, INC.
CONSOLIDATED STATEMENTS OF LOSS (UNAUDITED)
(In millions, except per share data)
| Three Months Ended | Nine Months Ended | |||||||||||||||
| September 30, | September 30, | |||||||||||||||
| 2017 | 2016 | 2017 | 2016 | |||||||||||||
| Revenue |
$ | 1,835 | $ | 1,646 | $ | 5,335 | $ | 5,559 | ||||||||
| Cost of revenue |
1,550 | 1,567 | 4,610 | 5,201 | ||||||||||||
|
|
|
|
|
|
|
|
|
|||||||||
| Gross profit |
285 | 79 | 725 | 358 | ||||||||||||
| Selling, general and administrative |
292 | 293 | 891 | 1,031 | ||||||||||||
| Goodwill impairment |
— | 972 | — | 972 | ||||||||||||
|
|
|
|
|
|
|
|
|
|||||||||
| Operating loss |
(7 | ) | (1,186 | ) | (166 | ) | (1,645 | ) | ||||||||
| Interest and financial costs |
(26 | ) | (25 | ) | (77 | ) | (80 | ) | ||||||||
| Interest income |
11 | 3 | 19 | 11 | ||||||||||||
| Equity loss in unconsolidated affiliates |
(2 | ) | (6 | ) | (4 | ) | (19 | ) | ||||||||
| Other income (expense), net |
(6 | ) | (30 | ) | (19 | ) | (85 | ) | ||||||||
|
|
|
|
|
|
|
|
|
|||||||||
| Loss before income taxes |
(30 | ) | (1,244 | ) | (247 | ) | (1,818 | ) | ||||||||
| Provision for income taxes |
(3 | ) | 120 | (26 | ) | (119 | ) | |||||||||
|
|
|
|
|
|
|
|
|
|||||||||
| Net loss |
(27 | ) | (1,364 | ) | (221 | ) | (1,699 | ) | ||||||||
| Net income (loss) attributable to noncontrolling interests |
(1 | ) | (2 | ) | 2 | (1 | ) | |||||||||
|
|
|
|
|
|
|
|
|
|||||||||
| Net loss attributable to Company |
$ | (26 | ) | $ | (1,362 | ) | $ | (223 | ) | $ | (1,698 | ) | ||||
|
|
|
|
|
|
|
|
|
|||||||||
| Net loss attributable to Company per share: |
||||||||||||||||
| Basic |
$ | (0.07 | ) | $ | (3.62 | ) | $ | (0.59 | ) | $ | (4.53 | ) | ||||
|
|
|
|
|
|
|
|
|
|||||||||
| Diluted |
$ | (0.07 | ) | $ | (3.62 | ) | $ | (0.59 | ) | $ | (4.53 | ) | ||||
|
|
|
|
|
|
|
|
|
|||||||||
| Cash dividends per share |
$ | 0.05 | $ | 0.05 | $ | 0.15 | $ | 0.56 | ||||||||
|
|
|
|
|
|
|
|
|
|||||||||
| Weighted average shares outstanding: |
||||||||||||||||
| Basic |
377 | 376 | 377 | 375 | ||||||||||||
|
|
|
|
|
|
|
|
|
|||||||||
| Diluted |
377 | 376 | 377 | 375 | ||||||||||||
|
|
|
|
|
|
|
|
|
|||||||||
See notes to unaudited consolidated financial statements.
3
NATIONAL OILWELL VARCO, INC.
CONSOLIDATED STATEMENTS OF COMPREHENSIVE INCOME (LOSS) (UNAUDITED)
(In millions)
| Three Months Ended | Nine Months Ended | |||||||||||||||
| September 30, | September 30, | |||||||||||||||
| 2017 | 2016 | 2017 | 2016 | |||||||||||||
| Net loss |
$ | (27 | ) | $ | (1,364 | ) | $ | (221 | ) | $ | (1,699 | ) | ||||
| Currency translation adjustments |
124 | (18 | ) | 290 | 79 | |||||||||||
| Changes in derivative financial instruments, net of tax |
25 | 60 | 53 | 191 | ||||||||||||
|
|
|
|
|
|
|
|
|
|||||||||
| Comprehensive income (loss) |
122 | (1,322 | ) | 122 | (1,429 | ) | ||||||||||
| Comprehensive income (loss) attributable to noncontrolling interest |
(1 | ) | (2 | ) | 2 | (1 | ) | |||||||||
|
|
|
|
|
|
|
|
|
|||||||||
| Comprehensive income (loss) attributable to Company |
$ | 123 | $ | (1,320 | ) | $ | 120 | $ | (1,428 | ) | ||||||
|
|
|
|
|
|
|
|
|
|||||||||
See notes to unaudited consolidated financial statements.
4
NATIONAL OILWELL VARCO, INC.
CONSOLIDATED STATEMENTS OF CASH FLOWS (UNAUDITED)
(In millions)
| Nine Months Ended | ||||||||
| September 30, | ||||||||
| 2017 | 2016 | |||||||
| Cash flows from operating activities: |
||||||||
| Net loss |
$ | (221 | ) | $ | (1,699 | ) | ||
| Adjustments to reconcile net loss to net cash provided by operating activities: |
||||||||
| Depreciation and amortization |
523 | 529 | ||||||
| Deferred income taxes |
16 | (216 | ) | |||||
| Equity loss in unconsolidated affiliates |
4 | 19 | ||||||
| Goodwill impairment |
— | 972 | ||||||
| Other, net |
141 | 287 | ||||||
| Change in operating assets and liabilities, net of acquisitions: |
||||||||
| Receivables |
13 | 1,089 | ||||||
| Inventories |
103 | 430 | ||||||
| Costs in excess of billings |
147 | 485 | ||||||
| Prepaid and other current assets |
95 | 31 | ||||||
| Accounts payable |
36 | (230 | ) | |||||
| Accrued liabilities |
(50 | ) | (664 | ) | ||||
| Billings in excess of costs |
(152 | ) | (235 | ) | ||||
| Income taxes payable |
(72 | ) | (229 | ) | ||||
| Other assets/liabilities, net |
(72 | ) | 238 | |||||
|
|
|
|
|
|||||
| Net cash provided by operating activities |
511 | 807 | ||||||
|
|
|
|
|
|||||
| Cash flows from investing activities: |
||||||||
| Purchases of property, plant and equipment |
(127 | ) | (221 | ) | ||||
| Business acquisitions, net of cash acquired |
(85 | ) | (60 | ) | ||||
| Other |
28 | 4 | ||||||
|
|
|
|
|
|||||
| Net cash used in investing activities |
(184 | ) | (277 | ) | ||||
|
|
|
|
|
|||||
| Cash flows from financing activities: |
||||||||
| Borrowings against lines of credit and other debt |
— | 3,972 | ||||||
| Payments against lines of credit and other debt |
(4 | ) | (4,869 | ) | ||||
| Cash dividends paid |
(57 | ) | (211 | ) | ||||
| Activity under stock incentive plans |
11 | 2 | ||||||
| Other |
(2 | ) | (10 | ) | ||||
|
|
|
|
|
|||||
| Net cash used in financing activities |
(52 | ) | (1,116 | ) | ||||
| Effect of exchange rates on cash |
39 | 16 | ||||||
|
|
|
|
|
|||||
| Increase (decrease) in cash and cash equivalents |
314 | (570 | ) | |||||
| Cash and cash equivalents, beginning of period |
1,408 | 2,080 | ||||||
|
|
|
|
|
|||||
| Cash and cash equivalents, end of period |
$ | 1,722 | $ | 1,510 | ||||
|
|
|
|
|
|||||
| Supplemental disclosures of cash flow information: |
||||||||
| Cash payments during the period for: |
||||||||
| Interest |
$ | 51 | $ | 56 | ||||
| Income taxes |
$ | 130 | $ | 173 | ||||
See notes to unaudited consolidated financial statements.
5
NATIONAL OILWELL VARCO, INC.
Notes to Consolidated Financial Statements (Unaudited)
| 1. | Basis of Presentation |
The preparation of financial statements in conformity with generally accepted accounting principles (“GAAP”) in the United States requires management to make estimates and assumptions that affect reported and contingent amounts of assets and liabilities as of the date of the financial statements and reported amounts of revenues and expenses during the reporting period. Actual results could differ from those estimates.
The accompanying unaudited consolidated financial statements of National Oilwell Varco, Inc. (“NOV” or the “Company”) present information in accordance with GAAP in the United States for interim financial information and the instructions to Form 10-Q and applicable rules of Regulation S-X. They do not include all information or footnotes required by GAAP in the United States for complete consolidated financial statements and should be read in conjunction with our 2016 Annual Report on Form 10-K.
In our opinion, the consolidated financial statements include all adjustments, which are of a normal recurring nature, unless otherwise disclosed, necessary for a fair presentation of the results for the interim periods. The results of operations for the three and nine months ended September 30, 2017 are not necessarily indicative of the results to be expected for the full year.
Fair Value of Financial Instruments
The carrying amounts of cash and cash equivalents, receivables, and payables approximated fair value because of the relatively short maturity of these instruments. Cash equivalents include only those investments having a maturity date of three months or less at the time of purchase. See Note 7 for the fair value of long-term debt and Note 10 for the fair value of derivative financial instruments.
| 2. | Inventories, net |
Inventories consist of (in millions):
| September 30, 2017 |
December 31, 2016 |
|||||||
| Raw materials and supplies |
$ | 719 | $ | 961 | ||||
| Work in process |
499 | 561 | ||||||
| Finished goods and purchased products |
2,001 | 1,803 | ||||||
|
|
|
|
|
|||||
| Total |
$ | 3,219 | $ | 3,325 | ||||
|
|
|
|
|
|||||
6
| 3. | Accrued Liabilities |
Accrued liabilities consist of (in millions):
| September 30, 2017 |
December 31, 2016 |
|||||||
| Compensation |
$ | 314 | $ | 181 | ||||
| Customer prepayments and billings |
262 | 222 | ||||||
| Vendor costs |
202 | 235 | ||||||
| Warranty |
147 | 172 | ||||||
| Taxes (non-income) |
133 | 176 | ||||||
| Insurance |
77 | 103 | ||||||
| Commissions |
55 | 57 | ||||||
| Fair value of derivative financial instruments |
7 | 66 | ||||||
| Interest |
29 | 8 | ||||||
| Other |
318 | 348 | ||||||
|
|
|
|
|
|||||
| Total |
$ | 1,544 | $ | 1,568 | ||||
|
|
|
|
|
|||||
Service and Product Warranties
The Company provides service and warranty policies on certain of its products. The Company accrues liabilities under service and warranty policies based upon specific claims and a review of historical warranty and service claim experience in accordance with Accounting Standards Codification (“ASC”) Topic 450 “Contingencies”. Adjustments are made to accruals as claim data and historical experience change. In addition, the Company incurs discretionary costs to service its products in connection with product performance issues and accrues for them when they are encountered.
The changes in the carrying amount of service and product warranties are as follows (in millions):
| Balance at December 31, 2016 |
$ | 172 | ||
|
|
|
|||
| Net provisions for warranties issued during the year |
27 | |||
| Amounts incurred |
(60 | ) | ||
| Currency translation adjustments and other |
8 | |||
|
|
|
|||
| Balance at September 30, 2017 |
$ | 147 | ||
|
|
|
| 4. | Costs and Estimated Earnings on Uncompleted Contracts |
Costs and estimated earnings on uncompleted contracts consist of (in millions):
| September 30, 2017 |
December 31, 2016 |
|||||||
| Costs incurred on uncompleted contracts |
$ | 6,807 | $ | 8,132 | ||||
| Estimated earnings |
3,242 | 3,869 | ||||||
|
|
|
|
|
|||||
| 10,049 | 12,001 | |||||||
| Less: Billings to date |
9,819 | 11,776 | ||||||
|
|
|
|
|
|||||
| $ | 230 | $ | 225 | |||||
|
|
|
|
|
|||||
| Costs and estimated earnings in excess of billings on uncompleted contracts |
$ | 518 | $ | 665 | ||||
| Billings in excess of costs and estimated earnings on uncompleted contracts |
(288 | ) | (440 | ) | ||||
|
|
|
|
|
|||||
| $ | 230 | $ | 225 | |||||
|
|
|
|
|
|||||
7
| 5. | Accumulated Other Comprehensive Income (Loss) |
The components of accumulated other comprehensive income (loss) are as follows (in millions):
| Currency Translation Adjustments |
Derivative Financial Instruments, Net of Tax |
Defined Benefit Plans, Net of Tax |
Total | |||||||||||||
| Balance at December 31, 2016 |
$ | (1,376 | ) | $ | (39 | ) | $ | (37 | ) | $ | (1,452 | ) | ||||
| Accumulated other comprehensive income (loss) before reclassifications |
290 | 50 | — | 340 | ||||||||||||
| Amounts reclassified from accumulated other comprehensive income (loss) |
— | 3 | — | 3 | ||||||||||||
|
|
|
|
|
|
|
|
|
|||||||||
| Balance at September 30, 2017 |
$ | (1,086 | ) | $ | 14 | $ | (37 | ) | $ | (1,109 | ) | |||||
|
|
|
|
|
|
|
|
|
|||||||||
The components of amounts reclassified from accumulated other comprehensive income (loss) are as follows (in millions):
| Three Months Ended September 30, | ||||||||||||||||||||||||||||||||
| 2017 | 2016 | |||||||||||||||||||||||||||||||
| Currency Translation Adjustments |
Derivative Financial Instruments |
Defined Benefit Plans |
Total | Currency Translation Adjustments |
Derivative Financial Instruments |
Defined Benefit Plans |
Total | |||||||||||||||||||||||||
| Revenue |
$ | — | $ | (2 | ) | $ | — | $ | (2 | ) | $ | — | $ | — | $ | — | $ | — | ||||||||||||||
| Cost of revenue |
— | 4 | — | 4 | — | 48 | — | 48 | ||||||||||||||||||||||||
| Tax effect |
— | (1 | ) | — | (1 | ) | — | (12 | ) | — | (12 | ) | ||||||||||||||||||||
|
|
|
|
|
|
|
|
|
|
|
|
|
|
|
|
|
|||||||||||||||||
| $ | — | $ | 1 | $ | — | $ | 1 | $ | — | $ | 36 | $ | — | $ | 36 | |||||||||||||||||
|
|
|
|
|
|
|
|
|
|
|
|
|
|
|
|
|
|||||||||||||||||
| Nine Months Ended September 30, | ||||||||||||||||||||||||||||||||
| 2017 | 2016 | |||||||||||||||||||||||||||||||
| Currency Translation Adjustments |
Derivative Financial Instruments |
Defined Benefit Plans |
Total | Currency Translation Adjustments |
Derivative Financial Instruments |
Defined Benefit Plans |
Total | |||||||||||||||||||||||||
| Revenue |
$ | — | $ | (6 | ) | $ | — | $ | (6 | ) | $ | — | $ | (3 | ) | $ | — | $ | (3 | ) | ||||||||||||
| Cost of revenue |
— | 8 | — | 8 | — | 170 | — | 170 | ||||||||||||||||||||||||
| Tax effect |
— | 1 | — | 1 | — | (47 | ) | — | (47 | ) | ||||||||||||||||||||||
|
|
|
|
|
|
|
|
|
|
|
|
|
|
|
|
|
|||||||||||||||||
| $ | — | $ | 3 | $ | — | $ | 3 | $ | — | $ | 120 | $ | — | $ | 120 | |||||||||||||||||
|
|
|
|
|
|
|
|
|
|
|
|
|
|
|
|
|
|||||||||||||||||
The Company’s reporting currency is the U.S. dollar. For a majority of the Company’s international entities in which there is a substantial investment, the local currency is their functional currency. As a result, currency translation adjustments resulting from the process of translating the entities’ financial statements into the reporting currency are reported in other comprehensive income or loss in accordance with ASC Topic 830 “Foreign Currency Matters” (“ASC Topic 830”). For the three months ended September 30, 2017, a majority of these local currencies strengthened against the U.S. dollar resulting in net other comprehensive income of $124 million, upon the translation from local currencies to the U.S. dollar. For the nine months ended September 30, 2017, a majority of these local currencies strengthened against the U.S. dollar resulting in net other comprehensive income of $290 million, upon the translation from local currencies to the U.S. dollar. For the three months ended September 30, 2016, a majority of these local currencies weakened against the U.S. dollar resulting in net other comprehensive loss of $18 million upon the translation from local currencies to the U.S. dollar. For the nine months ended September 30, 2016, a majority of these local currencies strengthened against the U.S. dollar resulting in net other comprehensive income of $79 million, upon the translation from local currencies to the U.S. dollar.
8
The effect of changes in the fair values of derivatives designated as cash flow hedges are accumulated in other comprehensive income or loss, net of tax, until the underlying transactions to which they are designed to hedge are realized. The movement in other comprehensive income or loss from period to period will be the result of the combination of changes in fair value for open derivatives and the outflow of other comprehensive income or loss related to cumulative changes in the fair value of derivatives that have settled in the current or prior periods. The accumulated effect was other comprehensive income of $25 million (net of tax of $8 million) and $53 million (net of tax of $15 million) for the three and nine months ended September 30, 2017, respectively. The accumulated effect was other comprehensive income of $60 million (net of tax of $20 million) and $191 million (net of tax of $72 million) for the three and nine months ended September 30, 2016, respectively.
| 6. | Business Segments |
Operating results by segment are as follows (in millions):
| Three Months Ended September 30, |
Nine Months Ended September 30, |
|||||||||||||||
| 2017 | 2016 | 2017 | 2016 | |||||||||||||
| Revenue: |
||||||||||||||||
| Rig Systems |
$ | 330 | $ | 470 | $ | 1,069 | $ | 1,960 | ||||||||
| Rig Aftermarket |
311 | 322 | 973 | 1,077 | ||||||||||||
| Wellbore Technologies |
693 | 526 | 1,862 | 1,668 | ||||||||||||
| Completion & Production Solutions |
682 | 543 | 1,982 | 1,639 | ||||||||||||
| Eliminations |
(181 | ) | (215 | ) | (551 | ) | (785 | ) | ||||||||
|
|
|
|
|
|
|
|
|
|||||||||
| Total revenue |
$ | 1,835 | $ | 1,646 | $ | 5,335 | $ | 5,559 | ||||||||
|
|
|
|
|
|
|
|
|
|||||||||
| Operating profit (loss): |
||||||||||||||||
| Rig Systems |
$ | 11 | $ | (962 | ) | $ | 13 | $ | (888 | ) | ||||||
| Rig Aftermarket |
64 | 72 | 201 | 203 | ||||||||||||
| Wellbore Technologies |
— | (94 | ) | (81 | ) | (331 | ) | |||||||||
| Completion & Production Solutions |
44 | (61 | ) | 79 | (132 | ) | ||||||||||
| Eliminations and corporate costs |
(126 | ) | (141 | ) | (378 | ) | (497 | ) | ||||||||
|
|
|
|
|
|
|
|
|
|||||||||
| Total operating profit (loss) |
$ | (7 | ) | $ | (1,186 | ) | $ | (166 | ) | $ | (1,645 | ) | ||||
|
|
|
|
|
|
|
|
|
|||||||||
| Operating profit (loss)%: |
||||||||||||||||
| Rig Systems |
3.3 | % | (204.7 | %) | 1.2 | % | (45.3 | %) | ||||||||
| Rig Aftermarket |
20.6 | % | 22.4 | % | 20.7 | % | 18.8 | % | ||||||||
| Wellbore Technologies |
0.0 | % | (17.9 | %) | (4.4 | %) | (19.8 | %) | ||||||||
| Completion & Production Solutions |
6.5 | % | (11.2 | %) | 4.0 | % | (8.1 | %) | ||||||||
| Total operating profit (loss) % |
(0.4 | %) | (72.1 | %) | (3.1 | %) | (29.6 | %) | ||||||||
Sales from one segment to another generally are priced at estimated equivalent commercial selling prices; however, segments originating an external sale are credited with the full profit to the Company. Eliminations include intercompany transactions conducted between the four reporting segments that are eliminated in consolidation. Intercompany transactions within each reporting segment are eliminated within each reporting segment.
On July 1, 2017, the Company’s Wellbore Technologies segment reorganized three of its reporting units, moving various operations between them. The goodwill impairment analyses performed prior to and subsequent to the restructuring of the three reporting units, concluded that the calculated fair values of these reporting units were substantially in excess of their carrying value. The restructuring had no effect on Wellbore Technologies consolidated financial position and results of operations.
Included in operating profit (loss) are other items primarily related to costs associated with severance, facility closures, goodwill impairment, and a Voluntary Early Retirement Plan (“VERP”) established by the Company during the first quarter of 2016. As of September 30, 2017, the Company had approximately $44 million accrued for the VERP postretirement medical benefits.
9
| 7. | Debt |
Debt consists of (in millions):
| September 30, 2017 |
December 31, 2016 |
|||||||
| $500 million in Senior Notes, interest at 1.35% payable semiannually, principal due on December 1, 2017 |
$ | 500 | $ | 499 | ||||
| $1.4 billion in Senior Notes, interest at 2.60% payable semiannually, principal due on December 1, 2022 |
1,392 | 1,391 | ||||||
| $1.1 billion in Senior Notes, interest at 3.95% payable semiannually, principal due on December 1, 2042 |
1,087 | 1,087 | ||||||
| Other |
234 | 237 | ||||||
|
|
|
|
|
|||||
| Total debt |
3,213 | 3,214 | ||||||
| Less current portion |
506 | 506 | ||||||
|
|
|
|
|
|||||
| Long-term debt |
$ | 2,707 | $ | 2,708 | ||||
|
|
|
|
|
|||||
On June 27, 2017, the Company entered into a new $3.0 billion credit agreement evidencing a five-year unsecured revolving credit facility, which expires on June 27, 2022, with a syndicate of financial institutions. This new credit facility replaced the Company’s previous $4.5 billion revolving credit facility. The Company has the right to increase the aggregate commitments under this new agreement to an aggregate amount of up to $4.0 billion upon the consent of only those lenders holding any such increase. Interest under the new multicurrency facility is based upon LIBOR, NIBOR or CDOR plus 1.125% subject to a ratings-based grid or the U.S. prime rate. The new credit facility contains a financial covenant regarding maximum debt-to-capitalization ratio of 60%. As of September 30, 2017, the Company was in compliance with a debt-to-capitalization ratio of 18.5%.
The Company has a commercial paper program under which borrowings are classified as long-term since the program is supported by the $3.0 billion, five-year credit facility. At September 30, 2017, there were no commercial paper borrowings, and there were no outstanding letters of credit issued under the credit facility, resulting in $3.0 billion of funds available under this credit facility.
The Company had $731 million of outstanding letters of credit at September 30, 2017 that are under various bilateral letter of credit facilities. Letters of credit are issued as bid bonds, advanced payment bonds and performance bonds.
The fair value of the Company’s debt is estimated using Level 2 inputs in the fair value hierarchy and is based on quoted prices for those or similar instruments. At September 30, 2017 and December 31, 2016, the fair value of the Company’s unsecured Senior Notes approximated $2,817 million and $2,669 million, respectively. At September 30, 2017 and December 31, 2016, the carrying value of the Company’s unsecured Senior Notes approximated $2,979 million and $2,977 million, respectively.
10
| 8. | Tax |
The effective tax rates for the three and nine months ended September 30, 2017 were 10.0% and 10.5%, respectively, compared to (9.6)% and 6.5% for the same periods in 2016. Market conditions continued to negatively impact our business in the third quarter of 2017. As a result of these conditions, we continue to establish valuation allowances on deferred tax assets for losses and tax credits generated in the current year, which, when applied to losses resulted in a lower effective tax rate than the U.S. statutory rate. For the three and nine months ended September 30, 2016, impairment of goodwill not deductible for tax purposes, lower tax rates on losses incurred in foreign jurisdictions, and the establishment of valuation allowances, when applied to losses resulted in a lower effective tax rate than the U.S. statutory rate.
For the three and nine months ended September 30, 2016, the Company utilized the discrete-period method to compute its interim tax provision due to significant variations in the relationship between income tax expense and pre-tax accounting income or loss; consequently, the actual effective rate for the interim period was reported. For the three and nine months ended September 30, 2017, the Company returned to estimating and recording a full year effective tax rate.
| 9. | Stock-Based Compensation |
The Company has a stock-based compensation plan known as the National Oilwell Varco, Inc. Long-Term Incentive Plan (the “Plan”). The Plan provides for the granting of stock options, performance-based share awards, restricted stock, phantom shares, stock payments and stock appreciation rights (“SARs”). The number of shares authorized under the Plan is 69.4 million. The Plan is subject to a fungible ratio concept, such that the issuance of stock options and SARs reduces the number of available shares under the Plan on a 1-for-1 basis, and the issuance of other awards reduces the number of available shares under the Plan on a 3-for-1 basis. At September 30, 2017, 21,026,617 shares remain available for future grants under the Plan, all of which are available for grants of stock options, performance-based share awards, restricted stock awards, phantom shares, stock payments and SARs.
On February 22, 2017, the Company granted 3,362,460 stock options with a fair value of $10.98 per share and an exercise price of $38.86 per share; 1,504,450 shares of restricted stock and restricted stock units with a fair value of $38.86 per share; and performance share awards to senior management employees with potential payouts varying from zero to 388,380 shares. The stock options vest over a three-year period from the grant date. The restricted stock and restricted stock units vest on the third anniversary of the grant date or in three equal annual installments commencing on the first anniversary of the grant date. The performance share awards can be earned based on performance against established goals over a three-year performance period. The performance share awards are based entirely on a TSR (total shareholder return) goal. Performance against the TSR goal is determined by comparing the performance of the Company’s TSR with the TSR performance of the members of the OSX index for the three-year performance period.
On May 17, 2017, the Company granted 36,701 restricted stock awards with a fair value of $33.38 per share. The awards were granted to non-employee members of the board of directors and vest on the first anniversary of the grant date.
Total stock-based compensation for all stock-based compensation arrangements under the Plan was $33 million and $85 million for the three and nine months ended September 30, 2017, respectively, and $28 million and $78 million for the three and nine months ended September 30, 2016, respectively. Included in stock-based compensation for the nine months ended September 30, 2016 is $5 million related to the Voluntary Early Retirement Plan established by the Company in the first quarter of 2016. The total income tax benefit recognized in the Consolidated Statements of Loss for all stock-based compensation arrangements under the Plan was $9 million and $18 million for the three and nine months ended September 30, 2017, respectively, and $5 million and $17 million for the three and nine months ended September 30, 2016, respectively.
11
| 10. | Derivative Financial Instruments |
ASC Topic 815, “Derivatives and Hedging” requires a company to recognize all of its derivative instruments as either assets or liabilities in the Consolidated Balance Sheet at fair value. The accounting for changes in the fair value (i.e., gains or losses) of a derivative instrument depends on whether it has been designated and qualifies as part of a hedging relationship and further, on the type of hedging relationship. For those derivative instruments that are designated and qualify as hedging instruments, a company must designate the hedging instrument, based upon the exposure being hedged, as a fair value hedge, cash flow hedge, or a hedge of a net investment in a foreign operation.
The Company is exposed to certain risks relating to its ongoing business operations. The primary risk managed by using derivative instruments is foreign currency exchange rate risk. Forward contracts against various foreign currencies are entered into to manage the foreign currency exchange rate risk on forecasted revenues and expenses denominated in currencies other than the functional currency of the operating unit (cash flow hedge). In addition, the Company will enter into non-designated forward contracts against various foreign currencies to manage the foreign currency exchange rate risk on recognized nonfunctional currency monetary accounts (non-designated hedge).
The Company records all derivative financial instruments at their fair value in its Consolidated Balance Sheet. Except for certain non-designated hedges discussed below, all derivative financial instruments that the Company holds are designated as cash flow hedges and are highly effective in offsetting movements in the underlying risks. Such arrangements typically have terms between 2 and 24 months, but may have longer terms depending on the underlying cash flows being hedged, typically related to the projects in our backlog. The Company may also use interest rate contracts to mitigate its exposure to changes in interest rates on anticipated long-term debt issuances.
At September 30, 2017, the Company has determined that the fair value of its derivative financial instruments representing assets of $42 million and liabilities of $10 million (primarily currency related derivatives) are determined using level 2 inputs (inputs other than quoted prices in active markets for identical assets and liabilities that are observable either directly or indirectly for substantially the full term of the asset or liability) in the fair value hierarchy as the fair value is based on publicly available foreign exchange and interest rates at each financial reporting date. At September 30, 2017, the net fair value of the Company’s foreign currency forward contracts totaled a net asset of $32 million.
At September 30, 2017, the Company did not have any interest rate swaps and its financial instruments do not contain any credit-risk-related or other contingent features that could cause accelerated payments when the Company’s financial instruments are in net liability positions. We do not use derivative financial instruments for trading or speculative purposes.
Cash Flow Hedging Strategy
To protect against the volatility of forecasted foreign currency cash flows resulting from forecasted revenues and expenses, the Company has instituted a cash flow hedging program. The Company hedges portions of its forecasted revenues and expenses denominated in nonfunctional currencies with forward contracts. When the U.S. dollar strengthens or weakens against the foreign currencies, the change in present value of future foreign currency revenues and expenses is offset by changes in the fair value of the forward contracts designated as hedges.
For derivative instruments that are designated and qualify as a cash flow hedge (i.e., hedging the exposure to variability in expected future cash flows that is subject to a particular currency risk), the effective portion of the gain or loss on the derivative instrument is reported as a component of other comprehensive income (loss) and reclassified into earnings in the same line item associated with the forecasted transaction and in the same period or periods during which the hedged transaction affects earnings (e.g., in “revenues” when the hedged transactions are cash flows associated with forecasted revenues). The remaining gain or loss on the derivative instrument in excess of the cumulative change in the present value of future cash flows of the hedged item, if any (i.e., the ineffective portion), or hedge components excluded from the assessment of effectiveness, is recognized in the Consolidated Statements of Loss during the current period.
For the three and nine months ended September 30, 2017, the Company recognized a loss of $3 million and a gain of $10 million, respectively, as a result of the discontinuance of certain cash flow hedges when it became probable that the original forecasted transactions would not occur by the end of the originally specified time period. At September 30, 2017, there were $19 million in pre-tax gains recorded in accumulated other comprehensive income (loss). Significant changes in forecasted operating levels or delays in large capital construction projects, whereby certain hedged transactions associated with these projects are no longer probable of occurring by the end of the originally specified time period, could result in additional gains or losses due to the de-designation of existing hedge contracts.
12
The Company had the following outstanding foreign currency forward contracts that were entered into to hedge nonfunctional currency cash flows from forecasted revenues and expenses (in millions):
| Currency Denomination | ||||||||
| Foreign Currency |
September 30, 2017 |
December 31, 2016 |
||||||
| Norwegian Krone |
NOK | 3,692 | NOK | 5,621 | ||||
| Japanese Yen |
JPY | 1,071 | JPY | 1,462 | ||||
| U.S. Dollar |
USD | 229 | USD | 321 | ||||
| Euro |
EUR | 74 | EUR | 279 | ||||
| Danish Krone |
DKK | 29 | DKK | 29 | ||||
| British Pound Sterling |
GBP | 7 | GBP | 1 | ||||
| Singapore Dollar |
SGD | 1 | SGD | 2 | ||||
Non-designated Hedging Strategy
The Company enters into forward exchange contracts to hedge certain nonfunctional currency monetary accounts. The purpose of the Company’s foreign currency hedging activities is to protect the Company from risk that the eventual U.S. dollar equivalent cash flows from the nonfunctional currency monetary accounts will be adversely affected by changes in the exchange rates.
For derivative instruments that are non-designated, the gain or loss on the derivative instrument subject to the hedged risk (i.e., nonfunctional currency monetary accounts) is recognized in other income (expense), net in current earnings.
The Company had the following outstanding foreign currency forward contracts that hedge the fair value of nonfunctional currency monetary accounts (in millions):
| Currency Denomination | ||||||||
| Foreign Currency |
September 30, 2017 |
December 31, 2016 |
||||||
| Russian Ruble |
RUB | 2,645 | RUB | 1,893 | ||||
| Norwegian Krone |
NOK | 1,766 | NOK | 538 | ||||
| U.S. Dollar |
USD | 461 | USD | 457 | ||||
| South African Rand |
ZAR | 150 | ZAR | 150 | ||||
| Euro |
EUR | 101 | EUR | 272 | ||||
| Danish Krone |
DKK | 38 | DKK | 49 | ||||
| Singapore Dollar |
SGD | 2 | SGD | 7 | ||||
| British Pound Sterling |
GBP | 2 | GBP | 3 | ||||
| Canadian Dollar |
CAD | 1 | CAD | 1 | ||||
13
The Company has the following gross fair values of its derivative instruments and their balance sheet classifications:
| Asset Derivatives | Liability Derivatives | |||||||||||||||||||||||
| Fair Value | Fair Value | |||||||||||||||||||||||
| Balance Sheet Location |
September 30, 2017 |
December 31, 2016 |
Balance Sheet Location |
September 30, 2017 |
December 31, 2016 |
|||||||||||||||||||
| Derivatives designated as hedging instruments under ASC Topic 815 |
||||||||||||||||||||||||
| Foreign exchange contracts |
|
Prepaid and other current assets |
|
$ | 20 | $ | 24 | Accrued liabilities | $ | 2 | $ | 37 | ||||||||||||
| Foreign exchange contracts |
Other Assets | 14 | 6 | Other liabilities | 3 | 11 | ||||||||||||||||||
|
|
|
|
|
|
|
|
|
|||||||||||||||||
| Total derivatives designated as hedging instruments under ASC Topic 815 |
$ | 34 | $ | 30 | $ | 5 | $ | 48 | ||||||||||||||||
|
|
|
|
|
|
|
|
|
|||||||||||||||||
| Derivatives not designated as hedging instruments under ASC Topic 815 |
||||||||||||||||||||||||
| Foreign exchange contracts |
|
Prepaid and other current assets |
|
$ | 6 | $ | 32 | Accrued liabilities | $ | 5 | $ | 29 | ||||||||||||
| Foreign exchange contracts |
Other Assets | 2 | — | Other Liabilities | — | — | ||||||||||||||||||
|
|
|
|
|
|
|
|
|
|||||||||||||||||
| Total derivatives not designated as hedging instruments under ASC Topic 815 |
$ | 8 | $ | 32 | $ | 5 | $ | 29 | ||||||||||||||||
|
|
|
|
|
|
|
|
|
|||||||||||||||||
| Total derivatives |
$ | 42 | $ | 62 | $ | 10 | $ | 77 | ||||||||||||||||
|
|
|
|
|
|
|
|
|
|||||||||||||||||
14
The Effect of Derivative Instruments on the Consolidated Statements of Income
($ in millions)
| Derivatives in ASC Topic 815 Cash Flow Hedging Relationships |
Amount of Gain (Loss) Recognized in OCI on Derivative (Effective Portion) (a) |
Location of Gain (Loss) Reclassified from Accumulated OCI into Income (Effective Portion) |
Amount of Gain (Loss) Reclassified from Accumulated OCI into Income (Effective Portion) |
Location of Gain (Loss) Recognized in Income on Derivative (Ineffective Portion and Amount Excluded from Effectiveness Testing) |
Amount of Gain (Loss) Recognized in Income on Derivative (Ineffective Portion and Amount Excluded from Effectiveness Testing) (b) |
|||||||||||||||||||||||||||||||
| Nine Months Ended September 30, | Nine Months Ended September 30, |
Nine Months Ended September 30, |
||||||||||||||||||||||||||||||||||
| 2017 | 2016 | 2017 | 2016 | 2017 | 2016 | |||||||||||||||||||||||||||||||
| Revenue | 6 | 3 | Cost of revenue | 10 | (19 | ) | ||||||||||||||||||||||||||||||
| Foreign exchange contracts | 67 | 96 | Cost of revenue | (18 | ) | (151 | ) | Other income (expense), net | 4 | 3 | ||||||||||||||||||||||||||
|
|
|
|
|
|
|
|
|
|
|
|
|
|||||||||||||||||||||||||
| Total |
67 | 96 | (12 | ) | (148 | ) | 14 | (16 | ) | |||||||||||||||||||||||||||
|
|
|
|
|
|
|
|
|
|
|
|
|
|||||||||||||||||||||||||
|
Derivatives Not Designated as |
Location of Gain (Loss) Recognized in Income on Derivative |
Amount of Gain (Loss) Recognized in Income on Derivative |
||||||||||||||||||||||||||||||||||
| Nine Months Ended September 30, |
||||||||||||||||||||||||||||||||||||
| 2017 | 2016 | |||||||||||||||||||||||||||||||||||
| Foreign exchange contracts | Other income (expense), net | 65 | — | |||||||||||||||||||||||||||||||||
|
|
|
|
|
|||||||||||||||||||||||||||||||||
| Total |
65 | — | ||||||||||||||||||||||||||||||||||
|
|
|
|
|
|||||||||||||||||||||||||||||||||
| (a) | The Company expects that $11 million of the accumulated other comprehensive income (loss) will be reclassified into earnings within the next twelve months with an offset by losses from the underlying transactions resulting in no impact to earnings or cash flow. |
| (b) | The amount of gain (loss) recognized in income represents $10 million and $(19) million related to the ineffective portion of the hedging relationships for the nine months ended September 30, 2017 and 2016, respectively, and $4 million and $3 million related to the amount excluded from the assessment of the hedge effectiveness for the nine months ended September 30, 2017 and 2016, respectively. |
15
| 11. | Net Loss Attributable to Company Per Share |
The following table sets forth the computation of weighted average basic and diluted shares outstanding (in millions, except per share data):
| Three Months Ended September 30, |
Nine Months Ended September 30, |
|||||||||||||||
| 2017 | 2016 | 2017 | 2016 | |||||||||||||
| Numerator: |
||||||||||||||||
| Net loss attributable to Company |
$ | (26 | ) | $ | (1,362 | ) | $ | (223 | ) | $ | (1,698 | ) | ||||
|
|
|
|
|
|
|
|
|
|||||||||
| Denominator: |
||||||||||||||||
| Basic—weighted average common shares outstanding |
377 | 376 | 377 | 375 | ||||||||||||
| Dilutive effect of employee stock options and other unvested stock awards |
— | — | — | — | ||||||||||||
|
|
|
|
|
|
|
|
|
|||||||||
| Diluted outstanding shares |
377 | 376 | 377 | 375 | ||||||||||||
|
|
|
|
|
|
|
|
|
|||||||||
| Net loss attributable to Company per share: |
||||||||||||||||
| Basic |
$ | (0.07 | ) | $ | (3.62 | ) | $ | (0.59 | ) | $ | (4.53 | ) | ||||
|
|
|
|
|
|
|
|
|
|||||||||
| Diluted |
$ | (0.07 | ) | $ | (3.62 | ) | $ | (0.59 | ) | $ | (4.53 | ) | ||||
|
|
|
|
|
|
|
|
|
|||||||||
| Cash dividends per share |
$ | 0.05 | $ | 0.05 | $ | 0.15 | $ | 0.56 | ||||||||
|
|
|
|
|
|
|
|
|
|||||||||
ASC Topic 260, “Earnings Per Share” requires companies with unvested participating securities to utilize a two-class method for the computation of net income attributable to Company per share. The two-class method requires a portion of net income attributable to Company to be allocated to participating securities, which are unvested awards of share-based payments with non-forfeitable rights to receive dividends or dividend equivalents, if declared. Net loss attributable to Company allocated to these participating securities was immaterial for the three and nine months ended September 30, 2017 and therefore not excluded from the net income attributable to Company per share calculation.
The Company had stock options outstanding that were anti-dilutive totaling 17 million shares and 13 million shares for the three and nine months ended September 30, 2017, respectively, and 14 million shares for each of the three and nine months ended September 30, 2016.
| 12. | Cash Dividends |
On August 17, 2017, the Company’s Board of Directors approved a cash dividend of $0.05 per share. The cash dividend was paid on September 29, 2017, to each stockholder of record on September 15, 2017. Cash dividends were $19 million and $57 million for the three and nine months ended September 30, 2017, respectively, and $19 million and $211 million for the three and nine months ended September 30, 2016, respectively. The declaration and payment of future dividends is at the discretion of the Company’s Board of Directors and will be dependent upon the Company’s results of operations, financial condition, capital requirements and other factors deemed relevant by the Company’s Board of Directors.
16
| 13. | Commitments and Contingencies |
We are involved in various claims, internal investigations, regulatory agency audits and pending or threatened legal actions involving a variety of matters. Predicting the ultimate outcome of such matters involves subjective judgment, estimates and inherent uncertainties. As of September 30, 2017, the Company recorded an amount for contingent liabilities representing all contingencies believed to be probable. The Company has also assessed the potential for additional losses above the amounts accrued as well as potential losses for matters that are not probable but are reasonably possible. The total potential loss on these matters cannot be determined; however, in our opinion, any ultimate liability, to the extent not otherwise provided for, will not materially affect our financial position, cash flow or results of operations. These estimated liabilities are based on the Company’s assessment of the nature of these matters, their progress toward resolution, the advice of legal counsel and outside experts as well as management’s intention and experience.
Our business is affected both directly and indirectly by governmental laws and regulations relating to the oilfield service industry in general, as well as by trade, environmental and safety regulations that specifically apply to our business. Although we have not incurred material costs in connection with our compliance with such laws, there can be no assurance that other developments, such as new trade regulations, trade sanctions, environmental laws, regulations and enforcement policies hereunder may not result in additional, presently unquantifiable, costs or liabilities to us.
Further, in some instances, direct or indirect consumers of our products and services, entities providing financing for purchases of our products and services or members of the supply chain for our products and services may become involved in governmental investigations, internal investigations, political or other enforcement matters. In such circumstances, such investigations may adversely impact the ability of consumers of our products, entities providing financial support to such consumers or entities in the supply chain to timely perform their business plans or to timely perform under agreements with us. For example, the on-going, publicly disclosed investigations in Brazil have adversely impacted our shipyard customers, their customers, entities providing financing for our shipyard customers and/or entities in the supply chain. The investigations in Brazil have led to, and are expected to continue to lead to, delays in deliveries to our shipyard customers in Brazil, along with temporary suspension of performance under our supply contracts, and have resulted in cancellations and could result in further attempted cancellation or other breaches of our contracts by our shipyard customers.
In other jurisdictions, our shipyard customers’ customers in some instances have sought, and may in the future seek, suspension, delay or cancellation of the contracts or payment due between our shipyard customers and their customers. To the extent our shipyard customers and their customers become engaged in disputes or litigation related to any such suspensions, delays or cancellations, we may also become involved, either directly or indirectly, in such disputes or litigation, as we enforce the terms of our contracts with our shipyard customers. As the result of such disputes, payments to us may be delayed or jeopardized. Further, customers in other markets may seek delay or suspension of deliveries, the extension of delivery into future periods, or may attempt cancellations. While we manage deliveries and collection of payment to achieve milestone payments that mitigate our financial risk, such delays, suspensions, attempted cancellations, breaches of contract or other similar circumstances, could adversely affect our operating results, collections of accounts receivable and financial condition and could reduce our backlog.
17
| 14. | New Accounting Pronouncements |
Recently Adopted Accounting Standards
In July 2015, the FASB issued Accounting Standard Update No. 2015-11 “Simplifying the Measurement of Inventory” (ASU 2015-11). This update requires inventory measured using the first in, first out (FIFO) or average cost methods to be subsequently measured at the lower of cost and net realizable value. Net realizable value is the estimated selling price in the ordinary course of business, less reasonably predictable cost of completion, disposal and transportation. ASU 2015-11 is effective for fiscal years beginning after December 15, 2016, and for interim periods within those fiscal years. The Company adopted this update on January 1, 2017 with no material impact.
In March 2016, the FASB issued Accounting Standard Update No. 2016-09 “Improvements to Employee Share-Based Payment Accounting” (ASU 2016-09). This update simplifies several aspects of accounting for share-based payment transactions, including the income tax consequences, forfeitures, and the classification on the statement of cash flows. ASU 2016-09 is effective for fiscal periods beginning after December 15, 2016, and for interim periods within those fiscal years. The Company adopted this update on January 1, 2017. The cumulative impact of the adoption of this standard was $1 million to retained earnings, and the classification on the statement of cash flows was applied on a prospective basis. The Company also recorded a $4 million increase to tax expense in the first quarter of 2017 due to the impact of the adoption of this standard.
In October 2016, the FASB issued Accounting Standard Update No. 2016-16 “Intra-Entity Transfers of Assets Other Than Inventory” (ASU 2016-16). This update requires an entity to recognize the income tax consequences of an intra-entity transfer of an asset other than inventory when the transfer occurs. ASU 2016-16 is effective for fiscal years beginning after December 15, 2017, and for interim reporting periods within those fiscal years. The Company has early adopted this update on January 1, 2017 and recorded a $5 million reduction to retained earnings and receivables. The effect of the change on net income is not significant.
In January 2017, the FASB issued Accounting Standard Update No. 2017-04 “Simplifying the Test for Goodwill Impairment” (ASU 2017-04). This update eliminates the requirement to compute the implied fair value of goodwill under Step 2 of the goodwill impairment test. ASU 2017-04 is effective for fiscal periods beginning after December 15, 2019. Early adoption is permitted for interim or annual goodwill impairment tests performed on testing dates after January 1, 2017. The Company has early adopted this update on July 1, 2017 with no material impact.
Recently Issued Accounting Standards
In August 2017, the FASB issued Accounting Standard Update No. 2017-12 “Derivatives and Hedging – Targeted Improvements to Accounting for Hedging Activities” (ASU 2017-12). This update improves the financial reporting of hedging relationships and simplifies the application of the hedge accounting guidance. ASU 2017-12 is effective for fiscal periods beginning after December 15, 2018, and for interim periods within those fiscal years. Early adoption is permitted in any interim period after issuance of ASU 2017-12. The Company is currently assessing the impact of the adoption of ASU No. 2017-12 on its consolidated financial position and results of operations.
In March 2017, the FASB issued Accounting Standard Update No. 2017-07 “Improving the Presentation of Net Periodic Pension Cost and Net Periodic Postretirement Benefit Cost” (ASU 2017-07). This update requires that an employer report the service cost component in the same line item as other compensation costs and separately from other components of net benefit cost. ASU 2017-04 is effective for fiscal periods beginning after December 15, 2017, and for interim periods within those fiscal years. The Company is currently assessing the impact of the adoption of ASU No. 2017-04 on its consolidated financial position and results of operations.
In August 2016, the FASB issued Accounting Standard Update No. 2016-15 “Classification of Certain Cash Receipts and Cash Payments” (ASU 2016-15). This update amends Accounting Standard Codification Topic No. 230 “Statement of Cash Flows” and provides guidance and clarification on presentation of certain cash flow issues. ASU No. 2016-15 is effective for fiscal years beginning after December 15, 2017, and for interim periods within those fiscal years. The Company is currently assessing the impact of the adoption of ASU No. 2016-15 on its consolidated statement of cash flows.
In March 2016, the FASB issued ASC Topic 842, “Leases” (ASC Topic 842), which supersedes the lease requirements in ASC Topic No. 840 “Leases” and most industry-specific guidance. This update increases transparency and comparability among organizations by recognizing lease assets and lease liabilities on the balance sheet and disclosing key information about leasing arrangements. ASC Topic 842 is effective for fiscal years beginning after December 15, 2018, and for interim periods within those fiscal years.
In preparing for the adoption of this new standard, the Company has established an internal team to centralize the implementation process as well as engaged external resources to assist in our approach. We are currently utilizing a software program to consolidate and accumulate leases with documentation as required by the new standard. We have assessed the changes to the Company’s current accounting practices and are currently investigating the related tax impact and process changes. We are also in process of quantifying the impact of the new standard on our balance sheet.
In May 2014, the FASB issued Accounting Standard Update No. 2014-09, “Revenue from Contracts with Customers” (ASU 2014-09), which supersedes the revenue recognition requirements in FASB ASC Topic 605, “Revenue Recognition,” and most industry-specific guidance. This ASU proscribes a five-step model for determining when and how revenue is recognized. Under the model, an entity will recognize revenue to depict the transfer of goods or services to a customer at an amount reflecting the consideration it expects to receive in exchange for those goods or services.
18
The standard permits either a full retrospective adoption, in which the standard is applied to all the periods presented, or a modified retrospective adoption, in which the standard is applied only to the current period with a cumulative-effect adjustment reflected in retained earnings. ASU 2014-09 is effective for fiscal periods beginning after December 15, 2017. The Company currently anticipates following the modified retrospective adoption.
In 2015, the Company assembled an internal team to study the provisions of ASU 2014-09, began assessing the potential impacts on the Company and educating the organization. In 2016, the Company engaged external resources to complete the assessment of potential changes to current accounting practices related to material revenue streams. Potential impacts were identified based on required changes to current processes to accommodate provisions in the new standard. We are currently designing and implementing required process, system, control and data requirement chanages to address the impacts identified in our assessments.
Based on an analysis of revenue streams, customer contracts and transactions, the Company does not expect a material change in the timing or other impacts to revenue recognition across most of our businesses. We are still evaluating certain revenue streams, which will change from point-in-time to over-time revenue recognition, and we are reviewing the impact of the new disclosure requirements.
19
| Item 2. | Management’s Discussion and Analysis of Financial Condition and Results of Operations |
Introduction
National Oilwell Varco, Inc. (the “Company”) is a leading oilfield equipment manufacturer and technology provider. The breadth and depth of our product and technology portfolio supports customers’ full-field development needs, from drilling to completion to production, in basins around the world, land or offshore. As a leading provider of technology and industrial capabilities to the oilfield, we have a long tradition of pioneering innovations that improve the cost-effectiveness, efficiency, safety and environmental impact of oil and gas operations.
Unless indicated otherwise, results of operations data are presented in accordance with accounting principles generally accepted in the United States (“GAAP”). To provide investors with additional information regarding our results of operations, certain non-GAAP financial measures are provided. See Non-GAAP Financial Measures and Reconciliations in Results of Operations for an explanation of our use of non-GAAP financial measures and reconciliations to their corresponding measures calculated in accordance with GAAP.
Rig Systems
The Company’s Rig Systems segment makes and supports the capital equipment and integrated systems needed to drill oil and gas wells on land and offshore. The segment designs, manufactures, and sells land rigs, complete offshore drilling equipment packages, and drilling rig components that mechanize, improve and automate many complex rig processes.
Equipment and technologies in Rig Systems include: power transmission systems, like drives and generators; substructures, derricks, and masts; pipe lifting, racking, rotating, and assembly systems; pressure control equipment, including blowout preventers; cranes; and rig instrumentation and control systems.
Rig Systems supports land and offshore drillers. Demand for the segment’s products depends on drilling contractors’ and oil and gas companies’ capital spending plans, specifically capital expenditures on rig construction and refurbishment.
Rig Aftermarket
The Company’s Rig Aftermarket segment provides comprehensive aftermarket products and services to support a large installed base of land and offshore rigs, and drilling rig components manufactured by the Company’s Rig Systems segment. The segment provides spare parts, repair, and rentals as well as technical support, field service and first well support, field engineering, and customer training through a network of aftermarket service and repair facilities strategically located in major areas of drilling operations.
Rig Aftermarket supports land and offshore drillers. Demand for the segment’s products and services depends on overall levels of oilfield drilling activity, which drives demand for spare parts, service, and repair for Rig Systems’ large installed base of equipment; and secondarily on drilling contractors’ and oil and gas companies’ capital spending plans, specifically capital expenditures on rig refurbishments and re-certifications.
Wellbore Technologies
The Company’s Wellbore Technologies segment designs, manufactures, rents, and sells a variety of equipment and technologies used to perform drilling operations, and offers services that optimize their performance. Key technologies and services include: drilling optimization and automation services; instrumentation, measuring and monitoring systems; drill bits; downhole tools, like downhole drilling motors and other steerable technologies; solids control and waste management equipment and services; drilling fluids; premium drill pipe, wired pipe and drill string accessories; tubular inspection, repair and coating services; fishing tools and hole openers; and portable power generation.
The Wellbore Technologies segment focuses on oil and gas companies and supports drilling contractors, oilfield service companies, and oilfield rental companies. Additional customers include steel mills and industrial companies. Demand for Wellbore Technologies’ products and services primarily depends on the level of oilfield drilling activity by oil and gas companies, drilling contractors, and oilfield service companies, as measured by rig count, well count, and footage drilled.
20
Completion & Production Solutions
The Company’s Completion & Production Solutions segment integrates technologies for well completions and oil and gas production. The segment designs, manufactures, and sells equipment and technologies needed for hydraulic stimulation, including pressure pumping trucks, blenders, sanders, hydration units, injection units, flowline, manifolds and completion tools; well intervention, including coiled tubing units, coiled tubing, and wireline units and tools; offshore production, including process equipment, conductor pipe connectors, floating production systems and subsea production technologies; and, onshore production including surface transfer and progressive cavity pumps, positive displacement reciprocating pumps, pressure vessels, composite pipe, and artificial lift systems.
Completion & Production Solutions supports service companies and oil and gas companies. Demand for Completion & Production Solutions’ products depends on the level of oilfield completions and workover activity by oilfield service companies and drilling contractors and capital spending plans by oil and gas companies and oilfield service companies.
Critical Accounting Policies and Estimates
In our annual report on Form 10-K for the year ended December 31, 2016, we identified our most critical accounting policies. In preparing the financial statements, we make assumptions, estimates and judgments that affect the amounts reported. We periodically evaluate our estimates and judgments that are most critical in nature which are related to revenue recognition under long-term construction contracts; allowance for doubtful accounts; inventory reserves; impairment of long-lived assets (excluding goodwill and other indefinite-lived intangible assets); goodwill and other indefinite-lived intangible assets; purchase price allocation of acquisitions; service and product warranties; and income taxes. Our estimates are based on historical experience and on our future expectations that we believe are reasonable. The combination of these factors forms the basis for making judgments about the carrying values of assets and liabilities that are not readily apparent from other sources. Actual results are likely to differ from our current estimates and those differences may be material.
21
EXECUTIVE SUMMARY
For the third quarter ended September 30, 2017, the Company had a $26 million net loss attributable to Company, or $(0.07) per fully diluted share, on $1.8 billion in revenue. Compared to the second quarter of 2017, revenue increased $76 million or 4% and net loss attributable to Company decreased $49 million or 65%. Compared to the third quarter of 2016, revenue increased $189 million or 11%, and net loss attributable to Company decreased $ 1,336 million or 98%.
Operating loss for the third quarter of 2017 was $7 million, or (0.4)% of sales. Excluding other items from all periods, operating loss was $7 million or (0.4)% of sales in the third quarter of 2017, compared to operating loss of $32 million or (1.8)% of sales in the second quarter of 2017, and operating loss of $108 million or (6.6)% of sales in the third quarter of 2016.
During the third quarter of 2017, second quarter of 2017, and third quarter of 2016, pre-tax other items (severance, facility closures, write-downs, goodwill impairment,and other) included in operating loss were nil, $30 million and $1,078 million, respectively. Excluding other items from all periods, third quarter 2017 earnings (losses) were $(0.07) per fully diluted share, compared to $(0.14) per fully diluted share in the second quarter of 2017 and $(0.34) per fully diluted share in the third quarter of 2016.
Oil & Gas Equipment and Services Market
Over the past two decades, technological advancements in the oilfield equipment and service space unlocked production from formations that were previously deemed uneconomic, especially in North America. From 2004 to 2014 global oil and liquids supply increased dramatically from U.S. unconventional resources, deep-water (defined as water depths greater than 400 feet) resources and from other sources. The advances in technology combined with relatively high commodity prices caused by growing demand enabled and sustained an increase in global drilling activity. Global supply started to catch up to demand, and in the latter half of 2014, demand growth in areas such as Asia, Europe and the U.S. weakened while drilling activity remained strong and production continued to grow. As a result, global inventories of crude and refined products grew and the price of oil declined significantly during early 2015, remaining depressed throughout the year and undergoing another major reduction toward the end of 2015. In early 2016, the market witnessed oil trading in the high $20 per barrel range, prices not seen since 2003.
In response to rapidly deteriorating market conditions, operators acutely reduced both operating and capital expenditures. Orders for our equipment and services slowed and rig counts declined rapidly with active U.S. drilling rig counts hitting 70 year lows and international rig counts reaching decade lows during the second quarter of 2016. As a result of the sharp cutback in activity, production began to decline in certain areas of the world and commodity prices started to rebound as oil markets commenced the process of re-balancing. The market downturn began to stabilize during the second half of 2016 and showed early signs of improvement during the fourth quarter of 2016. During the first three quarters of 2017, land drilling activity in North America continued to increase, while international markets stabilized and offshore activity neared bottom. The average price of West Texas Intermediate Cushing Crude for the third quarter of 2017 was $48.15 a barrel.
Segment Performance
The Rig Systems segment generated $330 million in revenue and $11 million in operating profit or 3.3% of sales in the third quarter of 2017. Compared to the prior quarter, revenue decreased $16 million or 5%, and operating profit increased $18 million or 257%. Compared to the third quarter of 2016, segment revenue decreased $140 million or 30%, and operating profit increased $973 million or 101%. Third quarter 2017 revenue out of backlog for the Rig Systems segment decreased 10% sequentially and 45% year-over-year on fewer shipments of offshore projects. During the third quarter of 2017, the segment received $84 million in new orders and had $101 million of order cancellations, which came from an agreement with a customer to cancel two jackup drilling equipment package orders in exchange for firm commitments to continue forward with several other jackup packages the customer has under contract, retention of down payments, and other consideration. Backlog for capital equipment orders for the Rig Systems segment at September 30, 2017 was $2.0 billion.
The Rig Aftermarket segment generated $311 million in revenue and $64 million in operating profit or 20.6% of sales in the third quarter of 2017. Compared to the prior quarter, revenue decreased $30 million or 9%, and operating profit decreased $12 million or 16%. Compared to the third quarter of 2016, segment revenue decreased $11 million or 3%, and operating profit decreased $8 million or 11%. Revenue declined sequentially as drilling contractor customers curtailed aftermarket spending in response to uncertain near-term market conditions.
The Wellbore Technologies segment generated $693 million in revenue and operating profit was nil for the third quarter of 2017. Compared to the prior quarter, revenue increased $79 million or 13%, and operating loss decreased $24 million. Compared to the third quarter of 2016, revenue increased $167 million or 32%, and operating loss decreased $94 million. The increase in revenue from the prior year was driven primarily by activity increases in North America and the Middle East.
The Completion & Production Solutions segment generated $682 million in revenue and $44 million in operating profit or 6.5% of sales during the third quarter of 2017. Compared to the prior quarter, revenue increased $30 million or 5%, and operating profit increased $17 million or 63%. Compared to the third quarter of 2016, revenue increased $139 million or 26%, and operating profit increased
22
$105 million or 172%. Revenue and operating profit increased year-over-year primarily due to higher levels of completion and production activity in North America. During the third quarter of 2017, the segment received $463 million in new orders. Backlog for capital equipment orders for the Completion & Production Solutions segment at September 30, 2017 was $974 million.
Outlook
Activity in North America increased sharply off historical lows during the last two quarters of 2016 and first three quarters of 2017 and declines in supply, assisted by OPEC production cuts, appear to be rebalancing the market; however, global stocks of crude oil and refined product remain bloated and challenging conditions persist. Consequently, we are cautious in our outlook for the remainder of 2017, and anticipate that our customers will continue to moderate capital expenditures until there is more certainty in a sustainable recovery in commodity prices.
While North America land drilling has increased, activity levels remain well below prior cyclical highs. International activity, which had been slower to fall than North American activity, appears to be at or approaching a bottom with many markets stabilizing. Offshore activity, which has longer project cycle times and, in certain instances, more challenged economics, may continue to decline through the fourth quarter of 2017 and into 2018. Although the Company believes offshore activity is approaching a bottom.
Low activity levels result in an oversupply of service capacity and capital equipment, creating challenging prospects for many of our customers and sharply reducing demand for our products. In this environment, contractors are hesitant to invest in their existing equipment to conserve as much capital as possible. Equipment is neglected and idle fleets are often stripped of parts to sustain assets that remain active. Additionally, certain equipment becomes less desirable and obsolete as equipment manufacturers develop new technologies and produce more efficient equipment that lowers the marginal cost of supply for oil and gas operating companies. We believe the sharp spending reductions our customers have had in place for an extended period have created pent up demand for our products that is beginning to show in certain areas where industry activity levels have begun to improve.
Our global customer base includes national oil companies, international oil companies, independent oil and gas companies, onshore and offshore service companies and others whose strategies and reactions to low commodity prices vary. Likewise, we expect the slope and timing of revenue decline, stabilization and recovery will be different across our operating regions and our four business segments. Elements of our Wellbore Technologies and Rig Aftermarket segments are expected to see a faster recovery as drilling of new wells increases, while a strong recovery for the more capital equipment oriented businesses within our Completion & Production Solutions and Rig Systems segments may come later in the cycle.
We will continue to adjust the size of our operations to fit anticipated levels of activity while investing in developing and acquiring new products, technologies and operations that advance our longer term strategic goals. The Company has a history of implementing cost-control measures and downsizing in response to depressed market conditions as well as cost effectively ramping operations to capitalize on rapidly increasing demand. The Company has closed, or is in the process of closing, 385 locations over the past three years. It has reduced its annual expenses relating to salaries, wages, outside services, contractors, travel and entertainment by approximately $3.0 billion. The Company remains optimistic regarding longer-term market fundamentals as existing oil and gas fields continue to deplete and numerous major projects to replenish supply have been deferred or canceled while global demand is expected to continue to grow.
We expect unconventional shale resources to continue to gain a greater share of global production, and we continue to enhance the Company’s offering into unconventional resource focused products and technologies, including advanced, automated drilling rigs; premium drillpipe and directional drilling technologies; hydraulic fracture stimulation equipment; and multistage completion tools. We expect big data and predictive analytics to improve uptime and operating efficiency, and the Company remains at the forefront of applying this promising technology to oilfield drilling and completion equipment. We expect the oil and gas industry to adopt more efficient supply chain practices that the Company is pioneering to construct floating production facilities to produce the immense resources discovered offshore. The Company has used the recent downturn to vigorously advance these strategic initiatives, and we are encouraged by our progress.
23
Operating Environment Overview
The Company’s results are dependent on, among other things, the level of worldwide oil and gas drilling, well remediation activity, the prices of crude oil and natural gas, capital spending by other oilfield service companies and drilling contractors, and worldwide oil and gas inventory levels. Key industry indicators for the third quarter of 2017 and 2016, and the second quarter of 2017 include the following:
| 3Q17* | 3Q16* | 2Q17* | % 3Q17 3Q16 |
% 3Q17 2Q17 |
||||||||||||||||
| Active Drilling Rigs: |
||||||||||||||||||||
| U.S. |
947 | 479 | 892 | 97.7 | % | 6.2 | % | |||||||||||||
| Canada |
208 | 122 | 115 | 70.5 | % | 80.9 | % | |||||||||||||
| International |
947 | 936 | 957 | 1.2 | % | (1.0 | %) | |||||||||||||
|
|
|
|
|
|
|
|
|
|
|
|||||||||||
| Worldwide |
2,102 | 1,537 | 1,964 | 36.8 | % | 7.0 | % | |||||||||||||
| West Texas Intermediate Crude Prices (per barrel) |
$ | 48.15 | $ | 44.85 | $ | 48.24 | 7.4 | % | (0.2 | %) | ||||||||||
| Natural Gas Prices ($/mmbtu) |
$ | 2.93 | $ | 2.85 | $ | 3.05 | 2.8 | % | (3.9 | %) | ||||||||||
| * | Averages for the quarters indicated. See sources below. |
24
The following table details the U.S., Canadian, and international rig activity and West Texas Intermediate Crude Oil prices for the past nine quarters ended September 30, 2017, on a quarterly basis:
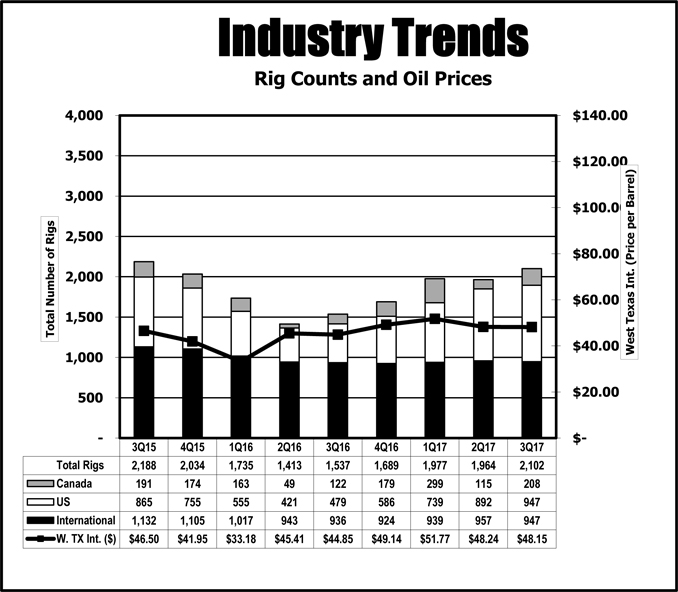
Source: Rig count: Baker Hughes, Inc. (www.bakerhughes.com); West Texas Intermediate Crude Oil and Natural Gas Prices: Department of Energy, Energy Information Administration (www.eia.doe.gov).
The worldwide quarterly average rig count increased 7.0% (from 1,964 to 2,102), and the U.S. increased 6.2% (from 892 to 947), in the third quarter of 2017 compared to the second quarter of 2017. The average per barrel price of West Texas Intermediate Crude Oil decreased 0.2% (from $48.24 per barrel to $48.15 per barrel) and natural gas prices decreased 3.9% (from $3.05 per mmbtu to $2.93 per mmbtu) in the third quarter of 2017 compared to the second quarter of 2017.
U.S. rig activity at October 20, 2017 was 913 rigs, decreasing 4% compared to the third quarter of 2017 average of 947 rigs. The price for West Texas Intermediate Crude Oil was at $51.47 per barrel at October 20, 2017, increasing 7% from the third quarter of 2017 average. The price for natural gas was at $2.92 per mmbtu at October 20, 2017, decreasing 0.3% from the third quarter of 2017 average.
25
Results of Operations
Operating results by segment are as follows (in millions):
| Three Months Ended September 30, |
Nine Months Ended September 30, |
|||||||||||||||
| 2017 | 2016 | 2017 | 2016 | |||||||||||||
| Revenue: |
||||||||||||||||
| Rig Systems |
$ | 330 | $ | 470 | $ | 1,069 | $ | 1,960 | ||||||||
| Rig Aftermarket |
311 | 322 | 973 | 1,077 | ||||||||||||
| Wellbore Technologies |
693 | 526 | 1,862 | 1,668 | ||||||||||||
| Completion & Production Solutions |
682 | 543 | 1,982 | 1,639 | ||||||||||||
| Eliminations |
(181 | ) | (215 | ) | (551 | ) | (785 | ) | ||||||||
|
|
|
|
|
|
|
|
|
|||||||||
| Total revenue |
$ | 1,835 | $ | 1,646 | $ | 5,335 | $ | 5,559 | ||||||||
|
|
|
|
|
|
|
|
|
|||||||||
| Operating profit (loss): |
||||||||||||||||
| Rig Systems |
$ | 11 | $ | (962 | ) | $ | 13 | $ | (888 | ) | ||||||
| Rig Aftermarket |
64 | 72 | 201 | 203 | ||||||||||||
| Wellbore Technologies |
— | (94 | ) | (81 | ) | (331 | ) | |||||||||
| Completion & Production Solutions |
44 | (61 | ) | 79 | (132 | ) | ||||||||||
| Eliminations and corporate costs |
(126 | ) | (141 | ) | (378 | ) | (497 | ) | ||||||||
|
|
|
|
|
|
|
|
|
|||||||||
| Total operating profit (loss) |
$ | (7 | ) | $ | (1,186 | ) | $ | (166 | ) | $ | (1,645 | ) | ||||
|
|
|
|
|
|
|
|
|
|||||||||
| Operating profit (loss)%: |
||||||||||||||||
| Rig Systems |
3.3 | % | (204.7 | %) | 1.2 | % | (45.3 | %) | ||||||||
| Rig Aftermarket |
20.6 | % | 22.4 | % | 20.7 | % | 18.8 | % | ||||||||
| Wellbore Technologies |
0.0 | % | (17.9 | %) | (4.4 | %) | (19.8 | %) | ||||||||
| Completion & Production Solutions |
6.5 | % | (11.2 | %) | 4.0 | % | (8.1 | %) | ||||||||
| Total operating profit (loss) % |
(0.4 | %) | (72.1 | %) | (3.1 | %) | (29.6 | %) | ||||||||
Rig Systems
Three and nine months ended September 30, 2017 and 2016. Revenue from Rig Systems was $330 million for the three months ended September 30, 2017, compared to $470 million for the three months ended September 30, 2016, a decrease of $140 million or 30%. For the nine months ended September 30, 2017, revenue from Rig Systems was $1,069 million compared to $1,960 million for the nine months ending September 30, 2016, a decrease of $891 million or 45%.
Operating profit (loss) from Rig Systems was $11 million for the three months ended September 30, 2017 compared to $(962) million for the three months ended September 30, 2016, an increase of $973 million. Operating profit (loss) percentage increased to 3.3% for the three months ended September 30, 2017, from (204.7)% in the three months ended September 30, 2016. For the nine months ended September 30, 2017, operating profit (loss) from Rig Systems was $13 million compared to $(888) million for the nine months ending September 30, 2016, an increase of $901 million. Operating profit (loss) percentage increased to 1.2% for the nine months ended September 30, 2017, from (45.3)% in the nine months ended September 30, 2016. Operating profit percentage increased due to a nonrecurring $972 million goodwill impairment charge in the third quarter of 2016.
The Rig Systems segment monitors its capital equipment backlog to plan its business. New orders are added to backlog only when the Company receives a firm written order for major drilling rig components or a signed contract related to a construction project. The capital equipment backlog was $2.0 billion at September 30, 2017, a decrease of $753 million, or 27%, from backlog of $2.8 billion at September 30, 2016. Numerous factors may affect the timing of revenue out of backlog. Considering these factors, the Company reasonably expects approximately $245 million of revenue out of backlog for the remainder of 2017 and approximately $1.8 billion of revenue out of backlog in 2018 and thereafter. At September 30, 2017, approximately 76% of the capital equipment backlog was for offshore products and approximately 80% of the capital equipment backlog was destined for international markets.
26
Rig Aftermarket
Three and nine months ended September 30, 2017 and 2016. Revenue from Rig Aftermarket was $311 million for the three months ended September 30, 2017, compared to $322 million for the three months ended September 30, 2016, a decrease of $11 million or 3%. For the nine months ended September 30, 2017, revenue from Rig Aftermarket was $973 million compared to $1,077 million for the nine months ending September 30, 2016, a decrease of $104 million or 10%. This decrease was due to the decrease in offshore related drilling activity.
Operating profit from Rig Aftermarket was $64 million for the three months ended September 30, 2017 compared to $72 million for the three months ended September 30, 2016, a decrease of $8 million or 11%. Operating profit percentage decreased to 20.6% for the three months ended September 30, 2017, from 22.4% in the three months ended September 30, 2016. For the nine months ended September 30, 2017, operating profit from Rig Aftermarket was $201 million compared to $203 million for the nine months ending September 30, 2016, a decrease of $2 million or 1%. Operating profit percentage increased to 20.7% for the nine months ended September 30, 2017, from 18.8% in the nine months ended September 30, 2016. Operating profit percentage increased due to a change in product mix.
Wellbore Technologies
Three and nine months ended September 30, 2017 and 2016. Revenue from Wellbore Technologies was $693 million for the three months ended September 30, 2017, compared to $526 million for the three months ended September 30, 2016, an increase of $167 million or 32%. For the nine months ended September 30, 2017, revenue from Wellbore Technologies was $1,862 million compared to $1,668 million for the nine months ending September 30, 2016, an increase of $194 million or 12%. This increase was due to improving North American market conditions.
Operating profit (loss) from Wellbore Technologies was nil for the three months ended September 30, 2017 compared to $(94) million for the three months ended September 30, 2016, an increase of $94 million. Operating profit (loss) percentage increased to 0% for the three months ended September 30, 2017, from (17.9)% in the three months ended September 30, 2016. For the nine months ended September 30, 2017, operating loss from Wellbore Technologies was $81 million compared to $331 million for the nine months ending September 30, 2016, a decrease of $250 million or 76%. Operating loss percentage decreased to (4.4)% for the nine months ended September 30, 2017, from (19.8)% in the nine months ended September 30, 2016. This improvement was due to operating efficiencies and better market conditions.
Completion & Production Solutions
Three and nine months ended September 30, 2017 and 2016. Revenue from Completion & Production Solutions was $682 million for the three months ended September 30, 2017, compared to $543 million for the three months ended September 30, 2016, an increase of $139 million or 26%. For the nine months ended September 30, 2017, revenue from Completion & Production Solutions was $1,982 million compared to $1,639 million for the nine months ending September 30, 2016, an increase of $343 million or 21%. This increase was due to the overall increase in demand for capital equipment used in completion and production related activities.
Operating profit (loss) from Completion & Production Solutions was $44 million for the three months ended September 30, 2017 compared to $(61) million for the three months ended September 30, 2016, an increase of $105 million or 172%. Operating profit (loss) percentage increased to 6.5% for the three months ended September 30, 2017, from (11.2)% in the three months ended September 30, 2016. For the nine months ended September 30, 2017, operating profit from Completion & Production Solutions was $79 million compared to operating loss of $132 million for the nine months ending September 30, 2016, an increase of $211 million or 160%. Operating profit (loss) percentage increased to 4.0% for the nine months ended September 30, 2017, from (8.1)% in the nine months ended September 30, 2016. This increase was due to an overall increase in market activity.
The Completion & Productions Solutions segment monitors its capital equipment backlog to plan its business. New orders are added to backlog only when the Company receives a firm written order for major completion and production components or a signed contract related to a construction project. The capital equipment backlog was $974 million at September 30, 2017, an increase of $162 million, or 20% from backlog of $812 million at September 30, 2016. Numerous factors may affect the timing of revenue out of backlog. Considering these factors, the Company reasonably expects approximately $415 million of revenue out of backlog for the remainder of 2017 and approximately $559 million of revenue out of backlog in 2018 and thereafter. At September 30, 2017, approximately 51% of the capital equipment backlog was for offshore products and approximately 70% of the capital equipment backlog was destined for international markets.
Eliminations and corporate costs
Eliminations and corporate costs were $126 million and $378 million for the three and nine months ended September 30, 2017, respectively, compared to $141 million and $497 million for the three and nine months ended September 30, 2016, respectively. This change is primarily due to the change in intersegment eliminations. Sales from one segment to another generally are priced at estimated equivalent commercial selling prices; however, segments originating an external sale are credited with the full profit to the company. Eliminations include intercompany transactions conducted between the four reporting segments that are eliminated in consolidation. Intercompany transactions within each reporting segment are eliminated within each reporting segment.
27
Other income (expense), net
Other income (expense), net were expenses of $6 million and $19 million for the three and nine months ended September 30, 2017, respectively, compared to expenses of $30 million and $85 million for the three and nine months ended September 30, 2016, respectively. The change in expense was primarily due to the fluctuations in foreign currencies.
Provision for income taxes
The effective tax rates for the three and nine months ended September 30, 2017 were 10.0% and 10.5%, respectively, compared to (9.6)% and 6.5% for the same periods in 2016. Market conditions continued to negatively impact our business in the third quarter of 2017. As a result of these conditions, we continue to establish valuation allowances on deferred tax assets for losses and tax credits generated in the current year, which, when applied to losses resulted in a lower effective tax rate than the U.S. statutory rate. For the three and nine months ended September 30, 2016, impairment of goodwill not deductible for tax purposes, lower tax rates on losses incurred in foreign jurisdictions, and the establishment of valuation allowances, when applied to losses resulted in a lower effective tax rate than the U.S. statutory rate.
28
Non-GAAP Financial Measures and Reconciliations
To provide investors with additional information regarding our results of operations, we disclose various non-GAAP financial measures in our quarterly earnings press releases and other public disclosures. Each of these financial measures excludes the impact of certain amounts as further identified below and have not been calculated in accordance with GAAP. A reconciliation of each of these non-GAAP financial measures to its most comparable GAAP financial measure is included below, and these non-GAAP financial measures are not intended to replace GAAP financial measures.
We use these non-GAAP financial measures internally to evaluate and manage the Company’s operations because we believe it provides useful supplemental information regarding the Company’s on-going economic performance. We have chosen to provide this information to investors to enable them to perform more meaningful comparisons of operating results and as a means to emphasize the results of on-going operations.
The following tables set forth the reconciliations of these non-GAAP financial measures to their most comparable GAAP financial measures (in millions, except per share data):
| Three Months Ended | Nine Months Ended September 30, |
|||||||||||||||||||
| September 30, | June 30, 2017 |
|||||||||||||||||||
| 2017 | 2016 | 2017 | 2016 | |||||||||||||||||
| Reconciliation of operating loss: |
||||||||||||||||||||
| GAAP operating loss |
$ | (7 | ) | $ | (1,186 | ) | $ | (62 | ) | $ | (166 | ) | $ | (1,645 | ) | |||||
| Other (1): |
||||||||||||||||||||
| Rig Systems |
— | 994 | 16 | 23 | 1,069 | |||||||||||||||
| Rig Aftermarket |
— | 3 | 1 | 6 | 16 | |||||||||||||||
| Wellbore Technologies |
— | 24 | (4 | ) | (4 | ) | 112 | |||||||||||||
| Completion & Production Solutions |
— | 51 | 17 | 32 | 123 | |||||||||||||||
| Eliminations |
— | 6 | — | — | 16 | |||||||||||||||
|
|
|
|
|
|
|
|
|
|
|
|||||||||||
| Operating loss excluding other items |
$ | (7 | ) | $ | (108 | ) | $ | (32 | ) | $ | (109 | ) | $ | (309 | ) | |||||
|
|
|
|
|
|
|
|
|
|
|
|||||||||||
| Three Months Ended | Nine Months Ended September 30, |
|||||||||||||||||||
| September 30, | June 30, 2017 |
|||||||||||||||||||
| 2017 | 2016 | 2017 | 2016 | |||||||||||||||||
| Reconciliation of operating loss %: |
||||||||||||||||||||
| GAAP operating loss % |
(0.4 | %) | (72.1 | %) | (3.5 | %) | (3.1 | %) | (29.6 | %) | ||||||||||
| Asset write-downs and other items % |
0.0 | % | 65.5 | % | 1.7 | % | 1.1 | % | 24.0 | % | ||||||||||
|
|
|
|
|
|
|
|
|
|
|
|||||||||||
| Operating loss % excluding other items |
(0.4 | %) | (6.6 | %) | (1.8 | %) | (2.0 | %) | (5.6 | %) | ||||||||||
|
|
|
|
|
|
|
|
|
|
|
|||||||||||
| Three Months Ended | Nine Months Ended September 30, |
|||||||||||||||||||
| September 30, | June 30, | |||||||||||||||||||
| 2017 | 2016 | 2017 | 2017 | 2016 | ||||||||||||||||
| Reconciliation of adjusted loss per share: |
||||||||||||||||||||
| GAAP loss per share |
$ | (0.07 | ) | $ | (3.62 | ) | $ | (0.20 | ) | $ | (0.59 | ) | $ | (4.53 | ) | |||||
| Other (1) |
— | 0.18 | 0.06 | 0.10 | 0.67 | |||||||||||||||
| Goodwill write-downs (1) |
— | 2.51 | — | — | 2.51 | |||||||||||||||
| Fixed asset write-downs (Other income (expense), net) |
— | 0.02 | — | 0.02 | 0.08 | |||||||||||||||
| Tax items (Provision for income taxes) |
— | 0.57 | — | 0.09 | 0.57 | |||||||||||||||
|
|
|
|
|
|
|
|
|
|
|
|||||||||||
| Adjusted loss per share excluding other items |
$ | (0.07 | ) | $ | (0.34 | ) | $ | (0.14 | ) | $ | (0.38 | ) | $ | (0.70 | ) | |||||
|
|
|
|
|
|
|
|
|
|
|
|||||||||||
| (1) | Included in operating loss are other items related to costs associated with the Voluntary Early Retirement Plan established by the Company during the first quarter of 2016, goodwill impairment in the third quarter of 2016 and costs related to severance, facility closures, and other items. See Note 6. For the three and nine months ended September 30, 2017, other items included in operating loss were nil and $57 million, respectively. For the three and nine months ended September 30, 2016, other items included in operating loss were $1,078 million and $1,336 million, respectively. Other items included in operating loss for the three months ended June 30, 2017 totaled $30 million. |
29
Liquidity and Capital Resources
Overview
The Company assesses liquidity in terms of its ability to generate cash to fund operating, investing and financing activities. The Company remains in a strong financial position, with resources available to reinvest in existing businesses, strategic acquisitions and capital expenditures to meet short- and long-term objectives. The Company believes that cash on hand, cash generated from expected results of operations, amounts available under its credit facility and its commercial paper program will be sufficient to fund operations, anticipated working capital needs and other cash requirements such as capital expenditures, debt and interest payments and dividend payments for the foreseeable future.
At September 30, 2017, the Company had cash and cash equivalents of $1,722 million and total debt of $3,213 million. At December 31, 2016, cash and cash equivalents were $1,408 million and total debt was $3,214 million. As of September 30, 2017, approximately $1,370 million of the $1,722 million of cash and cash equivalents was held by our foreign subsidiaries, of which $1,319 million would be subject to a 35% U.S. income tax rate, offset by any available foreign tax credits if repatriated. However, our current plans are to indefinitely reinvest these funds outside of the U.S. If opportunities to invest in the U.S. are greater than available cash balances that are not subject to income tax, rather than repatriating cash, the Company may choose to borrow against its revolving credit facility or utilize its commercial paper program.
On June 27, 2017, the Company entered into a new $3.0 billion credit agreement evidencing a five-year unsecured revolving credit facility, which expires on June 27, 2022, with a syndicate of financial institutions. This new credit facility replaced the Company’s previous $4.5 billion revolving credit facility. The Company has the right to increase the aggregate commitments under this new agreement to an aggregate amount of up to $4.0 billion upon the consent of only those lenders holding any such increase. Interest under the new multicurrency facility is based upon LIBOR, NIBOR or CDOR plus 1.125% subject to a ratings-based grid or the U.S. prime rate. The new credit facility contains a financial covenant regarding maximum debt-to-capitalization ratio of 60%. As of September 30, 2017, the Company was in compliance with a debt-to-capitalization ratio of 18.5%.
The Company’s outstanding debt at September 30, 2017 was $3,213 million and consisted of $500 million in 1.35% Senior Notes, $1,392 million in 2.60% Senior Notes, $1,087 million in 3.95% Senior Notes, and other debt of $234 million. The Company was in compliance with all covenants at September 30, 2017.
At September 30, 2017, there were no commercial paper borrowings supported by the $3.0 billion credit facility and no outstanding letters of credit issued under the credit facility, resulting in $3.0 billion of funds available under this credit facility.
The Company had $731 million of outstanding letters of credit at September 30, 2017 that are under various bilateral letter of credit facilities. Letters of credit are issued as bid bonds, advanced payment bonds and performance bonds.
The following table summarizes our net cash provided by (used in) continuing operating activities, continuing investing activities and continuing financing activities for the periods presented (in millions):
| Nine Months Ended September 30, |
||||||||
| 2017 | 2016 | |||||||
| Net cash provided by operating activities |
$ | 511 | $ | 807 | ||||
| Net cash used in investing activities |
(184 | ) | (277 | ) | ||||
| Net cash used in financing activities |
(52 | ) | (1,116 | ) | ||||
Operating Activities
For the first nine months of 2017, cash provided by operating activities was $511 million compared to $807 million in the same period of 2016. Before changes in operating assets and liabilities, net of acquisitions, cash was provided primarily by net loss from operations of $221 million plus non-cash charges of $684 million.
The change in operating assets and liabilities in the first nine months of 2017 compared to the same period in 2016 was primarily due to declines in inventory, costs in excess of billings and prepaid and other current assets, partially offset by declines in accrued liabilities, billings in excess of cost and income taxes payable. Net changes in operating assets and liabilities, net of acquisitions, provided $48 million of cash for the first nine months of 2017 compared to cash provided of $915 million in the same period in 2016.
30
Investing Activities
For the first nine months of 2017, net cash used in investing activities was $184 million compared to $277 million for the same period of 2016. The decrease in net cash used in investing activities in the first nine months of 2017 compared to the same period in 2016 was primarily the result of lower capital expenditures, partially offset by higher acquisition activity. The Company used $127 million for capital expenditures during the first nine months of 2017 compared to $221 million for the same period of 2016 and $85 million for acquisitions in the first nine months of 2017 compared to $60 million for the same period of 2016.
Financing Activities
For the first nine months of 2017, net cash used in financing activities was $52 million compared to $1,116 million for the same period of 2016. This decrease was primarily the result of dividends paid of $57 million in 2017 compared to $211 million in 2016 and $4 million in payments on net borrowings in 2017 compared to $897 million used to make payments on net commercial paper borrowings and other in 2016.
Other
The effect of the change in exchange rates on cash flows was an increase of $39 million and $16 million for the first nine months of 2017 and 2016, respectively.
We believe that cash on hand, cash generated from operations, amounts available under our credit facility and through our commercial paper program, as well as from other sources of debt will be sufficient to fund operations, working capital needs, capital expenditure requirements, dividends and financing obligations.
We intend to pursue additional acquisition candidates, but the timing, size or success of any acquisition effort and the related potential capital commitments cannot be predicted. We continue to expect to fund future acquisitions primarily with cash on hand and cash flow from operations and borrowings, including the unborrowed portion of the credit facility, our commercial paper program or new debt issuances, but may also issue additional equity either directly or in connection with acquisitions. There can be no assurance that additional financing for acquisitions will be available at terms acceptable to us.
31
New Accounting Pronouncements
Recently Adopted Accounting Standards
In July 2015, the FASB issued Accounting Standard Update No. 2015-11 “Simplifying the Measurement of Inventory” (ASU 2015-11). This update requires inventory measured using the first in, first out (FIFO) or average cost methods to be subsequently measured at the lower of cost and net realizable value. Net realizable value is the estimated selling price in the ordinary course of business, less reasonably predictable cost of completion, disposal and transportation. ASU 2015-11 is effective for fiscal years beginning after December 15, 2016, and for interim periods within those fiscal years. The Company adopted this update on January 1, 2017 with no material impact.
In March 2016, the FASB issued Accounting Standard Update No. 2016-09 “Improvements to Employee Share-Based Payment Accounting” (ASU 2016-09). This update simplifies several aspects of accounting for share-based payment transactions, including the income tax consequences, forfeitures, and the classification on the statement of cash flows. ASU 2016-09 is effective for fiscal periods beginning after December 15, 2016, and for interim periods within those fiscal years. The Company adopted this update on January 1, 2017. The cumulative impact of the adoption of this standard was $1 million to retained earnings, and the classification on the statement of cash flows was applied on a prospective basis. The Company also recorded a $4 million increase to tax expense in the first quarter of 2017 due to the impact of the adoption of this standard.
In October 2016, the FASB issued Accounting Standard Update No. 2016-16 “Intra-Entity Transfers of Assets Other Than Inventory” (ASU 2016-16). This update requires an entity to recognize the income tax consequences of an intra-entity transfer of an asset other than inventory when the transfer occurs. ASU 2016-16 is effective for fiscal years beginning after December 15, 2017, and for interim reporting periods within those fiscal years. The Company has early adopted this update on January 1, 2017 and recorded a $5 million reduction to retained earnings and receivables. The effect of the change on net income is not significant.
In January 2017, the FASB issued Accounting Standard Update No. 2017-04 “Simplifying the Test for Goodwill Impairment” (ASU 2017-04). This update eliminates the requirement to compute the implied fair value of goodwill under Step 2 of the goodwill impairment test. ASU 2017-04 is effective for fiscal periods beginning after December 15, 2019. Early adoption is permitted for interim or annual goodwill impairment tests performed on testing dates after January 1, 2017. The Company has early adopted this update on July 1, 2017 with no material impact.
Recently Issued Accounting Standards
In August 2017, the FASB issued Accounting Standard Update No. 2017-12 “Derivatives and Hedging – Targeted Improvements to Accounting for Hedging Activities” (ASU 2017-12). This update improves the financial reporting of hedging relationships and simplifies the application of the hedge accounting guidance. ASU 2017-12 is effective for fiscal periods beginning after December 15, 2018, and for interim periods within those fiscal years. Early adoption is permitted in any interim period after issuance of ASU 2017-12. The Company is currently assessing the impact of the adoption of ASU No. 2017-12 on its consolidated financial position and results of operations.
In March 2017, the FASB issued Accounting Standard Update No. 2017-07 “Improving the Presentation of Net Periodic Pension Cost and Net Periodic Postretirement Benefit Cost” (ASU 2017-07). This update requires that an employer report the service cost component in the same line item as other compensation costs and separately from other components of net benefit cost. ASU 2017-04 is effective for fiscal periods beginning after December 15, 2017, and for interim periods within those fiscal years. The Company is currently assessing the impact of the adoption of ASU No. 2017-04 on its consolidated financial position and results of operations.
In August 2016, the FASB issued Accounting Standard Update No. 2016-15 “Classification of Certain Cash Receipts and Cash Payments” (ASU 2016-15). This update amends Accounting Standard Codification Topic No. 230 “Statement of Cash Flows” and provides guidance and clarification on presentation of certain cash flow issues. ASU No. 2016-15 is effective for fiscal years beginning after December 15, 2017, and for interim periods within those fiscal years. The Company is currently assessing the impact of the adoption of ASU No. 2016-15 on its consolidated statement of cash flows.
In March 2016, the FASB issued ASC Topic 842, “Leases” (ASC Topic 842), which supersedes the lease requirements in ASC Topic No. 840 “Leases” and most industry-specific guidance. This update increases transparency and comparability among organizations by recognizing lease assets and lease liabilities on the balance sheet and disclosing key information about leasing arrangements. ASC Topic 842 is effective for fiscal years beginning after December 15, 2018, and for interim periods within those fiscal years.
In preparing for the adoption of this new standard, the Company has established an internal team to centralize the implementation process as well as engaged external resources to assist in our approach. We are currently utilizing a software program to consolidate and accumulate leases with documentation as required by the new standard. We have assessed the changes to the Company’s current accounting practices and are currently investigating the related tax impact and process changes. We are also in process of quantifying the impact of the new standard on our balance sheet.
In May 2014, the FASB issued Accounting Standard Update No. 2014-09, “Revenue from Contracts with Customers” (ASU 2014-09), which supersedes the revenue recognition requirements in FASB ASC Topic 605, “Revenue Recognition,” and most industry-specific guidance. This ASU proscribes a five-step model for determining when and how revenue is recognized. Under the model, an entity will recognize revenue to depict the transfer of goods or services to a customer at an amount reflecting the consideration it expects to receive in exchange for those goods or services.
32
The standard permits either a full retrospective adoption, in which the standard is applied to all the periods presented, or a modified retrospective adoption, in which the standard is applied only to the current period with a cumulative-effect adjustment reflected in retained earnings. ASU 2014-09 is effective for fiscal periods beginning after December 15, 2017. The Company currently anticipates following the modified retrospective adoption.
In 2015, the Company assembled an internal team to study the provisions of ASU 2014-09, began assessing the potential impacts on the Company and educating the organization. In 2016, the Company engaged external resources to complete the assessment of potential changes to current accounting practices related to material revenue streams. Potential impacts were identified based on required changes to current processes to accommodate provisions in the new standard. We are currently designing and implementing required process, system, control and data requirement changes to address the impacts identified in our assessments.
Based on an analysis of revenue streams, customer contracts and transactions, the Company does not expect a material change in the timing or other impacts to revenue recognition across most of our businesses. We are still evaluating certain revenue streams, which will change from point-in-time to over-time revenue recognition, and we are reviewing the impact of the new disclosure requirements.
33
Forward-Looking Statements
Some of the information in this document contains, or has incorporated by reference, forward-looking statements. Statements that are not historical facts, including statements about our beliefs and expectations, are forward-looking statements. Forward-looking statements typically are identified by use of terms such as “may,” “expect,” “anticipate,” “estimate,” and similar words, although some forward-looking statements are expressed differently. All statements herein regarding expected merger synergies are forward-looking statements. You should be aware that our actual results could differ materially from results anticipated in the forward-looking statements due to a number of factors, including but not limited to changes in oil and gas prices, customer demand for our products, difficulties encountered in integrating mergers and acquisitions, and worldwide economic activity. You should also consider carefully the statements under “Risk Factors,” as disclosed in our Annual Report on Form 10-K for the year ended December 31, 2016, which address additional factors that could cause our actual results to differ from those set forth in the forward-looking statements. Given these uncertainties, current or prospective investors are cautioned not to place undue reliance on any such forward-looking statements. We undertake no obligation to update any such factors or forward-looking statements to reflect future events or developments.
34
| Item 3. | Quantitative and Qualitative Disclosures About Market Risk |
We are exposed to changes in foreign currency exchange rates and interest rates. Additional information concerning each of these matters follows:
Foreign Currency Exchange Rates
We have extensive operations in foreign countries. The net assets and liabilities of these operations are exposed to changes in foreign currency exchange rates, although such fluctuations generally do not affect income since their functional currency is typically the local currency. These operations also have net assets and liabilities not denominated in the functional currency, which exposes us to changes in foreign currency exchange rates that impact income. We recorded a foreign exchange gain in our income statement of approximately $4 million in the first nine months of 2017, compared to approximately $10 million in foreign exchange loss in the same period of the prior year. The gains and losses are primarily due to exchange rate fluctuations related to monetary asset balances denominated in currencies other than the functional currency and adjustments to our hedged positions as a result of changes in foreign currency exchange rates. Currency exchange rate fluctuations may create losses in future periods to the extent we maintain net monetary assets and liabilities not denominated in the functional currency of the countries using the local currency as their functional currency.
Some of our revenues in foreign countries are denominated in U.S. dollars, and therefore, changes in foreign currency exchange rates impact our earnings to the extent that costs associated with those U.S. dollar revenues are denominated in the local currency. Similarly, some of our revenues are denominated in foreign currencies, but have associated U.S. dollar costs, which also give rise to foreign currency exchange rate exposure. In order to mitigate that risk, we may utilize foreign currency forward contracts to better match the currency of our revenues and associated costs. We do not use foreign currency forward contracts for trading or speculative purposes.
35
The following table details the Company’s foreign currency forward contracts grouped by functional currency and their expected maturity periods (in millions, except contract rates):
| As of September 30, 2017 | December 31, | |||||||||||||||||||||||
| Functional Currency |
2017 | 2018 | 2019 | 2020 | Total | 2016 | ||||||||||||||||||
| CAD Buy USD/Sell CAD: |
||||||||||||||||||||||||
| Notional amount to buy (in Canadian dollars) |
— | 40 | 35 | — | 75 | 75 | ||||||||||||||||||
| Average USD to CAD contract rate |
— | 1.3286 | 1.3242 | — | 1.3265 | 1.3265 | ||||||||||||||||||
| Fair Value at September 30, 2017 in U.S. dollars |
— | (2 | ) | (2 | ) | — | (4 | ) | — | |||||||||||||||
| Sell USD/Buy CAD: |
||||||||||||||||||||||||
| Notional amount to sell (in Canadian dollars) |
62 | 23 | 141 | 226 | 260 | |||||||||||||||||||
| Average USD to CAD contract rate |
1.2357 | 1.3167 | 1.3147 | 1.2924 | 1.3120 | |||||||||||||||||||
| Fair Value at September 30, 2017 in U.S. dollars |
— | — | 1 | 5 | 6 | (2 | ) | |||||||||||||||||
| EUR Buy GBP/Sell EUR: |
|
|||||||||||||||||||||||
| Notional amount to buy (in Euros) |
— | — | — | — | — | — | ||||||||||||||||||
| Average GBP to EUR contract rate |
1.1000 | 1.1459 | — | — | 1.1268 | — | ||||||||||||||||||
| Fair Value at September 30, 2017 in U.S. dollars |
— | — | — | — | — | — | ||||||||||||||||||
| Buy NOK/Sell EUR: |
||||||||||||||||||||||||
| Notional amount to buy (in Euros) |
— | — | — | — | — | — | ||||||||||||||||||
| Average NOK to EUR contract rate |
0.1095 | 0.1069 | — | — | 0.1072 | — | ||||||||||||||||||
| Fair Value at September 30, 2017 in U.S. dollars |
— | — | — | — | — | — | ||||||||||||||||||
| Buy USD/Sell EUR: |
||||||||||||||||||||||||
| Notional amount to buy (in Euros) |
6 | 1 | — | — | 7 | 3 | ||||||||||||||||||
| Average USD to EUR contract rate |
0.8388 | 0.8486 | — | — | 0.8394 | 0.9309 | ||||||||||||||||||
| Fair Value at September 30, 2017 in U.S. dollars |
— | — | — | — | — | — | ||||||||||||||||||
| Sell USD/Buy EUR: |
||||||||||||||||||||||||
| Notional amount to sell (in Euros) |
109 | 16 | — | — | 125 | 104 | ||||||||||||||||||
| Average USD to EUR contract rate |
0.8508 | 0.8480 | — | — | 0.8504 | 0.9206 | ||||||||||||||||||
| Fair Value at September 30, 2017 in U.S. dollars |
1 | — | — | — | 1 | (3 | ) | |||||||||||||||||
| Sell ZAR/Buy EUR: |
||||||||||||||||||||||||
| Notional amount to sell (in Euros) |
8 | — | — | — | 8 | 8 | ||||||||||||||||||
| Average ZAR to EUR contract rate |
0.0525 | — | — | — | 0.0525 | 0.0555 | ||||||||||||||||||
| Fair Value at September 30, 2017 in U.S. dollars |
(2 | ) | — | — | — | (2 | ) | (2 | ) | |||||||||||||||
| AUD Buy USD/Sell AUD: |
|
|||||||||||||||||||||||
| Notional amount to buy (in Australian dollars) |
3 | — | — | — | 3 | — | ||||||||||||||||||
| Average USD to AUD contract rate |
1.3254 | — | — | — | 1.3254 | — | ||||||||||||||||||
| Fair Value at September 30, 2017 in U.S. dollars |
— | — | — | — | — | — | ||||||||||||||||||
| Sell USD/Buy AUD: |
||||||||||||||||||||||||
| Notional amount to sell (in Australian dollars) |
5 | 3 | — | — | 8 | — | ||||||||||||||||||
| Average USD to AUD contract rate |
1.3240 | 1.3507 | — | — | 1.3335 | — | ||||||||||||||||||
| Fair Value at September 30, 2017 in U.S. dollars |
— | — | — | — | — | — | ||||||||||||||||||
| GBP Buy USD/Sell GBP: |
||||||||||||||||||||||||
| Notional amount to buy (in British Pounds Sterling) |
— | — | — | — | — | 1 | ||||||||||||||||||
| Average USD to GBP contract rate |
— | 0.7855 | — | — | 0.7855 | 0.8028 | ||||||||||||||||||
| Fair Value at September 30, 2017 in U.S. dollars |
— | — | — | — | — | — | ||||||||||||||||||
| Sell USD/Buy GBP: |
||||||||||||||||||||||||
| Notional amount to sell (in British Pounds Sterling) |
119 | — | — | — | 119 | 169 | ||||||||||||||||||
| Average USD to GBP contract rate |
0.7436 | — | — | — | 0.7436 | 0.7844 | ||||||||||||||||||
| Fair Value at September 30, 2017 in U.S. dollars |
— | — | — | — | — | (6 | ) | |||||||||||||||||
| Sell EUR/Buy GBP: |
||||||||||||||||||||||||
| Notional amount to sell (in British Pounds Sterling) |
— | — | — | — | — | 1 | ||||||||||||||||||
| Average EUR to GBP contract rate |
— | — | — | — | — | 0.8604 | ||||||||||||||||||
| Fair Value at September 30, 2017 in U.S. dollars |
— | — | — | — | — | — | ||||||||||||||||||
36
| As of September 30, 2017 | December 31, | |||||||||||||||||||||||
| Functional Currency |
2017 | 2018 | 2019 | 2020 | Total | 2016 | ||||||||||||||||||
| USD Buy CAD/Sell USD: |
||||||||||||||||||||||||
| Notional amount to buy (in U.S. dollars) |
— | — | — | — | — | 1 | ||||||||||||||||||
| Average CAD to USD contract rate |
0.7526 | — | — | — | 0.7526 | 0.7559 | ||||||||||||||||||
| Fair Value at September 30, 2017 in U.S. dollars |
— | — | — | — | — | — | ||||||||||||||||||
| Buy DKK/Sell USD: |
||||||||||||||||||||||||
| Notional amount to buy (in U.S. dollars) |
5 | 1 | — | — | 6 | 10 | ||||||||||||||||||
| Average DKK to USD contract rate |
0.1466 | 0.1546 | — | — | 0.1483 | 0.1509 | ||||||||||||||||||
| Fair Value at September 30, 2017 in U.S. dollars |
— | — | — | — | — | (1 | ) | |||||||||||||||||
| Buy EUR/Sell USD: |
||||||||||||||||||||||||
| Notional amount to buy (in U.S. dollars) |
27 | 42 | — | — | 69 | 81 | ||||||||||||||||||
| Average EUR to USD contract rate |
1.1928 | 1.1506 | — | — | 1.1665 | 1.1114 | ||||||||||||||||||
| Fair Value at September 30, 2017 in U.S. dollars |
— | 2 | — | — | 2 | (4 | ) | |||||||||||||||||
| Buy GBP/Sell USD: |
||||||||||||||||||||||||
| Notional amount to buy (in U.S. dollars) |
7 | 3 | — | — | 10 | 3 | ||||||||||||||||||
| Average GBP to USD contract rate |
1.2432 | 1.2708 | — | — | 1.2500 | 1.2516 | ||||||||||||||||||
| Fair Value at September 30, 2017 in U.S. dollars |
1 | — | — | — | 1 | — | ||||||||||||||||||
| Buy NOK/Sell USD: |
||||||||||||||||||||||||
| Notional amount to buy (in U.S. dollars) |
182 | 329 | 61 | — | 572 | 737 | ||||||||||||||||||
| Average NOK to USD contract rate |
0.1238 | 0.1198 | 0.1187 | — | 0.1209 | 0.1231 | ||||||||||||||||||
| Fair Value at September 30, 2017 in U.S. dollars |
3 | 19 | 4 | — | 26 | (41 | ) | |||||||||||||||||
| Buy SGD/Sell USD: |
||||||||||||||||||||||||
| Notional amount to buy (in U.S. dollars) |
1 | — | — | — | 1 | 5 | ||||||||||||||||||
| Average SGD to USD contract rate |
0.7031 | — | — | — | 0.7031 | 0.7262 | ||||||||||||||||||
| Fair Value at September 30, 2017 in U.S. dollars |
— | — | — | — | — | — | ||||||||||||||||||
| Sell DKK/Buy USD: |
||||||||||||||||||||||||
| Notional amount to sell (in U.S. dollars) |
4 | — | — | — | 4 | 2 | ||||||||||||||||||
| Average DKK to USD contract rate |
0.1549 | — | — | — | 0.1549 | 0.1481 | ||||||||||||||||||
| Fair Value at September 30, 2017 in U.S. dollars |
— | — | — | — | — | — | ||||||||||||||||||
| Sell EUR/Buy USD: |
||||||||||||||||||||||||
| Notional amount to sell (in U.S. dollars) |
76 | 9 | — | — | 85 | 29 | ||||||||||||||||||
| Average EUR to USD contract rate |
1.1850 | 1.1101 | — | — | 1.1770 | 1.1059 | ||||||||||||||||||
| Fair Value at September 30, 2017 in U.S. dollars |
— | (1 | ) | — | — | (1 | ) | 1 | ||||||||||||||||
| Sell GBP/Buy USD: |
||||||||||||||||||||||||
| Notional amount to sell (in U.S. dollars) |
1 | — | — | — | 1 | 1 | ||||||||||||||||||
| Average GBP to USD contract rate |
1.2871 | — | — | — | 1.2871 | 1.2549 | ||||||||||||||||||
| Fair Value at September 30, 2017 in U.S. dollars |
— | — | — | — | — | — | ||||||||||||||||||
| Sell NOK/Buy USD: |
||||||||||||||||||||||||
| Notional amount to sell (in U.S. dollars) |
44 | 48 | — | — | 92 | 21 | ||||||||||||||||||
| Average NOK to USD contract rate |
0.1266 | 0.1294 | — | — | 0.1281 | 0.1183 | ||||||||||||||||||
| Fair Value at September 30, 2017 in U.S. dollars |
— | 1 | — | — | 1 | — | ||||||||||||||||||
| Sell RUB/Buy USD: |
||||||||||||||||||||||||
| Notional amount to sell (in U.S. dollars) |
45 | — | — | — | 45 | 30 | ||||||||||||||||||
| Average RUB to USD contract rate |
0.0170 | — | — | — | 0.0170 | 0.0158 | ||||||||||||||||||
| Fair Value at September 30, 2017 in U.S. dollars |
— | — | — | — | — | — | ||||||||||||||||||
| Sell SGD/Buy USD: |
||||||||||||||||||||||||
| Notional amount to sell (in U.S. dollars) |
1 | — | — | — | 1 | 2 | ||||||||||||||||||
| Average SGD to USD contract rate |
0.7315 | — | — | — | 0.7315 | 0.7006 | ||||||||||||||||||
| Fair Value at September 30, 2017 in U.S. dollars |
— | — | — | — | — | — | ||||||||||||||||||
37
| As of September 30, 2017 | December 31, | |||||||||||||||||||||||
| Functional Currency |
2017 | 2018 | 2019 | 2020 | Total | 2016 | ||||||||||||||||||
| BRL Buy EUR/Sell BRL: |
||||||||||||||||||||||||
| Notional amount to buy (in Brazilian reals) |
21 | — | — | — | 21 | 326 | ||||||||||||||||||
| Average EUR to BRL contract rate |
3.6355 | — | — | — | 3.6355 | 4.1974 | ||||||||||||||||||
| Fair Value at September 30, 2017 in U.S. dollars |
— | — | — | — | — | (13 | ) | |||||||||||||||||
| Buy GBP/Sell BRL: |
||||||||||||||||||||||||
| Notional amount to buy (in Brazilian reals) |
3 | — | — | — | 3 | — | ||||||||||||||||||
| Average GBP to BRL contract rate |
4.1230 | — | — | — | 4.1230 | — | ||||||||||||||||||
| Fair Value at September 30, 2017 in U.S. dollars |
— | — | — | — | — | — | ||||||||||||||||||
| Buy USD/Sell BRL: |
||||||||||||||||||||||||
| Notional amount to buy (in Brazilian reals) |
3 | — | — | — | 3 | 27 | ||||||||||||||||||
| Average USD to BRL contract rate |
3.2760 | — | — | — | 3.2760 | 4.0278 | ||||||||||||||||||
| Fair Value at September 30, 2017 in U.S. dollars |
— | — | — | — | — | (1 | ) | |||||||||||||||||
| Sell EUR/Buy BRL: |
||||||||||||||||||||||||
| Notional amount to sell (in Brazilian reals) |
35 | — | — | — | 35 | 1,440 | ||||||||||||||||||
| Average EUR to BRL contract rate |
3.8701 | — | — | — | 3.8701 | 4.2950 | ||||||||||||||||||
| Fair Value at September 30, 2017 in U.S. dollars |
2 | — | — | — | 2 | 59 | ||||||||||||||||||
| Sell USD/Buy BRL: |
||||||||||||||||||||||||
| Notional amount to sell (in Brazilian reals) |
112 | — | — | — | 112 | 23 | ||||||||||||||||||
| Average USD to BRL contract rate |
3.1940 | — | — | — | 3.1940 | 3.6378 | ||||||||||||||||||
| Fair Value at September 30, 2017 in U.S. dollars |
1 | — | — | — | 1 | — | ||||||||||||||||||
| DKK Buy USD/Sell DKK: |
||||||||||||||||||||||||
| Notional amount to buy (in Danish Krone) |
— | — | — | — | — | 22 | ||||||||||||||||||
| Average USD to DKK contract rate |
— | — | — | — | — | 7.1140 | ||||||||||||||||||
| Fair Value at September 30, 2017 in U.S. dollars |
— | — | — | — | — | — | ||||||||||||||||||
| Sell USD/Buy DKK: |
||||||||||||||||||||||||
| Notional amount to sell (in Danish Krone) |
491 | 77 | — | — | 568 | 855 | ||||||||||||||||||
| Average USD to DKK contract rate |
6.1936 | 6.3915 | — | — | 6.2196 | 6.9660 | ||||||||||||||||||
| Fair Value at September 30, 2017 in U.S. dollars |
(1 | ) | — | — | — | (1 | ) | (1 | ) | |||||||||||||||
| NOK Buy EUR/Sell NOK: |
||||||||||||||||||||||||
| Notional amount to buy (in Norwegian Kroner) |
146 | 6 | — | — | 152 | 231 | ||||||||||||||||||
| Average EUR to NOK contract rate |
9.3476 | 9.2781 | — | — | 9.3450 | 9.1870 | ||||||||||||||||||
| Fair Value at September 30, 2017 in U.S. dollars |
— | — | — | — | — | — | ||||||||||||||||||
| Buy GBP/Sell NOK: |
||||||||||||||||||||||||
| Notional amount to buy (in Norwegian Kroner) |
— | — | — | — | — | 2 | ||||||||||||||||||
| Average GBP to NOK contract rate |
10.4215 | — | — | — | 10.4215 | 10.7029 | ||||||||||||||||||
| Fair Value at September 30, 2017 in U.S. dollars |
— | — | — | — | — | — | ||||||||||||||||||
| Buy USD/Sell NOK: |
||||||||||||||||||||||||
| Notional amount to buy (in Norwegian Kroner) |
1 | — | — | — | 1 | 21 | ||||||||||||||||||
| Average USD to NOK contract rate |
7.8350 | — | — | — | 7.8350 | 8.7062 | ||||||||||||||||||
| Fair Value at September 30, 2017 in U.S. dollars |
— | — | — | — | — | — | ||||||||||||||||||
| Buy JPY/Sell NOK: |
||||||||||||||||||||||||
| Notional amount to buy (in Norwegian Kroner) |
45 | — | — | — | 45 | 58 | ||||||||||||||||||
| Average JPY to NOK contract rate |
0.0717 | — | — | — | 0.0717 | 0.0748 | ||||||||||||||||||
| Fair Value at September 30, 2017 in U.S. dollars |
— | — | — | — | — | — | ||||||||||||||||||
| Sell EUR/Buy NOK: |
||||||||||||||||||||||||
| Notional amount to sell (in Norwegian Kroner) |
94 | 14 | — | — | 108 | 120 | ||||||||||||||||||
| Average EUR to NOK contract rate |
9.2863 | 9.2781 | — | — | 9.2852 | 9.2144 | ||||||||||||||||||
| Fair Value at September 30, 2017 in U.S. dollars |
— | — | — | — | — | — | ||||||||||||||||||
38
| As of September 30, 2017 | December 31, | |||||||||||||||||||||||
| Functional Currency |
2017 | 2018 | 2019 | 2020 | Total | 2016 | ||||||||||||||||||
| NOK Sell USD/Buy NOK: |
||||||||||||||||||||||||
| Notional amount to sell (in Norwegian Kroner) |
51 | 1 | — | — | 52 | 126 | ||||||||||||||||||
| Average USD to NOK contract rate |
7.8348 | 8.6642 | — | — | 7.8509 | 8.7030 | ||||||||||||||||||
| Fair Value at September 30, 2017 in U.S. dollars |
— | — | — | — | — | — | ||||||||||||||||||
| Sell JPY/Buy NOK: |
||||||||||||||||||||||||
| Notional amount to sell (in Norwegian Kroner) |
27 | 6 | — | — | 33 | 51 | ||||||||||||||||||
| Average JPY to NOK contract rate |
0.0753 | 0.0758 | — | — | 0.0754 | 0.0750 | ||||||||||||||||||
| Fair Value at September 30, 2017 in U.S. dollars |
— | — | — | — | — | — | ||||||||||||||||||
| Other Currencies |
||||||||||||||||||||||||
| Fair Value at September 30, 2017 in U.S. dollars |
— | — | — | — | — | (1 | ) | |||||||||||||||||
|
|
|
|
|
|
|
|
|
|
|
|
|
|||||||||||||
| Total Fair Value at September 30, 2017 in U.S. dollars |
5 | 19 | 3 | 5 | 32 | (15 | ) | |||||||||||||||||
|
|
|
|
|
|
|
|
|
|
|
|
|
|||||||||||||
The Company had other financial market risk sensitive instruments denominated in foreign currencies for transactional exposures totaling $47 million and translation exposures totaling $195 million as of September 30, 2017 excluding trade receivables and payables, which approximate fair value. These market risk sensitive instruments consisted of cash balances and overdraft facilities. The Company estimates that a hypothetical 10% movement of all applicable foreign currency exchange rates on the transactional exposures financial market risk sensitive instruments could affect net income by $3 million and the translational exposures financial market risk sensitive instruments could affect the future fair value by $19 million.
The counterparties to forward contracts are major financial institutions. The credit ratings and concentration of risk of these financial institutions are monitored on a continuing basis. In the event that the counterparties fail to meet the terms of a foreign currency contract, our exposure is limited to the foreign currency rate differential.
Interest Rate Risk
At September 30, 2017, long-term borrowings consisted of $500 million in 1.35% Senior Notes, $1,392 million in 2.60% Senior Notes and $1,087 million in 3.95% Senior Notes. At September 30, 2017, there were no commercial paper borrowings and no outstanding letters of credit issued under the new credit facility, resulting in $3.0 billion of funds available under this credit facility. Occasionally a portion of borrowings under our credit facility could be denominated in multiple currencies which could expose us to market risk with exchange rate movements. These borrowings carry interest at a pre-agreed upon percentage point spread from either LIBOR, NIBOR or CDOR, or at the U.S. prime rate. Under our credit facility, we may, at our option, fix the interest rate for certain borrowings based on a spread over LIBOR, NIBOR or CDOR for 30 days to six months. Our objective is to maintain a portion of our debt in variable rate borrowings for the flexibility obtained regarding early repayment without penalties and lower overall cost as compared with fixed-rate borrowings.
39
| Item 4. | Controls and Procedures |
As of the end of the period covered by this report, we carried out an evaluation, under the supervision and with the participation of the Company’s management, including the Company’s Chief Executive Officer and Chief Financial Officer, of the effectiveness of the design and operation of the Company’s disclosure controls and procedures. The Company’s disclosure controls and procedures are designed to provide reasonable assurance that the information required to be disclosed by the Company in the reports it files under the Exchange Act is accumulated and communicated to the Company’s management, including the Company’s Chief Executive Officer and Chief Financial Officer, as appropriate, to allow timely decisions regarding required disclosures and is recorded, processed, summarized and reported within the time period specified in the rules and forms of the Securities and Exchange Commission. Based upon that evaluation, the Company’s Chief Executive Officer and Chief Financial Officer concluded that the Company’s disclosure controls and procedures are effective as of the end of the period covered by this report at a reasonable assurance level.
There has been no change in our internal control over financial reporting (as defined in Rule 13a-15(f) under the Exchange Act) that occurred during our last fiscal quarter that has materially affected, or is reasonably likely to materially affect, our internal control over financial reporting.
40
PART II - OTHER INFORMATION
| Item 1A. | Risk Factors |
As of the date of this filing, the Company and its operations continue to be subject to the risk factors previously disclosed in Part I, Item 1A “Risk Factors” in our 2016 Annual Report on Form 10-K.
| Item 4. | Mine Safety Disclosures |
Information regarding mine safety and other regulatory actions at our mines is included in Exhibit 95 to this Form 10-Q.
| Item 6. | Exhibits |
Reference is hereby made to the Exhibit Index commencing on page 42.
41
INDEX TO EXHIBITS
| (a) | Exhibits |
| * | Compensatory plan or arrangement for management or others. |
| (1) | Filed as an Exhibit to our Quarterly Report on Form 10-Q filed on August 5, 2011. |
| (2) | Filed as an Exhibit to our Current Report on Form 8-K filed on August 17, 2011. |
| (3) | Filed as an Exhibit to our Current Report on Form 8-K filed on June 28, 2017 |
| (4) | Filed as Appendix I to our Proxy Statement filed on April 11, 2016. |
42
| (5) | Filed as an Exhibit to our Current Report on Form 8-K filed on February 23, 2006. |
| (6) | Filed as an Exhibit to our Current Report on Form 8-K filed on March 27, 2007. |
| (7) | Filed as an Exhibit to our Current Report on Form 8-K filed on March 27, 2013. |
| (8) | Filed as an Exhibit to our Current Report on Form 8-K filed on November 24, 2014. |
| (9) | Filed as an Exhibit to our Current Report on Form 8-K filed on February 26, 2016. |
| (10) | As provided in Rule 406T of Regulation S-T, this information is furnished and not filed for purposes of Sections 11 and 12 of the Securities Act of 1933 and Section 18 of the Securities Exchange Act of 1934. |
We hereby undertake, pursuant to Regulation S-K, Item 601(b), paragraph (4) (iii), to furnish to the U.S. Securities and Exchange Commission, upon request, all constituent instruments defining the rights of holders of our long-term debt not filed herewith.
43
SIGNATURE
Pursuant to the requirements of the Securities Exchange Act of 1934, the registrant has duly caused this report to be signed on its behalf by the undersigned thereunto duly authorized.
| Date: October 27, 2017 | By: | /s/ Scott K. Duff | ||||
| Scott K. Duff | ||||||
| Vice President, Corporate Controller & Chief Accounting Officer | ||||||
| (Duly Authorized Officer, Principal Accounting Officer) |
44