Attached files
| file | filename |
|---|---|
| EX-95 - EX-95 - NOV Inc. | d313669dex95.htm |
| EX-32.2 - EX-32.2 - NOV Inc. | d313669dex322.htm |
| EX-32.1 - EX-32.1 - NOV Inc. | d313669dex321.htm |
| EX-31.2 - EX-31.2 - NOV Inc. | d313669dex312.htm |
| EX-31.1 - EX-31.1 - NOV Inc. | d313669dex311.htm |
| EX-23.1 - EX-23.1 - NOV Inc. | d313669dex231.htm |
| EX-21.1 - EX-21.1 - NOV Inc. | d313669dex211.htm |
Table of Contents
UNITED STATES
SECURITIES AND EXCHANGE COMMISSION
Washington, D.C. 20549
FORM 10-K
(Mark one)
| ☒ | ANNUAL REPORT PURSUANT TO SECTION 13 OR 15(d) OF THE SECURITIES EXCHANGE ACT OF 1934 |
FOR THE YEAR ENDED DECEMBER 31, 2016
OR
| ☐ | TRANSITION REPORT PURSUANT TO SECTION 13 OR 15(d) OF THE SECURITIES EXCHANGE ACT OF 1934 |
Commission file number 1-12317
NATIONAL OILWELL VARCO, INC.
(Exact name of registrant as specified in its charter)
| Delaware |
76-0475815 | |
| (State or other jurisdiction of incorporation or organization) |
(IRS Employer Identification No.) |
7909 Parkwood Circle Drive, Houston, Texas 77036-6565
(Address of principal executive offices)
(713) 346-7500
(Registrant’s telephone number, including area code)
Securities registered pursuant to Section 12(b) of the Act:
| Common Stock, par value $.01 |
New York Stock Exchange | |
| (Title of Class) | (Exchange on which registered) |
Securities registered pursuant to Section 12(g) of the Act: None
Indicate by check mark if the registrant is a well-known seasoned issuer, as defined in Rule 405 of the Securities
Act. Yes ☒ No ☐
Indicate by check mark if the registrant is not required to file reports pursuant to Section 13 or Section 15 (d) of the
Act. Yes ☐ No ☒
Indicate by check mark whether the registrant (1) has filed all reports required to be filed by Section 13 or 15(d) of the Securities Exchange Act of 1934 during the preceding 12 months (or for such shorter period that the registrant was required to file such reports), and (2) has been subject to such filing requirements for the past 90 days. Yes ☒ No ☐
Indicate by check mark whether the registrant has submitted electronically and posted on its corporate Web site, if any, every Interactive Data File required to be submitted and posted pursuant to Rule 405 of Regulation S-T during the preceding 12 months (or for such shorter period that the registrant was required to submit and post such files). Yes ☒ No ☐
Indicate by check mark if disclosure of delinquent filers pursuant to Item 405 of Regulation S-K is not contained herein, and will not be contained, to the best of registrant’s knowledge, in definitive proxy or information statements incorporated by reference in Part III of this Form 10-K or any amendment to this Form 10-K. ☐
Indicate by check mark whether the registrant is a large accelerated filer, an accelerated filer, a non-accelerated filer, or a smaller reporting company. See the definitions of “large accelerated filer,” “accelerated filer” and “smaller reporting company” in Rule 12b-2 of the Exchange Act. (Check one):
| Large accelerated filer | ☒ | Accelerated filer | ☐ | |||
| Non-accelerated filer | ☐ (Do not check if a smaller reporting company) | Smaller Reporting Company | ☐ | |||
Indicate by check mark whether the registrant is a shell company (as defined in Rule 12b-2 of the Exchange Act). Yes ☐ No ☒
The aggregate market value of voting and non-voting common stock held by non-affiliates of the registrant as of June 30, 2016 was $12.7 billion. As of February 10, 2017, there were 378,727,274 shares of the Company’s common stock ($0.01 par value) outstanding.
Documents Incorporated by Reference
Portions of the Proxy Statement in connection with the 2017 Annual Meeting of Stockholders are incorporated in Part III of this report.
Table of Contents
FORM 10-K
PART I
| ITEM 1. | BUSINESS |
General
National Oilwell Varco, Inc. (“NOV” or the “Company”), a Delaware corporation incorporated in 1995, is a leading oilfield equipment manufacturer and technology provider. The breadth and depth of our product and technology portfolio supports customers’ full-field development needs, from drilling to completion to production, in basins around the world, land or offshore. As a leading provider of innovation, technology, and industrial capabilities to the oilfield, we have a long tradition of pioneering innovations that improve the cost-effectiveness, efficiency, safety and environmental impact of oil and gas operations. The Company operates through four reporting segments: Rig Systems, Rig Aftermarket, Wellbore Technologies and Completion & Production Solutions.
On May 30, 2014, the Company completed the spin-off of its distribution business into an independent public company named NOW Inc., which trades on the New York Stock Exchange under the symbol “DNOW”. After the close of the New York Stock Exchange on May 30, 2014, stockholders of record as of May 22, 2014 (the “Record Date”) received one share of NOW Inc. common stock for every four NOV common shares they held as of the Record Date. No fractional shares of NOW Inc. common stock were distributed. The transfer agent aggregated any fractional shares into whole shares, sold those whole shares in the open market at prevailing rates and distributed the net cash proceeds, after deducting any taxes required to be withheld and brokerage charges and commissions, pro rata to each holder who would otherwise have been entitled to receive fractional shares in the distribution. Our operating segments were realigned upon separation of NOW Inc., and as a result, all prior periods are presented on this basis. Results of operations related to NOW Inc. have been classified as discontinued operations in all periods presented on Form 10-K.
Rig Systems
The Company’s Rig Systems segment makes and supports the capital equipment and integrated systems needed to drill oil and gas wells on land and offshore. The segment designs, manufactures, and sells land rigs, complete offshore drilling equipment packages, and drilling rig components that mechanize and automate many complex rig processes.
Equipment and technologies in Rig Systems include: power transmission systems, like drives and generators; substructures, derricks, and masts; pipe lifting, racking, rotating, and assembly systems; pressure control equipment, including blowout preventers; cranes; and rig instrumentation and control systems.
Rig Systems supports land and offshore drillers. Demand for the segment’s products depends on drilling contractors’ and oil and gas companies’ capital spending plans, specifically capital expenditures on rig construction and refurbishment.
To achieve higher efficiencies and reduce costs in the current market, the Company combined the Rig Offshore and Rig Land reporting units during the third quarter of 2016. See Note 2 to the Consolidated Financial Statements.
Rig Aftermarket
The Company’s Rig Aftermarket segment provides comprehensive aftermarket products and services to support a large installed base of land and offshore rigs, and drilling rig components manufactured by the Company’s Rig Systems segment. The segment provides spare parts, repair, and rentals as well as technical support, field service and first well support, field engineering, and customer training through a network of aftermarket service and repair facilities strategically located in major areas of drilling operations.
Rig Aftermarket supports land and offshore drillers. Demand for the segment’s products and services depends on overall levels of oilfield drilling activity, which drives demand for spare parts, service, and repair for Rig Systems’ large installed base of equipment; and secondarily on drilling contractors’ and oil and gas companies’ capital spending plans, specifically capital expenditures on rig refurbishments and re-certifications.
Wellbore Technologies
The Company’s Wellbore Technologies segment designs, manufactures, rents, and sells a variety of equipment and technologies used to perform drilling operations, and offers services that optimize their performance. Key technologies and services include: drilling optimization and automation services; instrumentation, measuring and monitoring systems; drill bits; downhole tools, like downhole drilling motors and other steerable technologies; solids control and waste management equipment and services; drilling fluids; premium drill pipe, wired pipe and drill string accessories; tubular inspection, repair and coating services; fishing tools and hole openers; and portable power generation.
1
Table of Contents
The Wellbore Technologies segment focuses on oil and gas companies and supports drilling contractors, oilfield service companies, and oilfield rental companies. Additional customers include steel mills and industrial companies. Demand for Wellbore Technologies’ products and services primarily depends on the level of oilfield drilling activity by oil and gas companies, drilling contractors, and oilfield service companies, as measured by rig count, well count, and footage drilled.
Completion & Production Solutions
The Company’s Completion & Production Solutions segment integrates technologies for well completions and oil and gas production. The segment designs, manufactures, and sells equipment and technologies needed for hydraulic stimulation, including pressure pumping trucks, blenders, sanders, hydration units, injection units, flowline, manifolds and completion tools; well intervention, including coiled tubing units, coiled tubing, and wireline units and tools; offshore production, including process equipment, conductor pipe connectors, floating production systems and subsea production technologies; and, onshore production including surface transfer and progressive cavity pumps, positive displacement reciprocating pumps, pressure vessels, composite pipe, and artificial lift systems.
Completion & Production Solutions supports service companies and oil and gas companies. Demand for Completion & Production Solutions’ products depends on the level of oilfield completions and workover activity by oilfield service companies and drilling contractors and capital spending plans by oil and gas companies and oilfield service companies.
The following table sets forth the contribution to our total revenue of our four reporting segments (in millions):
| Years Ended December 31, | ||||||||||||
| 2016 | 2015 | 2014 | ||||||||||
| Revenue: |
||||||||||||
| Rig Systems |
$ | 2,386 | $ | 6,964 | $ | 9,848 | ||||||
| Rig Aftermarket |
1,416 | 2,515 | 3,222 | |||||||||
| Wellbore Technologies |
2,199 | 3,718 | 5,722 | |||||||||
| Completion & Production Solutions |
2,241 | 3,365 | 4,645 | |||||||||
| Eliminations |
(991 | ) | (1,805 | ) | (1,997 | ) | ||||||
|
|
|
|
|
|
|
|||||||
| Total Revenue |
$ | 7,251 | $ | 14,757 | $ | 21,440 | ||||||
|
|
|
|
|
|
|
|||||||
Sales from one segment to another generally are priced at estimated equivalent commercial selling prices; however, segments originating an external sale are credited with the full profit to the Company. Eliminations include intercompany transactions conducted between the four reporting segments that are eliminated in consolidation. Intercompany transactions within each reporting segment are eliminated within each reporting segment.
See Note 15 to the Consolidated Financial Statements for financial information by segment and a geographical breakout of revenues and long-lived assets. We have also included a glossary of oilfield terms at the end of Item 1. “Business” of this Annual Report.
Influence of Oil and Gas Activity Levels on the Company’s Business
The oil and gas industry has historically experienced significant volatility. Demand for the Company’s products and services depends primarily upon the general level of activity in the oil and gas industry worldwide, including the number of drilling rigs in operation, the number of oil and gas wells being drilled, the depth and drilling conditions of these wells, the volume of production, the number of well completions and the level of well remediation activity. Oil and gas activity is in turn heavily influenced by, among other factors, oil and gas prices worldwide. High levels of drilling and well remediation generally spurs demand for the Company’s products and services. Additionally, high levels of oil and gas activity increase cash flows available for oil and gas companies, drilling contractors, oilfield service companies, and manufacturers of oil country tubular goods (“OCTG”) to invest in capital equipment that the Company sells.
In 2010, as the financial crisis of the preceding three years eased and oil prices recovered, order rates began to improve across a broad array of rig equipment, with a particular focus on continued build out of the deepwater fleet. Each year 2011, 2012 and 2013 saw a further improvement in order rates as commodity prices remained at levels supporting sustained capital spending by our customers. Global rig count increased 5% in 2014 compared to 2013, after falling by 3% in 2013 compared to 2012. During the second half of 2014 through 2016, the global oil and gas industry experienced a particularly severe cyclical decline causing the Company to experience a decline in
2
Table of Contents
new orders. Backlog for Rig Systems at December 31, 2016, 2015 and 2014, was $2.5 billion, $6.1 billion and $12.5 billion, respectively. Backlog for Completion & Production Solutions at December 31, 2016, 2015 and 2014 was $0.8 billion, $1.0 billion and $1.8 billion, respectively.
The willingness of oil and gas operators to make capital investments to explore for and produce oil and natural gas will continue to be influenced by numerous factors over which the Company has no control, including but not limited to: prices for oil and natural gas; supply and demand for oil and natural gas; the ability or willingness of members of the Organization of Petroleum Exporting Countries (“OPEC”) to maintain oil price stability through voluntary production limits; the level of oil production by non-OPEC countries; general economic and political conditions; costs of exploration and production; the availability of new leases and concessions; access to external financing; and governmental regulations regarding, among other things, environmental protection, climate change, taxation, price controls and product allocations. The willingness of drilling contractors and well servicing companies to make capital expenditures for the type of specialized equipment the Company provides is also influenced by numerous factors over which the Company has no control, including: the general level of oil and gas well drilling and servicing; rig day-rates; access to external financing; outlook for future increases in well drilling and well remediation activity; steel prices and fabrication costs; and government regulations regarding, among other things, environmental protection, climate change, taxation, and price controls.
See additional discussion on the current worldwide economic environment and related oil and gas activity levels in Item 1A. “Risk Factors” and Item 7. “Management’s Discussion and Analysis of Financial Condition and Results of Operations.”
Overview of Oil and Gas Well Construction Processes
Oil and gas wells are usually drilled by drilling contractors using a drilling rig. A bit is attached to the end of a drill stem, which is assembled by the drilling rig and its crew from 30 or 45-foot joints of drill pipe and specialized drilling components known as downhole tools. Using the conventional rotary drilling method, the drill stem is turned from the rotary table of the drilling rig by torque applied to the kelly, which is screwed into the top of the drill stem. Increasingly, drilling is performed using a drilling motor, which is attached to the bottom of the drill stem and provides rotational force directly to the bit, or a top drive, a device suspended from the derrick that turns the entire drill stem, rather than such force being supplied by the rotary table. The use of drilling motors and top drives permits the drilling contractor to drill directionally, including horizontally. The Company sells and rents drilling motors, agitators, drill bits, downhole tools and drill pipe through Wellbore Technologies, and sells top drives through Rig Systems.
Heavy drilling fluids, or “drilling muds”, are pumped down the drill stem and forced out through jets in the bit. The drilling mud returns to the surface through the space between the borehole wall and the drill stem, carrying with it the rock cuttings drilled out by the bit. The cuttings are removed from the mud by a solids control system (which can include shakers, centrifuges and other specialized equipment) and disposed of in an environmentally sound manner. The solids control system permits the mud, which is often comprised of expensive chemicals, to be continuously reused and re-circulated back into the hole.
Rig Systems sells the large “mud pumps” that are used to pump drilling mud through the drill stem, down and back up the hole. Wellbore Technologies sells and rents solids control equipment; and provides solids control, waste management and drilling fluids services. Many operators internally coat the drill stem to improve its hydraulic efficiency and protect it from corrosive fluids sometimes encountered during drilling; have hardfacing alloys applied to drill pipe joints, collars and other components to protect tool joints and casing against wear; and inspect and assess the integrity of the drill pipe from time to time. Wellbore Technologies manufactures and sells drill pipe and provides coating, “hard-banding”, and drill pipe inspection and repair.
As the hole depth increases, the kelly must be removed frequently so that additional joints of drill pipe can be added to the drill stem. When the bit becomes dull or the equipment at the bottom of the drill stem – including the drilling motors – otherwise requires servicing, the entire drill stem is pulled out of the hole and disassembled by disconnecting the joints of drill pipe. These are set aside or “racked”, the old bit is replaced or service is performed, and the drill stem is reassembled and lowered back into the hole (a process called “tripping”). During drilling and tripping operations, joints of drill pipe must be screwed together and tightened (“made up”), and loosened and unscrewed (“spun out”). Rig Systems provides drilling equipment to manipulate and maneuver the drill pipe in this manner. When the hole has reached certain depths, all of the drill pipe is pulled out of the hole and larger diameter pipe known as casing is lowered into the hole and permanently cemented in place in order to protect against collapse and contamination of the hole. The casing is typically inspected before it is lowered into the hole, another service provided by Wellbore Technologies. Wellbore Technologies drilling optimization and automation maximizes bit performance in the wellbore by mitigating vibrations, dynamic and impact loading, and stick slip which ensures longer bit runs, reducing trips. Hole openers from Wellbore Technologies, that mount above the drill bits in the drill stem, opens the tolerance of the hole to allow for easier and faster casing installation. Completion & Production Solutions manufactures pressure pumping equipment that is used to cement the casing in place. The rig’s hoisting system raises and lowers the drill stem while drilling or tripping, and lowers casing into the wellbore. A conventional hoisting system is a block and tackle mechanism that works within the drilling rig’s derrick. The mechanism is lifted by a series of pulleys that are attached to the drawworks at the base of the derrick. Rig Systems sells and installs drawworks and pipe hoisting systems.
3
Table of Contents
During the course of normal drilling operations, the drill stem passes through different geological formations which exhibit varying pressure characteristics. If this pressure is not contained, oil, gas and/or water would flow out of these formations to the surface. Containing reservoir pressures is accomplished primarily by the circulation of heavy drilling muds and secondarily by blowout preventers (“BOPs”), should the mud prove inadequate in an emergency situation. Rig Systems sells blowout preventers. Drilling muds are carefully designed to exhibit certain qualities that optimize the drilling process. In addition to containing formation pressure, they must provide power to the drilling motor; carry drilled solids to the surface; protect the drilled formations from being damaged; and, cool the drill bit. Achieving these objectives often requires a formulation specific to a given well, requires a high level of cleanliness for better bottom hole assembly and can involve the use of expensive chemicals as well as natural materials, such as certain types of clay. The fluid itself is often oil, or more expensive synthetic mud. Given the cost, it is highly desirable to reuse as much of the drilling mud as possible. Solids control equipment such as shale shakers, centrifuges, cuttings dryers, and mud cleaners help accomplish this objective. Wellbore Technologies rents, sells, operates and services this equipment. Drilling muds are formulated based on expected drilling conditions. However, as the hole is drilled, the drill stem may encounter a high pressure zone where the mud density is inadequate to maintain sufficient pressure. Should efforts to “weight up” the mud in order to contain such a pressure kick fail, a blowout could result, whereby reservoir fluids would flow uncontrolled into the well. A series of high-pressure valves known as blowout preventers are positioned at the top of the well and, when activated, form tight seals that prevent the escape of fluids to the surface. When closed, conventional BOPs prevent normal rig operations so the BOPs are activated only if drilling mud and normal well control procedures cannot safely contain the pressure.
The operations of the rig and the condition of the drilling mud are closely monitored by various sensors, which measure operating parameters such as the weight on the rig’s hook, the incidence of pressure kicks, the operation of the drilling mud pumps, etc. Wellbore Technologies sells and rents drilling rig instrumentation packages that perform these monitoring functions. Monitoring can be done at the well or remotely from selected centralized operation centers.
During drilling operations the drilling rig and related equipment and tools are subject to severe stresses, pressures and temperatures, as well as a corrosive environment, and require regular repair and maintenance. Rig Aftermarket supplies spare parts and can dispatch field service engineers with the expertise to quickly repair and maintain equipment, minimizing down time.
After the well has reached its total depth and the final section of casing has been set, the drilling rig is moved off and the well is prepared to begin producing oil or gas in a process known as “well completion.” Well completion usually involves installing production tubing concentrically in the casing. Due to the corrosive nature of many produced fluids, production tubing is often inspected and coated, services offered by Wellbore Technologies. Sometimes operators choose to use corrosion resistant composite materials or alloys, sold by Completion & Production Solutions.
From time to time, a producing well may undergo workover procedures to extend its life and/or increase its production rate. Workover rigs are used to disassemble the wellhead, tubing and other completion components of an existing well in order to stimulate or remediate the well. Workover rigs are similar to drilling rigs in their capabilities to handle tubing, but are usually smaller and somewhat less sophisticated. The Company offers a comprehensive range of workover rigs through Rig Systems. Tubing and sucker rods removed from a well during a well remediation operation are often inspected to determine their suitability to be reused in the well, a service Wellbore Technologies provides.
Frequently, coiled tubing units or wireline units are used to accomplish certain well remediation operations or well completions. Coiled tubing consists of a continuous length of reeled steel tubing which can be injected concentrically into the production tubing all the way to the bottom of most wells. It permits many operations to be performed without disassembling the production tubing, and without curtailing the production of the well. Wireline winch units are devices that utilize single-strand or multi-strand wires to perform well remediation operations, such as lowering tools and transmitting data to the surface. The Completion & Production Solutions segment manufactures and sells various types of coiled tubing and wireline equipment and tools.
4
Table of Contents
Rig Systems
The Company’s Rig Systems segment makes and supports the capital equipment and integrated systems needed to drill oil and gas wells on land and offshore. The segment designs, manufactures, and sells land rigs, complete offshore drilling equipment packages, and drilling rig components that mechanize and automate many complex rig processes.
Equipment and technologies in Rig Systems include: power transmission systems, like drives and generators; substructures, derricks, and masts; pipe lifting, racking, rotating, and assembly systems; pressure control equipment, including blowout preventers; cranes; and rig instrumentation and control systems.
Top Drives. The TDS™ Top Drive Drilling System, originally introduced by the Company in 1982, significantly altered the traditional drilling process. The TDS rotates the drill stem from its top, rather than by the rotary table, with a large electric motor affixed to rails installed in the derrick that traverses the length of the derrick to the rig floor, eliminating the conventional rotary table for drilling. Components of the TDS also are used to connect additional joints of drill pipe to the drill stem during drilling operations, enabling the use of three or four pre-connected joints of drill pipe at a time, compared to traditional drilling with one joint of drill pipe. Additionally, the TDS facilitates horizontal and extended reach drilling.
Electric Rig Motors. The Company has helped lead the application of AC motor technology in the oilfield industry. The Company buys motors from third parties and builds them in its own facilities and is further developing motor technology, including the introduction of permanent magnet drilling motors for use in top drives, cranes, mud pumps, winches, and drawworks.
Rotary Equipment. The alternative to using a TDS to rotate the drill stem is to use a rotary table, which rotates the pipe at the floor of the rig. Rig Systems produces rotary tables as well as kelly and master bushings. In 1998, the Company introduced the Rotary Support Table for use on rigs with a TDS. The Rotary Support Table is used in concert with the TDS to completely eliminate the need for the larger conventional rotary table.
Pipe Handling Systems. Pipe racking systems are used to handle drill pipe, casing and tubing on a drilling rig. Vertical pipe racking systems move drill pipe and casing between the well and a storage (“racking”) area on the rig floor. Horizontal racking systems are used to handle tubulars while stored horizontally (for example, on the pipe deck of an offshore rig) and transport tubulars up to the rig floor and into a vertical position for use in the drilling process.
Vertical pipe racking systems are used predominantly on offshore rigs and are found on almost all floating rigs. Mechanical vertical pipe racking systems greatly reduce the manual effort involved in pipe handling. Pipe racking systems, introduced by the Company in 1985, provide a fully automated mechanism for handling and racking drill pipe during drilling and tripping operations, spinning and torquing drill pipe, and automatic hoisting and racking of disconnected joints of drill pipe. These functions can be integrated via computer controlled sequencing, and operated by a driller from an environmentally secure cabin. An important element of this system is the Iron Roughneck, which was originally introduced by the Company in 1976 and is an automated device that makes pipe connections on the rig floor and requires less direct involvement of rig floor personnel in potentially dangerous operations. The Automated Roughneck is a microprocessor-controlled version of the Iron Roughneck.
Horizontal pipe transfer systems were introduced by the Company in 1993. They include the Pipe Deck Machine, which is used to manipulate and move stored tubulars; the Pipe Transfer Conveyor, which transports sections of pipe to the rig floor; and a Pickup Laydown System, which raises the pipe to a vertical position for transfer to a vertical racking system. These components may be employed separately, or incorporated together to form a complete horizontal racking system, known as the Pipe Transfer System.
Pipe Handling Tools. The Company’s pipe handling tools are designed to enhance the safety, efficiency and reliability of pipe handling operations. Many of these tools have provided innovative methods of performing the designated task through mechanization of functions previously performed manually. Rig Systems manufactures various tools used to grip, hold, raise, and lower pipe, and in the making up and breaking out of drill pipe, workstrings, casing and production tubulars including spinning wrenches, manual tongs, torque wrenches and kelly spinners.
Mud Pumps. Mud pumps are high pressure pumps located on the rig that force drilling mud down the drill pipe, through the drill bit, and up the space between the drill pipe and the drilled formation (the “annulus”) back to the surface. These pumps, which generate pressures of up to 7,500 psi, must therefore be capable of displacing drilling fluids thousands of feet down and back up the well bore. The conventional mud pump design, known as the triplex pump, uses three reciprocating pistons oriented horizontally. The Company has introduced the HEX™ Pump, which uses six pumping cylinders, versus the three used in the triplex pump. Along with other design features, the greater number of cylinders reduces pulsations (or surges) and increases the output available from a given footprint. Reduced pulsation is desirable where downhole measurement equipment is being used during the drilling process, as is often the case in directional drilling.
5
Table of Contents
Hoisting Systems. Hoisting systems are used to raise or lower the drill stem while drilling or tripping, and to lower casing into the wellbore. The drawworks, the heart of the hoisting system, is a large winch that spools off or takes in the drilling line, which is in turn connected to the drill stem at the top of the derrick. The drawworks also plays an important role in keeping the weight on the drill bit at a desired level. This task is particularly challenging on offshore drilling rigs, which are subject to wave motion. To address this, the Company has introduced the AHD™ Active Heave Drilling Drawworks which uses computer-controlled motors to compensate for the motion experienced in offshore drilling operations.
Cranes. The Company provides a comprehensive range of crane solutions, with purpose-built products for all segments of the oil and gas industry as well as many other markets. The Company has a broad collection of crane brand names with international recognition, and a large staff of engineers specializing in the design of cranes and related equipment. The product range extends from small cargo-handling cranes to the world’s largest marine cranes. In all, the Company provides over twenty crane product lines that include standard model configurations as well as custom-engineered and specialty cranes.
Motion Compensation Systems. Traditionally, motion compensation equipment is located on top of the drilling rig and serves to stabilize the bit on the bottom of the hole, increasing drilling effectiveness of floating offshore rigs by compensating for wave and wind action. The AHD Drawworks, discussed above, was introduced to eliminate weight and improve safety, removing the compensator from the top of the rig and integrating it into the drawworks system. In addition to the AHD Drawworks, the Company has introduced an Active Heave Compensation (“AHC”) System that goes beyond the capabilities of the AHD Drawworks to handle the most severe weather. Additionally, the Company’s tensioning systems provide continuous axial tension to the marine riser pipe (larger diameter pipe which connects floating drilling rigs to the well on the ocean floor) and guide lines on floating drilling rigs, tension leg platforms and jack-up drilling rigs.
Blowout Preventers. BOPs are devices used to seal the space between the drill pipe and the borehole and, if necessary, to also shear the drill pipe itself to prevent blowouts (uncontrolled flows of formation fluids and gases to the surface). Rig Systems manufactures a wide array of BOPs used in various applications from deepwater offshore vessels to land rigs. Ram and annular BOPs are back-up devices that are activated only if other techniques for controlling pressure in the wellbore are inadequate. When closed, these devices prevent normal drilling operations. Ram BOPs seal the wellbore by hydraulically closing rams (thick heavy blocks of steel) against each other across the wellbore. Specially designed packers seal around specific sizes of pipe in the wellbore, shear pipe in the wellbore or close off an open hole. Annular BOPs seal the wellbore by hydraulically closing a rubber packing unit around the drill pipe or kelly or by sealing against itself if nothing is in the hole.
In 1998, the Company introduced the NXT TM ram type BOP which eliminates door bolts, providing significant weight, rig-time, and space savings. Its unique features make subsea operation more efficient through faster ram configuration changes. In 2004, the Company introduced the LXT TM ram type of BOP, which features many of the design elements of the NXT TM, but is targeted at the land market. Over the past five years considerable focus has been placed on robustness and reliability in the fundamental design of the equipment with extensive testing being performed in an R&D facility opened in 2012. In 2013, the Company acquired the T3 BOP product line, further expanding its market offering of reliable, field proven designs for land based drilling applications.
The ShearMaxTM line of low force BOP shear rams released in 2010 add substantial tubular shearing capability to the Company’s line of pressure control equipment, including the capability to shear large drill pipe tool joints, previously unheard of in the industry. This innovative shear blade design utilizes patented “Puncture Technology” to reduce the shearing pressures 50% or more and in some cases as much as five times lower. The ShearMax Blind shear provides a shear-and-seal design for drill pipe, while the Casing and TJC shears address casing up to 16” OD and most tool joints up to 2” wall thickness, respectively.
Derricks and Substructures. Drilling activities are carried out from a drilling rig. A drilling rig consists of one or two derricks; the substructure that supports the derrick(s); and the rig package, which consists of the various pieces of equipment discussed above. Rig Systems designs, fabricates and services derricks used in both onshore and offshore applications, and substructures used in onshore applications. Rig Systems also works with shipyards in the fabrication of substructures for offshore drilling rigs.
Land Rig Packages. The Company designs, manufactures, assembles, upgrades, and supplies equipment sets to a variety of land drilling rigs, including those specifically designed to operate in harsh environments such as the Arctic Circle and the desert. Our key land rig product names include the Ideal Rig™, Drake Rig™, and Rapid Rig TM. The Company’s recent rig packages are designed to be safer and fast moving, to utilize AC technology, and to reduce manpower required to operate a rig.
Offshore Drilling Equipment Packages. Rig Systems also provides the above major pieces of equipment in fully integrated equipment packages for offshore drilling rigs. By purchasing an entire drilling equipment package customers reap the benefits of Rig Systems’ integrated package engineering and installation and commissioning expertise, alleviating many of the potential problems of sourcing complex equipment that must work together from multiple vendors.
Customers and Competition. Rig Systems sells directly to drilling contractors, rig fabricators, well servicing companies, pressure pumping companies, national oil companies, major and independent oil and gas companies, and also through distribution companies. Demand for its products is strongly dependent upon capital spending plans by oil and gas companies and drilling contractors, and the level of oil and gas well drilling activity.
6
Table of Contents
The products of Rig Systems are sold in highly competitive markets and its sales and earnings can be affected by competitive actions such as price changes, new product development, or improved availability and delivery. The segment’s primary competitors are MHWirth; Aker Solutions; American Electric Technologies; American Block; AXON Energy Products; Bentec; Bomco; Canrig (a division of Nabors Industries); Cavins Oil Well Tools; Cameron International and Omron Corporation (divisions of Schlumberger, Ltd.); Den-Con Tool Company; Forum Energy Technologies; General Electric; Hitec Products; Honghua; Huisman; Liebherr; Parveen Industries; Rolls Royce; Siemens; Stewart & Stevenson; Soilmec and Drillmec (a part of the Trevi Group); Seatrax; Tesco Corporation; Wärtsilä and Weatherford International. Management believes that the principal competitive factors affecting Rig Systems are performance, quality, reputation, customer service, availability of spare parts and consumables, breadth of product line and price.
Rig Aftermarket
The Company’s Rig Aftermarket segment provides comprehensive aftermarket products and services to support a large installed base of land and offshore rigs, and drilling rig components manufactured by the Company’s Rig Systems segment. The segment provides spare parts, repair, and rentals as well as technical support, field service and first well support, field engineering, and customer training through a network of aftermarket service and repair facilities strategically located in major areas of drilling operations.
Spare Parts. Rig Aftermarket maintains an inventory of spare parts, the majority manufactured by Rig Systems, across a global network of aftermarket service and repair facilities.
Technical Support. Rig Aftermarket’s Technical Support Centers troubleshoot and resolve equipment needs for customers. Cross-disciplinary teams work together with field service technicians and subject matter experts to keep customers’ rigs in operation and utilize web-based applications to record, manage, and resolve issues.
Field Service. Field service engineers actively support rig equipment and technologies on location. Based across a global network of aftermarket service and repair facilities, field service engineers can be deployed to operating sites worldwide to resolve equipment issues, whether structural, mechanical, electrical, or software-related.
Repair. Rig Aftermarket overhauls, repairs, rebuilds, and recertifies equipment to quality assurance and OEM specifications using only OEM parts.
eHawk Remote Support. A subscription service available to customers, eHawk Support Centers provide fast issue response times. Using satellite and computer technology, eHawk Support Centers can diagnose equipment status and work to handle issues remotely, reducing service personnel visits to the field. eHawk utilizes web-based applications to record, manage, and resolve issues.
Field Engineering. Rig Aftermarket Field Engineering supports customers by providing rig-specific designs, modifications, and solutions as needed. Services include rig surveys, proposal and design drawings, service manuals, and equipment installation.
Training Centers and Technical Colleges. Rig Aftermarket Training Centers offering training for all equipment and technologies designed and manufactured by Rig Systems. Training centers offer a varied curriculum that incorporates hands-on experience, use of equipment simulators, automated classrooms, and enhanced animations with cross-sectional cutouts.
Customers and Competition. Rig Aftermarket supports land and offshore drillers. Demand for the segment’s products and services depends on overall levels of oilfield drilling activity, which drives demand for spare parts, service, and repair for Rig System’s large installed base of equipment; and secondarily on drilling contractors’ and oil and gas companies’ capital spending plans, specifically capital expenditures on rig refurbishments and re-certifications.
The products of Rig Aftermarket are sold in highly competitive markets and its sales and earnings can be affected by competitive actions such as price changes, new product development, or improved availability and delivery. The segment’s primary competitors are MHWirth; American Electric Technologies; American Block; AXON Energy Products; Bentec; Bomco; Canrig (a division of Nabors Industries); Cavins Oil Well Tools; Cameron International and Omron Corporation (divisions of Schlumberger, Ltd.); Den-Con Tool Company; Forum Energy Technologies; General Electric; Hitec Products; Honghua; Huisman Liebherr; Parveen Industries; Rolls Royce; Siemens; Stewart & Stevenson; Soilmec and Drillmec (a part of the Trevi Group); Seatrax; Sparrows Offshore; Subsea Solutions; Tesco Corporation; Wärtsilä and Weatherford International. Management believes that the principal competitive factors affecting Rig Aftermarket are performance, quality, reputation, customer service, availability of spare parts and consumables, breadth of product line and price.
7
Table of Contents
Wellbore Technologies
The Company’s Wellbore Technologies segment designs, manufactures, rents, and sells a variety of equipment and technologies used to perform drilling operations, and offers services that optimize their performance. Key technologies and services include: drilling optimization and automation services, instrumentation, measuring and monitoring systems; drill bits; downhole tools, like downhole drilling motors and other steerable technologies; solids control and waste management equipment and services; drilling fluids; premium drill pipe, wired pipe and drill string accessories; tubular inspection, repair and coating services; fishing tools and hole openers; and portable power generation.
The Wellbore Technologies segment focuses on oil and gas companies and supports drilling contractors, oilfield service companies, and oilfield rental companies. Additional customers include steel mills and industrial companies. Demand for Wellbore Technologies’ products and services primarily depends on the level of oilfield drilling activity by oil and gas companies, drilling contractors, and oilfield service companies, as measured by rig count, well count, and footage drilled.
Drill Pipe Products. The Company designs, manufactures, and sells a full range of proprietary premium and API drill stem products used for the drilling of oil and gas wells, including drill pipe, heavy-weight drill pipe, drill collars, drill subs, and accessories.
A drilling rig typically carries an inventory of 10,000 to 30,000 feet of drill pipe, which is consumed over time by the drilling process.
During the drilling process, motors mounted on the rig rotate the drill pipe, bottom-hole assembly, and drill bit. In addition to driving the drill bit, drill pipe serves as the conduit for drilling fluids. The Company offers a broad line of premium drilling products designed for the drilling of extended reach, directional, horizontal, deepwater, and ultra-deep wells in both international and domestic markets.
Voest-Alpine Tubulars (“VAT”). VAT is a joint venture between the Company and the Austrian based Voest-Alpine Group. The Company has a 50.11% investment in the joint venture which is located in Kindberg, Austria. VAT owns a tubular mill with an annual capacity of approximately 380,000 metric tons and is the primary supplier of green tubes, or raw material, for our U.S. based drill pipe production. VAT is accounted for under the equity-method of accounting due to the minority owner having substantive participating rights.
Tubular Coating. The Company develops, manufactures and applies its proprietary tubular coatings, known as Tube-Kote® coatings, to new and used drill pipe products and line pipe. Tubular coatings help prevent corrosion, extending the life of tubular assets; reduce expensive interruptions in production; and improve hydraulic efficiency, increasing fluid flow rate up to 25%. The Company also offers a mechanical fit connection that is very quick to field install and, when combined with internal coatings, provides a continuous internal surface of coatings throughout the connection. Additionally, the Company also offers other corrosion solutions such as fiberglass lined tubing for wells used for injection or enhanced oil recovery.
Tubular Inspection. Tubular inspection ensures the integrity of drill pipe products and tubulars used in completion and production. The Company engineers and fabricates inspection equipment for steel mills, which it sells and rents. The equipment is used for quality control purposes to detect defects in the pipe during the high-speed manufacturing process. Because not all mills use this equipment, newly manufactured tubulars may have serious defects not detected at the mill and/or incur damage during handling prior to use at the well site, while used tubulars may have service-induced flaws. Consequently, E&P companies typically have tubulars inspected before they are placed in service to reduce the risk of failures during drilling, completion, or production.
Tubular inspection techniques include electromagnetic, ultrasonic, magnetic flux leakage and gamma ray. Inspection services are provided by mobile units at the wellhead as used tubing is removed from a well, and at fixed site locations. In addition to its Tubular Inspection product line, the Company has a Specialty Inspection Services group that performs rig inspections, drop surveys, lift gear inspections and derrick building services via rope access to service land and offshore drilling contractors.
Machining, Repair and Services. The Company offers a variety of tubular machining services including: thread repair, tool joint rebuilding and sub manufacturing, providing a “one-stop-shop” concept for its drill pipe customers.
Drilling & Intervention. The Company designs, manufactures and services a wide array of downhole drilling tools and offers all components for a comprehensive bottom hole assembly (“BHA”). The Company designs, manufactures, and services fixed cutter and roller cone drill bits and services its customer base in virtually every significant oil and gas producing region of the world. The Company provides downhole drilling motors, capable of achieving higher rotary velocities than can generally be achieved using conventional surface rotary equipment, and ancillary motor technologies that improve drilling efficiency and extend the reach of horizontal drilling applications, like the AGITATOR™ friction reduction tool. The Company also manufactures steerable technologies that allow for borehole directional control, enabling more efficient drilling in more challenging formations.
The Company manufactures an extensive range of borehole enlargement tools to produce enlarged wellbores that bring production online faster. The Company also sells and rents a comprehensive offering of leading fishing and thru-tubing tools to perform retrieval of stuck tools, remove debris, mill bridge plugs and similar devices, and manage well flow control.
8
Table of Contents
Through its Coring Services business line, the Company enables the extraction of actual rock samples from a drilled well bore and allows geologists to examine the formations at the surface.
Dynamic Drilling Solutions. The Company’s Dynamic Drilling Solutions business combines product lines that are focused on drilling instrumentation and visualization solutions, data communication support, well monitoring, drilling performance software, directional measurement sensors and systems, and drilling automation and optimization. Dynamic Drilling Solutions generates, collects, aggregates, communicates, and analyzes drilling data to provide our customers effective solutions for their well environments. The Company’s Instrumentation business provides drilling rig operators real time measurement and monitoring of critical parameters required to improve rig safety and efficiency. The Company’s measurement and monitoring systems combine leading hardware and software technologies (both at the surface and in the wellbore) into an integrated drilling rig package. Access of drilling data is provided to offsite locations, enabling company personnel to monitor drilling operations through a secure link.
eVolve Optimization Services. The eVolve service is a technology offering designed to optimize drilling operations. The service equips existing rigs, rig crews, and engineers with tools and systems designed to deliver increased performance, enhanced real-time decision making, and comprehensive analytics capabilities. Downhole tools and sensors, placed at multiple points in the drillstring, acquire pressure, dynamics, and measurement-while-drilling (MWD) information, transmitting real-time data to surface via wired drillpipe. The eVolve service focuses on reducing well delivery time and costs, improving safety, and enhancing the quality of wellbores.
Directional Sensors, Steering Tools, Magnetic Multi-shot Tools, Mud-Pulse Telemetry and Electromagnetic Measurement-While-Drilling Systems are offered by the Company. These directional eTools provide measurements and store the data in memory or use a telemetry pathway to transmit downhole data to the surface. At the surface this data is analyzed to optimize well trajectory and improve the drilling rate-of-penetration.
Managed Pressure Drilling equipment and support services enable improved kick detection and help manage wellbore pressures during drilling to permit accessing reserves in certain areas using chokes, manifolds, rotating control devices, continuous circulation systems, downhole sensors and optimized control systems.
Solids Control and Waste Management. The Company offers highly-engineered equipment and services to separate and manage drill cuttings produced by the drilling process (“Solids Control”). Failing to remove drilled solids can negatively impact drilling operations, while good solids control improves drilling efficiency, promoting faster penetration rates that decrease the time to drill and reducing the need to dilute drilling fluids to maintain the desired liquids to solid ratio. The cuttings generated during drilling are usually contaminated with petroleum or drilling fluids, and must be disposed of in an environmentally sound manner. Wellsite Services manufactures state-of-the-art patented solids control equipment. Upon the separation of the drill cuttings Wellsite Services provides waste management (both onsite and at centralized locations), including transport and storage.
Fluids Services. The Company is engaged in the provision of drilling fluids, completion fluids and other related services. Drilling fluids are used to maintain well bore stability while drilling, control downhole pressure, lubricate and cool the drill bit, suspend and release cuttings, and transmit hydraulic energy to drilling tools and bits. The Company provides water-, oil-, and synthetic-based drilling fluids.
Portable Power Generation. The Company provides rental generators, lighting and other accessories for use in the upstream oil and gas industry, refinery and petrochemical operations, construction sites, events, disaster relief and other industries.
NOV IntelliServ. NOV IntelliServ is a joint venture between the Company and Schlumberger, Ltd. in which the Company holds a 55% interest and maintains operational control. NOV IntelliServ manufactures wired pipe and ancillary wellbore data transmission products used to deliver high-speed bi-directional communication of downhole data.
Customers and Competition. Customers for Wellbore Technologies include major and independent oil and gas companies, national oil companies, drilling and workover contractors, oilfield equipment and product distributors and other manufacturers, oilfield service companies, steel mills, rental companies, and other industrial companies. The Company’s competitors include: Baker Hughes; Drill Pipe Masters; Frank’s International; Future Pipe; Halliburton; Hanwei; Hilong; Patterson Tubular Services; Precision Tube; ShawCor; Schlumberger; Superior Energy Services; Texas Steel Conversion; Vallourec & Mannesmann and Weatherford International, along with a number of smaller regional competitors.
9
Table of Contents
Completion & Production Solutions
The Company’s Completion & Production Solutions segment integrates technologies for well completions and oil and gas production. The segment designs, manufactures, and sells equipment and technologies needed for hydraulic fracture stimulation, including pressure pumping trucks, blenders, sanders, hydration units, injection units, flowline, manifolds, wellheads and completion tools; well intervention, including coiled tubing units, coiled tubing, and wireline units and tools; offshore production, including composite pipe, process equipment, floating production systems and subsea production technologies; and, onshore production including surface transfer and progressive cavity pumps, positive displacement reciprocating pumps, pressure vessels, and artificial lift systems.
Completion & Production Solutions supports service companies and oil and gas companies. Demand for Completion & Production Solutions’ products depends on the level of oilfield completions and workover activity by oilfield service companies and drilling contractors and capital spending plans by oil and gas companies and oilfield service companies.
Coiled Tubing Equipment. Coiled tubing consists of flexible steel tubing manufactured in a continuous string and spooled on a reel. It can often extend over twenty thousand feet in length and is run in and out of the wellbore at a high rate of speed by a hydraulically operated coiled tubing unit. A coiled tubing unit is typically mounted on a truck, semi-trailer or skid (steel frames on which portable equipment is mounted to facilitate handling with cranes for offshore use) and consists of a hydraulically operated tubing reel or drum, an injector head which pushes or pulls the tubing in or out of the wellbore, and various power and control systems. Coiled tubing is typically used with sophisticated pressure control equipment which permits the operator to perform workover operations on a live well. The Completion & Production Solutions segment manufactures and sells both coiled tubing units and the ancillary pressure control equipment used in these operations. Currently, most coiled tubing units are used in well remediation and completion applications. The Company believes that advances in the manufacturing process of coiled tubing, tubing fatigue protection and the capability to manufacture larger diameter and increased wall thickness coiled tubing strings have resulted in increased uses and applications for these products. For example, some well operators are now using coiled tubing in drilling applications such as slim-hole re-entries of existing wells.
Wireline Equipment. The Company’s wireline products include wireline drum units, which consist of a spool or drum of wireline cable, mounted in a mobile vehicle or skid, which works in conjunction with a source of power (an engine mounted in the vehicle or within a separate “power pack” skid). The wireline drum unit is used to spool wireline cable into or out of a well, in order to perform surveys inside the well, sample fluids from the bottom of the well, retrieve or replace components from inside the well, or to perform other well remediation or survey operations. The wireline used may be “slick line”, which is conventional single-strand steel cable used to convey tools in or out of the well, or “electric line”, which contains an imbedded single-conductor or multi-conductor electrical line which permits communication between the surface and electronic instruments attached to the end of the wireline at the bottom of the well. Wireline units are usually used in conjunction with a variety of pressure control equipment which permits safe access into wells while they are flowing and under pressure at the surface. The Company engineers and manufactures a broad range of pressure control equipment for wireline operations, including wireline blowout preventers, strippers, packers, lubricators and grease injection units. Additionally, the Company makes wireline rigging equipment such as mast trucks, and skidded masts for offshore rig-up.
Stimulation Equipment. The Company’s stimulation products include fracturing pumpers, acid units, blenders, control systems, sand handling systems, combo units, hydration and chemical additive systems as well as services and parts. Additionally, the Company sells, services, and rents portable flow line and well testing equipment.
Turret Mooring Systems. The Company designs and manufacturers Turret Mooring Systems and Spread Moored Systems, and other products for Floating Production, Storage and Offloading (“FPSOs”) and other offshore vessels and terminals. A turret mooring system consists of a geostatic part attached to the seabed and a rotating part integrated in the hull of the FPSO, which are connected and allow the ship to weathervane (rotate) around the turret during production.
Flexible Pipe Systems. The Company designs and manufactures flexible pipe products and systems for the offshore oil and gas industry, including products associated with FPSO’s and other offshore production platforms, as well as subsea production systems including flexible risers, flowlines and jumpers. The product range consists of flexible pipe solutions from 2” – 16”, designed to operate under very demanding offshore conditions in all parts of the world. The products remain flexible even under very high working pressure, up to 1,000 bars, and at the same time they are able to withstand working temperatures from minus 50° centigrade up to +130° centigrade. Flexible pipe systems are superior to other pipe solutions in respect of flexibility, ability to withstand different design conditions and capability to convey challenging mixtures of liquid and gaseous fluids. The Company’s products are qualified for use in water depths down to 2,500 meters. The Company also supplies a wide range of additional equipment such as accessories and steel structures required in each system configuration.
10
Table of Contents
Subsea Products. The Company provides critical equipment required for Subsea Production including subsea water injection treatment systems, subsea storage units, tie-in connector systems, active and passive cooling systems, subsea automatic pig launchers, pig tracking systems and weak-links for controlled disconnection on the seabed.
Fiberglass & Composite Tubulars. The Company designs, manufactures and markets filament-wound and molded fiberglass pipe and fittings as well as spoolable fiberglass pipe. These products are used by a wide range of petroleum, petrochemical and other industrial fluid and gas processing industries; for service station piping systems; aboard marine vessels, FPSOs and offshore oil platforms; and, are marketed as an alternative to metallic piping systems which can fail under corrosive operating conditions. The Company’s Fiberspar™ business, manufactures and sells fiberglass-reinforced spoolable pipe to the oil and gas industry which provides a reliable, corrosion-resistant, cost-effective solution for the production and transportation of oil and gas. Additionally, the Company manufactures vessels, chambers, structures, and other bespoke components from composite materials allowing for a fit and forget solution across a diverse range of user applications, both onshore and offshore.
XL Systems. The Company’s XL Systems product line offers the customer an integrated package of large-bore tubular products and services for offshore or deep onshore wells. This product line includes the Company’s proprietary line of wedge thread connections on large-bore tubulars and related engineering and design services. The Company provides this product line for drive pipe, jet strings and conductor casing. The Company produces large-bore tubulars with a high-strength, high-fatigue Viper™ weld-on connector for use in deep-water and other environments where an extremely robust connector is needed. The Company also offers service personnel in connection with the installation of all of these products.
Process and Flow Technologies. The Company serves its customers in various markets by designing, manufacturing and distributing integrated solutions and discrete products, including wellstream processing systems (dynamic oil recovery, water treatment, phased separation, hydrate inhibition, and gas processing) pumping technologies (reciprocating, multistage and progressive cavity pumps), chokes, midstream products (closures, transfer pumps and valves), artificial lift systems (stuffing boxes, drive heads, PCP, control boxes, polished rod accessories, and hydraulic pumping units), mixing and agitation equipment, heat exchangers, and other general oilfield products (critical service hookups, pumping tees, and production BOP’s). These products are used by a highly-diversified customer base with presence in both oil and gas and industrial markets, of which the latter includes waste water treatment, mining, and chemical processing.
Pumps & Expendables. The Company designs, manufactures, and sells pumps and expendables that are used in oil and gas drilling operations, well service operations, production applications, as well as industrial applications. These pumps include reciprocating positive displacement piston and plunger pumps and high pressure mud pumps. These pumps are sold as individual units and unitized packages with drivers, controls and piping. The Company also manufactures fluid end expendables (liners, valves, pistons, and plungers). The Company offers popular industry brand names including: Wheatley, Gaso, National, Oilwell, MSW, and Omega reciprocating pumps.
Completion Tools. The Company designs, manufactures and installs well completion tools that are primarily focused on the Horizontal Multi-Stage Fracturing (HMSF) market. HMSF wells are found in many of the oil and gas producing basins of the world and involve segmenting the horizontal section of the wellbore into smaller compartments that can be stimulated independently. Specially designed sliding sleeves are inserted at regular intervals in the production casing and are opened on demand during the stimulation operation. These sliding sleeves can be configured to activate with a variety of methods including dropping balls from surface or by using custom designed coiled tubing tools. In addition, the Company provides custom designed intervention tools that can be used to improve production from the HMSF completion by opening or closing sleeves that may be producing water or sand. The business provides equipment and services to a diverse group of oil and gas companies in North America and international markets including the North Sea.
Customers and Competition. The primary customers for the products and services offered by the Completion & Productions Solutions segment include well servicing companies, oil and gas companies, and fabricators, as well as distributors in select markets. Competitors include: Cameron International (a division of Schlumberger, Ltd.); Circor International; Corpro (a division of ALS); Dover; Drilquip; FMC Technologies; Forum Energy Technologies; GE Oil & Gas; Stewart & Stevenson; Technip; Roper Industries; Weir Group; and a number of regional competitors. Management believes that on-site support is becoming a more important competitive element in this market, and other competitive factors affecting the business are performance, quality, reputation, customer service, product availability and technology, breadth of product line and price.
Available Information
The Company’s principal executive offices are located at 7909 Parkwood Circle Drive, Houston, Texas 77036. Its telephone number is (713) 346-7500. The Company’s common stock is traded on the New York Stock Exchange under the symbol “NOV”. Further information about the Company’s products and services can be found on its website at: http://www.nov.com. The Company’s annual reports on Form 10-K, quarterly reports on Form 10-Q, current reports on Form 8-K, and all related amendments are available free of charge on the Investor Relations portion of the Company’s website, www.nov.com/investor, as soon as reasonably practicable after such material is electronically filed with, or furnished to, the Securities and Exchange Commission (“SEC”). The Company’s Code of Ethics is also posted on its website.
11
Table of Contents
2016 Acquisitions and Other Investments
During 2016, the Company completed a total of 10 acquisitions and other investments for an aggregate cash investment of $230 million, net of cash acquired and $18 million of NOV stock.
Seasonal Nature of the Company’s Business
Historically, activity levels of some of the Company’s segments have followed seasonal trends to some degree.
In Canada, Wellbore Technologies and Completion & Production Solutions typically realized high first quarter activity levels, as operators take advantage of the winter freeze to gain access to remote drilling and production areas. In past years, certain Canadian businesses within Wellbore Technologies and Completion & Production Solutions have declined during the second quarter due to warming weather conditions which resulted in thawing, softer ground, difficulty accessing drill sites, and road bans that curtailed drilling activity (“Canadian Breakup”). However, these segments have typically rebounded in the third and fourth quarter. Wellbore Technologies and Completion & Production Solutions activity in the U.S. sometimes increases during the third quarter and then peaks in the fourth quarter as operators spend the remaining drilling and/or production capital budgets for that year. Wellbore Technologies and Completion & Production Solutions revenues in the Rocky Mountain region sometimes decline in the late fourth quarter or early first quarter due to harsh winter weather. The Company’s fiberglass and composite tubulars business in China has typically declined in the first quarter due to the impact of weather on manufacturing and installation operations, and due to business slowdowns associated with the Chinese New Year. In general, Rig Systems and Rig Aftermarket have experienced minor seasonal fluctuation with orders for aftermarket spare parts and repair sometimes rising in the fourth quarter (as annual budgets are used up) and then falling in the first quarter. There can be no guarantee that seasonal effects will not influence future sales in these segments.
The Company anticipates that the seasonal trends described above will continue. However, there can be no guarantee that spending by the Company’s customers will continue to follow patterns seen in the past.
Marketing and Distribution Network
Substantially all of Rig Systems’ capital equipment and Rig Aftermarket’s spare parts sales, and a large portion of our smaller pumps and parts sales, are made through our direct sales force and distribution service centers. Sales to foreign oil companies are often made with or through representative arrangements. Products within Wellbore Technologies and Completion & Production Solutions are rented and sold worldwide through our own sales force and through commissioned representatives.
Completion & Production Solutions’ customers are predominantly service companies and oil and gas companies. Demand for the Company’s Completion & Production Solutions segment products depends on the level of oilfield completions and workover activity by oilfield service companies and drilling contractors and capital spending plans by oil and gas companies and oilfield service companies.
The Company’s foreign operations, which include significant operations in Canada, Europe, Russia, the Far East, the Middle East, Africa and Latin America, are subject to the risks normally associated with conducting business in foreign countries, including foreign currency exchange risks and uncertain political and economic environments, which may limit or disrupt markets, restrict the movement of funds or result in the deprivation of contract rights or the taking of property without fair compensation. Government-owned petroleum companies located in some of the countries in which the Company operates have adopted policies (or are subject to governmental policies) giving preference to the purchase of goods and services from companies that are majority-owned by local nationals. As a result of such policies, the Company relies on joint ventures, license arrangements and other business combinations with local nationals in these countries. See Note 15 to the Consolidated Financial Statements for information regarding geographic revenue information.
Research and New Product Development and Intellectual Property
The Company believes that it has been a leader in the development of new technology and equipment to enhance the safety and productivity of drilling and well servicing processes and that its sales and earnings have been dependent, in part, upon the successful introduction of new or improved products. Through its internal development programs and certain acquisitions, the Company has assembled an extensive array of technologies protected by a substantial number of trade and service marks, patents, trade secrets, and other proprietary rights.
As of December 31, 2016, the Company held a substantial number of United States patents and had additional patent applications pending. As of this date, the Company also had foreign patents and patent applications pending relating to inventions covered by the United States patents. Additionally, the Company maintains a substantial number of trade and service marks and maintains a number of trade secrets. Expiration dates of such patents range from 2017 to 2036.
12
Table of Contents
Although the Company believes that this intellectual property has value, competitive products with different designs have been successfully developed and marketed by others. The Company considers the quality and timely delivery of its products, the service it provides to its customers and the technical knowledge and skills of its personnel to be as important as its intellectual property in its ability to compete. While the Company stresses the importance of its research and development programs, the technical challenges and market uncertainties associated with the development and successful introduction of new products are such that there can be no assurance that the Company will realize future revenue from new products.
Manufacturing and Service Locations
The manufacturing processes for the Company’s products generally consist of machining, welding and fabrication, heat treating, assembly of manufactured and purchased components and testing. Most equipment is manufactured primarily from alloy steel. The availability and price of alloy steel castings, forgings, purchased components and bar stock is critical to the production and timing of shipments.
Rig Systems provides drilling rig components, as well as complete land drilling rigs, and offshore drilling equipment packages. The primary manufacturing facilities are located in Houston, Texas; Orange, California; and Ulsan, South Korea.
Rig Aftermarket provides comprehensive aftermarket products and services to support land rigs and offshore rigs, and drilling rig components manufactured by Rig Systems. Primary facilities are located in Houston, Texas; New Iberia, Louisiana; Aberdeen, Scotland; Singapore; and Dubai, UAE.
Wellbore Technologies designs, manufactures, rents, and sells a variety of equipment and technologies used to perform drilling operations, and offers services that optimize their performance, including: solids control and waste management equipment and services, drilling fluids, premium drill pipe, wired pipe, drilling optimization services, tubular inspection and coating services, instrumentation, downhole tools, and drill bits. Primary facilities are located in Houston, Conroe, Navasota, Cedar Park, Texas; Veracruz, Mexico; and Dubai, UAE.
Completion & Production Solutions integrates technologies for well completions and oil and gas production. The segment designs, manufactures, and sells equipment and technologies needed for hydraulic fracture stimulation, including pressure pumping trucks, blenders, sanders, hydration units, injection units, flowline, manifolds and wellheads; well intervention, including coiled tubing units, coiled tubing, and wireline units and tools; onshore production, including composite pipe, surface transfer and progressive cavity pumps, and artificial lift systems; and, offshore production, including floating production systems and subsea production technologies. Primary facilities are located in Houston, Fort Worth, Texas; Tulsa, Oklahoma; Senai, Malaysia; Kalundborg, Denmark; Superporto du Acu, Brazil; and Manchester, England.
Raw Materials
The Company believes that materials and components used in its operations are generally available from multiple sources. The prices paid by the Company for its raw materials may be affected by, among other things, energy, steel and other commodity prices; tariffs and duties on imported materials; and foreign currency exchange rates. The Company has experienced rising, declining and stable prices for mild steel and standard grades in line with broader economic activity and has generally seen specialty alloy prices continue to rise, driven primarily by escalation in the price of the alloying agents. The Company has generally been successful in its effort to mitigate the financial impact of higher raw materials costs on its operations by applying surcharges to, and adjusting prices on, the products it sells. Higher prices and lower availability of steel and other raw materials the Company uses in its business may adversely impact future periods.
Backlog
The Company monitors its backlog of orders within its Rig Systems and Completion & Production Solutions segments to guide its planning. Backlog includes orders which typically require more than three months to manufacture and deliver.
Backlog measurements are made on the basis of written orders which are firm, but may be defaulted upon by the customer in some instances. Most require reimbursement to the Company for costs incurred in such an event. There can be no assurance that the backlog amounts will ultimately be realized as revenue, or that the Company will earn a profit on backlog work. Backlog for Rig Systems at December 31, 2016, 2015 and 2014, was $2.5 billion, $6.1 billion and $12.5 billion, respectively. Backlog for Completion & Production Solutions at December 31, 2016, 2015 and 2014 was $0.8 billion, $1.0 billion and $1.8 billion, respectively.
13
Table of Contents
Employees
At December 31, 2016, the Company had a total of 36,627 employees, of which 487 were temporary employees. Approximately 380 employees in the U.S. are subject to collective bargaining agreements. Additionally, certain of the Company’s employees in various foreign locations are subject to collective bargaining agreements. The Company believes its relationship with its employees is good.
14
Table of Contents
| ITEM 1A. | RISK FACTORS |
You should carefully consider the risks described below, in addition to other information contained or incorporated by reference herein. Realization of any of the following risks could have a material adverse effect on our business, financial condition, cash flows and results of operations.
We are dependent upon the level of activity in the oil and gas industry, which is volatile and has caused, and may cause future, fluctuations in our operating results.
The oil and gas industry historically has experienced significant volatility. Demand for our products and services depends primarily upon the number of oil rigs in operation, the number of oil and gas wells being drilled, the depth and drilling conditions of these wells, the volume of production, the number of well completions, capital expenditures of other oilfield service companies and the level of workover activity. Drilling and workover activity can fluctuate significantly in a short period, particularly in the United States and Canada. The willingness of oil and gas operators to make capital expenditures to explore for and produce oil and natural gas and the willingness of oilfield service companies to invest in capital equipment will continue to be influenced by numerous factors over which we have no control, including the:
| • | current and anticipated future prices for oil and natural gas; |
| • | volatility of prices for oil and natural gas; |
| • | ability or willingness of the members of the Organization of Petroleum Exporting Countries (“OPEC”) to maintain or influence price stability through voluntary production limits; |
| • | level of production by non-OPEC countries; |
| • | level of excess production capacity; |
| • | cost of exploring for and producing oil and gas; |
| • | level of drilling activity and drilling rig dayrates; |
| • | worldwide economic activity and associated demand for oil and gas; |
| • | availability and access to potential hydrocarbon resources; |
| • | national government political requirements; |
| • | fluctuations in political conditions in the United States and abroad; |
| • | currency exchange rate fluctuations and devaluations; |
| • | development of alternate energy sources; and, |
| • | environmental regulations. |
The significant oil and gas industry downturn that began in the second half of 2014 resulted in reduced demand for oilfield services, which has had, and may continue to have, a significant adverse impact on our financial results. Expectations for future oil and gas prices cause many shifts in the strategies and expenditure levels of oil and gas companies, drilling contractors, and other service companies, particularly with respect to decisions to purchase major capital equipment of the type we manufacture. Although oil and gas prices, which are determined by the marketplace, have increased in recent months, prices may remain below a range that is acceptable to our customers, which could continue the reduced demand for our products and have a material adverse effect on our financial condition, results of operations and cash flows.
This volatility in oil and gas prices and in the oil and gas industry has caused fluctuations in our quarterly operating results in the past. We cannot assure you that we will realize earnings growth or that earnings in any particular quarter will not fall short of either a prior fiscal quarter or investors’ expectations.
There are risks associated with certain contracts for our equipment.
As of December 31, 2016, we had a backlog of capital equipment to be manufactured, assembled, tested and delivered by Rig Systems and Completion & Production Solutions in the amount of $2.5 billion and $0.8 billion, respectively. The following factors, in addition to others not listed, could reduce our margins on these contracts, adversely impact completion of these contracts, adversely affect our position in the market or subject us to contractual penalties:
| • | financial challenges for consumers of our capital equipment; |
| • | credit market conditions for consumers of our capital equipment; |
15
Table of Contents
| • | our failure to adequately estimate costs for making this equipment; |
| • | our inability to deliver equipment that meets contracted technical requirements; |
| • | our inability to maintain our quality standards during the design and manufacturing process; |
| • | our inability to secure parts made by third party vendors at reasonable costs and within required timeframes; |
| • | unexpected increases in the costs of raw materials; |
| • | our inability to manage unexpected delays due to weather, shipyard access, labor shortages or other factors beyond our control; and, |
| • | the imposition of tarrifs or duties between countries, which could materially affect our global supply chain. |
The Company’s existing contracts for rig equipment generally carry significant down payment and progress billing terms favorable to the ultimate completion of these projects and the majority do not allow customers to cancel projects for convenience. However, unfavorable market conditions or financial difficulties experienced by our customers may result in cancellation of contracts or the delay or abandonment of projects. Any such developments could have a material adverse effect on our operating results and financial condition.
Competition in our industry, including the introduction of new products and technologies by our competitors, as well as the expiration of the intellectual property rights protecting our products and technologies, could ultimately lead to lower revenue and earnings.
The oilfield products and services industry is highly competitive. We compete with national, regional and foreign competitors in each of our current major product lines. Certain of these competitors may have greater financial, technical, manufacturing and marketing resources than us, and may be in a better competitive position. The following can each affect our revenue and earnings:
| • | price changes; |
| • | improvements in the availability and delivery of products and services by our competitors; |
| • | the introduction of new products and technologies by our competitors; and, |
| • | the expiration of intellectual property rights protecting our products and technologies. |
We are a leader in the development of new technology and equipment to enhance the safety and productivity of drilling and well servicing processes. Our revenues and operating results have been dependent, in part, upon the successful introduction of new or improved products. Through our internal development programs and acquisitions, we have assembled an extensive array of technologies protected by a substantial number of trade and service marks, patents, trade secrets, and other proprietary rights, some of which expire in the near future. The expiration of these rights could have a material adverse effect on our operating results. Furthermore, while the Company stresses the importance of its research and development programs, the technical challenges and market uncertainties associated with the development and successful introduction of new products are such that there can be no assurance that the Company will realize future revenue from new products.
In addition, certain foreign jurisdictions and government-owned petroleum companies located in some of the countries in which we operate have adopted policies or regulations which may give local nationals in these countries competitive advantages. Actions taken by our competitors and changes in local policies, preferences or regulations could impact our ability to compete in certain markets and adversely affect our financial results.
There are risks associated with our presence in the U.S. and international markets, including political or economic instability, tax, potential changes to tariffs and trade disputes, currency restrictions, and trade and economic sanctions.
Approximately 75% of our revenues in 2016 were derived from operations outside the United States (based on revenue destination). Our foreign operations include significant operations in Argentina, Canada, Brazil, Europe, the Middle East, China, Africa, Nigeria, Southeast Asia, Russia, Latin America and other international markets. Our revenues and operations are subject to the risks normally associated with conducting business in foreign countries, including uncertain political and economic environments, which may limit or disrupt markets, restrict the movement of funds or result in the deprivation of contract rights or the taking of property without fair compensation. Government-owned petroleum companies located in some of the countries in which we operate have adopted policies, or are subject to governmental policies, giving preference to the purchase of goods and services from companies that are majority-owned by local nationals. As a result of these policies, we may rely on joint ventures, license arrangements and other business combinations with local nationals in these countries. In addition, political considerations may disrupt the commercial relationships between us and government-owned petroleum companies or oilfield service companies.
16
Table of Contents
We manufacture and deliver products and provide services throughout the world. These operations involve complex, international supply chains. Our supply of materials for manufacturing and our channels to market involve import and export of materials and products to facilities and customers. The imposition of tariffs, retaliatory trade disputes, anti-dumping laws and regulations and other such trade restrictions could materially increase our costs, reduce sales, adversely impact our margins or completely restrict our ability to conduct business in certain markets.
Our operations outside the United States could also expose us to trade and economic sanctions or other restrictions imposed by the United States as well as non-U.S. Governmental Regulatory Authorities. The U.S. Department of Justice (“DOJ”), the U.S. Securities and Exchange Commission, other U.S. federal agencies and foreign governmental authorities have a broad range of civil and criminal penalties they may seek to impose against corporations and individuals for violations of trading sanctions laws, the Foreign Corrupt Practices Act (“FCPA”), other federal statutes, and foreign anti-bribery, anti-corruption and trade laws. Under U.S. trading sanctions laws, the government authorities may seek to impose modifications to business practices, including cessation of business activities in sanctioned countries, and modifications to compliance programs, which may increase compliance costs. If any of the risks described above materialize, it could adversely impact our operating results and financial condition.
Our ability to comply with the FCPA and foreign anti-bribery laws is dependent on the success of our ongoing compliance program, including our ability to continue to supervise, train and retain competent employees. Our compliance program also depends on the efforts of our employees to comply with applicable law. We could be subject to sanctions and civil and criminal prosecution as well as fines and penalties in the event of a finding of a violation of the FCPA or other anti-corruption laws by us or any of our employees. Compliance with, and changes in, laws could be costly and could affect operating results. In addition, government disruptions could negatively impact our ability to conduct our business.
Further, in some instances, direct or indirect consumers of our products and services, entities providing financing for purchases of our products and services or members of the supply chain for our products and services may become involved in governmental investigations, internal investigations, political or other enforcement matters. In such circumstances, such investigations may adversely impact the ability of consumers of our products, entities providing financial support to such consumers or entities in the supply chain to timely perform their business plans or to timely perform under agreements with us.
We have operations in the U.S. and in approximately 65 countries that can be impacted by changes in the legal and business environments in which we operate, including new legislation, new regulations, new policies, investigations and legal proceedings and new interpretations of existing legal rules and regulations, export control laws or exchange control laws, additional restrictions on doing business in countries subject to sanctions, and changes in laws in countries where we operate or intend to operate all could adversely impact our business.
We are subject to audits and imposition of taxation by different tax authorities internationally. The occurrence of audits may increase depending on a variety of factors including: the level of enforcement, political circumstance, and potential for revenue generation. Such factors are not within our control. Further, although there are international tax treaties designed to minimize the risk of double taxation, or inconsistent treatment by taxing authorities, the potential still exists for inconsistent treatment by multiple jurisdictions. As the result of such audits, taxes could be imposed that result in a material adverse impact on our operating results and financial condition.
Customers (typically drillship owners or drilling contractors) of our shipyard customers have sought and may in the future seek to suspend, delay or cancel their contracts or payments due to such shipyards. As a result, our shipyard customers have sought and may in the future seek to suspend, delay or cancel deliveries of our drilling equipment packages. To the extent our shipyard customers and their customers become engaged in disputes or litigation related to any such suspensions, delays or cancellations, we may also become involved, either directly or indirectly, in such disputes or litigation, as we enforce the terms of our contracts with our shipyard customers. While we manage equipment deliveries and collection of payment to achieve milestone payments that mitigate our financial risk, such delays, suspensions, attempted cancellations, breaches of contract or other similar circumstances, could adversely affect our operating results and could reduce our backlog.
Sanctions imposed by the United States, European Union and other countries could adversely impact our business activities in or related to Russia and certain Russian companies, including prohibitions of certain sales of goods and services, delays in executing construction or manufacturing projects, credit risk and adverse impacts due to currency fluctuations. To date, we have not identified any material adverse financial impact to our business from these sanctions. Future trade regulations or sanctions, however, could result in adverse impacts on our operating results and financial condition.
17
Table of Contents
The results of our operations are subject to market risk from changes in foreign currency exchange rates.
We earn revenues, pay expenses, purchase assets and incur liabilities in countries using currencies other than the U.S. dollar, including, but not limited to, the Canadian dollar, the Euro, the British pound sterling, the Norwegian krone and the South Korean won. Approximately 75% of our 2016 revenue was derived from sales outside the United States. Because our Consolidated Financial Statements are presented in U.S. dollars, we must translate revenues and expenses into U.S. dollars at exchange rates in effect during or at the end of each reporting period. Thus, increases or decreases in the value of the U.S. dollar against other currencies in which our operations are conducted will affect our revenue and operating income. Because of the geographic diversity of our operations, weaknesses in some currencies might be offset by strengths in others over time. We use derivative financial instruments to mitigate our net exposure to currency exchange fluctuations. We had forward contracts with a notional amount of $2,219 million (with a fair value of a net liability of $15 million) as of December 31, 2016, to reduce the impact of foreign currency exchange rate movements. We are also subject to risks that the counterparties to these contracts fail to meet the terms of our foreign currency contracts. We cannot assure you that fluctuations in foreign currency exchange rates would not affect our financial results.
An impairment of goodwill or other indefinite lived intangible assets could reduce our earnings.
The Company has approximately $6.1 billion of goodwill and $0.4 billion of other intangible assets with indefinite lives as of December 31, 2016. Generally accepted accounting principles require the Company to test goodwill and other indefinite lived intangible assets for impairment on an annual basis or whenever events or circumstances indicate they might be impaired. Events or circumstances which could indicate a potential impairment include (but are not limited to) a significant sustained reduction in worldwide oil and gas prices or drilling; a significant sustained reduction in profitability or cash flow of oil and gas companies or drilling contractors; a significant sustained reduction in capital investment by other oilfield service companies; or a significant increase in worldwide inventories of oil or gas. The timing and magnitude of any goodwill impairment charge, which could be material, would depend on the timing and severity of the event or events triggering the charge and would require a high degree of management judgment. If we were to determine that any of our remaining balance of goodwill or other indefinite lived intangible assets was impaired, we would record an immediate charge to earnings with a corresponding reduction in stockholders’ equity; resulting in a possible increase in balance sheet leverage as measured by debt to total capitalization.
In the third quarter of 2016, the Company impaired $972 million of goodwill. See additional discussion on “Goodwill and Other Indefinite – Lived Intangible Assets” in Critical Accounting Estimates of Item 7, “Management’s Discussion and Analysis of Financial Condition and Results of Operations.”
We could be adversely affected if we fail to comply with any of the numerous federal, state and local laws, regulations and policies that govern environmental protection, zoning and other matters applicable to our businesses.
Our businesses are subject to numerous federal, state and local laws, regulations and policies governing environmental protection, zoning and other matters. These laws and regulations have changed frequently in the past and it is reasonable to expect additional changes in the future. If existing regulatory requirements change, we may be required to make significant unanticipated capital and operating expenditures. We cannot assure you that our operations will continue to comply with future laws and regulations. Governmental authorities may seek to impose fines and penalties on us or to revoke or deny the issuance or renewal of operating permits for failure to comply with applicable laws and regulations. Under these circumstances, we might be required to reduce or cease operations or conduct site remediation or other corrective action which could adversely impact our operations and financial condition.
Our businesses expose us to potential environmental, product or personal injury liability.
Our businesses expose us to the risk that harmful substances may escape into the environment or a product could fail to perform or cause personal injury, which could result in:
| • | personal injury or loss of life; |
| • | severe damage to or destruction of property; or, |
| • | environmental damage and suspension of operations. |
Our current and past activities, as well as the activities of our former divisions and subsidiaries, could result in our facing substantial environmental, regulatory and other litigation and liabilities. These could include the costs of cleanup of contaminated sites and site closure obligations. These liabilities could also be imposed on the basis of one or more of the following theories:
| • | negligence; |
| • | strict liability; |
18
Table of Contents
| • | breach of contract with customers; or, |
| • | as a result of our contractual agreement to indemnify our customers in the normal course of business, which is normally the case. |
We may not have adequate insurance for potential environmental, product or personal injury liabilities.
While we maintain liability insurance, this insurance is subject to coverage limits. In addition, certain policies do not provide coverage for damages resulting from environmental contamination or may exclude coverage for other reasons. We face the following risks with respect to our insurance coverage:
| • | we may not be able to continue to obtain insurance on commercially reasonable terms; |
| • | we may be faced with types of liabilities that will not be covered by our insurance; |
| • | our insurance carriers may not be able to meet their obligations under the policies; or, |
| • | the dollar amount of any liabilities may exceed our policy limits. |
Even a partially uninsured claim, if successful and of significant size, could have a material adverse effect on our consolidated financial statements.
The adoption of climate change legislation, restrictions on emissions of greenhouse gases, or other environmental regulations could increase our operating costs or reduce demand for our products.
Environmental advocacy groups and regulatory agencies in the United States and other countries have been focusing considerable attention on the emissions of carbon dioxide, methane and other greenhouse gases and their potential role in climate change. The adoption of laws and regulations to implement controls of greenhouse gases, including the imposition of fees or taxes, could adversely impact our operations and financial condition. The U.S. Congress and other governments routinely consider legislation to control and reduce emissions of greenhouse gasses and other climate change related legislation, which could require significant reductions in emissions from oil and gas related operations. Additionally, recent concerns regarding the potential impact of hydraulic stimulation, or “fracking”, activities have resulted in government officials promulgating regulations to impose certain operational restrictions and disclosure requirements on oil and gas companies. Changes in the legal and regulatory environment could reduce oil and natural gas drilling activity and result in a corresponding decline in the demand for our products and services, which could adversely impact our operating results and financial condition.
Our information systems may experience an interruption or breach in security.
We rely heavily on information systems to conduct our business. Any failure, interruption or breach in security of our information systems could result in failures or disruptions in our customer relationship management, general ledger systems and other systems. While we have policies and procedures designed to prevent or limit the effect of the failure, interruption or security breach of our information systems, there can be no assurance that any such failures, interruptions or security breaches will not occur or, if they do occur, that any breach or interruption will be sufficiently limited. The occurrence of any failures, interruptions or security breaches of our information systems could damage our reputation, result in a loss of customer business, subject us to additional regulatory scrutiny, or expose us to civil litigation and possible financial liability, any of which could have a material adverse effect on our financial position or results of operations.
Local content requirements imposed in certain jurisdictions may increase the complexity of our operations and impact the demand for our services.
A growing number of nations are requiring equipment providers and contractors to meet local content requirements or other local standards. Our ability to work in certain jurisdictions is sometimes subject to our ability to successfully negotiate and agree upon acceptable joint venture agreements. The failure to reach acceptable agreements could adversely impact the Company’s operations in certain countries. Additionally, we may share control of joint ventures with unaffiliated third parties. Differences in views, and disagreements, among joint venture parties may result in delayed decision making and disputes on important issues. In some instances, we could suffer a material adverse effect to the results of our joint ventures and our consolidated results of operations.
Our ability to hire and retain qualified personnel at competitive cost could materially affect our operations and growth potential.
Many of the products we sell, and related services that we provide, are complex and technologically advanced, which enable them to perform in challenging conditions. Our ability to succeed is, in part, dependent on our success in attracting and retaining qualified personnel to provide service and to design, manufacture, use, install and commission our products. A significant increase in wages paid by competitors, both within and outside the energy industry, for such highly skilled personnel could result in insufficient availability of skilled labor or increase our labor costs, or both. If the supply of skilled labor is constrained or our costs increase, our margins could decrease and our growth potential could be impaired.
19
Table of Contents
We have expanded our businesses through acquisitions and intend to maintain a growth strategy.
We have expanded and grown our businesses through acquisitions and continue to pursue a growth strategy but we cannot assure you that attractive acquisitions will be available to us at reasonable prices or at all. In addition, we cannot assure you that we will successfully integrate the operations and assets of any acquired business with our own or that our management will be able to manage effectively any new lines of business. Any inability on the part of management to integrate and manage acquired businesses and their assumed liabilities could adversely affect our business and financial performance. In addition, we may need to incur substantial indebtedness to finance future acquisitions. We cannot assure you that we will be able to obtain this financing on terms acceptable to us or at all. Future acquisitions may result in increased depreciation and amortization expense, increased interest expense, increased financial leverage or decreased operating income for the Company, any of which could cause our business to suffer.
20
Table of Contents
GLOSSARY OF OILFIELD TERMS
| (Sources: Company management; “A Dictionary for the Petroleum Industry,” The University of Texas at Austin, 2001.) | ||
| API | Abbr: American Petroleum Institute | |
| Annular Blowout Preventer | A large valve, usually installed above the ram blowout preventers, that forms a seal in the annular space between the pipe and the wellbore or, if no pipe is present, in the wellbore itself. | |
| Annulus | The open space around pipe in a wellbore through which fluids may pass. | |
| Automatic Pipe Handling Systems (Automatic Pipe Racker) | A device used on a drilling rig to automatically remove and insert drill stem components from and into the hole. It replaces the need for a person to be in the derrick or mast when tripping pipe into or out of the hole. | |
| Automatic Roughneck | A large, self-contained pipe-handling machine used by drilling crew members to make up and break out tubulars. The device combines a spinning wrench, torque wrench, and backup wrenches. | |
| Beam pump | Surface pump that raise and lowers sucker rods continually, so as to operate a downhole pump. | |
| Bit | The cutting or boring element used in drilling oil and gas wells. The bit consists of a cutting element and a circulating element. The cutting element is steel teeth, tungsten carbide buttons, industrial diamonds, or polycrystalline diamonds (“PDCs”). These teeth, buttons, or diamonds penetrate and gouge or scrape the formation to remove it. The circulating element permits the passage of drilling fluid and utilizes the hydraulic force of the fluid stream to improve drilling rates. In rotary drilling, several drill collars are joined to the bottom end of the drill pipe column, and the bit is attached to the end of the drill collars. Drill collars provide weight on the bit to keep it in firm contact with the bottom of the hole. | |
| Blowout | An uncontrolled flow of gas, oil or other well fluids into the atmosphere. A blowout, or gusher, occurs when formation pressure exceeds the pressure applied to it by the column of drilling fluid. A kick warns of an impending blowout. | |
| Blowout Preventer (BOP) | Series of valves installed at the wellhead while drilling to prevent the escape of pressurized fluids. | |
| Blowout Preventer (BOP) Stack | The assembly of well-control equipment including preventers, spools, valves, and nipples connected to the top of the wellhead. | |
| Borehole Enlargement (“BHE”) | The process opening up or enlarging the internal diameter of the wellbore. This is typically done with under-reamers, reamers, or hole openers. | |
| Closed Loop Drilling Systems | A solids control system in which the drilling mud is reconditioned and recycled through the drilling process on the rig itself. | |
| Coiled Tubing | A continuous string of flexible steel tubing, often hundreds or thousands of feet long, that is wound onto a reel, often dozens of feet in diameter. The reel is an integral part of the coiled tubing unit, which consists of several devices that ensure the tubing can be safely and efficiently inserted into the well from the surface. Because tubing can be lowered into a well without having to make up joints of tubing, running coiled tubing into the well is faster and less expensive than running conventional tubing. Rapid advances in the use of coiled tubing make it a popular way in which to run tubing into and out of a well. Also called reeled tubing. | |
| Cuttings | Fragments of rock dislodged by the bit and brought to the surface in the drilling mud. Washed and dried cutting samples are analyzed by geologist to obtain information about the formations drilled. | |
| Directional Well | Well drilled in an orientation other than vertical in order to access broader portions of the formation. | |
| Drawworks | The hoisting mechanism on a drilling rig. It is essentially a large winch that spools off or takes in the drilling line and thus raises or lowers the drill stem and bit. | |
21
Table of Contents
| Drill Pipe Elevator (Elevator) | On conventional rotary rigs and top-drive rigs, hinged steel devices with manual operating handles that crew members latch onto a tool joint (or a sub). Since the elevators are directly connected to the traveling block, or to the integrated traveling block in the top drive, when the driller raises or lowers the block or the top-drive unit, the drill pipe is also raised or lowered. | |
| Drilling jars | A percussion tool operated manually or hydraulically to deliver a heavy downward blow to free a stuck drill stem. | |
| Drilling mud | A specially compounded liquid circulated through the wellbore during rotary drilling operations. | |
| Drilling riser | A conduit used in offshore drilling through which the drill bit and other tools are passed from the rig on the water’s surface to the sea floor. | |
| Drill stem | All members in the assembly used for rotary drilling from the swivel to the bit, including the Kelly, the drill pipe and tool joints, the drill collars, the stabilizers, and various specialty items. | |
| Fiberglass-reinforced spoolable pipe | A spoolable glass fiber-reinforced epoxy composite tubular product for onshore oil and gas gathering and injection systems, with superior corrosion resistant properties and lower installed cost than steel. | |
| Flexible pipe | A dynamic riser that connects subsea production equipment to a topside facility allowing for the flow of oil, gas, and/or water. Also used on the seafloor to tie wells and subsea equipment together. | |
| Formation | A bed or deposit composed throughout of substantially the same kind of rock; often a lithologic unit. Each formation is given a name, frequently as a result of the study of the formation outcrop at the surface and sometimes based on fossils found in the formation. | |
| FPSO | A Floating Production, Storage and Offloading vessel used to receive hydrocarbons from subsea wells, and then produce and store the hydrocarbons until they can be offloaded to a tanker or pipeline. | |
| Hardbanding | A special wear-resistant material often applied to tool joints to prevent abrasive wear to the area when the pipe is being rotated downhole. | |
| Hydraulic Fracturing | The process of creating fractures in a formation by pumping fluids, at high pressures, into the reservoir, which allows or enhances the flow of hydrocarbons. | |
| Iron Roughneck | A floor-mounted combination of a spinning wrench and a torque wrench. The Iron Roughneck moves into position hydraulically and eliminates the manual handling involved with suspended individual tools. | |
| Jack-up rig | A mobile bottom-supported offshore drilling structure with columnar or open-truss legs that support the deck and hull. When positioned over the drilling site, the bottoms of the legs penetrate the seafloor. | |
| Jar | A mechanical device placed near the top of the drill stem which allows the driller to strike a very heavy blow upward or downward on stuck pipe. | |
| Joint | 1. In drilling, a single length (from 16 feet to 45 feet, or 5 meters to 14.5 meters, depending on its range length) of drill pipe, drill collar, casing or tubing that has threaded connections at both ends. Several joints screwed together constitute a stand of pipe. 2. In pipelining, a single length (usually 40 feet-12 meters) of pipe. 3. In sucker rod pumping, a single length of sucker rod that has threaded connections at both ends. | |
| Kelly | The heavy steel tubular device, four-or six-sided, suspended from the swivel through the rotary table and connected to the top joint of drill pipe to turn the drill stem as the rotary table returns. It has a bored passageway that permits fluid to be circulated into the drill stem and up the annulus, or vice versa. Kellys manufactured to API specifications are available only in four-or six-sided versions, are either 40 or 54 feet (12 or 16 meters) long, and have diameters as small as 2.5 inches (6 centimeters) and as large as 6 inches (15 centimeters). | |
| Kelly bushing | A special device placed around the kelly that mates with the kelly flats and fits into the master bushing of the rotary table. The kelly bushing is designed so that the kelly is free to move up or down through it. The bottom of the bushing may be shaped to fit the opening in the master bushing or it may have pins that fit into the master bushing. In either case, when the kelly bushing is inserted into the master bushing and the master bushing is turned, the kelly bushing also turns. Since the kelly bushing fits onto the kelly, the kelly turns, and since the kelly is made up to the drill stem, the drill stem turns. Also called the drive bushing. | |
22
Table of Contents
| Kelly spinner | A pneumatically operated device mounted on top of the kelly that, when actuated, causes the kelly to turn or spin. It is useful when the kelly or a joint of pipe attached to it must be spun up, that is, rotated rapidly for being made up. | |
| Kick | An entry of water, gas, oil, or other formation fluid into the wellbore during drilling. It occurs because the pressure exerted by the column of drilling fluid is not great enough to overcome the pressure exerted by the fluids in the formation drilled. If prompt action is not taken to control the kick, or kill the well, a blowout may occur. | |
| Making-up | 1. To assemble and join parts to form a complete unit (e.g., to make up a string of drill pipe). 2. To screw together two threaded pieces. 3. To mix or prepare (e.g., to make up a tank of mud). 4. To compensate for (e.g., to make up for lost time). | |
| Manual tongs (Tongs) | The large wrenches used for turning when making up or breaking out drill pipe, casing, tubing, or other pipe; variously called casing tongs, pipe tongs, and so forth, according to the specific use. Power tongs or power wrenches are pneumatically or hydraulically operated tools that serve to spin the pipe up tight and, in some instances to apply the final makeup torque. | |
| Master bushing | A device that fits into the rotary table to accommodate the slips and drive the kelly bushing so that the rotating motion of the rotary table can be transmitted to the kelly. Also called rotary bushing. | |
| Mooring system | The method by which a vessel or buoy is fixed to a certain position, whether permanently or temporarily. | |
| Motion compensation equipment | Any device (such as a bumper sub or heave compensator) that serves to maintain constant weight on the bit in spite of vertical motion of a floating offshore drilling rig. | |
| Mud pump | A large, high-pressure reciprocating pump used to circulate the mud on a drilling rig. | |
| Plug gauging | The mechanical process of ensuring that the inside threads on a piece of drill pipe comply with API standards. | |
| Pressure control equipment | Equipment used in: 1. The act of preventing the entry of formation fluids into a wellbore. 2. The act of controlling high pressures encountered in a well. | |
| Pressure pumping | Pumping fluids into a well by applying pressure at the surface. | |
| Ram blowout preventer | A blowout preventer that uses rams to seal off pressure on a hole that is with or without pipe. Also called a ram preventer. | |
| Ring gauging | The mechanical process of ensuring that the outside threads on a piece of drill pipe comply with API standards. | |
| Riser | A pipe through which liquids travel upward. | |
| Riser pipe | The pipe and special fitting used on floating offshore drilling rigs to established a seal between the top of the wellbore, which is on the ocean floor, and the drilling equipment located above the surface of the water. A riser pipe serves as a guide for the drill stem from the drilling vessel to the wellhead and as a conductor or drilling fluid from the well to the vessel. The riser consists of several sections of pipe and includes special devices to compensate for any movement of the drilling rig caused by waves. Also called marine riser pipe, riser joint. | |
| Rotary table | The principal piece of equipment in the rotary table assembly; a turning device used to impart rotational power to the drill stem while permitting vertical movement of the pipe for rotary drilling. The master bushing fits inside the opening of the rotary table; it turns the kelly bushing, which permits vertical movement of the kelly while the stem is turning. | |
| Rotating blowout preventer (Rotating Head) | A sealing device used to close off the annular space around the kelly in drilling with pressure at the surface, usually installed above the main blowout preventers. A rotating head makes it possible to drill ahead even when there is pressure in the annulus that the weight of the drilling fluid is not overcoming; the head prevents the well from blowing out. It is used mainly in the drilling of formations that have low permeability. The rate of penetration through such formations is usually rapid. | |
23
Table of Contents
| Safety clamps | A clamp placed very tightly around a drill collar that is suspended in the rotary table by drill collar slips. Should the slips fail, the clamp is too large to go through the opening in the rotary table and therefore prevents the drill collar string from falling into the hole. Also called drill collar clamp. | |
| Shale shaker | A piece of drilling rig equipment that uses a vibrating screen to remove cuttings from the circulating fluid in rotary drilling operations. The size of the openings in the screen should be selected carefully to be the smallest size possible to allow 100 per cent flow of the fluid. Also called a shaker. | |
| Slim-hole completions (Slim-hole Drilling) | Drilling in which the size of the hole is smaller than the conventional hole diameter for a given depth. This decrease in hole size enables the operator to run smaller casing, thereby lessening the cost of completion. | |
| Slips | Wedge-shaped pieces of metal with serrated inserts (dies) or other gripping elements, such as serrated buttons, that suspend the drill pipe or drill collars in the master bushing of the rotary table when it is necessary to disconnect the drill stem from the kelly or from the top-drive unit’s drive shaft. Rotary slips fit around the drill pipe and wedge against the master bushing to support the pipe. Drill collar slips fit around a drill collar and wedge against the master bushing to support the drill collar. Power slips are pneumatically or hydraulically actuated devices that allow the crew to dispense with the manual handling of slips when making a connection. | |
| Solids | See “Cuttings” | |
| Spinning wrench | Air-powered or hydraulically powered wrench used to spin drill pipe in making or breaking connections. | |
| Spinning-in | The rapid turning of the drill stem when one length of pipe is being joined to another. “Spinning-out” refers to separating the pipe. | |
| Stand | The connected joints of pipe racked in the derrick or mast when making a trip. On a rig, the usual stand is about 90 feet (about 27 meters) long (three lengths of drill pipe screwed together), or a treble. | |
| Steerable Technologies | Tools that allow for steering the BHA towards a target while rotating from surface. | |
| String | The entire length of casing, tubing, sucker rods, or drill pipe run into a hole. | |
| Sucker rod | A special steel pumping rod. Several rods screwed together make up the link between the pumping unit on the surface and the pump at the bottom of the well. | |
| Tensioner | A system of devices installed on a floating offshore drilling rig to maintain a constant tension on the riser pipe, despite any vertical motion made by the rig. The guidelines must also be tensioned, so a separate tensioner system is provided for them. | |
| Thermal desorption | The process of removing drilling mud from cuttings by applying heat directly to drill cuttings. | |
| Tiebacks (Subsea) | A series of flowlines and pipes that connect numerous subsea wellheads to a single collection point. | |
| Top drive | A device similar to a power swivel that is used in place of the rotary table to turn the drill stem. It also includes power tongs. Modern top drives combine the elevator, the tongs, the swivel, and the hook. Even though the rotary table assembly is not used to rotate the drill stem and bit, the top-drive system retains it to provide a place to set the slips to suspend the drill stem when drilling stops. | |
| Torque wrench | Spinning wrench with a gauge for measuring the amount of torque being applied to the connection. | |
24
Table of Contents
| Trouble cost | Costs incurred as a result of unanticipated complications while drilling a well. These costs are often referred to as contingency costs during the planning phase of a well. | |
| Turret | Mechanical device that allows a floating vessel to rotate around stationary flowlines, umbilicals, and other associated risers. | |
| Well completion | 1. The activities and methods of preparing a well for the production of oil and gas or for other purposes, such as injection; the method by which one or more flow paths for hydrocarbons are established between the reservoir and the surface. 2. The system of tubulars, packers, and other tools installed beneath the wellhead in the production casing; that is, the tool assembly that provides the hydrocarbon flow path or paths. | |
| Wellhead | The termination point of a wellbore at surface level or subsea, often incorporating various valves and control instruments. | |
| Well stimulation | Any of several operations used to increase the production of a well, such as acidizing or fracturing. | |
| Well workover | The performance of one or more of a variety of remedial operations on a producing oil well to try to increase production. Examples of workover jobs are deepening, plugging back, pulling and resetting liners, and squeeze cementing. | |
| Wellbore | A borehole; the hole drilled by the bit. A wellbore may have casing in it or it may be open (uncased); or part of it may be cased, and part of it may be open. Also called a borehole or hole. | |
| Wireline | A slender, rodlike or threadlike piece of metal usually small in diameter, that is used for lowering special tools (such as logging sondes, perforating guns, and so forth) into the well. Also called slick line. | |
| ITEM 1B. | UNRESOLVED STAFF COMMENTS |
None.
25
Table of Contents
| ITEM 2. | PROPERTIES |
The Company owned or leased approximately 635 facilities worldwide as of December 31, 2016, including the following principal manufacturing, service, distribution and administrative facilities:
| Location |
Description |
Building Size (SqFt) |
Property Size (Acres) |
Owned / Leased |
Lease Termination Date |
|||||||||||||
| Rig Systems: |
||||||||||||||||||
| Houston, Texas |
Manufacturing Plant of Drilling Equipment | 511,964 | 33 | Leased | 4/30/2019 | |||||||||||||
| Houston, Texas |
West Little York Manufacturing Facility, Repairs, Service, Administrative & Sales Offices | 483,450 | 34 | Owned | ||||||||||||||
| Orange, California |
Manufacturing & Office Facility | 338,337 | 9 | Owned | * | 12/31/2020 | ||||||||||||
| Rig Aftermarket: |
||||||||||||||||||
| Houston, Texas |
Bammel Facility, Repairs, Service, Aftermarket Parts, Administrative & Sales Offices | 602,110 | 33 | Leased | 6/30/2028 | |||||||||||||
| New Iberia, Louisiana |
Repair, Services and Spares facility | 189,000 | 17 | Leased | 10/1/2025 | |||||||||||||
| Singapore |
Manufacturing, Repairs, Service, Field Service/Training, Administrative & Sales Offices | 133,659 | 4 | Leased | 1/5/2024 | |||||||||||||
| Dubai, UAE |
Repair & Overhaul of Drilling Equipment, Warehouse & Sales Office | 39,433 | 2 | Owned | ||||||||||||||
| Wellbore Technologies: |
||||||||||||||||||
| Navasota, Texas |
Manufacturing Facility & Administrative Offices | 562,112 | 196 | Owned | ||||||||||||||
| Conroe, Texas |
Manufacturing Facility of Drill Bits and Downhole Tools, Administrative & Sales Offices | 410,623 | 35 | Owned | ||||||||||||||
| Houston, Texas |
Sheldon Road Inspection Facility | 319,365 | 192 | Owned | ||||||||||||||
| Veracruz, Mexico |
Manufacturing Facility of Tool Joints, Warehouse & Administrative Offices | 303,400 | 42 | Owned | ||||||||||||||
| Houston, Texas |
Holmes Rd Complex: Manufacturing, Warehouse, Coating Manufacturing Plant & Corporate Office | 300,000 | 50 | Owned | ||||||||||||||
| Cedar Park, Texas |
Instrumentation Manufacturing Facility, Administrative & Sales Offices | 215,778 | 38 | Owned | ||||||||||||||
| Dubai, UAE |
Manufacturing Facility of Downhole Tools, Distribution Warehouse | 184,492 | 8 | Leased | 1/29/2021 | |||||||||||||
| Conroe, Texas |
Solids Control Manufacturing Facility, Warehouse, Administrative & Sales Offices, and Engineering Labs | 153,750 | 35 | Owned | ||||||||||||||
| Completion & Production Solutions: |
||||||||||||||||||
| Senai, Malaysia |
Manufacturing Facility of Fiber Glass Products | 595,965 | 14 | Owned | * | 10/31/2027 | ||||||||||||
| Kalundborg, Denmark |
Flexibles Manufacturing, Warehouse, Shop & Administrative Offices | 485,067 | 38 | Owned | ||||||||||||||
| Superporto du Acu, Brazil | Flexibles Manufacturing, Warehouse, Shop & Administrative Offices | 464,885 | 30 | Owned | * | 10/20/2031 | ||||||||||||
| Manchester, England |
Manufacturing, Assembly & Testing of PC Pumps and Expendable Parts, Administrative & Sales Offices | 464,000 | 28 | Owned | ||||||||||||||
| Fort Worth, Texas |
Coiled Tubing Manufacturing Facility, Warehouse, Administrative & Sales Offices | 233,173 | 24 | Owned | ||||||||||||||
| Tulsa, Oklahoma |
Manufacturing Facility of Pumps, Warehouse and Administrative & Sales Offices |
222,625 | 10 | Owned | ||||||||||||||
| Houston, Texas |
Manufacturing of fiber-reinforced tubular products & Administrative Offices | 146,668 | 6 | Leased | 8/31/2018 | |||||||||||||
| Houston, Texas |
Manufacturing of Wireline and Pressure Performance Equipment, Warehouse and Administrative Offices | 383,750 | 26 | Leased | 6/30/2041 | |||||||||||||
| Corporate: |
||||||||||||||||||
| Houston, Texas |
Corporate and Shared Administrative Offices | 337,019 | 14 | Leased | 5/31/2037 | |||||||||||||
| Houston, Texas |
Corporate and Shared Administrative Offices | 441,029 | 3 | Leased | 1/31/2041 | |||||||||||||
| * | Building owned but land leased. |
26
Table of Contents
We own or lease approximately 225 repair and manufacturing facilities that refurbish and manufacture new equipment and parts, 200 service centers that provide inspection and equipment rental and 210 engineering, sales and administration facilities.
| ITEM 3. | LEGAL PROCEEDINGS |
We have various claims, lawsuits and administrative proceedings that are pending or threatened, arising in the ordinary course of business. These include commercial disputes, product liability and employee matters. Such disputes arise in locations around the world and include proceedings in civil courts and arbitrations.
Forecasting the ultimate outcome of such matters requires a combination of judgment, experience and involves inherent uncertainties. In those instances, in which we believe that incurrence of a loss is probable and the amount can be reasonably estimated, we estimate a range of probable outcomes and record a reserve within that range, including accruals for self-insured losses which may be calculated based on historical claim data, specific loss development factors and other information. We have many product liability, premises liability and commercial claims pending against our subsidiaries. A range of total possible losses for all litigation matters cannot be reasonably estimated because of the number of uncertainties and incomplete information for individual claims. Based on a consideration of our judgment as to pertinent facts and circumstances, we do not expect the ultimate outcome of any currently pending lawsuits or claims against us will have a material adverse effect on our financial position, results of operations or cash flows. However, no assurance as to the ultimate outcome of these matters can be provided.
We insure against risks arising from our business based on market availability of insurance and our judgment concerning such risks. No assurance can be given that the amount of that insurance will be sufficient to fully indemnify us against liabilities arising out of pending or future legal proceedings or other claims. Typically, our insurance policies contain deductibles or self-insured retentions, for which we are responsible for payment. In determining whether to, and the amount of self-insurance, it is our policy to self-insure at a level that we deem appropriate considering the cost of self-insuring compared to premiums for insurance with lower deductibles or self-insured retentions.
Although no assurance can be given with respect to the outcome of these or any other pending legal and administrative proceedings and the effect such outcomes may have, we believe any ultimate liability resulting from the outcome of such claims, lawsuits or administrative proceedings will not have a material adverse effect on our consolidated financial position, results of operations or cash flows.
In the fourth quarter of 2016, one of our subsidiaries settled a product liability claim for CAD 42 million ($31 million at December 31, 2016), in Canada. The settlement is expected to be consummated in the first quarter of 2017. Our insurers paid the claim under a reservation of rights. We believe that the policies of insurance covered all settled claims and intend to vigorously contest any contrary allegation. We do not believe the outcome of this claim will have a material adverse impact on our earnings.
| ITEM 4. | MINE SAFETY DISCLOSURES |
Information regarding mine safety and other regulatory actions at our mines is included in Exhibit 95 to this Form 10-K.
27
Table of Contents
PART II
| ITEM 5. | MARKET FOR REGISTRANT’S COMMON EQUITY, RELATED STOCKHOLDER MATTERS AND ISSUER PURCHASES OF EQUITY SECURITIES |
Market Information
Our common stock is traded on the New York Stock Exchange (NYSE) under the symbol “NOV”. The following table sets forth, for the calendar periods indicated, the range of high and low closing prices for the common stock, as reported by the NYSE and the cash dividends declared per share.
| 2016 | 2015 | |||||||||||||||||||||||||||||||
| First | Second | Third | Fourth | First | Second | Third | Fourth | |||||||||||||||||||||||||
| Quarter | Quarter | Quarter | Quarter | Quarter | Quarter | Quarter | Quarter | |||||||||||||||||||||||||
| Common stock sale price: |
||||||||||||||||||||||||||||||||
| High |
$ | 34.93 | $ | 36.98 | $ | 36.86 | $ | 40.32 | $ | 66.02 | $ | 56.00 | $ | 46.95 | $ | 40.80 | ||||||||||||||||
| Low |
$ | 26.34 | $ | 27.32 | $ | 31.27 | $ | 31.43 | $ | 47.46 | $ | 47.90 | $ | 36.72 | $ | 33.27 | ||||||||||||||||
| Cash dividends per share |
$ | 0.46 | $ | 0.05 | $ | 0.05 | $ | 0.05 | $ | 0.46 | $ | 0.46 | $ | 0.46 | $ | 0.46 | ||||||||||||||||
As of February 10, 2017, there were 3,786 holders of record of our common stock. Many stockholders choose to own shares through brokerage accounts and other intermediaries rather than as holders of record (excluding individual participants in securities positions listing) so the actual number of stockholders is unknown but significantly higher.
Cash dividends aggregated $230 million and $710 million for the years ended December 31, 2016 and 2015, respectively. The declaration and payment of future dividends is at the discretion of the Company’s Board of Directors and will be dependent upon the Company’s results of operations, financial condition, capital requirements, future outlook and other factors deemed relevant by the Company’s Board of Directors.
The information relating to our equity compensation plans required by Item 5. “Market for Registrant’s Common Equity, Related Stockholder Matters and Issuer Purchases of Equity Securities” is incorporated by reference to such information as set forth in Item 12. “Security Ownership of Certain Beneficial Owners and Management and Related Stockholder Matters” contained herein.
28
Table of Contents
PERFORMANCE GRAPH
The graph below compares the cumulative total shareholder return on our common stock to the S&P 500 Index and the S&P Oil & Gas Equipment & Services Index. The total shareholder return assumes $100 invested on December 31, 2011 in National Oilwell Varco, Inc., the S&P 500 Index and the S&P Oil & Gas Equipment & Services Index. It also assumes reinvestment of all dividends. The peer group is weighted based on the market capitalization of each company. The results shown in the graph below are not necessarily indicative of future performance.
COMPARISON OF 5 YEAR CUMULATIVE TOTAL RETURN*
Among National Oilwell Varco, Inc., the S&P 500 Index
and the S&P Oil & Gas Equipment & Services Index
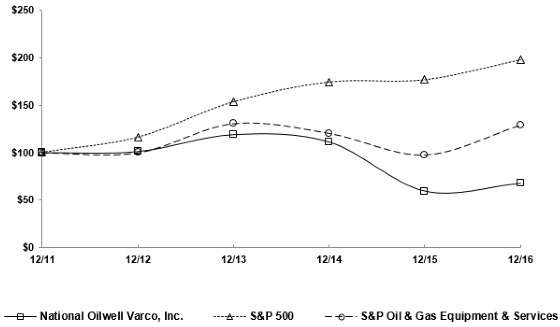
| 12/11 | 12/12 | 12/13 | 12/14 | 12/15 | 12/16 | |||||||||||||||||||
| National Oilwell Varco, Inc. |
100.00 | 101.20 | 119.19 | 111.37 | 59.39 | 67.66 | ||||||||||||||||||
| S&P 500 |
100.00 | 116.00 | 153.58 | 174.60 | 177.01 | 198.18 | ||||||||||||||||||
| S&P Oil & Gas Equipment & Services |
100.00 | 100.00 | 130.65 | 120.46 | 97.87 | 129.13 | ||||||||||||||||||
This information shall not be deemed to be ‘‘soliciting material’’ or to be ‘‘filed’’ with the Commission or subject to Regulation 14A (17 CFR 240.14a-1-240.14a-104), other than as provided in Item 201(e) of Regulation S-K, or to the liabilities of section 18 of the Exchange Act (15 U.S.C. 78r).
29
Table of Contents
| ITEM 6. | SELECTED FINANCIAL DATA |
| Years Ended December 31, | ||||||||||||||||||||
| 2016 | 2015 | 2014 | 2013 (1) | 2012 | ||||||||||||||||
| (in millions, except per share data) | ||||||||||||||||||||
| Operating Data: |
||||||||||||||||||||
| Revenue |
$ | 7,251 | $ | 14,757 | $ | 21,440 | $ | 19,221 | $ | 17,194 | ||||||||||
| Operating profit (loss) |
$ | (2,411 | ) | $ | (390 | ) | $ | 3,613 | $ | 3,199 | $ | 3,389 | ||||||||
| Income (loss) from continuing operations before income taxes |
$ | (2,623 | ) | $ | (589 | ) | $ | 3,494 | $ | 3,124 | $ | 3,340 | ||||||||
| Income (loss) from continuing operations |
$ | (2,416 | ) | $ | (767 | ) | $ | 2,455 | $ | 2,181 | $ | 2,375 | ||||||||
| Income from discontinued operations |
$ | — | $ | — | $ | 52 | $ | 147 | $ | 108 | ||||||||||
| Net income (loss) attributable to Company |
$ | (2,412 | ) | $ | (769 | ) | $ | 2,502 | $ | 2,327 | $ | 2,491 | ||||||||
| Per share data: |
||||||||||||||||||||
| Basic: |
||||||||||||||||||||
| Income (loss) from continuing operations |
$ | (6.41 | ) | $ | (1.99 | ) | $ | 5.73 | $ | 5.11 | $ | 5.61 | ||||||||
|
|
|
|
|
|
|
|
|
|
|
|||||||||||
| Income from discontinued operations |
$ | — | $ | — | $ | 0.12 | $ | 0.35 | $ | 0.25 | ||||||||||
|
|
|
|
|
|
|
|
|
|
|
|||||||||||
| Net income (loss) attributable to Company |
$ | (6.41 | ) | $ | (1.99 | ) | $ | 5.85 | $ | 5.46 | $ | 5.86 | ||||||||
|
|
|
|
|
|
|
|
|
|
|
|||||||||||
| Diluted: |
||||||||||||||||||||
| Income (loss) from continuing operations |
$ | (6.41 | ) | $ | (1.99 | ) | $ | 5.70 | $ | 5.09 | $ | 5.58 | ||||||||
|
|
|
|
|
|
|
|
|
|
|
|||||||||||
| Income from discontinued operations |
$ | — | $ | — | $ | 0.12 | $ | 0.35 | $ | 0.25 | ||||||||||
|
|
|
|
|
|
|
|
|
|
|
|||||||||||
| Net income (loss) attributable to Company |
$ | (6.41 | ) | $ | (1.99 | ) | $ | 5.82 | $ | 5.44 | $ | 5.83 | ||||||||
|
|
|
|
|
|
|
|
|
|
|
|||||||||||
| Cash dividends per share |
$ | 0.61 | $ | 1.84 | $ | 1.64 | $ | 0.91 | $ | 0.49 | ||||||||||
|
|
|
|
|
|
|
|
|
|
|
|||||||||||
| Other Data: |
||||||||||||||||||||
| Depreciation and amortization |
$ | 703 | $ | 747 | $ | 778 | $ | 738 | $ | 616 | ||||||||||
| Capital expenditures |
$ | 284 | $ | 453 | $ | 699 | $ | 614 | $ | 569 | ||||||||||
| Balance Sheet Data: |
||||||||||||||||||||
| Working capital |
$ | 4,829 | $ | 7,552 | $ | 8,788 | $ | 9,745 | $ | 10,029 | ||||||||||
| Total assets |
$ | 21,140 | $ | 26,725 | $ | 33,562 | $ | 34,812 | $ | 31,484 | ||||||||||
| Long-term debt, less current maturities |
$ | 2,708 | $ | 3,928 | $ | 3,014 | $ | 3,149 | $ | 3,148 | ||||||||||
| Total Company stockholders’ equity |
$ | 13,940 | $ | 16,383 | $ | 20,692 | $ | 22,230 | $ | 20,239 | ||||||||||
| (1) | Financial information for prior periods and dates may not be comparable due to the impact of $2.4 billion in business combinations on our financial position and results of operations during 2013. |
30
Table of Contents
| ITEM 7. | MANAGEMENT’S DISCUSSION AND ANALYSIS OF FINANCIAL CONDITION AND RESULTS OF OPERATIONS |
General Overview
The Company is a leading worldwide provider of highly engineered drilling and well-servicing equipment, products and services to the exploration and production segments of the oil and gas industry. With operations in approximately 635 locations across six continents, we design, manufacture and service a comprehensive line of drilling and well servicing equipment; sell and rent drilling motors, specialized downhole tools, and rig instrumentation; perform inspection and internal coating of oilfield tubular products; provide drill cuttings separation, management and disposal systems and services; and provide expendables and spare parts used in conjunction with our large installed base of equipment. We also manufacture coiled tubing and high pressure fiberglass and composite tubing, and sell and rent advanced in-line inspection equipment to makers of oil country tubular goods. We have a long tradition of pioneering innovations which improve the cost-effectiveness, efficiency, safety, and environmental impact of oil and gas operations.
Our revenue and operating results are directly related to the level of worldwide oil and gas drilling and production activities and the profitability and cash flow of oil and gas companies and drilling contractors, which in turn are affected by current and anticipated prices of oil and gas. Oil and gas prices have been and are likely to continue to be volatile. See Item 1A. “Risk Factors”. We conduct our operations through four business segments: Rig Systems, Rig Aftermarket, Wellbore Technologies and Completion & Production Solutions. See Item 1. “Business”, for a discussion of each of these business segments.
Unless indicated otherwise, results of operations are presented in accordance with accounting principles generally accepted in the United States (“GAAP”). Certain reclassifications have been made to the prior year financial statements in order for them to conform with the 2016 presentation. In an effort to provide investors with additional information regarding our results of operations, certain non-GAAP financial measures, including operating profit (loss) excluding other items, operating profit (loss) percentage excluding other items, and diluted earnings (loss) per share excluding other items, are provided. See Non-GAAP Financial Measures and Reconciliations in Results of Operations for an explanation of our use of non-GAAP financial measures and reconciliations to their corresponding measures calculated in accordance with GAAP.
Operating Environment Overview
Our results are dependent on, among other things, the level of worldwide oil and gas drilling, well remediation activity, the price of crude oil and natural gas, capital spending by exploration and production companies and drilling contractors, and worldwide oil and gas inventory levels. Key industry indicators for the past three years include the following:
| 2016* | 2015* | 2014* | % 2016 v 2015 |
% 2016 v 2014 |
||||||||||||||||
| Active Drilling Rigs: |
||||||||||||||||||||
| U.S. |
510 | 977 | 1,862 | (47.8 | %) | (72.6 | %) | |||||||||||||
| Canada |
128 | 194 | 380 | (34.0 | %) | (66.3 | %) | |||||||||||||
| International |
956 | 1,167 | 1,337 | (18.1 | %) | (28.5 | %) | |||||||||||||
|
|
|
|
|
|
|
|
|
|
|
|||||||||||
| Worldwide |
1,594 | 2,338 | 3,579 | (31.8 | %) | (55.5 | %) | |||||||||||||
| West Texas Intermediate Crude Prices (per barrel) |
$ | 43.15 | $ | 48.71 | $ | 93.26 | (11.4 | %) | (53.7 | %) | ||||||||||
| Natural Gas Prices ($/mmbtu) |
$ | 2.49 | $ | 2.61 | $ | 4.38 | (4.6 | %) | (43.2 | %) | ||||||||||
| * | Averages for the years indicated. See sources below. |
31
Table of Contents
The following table details the U.S., Canadian, and international rig activity and West Texas Intermediate Oil prices for the past nine quarters ended December 31, 2016 on a quarterly basis:
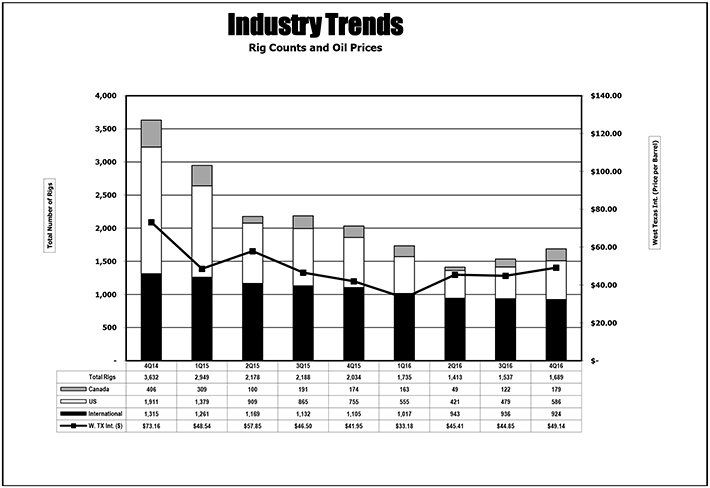
Source: Rig count: Baker Hughes, Inc. (www.bakerhughes.com); West Texas Intermediate Crude Price: Department of Energy, Energy Information Administration (www.eia.doe.gov).
The average price per barrel of West Texas Intermediate Crude was $43.15 in 2016, a decrease of 11% over the average price for 2015 of $48.71 per barrel. The average natural gas price was $2.49 per mmbtu, a decrease of 5% compared to the 2015 average of $2.61 per mmbtu. Average rig activity worldwide decreased 32% for the full year in 2016 compared to 2015. The average crude oil price for the fourth quarter of 2016 was $49.14 per barrel, and natural gas was $3.01 per mmbtu.
At February 10, 2017, there were 1,093 rigs actively drilling in North America, compared to the fourth quarter average of 765 rigs, an increase of 43%. The price for West Texas Intermediate Crude Oil was $53.86 per barrel at February 10, 2017, an increase of 10% from the fourth quarter of 2016 average. The price for natural gas was $3.03 per mmbtu at February 10, 2017, an increase of 1% from the fourth quarter of 2016 average.
32
Table of Contents
EXECUTIVE SUMMARY
National Oilwell Varco, Inc. generated revenue of $7.3 billion in 2016, a decrease of 51% from the prior year due to declining oil and gas prices resulting in reduced drilling activity and demand for oilfield equipment and services. Average 2016 worldwide rig count (as measured by Baker Hughes) decreased 32% in comparison to 2015. The broad-based decline in activity led all four of the Company’s reporting segments to post lower year-over-year revenues.
For the year ended December 31, 2016, the Company reported an operating loss of $2,411 million compared to an operating loss of $390 million in 2015, and a net loss from continuing operations of $2,412 million, or $6.41 per share compared to a net loss of $769 million or $1.99 per share during 2015. Operating loss excluding other items (as defined in the “Non-GAAP Financial Measures and Reconciliations” in Results of Operations) was $381 million in 2016 and earnings (loss) per share excluding other items was $(0.84) in 2016, a 130% decrease from $2.80 per share in 2015.
For the fourth quarter ended December 31, 2016, revenue was $1.7 billion, a $46 million or 3% increase compared to the third quarter of 2016. The Company reported a net loss of $714 million from continuing operations, or $1.90 per fully diluted share, an increase of $648 million, or $1.72 per fully diluted share. Compared to the fourth quarter of 2015, revenue decreased $1,030 million or 38%, and net income from continuing operations increased $809 million.
During the fourth quarter of 2016, third quarter of 2016, and fourth quarter of 2015, pre-tax other items (severance, facility closures, asset impairments, foreign exchange losses, write-downs, and other) were $694 million, $1,078 million and $1,773 million, respectively. Excluding the other items from all periods, fourth quarter 2016 earnings (losses) per share excluding other items were $(0.15) per fully diluted share, compared to $(0.34) per fully diluted share in the third quarter of 2016 and earnings of $0.23 per fully diluted share in the fourth quarter of 2015.
Operating profit (loss) excluding other items was $(72) million or (4.3)% of sales in the fourth quarter of 2016, compared to $(108) million or (6.6)% of sales in the third quarter of 2016, and $141 million or 5.2% of sales in the fourth quarter of 2015.
Segment Performance
Rig Systems
The Company’s Rig Systems segment generated $2.4 billion in revenue and $969 million in operating loss, or (40.6)% of revenue, during 2016. Compared to the prior year, revenue decreased 66% and operating profit dollars decreased 173%. For the fourth quarter of 2016, the segment generated $426 million in revenue and $81 million in operating loss, or (19.0)% of revenue. Compared to the prior quarter, revenue decreased $44 million or 9%, and operating loss decreased $881 million or 92%. Compared to the fourth quarter of 2015, revenue decreased $589 million or 58%, and operating profit decreased $227 million or 155%. Fourth quarter 2016 revenue out of backlog for the Rig Systems segment decreased 11% sequentially and 62% year-over-year on fewer shipments of land rigs and postponed delivery dates of some offshore projects. During the fourth quarter of 2016, the segment received $115 million in new orders, primarily composed of discreet capital equipment components including top drives, blowout preventers and offshore cranes. Year-end backlog for the segment was $2.5 billion, a 10% decline sequentially and a 59% decrease year-over-year.
Rig Aftermarket
The Company’s Rig Aftermarket segment generated $1.4 billion in revenue and $229 million in operating profit, or 16.2% of revenue, during 2016. Compared to the prior year, revenue decreased 44% and operating profit dollars decreased 65%. For the fourth quarter of 2016, the segment generated $339 million in revenue and $26 million in operating profit, or 7.7% of revenue. Compared to the prior quarter, revenue increased $17 million or 5%, and operating profit decreased $46 million or 64%. Compared to the fourth quarter of 2015, revenue decreased $230 million or 40%, and operating profit decreased $112 million or 81%. Revenue decreased year-over-year as drilling contractors reduced spending and depleted existing spares inventories rather than purchase new, and deferred repair and maintenance work on their rig fleets.
Wellbore Technologies
The Company’s Wellbore Technologies segment generated $2.2 billion in revenue and $770 million in operating loss, or (35.0)% of revenue, for the full year 2016. Compared to the prior year, revenue decreased 41% and operating loss decreased 51%. For the fourth quarter of 2016, the segment generated $531 million in revenue and $439 million in operating loss, or (82.7)% of revenue. Compared to the prior quarter, revenue increased $5 million or 1%, and operating loss increased $345 million. Compared to the fourth quarter of 2015, revenue decreased $226 million, and operating loss decreased $1,275 million. Revenue decreased due to lower levels of worldwide drilling activity, resulting in less demand for the segment’s services and product offerings. Year-over-year operating margins were impacted by lower volumes, but were more than offset by the $1,634 million impairment charge related to goodwill and a certain indefinite-lived trade name recorded in 2015 that did not repeat in 2016 and cost reduction efforts.
33
Table of Contents
Completion & Production Solutions
The Company’s Completion & Production Solutions segment generated $2.2 billion in revenue and $266 million in operating loss, or (11.9)% of revenue, for the full year 2016. Compared to the prior year, revenue decreased 33% and operating profit decreased $453 million. Year-over-year revenue decreases were attributable to reduced demand and customers delaying receipt of finished orders for onshore completion and production equipment in response to commodity price declines. For the fourth quarter of 2016, the segment generated $602 million in revenue and $134 million in operating loss, or (22.3)% of revenue. Compared to the prior quarter, revenue increased $59 million or 11%, and operating loss increased $73 million. Sequentially, operating loss increased on pricing pressures and product mix. Compared to the fourth quarter of 2015, revenue decreased $144 million and operating profit decreased $138 million as lower levels of worldwide drilling activity resulted in reduced sales across most product lines. Fourth quarter 2016 revenue out of backlog for the Completion & Production Solutions segment increased 12% sequentially and decreased 22% year-over-year. During the fourth quarter of 2016, the segment received $370 million in new orders. Year-end backlog for the segment was $818 million, an increase of 1% sequentially and a 15% decline year-over-year.
Oil & Gas Equipment and Services Market
Over the past decade, technological advancements in the oilfield equipment and service space unlocked production from formations that were previously deemed uneconomic, especially in North America. From 2004 to 2014 global oil and liquids supply increased dramatically from U.S. unconventional resources, deep-water (defined as water depths greater than 400 feet) resources and from other sources. The advances in technology combined with relatively high commodity prices caused by growing demand enabled and sustained an increase in global drilling activity. Global supply started to catch up to demand, and in the latter half of 2014, demand growth in areas such as Asia, Europe and the U.S. weakened while drilling activity remained strong and production continued to grow. As a result, global inventories of crude and refined products grew and the price of oil declined significantly during early 2015, remaining depressed throughout the year and undergoing another major reduction toward the end of 2015. In early 2016, the market witnessed oil trading in the high $20 per barrel range, prices not seen since 2003.
In response to rapidly deteriorating market conditions, operators acutely reduced both operating and capital expenditures. Orders for our equipment and services slowed and rig counts declined rapidly with active U.S. drilling rig counts hitting 70 year lows and international rig counts reaching decade lows during the second quarter of 2016. As a result of the sharp cutback in activity, production began to decline in certain areas of the world and commodity prices started to rebound as oil markets commenced the process of re-balancing. The market downturn began to stabilize during the second half of 2016 and, aided by OPEC and certain other countries announcing production cuts of 1.7 million barrels per day, showed early signs of improvement during the fourth quarter. The price of West Texas Intermediate Cushing Crude ended the year at $53.72 a barrel.
Outlook
Activity in North America increased sharply off historical lows during the last two quarters of 2016 and declines in supply, assisted by the OPEC production cuts, appear to be rebalancing the market; however, global stocks of crude oil and refined product remain bloated and challenging conditions persist. Consequently, we are cautious in our outlook for 2017, and anticipate that our customers will continue to moderate capital expenditures until a there is more certainty in a sustainable recovery in commodity prices.
While North America has exhibited the signs of a burgeoning recovery, activity levels remain well below prior cyclical highs. International activity, which has been slower to fall than North American activity, appears to be approaching a bottom, which could be achieved in the first half of 2017. Offshore activity, which has longer project cycle times and, in certain instances, more challenged economics, may continue to decline throughout 2017.
Low activity levels result in an oversupply of service capacity and capital equipment, creating challenging prospects for many of our customers in the form of reduced volumes and pricing pressures. In this environment, contractors have been hesitant to invest in their existing equipment to conserve as much capital as possible. Equipment has been neglected and idle fleets have been stripped of parts to sustain assets that remains active. Additionally, certain equipment becomes less desirable and obsolete as equipment manufacturers develop new technologies and produce more efficient equipment that improves efficiencies and lowers the marginal cost of supply for oil and gas operating companies. As a result, the industry may retire a significant portion of the installed base of capital equipment that existed at the beginning of this cyclical downturn, causing a sharp rebound in newbuild orders if commodity prices continue to recover and activity levels increase.
Our global customer base includes national oil companies, international oil companies, independent oil and gas companies, onshore and offshore service companies and others whose strategies and reactions to low commodity prices vary. Likewise, we expect the slope and timing of revenue decline, stabilization and recovery will be different across our operating regions and our four business segments. Elements of our Wellbore Technologies and Rig Aftermarket segments are expected to see a faster recovery as drilling of new wells increases, while a strong recovery for the more capital equipment oriented businesses within our Completion & Production Solutions and Rig Systems segments may come later in the cycle.
34
Table of Contents
Throughout 2017 we will continue to focus on what we can control, in the form of sizing our operations with anticipated levels of activity while continuing to invest in developing and acquiring new products, technologies and operations that advance our longer term strategic goals. The Company has a history of implementing cost-control measures and downsizing in response to depressed market conditions as well as cost effectively ramping operations to capitalize on rapidly increasing demand. The Company remains optimistic regarding longer-term market fundamentals as existing oil and gas fields continue to deplete and numerous major projects to replenish supply have been deferred or canceled while global demand continues to grow.
35
Table of Contents
Results of Operations
Years Ended December 31, 2016 and December 31, 2015
The following table summarizes the Company’s revenue and operating profit (loss) by operating segment in 2016 and 2015 (in millions):
| Years Ended December 31, | Variance | |||||||||||||||
| 2016 | 2015 | $ | % | |||||||||||||
| Revenue: |
||||||||||||||||
| Rig Systems |
$ | 2,386 | $ | 6,964 | $ | (4,578 | ) | (65.7 | %) | |||||||
| Rig Aftermarket |
1,416 | 2,515 | (1,099 | ) | (43.7 | %) | ||||||||||
| Wellbore Technologies |
2,199 | 3,718 | (1,519 | ) | (40.9 | %) | ||||||||||
| Completion & Production Solutions |
2,241 | 3,365 | (1,124 | ) | (33.4 | %) | ||||||||||
| Eliminations |
(991 | ) | (1,805 | ) | 814 | (45.1 | %) | |||||||||
|
|
|
|
|
|
|
|
|
|||||||||
| Total Revenue |
$ | 7,251 | $ | 14,757 | $ | (7,506 | ) | (50.9 | %) | |||||||
|
|
|
|
|
|
|
|
|
|||||||||
| Operating Profit (Loss): |
||||||||||||||||
| Rig Systems |
$ | (969 | ) | $ | 1,322 | $ | (2,291 | ) | (173.3 | %) | ||||||
| Rig Aftermarket |
229 | 652 | (423 | ) | (64.9 | %) | ||||||||||
| Wellbore Technologies |
(770 | ) | (1,573 | ) | 803 | (51.0 | %) | |||||||||
| Completion & Production Solutions |
(266 | ) | 187 | (453 | ) | (242.2 | %) | |||||||||
| Eliminations and corporate costs |
(635 | ) | (978 | ) | 343 | (35.1 | %) | |||||||||
|
|
|
|
|
|
|
|
|
|||||||||
| Total Operating Profit (Loss) |
$ | (2,411 | ) | $ | (390 | ) | $ | (2,021 | ) | 518.2 | % | |||||
|
|
|
|
|
|
|
|
|
|||||||||
| Operating Profit (Loss)%: |
||||||||||||||||
| Rig Systems |
(40.6 | %) | 19.0 | % | ||||||||||||
| Rig Aftermarket |
16.2 | % | 25.9 | % | ||||||||||||
| Wellbore Technologies |
(35.0 | %) | (42.3 | %) | ||||||||||||
| Completion & Production Solutions |
(11.9 | %) | 5.6 | % | ||||||||||||
| Total Operating Profit (Loss)% |
(33.3 | %) | (2.6 | %) | ||||||||||||
Rig Systems
Revenue from Rig Systems for the year ended December 31, 2016 was $2,386 million, a decrease of $4,578 million (65.7%) compared to the year ended December 31, 2015. The decrease was due to lower land rig shipments and delayed delivery dates of certain offshore projects.
Operating loss from Rig Systems was $969 million for the year ended December 31, 2016, a decrease of $2,291 million (173.3%) compared to 2015. Operating profit (loss) percentage decreased to (40.6)%, from 19.0% in 2015. Operating profit percentage decreased primarily due to lower volumes and a $972 million impairment charge incurred on the carrying value of goodwill during the third quarter of 2016.
Included in operating profit are other items related to costs associated with a Voluntary Early Retirement Plan established by the Company during the first quarters of 2016 and 2015, costs related to severance and facility closures, and asset write-downs. Other items included in operating profit for Rig Systems were $218 million for the year ended December 31, 2016 and $105 million for the year ended December 31, 2015.
The Rig Systems segment monitors its capital equipment backlog to plan its business. New orders are added to backlog only when the Company receives a firm written order for major drilling rig components or a signed contract related to a construction project. In light of the vote by the shareholders of SETE Brasil Participacoes SA to authorize Sete to file for bankruptcy, and a further decline in drilling activity during the first half of the year to record lows and the resulting effect on certain other customers, the Company removed $2.1 billion of orders from its backlog in the first quarter of 2016. Some of the contracts for these orders remain in place and are enforceable. If these customers obtain funding to continue their projects, the Company may pursue resumption of construction and update the backlog accordingly. The capital equipment backlog was $2.5 billion at December 31, 2016, a decrease of $3.6 billion, or 59%, from backlog of $6.1 billion at December 31, 2015. Numerous factors may affect the timing of revenue out of backlog. Considering these factors, the Company reasonably expects approximately $1.0 billion of revenue out of backlog in 2017 and approximately $1.5 billion of revenue out of backlog in 2018 and thereafter. At December 31, 2016, approximately 81% of the capital equipment backlog was for offshore products and approximately 82% of the capital equipment backlog was destined for international markets.
36
Table of Contents
Rig Aftermarket
Revenue from Rig Aftermarket for the year ended December 31, 2016 was $1,416 million, a decrease of $1,099 million (43.7%) compared to the year ended December 31, 2015. The decrease was due to lower global drilling activity which has caused customers to use existing inventories and components from idle and unused rigs to repair better utilized rigs rather than purchase new.
Operating profit from Rig Aftermarket was $229 million for the year ended December 31, 2016, a decrease of $423 million (64.9%) compared to 2015. Operating profit percentage decreased to 16.2%, from 25.9% in 2015. Operating profit percentage decreased primarily due to lower volumes and pricing pressure.
Included in operating profit are other items related to costs associated with a Voluntary Early Retirement Plan established by the Company during the first quarters of 2016 and 2015, costs related to severance and facility closures, and asset write-downs. Other items included in operating profit for Rig Aftermarket were $65 million for the year ended December 31, 2016 and $12 million for the year ended December 31, 2015.
Wellbore Technologies
Revenue from Wellbore Technologies for the year ended December 31, 2016 was $2,199 million, a decrease of $1,519 million (40.9%) compared to the year ended December 31, 2015. The decrease was due to lower drilling activity.
Operating loss from Wellbore Technologies was $770 million for the year ended December 31, 2016, a decrease of $803 million (51.0%) compared to the year ended December 31, 2015. Operating loss percentage decreased to 35.0% from 42.3% in 2015. Operating loss decreased due to $1,658 million in goodwill and intangible asset impairment charges, which occurred in the fourth quarter of 2015 and did not repeat in 2016, partially offset by a decrease in drilling activity.
Included in operating profit are other items related to costs associated with a Voluntary Early Retirement Plan established by the Company during the first quarters of 2016 and 2015, costs related to severance and facility closures, and asset write-downs. Other items included in operating profit for Wellbore Technologies were $476 million for the year ended December 31, 2016 and $117 million for the year ended December 31, 2015.
Completion & Production Solutions
Revenue from Completion & Production Solutions for the year ended December 31, 2016 was $2,241 million, a decrease of $1,124 million (33.4%) compared to the year ended December 31, 2015. The decrease was due to lower market activity.
Operating profit (loss) from Completion & Production Solutions was $(266) million for the year ended December 31, 2016 compared to $187 million for 2015, a decrease of $453 million (242.2%). Operating profit (loss) percentage decreased to (11.9)% from 5.6% in 2015. This decrease was due to the overall decline in market activity.
Included in operating profit are other items related to costs associated with a Voluntary Early Retirement Plan established by the Company during the first quarters of 2016 and 2015; costs related to severance and facility closures; items related to acquisitions, such as transaction costs, the amortization of backlog and inventory that was stepped up to fair value during purchase accounting; and asset write-downs. Other items included in operating profit for Completion & Production Solutions were $274 million for the year ended December 31, 2016 and $101 million for the year ended December 31, 2015.
The Completion & Productions Solutions segment monitors its capital equipment backlog to plan its business. New orders are added to backlog only when the Company receives a firm written order for major completion and production components or a signed contract related to a construction project. The capital equipment backlog was $818 million at December 31, 2016, a decrease of $151 million, or 16% from backlog of $969 million at December 31, 2015. Numerous factors may affect the timing of revenue out of backlog. Considering these factors, the Company reasonably expects approximately $770 million of revenue out of backlog in 2017 and approximately $48 million of revenue out of backlog in 2018 and thereafter. At December 31, 2016, approximately 71% of the capital equipment backlog was for offshore products and approximately 87% of the capital equipment backlog was destined for international markets.
Eliminations
Eliminations in operating profit were $635 million for the year ended December 31, 2016 compared to $978 million for the year ended December 31, 2015. This change is primarily due to lower intersegment sales. Sales from one segment to another generally are priced at estimated equivalent commercial selling prices; however, segments originating an external sale are credited with the full profit to the company. Eliminations include intercompany transactions conducted between the four reporting segments that are eliminated in consolidation. Intercompany transactions within each reporting segment are eliminated within each reporting segment.
37
Table of Contents
Other income (expense), net
Other income (expense), net were expenses of $101 million for the year ended December 31, 2016 compared to expenses of $123 million for the year ended December 31, 2015. The decrease was primarily due to lower foreign exchange losses.
Provision for income taxes
The effective tax rate for the year ended December 31, 2016 was 7.9%, compared to (30.2)% for 2015. Impairment of goodwill not deductible for tax purposes, lower tax rates on losses incurred in foreign jurisdictions, and an increase in valuation allowance on deferred taxes, which, when applied to losses generated during the period, resulted in a lower effective tax rate than the U.S. statutory rate. Included in the increase in valuation allowance is $404 million recorded against excess foreign tax credits that are not expected to be realized before expiration in the current depressed market conditions.
38
Table of Contents
Years Ended December 31, 2015 and December 31, 2014
The following table summarizes the Company’s revenue and operating profit (loss) by operating segment in 2015 and 2014 (in millions):
| Years Ended December 31, | Variance | |||||||||||||||
| 2015 | 2014 | $ | % | |||||||||||||
| Revenue: |
||||||||||||||||
| Rig Systems |
$ | 6,964 | $ | 9,848 | $ | (2,884 | ) | (29.3 | %) | |||||||
| Rig Aftermarket |
2,515 | 3,222 | (707 | ) | (21.9 | %) | ||||||||||
| Wellbore Technologies |
3,718 | 5,722 | (2,004 | ) | (35.0 | %) | ||||||||||
| Completion & Production Solutions |
3,365 | 4,645 | (1,280 | ) | (27.6 | %) | ||||||||||
| Eliminations |
(1,805 | ) | (1,997 | ) | 192 | (9.6 | %) | |||||||||
|
|
|
|
|
|
|
|
|
|||||||||
| Total Revenue |
$ | 14,757 | $ | 21,440 | $ | (6,683 | ) | (31.2 | %) | |||||||
|
|
|
|
|
|
|
|
|
|||||||||
| Operating Profit (Loss): |
||||||||||||||||
| Rig Systems |
$ | 1,322 | $ | 2,118 | $ | (796 | ) | (37.6 | %) | |||||||
| Rig Aftermarket |
652 | 935 | (283 | ) | (30.3 | %) | ||||||||||
| Wellbore Technologies |
(1,573 | ) | 1,000 | (2,573 | ) | (257.3 | %) | |||||||||
| Completion & Production Solutions |
187 | 730 | (543 | ) | (74.4 | %) | ||||||||||
| Eliminations and corporate costs |
(978 | ) | (1,170 | ) | 192 | (16.4 | %) | |||||||||
|
|
|
|
|
|
|
|
|
|||||||||
| Total Operating Profit (Loss) |
$ | (390 | ) | $ | 3,613 | $ | (4,003 | ) | (110.8 | %) | ||||||
|
|
|
|
|
|
|
|
|
|||||||||
| Operating Profit (Loss)%: |
||||||||||||||||
| Rig Systems |
19.0 | % | 21.5 | % | ||||||||||||
| Rig Aftermarket |
25.9 | % | 29.0 | % | ||||||||||||
| Wellbore Technologies |
(42.3 | %) | 17.5 | % | ||||||||||||
| Completion & Production Solutions |
5.6 | % | 15.7 | % | ||||||||||||
| Total Operating Profit (Loss)% |
(2.6 | %) | 16.9 | % | ||||||||||||
Rig Systems
Revenue from Rig Systems for the year ended December 31, 2015 was $6,964 million, a decrease of $2,884 million (29.3%) compared to the year ended December 31, 2014. The decrease was due to lower land rig shipments and delayed delivery dates of certain offshore projects.
Operating profit from Rig Systems was $1,322 million for the year ended December 31, 2015, a decrease of $796 million (37.6%) compared to 2014. Operating profit percentage decreased to 19.0%, from 21.5% in 2014. Operating profit percentage decreased primarily due to lower volumes. Despite the strong fall off in revenue, strategic cost management efforts significantly reduced the decline in operating profit percentage.
Included in operating profit are other items related to costs associated with a Voluntary Early Retirement Plan established by the Company during the first quarter of 2015 and costs related to severance and facility closures. Other items included in operating profit for Rig Systems were $105 million for the year ended December 31, 2015 and nil for the year ended December 31, 2014.
The Rig Systems segment monitors its capital equipment backlog to plan its business. New orders are added to backlog only when the Company receives a firm written order for major drilling rig components or a signed contract related to a construction project. The capital equipment backlog was $6.1 billion at December 31, 2015, a decrease of $6.4 billion, or 52%, from backlog of $12.5 billion at December 31, 2014. At December 31, 2015, approximately 90% of the capital equipment backlog was for offshore products and approximately 93% of the capital equipment backlog was destined for international markets.
Rig Aftermarket
Revenue from Rig Aftermarket for the year ended December 31, 2015 was $2,515 million, a decrease of $707 million (21.9%) compared to the year ended December 31, 2014. The decrease was due to lower global drilling activity which has caused customers to use existing inventories and components from idle and unused rigs to repair better utilized rigs rather than purchase new.
Operating profit from Rig Aftermarket was $652 million for the year ended December 31, 2015, a decrease of $283 million (30.3%) compared to 2014. Operating profit percentage decreased to 25.9%, from 29.0% in 2014. Operating profit percentage decreased primarily due to lower volumes and pricing pressure.
39
Table of Contents
Included in operating profit are other items related to costs associated with a Voluntary Early Retirement Plan established by the Company during the first quarter of 2015 and costs related to severance and facility closures. Other items included in operating profit for Rig Aftermarket were $12 million for the year ended December 31, 2015 and nil for the year ended December 31, 2014.
Wellbore Technologies
Revenue from Wellbore Technologies for the year ended December 31, 2015 was $3,718 million, a decrease of $2,004 million (35.0%) compared to the year ended December 31, 2014. The decrease was due to lower drilling activity.
Operating loss from Wellbore Technologies was $1,573 million for the year ended December 31, 2015 compared to operating profit of $1,000 million for 2014, a decrease of $2,573 million (257.3%). Operating profit percentage decreased to negative 42.3% from 17.5% in 2014. Operating profit decreased mainly due to a $1,658 million impairment charge incurred on the carrying value of goodwill in the segment’s Drilling & Intervention and Drill Pipe business units as well as a certain indefinite-lived trade name associated with this segment in the fourth quarter of 2015, as well as the overall decrease in drilling activity.
Included in operating profit are other items related to costs associated with a Voluntary Early Retirement Plan established by the Company during the first quarter of 2015 and costs related to severance and facility closures. Other items included in operating profit for Wellbore Technologies were $117 million for the year ended December 31, 2015 and $6 million for the year ended December 31, 2014.
Completion & Production Solutions
Revenue from Completion & Production Solutions for the year ended December 31, 2015 was $3,365 million, a decrease of $1,280 million (27.6%) compared to the year ended December 31, 2014. The decrease was due lower market activity.
Operating profit from Completion & Production Solutions was $187 million for the year ended December 31, 2015 compared to $730 million for 2014, a decrease of $543 million (74.4%). Operating profit percentage decreased to 5.6% from 15.7% in 2014. This decrease was due to the overall decrease in market activity as well as $24 million in impairment charges incurred on intangible assets.
Included in operating profit are other items related to costs associated with a Voluntary Early Retirement Plan established by the Company during the first quarter of 2015; costs related to severance and facility closures; items related to acquisitions, such as transaction costs, the amortization of backlog and inventory that was stepped up to fair value during purchase accounting. Other items included in operating profit for Completion & Production Solutions were $101 million for the year ended December 31, 2015 and $10 million for the year ended December 31, 2014.
The Completion & Productions Solutions segment monitors its capital equipment backlog to plan its business. New orders are added to backlog only when the Company receives a firm written order for major completion and production components or a signed contract related to a construction project. The capital equipment backlog was $969 million at December 31, 2015, a decrease of $810 million, or 46% from backlog of $1,780 million at December 31, 2014. At December 31, 2015, approximately 75% of the capital equipment backlog was for offshore products and approximately 87% of the capital equipment backlog was destined for international markets.
Eliminations
Eliminations in operating profit were $978 million for the year ended December 31, 2015 compared to $1,170 million for the year ended December 31, 2014. This change is primarily due to lower intersegment sales. Sales from one segment to another generally are priced at estimated equivalent commercial selling prices; however, segments originating an external sale are credited with the full profit to the company. Eliminations include intercompany transactions conducted between the four reporting segments that are eliminated in consolidation. Intercompany transactions within each reporting segment are eliminated within each reporting segment.
Other income (expense), net
Other income (expense), net were expenses of $123 million for the year ended December 31, 2015 compared to expenses of $90 million for the year ended December 31, 2014. The increase was primarily due to higher foreign exchange losses.
Provision for income taxes
The effective tax rate for the year ended December 31, 2015 was (30.2)%, compared to 29.7% for 2014. Compared to the U.S. statutory rate, the effective tax rate was positively impacted in the period by a domestic loss, the effect of lower tax rates on income earned in foreign jurisdictions, a reduction of deferred taxes due to decreases in statutory tax rates of foreign jurisdictions, and foreign exchange losses for tax reporting in Norway. The effective tax rate was negatively impacted by additional U.S. tax on foreign dividends net of foreign tax credits, the recognition and settlement of an uncertain tax position in a foreign jurisdiction, and nondeductible expenses. The nondeductible expenses primarily consist of non-deductible goodwill impaired during the year ended December 31, 2015.
40
Table of Contents
Non-GAAP Financial Measures and Reconciliations
In an effort to provide investors with additional information regarding our results as determined by GAAP, we disclose various non-GAAP financial measures in our quarterly earnings press releases and other public disclosures. The primary non-GAAP financial measures we focus on herein are: (i) operating profit (loss) excluding other items, (ii) operating profit (loss) percentage excluding other items, and (iii) diluted earnings (loss) per share excluding other items. Each of these financial measures excludes the impact of certain amounts as further identified below and has not been calculated in accordance with GAAP. A reconciliation of each of these non-GAAP financial measures to its most comparable GAAP financial measure is included below.
We use these non-GAAP financial measures internally to evaluate and manage the Company’s operations because we believe it provides useful supplemental information regarding the Company’s on-going economic performance. We have chosen to provide this information to investors to enable them to perform more meaningful comparisons of operating results, and as a means to emphasize the results of on-going operations.
The following tables set forth the reconciliations of these non-GAAP financial measures to their most comparable GAAP financial measures (in millions, except per share data):
| Three Months Ended | Years Ended December 31, | |||||||||||||||||||||||
| December 31, | September 30, | |||||||||||||||||||||||
| 2016 | 2015 | 2016 | 2016 | 2015 | 2014 | |||||||||||||||||||
| Reconciliation of operating profit (loss): |
||||||||||||||||||||||||
| GAAP operating profit (loss) |
$ | (766 | ) | $ | (1,632 | ) | $ | (1,186 | ) | $ | (2,411 | ) | $ | (390 | ) | $ | 3,613 | |||||||
| Goodwill and other intangible asset write-downs (1): |
||||||||||||||||||||||||
| Rig Systems |
— | — | 972 | 972 | 7 | — | ||||||||||||||||||
| Wellbore Technologies |
— | 1,634 | — | — | 1,658 | 104 | ||||||||||||||||||
| Completion & Production Solutions |
— | — | — | — | 24 | — | ||||||||||||||||||
| Other (2): |
||||||||||||||||||||||||
| Rig Systems |
121 | 47 | 22 | 218 | 105 | — | ||||||||||||||||||
| Rig Aftermarket |
49 | 1 | 3 | 65 | 12 | — | ||||||||||||||||||
| Wellbore Technologies |
364 | 58 | 24 | 476 | 117 | 6 | ||||||||||||||||||
| Completion & Production Solutions |
151 | 33 | 51 | 274 | 101 | 10 | ||||||||||||||||||
| Eliminations and corporate costs |
9 | — | 6 | 25 | — | 36 | ||||||||||||||||||
|
|
|
|
|
|
|
|
|
|
|
|
|
|||||||||||||
| Operating profit (loss) excluding other items |
$ | (72 | ) | $ | 141 | $ | (108 | ) | $ | (381 | ) | $ | 1,634 | $ | 3,769 | |||||||||
|
|
|
|
|
|
|
|
|
|
|
|
|
|||||||||||||
| Three Months Ended | Years Ended December 31, | |||||||||||||||||||||||
| December 31, | September 30, | |||||||||||||||||||||||
| 2016 | 2015 | 2016 | 2016 | 2015 | 2014 | |||||||||||||||||||
| Reconciliation of operating profit (loss)%: |
||||||||||||||||||||||||
| GAAP operating profit (loss)% |
(45.3 | %) | (60.0 | %) | (72.1 | %) | (33.3 | %) | (2.6 | %) | 16.9 | % | ||||||||||||
| Asset write-downs and other items (1) (2)% |
41.0 | % | 65.2 | % | 65.5 | % | 28.0 | % | 13.7 | % | 0.7 | % | ||||||||||||
|
|
|
|
|
|
|
|
|
|
|
|
|
|||||||||||||
| Operating profit (loss)% excluding other items |
(4.3 | %) | 5.2 | % | (6.6 | %) | (5.3 | %) | 11.1 | % | 17.6 | % | ||||||||||||
|
|
|
|
|
|
|
|
|
|
|
|
|
|||||||||||||
| Three Months Ended | Years Ended December 31, | |||||||||||||||||||||||
| December 31, | September 30, | |||||||||||||||||||||||
| 2016 | 2015 | 2016 | 2016 | 2015 | 2014 | |||||||||||||||||||
| Reconciliation of diluted earnings (loss) per share: |
||||||||||||||||||||||||
| GAAP earnings (loss) per share (continuing operations) |
$ | (1.90 | ) | $ | (4.06 | ) | $ | (3.62 | ) | $ | (6.41 | ) | $ | (1.99 | ) | $ | 5.70 | |||||||
| Goodwill and other intangible asset write-downs (1) |
— | 4.21 | 2.51 | 2.51 | 4.18 | 0.13 | ||||||||||||||||||
| Other (2) |
1.26 | 0.25 | 0.18 | 1.93 | 0.57 | 0.24 | ||||||||||||||||||
| Fixed asset write-downs (Other income (expense), net) |
0.02 | — | 0.02 | 0.10 | — | — | ||||||||||||||||||
| Argentina/Venezuela asset write-down (Other income (expense), net) |
— | 0.01 | — | — | 0.04 | — | ||||||||||||||||||
| Tax items (Provision for income taxes) |
0.47 | (0.18 | ) | 0.57 | 1.03 | — | — | |||||||||||||||||
|
|
|
|
|
|
|
|
|
|
|
|
|
|||||||||||||
| Earnings (loss) per share excluding other items |
$ | (0.15 | ) | $ | 0.23 | $ | (0.34 | ) | $ | (0.84 | ) | $ | 2.80 | $ | 6.07 | |||||||||
|
|
|
|
|
|
|
|
|
|
|
|
|
|||||||||||||
| (1) | Included in operating profit (loss) are other items related to goodwill and intangible asset impairments. |
| (2) | Included in operating profit (loss) are other items related to costs associated with a Voluntary Early Retirement Plan established by the Company during the first quarters of 2016 and 2015; costs related to severance and facility closures; items related to acquisitions, such as transaction costs and the amortization of backlog; the costs of the spin-off of the Company’s distribution business and certain legal costs. Other items that are included in other income (expense), net were $12 million and $54 million for the three months and year ended December 31, 2016, respectively; nil for each of the three months and for the year ended December 31, 2015, respectively; and $10 million for the three months ended September, 2016. |
41
Table of Contents
Liquidity and Capital Resources
The Company assesses liquidity in terms of its ability to generate cash to fund operating, investing and financing activities. The Company remains in a strong financial position, with resources available to reinvest in existing businesses, strategic acquisitions and capital expenditures to meet short- and long-term objectives. The Company believes that cash on hand, cash generated from expected results of operations and amounts available under its revolving credit facility will be sufficient to fund operations, anticipated working capital needs and other cash requirements including capital expenditures, debt and interest payments and dividend payments for the foreseeable future.
At December 31, 2016, the Company had cash and cash equivalents of $1,408 million, and total debt of $3,214 million. At December 31, 2015, cash and cash equivalents were $2,080 million and total debt was $3,909 million. As of December 31, 2016, approximately $1,157 million of the $1,408 million of cash and cash equivalents was held by our foreign subsidiaries, of which $1,126 million would be subject to a 35% U.S. income tax rate, offset by any available foreign tax credits if repatriated. However, our current plans are to permanently reinvest these funds outside of the U.S. If opportunities to invest in the U.S. are greater than available cash balances that are not subject to income tax, rather than repatriating cash, the Company may choose to borrow against its revolving credit facility or utilize its commercial paper program.
The Company’s outstanding debt at December 31, 2016 was $3,214 million and consisted of $499 million in 1.35% Senior Notes, $1,391 million in 2.60% Senior Notes, $1,087 million in 3.95% Senior Notes, no commercial paper borrowings, and other debt of $237 million. The Company was in compliance with all covenants at December 31, 2016.
At December 31, 2016, there were no commercial paper borrowings supported by the $4.5 billion credit facility and no outstanding letters of credit issued under the credit facility, resulting in $4,500 million of funds available under this revolving credit facility.
The Company had $1,196 million of outstanding letters of credit at December 31, 2016 that are under various bilateral letter of credit facilities. Letters of credit are issued as bid bonds, advanced payment bonds and performance bonds. The following table summarizes our net cash provided by continuing operating activities, net cash used in continuing investing activities and net cash used in continuing financing activities for the periods presented (in millions):
| Years Ended December 31, | ||||||||||||
| 2016 | 2015 | 2014 | ||||||||||
| Net cash provided by continuing operating activities |
$ | 960 | $ | 1,332 | $ | 2,525 | ||||||
| Net cash used in continuing investing activities |
(488 | ) | (514 | ) | (1,092 | ) | ||||||
| Net cash used in continuing financing activities |
(1,141 | ) | (2,163 | ) | (1,343 | ) | ||||||
Operating Activities
2016 vs 2015. Net cash provided by continuing operating activities was $960 million in 2016 compared to net cash provided by continuing operating activities of $1,332 million in 2015. Before changes in operating assets and liabilities, net of acquisitions, cash was used by continuing operations primarily through loss from continuing operations of $2,416 million plus non-cash charges of $2,305 million, $6 million in a dividend received from Voest-Alpine Tubulars, an unconsolidated affiliate, and $21 million in equity loss in unconsolidated affiliates.
Net changes in operating assets and liabilities, net of acquisitions, provided $1,044 million of cash in 2016 compared to $466 million used in the same period in 2015. The decrease in cash used in 2016 compared to the same period in 2015 was primarily due to declines in accounts receivable, inventory and costs in excess of billings, partially offset by declines in accounts payable, accrued liabilities and billings in excess of costs.
2015 vs 2014. Net cash provided by continuing operating activities was $1,332 million in 2015 compared to net cash provided by continuing operating activities of $2,525 million in 2014. Before changes in operating assets and liabilities, net of acquisitions, cash was provided by continuing operations primarily through loss from continuing operations of $767 million plus non-cash charges of $2,544 million, plus $34 million in a dividend received from Voest-Alpine Tubulars, an unconsolidated affiliate, less $13 million in equity income.
Net changes in operating assets and liabilities, net of acquisitions, used $466 million of cash in 2015 compared to $794 million used in the same period in 2014. The decrease in cash used in 2015 compared to the same period in 2014 was the result of a decline in accounts receivable and inventory; partially offset by a decline in accounts payable and decreased orders in the Rig Systems segment which is reflected in customer financing, where revenue recognized outpaced prepayments and milestone invoicing on major projects.
42
Table of Contents
Investing Activities
2016 vs 2015. Net cash used in continuing investing activities was $488 million in 2016 compared to net cash used in continuing investing activities of $514 million in 2015. Net cash used in continuing investing activities was primarily the result of decreased capital expenditures in 2016 compared to 2015, offset by an increase in cash used for acquisitions. The Company used $284 million during 2016 for capital expenditures compared to $453 million in 2015 and $230 million for acquisitions during 2016, compared to $86 million in 2015.
2015 vs 2014. Net cash used in continuing investing activities was $514 million in 2014 compared to net cash used in continuing investing activities of $1,092 million in 2014. Net cash used in continuing investing activities was primarily the result of capital expenditures and acquisition activity both of which decreased in 2015 compared to 2014. The Company used $453 million during 2015 for capital expenditures compared to $699 million in 2014 and $86 million for acquisitions during 2015, compared to $291 million in 2014.
Financing Activities
2016 vs 2015. Net cash used in continuing financing activities was $1,141 million in 2016 compared to $2,163 million in 2015. This decrease was primarily the result of $900 million used to make payments on net commercial paper borrowings in 2016 compared to $762 million of net commercial paper borrowings in 2015 used to purchase $2,221 million (44.0 million shares) of the Company’s outstanding common shares. In addition, the Company decreased its dividend to $230 million during 2016 compared to $710 million in 2015.
2015 vs 2014. Net cash used in continuing financing activities was $2,163 million in 2015 compared to $1,343 million in 2014. This increase was primarily the result of $2,221 million used to repurchase and retire 44.0 million of the Company’s common shares outstanding during 2015. In order to fund a large portion of the share repurchases, the Company entered into net commercial paper borrowings of $893 million during 2015. The Company repaid $151 million of Senior Notes in the third quarter of 2015. In addition, the Company increased its dividend to $710 million during 2015 compared to $703 million in 2014.
Other
The effect of the change in exchange rates on cash was a decrease of $3 million, $111 million and $67 million for the years ended December 31, 2016, 2015 and 2014, respectively.
We believe that cash on hand, cash generated from operations and amounts available under our credit facilities and from other sources of debt will be sufficient to fund operations, working capital needs, capital expenditure requirements, dividends and financing obligations.
We intend to pursue additional acquisition candidates, but the timing, size or success of any acquisition effort and the related potential capital commitments cannot be predicted. We continue to expect to fund future cash acquisitions primarily with cash flow from operations and borrowings, including the unborrowed portion of the revolving credit facility or new debt issuances, but may also issue additional equity either directly or in connection with acquisitions. There can be no assurance that additional financing for acquisitions will be available at terms acceptable to us.
A summary of the Company’s outstanding contractual obligations at December 31, 2016 is as follows (in millions):
| Payment Due by Period | ||||||||||||||||||||
| Less | ||||||||||||||||||||
| Total | than 1 Year |
1-3 Years |
4-5 Years |
After 5 Years |
||||||||||||||||
| Contractual Obligations: |
||||||||||||||||||||
| Total debt |
$ | 3,214 | $ | 506 | $ | 7 | $ | 10 | $ | 2,691 | ||||||||||
| Operating leases |
866 | 150 | 201 | 144 | 371 | |||||||||||||||
|
|
|
|
|
|
|
|
|
|
|
|||||||||||
| Total Contractual Obligations |
$ | 4,080 | $ | 656 | $ | 208 | $ | 154 | $ | 3,062 | ||||||||||
|
|
|
|
|
|
|
|
|
|
|
|||||||||||
| Commercial Commitments: |
||||||||||||||||||||
| Standby letters of credit |
$ | 1,196 | $ | 687 | $ | 353 | $ | 55 | $ | 101 | ||||||||||
|
|
|
|
|
|
|
|
|
|
|
|||||||||||
43
Table of Contents
As of December 31, 2016, the Company had $78 million of unrecognized tax benefits. This represents the tax benefits associated with various tax positions taken, or expected to be taken, on domestic and international tax returns that have not been recognized in our financial statements due to uncertainty regarding their resolution. Due to the uncertainty of the timing of future cash flows associated with these unrecognized tax benefits, we are unable to make reasonably reliable estimates of the period of cash settlement, if any, with the respective taxing authorities. Accordingly, unrecognized tax benefits have been excluded from the contractual obligations table above. For further information related to unrecognized tax benefits, see Note 14 to the Consolidated Financial Statements.
44
Table of Contents
Critical Accounting Policies and Estimates
In preparing the financial statements, we make assumptions, estimates and judgments that affect the amounts reported. We periodically evaluate our estimates and judgments that are most critical in nature which are related to revenue recognition under long-term construction contracts; allowance for doubtful accounts; inventory reserves; impairments of long-lived assets (excluding goodwill and other indefinite-lived intangible assets); impairment of goodwill and other indefinite-lived intangible assets; purchase price allocation of acquisitions; service and product warranties and income taxes. Our estimates are based on historical experience and on our future expectations that we believe are reasonable. The combination of these factors forms the basis for making judgments about the carrying values of assets and liabilities that are not readily apparent from other sources. Actual results are likely to differ from our current estimates and those differences may be material.
Revenue Recognition under Long-term Construction Contracts
The Company uses the percentage-of-completion method to account for certain long-term construction contracts in the Rig Systems and Completion & Production Solutions segments. These long-term construction contracts include the following characteristics:
| • | the contracts include custom designs for customer specific applications; |
| • | the structural design is unique and requires significant engineering efforts; and |
| • | construction projects often have progress payments. |
This method requires the Company to make estimates regarding the total costs of the project, progress against the project schedule and the estimated completion date, all of which impact the amount of revenue and gross margin the Company recognizes in each reporting period. The Company prepares detailed cost to complete estimates at the beginning of each project, taking into account all factors considered likely to affect gross margin. Significant projects and their related costs and profit margins are updated and reviewed at least quarterly by senior management. Factors that may affect future project costs and margins include shipyard access, weather, production efficiencies, availability and costs of labor, materials and subcomponents and other factors as mentioned in “Risk Factors.” These factors can significantly impact the accuracy of the Company’s estimates and materially impact the Company’s future reported earnings.
Historically, the Company’s estimates have been reasonably dependable regarding the recognition of revenues and gross profits on percentage-of-completion contracts. For the years ended December 31, 2016 and 2015, the difference between the prior year estimated margin on open contracts and actual results achieved in the years indicated was a net increase to gross profit margins of 0.75% ($103 million on $13.7 billion of outstanding contracts) and 0.53% ($92 million on $17.3 billion of outstanding contracts), respectively. While the Company believes that its estimates on outstanding contracts at and in future periods will continue to be reasonably dependable under percentage-of-completion accounting, the factors identified in the preceding paragraph could result in significant adjustments in future periods. The Company has recorded revenue on outstanding contracts (on a contract-to-date basis) of $15 billion at December 31, 2016.
Allowance for Doubtful Accounts
The determination of the collectability of amounts due from customer accounts requires the Company to make judgments regarding future events and trends. Allowances for doubtful accounts are determined based on a continuous process of assessing the Company’s portfolio on an individual customer basis taking into account current market conditions and trends. This process consists of a thorough review of historical collection experience, current aging status of the customer accounts, and financial condition of the Company’s customers. Based on a review of these factors, the Company will establish or adjust allowances for specific customers. A substantial portion of the Company’s revenue come from international oil companies, international shipyards, international oilfield service companies, and government-owned or government-controlled oil companies. Therefore, the Company has significant receivables in many foreign jurisdictions. If worldwide oil and gas drilling activity or changes in economic conditions in foreign jurisdictions deteriorate, the creditworthiness of the Company’s customers could also deteriorate and they may be unable to pay these receivables, and additional allowances could be required. At December 31, 2016 and 2015, allowance for bad debts totaled $209 million and $159 million, or 9.1% and 5.2% of gross accounts receivable, respectively.
Historically, the Company’s charge-offs and provisions for the allowance for doubtful accounts have been immaterial to the Company’s consolidated financial statements. However, because of the risk factors mentioned above, changes in estimates could become material in future periods.
45
Table of Contents
Inventory Reserves
Inventory is carried at the lower of cost or estimated net realizable value. The Company determines reserves for inventory based on historical usage of inventory on-hand, assumptions about future demand and market conditions, and estimates about potential alternative uses, which are limited. The Company’s inventory consists of spare parts, work in process, and raw materials to support ongoing manufacturing operations and the Company’s large installed base of highly specialized oilfield equipment. The Company’s estimated carrying value of inventory depends upon demand largely driven by levels of oil and gas well drilling and remediation activity, which depends in turn upon oil and gas prices, the general outlook for economic growth worldwide, available financing for the Company’s customers, political stability and governmental regulation in major oil and gas producing areas, and the potential obsolescence of various types of equipment we sell, among other factors.
The Company evaluates inventory quarterly using the best information available at the time to inform our assumptions and estimates about future demand and resulting sales volumes, and recognizes reserves as necessary to properly state inventory. The historically severe oil-industry downturn that started in mid-2014 began to stabilize during the second half of 2016, and showed early signs of improvement in many areas in the fourth quarter. These signs of improvement, including conversations with customers about their plans for 2017 as well as inquiries and orders for products, provided the Company information with which to assess and adjust assumptions about future demand and market conditions. We saw clear evidence that a market recovery will favor newer technology and the most efficient equipment, and that certain products across our portfolio, for both land and offshore environments, were less likely to be successful going forward as our customers find footing in their newly competitive landscape.
Based on an update of our assumptions related to estimates of future demand, during the fourth quarter we recorded a charge for additions to inventory reserves of approximately $582 million, consisting primarily of obsolete and surplus inventories. At December 31, 2016 and 2015, inventory reserves totaled $1,017 million and $500 million, or 23.4% and 9.7% of gross inventory, respectively.
Throughout the downturn the Company has continued to invest in developing and advancing products and technologies, contributing to the obsolescence of certain older products in a dramatically-shifted and more highly competitive recovering market, but also ensuring that the portfolio of products and services offered by the company will meet customer needs in 2017 and beyond.
We will continue to assess our inventory levels and inventory offerings for our customers, which could require the Company to record additional allowances to reduce the value of its inventory. Such changes in our estimates or assumptions could be material under weaker market conditions or outlook.
Impairment of Long-Lived Assets (Excluding Goodwill and Other Indefinite-Lived Intangible Assets)
Long-lived assets, which include property, plant and equipment and identified intangible assets, comprise a significant amount of the Company’s total assets. The Company makes judgments and estimates in conjunction with the carrying value of these assets, including amounts to be capitalized, depreciation and amortization methods and estimated useful lives.
The carrying values of these assets are reviewed for impairment whenever events or changes in circumstances indicate that the carrying amounts may not be recoverable. An impairment loss is recorded in the period in which it is determined that the carrying amount is not recoverable based on estimated future undiscounted cash flows. We estimate the fair value of these intangible and fixed assets using an income approach. This requires the Company to make long-term forecasts of its future revenues and costs related to the assets subject to review. These forecasts require assumptions about demand for the Company’s products and services, future market conditions and technological developments. The forecasts are dependent upon assumptions regarding oil and gas prices, the general outlook for economic growth worldwide, available financing for the Company’s customers, political stability in major oil and gas producing areas, and the potential obsolescence of various types of equipment we sell, among other factors. The financial and credit market volatility directly impacts our fair value measurement through our income forecast. Changes to these assumptions, including, but not limited to: sustained declines in worldwide rig counts below current analysts’ forecasts, collapse of spot and futures prices for oil and gas, significant deterioration of external financing for our customers, higher risk premiums or higher cost of equity, or any other significant adverse economic news could require a provision for impairment in a future period.
Goodwill and Other Indefinite-Lived Intangible Assets
The Company has approximately $6.1 billion of goodwill and $0.4 billion of other intangible assets with indefinite lives as of December 31, 2016. Generally accepted accounting principles require the Company to test goodwill and other indefinite-lived intangible assets for impairment at least annually or more frequently whenever events or circumstances occur indicating that goodwill or other indefinite-lived intangible assets might be impaired. Events or circumstances which could indicate a potential impairment include (but are not limited to) a significant sustained reduction in worldwide oil and gas prices or drilling; a significant sustained reduction in profitability or cash flow of oil and gas companies or drilling contractors; a sustained reduction in the market capitalization of the Company; a significant sustained reduction in capital investment by drilling companies and oil and gas companies; or a significant sustained increase in worldwide inventories of oil or gas.
46
Table of Contents
The discounted cash flow is based on management’s forecast of operating performance for each reporting unit. The two main assumptions used in measuring goodwill impairment, which bear the risk of change and could impact the Company’s goodwill impairment analysis, include the cash flow from operations from each of the Company’s individual reporting units and the weighted average cost of capital. The starting point for each of the reporting unit’s cash flow from operations is the detailed annual plan or updated forecast. Cash flows beyond the specific operating plans were estimated using a terminal value calculation, which incorporated historical and forecasted financial cyclical trends for each reporting unit and considered long-term earnings growth rates. The financial and credit market volatility directly impacts our fair value measurement through our weighted average cost of capital that we use to determine our discount rate. During times of volatility, significant judgment must be applied to determine whether credit changes are a short-term or long-term trend.
While the Company primarily uses the discounted cash flow method to assess fair value, the Company uses the comparable companies and representative transaction methods to validate the discounted cash flow analysis and further support management’s expectations, where possible. The valuation techniques used in the annual test were consistent with those used during previous testing. The inputs used in the annual test were updated for current market conditions and forecasts.
During the review of its 2014 annual impairment test, the calculated fair values for all of the Company’s reporting units were in excess of the respective reporting unit’s carrying value. Also, the fair value for all of the Company’s intangible assets with indefinite lives were in excess of the respective asset carrying values, with two exceptions. These intangible assets, which represent indefinite-lived trade names within the Company’s Wellbore Technologies segment, had a calculated fair value approximately $104 million below carrying value. The impairment charge was primarily the result of the substantial decline in oil prices during the fourth quarter of 2014, declines in forecasts in rig activity for 2015, and a decline in the revenue forecast for the segment for 2015.
During the review of its 2015 annual goodwill impairment test, the calculated fair values for all of the Company’s reporting units were in excess of the respective reporting unit’s carrying value, with two exceptions. The Drilling & Intervention and Drill Pipe reporting units within the Company’s Wellbore Technologies segment, had calculated fair values below carrying value, resulting in a $1,485 million write-down in goodwill. Additionally, based on the Company’s indefinite-lived intangible asset impairment analysis performed during the fourth quarter of 2015, the fair value for all of the Company’s intangible assets with indefinite lives were in excess of the respective asset carrying values, with one exception. This intangible asset, which represents a trade name within the Company’s Wellbore Technologies segment, had a calculated fair value approximately $149 million below its carrying value. Impairment charges in the fourth quarter of 2015 were primarily the result of the substantial decline in worldwide rig counts through the fourth quarter of 2015, declines in forecasts in rig activity, and a decline in the revenue forecast for the Company for 2016.
The steep worldwide oil and gas industry downturn that started in 2014 stabilized somewhat during the third quarter of 2016, though at very low levels of activity. Operators have improved their cost structures and achieved operational efficiencies, reducing the industry’s marginal cost of supply, primarily in the North American land market. While some improvements in offshore operations have been made, many deepwater projects will not be able to achieve an economically competitive cost structure under the current commodity pricing outlook. As a result, the market shift from offshore drilling to land drilling in North America intensified. Announced cancellations of major offshore projects during the quarter, releases of contracted offshore rigs, the number of idle offshore rigs and the number of current newbuilds still to be completed and enter the market all indicate a large over-supply of offshore equipment that will take years to absorb, even as offshore drilling activity recovers. During the third quarter of 2016, these factors indicated a more prolonged downturn associated with newbuild offshore drilling rigs, and we reduced our forecast accordingly, which indicated a goodwill impairment in the Rig Offshore reporting unit was possible.
Generally Accepted Accounting Principles require the Company test goodwill and other indefinite-lived intangible assets for impairment at least annually or more frequently whenever events or circumstances occur indicating that those assets might be impaired. Based on the Company’s step one interim goodwill impairment analysis as of July 1, 2016, the Rig Offshore reporting unit had a calculated fair value below its carrying value, and required a step two analysis, which compares the implied fair value of goodwill of a reporting unit to the carrying value of goodwill for the reporting unit. The implied fair value of goodwill is determined by deducting the fair value of a reporting unit’s identifiable assets and liabilities from the fair value of that reporting unit as a whole. Consistent with the step one analysis, fair value of the assets and liabilities was determined in accordance with ASC Topic 820. Based on the step two analysis performed for the Rig Offshore reporting unit, the Company recorded a $972 million write-down of goodwill during the third quarter of 2016.
During the fourth quarter of 2016, the Company performed its annual impairment test, as described in ASC Topic No. 350, “Intangibles – Goodwill and Other” (“ASC Topic 350”), as of October 1, 2016. Based on the Company’s annual impairment test, the calculated fair values for all of the Company’s reporting units were substantially in excess of the respective reporting unit’s carrying value. Additionally, the fair value for all of the Company’s intangible assets with indefinite lives were substantially in excess of the respective asset carrying values.
Based on its analysis, the Company did not report any impairment of goodwill and other indefinite-lived intangible assets, other than those mentioned above, for the years ended December 31, 2016, 2015 and 2014.
47
Table of Contents
Purchase Price Allocation of Acquisitions
The Company allocates the purchase price of an acquired business to its identifiable assets and liabilities based on estimated fair values. The excess of the purchase price over the amount allocated to the assets and liabilities, if any, is recorded as goodwill. The Company uses all available information to estimate fair values including quoted market prices, the carrying value of acquired assets, and widely accepted valuation techniques such as discounted cash flows. The Company engages third-party appraisal firms to assist in fair value determination of inventories, identifiable intangible assets, and any other significant assets or liabilities when appropriate. The judgments made in determining the estimated fair value assigned to each class of assets acquired and liabilities assumed, as well as asset lives, could materially impact the Company’s results of operations.
Service and Product Warranties
The Company provides service and warranty policies on certain of its products. The Company accrues liabilities under service and warranty policies based upon specific claims and a review of historical warranty and service claim experience in accordance with ASC Topic 450 “Contingencies” (“ASC Topic 450”). Adjustments are made to accruals as claim data and historical experience change. In addition, the Company incurs discretionary costs to service its products in connection with product performance issues and recognizes them when they are incurred. At December 31, 2016 and 2015, service and product warranty accruals totaled $172 million and $244 million, respectively.
Income Taxes
The Company is U.S. registered and is subject to income taxes in the U.S. The Company operates through various subsidiaries in a number of countries throughout the world. Income taxes have been recorded based upon the tax laws and rates of the countries in which the Company operates and income is earned.
The Company’s annual tax provision is based on taxable income, statutory rates and tax planning opportunities available in the various jurisdictions in which it operates. The determination and evaluation of the annual tax provision and tax positions involves the interpretation of the tax laws in the various jurisdictions in which the Company operates. It requires significant judgment and the use of estimates and assumptions regarding significant future events such as the amount, timing and character of income, deductions and tax credits. Changes in tax laws, regulations, and treaties, foreign currency exchange restrictions or the Company’s level of operations or profitability in each jurisdiction could impact the tax liability in any given year. The Company also operates in many jurisdictions where the tax laws relating to the pricing of transactions between related parties are open to interpretation, which could potentially result in aggressive tax authorities asserting additional tax liabilities with no offsetting tax recovery in other countries.
The Company maintains liabilities for estimated tax exposures in jurisdictions of operation. The annual tax provision includes the impact of income tax provisions and benefits for changes to liabilities that the Company considers appropriate, as well as related interest. Tax exposure items primarily include potential challenges to intercompany pricing and certain operating expenses that may not be deductible in foreign jurisdictions. These exposures are resolved primarily through the settlement of audits within these tax jurisdictions or by judicial means. The Company is subject to audits by federal, state and foreign jurisdictions which may result in proposed assessments. The Company believes that an appropriate liability has been established for estimated exposures under the guidance in ASC Topic 740 “Income Taxes” (“ASC Topic 740”). However, actual results may differ materially from these estimates. The Company reviews these liabilities quarterly and to the extent audits or other events result in an adjustment to the liability accrued for a prior year, the effect will be recognized in the period of the event.
The Company currently has recorded valuation allowances that the Company intends to maintain until it is more likely than not the deferred tax assets will be realized. Income tax expense recorded in the future will be reduced to the extent of decreases in the Company’s valuation allowances. The realization of remaining deferred tax assets is primarily dependent on future taxable income. Any reduction in future taxable income including but not limited to any future restructuring activities may require that the Company record an additional valuation allowance against deferred tax assets. An increase in the valuation allowance would result in additional income tax expense in such period and could have a significant impact on future earnings.
The Company has not provided for deferred taxes on the unremitted earnings of certain subsidiaries that are permanently reinvested. Should the Company make a distribution from the unremitted earnings of these subsidiaries, the Company may be required to record additional taxes. Unremitted earnings of these subsidiaries were $5,673 million at December 31, 2016. The Company makes a determination each period whether to permanently reinvest these earnings. If, as a result of these reassessments, the Company distributes these earnings in the future, additional tax liabilities would result, offset by any available foreign tax credits.
48
Table of Contents
Recently Adopted Accounting Standards
In November 2015, the FASB issued Accounting Standard Update No. 2015-17 “Balance Sheet Classification of Deferred Taxes” (ASU 2015-17). This update requires companies to classify all deferred tax assets and liabilities as non-current on its consolidated financial position. The Company has early adopted ASU 2015-17 on a retrospective basis, resulting in a reclassification of current deferred tax assets and liabilities to non-current deferred tax assets and liabilities. The Company adopted this update on January 1, 2016, and prior periods have been retrospectively adjusted. See Note 8 to the Consolidated Financial Statements for further information on the presentation of deferred taxes.
In April 2015, the FASB issued Accounting Standard Update No. 2015-03 “Simplifying the Presentation of Debt Issuance Costs” (ASU 2015-03) to simplify the presentation of debt issuance costs. This update requires that debt issuance costs related to a recognized debt liability be presented in the balance sheet as a direct deduction from the carrying amount of that debt liability, consistent with debt discounts, as opposed to historical presentation as an asset on the balance sheet. ASU No. 2015-03 is effective for fiscal years beginning after December 15, 2015, and for interim periods within those fiscal years. The Company adopted this update on January 1, 2016, and has applied the change retrospectively to prior periods for unamortized debt issuance costs. See Note 7 to the Consolidated Financial Statements for further information on the presentation of debt issuance costs.
In August 2014, the FASB issued Accounting Standard Update No. 2014-15 “Disclosure of Uncertainties about an Entity’s Ability to Continue as a Going Concern” (ASU No. 2014-15), which amends FASB Accounting Standards Codification 205 “Presentation of Financial Statements.” This update requires management to assess an entity’s ability to continue as a going concern by incorporating and expanding upon certain principles that are currently in U.S. auditing standards. ASU No. 2014-15 is effective for the annual period ending after December 15, 2016, and for annual periods and interim periods thereafter. The Company adopted ASU No. 2014-15 as of December 31, 2016.
Recently Issued Accounting Standards
In August 2016, the FASB issued Accounting Standard Update No. 2016-15 “Classification of Certain Cash Receipts and Cash Payments” (ASU 2016-15). This update amends Accounting Standard Codification Topic No. 230 “Statement of Cash Flows” and provides guidance and clarification on presentation of certain cash flow issues. ASU No. 2016-15 is effective for fiscal years beginning after December 15, 2017, and for interim periods within those fiscal years. The Company is currently assessing the impact of the adoption of ASU No. 2016-15 on its consolidated financial position and results of operations.
In March 2016, the FASB issued Accounting Standard Update No. 2016-09 “Improvements to Employee Share-Based Payment Accounting” (ASU 2016-09). This update requires that entities record all of the tax effects related to share-based payments at settlement (or expiration) through the income statement. ASU No. 2016-09 is effective for fiscal years beginning after December 15, 2016, and for interim periods within those fiscal years. The Company will adopt ASU No. 2016-09 on January 1, 2017.
In March 2016, the FASB issued ASC Topic 842, “Leases” (ASC Topic 842), which supersedes the lease requirements in ASC Topic No. 840 “Leases” and most industry-specific guidance. This update increases transparency and comparability among organizations by recognizing lease assets and lease liabilities on the balance sheet and disclosing key information about leasing arrangements. ASC Topic 842 is effective for fiscal years beginning after December 15, 2018, and for interim periods within those fiscal years.
In preparing for the adoption of this new standard, the Company has established an internal team to centralize the implementation process as well as engaged external resources to assist in our approach. We are currently utilizing a software program to consolidate and accumulate our existing leases with documentation as required by the new standard. We have assessed the changes to the Company’s current accounting practices and are currently investigating the related tax impact and process changes. We are also in process of quantifying the impact of the new standard on our balance sheet.
In May 2014, the FASB issued Accounting Standard Update No. 2014-09, “Revenue from Contracts with Customers” (ASU 2014-09), which outlines a single comprehensive model for entities to use in accounting for revenue. This ASU supersedes the revenue recognition requirements in FASB ASC Topic 605, “Revenue Recognition,” and most industry-specific guidance. This ASU sets forth a five-step model for determining when and how revenue is recognized. Under the model, an entity will be required to recognize revenue to depict the transfer of goods or services to a customer at an amount reflecting the consideration it expects to receive in exchange for those goods or services.
In 2015, the FASB issued guidance to defer the effective date to fiscal years beginning after December 15, 2017 with optional early adoption for fiscal periods beginning after December 15, 2016. The Company does not plan to early adopt ASU 2014-09.
The standard permits either a full retrospective adoption, in which the standard is applied to all the periods presented, or a modified retrospective adoption, in which the standard is applied only to the current period with a cumulative-effect adjustment reflected in retained earnings. The Company currently anticipates following the modified retrospective adoption, but will not make a final decision on the adoption method until later in 2017.
49
Table of Contents
In 2015, the Company assembled an internal team to study the provisions of ASU 2014-09, began assessing the potential impacts on the Company and educating the organization. In 2016, the Company engaged external resources to complete the assessment of potential changes to current accounting practices related to material revenue streams. Potential impacts were identified based on required changes to current processes to accommodate provisions in the new standard. During 2017, we will quantify the potential impacts as well as design and implement required process, system, control and data requirements to address the impacts identified in the assessments.
The Company has not quantified and is not currently able to reasonably estimate the effect of the potential timing or other impacts to revenue recognition caused by the new standard, nor the amount of contract assets and liabilities which will be added to our balance sheet.
Forward–Looking Statements
Some of the information in this document contains, or has incorporated by reference, forward-looking statements. Statements that are not historical facts, including statements about our beliefs and expectations, are forward-looking statements. Forward-looking statements typically are identified by use of terms such as “may,” “will,” “expect,” “anticipate,” “estimate,” and similar words, although some forward-looking statements are expressed differently. All statements herein regarding expected merger synergies are forward looking statements. You should be aware that our actual results could differ materially from results anticipated in the forward-looking statements due to a number of factors, including but not limited to changes in oil and gas prices, customer demand for our products and worldwide economic activity. You should also consider carefully the statements under “Risk Factors” which address additional factors that could cause our actual results to differ from those set forth in the forward-looking statements. Given these uncertainties, current or prospective investors are cautioned not to place undue reliance on any such forward-looking statements. We undertake no obligation to update any such factors or forward-looking statements to reflect future events or developments.
50
Table of Contents
| ITEM 7A. | QUANTITATIVE AND QUALITATIVE DISCLOSURES ABOUT MARKET RISK |
We are exposed to changes in foreign currency exchange rates and interest rates. Additional information concerning each of these matters follows:
Foreign Currency Exchange Rates
We have extensive operations in foreign countries. The net assets and liabilities of these operations are exposed to changes in foreign currency exchange rates, although such fluctuations generally do not affect income since their functional currency is typically the local currency. These operations also have net assets and liabilities not denominated in the functional currency, which exposes us to changes in foreign currency exchange rates that impact income. During the years ended December 31, 2016, 2015 and 2014, the Company reported foreign currency gains (losses) of ($10) million, $(47) million and $20 million, respectively. Gains and losses are primarily due to exchange rate fluctuations related to monetary asset balances denominated in currencies other than the functional currency and adjustments to our hedged positions as a result of changes in foreign currency exchange rates. Strengthening of currencies against the U.S. dollar may create losses in future periods to the extent we maintain net assets and liabilities not denominated in the functional currency of our subsidiaries using the local currency as their functional currency.
Some of our revenues in foreign countries are denominated in U.S. dollars, and therefore, changes in foreign currency exchange rates impact our earnings to the extent that costs associated with those U.S. dollar revenues are denominated in the local currency. Similarly some of our revenues are denominated in foreign currencies, but have associated U.S. dollar costs, which also give rise to foreign currency exchange rate exposure. In order to mitigate that risk, we may utilize foreign currency forward contracts to better match the currency of our revenues and associated costs. We do not use foreign currency forward contracts for trading or speculative purposes.
The following table details the Company’s foreign currency exchange risk grouped by functional currency and their expected maturity periods as of December 31, 2016 (in millions except for rates):
| December 31, 2016 | December 31, | |||||||||||||||||||||||||
| Functional Currency |
2017 | 2018 | 2019 | 2020 | Total | 2015 | ||||||||||||||||||||
| CAD |
Buy USD/Sell CAD: |
|||||||||||||||||||||||||
| Notional amount to buy (in Canadian dollars) |
— | 40 | 35 | — | 75 | 10 | ||||||||||||||||||||
| Average USD to CAD contract rate |
— | 1.3286 | 1.3242 | — | 1.3265 | 1.3759 | ||||||||||||||||||||
| Fair Value at December 31, 2016 in U.S. dollars |
— | — | — | — | — | — | ||||||||||||||||||||
| Sell USD/Buy CAD: |
||||||||||||||||||||||||||
| Notional amount to sell (in Canadian dollars) |
95 | — | 24 | 141 | 260 | 136 | ||||||||||||||||||||
| Average USD to CAD contract rate |
1.3068 | — | 1.3167 | 1.3147 | 1.3120 | 1.3554 | ||||||||||||||||||||
| Fair Value at December 31, 2016 in U.S. dollars |
(2 | ) | — | — | (2 | ) | (2 | ) | ||||||||||||||||||
| EUR |
Buy USD/Sell EUR: |
|||||||||||||||||||||||||
| Notional amount to buy (in Euros) |
3 | — | — | — | 3 | 11 | ||||||||||||||||||||
| Average USD to EUR contract rate |
0.9309 | — | — | — | 0.9309 | 0.8528 | ||||||||||||||||||||
| Fair Value at December 31, 2016 in U.S. dollars |
— | — | — | — | — | 1 | ||||||||||||||||||||
| Sell USD/Buy EUR: |
||||||||||||||||||||||||||
| Notional amount to buy (in Euros) |
104 | — | — | — | 104 | 199 | ||||||||||||||||||||
| Average USD to EUR contract rate |
0.9206 | — | — | — | 0.9206 | 0.8953 | ||||||||||||||||||||
| Fair Value at December 31, 2016 in U.S. dollars |
(3 | ) | — | — | — | (3 | ) | (5 | ) | |||||||||||||||||
| Sell ZAR/Buy EUR: |
||||||||||||||||||||||||||
| Notional amount to buy (in Euros) |
8 | — | — | — | 8 | — | ||||||||||||||||||||
| Average USD to EUR contract rate |
0.0555 | — | — | — | 0.0555 | — | ||||||||||||||||||||
| Fair Value at December 31, 2016 in U.S. dollars |
(2 | ) | — | — | — | (2 | ) | — | ||||||||||||||||||
| KRW |
Sell USD/Buy KRW: |
|||||||||||||||||||||||||
| Notional amount to buy (in South Korean won) |
40,674 | — | — | — | 40,674 | 23,613 | ||||||||||||||||||||
| Average USD to KRW contract rate |
1,162 | — | — | — | 1,162 | 1,181 | ||||||||||||||||||||
| Fair Value at December 31, 2016 in U.S. dollars |
(1 | ) | — | — | — | (1 | ) | — | ||||||||||||||||||
| GBP |
Buy USD/Sell GBP: |
|||||||||||||||||||||||||
| Notional amount to buy (in British Pounds Sterling) |
1 | — | — | — | 1 | 2 | ||||||||||||||||||||
| Average USD to GBP contract rate |
0.8028 | — | — | — | 0.8028 | 0.6416 | ||||||||||||||||||||
| Fair Value at December 31, 2016 in U.S. dollars |
— | — | — | — | — | — | ||||||||||||||||||||
| Sell USD/Buy GBP: |
||||||||||||||||||||||||||
| Notional amount to buy (in British Pounds Sterling) |
169 | — | — | — | 169 | 170 | ||||||||||||||||||||
| Average USD to GBP contract rate |
0.7844 | — | — | — | 0.7844 | 0.6613 | ||||||||||||||||||||
| Fair Value at December 31, 2016 in U.S. dollars |
(6 | ) | — | — | — | (6 | ) | (5 | ) | |||||||||||||||||
| Sell EUR/Buy GBP: |
||||||||||||||||||||||||||
| Notional amount to buy (in British Pounds Sterling) |
1 | — | — | — | 1 | — | ||||||||||||||||||||
| Average USD to GBP contract rate |
0.8604 | — | — | — | 0.8604 | — | ||||||||||||||||||||
| Fair Value at December 31, 2016 in U.S. dollars |
— | — | — | — | — | — | ||||||||||||||||||||
51
Table of Contents
| December 31, 2016 | December 31, | |||||||||||||||||||||||||
| Functional Currency |
2017 | 2018 | 2019 | 2020 | Total | 2015 | ||||||||||||||||||||
| USD | Buy CAD/Sell USD: |
|||||||||||||||||||||||||
| Notional amount to buy (in U.S. dollars) |
1 | — | — | — | 1 | 7 | ||||||||||||||||||||
| Average CAD to USD contract rate |
0.7559 | — | — | — | 0.7559 | 0.7635 | ||||||||||||||||||||
| Fair Value at December 31, 2016 in U.S. dollars |
— | — | — | — | — | — | ||||||||||||||||||||
| Buy DKK/Sell USD: |
||||||||||||||||||||||||||
| Notional amount to buy (in U.S. dollars) |
10 | — | — | — | 10 | 24 | ||||||||||||||||||||
| Average DKK to USD contract rate |
0.1509 | — | — | — | 0.1509 | 0.1553 | ||||||||||||||||||||
| Fair Value at December 31, 2016 in U.S. dollars |
(1 | ) | — | — | — | (1 | ) | (1 | ) | |||||||||||||||||
| Buy EUR/Sell USD: |
||||||||||||||||||||||||||
| Notional amount to buy (in U.S. dollars) |
81 | — | — | — | 81 | 278 | ||||||||||||||||||||
| Average EUR to USD contract rate |
1.1114 | — | — | — | 1.1114 | 1.1925 | ||||||||||||||||||||
| Fair Value at December 31, 2016 in U.S. dollars |
(4 | ) | — | — | — | (4 | ) | (23 | ) | |||||||||||||||||
| Buy GBP/Sell USD: |
||||||||||||||||||||||||||
| Notional amount to buy (in U.S. dollars) |
3 | — | — | — | 3 | 20 | ||||||||||||||||||||
| Average GBP to USD contract rate |
1.2516 | — | — | — | 1.2516 | 1.5568 | ||||||||||||||||||||
| Fair Value at December 31, 2016 in U.S. dollars |
— | — | — | — | — | (1 | ) | |||||||||||||||||||
| Buy NOK/Sell USD: |
||||||||||||||||||||||||||
| Notional amount to buy (in U.S. dollars) |
618 | 119 | — | — | 737 | 1,501 | ||||||||||||||||||||
| Average NOK to USD contract rate |
0.1232 | 0.1228 | — | — | 0.1231 | 0.1353 | ||||||||||||||||||||
| Fair Value at December 31, 2016 in U.S. dollars |
(35 | ) | (6 | ) | — | — | (41 | ) | (239 | ) | ||||||||||||||||
| Buy SGD/Sell USD: |
||||||||||||||||||||||||||
| Notional amount to buy (in U.S. dollars) |
5 | — | — | — | 5 | 12 | ||||||||||||||||||||
| Average SGD to USD contract rate |
0.7262 | — | — | — | 0.7262 | 0.7534 | ||||||||||||||||||||
| Fair Value at December 31, 2016 in U.S. dollars |
— | — | — | — | — | (1 | ) | |||||||||||||||||||
| Sell DKK/Buy USD: |
||||||||||||||||||||||||||
| Notional amount to buy (in U.S. dollars) |
2 | — | — | — | 2 | 8 | ||||||||||||||||||||
| Average DKK to USD contract rate |
0.1481 | — | — | — | 0.1481 | 0.1510 | ||||||||||||||||||||
| Fair Value at December 31, 2016 in U.S. dollars |
— | — | — | — | — | — | ||||||||||||||||||||
| Sell EUR/Buy USD: |
||||||||||||||||||||||||||
| Notional amount to sell (in U.S. dollars) |
29 | — | — | — | 29 | 89 | ||||||||||||||||||||
| Average EUR to USD contract rate |
1.1059 | — | — | — | 1.1059 | 1.1075 | ||||||||||||||||||||
| Fair Value at December 31, 2016 in U.S. dollars |
1 | — | — | — | 1 | 1 | ||||||||||||||||||||
| Sell GBP/Buy USD: |
||||||||||||||||||||||||||
| Notional amount to sell (in U.S. dollars) |
1 | — | — | — | 1 | 3 | ||||||||||||||||||||
| Average GBP to USD contract rate |
1.2549 | — | — | — | 1.2549 | 1.4961 | ||||||||||||||||||||
| Fair Value at December 31, 2016 in U.S. dollars |
— | — | — | — | — | — | ||||||||||||||||||||
| Sell NOK/Buy USD: |
||||||||||||||||||||||||||
| Notional amount to sell (in U.S. dollars) |
21 | — | — | — | 21 | 110 | ||||||||||||||||||||
| Average NOK to USD contract rate |
0.1183 | — | — | — | 0.1183 | 0.1321 | ||||||||||||||||||||
| Fair Value at December 31, 2016 in U.S. dollars |
— | — | — | — | — | 15 | ||||||||||||||||||||
| Sell RUB/Buy USD: |
||||||||||||||||||||||||||
| Notional amount to sell (in U.S. dollars) |
30 | — | — | — | 30 | 30 | ||||||||||||||||||||
| Average RUB to USD contract rate |
0.0158 | — | — | — | 0.0158 | 0.0139 | ||||||||||||||||||||
| Fair Value at December 31, 2016 in U.S. dollars |
— | — | — | — | — | 1 | ||||||||||||||||||||
| Sell SGD/Buy USD: |
||||||||||||||||||||||||||
| Notional amount to sell (in U.S. dollars) |
2 | — | — | — | 2 | 2 | ||||||||||||||||||||
| Average SGD to USD contract rate |
0.7006 | — | — | — | 0.7006 | 0.7082 | ||||||||||||||||||||
| Fair Value at December 31, 2016 in U.S. dollars |
— | — | — | — | — | — | ||||||||||||||||||||
| BRL | Buy EUR/Sell BRL: |
|||||||||||||||||||||||||
| Notional amount to sell (in Brazilian Real) |
326 | — | — | — | 326 | 199 | ||||||||||||||||||||
| Average EUR to BRL contract rate |
4.1974 | — | — | — | 4.1974 | 4.3679 | ||||||||||||||||||||
| Fair Value at December 31, 2016 in U.S. dollars |
(13 | ) | — | — | — | (13 | ) | 1 | ||||||||||||||||||
| Buy USD/Sell BRL: |
||||||||||||||||||||||||||
| Notional amount to sell (in Brazilian Real) |
27 | — | — | — | 27 | — | ||||||||||||||||||||
| Average EUR to BRL contract rate |
4.0278 | — | — | — | 4.0278 | — | ||||||||||||||||||||
| Fair Value at December 31, 2016 in U.S. dollars |
(1 | ) | — | — | — | (1 | ) | — | ||||||||||||||||||
| Sell EUR/Buy BRL: |
||||||||||||||||||||||||||
| Notional amount to sell (in Brazilian Real) |
1,440 | — | — | — | 1,440 | 427 | ||||||||||||||||||||
| Average EUR to BRL contract rate |
4.2950 | — | — | — | 4.2950 | 4.6985 | ||||||||||||||||||||
| Fair Value at December 31, 2016 in U.S. dollars |
59 | — | — | — | 59 | 4 | ||||||||||||||||||||
| Sell USD/Buy BRL: |
||||||||||||||||||||||||||
| Notional amount to sell (in Brazilian Real) |
23 | — | — | — | 23 | — | ||||||||||||||||||||
| Average EUR to BRL contract rate |
3.6378 | — | — | — | 3.6378 | — | ||||||||||||||||||||
| Fair Value at December 31, 2016 in U.S. dollars |
— | — | — | — | — | — | ||||||||||||||||||||
52
Table of Contents
| December 31, 2016 | December 31, | |||||||||||||||||||||||||
| Functional Currency |
2017 | 2018 | 2019 | 2020 | Total | 2015 | ||||||||||||||||||||
| DKK | Buy USD/Sell DKK: |
|||||||||||||||||||||||||
| Notional amount to buy (in Danish Krone) |
22 | — | — | — | 22 | — | ||||||||||||||||||||
| Average DKK to USD contract rate |
7.1140 | — | — | — | 7.1140 | — | ||||||||||||||||||||
| Fair Value at December 31, 2016 in U.S. dollars |
— | — | — | — | — | — | ||||||||||||||||||||
| Sell USD/Buy DKK: |
||||||||||||||||||||||||||
| Notional amount to buy (in Danish Krone) |
855 | — | — | — | 855 | 1,396 | ||||||||||||||||||||
| Average DKK to USD contract rate |
6.9660 | — | — | — | 6.9660 | 6.5618 | ||||||||||||||||||||
| Fair Value at December 31, 2016 in U.S. dollars |
(1 | ) | — | — | — | (1 | ) | (8 | ) | |||||||||||||||||
| NOK | Buy EUR/Sell NOK: |
|||||||||||||||||||||||||
| Notional amount to sell (in Norwegian Kroner) |
225 | 6 | — | — | 231 | — | ||||||||||||||||||||
| Average EUR to BRL contract rate |
9.1849 | 9.2781 | — | — | 9.1872 | — | ||||||||||||||||||||
| Fair Value at December 31, 2016 in U.S. dollars |
— | — | — | — | — | — | ||||||||||||||||||||
| Buy GBP/Sell NOK: |
||||||||||||||||||||||||||
| Notional amount to sell (in Norwegian Kroner) |
2 | — | — | — | 2 | — | ||||||||||||||||||||
| Average EUR to BRL contract rate |
10.7029 | — | — | — | 10.7029 | — | ||||||||||||||||||||
| Fair Value at December 31, 2016 in U.S. dollars |
— | — | — | — | — | — | ||||||||||||||||||||
| Buy USD/Sell NOK: |
||||||||||||||||||||||||||
| Notional amount to sell (in Norwegian Kroner) |
21 | — | — | — | 21 | — | ||||||||||||||||||||
| Average EUR to BRL contract rate |
8.7062 | — | — | — | 8.7062 | — | ||||||||||||||||||||
| Fair Value at December 31, 2016 in U.S. dollars |
— | — | — | — | — | — | ||||||||||||||||||||
| Buy JPY/Sell NOK: |
||||||||||||||||||||||||||
| Notional amount to sell (in Norwegian Kroner) |
58 | — | — | — | 58 | — | ||||||||||||||||||||
| Average EUR to BRL contract rate |
0.0748 | — | — | — | 0.0748 | — | ||||||||||||||||||||
| Fair Value at December 31, 2016 in U.S. dollars |
— | — | — | — | — | — | ||||||||||||||||||||
| Sell EUR/Buy NOK: |
||||||||||||||||||||||||||
| Notional amount to sell (in Norwegian Kroner) |
106 | 14 | — | — | 120 | — | ||||||||||||||||||||
| Average EUR to BRL contract rate |
9.2059 | 9.2781 | — | — | 9.2144 | — | ||||||||||||||||||||
| Fair Value at December 31, 2016 in U.S. dollars |
— | — | — | — | — | — | ||||||||||||||||||||
| Sell USD/Buy NOK: |
||||||||||||||||||||||||||
| Notional amount to sell (in Norwegian Kroner) |
125 | 1 | — | — | 126 | — | ||||||||||||||||||||
| Average EUR to BRL contract rate |
8.7033 | 8.6642 | — | — | 8.7030 | — | ||||||||||||||||||||
| Fair Value at December 31, 2016 in U.S. dollars |
— | — | — | — | — | — | ||||||||||||||||||||
| Sell JPY/Buy NOK: |
||||||||||||||||||||||||||
| Notional amount to sell (in Norwegian Kroner) |
45 | 6 | — | — | 51 | — | ||||||||||||||||||||
| Average EUR to BRL contract rate |
0.0749 | 0.0758 | — | — | 0.0750 | — | ||||||||||||||||||||
| Fair Value at December 31, 2016 in U.S. dollars |
— | — | — | — | — | — | ||||||||||||||||||||
| Other Currencies | ||||||||||||||||||||||||||
| Fair Value at December 31, 2016 in U.S. dollars |
— | — | — | — | — | 2 | ||||||||||||||||||||
|
|
|
|
|
|
|
|
|
|
|
|
|
|||||||||||||||
| Total Fair Value at December 31, 2016 in U.S. dollars |
(9 | ) | (6 | ) | — | — | (15 | ) | (260 | ) | ||||||||||||||||
|
|
|
|
|
|
|
|
|
|
|
|
|
|||||||||||||||
The Company had other financial market risk sensitive instruments denominated in foreign currencies for transactional exposures totaling $58 million and translation exposures totaling $240 million as of December 31, 2016, excluding trade receivables and payables, which approximate fair value. These market risk sensitive instruments consisted of cash balances and overdraft facilities. The Company estimates that a hypothetical 10% movement of all applicable foreign currency exchange rates on the transactional exposures financial market risk sensitive instruments could affect net income by $4 million and the translational exposures financial market risk sensitive instruments could affect the future fair value by $24 million.
The counterparties to forward contracts are major financial institutions. The credit ratings and concentration of risk of these financial institutions are monitored on a continuing basis. In the event that the counterparties fail to meet the terms of a foreign currency contract, our exposure is limited to the foreign currency rate differential.
Historically, the Venezuelan government has devalued the country’s currency. During the first quarter of 2015, the Venezuelan government officially devalued the Venezuelan bolivar against the U.S. dollar. As a result, the Company incurred approximately $9 million in devaluation charges in the first quarter of 2015. The reporting currency of all of the Company’s Venezuelan entities is the U.S. dollar. The Company’s remaining net investment in Venezuela, which is largely U.S. dollar, was nil at December 31, 2016.
During the fourth quarter of 2015, the Argentinian government officially devalued the Argentine peso against the U.S. dollar. As a result, the Company incurred approximately $7 million of devaluation charges in the fourth quarter of 2015. The reporting currency of all of the Company’s Argentinian entities is the Argentine peso.
53
Table of Contents
Interest Rate Risk
At December 31, 2016, long term borrowings consisted of $499 million in 1.35% Senior Notes, $1,391 million in 2.60% Senior Notes and $1,087 million in 3.95% Senior Notes, no commercial paper borrowings and no borrowings against our revolving credit facility. Occasionally a portion of borrowings under our credit facility could be denominated in multiple currencies which could expose us to market risk with exchange rate movements. These instruments carry interest at a pre-agreed upon percentage point spread from either LIBOR, NIBOR or EURIBOR, or at the U.S. prime rate. Under our credit facility, we may, at our option, fix the interest rate for certain borrowings based on a spread over LIBOR, NIBOR or EURIBOR for 30 days to six months. Our objective is to maintain a portion of our debt in variable rate borrowings for the flexibility obtained regarding early repayment without penalties and lower overall cost as compared with fixed-rate borrowings.
54
Table of Contents
| ITEM 8. | FINANCIAL STATEMENTS AND SUPPLEMENTARY DATA |
Attached hereto and a part of this report are financial statements and supplementary data listed in Item 15. “Exhibits and Financial Statement Schedules.”
| ITEM 9. | CHANGES IN AND DISAGREEMENTS WITH ACCOUNTANTS ON ACCOUNTING AND FINANCIAL DISCLOSURE. |
None.
| ITEM 9A. | CONTROLS AND PROCEDURES |
(i) Evaluation of disclosure controls and procedures
As required by SEC Rule 13a-15(b), we have evaluated, under the supervision and with the participation of our management, including our principal executive officer and principal financial officer, the effectiveness of the design and operation of our disclosure controls and procedures (as defined in Rules 13a-15(e) and 15d-15(e) under the Exchange Act) as of the end of the period covered by this report. Our disclosure controls and procedures are designed to provide reasonable assurance that the information required to be disclosed by the Company in reports that it files under the Exchange Act is accumulated and communicated to the Company’s management, including our principal executive officer and principal financial officer, as appropriate, to allow timely decisions regarding required disclosure and is recorded, processed, summarized and reported within the time periods specified in the rules and forms of the SEC. Our principal executive officer and principal financial officer have concluded that our current disclosure controls and procedures were effective as of December 31, 2016 at the reasonable assurance level.
Pursuant to section 302 of the Sarbanes-Oxley Act of 2002, our Chief Executive Officer and Chief Financial Officer have provided certain certifications to the Securities and Exchange Commission. These certifications are included herein as Exhibits 31.1 and 31.2.
(ii) Internal Control Over Financial Reporting
(a) Management’s annual report on internal control over financial reporting.
The Company’s management report on internal control over financial reporting is set forth in this annual report on Page 60 and is incorporated herein by reference.
(b) Changes in internal control
There were no changes in the Company’s internal control over financial reporting that occurred during the Company’s last fiscal quarter covered by this report that have materially affected, or are reasonably likely to materially affect, the Company’s internal control over financial reporting.
| ITEM 9B. | OTHER INFORMATION |
None.
55
Table of Contents
PART III
| ITEM 10. | DIRECTORS, EXECUTIVE OFFICERS AND CORPORATE GOVERNANCE |
Incorporated by reference to the definitive Proxy Statement for the 2017 Annual Meeting of Stockholders.
| ITEM 11. | EXECUTIVE COMPENSATION |
Incorporated by reference to the definitive Proxy Statement for the 2017 Annual Meeting of Stockholders.
| ITEM 12. | SECURITY OWNERSHIP OF CERTAIN BENEFICIAL OWNERS AND MANAGEMENT AND RELATED STOCKHOLDER MATTERS |
Incorporated by reference to the definitive Proxy Statement for the 2017 Annual Meeting of Stockholders.
Securities Authorized for Issuance Under Equity Compensation Plans.
The following table sets forth information as of our fiscal year ended December 31, 2016, with respect to compensation plans under which our common stock may be issued:
| Plan Category |
Number of securities to be issued upon exercise of warrants and rights ( a ) |
Weighted-average exercise price of outstanding rights ( b ) |
Number of securities remaining available for equity compensation plans (excluding securities reflected in column (a)) ( c ) (1) |
|||||||||
| Equity compensation plans approved by security holders |
17,439,060 | $ | 61.56 | 27,754,276 | ||||||||
| Equity compensation plans not approved by security holders |
— | — | — | |||||||||
|
|
|
|
|
|
|
|||||||
| Total |
17,439,060 | $ | 61.56 | 27,754,276 | ||||||||
|
|
|
|
|
|
|
|||||||
| (1) | Shares could be issued through equity instruments other than stock options, warrants or rights. |
| ITEM 13. | CERTAIN RELATIONSHIPS AND RELATED TRANSACTIONS, AND DIRECTOR INDEPENDENCE |
Incorporated by reference to the definitive Proxy Statement for the 2017 Annual Meeting of Stockholders.
| ITEM 14. | PRINCIPAL ACCOUNTANT FEES AND SERVICES |
Incorporated by reference to the definitive Proxy Statement for the 2017 Annual Meeting of Stockholders.
56
Table of Contents
| ITEM 15. | EXHIBITS AND FINANCIAL STATEMENT SCHEDULES |
Financial Statements and Exhibits
| (1) | Financial Statements |
The following financial statements are presented in response to Part II, Item 8:
| Page | ||||
| 63 | ||||
| 64 | ||||
| 65 | ||||
| 66 | ||||
| 67 | ||||
| 68 | ||||
| (2) | Financial Statement Schedule |
All schedules, other than Schedule II, are omitted because they are not applicable, not required or the information is included in the financial statements or notes thereto.
| (3) | Exhibits |
| 3.1 | Fifth Amended and Restated Certificate of Incorporation of National Oilwell Varco, Inc. (Exhibit 3.1) (1) | |
| 3.2 | Amended and Restated By-laws of National Oilwell Varco, Inc. (Exhibit 3.1) (2) | |
| 10.1 | Credit Agreement, dated as of September 28, 2012, among National Oilwell Varco, Inc., the financial institutions signatory thereto, including Wells Fargo Bank, N.A., in their capacities as Administrative Agent, Co-Lead Arranger and Joint Book Runner. (Exhibit 10.1) (3) | |
| 10.2 | Amendment No. 2 to the Credit Agreement, dated as of September 28, 2012, among National Oilwell Varco, Inc., the financial institutions signatory thereto, including Wells Fargo Bank, N.A., as Administrative Agent, the other agents named therein, and the lenders parties thereto. (Exhibit 10.1) (4) | |
| 10.3 | National Oilwell Varco Long-Term Incentive Plan, as amended and restated. (5)* | |
| 10.4 | Form of Employee Stock Option Agreement. (Exhibit 10.1) (6) | |
| 10.5 | Form of Non-Employee Director Stock Option Agreement. (Exhibit 10.2) (6) | |
| 10.6 | Form of Performance-Based Restricted Stock. (18 Month) Agreement (Exhibit 10.1) (7) | |
| 10.7 | Form of Performance-Based Restricted Stock. (36 Month) Agreement (Exhibit 10.2) (7) | |
| 10.8 | Form of Performance Award Agreement (Exhibit 10.1) (8) | |
| 10.9 | Form of Executive Employment Agreement. (Exhibit 10.1) (9) | |
| 10.10 | Form of Executive Severance Agreement. (Exhibit 10.2) (9) | |
| 10.11 | Form of Employee Nonqualified Stock Option Grant Agreement (10) | |
| 10.12 | Form of Restricted Stock Agreement (10) | |
| 10.13 | Form of Performance Award Agreement (10) | |
57
Table of Contents
| 21.1 | Subsidiaries of the Registrant. | |
| 23.1 | Consent of Ernst & Young LLP. | |
| 24.1 | Power of Attorney. (included on signature page hereto) | |
| 31.1 | Certification pursuant to Rule 13a-14a and Rule 15d-14(a) of the Securities and Exchange Act, as amended. | |
| 31.2 | Certification pursuant to Rule 13a-14a and Rule 15d-14(a) of the Securities and Exchange Act, as amended. | |
| 32.1 | Certification pursuant to Section 906 of the Sarbanes-Oxley Act of 2002. | |
| 32.2 | Certification pursuant to Section 906 of the Sarbanes-Oxley Act of 2002. | |
| 95 | Mine Safety Information pursuant to section 1503 of the Dodd-Frank Act. | |
| 101 | The following materials from our Annual Report on Form 10-K for the period ended December 31, 2016 formatted in eXtensible Business Reporting Language (XBRL): (i) Consolidated Balance Sheets, (ii) Consolidated Statements of Income, (iii) Consolidated Statements of Cash Flows, and (iv) Notes to the Consolidated Financial Statements, tagged as block text. (11) | |
| * | Compensatory plan or arrangement for management or others. |
| (1) | Filed as an Exhibit to our Quarterly Report on Form 10-Q filed on August 5, 2011. |
| (2) | Filed as an Exhibit to our Current Report on Form 8-K filed on August 17, 2011. |
| (3) | Filed as an Exhibit to our Current Report on Form 8-K filed on October 1, 2012 |
| (4) | Filed as an Exhibit to our Current Report on Form 8-K filed on May 13, 2015. |
| (5) | Filed as Appendix I to our Proxy Statement filed on April 11, 2016. |
| (6) | Filed as an Exhibit to our Current Report on Form 8-K filed on February 23, 2006. |
| (7) | Filed as an Exhibit to our Current Report on Form 8-K filed on March 27, 2007. |
| (8) | Filed as an Exhibit to our Current Report on Form 8-K filed on March 27, 2013. |
| (9) | Filed as an Exhibit to our Current Report on Form 8-K filed on November 24, 2014. |
| (10) | Filed as an Exhibit to our Current Report on Form 8-K filed on February 26, 2016. |
| (11) | As provided in Rule 406T of Regulation S-T, this information is furnished and not filed for purposes of Sections 11 and 12 of the Securities Act of 1933 and Section 18 of the Securities Exchange Act of 1934. |
We hereby undertake, pursuant to Regulation S-K, Item 601(b), paragraph (4) (iii), to furnish to the U.S. Securities and Exchange Commission, upon request, all constituent instruments defining the rights of holders of our long-term debt not filed herewith.
58
Table of Contents
SIGNATURES
Pursuant to the requirements of Section 13 or 15(d) of the Securities Exchange Act of 1934, the registrant has duly caused this report to be signed on its behalf by the undersigned, thereunto duly authorized.
| NATIONAL OILWELL VARCO, INC. | ||||||
| Dated: February 17, 2017 | By: | /s/ CLAY C. WILLIAMS | ||||
| Clay C. Williams | ||||||
| Chairman, President and Chief Executive Officer | ||||||
Pursuant to the requirements of the Securities Exchange Act of 1934, this report has been signed below by the following persons on behalf of the registrant and in the capacities and on the dates indicated.
Each person whose signature appears below in so signing, constitutes and appoints Clay C. Williams and Jose A. Bayardo, and each of them acting alone, his/her true and lawful attorney-in-fact and agent, with full power of substitution, for him/her and in his/her name, place and stead, in any and all capacities, to execute and cause to be filed with the Securities and Exchange Commission any and all amendments to this report, and in each case to file the same, with all exhibits thereto and other documents in connection therewith, and hereby ratifies and confirms all that said attorney-in-fact or his/her substitute or substitutes may do or cause to be done by virtue hereof.
| Signature |
Title |
Date | ||
| /s/ CLAY C. WILLIAMS Clay C. Williams |
Chairman, President and Chief Executive Officer | February 17, 2017 | ||
| /s/ JOSE A. BAYARDO Jose A. Bayardo |
Senior Vice President and Chief Financial Officer | February 17, 2017 | ||
| /s/ SCOTT K. DUFF Scott K. Duff |
Vice President, Corporate Controller and Chief Accounting Officer | February 17, 2017 | ||
| /s/ GREG L. ARMSTRONG | Director | February 17, 2017 | ||
| Greg L. Armstrong | ||||
| /s/ MARCELA E. DONADIO | Director | February 17, 2017 | ||
| Marcela E. Donadio | ||||
| /s/ BEN A. GUILL | Director | February 17, 2017 | ||
| Ben A. Guill | ||||
| /s/ JAMES T. HACKETT | Director | February 17, 2017 | ||
| James T. Hackett | ||||
| /s/ DAVID D. HARRISON | Director | February 17, 2017 | ||
| David D. Harrison | ||||
| /s/ ROGER L. JARVIS | Director | February 17, 2017 | ||
| Roger L. Jarvis | ||||
| /s/ ERIC L. MATTSON | Director | February 17, 2017 | ||
| Eric L. Mattson | ||||
| /s/ WILLIAM R. THOMAS | Director | February 17 2017 | ||
| William R. Thomas | ||||
59
Table of Contents
MANAGEMENT’S REPORT ON INTERNAL CONTROL OVER FINANCIAL REPORTING
National Oilwell Varco, Inc.’s management is responsible for establishing and maintaining adequate internal control over financial reporting. National Oilwell Varco, Inc.’s internal control system was designed to provide reasonable assurance regarding the reliability of financial reporting and the preparation of financial statements for external purposes in accordance with generally accepted accounting principles.
Internal control over financial reporting cannot provide absolute assurance of achieving financial reporting objectives because of its inherent limitations. Internal control over financial reporting is a process that involves human diligence and compliance and is subject to lapses in judgment and breakdowns resulting from human failures. Internal control over financial reporting also can be circumvented by collusion or improper management override. Because of such limitations, there is a risk that material misstatements may not be prevented or detected on a timely basis by internal control over financial reporting. However, these inherent limitations are known features of the financial reporting process. Therefore, it is possible to design into the process safeguards to reduce, though not eliminate, this risk.
Management has used the 2013 framework set forth in the report entitled “Internal Control—Integrated Framework” published by the Committee of Sponsoring Organizations (“COSO”) of the Treadway Commission to evaluate the effectiveness of the Company’s internal control over financial reporting. Management has concluded that the Company’s internal control over financial reporting was effective as of December 31, 2016.
The effectiveness of our internal control over financial reporting as of December 31, 2016, has been audited by Ernst & Young LLP, the independent registered public accounting firm which also has audited the Company’s Consolidated Financial Statements included in this Annual Report on Form 10-K.
| /s/ Clay C. Williams |
| Clay C. Williams |
| Chairman, President and Chief Executive Officer |
| /s/ Jose A. Bayardo |
| Jose A. Bayardo |
| Senior Vice President and Chief Financial Officer |
| Houston, Texas |
| February 17, 2017 |
60
Table of Contents
REPORT OF INDEPENDENT REGISTERED PUBLIC ACCOUNTING FIRM
The Board of Directors and Stockholders
National Oilwell Varco, Inc.
We have audited National Oilwell Varco, Inc.’s internal control over financial reporting as of December 31, 2016, based on criteria established in Internal Control—Integrated Framework issued by the Committee of Sponsoring Organizations of the Treadway Commission (2013 framework) (the COSO criteria). National Oilwell Varco, Inc’s management is responsible for maintaining effective internal control over financial reporting, and for its assessment of the effectiveness of internal control over financial reporting included in the accompanying Management’s Report on Internal Control Over Financial Reporting. Our responsibility is to express an opinion on the Company’s internal control over financial reporting based on our audit.
We conducted our audit in accordance with the standards of the Public Company Accounting Oversight Board (United States). Those standards require that we plan and perform the audit to obtain reasonable assurance about whether effective internal control over financial reporting was maintained in all material respects. Our audit included obtaining an understanding of internal control over financial reporting, assessing the risk that a material weakness exists, testing and evaluating the design and operating effectiveness of internal control based on the assessed risk, and performing such other procedures as we considered necessary in the circumstances. We believe that our audit provides a reasonable basis for our opinion.
A company’s internal control over financial reporting is a process designed to provide reasonable assurance regarding the reliability of financial reporting and the preparation of financial statements for external purposes in accordance with generally accepted accounting principles. A company’s internal control over financial reporting includes those policies and procedures that (1) pertain to the maintenance of records that, in reasonable detail, accurately and fairly reflect the transactions and dispositions of the assets of the company; (2) provide reasonable assurance that transactions are recorded as necessary to permit preparation of financial statements in accordance with generally accepted accounting principles, and that receipts and expenditures of the company are being made only in accordance with authorizations of management and directors of the company; and (3) provide reasonable assurance regarding prevention or timely detection of unauthorized acquisition, use, or disposition of the company’s assets that could have a material effect on the financial statements.
Because of its inherent limitations, internal control over financial reporting may not prevent or detect misstatements. Also, projections of any evaluation of effectiveness to future periods are subject to the risk that controls may become inadequate because of changes in conditions, or that the degree of compliance with the policies or procedures may deteriorate.
In our opinion, National Oilwell Varco, Inc. maintained, in all material respects, effective internal control over financial reporting as of December 31, 2016, based on the COSO criteria.
We also have audited, in accordance with the standards of the Public Company Accounting Oversight Board (United States), the consolidated balance sheets as of December 31, 2016 and 2015, and the related consolidated statements of income (loss), comprehensive income (loss), stockholders’ equity and cash flows for each of the three years in the period ended December 31, 2016 of National Oilwell Varco, Inc., and our report dated February 17, 2017, expressed an unqualified opinion thereon.
/s/ ERNST & YOUNG LLP
Houston, Texas
February 17, 2017
61
Table of Contents
REPORT OF INDEPENDENT REGISTERED PUBLIC ACCOUNTING FIRM
To the Board of Directors and Stockholders
National Oilwell Varco, Inc.
We have audited the accompanying consolidated balance sheets of National Oilwell Varco, Inc. as of December 31, 2016 and 2015, and the related consolidated statements of income (loss), comprehensive income (loss), stockholders’ equity and cash flows for each of the three years in the period ended December 31, 2016. Our audits also included the financial statement schedule listed in the index at item 15(2). These financial statements and schedule are the responsibility of the Company’s management. Our responsibility is to express an opinion on these financial statements and schedule based on our audits.
We conducted our audits in accordance with the standards of the Public Company Accounting Oversight Board (United States). Those standards require that we plan and perform the audit to obtain reasonable assurance about whether the financial statements are free of material misstatement. An audit includes examining, on a test basis, evidence supporting the amounts and disclosures in the financial statements. An audit also includes assessing the accounting principles used and significant estimates made by management, as well as evaluating the overall financial statement presentation. We believe that our audit provides a reasonable basis for our opinion.
In our opinion, the financial statements referred to above present fairly, in all material respects, the consolidated financial position of National Oilwell Varco, Inc. as of December 31, 2016 and 2015, and the consolidated results of its operations and its cash flows for each of the three years in the period ended December 31, 2016, in conformity with U.S. generally accepted accounting principles. Also, in our opinion, the related financial statement schedule, when considered in relation to the basic financial statements taken as a whole, presents fairly in all material respects the information set forth therein.
As discussed in Note 2 to the consolidated financial statements, the Company changed their classification of deferred tax assets and liabilities, and changed the presentation of debt issuance costs as a result of the adoption of the amendments to the FASB Accounting Standards Codification resulting from Accounting Standards Update 2015-17, “Balance Sheet Classification of Deferred Taxes” and Accounting Standards Update 2015-03, “Simplifying the Presentation of Debt Issuance Costs”, respectively, effective January 1, 2016.
We also have audited, in accordance with the standards of the Public Company Accounting Oversight Board (United States), National Oilwell Varco, Inc.’s internal control over financial reporting as of December 31, 2016, based on criteria established in Internal Control-Integrated Framework issued by the Committee of Sponsoring Organizations of the Treadway Commission (2013 framework) and our report dated February 17, 2017, expressed an unqualified opinion thereon.
/s/ ERNST & YOUNG LLP
Houston, Texas
February 17, 2017
62
Table of Contents
CONSOLIDATED BALANCE SHEETS
(In millions, except share data)
| December 31, | ||||||||
| 2016 | 2015 | |||||||
| ASSETS | ||||||||
| Current assets: |
||||||||
| Cash and cash equivalents |
$ | 1,408 | $ | 2,080 | ||||
| Receivables, net |
2,083 | 2,926 | ||||||
| Inventories, net |
3,325 | 4,678 | ||||||
| Costs in excess of billings |
665 | 1,250 | ||||||
| Prepaid and other current assets |
395 | 491 | ||||||
|
|
|
|
|
|||||
| Total current assets |
7,876 | 11,425 | ||||||
| Property, plant and equipment, net |
3,150 | 3,124 | ||||||
| Deferred income taxes |
86 | 130 | ||||||
| Goodwill |
6,067 | 6,980 | ||||||
| Intangibles, net |
3,530 | 3,849 | ||||||
| Investment in unconsolidated affiliates |
307 | 327 | ||||||
| Other assets |
124 | 135 | ||||||
|
|
|
|
|
|||||
| Total assets |
$ | 21,140 | $ | 25,970 | ||||
|
|
|
|
|
|||||
| LIABILITIES AND STOCKHOLDERS’ EQUITY | ||||||||
| Current liabilities: |
||||||||
| Accounts payable |
$ | 414 | $ | 623 | ||||
| Accrued liabilities |
1,568 | 2,284 | ||||||
| Billings in excess of costs |
440 | 785 | ||||||
| Current portion of long-term debt and short-term borrowings |
506 | 2 | ||||||
| Accrued income taxes |
119 | 264 | ||||||
|
|
|
|
|
|||||
| Total current liabilities |
3,047 | 3,958 | ||||||
| Long-term debt |
2,708 | 3,907 | ||||||
| Deferred income taxes |
1,064 | 1,362 | ||||||
| Other liabilities |
318 | 283 | ||||||
|
|
|
|
|
|||||
| Total liabilities |
7,137 | 9,510 | ||||||
|
|
|
|
|
|||||
| Commitments and contingencies |
||||||||
| Stockholders’ equity: |
||||||||
| Common stock - par value $.01; 1 billion shares authorized; 378,637,403 and 375,764,794 shares issued and outstanding at December 31, 2016 and December 31, 2015 |
4 | 4 | ||||||
| Additional paid-in capital |
8,103 | 8,005 | ||||||
| Accumulated other comprehensive loss |
(1,452 | ) | (1,553 | ) | ||||
| Retained earnings |
7,285 | 9,927 | ||||||
|
|
|
|
|
|||||
| Total Company stockholders’ equity |
13,940 | 16,383 | ||||||
| Noncontrolling interests |
63 | 77 | ||||||
|
|
|
|
|
|||||
| Total stockholders’ equity |
14,003 | 16,460 | ||||||
|
|
|
|
|
|||||
| Total liabilities and stockholders’ equity |
$ | 21,140 | $ | 25,970 | ||||
|
|
|
|
|
|||||
The accompanying notes are an integral part of these statements.
63
Table of Contents
CONSOLIDATED STATEMENTS OF INCOME (LOSS)
(In millions, except per share data)
| Years Ended December 31, | ||||||||||||
| 2016 | 2015 | 2014 | ||||||||||
| Revenue |
||||||||||||
| Sales |
$ | 5,351 | $ | 11,707 | $ | 17,173 | ||||||
| Services |
1,900 | 3,050 | 4,267 | |||||||||
|
|
|
|
|
|
|
|||||||
| Total |
7,251 | 14,757 | 21,440 | |||||||||
|
|
|
|
|
|
|
|||||||
| Cost of revenue |
||||||||||||
| Cost of sales |
5,671 | 9,362 | 12,407 | |||||||||
| Cost of services |
1,681 | 2,332 | 3,224 | |||||||||
|
|
|
|
|
|
|
|||||||
| Total |
7,352 | 11,694 | 15,631 | |||||||||
|
|
|
|
|
|
|
|||||||
| Gross profit (loss) |
(101 | ) | 3,063 | 5,809 | ||||||||
| Selling, general and administrative |
1,338 | 1,764 | 2,092 | |||||||||
| Goodwill and intangible asset impairment |
972 | 1,689 | 104 | |||||||||
|
|
|
|
|
|
|
|||||||
| Operating profit (loss) |
(2,411 | ) | (390 | ) | 3,613 | |||||||
| Interest and financial costs |
(105 | ) | (103 | ) | (105 | ) | ||||||
| Interest income |
15 | 14 | 18 | |||||||||
| Equity income (loss) in unconsolidated affiliates |
(21 | ) | 13 | 58 | ||||||||
| Other income (expense), net |
(101 | ) | (123 | ) | (90 | ) | ||||||
|
|
|
|
|
|
|
|||||||
| Income (loss) from continuing operations before income taxes |
(2,623 | ) | (589 | ) | 3,494 | |||||||
| Provision for income taxes |
(207 | ) | 178 | 1,039 | ||||||||
|
|
|
|
|
|
|
|||||||
| Income (loss) from continuing operations |
(2,416 | ) | (767 | ) | 2,455 | |||||||
| Income from discontinued operations |
— | — | 52 | |||||||||
|
|
|
|
|
|
|
|||||||
| Net income (loss) |
(2,416 | ) | (767 | ) | 2,507 | |||||||
| Net income (loss) attributable to noncontrolling interests |
(4 | ) | 2 | 5 | ||||||||
|
|
|
|
|
|
|
|||||||
| Net income (loss) attributable to Company |
$ | (2,412 | ) | $ | (769 | ) | $ | 2,502 | ||||
|
|
|
|
|
|
|
|||||||
| Per share data: |
||||||||||||
| Basic: |
||||||||||||
| Income (loss) from continuing operations |
$ | (6.41 | ) | $ | (1.99 | ) | $ | 5.73 | ||||
|
|
|
|
|
|
|
|||||||
| Income from discontinued operations |
$ | — | $ | — | $ | 0.12 | ||||||
|
|
|
|
|
|
|
|||||||
| Net income (loss) attributable to Company |
$ | (6.41 | ) | $ | (1.99 | ) | $ | 5.85 | ||||
|
|
|
|
|
|
|
|||||||
| Diluted: |
||||||||||||
| Income (loss) from continuing operations |
$ | (6.41 | ) | $ | (1.99 | ) | $ | 5.70 | ||||
|
|
|
|
|
|
|
|||||||
| Income from discontinued operations |
$ | — | $ | — | $ | 0.12 | ||||||
|
|
|
|
|
|
|
|||||||
| Net income (loss) attributable to Company |
$ | (6.41 | ) | $ | (1.99 | ) | $ | 5.82 | ||||
|
|
|
|
|
|
|
|||||||
| Cash dividends per share |
$ | 0.61 | $ | 1.84 | $ | 1.64 | ||||||
|
|
|
|
|
|
|
|||||||
| Weighted average shares outstanding: |
||||||||||||
| Basic |
376 | 387 | 428 | |||||||||
|
|
|
|
|
|
|
|||||||
| Diluted |
376 | 387 | 430 | |||||||||
|
|
|
|
|
|
|
|||||||
The accompanying notes are an integral part of these statements.
64
Table of Contents
CONSOLIDATED STATEMENTS OF COMPREHENSIVE INCOME (LOSS)
(In millions)
| Years Ended December 31, | ||||||||||||
| 2016 | 2015 | 2014 | ||||||||||
| Net income (loss) |
$ | (2,416 | ) | $ | (767 | ) | $ | 2,507 | ||||
| Other comprehensive income (loss): |
||||||||||||
| Currency translation adjustments |
(97 | ) | (764 | ) | (532 | ) | ||||||
| Derivative financial instruments, net of tax |
166 | 23 | (233 | ) | ||||||||
| Change in defined benefit plans, net of tax |
32 | 22 | (65 | ) | ||||||||
|
|
|
|
|
|
|
|||||||
| Comprehensive income (loss) |
(2,315 | ) | (1,486 | ) | 1,677 | |||||||
| Net income (loss) attributable to noncontrolling interests |
(4 | ) | 2 | 5 | ||||||||
|
|
|
|
|
|
|
|||||||
| Comprehensive income (loss) attributable to Company |
$ | (2,311 | ) | $ | (1,488 | ) | $ | 1,672 | ||||
|
|
|
|
|
|
|
|||||||
The accompanying notes are an integral part of these statements.
65
Table of Contents
CONSOLIDATED STATEMENTS OF CASH FLOWS
(In millions)
| Years Ended December 31, | ||||||||||||
| 2016 | 2015 | 2014 | ||||||||||
| Cash flows from operating activities: |
||||||||||||
| Income (loss) from continuing operations |
$ | (2,416 | ) | $ | (767 | ) | $ | 2,455 | ||||
| Adjustments to reconcile net income (loss) to net cash provided by operating activities: |
||||||||||||
| Depreciation and amortization |
703 | 747 | 778 | |||||||||
| Deferred income taxes |
(198 | ) | (258 | ) | (300 | ) | ||||||
| Stock-based compensation |
107 | 109 | 101 | |||||||||
| Excess tax benefit from stock-based compensation |
7 | 1 | (15 | ) | ||||||||
| Equity (income) loss in unconsolidated affiliates |
21 | (13 | ) | (58 | ) | |||||||
| Dividend from unconsolidated affiliate |
6 | 34 | 73 | |||||||||
| Goodwill and intangible asset impairment |
972 | 1,689 | 104 | |||||||||
| Provision for inventory losses |
606 | 186 | 128 | |||||||||
| Other, net |
108 | 70 | 53 | |||||||||
| Change in operating assets and liabilities, net of acquisitions: |
||||||||||||
| Receivables |
845 | 1,091 | (153 | ) | ||||||||
| Inventories |
782 | 410 | (710 | ) | ||||||||
| Costs in excess of billings |
646 | 548 | (262 | ) | ||||||||
| Prepaid and other current assets |
102 | 112 | (60 | ) | ||||||||
| Accounts payable |
(243 | ) | (570 | ) | 95 | |||||||
| Accrued liabilities |
(773 | ) | (1,137 | ) | 879 | |||||||
| Billings in excess of costs |
(366 | ) | (686 | ) | (59 | ) | ||||||
| Income taxes payable |
(146 | ) | (167 | ) | (124 | ) | ||||||
| Other assets/liabilities, net |
197 | (67 | ) | (400 | ) | |||||||
|
|
|
|
|
|
|
|||||||
| Net cash provided by continuing operating activities |
960 | 1,332 | 2,525 | |||||||||
| Discontinued operations |
— | — | 89 | |||||||||
|
|
|
|
|
|
|
|||||||
| Net cash provided by operating activities |
960 | 1,332 | 2,614 | |||||||||
|
|
|
|
|
|
|
|||||||
| Cash flows from investing activities: |
||||||||||||
| Purchases of property, plant and equipment |
(284 | ) | (453 | ) | (699 | ) | ||||||
| Business acquisitions, net of cash acquired |
(230 | ) | (86 | ) | (291 | ) | ||||||
| Cash distributed in spin-off |
— | — | (253 | ) | ||||||||
| Other, net |
26 | 25 | 151 | |||||||||
|
|
|
|
|
|
|
|||||||
| Net cash used in continuing investing activities |
(488 | ) | (514 | ) | (1,092 | ) | ||||||
| Discontinued operations |
— | — | (12 | ) | ||||||||
|
|
|
|
|
|
|
|||||||
| Net cash used in investing activities |
(488 | ) | (514 | ) | (1,104 | ) | ||||||
|
|
|
|
|
|
|
|||||||
| Cash flows from financing activities: |
||||||||||||
| Borrowings against lines of credit and other debt |
3,972 | 11,377 | 173 | |||||||||
| Payments against lines of credit and other debt |
(4,872 | ) | (10,615 | ) | (155 | ) | ||||||
| Cash dividends paid |
(230 | ) | (710 | ) | (703 | ) | ||||||
| Share repurchases |
— | (2,221 | ) | (779 | ) | |||||||
| Proceeds from stock options exercised |
4 | 7 | 108 | |||||||||
| Excess tax benefit from stock-based compensation |
(7 | ) | (1 | ) | 15 | |||||||
| Other |
(8 | ) | — | (2 | ) | |||||||
|
|
|
|
|
|
|
|||||||
| Net cash used in continuing financing activities |
(1,141 | ) | (2,163 | ) | (1,343 | ) | ||||||
| Discontinued operations |
— | — | — | |||||||||
|
|
|
|
|
|
|
|||||||
| Net cash used in financing activities |
(1,141 | ) | (2,163 | ) | (1,343 | ) | ||||||
|
|
|
|
|
|
|
|||||||
| Effect of exchange rates on cash |
(3 | ) | (111 | ) | (67 | ) | ||||||
|
|
|
|
|
|
|
|||||||
| Increase (decrease) in cash and cash equivalents |
(672 | ) | (1,456 | ) | 100 | |||||||
| Cash and cash equivalents, beginning of period |
2,080 | 3,536 | 3,436 | |||||||||
|
|
|
|
|
|
|
|||||||
| Cash and cash equivalents, end of period |
$ | 1,408 | $ | 2,080 | $ | 3,536 | ||||||
|
|
|
|
|
|
|
|||||||
| Supplemental disclosures of cash flow information: |
||||||||||||
| Cash payments during the period for: |
||||||||||||
| Interest |
$ | 101 | $ | 103 | $ | 102 | ||||||
| Income taxes |
$ | 181 | $ | 782 | $ | 1,380 | ||||||
The accompanying notes are an integral part of these statements.
66
Table of Contents
CONSOLIDATED STATEMENTS OF STOCKHOLDERS’ EQUITY
(In millions)
| Shares Outstanding |
Common Stock |
Additional Paid in Capital |
Accumulated Other Comprehensive Income (Loss) |
Retained Earnings (Loss) |
Total Company Stockholders’ Equity |
Noncontrolling Interests |
Total Stockholders’ Equity |
|||||||||||||||||||||||||
| Balance at December 31, 2013 |
428 | $ | 4 | $ | 8,907 | $ | (4 | ) | $ | 13,323 | $ | 22,230 | $ | 100 | $ | 22,330 | ||||||||||||||||
|
|
|
|
|
|
|
|
|
|
|
|
|
|
|
|
|
|||||||||||||||||
| Net income |
— | — | — | — | 2,502 | 2,502 | 5 | 2,507 | ||||||||||||||||||||||||
| Other comprehensive income (loss), net |
— | — | — | (830 | ) | — | (830 | ) | — | (830 | ) | |||||||||||||||||||||
| Cash dividends, $1.64 per common share |
— | — | — | — | (703 | ) | (703 | ) | — | (703 | ) | |||||||||||||||||||||
| Dividends to noncontrolling interests |
— | — | — | — | — | — | (20 | ) | (20 | ) | ||||||||||||||||||||||
| Noncontrolling interest contribution |
— | — | — | — | — | — | 16 | 16 | ||||||||||||||||||||||||
| Disposal of noncontrolling interest, net |
— | — | — | — | — | — | (21 | ) | (21 | ) | ||||||||||||||||||||||
| Spin-off of distribution business |
— | — | — | — | (1,941 | ) | (1,941 | ) | — | (1,941 | ) | |||||||||||||||||||||
| Stock-based compensation |
— | — | 101 | — | — | 101 | — | 101 | ||||||||||||||||||||||||
| Common stock issued |
3 | — | 108 | — | — | 108 | — | 108 | ||||||||||||||||||||||||
| Withholding taxes |
— | — | (11 | ) | — | — | (11 | ) | — | (11 | ) | |||||||||||||||||||||
| Share repurchases |
(12 | ) | — | (779 | ) | — | — | (779 | ) | — | (779 | ) | ||||||||||||||||||||
| Excess tax benefit from stock-based compensation |
— | — | 15 | — | — | 15 | — | 15 | ||||||||||||||||||||||||
|
|
|
|
|
|
|
|
|
|
|
|
|
|
|
|
|
|||||||||||||||||
| Balance at December 31, 2014 |
419 | $ | 4 | $ | 8,341 | $ | (834 | ) | $ | 13,181 | $ | 20,692 | $ | 80 | $ | 20,772 | ||||||||||||||||
|
|
|
|
|
|
|
|
|
|
|
|
|
|
|
|
|
|||||||||||||||||
| Net income (loss) |
— | — | — | — | (769 | ) | (769 | ) | 2 | (767 | ) | |||||||||||||||||||||
| Other comprehensive income (loss), net |
— | — | — | (719 | ) | — | (719 | ) | — | (719 | ) | |||||||||||||||||||||
| Cash dividends, $1.84 per common share |
— | — | — | — | (710 | ) | (710 | ) | — | (710 | ) | |||||||||||||||||||||
| Dividends to noncontrolling interests |
— | — | — | — | — | — | (8 | ) | (8 | ) | ||||||||||||||||||||||
| Noncontrolling interest contribution |
— | — | — | — | — | — | 3 | 3 | ||||||||||||||||||||||||
| Stock-based compensation |
— | — | 109 | — | — | 109 | — | 109 | ||||||||||||||||||||||||
| Common stock issued |
1 | — | 7 | — | — | 7 | — | 7 | ||||||||||||||||||||||||
| Withholding taxes |
— | — | (5 | ) | — | — | (5 | ) | — | (5 | ) | |||||||||||||||||||||
| Share repurchases |
(44 | ) | — | (446 | ) | — | (1,775 | ) | (2,221 | ) | — | (2,221 | ) | |||||||||||||||||||
| Excess tax benefit from stock-based compensation |
— | — | (1 | ) | — | — | (1 | ) | — | (1 | ) | |||||||||||||||||||||
|
|
|
|
|
|
|
|
|
|
|
|
|
|
|
|
|
|||||||||||||||||
| Balance at December 31, 2015 |
376 | $ | 4 | $ | 8,005 | $ | (1,553 | ) | $ | 9,927 | $ | 16,383 | $ | 77 | $ | 16,460 | ||||||||||||||||
|
|
|
|
|
|
|
|
|
|
|
|
|
|
|
|
|
|||||||||||||||||
| Net loss |
— | — | — | — | (2,412 | ) | (2,412 | ) | (4 | ) | (2,416 | ) | ||||||||||||||||||||
| Other comprehensive income (loss), net |
— | — | — | 101 | — | 101 | — | 101 | ||||||||||||||||||||||||
| Cash dividends, $0.61 per common share |
— | — | — | — | (230 | ) | (230 | ) | — | (230 | ) | |||||||||||||||||||||
| Dividends to noncontrolling interests |
— | — | — | — | — | — | (11 | ) | (11 | ) | ||||||||||||||||||||||
| Noncontrolling interest contribution |
— | — | — | — | — | — | 3 | 3 | ||||||||||||||||||||||||
| Disposal of noncontrolling interest |
— | — | — | — | — | — | (2 | ) | (2 | ) | ||||||||||||||||||||||
| Stock-based compensation |
— | — | 87 | — | — | 87 | — | 87 | ||||||||||||||||||||||||
| Common stock issued |
2 | — | 4 | — | — | 4 | — | 4 | ||||||||||||||||||||||||
| Stock issued in acquisition |
1 | — | 18 | — | — | 18 | — | 18 | ||||||||||||||||||||||||
| Withholding taxes |
— | — | (4 | ) | — | — | (4 | ) | — | (4 | ) | |||||||||||||||||||||
| Excess tax benefit from stock-based compensation |
— | — | (7 | ) | — | — | (7 | ) | — | (7 | ) | |||||||||||||||||||||
|
|
|
|
|
|
|
|
|
|
|
|
|
|
|
|
|
|||||||||||||||||
| Balance at December 31, 2016 |
379 | $ | 4 | $ | 8,103 | $ | (1,452 | ) | $ | 7,285 | $ | 13,940 | $ | 63 | $ | 14,003 | ||||||||||||||||
|
|
|
|
|
|
|
|
|
|
|
|
|
|
|
|
|
|||||||||||||||||
The accompanying notes are an integral part of these statements.
67
Table of Contents
NOTES TO CONSOLIDATED FINANCIAL STATEMENTS
1. Organization and Basis of Presentation
Nature of Business
We design, construct, manufacture and sell comprehensive systems, components, and products used in oil and gas drilling and production, provide oilfield services and supplies, and distribute products and provide supply chain integration services to the upstream oil and gas industry. Our revenues and operating results are directly related to the level of worldwide oil and gas drilling and production activities and the profitability and cash flow of oil and gas companies, drilling contractors and oilfield service companies, which in turn are affected by current and anticipated prices of oil and gas. Oil and gas prices have been, and are likely to continue to be, volatile.
Basis of Consolidation
The accompanying Consolidated Financial Statements include the accounts of National Oilwell Varco, Inc. and its consolidated subsidiaries. Certain reclassifications have been made to the prior year financial statements in order for them to conform with the 2016 presentation. All significant intercompany transactions and balances have been eliminated in consolidation. Investments that are not wholly-owned, but where we exercise control, are fully consolidated with the equity held by minority owners and their portion of net income (loss) reflected as noncontrolling interests in the accompanying consolidated financial statements. Investments in unconsolidated affiliates, over which we exercise significant influence, but not control, are accounted for by the equity method.
On May 30, 2014, the Company completed the spin-off of its distribution business into an independent public company named NOW Inc. In conjunction with the spin-off of NOW Inc. the Company reviewed its reporting and management structure, and effective April 1, 2014, reorganized the Rig Technology, Petroleum Services & Supplies and remaining operations of Distribution & Transmission reporting segments into four new reporting segments. The new reporting segments are Rig Systems, Rig Aftermarket, Wellbore Technologies and Completion & Production Solutions. As a result of the reorganization, all prior periods are presented on this basis. Results of operations related to NOW Inc. have been classified as discontinued operations in all periods presented on Form 10-K.
2. Summary of Significant Accounting Policies
Fair Value of Financial Instruments
The carrying amounts of financial instruments including cash and cash equivalents, receivables, and payables approximated fair value because of the relatively short maturity of these instruments. Cash equivalents include only those investments having a maturity date of three months or less at the time of purchase.
Derivative Financial Instruments
Accounting Standards Codification (“ASC”) Topic 815, “Derivatives and Hedging” (“ASC Topic 815”) requires companies to recognize all derivative instruments as either assets or liabilities in the Consolidated Balance Sheet at fair value. The accounting for changes in the fair value (i.e., gains or losses) of a derivative instrument depends on whether it has been designated and qualifies as part of a hedging relationship and further, on the type of hedging relationship. For those derivative instruments that are designated and qualify as hedging instruments, a company must designate the hedging instrument, based upon the exposure being hedged, as a fair value hedge, cash flow hedge, or a hedge of a net investment in a foreign operation.
The Company records all derivative financial instruments at their fair value in its Consolidated Balance Sheet. Except for certain non-designated hedges discussed below, all derivative financial instruments that the Company holds are designated as cash flow hedges and are highly effective in offsetting movements in the underlying risks. Such arrangements typically have terms between two and 24 months, but may have longer terms depending on the underlying cash flows being hedged, typically related to the projects in our backlog.
Inventories
Inventories consist of raw materials, work-in-process and oilfield and industrial finished products, manufactured equipment and spare parts. Inventories are stated at the lower of cost or market using the first-in, first-out or average cost methods. The Company determines reserves for inventory based on historical usage of inventory on-hand, assumptions about future demand and market conditions, and estimates about potential alternative uses, which are limited. The Company’s inventory consists of spare parts, work in process, and raw materials to support ongoing manufacturing operations and the Company’s large installed base of highly specialized oilfield equipment. The Company’s estimated carrying value of inventory depends upon demand largely driven by levels of oil and
68
Table of Contents
gas well drilling and remediation activity, which depends in turn upon oil and gas prices, the general outlook for economic growth worldwide, available financing for the Company’s customers, political stability and governmental regulation in major oil and gas producing areas, and the potential obsolescence of various types of equipment we sell, among other factors.
The Company evaluates inventory quarterly using the best information available at the time to inform our assumptions and estimates about future demand and resulting sales volumes, and recognizes reserves as necessary to properly state inventory. The historically severe oil-industry downturn that started in mid-2014 began to stabilize during the second half of 2016, and showed early signs of improvement in many areas in the fourth quarter. These signs of improvement, including conversations with customers about their plans for 2017 as well as inquiries and orders for products, provided the Company information with which to assess and adjust assumptions about future demand and market conditions. We saw clear evidence that a market recovery will favor newer technology and the most efficient equipment, and that certain products across our portfolio, for both land and offshore environments, were less likely to be successful going forward as our customers find footing in their newly competitive landscape.
Based on an update of our assumptions related to estimates of future demand, during the fourth quarter we recorded a charge for additions to inventory reserves of $582 million, consisting primarily of obsolete and surplus inventories. At December 31, 2016 and 2015, inventory reserves totaled $1,017 million and $500 million, or 23.4% and 9.7% of gross inventory, respectively.
Property, Plant and Equipment
Property, plant and equipment are recorded at cost. Expenditures for major improvements that extend the lives of property and equipment are capitalized while minor replacements, maintenance and repairs are charged to operations as incurred. Disposals are removed at cost less accumulated depreciation with any resulting gain or loss reflected in operations. Depreciation is provided using the straight-line method over the estimated useful lives of individual items. Depreciation expense, which includes the amortization of assets recorded under capital leases, was $370 million, $391 million and $413 million for the years ended December 31, 2016, 2015 and 2014, respectively. Accumulated depreciation of $2,298 million as of December 31, 2016 included accumulated depreciation of $6 million for capital leases. The estimated useful lives of the major classes of property, plant and equipment are included in Note 6 to the consolidated financial statements.
We record impairment losses on long-lived assets used in operations when events and circumstances indicate that the assets are impaired and the undiscounted cash flows estimated to be generated by those assets are less than the carrying amount of those assets. The carrying value of assets used in operations that are not recoverable is reduced to fair value if lower than carrying value. In determining the fair market value of the assets, we consider market trends and recent transactions involving sales of similar assets, or when not available, discounted cash flow analysis. There have been $54 million in impairments of long-lived assets for the year ended December 31, 2016, and nil for the each of the years ended December 31, 2015 and 2014.
Intangible Assets
The Company has approximately $6.1 billion of goodwill and $3.5 billion of identified intangible assets at December 31, 2016.
Goodwill is identified by segment as follows (in millions):
| Rig Systems |
Rig Aftermarket |
Wellbore Technologies |
Completion & Production Solutions |
Total | ||||||||||||||||
| Balance at December 31, 2014 |
$ | 1,236 | $ | 877 | $ | 4,357 | $ | 2,069 | $ | 8,539 | ||||||||||
| Goodwill acquired and adjusted during period |
— | — | 8 | (8 | ) | — | ||||||||||||||
| Impairment (1) |
— | — | (1,485 | ) | — | (1,485 | ) | |||||||||||||
| Currency translation adjustments and other |
(4 | ) | — | (6 | ) | (64 | ) | (74 | ) | |||||||||||
|
|
|
|
|
|
|
|
|
|
|
|||||||||||
| Balance at December 31, 2015 |
$ | 1,232 | $ | 877 | $ | 2,874 | $ | 1,997 | $ | 6,980 | ||||||||||
| Goodwill acquired and adjusted during period |
— | — | 24 | 126 | 150 | |||||||||||||||
| Impairment (1) |
(972 | ) | — | — | — | (972 | ) | |||||||||||||
| Currency translation adjustments and other |
(2 | ) | — | (24 | ) | (65 | ) | (91 | ) | |||||||||||
|
|
|
|
|
|
|
|
|
|
|
|||||||||||
| Balance at December 31, 2016 |
$ | 258 | $ | 877 | $ | 2,874 | $ | 2,058 | $ | 6,067 | ||||||||||
|
|
|
|
|
|
|
|
|
|
|
|||||||||||
| (1) | Accumulated goodwill impairment was $2,457 million as of December 31, 2016. |
Identified intangible assets with determinable lives consist primarily of customer relationships, trademarks, trade names, patents, and technical drawings acquired in acquisitions, and are being amortized on a straight-line basis over the estimated useful lives of 2-30 years. Amortization expense of identified intangibles is expected to be approximately $320 million in each of the next five years. Included in intangible assets are $384 million of indefinite-lived trade names.
69
Table of Contents
The net book values of identified intangible assets are identified by segment as follows (in millions):
| Rig Systems | Rig Aftermarket |
Wellbore Technologies |
Completion & Production Solutions |
Total | ||||||||||||||||
| Balance at December 31, 2014 |
$ | 208 | $ | 133 | $ | 2,666 | $ | 1,437 | $ | 4,444 | ||||||||||
| Additions to intangible assets |
— | — | 2 | 57 | 59 | |||||||||||||||
| Asset impairment |
(7 | ) | — | (173 | ) | (24 | ) | (204 | ) | |||||||||||
| Amortization |
(22 | ) | (6 | ) | (214 | ) | (114 | ) | (356 | ) | ||||||||||
| Currency translation adjustments and other |
(3 | ) | (4 | ) | (27 | ) | (60 | ) | (94 | ) | ||||||||||
|
|
|
|
|
|
|
|
|
|
|
|||||||||||
| Balance at December 31, 2015 |
$ | 176 | $ | 123 | $ | 2,254 | $ | 1,296 | $ | 3,849 | ||||||||||
| Additions to intangible assets |
— | — | 15 | 9 | 24 | |||||||||||||||
| Amortization |
(15 | ) | (7 | ) | (205 | ) | (106 | ) | (333 | ) | ||||||||||
| Currency translation adjustments and other |
(1 | ) | (1 | ) | — | (8 | ) | (10 | ) | |||||||||||
|
|
|
|
|
|
|
|
|
|
|
|||||||||||
| Balance at December 31, 2016 |
$ | 160 | $ | 115 | $ | 2,064 | $ | 1,191 | $ | 3,530 | ||||||||||
|
|
|
|
|
|
|
|
|
|
|
|||||||||||
Identified intangible assets by major classification consist of the following (in millions):
| Gross | Accumulated Amortization |
Net Book Value |
||||||||||
| December 31, 2015: |
||||||||||||
| Customer relationships |
$ | 4,016 | $ | (1,630 | ) | $ | 2,386 | |||||
| Trademarks |
880 | (265 | ) | 615 | ||||||||
| Indefinite-lived trade names |
384 | — | 384 | |||||||||
| Other |
1,040 | (576 | ) | 464 | ||||||||
|
|
|
|
|
|
|
|||||||
| Total identified intangibles |
$ | 6,320 | $ | (2,471 | ) | $ | 3,849 | |||||
|
|
|
|
|
|
|
|||||||
| December 31, 2016: |
||||||||||||
| Customer relationships |
$ | 4,024 | $ | (1,874 | ) | $ | 2,150 | |||||
| Trademarks |
878 | (290 | ) | 588 | ||||||||
| Indefinite-lived trade names |
384 | — | 384 | |||||||||
| Other |
1,048 | (640 | ) | 408 | ||||||||
|
|
|
|
|
|
|
|||||||
| Total identified intangibles |
$ | 6,334 | $ | (2,804 | ) | $ | 3,530 | |||||
|
|
|
|
|
|
|
|||||||
Asset Impairment
The steep worldwide oil and gas industry downturn that started in 2014 stabilized somewhat during the third quarter of 2016, though at very low levels of activity. Operators have improved their cost structures and achieved operational efficiencies, reducing the industry’s marginal cost of supply, primarily in the North American land market. While some improvements in offshore operations have been made, many deepwater projects will not be able to achieve an economically competitive cost structure under the current commodity pricing outlook. As a result, the market shift from offshore drilling to land drilling in North America intensified. Announced cancellations of major offshore projects during the third quarter, releases of contracted offshore rigs, the number of idle offshore rigs and the number of current newbuilds still to be completed and enter the market all indicate a large over-supply of offshore equipment that may take years to absorb, even as offshore drilling activity recovers. During the third quarter of 2016, these factors indicated a more prolonged downturn associated with newbuild offshore drilling rigs, and we reduced our forecast accordingly, which indicated a goodwill impairment in the Rig Offshore reporting unit was possible.
Generally Accepted Accounting Principles require the company test goodwill and other indefinite-lived intangible assets for impairment at least annually or more frequently whenever events or circumstances occur indicating that those assets might be impaired.
70
Table of Contents
The first step of the impairment analysis is to compare the reporting unit’s carrying value to the respective fair value. Fair value of the reporting unit is determined in accordance with ASC Topic 820 “Fair Value Measurements and Disclosures” using significant unobservable inputs, or level 3 in the fair value hierarchy. These inputs are based on internal management estimates, forecasts and judgments, using discounted cash flow.
The discounted cash flow is based on management’s forecast of operating performance for the reporting unit. The two main assumptions used in measuring goodwill impairment, which bear the risk of change and could impact the Company’s goodwill impairment analysis, include the cash flow from operations from each reporting unit and its weighted average cost of capital. The starting point for each of the reporting unit’s cash flow from operations is the detailed annual plan or updated forecast. Cash flows beyond the updated forecasted operating plans were estimated using a terminal value calculation, which incorporated historical and forecasted financial cyclical trends for each reporting unit and considered long-term earnings growth rates. The financial and credit market volatility directly impacts our fair value measurement through our weighted average cost of capital that we use to determine our discount rate. During times of volatility, significant judgment must be applied to determine whether credit changes are a short-term or long-term trend.
Based on the Company’s step one impairment analysis, as of July 1, 2016, completed as a result of the indicators identified in the third quarter, the Rig Offshore reporting unit had a calculated fair value below its carrying value, and required a step two analysis, which compares the implied fair value of goodwill of a reporting unit to the carrying value of goodwill for the reporting unit. The implied fair value of goodwill is determined by deducting the fair value of a reporting unit’s identifiable assets and liabilities from the fair value of that reporting unit as a whole. Consistent with the step one analysis, fair value of the assets and liabilities was determined in accordance with ASC Topic 820. Based on the step two analysis performed for the Rig Offshore reporting unit, the Company recorded a $972 million write-down of goodwill during the third quarter.
Also, to achieve higher efficiencies and reduce costs, the Company combined the operations of the Rig Offshore and Rig Land reporting units during the third quarter of 2016. Generally accepted accounting principles require the Company to test the value of goodwill assets for impairment before and after combining reporting units. As a result we also tested Rig Land before the combination as well as the combined reporting unit, Rig Systems, as of July 1, 2016 for goodwill impairment, in accordance with ASC Topic 350.
Based on the Company’s step one impairment analysis, the calculated fair value of the Rig Land reporting unit was substantially in excess of its carrying value. Additionally, the goodwill impairment analysis performed subsequent to the combination of the two reporting units into the Rig Systems reporting unit, concluded that the calculated fair value of the Rig Systems reporting unit was substantially in excess of its carrying value. We also considered whether impairment indicators existed that would suggest the goodwill of our other reporting units was more likely than not impaired and concluded there were none. While the outlook for offshore new-builds has declined sharply, higher activity levels in land drilling will benefit our other businesses.
During the fourth quarter of 2016, the Company performed its annual impairment test, as described in ASC Topic 350, as of October 1, 2016. Based on the Company’s annual impairment test, the calculated fair values for all of the Company’s reporting units were substantially in excess of the respective reporting unit’s carrying value. Additionally, the fair value for all of the Company’s intangible assets with indefinite lives were substantially in excess of the respective asset carrying values.
Foreign Currency
The functional currency for most of our foreign operations is the local currency. The cumulative effects of translating the balance sheet accounts from the functional currency into the U.S. dollar at current exchange rates are included in accumulated other comprehensive income (loss). Revenues and expenses are translated at average exchange rates in effect during the period. Certain other foreign operations, including our operations in Norway, use the U.S. dollar as the functional currency. Accordingly, financial statements of these foreign subsidiaries are remeasured to U.S. dollars for consolidation purposes using current rates of exchange for monetary assets and liabilities and historical rates of exchange for nonmonetary assets and related elements of expense. Revenue and expense elements are remeasured at rates that approximate the rates in effect on the transaction dates. For all operations, gains or losses from remeasuring foreign currency transactions into the functional currency are included in income. Net foreign currency transaction gains (losses) were $(10) million, $(47) million and $20 million for the years ending December 31, 2016, 2015 and 2014, respectively, and are included in other income (expense) in the accompanying statement of income.
Historically, the Venezuelan government has devalued the country’s currency. During the first quarter of 2015, the Venezuelan government officially devalued the Venezuelan bolivar against the U.S. dollar. As a result, the Company incurred approximately $9 million in devaluation charges in the first quarter of 2015. The reporting currency of all of the Company’s Venezuelan entities is the U.S. dollar. The Company’s net remaining investment in Venezuela, which is largely U.S. dollar, was nil at December 31, 2016.
71
Table of Contents
During the fourth quarter of 2015, the Argentinian government officially devalued the Argentine peso against the U.S. dollar. As a result, the Company incurred approximately $7 million devaluation charges in the fourth quarter of 2015. The reporting currency of all of the Company’s Argentinian entities is the Argentine peso.
Revenue Recognition
The Company’s products and services are sold based upon purchase orders or contracts with the customer that include fixed or determinable prices and that do not generally include right of return or other similar provisions or other significant post delivery obligations. Except for certain construction contracts and drill pipe sales described below, the Company records revenue at the time its manufacturing process is complete, the customer has been provided with all proper inspection and other required documentation, title and risk of loss has passed to the customer, collectability is reasonably assured and the product has been delivered. Customer advances or deposits are deferred and recognized as revenue when the Company has completed all of its performance obligations related to the sale. The Company also recognizes revenue as services are performed. The amounts billed for shipping and handling costs are included in revenue and related costs are included in cost of sales.
Revenue Recognition under Long-term Construction Contracts
The Company uses the percentage-of-completion method to account for certain long-term construction contracts in the Rig Systems and Completion & Production Solutions segments. These long-term construction contracts include the following characteristics:
| • | the contracts include custom designs for customer specific applications; |
| • | the structural design is unique and requires significant engineering efforts; and |
| • | construction projects often have progress payments. |
This method requires the Company to make estimates regarding the total costs of the project, progress against the project schedule and the estimated completion date, all of which impact the amount of revenue and gross margin the Company recognizes in each reporting period. The Company prepares detailed cost estimates at the beginning of each project. Significant projects and their related costs and profit margins are updated and reviewed at least quarterly by senior management. Factors that may affect future project costs and margins include shipyard access, weather, production efficiencies, availability and costs of labor, materials and subcomponents and other factors. These factors can impact the accuracy of the Company’s estimates and materially impact the Company’s current and future reported earnings.
The asset, “Costs in excess of billings,” represents revenues recognized in excess of amounts billed. The liability, “Billings in excess of costs,” represents billings in excess of revenues recognized.
Drill Pipe Sales
For drill pipe sales, if requested in writing by the customer, delivery may be satisfied through delivery to the Company’s customer storage location or to a third-party storage facility. For sales transactions where title and risk of loss have transferred to the customer but the supporting documentation does not meet the criteria for revenue recognition prior to the products being in the physical possession of the customer, the recognition of the revenues and related inventory costs from these transactions are deferred until the customer takes physical possession.
Service and Product Warranties
The Company provides service and warranty policies on certain of its products. The Company accrues liabilities under service and warranty policies based upon specific claims and a review of historical warranty and service claim experience in accordance with ASC Topic 450 “Contingencies” (“ASC Topic 450”). Adjustments are made to accruals as claim data and historical experience change. In addition, the Company incurs discretionary costs to service its products in connection with product performance issues and accrues for them when they are encountered. The Company monitors the actual cost of performing these discretionary services and adjusts the accrual based on the most current information available.
72
Table of Contents
The changes in the carrying amount of service and product warranties are as follows (in millions):
| Balance at December 31, 2014 |
$ | 272 | ||
|
|
|
|||
| Net provisions for warranties issued during the year |
92 | |||
| Amounts incurred |
(117 | ) | ||
| Currency translation adjustments and other |
(3 | ) | ||
|
|
|
|||
| Balance at December 31, 2015 |
$ | 244 | ||
|
|
|
|||
| Net provisions for warranties issued during the year |
50 | |||
| Amounts incurred |
(127 | ) | ||
| Currency translation adjustments and other |
5 | |||
|
|
|
|||
| Balance at December 31, 2016 |
$ | 172 | ||
|
|
|
Income Taxes
The liability method is used to account for income taxes. Deferred tax assets and liabilities are determined based on differences between the financial reporting and tax basis of assets and liabilities and are measured using the enacted tax rates that will be in effect when the differences are expected to reverse. Valuation allowances are established when necessary to reduce deferred tax assets to amounts which are more likely than not to be realized.
Concentration of Credit Risk
We grant credit to our customers, which operate primarily in the oil and gas industry. Concentrations of credit risk are limited because we have a large number of geographically diverse customers, thus spreading trade credit risk. We control credit risk through credit evaluations, credit limits and monitoring procedures. We perform periodic credit evaluations of our customers’ financial condition and generally do not require collateral, but may require letters of credit for certain international sales. Credit losses are provided for in the financial statements. Allowances for doubtful accounts are determined based on a continuous process of assessing the Company’s portfolio on an individual customer basis taking into account current market conditions and trends. This process consists of a thorough review of historical collection experience, current aging status of the customer accounts, and financial condition of the Company’s customers. Based on a review of these factors, the Company will establish or adjust allowances for specific customers. Accounts receivable are net of allowances for doubtful accounts of approximately $209 million and $159 million at December 31, 2016 and 2015.
Stock-Based Compensation
Compensation expense for the Company’s stock-based compensation plans is measured using the fair value method required by ASC Topic 718 “Compensation – Stock Compensation” (“ASC Topic 718”). Under this guidance the fair value of stock option grants and restricted stock is amortized to expense using the straight-line method over the shorter of the vesting period or the remaining employee service period.
The Company provides compensation benefits to employees and non-employee directors under share-based payment arrangements, including various employee stock option plans.
Environmental Liabilities
When environmental assessments or remediations are probable and the costs can be reasonably estimated, remediation liabilities are recorded on an undiscounted basis and are adjusted as further information develops or circumstances change.
Use of Estimates
The preparation of financial statements in conformity with accounting principles generally accepted in the United States requires management to make estimates and assumptions that affect reported and contingent amounts of assets and liabilities as of the date of
73
Table of Contents
the financial statements and reported amounts of revenues and expenses during the reporting period. Such estimates include but are not limited to, estimated losses on accounts receivable, estimated costs and related margins of projects accounted for under percentage-of-completion, estimated realizable value on excess and obsolete inventory, contingencies, estimated liabilities for litigation exposures and liquidated damages, estimated warranty costs, estimates related to pension accounting, estimates related to the fair value of reporting units for purposes of assessing goodwill and other indefinite-lived intangible assets for impairment and estimates related to deferred tax assets and liabilities, including valuation allowances on deferred tax assets. Actual results could differ from those estimates.
Contingencies
The Company accrues for costs relating to litigation claims and other contingent matters, including liquidated damage liabilities, when such liabilities become probable and reasonably estimable. In circumstances where the most likely outcome of a contingency can be reasonably estimated, we accrue a liability for that amount. Where the most likely outcome cannot be estimated, a range of potential losses is established and if no one amount in that range is more likely than others, the low end of the range is accrued. Such estimates may be based on advice from third parties or on management’s judgment, as appropriate. Revisions to contingent liabilities are reflected in income in the period in which different facts or information become known or circumstances change that affect the Company’s previous judgments with respect to the likelihood or amount of loss. Amounts paid upon the ultimate resolution of contingent liabilities may be materially different from previous estimates and could require adjustments to the estimated reserves to be recognized in the period such new information becomes known.
Net Income (Loss) Attributable to Company Per Share
The following table sets forth the computation of weighted average basic and diluted shares outstanding (in millions, except per share data):
| Years Ended December 31, | ||||||||||||
| 2016 | 2015 | 2014 | ||||||||||
| Numerator: |
||||||||||||
| Income (loss) from continuing operations |
$ | (2,412 | ) | $ | (769 | ) | $ | 2,450 | ||||
|
|
|
|
|
|
|
|||||||
| Income from discontinued operations |
$ | — | $ | — | $ | 52 | ||||||
|
|
|
|
|
|
|
|||||||
| Net income (loss) attributable to Company |
$ | (2,412 | ) | $ | (769 | ) | $ | 2,502 | ||||
|
|
|
|
|
|
|
|||||||
| Denominator: |
||||||||||||
| Basic—weighted average common shares outstanding |
376 | 387 | 428 | |||||||||
| Dilutive effect of employee stock options and other |
— | — | 2 | |||||||||
|
|
|
|
|
|
|
|||||||
| Diluted outstanding shares |
376 | 387 | 430 | |||||||||
|
|
|
|
|
|
|
|||||||
| Per share data: |
||||||||||||
| Basic: |
||||||||||||
| Income (loss) from continuing operations |
$ | (6.41 | ) | $ | (1.99 | ) | $ | 5.73 | ||||
|
|
|
|
|
|
|
|||||||
| Income from discontinued operations |
$ | — | $ | — | $ | 0.12 | ||||||
|
|
|
|
|
|
|
|||||||
| Net income (loss) attributable to Company |
$ | (6.41 | ) | $ | (1.99 | ) | $ | 5.85 | ||||
|
|
|
|
|
|
|
|||||||
| Diluted: |
||||||||||||
| Income (loss) from continuing operations |
$ | (6.41 | ) | $ | (1.99 | ) | $ | 5.70 | ||||
|
|
|
|
|
|
|
|||||||
| Income from discontinued operations |
$ | — | $ | — | $ | 0.12 | ||||||
|
|
|
|
|
|
|
|||||||
| Net income (loss) attributable to Company |
$ | (6.41 | ) | $ | (1.99 | ) | $ | 5.82 | ||||
|
|
|
|
|
|
|
|||||||
| Cash dividends per share |
$ | 0.61 | $ | 1.84 | $ | 1.64 | ||||||
|
|
|
|
|
|
|
|||||||
ASC Topic 260, “Earnings Per Share” (“ASC Topic 260”) requires companies with unvested participating securities to utilize a two-class method for the computation of net income attributable to Company per share. The two-class method requires a portion of net income attributable to Company to be allocated to participating securities, which are unvested awards of share-based payments with non-forfeitable rights to receive dividends or dividend equivalents, if declared. Net income attributable to Company allocated to these participating securities was immaterial for the years ended December 31, 2016, 2015 and 2014 and therefore not excluded from net income attributable to Company per share calculation. The Company had stock options outstanding that were anti-dilutive totaling 14 million, 13 million, and 8 million at December 31, 2016, 2015 and 2014, respectively.
74
Table of Contents
Recently Adopted Accounting Standards
In November 2015, the FASB issued Accounting Standard Update No. 2015-17 “Balance Sheet Classification of Deferred Taxes” (ASU 2015-17). This update requires companies to classify all deferred tax assets and liabilities as non-current on its consolidated financial position. The Company has early adopted ASU 2015-17 on a retrospective basis, resulting in a reclassification of current deferred tax assets and liabilities to non-current deferred tax assets and liabilities. The Company adopted this update on January 1, 2016, and prior periods have been retrospectively adjusted. See Note 8 for further information on the presentation of deferred taxes.
In April 2015, the FASB issued Accounting Standard Update No. 2015-03 “Simplifying the Presentation of Debt Issuance Costs” (ASU 2015-03) to simplify the presentation of debt issuance costs. This update requires that debt issuance costs related to a recognized debt liability be presented in the balance sheet as a direct deduction from the carrying amount of that debt liability, consistent with debt discounts, as opposed to historical presentation as an asset on the balance sheet. ASU No. 2015-03 is effective for fiscal years beginning after December 15, 2015, and for interim periods within those fiscal years. The Company adopted this update on January 1, 2016, and has applied the change retrospectively to prior periods for unamortized debt issuance costs. See Note 7 for further information on the presentation of debt issuance costs.
In August 2014, the FASB issued Accounting Standard Update No. 2014-15 “Disclosure of Uncertainties about an Entity’s Ability to Continue as a Going Concern” (ASU No. 2014-15), which amends FASB Accounting Standards Codification 205 “Presentation of Financial Statements.” This update requires management to assess an entity’s ability to continue as a going concern by incorporating and expanding upon certain principles that are currently in U.S. auditing standards. ASU No. 2014-15 is effective for the annual period ending after December 15, 2016, and for annual periods and interim periods thereafter. The Company adopted ASU No. 2014-15 as of December 31, 2016.
Recently Issued Accounting Standards
In August 2016, the FASB issued Accounting Standard Update No. 2016-15 “Classification of Certain Cash Receipts and Cash Payments” (ASU 2016-15). This update amends Accounting Standard Codification Topic No. 230 “Statement of Cash Flows” and provides guidance and clarification on presentation of certain cash flow issues. ASU No. 2016-15 is effective for fiscal years beginning after December 15, 2017, and for interim periods within those fiscal years. The Company is currently assessing the impact of the adoption of ASU No. 2016-15 on its consolidated financial position and results of operations.
In March 2016, the FASB issued Accounting Standard Update No. 2016-09 “Improvements to Employee Share-Based Payment Accounting” (ASU 2016-09). This update requires that entities record all of the tax effects related to share-based payments at settlement (or expiration) through the income statement. ASU No. 2016-09 is effective for fiscal years beginning after December 15, 2016, and for interim periods within those fiscal years. The Company will adopt ASU No. 2016-09 on January 1, 2017.
In March 2016, the FASB issued ASC Topic 842, “Leases” (ASC Topic 842), which supersedes the lease requirements in ASC Topic No. 840 “Leases” and most industry-specific guidance. This update increases transparency and comparability among organizations by recognizing lease assets and lease liabilities on the balance sheet and disclosing key information about leasing arrangements. ASC Topic 842 is effective for fiscal years beginning after December 15, 2018, and for interim periods within those fiscal years.
In preparing for the adoption of this new standard, the Company has established an internal team to centralize the implementation process as well as engaged external resources to assist in our approach. We are currently utilizing a software program to consolidate and accumulate our existing leases with documentation as required by the new standard. We have assessed the changes to the Company’s current accounting practices and are currently investigating the related tax impact and process changes. We are also in process of quantifying the impact of the new standard on our balance sheet.
In May 2014, the FASB issued Accounting Standard Update No. 2014-09, “Revenue from Contracts with Customers” (ASU 2014-09), which outlines a single comprehensive model for entities to use in accounting for revenue. This ASU supersedes the revenue recognition requirements in FASB ASC Topic 605, “Revenue Recognition,” and most industry-specific guidance. This ASU sets forth a five-step model for determining when and how revenue is recognized. Under the model, an entity will be required to recognize revenue to depict the transfer of goods or services to a customer at an amount reflecting the consideration it expects to receive in exchange for those goods or services.
In 2015, the FASB issued guidance to defer the effective date to fiscal years beginning after December 15, 2017 with optional early adoption for fiscal periods beginning after December 15, 2016. The Company does not plan to early adopt ASU 2014-09.
The standard permits either a full retrospective adoption, in which the standard is applied to all the periods presented, or a modified retrospective adoption, in which the standard is applied only to the current period with a cumulative-effect adjustment reflected in retained earnings. The Company currently anticipates following the modified retrospective adoption, but will not make a final decision on the adoption method until later in 2017.
75
Table of Contents
In 2015, the Company assembled an internal team to study the provisions of ASU 2014-09, began assessing the potential impacts on the Company and educating the organization. In 2016, the Company engaged external resources to complete the assessment of potential changes to current accounting practices related to material revenue streams. Potential impacts were identified based on required changes to current processes to accommodate provisions in the new standard. During 2017, we will quantify the potential impacts as well as design and implement required process, system, control and data requirements to address the impacts identified in the assessments.
The Company has not quantified and is not currently able to reasonably estimate the effect of the potential timing or other impacts to revenue recognition caused by the new standard, nor the amount of contract assets and liabilities which will be added to our balance sheet.
76
Table of Contents
3. Derivative Financial Instruments
The Company is exposed to certain risks relating to its ongoing business operations. The primary risk managed by using derivative instruments is foreign currency exchange rate risk. Forward contracts against various foreign currencies are entered into to manage the foreign currency exchange rate risk on forecasted revenues and expenses denominated in currencies other than the functional currency of the operating unit (cash flow hedge). Other forward exchange contracts against various foreign currencies are entered into to manage the foreign currency exchange rate risk associated with certain firm commitments denominated in currencies other than the functional currency of the operating unit (fair value hedge). In addition, the Company will enter into non-designated forward contracts against various foreign currencies to manage the foreign currency exchange rate risk on recognized nonfunctional currency monetary accounts (non-designated hedge).
At December 31, 2016, the Company has determined that the fair value of its derivative financial instruments representing assets of $62 million and liabilities of $77 million (primarily currency related derivatives) are determined using level 2 inputs (inputs other than quoted prices in active markets for identical assets and liabilities that are observable either directly or indirectly for substantially the full term of the asset or liability) in the fair value hierarchy as the fair value is based on publicly available foreign exchange and interest rates at each financial reporting date. At December 31, 2016, the net fair value of the Company’s foreign currency forward contracts totaled a net liability of $15 million.
At December 31, 2016, the Company’s financial instruments do not contain any credit-risk-related or other contingent features that could cause accelerated payments when the Company’s financial instruments are in net liability positions. We do not use derivative financial instruments for trading or speculative purposes.
Cash Flow Hedging Strategy
To protect against the volatility of forecasted foreign currency cash flows resulting from forecasted revenues and expenses, the Company has instituted a cash flow hedging program. The Company hedges portions of its forecasted revenues and expenses denominated in nonfunctional currencies with forward contracts. When the U.S. dollar strengthens against the foreign currencies, the decrease in present value of future foreign currency revenues and expenses is offset by gains in the fair value of the forward contracts designated as hedges. Conversely, when the U.S. dollar weakens, the increase in the present value of future foreign currency cash flows is offset by losses in the fair value of the forward contracts.
For derivative instruments that are designated and qualify as a cash flow hedge (i.e., hedging the exposure to variability in expected future cash flows that is subject to a particular currency risk), the effective portion of the gain or loss on the derivative instrument is reported as a component of Other Comprehensive Income (Loss) and reclassified into earnings in the same line item associated with the forecasted transaction and in the same period or periods during which the hedged transaction affects earnings (e.g., in “revenues” when the hedged transactions are cash flows associated with forecasted revenues). The remaining gain or loss on the derivative instrument in excess of the cumulative change in the present value of future cash flows of the hedged item, if any (i.e., the ineffective portion), or hedge components excluded from the assessment of effectiveness, is recognized in the Consolidated Statements of Income (Loss) during the current period.
The Company had the following outstanding foreign currency forward contracts that were entered into to hedge nonfunctional currency cash flows from forecasted revenues and expenses (in millions):
| Currency Denomination | ||||||||||||
| Foreign Currency |
December 31, 2016 |
December 31, 2015 |
||||||||||
| Norwegian Krone |
NOK | 5,621 | NOK | 9,655 | ||||||||
| Japanese Yen |
JPY | 1,462 | JPY | — | ||||||||
| U.S. Dollar |
USD | 321 | USD | 321 | ||||||||
| Euro |
EUR | 279 | EUR | 78 | ||||||||
| Danish Krone |
DKK | 29 | DKK | 57 | ||||||||
| Singapore Dollar |
SGD | 2 | SGD | 14 | ||||||||
| British Pound Sterling |
GBP | 1 | GBP | 4 | ||||||||
| Canadian Dollar |
CAD | — | CAD | 2 | ||||||||
77
Table of Contents
Non-designated Hedging Strategy
The Company enters into forward exchange contracts to hedge certain nonfunctional currency monetary accounts. The purpose of the Company’s foreign currency hedging activities is to protect the Company from risk that the eventual U.S. dollar equivalent cash flows from the nonfunctional currency monetary accounts will be adversely affected by changes in the exchange rates.
For derivative instruments that are non-designated, the gain or loss on the derivative instrument subject to the hedged risk (i.e., nonfunctional currency monetary accounts) is recognized in other income (expense), net in the Consolidated Statement of Income (Loss).
The Company had the following outstanding foreign currency forward contracts that hedge the fair value of nonfunctional currency monetary accounts (in millions):
| Currency Denomination | ||||||||||||
| Foreign Currency |
December 31, 2016 |
December 31, 2015 |
||||||||||
| Russian Ruble | RUB | 1,893 | RUB | 2,164 | ||||||||
| Norwegian Krone | NOK | 538 | NOK | 2,265 | ||||||||
| U.S. Dollar | USD | 457 | USD | 515 | ||||||||
| Euro | EUR | 272 | EUR | 371 | ||||||||
| South African Rand | ZAR | 150 | ZAR | — | ||||||||
| Danish Krone | DKK | 49 | DKK | 153 | ||||||||
| Singapore Dollar | SGD | 7 | SGD | 5 | ||||||||
| British Pound Sterling | GBP | 3 | GBP | 11 | ||||||||
| Canadian Dollar | CAD | 1 | CAD | 7 | ||||||||
78
Table of Contents
The Company has the following fair values of its derivative instruments and their balance sheet classifications (in millions):
Fair Values of Derivative Instruments
(In millions)
| Asset Derivatives | Liability Derivatives | |||||||||||||||||||||||
| Balance Sheet | Fair Value December 31, |
Balance Sheet | Fair Value December 31, |
|||||||||||||||||||||
| Location | 2016 | 2015 | Location | 2016 | 2015 | |||||||||||||||||||
| Derivatives designated as hedging instruments under ASC Topic 815 |
||||||||||||||||||||||||
| Foreign exchange contracts |
Prepaid and other current assets | $ | 24 | $ | 5 | Accrued liabilities | $ | 37 | $ | 212 | ||||||||||||||
| Foreign exchange contracts |
Other Assets | 6 | — | Other Liabilities | 11 | 25 | ||||||||||||||||||
|
|
|
|
|
|
|
|
|
|||||||||||||||||
| Total derivatives designated as hedging instruments under ASC Topic 815 |
$ | 30 | $ | 5 | $ | 48 | $ | 237 | ||||||||||||||||
|
|
|
|
|
|
|
|
|
|||||||||||||||||
| Derivatives not designated as hedging instruments under ASC Topic 815 |
||||||||||||||||||||||||
| Foreign exchange contracts |
Prepaid and other current assets | $ | 32 | $ | 21 | Accrued liabilities | $ | 29 | $ | 49 | ||||||||||||||
|
|
|
|
|
|
|
|
|
|||||||||||||||||
| Total derivatives not designated as hedging instruments under ASC Topic 815 |
$ | 32 | $ | 21 | $ | 29 | $ | 49 | ||||||||||||||||
|
|
|
|
|
|
|
|
|
|||||||||||||||||
| Total derivatives |
$ | 62 | $ | 26 | $ | 77 | $ | 286 | ||||||||||||||||
|
|
|
|
|
|
|
|
|
|||||||||||||||||
The Effect of Derivative Instruments on the Consolidated Statements of Income (Loss)
($ in millions)
| Derivatives Designated as Hedging Instruments under ASC Topic 815 |
Amount of Gain (Loss) Recognized in OCI on Derivatives (Effective Portion) (a) |
Location of Gain (Loss) OCI into Income |
Amount of Gain (Loss) Reclassified from Accumulated OCI into Income (Effective Portion) |
Location of Gain (Loss) Recognized in Income on Derivatives (Ineffective Portion and Amount Excluded from Effectiveness Testing) |
Amount of Gain (Loss) Recognized in Income on Derivatives (Ineffective Portion and Amount Excluded from Effectiveness Testing) (b) |
|||||||||||||||||||||||
| Years Ended December 31, |
Years Ended December 31, |
Years Ended December 31, |
||||||||||||||||||||||||||
| 2016 | 2015 | 2016 | 2015 | 2016 | 2015 | |||||||||||||||||||||||
| Revenue | 5 | 19 | Cost of revenue | (21 | ) | (33 | ) | |||||||||||||||||||||
| Foreign exchange contracts |
45 | (243 | ) | Cost of revenue | (170 | ) | (262 | ) | Other income (expense), net | 8 | 4 | |||||||||||||||||
|
|
|
|
|
|
|
|
|
|
|
|
|
|||||||||||||||||
| Total |
45 | (243 | ) | (165 | ) | (243 | ) | (13 | ) | (29 | ) | |||||||||||||||||
|
|
|
|
|
|
|
|
|
|
|
|
|
|||||||||||||||||
| Derivatives Not Designated as Hedging Instruments under ASC Topic 815 |
Location of Gain (Loss) Recognized in Income on Derivatives |
Amount of Gain (Loss) Recognized in Income on Derivatives |
||||||||||
| Years Ended December 31, |
||||||||||||
| 2016 | 2015 | |||||||||||
| Foreign exchange contracts |
Other income (expense), net | (33 | ) | (97 | ) | |||||||
|
|
|
|
|
|||||||||
| Total |
(33 | ) | (97 | ) | ||||||||
|
|
|
|
|
|||||||||
| (a) | The Company expects that $20 million of the Accumulated Other Comprehensive Income (Loss) will be reclassified into earnings within the next twelve months with an offset by losses from the underlying transactions resulting in no impact to earnings or cash flow. |
| (b) | The amount of gain (loss) recognized in income represents $(21) million and $(33) million related to the ineffective portion of the hedging relationships for the years ended December 31, 2016 and 2015, respectively, and $8 million and $4 million related to the amount excluded from the assessment of the hedge effectiveness for the years ended December 31, 2016 and 2015, respectively. |
79
Table of Contents
4. Acquisitions and Investments
2016
In the year ended December 31, 2016, the Company completed a total of 10 acquisitions and other investments for an aggregate cash investment of $230 million, net of cash acquired and $18 million of NOV stock. The Company has preliminarily allocated $24 million to identifiable intangible assets and $152 million to goodwill. The amount allocated to goodwill represents the excess of the purchase price over the fair value of the net assets acquired. Goodwill specifically includes the expected synergies and other benefits that the Company believes will result from combining its operations with those of businesses acquired and other intangible assets that do not qualify for separate recognition, such as assembled workforce in place at the date of acquisition. Goodwill resulting from the acquisitions is not deductible for tax purposes.
2015
In the year ended December 31, 2015, the Company completed seven acquisitions and other investments for an aggregate purchase price of $86 million, net of cash acquired. The Company has allocated $13 million to identifiable intangible assets and $51 million to goodwill. The amount allocated to goodwill represents the excess of the purchase price over the fair value of the net assets acquired. Goodwill specifically includes the expected synergies and other benefits that the Company believes will result from combining its operations with those of businesses acquired and other intangible assets that do not qualify for separate recognition, such as assembled workforce in place at the date of acquisition. Goodwill resulting from the acquisitions is not deductible for tax purposes.
2014
In the year ended December 31, 2014, the Company completed 10 acquisitions for an aggregate purchase price of $291 million, net of cash acquired. The Company has allocated $59 million to identifiable intangible assets and $167 million to goodwill. The amount allocated to goodwill represents the excess of the purchase price over the fair value of the net assets acquired. Goodwill specifically includes the expected synergies and other benefits that the Company believes will result from combining its operations with those of businesses acquired and other intangible assets that do not qualify for separate recognition, such as assembled workforce in place at the date of acquisition. Goodwill resulting from the acquisitions is not deductible for tax purposes.
Each of the acquisitions was accounted for using the purchase method of accounting and, accordingly, the results of operations of each business are included in the Consolidated Statements of Income (Loss) from the date of acquisition. A summary of the acquisitions follows (in millions):
| Years Ended December 31, | ||||||||||||
| 2016 | 2015 | 2014 | ||||||||||
| Fair value of assets acquired, net of cash acquired |
$ | 357 | $ | 116 | $ | 406 | ||||||
| Cash paid, net of cash acquired |
(230 | ) | (86 | ) | (291 | ) | ||||||
|
|
|
|
|
|
|
|||||||
| Liabilities assumed, debt issued and noncontrolling interest |
$ | 127 | $ | 30 | $ | 115 | ||||||
|
|
|
|
|
|
|
|||||||
| Excess purchase price over fair value of net assets acquired |
$ | 152 | $ | 51 | $ | 167 | ||||||
|
|
|
|
|
|
|
|||||||
5. Inventories, net
Inventories consist of (in millions):
| December 31, | ||||||||
| 2016 | 2015 | |||||||
| Raw materials and supplies |
$ | 961 | $ | 1,069 | ||||
| Work in process |
561 | 632 | ||||||
| Finished goods and purchased products |
1,803 | 2,977 | ||||||
|
|
|
|
|
|||||
| Total |
$ | 3,325 | $ | 4,678 | ||||
|
|
|
|
|
|||||
80
Table of Contents
6. Property, Plant and Equipment
Property, plant and equipment consist of (in millions):
| Estimated | December 31, | |||||||||||
| Useful Lives | 2016 | 2015 | ||||||||||
| Land and buildings |
5-35 Years | $ | 1,570 | $ | 1,565 | |||||||
| Operating equipment |
3-15 Years | 3,102 | 3,055 | |||||||||
| Rental equipment |
3-12 Years | 557 | 639 | |||||||||
| Capital leases |
20-24 Years | 219 | 17 | |||||||||
|
|
|
|
|
|||||||||
| 5,448 | 5,276 | |||||||||||
| Less: Accumulated Depreciation |
(2,298 | ) | (2,152 | ) | ||||||||
|
|
|
|
|
|||||||||
| $ | 3,150 | $ | 3,124 | |||||||||
|
|
|
|
|
|||||||||
7. Accrued Liabilities
Accrued liabilities consist of (in millions):
| December 31, | ||||||||
| 2016 | 2015 | |||||||
| Vendor costs |
$ | 235 | $ | 449 | ||||
| Customer prepayments and billings |
222 | 426 | ||||||
| Compensation |
181 | 241 | ||||||
| Taxes (non income) |
176 | 175 | ||||||
| Warranty |
172 | 244 | ||||||
| Insurance |
103 | 113 | ||||||
| Fair value of derivatives |
66 | 261 | ||||||
| Commissions |
57 | 73 | ||||||
| Interest |
8 | 8 | ||||||
| Other |
348 | 294 | ||||||
|
|
|
|
|
|||||
| Total |
$ | 1,568 | $ | 2,284 | ||||
|
|
|
|
|
|||||
8. Costs and Estimated Earnings on Uncompleted Contracts
Costs and estimated earnings on uncompleted contracts consist of (in millions):
| December 31, | ||||||||
| 2016 | 2015 | |||||||
| Costs incurred on uncompleted contracts |
$ | 8,132 | $ | 9,082 | ||||
| Estimated earnings |
3,869 | 4,080 | ||||||
|
|
|
|
|
|||||
| 12,001 | 13,162 | |||||||
| Less: Billings to date on uncompleted contracts |
11,776 | 12,697 | ||||||
|
|
|
|
|
|||||
| $ | 225 | $ | 465 | |||||
|
|
|
|
|
|||||
| Costs and estimated earnings in excess of billings on uncompleted contracts |
$ | 665 | $ | 1,250 | ||||
| Billings in excess of costs and estimated earnings on uncompleted contracts |
(440 | ) | (785 | ) | ||||
|
|
|
|
|
|||||
| $ | 225 | $ | 465 | |||||
|
|
|
|
|
|||||
81
Table of Contents
9. Debt
Debt consists of (in millions):
| December 31, | ||||||||
| 2016 | 2015 | |||||||
| $500 million in Senior Notes, interest at 1.35% payable semiannually, principal due on December 1, 2017 |
499 | 498 | ||||||
| $1.4 billion in Senior Notes, interest at 2.60% payable semiannually, principal due on December 1, 2022 |
1,391 | 1,389 | ||||||
| $1.1 billion in Senior Notes, interest at 3.95% payable semiannually, principal due on December 1, 2042 |
1,087 | 1,087 | ||||||
| Commercial paper |
— | 890 | ||||||
| Capital Leases and other debt |
237 | 45 | ||||||
|
|
|
|
|
|||||
| Total debt |
3,214 | 3,909 | ||||||
| Less current portion |
506 | 2 | ||||||
|
|
|
|
|
|||||
| Long-term debt |
$ | 2,708 | $ | 3,907 | ||||
|
|
|
|
|
|||||
Principal payments of debt and capital leases for years subsequent to 2016 are as follows (in millions):
| 2017 |
$ | 506 | ||
| 2018 |
3 | |||
| 2019 |
4 | |||
| 2020 |
5 | |||
| 2021 |
5 | |||
| Thereafter |
2,691 | |||
|
|
|
|||
| $ | 3,214 | |||
|
|
|
See Note 12 for additional details on future lease payments specific to capital leases.
On January 1, 2016, the Company adopted Accounting Standards Update No. 2015-03 “Simplifying the Presentation of Debt Issuance Costs.” This update requires that debt issuance costs related to a recognized debt liability be presented in the balance sheet as a direct deduction from the carrying amount of that debt liability, consistent with debt discounts. We have applied the change retrospectively for prior period balances of unamortized debt issuance costs, resulting in a $21 million reduction in other assets and long-term debt on our consolidated balance sheet as of December 31, 2015. The table above now presents our debt liability net of the related debt discount and debt issuance costs.
The Company has a $4.5 billion, five-year credit facility which expires September 28, 2018. The Company also has a commercial paper program under which borrowings are classified as long-term since the program is supported by the $4.5 billion, five-year unsecured revolving credit facility. At December 31, 2016, there were no commercial paper borrowings, and there were no outstanding letters of credit issued under the credit facility, resulting in $4,500 million of funds available under this revolving credit facility. Interest under this multicurrency facility is based upon LIBOR, NIBOR or EURIBOR plus 1.125% subject to a ratings-based grid, or the U.S. prime rate. The credit facility contains a financial covenant regarding maximum debt-to-capitalization ratio of 60%. As of December 31, 2016, the Company was in compliance with a debt-to-capitalization ratio of 18.7%.
The Company had $1,196 million of outstanding letters of credit at December 31, 2016, primarily in the U.S. and Norway, that are under various bilateral committed letter of credit facilities. Letters of credit are issued as bid bonds, advanced payment bonds and performance bonds.
At December 31, 2016 and 2015, the fair value of the Company’s unsecured Senior Notes approximated $2,669 million and $2,551 million, respectively. The fair value of the Company’s debt is estimated using Level 2 inputs in the fair value hierarchy and is based on quoted prices for those or similar instruments. At December 31, 2016 and 2015, the carrying value of the Company’s unsecured Senior Notes approximated $2,977 million and $2,974 million, respectively.
82
Table of Contents
10. Employee Benefit Plans
We have benefit plans covering substantially all of our employees. Defined-contribution benefit plans cover most of the U.S. and Canadian employees, and benefits are based on years of service, a percentage of current earnings and matching of employee contributions. We also have defined contribution plans in Norway and the United Kingdom. For the years ended December 31, 2016, 2015 and 2014, expenses for defined-contribution plans were $66 million, $95 million, and $115 million, respectively, and all funding is current.
Certain retired or terminated employees of predecessor or acquired companies participate in a defined benefit plan in the United States. Approximately 75 employees represented by certain collective bargaining agreements continue to accrue benefits under the plan. In addition, approximately 1,900 U.S. retirees and spouses participate in defined benefit health care plans of predecessor or acquired companies that provide postretirement medical and life insurance benefits. Except for two locations represented by certain collective bargaining agreements, active employees are ineligible to participate in any of these U.S. defined benefit plans. Active employees based in the United Kingdom are ineligible to participate in any defined benefit plans.
During 2014, the Company sold certain industrial assets of which the impact on the defined benefit plans is reflected in the table below.
During 2016, the Company settled its Norway defined benefit plan and transferred all participants to the defined-contribution plan. The impact on the defined benefit plans is reflected in the table below.
Net periodic benefit cost for our defined benefit plans aggregated $5 million, $5 million and $7 million for the years ended December 31, 2016, 2015 and 2014, respectively.
The change in benefit obligation, plan assets and the funded status of the defined benefit pension plans in the United States, United Kingdom, Norway, Germany and the Netherlands and defined postretirement plans in the United States, using a measurement date of December 31, 2016 and 2015, is as follows (in millions):
| Pension benefits | Postretirement benefits | |||||||||||||||
| At year end |
2016 | 2015 | 2016 | 2015 | ||||||||||||
| Benefit obligation at beginning of year |
$ | 703 | $ | 792 | $ | 90 | $ | 53 | ||||||||
| Service cost |
5 | 6 | — | — | ||||||||||||
| Interest cost |
25 | 26 | 3 | 3 | ||||||||||||
| Actuarial loss (gain) |
42 | (38 | ) | (29 | ) | (7 | ) | |||||||||
| Benefits paid |
(30 | ) | (34 | ) | (16 | ) | (5 | ) | ||||||||
| Participants contributions |
— | — | 2 | 1 | ||||||||||||
| Exchange rate loss (gain) |
(37 | ) | (33 | ) | — | — | ||||||||||
| Acquisitions (disposals) |
2 | — | — | — | ||||||||||||
| Curtailments |
(71 | ) | — | — | — | |||||||||||
| Settlements |
(17 | ) | (16 | ) | — | — | ||||||||||
| Other |
— | — | 42 | 45 | ||||||||||||
|
|
|
|
|
|
|
|
|
|||||||||
| Benefit obligation at end of year |
$ | 622 | $ | 703 | $ | 92 | $ | 90 | ||||||||
|
|
|
|
|
|
|
|
|
|||||||||
| Fair value of plan assets at beginning of year |
$ | 601 | $ | 660 | $ | — | $ | — | ||||||||
| Actual return |
60 | 3 | — | — | ||||||||||||
| Benefits paid |
(30 | ) | (34 | ) | (16 | ) | (5 | ) | ||||||||
| Company contributions |
16 | 12 | 14 | 4 | ||||||||||||
| Participants contributions |
— | — | 2 | 1 | ||||||||||||
| Exchange rate gain (loss) |
(34 | ) | (23 | ) | — | — | ||||||||||
| Curtailments |
(71 | ) | — | — | — | |||||||||||
| Acquisitions (disposals) |
1 | (17 | ) | — | — | |||||||||||
|
|
|
|
|
|
|
|
|
|||||||||
| Fair value of plan assets at end of year |
$ | 543 | $ | 601 | $ | — | $ | — | ||||||||
|
|
|
|
|
|
|
|
|
|||||||||
| Funded status |
$ | (79 | ) | $ | (102 | ) | $ | (92 | ) | $ | (90 | ) | ||||
|
|
|
|
|
|
|
|
|
|||||||||
| Accumulated benefit obligation at end of year |
$ | 617 | $ | 685 | ||||||||||||
|
|
|
|
|
|||||||||||||
Liabilities associated with the funded status of the defined benefit pension plans are included in the balances of accrued liabilities and other liabilities in the Consolidated Balance Sheet.
83
Table of Contents
Defined Benefit Pension Plans
Assumed long-term rates of return on plan assets, discount rates and rates of compensation increases vary for the different plans according to the local economic conditions. The assumption rates used for benefit obligations are as follows:
| Years Ended December 31, | ||||||||
| 2016 | 2015 | |||||||
| Discount rate: | ||||||||
| United States plan |
3.10% - 4.00 | % | 3.40% - 3.90 | % | ||||
| International plans |
1.80% - 2.80 | % | 2.10% - 3.60 | % | ||||
| Salary increase: | ||||||||
| United States plan |
N/A | N/A | ||||||
| International plans |
1.80% - 3.50 | % | 2.00% - 4.20 | % | ||||
The assumption rates used for net periodic benefit costs are as follows:
| Years Ended December 31, | ||||||||||||
| 2016 | 2015 | 2014 | ||||||||||
| Discount rate: |
||||||||||||
| United States plan |
3.20% - 4.20 | % | 3.70% - 4.20 | % | 3.99% - 4.67 | % | ||||||
| International plans |
2.20% - 3.70 | % | 2.20% - 3.70 | % | 3.50% - 4.40 | % | ||||||
| Salary increase: |
||||||||||||
| United States plan |
N/A | N/A | N/A | |||||||||
| International plans |
2.00% - 4.20 | % | 2.00% - 4.20 | % | 2.00% - 4.40 | % | ||||||
| Expected return on assets: |
||||||||||||
| United States plan |
5.60 | % | 5.50 | % | 6.50 | % | ||||||
| International plans |
1.80% - 3.00 | % | 2.30% - 5.12 | % | 3.50% - 5.53 | % | ||||||
In determining the overall expected long-term rate of return for plan assets, the Company takes into consideration the historical experience as well as future expectations of the asset mix involved. As different investments yield different returns, each asset category is reviewed individually and then weighted for significance in relation to the total portfolio.
The majority of our plans have projected benefit obligations in excess of plan assets.
The Company expects to pay future benefit amounts on its defined benefit plans of approximately $35 million for each of the next five years and aggregate payments of $338 million over the next five years thereafter.
Plan Assets
The Company and its investment advisers collaboratively reviewed market opportunities using historic and statistical data, as well as the actuarial valuation reports for the plans, to ensure that the levels of acceptable return and risk are well-defined and monitored. Currently, the Company’s management believes that there are no significant concentrations of risk associated with plan assets. Our pension investment strategy worldwide prohibits a direct investment in our own stock.
84
Table of Contents
The following table sets forth by level, within the fair value hierarchy, the Plan’s assets carried at fair value (in millions):
| Fair Value Measurements | ||||||||||||||||
| Total | Level 1 | Level 2 | Level 3 | |||||||||||||
| December 31, 2015: |
||||||||||||||||
| Equity securities |
$ | 186 | $ | — | $ | 186 | $ | — | ||||||||
| Bonds |
259 | — | 259 | — | ||||||||||||
| Other (insurance contracts) |
156 | — | 57 | 99 | ||||||||||||
|
|
|
|
|
|
|
|
|
|||||||||
| Total Fair Value Measurements |
$ | 601 | $ | — | $ | 502 | $ | 99 | ||||||||
|
|
|
|
|
|
|
|
|
|||||||||
| December 31, 2016: |
||||||||||||||||
| Equity securities |
$ | 181 | $ | — | $ | 181 | $ | — | ||||||||
| Bonds |
262 | — | 262 | — | ||||||||||||
| Other (insurance contracts) |
100 | — | 47 | 53 | ||||||||||||
|
|
|
|
|
|
|
|
|
|||||||||
| Total Fair Value Measurements |
$ | 543 | $ | — | $ | 490 | $ | 53 | ||||||||
|
|
|
|
|
|
|
|
|
|||||||||
Level 3 inputs are unobservable (i.e., supported by little or no market activity). Level 3 inputs include management’s own judgement about the assumptions that market participants would use in pricing the asset or liability (including assumptions about risk). The following table sets forth a summary of changes in the fair value of the Plan’s Level 3 assets (in millions):
| Level 3 Plan Assets |
||||
| Balance at December 31, 2014 |
$ | 108 | ||
|
|
|
|||
| Actual return on plan assets still held at reporting date |
3 | |||
| Purchases, sales and settlements |
2 | |||
| Currency translation adjustments |
(14 | ) | ||
|
|
|
|||
| Balance at December 31, 2015 |
$ | 99 | ||
|
|
|
|||
| Actual return on plan assets still held at reporting date |
5 | |||
| Purchases, sales and settlements |
(50 | ) | ||
| Currency translation adjustments |
(1 | ) | ||
|
|
|
|||
| Balance at December 31, 2016 |
$ | 53 | ||
|
|
|
|||
85
Table of Contents
11. Accumulated Other Comprehensive Income (Loss)
The components of accumulated other comprehensive income (loss) are as follows (in millions):
| Currency Translation Adjustments |
Derivative Financial Instruments, Net of Tax |
Defined Benefit Plans, Net of Tax |
Total | |||||||||||||
| Balance at December 31, 2013 |
$ | 17 | $ | 5 | $ | (26 | ) | $ | (4 | ) | ||||||
|
|
|
|
|
|
|
|
|
|||||||||
| Accumulated other comprehensive income (loss) before reclassifications |
(543 | ) | (245 | ) | (59 | ) | (847 | ) | ||||||||
| Amounts reclassified from accumulated other comprehensive income (loss) |
11 | 12 | (6 | ) | 17 | |||||||||||
|
|
|
|
|
|
|
|
|
|||||||||
| Balance at December 31, 2014 |
$ | (515 | ) | $ | (228 | ) | $ | (91 | ) | $ | (834 | ) | ||||
|
|
|
|
|
|
|
|
|
|||||||||
| Accumulated other comprehensive income (loss) before reclassifications |
(764 | ) | (176 | ) | 26 | (914 | ) | |||||||||
| Amounts reclassified from accumulated other comprehensive income (loss) |
— | 199 | (4 | ) | 195 | |||||||||||
|
|
|
|
|
|
|
|
|
|||||||||
| Balance at December 31, 2015 |
$ | (1,279 | ) | $ | (205 | ) | $ | (69 | ) | $ | (1,553 | ) | ||||
|
|
|
|
|
|
|
|
|
|||||||||
| Accumulated other comprehensive income (loss) before reclassifications |
(97 | ) | 32 | 35 | (30 | ) | ||||||||||
| Amounts reclassified from accumulated other comprehensive income (loss) |
— | 134 | (3 | ) | 131 | |||||||||||
|
|
|
|
|
|
|
|
|
|||||||||
| Balance at December 31, 2016 |
$ | (1,376 | ) | $ | (39 | ) | $ | (37 | ) | $ | (1,452 | ) | ||||
|
|
|
|
|
|
|
|
|
|||||||||
The components of amounts reclassified from accumulated other comprehensive income (loss) are as follows (in millions):
| Years Ended December 31, | ||||||||||||||||||||||||||||||||||||||||||||||||
| 2016 | 2015 | 2014 | ||||||||||||||||||||||||||||||||||||||||||||||
| Currency | Derivative | Defined | Currency | Derivative | Defined | Currency | Derivative | Defined | ||||||||||||||||||||||||||||||||||||||||
| Translation | Financial | Benefit | Translation | Financial | Benefit | Translation | Financial | Benefit | ||||||||||||||||||||||||||||||||||||||||
| Adjustments | Instruments | Plans | Total | Adjustments | Instruments | Plans | Total | Adjustments | Instruments | Plans | Total | |||||||||||||||||||||||||||||||||||||
| Revenue |
$ | — | $ | (5 | ) | $ | — | $ | (5 | ) | $ | — | $ | (19 | ) | $ | — | $ | (19 | ) | $ | — | $ | (26 | ) | $ | — | $ | (26 | ) | ||||||||||||||||||
| Cost of revenue |
— | 191 | — | 191 | — | 295 | — | 295 | — | 43 | — | 43 | ||||||||||||||||||||||||||||||||||||
| Selling, general, and administrative |
— | — | (5 | ) | (5 | ) | — | — | (6 | ) | (6 | ) | — | — | (8 | ) | (8 | ) | ||||||||||||||||||||||||||||||
| Other income (expense), net |
— | — | — | — | — | — | — | — | 11 | — | — | 11 | ||||||||||||||||||||||||||||||||||||
| Tax effect |
— | (52 | ) | 2 | (50 | ) | — | (77 | ) | 2 | (75 | ) | — | (5 | ) | 2 | (3 | ) | ||||||||||||||||||||||||||||||
|
|
|
|
|
|
|
|
|
|
|
|
|
|
|
|
|
|
|
|
|
|
|
|
|
|||||||||||||||||||||||||
| $ | — | $ | 134 | $ | (3 | ) | $ | 131 | $ | — | $ | 199 | $ | (4 | ) | $ | 195 | $ | 11 | $ | 12 | $ | (6 | ) | $ | 17 | ||||||||||||||||||||||
|
|
|
|
|
|
|
|
|
|
|
|
|
|
|
|
|
|
|
|
|
|
|
|
|
|||||||||||||||||||||||||
The Company’s reporting currency is the U.S. dollar. A majority of the Company’s international entities in which there is a substantial investment have the local currency as their functional currency. As a result, currency translation adjustments resulting from the process of translating the entities’ financial statements into the reporting currency are reported in other comprehensive income or loss in accordance with ASC Topic 830 “Foreign Currency Matters” (“ASC Topic 830”). For the years ended December 31, 2016, 2015 and 2014, a majority of these local currencies weakened against the U.S. dollar, resulting in a net other comprehensive loss of $97 million, $764 million, and $543 million, respectively, upon the translation from local currencies to the U.S. dollar. Due to the sale of non-core industrial businesses, $11 million of currency translation losses were reclassified from accumulated other comprehensive income (loss) into other income (expense), net in the Consolidated Statements of Income for the year ended December 31, 2014.
The effect of changes in the fair values of derivatives designated as cash flow hedges are accumulated in other comprehensive income (loss), net of tax, until the underlying transactions to which they are designed to hedge are realized. The movement in other comprehensive income (loss) from period to period will be the result of the combination of changes in fair value for open derivatives and the outflow of other comprehensive income (loss) related to cumulative changes in the fair value of derivatives that have settled in the current or prior periods. The accumulated effect was other comprehensive income of $166 million (net of tax of $65 million) for the year ended December 31, 2016, other comprehensive income of $23 million (net of tax of $14 million) for the year ended December 31, 2015 and other comprehensive loss of $233 million (net of tax of $89 million) for the year ended December 31, 2014.
86
Table of Contents
12. Commitments and Contingencies
In November 2016, the Company executed settlement documents settling an internal investigation related to a U.S. federal grand jury subpoenas issued in 2009 and subsequent inquiries from U.S. governmental agencies requesting records related to our compliance with U.S. export trade laws and regulations. We cooperated with agents from the Department of Justice, the Bureau of Industry and Security, the Office of Foreign Assets Control, and U.S. Immigration and Customs Enforcement in responding to the inquiries. At the conclusion of our internal review in the fourth quarter of 2009, we identified possible areas of concern and discussed these areas of concern with the relevant agencies. As anticipated, the administrative fines and penalties agreed to as part of a resolution were within established accruals, and had no material effect on our financial position or results of operations.
In addition, we are involved in various other claims, internal investigations, regulatory agency audits and pending or threatened legal actions involving a variety of matters. In many instances, the Company maintains insurance that covers claims arising from risks associated with the business activities of the Company, including claims for premises liability, product liability and other such claims. The Company carries substantial insurance to cover such risks above a self-insured retention. The Company believes and the Company’s experience has been that such insurance has been sufficient to cover such risks. See Item 1A. “Risk Factors”.
As of December 31, 2016, the Company recorded reserves in an amount believed to be sufficient for contingent liabilities representing all contingencies believed to be probable to cover liabilities. The Company has also assessed the potential for additional losses above the amounts accrued as well as potential losses for matters that are not probable but are reasonably possible. The total potential loss on these matters cannot be determined; however, in our opinion, any ultimate liability, to the extent not otherwise provided for and except for the specific cases referred to above, will not materially affect our financial position, cash flow or results of operations. As it relates to the specific cases referred to above we currently anticipate that any administrative fine or penalty agreed to as part of a resolution would be within established accruals, and would not have a material effect on our financial position or results of operations. To the extent a resolution is not negotiated as anticipated, we cannot predict the timing or effect that any resulting government actions may have on our financial position, cash flow or results of operations. These estimated liabilities are based on the Company’s assessment of the nature of these matters, their progress toward resolution, the advice of legal counsel and outside experts as well as management’s intention and experience.
Our business is affected both directly and indirectly by governmental laws and regulations relating to the oilfield service industry in general, as well as by environmental and safety regulations that specifically apply to our business. Although we have not incurred material costs in connection with our compliance with such laws, there can be no assurance that other developments, such as new environmental laws, regulations and enforcement policies may not result in additional, presently unquantifiable, costs or liabilities to us.
Further, in some instances, direct or indirect consumers of our products and services, entities providing financing for purchases of our products and services or members of the supply chain for our products and services may become involved in governmental investigations, internal investigations, political or other enforcement matters. In such circumstances, such investigations may adversely impact the ability of consumers of our products, entities providing financial support to such consumers or entities in the supply chain to timely perform their business plans or to timely perform under agreements with us.
The on-going, publicly disclosed investigations in Brazil may continue to adversely impact our shipyard customers, their customers, entities providing financing for our shipyard customers and/or entities in the supply chain. We have executed settlements with several shipyard customers since December 28, 2015 concerning contracts for the supply of drilling equipment packages for 16 drillship construction projects in Brazil (collectively the “Supply Contracts”). Pursuant to the terms of the settlements, the Supply Contracts have been terminated. We did not take a charge as a result of the settlement and, on a net basis, there was no change to our prior estimates on our Brazil contracts impacting income. The investigations in Brazil have led to, and are expected to continue to lead to, delays in deliveries to our shipyard customers in Brazil, along with temporary suspension of performance under our remaining supply contracts, and could result in additional cancellations or other breaches of our contracts by our shipyard customers. Our shipyard customers’ customer in Brazil has stated its intent to build some of the drillships it originally contracted for with our shipyard customers. In 2016, in light of the vote by the shareholders of SETE Brasil Participacoes SA to authorize Sete to file for bankruptcy, and a further decline in drilling activity during the first half of the year to record lows and the resulting effect on certain other customers, the Company removed $2.1 billion (unaudited) of orders from its backlog in the first quarter of 2016. Some of the contracts for these orders remain in place and are enforceable. If these customers obtain funding to continue their projects, the Company will pursue resumption of construction and update the backlog accordingly.
87
Table of Contents
Customers (typically drillship owners or drilling contractors) of our shipyard customers have sought, and may in the future seek, to suspend, delay or cancel their contracts or payments due to such shipyards. As a result, our shipyard customers have sought and may in the future seek to suspend, delay or cancel deliveries of our drilling equipment packages. To the extent our shipyard customers and their customers become engaged in disputes or litigation related to any such suspensions, delays or cancellations, we may also become involved, either directly or indirectly, in such disputes or litigation, as we enforce the terms of our contracts with our shipyard customers. While we manage equipment deliveries and collection of payment to mitigate our financial risk, such delays, suspensions, attempted cancellations, breaches of contract or other similar circumstances, could adversely affect our operating results and could reduce our backlog.
The Company leases certain facilities and equipment under operating leases that expire at various dates through 2041. These leases generally contain renewal options and require the lessee to pay maintenance, insurance, taxes and other operating expenses in addition to the minimum annual rentals. Rental expense related to operating leases approximated $246 million, $327 million, and $390 million in 2016, 2015 and 2014, respectively.
Future minimum lease commitments under capital leases and noncancellable operating leases with initial or remaining terms of one year or more at December 31, 2016, are payable as follows (in millions):
| Capital Lease | Operating Lease | |||||||
| Payments | Payments | |||||||
| 2017 |
$ | 15 | $ | 150 | ||||
| 2018 |
15 | 111 | ||||||
| 2019 |
15 | 90 | ||||||
| 2020 |
15 | 76 | ||||||
| 2021 |
15 | 68 | ||||||
| Thereafter |
287 | 371 | ||||||
|
|
|
|
|
|||||
| Total future lease commitments |
$ | 362 | $ | 866 | ||||
|
|
|
|
|
|||||
88
Table of Contents
13. Common Stock
National Oilwell Varco has authorized 1 billion shares of $0.01 par value common stock. The Company also has authorized 10 million shares of $0.01 par value preferred stock, none of which is issued or outstanding.
Cash dividends aggregated $230 million and $710 million for the years ended December 31, 2016 and 2015, respectively. The declaration and payment of future dividends is at the discretion of the Company’s Board of Directors and will be dependent upon the Company’s results of operations, financial condition, capital requirements and other factors deemed relevant by the Company’s Board of Directors.
Total compensation cost that has been charged against income for all share-based compensation arrangements was $107 million, $109 million and $101 million for 2016, 2015 and 2014, respectively. The total income tax benefit recognized in the consolidated statements of income for all share-based compensation arrangements was $30 million, $32 million and $29 million for 2016, 2015 and 2014, respectively.
Under the terms of National Oilwell Varco’s Long-Term Incentive Plan, as amended during the second quarter of 2016, 69.4 million shares of common stock are authorized for the grant of options to officers, key employees, non-employee directors and other persons. The Plan provides for the granting of stock options, performance-based share awards, restricted stock, phantom shares, stock payments and stock appreciation rights (“SARs”). The Plan is now subject to a fungible ratio concept, such that the issuance of stock options and SARs reduces the number of available shares under the Plan on a 1-for-1 basis, and the issuance of other awards reduces the number of available shares under the Plan on a 3-for-1 basis. At December 31, 2016, approximately 27.8 million shares were available for future grants.
Stock Options
Options granted under our stock option plan generally vest over a three-year period starting one year from the date of grant and expire ten years from the date of grant. The purchase price of options granted may not be less than the closing market price of National Oilwell Varco common stock on the date of grant.
We also have an inactive stock option plan that was acquired in connection with the acquisition of Grant Prideco in 2008. We converted the outstanding stock options under this plan to options to acquire our common stock and no further options are being issued under this plan. Stock option information summarized below includes amounts for the National Oilwell Varco Long-Term Incentive Plan and stock plans of acquired companies. Options outstanding at December 31, 2016 under the stock option plans have exercise prices between $23.94 and $77.99 per share, and expire at various dates from March 2, 2017 to February 25, 2026.
On June 2, 2014, as a result of the spin-off and pursuant to the terms of the Employee Matters Agreement and the Plan, outstanding NOV stock-based awards held by continuing NOV employees were adjusted to generally preserve the intrinsic value of the original award. Outstanding NOV stock-based awards held by employees of NOW were converted into similar NOW stock-based awards, each appropriately adjusted to generally preserve the intrinsic value of the original award. Adjustments to the awards are reflected in the following tables and did not have a material impact to compensation expense.
The following summarizes options activity:
| Years Ended December 31, | ||||||||||||||||||||||||
| 2016 | 2015 | 2014 | ||||||||||||||||||||||
| Number | Average | Number | Average | Number | Average | |||||||||||||||||||
| of | Exercise | of | Exercise | of | Exercise | |||||||||||||||||||
| Shares | Price | Shares | Price | Shares | Price | |||||||||||||||||||
| Shares under option at beginning of year |
15,430,307 | $ | 59.50 | 10,881,133 | $ | 61.22 | 11,535,566 | $ | 58.36 | |||||||||||||||
| Granted |
3,672,411 | 28.26 | 5,746,153 | 54.74 | 3,389,547 | 69.00 | ||||||||||||||||||
| Spun-off |
— | — | — | — | (1,567,348 | ) | 70.56 | |||||||||||||||||
| Cancelled |
(1,517,065 | ) | 49.95 | (886,356 | ) | 62.73 | (498,967 | ) | 70.32 | |||||||||||||||
| Exercised |
(146,593 | ) | 28.53 | (310,623 | ) | 22.56 | (1,977,665 | ) | 53.56 | |||||||||||||||
|
|
|
|
|
|
|
|
|
|
|
|
|
|||||||||||||
| Shares under option at end of year |
17,439,060 | $ | 54.08 | 15,430,307 | $ | 59.50 | 10,881,133 | $ | 61.22 | |||||||||||||||
|
|
|
|
|
|
|
|
|
|
|
|
|
|||||||||||||
| Exercisable at end of year |
9,828,897 | $ | 61.56 | 7,498,414 | $ | 60.30 | 5,903,712 | $ | 55.06 | |||||||||||||||
|
|
|
|
|
|
|
|
|
|
|
|
|
|||||||||||||
89
Table of Contents
The following summarizes information about stock options outstanding at December 31, 2016:
| Weighted-Avg | Options Outstanding | Options Exercisable | ||||||||||||||||||
| Remaining | Weighted-Avg | Weighted-Avg | ||||||||||||||||||
| Range of Exercise Price |
Contractual Life | Shares | Exercise Price | Shares | Exercise Price | |||||||||||||||
| $12.15 - $55.00 |
7.56 | 10,108,458 | $ | 42.77 | 3,312,182 | $ | 45.43 | |||||||||||||
| $55.01 - $70.00 |
6.21 | 4,720,781 | 66.21 | 3,906,894 | 65.63 | |||||||||||||||
| $70.01 - $77.99 |
4.66 | 2,609,821 | 75.95 | 2,609,821 | 75.95 | |||||||||||||||
|
|
|
|
|
|
|
|
|
|
|
|||||||||||
| Total |
6.76 | 17,439,060 | $ | 54.08 | 9,828,897 | $ | 61.56 | |||||||||||||
|
|
|
|
|
|
|
|
|
|
|
|||||||||||
The weighted-average fair value of options granted during 2016, 2015 and 2014, was approximately $6.44, $15.41 and $25.60 per share, respectively, as determined using the Black-Scholes option-pricing model. The total intrinsic value of options exercised during 2016 and 2015, was $4 million and $9 million, respectively.
The determination of fair value of share-based payment awards on the date of grant using an option-pricing model is affected by our stock price as well as assumptions regarding a number of highly complex and subjective variables. These variables include, but are not limited to, the expected stock price volatility over the term of the awards, and actual and projected employee stock option exercise activity. The use of the Black Scholes model requires the use of actual employee exercise activity data and the use of a number of complex assumptions including expected volatility, risk-free interest rate, expected dividends and expected term.
| Years Ended December 31, | ||||||||||||
| 2016 | 2015 | 2014 | ||||||||||
| Valuation Assumptions: |
||||||||||||
| Expected volatility |
48.6 | % | 49.1 | % | 49.4 | % | ||||||
| Risk-free interest rate |
1.2 | % | 1.5 | % | 1.5 | % | ||||||
| Expected dividends |
$ | 6.52 | $ | 3.36 | $ | 1.39 | ||||||
| Expected term (in years) |
3.0 | 3.0 | 3.7 | |||||||||
The Company used the actual volatility for traded options for the past 10 years prior to option date as the expected volatility assumption required in the Black Scholes model.
The risk-free interest rate assumption is based upon observed interest rates appropriate for the term of our employee stock options. The dividend yield assumption is based on the history and expectation of dividend payouts. The estimated expected term is based on actual employee exercise activity for the past ten years.
As stock-based compensation expense recognized in the Consolidated Statement of Income in 2016 is based on awards ultimately expected to vest, it has been reduced for estimated forfeitures. ASC Topic 718 requires forfeitures to be estimated at the time of grant and revised, if necessary, in subsequent periods if actual forfeitures differ from those estimates. Forfeitures were estimated based on historical experience.
The following summary presents information regarding outstanding options at December 31, 2016 and changes during 2016 with regard to options under all stock option plans:
| Weighted | ||||||||||||||||
| Weighted- Average |
Remaining Contractual |
|||||||||||||||
| Shares | Exercise Price |
Term (years) |
Aggregate Intrinsic Value |
|||||||||||||
| Outstanding at December 31, 2015 |
15,430,307 | $ | 59.50 | 5.16 | $ | 5,894,977 | ||||||||||
| Granted |
3,672,411 | $ | 28.26 | |||||||||||||
| Cancelled |
(1,517,065 | ) | $ | 49.95 | ||||||||||||
| Exercised |
(146,593 | ) | $ | 28.53 | ||||||||||||
|
|
|
|||||||||||||||
| Outstanding at December 31, 2016 |
17,439,060 | $ | 54.08 | 6.76 | $ | 37,928,494 | ||||||||||
|
|
|
|||||||||||||||
| Vested or expected to vest |
17,212,352 | $ | 54.08 | 6.76 | $ | 37,408,874 | ||||||||||
|
|
|
|||||||||||||||
| Exercisable at December 31, 2016 |
9,828,897 | $ | 61.56 | 5.42 | $ | 6,700,856 | ||||||||||
|
|
|
|||||||||||||||
90
Table of Contents
At December 31, 2016, total unrecognized compensation cost related to nonvested stock options was $45 million. This cost is expected to be recognized over a weighted-average period of two years. The total fair value of stock options vested in 2016, 2015 and 2014 was approximately $61 million, $72 million and $67 million, respectively. Cash received from option exercises for 2016, 2015 and 2014 was $4 million, $7 million and $108 million, respectively. The actual tax benefit realized for the tax deductions from option exercises totaled nil, $3 million and $16 million for 2016, 2015 and 2014, respectively. Cash used to settle equity instruments granted under all share-based payment arrangements for 2016, 2015 and 2014 was not material for any period.
Stock Appreciation Rights
On February 24, 2016, the Company also granted 4,618,400 SARs with an exercise price of $28.24 and a fair value of $6.44 per SAR. The SARs are cash-settled awards and vest over a three-year period from the grant date. Upon exercise of the SARs, the employee is entitled to receive cash payment for the appreciation in the value of our common stock over the exercise price. We account for the cash-settled SARs as liability awards, which require the awards to be revalued at each reporting period.
The following summary presents information regarding outstanding SARs at December 31, 2016 and changes during 2016 with regard to SARs:
| Year Ended December 31, | ||||||||
| 2016 | ||||||||
| Number | Average | |||||||
| of | Exercise | |||||||
| Shares | Price | |||||||
| Shares under SARs at beginning of year |
— | $ | — | |||||
| Granted |
4,618,400 | 28.32 | ||||||
| Cancelled |
(276,660 | ) | 28.24 | |||||
|
|
|
|
|
|||||
| Shares under SARs at end of year |
4,341,740 | $ | 28.32 | |||||
|
|
|
|
|
|||||
| Exercisable at end of year |
— | $ | — | |||||
|
|
|
|
|
|||||
As of December 31, 2016, there was $49 million of unrecognized compensation expense related to nonvested SARs, which is expected to be recognized over a weighted-average period of two years. The expense recognized in 2016 and the liability for cash-settled SARs was $20 million at December 31, 2016.
Restricted Shares
The Company issues restricted stock awards and restricted stock units to officers and key employees in addition to stock options. On February 24, 2016, the Company granted 1,732,095 shares of restricted stock and restricted stock units with a fair value of $28.24 per share; and performance share awards to senior management employees with potential payouts varying from zero to 341,780 shares. The restricted stock and restricted stock units vest on the third anniversary of the date of grant or in three equal annual installments commencing on the first anniversary of the date of grant. The performance share awards can be earned based on performance against established goals over a three-year performance period. The performance share awards are based entirely on a TSR (total shareholder return) goal. Performance against the TSR goal is determined by comparing the performance of the Company’s TSR with the TSR performance of the members of the OSX index for the three-year performance period.
On May 18, 2016, the Company granted 44,520 restricted stock awards with a fair value of $31.45 per share. The awards were granted to non-employee members of the board of directors and vest on the first anniversary of the grant date.
On November 15, 2016, the Company granted 1,435,450 shares of restricted stock and restricted stock units with a fair value of $36.04. The restricted stock and restricted stock units were granted to key employees and vest over a three-year period from the date of grant.
91
Table of Contents
The following summary presents information regarding outstanding restricted shares:
| Years Ended December 31, | ||||||||||||||||||||||||
| 2016 | 2015 | 2014 | ||||||||||||||||||||||
| Weighted- | Weighted- | Weighted- | ||||||||||||||||||||||
| Number | Average | Number | Average | Number | Average | |||||||||||||||||||
| of | Grant Date | of | Grant Date | of | Grant Date | |||||||||||||||||||
| Units | Fair Value | Units | Fair Value | Units | Fair Value | |||||||||||||||||||
| Nonvested at beginning of year |
1,969,250 | $ | 61.53 | 1,569,141 | $ | 73.73 | 1,643,193 | $ | 67.98 | |||||||||||||||
| Granted |
3,384,325 | 31.59 | 954,075 | 53.27 | 708,821 | 70.14 | ||||||||||||||||||
| Spin-off |
— | — | — | — | (319,949 | ) | 70.56 | |||||||||||||||||
| Vested |
(565,202 | ) | 29.32 | (405,327 | ) | 54.30 | (348,981 | ) | 74.97 | |||||||||||||||
| Cancelled |
(224,390 | ) | 49.95 | (148,639 | ) | 62.73 | (113,943 | ) | 70.32 | |||||||||||||||
|
|
|
|
|
|
|
|
|
|
|
|
|
|||||||||||||
| Nonvested at end of year |
4,563,983 | $ | 41.10 | 1,969,250 | $ | 61.53 | 1,569,141 | $ | 73.73 | |||||||||||||||
|
|
|
|
|
|
|
|
|
|
|
|
|
|||||||||||||
The weighted-average grant day fair value of restricted stock awards and restricted stock units granted during the years ended 2016, 2015 and 2014 was $31.59, $53.27 and $70.14 per share, respectively. There were 565,202; 405,327 and 348,981 restricted stock awards that vested during 2016, 2015 and 2014, respectively. At December 31, 2016, there was approximately $101 million of unrecognized compensation cost related to nonvested restricted stock awards and restricted stock units, which is expected to be recognized over a weighted-average period of two years.
92
Table of Contents
14. Income Taxes
The domestic and foreign components of income before income taxes were as follows (in millions):
| Years Ended December 31, | ||||||||||||
| 2016 | 2015 | 2014 | ||||||||||
| Domestic |
$ | (2,095 | ) | $ | (1,577 | ) | $ | 1,415 | ||||
| Foreign |
(528 | ) | 988 | 2,079 | ||||||||
|
|
|
|
|
|
|
|||||||
| $ | (2,623 | ) | $ | (589 | ) | $ | 3,494 | |||||
|
|
|
|
|
|
|
|||||||
The components of the provision for income taxes consisted of (in millions):
| Years Ended December 31, | ||||||||||||
| 2016 | 2015 | 2014 | ||||||||||
| Current: |
||||||||||||
| Federal |
$ | (79 | ) | $ | 30 | $ | 681 | |||||
| State |
(4 | ) | (58 | ) | 43 | |||||||
| Foreign |
74 | 464 | 615 | |||||||||
|
|
|
|
|
|
|
|||||||
| Total current income tax provision |
(9 | ) | 436 | 1,339 | ||||||||
|
|
|
|
|
|
|
|||||||
| Deferred: |
||||||||||||
| Federal |
(132 | ) | (41 | ) | (309 | ) | ||||||
| State |
(7 | ) | (38 | ) | (5 | ) | ||||||
| Foreign |
(59 | ) | (179 | ) | 14 | |||||||
|
|
|
|
|
|
|
|||||||
| Total deferred income tax benefit |
(198 | ) | (258 | ) | (300 | ) | ||||||
|
|
|
|
|
|
|
|||||||
| Total income tax provision |
$ | (207 | ) | $ | 178 | $ | 1,039 | |||||
|
|
|
|
|
|
|
|||||||
The difference between the effective tax rate reflected in the provision for income taxes and the U.S. federal statutory rate was as follows (in millions):
| Years Ended December 31, | ||||||||||||
| 2016 | 2015 | 2014 | ||||||||||
| Federal income tax at U.S. statutory rate |
$ | (918 | ) | $ | (206 | ) | $ | 1,223 | ||||
| Foreign income tax rate differential |
32 | (110 | ) | (261 | ) | |||||||
| Goodwill impairment |
271 | 462 | — | |||||||||
| Nondeductible expenses |
30 | 66 | 24 | |||||||||
| Foreign dividends, net of foreign tax credits |
(25 | ) | 28 | 132 | ||||||||
| Tax rate change on timing differences |
(8 | ) | (45 | ) | (2 | ) | ||||||
| Change in tax reserve |
11 | 69 | (11 | ) | ||||||||
| Prior years taxes |
(29 | ) | (47 | ) | (11 | ) | ||||||
| Tax impact on foreign exchange |
(4 | ) | (46 | ) | 28 | |||||||
| Change in deferred tax valuation allowance |
476 | 15 | (83 | ) | ||||||||
| Other |
(43 | ) | (8 | ) | — | |||||||
|
|
|
|
|
|
|
|||||||
| Total income tax provision |
$ | (207 | ) | $ | 178 | $ | 1,039 | |||||
|
|
|
|
|
|
|
|||||||
The effective tax rate for the year ended December 31, 2016 was 7.9%, compared to (30.2)% for 2015. Impairment of goodwill not deductible for tax purposes, lower tax rates on losses incurred in foreign jurisdictions, and an increase in valuation allowance on deferred taxes, which, when applied to losses generated during the period, resulted in a lower effective tax rate than the U.S. statutory rate. Included in the increase in valuation allowance is $404 million recorded against excess foreign tax credits that are not expected to be realized before expiration in the current depressed market conditions.
93
Table of Contents
Significant components of our deferred tax assets and liabilities were as follows (in millions):
| December 31, | ||||||||
| 2016 | 2015 | |||||||
| Deferred tax assets: |
||||||||
| Allowances and operating liabilities |
$ | 534 | $ | 491 | ||||
| Net operating loss carryforwards |
153 | 170 | ||||||
| Postretirement benefits |
60 | 79 | ||||||
| Tax credit carryforwards |
405 | 166 | ||||||
| Other |
164 | 21 | ||||||
| Valuation allowance |
(544 | ) | (63 | ) | ||||
|
|
|
|
|
|||||
| Total deferred tax assets |
772 | 864 | ||||||
|
|
|
|
|
|||||
| Deferred tax liabilities: |
||||||||
| Tax over book depreciation |
267 | 277 | ||||||
| Intangible assets |
1,148 | 1,323 | ||||||
| Deferred income |
185 | 232 | ||||||
| Accrued U.S. tax on unremitted earnings |
53 | 55 | ||||||
| Other |
97 | 209 | ||||||
|
|
|
|
|
|||||
| Total deferred tax liabilities |
1,750 | 2,096 | ||||||
|
|
|
|
|
|||||
| Net deferred tax liability |
$ | 978 | $ | 1,232 | ||||
|
|
|
|
|
|||||
On January 1, 2016, the Company adopted Accounting Standard Update No. 2015-17, “Balance Sheet Classification of Deferred Taxes” on a retrospective basis. Rather than classify deferred tax assets and liabilities as current and non-current, this update requires that deferred tax assets and liabilities be classified as non-current in the Consolidated Balance Sheet. Adoption of this standard resulted in a reclassification of our current deferred tax assets and liabilities to non-current deferred tax assets and liabilities in our Consolidated Balance Sheet. Prior periods have been retrospectively adjusted. At December 31, 2015, $376 million of current deferred tax assets have been reclassified to non-current deferred tax liabilities, $358 million of non-current deferred tax assets have been reclassified to non-current deferred tax liabilities, and $291 million of current deferred tax liabilities have been reclassified to non-current deferred tax liabilities.
The balance of unrecognized tax benefits at December 31, 2016 and 2015 was $78 million and $46 million, respectively. For the year ended December 31, 2015 a $69 million uncertain tax position was identified in a foreign jurisdiction that was included as an increase and settlement during the year and the completion of audits in foreign jurisdictions resulted in a $75 million decrease in uncertain tax positions.
A reconciliation of the beginning and ending amount of unrecognized tax benefits is as follows (in millions):
| 2016 | 2015 | 2014 | ||||||||||
| Unrecognized tax benefit at beginning of year |
$ | 46 | $ | 115 | $ | 127 | ||||||
| Gross increase for current period tax positions |
3 | 8 | 3 | |||||||||
| Gross increase for tax positions in prior years |
65 | 75 | — | |||||||||
| Gross decrease for tax positions in prior years |
(21 | ) | (75 | ) | — | |||||||
| Settlements |
(3 | ) | (69 | ) | — | |||||||
| Lapse of statute of limitations |
(12 | ) | (8 | ) | (15 | ) | ||||||
|
|
|
|
|
|
|
|||||||
| Unrecognized tax benefit at end of year |
$ | 78 | $ | 46 | $ | 115 | ||||||
|
|
|
|
|
|
|
|||||||
Substantially all of the unrecognized tax benefits, if ultimately realized, would be recorded as a benefit to the effective tax rate. The Company anticipates that it is reasonably possible that the amount of unrecognized tax benefits may decrease by up to $15 million in the next twelve months due to settlements and conclusions of tax examinations. To the extent penalties and interest would be assessed on any underpayment of income tax, such accrued amounts have been classified as a component of income tax expense in the financial statements consistent with the Company’s policy. For the years ended December 31, 2016, 2015 and 2014, we recorded income tax expense of $10 million, $1 million and $1 million, respectively, for interest and penalty related to unrecognized tax benefits. As of December 31, 2016 and 2015, the Company had accrued $15 million and $5 million, respectively, of interest and penalty relating to unrecognized tax benefits.
94
Table of Contents
The Company is subject to taxation in the United States, various states and foreign jurisdictions. The Company has significant operations in the United States, Norway, Canada, the United Kingdom, the Netherlands, France and Denmark. Tax years that remain subject to examination by major tax jurisdictions vary by legal entity, but are generally open in the U.S. for tax years ending after 2012 and outside the U.S. for tax years ending after 2010.
Net operating loss carryforwards by jurisdiction and expiration as of December 31, 2016 were as follows (in millions):
| Federal | State | Foreign | Total | |||||||||||||
| 2017 - 2021 Expiration |
$ | 8 | $ | 1 | $ | 78 | $ | 87 | ||||||||
| 2022 - 2033 Expiration |
16 | 14 | 102 | 132 | ||||||||||||
| 2034 - 2036 Expiration |
— | 154 | 65 | 219 | ||||||||||||
| Unlimited Expiration |
— | — | 261 | 261 | ||||||||||||
|
|
|
|
|
|
|
|
|
|||||||||
| Total Net Operating Loss (NOL) |
$ | 24 | $ | 169 | $ | 506 | $ | 699 | ||||||||
|
|
|
|
|
|
|
|
|
|||||||||
| Tax Effected NOL |
$ | 8 | $ | 9 | $ | 136 | $ | 153 | ||||||||
| Valuation Allowance (VA) |
(7 | ) | (1 | ) | (112 | ) | (120 | ) | ||||||||
|
|
|
|
|
|
|
|
|
|||||||||
| NOL Net of VA |
$ | 1 | $ | 8 | $ | 24 | $ | 33 | ||||||||
|
|
|
|
|
|
|
|
|
|||||||||
The Company has $404 million of excess foreign tax credits in the United States as of December 31, 2016, of which $11 million, $141 million and $252 million will expire in 2020, 2022 and 2026, respectively. As of December 31, 2016 the Company has remaining tax deductible goodwill of $175 million, resulting from acquisitions. The amortization of this goodwill is deductible over various periods ranging up to 15 years.
Undistributed earnings of certain of the Company’s foreign subsidiaries amounted to $5,673 million at December 31, 2016. Those earnings are considered to be indefinitely reinvested and no provision for U.S. federal and state income taxes has been made. Distribution of these earnings in the form of dividends or otherwise could result in U.S. federal taxes (subject to an adjustment for foreign tax credits) and withholding taxes payable in various foreign countries. Determination of the amount of unrecognized deferred U.S. income tax liability is not practical; however, unrecognized foreign tax credit carryforwards would be available to reduce some portion of the U.S. liability.
95
Table of Contents
15. Business Segments and Geographic Areas
The Company’s operations are organized into four reportable segments: Rig Systems, Rig Aftermarket, Wellbore Technologies and Completion & Production Solutions. Within the four reporting segments, the Company has one business unit under Rig Systems, one business unit under Rig Aftermarket, and aggregated six business units under Wellbore Technologies and nine business units under Completion & Production Solutions, for a total of 17 business units. The Company has aggregated each of its business units in one of the four reporting segments based on the guidelines of ASC Topic 280, “Segment Reporting” (“ASC Topic 280”).
Rig Systems
The Company’s Rig Systems segment makes and supports the capital equipment and integrated systems needed to drill oil and gas wells on land and offshore. The segment designs, manufactures and sells land rigs, offshore drilling equipment packages, including installation and commissioning services, and drilling rig components that mechanize and automate the drilling process and rig functionality.
Equipment and technologies in Rig Systems include: substructures, derricks, and masts; cranes; pipe lifting, racking, rotating, and assembly systems; fluid transfer technologies, such as mud pumps; pressure control equipment, including blowout preventers; power transmission systems, including drives and generators; and rig instrumentation and control systems.
Rig Systems supports land and offshore drillers. Demand for the segment’s products depends on drilling contractors’ and oil and gas companies’ capital spending plans, specifically capital expenditures on rig construction and refurbishment.
To achieve higher efficiencies and reduce costs in the current market, the Company combined the Rig Offshore and Rig Land reporting units during the third quarter of 2016. See Note 2.
Rig Aftermarket
The Company’s Rig Aftermarket segment provides comprehensive aftermarket products and services to support land and offshore rigs, and drilling rig components manufactured by the Company’s Rig Systems segment.
The segment provides spare parts, repair, and rentals as well as technical support, field service and first well support, field engineering, and customer training through a network of aftermarket service and repair facilities strategically located in major areas of drilling operations.
Rig Aftermarket supports land and offshore drillers. Demand for the segment’s products and services depends on overall levels of oilfield drilling activity, which drives demand for spare parts, service, and repair for Rig Systems’ large installed base of equipment; and secondarily on drilling contractors’ and oil and gas companies’ capital spending plans, specifically capital expenditures on rig refurbishment and re-certification.
Wellbore Technologies
The Company’s Wellbore Technologies segment designs, manufactures, rents, and sells a variety of equipment and technologies used to perform drilling operations, and offers services that optimize their performance, including: solids control and waste management equipment and services; drilling fluids; portable power generation; premium drill pipe; wired pipe; drilling optimization and automation services; tubular inspection, repair and coating services; rope access inspection; instrumentation; measuring and monitoring; downhole and fishing tools; steerable technologies; hole openers; and drill bits.
Wellbore Technologies focuses on oil and gas companies and supports drilling contractors, oilfield service companies, and oilfield equipment rental companies. Demand for the segment’s products and services depends on the level of oilfield drilling activity by oil and gas companies, drilling contractors, and oilfield service companies.
Completion & Production Solutions
The Company’s Completion & Production Solutions segment integrates technologies for well completions and oil and gas production. The segment designs, manufactures, and sells equipment and technologies needed for hydraulic fracture stimulation, including pressure pumping trucks, blenders, sanders, hydration units, injection units, flowline, manifolds and wellheads; well intervention, including coiled tubing units, coiled tubing, and wireline units and tools; onshore production, including composite pipe, surface transfer and progressive cavity pumps, and artificial lift systems; and, offshore production, including floating production systems and subsea production technologies.
Completion & Production Solutions supports service companies and oil and gas companies. Demand for the segment’s products depends on the level of oilfield completions and workover activity by oilfield service companies and drilling contractors, and capital spending plans by oil and gas companies and oilfield service companies.
The Company did not have any customers with revenues greater than 10% of total revenue for the years ended December 31, 2016, 2015, or 2014.
96
Table of Contents
Geographic Areas:
The following table presents consolidated revenues by country based on sales destination of the products or services (in millions):
| Years Ended December 31, | ||||||||||||
| 2016 | 2015 | 2014 | ||||||||||
| United States |
$ | 1,961 | $ | 3,640 | $ | 6,097 | ||||||
| China |
557 | 1,623 | 1,905 | |||||||||
| South Korea |
495 | 1,835 | 3,472 | |||||||||
| Singapore |
340 | 1,035 | 1,157 | |||||||||
| Norway |
339 | 555 | 881 | |||||||||
| United Arab Emirates |
334 | 532 | 459 | |||||||||
| United Kingdom |
299 | 634 | 715 | |||||||||
| Saudi Arabia |
258 | 416 | 444 | |||||||||
| Brazil |
242 | 605 | 1,299 | |||||||||
| Canada |
217 | 365 | 645 | |||||||||
| Other Countries |
2,209 | 3,517 | 4,366 | |||||||||
|
|
|
|
|
|
|
|||||||
| Total |
$ | 7,251 | $ | 14,757 | $ | 21,440 | ||||||
|
|
|
|
|
|
|
|||||||
The following table presents long-lived assets by country based on the location (in millions):
| December 31, | ||||||||
| 2016 | 2015 | |||||||
| United States |
$ | 1,810 | $ | 1,735 | ||||
| Brazil |
281 | 226 | ||||||
| United Kingdom |
137 | 163 | ||||||
| Denmark |
120 | 128 | ||||||
| South Korea |
94 | 102 | ||||||
| United Arab Emirates |
90 | 58 | ||||||
| Russia |
88 | 68 | ||||||
| Canada |
82 | 78 | ||||||
| Mexico |
77 | 93 | ||||||
| Singapore |
63 | 78 | ||||||
| Other Countries |
308 | 395 | ||||||
|
|
|
|
|
|||||
| Total |
$ | 3,150 | $ | 3,124 | ||||
|
|
|
|
|
|||||
97
Table of Contents
Business Segments:
The following table presents selected financial data by business segment (in millions):
| Rig Systems | Rig Aftermarket |
Wellbore Technologies |
Completion & Production Solutions |
Eliminations and Corporate Costs (1) |
Total | |||||||||||||||||||
| December 31, 2016 |
||||||||||||||||||||||||
| Revenue |
$ | 2,386 | $ | 1,416 | $ | 2,199 | $ | 2,241 | $ | (991 | ) | $ | 7,251 | |||||||||||
| Operating profit (loss) |
(969 | ) | 229 | (770 | ) | (266 | ) | (635 | ) | (2,411 | ) | |||||||||||||
| Capital expenditures |
20 | 4 | 124 | 61 | 75 | 284 | ||||||||||||||||||
| Depreciation and amortization |
72 | 22 | 384 | 209 | 16 | 703 | ||||||||||||||||||
| Goodwill |
258 | 877 | 2,874 | 2,058 | — | 6,067 | ||||||||||||||||||
| Total assets |
3,255 | 2,072 | 7,911 | 5,765 | 2,137 | 21,140 | ||||||||||||||||||
| December 31, 2015 |
||||||||||||||||||||||||
| Revenue |
$ | 6,964 | $ | 2,515 | $ | 3,718 | $ | 3,365 | $ | (1,805 | ) | $ | 14,757 | |||||||||||
| Operating profit |
1,322 | 652 | (1,573 | ) | 187 | (978 | ) | (390 | ) | |||||||||||||||
| Capital expenditures |
81 | 10 | 180 | 87 | 95 | 453 | ||||||||||||||||||
| Depreciation and amortization |
84 | 23 | 403 | 223 | 14 | 747 | ||||||||||||||||||
| Goodwill |
1,232 | 877 | 2,874 | 1,997 | — | 6,980 | ||||||||||||||||||
| Total assets |
6,772 | 2,455 | 8,766 | 5,916 | 2,061 | 25,970 | ||||||||||||||||||
| December 31, 2014 |
||||||||||||||||||||||||
| Revenue |
$ | 9,848 | $ | 3,222 | $ | 5,722 | $ | 4,645 | $ | (1,997 | ) | $ | 21,440 | |||||||||||
| Operating profit |
2,118 | 935 | 1,000 | 730 | (1,170 | ) | 3,613 | |||||||||||||||||
| Capital expenditures |
133 | 12 | 262 | 184 | 108 | 699 | ||||||||||||||||||
| Depreciation and amortization |
86 | 26 | 438 | 223 | 5 | 778 | ||||||||||||||||||
| Goodwill |
1,236 | 877 | 4,357 | 2,069 | — | 8,539 | ||||||||||||||||||
| Total assets |
8,052 | 2,789 | 11,687 | 7,072 | 3,962 | 33,562 | ||||||||||||||||||
| (1) | Sales from one segment to another generally are priced at estimated equivalent commercial selling prices; however, segments originating an external sale are credited with the full profit to the company. Eliminations include intercompany transactions conducted between the four reporting segments that are eliminated in consolidation. Intercompany transactions within each reporting segment are eliminated within each reporting segment. Also included in the eliminations column are capital expenditures and total assets related to corporate. Corporate assets consist primarily of cash and fixed assets. |
98
Table of Contents
16. Spin-off of distribution business
On May 30, 2014, the Company completed the previously announced spin-off of its distribution business into an independent public company named NOW Inc., which trades on the New York Stock Exchange under the symbol “DNOW”. After the close of the New York Stock Exchange on May 30, 2014, the stockholders of record as of May 22, 2014 (the “Record Date”) received one share of NOW Inc. common stock for every four shares of NOV common stock held on the Record Date. No fractional shares of NOW Inc. common stock were distributed. Instead, the transfer agent aggregated any fractional shares into whole shares, sold those whole shares in the open market at prevailing rates and distributed the net cash proceeds, after deducting any taxes required to be withheld and any amount equal to all brokerage charges and commissions, pro rata to each holder who would otherwise have been entitled to receive fractional shares in the distribution.
Other items incurred as a result of the spin-off were $36 million for the year ended December 31, 2014 and are included in continuing operations. The following table presents selected financial information, through May 30, 2014, regarding the results of operations of our distribution business, which is reported as discontinued operations (in millions):
| Year Ended | ||||
| December 31, 2014 | ||||
| Revenue from discontinued operations |
$ | 1,701 | ||
|
|
|
|||
| Income from discontinued operations before income taxes |
83 | |||
|
|
|
|||
| Income tax expense |
31 | |||
|
|
|
|||
| Income from discontinued operations |
$ | 52 | ||
|
|
|
|||
Prior to the spin-off, sales to NOW were $231 million for the period ended May 30, 2014 and purchases from NOW were $82 million for the period ended May 30, 2014. Prior to May 30, 2014, the spin-off date, revenue and related cost of revenue were eliminated in consolidation between NOV and NOW. Beginning May 31, 2014, this revenue and cost of revenue represent third-party transactions with NOW.
17. Quarterly Financial Data (Unaudited)
Summarized quarterly results, were as follows (in millions, except per share data):
| First | Second | Third | Fourth | |||||||||||||
| Quarter | Quarter | Quarter | Quarter | |||||||||||||
| Year ended December 31, 2016 |
||||||||||||||||
| Revenue |
$ | 2,189 | $ | 1,724 | $ | 1,646 | $ | 1,692 | ||||||||
| Gross profit (loss) |
244 | 35 | 79 | (459 | ) | |||||||||||
| Net loss attributable to Company |
(119 | ) | (217 | ) | (1,362 | ) | (714 | ) | ||||||||
| Net loss attributable to Company per basic share |
(0.32 | ) | (0.58 | ) | (3.62 | ) | (1.90 | ) | ||||||||
| Net loss attributable to Company per diluted share |
(0.32 | ) | (0.58 | ) | (3.62 | ) | (1.90 | ) | ||||||||
| Cash dividends per share |
0.46 | 0.05 | 0.05 | 0.05 | ||||||||||||
| Year ended December 31, 2015 |
||||||||||||||||
| Revenue |
$ | 4,820 | $ | 3,909 | $ | 3,306 | $ | 2,722 | ||||||||
| Gross profit |
1,177 | 855 | 672 | 359 | ||||||||||||
| Net income (loss) attributable to Company |
310 | 289 | 155 | (1,523 | ) | |||||||||||
| Net income (loss) attributable to Company per basic share |
0.76 | 0.75 | 0.41 | (4.06 | ) | |||||||||||
| Net income (loss) attributable to Company per diluted share |
0.76 | 0.74 | 0.41 | (4.06 | ) | |||||||||||
| Cash dividends per share |
0.46 | 0.46 | 0.46 | 0.46 | ||||||||||||
99
Table of Contents
NATIONAL OILWELL VARCO, INC.
VALUATION AND QUALIFYING ACCOUNTS
Years Ended December 31, 2016, 2015 and 2014
(in millions)
| Balance beginning of year |
Additions (Deductions) charged to costs and expenses |
Charge off’s and other |
Balance end of year |
|||||||||||||
| Allowance for doubtful accounts: |
||||||||||||||||
| 2016 |
$ | 159 | $ | 52 | $ | (2 | ) | $ | 209 | |||||||
| 2015 |
125 | 77 | (43 | ) | 159 | |||||||||||
| 2014 |
132 | 31 | (38 | ) | 125 | |||||||||||
| Reserve for excess and obsolete inventories: |
|
|||||||||||||||
| 2016 |
$ | 500 | $ | 606 | $ | (89 | ) | $ | 1,017 | |||||||
| 2015 |
370 | 186 | (56 | ) | 500 | |||||||||||
| 2014 |
396 | 128 | (154 | ) | 370 | |||||||||||
| Valuation allowance for deferred tax assets: |
||||||||||||||||
| 2016 |
$ | 63 | $ | 476 | $ | 5 | $ | 544 | ||||||||
| 2015 |
48 | 15 | — | 63 | ||||||||||||
| 2014 |
133 | (83 | ) | (2 | ) | 48 | ||||||||||
| Warranty reserve: |
||||||||||||||||
| 2016 |
$ | 244 | $ | 50 | $ | (122 | ) | $ | 172 | |||||||
| 2015 |
272 | 92 | (120 | ) | 244 | |||||||||||
| 2014 |
228 | 123 | (79 | ) | 272 | |||||||||||
100