Attached files
| file | filename |
|---|---|
| EX-99.1 - EXHIBIT 99.1 - CATHAY GENERAL BANCORP | tv477702_ex99-1.htm |
| 8-K - FORM 8-K - CATHAY GENERAL BANCORP | tv477702_8k.htm |
Exhibit 99.2
Cathay General Bancorp & Cathay Bank
Dodd-Frank Act Stress Test
Results Disclosure
October 25, 2017
Overview
Cathay General Bancorp was incorporated in 1990 under the laws of the State of Delaware (“Bancorp”). We are the holding company of Cathay Bank, a California state-chartered commercial bank, seven limited partnerships investing in affordable housing investments in which the Bank is the sole limited partner, GBC Venture Capital, Inc., and Asia Realty Corp. We also own 100% of the common stock of five statutory business trusts created for the purpose of issuing capital securities. We are regulated as a bank holding company by the Board of Governors of the Federal Reserve System (“Federal Reserve”). Cathay Bank is regulated as a California commercial bank by the California Department of Business Oversight (“DBO”) and the Federal Deposit Insurance Corporation (“FDIC”). In this disclosure, the term “Bancorp” refers to Cathay General Bancorp and the term “Bank” refers to Cathay Bank. The terms “Company,” “we,” “us,” and “our” refer to Bancorp and the Bank collectively.
Bancorp and the Bank are required to conduct annual stress testing pursuant to the requirements of 12 CFR Part 252 and 12 CFR Part 325, respectively (known as the Dodd-Frank Act Stress Test or “DFAST”). The Company conducted the 2017 severely adverse scenario stress test using the severely adverse economic scenario provided by the Federal Reserve in the 2017 Supervisory Scenarios for Annual Stress Tests Required under the Dodd-Frank Act Stress Testing Rules and the Capital Plan Rule.
The Company’s capital ratios are projected to significantly exceed the regulatory minimums for adequately capitalized financial institutions throughout the nine-quarter hypothetical Supervisory Severely Adverse Scenario.
Supervisory Severely Adverse Scenario
The Supervisory Severely Adverse Scenario is characterized by a severe global recession that is accompanied by a period of heightened stress in corporate loan markets and commercial real estate markets.
In this scenario, the level of U.S. real GDP begins to decline in the first quarter of 2017 and reaches a trough in the second quarter of 2018 that is about 6½ percent below the pre-recession peak. The unemployment rate increases by about 5¼ percentage points, to 10 percent, by the third quarter of 2018. Headline consumer price inflation falls to about 1¼ percent at an annual rate by the second quarter of 2017 and then rises to about 1¾ percent at an annual rate by the middle of 2018.
As a result of the severe decline in real activity, short-term Treasury rates fall and remain near zero through the end of the scenario period. The 10-year Treasury yield drops to ¾ percent in the first quarter of 2017, rising gradually thereafter to around 1½ percent by the first quarter of 2019 and to about 1¾ percent by the first quarter of 2020. Financial conditions in corporate and real estate lending markets are stressed severely. The spread between yields on investment-grade corporate bonds and yields on long-term Treasury securities widens to about 5¾ percentage points by the end of 2017, an increase of 3½ percentage points relative to the fourth quarter of 2016. The spread between mortgage rates and 10-year Treasury yields widens to over 3½ percentage points over the same time period.
1
Asset prices drop sharply in this scenario. Equity prices fall by 50 percent through the end of 2017, accompanied by a surge in equity market volatility, which approaches the levels attained in 2008. House prices and commercial real estate prices also experience large declines, with house prices and commercial real estate prices falling by 25 percent and 35 percent, respectively, through the first quarter of 2019.
The international component of this scenario features severe recessions in the euro area, the United Kingdom, and Japan and a marked growth slowdown in developing Asia. As a result of the sharp contraction in economic activity, all foreign economies included in the scenario experience a decline in consumer prices. As in this year’s adverse scenario, the U.S. dollar appreciates against the euro, the pound sterling, and the currencies of developing Asia but depreciates modestly against the yen because of flight-to-safety capital flows.
Risk Types and Summary of Methodologies
Identification of key risks is a core component of our capital planning and stress testing framework. In developing the DFAST methodology, significant risks were assessed including, but not limited to, the following risk types:
| · | Interest Rate Risk – Interest rate risk is the risk to earnings or capital that arises from the movement in interest rates. Components of interest rate risk include repricing risk caused by the differences between the timing of rate changes and the timing of cash flows, basis risk caused by the change in relationships between yield curves, yield curve risk caused by changing rate relationships across a spectrum of maturities, and option risk caused by interest rate related options embedded in bank products. |
| · | Market Risk – Market risk is the risk to earnings or capital that arises from movements in equity values and other market-based values. Interest rate risk, though a component of market risk, is broken out as a separate category above. |
| · | Operational Risk – Operational risk is the risk to earnings or capital that arises from operational problems such as inadequate or failed information systems, breaches in internal control, fraud, legal matters, human error, or unforeseen catastrophes that result in unexpected losses. Operational risk also includes the risk of failure to comply with rules and regulations, or compliance risk, and reputational risk. |
| · | Model Risk – Model risk is the risk to earnings or capital that arises from the reliance on model results in decision making. |
| · | Credit Risk – Credit risk is the risk to earnings or capital that arises from a borrower’s inability to perform under the terms of its loan agreement, or from the inability of issuers of debt securities to meet debt obligations. |
2
We use a variety of modeling techniques that utilize the Supervisory Severely Adverse Scenario macroeconomic variables to forecast pre-provision net revenue (“PPNR”), credit losses and pre-tax net income. The models include a combination of statistical econometric models as well as models based on our historical performance during times of economic stress. The models undergo a set of model risk management procedures, including review and challenge by the Board of Directors, Risk Committee of the Board, and members of executive and senior management. The models are also subject to third party validation and internal audit examination. The results of credit loss models, the most significant driver of severely adverse scenario losses, are also compared to challenger model results as an additional check on the quality of model outputs. A summary of the methodologies used in the 2017 DFAST are described below.
Pre-provision net revenue
Pre-provision net revenue is forecasted by modeling net interest income, non-interest income and non-interest expense. Net interest income is modeled using a dynamic interest income and expense simulation tool. Loan and deposit balances are forecasted using a combination of econometric modeling techniques and forecasted interest rates based on the hypothetical Supervisory Severely Adverse Scenario interest rate variables provided by the Federal Reserve, which serve as the basis for modeling net interest income. Prepayment behavior is modeled using a combination of external and internal models, and is used to forecast cash flows and repricing behavior. Non-accrual loan balances are forecasted using statistical models for purposes of calculating interest income on loans. Non-interest income and non-interest expense are modeled based on a variety of techniques, including econometric models where feasible and appropriate, as well as management forecasts based on historical performance and expectations of performance under the hypothetical Supervisory Severely Adverse Scenario.
Credit models
Credit loss models were developed using both econometric models and models based on historical loan loss experience. In certain cases, where projections were not in-line with expectations, management overlays were applied to the results of the econometric models. Forecasted loan losses under the Supervisory Severely Adverse Scenario are consistent with management expectation and are directionally in-line with the severity of the Supervisory Severely Adverse Scenario and the results of challenger models. The Company models the allowance for loan and lease losses (“ALLL”) using an econometric modeling approach.
The projected results using the methodologies described above are used to forecast risk weighted assets and capital ratios for the nine-quarter forecast horizon. The instructions for the preparation of DFAST stress testing require the use of risk-based capital rules in effect during the forecasted time period. Accordingly, we have used the Basel III capital rules in the calculation of forecasted capital ratios.
3
Summary of Results
The results of the Company’s annual DFAST stress testing under the hypothetical Supervisory Severely Adverse Scenario are summarized in the tables below. It is important to note that these results are based on a hypothetical severely adverse economic scenario that is more severe than management’s expectations and does not represent management’s current forecast of actual future events. The results have been prepared using capital action rules prescribed by the DFAST stress testing rule. These rules require the Company to assume the following capital actions:
| · | Common stock dividends in the first quarter of 2017 are equal to the actual dividend amount that was paid in the first quarter of 2017. |
| · | Common stock dividends in the second quarter of 2017 through the first quarter of 2019 are reasonably assumed consistent with internal capital needs and projections. |
| · | Common stock issuances, conversions, or repurchases in the first quarter of 2017 equal to the actual amount in the first quarter of 2017. |
| · | No new issuances of common or preferred stock in the second quarter of 2017 through first quarter of 2019. |
These rules require the Company to assume certain capital actions that may not represent the most likely course of action management would take in a severe economic downturn, and there are no other capital actions included in the forecasts. Capital actions referred to in this disclosure are not consistent with the Company’s planned capital actions. Capital positions are forecasted for each quarter of the forecast horizon by adding current quarter income, less forecasted dividends, to prior quarter ending capital under the prescribed approach. The Company has elected to exclude accumulated other comprehensive income for purposes of calculating regulatory capital under the Basel III approach. Under the Supervisory Severely Adverse scenario, the Company expects to reduce the dividend rate to preserve capital under the stress economic conditions and resulting financial impact. The Company assumes the dividend rate will be reduced from $0.21 to $0.01 per quarter starting from the second quarter of 2017, which will be maintained until the end of the stress testing period.
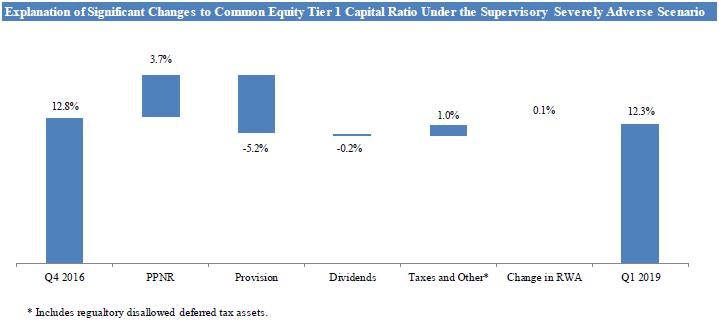
Bancorp’s capital ratios are projected to significantly exceed the regulatory minimums for adequately capitalized financial institutions under the hypothetical Supervisory Severely Adverse Scenario. Under this scenario, our Common Equity Tier 1 capital ratio decreases by 54 basis points from 12.8% at December 31, 2016 to 12.3% at March 31, 2019.
Cathay General Bancorp Actual Q4 2016 Capital Ratios and Projected Stressed Capital Ratios under the Supervisory Severely Adverse Scenario
| Required Regulatory | Actual | Stressed capital ratios | ||||||
| Minimum | Q4 2016 | Ending | Minimum | |||||
| Common equity tier 1 capital ratio (%)1 | 4.5% | 12.8% | 12.3% | 12.3% | ||||
| Tier 1 risk-based capital ratio (%) | 6.0% | 13.9% | 12.3% | 12.3% | ||||
| Total risk-based capital ratio (%) | 8.0% | 15.0% | 14.7% | 14.7% | ||||
| Tier 1 leverage ratio (%) | 4.0% | 11.6% | 10.2% | 10.1% | ||||
1Actual Q4 2016 Common Equity Tier 1 capital ratio is presented under the Basel III rules as adopted by the Federal Reserve.
4
Cathay General Bancorp Actual Q4 2016 Risk-Weighted Assets and Projected Stressed Risk-Weighted Assets under the Supervisory Severely Adverse Scenario ($ in Thousands)
| Actual | Stress Projected | |||||||
| Q4 2016 | Q1 2019 | |||||||
| Risk-Weighted Assets | $ | 11,368,663 | $ | 11,288,628 | ||||
The Bank’s capital ratios are similar to Bancorp’s and are generally subject to the same risks. The primary difference between the Bank’s capital ratios and Bancorp’s capital ratios is from $119 million of trust preferred securities issued by Bancorp, and the related interest expense. The Bank’s capital ratios are projected to significantly exceed the regulatory minimums for adequately capitalized institutions under the Supervisory Severely Adverse Scenario.
Cathay Bank Actual Q4 2016 Capital Ratios and Projected Stressed Capital Ratios under the Supervisory Severely Adverse Scenario
| Required Regulatory | Actual | Stressed capital ratios | ||||||
| Minimum | Q4 2016 | Ending | Minimum | |||||
| Common equity tier 1 capital ratio (%)1 | 4.5% | 13.4% | 12.9% | 12.9% | ||||
| Tier 1 risk-based capital ratio (%) | 6.0% | 13.4% | 12.9% | 12.9% | ||||
| Total risk-based capital ratio (%) | 8.0% | 14.4% | 14.2% | 14.2% | ||||
| Tier 1 leverage ratio (%) | 4.0% | 11.2% | 10.6% | 10.4% | ||||
1Actual Q4 2016 Common Equity Tier 1 capital ratio is presented under the Basel III rules as adopted by the Federal Reserve.
Cathay Bank Actual Q4 2016 Risk-Weighted Assets and Projected Stressed Risk-Weighted Assets under the Supervisory Severely Adverse Scenario ($ in Thousands)
| Actual | Stress Projected | |||||||
| Q4 2016 | Q1 2019 | |||||||
| Risk-Weighted Assets | $ | 11,346,260 | $ | 11,268,204 | ||||
5
The primary cause for the decrease in capital ratios is the projected nine quarter cumulative loan loss provision of $591 million, exceeding projected pre-provision net revenue of $425 million. Of the $591 million of loan loss provision, $404 million is resulted from projected charge offs and $187 million is resulted from projected additional ALLL needed at the end of each quarter in the nine quarter DFAST horizon. Other significant causes for the decrease in regulatory capital include a decrease to risk weighted assets of $80 million from $11.4 billion at December 31, 2016 to $11.3 billion at March 31, 2019, and $17 million of regulatory disallowed deferred tax assets from net operating loss carry forwards in the Supervisory Severely Adverse Scenario.
Cathay General Bancorp projected net revenue, losses and net income before taxes from Q1 2017 through Q1 2019 under the Supervisory Severely Adverse Scenario
| Dollars in | Percentage of | |||
| millions | Average Assets %1 | |||
| Pre-provision net revenue2 | $425 | 2.9% | ||
| Other revenue/(expense) | - | |||
| Less: | ||||
| Provision | $591 | 4.0% | ||
| Realized net losses on securities AFS | - | |||
| Other losses/gains | - | |||
| Equals: | ||||
| Net income/(loss) before taxes | ($166) | -1.1% |
| 1 | Average assets is the nine quarter average of total assets. |
| 2 | Pre-provision net revenue includes losses from operational risk events and other real estate owned expenses. |
6
A summary of the cumulative loan loss rates by loan segments for the Supervisory Severely Adverse Scenario is provided in the following table:
| Dollars | Cumulative Loss | |||||||
| Losses by Loan Segments | in Millions | Rates (%)1 | ||||||
| Residential Mortgages and HELOCs | $ | 35 | 1.0 | % | ||||
| Commercial and Industrial | 143 | 6.5 | % | |||||
| Construction (commercial and residential) | 110 | 18.8 | % | |||||
| Multifamily | 16 | 2.4 | % | |||||
| Commercial Real Estate (excluding construction) | 99 | 2.2 | % | |||||
| All Other Loans2 | 1 | 1.0 | % | |||||
| Total | $ | 404 | 3.5 | % | ||||
| 1 | The cumulative loss rate is comptued by divding the nine-quarter cumulative loan losses by segment, by the average loan balances for the nine-quarter period for each loan segment. Ratios are cumulative, not annualized. |
| 2 | All other loans includes automobile loans, other consumer loans, and loans to depository institutions. |
Important Cautionary Note
These stress test results present certain projected financial measures for Bancorp and the Bank under the hypothetical scenario, models and assumptions that are described above. The economic and financial scenario is more severe than management’s expectations, and the results do not represent management’s current forecast of actual future results. Investors should not rely on the stress test results as being indicative of expected future results.
These disclosures include forward-looking statements within the meaning of the Private Securities Litigation Reform Act of 1995 that involve risks and uncertainties. These forward-looking statements include projections under a hypothetical scenario incorporating a set of assumed economic and financial conditions prescribed by our federal banking regulators. Such statements speak as of the date hereof, and we have no intention to update these statements or to publicly announce any revision of any of these forward-looking statements to reflect future developments or events. Our actual financial results will be influenced by future economic and financial conditions and other factors, including those described in our Annual Report on Form 10-K for the year ended December 31, 2016 (Item 1A in particular), and other reports and registration statements filed with the Securities and Exchange Commission from time to time.
7