Attached files
| file | filename |
|---|---|
| EX-99.1 - EX-99.1 - Oaktree Strategic Income Corp | d476762dex991.htm |
| EX-10.3 - EX-10.3 - Oaktree Strategic Income Corp | d476762dex103.htm |
| EX-10.2 - EX-10.2 - Oaktree Strategic Income Corp | d476762dex102.htm |
| EX-10.1 - EX-10.1 - Oaktree Strategic Income Corp | d476762dex101.htm |
| EX-3.1 - EX-3.1 - Oaktree Strategic Income Corp | d476762dex31.htm |
| 8-K - FORM 8-K - Oaktree Strategic Income Corp | d476762d8k.htm |
Exhibit 99.2
OAKTREE OCSI Strategic Income Corporation Investor Presentation
OAKTREE OCSI Strategic Income Corporation Forward Looking Statements This presentation contains forward-looking statements within the meaning of Section 27A of the U.S. Securities Act of 1933, as amended (the “Securities Act”), and Section 21E of the U.S. Securities Exchange Act of 1934, as amended (the “Exchange Act”), which reflect the current views of the Oaktree Strategic Income Corporation with respect to, among other things, its future results of operations, dividend projections, financial performance, business prospects, the prospects of its portfolio companies, and its expected financings and investments. In some cases, you can identify forward-looking statements by words such as “anticipate,” “approximately,” “believe,” “continue,” “could,” “estimate,” “expect,” “intend,” “may,” “outlook,” “plan,” “potential,” “predict,” “seek,” “should,” “will” and “would” or the negative version of these words or other comparable or similar words. These statements identify prospective information. Important factors could cause actual results to differ, possibly materially, from those indicated in these statements. Forward-looking statements are based on the Company’s beliefs, assumptions and expectations of its future performance, taking into account all information currently available to the Company. Such forward-looking statements are subject to risks and uncertainties and assumptions relating to the Company’s operations, financial results, financial condition, business prospects and liquidity, including, but not limited to, changes in the Company’s anticipated revenue and income; changes in the value of the Company’s investments and net assets; the ability of the Company’s portfolio companies to achieve their objectives; changes in the Company’s operating or other expenses; the degree to which the Company encounters competition; future changes in laws or regulations; and general political, economic and market conditions. The factors listed in the item captioned “Risk Factors” in the Company’s Annual Report on Form 10-K for the year ended September 30, 2016, filed with the Securities and Exchange Commission (the “SEC”) on December 14, 2016, which is accessible on the SEC’s website at www.sec.gov, provide examples of risks, uncertainties and events that may cause the Company’s actual results to differ materially from the expectations described in its forward-looking statements. Forward-looking statements speak only as of the date of this presentation. Except as required by law, the Company does not undertake any obligation to publicly update or review any forward-looking statement, whether as a result of new information, future developments or otherwise. Unless otherwise indicated, data provided herein is dated as of June 30, 2017. 1
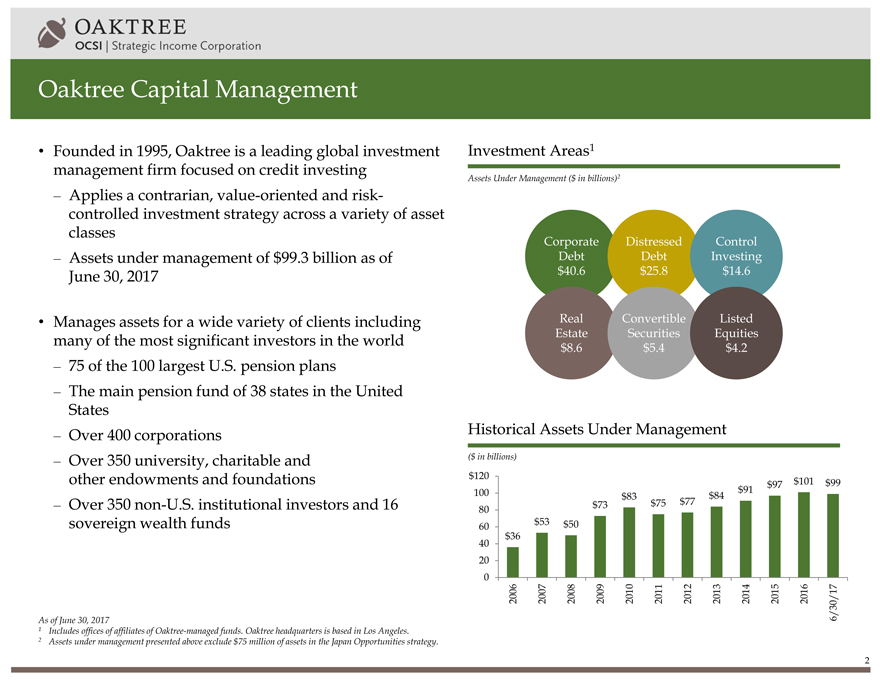
OAKTREE OCSI Strategic Income Corporation Oaktree Capital Management • Founded in 1995, Oaktree is a leading global investment management firm focused on credit investing – Applies a contrarian, value-oriented and risk-controlled investment strategy across a variety of asset classes – Assets under management of $99.3 billion as of June 30, 2017 • Manages assets for a wide variety of clients including many of the most significant investors in the world – 75 of the 100 largest U.S. pension plans – The main pension fund of 38 states in the United States – Over 400 corporations – Over 350 university, charitable and other endowments and foundations – Over 350 non-U.S. institutional investors and 16 sovereign wealth funds Investment Areas1 Assets Under Management ($ in billions)2 Corporate Distressed Control Debt Debt Investing $40.6 $25.8 $14.6 Real Convertible Listed Estate Securities Equities $8.6 $5.4 $4.2 Historical Assets Under Management ($ in billions) $120 $97 $101 $99 100 $91 $83 $84 $73 $75 $77 80 $53 $50 60 $36 40 20 0 2006 2007 2008 2009 2010 2011 2012 2013 2014 2015 2016 6/30/17 As of June 30, 2017 1 Includes offices of affiliates of Oaktree-managed funds. Oaktree headquarters is based in Los Angeles. 2 Assets under management presented above exclude $75 million of assets in the Japan Opportunities strategy. 2
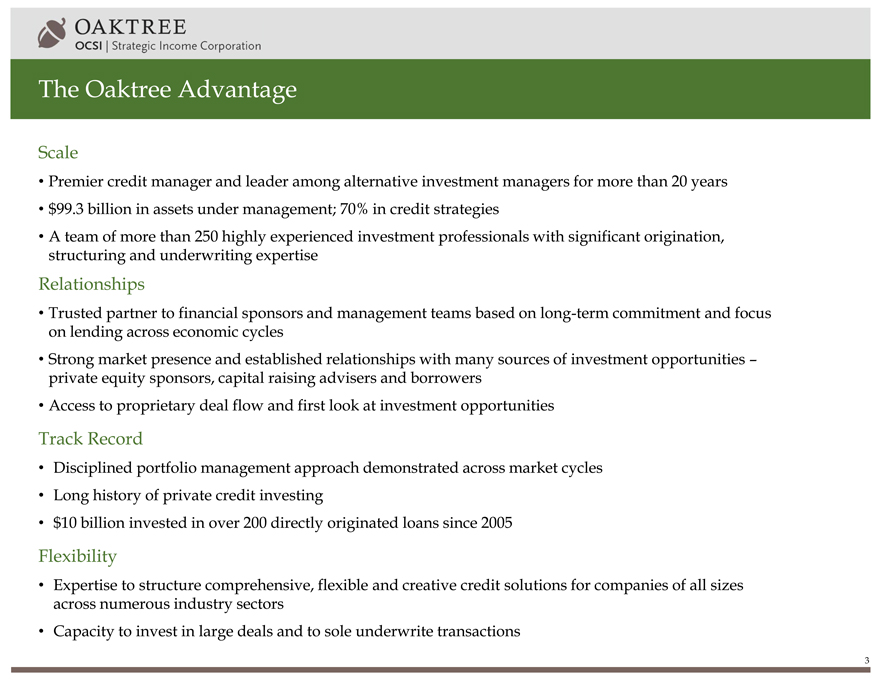
OAKTREE OCSI Strategic Income Corporation The Oaktree Advantage Scale • Premier credit manager and leader among alternative investment managers for more than 20 years • $99.3 billion in assets under management; 70% in credit strategies • A team of more than 250 highly experienced investment professionals with significant origination, structuring and underwriting expertise Relationships • Trusted partner to financial sponsors and management teams based on long-term commitment and focus on lending across economic cycles • Strong market presence and established relationships with many sources of investment opportunities – private equity sponsors, capital raising advisers and borrowers • Access to proprietary deal flow and first look at investment opportunities Track Record • Disciplined portfolio management approach demonstrated across market cycles • Long history of private credit investing • $10 billion invested in over 200 directly originated loans since 2005 Flexibility • Expertise to structure comprehensive, flexible and creative credit solutions for companies of all sizes across numerous industry sectors • Capacity to invest in large deals and to sole underwrite transactions 3
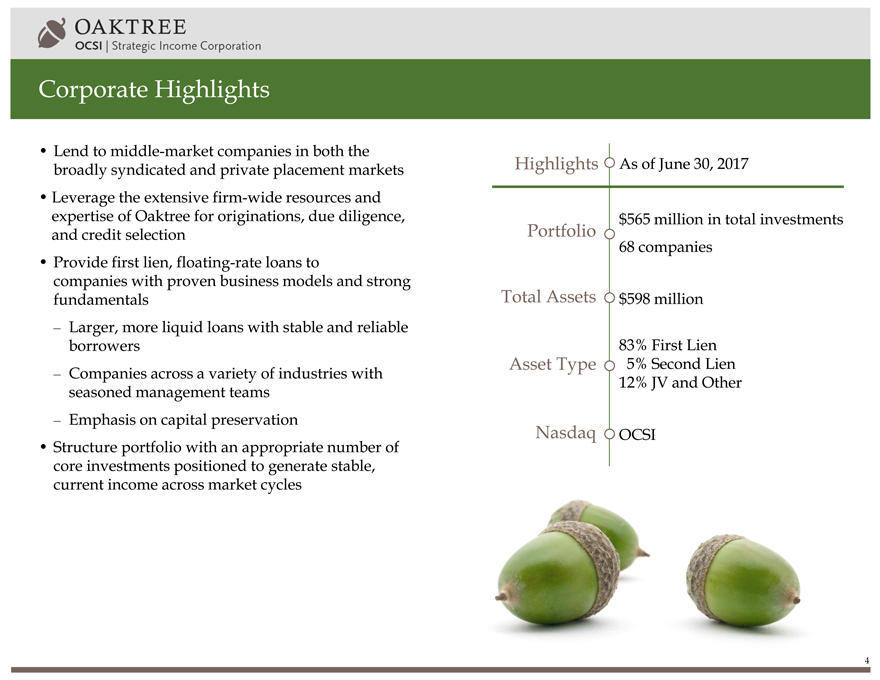
OAKTREE OCSI Strategic Income Corporation Corporate Highlights • Lend to middle-market companies in both the broadly syndicated and private placement markets • Leverage the extensive firm-wide resources and expertise of Oaktree for originations, due diligence, and credit selection • Provide first lien, floating-rate loans to companies with proven business models and strong fundamentals – Larger, more liquid loans with stable and reliable borrowers – Companies across a variety of industries with seasoned management teams – Emphasis on capital preservation • Structure portfolio with an appropriate number of core investments positioned to generate stable, current income across market cycles Highlights As of June 30, 2017 $565 million in total investments Portfolio 68 companies Total Assets $598 million 83% First Lien Asset Type 5% Second Lien 12% JV and Other Nasdaq OCSI 4
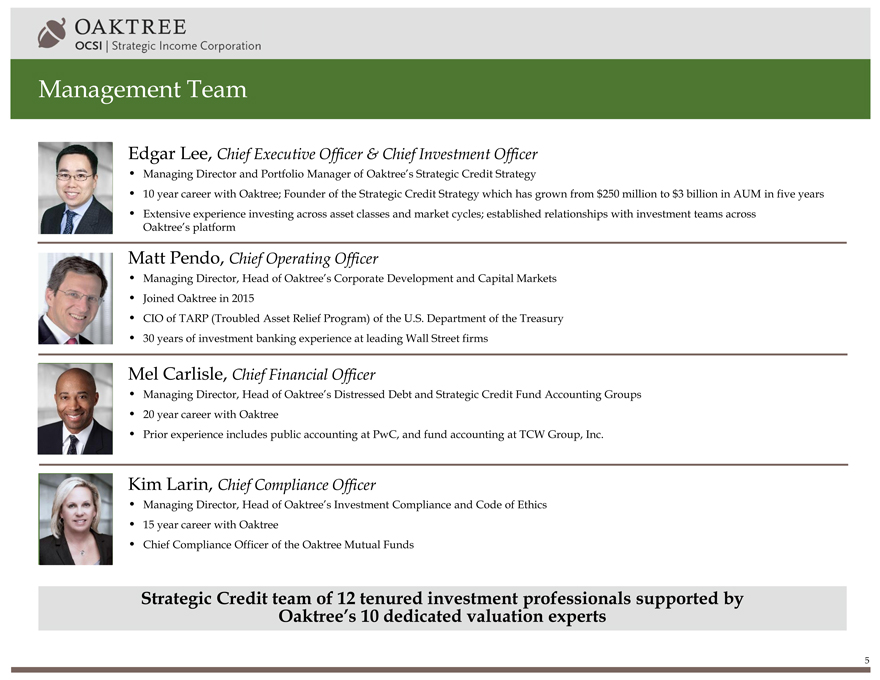
OAKTREE OCSI Strategic Income Corporation Management Team Edgar Lee, Chief Executive Officer & Chief Investment Officer • Managing Director and Portfolio Manager of Oaktree’s Strategic Credit Strategy • 10 year career with Oaktree; Founder of the Strategic Credit Strategy which has grown from $250 million to $3 billion in AUM in five years • Extensive experience investing across asset classes and market cycles; established relationships with investment teams across Oaktree’s platform Matt Pendo, Chief Operating Officer • Managing Director, Head of Oaktree’s Corporate Development and Capital Markets • Joined Oaktree in 2015 • CIO of TARP (Troubled Asset Relief Program) of the U.S. Department of the Treasury • 30 years of investment banking experience at leading Wall Street firms Mel Carlisle, Chief Financial Officer • Managing Director, Head of Oaktree’s Distressed Debt and Strategic Credit Fund Accounting Groups • 20 year career with Oaktree • Prior experience includes public accounting at PwC, and fund accounting at TCW Group, Inc. Kim Larin, Chief Compliance Officer • Managing Director, Head of Oaktree’s Investment Compliance and Code of Ethics • 15 year career with Oaktree • Chief Compliance Officer of the Oaktree Mutual Funds Strategic Credit team of 12 tenured investment professionals supported by Oaktree’s 10 dedicated valuation experts 5
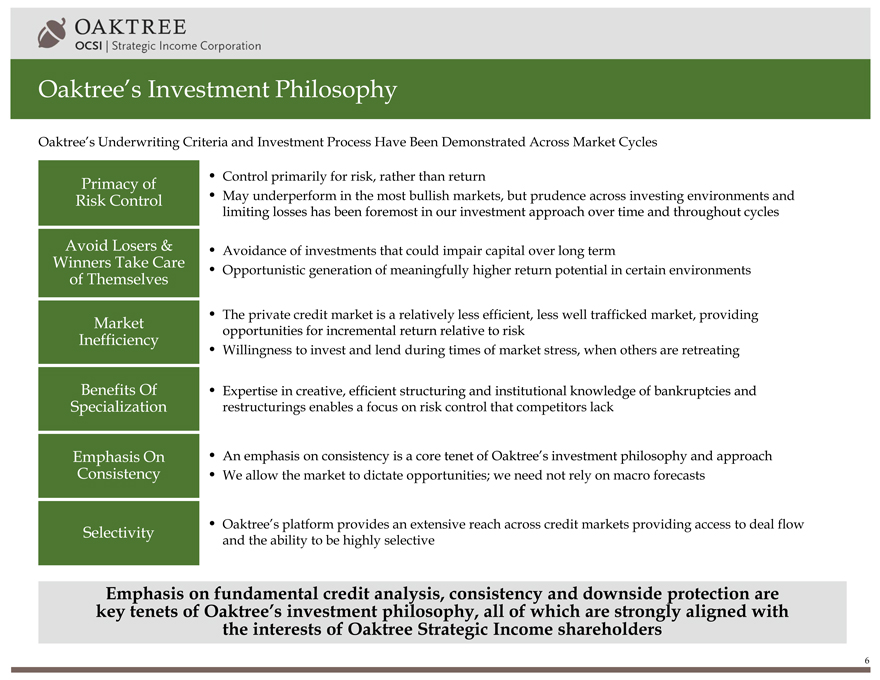
OAKTREE OCSI Strategic Income Corporation Oaktree’s Investment Philosophy Oaktree’s Underwriting Criteria and Investment Process Have Been Demonstrated Across Market Cycles Primacy of • Control primarily for risk, rather than return Risk Control • May underperform in the most bullish markets, but prudence across investing environments and limiting losses has been foremost in our investment approach over time and throughout cycles Avoid Losers & • Avoidance of investments that could impair capital over long term Winners Take Care • Opportunistic generation of meaningfully higher return potential in certain environments of Themselves • The private credit market is a relatively less efficient, less well trafficked market, providing Market opportunities for incremental return relative to risk Inefficiency • Willingness to invest and lend during times of market stress, when others are retreating Benefits Of • Expertise in creative, efficient structuring and institutional knowledge of bankruptcies and Specialization restructurings enables a focus on risk control that competitors lack Emphasis On • An emphasis on consistency is a core tenet of Oaktree’s investment philosophy and approach Consistency • We allow the market to dictate opportunities; we need not rely on macro forecasts • Oaktree’s platform provides an extensive reach across credit markets providing access to deal flow Selectivity and the ability to be highly selective Emphasis on fundamental credit analysis, consistency and downside protection are key tenets of Oaktree’s investment philosophy, all of which are strongly aligned with the interests of Oaktree Strategic Income shareholders 6
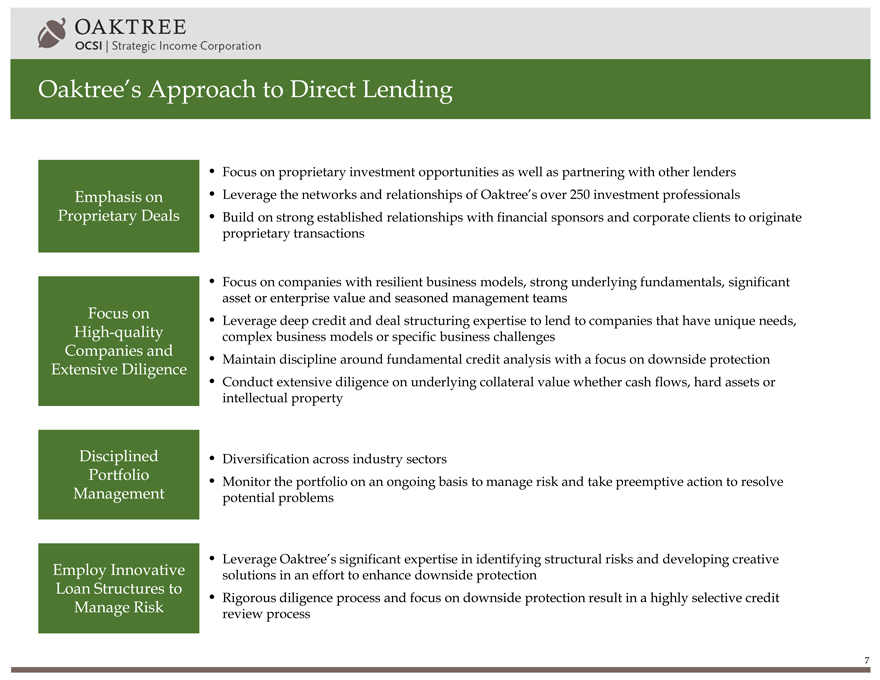
OAKTREE OCSI Strategic Income Corporation Oaktree’s Approach to Direct Lending • Focus on proprietary investment opportunities as well as partnering with other lenders Emphasis on • Leverage the networks and relationships of Oaktree’s over 250 investment professionals Proprietary Deals • Build on strong established relationships with financial sponsors and corporate clients to originate proprietary transactions • Focus on companies with resilient business models, strong underlying fundamentals, significant asset or enterprise value and seasoned management teams Focus on • Leverage deep credit and deal structuring expertise to lend to companies that have unique needs, High-quality complex business models or specific business challenges Companies and • Maintain discipline around fundamental credit analysis with a focus on downside protection Extensive Diligence whether cash flows, hard assets or • Conduct extensive diligence on underlying collateral value intellectual property Disciplined • Diversification across industry sectors Portfolio • Monitor the portfolio on an ongoing basis to manage risk and take preemptive action to resolve Management potential problems • Leverage Oaktree’s significant expertise in identifying structural risks and developing creative Employ Innovative solutions in an effort to enhance downside protection Loan Structures to • Rigorous diligence process and focus on downside protection result in a highly selective credit Manage Risk review process 7
OAKTREE OCSI Strategic Income Corporation Oaktree’s Extensive Origination Capabilities Extensive, Global Credit Platform to Source Deal Flow • Strong market presence and established relationships with financial sponsors, management teams and capital raising advisers • Emphasis on proprietary deals: Frequent first look opportunities, well positioned for difficult and complex transactions • Established reputation as a “go-to” source for borrowers, large and small, due to longstanding track record in direct lending; $10 billion invested in over 200 directly originated loans since 2005 Ability To Address A Wide Range of Borrower Needs • Capability to invest across the capital structure • Certainty to borrowers by seeking to provide fully underwritten finance commitments • Capacity to fund large loans • Expertise in performing credit, as well as restructuring and turnaround situations Extensive origination capabilities leads to greater ability to source quality investments 8
OAKTREE OCSI Strategic Income Corporation Oaktree’s Rigorous Diligence Process Company Analysis • Actively engage and assess company management teams • Identify and understand key business and demand drivers • Evaluate core risks within businesses and industries • “Think like an owner” regarding cash flow Downside-focus • Consider impact on business and cash flows under downside case scenarios • Focus on potential secular and business model risks • Develop exit strategy in the event of downside case • Consider appropriate risk mitigants (structure, covenants, etc.) Financial Analysis • Analyze consistency, stability, and reliability of cash flows • Evaluate quality of earnings and conversion of EBITDA to cash • Review historical performance through cycles and potential impact of downturn in end markets • Compare key metrics to competitors Value • Consider risk/reward relative to others in the industry and the market • Focus on competitors’ cost of capital and alternative investment options • Question overall industry valuation compared to risk profile in evaluating investment potential of the space • Consider value of liquidity and the appropriate “illiquidity premium”9
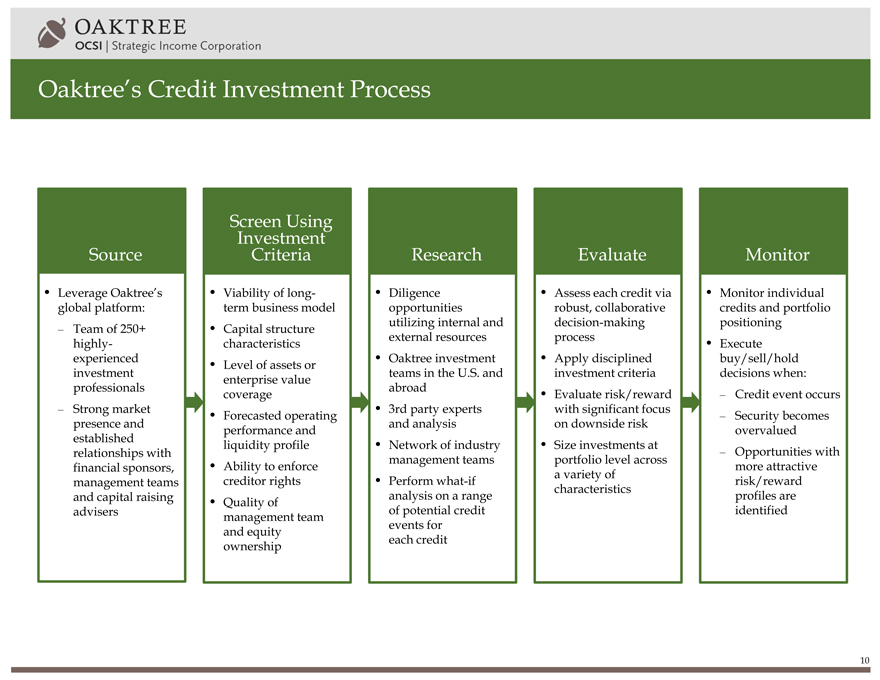
OAKTREE OCSI Strategic Income Corporation Oaktree’s Credit Investment Process Source • Leverage Oaktree’s global platform: – Team of 250+ highly- experienced investment professionals – Strong market presence and established relationships with financial sponsors, management teams and capital raising advisers Screen Investment Using Criteria • Viability of long-term business model • Capital structure characteristics • Level of assets or enterprise value coverage • Forecasted operating performance and liquidity profile • Ability to enforce creditor rights • Quality of management team and equity ownership Research • Diligence opportunities utilizing internal and external resources • Oaktree investment teams in the U.S. and abroad • 3rd party experts and analysis • Network of industry management teams • Perform what-if analysis on a range of potential credit events for each credit Evaluate • Assess each credit via robust, collaborative decision-making process • Apply disciplined investment criteria • Evaluate risk/reward with significant focus on downside risk • Size investments at portfolio level across a variety of characteristics Monitor • Monitor individual credits and portfolio positioning • Execute buy/sell/hold decisions when: – Credit event occurs – Security becomes overvalued – Opportunities with more attractive risk/reward profiles are identified 10
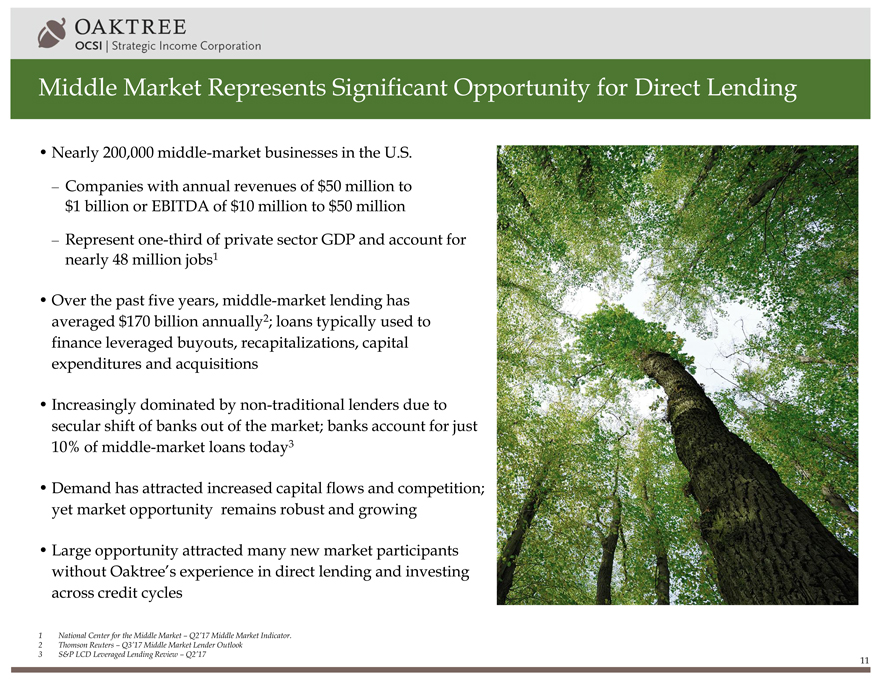
OAKTREE OCSI Strategic Income Corporation Middle Market Represents Significant Opportunity for Direct Lending • Nearly 200,000 middle-market businesses in the U.S. – Companies with annual revenues of $50 million to $1 billion or EBITDA of $10 million to $50 million – Represent one-third of private sector GDP and account for nearly 48 million jobs1 • Over the past five years, middle-market lending has averaged $170 billion annually2; loans typically used to finance leveraged buyouts, recapitalizations, capital expenditures and acquisitions • Increasingly dominated by non-traditional lenders due to secular shift of banks out of the market; banks account for just 10% of middle-market loans today3 • Demand has attracted increased capital flows and competition; yet market opportunity remains robust and growing • Large opportunity attracted many new market participants without Oaktree’s experience in direct lending and investing across credit cycles 1 National Center for the Middle Market – Q2’17 Middle Market Indicator. 2 Thomson Reuters – Q3’17 Middle Market Lender Outlook 3 S&P LCD Leveraged Lending Review – Q2’17 11
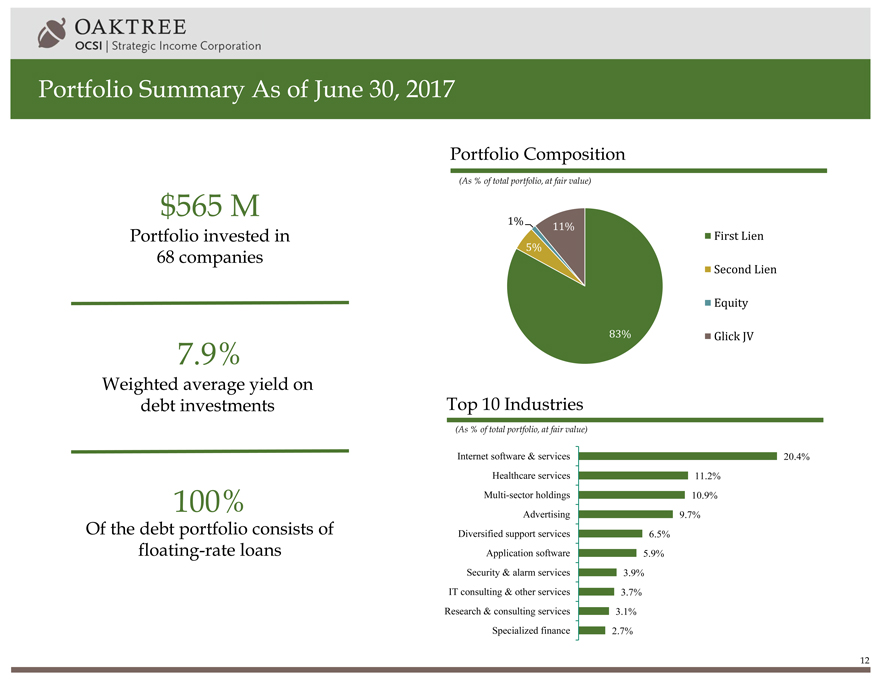
OAKTREE OCSI Strategic Income Corporation Portfolio Summary As of June 30, 2017 $565 M Portfolio invested in 68 companies 7.9% Weighted average yield on debt investments 100% Of the debt portfolio consists of floating-rate loans Portfolio Composition (As % of total portfolio, at fair value) 1% 11% 5% First Lien Second Lien Equity 83% Glick JV Top 10 Industries (As % of total portfolio, at fair value) Internet software & services 20.4% Healthcare services 11.2% Multi-sector holdings 10.9% Advertising 9.7% Diversified support services 6.5% Application software 5.9% Security & alarm services 3.9% IT consulting & other services 3.7% Research & consulting services 3.1% Specialized finance 2.7% 12
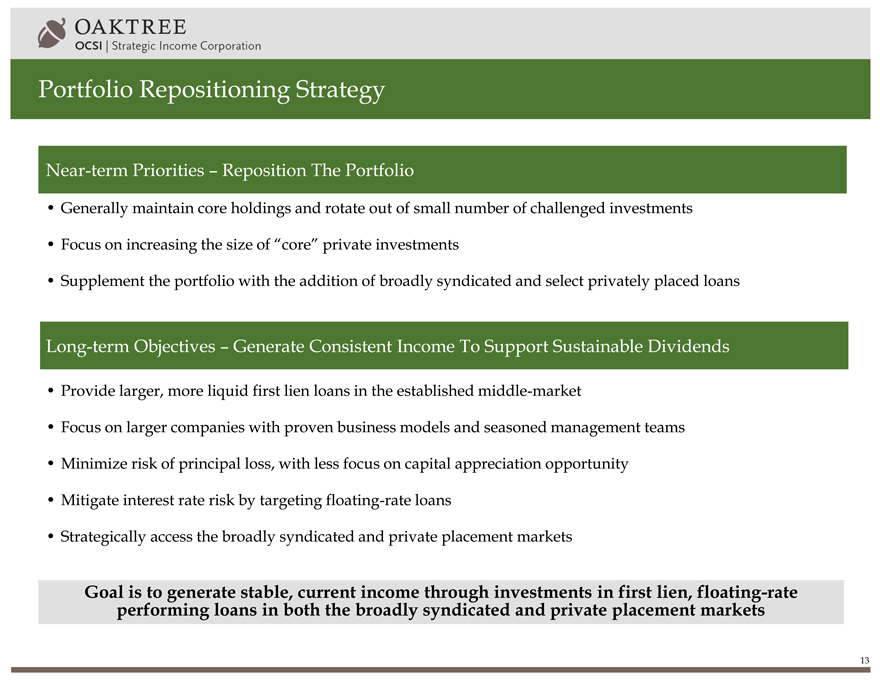
OAKTREE OCSI Strategic Income Corporation Portfolio Repositioning Strategy Near-term Priorities – Reposition The Portfolio • Generally maintain core holdings and rotate out of small number of challenged investments • Focus on increasing the size of “core” private investments • Supplement the portfolio with the addition of broadly syndicated and select privately placed loans Long-term Objectives – Generate Consistent Income To Support Sustainable Dividends • Provide larger, more liquid first lien loans in the established middle-market • Focus on larger companies with proven business models and seasoned management teams • Minimize risk of principal loss, with less focus on capital appreciation opportunity • Mitigate interest rate risk by targeting floating-rate loans • Strategically access the broadly syndicated and private placement markets Goal is to generate stable, current income through investments in first lien, floating-rate performing loans in both the broadly syndicated and private placement markets 13
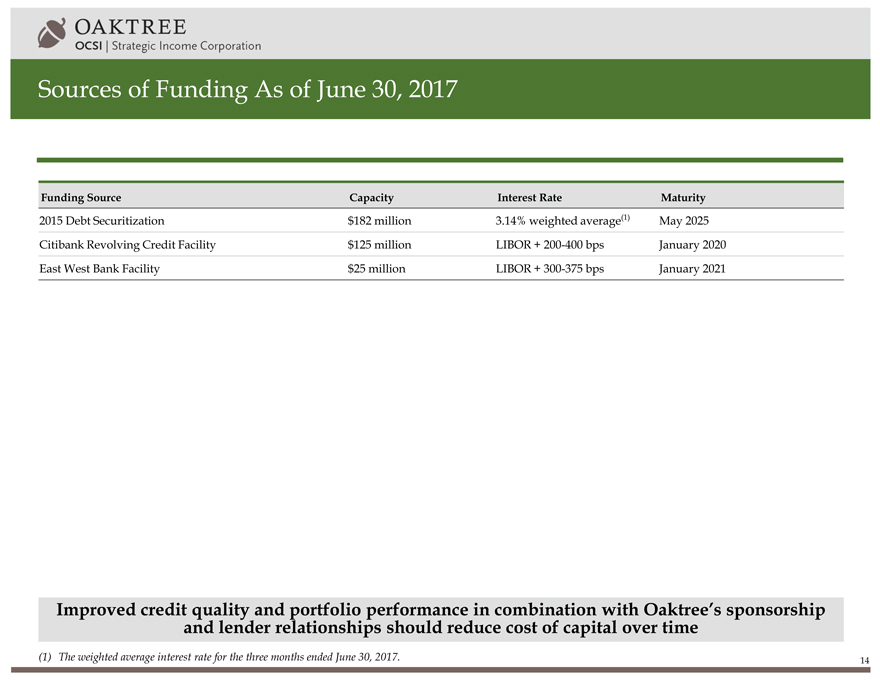
OAKTREE OCSI Strategic Income Corporation Sources of Funding As of June 30, 2017 Funding Source Capacity Interest Rate Maturity 2015 Debt Securitization $182 million 3.14% weighted average(1) May 2025 Citibank Revolving Credit Facility $125 million LIBOR + 200-400 bps January 2020 East West Bank Facility $25 million LIBOR + 300-375 bps January 2021 Improved credit quality and portfolio performance in combination with Oaktree’s sponsorship and lender relationships should reduce cost of capital over time (1) The weighted average interest rate for the three months ended June 30, 2017. 14
OAKTREE OCSI Strategic Income Corporation Fee Structure Aligned with Investment Strategy and Shareholder Interests Fee Structure • 1% base management fee on total gross assets (excluding cash and cash equivalents) • Incentive fee: – 6% hurdle rate – 17.5% of ordinary income – 17.5% on capital gains – No accumulation or payment of incentive fee on capital gains until fiscal year 2019 – Aggregate fees that exceed what would have been paid under prior investment advisory agreement will be waived for two years Dividend Philosophy • Based on portfolio performance, with the long-term goal of sustainability and consistency across economic cycles Advisory fee structure and dividend policy aligned with shareholders 15
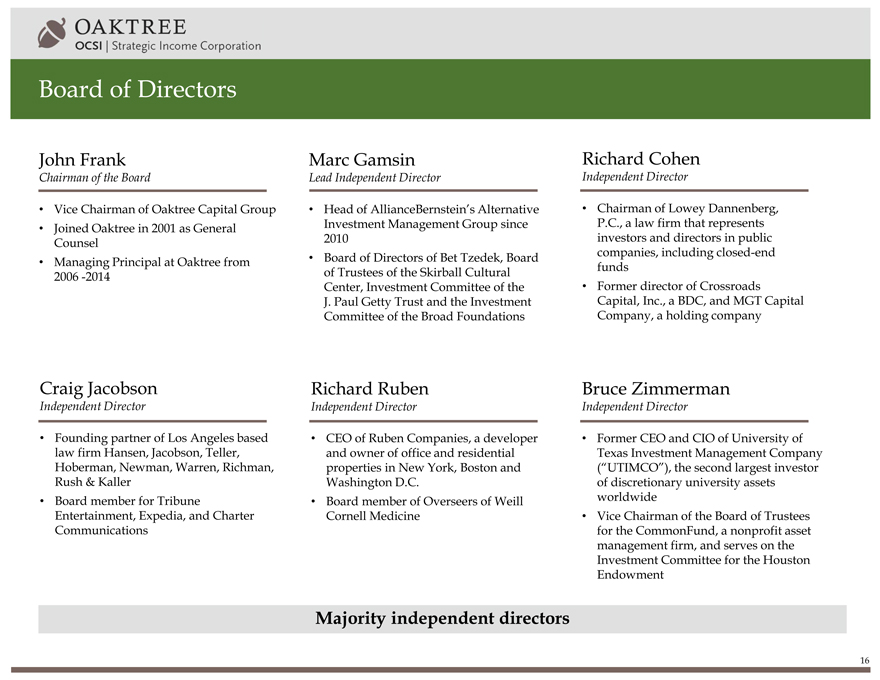
OAKTREE OCSI Strategic Income Corporation Board of Directors John Frank Chairman of the Board • Vice Chairman of Oaktree Capital Group • Joined Oaktree in 2001 as General Counsel • Managing Principal at Oaktree from 2006 -2014 Craig Jacobson Independent Director • Founding partner of Los Angeles based law firm Hansen, Jacobson, Teller, Hoberman, Newman, Warren, Richman, Rush & Kaller • Board member for Tribune Entertainment, Expedia, and Charter Communications Marc Gamsin Lead Independent Director • Head of AllianceBernstein’s Alternative Investment Management Group since 2010 • Board of Directors of Bet Tzedek, Board of Trustees of the Skirball Cultural Center, Investment Committee of the J. Paul Getty Trust and the Investment Committee of the Broad Foundations Richard Ruben Independent Director • CEO of Ruben Companies, a developer and owner of office and residential properties in New York, Boston and Washington D.C. • Board member of Overseers of Weill Cornell Medicine Richard Cohen Independent Director • Chairman of Lowey Dannenberg, P.C., a law firm that represents investors and directors in public companies, including closed-end funds • Former director of Crossroads Capital, Inc., a BDC, and MGT Capital Company, a holding company Bruce Zimmerman Independent Director • Former CEO and CIO of University of Texas Investment Management Company (“UTIMCO”), the second largest investor of discretionary university assets worldwide • Vice Chairman of the Board of Trustees for the CommonFund, a nonprofit asset management firm, and serves on the Investment Committee for the Houston Endowment Majority independent directors 16
OAKTREE OCSI Strategic Income Corporation Investment Highlights Specialty finance company dedicated to providing customized capital solutions for middle-market companies in both the broadly syndicated and private placement markets Managed by Oaktree Capital, a premier credit manager and leading global alternative investment manager with a 22 year track record of alternative credit investing Extensive credit platform with significant origination capabilities and due diligence resources Disciplined and long-term focused approach to investing demonstrated across market cycles Focused on first lien, floating-rate performing loans to companies with proven business models, strong fundamentals and seasoned management teams Strong shareholder alignment and corporate governance
Appendix OAKTREE OCSI Strategic Income Corporation
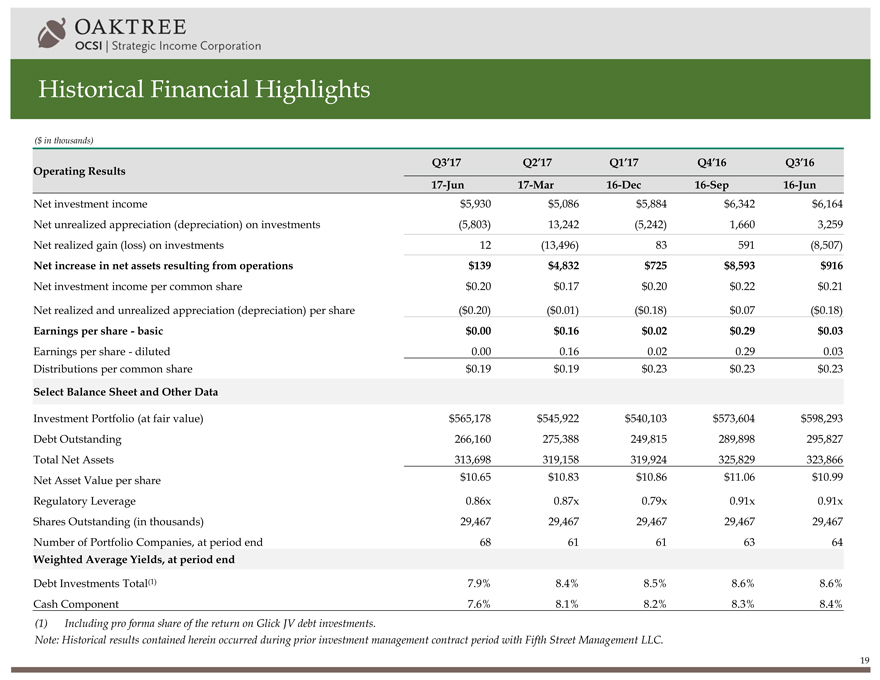
OAKTREE OCSI Strategic Income Corporation Historical Financial Highlights ($ in thousands) Q3’17 Q2’17 Q1’17 Q4’16 Q3’16 Operating Results 17-Jun 17-Mar 16-Dec 16-Sep 16-Jun Net investment income $5,930 $5,086 $5,884 $6,342 $6,164 Net unrealized appreciation (depreciation) on investments (5,803) 13,242 (5,242) 1,660 3,259 Net realized gain (loss) on investments 12 (13,496) 83 591 (8,507) Net increase in net assets resulting from operations $139 $4,832 $725 $8,593 $916 Net investment income per common share $0.20 $0.17 $0.20 $0.22 $0.21 Net realized and unrealized appreciation (depreciation) per share ($0.20) ($0.01) ($0.18) $0.07 ($0.18) Earnings per share - basic $0.00 $0.16 $0.02 $0.29 $0.03 Earnings per share - diluted 0.00 0.16 0.02 0.29 0.03 Distributions per common share $0.19 $0.19 $0.23 $0.23 $0.23 Select Balance Sheet and Other Data Investment Portfolio (at fair value) $565,178 $545,922 $540,103 $573,604 $598,293 Debt Outstanding 266,160 275,388 249,815 289,898 295,827 Total Net Assets 313,698 319,158 319,924 325,829 323,866 Net Asset Value per share $10.65 $10.83 $10.86 $11.06 $10.99 Regulatory Leverage 0.86x 0.87x 0.79x 0.91x 0.91x Shares Outstanding (in thousands) 29,467 29,467 29,467 29,467 29,467 Number of Portfolio Companies, at period end 68 61 61 63 64 Weighted Average Yields, at period end Debt Investments Total(1) 7.9% 8.4% 8.5% 8.6% 8.6% Cash Component 7.6% 8.1% 8.2% 8.3% 8.4% (1) Including pro forma share of the return on Glick JV debt investments. Note: Historical results contained herein occurred during prior investment management contract period with Fifth Street Management LLC. 19
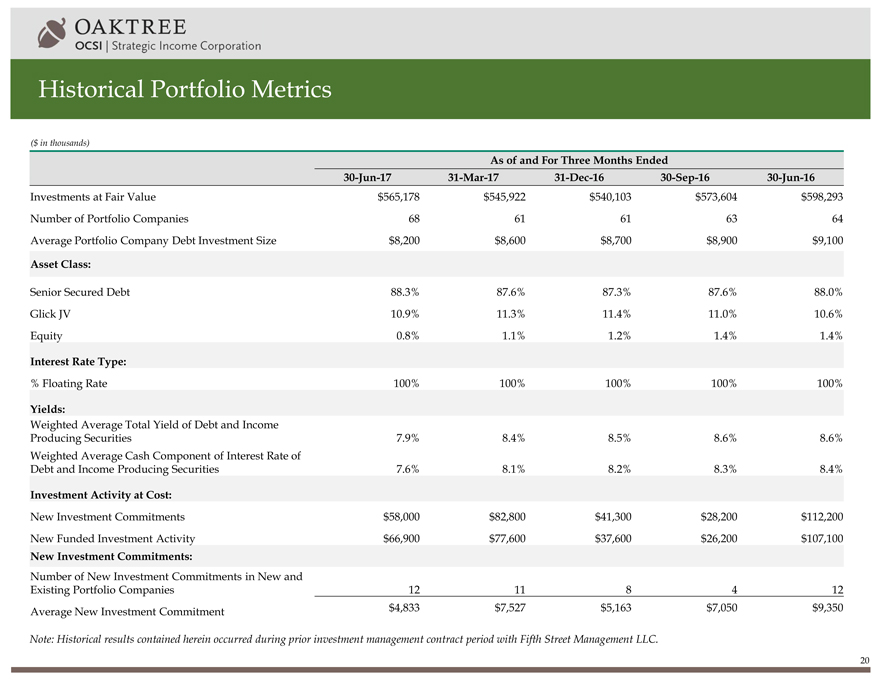
OAKTREE OCSI Strategic Income Corporation Historical Portfolio Metrics ($ in thousands) As of and For Three Months Ended 30-Jun-17 31-Mar-17 31-Dec-16 30-Sep-16 30-Jun-16 Investments at Fair Value $565,178 $545,922 $540,103 $573,604 $598,293 Number of Portfolio Companies 68 61 61 63 64 Average Portfolio Company Debt Investment Size $8,200 $8,600 $8,700 $8,900 $9,100 Asset Class: Senior Secured Debt 88.3% 87.6% 87.3% 87.6% 88.0% Glick JV 10.9% 11.3% 11.4% 11.0% 10.6% Equity 0.8% 1.1% 1.2% 1.4% 1.4% Interest Rate Type: % Floating Rate 100% 100% 100% 100% 100% Yields: Weighted Average Total Yield of Debt and Income Producing Securities 7.9% 8.4% 8.5% 8.6% 8.6% Weighted Average Cash Component of Interest Rate of Debt and Income Producing Securities 7.6% 8.1% 8.2% 8.3% 8.4% Investment Activity at Cost: New Investment Commitments $58,000 $82,800 $41,300 $28,200 $112,200 New Funded Investment Activity $66,900 $77,600 $37,600 $26,200 $107,100 New Investment Commitments: Number of New Investment Commitments in New and Existing Portfolio Companies 12 11 8 4 12 Average New Investment Commitment $4,833 $7,527 $5,163 $7,050 $9,350 Note: Historical results contained herein occurred during prior investment management contract period with Fifth Street Management LLC. 20
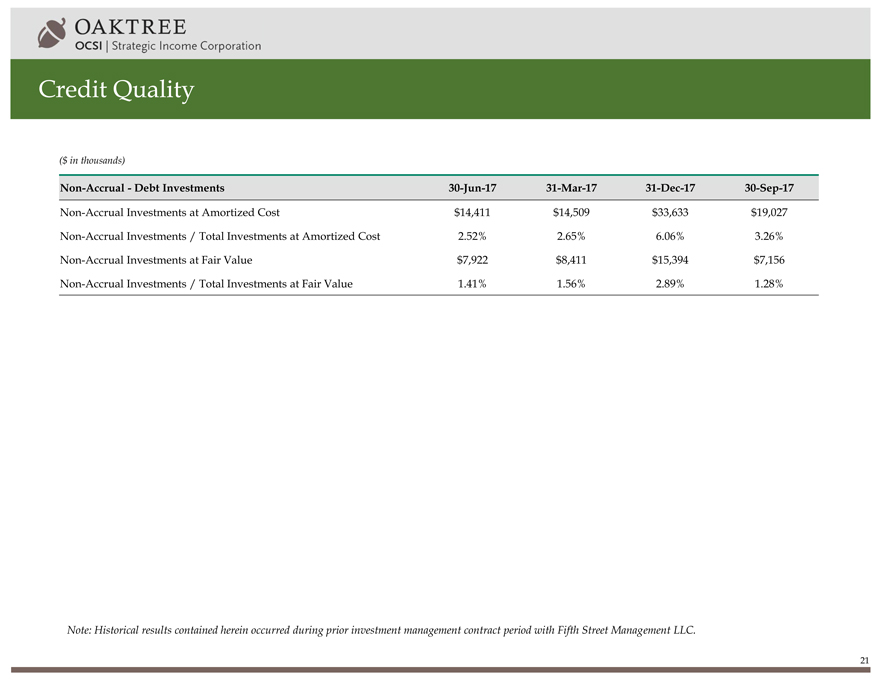
OAKTREE OCSI Strategic Income Corporation Credit Quality ($ in thousands) Non-Accrual - Debt Investments 30-Jun-17 31-Mar-17 31-Dec-17 30-Sep-17 Non-Accrual Investments at Amortized Cost $14,411 $14,509 $33,633 $19,027 Non-Accrual Investments / Total Investments at Amortized Cost 2.52% 2.65% 6.06% 3.26% Non-Accrual Investments at Fair Value $7,922 $8,411 $15,394 $7,156 Non-Accrual Investments / Total Investments at Fair Value 1.41% 1.56% 2.89% 1.28% Note: Historical results contained herein occurred during prior investment management contract period with Fifth Street Management LLC. 21
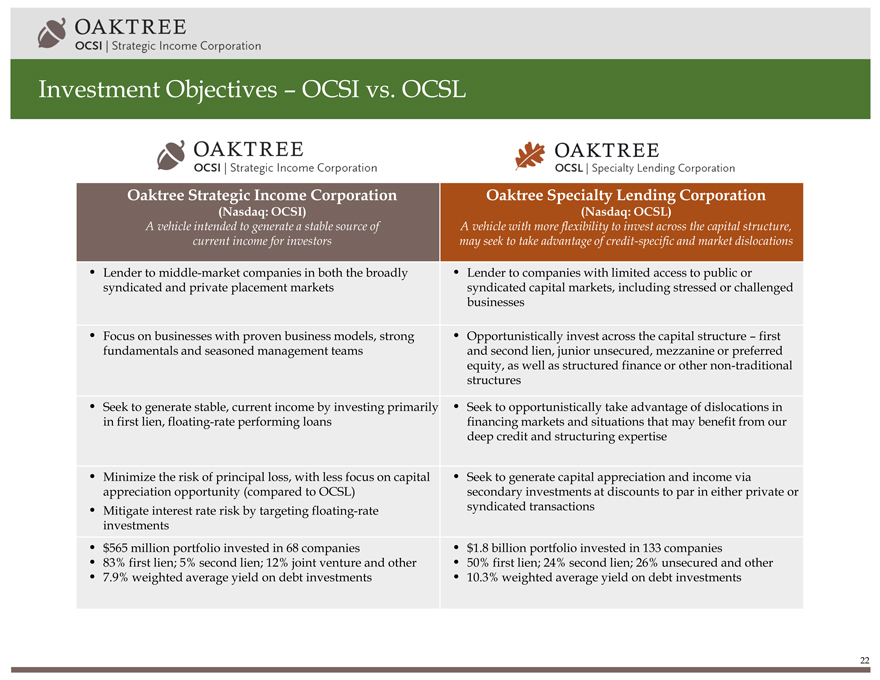
OAKTREE OCSI Strategic Income Corporation Investment Objectives – OCSI vs. OCSL Oaktree OCSI Strategic Income Corporation Investment Oaktree Strategic Income Corporation (Nasdaq: OCSI) A vehicle intended to generate a stable source of current income for investors • Lender to middle-market companies in both the broadly syndicated and private placement markets • Focus on businesses with proven business models, strong fundamentals and seasoned management teams • Seek to generate stable, current income by investing primarily in first lien, floating-rate performing loans • Minimize the risk of principal loss, with less focus on capital appreciation opportunity (compared to OCSL) • Mitigate interest rate risk by targeting floating-rate investments • $565 million portfolio invested in 68 companies • 83% first lien; 5% second lien; 12% joint venture and other • 7.9% weighted average yield on debt investments Oaktree OCSL Specialty Lending Corporation Oaktree Specialty Lending Corporation (Nasdaq: OCSL) A vehicle with more flexibility to invest across the capital structure, may seek to take advantage of credit-specific and market dislocations • Lender to companies with limited access to public or syndicated capital markets, including stressed or challenged businesses • Opportunistically invest across the capital structure – first and second lien, junior unsecured, mezzanine or preferred equity, as well as structured finance or other non-traditional structures • Seek to opportunistically take advantage of dislocations in financing markets and situations that may benefit from our deep credit and structuring expertise • Seek to generate capital appreciation and income via secondary investments at discounts to par in either private or syndicated transactions • $1.8 billion portfolio invested in 133 companies • 50% first lien; 24% second lien; 26% unsecured and other • 10.3% weighted average yield on debt investments 22
Contact: Michael Mosticchio, Investor Relations osci-ir@oaktreecapital.com OAKTREE OCSI Strategic Income Corporation