Attached files
| file | filename |
|---|---|
| 8-K - 8-K - DST SYSTEMS INC | a8-kseptember2017.htm |

DST SYSTEMS, INC.
September 2017

2
Certain material presented in this presentation include forward-looking statements intended to qualify for the safe
harbor from liability established by the Private Securities Litigation Reform Act of 1995. These forward-looking
statements include, but are not limited to, (i) all statements, other than statements of historical fact, included in
this presentation that address activities, events or developments that we expect or anticipate will or may occur in
the future or that depend on future events, or (ii) statements about our future business plans and strategy and
other statements that describe the Company’s outlook, objectives, plans, intentions or goals, and any discussion of
future operating or financial performance. Whenever used, words such as “may,” “will,” “would,” “should,”
“potential,” “strategy,” “anticipates,” “estimates,” “expects,” “project,” “predict,” “intends,” “plans,” “believes,” “targets”
and other terms of similar meaning are intended to identify such forward-looking statements. Forward-looking
statements are uncertain and to some extent unpredictable, and involve known and unknown risks, uncertainties
and other important factors that could cause actual results to differ materially from those expressed or implied in,
or reasonably inferred from, such forward-looking statements. Factors that could cause results to differ materially
from those anticipated include, but are not limited to, the risk factors and cautionary statements included in the
Company’s periodic and current reports (Forms 10-K, 10-Q and 8-K) filed from time to time with the Securities and
Exchange Commission. All such factors should be considered in evaluating any forward-looking statements. The
Company undertakes no obligation to update any forward-looking statements in this presentation to reflect new
information, future events or otherwise.
COPYRIGHT © 2017 BY DST SYSTEMS, INC. ALL RIGHTS RESERVED. OUR TRADEMARKS AND SERVICE MARKS AND THOSE OF THIRD
PARTIES USED IN THIS PRESENTATION ARE THE PROPERTY OF THEIR RESPECTIVE OWNERS.
FORWARD LOOKING STATEMENTS

3
COMPANY PROFILE
71%
29%
Domestic and International
Financial Services
Healthcare Services
2016 Operating Revenue from continuing operations - $1,474.4 million
• Leading provider of:
• Technology
• Strategic advisory
• Business processing solutions
• Strategic focus on two growth industries:
• Financial
• Healthcare
• NYSE: DST
• Headquartered in Kansas City, MO
• Operates with ~16,000 employees
(including BFDS and IFDS UK)

4
LONG HISTORY OF VALUE CREATION
1973:
Formed BFDS,
joint venture
with State
Street Bank
1989:
Acquired 50%
interest in
Argus Health
Systems
1992:
Formed IFDS,
UK, a joint
venture with
State Street
Bank
1995:
Began trading
on the New
York Stock
Exchange
2005:
Acquired DST
Health
Solutions
2008:
Acquired Blue
Door
Technologies
Formed DST
Retirement
Solutions
2009:
Acquired
remaining
stake of
Argus Health
Systems
2011:
Acquired ALPS
Holdings
2012:
Steve Hooley
appointed CEO
Defined
contribution
participants
exceeded 5
million
2013:
Subaccounts
processed
exceeds 25
million
2015:
Acquired kasina, Red Rocks Capital
LLC and Wealth Management Systems
Inc
Completed the sale and leaseback of
Customer Communications’ North
America production facilities
19
73
19
89
19
92
19
95
20
05
20
08
20
09
20
11
20
12
20
13
20
15
20
16
2016:
Acquired Kaufman
Rossin Fund Services LLC.
Completed the sale and leaseback of
Customer Communications’ Bristol, UK
production facilities
Sold Customer Communications North
America business
19
69
20
17
20
16
2017:
Acquired remaining 50% of
BFDS & IFDS UK
Sold Customer
Communications UK business
Completed conversion of
2.5 million new registered
accounts

5
LEADERSHIP POSITIONS IN HEALTH AND WEALTH
Domestic and International Financial Services Healthcare Services
Distribution
Solutions
Serve
45 of 50 largest asset
management firms
Exclusive distributor of
Sector SPDR ETFs
Medical
Solutions
Covered Lives:
21.9M
Pharmacy
Solutions
Pharmacy Claims Paid
in 2016:
507.0M
Asset
Management
ALPS AUM
$18.6B
Retirement
Solutions
TRAC® 6.6M
participants
Largest SaaS
Provider
Brokerage
Solutions
Subaccounting
44.0M accounts
Infrastructure Leverage
Data Centers | Communication Networks | Business Continuity | Disaster Recovery
Business Process Management
Applied Analytics
Compliance
Business Process Outsourcing
Asset Manager
Solutions
TA2000® 59.7M
accounts
Fast 8.7M accounts
iFast 14.0M accounts
ALPS AUA $197.5B

6
ATTRACTIVE BUSINESS MODEL
SAAS
Strategic
Advisory
Applied
Analytics
Customer
Experience
Risk and
Compliance
Business
Process
Management
Full
Service
20
Years
Top 5
Financial
Services
Companies
19
Years
Top 5
Healthcare
Services
Companies
Average Length of Customer Relationships:
Long-Term Contracts
Deeply Embedded in Client Work Flow
Significant Switching Costs
Recurring Revenue
Significant Recurring Sources of Revenue:
7
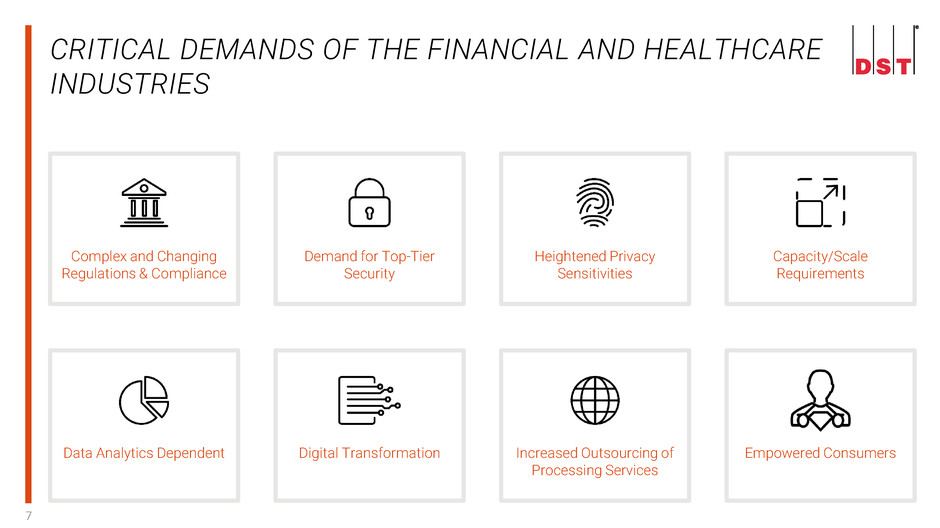
CRITICAL DEMANDS OF THE FINANCIAL AND HEALTHCARE
INDUSTRIES
Complex and Changing
Regulations & Compliance
Heightened Privacy
Sensitivities
Demand for Top-Tier
Security
Capacity/Scale
Requirements
Data Analytics Dependent
Digital Transformation
Increased Outsourcing of
Processing Services
Empowered Consumers

8
• Asset Management
• $75 million seed fund commitment
• Brokerage Solutions
• Sub-accounting platform
• Distribution Solutions
• Marketshare platform
• Advisor segmentation
• DST SalesConnect™
• Retirement Solutions
• Retirement plan participant analytics
• Rollover services
• Wealth Management Solutions
• SAAS and Full Service
• Wealth Platform
• Pharmacy Solutions
• Government programs administration
• Pharmacy network solutions
• Specialty pharmacy
• Formulary and rebate management
• Healthcare Administration
• Revenue management
• Provider network administration
• Health plan compliance and program integrity
• Health Outcomes Optimization
• Quality incentive management (Star5)
• Population assessment, stratification and care gaps
• Disease/care management
• Predictive/prescriptive analytics
• Behaviorally based interventions
Domestic and International Financial Services Healthcare Services
KEY FOCUS AREAS FOR GROWTH
9
More than 200 years of cumulative industry experience | Leadership team with deep industry expertise
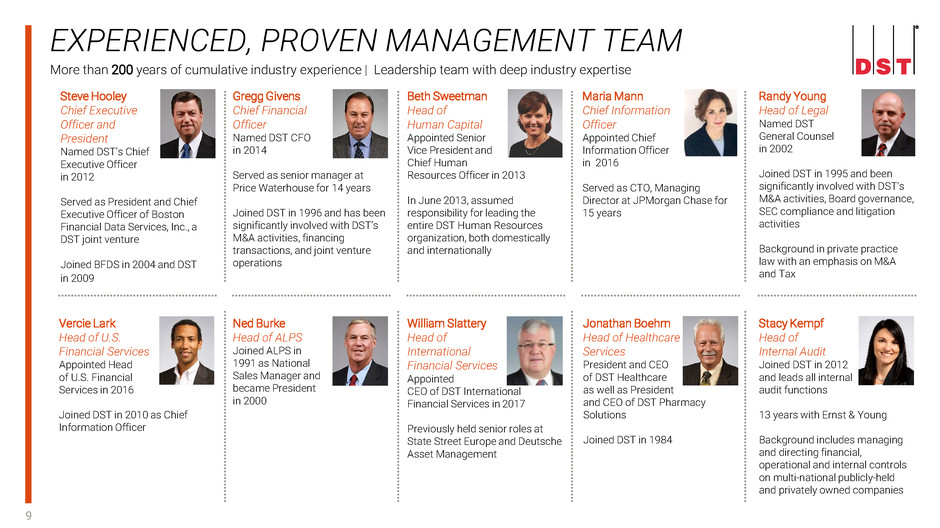
EXPERIENCED, PROVEN MANAGEMENT TEAM
Steve Hooley
Chief Executive
Officer and
President
Named DST’s Chief
Executive Officer
in 2012
Served as President and Chief
Executive Officer of Boston
Financial Data Services, Inc., a
DST joint venture
Joined BFDS in 2004 and DST
in 2009
Gregg Givens
Chief Financial
Officer
Named DST CFO
in 2014
Served as senior manager at
Price Waterhouse for 14 years
Joined DST in 1996 and has been
significantly involved with DST’s
M&A activities, financing
transactions, and joint venture
operations
Beth Sweetman
Head of
Human Capital
Appointed Senior
Vice President and
Chief Human
Resources Officer in 2013
In June 2013, assumed
responsibility for leading the
entire DST Human Resources
organization, both domestically
and internationally
Maria Mann
Chief Information
Officer
Appointed Chief
Information Officer
in 2016
Served as CTO, Managing
Director at JPMorgan Chase for
15 years
Vercie Lark
Head of U.S.
Financial Services
Appointed Head
of U.S. Financial
Services in 2016
Joined DST in 2010 as Chief
Information Officer
Ned Burke
Head of ALPS
Joined ALPS in
1991 as National
Sales Manager and
became President
in 2000
William Slattery
Head of
International
Financial Services
Appointed
CEO of DST International
Financial Services in 2017
Previously held senior roles at
State Street Europe and Deutsche
Asset Management
Jonathan Boehm
Head of Healthcare
Services
President and CEO
of DST Healthcare
as well as President
and CEO of DST Pharmacy
Solutions
Joined DST in 1984
Randy Young
Head of Legal
Named DST
General Counsel
in 2002
Joined DST in 1995 and been
significantly involved with DST's
M&A activities, Board governance,
SEC compliance and litigation
activities
Background in private practice
law with an emphasis on M&A
and Tax
Stacy Kempf
Head of
Internal Audit
Joined DST in 2012
and leads all internal
audit functions
13 years with Ernst & Young
Background includes managing
and directing financial,
operational and internal controls
on multi-national publicly-held
and privately owned companies

10
DST FINANCIAL DISCUSSION
11
FINANCIAL HIGHLIGHTS
Significant recurring revenues
Strong cash flows
Solid balance sheet
Robust revolving debt capacity
Monetization of assets
Focus on returning capital to shareholders

12
Non-GAAP Net Income from Continuing Operations and
EPS from Continuing Operations(1) Non-GAAP Operating Revenues
HISTORICAL FINANCIAL PERFORMANCE
$1,362
$1,446 $1,405
$1,474
$500
$600
$700
$800
$900
$1,000
$1,100
$1,200
$1,300
$1,400
$1,500
2013 2014 2015 2016
$185.9
$201.1
$179.8
$190.9
$2.11
$2.49 $2.47
$2.87
$1.00
$1.50
$2.00
$2.50
$3.00
$40.0
$60.0
$80.0
$100.0
$120.0
$140.0
$160.0
$180.0
$200.0
2013 2014 2015 2016
(M
ill
io
ns
)
(M
ill
io
ns
) EPS
Note: Please refer to Non-GAAP reconciliation slides for adjustment details. (1) Non-GAAP net income from continuing operations after non-controlling interest.
13
Non-GAAP Net Income from Continuing Operations and
EPS from Continuing Operations(1) Non-GAAP Operating Revenues
(2)
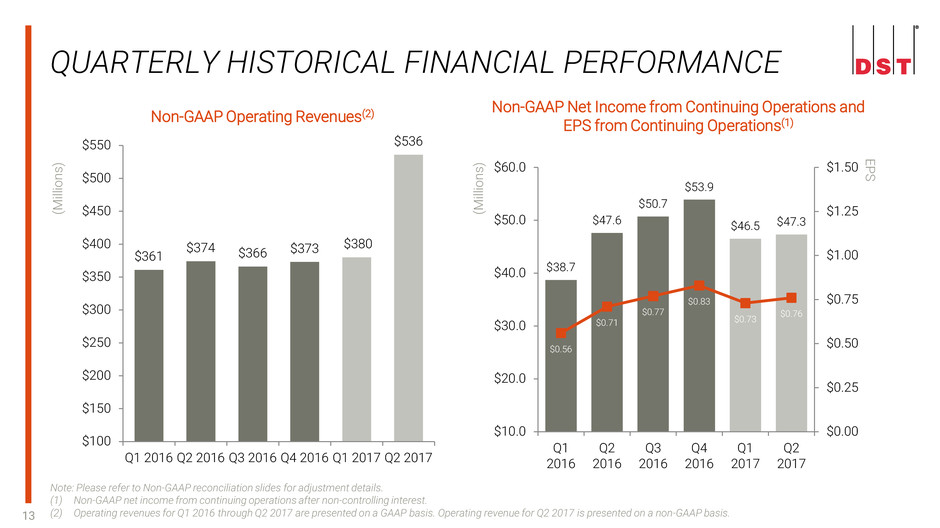
QUARTERLY HISTORICAL FINANCIAL PERFORMANCE
$361
$374 $366 $373
$380
$536
$100
$150
$200
$250
$300
$350
$400
$450
$500
$550
Q1 2016 Q2 2016 Q3 2016 Q4 2016 Q1 2017 Q2 2017
$38.7
$47.6
$50.7
$53.9
$46.5 $47.3
$0.56
$0.71
$0.77
$0.83
$0.73 $0.76
$0.00
$0.25
$0.50
$0.75
$1.00
$1.25
$1.50
$10.0
$20.0
$30.0
$40.0
$50.0
$60.0
Q1
2016
Q2
2016
Q3
2016
Q4
2016
Q1
2017
Q2
2017
(M
ill
io
ns
)
(M
ill
io
ns
) EPS
Note: Please refer to Non-GAAP reconciliation slides for adjustment details.
(1) Non-GAAP net income from continuing operations after non-controlling interest.
(2) Operating revenues for Q1 2016 through Q2 2017 are presented on a GAAP basis. Operating revenue for Q2 2017 is presented on a non-GAAP basis.

14
Domestic
Financial Services
International
Financial Services Healthcare Services
Operating Revenue
(in Millions)
Operating Margin
NON-GAAP SEGMENT FINANCIAL HIGHLIGHTS – YTD 2ND QUARTER
Note: Please refer to Non-GAAP reconciliation slides for adjustment details.
17.1% 18.1%
Q2 2016 Q2 2017
2.6%
10.0%
1.3%
Q2 2016 Q2 2017
17.8% 18.5%
Q2 2016 Q2 2017
$500
$566
Q2 2016 Q2 2017
$56
$171
Q2 2016 Q2 2017
$208 $209
Q2 2016 Q2 2017
13.2% 205% 0.4%
15
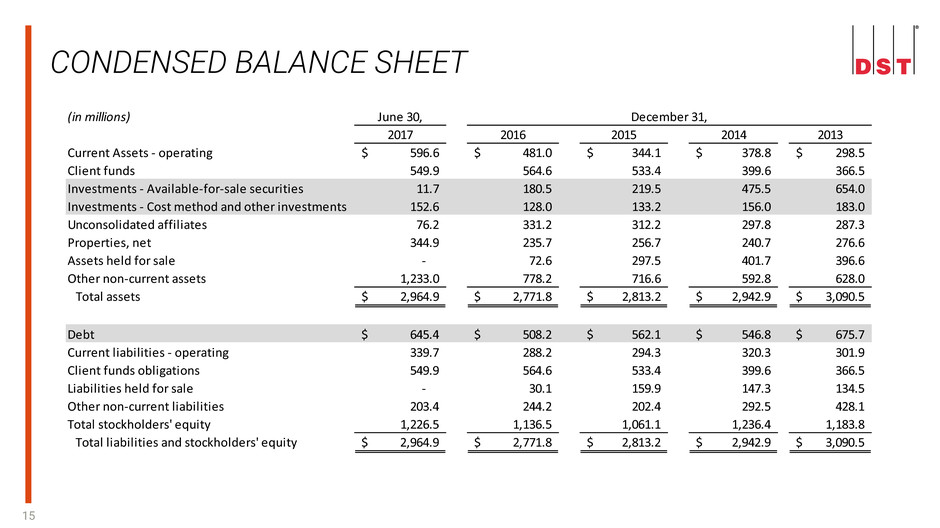
CONDENSED BALANCE SHEET
(in millions) June 30,
2017 2016 2015 2014 2013
Current Assets - operating 596.6$ 481.0$ 344.1$ 378.8$ 298.5$
Client funds 549.9 564.6 533.4 399.6 366.5
Investments - Available-for-sale securities 11.7 180.5 219.5 475.5 654.0
Investments - Cost method and other investments 152.6 128.0 133.2 156.0 183.0
Unconsolidated affiliates 76.2 331.2 312.2 297.8 287.3
Properties, net 344.9 235.7 256.7 240.7 276.6
Assets held for sale - 72.6 297.5 401.7 396.6
Other non-current assets 1,233.0 778.2 716.6 592.8 628.0
Total assets 2,964.9$ 2,771.8$ 2,813.2$ 2,942.9$ 3,090.5$
Debt 645.4$ 508.2$ 562.1$ 546.8$ 675.7$
Current liabilities - operating 339.7 288.2 294.3 320.3 301.9
Client funds obligations 549.9 564.6 533.4 399.6 366.5
Liabilities held for sale - 30.1 159.9 147.3 134.5
Other non-current liabilities 203.4 244.2 202.4 292.5 428.1
Total stockholders' equity 1,226.5 1,136.5 1,061.1 1,236.4 1,183.8
Total liabilities and stockholders' equity 2,964.9$ 2,771.8$ 2,813.2$ 2,942.9$ 3,090.5$
December 31,
16
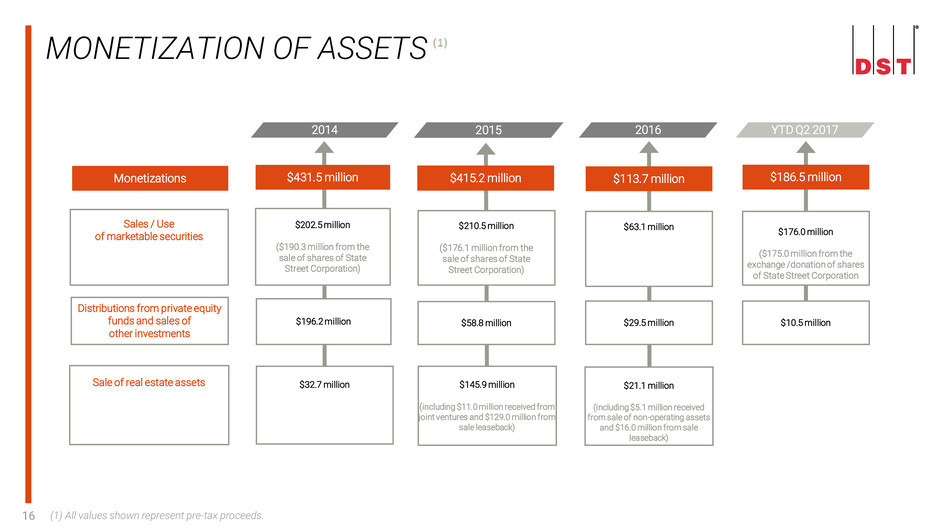
MONETIZATION OF ASSETS
(1) All values shown represent pre-tax proceeds.
Q2 2013
2014
$32.7 million
$431.5 million
$202.5 million
($190.3 million from the
sale of shares of State
Street Corporation)
$196.2 million
$145.9 million
(including $11.0 million received from
joint ventures and $129.0 million from
sale leaseback)
$415.2 million
$210.5 million
($176.1 million from the
sale of shares of State
Street Corporation)
$58.8 million
2015
$21.1 million
(including $5.1 million received
from sale of non-operating assets
and $16.0 million from sale
leaseback)
$113.7 million
$63.1 million
$29.5 million
2016
Sales / Use
of marketable securities
Distributions from private equity
funds and sales of
other investments
Sale of real estate assets
Monetizations $186.5 million
$176.0 million
($175.0 million from the
exchange /donation of shares
of State Street Corporation
$10.5 million
YTD Q2 2017
17
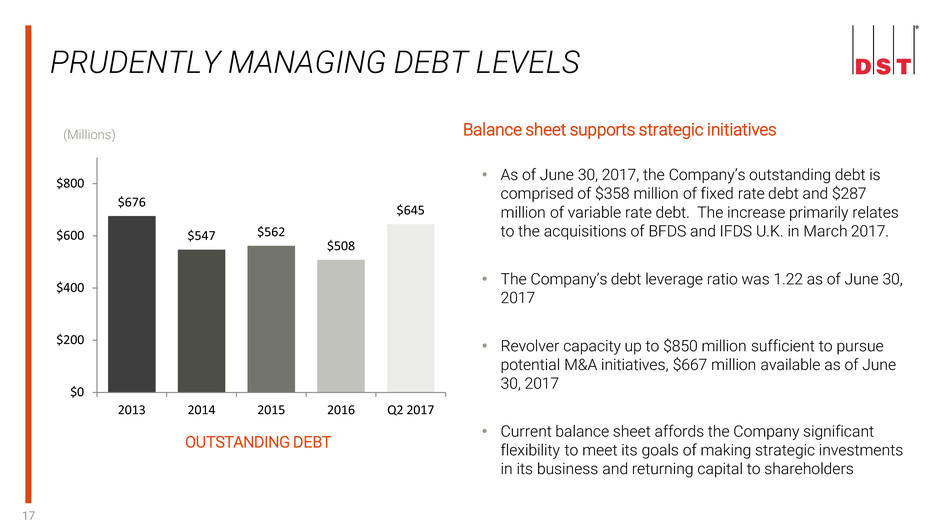
OUTSTANDING DEBT
Balance sheet supports strategic initiatives
• As of June 30, 2017, the Company’s outstanding debt is
comprised of $358 million of fixed rate debt and $287
million of variable rate debt. The increase primarily relates
to the acquisitions of BFDS and IFDS U.K. in March 2017.
• The Company’s debt leverage ratio was 1.22 as of June 30,
2017
• Revolver capacity up to $850 million sufficient to pursue
potential M&A initiatives, $667 million available as of June
30, 2017
• Current balance sheet affords the Company significant
flexibility to meet its goals of making strategic investments
in its business and returning capital to shareholders
PRUDENTLY MANAGING DEBT LEVELS
$676
$547 $562
$508
$645
$0
$200
$400
$600
$800
2013 2014 2015 2016 Q2 2017
(Millions)

18
Since 2010, DST has returned $2.1 billion of capital to shareholders
RETURN OF CAPITAL TO SHAREHOLDERS
Total: $447.6 million
DST spent $200 million to
repurchase 4.4 million
shares of Common Stock
DST paid $47.6 million in
dividends
($0.60 per share)
DST spent $200 million to
repurchase 4.8 million
shares directly from the
Argyros group
2014
Total: $443.1 million
DST paid $43.1 million in
dividends
($0.60 per share)
DST spent $400.0 million to
repurchase 7.2 million shares
of Common Stock
2015
Total: $343.4 million
DST paid $43.4 million in
dividends
($0.68 per share)
DST spent $300 million to
repurchase 5.3 million
shares of Common Stock
2016
Total: $172.1 million
DST paid $22.1 million in
dividends
($0.36 per share)
DST spent $150 million to
repurchase 2.6 million
shares of Common Stock
YTD Q2 2017
(1) All shares have been retroactively adjusted for all periods presented to reflect the stock split

19
KEY TAKEAWAYS
Leadership position in industries served
Deep, longstanding customer relationships
Robust, scalable technology platform and infrastructure
Deep regulatory compliance expertise
Attractive business model with significant recurring and diversified revenues
Experienced management team with proven track record

20
Termination of Employee Stock Ownership Plan (“ESOP”)
• Effective July 28, 2017, the DST Systems’ ESOP was terminated and the participants’ respective account balances,
which were comprised solely of DST common stock, began being liquidated into cash and distributed in accordance
with the plan agreement. Liquidations are expected to continue from the effective date through mid-October 2017.
Litigation Update – Class action suits involving DST Systems’ 401(k) Profit Sharing Plan
• In September 2017, two new complaints alleging breach of fiduciary duties and other violations of the Employee
Retirement Income Security Act were filed, Ferguson, et al. v. Ruane, Cuniff & Goldfarb Inc., et al., in the Southern
District of New York and Ostrander v. DST Systems, Inc., et al. in the U.S. District Court for the Western District of
Missouri.
• We intend to defend these cases vigorously, and because the suits are in their preliminary stages, have not yet
determined what effect these lawsuits will have, if any, on our financial position or results of operations.
APPENDIX - BENEFIT PLAN UPDATES

21
APPENDIX - CUSTOMER CONCENTRATION BY SEGMENT
Percentage of Segment's 2016 Operating Revenue
Segment Largest Customer of Segment Largest Five Customers of Segment
Domestic Financial Services 11.5% 21.5%
International Financial Services 16.5% 33.1%
Healthcare Services 17.8% 51.4%
The customer concentration metrics disclosed within the 2016 Form 10-K have been updated below to
reflect the new segment realignment. The amounts below exclude sales to operating joint ventures.

22
APPENDIX – USE OF NON-GAAP FINANCIAL INFORMATION
In addition to reporting financial information on a GAAP basis, DST has disclosed certain non-GAAP financial information which has been reconciled to the
corresponding GAAP measures. In making these adjustments to determine the non-GAAP results, the Company takes into account the impact of items that are not
necessarily ongoing in nature, that do not have a high level of predictability associated with them or that are non-operational in nature. Generally, these items include
net gains on dispositions of businesses, net gains (losses) associated with securities and other investments, acquired intangible asset amortization, restructuring and
impairment costs and other similar items. Our non-GAAP net income from continuing operations attributable to DST Systems, Inc. and Diluted earnings per share from
continuing operations are also adjusted for the income tax impact of the above items, as applicable. The income tax impact of each item is calculated by applying the
statutory rate and local tax regulations in the jurisdiction in which the item was incurred. The Company believes that the exclusion of these items provides a useful
basis for evaluating underlying business unit performance, but should not be considered in isolation and is not in accordance with, or a substitute for, evaluating
business unit performance utilizing GAAP financial information. The Company uses non-GAAP measures in its budgeting and forecasting processes and to further
analyze its financial trends and “operational run-rate,” as well as making financial comparisons to prior periods presented on a similar basis. The Company believes that
providing such adjusted results allows investors and other users of DST’s financial statements to better understand DST’s comparative operating performance for the
periods presented.
Company’s management uses these non-GAAP financial measures in its own evaluation of the Company’s performance, particularly when comparing performance to
past periods. Company’s non-GAAP measures may differ from similar measures by other companies, even if similar terms are used to identify such measures.
Although Company’s management believes non-GAAP measures are useful in evaluating the performance of its business, the Company acknowledges that items
excluded from such measures may have a material impact on the Company’s financial information calculated in accordance with GAAP and prospective investors
should not rely solely on the non-GAAP information. Therefore, Company’s management typically uses non-GAAP measures in conjunction with GAAP results. These
factors should be considered when evaluating DST’s results. See “Historical Financials - Reconciliation of GAAP to Non-GAAP Results.”
The tables on the following pages reconcile the GAAP financial results to the corresponding non-GAAP financial results. Additional descriptions of the non-GAAP
adjustments can be found in DST’s Form 10-K filings.

23
APPENDIX:
RECONCILIATION OF GAAP TO NON-GAAP OPERATING INCOME BY SEGMENT
(in millions)
Domestic International
Financial Financial Healthcare
For the Three Months Ended December 31, 2016 Services Services Services
Reported GAAP Operating Income 49.2$ 2.7$ 23.5$
Restructuring charges 0.8 1.0 -
Amortization of intangible assets 4.4 - 1.6
Adjusted Non-GAAP Operating Income 54.4$ 3.7$ 25.1$
For the Three Months Ended September 30, 2016
Reported GAAP Operating Income 53.7$ 2.5$ 18.1$
Amortization of intangible assets 4.2 - 1.6
Reversal of accrued contingent consideration (6.5) - -
Adjusted Non-GAAP Operating Income 51.4$ 2.5$ 19.7$
For the Three Months Ended June 30, 2016
Reported GAAP Operating Income 24.3$ 4.3$ 17.3$
Amortization of intangible assets 4.4 - 1.5
Restructuring charges 10.4 - 0.7
Software impairment 6.0 - -
Adjusted Non-GAAP Operating Income 45.1$ 4.3$ 19.5$
For the Three Months Ended March 31, 2016
Reported GAAP Operating Income 35.3$ 1.3$ 15.1$
Amortization of intangible assets 3.8 - 1.6
Restructuring charges 1.4 - 0.9
Adjusted Non-GAAP Operating Income 40.5$ 1.3$ 17.6$
2016
Domestic International
Financial Financial Healthcare
For the Three Months Ended June 30, 2017 Services Services Services
Reported GAAP Operating Income 28.2$ 50.1$ 17.9$
Amortization of intangible assets 5.5 3.7 0.8
Restructuring charges 8.0 - -
Advisory expense 3.2 1.0 -
Chartitable contribution of securities 11.6 - -
Contract termination - (53.5) -
Adjusted Non-GAAP Operating Income 56.5$ 1.3$ 18.7$
For the Three Months Ended March 31, 2017
Reported GAAP Operating Income 38.2$ (0.6)$ 18.3$
Amortization of intangible assets 4.2 - 1.6
Restructuring charges 0.6 0.8 -
Advisory expenses 2.7 0.8 -
Adjusted Non-GAAP Operating Income 45.7$ 1.0$ 19.9$
2017
24
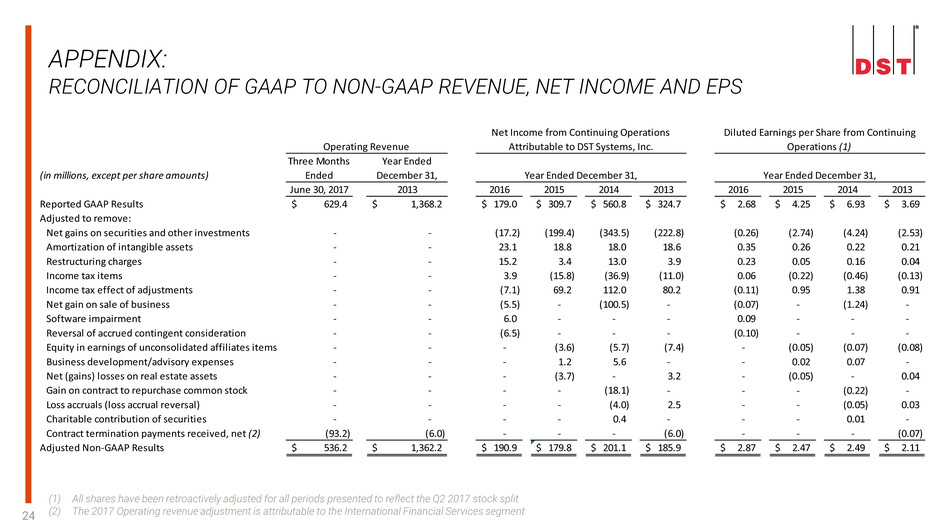
APPENDIX:
RECONCILIATION OF GAAP TO NON-GAAP REVENUE, NET INCOME AND EPS
(1) All shares have been retroactively adjusted for all periods presented to reflect the Q2 2017 stock split
(2) The 2017 Operating revenue adjustment is attributable to the International Financial Services segment
(in millions, except per share amounts)
Three Months
Ended
Year Ended
December 31,
June 30, 2017 2013 2016 2015 2014 2013 2016 2015 2014 2013
Reported GAAP Results 629.4$ 1,368.2$ 179.0$ 309.7$ 560.8$ 324.7$ 2.68$ 4.25$ 6.93$ 3.69$
Adjusted to remove:
Net gains on securities and other investments - - (17.2) (199.4) (343.5) (222.8) (0.26) (2.74) (4.24) (2.53)
Amortization of intangible assets - - 23.1 18.8 18.0 18.6 0.35 0.26 0.22 0.21
Restructuring charges - - 15.2 3.4 13.0 3.9 0.23 0.05 0.16 0.04
Income tax items - - 3.9 (15.8) (36.9) (11.0) 0.06 (0.22) (0.46) (0.13)
Income tax effect of adjustments - - (7.1) 69.2 112.0 80.2 (0.11) 0.95 1.38 0.91
Net gain on sale of business - - (5.5) - (100.5) - (0.07) - (1.24) -
Software impairment - - 6.0 - - - 0.09 - - -
Reversal of accrued contingent consideration - - (6.5) - - - (0.10) - - -
Equity in earnings of unconsolidated affiliates items - - - (3.6) (5.7) (7.4) - (0.05) (0.07) (0.08)
Business development/advisory expenses - - - 1.2 5.6 - - 0.02 0.07 -
Net (gains) losses on real estate assets - - - (3.7) - 3.2 - (0.05) - 0.04
Gain on contract to repurchase common stock - - - - (18.1) - - - (0.22) -
Loss accruals (loss accrual reversal) - - - - (4.0) 2.5 - - (0.05) 0.03
Charitable contribution of securities - - - - 0.4 - - - 0.01 -
Contract termination payments received, net (2) (93.2) (6.0) - - - (6.0) - - - (0.07)
Adjusted Non-GAAP Results 536.2$ 1,362.2$ 190.9$ 179.8$ 201.1$ 185.9$ 2.87$ 2.47$ 2.49$ 2.11$
Operating Revenue
Year Ended December 31,
Diluted Earnings per Share from Continuing
Operations (1)
Net Income from Continuing Operations
Attributable to DST Systems, Inc.
Year Ended December 31,
25
APPENDIX:
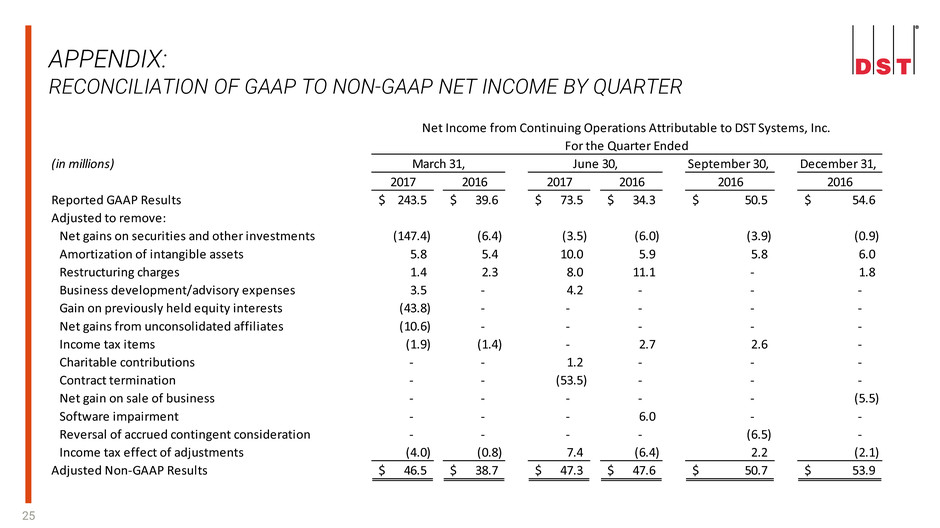
RECONCILIATION OF GAAP TO NON-GAAP NET INCOME BY QUARTER
(in millions) September 30, December 31,
2017 2016 2017 2016 2016 2016
Reported GAAP Results 243.5$ 39.6$ 73.5$ 34.3$ 50.5$ 54.6$
Adjusted to remove:
Net gains on securities and other investments (147.4) (6.4) (3.5) (6.0) (3.9) (0.9)
Amortization of intangible assets 5.8 5.4 10.0 5.9 5.8 6.0
Restructuring charges 1.4 2.3 8.0 11.1 - 1.8
Business development/advisory expenses 3.5 - 4.2 - - -
Gain on previously held equity interests (43.8) - - - - -
Net gains from unconsolidated affiliates (10.6) - - - - -
Income tax items (1.9) (1.4) - 2.7 2.6 -
Charitable contributions - - 1.2 - - -
Contract termination - - (53.5) - - -
Net gain on sale of business - - - - - (5.5)
Software impairment - - - 6.0 - -
Reversal of accrued contingent consideration - - - - (6.5) -
Income tax effect of adjustments (4.0) (0.8) 7.4 (6.4) 2.2 (2.1)
Adjusted Non-GAAP Results 46.5$ 38.7$ 47.3$ 47.6$ 50.7$ 53.9$
Net Income from Continuing Operations Attributable to DST Systems, Inc.
For the Quarter Ended
March 31, June 30,

26
APPENDIX:
RECONCILIATION OF GAAP TO NON-GAAP DILUTED EPS BY QUARTER
(1) All shares have been retroactively adjusted for all periods presented to reflect the stock split
2017 2016 2017 2016 2016 2016
Reported GAAP Results 3.81$ 0.58$ 1.18$ 0.51$ 0.76$ 0.84$
Adjusted to remove:
Net gains on securities and other investments (2.30) (0.09) (0.06) (0.09) (0.06) (0.01)
Amortization of intangible assets 0.09 0.07 0.16 0.09 0.09 0.09
Restructuring charges 0.02 0.03 0.13 0.17 - 0.03
Business development/advisory expenses 0.05 - 0.07 - - -
Gain on previously held equity interests (0.68) - - - - -
Net gains from unconsolidated affiliates (0.17) - - - - -
Income tax items (0.03) (0.02) - 0.04 0.04 -
Charitable contributions - - 0.02 - - -
Contract termination - - (0.86) - - -
Net gain on sale of business - - - - - (0.09)
Software impairment - - - 0.09 - -
Reversal of accrued contingent consideration - - - - (0.10) -
Income tax effect of adjustments (0.06) (0.01) 0.12 (0.10) 0.04 (0.03)
Adjusted Non-GAAP Results 0.73$ 0.56$ 0.76$ 0.71$ 0.77$ 0.83$
Diluted EPS from Continuing Operations
For the Quarter Ended
March 31, September 30, December 31,June 30,
